

Form N-CSR MainGate Trust For: Nov 30
 Tweet
Tweet Share
ShareSECURITIES AND EXCHANGE COMMISSION
Washington, D.C. 20549
(Exact name of registrant as specified in charter)
(Address of principal executive offices) (Zip code)
(Name and address of agent for service)


MainGate MLP Fund
Class A (AMLPX)
Class C (MLCPX)
Class I (IMLPX)
6075 Poplar Avenue, Suite 720 | Memphis, TN 38119 | 855.MLP.FUND (855.657.3863) | www.maingatefunds.com
Annual Report
November 30, 2020
annual report 2020 • 3
Table of Contents
MainGate mlp fund
The MainGate MLP Fund (“Fund”) had the following average annual total returns for its fiscal year ended November 30, 2020 compared to the S&P 500 Index and the Alerian MLP Total Return Index.
| Inception | 1 | 5 | Since | |||||
| Date | Year | Year | Inception | |||||
| MainGate MLP Fund – Class A without load | 2/17/11 | -22.61% | -8.75% | -2.76% | ||||
| MainGate MLP Fund – Class A with 5.75% maximum front-end load | 2/17/11 | -27.00% | -9.82% | -3.35% | ||||
| MainGate MLP Fund – Class I | 2/17/11 | -22.42% | -8.53% | -2.51% | ||||
| S&P 500 Index | 2/17/11 | 17.46% | 13.99% | 13.00% | ||||
| Alerian MLP Total Return Index | 2/17/11 | -24.50% | -7.09% | -3.13% | ||||
| MainGate MLP Fund – Class C without load | 3/31/14 | -22.99% | -9.39% | -10.44% | ||||
| MainGate MLP Fund – Class C with 1.00% Contingent Deferred Sales Charge | 3/31/14 | -23.68% | -9.39% | -11.14% | ||||
| S&P 500 Index | 3/31/14 | 17.46% | 13.99% | 12.66% | ||||
| Alerian MLP Total Return Index | 3/31/14 | -24.50% | -7.09% | -9.93% |
Expense Ratios (Gross/Net): A Shares = 1.70%/1.70% | C Shares = 2.45%/2.45% | I Shares = 1.45%/1.45%. Net expense ratios represent the percentages paid by investors and reflect a 0.00% deferred income tax expense which represents the performance impact of accrued deferred tax liabilities across the Fund, not individual share classes, for the fiscal year ended November 30, 2020 (the Fund did not have a current tax expense or benefit due to a valuation allowance). The Fund’s adviser has contractually agreed to cap the Fund’s total annual operating expenses (excluding brokerage fees and commissions; Class A 12b-1 fees; borrowing costs; taxes, such as Deferred Income Tax Expense; and extraordinary expenses) at 1.50% through March 31, 2022. The performance data shown For Class C with load reflects the Class C maximum deferred sales charge of 1.00%. Deferred income tax expense/(benefit) represents an estimate of the Fund’s potential tax expense/(benefit) if it were to recognize the unrealized gains/(losses) in the portfolio. An estimate of deferred income tax expense/(benefit) depends upon the Fund’s net investment income/(loss) and realized and unrealized gains/(losses) on its portfolio, which may vary greatly on a daily, monthly and annual basis depending on the nature of the Fund’s investments and their performance. An estimate of deferred income tax expenses/(benefit) cannot be reliably predicted from year to year.
The performance data quoted represents past performance. Past performance is no guarantee of future results. The investment return and the principal value of an investment will fluctuate and shares, when redeemed, may be worth more or less than their original cost. Current performance may be lower or higher than the information quoted. To obtain performance information current to the most recent month-end please call 855.MLP.FUND (855.657.3863). Performance data shown for Class A shares with load reflects the maximum sales charge of 5.75%. Performance data shown for Class C shares with load reflects the maximum deferred sales charge of 1.00%. Performance data shown for Class I shares does not reflect the deduction of a sales load or fee. Performance data shown “Without Load” does not reflect the deduction of the sales load or fee. If reflected, the load or fee would reduce the performance quoted.
During the fiscal year ended November 30, 2020, the Fund returns were lower than the broader market (as measured by the S&P 500 Index).
annual report 2020 • 5
We never want to wish away a year, for even in bad times important lessons can be learned. Like many of you, we eagerly anticipate 2021, though we acknowledge the next few months will probably mirror the past few months in terms of health and safety concerns.
2021 Outlook
This letter will be primarily focused on our thoughts for the year ahead. We reviewed the most recent quarterly results in early December, and if you did not have a chance to review those comments, we direct you to www.maingatefunds.com >> Documents & Research >> Newsletters.
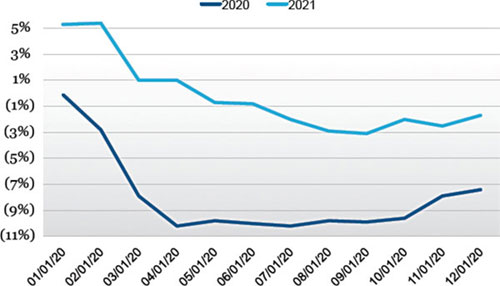
December continued to see appreciation of the Alerian MLP TR Index (AMZX)1 of +2.51%, but the index still finished the year down (28.69%). In previous communications, we asserted our belief that the underperformance and the volatility during the year masked the overall relative steadiness of Midstream earnings in spite of the immense macro uncertainty. Rather, market participants seemed focused on overly discounting Midstream in anticipation of future events, most specifically the development of green energy technology and the potential for adverse outcomes from a “Blue Wave” in the November elections. Clearing the November 3rd election hurdle helped. Yet, despite seemingly adverse outcomes in subsequent state runoff elections, Midstream has managed to post sizeable positive returns throughout the limited set of 2021 trading days.
Meanwhile, analysts have recently started to improve their expectations for 2020 distributable cash flow2 per unit (DCF/u), bringing expectations for weighted average3 2020 growth for the Alerian MLP Index (AMZ) to (7.4%) after the most recent earnings period. However, expectations for 2021 DCF/u growth have remained tighter most of the year and the expectation for the AMZ’s weighted average3 growth is now (1.7%) with potential room for improvement as companies release guidance in January and February.
DCF/u Growth
CCM aggregation of Wall Street consensus estimates, 12/31/20
(1) Alerian MLP Index: A capitalization-weighted index of the most prominent energy Master Limited Partnerships. Visit http://www.alerian.com/indices/ amz-index for more information, including performance. You cannot invest directly in an index. (2) Distributable Cash Flow: Measured as earnings before interest, taxes, depreciation and amortization (EBITDA) available to pay unit holders after reserving for maintenance capital expenditures and payment of interest expense. (3) Weighted Average: A calculation in which each quantity to be averaged is assigned a weight that represents its relative importance.
6 | MainGate mlp fund
The AMZ’s current valuation4 of 4.6x price-to-distributable cash flow (P/DCF)5 still rests close to the low end of the historical range, and we believe there remains upside to share price recovery that could be fundamentally driven by several themes we address below.
Alerian Weighted P/DCF
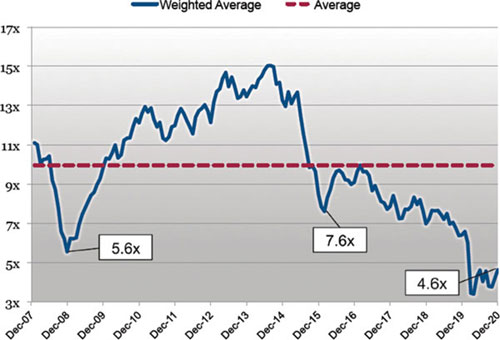
Average = 10.0x | Current = 4.6x | Minimum = 3.4x
Bloomberg, LP, CCM 12/31/20
Key Themes for 2021
Valuation Support
In theory, valuations are supposed to reflect investors’ expectations for earnings and long-term growth. Separating the two, we believe there is opportunity for earnings to modestly grow in 2021, driven by:
| ● | Increasing demand for hydrocarbons in 2H:21 in conjunction with a broader economic recovery |
| ● | Full year impacts of cost cutting measures undertaken in 2020, as well as additional operating efficiencies |
| ● | Share/unit repurchase to amplify the cash flow6 returns to equity holders |
(4) Valuation: The process of determining the current worth of an asset or a company. (5) Price to Distributable Cash Flow (P/DCF): Market cap of the MLP divided by a full year of distributable cash flow, which is measured as earnings before interest, taxes, depreciation and amortization (EBITDA) available to pay unitholders after reserving for maintenance capital expenditures and payment of interest expense. (6) Cash Flow: A measurement of the cash generating capability of a company by adding non-cash charges (e.g. depreciation) and interest expense to pretax income.
annual report 2020 • 7
More specifically on cost cutting, we estimate that over $4 billion of costs have been removed in 2020 with a large portion (anecdotally, 70-80%) of this being “sticky” for 2021. We also believe in conversations with management teams that more costs and operational inefficiencies can be wrung out of the system, with an increasing focus on the latter taking place in 2021 and beyond as field volumes increase to meet demand.
Thinking about the long-term imbedded value of the assets, we reprise and update the chart we shared in October showing that many securities still reflect no terminal value based on our free cash flow7 to equity (FCFE)-based discounted cash flow valuation methodology.
(Discount)/Premium to PV10

CCM estimates 12/31/20
(7) Free Cash Flow: A measure of financial performance calculated as operating cash flow minus capital expenditures.
8 | MainGate mlp fund
Free Cash Flow after Dividends (or Distributions)—FCFaD
This sector continues to meander towards new ways to ascribe value and now “free cash flow” is not sufficient — we have to discuss it after dividends (even though we struggle to find another sector that requires this much scrutiny). Regardless, even these scrutinized metrics illustrate the space positively. Currently the AMZ compares favorably to a broad basket of indices on FCF:
Estimated Free Cash Flow Yield

Bloomberg, LP at 12/31/20. Using Bloomberg definition of Free Cash Flow to Equity of cash flow from operations (CFFO) less capex.
BPMP has no consensus estimate; therefore, we use CCM’s estimate.
Taking it one step further by subtracting the dividends/distributions from FCF, UBS estimates 74% of its coverage universe produces a cumulative
FCFaD of $9 billion in 2021 and $13.7 billion in 20228.
Capital Allocation
As we have posited before “what will these companies do with all this free cash flow”, of course now amended to include “…after dividends”? Adhering to the description of FCFaD, operating expenses, capital expenditures and cash payments to equity holders have already been accounted for. Therefore, three reasonable options remain: maintain or reduce debt to earnings before interest, taxes, depreciation and amortization (D/EBITDA)9 leverage, pay special dividends/distributions or buy back equity. We think the emphasis, by and large, will be mutually on maintaining/ reducing leverage and repurchasing equity, not a binary focus on one or the other. To that end, the sector saw six new buyback authorizations, totaling $2.45 billion, added in Q4:20.
(8) UBS Global Research, “Where the Puck is Going: Can a Phoenix Rise from the Ashes”, January 4, 2021. (9) Debt to EBITDA: A measurement of leverage, calculated as a company’s interest-bearing liabilities minus cash or cash equivalents, divided by its Earnings Before Interest, Taxes, Depreciation and Amortization (EBITDA).
annual report 2020 • 9
Midstream Repurchase Authorizations
| Announcement Date |
Ticker | Company Name | Total Authorized Repurchase ($MM) |
% of Float at Announcement |
% of Float Remaining |
| July 19, 2017 | KMI | Kinder Morgan Inc | $2,000 | 5.2% | 3.7% |
| January 31, 2019 | EPD | Enterprise Product Partners | $2,000 | 5.2% | 4.5% |
| June 3, 2019 | LNG | Cheniere Energy Inc | $1,000 | 6.2% | 3.7% |
| August 12, 2019 | AM | Antero Midstream | $300 | 2.2% | 1.1% |
| January 21, 2020 | MMP | Magellan Midstream | $750 | 5.2% | 3.5% |
| October 5, 2020 | TRGP | Targa Resources Corporation | $500 | 13.8% | 12.5% |
| November 2, 2020 | MPLX | MPLX | $1,000 | 14.8% | 14.8% |
| November 2, 2020 | PAA | Plains All American | $500 | 12.1% | 12.1% |
| November 4, 2020 | ENLC | EnLink Midstream | $100 | 14.7% | 14.7% |
| November 5, 2020 | RTLR | Rattler Midstream | $100 | 36.3% | 36.3% |
| November 9, 2020 | WES | Western Midstream | $250 | 12.0% | 12.0% |
Company filings, CCM as of 12/31/20
While all buybacks are technically “opportunistic”, we don’t believe the current trend is a function of just the place in time where Midstream valuations are, and do believe it will be a part of companies’ capital allocation plans going forward. Looking no further than the 2022 FCFaD of $13.7 billion referenced above, “the money has to go somewhere”, and we expect both the number of authorizations and the size of the authorizations to pick up as we approach next year.
This is also not financial arbitrage, as some have claimed, because we expect debt leverage to decrease or stay flat across the sector. What is taking place is the scenario we have forecasted for years as eventually the billions of dollars companies were spending would have to meter off and equity holders would stand to benefit. While the change in spending plans was abrupt this year, the only real change versus our previous long-term expectations was the rate of deceleration as reductions in Midstream growth capital expenditures were pulled forward in 2020 and in 2021’s forecast, which is a positive for cash available to equity holders.
Lastly, buybacks are an effective capital management tool for both distributions/dividends and leverage management. Simplistically, if the equity outstanding is reduced by 10%, it’s an effective reduction in absolute cash outlay as the dividend per share stays the same but the total payout decreases. This 10% savings can then be reapplied to the capital allocation decision tree framework for capital expenditures, balance sheet management, further buybacks or special distributions/dividends.
Election Outcomes
With the election of Joseph R. Biden, we know the incoming administration will have a more restrictive view of traditional energy than the previous administration, but worst-case outcomes seem unlikely even with Democratic control of all three branches of government. Our view, though, is while a “Blue Wave” occurred, this was in no way a mandate for radical change, which President-elect Biden has acknowledged. Compromise should prevail, certainly for the next 2 years until the next election cycle, and this would be a healthy operating environment for Midstream companies.
Re-entry into the Paris Accord10 is all but certain, but this is natural progress towards a cleaner future, which we support. Domestic initiatives toward a greener future will happen whether we re-enter or not, but this will take time and is a part of our long-term forecasts (we’ll discuss further in the following section).
(10) The Paris Agreement (French: l’accord de Paris) is an agreement within the United Nations Framework Convention on Climate Change (UNFCCC), dealing with greenhouse-gas-emissions mitigation, adaptation, and finance, signed in 2016.
10 | MainGate mlp fund
There could potentially be restrictions on drilling on Federal land, but this is balanced by a pragmatic view that reducing U.S. production could be inflationary to consumers in the form of higher prices, as well as destructive to jobs in a recovering economy. Re-joining the Joint Comprehensive Plan of Action (JCPOA)11 on Iran is a goal of the administration that could increase crude oil barrels on the world market, but there are several hurdles, which would need to be met before this could occur, and it’s likely that increased barrels would come as demand is rising.
Lastly, there is market consensus that full control of all three branches implies more stimulus dollars for the economy. As referenced earlier, we believe hydrocarbon demand will continue to improve during 2021 and increasing dollars in the hands of consumers is a meaningful tool to reinforce that outlook. Though some may view the Georgia runoff election results as less than favorable to Midstream, the market voted strongly in favor of the asset class leading up to and after the results were made public, as the AMZX posted a +10% return over 1/5/21-1/7/21.
Energy Evolution
Expanding our views on clean energy, we firmly believe this is part of our country’s energy evolution, but we remind readers there is no green “switch” to flip no matter how many trillions of dollars we could throw at it in the near term. The evolution is much more dependent on technology, particularly battery and storage solutions, that is not yet cost effectively scalable. As these technologies gain scale, we anticipate they will be heavy consumers of raw hydrocarbons (i.e. mining for energy-dense battery materials, or the use of plastics for wind turbines). Meanwhile, wind and solar will continue to take share from coal-fired electricity generation in our projections, not natural gas, and we expect demand for U.S. natural gas to grow at 2-3% through 2025 due to demand growth around new, recently placed-into-service combined cycle gas plants and LNG exports. There are also baseload electricity demands required of gas pipelines for when the sun doesn’t shine and the wind doesn’t blow. Presented below is a case study on the California market from Kinder Morgan Inc (KMI, $15.21) which shows that baseload gas actually grows to 4.6 Bcf/d in 2027 from 2.6 Bcf/d based on growth in renewables.
Average Daily California Power Generation

Kinder Morgan Inc.
(11) Joint Comprehensive Plan of Action (JCPOA) is an agreement on the Iranian nuclear program reached in Viennaon 14 July 2015, between Iran and the P5+1 (the five permanent members of the United Nations Security Council – China, France, Russia, United Kingdom, United States – plus Germany) together with the European Union.
annual report 2020 • 11
While we wait on technological improvements, Midstream companies are playing and will play a strong role in the most important part of the climate initiatives: removing carbon dioxide (CO2) from the atmosphere. Nearly every company has released a sustainability or environmental, social and governance (ESG) presentation, which includes their methane reductions over their measurement period, and many are including goals to reduce those emissions further. We highlighted the initiatives from Antero Midstream Corp (AM, $8.47) and Williams Cos Inc (WMB, $22.43) in last quarter’s newsletter.
Additionally, we believe Midstream has a role to play in other emerging technologies ranging from transportation of hydrogen to carbon capture utilization and storage (CCUS). Whether we use, repurpose, or create new infrastructure assets, Midstream infrastructure will continue to play a strong role in global energy evolution.
At the End of the Day…
It should very much be the relative income, and this sector continues to compare favorably to other sectors and broader market indices.
Estimated Dividend/Distribution Yield

Bloomberg L.P., 12/31/20
When Master Limited Partnerships (MLPs) took root in the 1990s, the business proposition was to produce stable income with steady growth and provide attractive total returns. The business models have not fundamentally changed, even though there have been some wild gyrations around the prices of securities that hold them.
As mentioned at the outset, we can’t just forget 2020 because that would also mean we might erase what we should’ve learned. However, as we focus on what is in front of us, the AMZ has an expected 2021 estimated yield12 of 9.6%, which is protected by ~2.0x coverage, or a 50% payout ratio. This is the most conservatively covered the distributions and dividends have ever been and we expect that to continue. The excess cash not paid out as distributions would theoretically be available for investing in projects. But, since we are in a lull for new investments, as alluded to earlier, it’s most likely going toward strengthening D/EBITDA ratios and equity buybacks, and we expect balance sheets should remain healthy and get stronger. Lastly, the prospect of higher tax rates is real with the new administration and it’s important to remind readers: the forecasted AMZX yield is tax-advantaged, thus it is synthetically higher (or the comparable yields are lower) when viewed on a tax equivalent basis to other investment options.
(12) Yield: Refers to the interest or dividends received from a security and is usually expressed annually as a percentage based on the investment’s cost, its current market value or its face value.
12 | MainGate mlp fund
Conclusion
This has been a year of perseverance. We appreciate those of you who have done so with us this past year, and we believe we have opportunistically positioned the portfolio well within the favorable backdrop discussed in this letter.
We thank you for your continued confidence. We believe for the reasons we discussed in this letter that better days lie ahead.
| Sincerely, | |
 |
 |
| Geoffrey P. Mavar, Chairman | Matthew G. Mead, CEO |

Past performance is not a guarantee of future results.
Opinions expressed are those of Chickasaw Capital Management, LLC and are subject to change, are not guaranteed, and should not be considered investment advice.
The information contained in this report is authorized for use when preceded or accompanied by a prospectus.
Mutual fund investing involves risk. Principal loss is possible. The Fund is nondiversified, meaning it may concentrate its assets in fewer individual holdings than a diversified fund. Therefore, the Fund is more exposed to individual security price volatility than a diversified fund. The Fund invests in Master Limited Partnerships (MLPs) which concentrate investments in the energy sector and are subject to the risks of energy prices and demand and the volatility of commodity investments. Damage to facilities and infrastructure of MLPs may significantly affect the value of an investment and may incur environmental costs and liabilities due to the nature of their business. MLPs are subject to significant regulation and may be adversely affected by changes in the regulatory environment. Investments in smaller companies involve additional risks, such as limited liquidity and greater volatility. Investments in foreign securities involve greater volatility and political, economic and currency risks and differences in accounting methods. MLPs are subject to certain risks inherent in the structure of MLPs, including complex tax structure risks, limited ability for election or removal of management, limited voting rights, potential dependence on parent companies or sponsors for revenues to satisfy obligations, and potential conflicts of interest between partners, members and affiliates.
S&P 500: A free-float capitalization-weighted index published since 1957 of the prices of 500 large-cap common stocks actively traded in the United States.
The Alerian MLP Index is a composite of the most prominent energy Master Limited Partnerships that provides investors with an unbiased, comprehensive benchmark for this emerging asset class. The index, which is calculated using a float-adjusted, capitalization-weighted methodology, is disseminated real- time on a price-return basis (NYSE: AMZ), and the corresponding total-return index is disseminated daily (NYSE: AMZX). Relevant data points such as dividend yield are also published daily. For index values, constituents, and announcements regarding constituent changes, please visit www.alerian.com.
“Alerian MLP Index”, “Alerian MLP Total Return Index”, “AMZ” and “AMZX” are servicemarks of GKD Index Partners, LLC d/b/a Alerian (“Alerian”) and their use is granted under a license from Alerian. Alerian does not guarantee the accuracy and/or completeness of the Alerian MLP Index or any data included therein and Alerian shall have no liability for any errors, omissions, interruptions or defects therein. Alerian makes no warranty, express or implied, representations or promises, as to results to be obtained by Licensee, or any other person or entity from the use of the Alerian MLP Index or any data included therein. Alerian makes no express or implied warranties, representations or promises, regarding the originality, merchantability, suitability, non-infringement, or fitness for a particular purpose or use with respect to the Alerian MLP Index or any data included therein. Without limiting any of the foregoing, in no event shall Alerian have any liability for any indirect, special, incidental, or consequential damages (including lost profits), arising out of the Alerian MLP Index or any data included therein, even if notified of the possibility of such damages.
The Energy MLP Classification Standard (“EMCS”) was developed by and is the exclusive property (and a service mark) of GKD Index Partners, LLC d/b/a Alerian (“Alerian”) and its use is granted under a license from Alerian. Alerian make no warranties, express or implied, or representations with respect to such standard or classification (or the results to be obtained by the use thereof), and hereby expressly disclaims all warranties of originality, accuracy, completeness, merchantability, suitability, non-infringement, or fitness for a particular purpose with respect to any such standard or classification. No warranty is given that the standard or classification will conform to any description thereof or be free of omissions, errors, interruptions, or defects. Without limiting any of the foregoing, in no event shall Alerian have any liability for any indirect, special, incidental, or consequential damages (including lost profits), arising out of any such standard or classification, even if notified of the possibility of such damages.
References to market or composite indices, benchmarks or other measures of relative market performance over a specified period of time (each, an “index”) are provided for your information only. Reference to this index does not imply that the portfolio will achieve returns, volatility or other results similar to the index. The composition of the index may not reflect the manner in which a portfolio is constructed in relation to expected or achieved returns, portfolio guidelines, restrictions, sectors, correlations, concentrations, volatility or tracking error targets, all of which are subject to change over time. Indices are unmanaged. The figures for the indices do not reflect the deduction of any fees or expenses which would reduce returns. Investors cannot invest directly in indices.
annual report 2020 • 13
Distributable Cash Flow (DCF) is calculated as net income plus depreciation and other noncash items, less maintenance capital expenditure requirements. Distributable cash flow (DCF) data is CCM calculated consensus of Wall Street estimates. The estimated consensus weighted average distributable cash flow (DCF) per unit growth rate for the AMZ and the MainGate MLP Fund incorporates market expectations by using the average annual growth rate using rolling-forward 24-month data. DCF growth rate is not a forecast of the portfolio’s future performance. DCF growth rate for the portfolio’s holdings does not guarantee a corresponding increase in the market value of the holding or the portfolio.
Distribution Coverage Ratio is calculated as cash available to limited partners divided by cash distributed to limited partners. It gives an indication of an MLP’s ability to make dividend payments to limited partner investors from operating cash flows. MLPs with a coverage ratio of in excess of 1.0 times are able to meet their dividend payments without external financing.
Distributions are quarterly payments, similar to dividends, made to Limited Partner (LP) and General Partner (GP) investors. These amounts are set by the GP and are supported by an MLP’s operating cash flows.
EBITDA is earnings before interest rates taxes depreciation and amortization.
Free Cash Flow to Equity (FCFE) represents the amount of cash a company can pay to equity shareholders after all expenses, reinvestments, and debt payments.
Growth CapEx or Growth Capital Expenditures refers to the aggregate of all capital expenditures undertaken to further growth prospects and/or expand operations and excludes any maintenance and regulatory capital expenditures.
Incentive Distributions Rights (IDRs) allow the holder (typically the general partner) to receive an increasing percentage of quarterly distributions after the MQD and target distribution thresholds have been achieved. In most partnerships, IDRs can reach a tier wherein the GP is receiving 50% of every incremental dollar paid to the LP unitholders. This is known as the 50/50 or “high splits” tier.
Leverage is net debt divided by EBITDA.
Yield refers to the cash dividend or distribution divided by the share or unit price at a particular point in time.
This material is provided for informational and educational purposes only and should not be construed as investment advice or an offer or solicitation to buy or sell any security, product or service.
Fund holdings and sector allocations are subject to change at any time and should not be considered a recommendation to buy or sell any security. Please refer to the schedule of investments for a complete listing of Fund holdings.
The Fund does not receive the same tax benefits of a direct investment in an MLP.
The Fund is subject to U.S. federal income tax on its taxable income at rates applicable to corporations (currently at a rate of 21%) as well as state and local income taxes.
The Fund accrues deferred income taxes for future tax liabilities associated with the portion of MLP distributions considered to be a tax-deferred return of capital and for any net operating gains as well as capital appreciation of its investments. This deferred tax liability is reflected in the daily NAV and as a result the Fund’s after-tax performance could differ significantly from the underlying assets even if the pre-tax performance is closely tracked.
The potential tax benefits from investing in MLPs depend on MLPs being treated as partnerships for federal income tax purposes.
If the MLP is deemed to be a corporation then its income would be subject to federal taxation, reducing the amount of cash available for distribution to the Fund which could result in a reduction of the Fund’s value.
The MainGate MLP Fund is distributed by Quasar Distributors, LLC.
14 | MainGate mlp fund
Hypothetical Growth of a $10,000 Investment | unaudited

This chart illustrates the performance of a hypothetical $10,000 investment made in each share class as of its inception date (2/17/11 for Class A and 3/31/14 for Class C). Assumes reinvestment of dividends and capital gains. This chart does not imply any future performance.
Hypothetical Growth of a $1,000,000 Investment | unaudited

This chart illustrates the performance of a hypothetical $1,000,000 investment made in Class I shares as of their inception date (2/17/11). Assumes reinvestment of dividends and capital gains. This chart does not imply any future performance.
annual report 2020 • 15
Average Annual Returns | November 30, 2020 | unaudited
| 1 Year | 5 Year | Since Inception | Inception Date | ||||
| Class A (without sales load) | -22.61% | -8.75% | -2.76% | 2/17/11 | |||
| Class A (with sales load) | -27.00% | -9.82% | -3.35% | 2/17/11 | |||
| Class C | -22.99% | -9.39% | -10.44% | 3/31/14 | |||
| Class C (with CDSC) | -23.68% | -9.39% | -11.14% | 3/31/14 | |||
| Class I | -22.42% | -8.53% | -2.51% | 2/17/11 | |||
| S&P 500 Index | 17.46% | 13.99% | 13.00% | 2/17/11 | |||
| S&P 500 Index | 17.46% | 13.99% | 12.66% | 3/31/14 | |||
| Alerian MLP Total Return Index | -24.50% | -7.09% | -3.13% | 2/17/11 | |||
| Alerian MLP Total Return Index | -24.50% | -7.09% | -9.93% | 3/31/14 |
Performance data quoted represents past performance; past performance does not guarantee future results. The investment return and principal value of an investment will fluctuate so that an investor’s shares, when redeemed, may be worth more or less than their original cost. Current performance of the Fund may be lower or higher than the performance quoted. Performance data current to the most recent month end may be obtained by calling 855.MLP.FUND (855.657.3863) or by visiting www.maingatefunds.com.
Class A (with sales load) performance reflects the maximum sales charge of 5.75%. Class C (with CDSC) performance reflects the 1.00% contingent deferred sales charge. Class I is not subject to a sales charge or CDSC.
The S&P 500 Index is a broad based unmanaged index of 500 stocks, which is widely recognized as representative of the equity market in general.
The Alerian MLP Total Return Index is a capped, float-adjusted, capitalization-weighted index, whose constituents earn the majority of their cash flow from midstream activities involving energy commodities.
You cannot invest directly in an index.
The graph and table do not reflect the deduction of taxes that a shareholder would pay on Fund distributions or the redemption of the Fund shares.
16 | MainGate mlp fund
As a shareholder of the Fund, you incur two types of costs:
(1) transaction costs, including sales charges (loads) on purchase payments, reinvested dividends, or other distributions; and exchange fees; and (2) ongoing costs, including management fees; distribution and/or service (12b-1) fees; and other Fund expenses. This example is intended to help you understand your ongoing costs (in dollars) of investing in the Fund and to compare these costs with the ongoing costs of investing in other mutual funds. The example is based on an investment of $1,000 invested at the beginning of the period and held for the six-month period from June 1, 2020 to November 30, 2020.
Actual Expenses
For each class, the first line of the table below provides information about actual account values and actual expenses. You may use the information in this line, together with the amount you invested, to estimate the expenses that you paid over the period. Simply divide your account value by $1,000 (for example, an $8,600 account value divided by $1,000 = 8.6), then multiply the result by the number in the first line under the heading entitled “Expenses Paid During Period” to estimate the expenses you paid on your account during this period.
Hypothetical Example for Comparison Purposes
For each class, the second line of the table below provides information about hypothetical account values and hypothetical expenses based on the Fund’s actual expense ratio and an assumed rate of return of 5% per year before expenses, which is not the Fund’s actual return. The hypothetical account values and expenses may not be used to estimate the actual ending account balance or expense you paid for the period. You may use this information to compare the ongoing costs of investing in the Fund and other funds. To do so, compare this 5% hypothetical example with the 5% hypothetical examples that appear in the shareholder reports of the other funds.
Please note that the expenses shown in the table are meant to highlight your ongoing costs only and do not reflect any transactional costs, such as sales charges (loads) or exchange fees. Therefore, the second line of the table for each class is useful in comparing ongoing costs only, and will not help you determine the relative total costs of owning different funds. In addition, if transaction costs were included, your costs would have been higher.
| Beginning Account Value (06/01/20) |
Ending Account Value (11/30/20) |
Expenses Paid During Period(1) (06/01/20 – 11/30/20) |
Net Annualized Expense Ratio(2) |
||||
| Class A Actual | $1,000.00 | $985.10 | $8.44 | 1.71% | |||
| Class A
Hypothetical (5% return before expenses) |
$1,000.00 | $1,016.36 | $8.57 | 1.71% | |||
| Class C Actual | $1,000.00 | $981.07 | $12.12 | 2.46% | |||
| Class C
Hypothetical (5% return before expenses) |
$1,000.00 | $1,012.63 | $12.31 | 2.46% | |||
| Class I Actual | $1,000.00 | $988.84 | $7.22 | 1.46% | |||
| Class I
Hypothetical (5% return before expenses) |
$1,000.00 | $1,017.60 | $7.32 | 1.46% |
| (1) | Expenses are equal to the Fund’s annualized expense ratio multiplied by the average account value over the period, multiplied by 182 days (the number of days in the most recent period)/366 days (to reflect the period), for Class A, Class C and Class I. |
| (2) | Annualized expense ratio excludes current and deferred income and franchise tax expense. |
annual report 2020 • 17
Allocation of Portfolio Assets
November 30, 2020 | unaudited
(expressed as a percentage of total investments)
 Crude/Refined Products Pipelines and Storage* Crude/Refined Products Pipelines and Storage* |
49.1% |
 Natural Gas/Natural Gas Liquid
Pipelines and Storage* Natural Gas/Natural Gas Liquid
Pipelines and Storage* |
31.0% |
 Natural Gas
Gathering/Processing* Natural Gas
Gathering/Processing* |
19.9% |

*Master Limited Partnerships and Related Companies
Schedule of Investments | November 30, 2020
| Master Limited Partnerships and Related Companies - 98.9%(1) | Shares | Fair Value | |
| Crude/Refined Products Pipelines and Storage - 48.6%(1) | |||
| Canada - 0.9%(1) | |||
| Enbridge, Inc. | 232,000 | $7,240,720 | |
| United States - 47.7%(1) | |||
| BP Midstream Partners, L.P. | 1,771,000 | 20,083,140 | |
| Genesis Energy, L.P. | 1,973,000 | 12,686,390 | |
| Magellan Midstream Partners, L.P. | 2,174,000 | 89,460,100 | |
| MPLX, L.P. | 4,543,000 | 95,584,720 | |
| Phillips 66 Partners, L.P. | 1,205,000 | 32,390,400 | |
| Plains All American Pipeline, L.P. | 5,118,000 | 40,636,920 | |
| Plains GP Holdings, L.P. | 5,001,000 | 39,657,930 | |
| Shell Midstream Partners, L.P. | 4,636,000 | 47,565,360 | |
| 378,064,960 | |||
| Total Crude/Refined Products Pipelines and Storage | 385,305,680 | ||
| Natural Gas/Natural Gas Liquid Pipelines and Storage - 30.6%(1) | |||
| Canada - 0.9%(1) | |||
| TC Energy Corporation | 160,000 | 7,028,800 | |
| United States - 29.7%(1) | |||
| Cheniere Energy, Inc.(2) | 70,000 | 3,968,300 | |
| Energy Transfer, L.P. | 11,557,000 | 71,422,260 | |
| Enterprise Products Partners, L.P. | 4,051,000 | 78,589,400 | |
| Kinder Morgan, Inc. | 2,850,000 | 40,983,000 | |
| Williams Companies, Inc. | 1,955,000 | 41,015,900 | |
| 235,978,860 | |||
| Total Natural Gas/Natural Gas Liquid Pipelines and Storage | 243,007,660 | ||
| Natural Gas Gathering/Processing - 19.7%(1) | |||
| United States - 19.7%(1) | |||
| Antero Midstream Corporation | 3,554,000 | 23,953,960 | |
| Enlink Midstream, LLC | 8,578,000 | 31,738,600 | |
| Targa Resources Corporation | 3,298,000 | 77,503,000 | |
| Western Midstream Partners, L.P. | 1,756,000 | 22,652,400 | |
| Total Natural Gas Gathering/Processing | 155,847,960 | ||
| Total Master Limited Partnerships and Related Companies (Cost $845,540,063) | 784,161,300 | ||
| Total Investments - 98.9% (Cost $845,540,063)(1) | 784,161,300 | ||
| Other Assets in Excess of Liabilities - 1.1%(1) | 8,368,182 | ||
| Net Assets - 100.0%(1) | $792,529,482 |
| (1) | Calculated as a percentage of net assets applicable to common stockholders. |
| (2) | Non-Income Producing Security. |
18 | MainGate mlp fund
Statement of Assets and Liabilities
November 30, 2020
| Assets | |
| Investments at fair value (cost $845,540,063) | $784,161,300 |
| Cash(1) | 10,163,084 |
| Receivable for Fund shares sold | 283,257 |
| Dividends receivable | 157,862 |
| Prepaid expenses | 72,236 |
| Total assets | 794,837,739 |
| Liabilities | |
| Payable for Fund shares redeemed | 1,013,834 |
| Payable to Adviser | 766,547 |
| Payable for 12b-1 distribution fee | 68,608 |
| Payable to Trustees | 24,000 |
| Payable to Custodian | 11,927 |
| Accrued expenses and other liabilities | 423,341 |
| Total liabilities | 2,308,257 |
| Net assets | $792,529,482 |
| Net Assets Consist of | |
| Additional paid-in capital | $1,545,603,155 |
| Total distributable earnings, net of deferred taxes | (753,073,673) |
| Net assets | $792,529,482 |
| (1) | The Fund maintains cash in bank accounts which, at times, may exceed United States Federally insured limits. |
| Unlimited shares authorized, | |||
| no par value | Class A | Class C | Class I |
| Net assets | $28,693,359 | $16,108,024 | $747,728,099 |
| Shares issued and outstanding | 7,332,063 | 4,335,729 | 184,037,234 |
| Net asset value, redemption price and minimum offering price per share | $3.91 | $3.72 | $4.06 |
| Maximum offering price per share ($3.91/0.9425) | $4.15 | NA | NA |
Year Ended November 30, 2020
Investment Income
| Distributions received from master limited partnerships | $62,732,739 |
| Less: return of capital on distributions from master limited partnerships | (62,732,739) |
| Distribution income received in excess of return of capital from master limited partnerships | — |
| Dividends from common stock(2,3) | 3,366,323 |
| Total Investment Income | 3,366,323 |
| (2) | The return of capital amount from C-Corporations was $19,377,609. (See Note 2) |
| (3) | Net of foreign withholding tax of $95,909. |
Expenses
| Advisory fees | 10,594,085 |
| Administrator fees | 614,159 |
| Transfer agent expense | 483,705 |
| Reports to shareholders | 135,565 |
| Professional fees | 132,287 |
| Insurance expense | 124,917 |
| Registration fees | 119,687 |
| Trustees’ fees | 96,002 |
| Franchise tax expense | 87,319 |
| Compliance fees | 66,725 |
| Custodian fees and expenses | 63,831 |
| Fund accounting fees | 945 |
| 12b-1 distribution fee - Class A | 90,575 |
| 12b-1 distribution fee - Class C | 208,600 |
| Other expenses | 1,945 |
| Total Expenses | 12,820,347 |
| Net Investment Loss, before taxes | (9,454,024) |
| Current and deferred tax benefit/(expense)(4) | — |
| Net Investment Loss, net of taxes | (9,454,024) |
| Realized and Unrealized Loss on Investments | |
| Net realized loss on investments, before taxes | (177,024,312) |
| Current and deferred tax benefit/(expense)(4) | — |
| Net realized loss on investments, net of taxes | (177,024,312) |
| Net change in unrealized appreciation/depreciation on investments, before taxes | (38,350,092) |
| Deferred tax benefit/(expense)(4) | — |
| Net change in unrealized appreciation/depreciation on investments, net of taxes | (38,350,092) |
| Net Realized and Unrealized Loss on Investments | (215,374,404) |
| Decrease in Net Assets Resulting from Operations | $(224,828,428) |
| (4) | Any tax benefit/(expense) was fully offset by a valuation allowance recorded as of November 30, 2020. |
| The accompanying notes are an integral part of the financial statements. | annual report 2020 • 19 |
Statements of Changes in Net Assets
| Operations | Year Ended November 30, 2020 | Year Ended November 30, 2019 |
| Net investment loss, net of deferred tax benefit/(expense) | $(9,454,024) | $(6,540,143) |
| Net realized loss on investments, net of deferred tax benefit/(expense) | (177,024,312) | (110,373,514) |
| Net change in unrealized appreciation/depreciation on investments, net of deferred tax benefit/(expense) | (38,350,092) | (72,804,928) |
| Decrease in net assets applicable to shareholders resulting from operations | (224,828,428) | (189,718,585) |
| Dividends and Distributions to Class A Shareholders | ||
| Return of capital | (3,885,742) | (7,052,830) |
| Dividends and Distributions to Class C Shareholders | ||
| Return of capital | (2,331,384) | (4,163,701) |
| Dividends and Distributions to Class I Shareholders | ||
| Return of capital | (83,310,078) | (100,776,703) |
| Total dividends and distributions to Fund shareholders | (89,527,204) | (111,993,234) |
| Capital Share Transactions (Note 8) | ||
| Proceeds from shareholder subscriptions | 687,002,918 | 763,571,284 |
| Dividend reinvestments | 75,024,609 | 91,370,082 |
| Payments for redemptions | (717,093,632) | (856,884,667) |
| Increase/(decrease) in net assets from capital share transactions | 44,933,895 | (1,943,301) |
| Total decrease in net assets | (269,421,737) | (303,655,120) |
| Net Assets | ||
| Beginning of year | 1,061,951,219 | 1,365,606,339 |
| End of year | $792,529,482 | $1,061,951,219 |
| 20 | MAINGATE MLP FUND | The accompanying notes are an integral part of the financial statements. |
Financial Highlights: Class A Shares
| Year Ended | Year Ended | Year Ended | Year Ended | Year Ended | ||
| Per Share Data(1) | November 30, | November 30, | November 30, | November 30, | November 30, | |
| 2020 | 2019 | 2018 | 2017 | 2016 | ||
| Net Asset Value, beginning of year | $5.65 | $7.17 | $8.25 | $9.89 | $9.38 | |
| Income from Investment Operations | ||||||
| Net investment loss(2) | (0.06) | (0.05) | (0.09) | (0.11) | (0.06) | |
| Net realized and unrealized gain (loss) on investments | (1.22) | (0.84) | (0.36) | (0.90) | 1.20 | |
| Total increase (decrease) from investment operations | (1.28) | (0.89) | (0.45) | (1.01) | 1.14 | |
| Less Distributions to Shareholders | ||||||
| Return of capital | (0.46) | (0.63) | (0.63) | (0.63) | (0.63) | |
| Total distributions to shareholders | (0.46) | (0.63) | (0.63) | (0.63) | (0.63) | |
| Net Asset Value, end of year | $3.91 | $5.65 | $7.17 | $8.25 | $9.89 | |
| Total Investment Return | (22.61)% | (13.71)% | (6.24)% | (10.86)% | 13.32% | |
| Supplemental Data and Ratios | ||||||
| Net assets, end of year | $28,693,359 | $60,839,754 | $93,423,336 | $140,857,758 | $209,297,676 | |
| Ratio of Expenses to Average Net Assets | ||||||
| Net deferred income and franchise tax (benefit) expense(3,4) | 0.01% | 0.01% | 0.00%‡ | 0.01% | 0.00%‡ | |
| Expenses (excluding net deferred income and franchise tax (benefit) expense) before (waiver) recoupment(3,4) | 1.72% | 1.69% | 1.66% | 1.65% | 1.67% | |
| Expenses (excluding net deferred income and franchise tax (benefit) expense) after (waiver) recoupment(3,4) | 1.72% | 1.69% | 1.66% | 1.65% | 1.67% | |
| Expenses (including net deferred income and franchise tax (benefit) expense) before (waiver) recoupment(3,4) | 1.73% | 1.70% | 1.66% | 1.66% | 1.67% | |
| Net Fund Expenses(3,4) | 1.73% | 1.70% | 1.66% | 1.66% | 1.67% | |
| Ratio of Net Investment Income (Loss) to Average Net Assets | ||||||
| Net investment income (loss) (excluding net deferred tax benefit and franchise tax benefit (expense)) before waiver (recoupment)(3,4) | (1.32)% | (0.71)% | (1.05)% | (1.11)% | (0.67)% | |
| Net investment income (loss) (excluding net deferred tax benefit and franchise tax benefit (expense)) after waiver (recoupment)(3,4) | (1.32)% | (0.71)% | (1.05)% | (1.11)% | (0.67)% | |
| Net investment income (loss) (including net deferred tax benefit and franchise tax benefit (expense)) before waiver (recoupment)(3,4) | (1.33)% | (0.72)% | (1.05)% | (1.12)% | (0.68)% | |
| Net Investment Income (Loss)(3,4) | (1.33)% | (0.72)% | (1.05)% | (1.12)% | (0.68)% | |
| Portfolio turnover rate(5) | 36.65% | 66.39% | 44.57% | 19.35% | 24.63% |
‡ Less than 0.01%.
(1) Information presented relates to a share of Class A for the entire period. (2) Calculated using average shares outstanding method. (3) For the year ended November 30, 2020, the Fund accrued $87,319 in franchise tax expense, of which $3,733 is attributable to Class A. For the year ended November 30, 2019, the Fund accrued $85,100 in franchise tax expense, of which $5,253 is attributable to Class A. For the year ended November 30, 2018, the Fund accrued $26,903 in franchise tax expense, of which $1,982 is attributable to Class A. For the year ended November 30, 2017, the Fund accrued $148,000 in franchise tax expense, of which $14,756 is attributable to Class A. For the year ended November 30, 2016, the Fund accrued $55,653 in franchise tax expense, of which $7,370 is attributable to Class A. (4) The Fund did not accrue a deferred tax expense or benefit. (5) Portfolio turnover is calculated on the basis of the Fund as a whole without distinguishing between the classes of shares issued.
| The accompanying notes are an integral part of the financial statements. | annual report 2020 • 21 |
Financial Highlights: Class C Shares
| Year Ended | Year Ended | Year Ended | Year Ended | Year Ended | ||
| Per Share Data(1) | November 30, | November 30, | November 30, | November 30, | November 30, | |
| 2020 | 2019 | 2018 | 2017 | 2016 | ||
| Net Asset Value, beginning of year | $5.43 | $6.97 | $8.09 | $9.78 | $9.35 | |
| Income from Investment Operations | ||||||
| Net investment loss(2) | (0.08) | (0.10) | (0.14) | (0.17) | (0.13) | |
| Net realized and unrealized gain (loss) on investments | (1.17) | (0.81) | (0.35) | (0.89) | 1.19 | |
| Total increase (decrease) from investment operations | (1.25) | (0.91) | (0.49) | (1.06) | 1.06 | |
| Less Distributions to Shareholders | ||||||
| Return of capital | (0.46) | (0.63) | (0.63) | (0.63) | (0.63) | |
| Total distributions to shareholders | (0.46) | (0.63) | (0.63) | (0.63) | (0.63) | |
| Net Asset Value, end of year | $3.72 | $5.43 | $6.97 | $8.09 | $9.78 | |
| Total Investment Return | (22.99)% | (14.42)% | (6.88)% | (11.51)% | 12.47% | |
| Supplemental Data and Ratios | ||||||
| Net assets, end of year | $16,108,024 | $33,310,916 | $52,049,211 | $62,803,141 | $66,956,773 | |
| Ratio of Expenses to Average Net Assets | ||||||
| Net deferred income and franchise tax (benefit) expense(3,4) | 0.01% | 0.01% | 0.00%‡ | 0.01% | 0.00%‡ | |
| Expenses (excluding net deferred income and franchise tax (benefit) expense) before (waiver) recoupment(3,4) | 2.46% | 2.44% | 2.41% | 2.40% | 2.42% | |
| Expenses (excluding net deferred income and franchise tax (benefit) expense) after (waiver) recoupment(3,4) | 2.46% | 2.44% | 2.41% | 2.40% | 2.42% | |
| Expenses (including net deferred income and franchise tax (benefit) expense) before (waiver) recoupment(3,4) | 2.47% | 2.45% | 2.41% | 2.41% | 2.42% | |
| Net Fund Expenses(3,4) | 2.47% | 2.45% | 2.41% | 2.41% | 2.42% | |
| Ratio of Net Investment Income (Loss) to Average Net Assets | ||||||
| Net investment income (loss) (excluding net deferred tax benefit and franchise tax benefit (expense)) before waiver (recoupment)(3,4) | (2.06)% | (1.46)% | (1.80)% | (1.86)% | (1.42)% | |
| Net investment income (loss) (excluding net deferred tax benefit and franchise tax benefit (expense)) after waiver (recoupment)(3,4) | (2.06)% | (1.46)% | (1.80)% | (1.86)% | (1.42)% | |
| Net investment income (loss) (including net deferred tax benefit and franchise tax benefit (expense)) before waiver (recoupment)(3,4) | (2.07)% | (1.47)% | (1.80)% | (1.87)% | (1.43)% | |
| Net Investment Income (Loss)(3,4) | (2.07)% | (1.47)% | (1.80)% | (1.87)% | (1.43)% | |
| Portfolio turnover rate(5) | 36.65% | 66.39% | 44.57% | 19.35% | 24.63% |
‡ Less than 0.01%.
(1) Information presented relates to a share of Class C for the entire period. (2) Calculated using average shares outstanding method. (3) For the year ended November 30, 2020, the Fund accrued $87,319 in franchise tax expense, of which $2,149 is attributable to Class C. For the year ended November 30, 2019, the Fund accrued $85,100 in franchise tax expense, of which $2,996 is attributable to Class C. For the year ended November 30, 2018, the Fund accrued $26,903 in franchise tax expense, of which $1,007 is attributable to Class C. For the year ended November 30, 2017, the Fund accrued $148,000 in franchise tax expense, of which $5,467 is attributable to Class C. For the year ended November 30, 2016, the Fund accrued $55,653 in franchise tax expense, of which $2,149 is attributable to Class C. (4) The Fund did not accrue a deferred tax expense or benefit. (5) Portfolio turnover is calculated on the basis of the Fund as a whole without distinguishing between the classes of shares issued.
| 22 | MAINGATE MLP FUND | The accompanying notes are an integral part of the financial statements. |
Financial Highlights: Class I Shares
| Year Ended | Year Ended | Year Ended | Year Ended | Year Ended | ||
| Per Share Data(1) | November 30, | November 30, | November 30, | November 30, | November 30, | |
| 2020 | 2019 | 2018 | 2017 | 2016 | ||
| Net Asset Value, beginning of year | $5.83 | $7.36 | $8.43 | $10.07 | $9.52 | |
| Income from Investment Operations | ||||||
| Net investment loss(2) | (0.05) | (0.03) | (0.07) | (0.08) | (0.04) | |
| Net realized and unrealized gain (loss) on investments | (1.26) | (0.87) | (0.37) | (0.93) | 1.22 | |
| Total increase (decrease) from investment operations | (1.31) | (0.90) | (0.44) | (1.01) | 1.18 | |
| Less Distributions to Shareholders | ||||||
| Return of capital | (0.46) | (0.63) | (0.63) | (0.63) | (0.63) | |
| Total distributions to shareholders | (0.46) | (0.63) | (0.63) | (0.63) | (0.63) | |
| Net Asset Value, end of year | $4.06 | $5.83 | $7.36 | $8.43 | $10.07 | |
| Total Investment Return | (22.42)% | (13.48)% | (5.98)% | (10.66)% | 13.55% | |
| Supplemental Data and Ratios | ||||||
| Net assets, end of year | $747,728,099 | $967,800,549 | $1,220,133,792 | $1,403,597,144 | $1,542,427,608 | |
| Ratio of Expenses to Average Net Assets | ||||||
| Net deferred income and franchise tax (benefit) expense(3,4) | 0.01% | 0.01% | 0.00%‡ | 0.01% | 0.00%‡ | |
| Expenses (excluding net deferred income and franchise tax (benefit) expense) before (waiver) recoupment(3,4) | 1.46% | 1.44% | 1.41% | 1.40% | 1.42% | |
| Expenses (excluding net deferred income and franchise tax (benefit) expense) after (waiver) recoupment(3,4) | 1.46% | 1.44% | 1.41% | 1.40% | 1.42% | |
| Expenses (including net deferred income and franchise tax (benefit) expense) before (waiver) recoupment(3,4) | 1.47% | 1.45% | 1.41% | 1.41% | 1.42% | |
| Net Fund Expenses(3,4) | 1.47% | 1.45% | 1.41% | 1.41% | 1.42% | |
| Ratio of Net Investment Income (Loss) to Average Net Assets | ||||||
| Net investment income (loss) (excluding net deferred tax benefit and franchise tax benefit (expense)) before waiver (recoupment)(3,4) | (1.07)% | (0.46)% | (0.80)% | (0.86)% | (0.42)% | |
| Net investment income (loss) (excluding net deferred tax benefit and franchise tax benefit (expense)) after waiver (recoupment)(3,4) | (1.07)% | (0.46)% | (0.80)% | (0.86)% | (0.42)% | |
| Net investment income (loss) (including net deferred tax benefit and franchise tax benefit (expense)) before waiver (recoupment)(3,4) | (1.08)% | (0.47)% | (0.80)% | (0.87)% | (0.43)% | |
| Net Investment Income (Loss)(3,4) | (1.08)% | (0.47)% | (0.80)% | (0.87)% | (0.43)% | |
| Portfolio turnover rate(5) | 36.65% | 66.39% | 44.57% | 19.35% | 24.63% |
‡ Less than 0.01%.
(1) Information presented relates to a share of Class I for the entire period. (2) Calculated using average shares outstanding method. (3) For the year ended November 30, 2020, the Fund accrued $87,319 in franchise tax expense, of which $81,437 is attributable to Class I. For the year ended November 30, 2019, the Fund accrued $85,100 in franchise tax expense, of which $76,851 is attributable to Class I. For the year ended November 30, 2018, the Fund accrued $26,903 in franchise tax expense, of which $23,914 is attributable to Class I. For the year ended November 30, 2017, the Fund accrued $148,000 in franchise tax expense, of which $127,777 is attributable to Class I. For the year ended November 30, 2016, the Fund accrued $55,653 in franchise tax expense, of which $46,134 is attributable to Class I. (4) The Fund did not accrue a deferred tax expense or benefit. (5) Portfolio turnover is calculated on the basis of the Fund as a whole without distinguishing between the classes of shares issued.
| The accompanying notes are an integral part of the financial statements. | annual report 2020 • 23 |
November 30, 2020
1. Organization
MainGate MLP Fund (the “Fund”), a series of MainGate Trust (the “Trust”), is registered under the Investment Company Act of 1940 as an open-end, non-diversified investment company. The Trust was established under the laws of Delaware by an Agreement and Declaration of Trust dated November 3, 2010. The Fund’s investment objective is total return. Class A and Class I commenced operations on February 17, 2011. Class C commenced operations on March 31, 2014.
The Fund offers three classes of shares, Class A, Class C and Class I. Depending on the size of the initial purchase, Class A shares are subject to a maximum 5.75% front-end sales charge or a 1.00% contingent deferred sales charge if shares are redeemed within 18 months. Class C shares have no front-end sales charge, but are subject to a 1.00% contingent deferred sales charge within 12 months of redemption. Class I shares have no sales charge. Class A shareholders pay Rule 12b-1 fees at the annual rate of 0.25% of average daily net assets. Class C shareholders pay Rule 12b-1 fees at the annual rate of 1.00% of average daily net assets. For the year ended November 30, 2020, contingent deferred sales charges of $1,450 and $2,799 were incurred by Class A and Class C shareholders, respectively.
The Fund is an investment company and accordingly follows the investment company accounting and reporting guidance of the Financial Accounting Standards Board (FASB) Accounting Standards Board Codification Topic 946 Financial Services—Investment Companies.
2. Significant Accounting Policies
A. Use of Estimates. The preparation of financial statements in conformity with accounting principles generally accepted in the United States of America requires management to make estimates and assumptions that affect the reported amount of assets and liabilities and disclosure of contingent assets and liabilities at the date of the financial statements and the recognition of distribution income and the reported amounts of increases and decreases in net assets from operations during the reporting period. Actual results could differ from those estimates.
B. Investment Valuation. The Fund uses the following valuation methods to determine fair value as either current market value for investments for which market quotations are available, or if not available, a fair value, as determined in good faith pursuant to such policies and procedures as may be approved by the Trust’s Board of Trustees (“Board of Trustees”) from time to time. The valuation of the portfolio securities of the Fund currently includes the following processes:
| • | Equity Securities: Securities listed on a securities exchange or an automated quotation system for which quotations are readily available, including securities traded over the counter, will be valued at the last quoted sale price on the principal exchange on which they are traded on the valuation date (or at approximately 4:00 p.m. Eastern Time if a security’s principal exchange is normally open at that time), or, if there is no such reported sale on the valuation date, at the most recent quoted bid price. |
| • | Fixed Income Securities: Debt and fixed income securities will be priced by independent, third-party pricing agents approved by the Board of Trustees. These third-party pricing agents will employ methodologies that they believe are appropriate, including actual market transactions, broker-dealer supplied valuations, matrix pricing, or other electronic data processing techniques. |
These techniques generally consider such factors as security prices, yields, maturities, call features, ratings and developments relating to specific securities in arriving at valuations. Debt obligations with remaining maturities of sixty days or less will be valued at their amortized cost, which approximates fair market value.
| • | Foreign Securities: Foreign securities are often principally traded on markets that close at different hours than U.S. markets. Such securities will be valued at their most recent closing prices on the relevant principal exchange even if the close of that exchange is earlier than the time of the Fund’s net asset value (“NAV”) calculation. However, securities traded in foreign markets which remain open as of the time of the NAV calculation will be valued at the most recent sales price as of the time of the NAV calculation. In addition, prices for certain foreign securities may be obtained from the Fund’s approved pricing sources. The Adviser also monitors for the occurrence of significant events that may cast doubts on the reliability of previously obtained market prices for foreign securities held by the Fund. The prices for foreign securities will be reported in local currency and converted to U.S. dollars using currency exchange rates. Exchange rates will be provided daily by recognized independent pricing agents. The exchange rates used for the conversion will be captured as of the London close each day. |
C. Security Transactions, Investment Income and Expenses. Security transactions are accounted for on the date the securities are purchased or sold (trade date). Realized gains and losses are reported on a specific identified cost basis. Interest income is recognized on the accrual basis, including amortization of premiums and accretion of discounts. Distributions are recorded on the ex-dividend date. Distributions received from the Fund’s investments in master limited partnerships (“MLPs”), including MLP general partnership interests, generally are comprised of ordinary income and return of capital. Withholding taxes on foreign dividends have been provided for in accordance with the Fund’s understanding of the applicable country’s tax rules and regulations.
| 24 | MAINGATE MLP FUND | The accompanying notes are an integral part of the financial statements. |
For financial statement purposes, the Fund uses return of capital and income estimates to allocate the distribution income received. Such estimates are based on historical information available from each MLP and other industry sources. These estimates may subsequently be revised based on information received from MLPs after their tax reporting periods are concluded, as the actual character of these distributions is not known until after the fiscal year end of the Fund.
The Fund estimates the allocation of investment income and return of capital for the distributions received from MLPs within the Statement of Operations. For the year ended November 30, 2020, the Fund has estimated approximately 100% of the distributions from MLPs taxed as partnerships to be return of capital. Distributions from common stock may also include income and return of capital. The Fund records the character of distributions received during the year based on estimates available. The characterization of distributions received by the Fund may be subsequently revised based on the information received from the MLPs and common stock after their tax reporting periods conclude.
Expenses are recorded on the accrual basis.
D. Dividends and Distributions to Shareholders. The Fund intends to make quarterly distributions from net income, which include the amount received as cash distributions from MLPs and common stock dividends. These activities will be reported in the Statements of Changes in Net Assets.
Dividends and distributions to shareholders are recorded on the ex- dividend date. The character of dividends and distributions to shareholders made during the period may differ from their ultimate characterization for federal income tax purposes. For the year ended November 30, 2020, the Fund’s dividends and distributions were expected to be comprised of 100% return of capital. The tax character of distributions paid for the year ended November 30, 2020, will be determined in early 2021.
E. Federal Income Taxation. The Fund, taxed as a corporation, is obligated to pay federal and state income tax on its taxable income. Currently, the federal income tax rate for a corporation is 21%.
The Fund invests its assets primarily in MLPs, which generally are treated as partnerships for federal income tax purposes. As a limited partner in the MLPs, the Fund reports its allocable share of the MLP’s taxable income in computing its own taxable income. The Fund’s tax expense or benefit is included in the Statement of Operations based on the component of income or gains (losses) to which such expense or benefit relates. Deferred income taxes reflect the net tax effects of temporary differences between the carrying amounts of assets and liabilities for financial reporting purposes and the amounts used for income tax purposes. A valuation allowance is recognized if, based on the weight of available evidence, it is more likely than not that some portion or all of the deferred income tax asset will not be realized.
The Fund’s policy is to classify interest and penalties associated with underpayment of federal and state income taxes as an income tax expense on the Statement of Operations. For the year ended November 30, 2020, the Fund did not have interest or penalties associated with underpayment of income taxes.
F. Indemnifications. Under the Fund’s organizational documents, its officers and trustees are indemnified against certain liabilities arising out of the performance of their duties to the Fund. In addition, in the normal course of business, the Fund may enter into contracts that provide general indemnification to other parties. The Fund’s maximum exposure under these arrangements is unknown, as this would involve future claims that may be made against the Fund that have not yet occurred, and may not occur. However, the Fund has not had prior claims or losses pursuant to these contracts.
3. Fair Value Measurements
Various inputs that are used in determining the fair value of the Fund’s investments are summarized in the three broad levels listed below:
| • | Level 1: quoted prices in active markets for identical securities that the Fund has the ability to access |
| • | Level 2: other significant observable inputs (including quoted prices for similar securities, interest rates, prepayment speeds, credit risk, etc.) |
| • | Level 3: significant unobservable inputs (including the Fund’s own assumptions in determining the fair value of investments) |
The inputs or methodology used for valuing securities are not necessarily an indication of the risk associated with investing in those securities.
These inputs are summarized in the three broad levels that follow.
annual report 2020 • 25
| Fair Value Measurements at Reporting Date Using: | ||||||||
| Description | Fair Value at November 30, 2020 |
Quoted Prices in Active Markets for Identical Assets (Level 1) |
Significant Other Observable Inputs (Level 2) |
Significant Unobservable Inputs (Level 3) |
||||
| Equity Securities | ||||||||
| Master Limited Partnerships and and Related Companies(1) | $784,161,300 | $784,161,300 | $ — | $ — | ||||
| Total | $784,161,300 | $784,161,300 | $ — | $ — | ||||
| (1) | All other industry classifications are identified in the Schedule of Investments. |
4. Concentration Risk
The Fund seeks to achieve its investment objective by investing, under normal market conditions, at least 80% of its net assets (plus any borrowings for investment purposes) in MLP interests under normal circumstances as determined in the prospectus.
5. Agreements and Related Party Transactions
The Trust has entered into an Investment Advisory Agreement (the “Agreement”) with Chickasaw Capital Management, LLC (the “Adviser”). Under the terms of the Agreement, the Fund pays the Adviser a fee, payable at the end of each calendar month, at an annual rate equal to 1.25% of the average daily net assets of the Fund.
The Adviser has agreed to waive its advisory fee and/or reimburse certain operating expenses of the Fund, until at least March 31, 2022, but only to the extent necessary so that the Fund’s total annual expenses, excluding brokerage fees and commissions; borrowing costs (such as (a) interest and (b) dividend expenses on securities sold short); taxes, including deferred income tax expense/(benefit) and franchise taxes; any indirect expenses, such as acquired fund fees and expenses; Class A 12b-1 fees, Class C 12b-1 fees, and extraordinary expenses, do not exceed 1.50% of the average daily net assets of each class of the Fund. Any payment by the Adviser of the Fund’s operating, organizational and offering expenses are subject to repayment by the Fund in the three fiscal years following the fiscal year in which the payment was made; provided that the Fund is able to make the repayment without exceeding the 1.50% expense limitation.
Waived fees and reimbursed Fund expenses, including prior year expenses, are subject to potential recoupment by year of expiration. During the year ended November 30, 2020, the Fund waived $56,553 of expenses and recouped the full amount before year end. At November 30, 2020, there were no prior year amounts subject to potential recoupment.
Certain Trustees and Officers of the Trust/Fund are also Officers of the Adviser or Vigilant Compliance, LLC (“Vigilant”).
The Fund has engaged Vigilant to provide compliance services including the appointment of the Fund’s Chief Compliance Officer. Effective October 1, 2015, the Fund pays Vigilant a monthly fee of $4,728 for net assets up to $1.7 billion, $5,228 for net assets between $1.7 billion and $2.0 billion, $5,728 for net assets between $2.0 billion and $2.5 billion, and $6,000 for net assets above $2.5 billion with each rate subject to a 2% annual increase.
The Fund has entered into a Rule 12b-1 distribution agreement with Quasar Distributors, LLC (“Quasar”). Class A shareholders pay Rule 12b-1 fees at the annual rate of 0.25% of average daily net assets. Class C shareholders pay Rule 12b-1 fees at the annual rate of 1.00% of average daily net assets. For the year ended November 30, 2020, 12b-1 distribution expenses of $90,575 and $208,600 were accrued by Class A and Class C shares, respectively. On November 25, 2019, U.S. Bancorp announced that it had signed a purchase agreement to sell Quasar to Foreside Financial Group, LLC (“Foreside”) such that Quasar would become a wholly-owned broker-dealer subsidiary of Foreside. The transaction closed in March 2020, and Quasar became a wholly-owned broker-dealer subsidiary of Foreside. Quasar remains the Fund’s distributor.
The Fund reimbursed the Advisor for fees paid to financial intermediaries such as banks, broker-dealers, financial advisors or other financial institutions for sub-transfer agency, sub-administration and other services that the financial intermediaries provided to their clients. The financial intermediaries are the record owners of the Fund on the Fund’s records through omnibus accounts, other group accounts, retirement plans or accounts traded through registered securities clearing agents. These fees are fees that the Fund is obligated to pay to such intermediaries, and the fees may vary based on, for example, the nature of services provided. The fees paid to such intermediaries by the Fund is only a portion of the full fee that is paid to the intermediaries, and the Advisor is obligated to pay the remaining amount. These amounts are included within 12b-1 distribution fees on the Statement of Operations.
26 | MainGate mlp fund
The Fund has engaged U.S. Bancorp Fund Services, LLC d/b/a U.S. Bank Global Fund Services (“Fund Services”) to provide administration and accounting services to the Fund. The Fund pays Fund Services a monthly fee computed at an annual rate of 0.10% of the first $75,000,000 of the Fund’s average daily net assets, 0.08% on the next $250,000,000 of average daily net assets and 0.05% on the balance of the Fund’s average daily net assets, with a minimum annual fee of $64,000 plus $12,000 per share class fee, imposed upon the Fund reaching certain asset levels.
Fund Services serves as the Fund’s transfer agent, dividend paying agent, and agent for the automatic dividend reinvestment plan. The Fund pays the transfer agent a $45,000 flat fee, imposed upon the Fund reaching certain asset levels, plus transaction and other out-of-pocket charges.
U.S. Bank, N.A. serves as the Fund’s custodian. The Fund pays the custodian a monthly fee computed at an annual rate of 0.0075% of the first $250 million of market value and 0.0050% of the balance, with a minimum annual fee of $4,800, imposed upon Fund reaching certain asset levels, plus transaction and other out-of-pocket charges.
6. Income Taxes
Deferred income taxes reflect the net tax effects of temporary differences between the carrying amounts of assets and liabilities for financial reporting purposes and the amounts used for income tax purposes. Such temporary differences are principally: (i) taxes on unrealized gains/(losses), which are attributable to the temporary difference between fair market value and tax basis, (ii) the net tax effects of temporary differences between the carrying amounts of assets and liabilities for financial reporting and income tax purposes and (iii) the net tax benefit of accumulated net operating losses and capital loss carryforwards. Deferred tax assets and liabilities are measured using effective tax rates expected to apply to taxable income in the years such temporary differences are realized or otherwise settled. To the extent the Fund has a deferred tax asset, consideration is given to whether or not a valuation allowance is required. A valuation allowance is required if, based on the evaluation criterion provided by ASC 740, Income Taxes (ASC 740), it is more likely-than-not some portion or all of the deferred tax asset will not be realized. Among the factors considered in assessing the Fund’s valuation allowance are: the nature, frequency and severity of current and cumulative losses, forecasts of future profitability, the duration of the statutory carryforward periods, significant redemptions, and the associated risks that operating and capital loss carryforwards may expire unused.
At November 30, 2020, the Fund determined a valuation allowance was required.
Changes to the factors considered in assessing the Fund’s valuation allowance may result in the Fund revising its position as to the recoverability of its deferred tax assets which may result in a change to the valuation allowance at a later date and could have a material impact on the Fund’s net asset value and results of operations in the period it is recorded.
Components of the Fund’s deferred tax assets and liabilities as of November 30, 2020, are as follows:
Deferred tax assets:
| Net operating loss carryforward (tax basis) | $47,904,534 |
| Capital loss carryforward (tax basis) | 111,954,797 |
| Other | 30,072 |
| Unrealized losses on investment securities (tax basis) – net | 17,713,589 |
| Total deferred tax asset | 177,602,992 |
| Valuation allowance | (177,602,992) |
| Net deferred tax asset | $— |
The net operating loss carryforward is available to offset future taxable income. The Fund has the following net operating loss and capital loss carryforward amounts:
| Fiscal Year Ended Net Operating Loss | Amount | Expiration | |
| November 30, 2015 | $10,794,764 | November 30, 2035 | |
| November 30, 2016 | 62,681,569 | November 30, 2036 | |
| November 30, 2017 | 77,956,625 | November 30, 2037 | |
| November 30, 2018 | 46,816,412 | November 30, 2038 | |
| November 30, 2020 | 10,875,710 | Indefinite | |
| Total Fiscal Year Ended Net Operating Loss | $209,125,080 |
| Fiscal Year Ended Net Capital Loss | Amount | Expiration | |
| November 30, 2016 | $146,278,454 | November 30, 2021 | |
| November 30, 2017 | 18,645,662 | November 30, 2022 | |
| November 30, 2018 | 13,056,608 | November 30, 2023 | |
| November 30, 2019 | 146,554,196 | November 30, 2024 | |
| November 30, 2020 | 166,572,154 | November 30, 2025 | |
| Total Fiscal Year Ended Net Capital Loss | $491,107,074 |
annual report 2020 • 27
For corporations, capital losses can only be used to offset capital gains and cannot be used to offset ordinary income. The capital loss may be carried forward for 5 years and, accordingly, would begin to expire as of November 30, 2021. The net operating loss prior to the Tax Cuts and Jobs Act (“TCJA”) can be carried forward for 20 years and, accordingly, would begin to expire as of November 30, 2035. Any NOLs arising in tax years beginning after December 31, 2017 will have an indefinite carry forward period. The TCJA also established a limitation for any NOLs generated in tax years beginning after December 31, 2017 to the lesser of the aggregate of available NOLs or 80% of taxable income before any NOL utilization. On March 27, 2020 the Coronavirus Aid, Relief, and Economic Stability Act (CARES Act) was signed into law. The CARES Act delays the application of the 80% net operating loss limitation to tax years ending November 30, 2022 and beyond.
Total income tax expense (current and deferred) differs from the amount computed by applying the federal statutory income tax rate of 21% to net investment income (loss) and realized and unrealized gains (losses) on investments before taxes for the year ended November 30, 2020, as follows:
| Total Tax Expense (Benefit) | Amount | Rate | |
| Tax Expense (Benefit) at Statutory Rates | $(47,213,971) | (21.00)% | |
| State Income Tax Expense (Benefit) | |||
| (Net of Federal Benefit) | (4,038,847) | (1.80)% | |
| Tax Expense (Benefit) on Permanent Items(1) | (277,169) | (0.12)% | |
| Provision to Return Adjustment | (452,116) | (0.20)% | |
| Change in State Rate | 605,540 | 0.27% | |
| Capital Loss Carry Forward Expiration | 3,697,720 | 1.64% | |
| Change in Valuation Allowance | 47,678,843 | 21.21% | |
| Total Tax Expense (Benefit) | — | 0.00% |
(1) Permanent Items are made up of dividends received deductions, non-deductible expenses from K-1s, and tax exempt income from K-1s.
At November 30, 2020, the Fund did not have a current tax expense or benefit due to the use of a valuation allowance.
At November 30, 2020, the tax cost basis of investments was $861,864,551 and gross unrealized appreciation and depreciation of investments for federal income tax purposes were as follows:
| Gross unrealized appreciation | $77,695,241 |
| Gross unrealized depreciation | (155,398,492) |
| Net unrealized depreciation | $(77,703,251) |
The differences between book-basis and tax-basis unrealized appreciation (depreciation) are primarily due to timing differences of income recognition from the Fund’s MLP investments and wash sales on security transactions.
The Fund recognizes the tax benefits of uncertain tax positions only where the position is “more likely than not” to be sustained assuming examination by tax authorities. Management has analyzed the Fund’s tax positions, and has concluded that no liability for unrecognized tax benefits should be recorded related to uncertain tax positions taken on U.S. tax returns and state tax returns filed or expected to be filed since inception of the Fund. No income tax returns are currently under examination. The tax years since 2017 remain subject to examination by the tax authorities in the United States. Due to the nature of the Fund’s investments, the Fund may be required to file income tax returns in several states. The Fund is not aware of any tax positions for which it is reasonably possible that the total amounts of unrecognized tax benefits will change materially in the next 12 months.
7. Investment Transactions
For the year ended November 30, 2020, the Fund purchased (at cost) and sold securities (proceeds) in the amount of $336,202,422 and $300,966,390 (excluding short-term securities), respectively.
28 | MainGate mlp fund
8. Share Transactions
Transactions of shares of the Fund were as follows:
| Year Ended November 30, 2020 | Year Ended November 30, 2019 | ||||||||
| Class A Shares | Amount | Shares | Amount | Shares | |||||
| Sold | $10,233,488 | 2,591,548 | $16,308,566 | 2,389,575 | |||||
| Dividends Reinvested | 3,132,301 | 765,526 | 5,562,067 | 809,883 | |||||
| Redeemed | (29,822,750) | (6,795,337) | (37,124,308) | (5,462,695) | |||||
| Net Decrease | $(16,456,961) | (3,438,263) | $(15,253,675) | (2,263,237) | |||||
| Year Ended November 30, 2020 | Year Ended November 30, 2019 | ||||||||
| Class C Shares | Amount | Shares | Amount | Shares | |||||
| Sold | $1,876,508 | 403,978 | $4,039,965 | 617,242 | |||||
| Dividends Reinvested | 1,961,446 | 499,151 | 3,626,108 | 545,947 | |||||
| Redeemed | (11,102,286) | (2,699,961) | (16,330,074) | (2,502,522) | |||||
| Net Decrease | $(7,264,332) | (1,796,832) | $(8,664,001) | (1,339,333) | |||||
| Year Ended November 30, 2020 | Year Ended November 30, 2019 | ||||||||
| Class I Shares | Amount | Shares | Amount | Shares | |||||
| Sold | $674,892,922 | 158,647,941 | $743,222,753 | 106,443,839 | |||||
| Dividends Reinvested | 69,930,862 | 17,091,869 | 82,181,907 | 11,666,212 | |||||
| Redeemed | (676,168,596) | (157,742,884) | (803,430,285) | (117,890,158) | |||||
| Net Increase | $68,655,188 | 17,996,926 | $21,974,375 | 219,893 | |||||
9. Risk Factors
The recent global outbreak of COVID-19 has disrupted economic markets and the prolonged economic impact is uncertain. The operational and financial performance of the issuers of securities in which the Fund invests depends on future developments, including the duration and spread of the outbreak, and such uncertainty may in turn impact the value of the Fund’s investments. COVID-19 has had a material adverse effect on global, national and local economies, which could impact MLPs and midstream companies in which the Fund invests as a result of lower energy prices and an uncertain outlook, which could limit production growth and drive increased credit risk for MLP counterparties.
10. Subsequent Events
The Fund has adopted standards which establish general standards of accounting for disclosure of events that occur after the Statement of Assets and Liabilities date, but before the financial statements are issued. The Fund has performed an evaluation of subsequent events through the date the financial statements were issued.
On January 11, 2021 the Fund declared a distribution payable of $0.100 per share, to Class A shareholders, Class C shareholders, and Class I shareholders of record on January 15, 2021, and payable on January 20, 2021.
annual report 2020 • 29
Report of Independent Registered
Public Accounting Firm
To the Shareholders of MainGate MLP Fund and
Board of Trustees of MainGate Trust
Opinion on the Financial Statements
We have audited the accompanying statement of assets and liabilities, including the schedule of investments, of MainGate Trust comprising MainGate MLP Fund (the “Fund”) as of November 30, 2020, the related statement of operations for the year then ended, the statements of changes in net assets for each of the two years in the period then ended, the related notes, and the financial highlights for each of the five years in the period then ended (collectively referred to as the “financial statements”). In our opinion, the financial statements present fairly, in all material respects, the financial position of the Fund as of November 30, 2020, the results of its operations for the year then ended, the changes in net assets for each of the two years in the period then ended, and the financial highlights for each of the five years in the period then ended, in conformity with accounting principles generally accepted in the United States of America.
Basis for Opinion
These financial statements are the responsibility of the Fund’s management. Our responsibility is to express an opinion on the Fund’s financial statements based on our audits. We are a public accounting firm registered with the Public Company Accounting Oversight Board (United States) (“PCAOB”) and are required to be independent with respect to the Fund in accordance with the U.S. federal securities laws and the applicable rules and regulations of the Securities and Exchange Commission and the PCAOB.
We conducted our audits in accordance with the standards of the PCAOB. Those standards require that we plan and perform the audit to obtain reasonable assurance about whether the financial statements are free of material misstatement whether due to error or fraud.
Our audits included performing procedures to assess the risks of material misstatement of the financial statements, whether due to error or fraud, and performing procedures that respond to those risks. Such procedures included examining, on a test basis, evidence regarding the amounts and disclosures in the financial statements. Our procedures included confirmation of securities owned as of November 30, 2020, by correspondence with the custodian. Our audits also included evaluating the accounting principles used and significant estimates made by management, as well as evaluating the overall presentation of the financial statements. We believe that our audits provide a reasonable basis for our opinion.
We have served as the Fund’s auditor since 2011.

COHEN & COMPANY, LTD.
Milwaukee, Wisconsin
January 28, 2021
30 | MainGate mlp fund
November 30, 2020 | unaudited
Set forth below is information with respect to each of the Trustees and Officers of the Fund, including their principal occupation during the past five years. The business address of the Fund, its Trustees and Officers is 6075 Poplar Ave., Suite 720, Memphis, TN 38119.
| Name and Age | Position(s) with Trust, Term of Office and Length of Time Served |
Principal Occupation(s) During Past Five Years |
Number of Portfolios in Fund Complex Overseen by Trustee |
Other Directorships Held by Trustee During Past Five Years |
||||
| Independent Trustees | ||||||||
| Robert A. Reed Age: 54 |
Lead Independent Trustee since January 2011 | President, CEO and founder, ABC Polymer Industries, LLC since 1994 | 1 | Director, Oakworth Capital Bank since 2008; Director, Robert E. Reed Gastrointestinal Oncology Research Foundation, 2001-present; Member of the Young Presidents Organization International, 2010; Member, Society of International Business Fellows, 1999-present | ||||
| Darrison N. Wharton Age: 49 |
Independent Trustee since January 2011 | Vice President and Client Advocate, Willis Towers Watson/Willis of Tennessee, Inc. in Memphis, TN since 2005 | 1 | Board member, Goodwill Club of the Boys and Girls Clubs of Greater Memphis since 2009; President, Phoenix Club, a non-profit group dedicated to raising money for the Boys and Girls Clubs of Greater Memphis from 2006-2007 | ||||
| David C. Burns, CPA Age: 59 |
Independent Trustee and Chairman of the Audit Committee since January 2011 | Partner and cofounder, Cross Keys Capital, LLC since 2004; Managing Director and Principal,
Sundial Group, LLC since April 2012 |
1 | Board member, Ryan Taylor & Co. since 2002; Board member, The Haven since 2007; Board member, Mountainside Holdings since 2011 | ||||
| Marshall K. Gramm Age: 47 |
Independent Trustee since January 2011 | Associate Professor of Economics, Rhodes College, 2006-present | 1 | None | ||||
| Barry A. Samuels, CPA Age: 55 |
Independent Trustee since January 2011 | Private investor, 2009 to present; Director-Private Wealth Management, Deutsche Bank, 2003 to 2009 | 1 | None | ||||
| Moss W. Davis Age: 58 |
Independent Trustee and Chairman of the Pricing Committee since January 2011 | Vice President-Southeast Region and Head of Atlanta Office, RCG Global Services, Inc., 2020 to present; Principal, Collective Insights Consulting, 2018 to 2020; Managing Director and head of Atlanta, GA office, Midtown Consulting Group, 2012 to 2018; President and Founder, Fairview Consulting Group, 2008 to 2012; Vice President, Experient Group, Consulting and Staffing Firm, 2005 to 2008 | 1 | None | ||||
| Interested Trustees and Officers | ||||||||
| Matthew G. Mead(1) Age: 53 |
Interested Trustee, President and Chief Executive Officer since January 2011 | Principal, Chickasaw Capital Management, LLC since 2003; President, Chickasaw Securities | 1 | Director, Oakworth Capital Bank; Director, AGRI, Inc. | ||||
| Geoffrey Mavar(1) Age: 58 |
Chairman of the Board, Interested Trustee, Treasurer and Chief Financial Officer since January 2011 | Principal, Chickasaw Capital Management, LLC since 2003; Secretary, Chickasaw Securities | 1 | None | ||||
| Gerard Scarpati Age: 65 |
Chief Compliance Officer since April 2013 | Compliance Director, Vigilant Compliance, LLC , 2010 to present; Independent Consultant to the Securities Industry, 2004 to 2010 | 1 | None | ||||
| Salvatore Faia Age: 58 |
Assistant Compliance Officer since April 2013; Chief Compliance Officer from January 2011 to April 2013 | President, Vigilant Compliance, LLC Chairman, ELP Growth and Income Mutual Fund since 2017; Director since 2005 President, RBB Fund, Inc. Mutual Fund since 2009 | 1 | Trustee, EIP Growth & Income Fund | ||||
| (1) | This person’s status as an “interested” Trustee arises from his affiliation with the Adviser. |
annual report 2020 • 31
Additional Information | unaudited
November 30, 2020
Trustee and Officer Compensation
The Fund does not compensate any of its trustees who are interested persons nor any of its officers. For the year ended November 30, 2020, the aggregate compensation paid by the Fund to the independent trustees was $96,000. The Fund did not pay any special compensation to any of its trustees or officers. The Fund’s Statement of Additional Information includes additional information about the trustees and is available on the Fund’s Web site at www.maingatefunds.com or the SEC’s Web site at www.sec.gov.
Cautionary Note Regarding Forward-Looking Statements
This report contains “forward-looking statements” as defined under the U.S. federal securities laws. Generally, the words “believe,” “expect,” “intend,” “estimate,” “anticipate,” “project,” “will” and similar expressions identify forward-looking statements, which generally are not historical in nature. Forward-looking statements are subject to certain risks and uncertainties that could cause actual results to materially differ from the Fund’s historical experience and its present expectations or projections indicated in any forward-looking statements. These risks include, but are not limited to, changes in economic and political conditions; regulatory and legal changes; MLP industry risk; concentration risk; energy sector risk; commodities risk; MLP and other tax risks, such as deferred tax assets and liabilities risk; and other risks discussed in the Fund’s filings with the SEC. You should not place undue reliance on forward-looking statements, which speak only as of the date they are made. The Fund undertakes no obligation to update or revise any forward-looking statements made herein. There is no assurance that the Fund’s investment objectives will be attained.
Proxy Voting Policies
A description of the policies and procedures that the Fund uses to determine how to vote proxies relating to portfolio securities owned by the Fund and information regarding how the Fund voted proxies relating to the portfolio of securities during the most recent 12-month period ended June 30 is available to shareholders without charge by visiting the SEC’s Web site at www.sec.gov.
Portfolio Holdings Disclosure
The Fund files its complete schedule of portfolio holdings for the first and third quarters of each fiscal year with the SEC on Part F of Form N-PORT. The Fund’s Part F of Form N-PORT and statement of additional information are available without charge by visiting the SEC’s Web site at www.sec.gov. In addition, you may review and copy the Fund’s Part F of Form N-PORT at the SEC’s Public Reference Room in Washington D.C. You may obtain information on the operation of the Public Reference Room by calling (800) SEC-0330.
Householding
In an effort to decrease costs, the Fund intends to reduce the number of duplicate prospectuses, annual and semi-annual reports, proxy statements and other similar documents you receive by sending only one copy of each to those addresses shared by two or more accounts and to shareholders that the Transfer Agent reasonably believes are from the same family or household. Once implemented, if you would like to discontinue householding for your accounts, please call toll-free at 855.MLP.FUND (855.657.3863) to request individual copies of these documents. Once the Transfer Agent receives notice to stop householding, the Transfer Agent will begin sending individual copies thirty days after receiving your request. This policy does not apply to account statements.
Liquidity Risk Management Program
In accordance with Rule 22e-4 under the Investment Company Act of 1940, as amended, the Fund has adopted a written liquidity risk management program (the “Program”) designed to assess and manage the Fund’s liquidity risk, which is the risk that the Fund could not meet shareholder redemption requests without significant dilution of remaining Fund shareholders. The Board of Trustees has approved the appointment of the Adviser to administer the Program. The Adviser uses certain market and liquidity classification data provided by a third party in fulfilling its responsibilities as the administrator of the Program.
Rule 22e-4 and the Program further require the Board of Trustees to review, no less frequently than annually, a written report prepared by the Adviser that addresses the operation of the Program and assesses its adequacy and effectiveness of implementation, including, if applicable, any material changes to the Program. The Adviser presented the first such annual report on the Program to the Board of Trustees at a meeting of the Board of Trustees held in April 2020. The report covered the period since the full implementation of the Program on June 1, 2019 to March 31, 2020 and addressed the assessment, management and review of the Fund’s liquidity risk by the Adviser as administrator of the Program, as well as the Adviser’s classification of the liquidity of the Fund’s portfolio investments. The Adviser recommended in the report that the Fund continue to determine that it primarily holds assets that are highly liquid investments, and thus not adopt a highly liquid investment minimum. The Adviser concluded in the report that the Program is reasonably designed to assess and manage the Fund’s liquidity risk, and has operated adequately and effectively to manage the Fund’s liquidity risk during the period covered by the report. In addition, the Adviser concluded in the report that there were no liquidity events during the period covered by the report that materially adversely impacted the Fund’s ability to timely meet redemptions without dilution to existing shareholders, and that no material changes were made to the Program since its full implementation.
32 | MainGate mlp fund
The following is a description of the Fund’s policies regarding disclosure of nonpublic personal information that you provide to the Fund or that the Fund collects from other sources. In the event that you hold shares of the Fund through a broker-dealer or other financial intermediary, the privacy policy of your financial intermediary would govern how your nonpublic personal information would be shared with nonaffiliated third parties.
Categories of Information the Fund Collects. The Fund collects the following nonpublic personal information about you:
| • | Information the Fund receives from you on applications or other forms, correspondence, or conversations (such as your name, address, phone number, social security number, and date of birth); and |
| • | Information about your transactions with the Fund, its affiliates, or others (such as your account number and balance, payment history, cost basis information, and other financial information). |
Categories of Information the Fund Discloses. The Fund does not disclose any nonpublic personal information about its current or former shareholders to unaffiliated third parties, except as required or permitted by law. The Fund is permitted by law to disclose all of the information it collects, as described above, to service providers (such as the Fund’s custodian, administrator, transfer agent, accountant and legal counsel) to process your transactions and otherwise provide services to you.
Confidentiality and Security. The Fund restricts access to your nonpublic personal information to those persons who require such information to provide products or services to you. The Fund maintains physical, electronic, and procedural safeguards that comply with federal standards to guard your nonpublic personal information.
Disposal of Information. The Fund, through its transfer agent, has taken steps to reasonably ensure that the privacy of your nonpublic personal information is maintained at all times, including in connection with the disposal of information that is no longer required to be maintained by the Fund. Such steps shall include, whenever possible, shredding paper documents and records prior to disposal, requiring off-site storage vendors to shred documents maintained in such locations prior to disposal, and erasing and/or obliterating any data contained on electronic media in such a manner that the information can no longer be read or reconstructed.
annual report 2020 • 33
November 30, 2020
Board of Trustees
Geoffrey P. Mavar*, Chairman of the Board
Robert A. Reed, Lead Independent Trustee
David C. Burns, Independent Trustee
Moss W. Davis, Independent Trustee
Marshall K. Gramm, Independent Trustee
Matthew G. Mead*, Interested Trustee
Barry A. Samuels, Independent Trustee
Darrison N. Wharton, Independent Trustee
Officers
Matthew G. Mead*, President and Chief Executive Officer
Geoffrey P. Mavar*, Treasurer and Chief Financial Officer
Gerard Scarpati, Chief Compliance Officer
Andrew E. Garrett*, Secretary
Investment Adviser
Chickasaw Capital Management, LLC
6075 Poplar Avenue, Suite 720, Memphis, TN 38119
Distributor
Quasar Distributors, LLC
111 East Kilbourn Avenue, Suite 2200, Milwaukee, WI 53202
Custodian
U.S. Bank, N.A.
1555 North River Center Drive, Suite 302, Milwaukee, WI 53212
Transfer Agent
U.S. Bancorp Fund Services, LLC
615 East Michigan Street, 3rd Floor, Milwaukee, WI 53202
Administrator
U.S. Bancorp Fund Services, LLC
d/b/a U.S. Bank Global Fund Services
811 East Wisconsin Avenue, 8th Floor, Milwaukee, WI 53202
Legal Counsel
Bryan Cave Leighton Paisner LLP
One Metropolitan Square, St. Louis, MO 63102
Independent Registered Public Accounting Firm
Cohen & Company, Ltd.
342 North Water Street, Suite 830, Milwaukee, WI 53202
*Employed by Chickasaw Capital Management, LLC.
34 | MainGate mlp fund
Notes
annual report 2020 • 35
Notes
36 | MainGate mlp fund
Notes
annual report 2020 • 37
Notes
38 | MainGate mlp fund
Notes
annual report 2020 • 39

| Mutual fund investing involves risk. Principal loss is possible. | Must be preceded or accompanied by a prospectus. |
| BACK COVER | NOT PART OF REPORT | Quasar Distributors, LLC, distributor. |
|
FYE 11/30/2020
|
FYE 11/30/2019
|
|
|
Audit Fees
|
$41,800
|
$41,900
|
|
Audit-Related Fees
|
None
|
None
|
|
Tax Fees
|
27,000
|
20,500
|
|
All Other Fees
|
None
|
None
|
|
FYE 11/30/2020
|
FYE 11/30/2019
|
|
|
Audit-Related Fees
|
0%
|
0%
|
|
Tax Fees
|
0%
|
0%
|
|
All Other Fees
|
0%
|
0%
|
|
Non-Audit Related Fees
|
FYE 11/30/2020
|
FYE 11/30/2019
|
|
Registrant
|
None
|
None
|
|
Registrant’s Investment Adviser
|
None
|
None
|
|
(a)
|
Schedule of Investments is included as part of the report to shareholders filed under Item 1 of this Form.
|
|
(b)
|
Not Applicable.
|
|
(a)
|
The Registrant’s President and Chief Executive Officer and Treasurer and Chief Financial Officer have reviewed the Registrant's disclosure controls and procedures (as defined in Rule 30a-3(c) under the Investment Company Act of 1940
(the “Act”)) as of a date within 90 days of the filing of this report, as required by Rule 30a-3(b) under the Act and Rules 13a-15(b) or 15d‑15(b) under the Securities Exchange Act of 1934. Based on their review, such officers have
concluded that the disclosure controls and procedures are effective in ensuring that information required to be disclosed in this report is appropriately recorded, processed, summarized and reported and made known to them by others within
the Registrant and by the Registrant’s service provider.
|
|
(b)
|
There were no changes in the Registrant's internal control over financial reporting (as defined in Rule 30a-3(d) under the Act) that occurred during the second fiscal quarter of the period covered by this report that has materially
affected, or is reasonably likely to materially affect, the Registrant's internal control over financial reporting.
|
|
1.
|
I have reviewed this report on Form N-CSR of MainGate Trust;
|
|
2.
|
Based on my knowledge, this report does not contain any untrue statement of a material fact or omit to state a material fact necessary to make the statements made, in light of the circumstances under which such statements were made,
not misleading with respect to the period covered by this report;
|
|
3.
|
Based on my knowledge, the financial statements, and other financial information included in this report, fairly present in all material respects the financial condition, results of operations, changes in net assets, and cash flows (if
the financial statements are required to include a statement of cash flows) of the registrant as of, and for, the periods presented in this report;
|
|
4.
|
The registrant’s other certifying officer(s) and I are responsible for establishing and maintaining disclosure controls and procedures (as defined in Rule 30a-3(c) under the Investment Company Act of 1940) and internal control over
financial reporting (as defined in Rule 30a-3(d) under the Investment Company Act of 1940) for the registrant and have:
|
|
(a)
|
Designed such disclosure controls and procedures, or caused such disclosure controls and procedures to be designed under our supervision, to ensure that material information relating to the registrant, including its consolidated
subsidiaries, is made known to us by others within those entities, particularly during the period in which this report is being prepared;
|
|
(b)
|
Designed such internal control over financial reporting, or caused such internal control over financial reporting to be designed under our supervision, to provide reasonable assurance regarding the reliability of financial reporting
and the preparation of financial statements for external purposes in accordance with generally accepted accounting principles;
|
|
(c)
|
Evaluated the effectiveness of the registrant's disclosure controls and procedures and presented in this report our conclusions about the effectiveness of the disclosure controls and procedures, as of a date within 90 days prior to the
filing date of this report based on such evaluation; and
|
|
(d)
|
Disclosed in this report any change in the registrant’s internal control over financial reporting that occurred during the second fiscal quarter of the period covered by this report that has materially affected, or is reasonably likely
to materially affect, the registrant’s internal control over financial reporting; and
|
|
5.
|
The registrant’s other certifying officer(s) and I have disclosed to the registrant’s auditors and the audit committee of the registrant’s board of directors (or persons performing the equivalent functions):
|
|
(a)
|
All significant deficiencies and material weaknesses in the design or operation of internal control over financial reporting which are reasonably likely to adversely affect the registrant’s ability to record, process, summarize, and
report financial information; and
|
|
(b)
|
Any fraud, whether or not material, that involves management or other employees who have a significant role in the registrant’s internal control over financial reporting.
|
|
Date: February 5, 2021
|
/s/ Matthew G. Mead
Matthew G. Mead
President & Chief Executive Officer |
|
|
1.
|
I have reviewed this report on Form N-CSR of MainGate Trust;
|
|
2.
|
Based on my knowledge, this report does not contain any untrue statement of a material fact or omit to state a material fact necessary to make the statements made, in light of the circumstances under which such statements were made,
not misleading with respect to the period covered by this report;
|
|
3.
|
Based on my knowledge, the financial statements, and other financial information included in this report, fairly present in all material respects the financial condition, results of operations, changes in net assets, and cash flows (if
the financial statements are required to include a statement of cash flows) of the registrant as of, and for, the periods presented in this report;
|
|
4.
|
The registrant’s other certifying officer(s) and I are responsible for establishing and maintaining disclosure controls and procedures (as defined in Rule 30a-3(c) under the Investment Company Act of 1940) and internal control over
financial reporting (as defined in Rule 30a-3(d) under the Investment Company Act of 1940) for the registrant and have:
|
|
(a)
|
Designed such disclosure controls and procedures, or caused such disclosure controls and procedures to be designed under our supervision, to ensure that material information relating to the registrant, including its consolidated
subsidiaries, is made known to us by others within those entities, particularly during the period in which this report is being prepared;
|
|
(b)
|
Designed such internal control over financial reporting, or caused such internal control over financial reporting to be designed under our supervision, to provide reasonable assurance regarding the reliability of financial reporting
and the preparation of financial statements for external purposes in accordance with generally accepted accounting principles;
|
|
(c)
|
Evaluated the effectiveness of the registrant’s disclosure controls and procedures and presented in this report our conclusions about the effectiveness of the disclosure controls and procedures, as of a date within 90 days prior to the
filing date of this report based on such evaluation; and
|
|
(d)
|
Disclosed in this report any change in the registrant’s internal control over financial reporting that occurred during the second fiscal quarter of the period covered by this report that has materially affected, or is reasonably likely
to materially affect, the registrant’s internal control over financial reporting; and
|
|
5.
|
The registrant’s other certifying officer(s) and I have disclosed to the registrant’s auditors and the audit committee of the registrant’s board of directors (or persons performing the equivalent functions):
|
|
(a)
|
All significant deficiencies and material weaknesses in the design or operation of internal control over financial reporting which are reasonably likely to adversely affect the registrant’s ability to record, process, summarize, and
report financial information; and
|
|
(b)
|
Any fraud, whether or not material, that involves management or other employees who have a significant role in the registrant’s internal control over financial reporting.
|
|
Date: February 5, 2021
|
/s/ Geoffrey P. Mavar
Geoffrey P. Mavar
Treasurer & Chief Financial Officer |
|
/s/ Matthew G. Mead
Matthew G. Mead
President & Chief Executive Officer, MainGate Trust
|
/s/ Geoffrey P. Mavar
Geoffrey P. Mavar
Treasurer & Chief Financial Officer, MainGate Trust
|
|
Dated: February 5, 2021
|
Serious News for Serious Traders! Try StreetInsider.com Premium Free!
You May Also Be Interested In
- Grifols 2023 Annual Report on Form 20-F filed with the SEC
- Welaxy Transforms Home Organization With Eco-Friendly Organizers Crafted From Recycled Ocean Waste
- Celularity Inc. Announces Receipt of Nasdaq Notice Regarding Late Form 10-K Filing
Create E-mail Alert Related Categories
SEC FilingsSign up for StreetInsider Free!
Receive full access to all new and archived articles, unlimited portfolio tracking, e-mail alerts, custom newswires and RSS feeds - and more!
