

Form N-CSR MUTUAL FUND SERIES TRUST For: Sep 30
 Tweet
Tweet Share
Shareunited
states
securities and exchange commission
washington, d.c. 20549
form n-csr
certified shareholder report of registered management
investment companies
Investment Company Act file number 811-21872
Mutual Fund Series Trust
(Exact name of registrant as specified in charter)
225 Pictoria Drive, Suite 450, Cincinnati, Ohio 45246
(Address of principal executive offices) (Zip code)
CT CORPORATION SYSTEM
1300 EAST NINTH STREET, CLEVELAND, OH 44114
(Name and address of agent for service)
Registrant's telephone number, including area code: 631-470-2619
Date of fiscal year end: 9/30
Date of reporting period: 9/30/19
ITEM 1. REPORTS TO SHAREHOLDERS.
ANNUAL REPORT
Camelot Premium Return Fund
Camelot Excalibur Small Cap Income Fund
September 30, 2019
Camelot Funds, LLC
1700 Woodlands Dr.
Suite 100
Maumee, OH 43537
Beginning January 1, 2021, the Funds intend to meet their shareholder report delivery obligations by posting annual and semi-annual shareholder reports to the Funds’ website, www.camelotfunds.com rather than delivering paper copies. You will be notified by mail each time a report is posted and provided with the website link to access the report. You may elect to receive paper copies of a specific shareholder report or all future shareholder reports free of charge by contacting your financial intermediary (such as a broker-dealer or bank), or, if you are a direct investor, by following the instructions included with this annual report. If you already elected to receive shareholder reports electronically, you will not be affected by this change and you do not need to do anything.

Dear Fellow Shareholders,
Greetings - welcome to Camelot! We are honored to serve you and blessed to have your trust. We would not exist without you, so we strive to serve you with excellence and integrity.
The strategies of our two funds are very similar, so much of the commentary for the Camelot Premium Return Fund will apply to the Camelot Excalibur Small Cap Income Fund. The commentary for Camelot Excalibur Small Cap Income Fund will focus on the areas that are different from the Camelot Premium Return Fund.
Camelot – Premium Return Fund
We are disappointed with our results for fiscal 2019 as the Camelot Premium Return Fund delivered what we believe to be unattractive total returns for the fiscal year, but continued to deliver consistent cash flows. The strong declines in U.S. equity markets during Q4 2018 were more severe and persistent than we expected, so our opportunistic buying was too early and led to a very poor start to the fiscal year. We have recovered well over the last three quarters and believe the recovery is not yet complete.
According to Morningstar, our performance for Class I shares ranked in the 83rd percentile in our category for the 1 year period ending 9/30/2019 out of 141 funds. The A Shares were ranked in the 48th & 60th percentiles for the trailing 3 and 5 year periods respectively.
| Annualized Total Returns (%) | Inception | |||||||||||
| Q3 | YTD | 1 Year | 3 Year | 5 Year | (12/31/2010) | |||||||
| Camelot Premium Return Fund Class A – CPRFX - Load Waived | -1.89% | 22.32% | -2.99% | 4.94% | 3.31% | 6.23% | ||||||
| Camelot Premium Return Fund Class A – CPRFX - With Load | -7.54% | 15.27% | -8.56% | 2.90% | 2.10% | 5.52% | ||||||
| Camelot Premium Return Fund Class I – CPRIX | -1.79% | 22.49% | -2.78% | N/A | N/A | 4.25% | ||||||
| Options Based | 0.83% | 10.18% | 1.03% | 4.18% | 3.09% | 4.49% | ||||||
The maximum sales charge (load) for Class A is 5.75%. Dividends are not assured. The performance data quoted here represents past performance. Current performance may be lower or higher than the performance data quoted above. Investment return and principal value will fluctuate, so that shares, when redeemed, may be worth more or less than their original cost. Past performance is no guarantee of future results. For performance information current to the most recent month-end, please call toll-free 855-226-3863. (Data source from both Morningstar and Gemini 9.30.19)
While we are competitive by nature and desire to be at the top of our category each year, we know that is likely not always possible. Ultimately, our focus is on delivering consistent income and reinvestment of capital for the long-term. We believe investing, by nature, is a long-term process and requires at least five years to properly evaluate results. This will be our focus and the basis for our decision-making process. Our desire is to partner with you, the investor, to deliver on our specified objectives for many years to come, so you have a great investing experience, and consistent returns.
We believe investing is like growing an orchard. The true value is in the fruit that is produced each year. In the short term, the value of each tree and the whole orchard will fluctuate. But over time, the value of the orchard will reflect the consistent and growing yield coming from the trees each year. This is what we seek to do for our investors – create an orchard of investments that produce yield (cash flow) year after year.
While short-term returns can vary significantly, our focus is on cash flow – generation seeking investments that produce cash flow now and are likely to do so long into the future. As we have no control over short-term market fluctuations, we suggest only investing in our funds if you intend to hold them for at least 3-5 years. A decision to invest should be based on our long-term track record it would be foolish to sell based on a short-term (less than 3 years) result.
We consider each investor in our fund to be a partner. We are honored to meet many of you and know there are many more we will never meet. Even so, we value each one and are honored to serve you.
1
Objective 1 - High Rate of Gains / Cash Flow
While total return results are best gauged over a period of 5 years or more, cash flow can give investors something to hold on to in the shorter term. In this fund, cash flow is our primary focus. We want retirees and those close to retirement to feel confident in the stability of their cash flow – which is more important than total return to their daily lifestyle. At the same time, due to the currently low interest rates, many retirees must maintain exposure to equities to reduce the probability of outliving their savings. While the flat income streams from many retirement income vehicles may fail to keep up with inflation, this fund seeks to provide an income stream that will increase over time to keep up and/or outpace inflation.
Reinvesting this cash flow can be a great way for younger investors to build wealth as well.
We have delivered a quarterly target distribution for the past 34 quarters and have paid our target of $.14 on Class A shares over the past four quarters. We remain focused on our objective of maintaining and increasing this distribution in the future.
Objective 2 - Total Return
Nearly all investors hope to realize strong total returns and we have utilized this strategy for over a decade to do so. As mentioned above, this is a long-term objective, best evaluated over periods of at least five years. Our trailing 5 year annualized return is 3.31%, which puts us in the 60th percentile for our Morningstar category Option Writing. We will continue to evaluate rolling 5 year periods moving forward.
Objective 3 - Lower volatility than common stocks
One of the best ways to help investors stay invested during difficult times is to reduce the volatility they experience. This can often be a difficult proposition when trying to fulfill income and total return objectives as well. This fund seeks to do all three, but will give preference to the first two.
Achieving this objective has been elusive as the markets recently experienced a few bouts of extreme volatility after having experienced much lower than normal volatility over the previous 5-6 years. We believe this may be ushering in a multi-year period with above average market volatility. We believe our strategy will be able to demonstrate lower relative volatility in those conditions.
We don’t believe daily volatility (beta) is what concerns most investors. The primary concern, and therefore ours in this objective, is the size of a pullback in a down market. We seek to experience even less drawdown in such periods. This is a more difficult measure as we don’t know when or why pullbacks will occur, but we believe there are things we can do to increase the probability of success in this area while still keeping the priority of our first two objectives.
At the same time, we welcome volatility in the market as it typically provides for greater option premiums and long-term buying opportunities. While volatility can be painful in the short-run, especially when it is not expected, we must be willing to accept some of it to achieve attractive real returns over time.
Conclusion
We are not pleased with our performance this year and will work diligently to improve the results in the coming year. We believe there have been significant and material changes to certain market dynamics to which we much adapt, so we are actively working to do so.
Thank you for the opportunity to serve you. We don’t take it for granted. We will continue to work tirelessly to deliver solid results moving forward.
Market Review
The near relentless growth in the equity markets we mentioned last year came to an abrupt halt in the fourth quarter of 2018 as the Federal Reserve continued to raise interest rates in the face of slowing economic growth. After suggesting 2-3 more increases were in store for 2019, the Fed relented and has actually cut rates twice so far in 2019, leading the equity markets to recover from the 2018 decline and rally to new highs.
2
After peaking around 3.2% at the end of September, 2018, interest rates have dropped in half as the U.S. 10 year treasury fell from 3.2% to below 1.5% in August, 2019. This led to strongly positive returns for most parts of the bond market. This raises concerns about future duration risk although the inverted yield curve suggests a low likelihood of rising rates in the near future.
Oil prices reversed from their strong recovery, dropping from over $70 a barrel into the low $50s despite unrest in the Middle East. The energy sector continued its weak returns and has fallen to account for just 5% of the S&P 500 market capitalization, a near-record low. Last year, we conceded oil may stabilize higher than the $60 level we suggested the year before, but was likely near its highs. Now, $60 looks outright optimistic and would likely lead to a sizeable rally in energy stocks if it materialized.
The Federal Reserve ended the process of shrinking its’ balance sheet and has had to reverse course already as liquidity problems developed in the overnight lending repo markets. The Federal Funds rate target decreased to 2.0% in September 2019, with little consensus whether the next move will be higher or lower.
The market volatility we have been expecting showed up with a vengeance and quickly exceeded our expectations. We continue to believe it is likely volatility will be heightened for the next 4-5 years. This doesn’t necessarily mean the market will do poorly, but it will likely shake out skittish investors and create opportunities for us.
Camelot - Premium Return Fund Commentary
Returns – The return for the Fund for this fiscal year was -2.78% (Class I shares)1 versus 1.03% for the average fund in our Morningstar Category (Options-based).
Sector Weightings – we make no attempt to match our sector weightings to any particular benchmark or index.
Contributors – We had realized gains spread over dozens of positions, most of which were put and call options. We also had $1.4 million in net investment income (dividends and interest). Premiums received from option writing contributed over $4.2 million in realized gains. Our greatest contributors were Chipotle (CMG), TC Energy Corp (TRP), Vereit Inc. (VER), Under Armour Inc. (UAA), a variety of Puerto Rico Bonds, and a short position in VXX, several of which had been significant detractors in previous years and staged strong recoveries.
Detractors – Cemex (CX), Fluor Corp (FLR), GameStop Corp (GME), Office Properties Income Trust (OPI), & Tata Motors (TTM).
Our largest equity positions are Cemex (4.45%), Energy Transfer LP (4.29%) & Ford Motor Company (4.07%).
New Positions – As our option writing strategy naturally produces higher turnover, we initiated dozens of new positions, which will almost always be the case.
Eliminated Positions – Due to the nature of our option based strategy, we had dozens of positions throughout the fiscal year which we no longer hold.
Current Portfolio – As of fiscal year-end, our portfolio composition is in balance between equity holdings (dividend-paying stocks and/or stocks with covered calls) and put positions. We typically seek to have more than 50% of our portfolio in an option writing position (put or covered call). Even so, we are currently allocated more conservatively than normal as we believe there are currently elevated risks to the markets. However, the portfolios composition will fluctuate over time as markets fluctuate and different positions become more attractive.
Dividend – We have continued to deliver our quarterly dividend since inception (35 quarters). We hope to maintain a steady quarterly dividend of $0.14 per share, but there is no guarantee this will happen as we must have realized gains in order to meet our target distribution.
Excalibur – Small Cap Income Fund
We are pleased with another positive year for Camelot Excalibur Small Cap Income Fund in relative terms despite having a negative year in absolute terms. As in the previous year, returns in the Small Cap Value space significantly lagged behind returns in the large cap and growth parts of the spectrum, making for a difficult environment. But our strategy and discipline paid off.
3
According to Morningstar, our performance for Class I shares ranked in the 17th percentile in our category for the 1 year period ending 9/30/2019 out of 417 funds.
| Annualized Total Returns (%) | Inception | |||||||||||
| Q3 | YTD | 1 Year | 3 Year | 5 Year | 12/31/2013 | |||||||
| Camelot Excalibur Small Cap Income Fund Class A – CEXAX – Load Waived | -3.74% | 16.64% | -4.68% | 5.24% | 2.74% | 1.53% | ||||||
| Camelot Excalibur Small Cap Income Fund Class A – CEXAX – With Load | -9.32% | 9.90% | -10.12% | 3.18% | 1.53% | 0.49% | ||||||
| Camelot Excalibur Small Cap Income Fund Class I – CEXIX | -3.58% | 16.99% | -4.33% | N/A | N/A | 3.53% | ||||||
| Russell 2000TR | -2.40% | 14.18% | -8.89% | 8.23% | 8.19% | 6.25% | ||||||
We delivered on our primary objective of delivering strong cash flow. We continued to maintain a $.10 quarterly distribution over the last four quarters, which we hope to maintain and increase over time. More than half of this distribution was attributed to Dividend Income.
Camelot Excalibur Small Cap Income Fund is designed to allow all investors to gain exposure to small caps and stay invested according to plan by generating consistent cash flow. We believe this fund is extremely unique in the small cap space and we believe it can be one of the most consistent & highest yielding funds in its category. Of course, there are no guarantees we will be able to achieve that.
Objective 1 – Consistent & Growing Income Stream
See notes under Objective 1 for the Camelot Fund.
We are pleased with the progress on this objective as we maintained a $.10 quarterly distribution, which is our target. We intend to maintain this as consistently as possible and increase it over time. Based on the 9/30/2019 NAV of $7.88 (CEXAX), this should equate to a very nice cash flow, especially for a small-cap fund.
Objective 2 – Total Return
The fund’s return was -4.33%, which was above the Russell 2000, which returned -8.89%, and above our category (Small Value) average of -9.37%, putting us in the 17th percentile.
Conclusion
We are pleased with our performance this year as we believe we delivered well on both objectives. We believe it shows the power of our strategy and our ability to capitalize on difficult market conditions. It is always fun to be near the top of our category, but we will not rest as our long term view continues to keep us disciplined.
Thank you for the opportunity to serve you. We don’t take it for granted. We will continue to work tirelessly to deliver solid results moving forward.
Market Review
Small caps (measured by the Russell 2000) under-performed larger companies (measured by the S&P 500) and Small Cap Value as measured by the Russell 2000 Value Index lagged the Russell 2000 Index. As this trend has persisted for quite some time, we believe the opportunities in small value are attractive and leave significant opportunities in the years ahead.
Excalibur – Small Cap Income Fund Commentary
Returns – The return for the Fund for this fiscal year was -4.33% (Class I shares)1 versus -8.89% for the Russell 2000 Total Return index and -9.37% for the average fund in our Morningstar Category (Small Value).
4
Sector Weightings – we make no attempt to match our sector weightings to any particular benchmark or index.
Contributors – We had realized gains spread over several dozen positions, most of which were put and call options, and over $400,000 in investment income (dividends & interest). The greatest contributors were Compass Diversified Holdings (CODI), Blackbaud Inc (BLKB), LGI Homes Inc (LGIH), a variety of Puerto Rico Bonds, and a short position in VXX.
Detractors – Our greatest detractors were Camping World Inc (CWH), Destination Maternity Corp (DEST), Fluor Corp (FLR), Tupperware Brands Corp (TUP), and Washington Prime Group Inc (WPG).
Our largest equity positions are Textainer Group Holdings Ltd (3.52%), Fluor Corp (3.38%), and Compass Minerals International Inc (3.01%).
New Positions – As our option writing strategy naturally produces higher turnover, we initiated dozens of new positions, which will almost always be the case.
Eliminated Positions – Due to the nature of our option based strategy, we had dozens of positions throughout the fiscal year which we no longer hold.
Current Portfolio – As of fiscal year-end, our portfolio composition is under 50% outright equity holdings and above 50% in put or covered call positions. This weighting is tilted more conservatively than normal as we believe there are currently elevated risks to the markets. However, the portfolios composition will fluctuate over time as markets fluctuate and different positions become more attractive.
Dividend – We maintained our quarterly dividend of $.10. We hope to maintain a steady quarterly dividend of $0.10 per share, increasing over time, but there is no guarantee this will happen as we must have investment income or realized gains in order to meet our target distribution.
Final Remarks
“Every trend goes on forever, until it ends.” -John Neff
“If you stay rational yourself, the stupidity of the world helps you.” -Charles Munger
The last several years have seemed like a broken record as the market returns have largely been driven by Large Caps, Growth, and Technology, something we saw in the late 1990’s. While we don’t believe there is a bubble of that size, we do believe this trend will eventually end. We believe Small Caps and Value will once again experience a period of outperformance and we plan to be ready when it happens.
Thank you to all our shareholders for the faith and trust you have placed in us. We are blessed and honored to be a part of your portfolio and take the responsibility seriously. Also, we thank all the advisors who utilize our funds for their clients. We know the risk you take every time you make a recommendation and will work hard to make sure your clients have a great investment experience.
May God bless you greatly in the coming year!
Kind Regards,
Darren T. Munn, CFA
Chief Investment Officer
© 2019 Morningstar. All Rights Reserved. The information contained herein: (1) is proprietary to Morningstar and/or its content providers; (2) may not be copied or distributed; and (3) is not warranted to be accurate, complete or timely. Neither Morningstar nor its content providers are responsible for any damages or losses arising from any use of this information. Past performance is no guarantee of future results.
5
| (a) | Past performance is not indicative of future results. Specifically, there is no assurance that the Fund will achieve its investment objective or be profitable in the future. There can be no assurance that any investment discussed in this presentation will achieve results comparable to what is discussed herein, or avoid losses. |
| (b) | Unless otherwise specified, all performance results are as of September 30, 2019. |
| (c) | Certain portions of this presentation include information regarding the performance of various sectors, indices, or the economy in general. Such information is taken from various sources, and while believed to be reliable, is not necessarily independently verified by Camelot Portfolios LLC, and accordingly, such information should not be relied upon in making any investment decisions. |
| (d) | Russell 2000 Index is a market capitalization-weighted index designed to measure the performance of the small-cap segment of the U.S. equity market. S&P 500 Index is a market capitalization-weighted index of 500 common stocks chosen for market size, liquidity, and industry group representation to represent U.S. equity performance. You cannot invest directly in an index. Accordingly, performance results for investment indexes do not reflect the deduction of transaction and/or custodial charges or the deduction of an investment-management fee, the incurrence of which would have the effect of decreasing historical performance results. |
| (e) | Nothing in this communication should be in any way be interpreted as investment advice. Any person or entity considering an investment in a fund managed by Camelot Portfolios LLC should carefully review the prospectus relative to that fund, and consult with appropriate legal, tax and investment professionals. Any person in receipt of this communication should consult the same professionals before acting on any of the commentary presented herein, as this communication is not a substitute for personalized investment advice. |
| (f) | Certain statements in this presentation are based on information that is deemed valid as of the date of the presentation. Changes in circumstances, even minor ones, can materially alter the economic outlook, the outlook for a given investment or for an entire fund. |
| (g) | This communication presents specific information regarding specific investments made by one or more of the Camelot funds. These investments are presented for educational and demonstrative purposes only, and are not intended to represent the performance of any fund as a whole, or to be in any way indicative of the performance a Camelot fund should achieve in the future. There are many other investments made by each Camelot fund not presented here. For a full list of investments and returns related to any of the funds discussed herein, please contact Jennifer Rogers at [email protected]. |
7232-NLD-10/17/2019 CF083
6
| Camelot Premium Return Fund |
| PORTFOLIO REVIEW (Unaudited) |
| September 30, 2019 |
The Fund’s performance figures(1) for each of the periods ended September 30, 2019, compared to its benchmark:
| One Year Return | Three Year Return | Five Year Return | Since Inception(4) | Since Inception(5) | |
| Class A | (2.99)% | 4.94% | 3.31% | 6.23% | N/A |
| Class A with 5.75% load | (8.56)% | 2.90% | 2.10% | 5.52% | N/A |
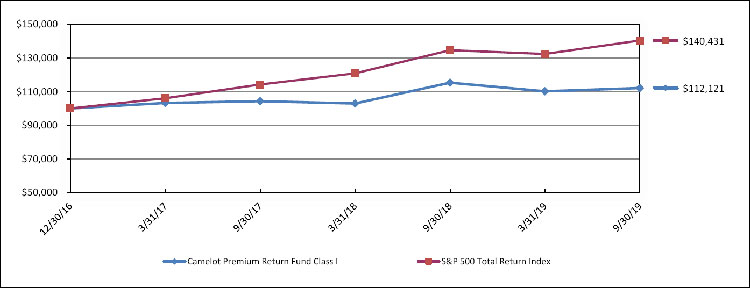
| Class I | (2.78)% | N/A | N/A | N/A | 4.25% |
| S&P 500 Total Return Index(2) | 4.25% | 13.39% | 10.84% | 12.67% | 13.14% |
| CBOE S&P BuyWrite Index(3) | (1.11)% | 6.99% | 5.92% | 6.88% | 6.63% |
| (1) | The performance data quoted here represents past performance. Current performance may be lower or higher than the performance data quoted above. Investment return and principal value will fluctuate, so that shares, when redeemed, may be worth more or less than their original cost. The returns shown do not reflect the deduction of taxes that a shareholder would pay on Fund distributions or on the redemptions of Fund shares. Past performance is no guarantee of future results. Performance figures for periods greater than 1 year are annualized. The Manager and the Fund have entered into an Expense Limitation Agreement under which the Manager has contractually agreed to waive fees and/or reimburse expenses but only to the extent necessary to maintain total annual operating expenses (excluding brokerage costs; borrowing and liquidity costs such as interest and dividends on securities sold short; taxes; underlying/acquired fund expenses; and extraordinary expenses) at 1.75% and 1.50% for Class A and Class I, respectively, through January 31, 2020. Class A shares are subject to a maximum sales charge of 1.00%. Each waiver or reimbursement by the Manager is subject to repayment by the Fund within the three years following the fiscal year in which that particular expense is incurred, if the Fund is able to make the repayment without exceeding the expense limitation in effect at the time of the waiver or reimbursement or at the time of recoupment. Without these waivers, the Fund’s total annual operating expenses would have been 2.36% and 2.11% for the Fund’s Class A and Class I shares, respectively, including interest, dividend expenses, and acquired fund fees, per the most recent prospectus. Please review the Fund’s most recent prospectus for more detail on the expense waiver. For performance information current to the most recent month-end, please call toll-free 1-855-226-3863. |
| (2) | The “S&P 500 Total Return Index”, a registered trademark of McGraw-Hill Co., Inc., is a market capitalization-weighted index of 500 widely held common stocks. |
| (3) | The CBOE S&P BuyWrite Index is a benchmark index designed to show the hypothetical performance of a portfolio that engages in a buy-write strategy using S&P 500 index call options. |
| (4) | Class A inception date is December 27, 2010. |
| (5) | Class I inception date is December 30, 2016. |
Comparison of the Change in Value of a $10,000 Investment
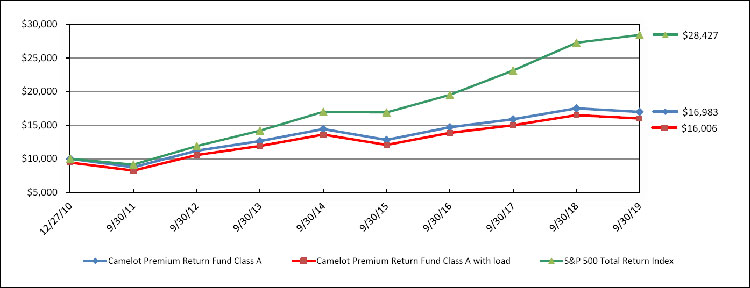
Comparison of the Change in Value of a $100,000 Investment
7
| Camelot Premium Return Fund |
| PORTFOLIO REVIEW (Unaudited) (Continued) |
| September 30, 2019 |
| Top 10 Allocations | % of Net Assets | |||
| Pipelines | 10.9 | % | ||
| Real Estate Investment Trusts | 9.5 | % | ||
| Municipal Bonds | 9.3 | % | ||
| Auto Manufacturers | 8.9 | % | ||
| Closed-End Funds | 8.0 | % | ||
| Retail | 5.4 | % | ||
| Building Materials | 5.2 | % | ||
| Banks | 5.1 | % | ||
| Telecommunications | 3.6 | % | ||
| Engineering & Construction | 2.8 | % | ||
| Other/Cash & Equivalents | 31.3 | % | ||
| 100.0 | % | |||
Please refer to the Schedule of Investments in this annual report for a detailed analysis of the Fund’s holdings.
8
| Camelot Excalibur Small Cap Income Fund |
| PORTFOLIO REVIEW (Unaudited) |
| September 30, 2019 |
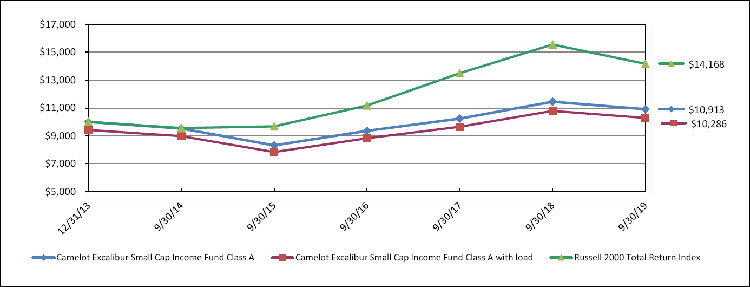
The Fund’s performance figures(1) for each of the periods ended September 30, 2019, compared to its benchmark:
| One Year Return | Three Year Return | Five Year Return | Since Inception(3) | Since Inception(4) | |
| Class A | (4.68)% | 5.24% | 2.74% | 1.53% | N/A |
| Class A with 5.75% load | (10.12)% | 3.18% | 1.53% | 0.49% | N/A |
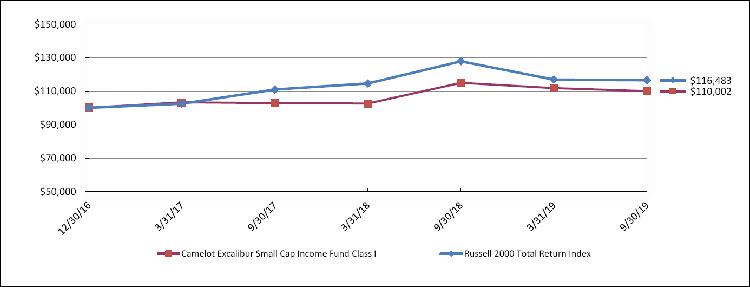
| Class I | (4.33)% | N/A | N/A | N/A | 3.53% |
| Russell 2000 Total Return Index(2) | (8.89)% | 8.23% | 8.19% | 6.25% | 5.70% |
| (1) | The performance data quoted here represents past performance. Current performance may be lower or higher than the performance data quoted above. Investment return and principal value will fluctuate, so that shares, when redeemed, may be worth more or less than their original cost. The returns shown do not reflect the deduction of taxes that a shareholder would pay on Fund distributions or on the redemptions of Fund shares. Past performance is no guarantee of future results. Performance figures for periods greater than 1 year are annualized. The Manager and the Fund have entered into an Expense Limitation Agreement under which the Manager has contractually agreed to waive fees and/or reimburse expenses but only to the extent necessary to maintain total annual operating expenses (excluding brokerage costs; borrowing and liquidity costs such as interest and dividends on securities sold short; taxes; underlying/acquired fund expenses; and extraordinary expenses) at 1.75% and 1.50% for Class A and Class I, respectively, through January 31, 2020. Class A shares are subject to a maximum sales charge of 1.00%. Each waiver or reimbursement by the Manager is subject to repayment by the Fund within the three years following the fiscal year in which that particular expense is incurred, if the Fund is able to make the repayment without exceeding the expense limitation in effect at the time of the waiver or reimbursement or at the time of recoupment. Without these waivers, the Fund’s total annual operating expenses would have been 3.00% and 2.75% for the Fund’s Class A and Class I shares, respectively, including interest, dividend expenses, and acquired fund fees, per the most recent prospectus. Please review the Fund’s most recent prospectus for more detail on the expense waiver. For performance information current to the most recent month-end, please call toll-free 1-855-226-3863. |
| (2) | The Russell 2000 Total Return Index measures the performance of the 2,000 smallest companies of the 3,000 largest U.S. companies based on total market capitalization. |
| (3) | Class A inception date is December 31, 2013. |
| (4) | Class I inception date is December 30, 2016. |
Comparison of the Change in Value of a $10,000 Investment
Comparison of the Change in Value of a $100,000 Investment
9
| Camelot Excalibur Small Cap Income Fund |
| PORTFOLIO REVIEW (Unaudited) (Continued) |
| September 30, 2019 |
| Top 10 Allocations | % of Net Assets | |||
| Real Estate Investment Trusts | 18.5 | % | ||
| Municipal Bonds | 12.9 | % | ||
| Retail | 12.2 | % | ||
| Closed-End Funds | 5.5 | % | ||
| Pipelines | 4.5 | % | ||
| Transportation | 4.2 | % | ||
| Commercial Services | 4.0 | % | ||
| Engineering & Construction | 3.9 | % | ||
| Insurance | 3.5 | % | ||
| Mining | 3.4 | % | ||
| Other/Cash & Equivalents | 27.4 | % | ||
| 100.0 | % | |||
Please refer to the Schedule of Investments in this annual report for a detailed analysis of the Fund’s holdings.
10
| Camelot Premium Return Fund |
| SCHEDULE OF INVESTMENTS |
| September 30, 2019 |
| Principal | Coupon Rate (%) | Maturity | Fair Value | |||||||||
| BONDS - 7.0% | ||||||||||||
| AGENCY COLLATERAL CMO - 1.4% | ||||||||||||
| $ | 1,988,450 | Fannie Mae REMICS | 3.0000 | 7/25/2042 | $ | 152,949 | ||||||
| 1,250,527 | Fannie Mae REMICS | 3.5000 | 3/25/2047 | 143,279 | ||||||||
| 746,810 | Fannie Mae REMICS | 3.5000 | 8/25/2049 | 116,766 | ||||||||
| 1,453,028 | Fannie Mae REMICS | 4.0000 | 7/25/2049 | 139,530 | ||||||||
| 552,524 | ||||||||||||
| RETAIL - 4.6% | ||||||||||||
| 500,000 | GameStop Corp. ^(a) | 6.7500 | 3/15/2021 | 491,250 | ||||||||
| 1,415,000 | Men’s Wearhouse, Inc. (a) | 7.0000 | 7/1/2022 | 1,393,775 | ||||||||
| 1,885,025 | ||||||||||||
| TELECOMMUNICATIONS - 1.0% | ||||||||||||
| 360,000 | Frontier Communications Corp. | 6.8750 | 1/15/2025 | 162,000 | ||||||||
| 500,000 | Frontier Communications Corp. | 10.5000 | 9/15/2022 | 233,125 | ||||||||
| 395,125 | ||||||||||||
| TOTAL BONDS (Cost $3,139,856) | 2,832,674 | |||||||||||
| MUNICIPAL BONDS - 9.3% | ||||||||||||
| PUERTO RICO - 8.5% | ||||||||||||
| 40,000 | Commonwealth of Puerto Rico # | 5.0000 | 7/1/2023 | 29,700 | ||||||||
| 225,000 | Commonwealth of Puerto Rico # | 5.0000 | 7/1/2024 | 167,625 | ||||||||
| 125,000 | Commonwealth of Puerto Rico # | 5.0000 | 7/1/2025 | 93,437 | ||||||||
| 100,000 | Commonwealth of Puerto Rico # | 5.0000 | 7/1/2029 | 74,750 | ||||||||
| 75,000 | Commonwealth of Puerto Rico # | 5.0000 | 7/1/2031 | 55,875 | ||||||||
| 140,000 | Commonwealth of Puerto Rico # | 5.0000 | 7/1/2034 | 104,650 | ||||||||
| 145,000 | Commonwealth of Puerto Rico # | 5.7500 | 7/1/2038 | 106,031 | ||||||||
| 50,000 | Puerto Rico Commonwealth Aqueduct & Sewer Authority | 4.9000 | 7/1/2020 | 49,975 | ||||||||
| 50,000 | Puerto Rico Commonwealth Aqueduct & Sewer Authority | 5.0000 | 7/1/2022 | 52,500 | ||||||||
| 200,000 | Puerto Rico Electric Power Authority # | 3.7500 | 7/1/2022 | 155,500 | ||||||||
| 70,000 | Puerto Rico Electric Power Authority # | 4.1000 | 10/24/2019 | 53,462 | ||||||||
| 100,000 | Puerto Rico Electric Power Authority # | 4.2500 | 7/1/2021 | 79,250 | ||||||||
| 110,000 | Puerto Rico Electric Power Authority # | 4.2500 | 7/1/2023 | 87,175 | ||||||||
| 130,000 | Puerto Rico Electric Power Authority # | 4.7500 | 7/1/2026 | 103,350 | ||||||||
| 220,000 | Puerto Rico Electric Power Authority # | 4.8000 | 7/1/2027 | 174,900 | ||||||||
| 40,000 | Puerto Rico Electric Power Authority # | 5.0000 | 7/1/2020 | 32,000 | ||||||||
| 25,000 | Puerto Rico Electric Power Authority # | 5.0000 | 7/1/2023 | 20,000 | ||||||||
| 20,000 | Puerto Rico Electric Power Authority # | 5.0000 | 7/1/2024 | 16,000 | ||||||||
| 165,000 | Puerto Rico Electric Power Authority # | 5.0000 | 7/1/2025 | 132,000 | ||||||||
| 25,000 | Puerto Rico Electric Power Authority # | 5.0000 | 7/1/2026 | 25,022 | ||||||||
| 30,000 | Puerto Rico Electric Power Authority # | 5.0000 | 7/1/2026 | 24,000 | ||||||||
| 105,000 | Puerto Rico Electric Power Authority # | 5.0000 | 7/1/2027 | 84,000 | ||||||||
| 80,000 | Puerto Rico Electric Power Authority # | 5.0000 | 7/1/2027 | 64,000 | ||||||||
| 50,000 | Puerto Rico Electric Power Authority # | 5.0000 | 7/1/2028 | 40,000 | ||||||||
| 85,000 | Puerto Rico Electric Power Authority # | 5.0000 | 7/1/2029 | 68,000 | ||||||||
| 25,000 | Puerto Rico Electric Power Authority # | 5.0000 | 7/1/2037 | 20,000 | ||||||||
| 50,000 | Puerto Rico Electric Power Authority # | 5.0500 | 7/1/2042 | 40,000 | ||||||||
| 35,000 | Puerto Rico Electric Power Authority # | 5.2500 | 7/1/2021 | 28,087 | ||||||||
| 50,000 | Puerto Rico Electric Power Authority # | 5.2500 | 7/1/2024 | 40,125 | ||||||||
| 35,000 | Puerto Rico Electric Power Authority # | 5.2500 | 7/1/2025 | 28,087 | ||||||||
| 65,000 | Puerto Rico Electric Power Authority # | 5.2500 | 7/1/2027 | 52,162 | ||||||||
| 25,000 | Puerto Rico Electric Power Authority # | 5.2500 | 7/1/2027 | 20,063 | ||||||||
| 55,000 | Puerto Rico Electric Power Authority # | 5.2500 | 7/1/2028 | 44,137 | ||||||||
| 25,000 | Puerto Rico Electric Power Authority # | 5.2500 | 7/1/2033 | 20,063 | ||||||||
| 50,000 | Puerto Rico Electric Power Authority # | 5.2500 | 7/1/2035 | 40,125 | ||||||||
| 130,000 | Puerto Rico Electric Power Authority # | 5.2500 | 7/1/2040 | 104,325 | ||||||||
| 50,000 | Puerto Rico Electric Power Authority # | 5.4000 | 7/1/2028 | 39,438 | ||||||||
| 40,000 | Puerto Rico Electric Power Authority # | 5.5000 | 7/1/2021 | 32,150 | ||||||||
| 485,000 | Puerto Rico Highway & Transportation Authority | 0.0000 | 7/1/2027 | 336,183 | ||||||||
| 100,000 | Puerto Rico Public Buildings Authority # | 5.3750 | 7/1/2028 | 83,750 | ||||||||
| 585,000 | University of Puerto Rico | 5.0000 | 6/1/2021 | 586,463 | ||||||||
| 15,000 | University of Puerto Rico | 5.0000 | 6/1/2022 | 15,019 | ||||||||
| 10,000 | University of Puerto Rico | 5.0000 | 6/1/2022 | 10,013 | ||||||||
| 3,433,392 | ||||||||||||
| NEVADA - 0.8% | ||||||||||||
| 515,000 | State of Nevada Department of Business & Industry | 0.0000 | 1/1/2027 | 317,516 | ||||||||
| TOTAL MUNICIPAL BONDS (Cost $3,465,646) | 3,750,908 | |||||||||||
See accompanying notes to financial statements.
11
| Camelot Premium Return Fund |
| SCHEDULE OF INVESTMENTS (Continued) |
| September 30, 2019 |
| Shares | Fair Value | |||||||
| CLOSED-END FUNDS - 8.0% | ||||||||
| 20,000 | Aberdeen Asia-Pacific Income Fund, Inc. | $ | 83,800 | |||||
| 10,000 | Altaba, Inc. (b) | 194,800 | ||||||
| 17,134 | Ares Dynamic Credit Allocation Fund, Inc. | 255,297 | ||||||
| 20,000 | Eaton Vance Limited Duration Income Fund | 250,000 | ||||||
| 40,000 | Eaton Vance Senior Income Trust (b) | 244,800 | ||||||
| 27,463 | First Trust High Income Long/Short Fund | 416,339 | ||||||
| 35,000 | Invesco Dynamic Credit Opportunities Fund | 385,350 | ||||||
| 40,000 | Invesco Senior Income Trust | 168,000 | ||||||
| 27,125 | Nuveen Real Asset Income and Growth Fund (b) | 474,959 | ||||||
| 20,000 | PGIM Global High Yield Fund, Inc. (b) | 287,400 | ||||||
| 30,000 | PGIM High Yield Bond Fund, Inc. (b) | 448,500 | ||||||
| TOTAL CLOSED-END FUNDS (Cost $3,319,279) | 3,209,245 | |||||||
| COMMON STOCKS - 57.0% | ||||||||
| APPAREL - 2.0% | ||||||||
| 45,000 | Under Armour, Inc. - Cl. C * | 815,850 | ||||||
| AUTO MANUFACTURERS - 8.9% | ||||||||
| 14,818 | Fiat Chrysler Automobiles NV (a) | 191,893 | ||||||
| 210,400 | Ford Motor Co. (b)(c) | 1,927,264 | ||||||
| 30,000 | Renault SA | 342,600 | ||||||
| 136,000 | Tata Motors Ltd. *(a)(b) | 1,141,040 | ||||||
| 3,602,797 | ||||||||
| BANKS - 5.1% | ||||||||
| 40,000 | Barclays PLC - ADR (b)(c) | 293,600 | ||||||
| 167,500 | ING Groep NV - ADR (a)(b) | 1,750,375 | ||||||
| 2,043,975 | ||||||||
| BIOTECHNOLOGY - 1.7% | ||||||||
| 3,000 | Biogen, Inc. *(d) | 698,460 | ||||||
| BUILDING MATERIALS - 5.2% | ||||||||
| 537,636 | Cemex SAB de CV - ADR (a)(b)(c) | 2,107,533 | ||||||
| BUSINESS DEVELOPMENT COMPANIES - 1.2% | ||||||||
| 25,000 | Ares Capital Corp. (b)(c) | 465,875 | ||||||
| COMMERCIAL SERVICES - 2.1% | ||||||||
| 5,000 | Macquarie Infrastructure Corp. | 197,350 | ||||||
| 7,500 | ManpowerGroup, Inc. (b)(c) | 631,800 | ||||||
| 829,150 | ||||||||
| DISTRIBUTION/WHOLESALE - 0.4% | ||||||||
| 5,000 | Triton International Ltd. (b) | 169,200 | ||||||
| DIVERSIFIED FINANCIAL SERVICES - 1.5% | ||||||||
| 6,900 | Capital One Financial Corp. (b)(c)(d) | 627,762 | ||||||
| ELECTRONICS - 0.5% | ||||||||
| 20,000 | Flex Ltd. *(c) | 209,300 | ||||||
| ENGINEERING & CONSTRUCTION - 2.8% | ||||||||
| 60,000 | Fluor Corp. | 1,147,800 | ||||||
| FOOD - 0.1% | ||||||||
| 400 | Beyond Meat, Inc. *(c)(d) | 59,448 | ||||||
| HEALTHCARE - SERVICES - 2.8% | ||||||||
| 20,000 | DaVita, Inc. * | 1,141,400 | ||||||
| HOME BUILDERS - 1.4% | ||||||||
| 700 | PulteGroup, Inc. | 25,585 | ||||||
| 5,000 | Thor Industries, Inc. (a) | 283,200 | ||||||
| 6,000 | Toll Brothers, Inc. (a)(d) | 246,300 | ||||||
| 555,085 | ||||||||
| HOUSEWARES - 1.9% | ||||||||
| 40,100 | Newell Brands, Inc. | 750,672 | ||||||
See accompanying notes to financial statements.
12
| Camelot Premium Return Fund |
| SCHEDULE OF INVESTMENTS (Continued) |
| September 30, 2019 |
| Shares | Fair Value | |||||||
| COMMON STOCKS - 57.0% (Continued) | ||||||||
| INSURANCE - 2.8% | ||||||||
| 20,000 | American International Group, Inc. (a)(c)(d) | $ | 1,114,000 | |||||
| INTERNET - 2.7% | ||||||||
| 8,100 | Expedia Group, Inc. (b)(c)(d) | 1,088,721 | ||||||
| LEISURE TIME - 2.0% | ||||||||
| 9,100 | Polaris Industries, Inc. (b)(c)(d) | 800,891 | ||||||
| MACHINERY - CONSTRUCTION & MINING - 0.9% | ||||||||
| 5,000 | Oshkosh Corp. (b)(c) | 379,000 | ||||||
| OIL & GAS - 2.6% | ||||||||
| 11,428 | Obsidian Energy Ltd. * | 9,542 | ||||||
| 20,000 | TC Energy Corp. *(b) | 1,035,800 | ||||||
| 1,045,342 | ||||||||
| PHARMACEUTICALS - 0.8% | ||||||||
| 5,000 | CVS Health Corp. (d) | 315,350 | ||||||
| PIPELINES - 1.7% | ||||||||
| 20,000 | Enbridge, Inc. (b)(c) | 701,600 | ||||||
| REAL ESTATE - 1.7% | ||||||||
| 5,000 | Jones Lang LaSalle, Inc. (c) | 695,300 | ||||||
| RETAIL - 0.8% | ||||||||
| 60,000 | GameStop Corp. (b) | 331,200 | ||||||
| TELECOMMUNICATIONS - 2.6% | ||||||||
| 38,300 | America Movil SAB de CV (a)(c) | 569,138 | ||||||
| 10,000 | Millicom International Cellular SA (a) | 486,700 | ||||||
| 1,055,838 | ||||||||
| TEXTILES - 0.8% | ||||||||
| 2,500 | Mohawk Industries, Inc. * | 310,175 | ||||||
| TOTAL COMMON STOCKS (Cost $30,126,478) | 23,061,724 | |||||||
| REAL ESTATE INVESTMENT TRUSTS (REITs) - 8.4% | ||||||||
| 20,000 | AGNC Investment Corp. (b) | 321,800 | ||||||
| 29,775 | Office Properties Income Trust | 912,306 | ||||||
| 20,000 | Sabra Health Care REIT, Inc. (b)(d) | 459,200 | ||||||
| 47,136 | Two Harbors Investment Corp. (a)(b) | 618,896 | ||||||
| 40,000 | VEREIT, Inc. | 391,200 | ||||||
| 169,400 | Washington Prime Group, Inc. (a)(b) | 701,316 | ||||||
| TOTAL REAL ESTATE INVESTMENT TRUSTS (REITs) (Cost $5,264,725) | 3,404,718 | |||||||
| LIMITED PARTNERSHIPS - 7.9% | ||||||||
| PIPELINES - 7.2% | ||||||||
| 155,363 | Energy Transfer Equity LP (b)(d) | 2,032,148 | ||||||
| 30,000 | Enterprise Products Partners LP (b)(c) | 857,400 | ||||||
| 2,889,548 | ||||||||
| REAL ESTATE - 0.7% | ||||||||
| 15,000 | Brookfield Property Partners LP (c) | 304,500 | ||||||
| TOTAL LIMITED PARTNERSHIPS (Cost $4,569,284) | 3,194,048 | |||||||
See accompanying notes to financial statements.
13
| Camelot Premium Return Fund |
| SCHEDULE OF INVESTMENTS (Continued) |
| September 30, 2019 |
| Shares | Coupon Rate (%) | Maturity | Fair Value | |||||||||
| PREFERRED STOCKS - 5.7% | ||||||||||||
| ELECTRIC - 1.6% | ||||||||||||
| 5,000 | Pacific Gas & Electric Co. * | 4.3600 | Perpetual | $ | 101,250 | |||||||
| 6,000 | Pacific Gas & Electric Co. * | 4.5000 | Perpetual | 111,060 | ||||||||
| 2,000 | Pacific Gas & Electric Co. * | 4.8000 | Perpetual | 41,000 | ||||||||
| 16,000 | Pacific Gas & Electric Co. * | 5.0000 | Perpetual | 338,000 | ||||||||
| 3,000 | Pacific Gas & Electric Co. * | 5.5000 | Perpetual | 69,300 | ||||||||
| 660,610 | ||||||||||||
| PIPELINES - 2.0% | ||||||||||||
| 1,000 | DCP Midstream LP, Quarterly US LIBOR +4.88% **** | 7.9500 | Perpetual | 24,170 | ||||||||
| 5,000 | Enbridge, Inc., Canada Government 5 Year Bond +2.51% **** | 4.6890 | Perpetual | 60,159 | ||||||||
| 15,000 | Energy Transfer Partners LP, Quarterly US LIBOR +4.74% **** | 7.6250 | Perpetual | 370,500 | ||||||||
| 15,000 | NuStar Energy LP, Quarterly US LIBOR +6.88% **** | 9.0000 | Perpetual | 364,200 | ||||||||
| 819,029 | ||||||||||||
| REAL ESTATE INVESTMENT TRUSTS (REITs) - 1.1% | ||||||||||||
| 1,262 | Ashford Hospitality Trust, Inc. | 8.4500 | Perpetual | 30,930 | ||||||||
| 16,350 | Two Harbors Investment Corp. | 7.7500 | Perpetual | 413,819 | ||||||||
| 444,749 | ||||||||||||
| TRANSPORTATION - 1.0% | ||||||||||||
| 15,000 | Seaspan Corp. | 8.2500 | Perpetual | 382,800 | ||||||||
| TOTAL PREFERRED STOCKS (Cost $2,221,534) | 2,307,188 | |||||||||||
| Shares | ||||||||||||
| SHORT-TERM INVESTMENTS - 16.3% | ||||||||||||
| INVESTMENT PURCHASED AS SECURITIES LENDING COLLATERAL - 16.3% | ||||||||||||
| 6,607,316 | Mount Vernon Liquid Assets Portfolio, LLC, 2.13% **(e) | 6,607,316 | ||||||||||
| TOTAL SHORT-TERM INVESTMENTS (Cost $6,607,316) | 6,607,316 | |||||||||||
| TOTAL INVESTMENTS IN LONG SECURITIES - 119.6% (Cost $58,714,118) | $ | 48,367,821 | ||||||||||
| TOTAL CALL OPTIONS WRITTEN - (3.8)% (Premiums Received $2,316,348) | (1,519,395 | ) | ||||||||||
| TOTAL PUT OPTIONS WRITTEN - (2.2)% (Premiums Received $1,119,616) | (899,563 | ) | ||||||||||
| TOTAL SECURITIES SOLD SHORT - (9.2)% (Proceeds $4,169,012) | (3,723,410 | ) | ||||||||||
| LIABILITIES IN EXCESS OF OTHER ASSETS - (4.4)% | (1,793,218 | ) | ||||||||||
| TOTAL NET ASSETS - 100.0% | $ | 40,432,235 | ||||||||||
| Notional Value at | ||||||||||||||
| September 30, | ||||||||||||||
| Contracts*** | Counterparty | 2019 | Fair Value | |||||||||||
| SCHEDULE OF CALL OPTIONS WRITTEN - (3.8)% * | ||||||||||||||
| 350 | America Movil SAB de CV | |||||||||||||
| Expiration February 2020, Exercise Price $15.00 | Interactive Brokers | $ | 525,000 | $ | 33,250 | |||||||||
| 200 | American International Group, Inc. | |||||||||||||
| Expiration January 2020, Exercise Price $55.00 | Interactive Brokers | 1,100,000 | 66,000 | |||||||||||
| 200 | American International Group, Inc. | |||||||||||||
| Expiration January 2020, Exercise Price $60.00 | Interactive Brokers | 1,200,000 | 24,600 | |||||||||||
| 250 | Ares Capital Corp. | |||||||||||||
| Expiration January 2020, Exercise Price $19.00 | Interactive Brokers | 475,000 | 9,500 | |||||||||||
| 400 | Barclays PLC | |||||||||||||
| Expiration January 2020, Exercise Price $7.00 | Interactive Brokers | 280,000 | 31,000 | |||||||||||
| 35 | Beyond Meat, Inc. | |||||||||||||
| Expiration November 2019, Exercise Price $145.00 | Interactive Brokers | 507,500 | 26,250 | |||||||||||
| 49 | Beyond Meat, Inc. | |||||||||||||
| Expiration December 2019, Exercise Price $140.00 | Interactive Brokers | 686,000 | 51,450 | |||||||||||
| 10 | Beyond Meat, Inc. | |||||||||||||
| Expiration January 2020, Exercise Price $135.00 | Interactive Brokers | 135,000 | 14,590 | |||||||||||
| 50 | Beyond Meat, Inc. | |||||||||||||
| Expiration January 2020, Exercise Price $145.00 | Interactive Brokers | 725,000 | 39,000 | |||||||||||
| 50 | Beyond Meat, Inc. | |||||||||||||
| Expiration January 2021, Exercise Price $140.00 | Interactive Brokers | 700,000 | 87,500 | |||||||||||
| 45 | Beyond Meat, Inc. | |||||||||||||
| Expiration January 2021, Exercise Price $170.00 | Interactive Brokers | 765,000 | 45,000 | |||||||||||
| 100 | Boston Scientific Corp. | |||||||||||||
| Expiration January 2020, Exercise Price $37.00 | Interactive Brokers | 370,000 | 51,000 | |||||||||||
See accompanying notes to financial statements.
14
| Camelot Premium Return Fund |
| SCHEDULE OF INVESTMENTS (Continued) |
| September 30, 2019 |
| Notional Value at | ||||||||||||||
| September 30, | ||||||||||||||
| Contracts*** | Counterparty | 2019 | Fair Value | |||||||||||
| SCHEDULE OF CALL OPTIONS WRITTEN - (3.8)% * (Continued) | ||||||||||||||
| 150 | Brookfield Property Partners LP | |||||||||||||
| Expiration January 2020, Exercise Price $20.00 | Interactive Brokers | $ | 300,000 | $ | 15,000 | |||||||||
| 69 | Capital One Financial Corp. | |||||||||||||
| Expiration January 2020, Exercise Price $92.50 | Interactive Brokers | 638,250 | 29,498 | |||||||||||
| 600 | Cemex SAB de CV - ADR | |||||||||||||
| Expiration January 2020, Exercise Price $4.00 | Interactive Brokers | 240,000 | 18,600 | |||||||||||
| 200 | Enbridge, Inc. | |||||||||||||
| Expiration January 2020, Exercise Price $35.00 | Interactive Brokers | 700,000 | 25,600 | |||||||||||
| 300 | Enterprise Products Partners LP | |||||||||||||
| Expiration January 2020, Exercise Price $29.00 | Interactive Brokers | 870,000 | 25,500 | |||||||||||
| 81 | Expedia Group, Inc. | |||||||||||||
| Expiration January 2020, Exercise Price $130.00 | Interactive Brokers | 1,053,000 | 85,050 | |||||||||||
| 200 | Flex Ltd. | |||||||||||||
| Expiration October 2019, Exercise Price $11.00 | Interactive Brokers | 220,000 | 2,600 | |||||||||||
| 600 | Ford Motor Co. | |||||||||||||
| Expiration January 2020, Exercise Price $9.00 | Interactive Brokers | 540,000 | 34,800 | |||||||||||
| 100 | Invesco QQQ Trust, Series 1 | |||||||||||||
| Expiration December 2019, Exercise Price $189.00 | Interactive Brokers | 1,890,000 | 71,500 | |||||||||||
| 400 | Invesco QQQ Trust, Series 1 | |||||||||||||
| Expiration January 2020, Exercise Price $188.00 | Interactive Brokers | 7,520,000 | 354,000 | |||||||||||
| 100 | Invesco QQQ Trust, Series 1 | |||||||||||||
| Expiration January 2020, Exercise Price $195.00 | Interactive Brokers | 1,950,000 | 49,600 | |||||||||||
| 300 | iShares Russell 2000 ETF | |||||||||||||
| Expiration January 2020, Exercise Price $150.00 | Interactive Brokers | 4,500,000 | 222,300 | |||||||||||
| 50 | Jones Lang LaSalle, Inc. | |||||||||||||
| Expiration December 2019, Exercise Price $160.00 | Interactive Brokers | 800,000 | 11,000 | |||||||||||
| 75 | ManpowerGroup, Inc. | |||||||||||||
| Expiration December 2019, Exercise Price $95.00 | Interactive Brokers | 712,500 | 7,312 | |||||||||||
| 50 | Oshkosh Corp. | |||||||||||||
| Expiration October 2019, Exercise Price $85.00 | Interactive Brokers | 425,000 | 750 | |||||||||||
| 50 | Polaris Industries, Inc. | |||||||||||||
| Expiration January 2020, Exercise Price $105.00 | Interactive Brokers | 525,000 | 10,000 | |||||||||||
| 15 | Tesla, Inc. | |||||||||||||
| Expiration October 2019, Exercise Price $250.00 | Interactive Brokers | 375,000 | 8,295 | |||||||||||
| 15 | Tesla, Inc. | |||||||||||||
| Expiration December 2019, Exercise Price $260.00 | Interactive Brokers | 390,000 | 21,300 | |||||||||||
| 15 | Tesla, Inc. | |||||||||||||
| Expiration January 2021, Exercise Price $300.00 | Interactive Brokers | 450,000 | 47,550 | |||||||||||
| TOTAL CALL OPTIONS WRITTEN - (Premiums Received $2,316,348) | $ | 1,519,395 | ||||||||||||
| SCHEDULE OF PUT OPTIONS WRITTEN - (2.2)% * | ||||||||||||||
| 100 | American International Group, Inc. | |||||||||||||
| Expiration January 2020, Exercise Price $50.00 | Interactive Brokers | $ | 500,000 | $ | 11,050 | |||||||||
| 50 | Beyond Meat, Inc. | |||||||||||||
| Expiration January 2020, Exercise Price $140.00 | Interactive Brokers | 700,000 | 252,500 | |||||||||||
| 30 | Biogen ,Inc. | |||||||||||||
| Expiration January 2020, Exercise Price $230.00 | Interactive Brokers | 690,000 | 38,400 | |||||||||||
| 50 | Capital One Financial Corp. | |||||||||||||
| Expiration December 2019, Exercise Price $95.00 | Interactive Brokers | 475,000 | 32,150 | |||||||||||
| 50 | Capital One Financial Corp. | |||||||||||||
| Expiration December 2019, Exercise Price $97.50 | Interactive Brokers | 487,500 | 41,200 | |||||||||||
| 100 | Cardinal Health, Inc. | |||||||||||||
| Expiration December 2019, Exercise Price $42.50 | Interactive Brokers | 425,000 | 12,000 | |||||||||||
| 50 | Citigroup, Inc. | |||||||||||||
| Expiration December 2019, Exercise Price $72.50 | Interactive Brokers | 362,500 | 26,500 | |||||||||||
| 100 | CVS Health Corp. | |||||||||||||
| Expiration January 2020, Exercise Price $75.00 | Interactive Brokers | 750,000 | 123,700 | |||||||||||
| 10 | Energy Transfer LP | |||||||||||||
| Expiration October 2019 Exercise Price $16.00 | Interactive Brokers | 16,000 | 2,920 | |||||||||||
| 50 | Expedia Group, Inc. | |||||||||||||
| Expiration November 2019, Exercise Price $125.00 | Interactive Brokers | 625,000 | 11,750 | |||||||||||
| 25 | Intel Corp. | |||||||||||||
| Expiration January 2020, Exercise Price $50.00 | Interactive Brokers | 125,000 | 5,950 | |||||||||||
See accompanying notes to financial statements.
15
| Camelot Premium Return Fund |
| SCHEDULE OF INVESTMENTS (Continued) |
| September 30, 2019 |
| Notional Value at | ||||||||||||||
| September 30, | ||||||||||||||
| Contracts*** | Counterparty | 2019 | Fair Value | |||||||||||
| SCHEDULE OF PUT OPTIONS WRITTEN - (2.2)% * (Continued) | ||||||||||||||
| 150 | iPath Series B S&P 500 | |||||||||||||
| Expiration October 2019, Exercise Price $24.00 | Interactive Brokers | $ | 360,000 | $ | 26,850 | |||||||||
| 250 | iPath Series B S&P 500 | |||||||||||||
| Expiration November 2019, Exercise Price $23.00 | Interactive Brokers | 575,000 | 52,500 | |||||||||||
| 60 | iPath Series B S&P 500 | |||||||||||||
| Expiration December 2019, Exercise Price $23.00 | Interactive Brokers | 138,000 | 17,280 | |||||||||||
| 25 | Laboratory Corporation of America | |||||||||||||
| Expiration November 2019, Exercise Price $160.00 | Interactive Brokers | 400,000 | 6,938 | |||||||||||
| 100 | Marathon Petroleum Corp . | |||||||||||||
| Expiration January 2020, Exercise Price $65.00 | Interactive Brokers | 650,000 | 76,000 | |||||||||||
| 100 | Owens Corning | |||||||||||||
| Expiration November 2019, Exercise Price $52.50 | Interactive Brokers | 525,000 | 4,750 | |||||||||||
| 25 | Polaris Industries, Inc. | |||||||||||||
| Expiration December 2019, Exercise Price $100.00 | Interactive Brokers | 250,000 | 36,500 | |||||||||||
| 50 | Polaris Industries, Inc. | |||||||||||||
| Expiration December 2019, Exercise Price $105.00 | Interactive Brokers | 525,000 | 93,000 | |||||||||||
| 190 | Sabra Health Care REIT, Inc. | |||||||||||||
| Expiration October 2019, Exercise Price $20.00 | Interactive Brokers | 380,000 | 1,425 | |||||||||||
| 50 | salesforce.com, Inc. | |||||||||||||
| Expiration November 2019, Exercise Price $140.00 | Interactive Brokers | 700,000 | 12,700 | |||||||||||
| 150 | Toll Brothers, Inc. | |||||||||||||
| Expiration December 2019, Exercise Price $37.00 | Interactive Brokers | 555,000 | 13,500 | |||||||||||
| TOTAL PUT OPTIONS WRITTEN - (Premiums Received $1,119,616) | $ | 899,563 | ||||||||||||
| Shares | ||||||||||||||
| SECURITIES SOLD SHORT - (9.2)% | ||||||||||||||
| COMMON STOCKS - (4.4)% | ||||||||||||||
| 2,000 | Danaher Corp. | $ | 288,860 | |||||||||||
| 2,500 | Home Depot, Inc. | 580,050 | ||||||||||||
| 45,000 | Under Armour, Inc. * | 897,300 | ||||||||||||
| 1,766,210 | ||||||||||||||
| CLOSED-END FUND - (1.0)% | ||||||||||||||
| 30,000 | Stone Harbor Emerging Markets Income Fund | 393,300 | ||||||||||||
| EXCHANGE TRADED FUNDS - (2.7)% | ||||||||||||||
| 2,500 | SPDR Gold Shares * | 347,175 | ||||||||||||
| 2,500 | SPDR S&P 500 ETF Trust | 741,925 | ||||||||||||
| 1,089,100 | ||||||||||||||
| EXCHANGE TRADED NOTE - (1.1)% | ||||||||||||||
| 20,000 | iPATH S&P 500 VIX Short-Term Futures ETN * | 474,800 | ||||||||||||
| TOTAL SECURITIES SOLD SHORT (Proceeds $4,169,012) | $ | 3,723,410 | ||||||||||||
ADR - American Depositary Receipt
ETN - Exchange Traded Note
LLC - Limited Liability Company
LP - Limited Partnership
PLC - Public Limited Company
REIT - Real Estate Investment Trust
VIX - S&P 500 Volatility Index
| **** | Variable Rate as of September 30, 2019. |
| ^ | 144A Security - Security exempt from registration under Rule 144A of the Securities Act of 1933. The 144A securities represent 1.21% of total net assets. The securities may be resold in transactions exempt from registration typically only to qualified institutional buyers. Unless otherwise indicated, these securities are not considered to be illiquid. |
| # | Security in default. |
| * | Non-Income producing security. |
| ** | Interest rate reflects seven-day effective yield on September 30, 2019. |
| *** | One contract is equivalent to 100 shares of common stock. |
| (a) | All or a portion of the security is out on loan at September 30, 2019. Total loaned securities had a market value of $6,441,250 at September 30, 2019. |
| (b) | All or a portion of the security is segregated as collateral for call options written. |
| (c) | Subject to call options written. |
| (d) | Subject to put options written. |
| (e) | All or a portion of the security is segregated as collateral for securities on loan at September 30, 2019. Total collateral had a market value of $6,607,316 at September 30, 2019. |
See accompanying notes to financial statements.
16
| Camelot Excalibur Small Cap Income Fund |
| SCHEDULE OF INVESTMENTS |
| September 30, 2019 |
| Principal | Coupon Rate (%) | Maturity | Fair Value | |||||||||
| BONDS - 8.6% | ||||||||||||
| RETAIL - 7.2% | ||||||||||||
| $ | 200,000 | GameStop Corp. ^ | 6.7500 | 3/15/2021 | $ | 196,500 | ||||||
| 524,000 | Men’s Wearhouse, Inc. | 7.0000 | 7/1/2022 | 516,140 | ||||||||
| 712,640 | ||||||||||||
| TELECOMMUNICATIONS - 1.4% | ||||||||||||
| 300,000 | Frontier Communications Corp. | 10.5000 | 9/15/2022 | 139,875 | ||||||||
| TOTAL BONDS (Cost $903,510) | 852,515 | |||||||||||
| MUNICIPAL BONDS - 12.9% | ||||||||||||
| PUERTO RICO - 12.9% | ||||||||||||
| 320,000 | Commonwealth of Puerto Rico # | 4.7500 | 7/1/2020 | 225,600 | ||||||||
| 50,000 | Commonwealth of Puerto Rico # | 5.7500 | 7/1/2023 | 37,438 | ||||||||
| 150,000 | Commonwealth of Puerto Rico # | 5.0000 | 7/1/2035 | 112,125 | ||||||||
| 25,000 | Puerto Rico Electric Power Authority # | 5.0000 | 10/24/2019 | 19,469 | ||||||||
| 25,000 | Puerto Rico Electric Power Authority # | 4.2500 | 7/1/2020 | 19,812 | ||||||||
| 25,000 | Puerto Rico Electric Power Authority # | 4.5000 | 7/1/2023 | 19,875 | ||||||||
| 30,000 | Puerto Rico Electric Power Authority # | 4.5000 | 7/1/2023 | 23,850 | ||||||||
| 110,000 | Puerto Rico Electric Power Authority # | 4.7500 | 7/1/2026 | 87,450 | ||||||||
| 30,000 | Puerto Rico Electric Power Authority # | 4.8750 | 7/1/2027 | 23,850 | ||||||||
| 30,000 | Puerto Rico Electric Power Authority # | 5.0000 | 7/1/2027 | 24,000 | ||||||||
| 45,000 | Puerto Rico Electric Power Authority # | 4.8000 | 7/1/2029 | 35,662 | ||||||||
| 20,000 | Puerto Rico Electric Power Authority # | 4.6250 | 7/1/2030 | 15,850 | ||||||||
| 35,000 | Puerto Rico Electric Power Authority # | 5.0500 | 7/1/2042 | 28,000 | ||||||||
| 140,000 | Puerto Rico Public Buildings Authority # | 5.7500 | 7/1/2022 | 119,700 | ||||||||
| 85,000 | Puerto Rico Public Buildings Authority # | 5.5000 | 7/1/2023 | 71,613 | ||||||||
| 45,000 | Puerto Rico Public Buildings Authority # | 5.1250 | 7/1/2025 | 37,631 | ||||||||
| 115,000 | Puerto Rico Public Buildings Authority # | 5.1250 | 7/1/2026 | 96,169 | ||||||||
| 270,000 | University of Puerto Rico | 5.0000 | 6/1/2021 | 270,675 | ||||||||
| TOTAL MUNICIPAL BONDS (Cost $1,062,436) | 1,268,769 | |||||||||||
| Shares | ||||||||||||
| CLOSED-END FUNDS - 5.5% | ||||||||||||
| 15,000 | Ares Dynamic Credit Allocation Fund, Inc. (a) | 223,500 | ||||||||||
| 35,000 | Morgan Stanley Emerging Markets Debt Fund, Inc. | 321,650 | ||||||||||
| TOTAL CLOSED-END FUNDS (Cost $528,397) | 545,150 | |||||||||||
| COMMON STOCKS - 42.0% | ||||||||||||
| AGRICULTURE - 0.6% | ||||||||||||
| 2,500 | Andersons, Inc. | 56,075 | ||||||||||
| AIRLINES - 1.5% | ||||||||||||
| 1,000 | Allegiant Travel Co. (a)(b) | 149,660 | ||||||||||
| AUTO MANUFACTURERS - 1.0% | ||||||||||||
| 7,000 | Wabash National Corp. (b)(c) | 101,570 | ||||||||||
| AUTO PARTS & EQUIPMENT - 1.1% | ||||||||||||
| 12,600 | American Axle & Manufacturing Holdings, Inc. * | 103,572 | ||||||||||
| BUSINESS DEVELOPMENT COMPANIES - 1.9% | ||||||||||||
| 3,333 | Apollo Investment Corp. | 53,628 | ||||||||||
| 20,000 | Prospect Capital Corp. | 131,800 | ||||||||||
| 185,428 | ||||||||||||
| CHEMICALS - 1.9% | ||||||||||||
| 10,000 | Olin Corp. | 187,200 | ||||||||||
| COMMERCIAL SERVICES - 4.0% | ||||||||||||
| 40,000 | Textainer Group Holdings Ltd. *(a)(b) | 396,400 | ||||||||||
| COSMETICS/PERSONAL CARE - 0.3% | ||||||||||||
| 14,500 | Veru, Inc. * | 31,320 | ||||||||||
| DISTRIBUTION/WHOLESALE - 1.7% | ||||||||||||
| 5,000 | Triton International Ltd. (a)(b) | 169,200 | ||||||||||
See accompanying notes to financial statements.
17
| Camelot Excalibur Small Cap Income Fund |
| SCHEDULE OF INVESTMENTS (Continued) |
| September 30, 2019 |
| Shares | Fair Value | |||||||
| COMMON STOCKS - 42.0% (Continued) | ||||||||
| DIVERSIFIED FINANCIAL SERVICES - 2.4% | ||||||||
| 5,000 | Ares Management Corp. (a)(b) | $ | 134,050 | |||||
| 2,000 | Deluxe Corp. (b) | 98,320 | ||||||
| 232,370 | ||||||||
| ELECTRONICS - 0.9% | ||||||||
| 12,500 | Celestica, Inc. * | 89,625 | ||||||
| ENERGY-ALTERNATE SOURCES - 0.8% | ||||||||
| 7,000 | FutureFuel Corp. | 83,580 | ||||||
| ENGINEERING & CONSTRUCTION - 3.9% | ||||||||
| 19,900 | Fluor Corp. (c) | 380,687 | ||||||
| HEALTHCARE-SERVICES - 0.8% | ||||||||
| 10,000 | Brookdale Senior Living, Inc. *(a)(b)(c) | 75,800 | ||||||
| HOUSEWARES - 1.6% | ||||||||
| 9,700 | Tupperware Brands Corp. (a) | 153,939 | ||||||
| LEISURE TIME - 0.5% | ||||||||
| 5,000 | Camping World Holdings, Inc. (a) | 44,500 | ||||||
| MEDIA - 0.4% | ||||||||
| 27,000 | Salem Media Group, Inc. | 41,310 | ||||||
| MINING - 3.4% | ||||||||
| 6,000 | Compass Minerals International, Inc. (a) | 338,940 | ||||||
| MISCELLANEOUS MANUFACTURING - 2.1% | ||||||||
| 5,000 | Sturm Ruger & Co., Inc. (a)(b) | 208,800 | ||||||
| OIL & GAS - 0.9% | ||||||||
| 1,950 | CVR Energy, Inc. (a)(b) | 85,858 | ||||||
| 1,429 | Obsidian Energy Ltd. * | 1,193 | ||||||
| 87,051 | ||||||||
| REAL ESTATE - 1.7% | ||||||||
| 39,900 | Xinyuan Real Estate Co. Ltd. - ADR (c) | 161,994 | ||||||
| RETAIL - 5.0% | ||||||||
| 5,000 | Big Lots, Inc. | 122,500 | ||||||
| 5,000 | Buckle, Inc. (b) | 103,000 | ||||||
| 3,000 | Cheesecake Factory, Inc. (a)(b)(c) | 125,040 | ||||||
| 100 | Cracker Barrel Old Country Store, Inc. | 16,265 | ||||||
| 10,000 | GameStop Corp. | 55,200 | ||||||
| 25,000 | Office Depot, Inc. | 43,875 | ||||||
| 10,000 | Tile Shop Holdings, Inc. | 31,900 | ||||||
| 497,780 | ||||||||
| SEMICONDUCTORS - 3.1% | ||||||||
| 10,000 | Rambus, Inc. *(b) | 131,250 | ||||||
| 5,000 | Silicon Motion Technology Corp. (a)(b) | 176,750 | ||||||
| 308,000 | ||||||||
| TRANSPORTATION - 0.5% | ||||||||
| 1,300 | Matson, Inc. | 48,763 | ||||||
| TOTAL COMMON STOCKS (Cost $5,622,852) | 4,133,564 | |||||||
| REAL ESTATE INVESTMENT TRUSTS (REITs) - 11.1% | ||||||||
| 10,000 | Ashford Hospitality Trust, Inc. | 33,100 | ||||||
| 12,500 | CoreCivic, Inc. (a) | 216,000 | ||||||
| 5,500 | Great Ajax Corp. | 85,250 | ||||||
| 6,250 | Office Properties Income Trust (a) | 191,500 | ||||||
| 24,360 | Two Harbors Investment Corp. (a) | 319,847 | ||||||
| 60,000 | Washington Prime Group, Inc. (a) | 248,400 | ||||||
| TOTAL REAL ESTATE INVESTMENT TRUSTS (REITs) (Cost $1,780,899) | 1,094,097 | |||||||
See accompanying notes to financial statements.
18
| Camelot Excalibur Small Cap Income Fund |
| SCHEDULE OF INVESTMENTS (Continued) |
| September 30, 2019 |
| Shares | Fair Value | |||||||||||
| LIMITED PARTNERSHIPS - 6.4% | ||||||||||||
| INVESTMENT COMPANIES - 2.5% | ||||||||||||
| 12,500 | Compass Diversified Holdings (a)(b) | $ | 246,375 | |||||||||
| OIL & GAS SERVICES - 0.5% | ||||||||||||
| 15,000 | CSI Compressco LP | 44,400 | ||||||||||
| PIPELINES - 2.4% | ||||||||||||
| 5,000 | Holly Energy Partners LP | 126,350 | ||||||||||
| 12,500 | Martin Midstream Partners LP (a) | 56,750 | ||||||||||
| 2,000 | NuStar Energy LP | 56,640 | ||||||||||
| 239,740 | ||||||||||||
| REAL ESTATE - 1.0% | ||||||||||||
| 5,000 | Brookfield Property Partners LP | 101,500 | ||||||||||
| TOTAL LIMITED PARTNERSHIPS (Cost $1,284,677) | 632,015 | |||||||||||
| Coupon Rate (%) | Maturity | |||||||||||
| PREFERRED STOCKS - 17.5% | ||||||||||||
| INSURANCE - 3.5% | ||||||||||||
| 5,000 | Maiden Holdings Ltd. | 6.6250 | 6/14/2046 | 89,250 | ||||||||
| 5,000 | Maiden Holdings Ltd. | 6.7000 | Perpetual | 34,600 | ||||||||
| 10,000 | Maiden Holdings Ltd. | 7.7500 | 12/1/2043 | 219,000 | ||||||||
| 342,850 | ||||||||||||
| INVESTMENT COMPANIES - 0.8% | ||||||||||||
| 3,000 | Prospect Capital Corp. (a) | 6.2500 | 6/15/2024 | 75,900 | ||||||||
| PIPELINES - 2.1% | ||||||||||||
| 10,000 | NuStar Energy LP, Quarterly US LIBOR +5.64% ** | 7.6250 | Perpetual | 211,000 | ||||||||
| REAL ESTATE INVESTMENT TRUSTS (REITs) - 7.4% | ||||||||||||
| 3,600 | Invesco Mortgage Capital, Inc. | 7.7500 | Perpetual | 94,392 | ||||||||
| 5,000 | Pennsylvania Real Estate Investment Trust | 7.2000 | Perpetual | 96,050 | ||||||||
| 3,573 | Pennsylvania Real Estate Investment Trust | 7.3750 | Perpetual | 73,961 | ||||||||
| 5,000 | Two Harbors Investment Corp. | 7.5000 | Perpetual | 127,650 | ||||||||
| 5,000 | Two Harbors Investment Corp. | 7.7500 | Perpetual | 126,550 | ||||||||
| 5,000 | Washington Prime Group, Inc. | 6.8750 | Perpetual | 101,750 | ||||||||
| 5,000 | Washington Prime Group, Inc. | 7.5000 | Perpetual | 109,900 | ||||||||
| 730,253 | ||||||||||||
| TRANSPORTATION - 3.7% | ||||||||||||
| 4,000 | Costamare, Inc. | 8.8750 | Perpetual | 103,801 | ||||||||
| 5,000 | Seaspan Corp. | 7.9500 | Perpetual | 127,600 | ||||||||
| 5,000 | Seaspan Corp. | 8.2500 | Perpetual | 127,600 | ||||||||
| 359,001 | ||||||||||||
| TOTAL PREFERRED STOCKS (Cost $1,716,680) | 1,719,004 | |||||||||||
| TOTAL INVESTMENTS IN LONG SECURITIES - 104.0% (Cost $12,899,451) | $ | 10,245,114 | ||||||||||
| TOTAL CALL OPTIONS WRITTEN - (5.2)% (Premiums Received $504,198) | (509,903 | ) | ||||||||||
| TOTAL PUT OPTIONS WRITTEN - (0.7)% (Premiums Received $117,302) | (74,800 | ) | ||||||||||
| TOTAL SECURITIES SOLD SHORT - (4.7)% (Proceeds $610,896) | (460,308 | ) | ||||||||||
| OTHER ASSETS IN EXCESS OF LIABILITIES - 6.6% | 649,210 | |||||||||||
| TOTAL NET ASSETS - 100.0% | $ | 9,849,313 | ||||||||||
See accompanying notes to financial statements.
19
| Camelot Excalibur Small Cap Income Fund |
| SCHEDULE OF INVESTMENTS (Continued) |
| September 30, 2019 |
| Notional Value at | ||||||||||||||
| September 30, | ||||||||||||||
| Contracts*** | Counterparty | 2019 | Fair Value | |||||||||||
| SCHEDULE OF CALL OPTIONS WRITTEN - (5.2)% * | ||||||||||||||
| 10 | Allegiant Travel Co. | |||||||||||||
| Expiration January 2020, Exercise Price $140.00 | Interactive Brokers | $ | 140,000 | $ | 14,150 | |||||||||
| 3 | Ares Commercial Real Estate Co. | |||||||||||||
| Expiration November 2019, Exercise Price $15.00 | Interactive Brokers | 4,500 | 158 | |||||||||||
| 50 | Ares Management Corp. | |||||||||||||
| Expiration December 2019, Exercise Price $30.00 | Interactive Brokers | 150,000 | 2,700 | |||||||||||
| 100 | Brookdale Senior Living, Inc. | |||||||||||||
| Expiration October 2019, Exercise Price $9.00 | Interactive Brokers | 90,000 | 750 | |||||||||||
| 50 | Buckle, Inc. | |||||||||||||
| Expiration December 2019, Exercise Price $17.50 | Interactive Brokers | 87,500 | 16,000 | |||||||||||
| 30 | Cheesecake Factory, Inc. | |||||||||||||
| Expiration October 2019, Exercise Price $50.00 | Interactive Brokers | 150,000 | 150 | |||||||||||
| 125 | Compass Diversified Holdings | |||||||||||||
| Expiration November 2019, Exercise Price $20.00 | Interactive Brokers | 250,000 | 6,250 | |||||||||||
| 60 | Compass Minerals International | |||||||||||||
| Expiration December 2019, Exercise Price $55.00 | Interactive Brokers | 330,000 | 24,300 | |||||||||||
| 20 | CVR Energy, Inc. | |||||||||||||
| Expiration March 2020, Exercise Price $45.00 | Interactive Brokers | 90,000 | 7,000 | |||||||||||
| 20 | Deluxe Corp. | |||||||||||||
| Expiration January 2020, Exercise Price $45.00 | Interactive Brokers | 90,000 | 10,600 | |||||||||||
| 100 | Invesco QQQ Trust, Series 1 | |||||||||||||
| Expiration December 2020, Exercise Price $189.00 | Interactive Brokers | 1,890,000 | 71,500 | |||||||||||
| 70 | iShares Russell 2000 ETF | |||||||||||||
| Expiration December 2019, Exercise Price $150.00 | Interactive Brokers | 1,050,000 | 45,920 | |||||||||||
| 250 | iShares Russell 2000 ETF | |||||||||||||
| Expiration January 2020, Exercise Price $150.00 | Interactive Brokers | 3,750,000 | 185,250 | |||||||||||
| 25 | LGI Homes, Inc. | |||||||||||||
| Expiration November 2019, Exercise Price $70.00 | Interactive Brokers | 175,000 | 37,250 | |||||||||||
| 100 | Rambus, Inc. | |||||||||||||
| Expiration January 2020, Exercise Price $11.00 | Interactive Brokers | 110,000 | 24,800 | |||||||||||
| 50 | Silicon Motion Technology Corp. | |||||||||||||
| Expiration March 2020, Exercise Price $35.00 | Interactive Brokers | 175,000 | 19,500 | |||||||||||
| 50 | Sturm Ruger & Co., Inc. | |||||||||||||
| Expiration October 2019, Exercise Price $55.00 | Interactive Brokers | 275,000 | 125 | |||||||||||
| 200 | Textainer Group Holdings Ltd. | |||||||||||||
| Expiration February 2020, Exercise Price $10.00 | Interactive Brokers | 200,000 | 27,500 | |||||||||||
| 50 | Triton International Ltd. | |||||||||||||
| Expiration January 2020, Exercise Price $35.00 | Interactive Brokers | 175,000 | 8,650 | |||||||||||
| 70 | Wabash National Corp. | |||||||||||||
| Expiration January 2020, Exercise Price $15.00 | Interactive Brokers | 105,000 | 7,350 | |||||||||||
| TOTAL CALL OPTIONS WRITTEN - (Premiums Received $504,198) | $ | 509,903 | ||||||||||||
| SCHEDULE OF PUT OPTIONS WRITTEN - (0.7)% * | ||||||||||||||
| 100 | Brookdale Senior Living, Inc. | |||||||||||||
| Expiration October 2019, Exercise Price $7.00 | Interactive Brokers | 70,000 | 1,000 | |||||||||||
| 50 | Brookdale Senior Living, Inc. | |||||||||||||
| Expiration October 2019, Exercise Price $8.00 | Interactive Brokers | 40,000 | 2,625 | |||||||||||
| 30 | Cheesecake Factory, Inc. | |||||||||||||
| Expiration October 2019, Exercise Price $45.00 | Interactive Brokers | 135,000 | 10,200 | |||||||||||
| 1 | Fluor Corp. | |||||||||||||
| Expiration October 2019, Exercise Price $37.50 | Interactive Brokers | 3,750 | 1,925 | |||||||||||
| 100 | iPath Series B S&P 500 | |||||||||||||
| Expiration October 2019, Exercise Price $24.00 | Interactive Brokers | 240,000 | 17,900 | |||||||||||
| 100 | iPath Series B S&P 500 | |||||||||||||
| Expiration November 2019, Exercise Price $23.00 | Interactive Brokers | 230,000 | 21,000 | |||||||||||
| 50 | MEDNAX, Inc. | |||||||||||||
| Expiration November 2019, Exercise Price $22.50 | Interactive Brokers | 112,500 | 7,000 | |||||||||||
| 100 | Signet Jewelers Ltd. | |||||||||||||
| Expiration October 2019, Exercise Price $15.00 | Interactive Brokers | 150,000 | 3,500 | |||||||||||
See accompanying notes to financial statements.
20
| Camelot Excalibur Small Cap Income Fund |
| SCHEDULE OF INVESTMENTS (Continued) |
| September 30, 2019 |
| Notional Value at | ||||||||||||||
| September 30, | ||||||||||||||
| Contracts*** | Counterparty | 2019 | Fair Value | |||||||||||
| SCHEDULE OF PUT OPTIONS WRITTEN - (0.7)% (Continued) | ||||||||||||||
| 30 | Wabash National Corp. | |||||||||||||
| Expiration October 2019, Exercise Price $12.50 | Interactive Brokers | $ | 37,500 | $ | 150 | |||||||||
| 100 | Xinyuan Real Estate Co. Ltd. | |||||||||||||
| Expiration October 2019, Exercise Price $5.00 | Interactive Brokers | 50,000 | 9,500 | |||||||||||
| TOTAL PUT OPTIONS WRITTEN - (Premiums Received $117,302) | $ | 74,800 | ||||||||||||
| Shares | ||||||||||||||
| SECURITIES SOLD SHORT - (4.7)% | ||||||||||||||
| COMMON STOCK - (0.0)% | ||||||||||||||
| 100 | Ampco-Pittsburgh Corp. * | $ | 368 | |||||||||||
| CLOSED-END FUND - (2.0)% | ||||||||||||||
| 15,000 | Stone Harbor Emerging Markets Income Fund | 196,650 | ||||||||||||
| EXCHANGE TRADED NOTE - (2.4)% | ||||||||||||||
| 10,000 | iPATH S&P 500 VIX Short-Term Futures ETN * | 237,400 | ||||||||||||
| REAL ESTATE INVESTMENT TRUST (REIT) - (0.3)% | ||||||||||||||
| 1,700 | Ares Commercial Real Estate Corp. | 25,890 | ||||||||||||
| TOTAL SECURITIES SOLD SHORT (Proceeds $610,896) | $ | 460,308 | ||||||||||||
ADR - American Depositary Receipt
LP - Limited Partnership
ETN - Exchange Traded Note
REIT - Real Estate Investment Trust
VIX - S&P 500 Volatility Index
| ^ | 144A Security - Security exempt from registration under Rule 144A of the Securities Act of 1933. The 144A securities represent 2.00% of total net assets. The securities may be resold in transactions exempt from registration typically only to qualified institutional buyers. Unless otherwise indicated, these securities are not considered to be illiquid. |
| # | Security in default. |
| * | Non-Income producing security |
| ** | Variable Rate as of September 30, 2019. |
| *** | One contract is equivalent to 100 shares of common stock. |
| (a) | All or a portion of the security is segregated as collateral for call options written. |
| (b) | Subject to call options written. |
| (c) | Subject to put options written. |
See accompanying notes to financial statements.
21
| Camelot Funds |
| STATEMENTS OF ASSETS AND LIABILITIES |
| September 30, 2019 |
| Camelot Premium | Camelot Excalibur | |||||||
| Return Fund | Small Cap Income Fund | |||||||
| ASSETS | ||||||||
| Investment securities: | ||||||||
| At cost | $ | 58,714,118 | $ | 12,899,451 | ||||
| At value (including collateral for loaned securities) | $ | 48,367,821 | $ | 10,245,114 | ||||
| Cash and cash equivalents | 760,873 | 284,177 | ||||||
| Deposit with Brokers for options | 4,434,315 | 320,986 | ||||||
| Dividends and interest receivable | 131,020 | 54,927 | ||||||
| Receivable for Fund shares sold | 11,339 | 5,160 | ||||||
| Receivable for securities sold | 10,000 | — | ||||||
| Receivable due from Manager | — | 5 | ||||||
| Prepaid expenses and other assets | 16,307 | 16,107 | ||||||
| TOTAL ASSETS | 53,731,675 | 10,926,476 | ||||||
| LIABILITIES | ||||||||
| Options written, at value (Premiums received $3,435,964, $621,500) | 2,418,958 | 584,703 | ||||||
| Securities sold short (Proceeds $4,169,012, $610,896) | 3,723,410 | 460,308 | ||||||
| Investment management fees payable | 37,350 | — | ||||||
| Foreign currency overdraft | 58,586 | — | ||||||
| Payable upon return of securities loaned | 6,607,316 | — | ||||||
| Securities purchased payable | 237,644 | — | ||||||
| Distribution (12b-1) fees payable | 2,180 | 494 | ||||||
| Payable for Fund shares repurchased | 43,863 | 9,943 | ||||||
| Payable to related parties | 13,105 | 4,247 | ||||||
| Dividends on securities sold short payable | 3,799 | 561 | ||||||
| Broker fees for options | 148,604 | 13,235 | ||||||
| Accrued expenses and other liabilities | 4,625 | 3,672 | ||||||
| TOTAL LIABILITIES | 13,299,440 | 1,077,163 | ||||||
| NET ASSETS | $ | 40,432,235 | $ | 9,849,313 | ||||
| Composition of Net Assets: | ||||||||
| Paid in capital | $ | 48,475,684 | $ | 11,953,390 | ||||
| Accumulated losses | (8,043,449 | ) | (2,104,077 | ) | ||||
| NET ASSETS | $ | 40,432,235 | $ | 9,849,313 | ||||
| Net Asset Value Per Share: | ||||||||
| Class A Shares: | ||||||||
| Net Assets | $ | 1,994,590 | $ | 271,786 | ||||
| Shares of beneficial interest outstanding (a) | 217,303 | 34,483 | ||||||
| Net asset value (Net Assets ÷ Shares Outstanding) and redemption price per share (b) | $ | 9.18 | $ | 7.88 | ||||
| Maximum offering price per share (net asset value plus maximum sales charge of 5.75%) | $ | 9.74 | $ | 8.36 | ||||
| Class I Shares: | ||||||||
| Net Assets | $ | 38,437,645 | $ | 9,577,527 | ||||
| Shares of beneficial interest outstanding (a) | 4,186,638 | 1,223,896 | ||||||
| Net asset value (Net Assets ÷ Shares Outstanding), offering price and redemption price per share | $ | 9.18 | $ | 7.83 | ||||
| (a) | Unlimited number of shares of beneficial interest authorized, no par value. |
| (b) | Investments in Class A shares made at or above the $1 million breakpoint are not subject to an initial sales charge and may be subject to a 1.00% contingent deferred sales charge (“CDSC”) on shares redeemed less than 18 months after the date of purchase (excluding shares purchased with reinvested dividends and/or distributions). |
See accompanying notes to financial statements.
22
| Camelot Funds |
| STATEMENTS OF OPERATIONS |
| For the Year Ended September 30, 2019 |
| Camelot Premium | Camelot Excalibur | |||||||
| Return Fund | Small Cap Income Fund | |||||||
| INVESTMENT INCOME | ||||||||
| Dividends (net of withholding taxes of $41,496 and $521, respectively) | $ | 1,988,666 | $ | 611,874 | ||||
| Interest | 502,861 | 134,872 | ||||||
| Securities lending income - net | 45,573 | 2,626 | ||||||
| TOTAL INVESTMENT INCOME | 2,537,100 | 749,372 | ||||||
| EXPENSES | ||||||||
| Investment management fees | 451,751 | 106,916 | ||||||
| Distribution (12b-1) fees: | ||||||||
| Class A | 8,295 | 846 | ||||||
| Class C | 2,306 | — | ||||||
| Broker fees | 641,388 | 38,650 | ||||||
| Interest expense | 435,178 | 63,760 | ||||||
| Administration fees | 109,338 | 36,186 | ||||||
| Dividends on securities sold short | 61,469 | 35,246 | ||||||
| Management service fees | 48,697 | 15,343 | ||||||
| Registration fees | 47,793 | 47,740 | ||||||
| Shareholder service fees | 28,210 | 8,036 | ||||||
| Extraordinary expenses | 14,464 | — | ||||||
| Compliance officer fees | 13,491 | 12,623 | ||||||
| Audit fees | 12,750 | 12,750 | ||||||
| Legal Fees | 12,635 | 9,786 | ||||||
| Trustees fees and expenses | 11,189 | 11,184 | ||||||
| Printing and postage expenses | 11,140 | 3,127 | ||||||
| Custodian fees | 8,552 | 5,034 | ||||||
| Insurance expense | 1,723 | 733 | ||||||
| Other expenses | 2,104 | 1,786 | ||||||
| TOTAL EXPENSES | 1,922,473 | 409,746 | ||||||
| Less: Fees waived by the Manager | (79,292 | ) | (110,417 | ) | ||||
| NET EXPENSES | 1,843,181 | 299,329 | ||||||
| NET INVESTMENT INCOME | 693,919 | 450,043 | ||||||
| REALIZED AND UNREALIZED GAIN (LOSS) | ||||||||
| Net realized gain (loss) from: | ||||||||
| Investments | (1,655,193 | ) | (578,771 | ) | ||||
| Options written | 3,685,111 | 586,278 | ||||||
| Foreign currency transactions | 450 | 4 | ||||||
| Securities sold short | (5,195 | ) | 165,916 | |||||
| Net realized gain | 2,025,173 | 173,427 | ||||||
| Net change in unrealized appreciation (depreciation) on: | ||||||||
| Investments | (5,094,906 | ) | (1,072,429 | ) | ||||
| Options written | 872,056 | 27,307 | ||||||
| Foreign currency translations | (406 | ) | — | |||||
| Securities sold short | (80,255 | ) | 7,728 | |||||
| Net change in unrealized depreciation | (4,303,511 | ) | (1,037,394 | ) | ||||
| NET REALIZED AND UNREALIZED LOSS | (2,278,338 | ) | (863,967 | ) | ||||
| NET DECREASE IN NET ASSETS RESULTING FROM OPERATIONS | $ | (1,584,419 | ) | $ | (413,924 | ) | ||
See accompanying notes to financial statements.
23
| Camelot Premium Return Fund |
| STATEMENTS OF CHANGES IN NET ASSETS |
| For the | For the | |||||||
| Year Ended | Year Ended | |||||||
| September 30, 2019 | September 30, 2018 | |||||||
| FROM OPERATIONS | ||||||||
| Net investment income | $ | 693,919 | $ | 1,740,863 | ||||
| Net realized gain from investments, options written, foreign currency transactions, and securities sold short | 2,025,173 | 1,706,866 | ||||||
| Distributions of realized gains by underlying investment companies | — | 1,635 | ||||||
| Net change in unrealized appreciation (depreciation) of investments, options written, foreign currency translations, and securities sold short | (4,303,511 | ) | 1,579,706 | |||||
| Net increase (decrease) in net assets resulting from operations | (1,584,419 | ) | 5,029,070 | |||||
| DISTRIBUTIONS TO SHAREHOLDERS | ||||||||
| From net investment income: | ||||||||
| Class A | — | (373,316 | ) | |||||
| Class C | — | (32,339 | ) | |||||
| Class I | — | (1,609,181 | ) | |||||
| From net realized gains: | ||||||||
| Class A | — | (242,992 | ) | |||||
| Class C | — | (24,522 | ) | |||||
| Class I | — | (889,184 | ) | |||||
| Total distributions paid * | ||||||||
| Class A | (219,548 | ) | — | |||||
| Class C | (19,833 | ) | — | |||||
| Class I | (2,939,894 | ) | — | |||||
| Net decrease in net assets from distributions to shareholders | (3,179,275 | ) | (3,171,534 | ) | ||||
| FROM SHARES OF BENEFICIAL INTEREST | ||||||||
| Proceeds from shares sold: | ||||||||
| Class A | 689,126 | 4,298,040 | ||||||
| Class C # | 1,239 | 16,433 | ||||||
| Class I | 11,857,748 | 53,388,710 | ||||||
| Net asset value of shares issued in reinvestment of distributions: | ||||||||
| Class A | 157,114 | 382,362 | ||||||
| Class C # | 16,656 | 42,999 | ||||||
| Class I | 971,418 | 679,183 | ||||||
| Payments for shares redeemed: | ||||||||
| Class A | (4,639,061 | ) | (56,530,792 | ) | ||||
| Class C # | (832,337 | ) | (562,975 | ) | ||||
| Class I | (15,555,614 | ) | (12,291,965 | ) | ||||
| Net decrease in net assets from shares of beneficial interest | (7,333,711 | ) | (10,578,005 | ) | ||||
| TOTAL DECREASE IN NET ASSETS | (12,097,405 | ) | (8,720,469 | ) | ||||
| NET ASSETS | ||||||||
| Beginning of Year | 52,529,640 | 61,250,109 | ||||||
| End of Year ** | $ | 40,432,235 | $ | 52,529,640 | ||||
| * | Distributions from net investment income and net realized capital gains are combined for the year ended September 30, 2019. See “Recent Accounting Pronouncements and Reporting Updates” in the Notes to Financial Statements for more information. The dividends and distributions to shareholders for the year ended September 30, 2018 have not been reclassified to conform to the current period’s presentation. |
| # | Class C shares converted 94,297 shares, at a value of $775,125, to Class I shares effective January 4, 2019. |
| ** | Net Assets- End of Year includes distributions in excess of net investment gain of $812,775 as of September 30, 2018. |
See accompanying notes to financial statements.
24
| Camelot Premium Return Fund |
| STATEMENTS OF CHANGES IN NET ASSETS (Continued) |
| For the | For the | |||||||
| Year Ended | Year Ended | |||||||
| September 30, 2019 | September 30, 2018 | |||||||
| SHARE ACTIVITY | ||||||||
| Class A: | ||||||||
| Shares Sold | 73,920 | 425,244 | ||||||
| Shares Reinvested | 17,905 | 38,881 | ||||||
| Shares Redeemed | (500,899 | ) | (5,766,810 | ) | ||||
| Net decrease in shares of beneficial interest outstanding | (409,074 | ) | (5,302,685 | ) | ||||
| Class C: # | ||||||||
| Shares Sold | 137 | 1,698 | ||||||
| Shares Reinvested | 2,054 | 4,415 | ||||||
| Shares Redeemed | (100,514 | ) | (57,143 | ) | ||||
| Net decrease in shares of beneficial interest outstanding | (98,323 | ) | (51,030 | ) | ||||
| Class I: | ||||||||
| Shares Sold | 1,319,756 | 5,419,390 | ||||||
| Shares Reinvested | 110,239 | 69,201 | ||||||
| Shares Redeemed | (1,684,258 | ) | (1,235,239 | ) | ||||
| Net increase (decrease) in shares of beneficial interest outstanding | (254,263 | ) | 4,253,352 | |||||
| # | Class C shares converted 94,297 shares, at a value of $775,125, to Class I shares effective January 4, 2019. |
See accompanying notes to financial statements.
25
| Camelot Excalibur Small Cap Income Fund |
| STATEMENTS OF CHANGES IN NET ASSETS |
| For the | For the | |||||||
| Year Ended | Year Ended | |||||||
| September 30, 2019 | September 30, 2018 | |||||||
| FROM OPERATIONS | ||||||||
| Net investment income | $ | 450,043 | $ | 585,423 | ||||
| Net realized gain from investments, options written, foreign currency transactions, and securities sold short | 173,427 | 106,489 | ||||||
| Net change in unrealized appreciation (depreciation) of investments, options written, and securities sold short | (1,037,394 | ) | 594,764 | |||||
| Net increase (decrease) in net assets resulting from operations | (413,924 | ) | 1,286,676 | |||||
| DISTRIBUTIONS TO SHAREHOLDERS | ||||||||
| From net investment income: | ||||||||
| Class A | — | (104,673 | ) | |||||
| Class I | — | (442,410 | ) | |||||
| From net realized gains: | ||||||||
| Class A | — | (29,826 | ) | |||||
| Class I | — | (27,136 | ) | |||||
| Total distributions paid * | ||||||||
| Class A | (25,789 | ) | — | |||||
| Class I | (747,303 | ) | — | |||||
| Net decrease in net assets from distributions to shareholders | (773,092 | ) | (604,045 | ) | ||||
| FROM SHARES OF BENEFICIAL INTEREST | ||||||||
| Proceeds from shares sold: | ||||||||
| Class A | 128,649 | 460,597 | ||||||
| Class I | 4,062,558 | 12,329,240 | ||||||
| Net asset value of shares issued in reinvestment of distributions: | ||||||||
| Class A | 23,423 | 45,868 | ||||||
| Class I | 245,798 | 238,616 | ||||||
| Payments for shares redeemed: | ||||||||
| Class A | (266,672 | ) | (11,167,138 | ) | ||||
| Class C # | — | (1,151 | ) | |||||
| Class I | (4,281,610 | ) | (3,051,211 | ) | ||||
| Net decrease in net assets from shares of beneficial interest | (87,854 | ) | (1,145,179 | ) | ||||
| TOTAL DECREASE IN NET ASSETS | (1,274,870 | ) | (462,548 | ) | ||||
| NET ASSETS | ||||||||
| Beginning of Year | 11,124,183 | 11,586,731 | ||||||
| End of Year ** | $ | 9,849,313 | $ | 11,124,183 | ||||
| * | Distributions from net investment income and net realized capital gains are combined for the year ended September 30, 2019. See “Recent Accounting Pronouncements and Reporting Updates” in the Notes to Financial Statements for more information. The dividends and distributions to shareholders for the year ended September 30, 2018 have not been reclassified to conform to the current period’s presentation. |
| # | Class C shares closed effective November 14, 2017. |
| ** | Net Assets- End of Year includes distributions in excess of net investment gain of $367,843 as of September 30, 2018. |
See accompanying notes to financial statements.
26
| Camelot Excalibur Small Cap Income Fund |
| STATEMENTS OF CHANGES IN NET ASSETS (Continued) |
| For the | For the | |||||||
| Year Ended | Year Ended | |||||||
| September 30, 2019 | September 30, 2018 | |||||||
| SHARE ACTIVITY | ||||||||
| Class A: | ||||||||
| Shares Sold | 15,967 | 53,635 | ||||||
| Shares Reinvested | 3,094 | 5,383 | ||||||
| Shares Redeemed | (34,772 | ) | (1,316,825 | ) | ||||
| Net decrease in shares of beneficial interest outstanding | (15,711 | ) | (1,257,807 | ) | ||||
| Class C: # | ||||||||
| Shares Sold | — | — | ||||||
| Shares Reinvested | — | — | ||||||
| Shares Redeemed | — | (134 | ) | |||||
| Net decrease in shares of beneficial interest outstanding | — | (134 | ) | |||||
| Class I: | ||||||||
| Shares Sold | 515,984 | 1,455,151 | ||||||
| Shares Reinvested | 32,196 | 28,445 | ||||||
| Shares Redeemed | (530,945 | ) | (351,084 | ) | ||||
| Net increase in shares of beneficial interest outstanding | 17,235 | 1,132,512 | ||||||
| # | Class C shares closed effective November 14, 2017. |
See accompanying notes to financial statements.
27
| Camelot Premium Return Fund |
| FINANCIAL HIGHLIGHTS |
Per Share Data and Ratios for a Share of Beneficial Interest Outstanding Throughout each of the Years Presented
| Class A | ||||||||||||||||||||
| Year | Year | Year | Year | Year | ||||||||||||||||
| Ended | Ended | Ended | Ended | Ended | ||||||||||||||||
| September 30, 2019 | September 30, 2018 | September 30, 2017 | September 30, 2016 | September 30, 2015 | ||||||||||||||||
| Net asset value, beginning of year | $ | 10.17 | $ | 9.78 | $ | 9.57 | $ | 9.25 | $ | 11.21 | ||||||||||
| Activity from investment operations: | ||||||||||||||||||||
| Net investment income (1) | 0.14 | 0.27 | 0.27 | 0.27 | 0.21 | |||||||||||||||
| Net realized and unrealized gain (loss) on investments | (0.49 | ) | 0.69 | 0.50 | 0.98 | (1.41 | ) | |||||||||||||
| Total from investment operations | (0.35 | ) | 0.96 | 0.77 | 1.25 | (1.20 | ) | |||||||||||||
| Less distributions from: | ||||||||||||||||||||
| Net investment income | (0.15 | ) | (0.35 | ) | (0.21 | ) | (0.21 | ) | (0.19 | ) | ||||||||||
| Return of capital | — | — | (0.09 | ) | (0.26 | ) | — | |||||||||||||
| Net realized gains | (0.49 | ) | (0.22 | ) | (0.26 | ) | (0.46 | ) | (0.57 | ) | ||||||||||
| Total distributions | (0.64 | ) | (0.57 | ) | (0.56 | ) | (0.93 | ) | (0.76 | ) | ||||||||||
| Net asset value, end of year | $ | 9.18 | $ | 10.17 | $ | 9.78 | $ | 9.57 | $ | 9.25 | ||||||||||
| Total return (2) | (2.99 | )% | 10.16 | % | 8.14 | % | 14.71 | % (8) | (11.22 | )% (8) | ||||||||||
| Net assets, at end of year (000s) | $ | 1,995 | $ | 6,370 | $ | 57,965 | $ | 53,052 | $ | 59,401 | ||||||||||
| Ratio of gross expenses to average net assets (3)(4)(5) | 4.53 | % (7) | 1.86 | % | 1.76 | % | 1.86 | % | 1.66 | % | ||||||||||
| Ratio of net expenses to average net assets (4)(5) | 4.36 | % (7) | 1.78 | % | 1.77 | % (9) | 1.78 | % | 1.73 | % (9) | ||||||||||
| Ratio of net investment income to average net assets (4)(5)(6) | 1.30 | % (7) | 2.74 | % | 2.77 | % | 2.94 | % | 2.00 | % | ||||||||||
| Portfolio Turnover Rate | 221 | % | 44 | % | 32 | % | 44 | % | 38 | % | ||||||||||
| (1) | Per share amounts calculated using the average shares method. |
| (2) | Total return in the above table is historical in nature and represents the rate that the investor would have earned or lost on an investment in the Fund assuming reinvestment of dividends and capital gain distributions, if any. Had the Manager not waived a portion of the Fund’s expenses in certain periods, total return would have been lower. Does not reflect the impact of sales charges. |
| (3) | Represents the ratio of expenses to average net assets absent fee waivers and/or expense reimbursements by the Manager. |
| (4) | The ratios include 2.58%, 0.07%, 0.02% and 0.03% for the years ended September 30, 2019, September 30, 2018, September 30, 2017 and September 30, 2016 attributed to dividends from securities sold short and interest expense. |
| (5) | The ratios of expenses to average net assets and net investment income to average net assets do not reflect the expenses of the underlying investment companies in which the Fund invests. |
| (6) | Recognition of net investment income is affected by the timing and declaration of dividends by the underlying investment companies in which the Fund invests. |
| (7) | The ratios include 0.03% for the year ended September 30, 2019 attributed to extraordinary expense. |
| (8) | Includes adjustments in accordance with accounting principles generally accepted in the United States and, consequently, the net asset value for financial reporting purposes and the returns based upon those net asset values may differ from the net asset values and returns for shareholder transactions. |
| (9) | The ratio includes expense recapture by the Manager. |
See accompanying notes to financial statements.
28
| Camelot Premium Return Fund |
| FINANCIAL HIGHLIGHTS |
Per Share Data and Ratios for a Share of Beneficial Interest Outstanding Throughout each of the Periods Presented
| Class I | ||||||||||||
| Year | Year | For the Period | ||||||||||
| Ended | Ended | Ended | ||||||||||
| September 30, 2019 | September 30, 2018 | September 30, 2017 (1) | ||||||||||
| Net asset value, beginning of period | $ | 10.17 | $ | 9.78 | $ | 9.80 | ||||||
| Activity from investment operations: | ||||||||||||
| Net investment income (2) | 0.14 | 0.35 | 0.23 | |||||||||
| Net realized and unrealized gain (loss) on investments | (0.47 | ) | 0.65 | 0.19 | ||||||||
| Total from investment operations | (0.33 | ) | 1.00 | 0.42 | ||||||||
| Less distributions from: | ||||||||||||
| Net investment income | (0.17 | ) | (0.39 | ) | (0.13 | ) | ||||||
| Return of capital | — | — | (0.13 | ) | ||||||||
| Net realized gains | (0.49 | ) | (0.22 | ) | (0.18 | ) | ||||||
| Total distributions | (0.66 | ) | (0.61 | ) | (0.44 | ) | ||||||
| Net asset value, end of period | $ | 9.18 | $ | 10.17 | $ | 9.78 | ||||||
| Total return (3) | (2.78 | )% | 10.56 | % | 4.31 | % (9) | ||||||
| Net assets, at end of period (000s) | $ | 38,438 | $ | 45,166 | $ | 1,834 | ||||||
| Ratio of gross expenses to average net assets (4)(5)(6) | 4.28 | % (8) | 1.61 | % | 1.51 | % (10) | ||||||
| Ratio of net expenses to average net assets (5)(6) | 4.11 | % (8) | 1.53 | % | 1.52 | % (10)(11) | ||||||
| Ratio of net investment income to average net assets (5)(7) | 1.55 | % (8) | 3.46 | % | 3.02 | % (10) | ||||||
| Portfolio Turnover Rate | 221 | % | 44 | % | 32 | % (9) | ||||||
| (1) | The Camelot Premium Return Fund’s Class I shares commenced operations on December 30, 2016. |
| (2) | Per share amounts calculated using the average shares method. |
| (3) | Total return in the above table is historical in nature and represents the rate that the investor would have earned or lost on an investment in the Fund assuming reinvestment of dividends and capital gain distributions, if any. Does not reflect the impact of sales charges. |
| (4) | Represents the ratio of expenses to average net assets absent fee waivers and/or expense reimbursements by the Manager. |
| (5) | The ratios of expenses to average net assets and net investment income to average net assets do not reflect the expenses of the underlying investment companies in which the Fund invests. |
| (6) | The ratios include 2.58%, 0.07% and 0.02% for the periods ended September 30, 2019, September 30, 2018 and September 30, 2017 attributed to dividends from securities sold short and interest expense. |
| (7) | Recognition of net investment income is affected by the timing and declaration of dividends by the underlying investment companies in which the Fund invests. |
| (8) | The ratios include 0.03% for the year ended September 30, 2019 attributed to extraordinary expense. |
| (9) | Not annualized. |
| (10) | Annualized. |
| (11) | The ratio includes expense recapture by the Manager. |
See accompanying notes to financial statements.
29
| Camelot Excalibur Small Cap Income Fund |
| FINANCIAL HIGHLIGHTS |
Per Share Data and Ratios for a Share of Beneficial Interest Outstanding Throughout each of the Years Presented
| Class A | ||||||||||||||||||||
| Year | Year | Year | Year | Year | ||||||||||||||||
| Ended | Ended | Ended | Ended | Ended | ||||||||||||||||
| September 30, 2019 | September 30, 2018 | September 30, 2017 | September 30, 2016 | September 30, 2015 | ||||||||||||||||
| Net asset value, beginning of year | $ | 8.91 | $ | 8.38 | $ | 8.03 | $ | 7.86 | $ | 9.34 | ||||||||||
| Activity from investment operations: | ||||||||||||||||||||
| Net investment income (1) | 0.33 | 0.37 | 0.33 | 0.30 | 0.29 | |||||||||||||||
| Net realized and unrealized gain (loss) on investments | (0.78 | ) | 0.59 | 0.42 | 0.60 | (1.43 | ) | |||||||||||||
| Total from investment operations | (0.45 | ) | 0.96 | 0.75 | 0.90 | (1.14 | ) | |||||||||||||
| Less distributions from: | ||||||||||||||||||||
| Net investment income | (0.26 | ) | (0.39 | ) | (0.31 | ) | (0.26 | ) | (0.22 | ) | ||||||||||
| Return of capital | — | — | — | (0.08 | ) | — | ||||||||||||||
| Net realized gains | (0.32 | ) | (0.04 | ) | (0.09 | ) | (0.39 | ) | (0.12 | ) | ||||||||||
| Total distributions | (0.58 | ) | (0.43 | ) | (0.40 | ) | (0.73 | ) | (0.34 | ) | ||||||||||
| Net asset value, end of year | $ | 7.88 | $ | 8.91 | $ | 8.38 | $ | 8.03 | $ | 7.86 | ||||||||||
| Total return (2) | (4.68 | )% | 11.80 | % | 9.37 | % | 12.26 | % (7) | (12.50 | )% (7) | ||||||||||
| Net assets, at end of year (000s) | $ | 272 | $ | 447 | $ | 10,967 | $ | 9,094 | $ | 8,524 | ||||||||||
| Ratio of gross expenses to average net assets (3)(4)(5) | 4.08 | % | 2.70 | % | 2.70 | % | 2.50 | % | 2.23 | % | ||||||||||
| Ratio of net expenses to average net assets (4)(5) | 3.04 | % | 1.80 | % | 1.77 | % | 1.78 | % | 1.75 | % | ||||||||||
| Ratio of net investment income to average net assets (4)(6) | 4.03 | % | 4.52 | % | 3.86 | % | 3.92 | % | 3.22 | % | ||||||||||
| Portfolio Turnover Rate | 79 | % | 36 | % | 25 | % | 23 | % | 44 | % | ||||||||||
| (1) | Per share amounts calculated using the average shares method. |
| (2) | Total return in the above table is historical in nature and represents the rate that the investor would have earned or lost on an investment in the Fund assuming reinvestment of dividends and capital gain distributions, if any. Had the Manager not waived a portion of the Fund’s expenses in certain periods, total return would have been lower. Does not reflect the impact of sales charges. |
| (3) | Represents the ratio of expenses to average net assets absent fee waivers and/or expense reimbursements by the Manager. |
| (4) | The ratios of expenses to average net assets and net investment income to average net assets do not reflect the expenses of the underlying investment companies in which the Fund invests. |
| (5) | The ratios include 1.29%, 0.05%, 0.02% and 0.03% for the years ended September 30, 2019, September 30, 2018, September 30, 2017 and September 30, 2016 attributed to dividends from securities sold short and interest expense. |
| (6) | Recognition of net investment income is affected by the timing and declaration of dividends by the underlying investment companies in which the Fund invests. |
| (7) | Includes adjustments in accordance with accounting principles generally accepted in the United States and, consequently, the net asset value for financial reporting purposes and the returns based upon those net asset values may differ from the net asset values and returns for shareholder transactions. |
See accompanying notes to financial statements.
30
| Camelot Excalibur Small Cap Income Fund |
| FINANCIAL HIGHLIGHTS |
Per Share Data and Ratios for a Share of Beneficial Interest Outstanding for each of the Periods Presented
| Class I | ||||||||||||
| Year | Year | For the Period | ||||||||||
| Ended | Ended | Ended | ||||||||||
| September 30, 2019 | September 30, 2018 | September 30, 2017 (1) | ||||||||||
| Net asset value, beginning of period | $ | 8.85 | $ | 8.35 | $ | 8.43 | ||||||
| Activity from investment operations: | ||||||||||||
| Net investment income (2) | 0.34 | 0.45 | 0.25 | |||||||||
| Net realized and unrealized gain (loss) on investments | (0.76 | ) | 0.51 | (0.01 | ) | |||||||
| Total from investment operations | (0.42 | ) | 0.96 | 0.24 | ||||||||
| Less distributions from: | ||||||||||||
| Net investment income | (0.28 | ) | (0.42 | ) | (0.25 | ) | ||||||
| Net realized gains | (0.32 | ) | (0.04 | ) | (0.07 | ) | ||||||
| Total distributions | (0.60 | ) | (0.46 | ) | (0.32 | ) | ||||||
| Net asset value, end of period | $ | 7.83 | $ | 8.85 | $ | 8.35 | ||||||
| Total return (3) | (4.33 | )% | 11.85 | % | 2.80 | % (8) | ||||||
| Net assets, at end of period (000s) | $ | 9,578 | $ | 10,677 | $ | 619 | ||||||
| Ratio of gross expenses to average net assets (4)(5)(6) | 3.83 | % | 2.45 | % | 2.45 | % (9) | ||||||
| Ratio of net expenses to average net assets (5)(6) | 2.79 | % | 1.55 | % | 1.52 | % (9) | ||||||
| Ratio of net investment income to average net assets (5)(7) | 4.22 | % | 5.24 | % | 4.11 | % (9) | ||||||
| Portfolio Turnover Rate | 79 | % | 36 | % | 25 | % (8) | ||||||
| (1) | The Camelot Excalibur Small Cap Income Fund’s Class I shares commenced operations on December 30, 2016. |
| (2) | Per share amounts calculated using the average shares method. |
| (3) | Total return in the above table is historical in nature and represents the rate that the investor would have earned or lost on an investment in the Fund assuming reinvestment of dividends and capital gain distributions, if any. Had the Manager not waived a portion of the Fund’s expenses in certain periods, total return would have been lower. Does not reflect the impact of sales charges. |
| (4) | Represents the ratio of expenses to average net assets absent fee waivers and/or expense reimbursements by the Manager. |
| (5) | The ratios of expenses to average net assets and net investment income to average net assets do not reflect the expenses of the underlying investment companies in which the Fund invests. |
| (6) | The ratios include 1.29%, 0.05% and 0.02% for the periods ended September 30, 2019, September 30, 2018 and September 30, 2017 attributed to dividends from securities sold short and interest expense. |
| (7) | Recognition of net investment income is affected by the timing and declaration of dividends by the underlying investment companies in which the Fund invests. |
| (8) | Not annualized. |
| (9) | Annualized. |
See accompanying notes to financial statements.
31
| Camelot Funds |
| NOTES TO FINANCIAL STATEMENTS |
| September 30, 2019 |
(1) ORGANIZATION AND SIGNIFICANT ACCOUNTING POLICIES
Mutual Fund Series Trust (the “Trust”), was organized as an Ohio business trust on February 27, 2006. The Trust is registered as an open end management investment company under the Investment Company Act of 1940, as amended, (“1940 Act”). The trust currently consists of thirty-nine series. These financial statements include the following series: Camelot Premium Return Fund and Camelot Excalibur Small Cap Income Fund (each a “Fund” or collectively the “Funds”). The Camelot Premium Return Fund is registered as diversified and the Camelot Excalibur Small Cap Income Fund is registered as non-diversified. The Funds’ investment manager is Camelot Funds, LLC (the “Manager”), which began serving as the Funds’ manager in February 1, 2015. Prior to February 1, 2015, Camelot Portfolios, LLC served as the Funds’ manager. The Camelot Premium Return Fund’s Class A shares commenced operations on December 27, 2010 and the Fund’s Class I shares commenced operations on December 30, 2016. The Camelot Excalibur Small Cap Income Fund’s Class A shares commenced operations on December 31, 2013 and the Fund’s Class I shares commenced operations on December 30, 2016. The Camelot Premium Return Fund’s and Camelot Excalibur Small Cap Income Fund’s objective is to provide consistent and growing current income stream with a secondary objective of providing long-term growth of capital.
The Camelot Premium Return Fund offers two classes of shares, Class A and Class I. The Camelot Excalibur Small Cap Income Fund offers Class A and Class I shares. Each share class represents an interest in the same assets of the Funds, has the same rights and is identical in all material respects except that (i) each class of shares may bear different distribution fees; (ii) each class of shares may be subject to different (or no) sales charges; (iii) certain other class specific expenses will be borne solely by the class to which such expenses are attributable; and (iv) each class has exclusive voting rights with respect to matters relating to its own distribution arrangements. The Board of Trustees may classify and reclassify the shares of the Funds into additional classes of shares at a future date.
The following is a summary of significant accounting policies consistently followed by the Funds and are in accordance with accounting principles generally accepted in the United States of America (“GAAP”). The Funds are investment companies and accordingly follow the investment company accounting and reporting guidance of the Financial Accounting Standards Board (“FASB”) Accounting Standards Codification Topic 946 Financial Services – Investment Companies including FASB Accounting Standards Update (“ASU”) 2013-08.
a) Securities Valuation – Securities listed on an exchange are valued at the last reported sale price at the close of the regular trading session of the exchange on the business day the value is being determined, or in the case of securities listed on NASDAQ, at the NASDAQ Official Closing Price (“NOCP”). In the absence of a sale, such securities shall be valued at the last bid price on the day of valuation. Debt securities (other than short-term obligations) are valued each day by an independent pricing service approved by the Board of Trustees (the “Board”) using methods which include current market quotations from a major market maker in the securities and based on methods which include the consideration of yields or prices of securities of comparable quality, coupon, maturity and type. The Funds may invest in portfolios of open-end or closed-end investment companies (the “underlying funds”). Open-end investment companies are valued at their respective net asset values as reported by such investment companies. The underlying funds value securities in their portfolios for which market quotations are readily available at their market values (generally the last reported sale price) and all other securities and assets at their fair value by the methods established by the boards of the underlying funds. The shares of many closed-end investment companies, after their initial public offering, frequently trade at a price per share, which is different than the net asset value per share. The difference represents a market premium or market discount of such shares. There can be no assurances that the market discount or market premium on shares of any closed-end investment company purchased by the Funds will not change. Short term debt obligations having 60 days or less remaining until maturity, at time of purchase, may be valued at amortized cost, provided such valuations represent fair value. Options are valued at their closing price on the exchange they are traded on. When no closing price is available, options are valued at their mean price.
32
| Camelot Funds |
| NOTES TO FINANCIAL STATEMENTS (Continued) |
| September 30, 2019 |
In unusual circumstances, instead of valuing securities in the usual manner, the Funds may value securities at “fair value” as determined in good faith by the Board, pursuant to the procedures (the “Procedures”) approved by the Board. The Procedures consider, among others, the following factors to determine a security’s fair value: the nature and pricing history (if any) of the security; whether any dealer quotations for the security are available; and possible valuation methodologies that could be used to determine the fair value of the security. Fair value may also be used by the Board if extraordinary events occur after the close of the relevant world market but prior to the New York Stock Exchange close.
GAAP establishes a hierarchy that prioritizes inputs to valuation methods. The three levels of input are:
Level 1 – Unadjusted quoted prices in active markets for identical assets and liabilities that the Funds have the ability to access.
Level 2 – Observable inputs other than quoted prices included in Level 1 that are observable for the asset or liability, either directly or indirectly. These inputs may include quoted prices for the identical instrument in an inactive market, prices for similar instruments, interest rates, prepayment speeds, credit risk, yield curves, default rates and similar data.
Level 3 – Unobservable inputs for the asset or liability, to the extent relevant observable inputs are not available, representing the Funds’ own assumptions about the assumptions a market participant would use in valuing the asset or liability, and would be based on the best information available.
The availability of observable inputs can vary from security to security and is affected by a wide variety of factors, including, for example, the type of security, whether the security is new and not yet established in the marketplace, the liquidity of markets, and other characteristics particular to the security. To the extent that valuation is based on models or inputs that are less observable or unobservable in the market, the determination of fair value requires more judgment. Accordingly, the degree of judgment exercised in determining fair value is greatest for instruments categorized in Level 3.
The inputs used to measure fair value may fall into different levels of the fair value hierarchy. In such cases, for disclosure purposes, the level in the fair value hierarchy within which the fair value measurement falls in its entirety, is determined based on the lowest level input that is significant to the fair value measurement in its entirety.
The inputs or methodology used for valuing securities are not necessarily an indication of the risk associated with investing in those securities. The following tables summarize the inputs used as of September 30, 2019 for the Funds’ assets and liabilities measured at fair value:
Camelot Premium Return Fund
| Assets | ||||||||||||||||
| Security Classifications (a) | Level 1 | Level 2 | Level 3 | Total | ||||||||||||
| Bonds | $ | — | $ | 2,832,674 | $ | — | $ | 2,832,674 | ||||||||
| Closed-End Funds | 3,209,245 | — | — | 3,209,245 | ||||||||||||
| Common Stocks | 23,061,724 | — | — | 23,061,724 | ||||||||||||
| Limited Partnerships | 3,194,048 | — | — | 3,194,048 | ||||||||||||
| Municipal Bonds | — | 3,750,908 | — | 3,750,908 | ||||||||||||
| Preferred Stocks | 2,307,188 | — | — | 2,307,188 | ||||||||||||
| Real Estate Investment Trusts | 3,404,718 | — | — | 3,404,718 | ||||||||||||
| Investment Purchased as Securities Lending Collateral (b) | — | — | — | 6,607,316 | ||||||||||||
| Total | $ | 35,176,923 | $ | 6,583,582 | $ | — | $ | 48,367,821 | ||||||||
33
| Camelot Funds |
| NOTES TO FINANCIAL STATEMENTS (Continued) |
| September 30, 2019 |
| Liabilities | ||||||||||||||||
| Security Classifications (a) | Level 1 | Level 2 | Level 3 | Total | ||||||||||||
| Call Options Written | $ | (1,330,585 | ) | $ | (188,810 | ) | $ | — | $ | (1,519,395 | ) | |||||
| Put Options Written | (466,900 | ) | (432,663 | ) | — | (899,563 | ) | |||||||||
| Securities Sold Short | (3,723,410 | ) | — | — | (3,723,410 | ) | ||||||||||
| Total | $ | (5,520,895 | ) | $ | (621,473 | ) | $ | — | $ | (6,142,368 | ) | |||||
| (a) | As of and during the year ended September 30, 2019, the Fund held no securities that were considered to be “Level 3” securities. Therefore, a reconciliation of assets in which significant unobservable inputs (Level 3) were used in determining fair value is not applicable. |
| (b) | Management has elected to adopt ASU 2015-07, Disclosures for Investments in Certain Entities That Calculate Net Asset Value per Share (or Its Equivalent) — a consensus of the Emerging Issues Task Force issued, on May 1, 2015. In accordance with Subtopic 820-10, certain investments that are measured at fair value using the net asset value per share (or its equivalent) have not been classified in the fair value hierarchy. The fair value amount presented in this table is intended to permit reconciliation of the fair value hierarchy to the amounts presented in the statements of assets and liabilities. |
Camelot Excalibur Small Cap Income Fund
| Assets | ||||||||||||||||
| Security Classifications (a) | Level 1 | Level 2 | Level 3 | Total | ||||||||||||
| Bonds | $ | — | $ | 852,515 | $ | — | $ | 852,515 | ||||||||
| Closed-End Funds | 545,150 | — | — | 545,150 | ||||||||||||
| Common Stocks | 4,133,564 | — | — | 4,133,564 | ||||||||||||
| Limited Partnerships | 632,015 | — | — | 632,015 | ||||||||||||
| Municipal Bonds | — | 1,268,769 | — | 1,268,769 | ||||||||||||
| Preferred Stocks | 1,719,004 | — | — | 1,719,004 | ||||||||||||
| Real Estate Investment Trusts | 1,094,097 | — | — | 1,094,097 | ||||||||||||
| Total | $ | 8,123,830 | $ | 2,121,284 | $ | — | $ | 10,245,114 | ||||||||
| Liabilities | ||||||||||||||||
| Security Classifications (a) | Level 1 | Level 2 | Level 3 | Total | ||||||||||||
| Call Options Written | $ | (354,370 | ) | $ | (155,533 | ) | $ | — | $ | (509,903 | ) | |||||
| Put Options Written | (42,400 | ) | (32,400 | ) | — | (74,800 | ) | |||||||||
| Securities Sold Short | (460,308 | ) | — | — | (460,308 | ) | ||||||||||
| Total | $ | (857,078 | ) | $ | (187,933 | ) | $ | — | $ | (1,045,011 | ) | |||||
| (a) | As of and during the year ended September 30, 2019, the Fund held no securities that were considered to be “Level 3” securities. Therefore, a reconciliation of assets in which significant unobservable inputs (Level 3) were used in determining fair value is not applicable. |
b) Accounting for Options – When the Funds write an option, an amount equal to the premium received by the Funds is recorded as a liability and is subsequently adjusted to the current fair value of the option written. Premiums received from writing options that expire unexercised are treated by the Funds on the expiration date as realized gains from investments. The difference between the premium and the amount paid on effecting a closing purchase transaction, including brokerage commissions, is also treated as a realized gain, or, if the premium is less than the amount paid for the closing purchase transaction, as a realized loss. If a call option is exercised, the premium is added to the proceeds from the sale of the underlying security or currency in determining whether the Funds have realized gains or losses. If a put option is exercised, the premium reduces the cost basis of the securities purchased by the Funds.
34
| Camelot Funds |
| NOTES TO FINANCIAL STATEMENTS (Continued) |
| September 30, 2019 |
The Manager may use options strategies, such as puts and covered calls on individual securities, as well as options on securities indices, to generate income, to reduce portfolio volatility, or to reduce downside risk when the Manager believes adverse market, political or other conditions are likely. The Manager may also utilize a combination of puts and/or calls regarding the same security (sometimes referred to as “straddles,” “collars” or “spreads”) or utilize puts and calls on related securities. The Funds may purchase a call option on a stock (including securities of exchange-traded funds) it may purchase at some point in the future. When the Funds purchase an option, the premium paid is recorded as an asset. Each day the option contract is valued in accordance with the procedures for security valuation discussed above. When an offsetting option is written (a closing transaction) or the option contract expires, the Funds realize a gain or loss and the asset representing such option contract is eliminated. When a put option is exercised, the Funds realize a gain or loss from the sale of the underlying security and the proceeds of the sale are decreased by the premiums originally paid. When a call option is exercised, the Funds purchase the underlying security and the cost basis of such purchase is increased by the premium originally paid.
The locations on the Statements of Assets and Liabilities of derivative instruments by type of exposure, all of which are not accounted for as hedging instruments under GAAP, are as follows:
Camelot Premium Return Fund
| Derivatives Not | ||||||||
| Accounted for as Hedging | Primary Risk | Location of Derivatives on | Fair Value of Asset/ | |||||
| Instruments under GAAP | Exposure | Statements of Assets and Liabilities | Liability Derivatives | |||||
| Call options written | Equity Risk | Options written, at value | $ | (1,519,395 | ) | |||
| Put options written | Equity Risk | Options written, at value | (899,563 | ) | ||||
| Total | $ | (2,418,958 | ) | |||||
The effect of derivative instruments on the Statements of Operations for the year ended September 30, 2019, was as follows:
| Realized and Unrealized | ||||||||
| Derivatives Not | Gain (Loss) on | |||||||
| Accounted for as | Asset/Liability | |||||||
| Hedging Instruments | Location of Gain (Loss) on | Derivatives Recognized in | ||||||
| under GAAP | Primary Risk Exposure | Derivatives Recognized in Income | Income | |||||
| Purchased options | Equity Risk | Net realized loss from investments | $ | (45,787 | ) | |||
| Purchased options | Equity Risk | Net change in unrealized appreciation on investments | 15,437 | |||||
| Options written | Equity Risk | Net realized gain from options written | 3,685,111 | |||||
| Options written | Equity Risk | Net change in unrealized appreciation on options written | 872,056 | |||||
| Total | $ | 4,526,817 | ||||||
35
| Camelot Funds |
| NOTES TO FINANCIAL STATEMENTS (Continued) |
| September 30, 2019 |
The locations on the Statements of Assets and Liabilities of derivative instruments by type of exposure, all of which are not accounted for as hedging instruments under GAAP, are as follows:
Camelot Excalibur Small Cap Income Fund
| Derivatives Not | ||||||||
| Accounted for as | Fair Value of | |||||||
| Hedging Instruments | Primary Risk | Location of Derivatives on | Asset/Liability | |||||
| under GAAP | Exposure | Statements of Assets and Liabilities | Derivatives | |||||
| Call options written | Equity Risk | Options written, at value | $ | (509,903 | ) | |||
| Put options written | Equity Risk | Options written, at value | (74,800 | ) | ||||
| Total | $ | (584,703 | ) | |||||
The effect of derivative instruments on the Statements of Operations for the year ended September 30, 2019, was as follows:
| Realized and Unrealized | ||||||||
| Derivatives Not | Gain (Loss) on | |||||||
| Accounted for as | Asset/Liability | |||||||
| Hedging Instruments | Location of Gain (Loss) on | Derivatives Recognized in | ||||||
| under GAAP | Primary Risk Exposure | Derivatives Recognized in Income | Income | |||||
| Purchased option | Equity Risk | Net change in unrealized depreciation on investments | $ | (11,627 | ) | |||
| Options written | Equity Risk | Net realized gain from options written | 586,278 | |||||
| Options written | Equity Risk | Net change in unrealized appreciation on options written | 27,307 | |||||
| Total | $ | 601,958 | ||||||
The contracts of the derivative instruments outstanding as of September 30, 2019 as disclosed in the Schedules of Investments and the amounts realized and changes in unrealized gains and losses on derivative instruments during the period as disclosed above and within the Statements of Operations serve as indicators of the volume of derivative activity for the Funds.
36
| Camelot Funds |
| NOTES TO FINANCIAL STATEMENTS (Continued) |
| September 30, 2019 |
Offsetting of Financial Assets and Derivative Liabilities –
The following table presents the Funds’ asset and liability derivatives available for offset under a master netting arrangement net of collateral pledged as of September 30, 2019.
Camelot Premium Return Fund
| Gross Amounts Not Offset in the | ||||||||||||||||||||||||
| Liabilities: | Statements of Assets & Liabilities | |||||||||||||||||||||||
| Gross Amounts | Net Amounts of | |||||||||||||||||||||||
| Gross Amounts of | Offset in the | Liabilities Presented in | ||||||||||||||||||||||
| Recognized | Statements of Assets | the Statements of Assets | Financial | Cash Collateral | ||||||||||||||||||||
| Description | Assets/Liabilities | & Liabilities | & Liabilities | Instruments | Received | Net Amount | ||||||||||||||||||
| Options Written | $ | (2,418,958 | ) (1) | $ | — | $ | (2,418,958 | ) | $ | 2,418,958 | (2) | $ | — | $ | — | |||||||||
| Securities Lending | 6,441,250 | — | 6,441,250 | — | 6,441,250 | — | ||||||||||||||||||
| Total | $ | 4,022,292 | $ | — | $ | 4,022,292 | $ | 2,418,958 | $ | 6,441,250 | $ | — | ||||||||||||
| (1) | Purchased and written options at value as presented in the Schedules of Investments. |
| (2) | The amount is limited to the derivative liability balance and, accordingly, does not include excess collateral pledged. |
Camelot Excalibur Small Cap Income Fund
| Gross Amounts Not Offset in the | ||||||||||||||||||||||||
| Liabilities: | Statements of Assets & Liabilities | |||||||||||||||||||||||
| Gross Amounts | Net Amounts of | |||||||||||||||||||||||
| Gross Amounts of | Offset in the | Liabilities Presented in | ||||||||||||||||||||||
| Recognized | Statements of Assets | the Statements of Assets | Financial | Cash Collateral | ||||||||||||||||||||
| Description | Assets/Liabilities | & Liabilities | & Liabilities | Instruments | Received | Net Amount | ||||||||||||||||||
| Options Written | $ | (584,703 | ) (1) | $ | — | $ | (584,703 | ) | $ | 584,703 | (2) | $ | — | $ | — | |||||||||
| Total | $ | (584,703 | ) | $ | — | $ | (584,703 | ) | $ | 584,703 | $ | — | $ | — | ||||||||||
| (1) | Purchased and written options at value as presented in the Schedules of Investments. |
| (2) | The amount is limited to the derivative liability balance and, accordingly, does not include excess collateral pledged. |
The following table sets forth the remaining contractual maturity of the collateral held as of September 30, 2019:
| Securities Lending Transactions | ||||
| Overnight and Continuous | ||||
| Camelot Premium Return Fund | ||||
| Mount Vernon Liquid Assets Portfolio, LLC | $ | 6,607,316 | ||
c) Short Sales – The Funds may sell securities short. A short sale is a transaction in which the Funds sell securities they do not own in anticipation of a decline in the market price of the securities. To deliver the securities to the buyer, the Funds must arrange through a broker to borrow the securities and, in so doing, the Funds become obligated to replace the securities borrowed at their market price at the time of replacement, whatever that price may be. The Funds will make a profit or incur a loss as a result of a short sale depending on whether the price of the securities decrease or increase between the date of the short sale and the date on which the Funds purchased the securities to replace the borrowed securities that have been sold.
d) Federal Income Tax – The Funds have qualified and intend to continue to qualify as regulated investment companies and to comply with the applicable provisions of the Internal Revenue Code of 1986, as amended, and to distribute substantially all of their taxable income to their shareholders. Therefore, no federal income or excise tax provisions are required.
37
| Camelot Funds |
| NOTES TO FINANCIAL STATEMENTS (Continued) |
| September 30, 2019 |
As of and during the year ended September 30, 2019, the Funds did not have a liability for any unrecognized tax expense. The Funds recognize interest and penalties, if any, related to unrecognized tax expense as income tax expense in the Statements of Operations. As of September 30, 2019, the Funds did not incur any interest or penalties. Management has analyzed the Funds’ tax positions and has concluded that no liability for unrecognized tax benefits should be recorded related to uncertain tax positions taken on returns filed for open tax years ended September 30, 2016 to September 30, 2018, or expected to be taken in the Funds’ September 30, 2019 year end tax returns. The tax filings are open for examination by applicable taxing authorizes, U.S. federal, Ohio, and foreign jurisdictions. No examination of the Funds’ tax returns is presently in progress.
e) Distribution to Shareholders – Distributions to shareholders, which are determined in accordance with income tax regulations and may differ from GAAP are recorded on the ex-dividend date. The Funds distribute short-term capital gains and income quarterly and long-term capital gains annually.
f) Multiple Class Allocations – Income, non-class specific expenses and realized/unrealized gains or losses are allocated to each class based on relative net assets. Distribution fees are charged to each respective share class in accordance with the distribution plan. Expenses of the Trust that are directly identifiable to a specific Fund are charged to that Fund. Expenses, which are not readily identifiable to a specific Fund, are allocated in such a manner as deemed equitable, taking into consideration the nature and type of expense and the relative sizes of the Funds in the Trust.
g) Other – Investment and shareholder transactions are recorded on the trade date. The Funds determine the gain or loss realized from the investment transactions by comparing the identified cost of the security lot sold with the net sales proceeds. Dividend income is recognized on the ex-dividend date or as soon as information is available to the Funds and interest income is recognized on an accrual basis. Discounts and premiums on fixed income securities are amortized over their respective lives using the effective interest method. Withholding taxes on foreign dividends have been provided for in accordance with the Funds’ understanding of the applicable country’s tax rules and rates.
h) Use of Estimates – The preparation of financial statements in conformity with GAAP requires management to make estimates and assumptions that affect the reported amounts of assets and liabilities and disclosure of contingent assets and liabilities at the date of the financial statements and the reported amounts of revenues and expenses during the reporting period. Actual results could differ from those estimates.
i) Commitments and Contingencies – In the normal course of business, the Trust may enter into contracts that contain a variety of representations and warranties and provide general indemnifications. The Funds’ maximum exposure under these arrangements is dependent on future claims that may be made against the Funds and, therefore, cannot be estimated; however, management considers the risk of loss from such claims to be remote.
j) Sales Charges (loads) – A maximum sales charge of 5.75% is imposed on Class A shares of the Funds. Investments in Class A shares made at or above the $1 million breakpoint are not subject to an initial sales charge and may be subject to a 1% contingent deferred sales charge (“CDSC”) on shares redeemed within 18 months of purchase (excluding shares purchased with reinvested dividends and/or distributions). The respective shareholders pay such CDSC charges, which are not an expense of the Funds. For the year ended September 30, 2019 there were no CDSC fees paid.
38
| Camelot Funds |
| NOTES TO FINANCIAL STATEMENTS (Continued) |
| September 30, 2019 |
k) Security Loans – The Funds have entered into securities lending agreements with U.S. Bank National Association as of October 2018, previously Huntington National Bank. The Funds receive compensation in the form of fees, or retain a portion of interest on the investment of any cash received as collateral. The cash collateral is invested in short-term investments as noted in the Funds’ Schedules of Investments. Although risk is mitigated by the collateral, the Funds could experience a delay in recovering their securities and possible loss of income or value if the borrower fails to return them. The Funds also continue to receive interest or dividends on the securities loaned. The loans are secured by collateral at least equal, at all times, to 102% of the market value of loaned securities. Gain or loss in the fair value of the securities loaned that may occur during the term of the loan will be for the account of the Funds. The Funds have the right under the lending agreement to recover the securities from the borrower on demand. If the market value of the collateral falls below 102% of market value plus accrued interest of the loaned securities, the lender’s agent shall request additional collateral from the borrowers to bring the collateralization back to 102%.
The Funds receive cash as collateral in return for securities lent as part of the securities lending program. The collateral is invested in the Mount Vernon Liquid Assets Portfolio, LLC of which the investment objective is to seek to maximize current income to the extent with the preservation of capital and liquidity and maintain a stable NAV of $1.00 per unit. The Camelot Premium Return Fund held $6,607,316 as of September 30, 2019. The remaining contractual maturity of all securities lending transactions is overnight and continuous. The Fund is not subject to a master netting agreement with respect to securities lending; therefore no additional disclosures are required. The income earned by the Fund on investments of cash collateral received from borrowers for the securities loaned to them are reflected in the Fund’s Statement of Operations.
l) Cash and cash equivalents – The Funds consider their investment in a Federal Deposit Insurance Corporation (“FDIC”) insured interest bearing savings account to be cash. The Funds maintain cash balances, which, at times, may exceed federally insured limits. The Funds maintain these balances with a high quality financial institution.
m) Distributions from REITs – Distributions from REITs are initially recorded as dividend income and, to the extent such represent a return of capital or capital gain for tax purposes, are reclassified when such information becomes available.
(2) INVESTMENT TRANSACTIONS
For the year ended September 30, 2019, aggregate purchases and proceeds from sales of investment securities (excluding short-term investments) for the Funds were as follows:
| Purchases | Sales | |||||||
| Camelot Premium Return Fund | $ | 121,657,965 | $ | 104,887,819 | ||||
| Camelot Excalibur Small Cap Income Fund | 10,450,213 | 8,308,490 | ||||||
39
| Camelot Funds |
| NOTES TO FINANCIAL STATEMENTS (Continued) |
| September 30, 2019 |
(3) INVESTMENT MANAGEMENT AGREEMENT AND TRANSACTIONS WITH RELATED PARTIES
Camelot Funds, LLC is the Manager to the Funds pursuant to the terms of the Management Agreement (the “Management Agreement”) with the Trust on behalf of the Funds. Under the terms of the Management Agreement, the Manager manages the investment operations of the Funds in accordance with the Funds’ investment policies and restrictions. The Manager provides the Funds with investment advice and supervision and furnishes investment programs for the Funds. For its services under the Management Agreement, the Manager is paid a monthly management fee at the annual rate of 1.00% of the average daily net assets of each Fund. The Manager pays for all employees, office space and facilities required by it to provide services under the Management Agreement, with the exception of specific items of expense (as detailed in the Management Agreement). For the year ended September 30, 2019, Management fees of $451,751 and $106,916 were incurred by the Camelot Premium Return Fund and Camelot Excalibur Small Cap Income Fund, respectively, before the waiver and reimbursement described below.
The Manager and the Trust have entered into an Expense Limitation Agreement under which the Manager has contractually agreed to waive fees and/or reimburse expenses but only to the extent necessary to maintain total annual operating expenses (excluding taxes and brokerage commissions, borrowing costs, costs of investing in underlying funds and extraordinary expenses, interest and dividends on securities sold short, if any) at 1.75% and 1.50% for Class A and Class I Funds’ shares through January 31, 2020, respectively. Each waiver or reimbursement by the Manager is subject to recoupment within the three years following the fiscal year in which that particular expense is incurred, the recoupment may be achieved without exceeding the expense limitation in effect at the time of the waiver or reimbursement or at the time of recoupment.
For the year ended September 30, 2019, the Manager has waived and reimbursed $79,292 and $110,417 for the Camelot Premium Return Fund and Camelot Excalibur Small Cap Income Fund, respectively. As of September 30, 2019, the Manager has waived/reimbursed expenses of the Camelot Premium Return Fund and Camelot Excalibur Small Cap Income Fund that may be recovered no later than September 30 for the years indicated below:
| 2020 | 2021 | 2022 | ||||||||||
| Camelot Premium Return Fund | $ | — | $ | 37,705 | $ | 79,292 | ||||||
| Camelot Excalibur Small Cap Income Fund | 96,423 | 104,532 | 110,417 | |||||||||
The Trust has entered into a management services agreement (the “Management Services Agreement”) with MFund Services, LLC (“MFund”). Pursuant to the Management Services Agreement, MFund provides sponsorship, management and administration services. For MFund’s services to the Funds, the Funds pay MFund a base fee of $5,000 annually, an annualized asset based fee of 0.10% of average daily net assets up to $50 million, with lower fees at higher asset levels, plus reimbursement of out of pocket expenses. For the year ended September 30, 2019, the Funds incurred $48,697 and $15,343 for such fees for the Camelot Premium Return Fund and Camelot Excalibur Small Cap Income Fund, respectively.
A Trustee and Officer of the Trust is also the controlling member of MFund, Alphacentric Advisors LLC (“Alphacentric”), and Catalyst Capital Advisors LLC (“Catalyst”) and each serve as investment advisor to other series of the Trust and is not paid any fees directly by the Trust for serving in such capacities.
Gemini Fund Services, LLC (“GFS”) provides administrative, fund accounting, and transfer agency services to the Funds pursuant to agreements with the Trust, for which it receives from each Fund: (i) basis points in decreasing amounts as assets reach certain breakpoints; and (ii) any related out-of-pocket expenses.
40
| Camelot Funds |
| NOTES TO FINANCIAL STATEMENTS (Continued) |
| September 30, 2019 |
On February 1, 2019, NorthStar Financial Services Group, LLC, the parent company of GFS and its affiliated companies including Blu Giant, LLC (“Blu Giant”) and Northern Lights Distributors, LLC (“NLD” or the “Distributor”) (collectively, the “Gemini Companies”), sold its interest in the Gemini Companies to a third party private equity firm that contemporaneously acquired Ultimus Fund Solutions, LLC (an independent mutual fund administration firm) and its affiliates (collectively, the “Ultimus Companies”). As a result of these separate transactions, the Gemini Companies and the Ultimus Companies are now indirectly owned through a common parent entity, The Ultimus Group, LLC.
Certain Officers of the Trust are also employees of GFS, and are not paid any fees directly by the Funds for serving in such capacity.
Pursuant to the Management Services Agreement, MFund provides chief compliance officer services to the Funds. For these services, the Funds pay MFund an annual base fee plus an annual asset-based fee based upon net assets. In addition, the Funds reimburse MFund for any reasonable out-of-pocket expenses incurred in the performance of its duties under the management services agreement. For the year ended September 30, 2019, the Camelot Premium Return Fund and Camelot Excalibur Small Cap Income Fund incurred $13,491 and $12,623 for such fees, respectively.
The Independent Trustees are paid $120,000 per year. The Lead Independent Trustee of the Trust receives an additional fee of $25,000 per year. The Chairman of the Trust’s Audit Committee receives an additional fee of $25,000 per year.
The Trust has adopted a Distribution Plan pursuant to Rule 12b-1 under the 1940 Act for each class of shares, that allows the Funds to pay distribution and shareholder servicing expenses of up to 0.50% per annum for the Class A shares. Class A shares are currently paying 0.25% per annum of 12b-1 fees. The Trust has not adopted a plan for Class I shares. The fee may be used for a variety of purposes, including compensating dealers and other financial service organizations for eligible services provided by those parties to the Funds and its shareholders and to reimburse NLD and the Manager for distribution related expenses.
For the year ended September 30, 2019, the Distributor received $949 and $2 in underwriter concessions from the sale of shares of the Camelot Premium Return Fund and Camelot Excalibur Small Cap Income Fund, respectively.
(4) DISTRIBUTIONS TO SHAREHOLDERS AND TAX COMPONENTS OF CAPITAL
The below table represents aggregate cost for federal tax purposes, for the Camelot Funds as of September 30, 2019 and differs from market value by net unrealized appreciation/depreciation which consisted of:
| Total Unrealized | ||||||||||||||||
| Gross Unrealized | Gross Unrealized | Appreciation/ | ||||||||||||||
| Fund | Aggregate Cost | Appreciation | Depreciation | Depreciation | ||||||||||||
| Camelot Premium Return Fund | $ | 50,561,102 | $ | 5,438,955 | $ | (13,774,604 | ) | $ | (8,335,649 | ) | ||||||
| Camelot Excalibur Small Cap Income Fund | 11,310,365 | 1,445,961 | (3,556,223 | ) | (2,110,262 | ) | ||||||||||
41
| Camelot Funds |
| NOTES TO FINANCIAL STATEMENTS (Continued) |
| September 30, 2019 |
The tax character of distributions paid during the fiscal years ended September 30, 2019 and September 30, 2018 was as follows:
| For the year ended September 30, 2019 | ||||||||||||||||
| Long-Term | ||||||||||||||||
| Fund | Ordinary Income | Capital Gains | Return of Capital | Total | ||||||||||||
| Camelot Premium Return Fund | $ | 3,179,275 | $ | — | $ | — | $ | 3,179,275 | ||||||||
| Camelot Excalibur Small Cap Income Fund | 773,092 | — | — | 773,092 | ||||||||||||
| For the year ended September 30, 2018 | ||||||||||||||||
| Long-Term | ||||||||||||||||
| Fund | Ordinary Income | Capital Gains | Return of Capital | Total | ||||||||||||
| Camelot Premium Return Fund | $ | 3,171,534 | $ | — | $ | — | $ | 3,171,534 | ||||||||
| Camelot Excalibur Small Cap Income Fund | 604,045 | — | — | 604,045 | ||||||||||||
As of September 30, 2019, the components of accumulated earnings/ (losses) on a tax basis were as follows:
| Undistributed | Undistributed | Post October Loss | Capital Loss | Other | Unrealized | Total | ||||||||||||||||||||||
| Ordinary | Long-Term | and | Carry | Book/Tax | Appreciation/ | Accumulated | ||||||||||||||||||||||
| Fund | Income | Gains | Late Year Loss | Forwards | Differences | (Depreciation) | Earnings/(Losses) | |||||||||||||||||||||
| Camelot Premium | ||||||||||||||||||||||||||||
| Return Fund | $ | 664,977 | $ | — | $ | — | $ | — | $ | (372,371 | ) | $ | (8,336,055 | ) | $ | (8,043,449 | ) | |||||||||||
| Camelot Excalibur | ||||||||||||||||||||||||||||
| Small Cap Income | ||||||||||||||||||||||||||||
| Fund | 6,949 | — | — | — | (764 | ) | (2,110,262 | ) | (2,104,077 | ) | ||||||||||||||||||
The difference between book basis and tax basis unrealized depreciation, accumulated net investment income and accumulated net realized gain (loss) from investments is primarily attributable to the tax deferral of losses on wash sales and straddles, the mark-to -market treatment of option contracts and tax adjustments for publicly traded partnerships and underlying qualified electing funds held by publicly traded partnerships, perpetual bonds, constructive sales of securities held short and return of capital distributions from corporations. In addition, the amounts listed under other book/tax differences are primarily attributable to the tax deferral of losses on straddles and adjustments for constructive sales of securities held short.
The unrealized appreciation (depreciation) in the table for Camelot Premium Return Fund above includes unrealized foreign currency gains (losses) of ($406).
Permanent book and tax differences, primarily attributable to the book/tax basis treatment of non-deductible expenses, resulted in reclassifications for the Funds for the fiscal year ended September 30, 2019 as follows:
| Paid | ||||||||
| In | Accumulated | |||||||
| Fund | Capital | Earnings (Losses) | ||||||
| Camelot Premium Return Fund | $ | (3,672 | ) | $ | 3,672 | |||
| Camelot Excalibur Small Cap Income Fund | (3,153 | ) | 3,153 | |||||
(5) UNDERLYING FUND RISK
Each underlying fund, including each exchange-traded fund (“ETF”), is subject to specific risks, depending on the nature of the underlying fund. These risks could include liquidity risk, sector risk, foreign and related currency risk, as well as risks associated with real estate investments and commodities. Investors in the Funds will indirectly bear fees and expenses charged by the underlying investment companies in which the Funds invest in addition to the Funds’ direct fees and expenses.
42
| Camelot Funds |
| NOTES TO FINANCIAL STATEMENTS (Continued) |
| September 30, 2019 |
(6) OPTIONS RISK
There are risks associated with the sale and purchase of call and put options. The seller (writer) of a call option which is covered (e.g., the writer holds the underlying security) assumes the risk of a decline in the market price of an underlying security below the purchase price of an underlying security less the premium received, and gives up the opportunity for gain on the underlying security above the exercise price of the option. The seller of an uncovered call option assumes the risk of a theoretical unlimited increase in the market price of an underlying security above the exercise price of the option. The securities necessary to satisfy the exercise of the call option may be unavailable for purchase except at much higher prices. Purchasing securities to satisfy the exercise of the call option can itself cause the price of securities to rise further, sometimes by a significant amount, thereby exacerbating the loss. The buyer of a call option assumes the risk of losing its entire premium invested in the call option. The seller (writer) of a put option which is covered (e.g., the writer has a short position in the underlying security) assumes the risk of an increase in the market price of the underlying security above the sales price (in establishing the short position) of the underlying security plus the premium received, and gives up the opportunity for gain on the underlying security below the exercise price of the option. The seller of an uncovered put option assumes the risk of a decline in the market price of the underlying security below the exercise price of the option. The buyer of a put option assumes the risk of losing his entire premium invested in the put option.
(7) BENEFICIAL OWNERSHIP
The beneficial ownership, either directly or indirectly, of more than 25% of the voting securities of a fund creates a presumption of control of the fund, under Section 2(a)(9) of the 1940 Act. As of September 30, 2019 FOLIO Investments, Inc. Special Custody Account for the Exclusive Benefit of Customers held 37.09% of the Camelot Premium Return Fund and 37.18% of the Camelot Excalibur Small Cap Income Fund and may be deemed to control the Fund.
(8) RECENT ACCOUNTING PRONOUNCEMENTS AND REPORTING UPDATES
In August 2018, FASB issued ASU No. 2018-13, which changed certain fair value measurement disclosure requirements. The ASU, in addition to other modifications and additions, removed the requirement to disclose the amount and reasons for transfers between Level 1 and Level 2 of the fair value hierarchy, and the policy for the timing of transfers between levels. For investment companies, the amendments are effective for financial statements issued for fiscal years beginning after December 15, 2019, and interim periods within those fiscal years. Early adoption is allowed. These amendments have been adopted with these financial statements.
In August 2018, the Securities and Exchange Commission adopted amendments to certain disclosure requirements under Regulation S-X to conform to US GAAP, including: (i) an amendment to require presentation of the total, rather than the components, of distributable earnings on the Statements of Assets and Liabilities; and (ii) an amendment to require presentation of the total, rather than the components, of distributions to shareholders, except for tax return of capital distributions, on the Statements of Changes in Net Assets. The amendments also removed the requirement for parenthetical disclosure of undistributed net investment income on the Statements of Changes in Net Assets. These amendments have been adopted with these financial statements.
In March 2017, FASB issued ASU No. 2017-08, Receivables—Nonrefundable Fees and Other Costs (Subtopic 310-20): Premium Amortization on Purchased Callable Debt Securities. The amendments in the ASU shorten the amortization period for certain callable debt securities, held at a premium, to be amortized to the earliest call date. The ASU does not require an accounting change for securities held at a discount; which continues to be amortized to maturity. The ASU is effective for fiscal years and interim periods within those fiscal years beginning after December 15, 2018. Management is currently evaluating the impact, if any, of applying this provision.
43
| Camelot Funds |
| NOTES TO FINANCIAL STATEMENTS (Continued) |
| September 30, 2019 |
(9) SUBSEQUENT EVENTS
Subsequent events after the date of the Statements of Assets and Liabilities have been evaluated through the date the financial statements were issued. Management has determined that no events or transactions occurred requiring adjustment or disclosure in the financial statements.
44

REPORT OF INDEPENDENT REGISTERED PUBLIC ACCOUNTING FIRM
To the Shareholders of Camelot Premium Return Fund and Camelot Excalibur Small Cap Income Fund and Board of Trustees of Mutual Fund Series Trust
Opinion on the Financial Statements
We have audited the accompanying statements of assets and liabilities, including the schedules of investments, of Camelot Premium Return Fund and Camelot Excalibur Small Cap Income Fund (the “Funds”), each a series of Mutual Fund Series Trust, as of September 30, 2019, and the related statements of operations for the year then ended, and the statements of changes in net assets, including the related notes, and the financial highlights for each of the two years in the period then ended (collectively referred to as the “financial statements”). In our opinion, the financial statements present fairly, in all material respects, the financial position of each of the Funds as of September 30, 2019, the results of their operations for the year then ended, and the changes in their net assets and the financial highlights for each of the two years in the period then ended, in conformity with accounting principles generally accepted in the United States of America.
The Funds’ financial highlights for the years ended September 30, 2017, and prior, were audited by other auditors whose report dated November 28, 2017, expressed an unqualified opinion on those financial highlights.
Basis for Opinion
These financial statements are the responsibility of the Funds’ management. Our responsibility is to express an opinion on the Funds’ financial statements based on our audits. We are a public accounting firm registered with the Public Company Accounting Oversight Board (United States) (“PCAOB”) and are required to be independent with respect to the Funds in accordance with the U.S. federal securities laws and the applicable rules and regulations of the Securities and Exchange Commission and the PCAOB.
We conducted our audits in accordance with the standards of the PCAOB. Those standards require that we plan and perform the audit to obtain reasonable assurance about whether the financial statements are free of material misstatement, whether due to error or fraud.
Our audits included performing procedures to assess the risks of material misstatement of the financial statements, whether due to error or fraud, and performing procedures that respond to those risks. Such procedures included examining, on a test basis, evidence regarding the amounts and disclosures in the financial statements. Our procedures included confirmation of securities owned as of September 30, 2019, by correspondence with the custodian and brokers. Our audits also included evaluating the accounting principles used and significant estimates made by management, as well as evaluating the overall presentation of the financial statements. We believe that our audits provide a reasonable basis for our opinion.
We have served as the Funds’ auditor since 2018.

COHEN & COMPANY, LTD.
Chicago, Illinois
November 26, 2019
C O H E N & C O M P A N Y , L T D .
800.229.1099 | 866.818.4538 fax | cohencpa.com
Registered with the Public Company Accounting Oversight Board
45
| Camelot Funds |
| EXPENSE EXAMPLES (Unaudited) |
| September 30, 2019 |
As a shareholder of the Camelot Funds, you incur two types of costs: (1) transaction costs, including sales charges (loads) on purchases of Class A shares; (2) ongoing costs, including management fees; distribution and/or service (12b-1) fees; and other Fund expenses. This example is intended to help you understand your ongoing costs (in dollars) of investing in the Camelot Funds and to compare these costs with the ongoing costs of investing in other mutual funds.
The example is based on an investment of $1,000 invested at the beginning of the period and held for the entire period from April 1, 2019 through September 30, 2019.
Actual Expenses
The “Actual” lines in the table below provides information about actual account values and actual expenses. You may use the information below together with the amount you invested, to estimate the expenses that you paid over the period. Simply divide your account value by $1,000 (for example, an $8,600 account value divided by $1,000 = 8.6), then multiply the result by the number in the table under the heading entitled “Expenses Paid During Period” to estimate the expenses you paid on your account during this period.
Hypothetical Example for Comparison Purposes
The “Hypothetical” lines in the table below provides information about hypothetical account values and hypothetical expenses based on the Camelot Funds’ actual expense ratio and an assumed rate of return of 5% per year before expenses, which is not the Funds’ actual return. The hypothetical account values and expenses may not be used to estimate the actual ending account balances or expenses you paid for the period. You may use this information to compare this 5% hypothetical example with the 5% hypothetical examples that appear in the shareholder reports of other funds.
Please note that the expenses shown in the table are meant to highlight your ongoing costs only and do not reflect any transactional costs, such as sales charges (loads), or redemption fees. Therefore, the table is useful in comparing ongoing costs only, and will not help you determine the relative total costs of owning different funds. In addition, if these transactional costs were included, your costs would have been higher.
| Beginning | Ending | Expenses Paid | Expense Ratio | |
| Account Value | Account Value | During Period | During Period** | |
| Actual | 4/1/19 | 9/30/19 | 4/1/19 – 9/30/19 | 4/1/19 – 9/30/19 |
| Camelot Premium Return Fund | ||||
| Class A* | $1,000.00 | $1,016.00 | $8.84 | 1.75% |
| Class I* | 1,000.00 | 1,017.80 | 7.59 | 1.50 |
| Camelot Excalibur Small Cap Income Fund | ||||
| Class A* | 1,000.00 | 981.50 | 8.69 | 1.75 |
| Class I* | 1,000.00 | 983.90 | 7.46 | 1.50 |
| Beginning | Ending | Expenses Paid | Expense Ratio | |
| Hypothetical | Account Value | Account Value | During Period | During Period** |
| (5% return before expenses) | 4/1/19 | 9/30/19 | 4/1/19 – 9/30/19 | 4/1/19 – 9/30/19 |
| Camelot Premium Return Fund | ||||
| Class A* | $1,000.00 | $1,016.29 | $8.85 | 1.75% |
| Class I* | 1,000.00 | 1,017.55 | 7.59 | 1.50 |
| Camelot Excalibur Small Cap Income Fund | ||||
| Class A* | 1,000.00 | 1,016.29 | 8.85 | 1.75 |
| Class I* | 1,000.00 | 1,017.55 | 7.59 | 1.50 |
| * | Expenses are equal to the average account value over the period, multiplied by the Funds’ annualized expense ratio, multiplied by the number of days in the period (183) divided by the number of days in the fiscal year (365). |
| ** | Annualized. |
46
| Camelot Funds |
| ADDITIONAL INFORMATION (Unaudited) |
| September 30, 2019 |
Reference is made to the Prospectus and the Statement of Additional Information for more detailed descriptions of the Management Agreement, Services Agreement and Distribution and/or Service (12b-1) Plan, tax aspects of the Funds and the calculation of the net asset value of shares of the Funds.
The Funds file their complete schedules of portfolio holdings with the Securities and Exchange Commission (the “Commission”) for the first and third quarters of each fiscal year on Form N-Q. The Funds’ Forms N-Q are available on the Commission’s website at http://www.sec.gov.
A description of the policies and procedures that the Funds use to determine how to vote proxies relating to portfolio securities is available without charge, upon request, by calling 1-855-226-3862; and on the Commission’s website at http://www.sec.gov.
Information regarding how the Funds voted proxies relating to portfolio securities during the most recent 12-month period ended June 30 is available without charge, upon request, by calling 1-855-226-3862; and on the Commission’s website at http://www.sec.gov.
47
| Camelot Funds |
| TRUSTEES AND OFFICERS (Unaudited) |
| September 30, 2019 |
Independent Trustees
| Name,
Address Year of Birth |
Position(s) Held with Registrant |
Term
and Length Served* |
Principal Occupation(s) During Past 5 Years |
Number
of Portfolios Overseen In The Fund Complex** |
Other
Directorships Held During Past 5 Years |
| Tobias
Caldwell c/o Mutual Fund Series Trust 17645 Wright Street, Suite 200 Omaha NE 68130 Year of Birth: 1967 |
Trustee | Since 6/2006 | Manager of Genovese Family Enterprises LLC, a real estate firm, since 1999. Managing Member of PTL Real Estate LLC, a real estate/investment firm, since 2000. Managing Member of Bear Properties, LLC, a real estate firm, since 2006. President of Genovese Imports, an importer/ distributor of wine, from 2005 to 2011. | 55 | Trustee of Variable Insurance Trust since 2010; Chairman of the Board of Mutual Fund and Variable Insurance Trust since 2016; Chairman of the Board of Strategy Shares since 2016. Trustee of M3Sixty Funds Trust since 2016; Trustee of the AlphaCentric Prime Meridian Income Fund since 2018 |
| Tiberiu
Weisz c/o Mutual Fund Series Trust 17645 Wright Street, Suite 200 Omaha NE 68130 Year of Birth: 1949 |
Trustee | Since 6/2006 | Retired, Attorney with and shareholder of Gottlieb, Rackman & Reisman, P.C., from 1994 to 2015. | 39 | Trustee of Variable Insurance Trust since 2010 |
| Dr.
Bert Pariser c/o MITCU Corporation 860 East Broadway, Suite 2D, Long Beach, NY 11561 Year of Birth: 1940 |
Trustee | Since 5/2007 | Managing Partner of The MITCU Corporation, a technology consulting firm since 2004. Retired Faculty Member Technical Career Institutes, from 1991 to 2017. | 39 | Trustee of Variable Insurance Trust since 2010 |
48
| Camelot Funds |
| TRUSTEES AND OFFICERS (Unaudited)(Continued) |
| September 30, 2019 |
| Name,
Address Year of Birth |
Position(s) Held with Registrant |
Term
and Length Served* |
Principal Occupation(s) During Past 5 Years |
Number
of Portfolios Overseen In The Fund Complex** |
Other
Directorships Held During Past 5 Years |
| Jerry
Szilagyi 36 N. New York Avenue Huntington, NY 11743 Year of Birth: 1962 |
Trustee and President | Trustee since 7/2006; President since 2/2012 | Chief Executive Officer, Catalyst Capital Advisors LLC, since 2006; Member, AlphaCentric Advisors LLC, since 2014; President, Rational Advisors, Inc., since 2016; Managing Member, MFund Distributors LLC, since 2012; Managing Member, MFund Services LLC, since 2012; President, Abbington Capital Group LLC, since 1998; President, USA Mutuals, Inc., 3/2011 – 7/2016. | 39 | Variable Insurance Trust since 2010 |
| Erik
Naviloff 80 Arkay Drive Hauppauge, New York 11788 Year of Birth: 1968 |
Treasurer | Since 4/2012 | Vice President – Fund Administration, Gemini Fund Services, LLC, since 2011. | N/A | N/A |
| Aaron
Smith 80 Arkay Drive Hauppauge, New York 11788 Year of Birth: 1974 |
Assistant Treasurer | Since 11/2013 | Assistant Vice President, Gemini Fund Services, LLC, since 2017. Manager - Fund Administration, Gemini Fund Services, LLC, 2012-2017. | N/A | N/A |
| Brian
Curley 80 Arkay Drive Hauppauge, New York 11788 Year of Birth: 1970 |
Assistant Treasurer | Since 11/2013 | Vice President, Gemini Fund Services, LLC since 1/2015; Assistant Vice President, Gemini Fund Services, LLC (2012-2014). | N/A | N/A |
| Sam
Singh 80 Arkay Drive Hauppauge, New York 11788 Year of Birth: 1976 |
Assistant Treasurer | Since 2/2015 | Vice President, Gemini Fund Services, LLC since 1/2015; Assistant Vice President, Gemini Fund Services, LLC, 2011-12/2014. | N/A | N/A |
| Frederick
J. Schmidt 36 N. New York Avenue Huntington, NY 11743 Year of Birth: 1959 |
Chief Compliance Officer | Since 5/2015 | Director, MFund Services LLC since 5/2015; Director & Chief Compliance Officer, Citi Fund Services, 2010-2015. | N/A | N/A |
| Jennifer
A. Bailey 36 N. New York Avenue Huntington, NY 11743 Year of Birth: 1968 |
Secretary | Secretary since 4/2014 | Director of Legal Services, MFund Services LLC, since 2012. | N/A | N/A |
| Michael
Schoonover 36 N. New York Avenue Huntington, NY 11743 Year of Birth: 1983 |
Vice President | Since 6/2018 | Chief Operating Officer, Catalyst Capital Advisors LLC, & Rational Advisors, Inc., since 2017; Portfolio Manager, Catalyst Capital Advisors LLC since 2013; Portfolio Manager, Rational Advisors, Inc. 1/2016 to 5/2018. | N/A | N/A |
| * | The term of office of each Trustee is indefinite. |
| ** | The ‘Fund Complex’ includes the Trust, Variable Insurance Trust, Mutual Fund and Variable Insurance Trust, Strategy Shares, TCG Financial Series Trusts I-X, and AlphaCentric Prime Meridian Income Fund, each a registered investment company. |
| *** | The Trustee who is an “interested persons” of the Trust as defined in the 1940 Act is an interested person by virtue of being an officer of the advisor to certain series of the Trust. |
49
PRIVACY NOTICE
Mutual Fund Series Trust
Rev. June 2011
| FACTS | WHAT DOES MUTUAL FUND SERIES TRUST DO WITH YOUR PERSONAL INFORMATION? |
| Why? | Financial companies choose how they share your personal information. Federal law gives consumers the right to limit some, but not all sharing. Federal law also requires us to tell you how we collect, share, and protect your personal information. Please read this notice carefully to understand what we do. |
| What? | The types of personal information we collect and share depends on the product or service that you have with us. This information can include:
● Social Security number and wire transfer instructions
● account transactions and transaction history
● investment experience and purchase history
When you are no longer our customer, we continue to share your information as described in this notice. |
| How? | All financial companies need to share customers’ personal information to run their everyday business. In the section below, we list the reasons financial companies can share their customers’ personal information; the reasons Mutual Fund Series Trust chooses to share; and whether you can limit this sharing. |
| Reasons
we can share your personal information: |
Does
Mutual Fund Series Trust share information? |
Can
you limit this sharing? |
| For our everyday business purposes - such as to process your transactions, maintain your account(s), respond to court orders and legal investigations, or report to credit bureaus. | YES | NO |
| For our marketing purposes - to offer our products and services to you. | NO | We don’t share |
| For joint marketing with other financial companies. | NO | We don’t share |
| For our affiliates’ everyday business purposes - information about your transactions and records. | NO | We don’t share |
| For our affiliates’ everyday business purposes - information about your credit worthiness. | NO | We don’t share |
| For our affiliates to market to you | NO | We don’t share |
| For non-affiliates to market to you | NO | We don’t share |
| QUESTIONS? | Call 1-866-447-4228 |
50
PRIVACY NOTICE
Mutual Fund Series Trust
| Page 2 |
| What we do: | |
How does Mutual Fund Series Trust protect my personal information? |
To protect your personal information from unauthorized access and use, we use security measures that comply with federal law. These measures include computer safeguards and secured files and buildings.
Our service providers are held accountable for adhering to strict policies and procedures to prevent any misuse of your nonpublic personal information. |
How does Mutual Fund Series Trust collect my personal information? |
We collect your personal information, for example, when you ● open an account or deposit money
● direct us to buy securities or direct us to sell your securities
● seek advice about your investments
We also collect your personal information from others, such as credit bureaus, affiliates, or other companies. |
Why can’t I limit all sharing? |
Federal law gives you the right to limit only: ● sharing for affiliates’ everyday business purposes – information about your creditworthiness.
● affiliates from using your information to market to you.
● sharing for non-affiliates to market to you.
State laws and individual companies may give you additional rights to limit sharing. |
| Definitions | |
| Affiliates | Companies related by common ownership or control. They can be financial and non-financial companies.
● Mutual Fund Series Trust has no affiliates. |
| Non-affiliates | Companies not related by common ownership or control. They can be financial and non-financial companies.
● Mutual Fund Series Trust does not share with non-affiliates so they can market to you. |
| Joint marketing | A formal agreement between nonaffiliated financial companies that together market financial products or services to you.
● Mutual Fund Series Trust does not jointly market. |
51
| Mutual Fund Series Trust |
| 17645 Wright Street, Suite 200 |
| Omaha, NE 68130 |
| MANAGER |
| Camelot Portfolios, LLC. |
| 1700 Woodlands Drive, Suite 100 |
| Maumee, OH 43537 |
| ADMINISTRATOR |
| Gemini Fund Services, LLC |
| 80 Arkay Drive, Suite 110 |
| Hauppauge, NY 11788 |
| TRANSFER AGENT |
| Gemini Fund Services, LLC |
| 17645 Wright Street, Suite 200 |
| Omaha, NE 68130 |
| DISTRIBUTOR |
| Northern Lights Distributors, LLC |
| 17645 Wright Street, Suite 200 |
| Omaha, NE 68130 |
| INDEPENDENT REGISTERED PUBLIC ACCOUNTING FIRM |
| Cohen & Company, Ltd. |
| 151 N. Franklin St., Suite 575 |
| Chicago, IL 60606 |
| LEGAL COUNSEL |
| Thompson Hine LLP |
| 41 South High Street |
| Suite 1700 |
| Columbus, OH 43215 |
| CUSTODIAN BANK |
| U.S. Bank National Association |
| 1555 N. Rivercenter Drive. |
| Suite 302 |
| Milwaukee, WI 53212 |
ITEM 2. CODE OF ETHICS.
| (a) | The registrant has, as of the end of the period covered by this report, adopted a code of ethics that applies to the registrant's principal executive officer, principal financial officer, and principal accounting officer or controller, or persons performing similar functions, regardless of whether these individuals are employed by the registrant or a third party. |
| (b) | During the period covered by this report, there were no amendments to any provision of the code of ethics. |
| (c) | During the period covered by this report, there were no waivers or implicit waivers of a provision of the code of ethics. |
ITEM 3. AUDIT COMMITTEE FINANCIAL EXPERT.
| The registrant’s Board of Trustees has determined that it does not have an audit committee financial expert serving on its audit committee. At this time, the registrant believes that the experience provided by each member of the audit committee together offer the registrant adequate oversight for the registrant’s level of financial complexity. |
ITEM 4. PRINCIPAL ACCOUNTANT FEES AND SERVICES.
| (a) |
Audit Fees. The aggregate fees billed for each of the last two fiscal years for professional services rendered by the registrant's principal accountant for the audit of the registrant's annual financial statements or services that are normally provided by the accountant in connection with statutory and regulatory filings or engagements for those fiscal years are as follows:
| |||
| Trust Series | 2019 | 2018 | ||
| Camelot Premium Return Fund | 10,500 | 10,500 | ||
| Camelot Excalibur Small Cap Income Fund | 10,500 | 10,500 | ||
| (b) | Audit-Related Fees. There were no fees billed in each of the last two fiscal years for assurances and related services by the principal accountant that are reasonably related to the performance of the audit of the registrant’s financial statements and are not reported under paragraph (a) of this item. |
| (c) | Tax Fees. The aggregate fees billed in each of the last two fiscal years for professional services rendered by the principal accountant for tax compliance are as follows: |
| Trust Series | 2019 | 2018 |
| Camelot Premium Return Fund | 2,500 | 2,500 |
| Camelot Excalibur Small Cap Income Fund | 2,500 | 2,500 |
| (d) | All Other Fees. The aggregate fees billed in each of the last two fiscal years for products and services provided by the registrant’s principal accountant, other than the services reported in paragraphs (a) through (c) of this item were $0 and $0 for the fiscal years ended September 30, 2019 and 2018 respectively. |
| (e)(1) | The audit committee does not have pre-approval policies and procedures. Instead, the audit committee or audit committee chairman approves on a case-by-case basis each audit or non-audit service before the principal accountant is engaged by the registrant. |
| (e)(2) | There were no services described in each of paragraphs (b) through (d) of this Item that were approved by the audit committee pursuant to paragraph (c)(7)(i)(C) of Rule 2-01 of Regulation S-X. |
| f) | Not applicable. The percentage of hours expended on the principal accountant's engagement to audit the registrant's financial statements for the most recent fiscal year that were attributed to work performed by persons other than the principal accountant's full-time, permanent employees was zero percent (0%). |
| (g) | All non-audit fees billed by the registrant's principal accountant for services rendered to the registrant for the fiscal years ended September 30, 2019 and 2018 respectively are disclosed in (b)-(d) above. There were no audit or non-audit services performed by the registrant's principal accountant for the registrant's adviser. |
ITEM 5. AUDIT COMMITTEE OF LISTED REGISTRANTS.
Not applicable
ITEM 6. SCHEDULE OF INVESTMENT
Included in annual report to shareholders filed under item 1 of this form.
ITEM 7. DISCLOSURE OF PROXY VOTING POLICIES AND PROCEDURES FOR CLOSED-END MANAGEMENT INVESTMENT COMPANIES.
Not applicable Fund is an open-end management investment company
ITEM 8. PORTFOLIO MANAGERS OF CLOSED-END MANAGEMENT INVESTMENT COMPANIES
Not applicable Fund is an open-end management investment company
ITEM 9. PURCHASES OF EQUITY SECURITIES BY CLOSED-END MANAGEMENT INVESTMENT COMPANY AND AFFILIATED PURCHASERS.
Not applicable Fund is an open-end management investment company
ITEM 10. SUBMISSION OF MATTERS TO A VOTE OF SECURITY HOLDERS.
Not applicable at this time.
ITEM 11. CONTROLS AND PROCEDURES.
(a) The registrant's principal executive and principal financial officers, or persons performing similar functions, have concluded that the registrant's disclosure controls and procedures (as defined in Rule 30a-3(c) under the 1940 Act, are effective, as of a date within 90 days of the filing date of this report, based on the evaluation of these controls and procedures required by Rule 30a-3(b) under the 1940 Act and Rule 15d-15(b) under the Securities Exchange Act of 1934, as amended.
(b) There were no changes in the registrant's internal control over financial reporting (as defined in Rule 30a-3(d) under the 1940 Act) that occurred during the period covered by this report that have materially affected, or are reasonably likely to materially affect, the registrant's internal control over financial reporting.
ITEM 12. DISCLOSURE OF SECURITIES LENDING ACTIVITIES FOR CLOSED-END MANAGEMENT INVESTMENT COMPANIES.
Not applicable to open-end investment companies.
ITEM 13. EXHIBITS
(1) Code of Ethics for Principal Executive and Senior Financial Officers is attached hereto.
(2) Certifications pursuant to Section 302 of the Sarbanes-Oxley Act of 2002 are filed herewith.
(3) Certifications pursuant to Section 906 of the Sarbanes-Oxley Act of 2002 are filed herewith.
SIGNATURES
Pursuant to the requirements of the Securities Exchange Act of 1934 and the Investment Company Act of 1940, the registrant has duly caused this report to be signed on its behalf by the undersigned, thereunto duly authorized.
Mutual Fund Series Trust
| By Jerry Szilagyi | /s/ Jerry Szilagyi |
| Principal Executive Officer/President, | |
| Date: December 5, 2019 | |
Pursuant to the requirements of the Securities Exchange Act of 1934 and the Investment Company Act of 1940, this report has been signed below by the following person on behalf of the registrant and in the capacities and on the date indicated.
| By Jerry Szilagyi | /s/ Jerry Szilagyi ___________ |
| Principal Executive Officer/President | |
| Date: December 5, 2019 | |
Pursuant to the requirements of the Securities Exchange Act of 1934 and the Investment Company Act of 1940, this report has been signed below by the following person on behalf of the registrant and in the capacities and on the date indicated.
| By Erik Naviloff | /s/ Erik Naviloff_____________ |
| Principal Financial Officer/Treasurer | |
| Date: December 5, 2019 | |
Certification Pursuant to Section 302 of the Sarbanes-Oxley Act
I, Jerry Szilagyi, certify that:
| 1. | I have reviewed this report on Form N-CSR of the Camelot Funds, a series of the Mutual Fund Series Trust (the “registrant”); |
| 2. | Based on my knowledge, this report does not contain any untrue statement of a material fact or omit to state a material fact necessary to make the statements made, in light of the circumstances under which such statements were made, not misleading with respect to the period covered by this report; |
| 3. | Based on my knowledge, the schedules of investments included in this report fairly present in all material respects the investments of the registrant as of the end of the fiscal period for which the report is filed; |
| 4. | The registrant's other certifying officer(s) and I are responsible for establishing and maintaining disclosure controls and procedures (as defined in Rule 30a-3(c) under the Investment Company Act of 1940) and internal control over financial reporting (as defined in Rule 30a-3 (d) under the Investment Company Act of 1940) for the registrant and have: |
| (a) | Designed such disclosure controls and procedures, or caused such disclosure controls and procedures to be designed under our supervision, to ensure that material information relating to the registrant, including its consolidated subsidiaries, is made known to us by others within those entities, particularly during the period in which this report is being prepared; |
| (b) | Designed such internal control over financial reporting, or caused such internal control over financial reporting to be designed under our supervision, to provide reasonable assurance regarding the reliability of financial reporting and the preparation of financial statements for external purposes in accordance with generally accepted accounting principles: |
| (c) | Evaluated the effectiveness of the registrant's disclosure controls and procedures and presented in this report our conclusions about the effectiveness of the disclosure controls and procedures, as of a date within 90 days prior to the filing date of this report based on such evaluation; and |
| (d) | Disclosed in this report any change in the registrant's internal control over financial reporting that occurred during the period covered by this report that has materially affected, or is reasonably likely to materially affect, the registrant's internal control over financial reporting; and |
| 5. | The registrant's other certifying officer(s) and I have disclosed to the registrant's auditors and the audit committee of the registrant's board of Trustees (or persons performing the equivalent functions): |
| (a) | All significant deficiencies and material weaknesses in the design or operation of internal control over financial reporting which are reasonably likely to adversely affect the registrant's ability to record, process, summarize, and report financial information; and |
| (b) | Any fraud, whether or not material, that involves management or other employees who have a significant role in the registrant's internal control over financial reporting. |
| Date: December 5, 2019 | /s/ Jerry Szilagyi |
| Jerry Szilagyi | |
| Principal Executive Officer/President |
Certification Pursuant to Section 302 of the Sarbanes-Oxley Act
I, Erik Naviloff, certify that:
| 1. | I have reviewed this report on Form N-CSR of the Camelot Funds, a series of the Mutual Fund Series Trust (the “registrant”); |
| 2. | Based on my knowledge, this report does not contain any untrue statement of a material fact or omit to state a material fact necessary to make the statements made, in light of the circumstances under which such statements were made, not misleading with respect to the period covered by this report; |
| 3. | Based on my knowledge, the schedules of investments included in this report fairly present in all material respects the investments of the registrant as of the end of the fiscal period for which the report is filed; |
| 4. | The registrant's other certifying officer(s) and I are responsible for establishing and maintaining disclosure controls and procedures (as defined in Rule 30a-3(c) under the Investment Company Act of 1940) and internal control over financial reporting (as defined in Rule 30a-3 (d) under the Investment Company Act of 1940) for the registrant and have: |
| (a) | Designed such disclosure controls and procedures, or caused such disclosure controls and procedures to be designed under our supervision, to ensure that material information relating to the registrant, including its consolidated subsidiaries, is made known to us by others within those entities, particularly during the period in which this report is being prepared; |
| (b) | Designed such internal control over financial reporting, or caused such internal control over financial reporting to be designed under our supervision, to provide reasonable assurance regarding the reliability of financial reporting and the preparation of financial statements for external purposes in accordance with generally accepted accounting principles: |
| (c) | Evaluated the effectiveness of the registrant's disclosure controls and procedures and presented in this report our conclusions about the effectiveness of the disclosure controls and procedures, as of a date within 90 days prior to the filing date of this report based on such evaluation; and |
| (d) | Disclosed in this report any change in the registrant's internal control over financial reporting that occurred during the period covered by this report that has materially affected, or is reasonably likely to materially affect, the registrant's internal control over financial reporting; and |
| 5. | The registrant's other certifying officer(s) and I have disclosed to the registrant's auditors and the audit committee of the registrant's board of Trustees (or persons performing the equivalent functions): |
| (a) | All significant deficiencies and material weaknesses in the design or operation of internal control over financial reporting which are reasonably likely to adversely affect the registrant's ability to record, process, summarize, and report financial information; and |
| (b) | Any fraud, whether or not material, that involves management or other employees who have a significant role in the registrant's internal control over financial reporting. |
| Date: December 5, 2019 | /s/ Erik Naviloff________ |
| Erik Naviloff | |
| Principal Financial Officer/Treasurer |
CERTIFICATION PURSUANT TO SECTION 906 OF THE SARBANES-OXLEY ACT
I, Jerry Szilagyi, President of the Mutual Fund Series Trust, (the “Funds"), certify that:
| 1. |
The N-CSR of the Funds for the period ended September 30, 2019 (the "Report") fully complies with the requirements of Section 15(d) of the Securities Exchange Act of 1934; and
| 2. |
The information contained in the Report fairly presents, in all material respects, the financial condition and results of operations of the Registrant.
| By: | /s/ Jerry Szilagyi _______ |
| Jerry Szilagyi | |
| Principal Executive Officer/President | |
| Date: | December 5, 2019 |
A SIGNED ORIGINAL OF THIS WRITTEN STATEMENT REQUIRED BY SECTION 906, OR OTHER DOCUMENT AUTHENTICATING, ACKNOWLEDGING, OR OTHERWISE ADOPTING THE SIGNATURE THAT APPEARS IN TYPED FORM WITHIN THE ELECTRONIC VERSION OF THIS WRITTEN STATEMENT REQUIRED BY SECTION 906, HAS BEEN PROVIDED TO GEMINI FUND SERVICES, LLC AND WILL BE RETAINED BY GEMINI FUND SERVICES, LLC AND FURNISHED TO THE SECURITIES AND EXCHANGE COMMISSION OR ITS STAFF UPON REQUEST.
CERTIFICATION PURSUANT TO SECTION 906 OF THE SARBANES-OXLEY ACT
I, Erik Naviloff, Treasurer of the Mutual Fund Series Trust, (the “Funds"), certify that:
| 1. |
The N-CSR of the Funds for the period ended September 30, 2019 (the "Report") fully complies with the requirements of Section 15(d) of the Securities Exchange Act of 1934; and
| 2. |
The information contained in the Report fairly presents, in all material respects, the financial condition and results of operations of the Registrant.
| By: | /s/ Erik Naviloff_______ |
| Erik Naviloff | |
| Principal Financial Officer/Treasurer | |
| Date: | December 5, 2019 |
A SIGNED ORIGINAL OF THIS WRITTEN STATEMENT REQUIRED BY SECTION 906, OR OTHER DOCUMENT AUTHENTICATING, ACKNOWLEDGING, OR OTHERWISE ADOPTING THE SIGNATURE THAT APPEARS IN TYPED FORM WITHIN THE ELECTRONIC VERSION OF THIS WRITTEN STATEMENT REQUIRED BY SECTION 906, HAS BEEN PROVIDED TO GEMINI FUND SERVICES, LLC AND WILL BE RETAINED BY GEMINI FUND SERVICES, LLC. AND FURNISHED TO THE SECURITIES AND EXCHANGE COMMISSION OR ITS STAFF UPON REQUEST.
CODE OF ETHICS
I.
Statement of General Principles
This Code of Ethics has been adopted by the Mutual Fund Series Trust (the “Trust”) for the purpose of instructing all employees, officers and trustees of the Trust and Catalyst Capital Advisors, LLC, the adviser to the Trust (the “Adviser”), in their ethical obligations and to provide rules for their personal securities transactions. All such persons owe a fiduciary duty to the Trust and its shareholders. A fiduciary duty means a duty of loyalty, fairness and good faith towards the Trust and its shareholders, and the obligation to adhere not only to the specific provisions of this Code but to the general principles that guide the Code. These general principles are:
·
The duty at all times to place the interests of the Trust and its shareholders first;
·
The requirement that all personal securities transactions be conducted in a manner consistent with the Code of Ethics and in such a manner as to avoid any actual or potential conflict of interest or any abuse of any individual’s position of trust and responsibility; and
·
The fundamental standard that such employees, officers, directors and trustees should not take inappropriate advantage of their positions, or of their relationship with the Trust or its shareholders.
It is imperative that the personal trading activities of the employees, officers, directors and trustees of the Trust and the Adviser, respectively, be conducted with the highest regard for these general principles in order to avoid any possible conflict of interest, any appearance of a conflict, or activities that could lead to disciplinary action. This includes executing transactions through or for the benefit of a third party when the transaction is not in keeping with the general principles of this Code.
All personal securities transactions must also comply with the Securities & Exchange Commission’s Rule 17j-1. Under this rule, no Employee may:
·
employ any device, scheme or artifice to defraud the Trust or any of its shareholders;
·
make to the Trust or any of its shareholders any untrue statement of a material fact or omit to state to such client a material fact necessary in order to make the statements made, in light of the circumstances under which they are made, not misleading;
·
engage in any act, practice, or course of business which operates or would operate as a fraud or deceit upon the Trust or any of its shareholders; or
·
engage in any manipulative practice with respect to the Trust or any of its shareholders.
II.
Definitions
A.
Advisory Employees: Employees who, in connection with their regular functions or duties, make, participate in, or obtain information regarding the purchase or sale of securities by a Fund, or whose functions relate to the making of any recommendation with respect to purchases or sales. The Compliance Officer will maintain a current list of all Advisory Employees.
B.
Beneficial Interest: ownership or any benefits of ownership, including the opportunity to directly or indirectly profit or otherwise obtain financial benefits from any interest in a security.
C.
Compliance Officer: the Compliance Officer for the Adviser and the Trust is each company’s duly named Chief Compliance Officer.
D.
Disinterested Trustees: trustees of the Trust whose affiliation with the Trust is solely by reason of being a trustee of the Trust.
E.
Employee Account: each account in which an Employee or a member of his or her family has any direct or indirect Beneficial Interest or over which such person exercises control or influence, including, but not limited to, any joint account, partnership, corporation, trust or estate. An Employee’s family members include the Employee’s spouse, minor children, any person living in the home of the Employee and any relative of the Employee (including in-laws) to whose support an Employee directly or indirectly contributes.
F.
Employees: the employees, officers, and trustees of the Trust and the employees, officers and directors of the Adviser, including Advisory Employees. The Compliance Officer will maintain a current list of all Employees.
G.
Exempt Transactions: transactions which are 1) effected in an amount or in a manner over which the Employee has no direct or indirect influence or control, 2) pursuant to a systematic dividend reinvestment plan, systematic cash purchase plan or systematic withdrawal plan, 3) in connection with the exercise or sale of rights to purchase additional securities from an issuer and granted by such issuer pro-rata to all holders of a class of its securities, 4) in connection with the call by the issuer of a preferred stock or bond, 5) pursuant to the exercise by a second party of a put or call option, 6) closing transactions no more than five business days prior to the expiration of a related put or call option, 7) inconsequential to any Fund because the transaction is very unlikely to affect a highly liquid market or because the security is clearly not related economically to any securities that a Fund may purchase or sell, 8) involving shares of a security of a company with a market capitalization in excess of $500 million.
H.
Funds: any series of the Trust.
I.
Related Securities: securities issued by the same issuer or issuer under common control, or when either security gives the holder any contractual rights with respect to the other security, including options, warrants or other convertible securities.
J.
Securities: any note, stock, treasury stock, bond, debenture, evidence of indebtedness, certificate of interest or participation in any profit-sharing agreement, collateral-trust certificate, pre-organization certificate or subscription, transferable share, investment contract, voting-trust certificate, certificate of deposit for a security, fractional undivided interest in oil, gas or other mineral rights, or, in general, any interest or instrument commonly known as a “security,” or any certificate or interest or participation in temporary or interim certificate for, receipt for, guarantee of, or warrant or right to subscribe to or purchase (including options) any of the foregoing; except for the following: 1) securities issued by the government of the United States, 2) bankers’ acceptances, 3) bank certificates of deposit, 4) commercial paper, and 5) shares of unaffiliated registered open-end investment companies (other than exchange traded funds)..
K.
Securities Transaction: the purchase or sale, or any action to accomplish the purchase or sale, of a Security for an Employee Account. The term Securities Transaction does not include transactions executed by the Adviser for the benefit of unaffiliated persons, such as investment advisory and brokerage clients.
III.
Personal Investment Guidelines
A.
Personal Accounts
1.
The Personal Investment Guidelines in this Section III do not apply to Exempt Transactions unless the transaction involves a private placement or initial public offering. Employees must remember that regardless of the transaction’s status as exempt or not exempt, the Employee’s fiduciary obligations remain unchanged.
2.
While trustees of the Trust are subject at all times to the fiduciary obligations described in this Code, the Personal Investment Guidelines and Compliance Procedures in Sections III and IV of this Code apply to Disinterested Trustees only if such person knew, or in the ordinary course of fulfilling the duties of that position, should have known, that during the fifteen days immediately preceding or after the date of the such person’s transaction that the same Security or a Related Security was or was to be purchased or sold for a Fund or that such purchase or sale for a Fund was being considered, in which case such Sections apply only to such transaction.
3.
Employees may not execute a Securities Transaction on a day during which a purchase or sell order in that same Security or a Related Security is pending for a Fund unless the Securities Transaction is combined (“blocked”) with the Fund’s transaction. Securities Transactions executed in violation of this prohibition shall be unwound or, if not possible or practical, the Employee must disgorge to the Fund the value received by the Employee due to any favorable price differential received by the Employee. For example, if the Employee buys 100 shares at $10 per share, and the Fund buys 1000 shares at $11 per share, the Employee will pay $100 (100 shares x $1 differential) to the Fund.
4.
Any Securities Transactions in a private placement must be authorized by the Compliance Officer, in writing, prior to the transaction. In connection with a private placement acquisition, the Compliance Officer will take into account, among other factors, whether the investment opportunity should be reserved for a Fund, and whether the opportunity is being offered to the Employee by virtue of the Employee’s position with the Trust or the Adviser. If the private placement acquisition is authorized, the Compliance Officer shall retain a record of the authorization and the rationale supporting the authorization. Employees who have been authorized to acquire securities in a private placement will, in connection therewith, be required to disclose that investment if and when the Employee takes part in any subsequent investment in the same issuer. In such circumstances, the determination to purchase Securities of that issuer on behalf of a Fund will be subject to an independent review by personnel of the Adviser with no personal interest in the issuer.
5.
Employees are prohibited from acquiring any Securities in an initial public offering without the prior written approval of the Compliance Officer. This restriction is imposed in order to preclude any possibility of an Employee profiting improperly from the Employee’s position with the Trust or the Adviser. If the initial public offering is authorized, the Compliance Officer shall retain a record of the authorization and the rationale supporting the authorization.
B.
Other Restrictions
Employees are prohibited from serving on the boards of directors of publicly traded companies, absent prior authorization by the Compliance Officer. The consideration of prior authorization will be based upon a determination that the board service will be consistent with the interests of the Trust and the Funds’ shareholders. In the event that board service is authorized, Employees serving as directors will be isolated from other Employees making investment decisions with respect to the securities of the company in question.
IV.
Compliance Procedures
A.
Employee Disclosure
1.
Within ten (10) days of commencement of employment with the Trust or the Adviser, each Employee must certify that he or she has read and understands this Code and recognizes that he or she is subject to it, and must disclose the following information, which information must be current as of a date no more than 45 days prior to the date the person became an Employee: a) the title, number of shares and principal amount of each Security in which the Employee has a Beneficial Interest when the person became an Employee, b) the name of any broker/dealer with whom the Employee maintained an account when the person became an Employee, and c) the date the report is submitted.
2.
Annually, each Employee must certify that he or she has read and understands this Code and recognizes that he or she is subject to it, that he or she has complied with the requirements of this Code and has disclosed or reported all personal Securities Transactions required to be disclosed or reported pursuant to the requirements of this Code. In addition, each Employee shall annually provide the following information (as of a date no more than 30 days before the report is submitted): a) the title, number of shares and principal amount of each Security in which the Employee had any Beneficial Interest, b) the name of any broker, dealer or bank with whom the Employee maintains an account in which any Securities are held for the direct or indirect benefit of the Employee, and c) the date the report is submitted.
B.
Compliance
1.
All Employees must provide copies of all periodic broker account statements to the Compliance Officer. Each Employee must report, no later than thirty (30) days after the close of each calendar quarter, on the Securities Transaction Report form provided by the Trust or the Adviser, all transactions in which the Employee acquired or sold any direct or indirect Beneficial Interest in a Security, including Exempt Transactions, and certify that he or she has reported all transactions required to be disclosed pursuant to the requirements of this Code. The report will also identify any trading account, in which the Employee has a direct or indirect Beneficial Interest, established during the quarter with a broker, dealer or bank. The Employee may exclude transactions effected pursuant to an automatic investment plan. An automatic investment plan is a program in which regular periodic purchases (or withdrawals) are made automatically in (or from) investment accounts in accordance with a predetermined schedule and allocation. An automatic investment plan includes a dividend reinvestment plan.
2.
The Compliance Officer will, on a quarterly basis, check the trading account statements provided by brokers to verify that the Employee has not violated the Code. The Compliance Officer shall identify all Employees, inform those persons of their reporting obligations, and maintain a record of all current and former access persons.
3.
If an Employee violates this Code, the Compliance Officer will report the violation to management personnel of the Trust and the Adviser for appropriate remedial action which, in addition to the actions specifically delineated in other sections of this Code, may include a reprimand of the Employee, or suspension or termination of the Employee’s relationship with the Trust and/or the Adviser.
4.
The management personnel of the Trust will prepare an annual report to the Trust’s board of trustees that summarizes existing procedures and any changes in the procedures made during the past year and certify to the Trust’s Board of Trustees that the Adviser and the Trust have each adopted procedures reasonably necessary to prevent Employees from violating this Code. The report will describe any issues existing under this Code since the last report, including without limitation, information about any material violations of this Code, any significant remedial action during the past year and any recommended procedural or substantive changes to this Code based on management’s experience under this Code, evolving industry practices or legal developments.
Responsible Party/Compliance Process: Chief Compliance Officer/Investment Adviser
Approved: DFG
Revised: 02/01/2007
ANNUAL EMPLOYEE SECURITIES REPORT
This information is current as of _______________ (must be current as of a date no more than 45 days before the Report is submitted). Please list all Securities in which you have a Beneficial Interest, as defined in the Code of Ethics.
Security(name, type, CUSIP or ticker symbol) | # of Shares and Principal Amount | Date Acquired |
|
|
|
|
|
|
|
|
|
|
|
|
|
|
|
|
|
|
|
|
|
|
|
|
|
|
|
|
|
|
Please list all brokers, dealers and banks that maintain a brokerage account in which you have a Beneficial Interest, as defined in the Code of Ethics.
Name of Broker, Dealer or Bank | Account Name |
|
|
|
|
|
|
|
|
|
|
|
|
|
|
|
|
|
|
|
|
I certify that I have read and understand the Code of Ethics and recognize that I am subject to it. I certify that this is a complete list of all Securities in which I have a Beneficial Interest, and that I have complied with the requirements of the Code of Ethics including disclosure of all Securities Transactions for which the Code of Ethics requires disclosure.
Printed Name:
Signature:
Date:
PRE-CLEARANCE OF SECURITY TRANSACTION
To:
Compliance Officer
From:
__________________________________________
(Name of Employee)
Date:
__________________________________
1. I hereby seek approval for the o purchase/o sale of _________ shares or $__________ par value of _______________________ for the cash or margin account of _____________________.
2. The price per share or contract is approximately $_________________.
3. The transaction o is/o is not in connection with a private placement or an initial public offering.
4. Said transaction was recommended to me by __________________________________.
I have no knowledge of any pending purchase or sell order for this Security or a Related Security.
I have read the Code of Ethics within the past year and recognize that I am subject to it.
After inquiry, I am satisfied that this transaction is consistent with the Code of Ethics and the Insider Trading Policy. If I become aware that the trade does not comply with this Code or that the statements made on the request are no longer true, I will immediately notify the Compliance Officer.
______________________________________
Signature of Employee
APPROVED: _________________________________
DATE: ______________________
TRANSACTION COMPLETED: Date ___________
No. of Shares _________
Price _______
TRANSACTION UNFILLED: ___________________
COMMENTS/FOLLOW UP:
(This authorization is valid until close of business on the second trading day following authorization.
QUARTERLY SECURITIES TRANSACTIONS REPORT
Calendar Quarter/Year:
Persons subject to the Code of Ethics must report ALL Securities Transactions (including Exempt Transactions and transactions involving affiliated mutual Funds) as defined in the Code of Ethics, executed during the reporting period. DO NOT ATTACH BROKERAGE REPORTS. The report must be returned to the Compliance Officer, regardless of whether any Securities Transactions occurred, before the 30th day after the close of the calendar quarter. Please note that this Report covers all Securities in which you have a Beneficial Interest.
o
I have executed no Securities Transactions during the quarter.
o
The following is a complete list of my Securities Transactions:
Security* | Transaction Date | Purchase, Sale, or Other | # of Shares & Principal Amount of Security | Price | Executing Broker |
|
|
|
|
|
|
|
|
|
|
|
|
|
|
|
|
|
|
|
|
|
|
|
|
|
|
|
|
|
|
*Provide interest rate, maturity date, ticker symbol or CUSIP, if applicable
I have not opened a brokerage account during the quarter.
The following is a complete list of all brokerage accounts I opened during the quarter:
Name of Broker, Dealer or Bank: | Account Name: | Date Established: |
|
|
|
|
|
|
I certify that I have read and understand the Code of Ethics and that I have complied with the requirements of the Code of Ethics, including disclosure of all Securities Transactions that require disclosure.
Printed Name:
Signature:
Filing Date:
THIS REPORT SHALL NOT BE CONSTRUED AS AN ADMISSION THAT THE REPORTING PERSON HAS ANY DIRECT OR INDIRECT BENEFICIAL OWNERSHIP IN ANY SECURITY TO WHICH THIS REPORT RELATES.
NEW EMPLOYEE SECURITIES REPORT
This information is current as of _______________ (must be current as of a date no more than 45 days before your commencing employment). Return to Compliance Officer within 10 days of your commencing employment.
Please list all Securities in which you have a Beneficial Interest, as defined in the Code of Ethics.
Security(name, type, CUSIP or ticker symbol) | # of Shares or Principal Amount | Date Acquired |
|
|
|
|
|
|
|
|
|
|
|
|
|
|
|
|
|
|
|
|
|
|
|
|
|
|
|
|
|
|
Please list all brokers, dealers and banks that maintain a brokerage account in which you have a Beneficial Interest, as defined in the Code of Ethics.
Name of Broker, Dealer or Bank | Account Name |
|
|
|
|
|
|
|
|
|
|
|
|
|
|
|
|
|
|
|
|
I certify that I have read and understand the Code of Ethics and recognize that I am subject to it. I certify that this is a complete list of all Securities in which I have a Beneficial Interest, and that I have complied with the requirements of the Code of Ethics including disclosure of all Securities Transactions for which the Code of Ethics requires disclosure.
Printed Name:
Signature:
Date:
ANNUAL ISSUES REPORT AND CERTIFICATION
OF
CATALYST FUNDS
For the period__________ to ______________
A. Issues Report. Rule 17j-1 under the 1940 Act requires that the Catalysts Funds (the “Trust”) submit at least annually, for the Board of Trustees’ consideration, a written report describing any issues arising under the Trust’s Code of Ethics, including, but not limited to, information about material violations of the code and sanctions imposed in response to the material violations.
[Describe all issues relevant to the Board or state that there are no issues to report.]
No issues to report.
B.
Certification. The undersigned authorized officer of the Trust hereby certifies to the Board that the Trust has adopted procedures reasonably necessary to prevent Access Persons (as defined in the Code) from violating the Code.
Date:___________________
_________________________________________
Authorized Officer
ANNUAL ISSUES REPORT AND CERTIFICATION
OF
Name of Adviser or Sub Adviser
For the period _______________ to __________________
A.
Issues Report. Rule 17j-1 under the 1940 Act requires that __________________ (the “Adviser”), adviser to the Mutual Fund Series Trust submit at least annually, for the Board of Trustees’ consideration, a written report describing any issues arising under the Trust’s Code of Ethics, including, but not limited to, information about material violations of the code and sanctions imposed in response to the material violations.
[Describe all issues relevant to the Board or state that there are no issues to report.]
No issues to report.
B.
Certification. The undersigned authorized officer of the Adviser hereby certifies to the Board that the Trust has adopted procedures reasonably necessary to prevent Access Persons (as defined in the Code) from violating the Code.
Date:___________________
_________________________________________
Authorized Officer
ANNUAL ISSUES REPORT AND CERTIFICATION
OF
Matrix Capital Group, Inc.
For the period _______________ to __________________
A.
Issues Report. Rule 17j-1 under the 1940 Act requires that Matrix Capital Group, Inc. principal underwriter of the Mutual Fund Series Trust (the “Underwriter”) submit at least annually, for the Board of Trustees’ consideration, a written report describing any issues arising under the Trust’s Code of Ethics, including, but not limited to, information about material violations of the code and sanctions imposed in response to the material violations.
[Describe all issues relevant to the Board or state that there are no issues to report.]
No issues to report.
B.
Certification. The undersigned authorized officer of the Underwriter hereby certifies to the Board that the Trust has adopted procedures reasonably necessary to prevent Access Persons (as defined in the Code) from violating the Code.
Date:___________________
_________________________________________
Authorized Officer
Serious News for Serious Traders! Try StreetInsider.com Premium Free!
You May Also Be Interested In
- Convention Data Services Becomes Strategic Full-Service Registration and Integration Partner for Informa Markets' North American Event Portfolio
- Hyundai Bioscience's antiviral for Dengue Fever to enter clinical trials in Brazil
- AI Eye Podcast - Interview with Alset Capital; the New Kid on the Block Making Headlines on the Global AI Stage
Create E-mail Alert Related Categories
SEC FilingsSign up for StreetInsider Free!
Receive full access to all new and archived articles, unlimited portfolio tracking, e-mail alerts, custom newswires and RSS feeds - and more!
