

Form N-CSR MFS HIGH INCOME MUNICIPA For: Nov 30
 Tweet
Tweet Share
ShareTable of Contents
UNITED STATES
SECURITIES AND EXCHANGE COMMISSION
Washington, D.C. 20549
FORM N-CSR
CERTIFIED SHAREHOLDER REPORT OF
REGISTERED MANAGEMENT INVESTMENT COMPANIES
Investment Company Act file number 811-05754
MFS HIGH INCOME MUNICIPAL TRUST
(Exact name of registrant as specified in charter)
111 Huntington Avenue, Boston, Massachusetts 02199
(Address of principal executive offices) (Zip code)
Christopher R. Bohane
Massachusetts Financial Services Company
111 Huntington Avenue
Boston, Massachusetts 02199
(Name and address of agents for service)
Registrant’s telephone number, including area code: (617) 954-5000
Date of fiscal year end: November 30
Date of reporting period: November 30, 2018
Table of Contents
| ITEM 1. | REPORTS TO STOCKHOLDERS. |
Table of Contents
Annual Report
November 30, 2018

MFS® High Income Municipal Trust

Beginning on January 1, 2021, as permitted by regulations adopted by the U.S. Securities and Exchange Commission, paper copies of the fund’s annual and semiannual shareholder reports will no longer be sent by mail, unless you specifically request paper copies of the reports. Instead, the complete reports will be made available on the fund’s Web site, and you will be notified by mail each time a report is posted and provided with a Web site link to access the report.
If you are already signed up to receive shareholder reports by email, you will not be affected by this change and you need not take any action. You may sign up to receive shareholder reports and other communications from the fund by email by contacting your financial intermediary (such as a broker-dealer or bank) or, if you hold your shares directly with the fund, by calling 1-800-637-2304 or by logging into your Investor Center account at www.computershare.com/investor.
Beginning on January 1, 2019, you may elect to receive all future reports in paper free of charge. Contact your financial intermediary to request that you continue to receive paper copies of your shareholder reports. If you invest directly with the fund, you can call 1-800-637-2304 to let the fund know that you wish to continue receiving paper copies of your shareholder reports. Your election to receive reports in paper will apply to all funds held in your account if you invest through your financial intermediary or all funds held with the MFS fund complex if you invest directly.
CXE-ANN
Table of Contents
MFS® High Income Municipal Trust
New York Stock Exchange Symbol: CXE
NOT FDIC INSURED • MAY LOSE VALUE • NO BANK GUARANTEE
Table of Contents

LETTER FROM THE EXECUTIVE CHAIRMAN
Dear Shareholders:
Higher bond yields, international trade friction, and geopolitical uncertainty have contributed to an uptick in market volatility in recent quarters — a departure from the
low-volatility environment that prevailed for much of 2017. Against this more challenging backdrop, equity markets in the United States have outperformed most international markets on a relative basis, though returns have been modest year to date on an absolute basis. Global economic growth has become less synchronized over the past few months, with Europe, China, and some emerging markets having shown signs of slowing growth while U.S. growth has remained above average.
Although the U.S. Federal Reserve continues to gradually raise interest rates and shrink its balance sheet, monetary policy remains fairly accommodative around the world, with many central banks taking only tentative steps toward tighter policies.
U.S. tax reforms adopted in late 2017 have been welcomed by equity markets while emerging market economies have recently had to contend with tighter financial conditions as a result of firmer U.S. Treasury yields and a stronger dollar. With the Republicans losing control of the U.S. House of Representatives, further meaningful U.S. fiscal stimulus appears less likely. A partial U.S. government shutdown, beginning in late 2018, also added to political uncertainty. Globally, inflation remains largely subdued, but tight labor markets and moderate global demand have investors on the lookout for its potential reappearance. Increased U.S. protectionism is also a growing concern, as investors fear trade disputes could dampen business sentiment, leading to even slower global growth. While there has been progress on this front — a NAFTA replacement has been agreed upon between the U.S., Mexico, and Canada; the free trade pact with Korea has been updated; and a negotiating framework with the European Union has been agreed upon — tensions over trade with China remain quite high.
As a global investment manager with nearly a century of expertise, MFS® firmly believes active risk management offers downside mitigation and may help improve investment outcomes. We built our active investment platform with this belief in mind. Our long-term perspective influences nearly every aspect of our business, ensuring our investment decisions align with the investing time horizons of our clients.
Respectfully,

Robert J. Manning
Executive Chairman
MFS Investment Management
January 15, 2019
The opinions expressed in this letter are subject to change and may not be relied upon for investment advice. No forecasts can be guaranteed.
1
Table of Contents

2
Table of Contents
Portfolio Composition – continued
| (a) | For all securities other than those specifically described below, ratings are assigned to underlying securities utilizing ratings from Moody’s, Fitch, and Standard & Poor’s rating agencies and applying the following hierarchy: If all three agencies provide a rating, the middle rating (after dropping the highest and lowest ratings) is assigned; if two of the three agencies rate a security, the lower of the two is assigned. Ratings are shown in the S&P and Fitch scale (e.g., AAA). Securities rated BBB or higher are considered investment grade. All ratings are subject to change. Not Rated includes fixed income securities and fixed income derivatives, which have not been rated by any rating agency. The fund may or may not have held all of these instruments on this date. The fund is not rated by these agencies. |
| (d) | Duration is a measure of how much a bond’s price is likely to fluctuate with general changes in interest rates, e.g., if rates rise 1.00%, a bond with a 5-year duration is likely to lose about 5.00% of its value due to the interest rate move. This calculation is based on net assets applicable to common shares as of November 30, 2018. |
| (i) | For purposes of this presentation, the components include the value of securities, and reflect the impact of the equivalent exposure of derivative positions, if any. These amounts may be negative from time to time. Equivalent exposure is a calculated amount that translates the derivative position into a reasonable approximation of the amount of the underlying asset that the portfolio would have to hold at a given point in time to have the same price sensitivity that results from the portfolio’s ownership of the derivative contract. When dealing with derivatives, equivalent exposure is a more representative measure of the potential impact of a position on portfolio performance than value. The bond component will include any accrued interest amounts. |
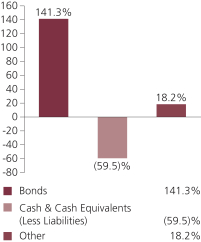
| (j) | For the purpose of managing the fund’s duration, the fund holds short treasury futures with a bond equivalent exposure of (18.2)%, which reduce the fund’s interest rate exposure but not its credit exposure. |
| (m) | In determining each instrument’s effective maturity for purposes of calculating the fund’s dollar-weighted average effective maturity, MFS uses the instrument’s stated maturity or, if applicable, an earlier date on which MFS believes it is probable that a maturity-shortening device (such as a put, pre-refunding or prepayment) will cause the instrument to be repaid. Such an earlier date can be substantially shorter than the instrument’s stated maturity. This calculation is based on gross assets, which consists of net assets applicable to common shares plus the value of preferred shares, as of November 30, 2018. |
Cash & Cash Equivalents includes any cash, investments in money market funds, short-term securities, and other assets less liabilities. Please see the Statement of Assets and Liabilities for additional information related to the fund’s cash position and other assets and liabilities.
Cash & Cash Equivalents is negative due to the aggregate liquidation value of variable rate municipal term preferred shares.
Other includes equivalent exposure from currency derivatives and/or any offsets to derivative positions.
Percentages are based on net assets applicable to common shares as of November 30, 2018.
The portfolio is actively managed and current holdings may be different.
3
Table of Contents
Summary of Results
MFS High Income Municipal Trust (“fund”) is a closed-end fund. The fund’s investment objective is to seek high current income exempt from federal income tax, but may also consider capital appreciation. The fund invests, under normal market conditions, at least 80% of its net assets, including assets attributable to preferred shares and borrowings for investment purposes, in tax-exempt bonds and tax exempt notes.
For the twelve months ended November 30, 2018, shares of the fund provided a total return of 2.98%, at net asset value, and a total return of –8.36%, at market value. This compares with a return of 1.13% for the fund’s benchmark, the Bloomberg Barclays Municipal Bond Index.
The performance commentary below is based on the net asset value performance of the fund which reflects the performance of the underlying pool of assets held by the fund. The total return at market value represents the return earned by owners of the shares of the fund which are traded publicly on the exchange.
Market Environment
During the reporting period, the US Federal Reserve (“Fed”) raised interest rates by 100 basis points, bringing the total number of rate hikes to eight since the central bank began to normalize monetary policy in late 2015. Economic growth rates in the US, eurozone and Japan remained above trend despite a slowing in global growth, particularly toward the end of the period. Inflation remained contained, particularly outside the US. Late in the period, the European Central Bank announced that it would halt its asset purchase program at the end of 2018, but issued forward guidance that it does not expect to raise interest rates at least until after the summer of 2019. Both the Bank of England and the Bank of Canada raised rates several times during the period. The European political backdrop became a bit more volatile late in the period, spurred by concerns over cohesion in the eurozone after the election of an anti-establishment, Eurosceptic coalition government in Italy.
Bond yields rose in the US during the period but remained low by historical standards, while yields in many developed markets fell. Outside of emerging markets, where spreads and currencies came under pressure, credit spreads remained quite tight until the end of the period when thinner liquidity, lower oil prices and concerns over high degrees of corporate leverage emerged. Growing concern over increasing global trade friction appeared to have weighed on business sentiment during the period’s second half, especially outside the US. Tighter financial conditions from rising US rates and a strong dollar, combined with trade uncertainty, helped expose structural weaknesses in several emerging markets in the second half of the period.
Volatility increased at the end of the period amid signs of slowing global economic growth and increasing trade tensions, which prompted a market setback shortly after US markets set record highs in September. It was the second such equity market decline during the reporting period. The correction came despite a third consecutive quarter of strong growth in US earnings per share. Strong earnings growth, combined with the market decline, brought US equity valuations down from elevated levels, earlier in the period, to multiples more in line with long-term averages. While the US
4
Table of Contents
Management Review – continued
economy maintained its strength, global economic growth became less synchronized during the period, with Europe and China showing signs of a modest slowdown and some emerging markets coming under stress.
10-Year US Treasury yields generally rose during the reporting period, driven by a number of factors, including the passage of a number of fiscal stimulus measures and indications that the Fed was likely to continue raising short-term interest rates. Municipal bond yields also rose during the period, although not as much as treasuries. The Fed raised interest rates four times during the reporting period, and signaled that further gradual increases in interest rates would be likely.
The rise in yields was most pronounced during the first half of the reporting period amid the passage of the Tax Cuts and Jobs Act, which cut individual and corporate tax rates and provided for a larger-than-expected fiscal spending package. This appeared to have led investors to increase expectations for better economic growth and a potential increase in inflationary pressures, which pushed bond yields higher. Subsequent to the increase in yields during the first half of the reporting period, bond yields remained largely range-bound, with solid US economic data putting upward pressure on yields while uncertainty regarding slowing global growth, coupled with concerns about escalating trade tensions and muted signs of inflation, pushed yields lower.
Against this backdrop, municipal bonds provided slightly positive total returns, with the yield generated by the asset class offsetting negative price returns for the period, amid the rise in municipal yields. Other notable events during the year included a strong recovery in bonds issued by Puerto Rico, which were boosted by ongoing progress in restructuring negotiations.
Factors Affecting Performance
Relative to the Bloomberg Barclays Municipal Bond Index, the fund’s bond selection within the health care sector detracted from relative performance.
Conversely, the fund’s greater exposure to both “BBB” rated (r) securities, and to below investment grade bonds (which are not held within the benchmark), bolstered relative results.
The fund employs leverage which has been created through the issuance of variable rate municipal term preferred shares. To the extent that investments are purchased through the use of leverage, the fund’s net asset value may increase or decrease at a greater rate than a comparable unleveraged fund. During the reporting period, the fund’s use of leverage benefited the income (or yield) to the common shareholder.
Respectfully,
Portfolio Manager(s)
Gary Lasman and Geoffrey Schechter
| (r) | Bonds rated “BBB”, “Baa”, or higher are considered investment grade; bonds rated “BB”, “Ba”, or below are considered non-investment grade. The source for bond quality ratings is Moody’s Investors Service, Standard & Poor’s and Fitch, Inc. and are applied using the following hierarchy: If all three agencies provide a rating, the middle rating (after dropping the |
5
Table of Contents
Management Review – continued
| highest and lowest ratings) is assigned; if two of the three agencies rate a security, the lower of the two is assigned. Ratings are shown in the S&P and Fitch scale (e.g., AAA). For securities which are not rated by any of the three agencies, the security is considered Not Rated. |
The views expressed in this report are those of the portfolio manager(s) only through the end of the period of the report as stated on the cover and do not necessarily reflect the views of MFS or any other person in the MFS organization. These views are subject to change at any time based on market or other conditions, and MFS disclaims any responsibility to update such views. These views may not be relied upon as investment advice or an indication of trading intent on behalf of any MFS portfolio. References to specific securities are not recommendations of such securities, and may not be representative of any MFS portfolio’s current or future investments.
6
Table of Contents
PERFORMANCE SUMMARY THROUGH 11/30/18
The following chart presents the fund’s historical performance in comparison to its benchmark(s). Investment return and principal value will fluctuate, and shares, when sold, may be worth more or less than their original cost; current performance may be lower or higher than quoted. The performance shown does not reflect the deduction of taxes, if any, that a shareholder would pay on fund distributions or the sale of fund shares. Performance data shown represents past performance and is no guarantee of future results.
Price Summary for MFS High Income Municipal Trust
| Date | Price | |||||||||||
|
Year Ended 11/30/18 |
Net Asset Value | 11/30/18 | $5.18 | |||||||||
| 11/30/17 | $5.33 | |||||||||||
| New York Stock Exchange Price | 11/30/18 | $4.67 | ||||||||||
| 12/05/17 | (high) (t) | $5.44 | ||||||||||
| 11/21/18 | (low) (t) | $4.61 | ||||||||||
| 11/30/17 | $5.40 | |||||||||||
Total Returns vs Benchmark(s)
|
Year Ended 11/30/18 |
MFS High Income Municipal Trust at | |||||||
| New York Stock Exchange Price (r) |
(8.36)% | |||||||
| Net Asset Value (r) |
2.98% | |||||||
| Bloomberg Barclays Municipal Bond Index (f) | 1.13% | |||||||
| (f) | Source: FactSet Research Systems Inc. |
| (r) | Includes reinvestment of all distributions. |
| (t) | For the period December 1, 2017 through November 30, 2018. |
Benchmark Definition(s)
Bloomberg Barclays Municipal Bond Index – a market capitalization-weighted index that measures the performance of the tax-exempt bond market.
It is not possible to invest directly in an index.
Notes to Performance Summary
The fund’s shares may trade at a discount or premium to net asset value. When fund
shares trade at a premium, buyers pay more than the net asset value underlying fund
shares, and shares purchased at a premium would receive less than the amount paid for them in the event of the fund’s concurrent liquidation.
7
Table of Contents
Performance Summary – continued
The fund’s monthly distributions may include a return of capital to shareholders to the extent that distributions are in excess of the fund’s net investment income and net capital gains, determined in accordance with federal income tax regulations. Distributions that are treated for federal income tax purposes as a return of capital will reduce each shareholder’s basis in his or her shares and, to the extent the return of capital exceeds such basis, will be treated as gain to the shareholder from a sale of shares. Returns of shareholder capital may have the effect of reducing the fund’s assets and increasing the fund’s expense ratio.
Net asset values and performance results based on net asset value per share do not include adjustments made for financial reporting purposes in accordance with U.S. generally accepted accounting principles and may differ from amounts reported in the Statement of Assets and Liabilities or the Financial Highlights.
A portion of the fund’s monthly distributions may be subject to state, federal, and/or alternative minimum tax. Capital gains, if any, are subject to a capital gains tax.
From time to time the fund may receive proceeds from litigation settlements, without which performance would be lower.
In accordance with Section 23(c) of the Investment Company Act of 1940, the fund hereby gives notice that it may from time to time repurchase common and/or preferred shares of the fund in the open market at the option of the Board of Trustees and on such terms as the Trustees shall determine.
8
Table of Contents
| Portfolio Manager | Primary Role | Since | Title and Five Year History | |||
| Gary Lasman | Portfolio Manager | 2007 | Investment Officer of MFS; employed in the investment management area of MFS since 2002. | |||
| Geoffrey Schechter | Portfolio Manager | 2007 | Investment Officer of MFS; employed in the investment management area of MFS since 1993. | |||
9
Table of Contents
DIVIDEND REINVESTMENT AND CASH PURCHASE PLAN
The fund offers a Dividend Reinvestment and Cash Purchase Plan (the “Plan”) that allows common shareholders to reinvest either all of the distributions paid by the fund or only the long-term capital gains. Generally, purchases are made at the market price unless that price exceeds the net asset value (the shares are trading at a premium). If the shares are trading at a premium, purchases will be made at a price of either the net asset value or 95% of the market price, whichever is greater. You can also buy shares on a quarterly basis in any amount $100 and over. The Plan Agent will purchase shares under the Cash Purchase Plan on the 15th of January, April, July, and October or shortly thereafter.
If shares are registered in your own name, new shareholders will automatically participate in the Plan, unless you have indicated that you do not wish to participate. If your shares are in the name of a brokerage firm, bank, or other nominee, you can ask the firm or nominee to participate in the Plan on your behalf. If the nominee does not offer the Plan, you may wish to request that your shares be re-registered in your own name so that you can participate. There is no service charge to reinvest distributions, nor are there brokerage charges for shares issued directly by the fund. However, when shares are bought on the New York Stock Exchange or otherwise on the open market, each participant pays a pro rata share of the transaction expenses, including commissions. The tax status of dividends and capital gain distributions does not change whether received in cash or reinvested in additional shares – the automatic reinvestment of distributions does not relieve you of any income tax that may be payable (or required to be withheld) on the distributions.
If your shares are held directly with the Plan Agent, you may withdraw from the Plan at any time by going to the Plan Agent’s website at www.computershare.com/investor, by calling 1-800-637-2304 any business day from 9 a.m. to 5 p.m. Eastern time or by writing to the Plan Agent at P.O. Box 43078, Providence, RI 02940-3078. Please have available the name of the fund and your account number. For certain types of registrations, such as corporate accounts, instructions must be submitted in writing. Please call for additional details. When you withdraw from the Plan, you can receive the value of the reinvested shares in one of three ways: your full shares will be held in your account, the Plan Agent will sell your shares and send the proceeds to you, or you may transfer your full shares to your investment professional who can hold or sell them. Additionally, the Plan Agent will sell your fractional shares and send the proceeds to you.
If you have any questions or for further information or a copy of the Plan, contact the Plan Agent Computershare Trust Company, N.A. (the Transfer Agent for the fund) at 1-800-637-2304, at the Plan Agent’s website at www.computershare.com/investor, or by writing to the Plan Agent at P.O. Box 43078, Providence, RI 02940-3078.
10
Table of Contents
11/30/18
The Portfolio of Investments is a complete list of all securities owned by your fund. It is categorized by jurisdiction.
| Municipal Bonds - 157.0% | ||||||||
| Issuer | Shares/Par | Value ($) | ||||||
| Alabama - 1.5% | ||||||||
| Birmingham, AL, Special Care Facilities Financing Authority Rev. (Methodist Home for the Aging), 5.5%, 6/01/2030 | $ | 105,000 | $ | 111,752 | ||||
| Birmingham, AL, Special Care Facilities Financing Authority Rev. (Methodist Home for the Aging), 5.75%, 6/01/2035 | 115,000 | 123,375 | ||||||
| Birmingham, AL, Special Care Facilities Financing Authority Rev. (Methodist Home for the Aging), 5.75%, 6/01/2045 | 155,000 | 165,177 | ||||||
| Birmingham, AL, Special Care Facilities Financing Authority Rev. (Methodist Home for the Aging), 6%, 6/01/2050 | 165,000 | 177,873 | ||||||
| Birmingham, AL, Waterworks Board Water Rev., “A”, 5.125%, 1/01/2034 (Prerefunded 1/01/2019) | 280,000 | 280,714 | ||||||
| Birmingham, AL, Waterworks Board Water Rev., “A”, ASSD GTY, 5.125%, 1/01/2034 (Prerefunded 1/01/2019) | 475,000 | 476,211 | ||||||
| Cullman County, AL, Health Care Authority (Cullman Regional Medical Center), “A”, 6.75%, 2/01/2029 | 75,000 | 75,572 | ||||||
| Jefferson County, AL, Sewer Rev. Warrants, Capital Appreciation, Senior Lien, “B”, AGM, 0%, 10/01/2026 | 130,000 | 97,462 | ||||||
| Jefferson County, AL, Sewer Rev. Warrants, Capital Appreciation, Senior Lien, “B”, AGM, 0%, 10/01/2029 | 185,000 | 113,253 | ||||||
| Jefferson County, AL, Sewer Rev. Warrants, Capital Appreciation, Senior Lien, “B”, AGM, 0%, 10/01/2034 | 260,000 | 111,101 | ||||||
| Jefferson County, AL, Sewer Rev. Warrants, Capital Appreciation, Senior Lien, “B”, AGM, 0%, 10/01/2035 | 500,000 | 199,700 | ||||||
| Jefferson County, AL, Sewer Rev. Warrants, Subordinate Lien, “D”, 5%, 10/01/2021 | 95,000 | 100,582 | ||||||
| Jefferson County, AL, Sewer Rev. Warrants, Subordinate Lien, “D”, 5%, 10/01/2023 | 140,000 | 152,092 | ||||||
| Pell City, AL, Special Care Facilities, Financing Authority Rev. (Noland Health Services, Inc.), 5%, 12/01/2039 | 225,000 | 239,702 | ||||||
|
|
|
|||||||
| $ | 2,424,566 | |||||||
| Arizona - 3.0% | ||||||||
| Arizona Industrial Development Authority Education Rev. (Academies of Math & Science), “A”, 5%, 7/01/2038 | $ | 25,000 | $ | 27,237 | ||||
| Arizona Industrial Development Authority Education Rev. (Academies of Math & Science), “A”, 5%, 7/01/2048 | 55,000 | 58,965 | ||||||
| Arizona Industrial Development Authority Education Rev. (Academies of Math & Science), “A”, 5%, 7/01/2052 | 70,000 | 74,862 | ||||||
| Arizona Industrial Development Authority Education Rev. (Academies of Math & Science), “B”, 5.5%, 7/01/2038 | 55,000 | 55,318 | ||||||
11
Table of Contents
Portfolio of Investments – continued
| Issuer | Shares/Par | Value ($) | ||||||
| Municipal Bonds - continued | ||||||||
| Arizona - continued | ||||||||
| Arizona Industrial Development Authority Education Rev. (Academies of Math & Science), “B”, 5.625%, 7/01/2048 | $ | 110,000 | $ | 110,454 | ||||
| Arizona Industrial Development Authority Education Rev. (Academies of Math & Science), “B”, 5.75%, 7/01/2053 | 175,000 | 176,001 | ||||||
| Arizona Industrial Development Authority Education Rev. (Basis Schools Projects), “D”, 5%, 7/01/2037 | 25,000 | 25,155 | ||||||
| Arizona Industrial Development Authority Education Rev. (Basis Schools Projects), “D”, 5%, 7/01/2047 | 40,000 | 39,400 | ||||||
| Arizona Industrial Development Authority Education Rev. (Basis Schools Projects), “D”, 5%, 7/01/2051 | 105,000 | 101,691 | ||||||
| Glendale, AZ, Industrial Development Authority Refunding Rev. (The Terraces of Phoenix Project), “A”, 5%, 7/01/2048 | 70,000 | 71,021 | ||||||
| La Paz County, AZ, Industrial Development Authority Education Facility Lease Rev. (Charter School Solutions-Harmony Public Schools Project), “A”, 5%, 2/15/2048 | 100,000 | 104,031 | ||||||
| Phoenix, AZ, Industrial Development Authority Education Facility Rev. (Basis Schools Projects), “A”, 5%, 7/01/2035 | 125,000 | 126,250 | ||||||
| Phoenix, AZ, Industrial Development Authority Education Facility Rev. (Basis Schools Projects), “A”, 5%, 7/01/2035 | 45,000 | 45,450 | ||||||
| Phoenix, AZ, Industrial Development Authority Education Facility Rev. (Basis Schools Projects), “A”, 5%, 7/01/2045 | 205,000 | 202,614 | ||||||
| Phoenix, AZ, Industrial Development Authority Education Facility Rev. (Basis Schools Projects), “A”, 5%, 7/01/2046 | 110,000 | 108,537 | ||||||
| Phoenix, AZ, Industrial Development Authority Education Facility Rev. (Choice Academies, Inc. Project), 5.625%, 9/01/2042 | 165,000 | 168,015 | ||||||
| Phoenix, AZ, Industrial Development Authority Education Facility Rev. (Eagle College Prep Project), 5%, 7/01/2033 | 80,000 | 80,674 | ||||||
| Phoenix, AZ, Industrial Development Authority Education Facility Rev. (Eagle College Prep Project), 5%, 7/01/2043 | 160,000 | 152,176 | ||||||
| Phoenix, AZ, Industrial Development Authority Education Facility Rev. (Great Hearts Academies Project), “A”, 5%, 7/01/2034 | 445,000 | 460,949 | ||||||
| Phoenix, AZ, Industrial Development Authority Education Facility Rev. (Great Hearts Academies Project), “A”, 5%, 7/01/2044 | 280,000 | 286,132 | ||||||
| Phoenix, AZ, Industrial Development Authority Education Facility Rev. (Legacy Traditional Schools Project), 6.5%, 7/01/2034 | 145,000 | 157,147 | ||||||
| Phoenix, AZ, Industrial Development Authority Education Facility Rev. (Legacy Traditional Schools Project), 5%, 7/01/2035 | 195,000 | 196,950 | ||||||
| Phoenix, AZ, Industrial Development Authority Education Facility Rev. (Legacy Traditional Schools Project), 6.75%, 7/01/2044 | 235,000 | 254,665 | ||||||
| Phoenix, AZ, Industrial Development Authority Education Facility Rev. (Legacy Traditional Schools Project), 5%, 7/01/2045 | 215,000 | 214,989 | ||||||
| Phoenix, AZ, Industrial Development Authority Rev. (Guam Facilities Foundation, Inc.), 5.125%, 2/01/2034 | 435,000 | 405,959 | ||||||
12
Table of Contents
Portfolio of Investments – continued
| Issuer | Shares/Par | Value ($) | ||||||
| Municipal Bonds - continued | ||||||||
| Arizona - continued | ||||||||
| Phoenix, AZ, Industrial Development Authority Rev. (Guam Facilities Foundation, Inc.), 5.375%, 2/01/2041 | $ | 330,000 | $ | 302,914 | ||||
| Phoenix, AZ, Industrial Development Authority Student Housing Refunding Rev. (Downtown Phoenix Student Housing, LLC-Arizona State University Project), “A”, 5%, 7/01/2042 | 100,000 | 106,008 | ||||||
| Pima County, AZ, Industrial Development Authority Education Facility Rev. (American Leadership Academy Project), 4.75%, 6/15/2037 | 180,000 | 175,025 | ||||||
| Pima County, AZ, Industrial Development Authority Education Facility Rev. (American Leadership Academy Project), 5%, 6/15/2047 | 135,000 | 132,581 | ||||||
| Pima County, AZ, Industrial Development Authority Education Facility Rev. (American Leadership Academy Project), 5%, 6/15/2052 | 115,000 | 111,012 | ||||||
| Tempe, AZ, Industrial Development Authority Rev. (Friendship Village), “A”, 6%, 12/01/2032 | 75,000 | 78,844 | ||||||
| Tempe, AZ, Industrial Development Authority Rev. (Friendship Village), “A”, 6.25%, 12/01/2042 | 220,000 | 231,607 | ||||||
| Tempe, AZ, Industrial Development Authority Rev. (Friendship Village), “A”, 6.25%, 12/01/2046 | 85,000 | 89,387 | ||||||
|
|
|
|||||||
| $ | 4,932,020 | |||||||
| Arkansas - 0.3% | ||||||||
| Arkansas Development Finance Authority Hospital Rev. (Washington Regional Medical Center), “A”, 5%, 2/01/2035 | $ | 40,000 | $ | 43,042 | ||||
| Arkansas Development Finance Authority Hospital Rev. (Washington Regional Medical Center), “C”, 5%, 2/01/2033 | 60,000 | 65,031 | ||||||
| Arkansas Development Finance Authority, Charter School Capital Improvement Rev. (LISA Academy Project), 4%, 7/01/2028 | 40,000 | 40,601 | ||||||
| Arkansas Development Finance Authority, Charter School Capital Improvement Rev. (LISA Academy Project), 4.5%, 7/01/2033 | 80,000 | 80,953 | ||||||
| Arkansas Development Finance Authority, Charter School Capital Improvement Rev. (LISA Academy Project), 4.5%, 7/01/2039 | 10,000 | 9,362 | ||||||
| Arkansas Development Finance Authority, Tobacco Settlement Rev. (Cancer Research Center Project), Capital Appreciation, AAC, 0%, 7/01/2046 | 610,000 | 175,283 | ||||||
|
|
|
|||||||
| $ | 414,272 | |||||||
| California - 9.8% | ||||||||
| Beverly Hills, CA, Unified School District (Election of 2008), Capital Appreciation, 0%, 8/01/2031 | $ | 350,000 | $ | 231,854 | ||||
| Beverly Hills, CA, Unified School District (Election of 2008), Capital Appreciation, 0%, 8/01/2032 | 355,000 | 225,205 | ||||||
| Beverly Hills, CA, Unified School District (Election of 2008), Capital Appreciation, 0%, 8/01/2033 | 715,000 | 431,817 | ||||||
| California Educational Facilities Authority Rev. (Chapman University), 5%, 4/01/2031 | 190,000 | 202,314 | ||||||
13
Table of Contents
Portfolio of Investments – continued
| Issuer | Shares/Par | Value ($) | ||||||
| Municipal Bonds - continued | ||||||||
| California - continued | ||||||||
| California Health Facilities Financing Authority Rev. (St. Joseph Health System), “A”, 5.75%, 7/01/2039 | $ | 125,000 | $ | 127,799 | ||||
| California Health Facilities Financing Authority Rev. (Sutter Health), “B”, 5.875%, 8/15/2031 (Prerefunded 8/15/2020) | 835,000 | 893,199 | ||||||
| California M-S-R Energy Authority Gas Rev., “A”, 7%, 11/01/2034 | 155,000 | 215,882 | ||||||
| California M-S-R Energy Authority Gas Rev., “A”, 6.5%, 11/01/2039 | 570,000 | 779,817 | ||||||
| California Municipal Finance Authority Charter School Lease Rev. (The Palmdale Aerospace Academy Project), “A”, 3.875%, 7/01/2028 | 100,000 | 98,542 | ||||||
| California Municipal Finance Authority Charter School Lease Rev. (The Palmdale Aerospace Academy Project), “A”, 5%, 7/01/2049 | 100,000 | 101,822 | ||||||
| California Municipal Finance Authority Rev. (Community Medical Centers), “A”, 5%, 2/01/2042 | 110,000 | 119,688 | ||||||
| California Municipal Finance Authority Rev. (NorthBay Healthcare Group), 5%, 11/01/2035 | 45,000 | 47,961 | ||||||
| California Municipal Finance Authority Rev. (NorthBay Healthcare Group), “A”, 5.25%, 11/01/2036 | 115,000 | 123,425 | ||||||
| California Municipal Finance Authority Rev. (NorthBay Healthcare Group), “A”, 5.25%, 11/01/2041 | 105,000 | 111,247 | ||||||
| California Municipal Finance Authority Rev. (NorthBay Healthcare Group), “A”, 5.25%, 11/01/2047 | 15,000 | 15,822 | ||||||
| California Pollution Control Financing Authority, Solid Waste Disposal Rev. (CalPlant I Project), 8%, 7/01/2039 | 460,000 | 485,305 | ||||||
| California Pollution Control Financing Authority, Water Furnishing Rev. (Poseidon Resources Desalination Project), 5%, 11/21/2045 | 530,000 | 544,278 | ||||||
| California Pollution Control Financing Authority, Water Furnishing Rev. (San Diego County Water Desalination Project Pipeline), 5%, 11/21/2045 | 340,000 | 343,737 | ||||||
| California Public Works Board Lease Rev., Department of Corrections and Rehabilitation (Various Correctional Facilities), “A”, 5%, 9/01/2033 | 1,290,000 | 1,441,252 | ||||||
| California School Finance Authority, School Facility Rev. (Alliance For College-Ready Public Schools Projects), “A”, 5%, 7/01/2030 | 45,000 | 48,576 | ||||||
| California School Finance Authority, School Facility Rev. (Alliance For College-Ready Public Schools Projects), “A”, 5%, 7/01/2045 | 130,000 | 135,841 | ||||||
| California School Finance Authority, School Facility Rev. (ICEF View Park Elementary and Middle Schools), “A”, 5.875%, 10/01/2044 | 150,000 | 155,935 | ||||||
| California Statewide Communities Development Authority Environmental Facilities Rev. (Microgy Holdings Project), 9%, 12/01/2038 (a)(d) | 63,113 | 1 | ||||||
| California Statewide Communities Development Authority Rev. (California Baptist University), “A”, 6.125%, 11/01/2033 | 100,000 | 112,798 | ||||||
| California Statewide Communities Development Authority Rev. (California Baptist University), “A”, 5%, 11/01/2041 | 115,000 | 122,920 | ||||||
14
Table of Contents
Portfolio of Investments – continued
| Issuer | Shares/Par | Value ($) | ||||||
| Municipal Bonds - continued | ||||||||
| California - continued | ||||||||
| California Statewide Communities Development Authority Rev. (Lancer Plaza Project), 5.625%, 11/01/2033 | $ | 125,000 | $ | 136,997 | ||||
| California Statewide Communities Development Authority Rev. (Loma Linda University Medical Center), “A”, 5.25%, 12/01/2034 | 225,000 | 238,464 | ||||||
| California Statewide Communities Development Authority Rev. (Loma Linda University Medical Center), “A”, 5.25%, 12/01/2044 | 465,000 | 486,576 | ||||||
| California Statewide Communities Development Authority Rev. (Loma Linda University Medical Center), “A”, 5.25%, 12/01/2056 | 290,000 | 300,562 | ||||||
| Chula Vista, CA, Industrial Development Rev. (San Diego Gas & Electric Co.), “E”, 5.875%, 1/01/2034 | 310,000 | 314,507 | ||||||
| Golden State, CA, Tobacco Securitization Corp., Tobacco Settlement Rev., “A”, 3.5%, 6/01/2036 | 155,000 | 151,698 | ||||||
| Golden State, CA, Tobacco Securitization Corp., Tobacco Settlement Rev., “A”, 5%, 6/01/2047 | 170,000 | 163,027 | ||||||
| Golden State, CA, Tobacco Securitization Corp., Tobacco Settlement Rev., “A”, 5.25%, 6/01/2047 | 175,000 | 173,574 | ||||||
| Inland Valley, CA, Development Successor Agency Tax Allocation, “A”, AGM, 5%, 9/01/2044 | 260,000 | 279,646 | ||||||
| Jurupa, CA, Public Financing Authority, Special Tax Rev., “A”, 5%, 9/01/2042 | 215,000 | 234,008 | ||||||
| La Verne, CA, Brethren Hillcrest Homes, COP, 5%, 5/15/2036 | 65,000 | 67,130 | ||||||
| Long Beach, CA, Marina Rev. (Alamitos Bay Marina Project), 5%, 5/15/2035 | 40,000 | 43,220 | ||||||
| Los Angeles County, CA, Redevelopment Refunding Authority Tax Allocation Rev. “D”, AGM, 5%, 9/01/2022 | 330,000 | 363,746 | ||||||
| Los Angeles County, CA, Redevelopment Refunding Authority Tax Allocation Rev. “D”, AGM, 5%, 9/01/2023 | 330,000 | 370,867 | ||||||
| Los Angeles County, CA, Regional Financing Authority Rev. (Montecedro Inc. Project), “A”, CALHF, 5%, 11/15/2034 | 50,000 | 54,641 | ||||||
| Los Angeles County, CA, Regional Financing Authority Rev. (Montecedro Inc. Project), “A”, CALHF, 5%, 11/15/2044 | 80,000 | 86,862 | ||||||
| Los Angeles, CA, Unified School District, “D”, 5%, 1/01/2034 | 210,000 | 213,526 | ||||||
| Morongo Band of Mission Indians California Rev., “B”, 5%, 10/01/2042 (n) | 195,000 | 197,861 | ||||||
| Palomar Pomerado Health Care District, CA, COP, 6.75%, 11/01/2039 (Prerefunded 11/01/2019) | 1,125,000 | 1,175,344 | ||||||
| San Diego, CA, Redevelopment Agency, Tax Allocation Rev., Capital Appreciation, AGM, 0%, 9/01/2022 | 1,910,000 | 1,749,484 | ||||||
| San Francisco, CA, City & County Redevelopment Successor Agency, Tax Allocation (Mission Bay South Redevelopment Project), “A”, 5%, 8/01/2043 | 35,000 | 38,182 | ||||||
| State of California, 5.25%, 10/01/2028 | 425,000 | 461,303 | ||||||
| State of California, 5.25%, 9/01/2030 | 1,005,000 | 1,085,229 | ||||||
15
Table of Contents
Portfolio of Investments – continued
| Issuer | Shares/Par | Value ($) | ||||||
| Municipal Bonds - continued | ||||||||
| California - continued | ||||||||
| Whittier, CA, Health Facility Rev. (PIH Health), 5%, 6/01/2044 | $ | 430,000 | $ | 458,346 | ||||
|
|
|
|||||||
| $ | 15,961,837 | |||||||
| Colorado - 5.7% | ||||||||
| Colorado Educational & Cultural Facilities Authority Rev. (Peak to Peak Charter School Project), 5%, 8/15/2030 | $ | 50,000 | $ | 54,056 | ||||
| Colorado Educational & Cultural Facilities Authority Rev. (Peak to Peak Charter School Project), 5%, 8/15/2034 | 50,000 | 53,441 | ||||||
| Colorado Educational & Cultural Facilities Authority Rev. (The Classical Academy Project), 5%, 12/01/2031 | 85,000 | 92,605 | ||||||
| Colorado Educational & Cultural Facilities Authority Rev. (The Classical Academy Project), “A”, 5%, 12/01/2038 | 95,000 | 101,477 | ||||||
| Colorado Health Facilities Authority Rev. (American Baptist Homes), 8%, 8/01/2043 | 250,000 | 279,017 | ||||||
| Colorado Health Facilities Authority Rev. (Evangelical Lutheran Good Samaritan Society), 5.625%, 6/01/2043 | 130,000 | 141,108 | ||||||
| Colorado High Performance Transportation Enterprise Rev. (C-470 Express Lanes), 5%, 12/31/2056 | 120,000 | 125,818 | ||||||
| Colorado Regional Transportation District, Private Activity Rev. (Denver Transportation Partners), 6%, 1/15/2034 | 795,000 | 820,830 | ||||||
| Colorado Regional Transportation District, Private Activity Rev. (Denver Transportation Partners), 6%, 1/15/2041 | 385,000 | 397,081 | ||||||
| Denver, CO, City & County Airport Systems Rev., “A”, 5%, 11/15/2028 | 205,000 | 222,423 | ||||||
| Denver, CO, City & County Airport Systems Rev., “B”, ETM, 6.125%, 11/15/2025 | 2,840,000 | 2,958,939 | ||||||
| Denver, CO, City & County Airport Systems Rev., “C”, ETM, 6.125%, 11/15/2025 | 2,280,000 | 2,658,799 | ||||||
| Denver, CO, City & County Special Facilities Airport Refunding Rev. (United Airlines), 5%, 10/01/2032 | 290,000 | 304,674 | ||||||
| Denver, CO, Convention Center Hotel Authority Rev., 5%, 12/01/2035 | 80,000 | 86,163 | ||||||
| Denver, CO, Convention Center Hotel Authority Rev., 5%, 12/01/2036 | 50,000 | 53,594 | ||||||
| Denver, CO, Convention Center Hotel Authority Rev., 5%, 12/01/2040 | 135,000 | 141,707 | ||||||
| Denver, CO, Health & Hospital Authority Rev. COP (550 Acoma, Inc.), 5%, 12/01/2048 | 100,000 | 106,551 | ||||||
| Denver, CO, Health & Hospital Authority Rev., “A”, 5.25%, 12/01/2045 | 125,000 | 131,851 | ||||||
| Park Creek Metropolitan District, CO, Senior Limited Property Tax Supported Rev., “A”, NATL, 5%, 12/01/2045 | 475,000 | 512,416 | ||||||
| Tallyn’s Reach, CO, Metropolitan District No. 3, 5.125%, 11/01/2038 | 100,000 | 103,716 | ||||||
|
|
|
|||||||
| $ | 9,346,266 | |||||||
16
Table of Contents
Portfolio of Investments – continued
| Issuer | Shares/Par | Value ($) | ||||||
| Municipal Bonds - continued | ||||||||
| Connecticut - 0.6% | ||||||||
| Mohegan Tribal Finance Authority, CT, Economic Development Bonds, 7%, 2/01/2045 (n) | $ | 790,000 | $ | 799,804 | ||||
| Mohegan Tribe Indians, CT, Gaming Authority Rev., “C”, 4.75%, 2/01/2020 (n) | 245,000 | 247,384 | ||||||
|
|
|
|||||||
| $ | 1,047,188 | |||||||
| Delaware - 0.5% | ||||||||
| Kent County, DE, Student Housing and Dining Facility Rev. (CHF-Dover, LLC-Delaware State University Project), “A”, 5%, 7/01/2048 | $ | 110,000 | $ | 114,974 | ||||
| Kent County, DE, Student Housing and Dining Facility Rev. (CHF-Dover, LLC-Delaware State University Project), “A”, 5%, 7/01/2058 | 120,000 | 124,064 | ||||||
| Wilmington, DE, Multi-Family Housing Rev. (Electra Arms Senior Associates), 6.25%, 6/01/2028 | 555,000 | 555,178 | ||||||
|
|
|
|||||||
| $ | 794,216 | |||||||
| District of Columbia - 1.4% | ||||||||
| District of Columbia Rev. (Kipp, D.C. Charter School), “A”, 6%, 7/01/2033 (Prerefunded 7/01/2023) | $ | 55,000 | $ | 64,048 | ||||
| District of Columbia Rev. (Kipp, D.C. Charter School), “A”, 6%, 7/01/2043 (Prerefunded 7/01/2023) | 140,000 | 163,031 | ||||||
| District of Columbia Rev. (Methodist Home of the District of Columbia Issue), 4.5%, 1/01/2025 | 65,000 | 62,916 | ||||||
| District of Columbia Rev. (Methodist Home of the District of Columbia Issue), “A”, 5.125%, 1/01/2035 | 80,000 | 74,956 | ||||||
| District of Columbia Rev. (Methodist Home of the District of Columbia Issue), “A”, 5.25%, 1/01/2039 | 50,000 | 46,537 | ||||||
| District of Columbia Student Dormitory Rev. (Provident Group - Howard Properties LLC), 5%, 10/01/2030 | 160,000 | 161,150 | ||||||
| District of Columbia Student Dormitory Rev. (Provident Group - Howard Properties LLC), 5%, 10/01/2035 | 850,000 | 844,212 | ||||||
| District of Columbia Student Dormitory Rev. (Provident Group - Howard Properties LLC), 5%, 10/01/2045 | 985,000 | 944,241 | ||||||
|
|
|
|||||||
| $ | 2,361,091 | |||||||
| Florida - 9.1% | ||||||||
| Alachua County, FL, Health Facilities Authority Rev. (East Ridge Retirement Village, Inc.), 6%, 11/15/2034 | $ | 90,000 | $ | 93,082 | ||||
| Alachua County, FL, Health Facilities Authority Rev. (East Ridge Retirement Village, Inc.), 6.25%, 11/15/2044 | 215,000 | 222,089 | ||||||
| Alachua County, FL, Health Facilities Authority Rev. (East Ridge Retirement Village, Inc.), 6.375%, 11/15/2049 | 145,000 | 150,390 | ||||||
17
Table of Contents
Portfolio of Investments – continued
| Issuer | Shares/Par | Value ($) | ||||||
| Municipal Bonds - continued | ||||||||
| Florida - continued | ||||||||
| Arborwood Community Development District, FL, Capital Improvement Refunding Rev. (Subordinate Lien), “A-2”, 5%, 5/01/2036 | $ | 130,000 | $ | 125,453 | ||||
| Bellalago, FL, Educational Facilities Benefit District (Osceola County) Capital Improvement Refunding Rev., 4.375%, 5/01/2030 | 105,000 | 109,158 | ||||||
| Bellalago, FL, Educational Facilities Benefit District (Osceola County) Capital Improvement Refunding Rev., 4.5%, 5/01/2033 | 50,000 | 52,093 | ||||||
| Bellalago, FL, Educational Facilities Benefit District (Osceola County) Capital Improvement Refunding Rev., 4.6%, 5/01/2034 | 75,000 | 78,413 | ||||||
| Brevard County, FL, Industrial Development Rev. (TUFF Florida Tech LLC Project), 6.75%, 11/01/2039 | 685,000 | 699,405 | ||||||
| Capital Region Community Development District, FL, Capital Improvement Rev., “A-1”, 5.125%, 5/01/2039 | 185,000 | 178,856 | ||||||
| Collier County, FL, Educational Facilities Authority Rev. (Ave Maria University, Inc. Project), “A”, 6.125%, 6/01/2043 | 605,000 | 640,042 | ||||||
| Collier County, FL, Industrial Development Authority Continuing Care Community Rev. (The Arlington of Naples Project), “A”, 8.125%, 5/15/2044 | 610,000 | 586,234 | ||||||
| Collier County, FL, Industrial Development Authority Continuing Care Community Rev. (The Arlington of Naples Project), “A”, 6.5%, 5/15/2049 | 100,000 | 87,811 | ||||||
| Daytona Beach, FL, Halifax Hospital Medical Center Rev., 5%, 6/01/2035 | 170,000 | 180,962 | ||||||
| Daytona Beach, FL, Halifax Hospital Medical Center Rev., 5%, 6/01/2046 | 235,000 | 246,600 | ||||||
| Florida Capital Trust Agency, Education Facilities Rev. (The Florida Charter Educational Foundation, Inc. Project), “A”, 5.375%, 6/15/2048 | 140,000 | 133,148 | ||||||
| Florida Development Finance Corp. Educational Facilities Rev. (Renaissance Charter School), “A”, 6%, 6/15/2032 | 140,000 | 144,311 | ||||||
| Florida Development Finance Corp. Educational Facilities Rev. (Renaissance Charter School), “A”, 7.625%, 6/15/2041 | 935,000 | 1,005,284 | ||||||
| Florida Development Finance Corp. Educational Facilities Rev. (Renaissance Charter School), “A”, 6.125%, 6/15/2043 | 295,000 | 302,071 | ||||||
| Florida Development Finance Corp. Educational Facilities Rev. (Renaissance Charter School), “A”, 8.5%, 6/15/2044 | 555,000 | 620,251 | ||||||
| Florida Development Finance Corp. Educational Facilities Rev. (Southwest Charter Foundation, Inc. Project), “A”, 6%, 6/15/2037 | 100,000 | 100,063 | ||||||
| Florida Development Finance Corp. Educational Facilities Rev. (Southwest Charter Foundation, Inc. Project), “A”, 6.125%, 6/15/2047 | 205,000 | 204,036 | ||||||
| Florida Development Finance Corp. Educational Facilities Rev. (The Florida Charter Educational Foundation Project, Inc.), “A”, 6.375%, 6/15/2046 | 180,000 | 188,248 | ||||||
18
Table of Contents
Portfolio of Investments – continued
| Issuer | Shares/Par | Value ($) | ||||||
| Municipal Bonds - continued | ||||||||
| Florida - continued | ||||||||
| Florida Higher Educational Facilities Financing Authority Rev. (Jacksonville University Project), “A”, 4.5%, 6/01/2033 | $ | 100,000 | $ | 100,769 | ||||
| Florida Higher Educational Facilities Financing Authority Rev. (Jacksonville University Project), “A”, 4.75%, 6/01/2038 | 100,000 | 101,220 | ||||||
| Florida Higher Educational Facilities Financing Authority Rev. (Jacksonville University Project), “A”, 5%, 6/01/2048 | 110,000 | 112,587 | ||||||
| Homestead, FL, Community Development District, Special Assessment, “A”, 6%, 5/01/2037 | 470,000 | 445,240 | ||||||
| Jacksonville, FL, Educational Facilities Rev. (Jacksonville University Project), “B”, 5%, 6/01/2053 | 115,000 | 116,824 | ||||||
| Lakeland, FL, Hospital Rev. (Lakeland Regional Health Systems), 5%, 11/15/2034 | 185,000 | 200,597 | ||||||
| Lakewood Ranch Stewardship District, FL, Special Assessment Rev. (Lakewood Centre North Project), 4.25%, 5/01/2025 | 100,000 | 100,359 | ||||||
| Lakewood Ranch Stewardship District, FL, Special Assessment Rev. (Lakewood Centre North Project), 4.875%, 5/01/2035 | 100,000 | 99,271 | ||||||
| Lakewood Ranch Stewardship District, FL, Special Assessment Rev. (Lakewood Centre North Project), 4.875%, 5/01/2045 | 120,000 | 115,260 | ||||||
| Lakewood Ranch Stewardship District, FL, Special Assessment Rev. (Lakewood National and Polo Run Projects), 5.375%, 5/01/2047 | 165,000 | 167,275 | ||||||
| Marshall Creek, FL, Community Development District Rev. (St. John’s County), “A”, 5%, 5/01/2032 | 105,000 | 103,985 | ||||||
| Miami-Dade County, FL, Industrial Development Authority Rev. (Pinecrest Academy Project), 5.25%, 9/15/2044 | 370,000 | 385,107 | ||||||
| Mid-Bay Bridge Authority, FL, Springing Lien Rev., “A”, 7.25%, 10/01/2040 (Prerefunded 10/01/2021) | 1,015,000 | 1,154,908 | ||||||
| Midtown Miami, FL, Community Development District Special Assessment (Infrastructure Project), “B”, 5%, 5/01/2029 | 125,000 | 130,001 | ||||||
| Midtown Miami, FL, Community Development District Special Assessment (Parking Garage Project), “A”, 5%, 5/01/2037 | 100,000 | 102,982 | ||||||
| North Broward, FL, Hospital District Rev. (Broward Health), “B”, 5%, 1/01/2042 | 475,000 | 501,377 | ||||||
| Orlando, FL, Senior Tourist Development Tax Refunding Rev. (6th Cent Contract Payments), “A”, AGM, 5%, 11/01/2034 | 30,000 | 33,421 | ||||||
| Palm Beach County, FL, Health Facilities Rev. (Sinai Residences of Boca Raton Project), 7.5%, 6/01/2049 | 150,000 | 168,724 | ||||||
| Pasco County, FL, Bexley Community Development District, Special Assessment Rev., 4.7%, 5/01/2036 | 105,000 | 103,038 | ||||||
| Pasco County, FL, Bexley Community Development District, Special Assessment Rev., 4.875%, 5/01/2047 | 190,000 | 183,890 | ||||||
| Pasco County, FL, Del Webb Bexley Community Development District, Special Assessment Rev., 5.4%, 5/01/2049 | 120,000 | 118,931 | ||||||
| Pasco County, FL, Estancia At Wiregrass Community Development District, Capital Improvement, 7%, 11/01/2045 | 135,000 | 157,272 | ||||||
19
Table of Contents
Portfolio of Investments – continued
| Issuer | Shares/Par | Value ($) | ||||||
| Municipal Bonds - continued | ||||||||
| Florida - continued | ||||||||
| Pasco County, FL, Estancia At Wiregrass Community Development District, Capital Improvement, 5.375%, 11/01/2046 | $ | 95,000 | $ | 96,714 | ||||
| Sarasota County, FL, Health Facility Authority Retirement Facility Improvement Rev. (Village on the Isle Project), “A”, 5%, 1/01/2047 | 70,000 | 71,254 | ||||||
| Sarasota County, FL, Health Facility Authority Retirement Facility Improvement Rev. (Village on the Isle Project), “A”, 5%, 1/01/2052 | 130,000 | 131,893 | ||||||
| South Lake County, FL, Hospital District Rev. (South Lake Hospital), “A”, 6%, 4/01/2029 | 175,000 | 176,767 | ||||||
| South Lake County, FL, Hospital District Rev. (South Lake Hospital), “A”, 6.25%, 4/01/2039 | 100,000 | 101,057 | ||||||
| St. John’s County, FL, Industrial Development Authority Rev. (Presbyterian Retirement), “A”, 6%, 8/01/2045 (Prerefunded 8/01/2020) | 780,000 | 830,092 | ||||||
| Sumter County, FL, Industrial Development Authority Hospital Rev. (Central Florida Health Alliance Projects), “A”, 5%, 7/01/2026 | 25,000 | 27,568 | ||||||
| Sumter County, FL, Industrial Development Authority Hospital Rev. (Central Florida Health Alliance Projects), “A”, 5%, 7/01/2029 | 25,000 | 27,136 | ||||||
| Sumter County, FL, Industrial Development Authority Hospital Rev. (Central Florida Health Alliance Projects), “A”, 5.125%, 7/01/2034 | 50,000 | 53,573 | ||||||
| Sumter County, FL, Industrial Development Authority Hospital Rev. (Central Florida Health Alliance Projects), “A”, 5.25%, 7/01/2044 | 150,000 | 159,556 | ||||||
| Tallahassee, FL, Health Facilities Rev. (Tallahassee Memorial Healthcare, Inc.), “A”, 5%, 12/01/2040 | 430,000 | 456,712 | ||||||
| Tallahassee, FL, Health Facilities Rev. (Tallahassee Memorial Healthcare, Inc.), “A”, 5%, 12/01/2044 | 165,000 | 174,045 | ||||||
| Tampa, FL (University of Tampa Project), 5%, 4/01/2040 | 105,000 | 113,562 | ||||||
| Trout Creek Community Development District, FL, Capital Improvement Rev., 5.5%, 5/01/2035 | 215,000 | 216,602 | ||||||
| Trout Creek Community Development District, FL, Capital Improvement Rev., 5.625%, 5/01/2045 | 390,000 | 391,119 | ||||||
| Tuscany Reserve Community Development District, FL, Special Assessment, “B”, 5.25%, 5/01/2021 | 85,000 | 84,804 | ||||||
| Westridge, FL, Community Development District, Capital Improvement Rev., 5.8%, 5/01/2037 (a)(d) | 1,210,000 | 834,900 | ||||||
|
|
|
|||||||
| $ | 14,798,392 | |||||||
| Georgia - 1.8% | ||||||||
| Americus and Sumter County, GA, Hospital Authority Rev. (Magnolia Manor Obligated Group), “A”, 6.25%, 5/15/2033 | $ | 120,000 | $ | 128,425 | ||||
| Americus and Sumter County, GA, Hospital Authority Rev. (Magnolia Manor Obligated Group), “A”, 6.375%, 5/15/2043 | 120,000 | 128,326 | ||||||
| Atlanta, GA, Water & Wastewater Rev., “A”, 6%, 11/01/2022 (Prerefunded 11/01/2019) | 465,000 | 482,293 | ||||||
20
Table of Contents
Portfolio of Investments – continued
| Issuer | Shares/Par | Value ($) | ||||||
| Municipal Bonds - continued | ||||||||
| Georgia - continued | ||||||||
| Clayton County, GA, Development Authority Special Facilities Rev. (Delta Airlines, Inc.), “A”, 8.75%, 6/01/2029 | $ | 255,000 | $ | 277,249 | ||||
| Cobb County, GA, Development Authority, Student Housing Rev. (Kennesaw State University Real Estate Foundations), “C”, 5%, 7/15/2038 | 110,000 | 114,579 | ||||||
| Cobb County, GA, Development Authority, Student Housing Rev. (Kennesaw State University Real Estate Foundations), “C”, 5%, 7/15/2030 | 60,000 | 64,500 | ||||||
| Cobb County, GA, Development Authority, Student Housing Rev. (Kennesaw State University Real Estate Foundations), “C”, 5%, 7/15/2033 | 105,000 | 111,609 | ||||||
| Georgia Main Street Natural Gas, Inc., Gas Project Rev., “A”, 5%, 3/15/2022 | 830,000 | 894,922 | ||||||
| Georgia Main Street Natural Gas, Inc., Gas Project Rev., “A”, 5.5%, 9/15/2028 | 430,000 | 506,321 | ||||||
| Marietta, GA, Development Facilities Authority Rev. (Life University, Inc. Project), “A”, 5%, 11/01/2037 | 155,000 | 160,630 | ||||||
| Marietta, GA, Development Facilities Authority Rev. (Life University, Inc. Project), “A”, 5%, 11/01/2047 | 110,000 | 113,019 | ||||||
|
|
|
|||||||
| $ | 2,981,873 | |||||||
| Guam - 0.6% | ||||||||
| Guam Government Department of Education (John F. Kennedy High School), “A”, COP, 6.625%, 12/01/2030 | $ | 245,000 | $ | 249,483 | ||||
| Guam Government Department of Education (John F. Kennedy High School), “A”, COP, 6.875%, 12/01/2040 | 630,000 | 645,328 | ||||||
| Guam Government, “A”, 7%, 11/15/2039 (Prerefunded 11/15/2019) | 110,000 | 115,187 | ||||||
|
|
|
|||||||
| $ | 1,009,998 | |||||||
| Hawaii - 1.1% | ||||||||
| Hawaii Department of Budget & Finance, Special Purpose Rev. (15 Craigside Project), “A”, 8.75%, 11/15/2029 (Prerefunded 11/15/2019) | $ | 100,000 | $ | 106,251 | ||||
| Hawaii Department of Budget & Finance, Special Purpose Rev. (15 Craigside Project), “A”, 9%, 11/15/2044 (Prerefunded 11/15/2019) | 180,000 | 191,813 | ||||||
| Hawaii Department of Budget & Finance, Special Purpose Rev. (Chaminade University), 5%, 1/01/2030 | 150,000 | 150,384 | ||||||
| Hawaii Department of Budget & Finance, Special Purpose Rev. (Chaminade University), 5%, 1/01/2045 | 125,000 | 116,883 | ||||||
| Hawaii Department of Budget & Finance, Special Purpose Rev. (Hawaiian Electric Co. & Subsidiary), 6.5%, 7/01/2039 | 950,000 | 971,755 | ||||||
| State of Hawaii, “DZ”, 5%, 12/01/2031 (Prerefunded 12/01/2021) | 160,000 | 173,192 | ||||||
| State of Hawaii, “DZ”, 5%, 12/01/2031 (Prerefunded 12/01/2021) | 95,000 | 103,121 | ||||||
|
|
|
|||||||
| $ | 1,813,399 | |||||||
21
Table of Contents
Portfolio of Investments – continued
| Issuer | Shares/Par | Value ($) | ||||||
| Municipal Bonds - continued | ||||||||
| Idaho - 1.4% | ||||||||
| Idaho Health Facilities Authority Rev. (IHC Hospitals, Inc.), ETM, 6.65%, 2/15/2021 | $ | 1,750,000 | $ | 1,922,410 | ||||
| Idaho Health Facilities Authority Rev. (Madison Memorial Hospital Project), 5%, 9/01/2037 | 50,000 | 52,243 | ||||||
| Idaho Health Facilities Authority Rev. (St. Luke’s Health System Project), “A”, 4%, 3/01/2038 | 230,000 | 226,352 | ||||||
| Idaho Housing and Finance Association Nonprofit Facilities Rev. (Compass Public Charter School, Inc. Project), “A”, 6%, 7/01/2049 | 100,000 | 102,630 | ||||||
|
|
|
|||||||
| $ | 2,303,635 | |||||||
| Illinois - 17.0% | ||||||||
| Bolingbrook, IL, Sales Tax Rev., 6.25%, 1/01/2024 | $ | 545,000 | $ | 533,986 | ||||
| Chicago, IL, “A”, 5.25%, 1/01/2028 | 40,000 | 42,050 | ||||||
| Chicago, IL, “A”, 5%, 1/01/2036 | 130,000 | 132,561 | ||||||
| Chicago, IL, “A”, AGM, 5%, 1/01/2027 | 25,000 | 25,174 | ||||||
| Chicago, IL, “A”, AGM, 5%, 1/01/2028 (Prerefunded 1/01/2020) | 560,000 | 574,084 | ||||||
| Chicago, IL, “A”, AGM, 4.75%, 1/01/2030 | 30,000 | 30,098 | ||||||
| Chicago, IL, “A”, AGM, 4.625%, 1/01/2031 | 40,000 | 40,125 | ||||||
| Chicago, IL, “A”, AGM, 5%, 1/01/2037 | 390,000 | 392,660 | ||||||
| Chicago, IL, “C”, NATL, 5%, 1/01/2029 | 15,000 | 15,037 | ||||||
| Chicago, IL, “D”, 5.5%, 1/01/2033 | 110,000 | 116,205 | ||||||
| Chicago, IL, Board of Education (School Reform), “A”, NATL, 5.25%, 12/01/2023 | 625,000 | 671,844 | ||||||
| Chicago, IL, Board of Education (School Reform), Capital Appreciation, “B-1”, NATL, 0%, 12/01/2019 | 80,000 | 77,847 | ||||||
| Chicago, IL, Board of Education (School Reform), Capital Appreciation, “B-1”, NATL, 0%, 12/01/2028 | 315,000 | 204,114 | ||||||
| Chicago, IL, Board of Education, Dedicated Capital Improvement Tax Bond, 5%, 4/01/2046 | 105,000 | 110,242 | ||||||
| Chicago, IL, Board of Education, Dedicated Capital Improvement Tax Bond, 6%, 4/01/2046 | 1,225,000 | 1,385,830 | ||||||
| Chicago, IL, Board of Education, Unlimited Tax General Obligation Dedicated Rev., “C”, AGM, 5%, 12/01/2030 | 215,000 | 236,049 | ||||||
| Chicago, IL, Board of Education, Unlimited Tax General Obligation Dedicated Rev., “C”, AGM, 5%, 12/01/2031 | 410,000 | 448,716 | ||||||
| Chicago, IL, Board of Education, Unlimited Tax General Obligation Dedicated Rev., “C”, AGM, 5%, 12/01/2032 | 350,000 | 382,441 | ||||||
| Chicago, IL, Board of Education, Unlimited Tax General Obligation Refunding Dedicated Rev., “A”, 7%, 12/01/2046 | 405,000 | 467,848 | ||||||
| Chicago, IL, Board of Education, Unlimited Tax General Obligation Refunding Dedicated Rev., “A”, AGM, 5%, 12/01/2029 | 140,000 | 154,840 | ||||||
| Chicago, IL, Board of Education, Unlimited Tax General Obligation Refunding Dedicated Rev., “A”, AGM, 5%, 12/01/2035 | 135,000 | 145,568 | ||||||
22
Table of Contents
Portfolio of Investments – continued
| Issuer | Shares/Par | Value ($) | ||||||
| Municipal Bonds - continued | ||||||||
| Illinois - continued | ||||||||
| Chicago, IL, Board of Education, Unlimited Tax General Obligation Refunding Dedicated Rev., “G”, 5%, 12/01/2034 | $ | 315,000 | $ | 319,095 | ||||
| Chicago, IL, Board of Education, Unlimited Tax General Obligation Refunding Dedicated Rev., “H”, 5%, 12/01/2036 | 475,000 | 479,451 | ||||||
| Chicago, IL, Board of Education, Unlimited Tax General Obligation Refunding Dedicated Rev., “H”, 5%, 12/01/2046 | 305,000 | 298,699 | ||||||
| Chicago, IL, General Obligation, “A”, 6%, 1/01/2038 | 340,000 | 376,866 | ||||||
| Chicago, IL, Greater Chicago Metropolitan Water Reclamation District, “C”, 5%, 12/01/2030 | 1,000,000 | 1,064,450 | ||||||
| Chicago, IL, O’Hare International Airport Rev., Special Facilities, 5%, 7/01/2033 | 435,000 | 479,866 | ||||||
| Chicago, IL, O’Hare International Airport Rev., Special Facilities, 5%, 7/01/2038 | 380,000 | 411,859 | ||||||
| Chicago, IL, O’Hare International Airport Rev., Special Facilities, 5%, 7/01/2048 | 310,000 | 331,396 | ||||||
| Chicago, IL, O’Hare International Airport Rev., Customer Facility Charge, AGM, 5.25%, 1/01/2032 | 95,000 | 103,967 | ||||||
| Chicago, IL, O’Hare International Airport Rev., Customer Facility Charge, AGM, 5.25%, 1/01/2033 | 50,000 | 54,619 | ||||||
| Chicago, IL, O’Hare International Airport Rev., Customer Facility Charge, AGM, 5.5%, 1/01/2043 | 190,000 | 207,987 | ||||||
| Chicago, IL, Transit Authority Sales Tax Receipts Rev., 5.25%, 12/01/2029 | 215,000 | 228,672 | ||||||
| Chicago, IL, Transit Authority Sales Tax Receipts Rev., 5.25%, 12/01/2030 | 430,000 | 456,836 | ||||||
| Chicago, IL, Transit Authority Sales Tax Receipts Rev., 5.25%, 12/01/2031 | 80,000 | 84,898 | ||||||
| Cook County, IL, 5%, 11/15/2034 | 50,000 | 54,368 | ||||||
| Cook County, IL, 5%, 11/15/2035 | 180,000 | 195,206 | ||||||
| Cook County, IL, Community College District 508 (City Colleges), BAM, 5%, 12/01/2047 | 580,000 | 613,112 | ||||||
| Du Page County, IL, Special Service Area No. 31 Special Tax (Monarch Landing Project), 5.625%, 3/01/2036 | 227,000 | 227,068 | ||||||
| Illinois Finance Authority Rev. (Edward-Elmhurst Healthcare), “A”, 5%, 1/01/2034 | 165,000 | 178,680 | ||||||
| Illinois Finance Authority Rev. (Edward-Elmhurst Healthcare), “A”, 5%, 1/01/2035 | 165,000 | 177,738 | ||||||
| Illinois Finance Authority Rev. (Evangelical Retirement Homes of Greater Chicago, Inc.), 7.25%, 2/15/2045 (Prerefunded 2/15/2020) | 1,050,000 | 1,113,556 | ||||||
| Illinois Finance Authority Rev. (Franciscan Communities, Inc.), “A”, 4.75%, 5/15/2033 | 245,000 | 245,772 | ||||||
| Illinois Finance Authority Rev. (Franciscan Communities, Inc.), “A”, 5.125%, 5/15/2043 | 265,000 | 269,677 | ||||||
23
Table of Contents
Portfolio of Investments – continued
| Issuer | Shares/Par | Value ($) | ||||||
| Municipal Bonds - continued | ||||||||
| Illinois - continued | ||||||||
| Illinois Finance Authority Rev. (Lutheran Home & Services), 5.5%, 5/15/2027 | $ | 35,000 | $ | 36,354 | ||||
| Illinois Finance Authority Rev. (Lutheran Home & Services), 5.625%, 5/15/2042 | 260,000 | 264,586 | ||||||
| Illinois Finance Authority Rev. (Presence Health Network), “A”, 7.75%, 8/15/2034 (Prerefunded 8/15/2019) | 615,000 | 639,292 | ||||||
| Illinois Finance Authority Rev. (Presence Health Network), “C”, 5%, 2/15/2036 | 195,000 | 216,544 | ||||||
| Illinois Finance Authority Rev. (Presence Health Network), “C”, 4%, 2/15/2041 | 660,000 | 650,126 | ||||||
| Illinois Finance Authority Rev. (Presence Health Network), “C”, 5%, 2/15/2041 | 400,000 | 437,552 | ||||||
| Illinois Finance Authority Rev. (Rehabilitation Institute of Chicago), “A”, 6%, 7/01/2043 | 255,000 | 277,904 | ||||||
| Illinois Finance Authority Rev. (Roosevelt University Project), 6.25%, 4/01/2029 | 590,000 | 610,691 | ||||||
| Illinois Finance Authority Rev. (Rosalind Franklin University), “A”, 5%, 8/01/2042 | 45,000 | 47,756 | ||||||
| Illinois Finance Authority Rev. (Rosalind Franklin University), “A”, 5%, 8/01/2047 | 65,000 | 68,642 | ||||||
| Illinois Finance Authority Rev. (Rosalind Franklin University, Research Building Project), “C”, 5%, 8/01/2046 | 50,000 | 52,876 | ||||||
| Illinois Finance Authority Rev. (Rosalind Franklin University, Research Building Project), “C”, 5%, 8/01/2049 | 70,000 | 73,766 | ||||||
| Illinois Finance Authority Rev. (Silver Cross Hospital & Medical Centers), 6.875%, 8/15/2038 (Prerefunded 8/15/2019) | 615,000 | 635,762 | ||||||
| Illinois Finance Authority Rev. (Silver Cross Hospital & Medical Centers), “C”, 5%, 8/15/2035 | 530,000 | 569,299 | ||||||
| Illinois Finance Authority Rev. (Southern Illinois Healthcare Enterprises, Inc.), “C”, 5%, 3/01/2034 | 5,000 | 5,471 | ||||||
| Illinois Finance Authority Rev., Friendship Village of Schaumburg, 5%, 2/15/2037 | 805,000 | 736,511 | ||||||
| Illinois Finance Authority Student Housing and Academic Facility Rev. (CHF-Chicago, LLC-University of Illinois at Chicago Project), “A”, 5%, 2/15/2037 | 30,000 | 31,799 | ||||||
| Illinois Finance Authority Student Housing and Academic Facility Rev. (CHF-Chicago, LLC-University of Illinois at Chicago Project), “A”, 5%, 2/15/2047 | 60,000 | 62,928 | ||||||
| Illinois Finance Authority Student Housing and Academic Facility Rev. (CHF-Chicago, LLC-University of Illinois at Chicago Project), “A”, 5%, 2/15/2050 | 25,000 | 26,128 | ||||||
| Illinois Finance Authority Student Housing Rev. (Northern Illinois University Project), 6.625%, 10/01/2031 | 785,000 | 834,942 | ||||||
24
Table of Contents
Portfolio of Investments – continued
| Issuer | Shares/Par | Value ($) | ||||||
| Municipal Bonds - continued | ||||||||
| Illinois - continued | ||||||||
| Illinois Railsplitter Tobacco Settlement Authority Rev., 6%, 6/01/2028 (Prerefunded 6/01/2021) | $ | 1,710,000 | $ | 1,868,449 | ||||
| Lincolnshire, IL, Special Service Area No. 1 (Sedgebrook Project), 6.25%, 3/01/2034 | 365,000 | 365,602 | ||||||
| Metropolitan Pier & Exposition Authority Refunding Bonds (McCormick Place Expansion Project), “B-1”, Capital Appreciation, AGM, 0%, 6/15/2047 | 1,650,000 | 420,436 | ||||||
| Metropolitan Pier & Exposition Authority Refunding Bonds (McCormick Place Expansion Project), “A”, Capital Appreciation, AGM, 0%, 6/15/2026 | 195,000 | 145,893 | ||||||
| Romeoville, IL, Rev. (Lewis University Project), “A”, 5%, 10/01/2042 | 165,000 | 171,235 | ||||||
| Romeoville, IL, Rev. (Lewis University Project), “B”, 5%, 10/01/2039 | 90,000 | 93,755 | ||||||
| Romeoville, IL, Rev. (Lewis University Project), “B”, 4.125%, 10/01/2041 | 60,000 | 56,399 | ||||||
| Romeoville, IL, Rev. (Lewis University Project), “B”, 4.125%, 10/01/2046 | 70,000 | 64,704 | ||||||
| State of Illinois, 5%, 6/01/2020 | 335,000 | 344,849 | ||||||
| State of Illinois, 5%, 11/01/2027 | 585,000 | 619,462 | ||||||
| State of Illinois, 4.125%, 11/01/2031 | 115,000 | 109,831 | ||||||
| State of Illinois, 4.5%, 11/01/2039 | 160,000 | 153,702 | ||||||
| State of Illinois, AGM, 5%, 2/01/2027 | 145,000 | 157,315 | ||||||
| State of Illinois, NATL, 6%, 11/01/2026 | 405,000 | 457,982 | ||||||
| State of Illinois, “D”, 5%, 11/01/2028 | 570,000 | 600,974 | ||||||
| University of Illinois Rev. (Auxiliary Facilities Systems), “A”, 5.125%, 4/01/2029 (Prerefunded 4/01/2019) | 1,370,000 | 1,384,152 | ||||||
| Upper Illinois River Valley Development Authority Multifamily Housing Rev. (Prairie View and Timber Oaks Apartments), 5%, 12/01/2043 | 245,000 | 244,304 | ||||||
|
|
|
|||||||
| $ | 27,699,130 | |||||||
| Indiana - 2.3% | ||||||||
| Indiana Finance Authority Health Facilities Rev. (Baptist Healthcare System Obligated Group), 5%, 8/15/2051 | $ | 235,000 | $ | 243,314 | ||||
| Indiana Finance Authority Rev. (BHI Senior Living), “A”, 6%, 11/15/2041 | 350,000 | 387,915 | ||||||
| Indiana Finance Authority Rev. (Marquette Project), “A”, 5%, 3/01/2030 | 50,000 | 52,622 | ||||||
| Indiana Finance Authority Rev. (Marquette Project), “A”, 5%, 3/01/2039 | 125,000 | 129,391 | ||||||
| Indiana Finance Authority Rev. (Ohio River Bridges East End Crossing Project), “A”, 5%, 7/01/2035 | 235,000 | 247,641 | ||||||
| Indiana Finance Authority Rev. (Ohio River Bridges East End Crossing Project), “A”, 5%, 7/01/2040 | 590,000 | 618,450 | ||||||
25
Table of Contents
Portfolio of Investments – continued
| Issuer | Shares/Par | Value ($) | ||||||
| Municipal Bonds - continued | ||||||||
| Indiana - continued | ||||||||
| Indiana Finance Authority Rev. (Ohio River Bridges East End Crossing Project), “A”, 5%, 7/01/2044 | $ | 155,000 | $ | 162,011 | ||||
| Knox County, IN, Economic Development Rev. (Good Samaritan Hospital), “A”, 5%, 4/01/2042 | 130,000 | 133,028 | ||||||
| Lake County, IN, Hammond Multi-School Building Corp., 5%, 7/15/2032 | 35,000 | 39,142 | ||||||
| Lake County, IN, Hammond Multi-School Building Corp., 5%, 7/15/2033 | 25,000 | 27,818 | ||||||
| Lake County, IN, Hammond Multi-School Building Corp., 5%, 7/15/2035 | 35,000 | 38,625 | ||||||
| Lake County, IN, Hammond Multi-School Building Corp., 5%, 7/15/2038 | 100,000 | 109,368 | ||||||
| University of Southern Indiana Rev. (Student Fee), “J”, ASSD GTY, 5.75%, 10/01/2028 (Prerefunded 10/01/2019) | 370,000 | 381,625 | ||||||
| Valparaiso, IN, Exempt Facilities Rev. (Pratt Paper LLC Project), 6.75%, 1/01/2034 | 325,000 | 370,633 | ||||||
| Valparaiso, IN, Exempt Facilities Rev. (Pratt Paper LLC Project), 7%, 1/01/2044 | 750,000 | 859,425 | ||||||
|
|
|
|||||||
| $ | 3,801,008 | |||||||
| Iowa - 0.4% | ||||||||
| Iowa Student Loan Liquidity Corp. Rev., “A”, 3.75%, 12/01/2033 | $ | 330,000 | $ | 322,453 | ||||
| Iowa Student Loan Liquidity Corp. Rev., “A-1”, 4.625%, 12/01/2019 | 70,000 | 71,181 | ||||||
| Iowa Student Loan Liquidity Corp. Rev., “A-1”, 4.875%, 12/01/2020 | 15,000 | 15,388 | ||||||
| Iowa Student Loan Liquidity Corp. Rev., “A-2”, 5.5%, 12/01/2025 | 55,000 | 56,845 | ||||||
| Iowa Student Loan Liquidity Corp. Rev., “A-2”, 5.6%, 12/01/2026 | 55,000 | 56,837 | ||||||
| Iowa Student Loan Liquidity Corp. Rev., “A-2”, 5.7%, 12/01/2027 | 10,000 | 10,328 | ||||||
| Iowa Student Loan Liquidity Corp. Rev., “A-2”, 5.75%, 12/01/2028 | 100,000 | 103,217 | ||||||
|
|
|
|||||||
| $ | 636,249 | |||||||
| Kansas - 1.1% | ||||||||
| Coffeyville, KS, Electric Utility System Rev., “B”, NATL, 5%, 6/01/2038 | $ | 300,000 | $ | 322,518 | ||||
| Coffeyville, KS, Electric Utility System Rev., “B”, NATL, 5%, 6/01/2042 | 100,000 | 107,746 | ||||||
| Hutchinson, KS, Hospital Facilities Rev. (Hutchinson Regional | ||||||||
| Medical Center, Inc.), 5%, 12/01/2036 | 50,000 | 52,598 | ||||||
| Hutchinson, KS, Hospital Facilities Rev. (Hutchinson Regional | ||||||||
| Medical Center, Inc.), 5%, 12/01/2041 | 50,000 | 51,920 | ||||||
| Lenexa, KS, Health Care Facility Rev. (Lakeview Village, Inc.), “A”, 5%, 5/15/2030 | 55,000 | 58,093 | ||||||
| Lenexa, KS, Health Care Facility Rev. (Lakeview Village, Inc.), “A”, 5%, 5/15/2032 | 50,000 | 52,376 | ||||||
26
Table of Contents
Portfolio of Investments – continued
| Issuer | Shares/Par | Value ($) | ||||||
| Municipal Bonds - continued | ||||||||
| Kansas - continued | ||||||||
| Lenexa, KS, Health Care Facility Rev. (Lakeview Village, Inc.), “A”, 5%, 5/15/2039 | $ | 65,000 | $ | 66,174 | ||||
| Wichita, KS, Health Care Facilities Rev. (Kansas Masonic Home), “II-A”, 5%, 12/01/2031 | 35,000 | 35,623 | ||||||
| Wichita, KS, Health Care Facilities Rev. (Presbyterian Manors, Inc.), “A”, 6.375%, 5/15/2043 | 200,000 | 211,736 | ||||||
| Wichita, KS, Health Care Facilities Rev. (Presbyterian Manors, Inc.), “I”, 5%, 5/15/2047 | 195,000 | 196,162 | ||||||
| Wichita, KS, Sales Tax Special Obligations Rev. (K-96 Greenwich Star Bond Project), 3%, 9/01/2023 | 100,000 | 99,472 | ||||||
| Wichita, KS, Sales Tax Special Obligations Rev. (K-96 Greenwich Star Bond Project), 4.2%, 9/01/2027 | 190,000 | 188,343 | ||||||
| Wyandotte County, KS, Unified Government Community Improvement District Sales Tax Rev. (Legends Apartments Garage & West Lawn Project), 4.5%, 6/01/2040 | 80,000 | 77,850 | ||||||
| Wyandotte County/Kansas City, KS, Unified Government Utility System Improvement Rev., “A”, 5%, 9/01/2044 | 255,000 | 277,272 | ||||||
|
|
|
|||||||
| $ | 1,797,883 | |||||||
| Kentucky - 2.4% | ||||||||
| Commonwealth of Kentucky State Property & Buildings Commission Rev. (Project No. 119), BAM, 5%, 5/01/2032 | $ | 50,000 | $ | 56,345 | ||||
| Commonwealth of Kentucky State Property & Buildings Commission Rev. (Project No. 119), BAM, 5%, 5/01/2033 | 45,000 | 50,487 | ||||||
| Commonwealth of Kentucky State Property & Buildings Commission Rev. (Project No. 119), BAM, 5%, 5/01/2034 | 55,000 | 61,450 | ||||||
| Kentucky Economic Development Finance Authority Healthcare Facilities Rev. (Baptist Life Communities Project), “A”, 6.25%, 11/15/2046 | 355,000 | 338,358 | ||||||
| Kentucky Economic Development Finance Authority Healthcare Facilities Rev. (Baptist Life Communities Project), “A”, 6.375%, 11/15/2051 | 340,000 | 324,506 | ||||||
| Kentucky Economic Development Finance Authority Healthcare Facilities Rev. (Masonic Homes of Kentucky, Inc.), 5.375%, 11/15/2042 | 225,000 | 230,897 | ||||||
| Kentucky Economic Development Finance Authority Healthcare Facilities Rev. (Masonic Homes of Kentucky, Inc.), 5.5%, 11/15/2045 | 95,000 | 97,775 | ||||||
| Kentucky Economic Development Finance Authority Hospital Rev. (Baptist Healthcare System), “B”, 5%, 8/15/2037 | 40,000 | 42,190 | ||||||
| Kentucky Economic Development Finance Authority Hospital Rev. (Baptist Healthcare System), “B”, 5%, 8/15/2041 | 315,000 | 328,832 | ||||||
| Kentucky Economic Development Finance Authority Hospital Rev. (Baptist Healthcare System), “B”, 5%, 8/15/2046 | 205,000 | 213,058 | ||||||
27
Table of Contents
Portfolio of Investments – continued
| Issuer | Shares/Par | Value ($) | ||||||
| Municipal Bonds - continued | ||||||||
| Kentucky - continued | ||||||||
| Kentucky Economic Development Finance Authority Hospital Rev. (Owensboro Health, Inc.), “A”, 5%, 6/01/2037 | $ | 160,000 | $ | 167,280 | ||||
| Kentucky Economic Development Finance Authority Hospital Rev. (Owensboro Health, Inc.), “A”, 5%, 6/01/2041 | 105,000 | 108,890 | ||||||
| Kentucky Economic Development Finance Authority Hospital Rev. (Owensboro Health, Inc.), “A”, 5.25%, 6/01/2041 | 80,000 | 84,076 | ||||||
| Kentucky Economic Development Finance Authority Hospital Rev. (Owensboro Health, Inc.), “A”, 5%, 6/01/2045 | 135,000 | 139,726 | ||||||
| Kentucky Economic Development Finance Authority Hospital Rev. (Owensboro Medical Health System, Inc.), “A”, 6.375%, 6/01/2040 (Prerefunded 6/01/2020) | 735,000 | 781,687 | ||||||
| Kentucky Economic Development Finance Authority Rev. (Masonic Home Independent Living II, Inc. - The Meadow Project and Grove Pointe Project), “A”, 5%, 5/15/2036 | 140,000 | 144,028 | ||||||
| Kentucky Economic Development Finance Authority Rev. (Masonic Home Independent Living II, Inc. - The Meadow Project and Grove Pointe Project), “A”, 5%, 5/15/2046 | 395,000 | 401,620 | ||||||
| Kentucky Economic Development Finance Authority Rev. (Masonic Home Independent Living II, Inc. - The Meadow Project and Grove Pointe Project), “A”, 5%, 5/15/2051 | 100,000 | 101,362 | ||||||
| Owen County, KY, Waterworks System Rev. (American Water Co. Project), “A”, 6.25%, 6/01/2039 | 260,000 | 265,424 | ||||||
|
|
|
|||||||
| $ | 3,937,991 | |||||||
| Louisiana - 3.7% | ||||||||
| Jefferson Parish, LA, Hospital Service District No. 2 Hospital Rev. (East Jefferson General Hospital), 6.25%, 7/01/2031 | $ | 380,000 | $ | 373,897 | ||||
| Jefferson Parish, LA, Hospital Service District No. 2 Hospital Rev. (East Jefferson General Hospital), 6.375%, 7/01/2041 | 240,000 | 230,856 | ||||||
| Louisiana Local Government, Environmental Facilities & Community Development Authority Rev. (Cameron Parish, Louisiana Gomesa Project), 5.65%, 11/01/2037 | 100,000 | 100,976 | ||||||
| Louisiana Local Government, Environmental Facilities & Community Development Authority Rev. (CDF Healthcare), “A”, 5.625%, 6/01/2045 | 610,000 | 611,806 | ||||||
| Louisiana Local Government, Environmental Facilities & Community Development Authority Rev. (St. James Place of Baton Rouge Project), “A”, 6%, 11/15/2035 | 105,000 | 112,302 | ||||||
| Louisiana Local Government, Environmental Facilities & Community Development Authority Rev. (St. James Place of Baton Rouge Project), “A”, 6.25%, 11/15/2045 | 420,000 | 452,777 | ||||||
| Louisiana Local Government, Environmental Facilities & Community Development Authority Rev. (Tangipahoa Parish, Louisiana Gomesa Project), 5.375%, 11/01/2038 | 115,000 | 115,036 | ||||||
28
Table of Contents
Portfolio of Investments – continued
| Issuer | Shares/Par | Value ($) | ||||||
| Municipal Bonds - continued | ||||||||
| Louisiana - continued | ||||||||
| Louisiana Local Government, Environmental Facilities & Community Development Authority Rev. (Terrebonne Parish, Louisiana Gomesa Project), 5.5%, 11/01/2039 | $ | 105,000 | $ | 105,795 | ||||
| Louisiana Local Government, Environmental Facilities & Community Development Authority Rev. (Westside Rehab Center Project), “A”, 6.125%, 2/01/2037 | 240,000 | 246,559 | ||||||
| Louisiana Local Government, Environmental Facilities & Community Development Authority Rev. (Westside Rehab Center Project), “A”, 6.25%, 2/01/2047 | 185,000 | 189,956 | ||||||
| Louisiana Military Department Custody Receipts, 5%, 8/01/2024 | 1,500,000 | 1,507,515 | ||||||
| Louisiana Public Facilities Authority Hospital Rev. (Lake Charles Memorial Hospital), 6.375%, 12/01/2034 | 775,000 | 803,132 | ||||||
| New Orleans, LA, Sewerage Service Rev., 5%, 12/01/2040 | 80,000 | 86,762 | ||||||
| New Orleans, LA, Sewerage Service Rev., 5%, 6/01/2045 | 220,000 | 235,990 | ||||||
| New Orleans, LA, Sewerage Service Rev., 5%, 12/01/2045 | 95,000 | 102,059 | ||||||
| St. Charles Parish, LA, Gulf Zone Opportunity Zone Rev. (Valero Energy Corp.), 4%, 12/01/2040 (Put Date 6/01/2022) | 760,000 | 790,651 | ||||||
|
|
|
|||||||
| $ | 6,066,069 | |||||||
| Maine - 0.3% | ||||||||
| Maine Finance Authority Solid Waste Disposal Rev. (Casella Waste Systems, Inc.), “R-2”, 4.375%, 8/01/2035 (Put Date 8/01/2025) | $ | 160,000 | $ | 157,856 | ||||
| Maine Finance Authority Solid Waste Disposal Rev. (Casella Waste Systems, Inc.), “R-3”, 5.25%, 1/01/2025 | 365,000 | 384,349 | ||||||
|
|
|
|||||||
| $ | 542,205 | |||||||
| Maryland - 1.8% | ||||||||
| Baltimore, MD, Convention Center Hotel Rev., 5%, 9/01/2039 | $ | 115,000 | $ | 121,322 | ||||
| Baltimore, MD, Convention Center Hotel Rev., 5%, 9/01/2042 | 100,000 | 104,901 | ||||||
| Baltimore, MD, Convention Center Hotel Rev., 5%, 9/01/2046 | 165,000 | 172,597 | ||||||
| Howard County, MD, Special Obligation (Downtown Columbia Project), “A”, 4.5%, 2/15/2047 | 145,000 | 142,039 | ||||||
| Maryland Economic Development Corp. Rev. (Port America Chesapeake Terminal Project), “B”, 5.375%, 6/01/2025 (Prerefunded 6/01/2020) | 125,000 | 131,301 | ||||||
| Maryland Economic Development Corp., Subordinate Parking Facilities Rev. (Baltimore City Project), “C”, 4%, 6/01/2038 | 10,000 | 9,607 | ||||||
| Maryland Economic Development Corp., Subordinate Parking Facilities Rev. (Baltimore City Project), “C”, 4%, 6/01/2048 | 30,000 | 28,254 | ||||||
| Maryland Economic Development Corp., Subordinate Parking Facilities Rev. (Baltimore City Project), “C”, 4%, 6/01/2058 | 120,000 | 107,545 | ||||||
| Maryland Health & Higher Educational Facilities Authority Rev. (Adventist Healthcare Issue), “A”, 5.5%, 1/01/2036 | 190,000 | 213,041 | ||||||
29
Table of Contents
Portfolio of Investments – continued
| Issuer | Shares/Par | Value ($) | ||||||
| Municipal Bonds - continued | ||||||||
| Maryland - continued | ||||||||
| Maryland Health & Higher Educational Facilities Authority Rev. (Anne Arundel Health System, Inc.), “A”, 6.75%, 7/01/2039 (Prerefunded 7/01/2019) | $ | 945,000 | $ | 970,902 | ||||
| Maryland Health & Higher Educational Facilities Authority Rev. (Doctors Community Hospital), “A”, 5%, 7/01/2033 | 115,000 | 124,934 | ||||||
| Maryland Health & Higher Educational Facilities Authority Rev. (Doctors Community Hospital), “A”, 5%, 7/01/2034 | 70,000 | 75,711 | ||||||
| Maryland Health & Higher Educational Facilities Authority Rev. (Doctors Community Hospital), “A”, 5%, 7/01/2038 | 315,000 | 336,407 | ||||||
| Prince George’s County, MD, Special Obligation Bonds (Westphalia Town Center Project), 5.25%, 7/01/2048 | 100,000 | 98,082 | ||||||
| Rockville, MD, Mayor & Council Economic Development Refunding Rev. (Ingleside at King Farm Project), “A-1”, 5%, 11/01/2037 | 45,000 | 46,535 | ||||||
| Rockville, MD, Mayor & Council Economic Development Rev. (Ingleside at King Farm Project), “B”, 5%, 11/01/2042 | 85,000 | 87,208 | ||||||
| Rockville, MD, Mayor & Council Economic Development Rev. (Ingleside at King Farm Project), “B”, 5%, 11/01/2047 | 90,000 | 92,009 | ||||||
|
|
|
|||||||
| $ | 2,862,395 | |||||||
| Massachusetts - 4.3% | ||||||||
| Boston, MA, Metropolitan Transit Parking Corp., Systemwide Parking Rev., 5.25%, 7/01/2036 | $ | 370,000 | $ | 393,406 | ||||
| Massachusetts Development Finance Agency Rev. (Adventcare), “A”, 6.75%, 10/15/2037 | 895,000 | 896,011 | ||||||
| Massachusetts Development Finance Agency Rev. (Linden Ponds, Inc.), “A-1”, 6.25%, 11/15/2031 | 168,995 | 177,994 | ||||||
| Massachusetts Development Finance Agency Rev. (Linden Ponds, Inc.), “A-1”, 6.25%, 11/15/2039 | 42,309 | 44,562 | ||||||
| Massachusetts Development Finance Agency Rev. (Linden Ponds, Inc.), Capital Appreciation, “B”, 0%, 11/15/2056 | 56,165 | 10,493 | ||||||
| Massachusetts Development Finance Agency Rev. (Newbridge On The Charles, Inc.), 5%, 10/01/2047 | 100,000 | 101,131 | ||||||
| Massachusetts Development Finance Agency Rev. (Newbridge On The Charles, Inc.), 5%, 10/01/2057 | 255,000 | 256,066 | ||||||
| Massachusetts Development Finance Agency Rev. (North Hill Communities), “A”, 6.25%, 11/15/2033 (Prerefunded 11/15/2023) | 100,000 | 118,215 | ||||||
| Massachusetts Development Finance Agency Rev. (North Hill Communities), “A”, 6.5%, 11/15/2043 (Prerefunded 11/15/2023) | 135,000 | 161,368 | ||||||
| Massachusetts Development Finance Agency Rev. (Suffolk University), 5%, 7/01/2033 | 40,000 | 43,975 | ||||||
| Massachusetts Development Finance Agency Rev. (Suffolk University), 5%, 7/01/2034 | 50,000 | 54,738 | ||||||
| Massachusetts Development Finance Agency Rev. (Suffolk University), 5%, 7/01/2035 | 25,000 | 27,273 | ||||||
30
Table of Contents
Portfolio of Investments – continued
| Issuer | Shares/Par | Value ($) | ||||||
| Municipal Bonds - continued | ||||||||
| Massachusetts - continued | ||||||||
| Massachusetts Development Finance Agency Rev. (The Broad Institute, Inc.), “A”, 5.25%, 4/01/2037 (Prerefunded 4/01/2021) | $ | 710,000 | $ | 761,475 | ||||
| Massachusetts Development Finance Agency Rev. (Tufts Medical Center), “I”, 7.25%, 1/01/2032 (Prerefunded 1/01/2021) | 330,000 | 363,756 | ||||||
| Massachusetts Development Finance Agency Rev. (Tufts Medical Center), “I”, 7.25%, 1/01/2032 | 225,000 | 247,426 | ||||||
| Massachusetts Development Finance Agency Rev. (UMass Memorial Health Care Obligated Group), “I”, 5%, 7/01/2036 | 145,000 | 157,370 | ||||||
| Massachusetts Development Finance Agency, Solid Waste Disposal Rev. (Dominion Energy Brayton), 5.75%, 12/01/2042 (Prerefunded 5/01/2019) | 105,000 | 106,691 | ||||||
| Massachusetts Educational Financing Authority, Education Loan Rev, “A”, 4.25%, 1/01/2030 | 95,000 | 96,618 | ||||||
| Massachusetts Educational Financing Authority, Education Loan Rev, “A”, 4.25%, 1/01/2031 | 65,000 | 65,922 | ||||||
| Massachusetts Educational Financing Authority, Education Loan Rev., “Issue E”, “C”, 4.125%, 7/01/2046 | 405,000 | 391,894 | ||||||
| Massachusetts Educational Financing Authority, Education Loan Rev., “J”, 3.5%, 7/01/2033 | 835,000 | 811,770 | ||||||
| Massachusetts Health & Higher Educational Facilities Authority Refunding Bonds Rev. (Suffolk University), 6.25%, 7/01/2030 (Prerefunded 7/01/2019) | 585,000 | 599,847 | ||||||
| Massachusetts Health & Higher Educational Facilities Authority Refunding Bonds Rev., Unrefunded Balance (Suffolk University), 6.25%, 7/01/2030 | 335,000 | 342,390 | ||||||
| Massachusetts Port Authority Special Facilities Rev. (ConRAC Project), “A”, 5.125%, 7/01/2041 | 50,000 | 52,791 | ||||||
| Massachusetts Port Authority Special Facilities Rev. (Delta Air Lines Project, Inc.), “A”, AAC, 5%, 1/01/2027 | 235,000 | 239,387 | ||||||
| Massachusetts School Building Authority, Dedicated Sales Tax Rev., “B”, 5%, 10/15/2032 | 490,000 | 524,903 | ||||||
|
|
|
|||||||
| $ | 7,047,472 | |||||||
| Michigan - 3.6% | ||||||||
| Detroit, MI, Downtown Development Authority Tax Increment Rev. (Catalyst Development), “A”, AGM, 5%, 7/01/2043 | $ | 120,000 | $ | 124,949 | ||||
| Detroit, MI, Sewage Disposal System Rev., “B”, NATL, 5.5%, 7/01/2022 | 1,200,000 | 1,324,536 | ||||||
| Detroit, MI, Water & Sewerage Department, Senior Lien Sewage Disposal System Rev., “A”, 5.25%, 7/01/2039 | 730,000 | 778,888 | ||||||
| Detroit, MI, Water Supply System Rev., Senior Lien, “A”, 5%, 7/01/2036 | 35,000 | 36,547 | ||||||
| Detroit, MI, Water Supply System Rev., Senior Lien, “C”, 5%, 7/01/2041 | 50,000 | 52,084 | ||||||
31
Table of Contents
Portfolio of Investments – continued
| Issuer | Shares/Par | Value ($) | ||||||
| Municipal Bonds - continued | ||||||||
| Michigan - continued | ||||||||
| Eastern Michigan University Board of Regents, General Rev., “A”, 4%, 3/01/2047 | $ | 565,000 | $ | 558,762 | ||||
| Michigan Finance Authority Hospital Rev. (Beaumont Health Credit Group), “A”, 5%, 8/01/2033 | 125,000 | 136,460 | ||||||
| Michigan Finance Authority Local Government Loan Program Rev. (Detroit Water and Sewerage Department Sewage Disposal System Rev. Refunding Second Lien Local Project), “C”, 5%, 7/01/2033 | 80,000 | 87,486 | ||||||
| Michigan Finance Authority Local Government Loan Program Rev. (Detroit Water and Sewerage Department Sewage Disposal System Rev. Refunding Second Lien Local Project), “C”, 5%, 7/01/2034 | 180,000 | 195,815 | ||||||
| Michigan Finance Authority Local Government Loan Program Rev. (Detroit Water and Sewerage Department Sewage Disposal System Rev. Refunding Second Lien Local Project), “C”, 5%, 7/01/2035 | 115,000 | 124,620 | ||||||
| Michigan Finance Authority Local Government Loan Program Rev. (Detroit Water and Sewerage Department Water Supply System Rev. Refunding Second Lien Local Project), “D-2”, 5%, 7/01/2034 | 75,000 | 81,728 | ||||||
| Michigan Finance Authority Rev. (Trinity Health Corp.), 5%, 12/01/2035 | 1,250,000 | 1,328,712 | ||||||
| Michigan Strategic Fund Ltd. (Canterbury Health Care, Inc.), 5%, 7/01/2046 | 110,000 | 110,065 | ||||||
| Waterford Township, MI, Economic Development Corp. (Canterbury Health Care, Inc.), “A”, 5%, 7/01/2046 | 135,000 | 135,080 | ||||||
| Waterford Township, MI, Economic Development Corp. (Canterbury Health Care, Inc.), “A”, 5%, 7/01/2051 | 135,000 | 134,135 | ||||||
| Wayne County, MI, Airport Authority Rev. (Detroit Metropolitan Wayne County Airport), “B”, 5%, 12/01/2044 | 45,000 | 49,365 | ||||||
| Wayne County, MI, Airport Authority Rev. (Detroit Metropolitan Wayne County Airport), “B”, BAM, 5%, 12/01/2039 | 50,000 | 55,367 | ||||||
| Wayne County, MI, Airport Authority Rev. (Detroit Metropolitan Wayne County Airport), “C”, 5%, 12/01/2039 | 40,000 | 43,607 | ||||||
| Wayne County, MI, Airport Authority Rev. (Detroit Metropolitan Wayne County Airport), “C”, 5%, 12/01/2044 | 110,000 | 119,607 | ||||||
| Wayne County, MI, Airport Authority Rev. (Detroit Metropolitan Wayne County Airport), “D”, 5%, 12/01/2031 | 190,000 | 214,071 | ||||||
| Wayne County, MI, Airport Authority Rev. (Detroit Metropolitan Wayne County Airport), “D”, 5%, 12/01/2032 | 200,000 | 224,480 | ||||||
|
|
|
|||||||
| $ | 5,916,364 | |||||||
| Minnesota - 0.4% | ||||||||
| Duluth, MN, Economic Development Authority, Health Care Facilities Rev. (Essentia Health), “A”, 4.25%, 2/15/2043 | $ | 110,000 | $ | 107,874 | ||||
| Duluth, MN, Economic Development Authority, Health Care Facilities Rev. (Essentia Health), “A”, 5%, 2/15/2043 | 200,000 | 214,774 | ||||||
32
Table of Contents
Portfolio of Investments – continued
| Issuer | Shares/Par | Value ($) | ||||||
| Municipal Bonds - continued | ||||||||
| Minnesota - continued | ||||||||
| Duluth, MN, Economic Development Authority, Health Care Facilities Rev. (Essentia Health), “A”, 4.25%, 2/15/2048 | $ | 110,000 | $ | 106,768 | ||||
| Duluth, MN, Economic Development Authority, Health Care Facilities Rev. (Essentia Health), “A”, 5%, 2/15/2048 | 155,000 | 165,222 | ||||||
| Minneapolis & St. Paul, MN, Housing Authority Rev. (City Living), “A-2”, GNMA, 5%, 12/01/2038 | 12,507 | 12,510 | ||||||
| St. Paul, MN, Housing & Redevelopment Authority Charter School Lease Rev. (Great River School Project), “A”, 5.5%, 7/01/2052 | 100,000 | 99,843 | ||||||
|
|
|
|||||||
| $ | 706,991 | |||||||
| Mississippi - 1.9% | ||||||||
| Mississippi Business Finance Corp., Pollution Control Rev. (Systems Energy Resources Project), 5.875%, 4/01/2022 | $ | 1,240,000 | $ | 1,242,306 | ||||
| Mississippi Development Bank Special Obligation (Magnolia Regional Health Center Project), “A”, 6.25%, 10/01/2026 | 80,000 | 83,406 | ||||||
| Mississippi Development Bank Special Obligation (Magnolia Regional Health Center Project), “A”, 6.5%, 10/01/2031 | 120,000 | 125,063 | ||||||
| Mississippi Hospital Equipment & Facilities Authority Rev. (Baptist Memorial Healthcare), “A”, 5%, 9/01/2022 | 175,000 | 187,994 | ||||||
| Mississippi Hospital Equipment & Facilities Authority Rev. (Baptist Memorial Healthcare), “A”, 5%, 9/01/2023 | 455,000 | 495,295 | ||||||
| Mississippi State University, Educational Building Corp. Rev. (Residence Hall Construction and Refunding Project), 5%, 8/01/2036 (Prerefunded 8/01/2021) | 560,000 | 602,969 | ||||||
| University of Southern Mississippi Educational Building Corp. Rev. (Campus Facilities Project), 5.25%, 9/01/2032 (Prerefunded 9/01/2019) | 275,000 | 281,889 | ||||||
| University of Southern Mississippi Educational Building Corp. Rev. (Campus Facilities Project), 5.375%, 9/01/2036 (Prerefunded 9/01/2019) | 100,000 | 102,597 | ||||||
|
|
|
|||||||
| $ | 3,121,519 | |||||||
| Missouri - 1.3% | ||||||||
| Grundy County, MO, Industrial Development Authority Health Facilities Rev. (Wright Memorial Hospital), 6.125%, 9/01/2025 | $ | 80,000 | $ | 81,174 | ||||
| Kansas City, MO, Land Clearance for Redevelopment Authority Rev. (Convention Center Hotel Project - TIF Financing), “B”, 5%, 2/01/2040 | 100,000 | 101,280 | ||||||
| Kansas City, MO, Land Clearance for Redevelopment Authority Rev. (Convention Center Hotel Project - TIF Financing), “B”, 5%, 2/01/2050 | 280,000 | 277,783 | ||||||
| St. Louis County, MO, Industrial Development Authority Health Facilities Rev. (Nazareth Living Center), “A”, 5%, 8/15/2030 | 45,000 | 46,260 | ||||||
33
Table of Contents
Portfolio of Investments – continued
| Issuer | Shares/Par | Value ($) | ||||||
| Municipal Bonds - continued | ||||||||
| Missouri - continued | ||||||||
| St. Louis County, MO, Industrial Development Authority Health Facilities Rev. (Nazareth Living Center), “A”, 5%, 8/15/2035 | $ | 35,000 | $ | 35,475 | ||||
| St. Louis County, MO, Industrial Development Authority Health Facilities Rev. (Nazareth Living Center), “A”, 5.125%, 8/15/2045 | 80,000 | 81,011 | ||||||
| St. Louis, MO, Industrial Development Authority Financing Rev. (Ballpark Village Development Project), “A”, 3.875%, 11/15/2029 | 65,000 | 64,626 | ||||||
| St. Louis, MO, Industrial Development Authority Financing Rev. (Ballpark Village Development Project), “A”, 4.375%, 11/15/2035 | 125,000 | 125,373 | ||||||
| St. Louis, MO, Industrial Development Authority Financing Rev. (Ballpark Village Development Project), “A”, 4.75%, 11/15/2047 | 255,000 | 256,336 | ||||||
| St. Louis, MO, Industrial Development Authority Rev. (Friendship Village St. Louis Obligated Group), “A”, 5.25%, 9/01/2053 | 745,000 | 734,391 | ||||||
| St. Louis, MO, Industrial Development Authority Rev. (St. Andrew’s Resources for Seniors Obligated Group), “A”, 5.125%, 12/01/2045 | 230,000 | 235,492 | ||||||
|
|
|
|||||||
| $ | 2,039,201 | |||||||
| Montana - 0.0% | ||||||||
| Montana Board of Housing Single Family Program (Federally Insured or Guaranteed Mortgage Loans), “A”, 4%, 6/01/2049 | $ | 60,000 | $ | 62,921 | ||||
| National - 0.6% | ||||||||
| Centerline Capital Group, Inc., FHLMC, 6.3%, 10/31/2052 (Put Date 5/15/2019) (n) | $ | 1,000,000 | $ | 1,016,910 | ||||
| Nebraska - 0.3% | ||||||||
| Central Plains Energy Project, NE, Gas Project Rev. (Project No.3), “A”, 5%, 9/01/2036 | $ | 135,000 | $ | 152,477 | ||||
| Central Plains Energy Project, NE, Gas Project Rev. (Project No.3), “A”, 5%, 9/01/2042 | 265,000 | 301,117 | ||||||
|
|
|
|||||||
| $ | 453,594 | |||||||
| Nevada - 1.3% | ||||||||
| Director of the State of Nevada, Department of Business and Industry, Charter School Lease Rev. (Somerset Academy), “A”, 5.125%, 12/15/2045 | $ | 195,000 | $ | 195,624 | ||||
| Director of the State of Nevada, Department of Business and Industry, Charter School Lease Rev. (Somerset Academy), “A”, 5%, 12/15/2048 | 115,000 | 113,241 | ||||||
| Las Vegas Valley, NV, Water District, “C”, 5%, 6/01/2029 | 1,175,000 | 1,251,093 | ||||||
| Nevada Department of Business & Industry Charter School Rev. (Doral Academy of Nevada), “A”, 5%, 7/15/2047 | 110,000 | 108,508 | ||||||
| Reno, NV, Sales Tax Rev. (Retrac-Reno Transportation Rail Access Corridor Project), “B”, AGM, 5%, 6/01/2033 | 5,000 | 5,617 | ||||||
| Reno, NV, Sales Tax Rev. (Retrac-Reno Transportation Rail Access Corridor Project), “B”, AGM, 5%, 6/01/2038 | 5,000 | 5,530 | ||||||
34
Table of Contents
Portfolio of Investments – continued
| Issuer | Shares/Par | Value ($) | ||||||
| Municipal Bonds - continued | ||||||||
| Nevada - continued | ||||||||
| Reno, NV, Sales Tax Rev. (Retrac-Reno Transportation Rail Access Corridor Project), “B”, AGM, 4%, 6/01/2048 | $ | 25,000 | $ | 24,613 | ||||
| Reno, NV, Sales Tax Rev. (Retrac-Reno Transportation Rail Access Corridor Project), “B”, AGM, 4.125%, 6/01/2058 | 35,000 | 34,544 | ||||||
| Reno, NV, Sales Tax Rev. (Retrac-Reno Transportation Rail Access Corridor Project), Capital Appreciation, “C”, 0%, 7/01/2058 | 3,000,000 | 321,810 | ||||||
|
|
|
|||||||
| $ | 2,060,580 | |||||||
| New Hampshire - 1.0% | ||||||||
| National Finance Authority, New Hampshire Resource Recovery Refunding Rev. (Covanta Project), “C”, 4.875%, 11/01/2042 | $ | 375,000 | $ | 360,896 | ||||
| New Hampshire Business Finance Authority Rev. (Elliot Hospital Obligated Group), “A”, 6%, 10/01/2027 (Prerefunded 10/01/2019) | 745,000 | 769,928 | ||||||
| New Hampshire Business Finance Authority, Solid Waste Disposal Rev. (Casella Waste Systems, Inc. Project), 4%, 4/01/2029 (Put Date 10/01/2019) | 100,000 | 100,108 | ||||||
| New Hampshire Health & Education Facilities Authority Rev. (Memorial Hospital), 5.5%, 6/01/2031 | 150,000 | 167,692 | ||||||
| New Hampshire Health & Education Facilities Authority Rev. (Memorial Hospital), 5.5%, 6/01/2036 | 150,000 | 165,009 | ||||||
|
|
|
|||||||
| $ | 1,563,633 | |||||||
| New Jersey - 5.1% | ||||||||
| Atlantic City, NJ, Tax Appeal Refunding Bonds (Qualified Pursuant to the Provisions of the Municipal Qualified Bond Act), “A”, BAM, 5%, 3/01/2032 | $ | 25,000 | $ | 27,755 | ||||
| Atlantic City, NJ, Tax Appeal Refunding Bonds (Qualified Pursuant to the Provisions of the Municipal Qualified Bond Act), “A”, BAM, 5%, 3/01/2037 | 30,000 | 32,647 | ||||||
| Atlantic City, NJ, Tax Appeal Refunding Bonds (Qualified Pursuant to the Provisions of the Municipal Qualified Bond Act), “A”, BAM, 5%, 3/01/2042 | 35,000 | 37,720 | ||||||
| New Jersey Building Authority Rev., Unrefunded Balance, “A”, BAM, 5%, 6/15/2029 | 35,000 | 39,057 | ||||||
| New Jersey Economic Development Authority Rev. (Kapkowski Road Landfill Project), 6.5%, 4/01/2031 | 1,195,000 | 1,325,171 | ||||||
| New Jersey Economic Development Authority Rev. (Lions Gate Project), 5%, 1/01/2034 | 40,000 | 39,416 | ||||||
| New Jersey Economic Development Authority Rev. (Lions Gate Project), 5.125%, 1/01/2039 | 110,000 | 108,034 | ||||||
| New Jersey Economic Development Authority Rev. (Lions Gate Project), 5.25%, 1/01/2044 | 285,000 | 281,466 | ||||||
35
Table of Contents
Portfolio of Investments – continued
| Issuer | Shares/Par | Value ($) | ||||||
| Municipal Bonds - continued | ||||||||
| New Jersey - continued | ||||||||
| New Jersey Economic Development Authority Rev. (Provident Group - Rowan Properties LLC - Rowan University Student Housing Project), “A”, 5%, 1/01/2030 | $ | 100,000 | $ | 106,007 | ||||
| New Jersey Economic Development Authority Rev. (Provident Group - Rowan Properties LLC - Rowan University Student Housing Project), “A”, 5%, 1/01/2035 | 125,000 | 130,581 | ||||||
| New Jersey Economic Development Authority Rev. (The Goethals Bridge Replacement Project), 5.5%, 1/01/2027 | 55,000 | 60,772 | ||||||
| New Jersey Economic Development Authority Rev. (The Goethals Bridge Replacement Project), 5%, 1/01/2028 | 55,000 | 59,228 | ||||||
| New Jersey Economic Development Authority Rev. (The Goethals Bridge Replacement Project), 5.375%, 1/01/2043 | 315,000 | 336,344 | ||||||
| New Jersey Economic Development Authority Rev. (The Goethals Bridge Replacement Project), AGM, 5%, 1/01/2031 | 160,000 | 172,456 | ||||||
| New Jersey Economic Development Authority, Special Facilities Rev. (Continental Airlines, Inc.), 4.875%, 9/15/2019 | 145,000 | 147,346 | ||||||
| New Jersey Economic Development Authority, Special Facilities Rev. (Continental Airlines, Inc.), 5.125%, 9/15/2023 | 455,000 | 487,005 | ||||||
| New Jersey Economic Development Authority, Special Facilities Rev. (Continental Airlines, Inc.), 5.25%, 9/15/2029 | 640,000 | 689,357 | ||||||
| New Jersey Economic Development Authority, Special Facilities Rev. (Continental Airlines, Inc.), “A”, 5.625%, 11/15/2030 | 135,000 | 150,876 | ||||||
| New Jersey Economic Development Authority, Special Facilities Rev. (Continental Airlines, Inc.), “B”, 5.625%, 11/15/2030 | 120,000 | 134,112 | ||||||
| New Jersey Economic Development Authority, State Lease Rev. (Juvenile Justice Commission Facilities Project), “C”, 5%, 6/15/2042 | 235,000 | 243,056 | ||||||
| New Jersey Economic Development Motor Vehicle Surcharges Subordinate Refunding Rev., “A”, 3.125%, 7/01/2029 | 115,000 | 112,669 | ||||||
| New Jersey Economic Development Motor Vehicle Surcharges Subordinate Refunding Rev., “A”, 5%, 7/01/2033 | 335,000 | 355,378 | ||||||
| New Jersey Health Care Facilities, Financing Authority Rev. (University Hospital), “A”, AGM, 5%, 7/01/2046 | 500,000 | 539,220 | ||||||
| New Jersey Tobacco Settlement Financing Corp., “B”, 5%, 6/01/2046 | 1,295,000 | 1,296,645 | ||||||
| New Jersey Transportation Trust Fund Authority, Federal Highway Reimbursement Rev., “A”, 5%, 6/15/2029 | 200,000 | 221,074 | ||||||
| New Jersey Transportation Trust Fund Authority, Federal Highway Reimbursement Rev., “A”, 5%, 6/15/2031 | 135,000 | 147,874 | ||||||
| New Jersey Transportation Trust Fund Authority, Transportation Program, “AA”, 5%, 6/15/2038 | 1,000,000 | 1,042,020 | ||||||
|
|
|
|||||||
| $ | 8,323,286 | |||||||
| New York - 8.8% | ||||||||
| Brooklyn, NY, Arena Local Development Corp. (Barclays Center Project), 6%, 7/15/2030 (Prerefunded 1/15/2020) | $ | 155,000 | $ | 162,161 | ||||
36
Table of Contents
Portfolio of Investments – continued
| Issuer | Shares/Par | Value ($) | ||||||
| Municipal Bonds - continued | ||||||||
| New York - continued | ||||||||
| Buffalo & Erie County, NY, Industrial Land Development Corp. Rev. (Buffalo State College), “A”, 5.375%, 10/01/2041 | $ | 250,000 | $ | 266,538 | ||||
| Build NYC Resource Corp. Rev. (Albert Einstein School of Medicine, Inc.), 5.5%, 9/01/2045 | 535,000 | 559,433 | ||||||
| Glen Cove, NY, Local Economic Assistance Corp. (Garvies Point Public Improvement Project), Capital Appreciation, “B”, 0%, 1/01/2045 | 440,000 | 104,500 | ||||||
| Hudson Yards, NY, Infrastructure Corp. Rev., “A”, 5.75%, 2/15/2047 (Prerefunded 2/15/2021) | 300,000 | 324,462 | ||||||
| Hudson Yards, NY, Infrastructure Corp. Rev., “A”, Unrefunded Balance, 5.75%, 2/15/2047 | 180,000 | 192,704 | ||||||
| New Rochelle, NY, Corp. for Local Development Rev. (Iona College Project), “A”, 5%, 7/01/2034 | 85,000 | 91,703 | ||||||
| New Rochelle, NY, Corp. for Local Development Rev. (Iona College Project), “A”, 5%, 7/01/2040 | 205,000 | 218,206 | ||||||
| New Rochelle, NY, Corp. for Local Development Rev. (Iona College Project), “A”, 5%, 7/01/2045 | 105,000 | 111,451 | ||||||
| New York Dormitory Authority Rev., Non-State Supported Debt (Bronx-Lebanon Hospital Center), LOC, 6.5%, 8/15/2030 (Prerefunded 2/15/2019) | 245,000 | 247,296 | ||||||
| New York Dormitory Authority Rev., Non-State Supported Debt (Bronx-Lebanon Hospital Center), LOC, 6.25%, 2/15/2035 (Prerefunded 2/15/2019) | 150,000 | 151,335 | ||||||
| New York Dormitory Authority Rev., Non-State Supported Debt (Orange Regional Medical Center), 5%, 12/01/2040 | 100,000 | 106,094 | ||||||
| New York Dormitory Authority Rev., Non-State Supported Debt (Orange Regional Medical Center), “A”, 5%, 12/01/2035 | 100,000 | 107,651 | ||||||
| New York Dormitory Authority, State Personal Income Tax Rev., “C”, 5%, 3/15/2034 | 1,330,000 | 1,405,943 | ||||||
| New York Environmental Facilities Corp., Clean Drinking Water Revolving Funds, 5%, 6/15/2041 | 865,000 | 918,137 | ||||||
| New York Environmental Facilities Corp., State Revolving Funds Rev., “C”, 5%, 5/15/2041 | 1,195,000 | 1,266,055 | ||||||
| New York Liberty Development Corp., Liberty Rev. (3 World Trade Center Project), “1”, 5%, 11/15/2044 | 995,000 | 1,015,477 | ||||||
| New York Liberty Development Corp., Liberty Rev. (3 World Trade Center Project), “2”, 5.375%, 11/15/2040 | 505,000 | 527,286 | ||||||
| New York Liberty Development Corp., Liberty Rev. (One Bryant Park LLC), 6.375%, 7/15/2049 | 685,000 | 710,955 | ||||||
| New York Transportation Development Corp., Special Facilities Rev. (American Airlines, Inc. John F. Kennedy International Airport Project), 5%, 8/01/2026 | 435,000 | 452,979 | ||||||
| New York Transportation Development Corp., Special Facilities Rev. (American Airlines, Inc. John F. Kennedy International Airport Project), 5%, 8/01/2031 | 260,000 | 268,338 | ||||||
37
Table of Contents
Portfolio of Investments – continued
| Issuer | Shares/Par | Value ($) | ||||||
| Municipal Bonds - continued | ||||||||
| New York - continued | ||||||||
| New York Transportation Development Corp., Special Facilities Rev. (Delta Airlines, Inc. LaGuardia Airport Terminals C&D Redevelopment Project), 5%, 1/01/2032 | $ | 310,000 | $ | 340,817 | ||||
| New York Transportation Development Corp., Special Facilities Rev. (Delta Airlines, Inc. LaGuardia Airport Terminals C&D Redevelopment Project), 5%, 1/01/2033 | 180,000 | 197,023 | ||||||
| New York Transportation Development Corp., Special Facilities Rev. (Delta Airlines, Inc. LaGuardia Airport Terminals C&D Redevelopment Project), 5%, 1/01/2034 | 100,000 | 109,055 | ||||||
| New York Transportation Development Corp., Special Facilities Rev. (Delta Airlines, Inc. LaGuardia Airport Terminals C&D Redevelopment Project), 4%, 1/01/2036 | 100,000 | 99,385 | ||||||
| New York Urban Development Corp. (University Facilities Grants), 5.875%, 1/01/2021 | 1,000,000 | 1,049,850 | ||||||
| New York, NY, City Transitional Finance Authority Building Aid Rev., “S-3”, 5.25%, 1/15/2039 | 560,000 | 562,262 | ||||||
| Niagara County, NY, Industrial Development Agency, Solid Waste Disposal Rev. (Covanta Energy Project), “A”, 4.75%, 11/01/2042 | 335,000 | 321,124 | ||||||
| Onondaga, NY, Civic Development Corp. Rev. (St. Joseph’s Hospital Health Center), 5%, 7/01/2025 (Prerefunded 7/01/2019) | 40,000 | 40,726 | ||||||
| Onondaga, NY, Civic Development Corp. Rev. (St. Joseph’s Hospital Health Center), 5.125%, 7/01/2031 (Prerefunded 7/01/2019) | 35,000 | 35,660 | ||||||
| Onondaga, NY, Civic Development Corp. Rev. (St. Joseph’s Hospital Health Center), 5%, 7/01/2042 (Prerefunded 7/01/2022) | 320,000 | 352,029 | ||||||
| Orange County, NY, Funding Corp. Assisted Living Residence Rev. (The Hamlet at Wallkill Assisted Living Project), 6.5%, 1/01/2046 | 240,000 | 245,395 | ||||||
| Port Authority of NY & NJ, Special Obligation Rev. (JFK International Air Terminal LLC), 6%, 12/01/2036 | 315,000 | 336,417 | ||||||
| Port Authority of NY & NJ, Special Obligation Rev. (JFK International Air Terminal LLC), 6%, 12/01/2042 | 360,000 | 383,245 | ||||||
| Tobacco Settlement Asset Securitization Corp., NY, “A”, 5%, 6/01/2034 | 70,000 | 75,363 | ||||||
| Tobacco Settlement Asset Securitization Corp., NY, “A”, 5%, 6/01/2035 | 35,000 | 37,499 | ||||||
| Tobacco Settlement Asset Securitization Corp., NY, “A”, 5%, 6/01/2041 | 230,000 | 234,623 | ||||||
| Ulster County, NY, Capital Resource Corp. Rev. (Woodland Pond at New Paltz Project), 4%, 9/15/2025 | 245,000 | 233,620 | ||||||
| Ulster County, NY, Capital Resource Corp. Rev. (Woodland Pond at New Paltz Project), 5%, 9/15/2037 | 500,000 | 460,465 | ||||||
|
|
|
|||||||
| $ | 14,323,262 | |||||||
38
Table of Contents
Portfolio of Investments – continued
| Issuer | Shares/Par | Value ($) | ||||||
| Municipal Bonds - continued | ||||||||
| North Carolina - 2.0% | ||||||||
| Durham, NC, Durham Housing Authority Rev. (Magnolia Pointe Apartments), 5.65%, 2/01/2038 | $ | 1,279,331 | $ | 1,297,126 | ||||
| New Hanover County, NC, Hospital Rev., AGM, 5.125%, 10/01/2031 (Prerefunded 10/01/2019) | 1,130,000 | 1,159,380 | ||||||
| North Carolina Medical Care Commission, Health Care Facilities Rev. (Pennybyrn at Maryfield), 5%, 10/01/2025 | 70,000 | 75,222 | ||||||
| North Carolina Medical Care Commission, Health Care Facilities Rev. (Pennybyrn at Maryfield), 5%, 10/01/2030 | 85,000 | 88,299 | ||||||
| North Carolina Medical Care Commission, Health Care Facilities Rev. (Pennybyrn at Maryfield), 5%, 10/01/2035 | 55,000 | 56,648 | ||||||
| North Carolina Medical Care Commission, Retirement Facilities First Mortgage Rev. (United Church Homes and Services), “A”, 5%, 9/01/2037 | 95,000 | 98,443 | ||||||
| North Carolina Turnpike Authority, Monroe Expressway Toll Rev., “A”, 5%, 7/01/2042 | 40,000 | 42,617 | ||||||
| North Carolina Turnpike Authority, Monroe Expressway Toll Rev., “A”, 5%, 7/01/2047 | 80,000 | 84,913 | ||||||
| North Carolina Turnpike Authority, Monroe Expressway Toll Rev., “A”, 5%, 7/01/2051 | 165,000 | 174,690 | ||||||
| North Carolina Turnpike Authority, Monroe Expressway Toll Rev., “A”, 5%, 7/01/2054 | 70,000 | 74,018 | ||||||
| University of North Carolina, Greensboro, Rev., 5%, 4/01/2039 | 135,000 | 149,877 | ||||||
|
|
|
|||||||
| $ | 3,301,233 | |||||||
| North Dakota - 0.1% | ||||||||
| Country of Ward, ND, Health Care Facilities Rev. (Trinity Obligated Group), “C”, 5%, 6/01/2043 | $ | 150,000 | $ | 155,409 | ||||
| Ohio - 7.7% | ||||||||
| Bowling Green, OH, Student Housing Rev. (State University Project), 5.75%, 6/01/2031 (Prerefunded 6/01/2020) | $ | 225,000 | $ | 237,407 | ||||
| Buckeye, OH, Tobacco Settlement Financing Authority Rev., “A-2”, 5.125%, 6/01/2024 | 1,880,000 | 1,756,221 | ||||||
| Buckeye, OH, Tobacco Settlement Financing Authority Rev., “A-2”, 5.375%, 6/01/2024 | 830,000 | 783,055 | ||||||
| Buckeye, OH, Tobacco Settlement Financing Authority Rev., “A-2”, 5.875%, 6/01/2030 | 2,420,000 | 2,295,273 | ||||||
| Buckeye, OH, Tobacco Settlement Financing Authority Rev., “A-2”, 5.75%, 6/01/2034 | 635,000 | 593,153 | ||||||
| Buckeye, OH, Tobacco Settlement Financing Authority Rev., “A-2”, 6.5%, 6/01/2047 | 1,200,000 | 1,186,488 | ||||||
| Butler County, OH, Hospital Facilities Rev. (UC Health), 5.5%, 11/01/2040 (Prerefunded 11/01/2020) | 250,000 | 265,813 | ||||||
39
Table of Contents
Portfolio of Investments – continued
| Issuer | Shares/Par | Value ($) | ||||||
| Municipal Bonds - continued | ||||||||
| Ohio - continued | ||||||||
| Butler County, OH, Hospital Facilities Rev. (UC Health), 5.75%, 11/01/2040 (Prerefunded 11/01/2020) | $ | 165,000 | $ | 176,205 | ||||
| Butler County, OH, Hospital Facilities Rev., Unrefunded Balance, (UC Health), 5.5%, 11/01/2040 (Prerefunded 11/01/2020) | 500,000 | 531,625 | ||||||
| Cuyahoga County, OH, Hospital Rev. (The Metrohealth System), 5%, 2/15/2042 | 265,000 | 275,499 | ||||||
| Cuyahoga County, OH, Hospital Rev. (The Metrohealth System), 4.75%, 2/15/2047 | 360,000 | 358,560 | ||||||
| Cuyahoga County, OH, Hospital Rev. (The Metrohealth System), 5.25%, 2/15/2047 | 375,000 | 392,100 | ||||||
| Cuyahoga County, OH, Hospital Rev. (The Metrohealth System), 5.5%, 2/15/2052 | 55,000 | 58,463 | ||||||
| Cuyahoga County, OH, Hospital Rev. (The Metrohealth System), 5%, 2/15/2057 | 190,000 | 191,490 | ||||||
| Cuyahoga County, OH, Hospital Rev. (The Metrohealth System), 5.5%, 2/15/2057 | 925,000 | 977,262 | ||||||
| Gallia County, OH, Hospital Facilities Rev. (Holzer Health Systems), “A”, 8%, 7/01/2042 | 935,000 | 1,013,802 | ||||||
| Lake County, OH, Hospital Facilities Rev., Unrefunded Balance, “C”, 5.625%, 8/15/2029 | 90,000 | 90,248 | ||||||
| Lucas County, OH, Hospital Rev. (Promedica Healthcare), “A”, 5.25%, 11/15/2048 | 90,000 | 95,068 | ||||||
| Ohio Air Quality Development Authority, Facilities Rev. (Pratt Paper LLC Project), 3.75%, 1/15/2028 | 100,000 | 99,007 | ||||||
| Ohio Air Quality Development Authority, Facilities Rev. (Pratt Paper LLC Project), 4.25%, 1/15/2038 | 125,000 | 122,906 | ||||||
| Ohio Air Quality Development Authority, Facilities Rev. (Pratt Paper LLC Project), 4.5%, 1/15/2048 | 170,000 | 170,119 | ||||||
| Southeastern Ohio Port Authority, Hospital Facilities Improvement Rev. (Memorial Health System Obligated Group Project), 5.5%, 12/01/2029 | 45,000 | 48,823 | ||||||
| Southeastern Ohio Port Authority, Hospital Facilities Improvement Rev. (Memorial Health System Obligated Group Project), 5.75%, 12/01/2032 | 380,000 | 403,659 | ||||||
| Southeastern Ohio Port Authority, Hospital Facilities Improvement Rev. (Memorial Health System Obligated Group Project), 5%, 12/01/2035 | 120,000 | 124,129 | ||||||
| Southeastern Ohio Port Authority, Hospital Facilities Improvement Rev. (Memorial Health System Obligated Group Project), 5%, 12/01/2043 | 145,000 | 145,177 | ||||||
| Southeastern Ohio Port Authority, Hospital Facilities Improvement Rev. (Memorial Health System Obligated Group Project), 5.5%, 12/01/2043 | 175,000 | 180,612 | ||||||
|
|
|
|||||||
| $ | 12,572,164 | |||||||
40
Table of Contents
Portfolio of Investments – continued
| Issuer | Shares/Par | Value ($) | ||||||
| Municipal Bonds - continued | ||||||||
| Oklahoma - 1.5% | ||||||||
| Catoosa, OK, Industrial Authority Sales Tax Rev., 4%, 10/01/2028 | $ | 40,000 | $ | 39,550 | ||||
| Oklahoma Development Finance Authority, First Mortgage Rev. (Sommerset Project), 5%, 7/01/2042 | 135,000 | 139,810 | ||||||
| Oklahoma Development Finance Authority, Health System Rev. (OU Medicine Project), “B”, 5%, 8/15/2029 | 40,000 | 44,719 | ||||||
| Oklahoma Development Finance Authority, Health System Rev. (OU Medicine Project), “B”, 5%, 8/15/2033 | 190,000 | 206,467 | ||||||
| Oklahoma Development Finance Authority, Health System Rev. (OU Medicine Project), “B”, 5%, 8/15/2038 | 265,000 | 279,601 | ||||||
| Oklahoma Development Finance Authority, Health System Rev. (OU Medicine Project), “B”, 5.25%, 8/15/2043 | 285,000 | 305,061 | ||||||
| Oklahoma Development Finance Authority, Health System Rev. (OU Medicine Project), “B”, 5.25%, 8/15/2048 | 265,000 | 282,501 | ||||||
| Tulsa, OK, Airport Improvement Trust Rev., “A”, 5%, 6/01/2045 | 70,000 | 74,291 | ||||||
| Tulsa, OK, Municipal Airport Trust Rev. (American Airlines, Inc.), 5%, 6/01/2035 (Put Date 6/01/2025) | 135,000 | 143,843 | ||||||
| Tulsa, OK, Municipal Airport Trust Rev. (American Airlines, Inc.), “B”, 5.5%, 6/01/2035 | 370,000 | 392,300 | ||||||
| Tulsa, OK, Municipal Airport Trust Rev. (American Airlines, Inc.), “B”, 5.5%, 12/01/2035 | 470,000 | 498,327 | ||||||
|
|
|
|||||||
| $ | 2,406,470 | |||||||
| Oregon - 0.2% | ||||||||
| Forest Grove, OR, Campus Improvement Rev. (Pacific University Project), “A”, 4.5%, 5/01/2029 | $ | 105,000 | $ | 109,614 | ||||
| Forest Grove, OR, Campus Improvement Rev. (Pacific University Project), “A”, 5%, 5/01/2036 | 120,000 | 127,417 | ||||||
| Forest Grove, OR, Campus Improvement Rev. (Pacific University Project), “A”, 5%, 5/01/2040 | 135,000 | 140,655 | ||||||
|
|
|
|||||||
| $ | 377,686 | |||||||
| Pennsylvania - 10.6% | ||||||||
| Allegheny County, PA, Higher Education Building Authority Rev. (Robert Morris University), 5%, 10/15/2037 | $ | 15,000 | $ | 15,868 | ||||
| Allegheny County, PA, Higher Education Building Authority Rev. (Robert Morris University), 5%, 10/15/2047 | 45,000 | 47,130 | ||||||
| Allegheny County, PA, Hospital Development Authority Rev. (University of Pittsburgh Medical Center), “A”, 5.375%, 8/15/2029 | 560,000 | 572,667 | ||||||
| Allentown, PA, Neighborhood Improvement Zone Development Authority Tax Rev. (City Center Project), 5%, 5/01/2042 | 205,000 | 213,421 | ||||||
| Allentown, PA, Neighborhood Improvement Zone Development Authority Tax Rev. (City Center Refunding Project), 5%, 5/01/2042 | 185,000 | 191,934 | ||||||
| Allentown, PA, Neighborhood Improvement Zone Development Authority Tax Rev., “A”, 5%, 5/01/2035 | 125,000 | 129,063 | ||||||
41
Table of Contents
Portfolio of Investments – continued
| Issuer | Shares/Par | Value ($) | ||||||
| Municipal Bonds - continued | ||||||||
| Pennsylvania - continued | ||||||||
| Allentown, PA, Neighborhood Improvement Zone Development Authority Tax Rev., “A”, 5%, 5/01/2042 | $ | 535,000 | $ | 547,926 | ||||
| Berks County, PA, Reading School District, AGM, 5%, 3/01/2035 | 30,000 | 33,446 | ||||||
| Berks County, PA, Reading School District, AGM, 5%, 3/01/2036 | 35,000 | 38,861 | ||||||
| Berks County, PA, Reading School District, AGM, 5%, 3/01/2037 | 30,000 | 33,219 | ||||||
| Berks County, PA, Reading School District, AGM, 5%, 3/01/2038 | 15,000 | 16,564 | ||||||
| Blythe Township, PA, Solid Waste Authority Rev., 7.75%, 12/01/2037 | 275,000 | 281,418 | ||||||
| Chester County, PA, Health & Education Facilities Authority Rev. (Simpson Senior Services Project), “A”, 5%, 12/01/2030 | 50,000 | 50,558 | ||||||
| Chester County, PA, Health & Education Facilities Authority Rev. (Simpson Senior Services Project), “A”, 5%, 12/01/2035 | 55,000 | 54,997 | ||||||
| Chester County, PA, Health & Education Facilities Authority Rev. (Simpson Senior Services Project), “A”, 5.25%, 12/01/2045 | 120,000 | 121,328 | ||||||
| Commonwealth of Pennsylvania, Tobacco Master Settlement Financing Authority Rev., 5%, 6/01/2032 | 85,000 | 94,931 | ||||||
| Commonwealth of Pennsylvania, Tobacco Master Settlement Financing Authority Rev., 5%, 6/01/2033 | 75,000 | 83,315 | ||||||
| Commonwealth of Pennsylvania, Tobacco Master Settlement Financing Authority Rev., 5%, 6/01/2034 | 35,000 | 38,732 | ||||||
| Cumberland County, PA, Municipal Authority Rev. (Asbury Atlantic, Inc.), 5.25%, 1/01/2041 | 355,000 | 359,097 | ||||||
| Cumberland County, PA, Municipal Authority Rev. (Diakon Lutheran Social Ministries Project), Unrefunded Balance, 6.125%, 1/01/2029 | 90,000 | 90,289 | ||||||
| East Hempfield Township, PA, Industrial Development Authority Rev. (Student Services, Inc., Student Housing Project at Millersville University of Pennsylvania), 5%, 7/01/2030 | 35,000 | 37,005 | ||||||
| East Hempfield Township, PA, Industrial Development Authority Rev. (Student Services, Inc., Student Housing Project at Millersville University of Pennsylvania), 5%, 7/01/2035 | 40,000 | 41,704 | ||||||
| East Hempfield Township, PA, Industrial Development Authority Rev. (Student Services, Inc., Student Housing Project at Millersville University of Pennsylvania), 5%, 7/01/2039 | 50,000 | 51,692 | ||||||
| East Hempfield Township, PA, Industrial Development Authority Rev. (Student Services, Inc., Student Housing Project at Millersville University of Pennsylvania), 5%, 7/01/2046 | 25,000 | 25,759 | ||||||
| Franklin County, PA, Industrial Development Authority Rev. (Menno-Haven, Inc. Project), 5%, 12/01/2038 | 150,000 | 151,764 | ||||||
| Franklin County, PA, Industrial Development Authority Rev. (Menno-Haven, Inc. Project), 5%, 12/01/2043 | 195,000 | 195,761 | ||||||
| Franklin County, PA, Industrial Development Authority Rev. (Menno-Haven, Inc. Project), 5%, 12/01/2048 | 200,000 | 199,990 | ||||||
| Franklin County, PA, Industrial Development Authority Rev. (Menno-Haven, Inc. Project), 5%, 12/01/2053 | 195,000 | 193,405 | ||||||
42
Table of Contents
Portfolio of Investments – continued
| Issuer | Shares/Par | Value ($) | ||||||
| Municipal Bonds - continued | ||||||||
| Pennsylvania - continued | ||||||||
| Lancaster County, PA, Hospital Authority Health Center Rev. (Masonic Villages Project), 5%, 11/01/2027 | $ | 60,000 | $ | 66,284 | ||||
| Lehigh County, PA, Water and Sewer Authority Rev. (Allentown Concession), “A”, 5%, 12/01/2043 | 1,425,000 | 1,541,779 | ||||||
| Lehigh County, PA, Water and Sewer Authority Rev. (Allentown Concession), Capital Appreciation, “B”, 0%, 12/01/2037 | 1,200,000 | 532,920 | ||||||
| Luzerne County, PA, “A”, AGM, 5%, 11/15/2029 | 225,000 | 250,936 | ||||||
| Montgomery County, PA, Industrial Development Authority Retirement Community Rev. (ACTS Retirement - Life Communities, Inc.), 5%, 11/15/2028 | 440,000 | 464,468 | ||||||
| Montgomery County, PA, Industrial Development Authority Rev. (Albert Einstein Healthcare Network Issue), “A”, 5.25%, 1/15/2036 | 820,000 | 877,498 | ||||||
| Montgomery County, PA, Industrial Development Authority Rev. (Whitemarsh Continuing Care Retirement Community Project), 5.375%, 1/01/2050 | 1,180,000 | 1,152,943 | ||||||
| Moon Industrial Development Authority Rev. (Baptist Homes Society), 6.125%, 7/01/2050 | 325,000 | 340,255 | ||||||
| Northeastern PA, Hospital & Education Authority Rev. (Wilkes University Project), “A”, 5%, 3/01/2037 | 50,000 | 52,792 | ||||||
| Pennsylvania Economic Development Financing Authority Rev. (The Pennsylvania Rapid Bridge Replacement Project), 5%, 12/31/2030 | 130,000 | 140,001 | ||||||
| Pennsylvania Economic Development Financing Authority, Sewer Sludge Disposal Rev. (Philadelphia Biosolids Facility), 6.25%, 1/01/2032 | 325,000 | 334,789 | ||||||
| Pennsylvania Higher Educational Facilities Authority Rev. (Edinboro University Foundation), 5.8%, 7/01/2030 (Prerefunded 7/01/2020) | 100,000 | 105,477 | ||||||
| Pennsylvania Higher Educational Facilities Authority Rev. (Shippensburg University Student Services, Inc. Housing Project), 6.25%, 10/01/2043 (Prerefunded 10/01/2021) | 195,000 | 216,565 | ||||||
| Pennsylvania Higher Educational Facilities Authority Rev. (Shippensburg University Student Services, Inc. Housing Project), 5%, 10/01/2044 (Prerefunded 10/01/2022) | 330,000 | 363,709 | ||||||
| Philadelphia, PA, Authority for Industrial Development Rev. (MaST Charter School Project), “A”, 5.625%, 8/01/2036 | 100,000 | 100,146 | ||||||
| Philadelphia, PA, Authority for Industrial Development Rev. (MaST Charter School Project), “A”, 5.25%, 8/01/2046 | 215,000 | 214,052 | ||||||
| Philadelphia, PA, Authority for Industrial Development Rev. (MaST Charter School Project), “A”, 5.75%, 8/01/2046 | 325,000 | 323,632 | ||||||
| Philadelphia, PA, Authority for Industrial Development Rev. (MaST Charter School Project), “A”, 5.375%, 8/01/2051 | 155,000 | 154,870 | ||||||
| Philadelphia, PA, Authority for Industrial Development Rev. (MaST Charter School Project), “B”, 6%, 8/01/2051 | 220,000 | 221,588 | ||||||
43
Table of Contents
Portfolio of Investments – continued
| Issuer | Shares/Par | Value ($) | ||||||
| Municipal Bonds - continued | ||||||||
| Pennsylvania - continued | ||||||||
| Philadelphia, PA, Authority for Industrial Development Rev. (Philadelphia Performing Arts Charter School Project), 6.5%, 6/15/2033 | $ | 290,000 | $ | 299,608 | ||||
| Philadelphia, PA, Authority for Industrial Development Rev. (Philadelphia Performing Arts Charter School Project), 6.75%, 6/15/2043 | 390,000 | 402,597 | ||||||
| Philadelphia, PA, Authority for Industrial Development Rev. (Tacony Academy Charter School Project), 6.875%, 6/15/2033 | 100,000 | 107,432 | ||||||
| Philadelphia, PA, Authority for Industrial Development Rev. (Tacony Academy Charter School Project), 7.375%, 6/15/2043 | 145,000 | 157,582 | ||||||
| Philadelphia, PA, Authority for Industrial Development Rev. (Tacony Academy Charter School Project), “A-1”, 7%, 6/15/2043 | 120,000 | 128,617 | ||||||
| Philadelphia, PA, Authority for Industrial Development, Multifamily Housing Rev. (University Square Apartment Project - Section 8), “III”, 5.25%, 12/01/2047 | 180,000 | 164,479 | ||||||
| Philadelphia, PA, Authority for Industrial Development, Multifamily Housing Rev. (University Square Apartment Project - Section 8), “III”, 5.5%, 12/01/2058 | 260,000 | 237,455 | ||||||
| Philadelphia, PA, Authority for Industrial Development, Senior Living Facilities Rev. (Wesley Enhanced Living Obligated Group), “A”, 5%, 7/01/2037 | 130,000 | 131,440 | ||||||
| Philadelphia, PA, Authority for Industrial Development, Senior Living Facilities Rev. (Wesley Enhanced Living Obligated Group), “A”, 5%, 7/01/2042 | 150,000 | 150,513 | ||||||
| Philadelphia, PA, Authority for Industrial Development, Senior Living Facilities Rev. (Wesley Enhanced Living Obligated Group), “A”, 5%, 7/01/2049 | 215,000 | 214,323 | ||||||
| Philadelphia, PA, Gas Works Rev. (1998 General Ordinance), “15”, 5%, 8/01/2042 | 620,000 | 674,424 | ||||||
| Philadelphia, PA, Municipal Authority Rev., 6.5%, 4/01/2034 | 170,000 | 172,587 | ||||||
| Philadelphia, PA, School District, “A”, 5%, 9/01/2033 | 25,000 | 27,810 | ||||||
| Philadelphia, PA, School District, “A”, 5%, 9/01/2035 | 65,000 | 71,687 | ||||||
| Philadelphia, PA, School District, “A”, 5%, 9/01/2036 | 30,000 | 32,932 | ||||||
| Philadelphia, PA, School District, “A”, 5%, 9/01/2037 | 30,000 | 32,855 | ||||||
| Philadelphia, PA, School District, “A”, 5%, 9/01/2038 | 30,000 | 32,753 | ||||||
| Philadelphia, PA, School District, “B”, 5%, 9/01/2043 | 95,000 | 102,756 | ||||||
| Pittsburgh, PA, Urban Redevelopment Authority Rev., “C”, GNMA, 4.8%, 4/01/2028 | 1,475,000 | 1,479,292 | ||||||
| Scranton-Lackawanna, PA, Health and Welfare Authority, University Rev. (Marywood University Project), 5%, 6/01/2046 | 555,000 | 537,279 | ||||||
| State Public School Building Authority, PA, School Lease Rev. (The School District of Philadelphia Project), “A”, AGM, 5%, 6/01/2032 | 640,000 | 708,301 | ||||||
| Washington County, PA, Redevelopment Authority Refunding Rev. (Victory Centre Tax Increment Financing Project), 4%, 7/01/2023 | 30,000 | 29,851 | ||||||
44
Table of Contents
Portfolio of Investments – continued
| Issuer | Shares/Par | Value ($) | ||||||
| Municipal Bonds - continued | ||||||||
| Pennsylvania - continued | ||||||||
| Washington County, PA, Redevelopment Authority Refunding Rev. (Victory Centre Tax Increment Financing Project), 5%, 7/01/2035 | $ | 20,000 | $ | 19,999 | ||||
| West Shore, PA, Area Authority Rev. (Messiah Village Project) “A”, 5%, 7/01/2030 | 40,000 | 42,008 | ||||||
| West Shore, PA, Area Authority Rev. (Messiah Village Project) “A”, 5%, 7/01/2035 | 45,000 | 46,603 | ||||||
|
|
|
|||||||
| $ | 17,371,731 | |||||||
| Puerto Rico - 11.0% | ||||||||
| Commonwealth of Puerto Rico Aqueduct & Sewer Authority Rev., “A”, ASSD GTY, 5.125%, 7/01/2047 | $ | 265,000 | $ | 269,622 | ||||
| Commonwealth of Puerto Rico Highway & Transportation Authority Rev., ASSD GTY, 5.25%, 7/01/2041 | 325,000 | 356,798 | ||||||
| Commonwealth of Puerto Rico Highway & Transportation Authority Rev., “CC”, AGM, 5.5%, 7/01/2029 | 80,000 | 89,671 | ||||||
| Commonwealth of Puerto Rico Highway & Transportation Authority Rev., “CC”, AGM, 5.25%, 7/01/2032 | 80,000 | 88,181 | ||||||
| Commonwealth of Puerto Rico Highway & Transportation Authority Rev., “CC”, AGM, 5.25%, 7/01/2033 | 210,000 | 231,420 | ||||||
| Commonwealth of Puerto Rico Highway & Transportation Authority Rev., “CC”, AGM, 5.25%, 7/01/2036 | 85,000 | 93,273 | ||||||
| Commonwealth of Puerto Rico Highway & Transportation Authority Rev., “D”, AGM, 5%, 7/01/2032 | 440,000 | 453,433 | ||||||
| Commonwealth of Puerto Rico Highway & Transportation Authority Rev., “J”, NATL, 5%, 7/01/2029 | 45,000 | 45,035 | ||||||
| Commonwealth of Puerto Rico Highway & Transportation Authority Rev., “L”, AAC, 5.25%, 7/01/2038 | 1,205,000 | 1,283,482 | ||||||
| Commonwealth of Puerto Rico Highway & Transportation Authority Rev., “L”, ASSD GTY, 5.25%, 7/01/2041 | 480,000 | 526,963 | ||||||
| Commonwealth of Puerto Rico Highway & Transportation Authority Rev., “L”, NATL, 5.25%, 7/01/2035 | 680,000 | 701,019 | ||||||
| Commonwealth of Puerto Rico Highway & Transportation Authority Rev., “N”, AAC, 5.25%, 7/01/2030 | 325,000 | 351,367 | ||||||
| Commonwealth of Puerto Rico Highway & Transportation Authority Rev., “N”, AAC, 5.25%, 7/01/2031 | 210,000 | 227,092 | ||||||
| Commonwealth of Puerto Rico Highway & Transportation Authority Rev., “N”, ASSD GTY, 5.25%, 7/01/2034 | 385,000 | 423,870 | ||||||
| Commonwealth of Puerto Rico Highway & Transportation Authority Rev., “N”, ASSD GTY, 5.25%, 7/01/2036 | 655,000 | 718,758 | ||||||
| Commonwealth of Puerto Rico Highway & Transportation Authority Rev., “N”, NATL, 5.25%, 7/01/2033 | 120,000 | 124,837 | ||||||
| Commonwealth of Puerto Rico Highway & Transportation Authority Unrefunded Rev., “A”, NATL, 5%, 7/01/2038 | 45,000 | 44,666 | ||||||
45
Table of Contents
Portfolio of Investments – continued
| Issuer | Shares/Par | Value ($) | ||||||
| Municipal Bonds - continued | ||||||||
| Puerto Rico - continued | ||||||||
| Commonwealth of Puerto Rico, “A”, AGM, 5.375%, 7/01/2025 | $ | 60,000 | $ | 63,896 | ||||
| Commonwealth of Puerto Rico, “A”, NATL, 5.5%, 7/01/2020 | 185,000 | 189,331 | ||||||
| Commonwealth of Puerto Rico, “A”, NATL, 5.5%, 7/01/2021 | 40,000 | 41,404 | ||||||
| Commonwealth of Puerto Rico, Public Improvement, “A”, AGM, 5%, 7/01/2035 | 635,000 | 669,569 | ||||||
| Commonwealth of Puerto Rico, Public Improvement, “C”, AGM, 5.25%, 7/01/2027 | 35,000 | 36,420 | ||||||
| Commonwealth of Puerto Rico, Public Improvement, “C-7”, NATL, 6%, 7/01/2027 | 295,000 | 304,623 | ||||||
| Puerto Rico Convention Center District Authority, Hotel Occupancy Tax Rev., “A”, AAC, 5%, 7/01/2031 | 590,000 | 590,307 | ||||||
| Puerto Rico Electric Power Authority Rev., “MM”, NATL, 5%, 7/01/2020 | 5,000 | 5,079 | ||||||
| Puerto Rico Electric Power Authority Rev., “NN”, NATL, 5.25%, 7/01/2022 | 180,000 | 186,631 | ||||||
| Puerto Rico Electric Power Authority Rev., “NN”, NATL, 4.75%, 7/01/2033 | 30,000 | 29,893 | ||||||
| Puerto Rico Electric Power Authority Rev., “PP”, NATL, 5%, 7/01/2024 | 20,000 | 20,077 | ||||||
| Puerto Rico Electric Power Authority Rev., “PP”, NATL, 5%, 7/01/2025 | 20,000 | 20,065 | ||||||
| Puerto Rico Electric Power Authority Rev., “RR”, NATL, 5%, 7/01/2022 | 45,000 | 45,278 | ||||||
| Puerto Rico Electric Power Authority Rev., “SS”, NATL, 5%, 7/01/2019 | 700,000 | 703,430 | ||||||
| Puerto Rico Electric Power Authority Rev., “SS”, NATL, 5%, 7/01/2020 | 50,000 | 50,401 | ||||||
| Puerto Rico Electric Power Authority Rev., “TT”, NATL, 5%, 7/01/2024 | 80,000 | 80,306 | ||||||
| Puerto Rico Electric Power Authority Rev., “UU”, AGM, 5%, 7/01/2022 | 50,000 | 51,385 | ||||||
| Puerto Rico Electric Power Authority Rev., “UU”, NATL, 5%, 7/01/2019 | 80,000 | 80,562 | ||||||
| Puerto Rico Electric Power Authority Rev., “VV”, NATL, 5.25%, 7/01/2026 | 70,000 | 73,656 | ||||||
| Puerto Rico Electric Power Authority Rev., “VV”, NATL, 5.25%, 7/01/2030 | 305,000 | 319,542 | ||||||
| Puerto Rico Electric Power Authority Rev., “VV”, NATL, 5.25%, 7/01/2032 | 45,000 | 46,953 | ||||||
| Puerto Rico Industrial, Tourist, Educational, Medical & Environmental Control Facilities Financing Authority (Cogeneration Facilities - AES Puerto Rico Project), 6.625%, 6/01/2026 | 645,000 | 628,069 | ||||||
46
Table of Contents
Portfolio of Investments – continued
| Issuer | Shares/Par | Value ($) | ||||||
| Municipal Bonds - continued | ||||||||
| Puerto Rico - continued | ||||||||
| Puerto Rico Industrial, Tourist, Educational, Medical & Environmental Control Facilities Financing Authority, Educational Facilities Rev. (University Plaza Project), NATL, 5%, 7/01/2033 | $ | 355,000 | $ | 355,035 | ||||
| Puerto Rico Industrial, Tourist, Educational, Medical & Environmental Control Facilities Financing Authority, Higher Education Rev. (Ana G. Mendez University System Project), 4%, 4/01/2020 | 20,000 | 19,765 | ||||||
| Puerto Rico Industrial, Tourist, Educational, Medical & Environmental Control Facilities Financing Authority, Higher Education Rev. (Ana G. Mendez University System Project), 5%, 3/01/2021 | 10,000 | 9,978 | ||||||
| Puerto Rico Industrial, Tourist, Educational, Medical & Environmental Control Facilities Financing Authority, Higher Education Rev. (Ana G. Mendez University System Project), 5%, 4/01/2021 | 65,000 | 65,291 | ||||||
| Puerto Rico Industrial, Tourist, Educational, Medical & Environmental Control Facilities Financing Authority, Higher Education Rev. (Ana G. Mendez University System Project), 5.375%, 12/01/2021 | 35,000 | 34,927 | ||||||
| Puerto Rico Industrial, Tourist, Educational, Medical & Environmental Control Facilities Financing Authority, Higher Education Rev. (Ana G. Mendez University System Project), 5%, 4/01/2022 | 75,000 | 74,812 | ||||||
| Puerto Rico Industrial, Tourist, Educational, Medical & Environmental Control Facilities Financing Authority, Higher Education Rev. (Ana G. Mendez University System Project), 5%, 3/01/2026 | 15,000 | 14,625 | ||||||
| Puerto Rico Industrial, Tourist, Educational, Medical & Environmental Control Facilities Financing Authority, Higher Education Rev. (Ana G. Mendez University System Project), 5%, 4/01/2027 | 240,000 | 232,800 | ||||||
| Puerto Rico Industrial, Tourist, Educational, Medical & Environmental Control Facilities Financing Authority, Higher Education Rev. (Ana G. Mendez University System Project), 5.5%, 12/01/2031 | 80,000 | 78,200 | ||||||
| Puerto Rico Industrial, Tourist, Educational, Medical & Environmental Control Facilities Financing Authority, Higher Education Rev. (Ana G. Mendez University System Project), 5.125%, 4/01/2032 | 90,000 | 85,275 | ||||||
| Puerto Rico Industrial, Tourist, Educational, Medical & Environmental Control Facilities Financing Authority, Higher Education Rev. (Ana G. Mendez University System Project), 5%, 3/01/2036 | 90,000 | 83,025 | ||||||
| Puerto Rico Industrial, Tourist, Educational, Medical & Environmental Control Facilities Financing Authority, Higher Education Rev. (Ana G. Mendez University System Project), 5.375%, 4/01/2042 | 70,000 | 65,275 | ||||||
| Puerto Rico Industrial, Tourist, Educational, Medical & Environmental Control Facilities Financing Authority, Higher Education Rev. (University of Sacred Heart), 4.375%, 10/01/2031 | 55,000 | 48,812 | ||||||
| Puerto Rico Industrial, Tourist, Educational, Medical & Environmental Control Facilities Financing Authority, Higher Education Rev. (University of Sacred Heart), 5%, 10/01/2042 | 30,000 | 26,213 | ||||||
| Puerto Rico Infrastructure Financing Authority Special Tax Rev., “C”, AAC, 5.5%, 7/01/2023 | 405,000 | 433,982 | ||||||
47
Table of Contents
Portfolio of Investments – continued
| Issuer | Shares/Par | Value ($) | ||||||
| Municipal Bonds - continued | ||||||||
| Puerto Rico - continued | ||||||||
| Puerto Rico Infrastructure Financing Authority Special Tax Rev., “C”, AAC, 5.5%, 7/01/2024 | $ | 515,000 | $ | 556,689 | ||||
| Puerto Rico Infrastructure Financing Authority Special Tax Rev., “C”, AAC, 5.5%, 7/01/2025 | 85,000 | 92,557 | ||||||
| Puerto Rico Infrastructure Financing Authority Special Tax Rev., “C”, AAC, 5.5%, 7/01/2027 | 620,000 | 681,256 | ||||||
| Puerto Rico Infrastructure Financing Authority Special Tax Rev., “C”, AAC, 5.5%, 7/01/2028 | 90,000 | 99,142 | ||||||
| Puerto Rico Municipal Finance Agency, “A”, AGM, 5%, 8/01/2027 | 25,000 | 25,906 | ||||||
| Puerto Rico Public Buildings Authority Government Facilities Rev., “I”, ASSD GTY, 5%, 7/01/2036 | 55,000 | 56,325 | ||||||
| Puerto Rico Public Buildings Authority Government Facilities Rev., “M-3”, NATL, 6%, 7/01/2027 | 125,000 | 129,077 | ||||||
| Puerto Rico Public Buildings Authority Government Facilities Rev., “M-3”, NATL, 6%, 7/01/2028 | 40,000 | 41,210 | ||||||
| Puerto Rico Public Buildings Authority Rev., “M-2”, AAC, 10%, 7/01/2035 | 490,000 | 518,327 | ||||||
| Puerto Rico Public Finance Corp., “E”, ETM, 6%, 8/01/2026 | 155,000 | 190,650 | ||||||
| Puerto Rico Public Finance Corp., “E”, ETM, 6%, 8/01/2026 | 1,645,000 | 2,023,350 | ||||||
| Puerto Rico Sales Tax Financing Corp., Sales Tax Rev., Capital Appreciation, “A”, AAC, 0%, 8/01/2054 | 855,000 | 126,993 | ||||||
| Puerto Rico Sales Tax Financing Corp., Sales Tax Rev., Capital Appreciation, “A”, NATL, 0%, 8/01/2040 | 410,000 | 128,576 | ||||||
| Puerto Rico Sales Tax Financing Corp., Sales Tax Rev., Capital Appreciation, “A”, NATL, 0%, 8/01/2041 | 330,000 | 98,102 | ||||||
| Puerto Rico Sales Tax Financing Corp., Sales Tax Rev., Capital Appreciation, “A”, NATL, 0%, 8/01/2042 | 1,285,000 | 362,833 | ||||||
| Puerto Rico Sales Tax Financing Corp., Sales Tax Rev., Capital Appreciation, “A”, NATL, 0%, 8/01/2043 | 465,000 | 124,392 | ||||||
| Puerto Rico Sales Tax Financing Corp., Sales Tax Rev., Capital Appreciation, “A”, NATL, 0%, 8/01/2044 | 205,000 | 51,926 | ||||||
| Puerto Rico Sales Tax Financing Corp., Sales Tax Rev., Capital Appreciation, “A”, NATL, 0%, 8/01/2045 | 145,000 | 34,857 | ||||||
| Puerto Rico Sales Tax Financing Corp., Sales Tax Rev., Capital Appreciation, “A”, NATL, 0%, 8/01/2046 | 2,985,000 | 680,878 | ||||||
| University of Puerto Rico Rev., “P”, NATL, 5%, 6/01/2025 | 45,000 | 45,146 | ||||||
|
|
|
|||||||
| $ | 17,962,571 | |||||||
| Rhode Island - 0.6% | ||||||||
| Rhode Island Health & Educational Building Corp. Rev., Hospital Financing (Lifespan Obligated Group), “A”, ASSD GTY, 7%, 5/15/2039 (Prerefunded 5/15/2019) | $ | 840,000 | $ | 859,085 | ||||
48
Table of Contents
Portfolio of Investments – continued
| Issuer | Shares/Par | Value ($) | ||||||
| Municipal Bonds - continued | ||||||||
| Rhode Island - continued | ||||||||
| Rhode Island Student Loan Authority, Student Loan Rev., “A”, 3.5%, 12/01/2034 | $ | 165,000 | $ | 162,162 | ||||
|
|
|
|||||||
| $ | 1,021,247 | |||||||
| South Carolina - 1.5% | ||||||||
| Richland County, SC, Environmental Improvement Rev. (International Paper), “A”, 3.875%, 4/01/2023 | $ | 645,000 | $ | 673,309 | ||||
| South Carolina Jobs & Economic Development Authority, Health Facilities Rev. (Lutheran Homes of South Carolina, Inc.), 5.125%, 5/01/2048 | 50,000 | 49,213 | ||||||
| South Carolina Jobs & Economic Development Authority, Residential Care Facilities Rev. (South Carolina Episcopal Home at Still Hopes), 5%, 4/01/2047 | 100,000 | 100,806 | ||||||
| South Carolina Jobs & Economic Development Authority, Residential Care Facilities Rev. (South Carolina Episcopal Home at Still Hopes), 5%, 4/01/2052 | 65,000 | 65,215 | ||||||
| South Carolina Public Service Authority Rev., “A”, 5.125%, 12/01/2043 | 355,000 | 371,110 | ||||||
| South Carolina Public Service Authority Rev., “B”, 5.125%, 12/01/2043 | 845,000 | 883,346 | ||||||
| Spartanburg County, SC, Regional Health Services District Hospital Rev., “A”, 5%, 4/15/2048 | 320,000 | 342,746 | ||||||
|
|
|
|||||||
| $ | 2,485,745 | |||||||
| Tennessee - 2.8% | ||||||||
| Chattanooga, TN, Health Educational & Housing Facility Board Rev. (Catholic Health Initiatives), “A”, 5.25%, 1/01/2045 | $ | 1,295,000 | $ | 1,370,097 | ||||
| Knox County, TN, Health, Educational & Housing Facility Board Rev. (University Health System, Inc.), 5%, 4/01/2030 | 60,000 | 65,462 | ||||||
| Knox County, TN, Health, Educational & Housing Facility Board Rev. (University Health System, Inc.), 5%, 4/01/2031 | 65,000 | 70,634 | ||||||
| Knox County, TN, Health, Educational & Housing Facility Board Rev. (University Health System, Inc.), 5%, 4/01/2036 | 40,000 | 42,641 | ||||||
| Metropolitan Government of Nashville & Davidson County, TN, Health & Educational Facilities Board Rev. (Trousdale Foundation Properties), “A”, 6.25%, 4/01/2049 | 550,000 | 536,800 | ||||||
| Tennessee Energy Acquisition Corp., Gas Rev., “A”, 5.25%, 9/01/2021 | 2,185,000 | 2,341,315 | ||||||
| Tennessee Energy Acquisition Corp., Gas Rev., “A”, 5.25%, 9/01/2024 | 75,000 | 84,359 | ||||||
|
|
|
|||||||
| $ | 4,511,308 | |||||||
| Texas - 10.9% | ||||||||
| Arlington, TX, Higher Education Finance Corp. Education Rev. (Newman International Academy), “A”, 5.375%, 8/15/2036 | $ | 50,000 | $ | 50,231 | ||||
49
Table of Contents
Portfolio of Investments – continued
| Issuer | Shares/Par | Value ($) | ||||||
| Municipal Bonds - continued | ||||||||
| Texas - continued | ||||||||
| Arlington, TX, Higher Education Finance Corp. Education Rev. (Newman International Academy), “A”, 5.5%, 8/15/2046 | $ | 230,000 | $ | 229,979 | ||||
| Arlington, TX, Higher Education Finance Corp. Education Rev. (Wayside Schools), “A”, 4.375%, 8/15/2036 | 35,000 | 33,358 | ||||||
| Arlington, TX, Higher Education Finance Corp. Education Rev. (Wayside Schools), “A”, 4.625%, 8/15/2046 | 60,000 | 56,987 | ||||||
| Austin, TX, Convention Center (Convention Enterprises, Inc.), “A”, 5%, 1/01/2029 | 45,000 | 49,869 | ||||||
| Austin, TX, Convention Center (Convention Enterprises, Inc.), “A”, 5%, 1/01/2031 | 65,000 | 71,709 | ||||||
| Austin, TX, Convention Center (Convention Enterprises, Inc.), “A”, 5%, 1/01/2034 | 10,000 | 10,656 | ||||||
| Austin, TX, Convention Center (Convention Enterprises, Inc.), “B”, 5%, 1/01/2026 | 25,000 | 27,233 | ||||||
| Austin, TX, Convention Center (Convention Enterprises, Inc.), “B”, 5%, 1/01/2028 | 25,000 | 27,287 | ||||||
| Austin, TX, Convention Center (Convention Enterprises, Inc.), “B”, 5%, 1/01/2030 | 30,000 | 32,439 | ||||||
| Central Texas Regional Mobility Authority Senior Lien Rev., “A”, 5%, 1/01/2045 | 115,000 | 122,408 | ||||||
| Clifton, TX, Higher Education Finance Corp. Rev. (Idea Public Schools), 6%, 8/15/2033 | 130,000 | 144,254 | ||||||
| Clifton, TX, Higher Education Finance Corp. Rev. (Idea Public Schools), 5.75%, 8/15/2041 (Prerefunded 8/15/2021) | 100,000 | 109,051 | ||||||
| Clifton, TX, Higher Education Finance Corp. Rev. (Idea Public Schools), 5%, 8/15/2042 | 520,000 | 538,580 | ||||||
| Clifton, TX, Higher Education Finance Corp. Rev. (Idea Public Schools), 6%, 8/15/2043 | 210,000 | 229,690 | ||||||
| Clifton, TX, Higher Education Finance Corp. Rev. (Uplift Education), “A”, 6.125%, 12/01/2040 (Prerefunded 12/01/2020) | 320,000 | 344,928 | ||||||
| Clifton, TX, Higher Education Finance Corp. Rev. (Uplift Education), “A”, 6.25%, 12/01/2045 (Prerefunded 12/01/2020) | 200,000 | 216,066 | ||||||
| Dallas and Fort Worth, TX, International Airport Rev., “B”, 5%, 11/01/2044 | 465,000 | 498,661 | ||||||
| Dallas, TX, Civic Center Convention Complex Rev., ASSD GTY, 5.25%, 8/15/2034 | 1,065,000 | 1,087,280 | ||||||
| Decatur Hospital Authority Rev. (Wise Regional Health System), “A”, 5.25%, 9/01/2044 | 130,000 | 136,703 | ||||||
| Gulf Coast, TX, Industrial Development Authority Rev. (CITGO Petroleum Corp.), 4.875%, 5/01/2025 | 135,000 | 137,369 | ||||||
| Gulf Coast, TX, Industrial Development Authority Rev. (CITGO | ||||||||
| Petroleum Corp.), 8%, 4/01/2028 | 500,000 | 504,480 | ||||||
| Harris County-Houston, TX, Sports Authority Rev., “C”, 5%, 11/15/2031 | 140,000 | 152,881 | ||||||
50
Table of Contents
Portfolio of Investments – continued
| Issuer | Shares/Par | Value ($) | ||||||
| Municipal Bonds - continued | ||||||||
| Texas - continued | ||||||||
| Harris County-Houston, TX, Sports Authority Rev., “C”, 5%, 11/15/2032 | $ | 20,000 | $ | 21,806 | ||||
| Harris County-Houston, TX, Sports Authority Rev., “C”, 5%, 11/15/2033 | 50,000 | 54,347 | ||||||
| Harris County-Houston, TX, Sports Authority Rev., Capital Appreciation, “A”, AGM, 0%, 11/15/2041 | 90,000 | 32,180 | ||||||
| Harris County-Houston, TX, Sports Authority Rev., Capital Appreciation, “A”, AGM, 0%, 11/15/2046 | 220,000 | 60,601 | ||||||
| Houston, TX, Airport System Rev., “B”, 5%, 7/01/2026 | 210,000 | 224,217 | ||||||
| Houston, TX, Airport System Rev., Special Facilities Rev. (Continental Airlines, Inc.), 6.5%, 7/15/2030 | 555,000 | 598,379 | ||||||
| Houston, TX, Airport System Rev., Special Facilities Rev. (United Airlines, Inc. Terminal E Project), 4.5%, 7/01/2020 | 155,000 | 158,644 | ||||||
| Houston, TX, Airport System Rev., Special Facilities Rev. (United Airlines, Inc. Terminal E Project), 4.75%, 7/01/2024 | 200,000 | 212,828 | ||||||
| Houston, TX, Airport System Rev., Special Facilities Rev. (United Airlines, Inc. Terminal E Project), 5%, 7/01/2029 | 875,000 | 939,094 | ||||||
| Houston, TX, Airport System Rev., Special Facilities Rev. (United | ||||||||
| Airlines, Inc. Terminal Improvement Projects), “B-1”, 5%, 7/15/2030 | 485,000 | 522,854 | ||||||
| Houston, TX, Airport System Rev., Subordinate Lien, “A”, 5%, 7/01/2031 | 190,000 | 203,121 | ||||||
| Houston, TX, Industrial Development Corp. (United Parcel Service, Inc.), 6%, 3/01/2023 | 400,000 | 400,752 | ||||||
| La Vernia, TX, Higher Education Finance Corp. Rev. (KIPP, Inc.), “A”, 6.25%, 8/15/2039 (Prerefunded 8/15/2019) | 250,000 | 257,347 | ||||||
| Mission, TX, Economic Development Corp. (NatGasoline Project), 4.625%, 10/01/2031 | 225,000 | 227,862 | ||||||
| New Hope, TX, Cultural Education Facilities Finance Corp., Capital Improvement Rev. (CHF - Collegiate Housing Denton, L.L.C. - Texas Woman’s University Housing Project), “A-1”, AGM, 5%, 7/01/2038 | 30,000 | 32,537 | ||||||
| New Hope, TX, Cultural Education Facilities Finance Corp., Capital Improvement Rev. (CHF - Collegiate Housing Denton, L.L.C. - Texas Woman’s University Housing Project), “A-1”, AGM, 5%, 7/01/2048 | 110,000 | 117,647 | ||||||
| New Hope, TX, Cultural Education Facilities Finance Corp., Capital Improvement Rev. (CHF - Collegiate Housing Denton, L.L.C. - Texas Woman’s University Housing Project), “A-1”, AGM, 5%, 7/01/2058 | 105,000 | 111,116 | ||||||
| New Hope, TX, Cultural Education Facilities Finance Corp., Retirement Facility Rev. (MRC Senior Living - The Langford Project), “A”, 5%, 11/15/2026 | 15,000 | 14,941 | ||||||
| New Hope, TX, Cultural Education Facilities Finance Corp., Retirement Facility Rev. (MRC Senior Living - The Langford Project), “A”, 5.375%, 11/15/2036 | 20,000 | 19,627 | ||||||
51
Table of Contents
Portfolio of Investments – continued
| Issuer | Shares/Par | Value ($) | ||||||
| Municipal Bonds - continued | ||||||||
| Texas - continued | ||||||||
| New Hope, TX, Cultural Education Facilities Finance Corp., Retirement Facility Rev. (MRC Senior Living - The Langford Project), “A”, 5.5%, 11/15/2046 | $ | 50,000 | $ | 48,951 | ||||
| New Hope, TX, Cultural Education Facilities Finance Corp., Retirement Facility Rev. (MRC Senior Living - The Langford Project), “A”, 5.5%, 11/15/2052 | 55,000 | 53,354 | ||||||
| New Hope, TX, Cultural Education Facilities Finance Corp., Senior Living Rev. (Cardinal Bay, Inc. - Village on the Park/Carriage Inn Project), “A-1”, 5%, 7/01/2031 | 20,000 | 22,065 | ||||||
| New Hope, TX, Cultural Education Facilities Finance Corp., Senior Living Rev. (Cardinal Bay, Inc. - Village on the Park/Carriage Inn Project), “A-1”, 4%, 7/01/2036 | 90,000 | 89,996 | ||||||
| New Hope, TX, Cultural Education Facilities Finance Corp., Senior Living Rev. (Cardinal Bay, Inc. - Village on the Park/Carriage Inn Project), “A-1”, 5%, 7/01/2046 | 185,000 | 197,356 | ||||||
| New Hope, TX, Cultural Education Facilities Finance Corp., Senior Living Rev. (Cardinal Bay, Inc. - Village on the Park/Carriage Inn Project), “A-1”, 5%, 7/01/2051 | 180,000 | 191,416 | ||||||
| New Hope, TX, Cultural Education Facilities Finance Corp., Senior Living Rev. (Cardinal Bay, Inc. - Village on the Park/Carriage Inn Project), “B”, 4%, 7/01/2031 | 40,000 | 39,493 | ||||||
| New Hope, TX, Cultural Education Facilities Finance Corp., Senior Living Rev. (Cardinal Bay, Inc. - Village on the Park/Carriage Inn Project), “B”, 4.25%, 7/01/2036 | 65,000 | 64,521 | ||||||
| New Hope, TX, Cultural Education Facilities Finance Corp., Senior Living Rev. (Cardinal Bay, Inc. - Village on the Park/Carriage Inn Project), “B”, 5%, 7/01/2046 | 165,000 | 170,133 | ||||||
| New Hope, TX, Cultural Education Facilities Finance Corp., Senior Living Rev. (Cardinal Bay, Inc. - Village on the Park/Carriage Inn Project), “B”, 4.75%, 7/01/2051 | 145,000 | 146,743 | ||||||
| New Hope, TX, Cultural Education Facilities Finance Corp., Student Housing Rev. (CHF - Collegiate Housing Stephenville III, L.L.C. - Tarleton State University Project), 5%, 4/01/2030 | 35,000 | 36,897 | ||||||
| New Hope, TX, Cultural Education Facilities Finance Corp., Student Housing Rev. (CHF - Collegiate Housing Stephenville III, L.L.C. - Tarleton State University Project), 5%, 4/01/2035 | 30,000 | 31,218 | ||||||
| New Hope, TX, Cultural Education Facilities Finance Corp., Student Housing Rev. (CHF - Collegiate Housing Stephenville III, L.L.C. - Tarleton State University Project), 5%, 4/01/2047 | 85,000 | 87,264 | ||||||
| Newark, TX, Higher Education Finance Corp. Rev. (A+ Charter Schools, Inc.), “A”, 5.5%, 8/15/2035 | 105,000 | 108,795 | ||||||
| Newark, TX, Higher Education Finance Corp. Rev. (A+ Charter Schools, Inc.), “A”, 5.75%, 8/15/2045 | 140,000 | 145,418 | ||||||
52
Table of Contents
Portfolio of Investments – continued
| Issuer | Shares/Par | Value ($) | ||||||
| Municipal Bonds - continued | ||||||||
| Texas - continued | ||||||||
| Newark, TX, Higher Education Finance Corp. Rev. (Austin Achieve Public Schools, Inc.), 5%, 6/15/2033 | $ | 5,000 | $ | 5,040 | ||||
| Newark, TX, Higher Education Finance Corp. Rev. (Austin Achieve Public Schools, Inc.), 5%, 6/15/2038 | 15,000 | 15,038 | ||||||
| Newark, TX, Higher Education Finance Corp. Rev. (Austin Achieve Public Schools, Inc.), 5%, 6/15/2048 | 35,000 | 34,938 | ||||||
| Newark, TX, Higher Education Finance Corp. Rev. (Austin Achieve Public Schools, Inc.), “A”, 5%, 6/15/2032 | 30,000 | 29,594 | ||||||
| Newark, TX, Higher Education Finance Corp. Rev. (Austin Achieve Public Schools, Inc.), “A”, 5%, 6/15/2037 | 35,000 | 33,690 | ||||||
| Newark, TX, Higher Education Finance Corp. Rev. (Austin Achieve Public Schools, Inc.), “A”, 5%, 6/15/2042 | 40,000 | 37,730 | ||||||
| Newark, TX, Higher Education Finance Corp. Rev. (Austin Achieve Public Schools, Inc.), “A”, 5.25%, 6/15/2048 | 75,000 | 71,960 | ||||||
| North Texas Education Finance Corp., Education Rev. (Uplift Education), “A”, 5.125%, 12/01/2042 | 215,000 | 222,383 | ||||||
| North Texas Tollway Authority Rev., 6%, 1/01/2038 (Prerefunded 1/01/2021) | 970,000 | 1,046,814 | ||||||
| North Texas Tollway Authority Rev. (Special Projects System), “D”, 5%, 9/01/2031 (Prerefunded 9/01/2021) | 710,000 | 763,967 | ||||||
| Red River, TX, Education Finance Corp., Higher Education Rev. (Houston Baptist University Project), 5.5%, 10/01/2046 | 295,000 | 312,653 | ||||||
| Red River, TX, Health Facilities Development Corp., Retirement Facilities Rev. (MRC The Crossings Project), “A”, 7.5%, 11/15/2034 | 130,000 | 144,772 | ||||||
| Red River, TX, Health Facilities Development Corp., Retirement Facilities Rev. (MRC The Crossings Project), “A”, 7.75%, 11/15/2044 | 235,000 | 262,763 | ||||||
| Red River, TX, Health Facilities Development Corp., Retirement Facilities Rev. (MRC The Crossings Project), “A”, 8%, 11/15/2049 | 170,000 | 191,762 | ||||||
| Tarrant County, TX, Cultural Education Facilities Finance Corp. Retirement Facility Rev. (Air Force Village Obligated Group Project), 6.125%, 11/15/2029 (Prerefunded 11/15/2019) | 65,000 | 67,521 | ||||||
| Tarrant County, TX, Cultural Education Facilities Finance Corp. Retirement Facility Rev. (Air Force Village Obligated Group Project), 6.375%, 11/15/2044 (Prerefunded 11/15/2019) | 525,000 | 546,588 | ||||||
| Tarrant County, TX, Cultural Education Facilities Finance Corp. Retirement Facility Rev. (Barton Creek Senior Living Center, Inc., Querencia Project), 5%, 11/15/2030 | 100,000 | 103,133 | ||||||
| Tarrant County, TX, Cultural Education Facilities Finance Corp. Retirement Facility Rev. (Barton Creek Senior Living Center, Inc., Querencia Project), 5%, 11/15/2035 | 130,000 | 132,517 | ||||||
| Tarrant County, TX, Cultural Education Facilities Finance Corp. Retirement Facility Rev. (Barton Creek Senior Living Center, Inc., Querencia Project), 5%, 11/15/2040 | 140,000 | 142,379 | ||||||
53
Table of Contents
Portfolio of Investments – continued
| Issuer | Shares/Par | Value ($) | ||||||
| Municipal Bonds - continued | ||||||||
| Texas - continued | ||||||||
| Tarrant County, TX, Cultural Education Facilities Finance Corp. Retirement Facility Rev. (Buckingham Senior Living Community, Inc. Project), “A”, 5.25%, 11/15/2035 | $ | 55,000 | $ | 43,450 | ||||
| Tarrant County, TX, Cultural Education Facilities Finance Corp. Retirement Facility Rev. (Buckingham Senior Living Community, Inc. Project), “A”, 5.5%, 11/15/2045 | 250,000 | 197,500 | ||||||
| Tarrant County, TX, Cultural Education Facilities Finance Corp. Retirement Facility Rev. (Buckner Senior Living - Ventana Project), “B-3”, 3.875%, 11/15/2022 | 95,000 | 94,295 | ||||||
| Tarrant County, TX, Cultural Education Facilities Finance Corp. Retirement Facility Rev. (Northwest Senior Housing Corporation Edgemere Project), “A”, 5%, 11/15/2045 | 145,000 | 143,724 | ||||||
| Tarrant County, TX, Cultural Education Facilities Finance Corp. Retirement Facility Rev. (Northwest Senior Housing Corporation Edgemere Project), “B”, 5%, 11/15/2030 | 195,000 | 198,196 | ||||||
| Tarrant County, TX, Cultural Education Facilities Finance Corp. Retirement Facility Rev. (Northwest Senior Housing Corporation Edgemere Project), “B”, 5%, 11/15/2036 | 440,000 | 441,267 | ||||||
| Tarrant County, TX, Cultural Education Facilities Finance Corp. Retirement Facility Rev. (Stayton at Museum Way), 8.25%, 11/15/2044 | 980,000 | 882,000 | ||||||
| Tarrant County, TX, Cultural Education Facilities Finance Corp. Retirement Facility Rev. (Trinity Terrace Project), “A-1”, 5%, 10/01/2044 | 75,000 | 77,950 | ||||||
| Texas Gas Acquisition & Supply Corp III., Gas Supply Rev., 5%, 12/15/2031 | 190,000 | 203,281 | ||||||
| Texas Private Activity Surface Transportation Corp. Senior Lien Rev. (NTE Mobility Partners Segments 3 LLC Segments 3A & 3B Facility), 7%, 12/31/2038 | 210,000 | 242,040 | ||||||
| Texas Private Activity Surface Transportation Corp. Senior Lien Rev. (NTE Mobility Partners Segments 3 LLC Segments 3A & 3B Facility), 6.75%, 6/30/2043 | 170,000 | 193,378 | ||||||
| Texas Transportation Commission, Central Texas Turnpike System Rev., Capital Appreciation, “B”, 0%, 8/15/2036 | 435,000 | 204,811 | ||||||
| Travis County, TX, Health Facilities Development Corp. Rev. (Westminster Manor Health), 7%, 11/01/2030 (Prerefunded 11/01/2020) | 90,000 | 98,116 | ||||||
| Travis County, TX, Health Facilities Development Corp. Rev. (Westminster Manor Health), 7.125%, 11/01/2040 (Prerefunded 11/01/2020) | 165,000 | 180,262 | ||||||
| Travis County, TX, Health Facilities Development Corp. Rev., Unrefunded Balance (Westminster Manor Health), 7%, 11/01/2030 | 10,000 | 10,513 | ||||||
|
|
|
|||||||
| $ | 17,831,644 | |||||||
54
Table of Contents
Portfolio of Investments – continued
| Issuer | Shares/Par | Value ($) | ||||||
| Municipal Bonds - continued | ||||||||
| Utah - 0.5% | ||||||||
| Salt Lake City, UT, Salt Lake City International Airport Rev., “A”, 5%, 7/01/2043 | $ | 495,000 | $ | 541,891 | ||||
| Utah Charter School Finance Authority, Charter School Rev. (Reagan Academy Project), 5%, 2/15/2046 | 150,000 | 146,500 | ||||||
| Utah Charter School Finance Authority, Charter School Rev. (Spectrum Academy), 6%, 4/15/2045 | 160,000 | 162,706 | ||||||
|
|
|
|||||||
| $ | 851,097 | |||||||
| Vermont - 0.2% | ||||||||
| Burlington, VT, Airport Rev., “A”, 4%, 7/01/2028 | $ | 110,000 | $ | 113,099 | ||||
| State of Vermont, Student Assistance Corp. Education Loan Rev., “B”, 4.375%, 6/15/2046 | 185,000 | 174,505 | ||||||
|
|
|
|||||||
| $ | 287,604 | |||||||
| Virginia - 2.0% | ||||||||
| Embrey Mill Community Development Authority, VA, Special Assessment Rev., 7.25%, 3/01/2043 | $ | 515,000 | $ | 548,022 | ||||
| Norfolk, VA, Redevelopment & Housing Authority Rev. (Fort Norfolk Retirement Community), 5%, 1/01/2046 | 70,000 | 70,143 | ||||||
| Norfolk, VA, Redevelopment & Housing Authority Rev. (Fort Norfolk Retirement Community), 5.375%, 1/01/2046 | 165,000 | 169,854 | ||||||
| Peninsula Town Center Community Development Authority, VA, Special Obligation Refunding, 5%, 9/01/2037 | 145,000 | 150,076 | ||||||
| Peninsula Town Center Community Development Authority, VA, Special Obligation Refunding, 4.5%, 9/01/2045 | 190,000 | 185,936 | ||||||
| Prince William County, VA, Cherry Hill Community Development Authority Rev. (Potomac Shores Project), 5.4%, 3/01/2045 | 120,000 | 121,510 | ||||||
| Virginia College Building Authority, Educational Facilities Rev. (Marymount University), “B”, 5.25%, 7/01/2030 | 215,000 | 227,846 | ||||||
| Virginia College Building Authority, Educational Facilities Rev. (Marymount University), “B”, 5.25%, 7/01/2035 | 215,000 | 224,830 | ||||||
| Virginia Small Business Financing Authority Rev. (Elizabeth River Crossings Opco LLC Project), 6%, 1/01/2037 | 490,000 | 529,273 | ||||||
| Virginia Small Business Financing Authority Rev. (Elizabeth River Crossings Opco LLC Project), 5.5%, 1/01/2042 | 950,000 | 1,004,967 | ||||||
|
|
|
|||||||
| $ | 3,232,457 | |||||||
| Washington - 4.3% | ||||||||
| Kalispel Tribe Indians, WA, Priority District Rev., “A”, 5%, 1/01/2032 (n) | $ | 155,000 | $ | 160,600 | ||||
| Kalispel Tribe Indians, WA, Priority District Rev., “A”, 5.25%, 1/01/2038 (n) | 160,000 | 165,240 | ||||||
| King County, WA, Sewer Rev., 5%, 1/01/2040 (Prerefunded 7/01/2020) | 1,200,000 | 1,253,808 | ||||||
55
Table of Contents
Portfolio of Investments – continued
| Issuer | Shares/Par | Value ($) | ||||||
| Municipal Bonds - continued | ||||||||
| Washington - continued | ||||||||
| King County, WA, Sewer Rev., 5%, 1/01/2040 (Prerefunded 7/01/2020) | $ | 565,000 | $ | 591,685 | ||||
| Olympia, WA, Healthcare Facilities Authority Rev. (Catholic Health Initiatives), “D”, 6.375%, 10/01/2036 | 1,405,000 | 1,409,173 | ||||||
| Washington Health Care Facilities Authority Rev. (Multicare Health Systems), “B”, ASSD GTY, 6%, 8/15/2039 (Prerefunded 8/15/2019) | 560,000 | 575,574 | ||||||
| Washington Health Care Facilities Authority Rev. (Providence Health & Services), “A”, 5%, 10/01/2033 | 1,395,000 | 1,513,129 | ||||||
| Washington Health Care Facilities Authority Rev. (Virginia Mason Medical Center), 5%, 8/15/2035 | 120,000 | 127,490 | ||||||
| Washington Health Care Facilities Authority Rev. (Virginia Mason Medical Center), 5%, 8/15/2037 | 115,000 | 121,380 | ||||||
| Washington Higher Education Facilities Authority Rev. (Whitworth University), 5.875%, 10/01/2034 (Prerefunded 10/01/2019) | 355,000 | 366,218 | ||||||
| Washington Housing Finance Commission Nonprofit Housing Refunding Rev. (Judson Park Project), 5%, 7/01/2048 | 100,000 | 100,899 | ||||||
| Washington Housing Finance Commission Nonprofit Housing Refunding Rev. (The Hearthstone Project), “A”, 5%, 7/01/2048 | 175,000 | 174,457 | ||||||
| Washington Housing Finance Commission Nonprofit Housing Rev. (Presbyterian Retirement Communities Northwest Projects), “A”, 5%, 1/01/2036 | 100,000 | 104,245 | ||||||
| Washington Housing Finance Commission Nonprofit Housing Rev. (Presbyterian Retirement Communities Northwest Projects), “A”, 5%, 1/01/2046 | 130,000 | 134,090 | ||||||
| Washington Housing Finance Commission Nonprofit Housing Rev. (Presbyterian Retirement Communities Northwest Projects), “A”, 5%, 1/01/2051 | 150,000 | 154,208 | ||||||
|
|
|
|||||||
| $ | 6,952,196 | |||||||
| West Virginia - 0.4% | ||||||||
| Monongalia County, WV, Building Commission Improvement Rev. (Monongalia Health System Obligated Group), 5%, 7/01/2029 | $ | 50,000 | $ | 54,849 | ||||
| Monongalia County, WV, Building Commission Improvement Rev. (Monongalia Health System Obligated Group), 5%, 7/01/2030 | 105,000 | 114,798 | ||||||
| Monongalia County, WV, Special District Excise Tax Rev., Refunding & Improvement Bonds (University Town Centre Economic Opportunity Development District), “A”, 5.5%, 6/01/2037 | 135,000 | 136,643 | ||||||
| West Virginia Hospital Finance Authority Hospital Rev. (Cabell Huntington Hospital Obligated Group), “A”, 5%, 1/01/2043 | 385,000 | 415,273 | ||||||
|
|
|
|||||||
| $ | 721,563 | |||||||
| Wisconsin - 6.3% | ||||||||
| State of Wisconsin, Annual Appropriations Rev., “A”, 5.75%, 5/01/2033 (Prerefunded 5/01/2019) | $ | 80,000 | $ | 81,288 | ||||
56
Table of Contents
Portfolio of Investments – continued
| Issuer | Shares/Par | Value ($) | ||||||
| Municipal Bonds - continued | ||||||||
| Wisconsin - continued | ||||||||
| State of Wisconsin, Annual Appropriations Rev., Unrefunded Balance “A”, 5.75%, 5/01/2033 (Prerefunded 5/01/2019) | $ | 760,000 | $ | 772,236 | ||||
| Wisconsin Health & Educational Facilities Authority Refunding Rev. (American Baptist Homes), 5%, 8/01/2027 | 135,000 | 139,593 | ||||||
| Wisconsin Health & Educational Facilities Authority Refunding Rev. (American Baptist Homes), 5%, 8/01/2032 | 125,000 | 126,393 | ||||||
| Wisconsin Health & Educational Facilities Authority Refunding Rev. (American Baptist Homes), 5%, 8/01/2037 | 70,000 | 70,044 | ||||||
| Wisconsin Health & Educational Facilities Authority Refunding Rev. (American Baptist Homes), 5%, 8/01/2039 | 70,000 | 69,728 | ||||||
| Wisconsin Health & Educational Facilities Authority Rev. (Aurora Health Care, Inc.), “A”, 5%, 7/15/2026 (Prerefunded 7/15/2021) | 250,000 | 268,605 | ||||||
| Wisconsin Health & Educational Facilities Authority Rev. (Aurora Health Care, Inc.), “A”, 5%, 7/15/2028 (Prerefunded 7/15/2021) | 75,000 | 80,582 | ||||||
| Wisconsin Health & Educational Facilities Authority Rev. (Marshfield Clinic Health System, Inc.), “C”, 5%, 2/15/2047 | 150,000 | 158,074 | ||||||
| Wisconsin Health & Educational Facilities Authority Rev. (Meriter Hospital), “A”, 5.5%, 5/01/2031 (Prerefunded 5/01/2021) | 920,000 | 993,066 | ||||||
| Wisconsin Health & Educational Facilities Authority Rev. (Meriter Hospital), “A”, 6%, 5/01/2041 (Prerefunded 5/01/2021) | 605,000 | 660,115 | ||||||
| Wisconsin Health & Educational Facilities Authority Rev. (St. John’s Community, Inc.), “A”, 5%, 9/15/2040 | 25,000 | 25,423 | ||||||
| Wisconsin Health & Educational Facilities Authority Rev. (St. John’s Community, Inc.), “A”, 5%, 9/15/2045 | 35,000 | 35,487 | ||||||
| Wisconsin Health & Educational Facilities Authority Rev. (St. John’s Community, Inc.), “A”, 5%, 9/15/2050 | 155,000 | 156,827 | ||||||
| Wisconsin Public Finance Authority Education Rev. (Mountain Island Charter School), 5%, 7/01/2037 | 45,000 | 45,922 | ||||||
| Wisconsin Public Finance Authority Education Rev. (Mountain Island Charter School), 5%, 7/01/2047 | 60,000 | 60,813 | ||||||
| Wisconsin Public Finance Authority Education Rev. (Pine Lake Preparatory), 4.95%, 3/01/2030 | 70,000 | 70,743 | ||||||
| Wisconsin Public Finance Authority Education Rev. (Pine Lake Preparatory), 5.25%, 3/01/2035 | 70,000 | 70,624 | ||||||
| Wisconsin Public Finance Authority Education Rev. (Pine Lake Preparatory), 5.5%, 3/01/2045 | 175,000 | 175,992 | ||||||
| Wisconsin Public Finance Authority Educational Facilities Rev. (Community School of Davidson Project), 5%, 10/01/2033 | 30,000 | 30,511 | ||||||
| Wisconsin Public Finance Authority Educational Facilities Rev. (Community School of Davidson Project), 5%, 10/01/2048 | 160,000 | 157,309 | ||||||
| Wisconsin Public Finance Authority Healthcare Facility (Church Home of Hartford, Inc. Project), “A”, 4%, 9/01/2020 | 25,000 | 25,408 | ||||||
| Wisconsin Public Finance Authority Healthcare Facility (Church Home of Hartford, Inc. Project), “A”, 5%, 9/01/2025 | 35,000 | 37,240 | ||||||
57
Table of Contents
Portfolio of Investments – continued
| Issuer | Shares/Par | Value ($) | ||||||
| Municipal Bonds - continued | ||||||||
| Wisconsin - continued | ||||||||
| Wisconsin Public Finance Authority Healthcare Facility (Church Home of Hartford, Inc. Project), “A”, 5%, 9/01/2030 | $ | 95,000 | $ | 97,858 | ||||
| Wisconsin Public Finance Authority Healthcare Facility (Church Home of Hartford, Inc. Project), “A”, 5%, 9/01/2038 | 80,000 | 80,789 | ||||||
| Wisconsin Public Finance Authority Higher Education Facilities Rev. (Gannon University Project), 5%, 5/01/2047 | 100,000 | 104,676 | ||||||
| Wisconsin Public Finance Authority Limited Obligation Grant Rev. (American Dream at Meadowlands Project), “A”, 6.25%, 8/01/2027 | 840,000 | 900,186 | ||||||
| Wisconsin Public Finance Authority Limited Obligation PILOT Rev. (American Dream at Meadowlands Project), 6.5%, 12/01/2037 | 550,000 | 608,322 | ||||||
| Wisconsin Public Finance Authority Limited Obligation PILOT Rev. (American Dream at Meadowlands Project), 7%, 12/01/2050 | 330,000 | 370,969 | ||||||
| Wisconsin Public Finance Authority Rev. (Denver International Airport Great Hall Project), 5%, 9/30/2037 | 210,000 | 226,861 | ||||||
| Wisconsin Public Finance Authority Rev. (Roseman University of Health Sciences Project), 5.75%, 4/01/2035 | 190,000 | 201,297 | ||||||
| Wisconsin Public Finance Authority Senior Living Refunding Bonds Rev. (Mary’s Woods at Marylhurst Project), “A”, 5.25%, 5/15/2037 | 55,000 | 57,087 | ||||||
| Wisconsin Public Finance Authority Senior Living Refunding Bonds Rev. (Mary’s Woods at Marylhurst Project), “A”, 5.25%, 5/15/2042 | 35,000 | 36,058 | ||||||
| Wisconsin Public Finance Authority Senior Living Refunding Bonds Rev. (Mary’s Woods at Marylhurst Project), “A”, 5.25%, 5/15/2047 | 180,000 | 184,811 | ||||||
| Wisconsin Public Finance Authority Senior Living Refunding Bonds Rev. (Mary’s Woods at Marylhurst Project), “A”, 5.25%, 5/15/2052 | 55,000 | 56,279 | ||||||
| Wisconsin Public Finance Authority Senior Living Rev. (Rose Villa Project), “A”, 5.125%, 11/15/2029 | 140,000 | 144,297 | ||||||
| Wisconsin Public Finance Authority Senior Living Rev. (Rose Villa Project), “A”, 5.5%, 11/15/2034 | 125,000 | 129,804 | ||||||
| Wisconsin Public Finance Authority Senior Living Rev. (Rose Villa Project), “A”, 5.75%, 11/15/2044 | 120,000 | 125,834 | ||||||
| Wisconsin Public Finance Authority Senior Living Rev. (Rose Villa Project), “A”, 6%, 11/15/2049 | 155,000 | 164,109 | ||||||
| Wisconsin Public Finance Authority Student Housing Rev. (Western Carolina University Project), 5.25%, 7/01/2047 | 235,000 | 243,305 | ||||||
| Wisconsin Public Finance Authority, Airport Facilities Rev. (Transportation Infrastructure Properties LLC), “B”, 5%, 7/01/2022 |
|
110,000 |
|
|
115,443 |
| ||
| Wisconsin Public Finance Authority, Airport Facilities Rev. (Transportation Infrastructure Properties LLC), “B”, 5.25%, 7/01/2028 | 1,825,000 | 1,949,118 | ||||||
| Wisconsin Public Finance Authority, Airport Facilities Rev. (Transportation Infrastructure Properties LLC), “B”, 5%, 7/01/2042 | 95,000 | 99,097 | ||||||
|
|
|
|||||||
| $ | 10,208,223 | |||||||
| Total Municipal Bonds (Identified Cost, $249,323,740) | $ | 256,417,764 | ||||||
58
Table of Contents
Portfolio of Investments – continued
| Investment Companies (h) - 0.6% |
| |||||||
| Issuer | Shares/Par | Value ($) | ||||||
| Money Market Funds - 0.6% |
| |||||||
| MFS Institutional Money Market Portfolio, 2.31% (v) (Identified Cost, $1,046,994) |
1,047,134 | $ | 1,047,134 | |||||
| Other Assets, Less Liabilities - 2.1% | 3,383,121 | |||||||
| Variable Rate Municipal Term Preferred Shares (VMTPS), at liquidation value (issued by the fund) - (59.7)% |
|
(97,500,000 | ) | |||||
| Net assets applicable to common shares - 100.0% | $ | 163,348,019 | ||||||
| (a) | Non-income producing security. |
| (d) | In default. |
| (h) | An affiliated issuer, which may be considered one in which the fund owns 5% or more of the outstanding voting securities, or a company which is under common control. At period end, the aggregate values of the fund’s investments in affiliated issuers and in unaffiliated issuers were $1,047,134 and $256,417,764, respectively. |
| (n) | Securities exempt from registration under Rule 144A of the Securities Act of 1933. These securities may be sold in the ordinary course of business in transactions exempt from registration, normally to qualified institutional buyers. At period end, the aggregate value of these securities was $2,587,799, representing 1.6% of net assets applicable to common shares. |
| (v) | Affiliated issuer that is available only to investment companies managed by MFS. The rate quoted for the MFS Institutional Money Market Portfolio is the annualized seven-day yield of the fund at period end. |
The following abbreviations are used in this report and are defined:
| AAC | Ambac Assurance Corp. |
| AGM | Assured Guaranty Municipal |
| ASSD GTY | Assured Guaranty Insurance Co. |
| BAM | Build America Mutual |
| CALHF | California Health Facility Construction Loan Insurance Program |
| COP | Certificate of Participation |
| ETM | Escrowed to Maturity |
| FHLMC | Federal Home Loan Mortgage Corp. |
| GNMA | Government National Mortgage Assn. |
| LOC | Letter of Credit |
| NATL | National Public Finance Guarantee Corp. |
Derivative Contracts at 11/30/18
Futures Contracts
| Description | Long/ Short |
Currency | Contracts | Notional Amount |
Expiration Date |
Value/ Unrealized Appreciation (Depreciation) |
||||||||||||||||
| Liability Derivatives | ||||||||||||||||||||||
| Interest Rate Futures | ||||||||||||||||||||||
| U.S. Treasury Note 10 yr | Short | USD | 212 | $25,324,062 | March - 2019 | $(96,831 | ) | |||||||||||||||
| U.S. Treasury Ultra Bond 30 yr | Short | USD | 31 | 4,337,094 | March - 2019 | (21,427 | ) | |||||||||||||||
|
|
|
|||||||||||||||||||||
| $(118,258 | ) | |||||||||||||||||||||
|
|
|
|||||||||||||||||||||
59
Table of Contents
Portfolio of Investments – continued
At November 30, 2018, the fund had cash collateral of $293,900 to cover any collateral or margin obligations for certain derivative contracts. Restricted cash and/or deposits with brokers in the Statement of Assets and Liabilities are comprised of cash collateral.
See Notes to Financial Statements
60
Table of Contents
Financial Statements
STATEMENT OF ASSETS AND LIABILITIES
At 11/30/18
This statement represents your fund’s balance sheet, which details the assets and liabilities comprising the total value of the fund.
| Assets | ||||
| Investments in unaffiliated issuers, at value (identified cost, $249,323,740) |
$256,417,764 | |||
| Investments in affiliated issuers, at value (identified cost, $1,046,994) |
1,047,134 | |||
| Deposits with brokers for |
||||
| Futures contracts |
293,900 | |||
| Receivables for |
||||
| Investments sold |
1,170,015 | |||
| Interest |
4,058,045 | |||
| Receivable from investment adviser |
16,311 | |||
| Other assets |
2,481 | |||
| Total assets |
$263,005,650 | |||
| Liabilities | ||||
| Payables for |
||||
| Distributions on common shares |
$13,764 | |||
| Daily variation margin on open futures contracts |
42,388 | |||
| Investments purchased |
1,766,689 | |||
| Interest expense |
224,223 | |||
| Payable to affiliates |
||||
| Transfer agent and dividend disbursing costs |
439 | |||
| Payable for independent Trustees’ compensation |
11 | |||
| Accrued expenses and other liabilities |
110,117 | |||
| VMTPS, at liquidation value |
97,500,000 | |||
| Total liabilities |
$99,657,631 | |||
| Net assets applicable to common shares |
$163,348,019 | |||
| Net assets consist of | ||||
| Paid-in capital - common shares |
$159,517,787 | |||
| Total distributable earnings (loss) |
3,830,232 | |||
| Net assets applicable to common shares |
$163,348,019 | |||
| VMTPS, at liquidation value (3,900 shares issued and outstanding at $25,000 per share) |
97,500,000 | |||
| Net assets including preferred shares |
$260,848,019 | |||
| Common shares of beneficial interest issued and outstanding |
31,512,106 | |||
| Net asset value per common share (net assets of $163,348,019 / 31,512,106 shares of beneficial interest outstanding) |
$5.18 |
See Notes to Financial Statements
61
Table of Contents
Financial Statements
Year ended 11/30/18
This statement describes how much your fund earned in investment income and accrued in expenses. It also describes any gains and/or losses generated by fund operations.
| Net investment income (loss) |
| |||
| Income |
| |||
| Interest |
$13,746,528 | |||
| Dividends from affiliated issuers |
61,760 | |||
| Other |
489 | |||
| Total investment income |
$13,808,777 | |||
| Expenses |
||||
| Management fee |
$1,985,438 | |||
| Transfer agent and dividend disbursing costs |
21,621 | |||
| Administrative services fee |
48,338 | |||
| Independent Trustees’ compensation |
26,040 | |||
| Stock exchange fee |
30,715 | |||
| Custodian fee |
12,967 | |||
| Reimbursement of custodian expenses |
(2,667 | ) | ||
| Shareholder communications |
36,652 | |||
| Audit and tax fees |
82,559 | |||
| Legal fees |
17,833 | |||
| Interest expense and fees and amortization of VMTPS debt issuance costs |
2,530,529 | |||
| Miscellaneous |
80,054 | |||
| Total expenses |
$4,870,079 | |||
| Reduction of expenses by investment adviser |
(250,681 | ) | ||
| Net expenses |
$4,619,398 | |||
| Net investment income (loss) |
$9,189,379 | |||
| Realized and unrealized gain (loss) |
| |||
| Realized gain (loss) (identified cost basis) |
| |||
| Unaffiliated issuers |
$2,097,276 | |||
| Affiliated issuers |
637 | |||
| Futures contracts |
1,364,034 | |||
| Net realized gain (loss) |
$3,461,947 | |||
| Change in unrealized appreciation or depreciation |
| |||
| Unaffiliated issuers |
$(7,803,861 | ) | ||
| Affiliated issuers |
282 | |||
| Futures contracts |
(377,141 | ) | ||
| Net unrealized gain (loss) |
$(8,180,720 | ) | ||
| Net realized and unrealized gain (loss) |
$(4,718,773 | ) | ||
| Change in net assets from operations |
$4,470,606 | |||
See Notes to Financial Statements
62
Table of Contents
Financial Statements
STATEMENTS OF CHANGES IN NET ASSETS
These statements describe the increases and/or decreases in net assets resulting from operations, any distributions, and any shareholder transactions.
| Year ended | ||||||||
| 11/30/18 | 11/30/17 | |||||||
| Change in net assets | ||||||||
| From operations | ||||||||
| Net investment income (loss) |
$9,189,379 | $9,558,149 | ||||||
| Net realized gain (loss) |
3,461,947 | 480,732 | ||||||
| Net unrealized gain (loss) |
(8,180,720 | ) | 3,314,802 | |||||
| Change in net assets from operations |
$4,470,606 | $13,353,683 | ||||||
| Distributions to common shareholders (a) |
$(9,075,487 | ) | $(9,394,745 | ) | ||||
| Net asset value of shares issued to shareholders in reinvestment of distributions |
— | 45,253 | ||||||
| Total change in net assets |
$(4,604,881 | ) | $4,004,191 | |||||
| Net assets applicable to common shares | ||||||||
| At beginning of period |
167,952,900 | 163,948,709 | ||||||
| At end of period (b) |
$163,348,019 | $167,952,900 | ||||||
| (a) | Distributions from net investment income and from net realized gain are no longer required to be separately disclosed. See Note 2. For the year ended November 30, 2017, distributions from net investment income were $9,394,745. |
| (b) | Parenthetical disclosure of undistributed net investment income is no longer required. See Note 2. For the year ended November 30, 2017, end of period net assets included undistributed net investment income of $1,066,152. |
See Notes to Financial Statements
63
Table of Contents
Financial Statements
Year ended 11/30/18
This statement provides a summary of cash flows from investment activity for the fund.
| Cash flows from operating activities: | ||||
| Change in net assets from operations |
$4,470,606 | |||
| Adjustments to reconcile change in net assets from operations to net cash provided by operating activities: | ||||
| Purchase of investment securities |
(42,082,888 | ) | ||
| Proceeds from disposition of investment securities |
40,641,729 | |||
| Proceeds from disposition of short-term investments, net |
371,226 | |||
| Realized gain/loss on investments |
(2,097,276 | ) | ||
| Unrealized appreciation/depreciation on investments |
7,803,579 | |||
| Net amortization/accretion of income |
(321,162 | ) | ||
| Amortization of VMTPS debt issuance costs |
35,967 | |||
| Decrease in interest receivable |
28,258 | |||
| Decrease in accrued expenses and other liabilities |
(1,575 | ) | ||
| Increase in receivable from investment adviser |
(2,551 | ) | ||
| Decrease in receivable for daily variation margin on open futures contracts |
103,975 | |||
| Increase in payable for daily variation margin on open futures contracts |
42,388 | |||
| Decrease in deposits with brokers |
12,400 | |||
| Increase in other assets |
(21 | ) | ||
| Increase in payable for interest expense and fees |
57,084 | |||
| Net cash provided by operating activities |
$9,061,739 | |||
| Cash flows from financing activities: | ||||
| Cash distributions paid on common shares |
(9,061,739 | ) | ||
| Net cash used by financing activities |
$(9,061,739 | ) | ||
| Cash: | ||||
| Beginning of period |
$— | |||
| End of period |
$— |
Supplemental disclosure of cash flow information:
Cash paid during the year ended November 30, 2018 for interest was $2,437,478.
See Notes to Financial Statements
64
Table of Contents
Financial Statements
The financial highlights table is intended to help you understand the fund’s financial performance for the past 5 years. Certain information reflects financial results for a single fund share. The total returns in the table represent the rate that an investor would have earned (or lost) on an investment in the fund share class (assuming reinvestment of all distributions) held for the entire period.
| Common Shares | Year ended | |||||||||||||||||||
| 11/30/18 | 11/30/17 | 11/30/16 | 11/30/15 | 11/30/14 | ||||||||||||||||
| Net asset value, beginning of period |
$5.33 | $5.20 | $5.39 | $5.39 | $4.95 | |||||||||||||||
| Income (loss) from investment operations |
|
|||||||||||||||||||
| Net investment income (loss) (d) |
$0.29 | (c) | $0.30 | $0.32 | (c) | $0.34 | $0.32 | |||||||||||||
| Net realized and unrealized gain (loss) |
(0.15 | ) | 0.13 | (0.21 | ) | (0.03 | ) | 0.43 | ||||||||||||
| Distributions declared to shareholders of |
— | — | (0.00 | )(w) | (0.00 | )(w) | (0.00 | )(w) | ||||||||||||
| Total from investment operations |
$0.14 | $0.43 | $0.11 | $0.31 | $0.75 | |||||||||||||||
| Less distributions declared to common shareholders |
|
|||||||||||||||||||
| From net investment income |
$(0.29 | ) | $(0.30 | ) | $(0.30 | ) | $(0.31 | ) | $(0.31 | ) | ||||||||||
| Net asset value, end of period (x) |
$5.18 | $5.33 | $5.20 | $5.39 | $5.39 | |||||||||||||||
| Market value, end of period |
$4.67 | $5.40 | $4.81 | $4.92 | $4.74 | |||||||||||||||
| Total return at market value (%) (p) |
(8.36 | ) | 18.92 | 3.49 | 10.66 | 13.99 | ||||||||||||||
| Total return at net asset value (%) (j)(r)(s)(x) |
2.98 | (c) | 8.57 | 2.13 | (c) | 6.61 | 16.27 | |||||||||||||
| Ratios (%) (to average net assets applicable to common shares) and Supplemental data: |
|
|||||||||||||||||||
| Expenses before expense reductions (f)(p) |
2.91 | (c) | 2.56 | 2.27 | (c) | 2.13 | 2.19 | |||||||||||||
| Expenses after expense reductions (f)(p) |
2.76 | (c) | 2.51 | N/A | N/A | 2.19 | ||||||||||||||
| Net investment income (loss) (p) |
5.49 | (c) | 5.69 | 5.74 | (c) | 6.27 | 6.17 | |||||||||||||
| Portfolio turnover |
16 | 14 | 14 | 17 | 11 | |||||||||||||||
| Net assets at end of period (000 omitted) |
$163,348 | $167,953 | $163,949 | $169,764 | $169,926 | |||||||||||||||
| Supplemental Ratios (%): | ||||||||||||||||||||
| Ratio of expenses to average net assets |
1.25 | (c) | 1.34 | 1.37 | (c) | 1.43 | 1.45 | |||||||||||||
| Ratio of expenses to average net assets |
0.79 | (c) | 0.85 | 0.88 | (c) | 0.91 | 0.91 | |||||||||||||
| Net investment income available to common |
5.49 | (c) | 5.69 | 5.73 | (c) | 6.27 | 6.17 | |||||||||||||
65
Table of Contents
Financial Highlights – continued
| Year ended | ||||||||||||||||||||
| 11/30/18 | 11/30/17 | 11/30/16 | 11/30/15 | 11/30/14 | ||||||||||||||||
| Senior Securities: | ||||||||||||||||||||
| ARPS |
— | — | — | 225 | 225 | |||||||||||||||
| VMTPS |
3,900 | 3,900 | 3,900 | 3,675 | 3,675 | |||||||||||||||
| Total preferred shares outstanding |
3,900 | 3,900 | 3,900 | 3,900 | 3,900 | |||||||||||||||
| Asset coverage per preferred share (k) |
$66,884 | $68,056 | $67,022 | $68,529 | $68,571 | |||||||||||||||
| Involuntary liquidation preference per |
$25,000 | $25,000 | $25,000 | $25,000 | $25,000 | |||||||||||||||
| Average market value per preferred |
$25,000 | $25,000 | $25,000 | $25,000 | $25,000 | |||||||||||||||
| (c) | Amount reflects a one-time reimbursement of expenses by the custodian (or former custodian) without which net investment income and performance would be lower and expenses would be higher. See Note 2 in the Notes to Financial Statements for additional information. |
| (d) | Per share data is based on average shares outstanding. |
| (f) | Ratios do not reflect reductions from fees paid indirectly, if applicable. |
| (j) | Total return at net asset value is calculated using the net asset value of the fund, not the publicly traded price and therefore may be different than the total return at market value. |
| (k) | Calculated by subtracting the fund’s total liabilities (not including liquidation preference of preferred shares) from the fund’s total assets and dividing this number by the total number of preferred shares outstanding. |
| (l) | Interest expense and fees relate to payments made to the holders of the floating rate certificates from trust assets, interest expense paid to shareholders of VMTPS, and amortization of VMTPS debt issuance costs, as applicable. For the year ended November 30, 2016, the expense ratio also excludes fees and expenses related to redemption of the fund’s auction rate preferred shares (“ARPS”). For periods prior to November 30, 2016, the expense ratio includes amortization of VMTPS debt issuance costs. |
| (m) | Amount excludes accrued unpaid distributions on preferred shares. |
| (p) | Ratio excludes dividend payments on ARPS, if applicable. |
| (r) | Certain expenses have been reduced without which performance would have been lower. |
| (s) | From time to time the fund may receive proceeds from litigation settlements, without which performance would be lower. |
| (u) | Average market value represents the approximate fair value of each of the fund’s preferred shares. |
| (w) | Per share amount was less than $0.01. |
| (x) | The net asset values and total returns at net asset value have been calculated on net assets which include adjustments made in accordance with U.S. generally accepted accounting principles required at period end for financial reporting purposes. |
See Notes to Financial Statements
66
Table of Contents
(1) Business and Organization
MFS High Income Municipal Trust (the fund) is organized as a Massachusetts business trust and is registered under the Investment Company Act of 1940, as amended, as a diversified closed-end management investment company.
The fund is an investment company and accordingly follows the investment company accounting and reporting guidance of the Financial Accounting Standards Board (FASB) Accounting Standards Codification Topic 946 Financial Services – Investment Companies.
(2) Significant Accounting Policies
General – The preparation of financial statements in conformity with U.S. generally accepted accounting principles requires management to make estimates and assumptions that affect the reported amounts of assets and liabilities, and disclosure of contingent assets and liabilities at the date of the financial statements and the reported amounts of increases and decreases in net assets from operations during the reporting period. Actual results could differ from those estimates. In the preparation of these financial statements, management has evaluated subsequent events occurring after the date of the fund’s Statement of Assets and Liabilities through the date that the financial statements were issued. The fund invests primarily in municipal instruments, which generally trade in the over-the-counter market. The value of municipal instruments can be affected by changes in their actual or perceived credit quality. The credit quality of, and the ability to pay principal and interest when due by, an issuer of a municipal instrument depends on the credit quality of the entity supporting the municipal instrument, how essential any services supported by the municipal instrument are, the sufficiency of any revenues or taxes that support the municipal instrument, and/or the willingness or ability of the appropriate government entity to approve any appropriations necessary to support the municipal instrument. Many municipal instruments are supported by insurance which typically guarantees the timely payment of all principal and interest due on the underlying municipal instrument. The value of a municipal instrument can be volatile and significantly affected by adverse tax changes or court rulings, legislative or political changes, changes in specific or general market and economic conditions in the region where the instrument is issued, and the financial condition of municipal issuers and of municipal instrument insurers of which there are a limited number. Also, because many municipal instruments are issued to finance similar projects, conditions in certain industries can significantly affect the fund and the overall municipal market. If the Internal Revenue Service determines an issuer of a municipal instrument has not complied with the applicable tax requirements, interest from the security could become taxable, the security could decline in value, and distributions made by the fund could be taxable to shareholders. The fund invests in high-yield securities rated below investment grade. Investments in below investment grade quality securities can involve a substantially greater risk of default or can already be in default, and their values can decline significantly. Below investment grade quality securities tend to be more sensitive to adverse news about the issuer, or the market or economy in general, than higher quality debt instruments.
67
Table of Contents
Notes to Financial Statements – continued
In November 2016, the FASB issued Accounting Standards Update 2016-18, Statement of Cash Flows (Topic 230) – Restricted Cash (“ASU 2016-18”). For entities that have restricted cash and are required to present a statement of cash flows, ASU 2016-18 changes the cash flow presentation for restricted cash. Management has evaluated the potential impacts of ASU 2016-18 and expects that the effects of the fund’s adoption will be limited to the reclassification of restricted cash on the fund’s Statement of Cash Flows and the addition of disclosures regarding the nature of the restrictions on restricted cash. ASU 2016-18 will be effective for annual reporting periods beginning after December 15, 2017, and interim periods within those annual periods.
In March 2017, the FASB issued Accounting Standards Update 2017-08, Receivables – Nonrefundable Fees and Other Costs (Subtopic 310-20) – Premium Amortization on Purchased Callable Debt Securities (“ASU 2017-08”). For entities that hold callable debt securities at a premium, ASU 2017-08 requires that the premium be amortized to the earliest call date. ASU 2017-08 will be effective for fiscal years beginning after December 15, 2018, and interim periods within those fiscal years. Management has evaluated the potential impacts of ASU 2017-08 and believes that adoption of ASU 2017-08 will not have a material effect on the fund’s overall financial position or its overall results of operations.
In August 2018, the FASB issued Accounting Standards Update 2018-13, Fair Value Measurement (Topic 820) – Disclosure Framework – Changes to the Disclosure Requirements for Fair Value Measurement (“ASU 2018-13”) which introduces new fair value disclosure requirements as well as eliminates and modifies certain existing fair value disclosure requirements. ASU 2018-13 would be effective for fiscal years beginning after December 15, 2019, and interim periods within those fiscal years; however, management has elected to early adopt ASU 2018-13 effective with the current reporting period. The impact of the fund’s adoption was limited to changes in the fund’s financial statement disclosures regarding fair value, primarily those disclosures related to transfers between levels of the fair value hierarchy.
In August 2018, the Securities and Exchange Commission (SEC) released its Final Rule on Disclosure Update and Simplification (the “Final Rule”) which is intended to simplify an issuer’s disclosure compliance efforts by removing redundant or outdated disclosure requirements without significantly altering the mix of information provided to investors. Effective with the current reporting period, the fund adopted the Final Rule with the impacts being that the fund is no longer required to present the components of distributable earnings on the Statement of Assets and Liabilities or the sources of distributions to shareholders and the amount of undistributed net investment income on the Statements of Changes in Net Assets.
Balance Sheet Offsetting – The fund’s accounting policy with respect to balance sheet offsetting is that, absent an event of default by the counterparty or a termination of the agreement, the International Swaps and Derivatives Association (ISDA) Master Agreement, or similar agreement, does not result in an offset of reported amounts of financial assets and financial liabilities in the Statement of Assets and Liabilities across transactions between the fund and the applicable counterparty. The fund’s right to setoff may be restricted or prohibited by the bankruptcy or insolvency laws of the particular jurisdiction to which a specific master netting agreement counterparty is subject. Balance sheet offsetting disclosures, to the extent applicable to the fund, have
68
Table of Contents
Notes to Financial Statements – continued
been included in the fund’s Significant Accounting Policies note under the captions for each of the fund’s in-scope financial instruments and transactions.
Investment Valuations – Debt instruments and floating rate loans, including restricted debt instruments, are generally valued at an evaluated or composite bid as provided by a third-party pricing service. Short-term instruments with a maturity at issuance of 60 days or less may be valued at amortized cost, which approximates market value. Futures contracts are generally valued at last posted settlement price on their primary exchange as provided by a third-party pricing service. Futures contracts for which there were no trades that day for a particular position are generally valued at the closing bid quotation on their primary exchange as provided by a third-party pricing service. Open-end investment companies are generally valued at net asset value per share. Securities and other assets generally valued on the basis of information from a third-party pricing service may also be valued at a broker/dealer bid quotation. In determining values, third-party pricing services can utilize both transaction data and market information such as yield, quality, coupon rate, maturity, type of issue, trading characteristics, and other market data.
The Board of Trustees has delegated primary responsibility for determining or causing to be determined the value of the fund’s investments (including any fair valuation) to the adviser pursuant to valuation policies and procedures approved by the Board. If the adviser determines that reliable market quotations are not readily available, investments are valued at fair value as determined in good faith by the adviser in accordance with such procedures under the oversight of the Board of Trustees. Under the fund’s valuation policies and procedures, market quotations are not considered to be readily available for most types of debt instruments and floating rate loans and many types of derivatives. These investments are generally valued at fair value based on information from third-party pricing services. In addition, investments may be valued at fair value if the adviser determines that an investment’s value has been materially affected by events occurring after the close of the exchange or market on which the investment is principally traded (such as foreign exchange or market) and prior to the determination of the fund’s net asset value, or after the halting of trading of a specific security where trading does not resume prior to the close of the exchange or market on which the security is principally traded. The adviser generally relies on third-party pricing services or other information (such as the correlation with price movements of similar securities in the same or other markets; the type, cost and investment characteristics of the security; the business and financial condition of the issuer; and trading and other market data) to assist in determining whether to fair value and at what value to fair value an investment. The value of an investment for purposes of calculating the fund’s net asset value can differ depending on the source and method used to determine value. When fair valuation is used, the value of an investment used to determine the fund’s net asset value may differ from quoted or published prices for the same investment. There can be no assurance that the fund could obtain the fair value assigned to an investment if it were to sell the investment at the same time at which the fund determines its net asset value per share.
Various inputs are used in determining the value of the fund’s assets or liabilities. These inputs are categorized into three broad levels. In certain cases, the inputs used to
69
Table of Contents
Notes to Financial Statements – continued
measure fair value may fall into different levels of the fair value hierarchy. In such cases, an investment’s level within the fair value hierarchy is based on the lowest level of input that is significant to the fair value measurement. The fund’s assessment of the significance of a particular input to the fair value measurement in its entirety requires judgment, and considers factors specific to the investment. Level 1 includes unadjusted quoted prices in active markets for identical assets or liabilities. Level 2 includes other significant observable market-based inputs (including quoted prices for similar securities, interest rates, prepayment speed, and credit risk). Level 3 includes unobservable inputs, which may include the adviser’s own assumptions in determining the fair value of investments. Other financial instruments are derivative instruments, such as futures contracts. The following is a summary of the levels used as of November 30, 2018 in valuing the fund’s assets or liabilities:
| Financial Instruments | Level 1 | Level 2 | Level 3 | Total | ||||||||||||
| Municipal Bonds | $— | $256,417,764 | $— | $256,417,764 | ||||||||||||
| Mutual Funds | 1,047,134 | — | — | 1,047,134 | ||||||||||||
| Total | $1,047,134 | $256,417,764 | $— | $257,464,898 | ||||||||||||
| Other Financial Instruments | ||||||||||||||||
| Futures Contracts – Liabilities | $(118,258 | ) | $— | $— | $(118,258 | ) | ||||||||||
For further information regarding security characteristics, see the Portfolio of Investments.
Derivatives – The fund uses derivatives primarily to increase or decrease exposure to a particular market or segment of the market, or security, to increase or decrease interest rate exposure, or as alternatives to direct investments. Derivatives are used for hedging or non-hedging purposes. While hedging can reduce or eliminate losses, it can also reduce or eliminate gains. When the fund uses derivatives as an investment to increase market exposure, or for hedging purposes, gains and losses from derivative instruments may be substantially greater than the derivative’s original cost.
The derivative instruments used by the fund during the period were futures contracts. Depending on the type of derivative, the fund may exit a derivative position by entering into an offsetting transaction with a counterparty or exchange, negotiating an agreement with the derivative counterparty, or novating the position to a third party. The fund may be unable to promptly close out a futures position in instances where the daily fluctuation in the price for that type of future exceeds the daily limit set by the exchange. The fund’s period end derivatives, as presented in the Portfolio of Investments and the associated Derivative Contract tables, generally are indicative of the volume of its derivative activity during the period.
The following table presents, by major type of derivative contract, the fair value, on a gross basis, of the asset and liability components of derivatives held by the fund at November 30, 2018 as reported in the Statement of Assets and Liabilities:
| Fair Value (a) | ||||||
| Risk | Derivative Contracts | Liability Derivatives | ||||
| Interest Rate | Interest Rate Futures | $(118,258 | ) | |||
70
Table of Contents
Notes to Financial Statements – continued
| (a) | Values presented in this table for futures contracts correspond to the values reported in the fund’s Portfolio of Investments. Only the current day net variation margin for futures contracts is separately reported within the fund’s Statement of Assets and Liabilities. |
The following table presents, by major type of derivative contract, the realized gain (loss) on derivatives held by the fund for the year ended November 30, 2018 as reported in the Statement of Operations:
| Risk | Futures Contracts | |||
| Interest Rate | $1,364,034 | |||
The following table presents, by major type of derivative contract, the change in unrealized appreciation or depreciation on derivatives held by the fund for the year ended November 30, 2018 as reported in the Statement of Operations:
| Risk | Futures Contracts | |||
| Interest Rate | $(377,141 | ) | ||
Derivative counterparty credit risk is managed through formal evaluation of the creditworthiness of all potential counterparties. On certain, but not all, uncleared derivatives, the fund attempts to reduce its exposure to counterparty credit risk whenever possible by entering into an ISDA Master Agreement on a bilateral basis. The ISDA Master Agreement gives each party to the agreement the right to terminate all transactions traded under such agreement if there is a specified deterioration in the credit quality of the other party. Upon an event of default or a termination of the ISDA Master Agreement, the non-defaulting party has the right to close out all transactions traded under such agreement and to net amounts owed under each agreement to one net amount payable by one party to the other. This right to close out and net payments across all transactions traded under the ISDA Master Agreement could result in a reduction of the fund’s credit risk to such counterparty equal to any amounts payable by the fund under the applicable transactions, if any.
Collateral and margin requirements differ by type of derivative. For cleared derivatives (e.g., futures contracts, cleared swaps, and exchange-traded options), margin requirements are set by the clearing broker and the clearing house and collateral, in the form of cash or securities, is posted by the fund directly with the clearing broker. Collateral terms are counterparty agreement specific for uncleared derivatives (e.g., forward foreign currency exchange contracts, uncleared swap agreements, and uncleared options) and collateral, in the form of cash and securities, is held in segregated accounts with the fund’s custodian in connection with these agreements. For derivatives traded under an ISDA Master Agreement, which contains a collateral support annex, the collateral requirements are netted across all transactions traded under such counterparty-specific agreement and one amount is posted from one party to the other to collateralize such obligations. Cash that has been segregated or delivered to cover the fund’s collateral or margin obligations under derivative contracts, if any, will be reported separately in the Statement of Assets and Liabilities as restricted cash for uncleared derivatives and/or deposits with brokers for cleared derivatives. Securities pledged as collateral or margin for the same purpose, if any, are noted in the Portfolio of Investments. The fund may be required to make payments of interest on
71
Table of Contents
Notes to Financial Statements – continued
uncovered collateral or margin obligations with the broker. Any such payments are included in “Interest expense and fees and amortization of VMTPS debt issuance costs” in the Statement of Operations.
Futures Contracts – The fund entered into futures contracts which may be used to hedge against or obtain broad market exposure, interest rate exposure, or to manage duration. A futures contract represents a commitment for the future purchase or sale of an asset at a specified price on a specified date.
Upon entering into a futures contract, the fund is required to deposit with the broker, either in cash or securities, an initial margin in an amount equal to a specified percentage of the notional amount of the contract. Subsequent payments (variation margin) are made or received by the fund each day, depending on the daily fluctuations in the value of the contract, and are recorded for financial statement purposes as unrealized gain or loss by the fund until the contract is closed or expires at which point the gain or loss on futures contracts is realized.
The fund bears the risk of interest rates or securities prices moving unexpectedly, in which case, the fund may not achieve the anticipated benefits of the futures contracts and may realize a loss. While futures contracts may present less counterparty risk to the fund since the contracts are exchange traded and the exchange’s clearinghouse guarantees payments to the broker, there is still counterparty credit risk due to the insolvency of the broker. The fund’s maximum risk of loss due to counterparty credit risk is equal to the margin posted by the fund to the broker plus any gains or minus any losses on the outstanding futures contracts.
Statement of Cash Flows – Information on financial transactions which have been settled through the receipt or disbursement of cash is presented in the Statement of Cash Flows. The cash amount shown in the Statement of Cash Flows is the amount included within the fund’s Statement of Assets and Liabilities and includes cash on hand at its custodian bank and does not include any short-term investments.
Indemnifications – Under the fund’s organizational documents, its officers and Trustees may be indemnified against certain liabilities and expenses arising out of the performance of their duties to the fund. Additionally, in the normal course of business, the fund enters into agreements with service providers that may contain indemnification clauses. The fund’s maximum exposure under these agreements is unknown as this would involve future claims that may be made against the fund that have not yet occurred.
Investment Transactions and Income – Investment transactions are recorded on the trade date. Interest income is recorded on the accrual basis. All premium and discount is amortized or accreted for financial statement purposes in accordance with U.S. generally accepted accounting principles. Interest payments received in additional securities are recorded on the ex-interest date in an amount equal to the value of the security on such date. Debt obligations may be placed on non-accrual status or set to accrue at a rate of interest less than the contractual coupon when the collection of all or a portion of interest has become doubtful. Interest income for those debt obligations may be further reduced by the write-off of the related interest receivables when deemed uncollectible.
72
Table of Contents
Notes to Financial Statements – continued
The fund may receive proceeds from litigation settlements. Any proceeds received from litigation involving portfolio holdings are reflected in the Statement of Operations in realized gain/loss if the security has been disposed of by the fund or in unrealized gain/loss if the security is still held by the fund. Any other proceeds from litigation not related to portfolio holdings are reflected as other income in the Statement of Operations.
Legal fees and other related expenses incurred to preserve and protect the value of a security owned are added to the cost of the security; other legal fees are expensed. Capital infusions made directly to the security issuer, which are generally non-recurring, incurred to protect or enhance the value of high-yield debt securities, are reported as additions to the cost basis of the security. Costs that are incurred to negotiate the terms or conditions of capital infusions or that are expected to result in a plan of reorganization are reported as realized losses. Ongoing costs incurred to protect or enhance an investment, or costs incurred to pursue other claims or legal actions, are expensed.
Reimbursement of Expenses by Custodian – The fund’s custodian (or former custodian), State Street Bank and Trust Company, reimbursed its asset servicing clients for expense amounts that it billed in error during the period 1998 through 2015. The amount of this one-time reimbursement attributable to the fund is reflected as “Reimbursement of custodian expenses” in the Statement of Operations.
Tax Matters and Distributions – The fund intends to qualify as a regulated investment company, as defined under Subchapter M of the Internal Revenue Code, and to distribute all of its taxable and tax-exempt income, including realized capital gains. As a result, no provision for federal income tax is required. The fund’s federal tax returns, when filed, will remain subject to examination by the Internal Revenue Service for a three year period. Management has analyzed the fund’s tax positions taken on federal and state tax returns for all open tax years and does not believe that there are any uncertain tax positions that require recognition of a tax liability.
Distributions to shareholders are recorded on the ex-dividend date. Income and capital gain distributions are determined in accordance with income tax regulations, which may differ from U.S. generally accepted accounting principles. Certain capital accounts in the financial statements are periodically adjusted for permanent differences in order to reflect their tax character. These adjustments have no impact on net assets or net asset value per share. Temporary differences which arise from recognizing certain items of income, expense, gain or loss in different periods for financial statement and tax purposes will reverse at some time in the future. Distributions in excess of net investment income or net realized gains are temporary overdistributions for financial statement purposes resulting from differences in the recognition or classification of income or distributions for financial statement and tax purposes.
Book/tax differences primarily relate to defaulted bonds, expiration of capital loss carryforwards, amortization and accretion of debt securities, and non-deductible expenses that result from the treatment of VMTPS as equity for tax purposes.
73
Table of Contents
Notes to Financial Statements – continued
The tax character of distributions declared to shareholders for the last two fiscal years is as follows:
| Year ended 11/30/18 |
Year ended 11/30/17 |
|||||||
| Ordinary income (including any short-term capital gains) | $122,348 | $136,868 | ||||||
| Tax-exempt income | 11,445,879 | 11,180,645 | ||||||
| Total distributions | $11,568,227 | $11,317,513 | ||||||
The federal tax cost and the tax basis components of distributable earnings were as follows:
| As of 11/30/18 | ||||
| Cost of investments | $249,318,326 | |||
| Gross appreciation | 10,094,066 | |||
| Gross depreciation | (2,065,752 | ) | ||
| Net unrealized appreciation (depreciation) | $8,028,314 | |||
| Undistributed ordinary income | 264,913 | |||
| Undistributed tax-exempt income | 1,623,950 | |||
| Capital loss carryforwards | (5,512,578 | ) | ||
| Post-October capital loss deferral | (336,380 | ) | ||
| Other temporary differences | (237,987 | ) | ||
Under the Regulated Investment Company Modernization Act of 2010 (the “Act”), net capital losses recognized for fund fiscal years beginning after November 30, 2011 may be carried forward indefinitely, and their character is retained as short-term and/or long-term losses (“post-enactment losses”). Previously, net capital losses were carried forward for eight years and treated as short-term losses (“pre-enactment losses”). As a transition rule, the Act requires that all post-enactment net capital losses be used before pre-enactment net capital losses.
As of November 30, 2018, the fund had capital loss carryforwards available to offset future realized gains. Such pre-enactment losses expire as follows:
| 11/30/19 | $(5,512,578 | ) |
(3) Transactions with Affiliates
Investment Adviser – The fund has an investment advisory agreement with MFS to provide overall investment management and related administrative services and facilities to the fund. The management fee is computed daily and paid monthly at an annual rate of 0.75% of the fund’s average daily net assets (including the value of preferred shares).
The investment adviser has agreed in writing to pay a portion of the fund’s total annual operating expenses, excluding interest expense on VMTPS, amortization of debt issuance costs on VMTPS, taxes, extraordinary expenses, brokerage and transaction costs, other interest expense, and investment-related expenses, such that total fund operating expenses do not exceed 0.79% annually of the fund’s average daily net assets (including the value of preferred shares). This written agreement will continue
74
Table of Contents
Notes to Financial Statements – continued
until modified by the fund’s Board of Trustees, but such agreement will continue at least until November 30, 2019. For the year ended November 30, 2018, this reduction amounted to $250,681, which is included in the reduction of total expenses in the Statement of Operations.
Transfer Agent – The fund engages Computershare Trust Company, N.A. (“Computershare”) as the sole transfer agent for the fund’s common shares. MFS Service Center, Inc. (MFSC) monitors and supervises the activities of Computershare for an agreed upon fee approved by the Board of Trustees. For the year ended November 30, 2018, these fees paid to MFSC amounted to $5,776.
Administrator – MFS provides certain financial, legal, shareholder communications, compliance, and other administrative services to the fund. Under an administrative services agreement, the fund reimburses MFS the costs incurred to provide these services. The fund is charged an annual fixed amount of $17,500 plus a fee based on average daily net assets (including the value of preferred shares). The administrative services fee incurred for the year ended November 30, 2018 was equivalent to an annual effective rate of 0.0183% of the fund’s average daily net assets (including the value of preferred shares).
Trustees’ and Officers’ Compensation – The fund pays compensation to independent Trustees in the form of a retainer, attendance fees, and additional compensation to Board and Committee chairpersons. The fund does not pay compensation directly to Trustees or officers of the fund who are also officers of the investment adviser, all of whom receive remuneration for their services to the fund from MFS. Certain officers and Trustees of the fund are officers or directors of MFS and MFSC.
Other – This fund and certain other funds managed by MFS (the funds) have entered into a service agreement (the ISO Agreement) which provides for payment of fees solely by the funds to Tarantino LLC in return for the provision of services of an Independent Senior Officer (ISO) for the funds. Frank L. Tarantino serves as the ISO and is an officer of the funds and the sole member of Tarantino LLC. The funds can terminate the ISO Agreement with Tarantino LLC at any time under the terms of the ISO Agreement. For the year ended November 30, 2018, the fee paid by the fund under this agreement was $258 and is included in “Miscellaneous” expense in the Statement of Operations. MFS has agreed to bear all expenses associated with office space, other administrative support, and supplies provided to the ISO.
The fund invests in the MFS Institutional Money Market Portfolio which is managed by MFS and seeks current income consistent with preservation of capital and liquidity. This money market fund does not pay a management fee to MFS.
(4) Portfolio Securities
For the year ended November 30, 2018, purchases and sales of investments, other than short-term obligations, aggregated $41,241,121 and $40,444,197, respectively.
75
Table of Contents
Notes to Financial Statements – continued
(5) Shares of Beneficial Interest
The fund’s Declaration of Trust permits the Trustees to issue an unlimited number of full and fractional shares of beneficial interest. The fund reserves the right to repurchase shares of beneficial interest of the fund subject to Trustee approval. During the years ended November 30, 2018 and November 30, 2017, the fund did not repurchase any shares. Other transactions in fund shares were as follows:
| Year ended 11/30/18 |
Year ended 11/30/17 |
|||||||||||||||
| Shares | Amount | Shares | Amount | |||||||||||||
| Shares issued to shareholders in reinvestment of distributions |
— | $— | 8,448 | $45,253 | ||||||||||||
(6) Line of Credit
The fund and certain other funds managed by MFS participate in a $1.25 billion unsecured committed line of credit, subject to a $1 billion sublimit, provided by a syndication of banks under a credit agreement. Borrowings may be made for temporary financing needs. Interest is charged to each fund, based on its borrowings, generally at a rate equal to the higher of the Overnight Bank Funding rate or daily one month LIBOR plus an agreed upon spread. A commitment fee, based on the average daily, unused portion of the committed line of credit, is allocated among the participating funds. In addition, the fund and other funds managed by MFS have established unsecured uncommitted borrowing arrangements with certain banks for temporary financing needs. Interest is charged to each fund, based on its borrowings, at a rate equal to the Overnight Bank Funding rate plus an agreed upon spread. For the year ended November 30, 2018, the fund’s commitment fee and interest expense were $979 and $0, respectively, and are included in “Interest expense and fees and amortization of VMTPS debt issuance costs” in the Statement of Operations.
(7) Investments in Affiliated Issuers
An affiliated issuer may be considered one in which the fund owns 5% or more of the outstanding voting securities, or a company which is under common control. For the purposes of this report, the fund assumes the following to be affiliated issuers:
| Affiliated Issuers | Beginning Shares/Par Amount |
Acquisitions Shares/Par Amount |
Dispositions Shares/Par Amount |
Ending Shares/Par Amount |
||||||||||||||||
| MFS Institutional Money Market Portfolio | 1,418,220 | 41,948,892 | (42,319,978 | ) | 1,047,134 | |||||||||||||||
| Affiliated Issuers | Realized Gain (Loss) |
Change in Unrealized Appreciation/ Depreciation |
Capital Gain Distributions |
Dividend Income |
Ending Value |
|||||||||||||||
| MFS Institutional Money Market Portfolio | $637 | $282 | $— | $61,760 | $1,047,134 | |||||||||||||||
(8) Preferred Shares
The fund has 3,900 shares issued and outstanding of VMTPS. The outstanding VMTPS are redeemable at the option of the fund in whole or in part at the liquidation preference of $25,000 per share, plus accumulated and unpaid dividends, but generally
76
Table of Contents
Notes to Financial Statements – continued
solely for the purpose of decreasing the leverage of the fund. The VMTPS are subject to a mandatory term redemption date of October 31, 2021, as extended, unless further extended through negotiation with the private holders of the VMTPS. There is no assurance that the term of the VMTPS will be extended or that the VMTPS will be replaced with any other preferred shares or other form of leverage upon the redemption of the VMTPS. Two months prior to the term redemption date of the VMTPS, the fund is required to begin to segregate liquid assets with the fund’s custodian to fund the redemption. Dividends on the VMTPS are cumulative and are reset weekly to a fixed spread against the Securities Industry and Financial Markets Association (SIFMA) Municipal Swap Index. During the year ended November 30, 2018, the VMTPS dividend rates ranged from 2.09% to 2.96%. For the year ended November 30, 2018, the average dividend rate was 2.52%.
In the fund’s Statement of Assets and Liabilities, the VMTPS aggregate liquidation preference is shown as a liability since they have a stated mandatory redemption date. Dividends paid to the VMTPS are treated as interest expense and recorded as incurred. For the year ended November 30, 2018, interest expense related to the dividends paid to VMTPS amounted to $2,492,740 and is included in “Interest expense and fees and amortization of VMTPS debt issuance costs” in the Statement of Operations. Costs directly related to the issuance of the VMTPS are considered debt issuance costs. Debt issuance costs are presented as a direct deduction from the carrying amount of the related debt liability and are being amortized into interest expense over the life of the VMTPS. The period-end carrying value for the VMTPS in the fund’s Statement of Assets and Liabilities is its liquidation value less any unamortized debt issuance costs, which approximates its fair value. Its fair value would be considered level 2 under the fair value hierarchy.
Under the terms of a purchase agreement between the fund and the investor in the VMTPS, the fund is subject to various investment restrictions. These investment-related requirements are in various respects more restrictive than those to which the fund is otherwise subject in accordance with its investment objectives and policies. In addition, the fund is subject to certain restrictions on its investments imposed by guidelines of the rating agencies that rate the VMTPS, which guidelines may be changed by the applicable rating agency, in its sole discretion, from time to time. These guidelines may impose asset coverage or portfolio composition requirements that are more stringent than those imposed on the fund by the Investment Company Act of 1940 (the “1940 Act”).
The fund is required to maintain certain asset coverage with respect to the VMTPS as defined in the fund’s governing documents and the 1940 Act. One of a number of asset coverage-related requirements is that the fund is not permitted to declare or pay common share dividends unless immediately thereafter the fund has a minimum asset coverage ratio of 200% with respect to the VMTPS after deducting the amount of such common share dividends.
The 1940 Act requires that the preferred shareholders of the fund, voting as a separate class, have the right to elect at least two trustees at all times, and elect a majority of the trustees at any time when dividends on the preferred shares are unpaid for two full years. Unless otherwise required by law or under the terms of the preferred shares,
77
Table of Contents
Notes to Financial Statements – continued
each preferred share is entitled to one vote and preferred shareholders will vote together with common shareholders as a single class.
Leverage involves risks and special considerations for the fund’s common shareholders. To the extent that investments are purchased by the fund with proceeds from the issuance of preferred shares, the fund’s net asset value will increase or decrease at a greater rate than a comparable unleveraged fund. Changes in the value of the fund’s portfolio will be borne entirely by the common shareholders. It is possible that the fund will be required to sell assets at a time when it may be disadvantageous to do so in order to redeem preferred shares to comply with asset coverage or other restrictions including those imposed by the 1940 Act and the rating agencies that rate the preferred shares. There is no assurance that the fund’s leveraging strategy will be successful.
78
Table of Contents
REPORT OF INDEPENDENT REGISTERED PUBLIC ACCOUNTING FIRM
To the Shareholders and the Board of Trustees of MFS High Income Municipal Trust
Opinion on the Financial Statements
We have audited the accompanying statement of assets and liabilities of MFS High Income Municipal Trust (the “Fund”), including the portfolio of investments, as of November 30, 2018, and the related statements of operations and cash flows for the year then ended, the statements of changes in net assets for each of the two years in the period then ended, the financial highlights for each of the five years in the period then ended and the related notes (collectively referred to as the “financial statements”). In our opinion, the financial statements present fairly, in all material respects, the financial position of the Fund at November 30, 2018, the results of its operations and its cash flows for the year then ended, the changes in its net assets for each of the two years in the period then ended and its financial highlights for each of the five years in the period then ended, in conformity with U.S. generally accepted accounting principles.
Basis for Opinion
These financial statements are the responsibility of the Fund’s management. Our responsibility is to express an opinion on the Fund’s financial statements based on our audits. We are a public accounting firm registered with the Public Company Accounting Oversight Board (United States) (“PCAOB”) and are required to be independent with respect to the Fund in accordance with the U.S. federal securities laws and the applicable rules and regulations of the Securities and Exchange Commission and the PCAOB.
We conducted our audits in accordance with the standards of the PCAOB. Those standards require that we plan and perform the audit to obtain reasonable assurance about whether the financial statements are free of material misstatement, whether due to error or fraud. The Fund is not required to have, nor were we engaged to perform, an audit of the Fund’s internal control over financial reporting. As part of our audits, we are required to obtain an understanding of internal control over financial reporting but not for the purpose of expressing an opinion on the effectiveness of the Fund’s internal control over financial reporting. Accordingly, we express no such opinion.
Our audits included performing procedures to assess the risks of material misstatement of the financial statements, whether due to error or fraud, and performing procedures that respond to those risks. Such procedures included examining, on a test basis, evidence regarding the amounts and disclosures in the financial statements. Our procedures included confirmation of securities owned as of November 30, 2018, by correspondence with the custodian and others or by other appropriate auditing procedures where replies from others were not received. Our audits also included
79
Table of Contents
Report of Independent Registered Public Accounting Firm – continued
evaluating the accounting principles used and significant estimates made by management, as well as evaluating the overall presentation of the financial statements. We believe that our audits provide a reasonable basis for our opinion.

We have served as the auditor of one or more MFS investment companies since 1993.
Boston, Massachusetts
January 17, 2019
80
Table of Contents
RESULTS OF SHAREHOLDER MEETING
(unaudited)
At the annual meeting of shareholders of MFS High Income Municipal Trust, which was held on October 4, 2018, the following actions were taken:
Item 1: To elect the following individuals as Trustees, elected by the holders of common and preferred shares together:
| Number of Shares | ||||||||
| Nominee |
For | Withheld Authority |
||||||
| John A. Caroselli | 23,320,366.089 | 551,126.339 | ||||||
| Clarence Otis, Jr. | 23,295,404.089 | 576,088.339 | ||||||
| Robin A. Stelmach | 23,443,265.089 | 428,227.339 | ||||||
Item 2: To elect the following individuals as Trustees, elected by the holders of preferred shares only:
| Number of Shares | ||||||||
| Nominee |
For | Withheld Authority |
||||||
| John P. Kavanaugh | 3,900 | 0 | ||||||
| Laurie J. Thomsen | 3,900 | 0 | ||||||
81
Table of Contents
TRUSTEES AND OFFICERS — IDENTIFICATION AND BACKGROUND
The Trustees and Officers of the Trust, as of January 1, 2019, are listed below, together with their principal occupations during the past five years. (Their titles may have varied during that period.) The address of each Trustee and Officer is 111 Huntington Avenue, Boston, Massachusetts 02199-7618.
| Name, Age |
Position(s) with Fund |
Trustee/ Officer Since (h) |
Term Expiring |
Number by the Trustee |
Principal During the Past Five Years |
Other Directorships During the Past Five Years (j) | ||||||
| INTERESTED TRUSTEES | ||||||||||||
| Robert J. Manning (k) (age 55) |
Trustee | February 2004 | 2019 | 135 | Massachusetts Financial Services Company, Executive Chairman (since January 2017); Director; Chairman of the Board; Chief Executive Officer (until 2015); Co-Chief Executive Officer (2015-2016) | N/A | ||||||
| Robin A. Stelmach (k) (age 57) |
Trustee | January 2014 | 2021 | 135 | Massachusetts Financial Services Company, Vice Chair (since January 2017); Chief Operating Officer and Executive Vice President (until January 2017) | N/A | ||||||
| INDEPENDENT TRUSTEES | ||||||||||||
| John P. Kavanaugh (age 64) |
Trustee and Chair of Trustees | January 2009 | 2019 | 135 | Private investor | N/A | ||||||
| Steven E. Buller (age 67) |
Trustee | February 2014 | 2020 | 135 | Financial Accounting Standards Advisory Council, Chairman (2014-2015); Public Company Accounting Oversight Board, Standing Advisory Group, Member (until 2014); BlackRock, Inc. (investment management), Managing Director (until 2014), BlackRock Finco UK (investment management), Director (until 2014) | N/A | ||||||
82
Table of Contents
Trustees and Officers – continued
| Name, Age |
Position(s) with Fund |
Trustee/ Officer Since (h) |
Term Expiring |
Number by the Trustee |
Principal During the Past Five Years |
Other Directorships During the Past Five Years (j) | ||||||
| John A. Caroselli (age 64) |
Trustee | March 2017 | 2021 | 135 | JC Global Advisors, LLC (management consulting), President (since 2015); First Capital Corporation (commercial finance), Executive Vice President (until 2015) | N/A | ||||||
| Maureen R. Goldfarb (age 63) |
Trustee | January 2009 | 2019 | 135 | Private investor | N/A | ||||||
| Michael Hegarty (age 74) |
Trustee | December 2004 | 2020 | 135 | Private investor | Rouse Properties Inc., Director (until 2016); Capmark Financial Group Inc., Director (until 2015) | ||||||
| Peter D. Jones (age 63) |
Trustee | January 2019 | 2020 | 135 | Franklin Templeton Distributors, Inc. (investment management), President (until 2015); Franklin Templeton Institutional, LLC (investment management), Chairman (until 2015) | N/A | ||||||
| James W. Kilman, Jr. (age 57) |
Trustee | January 2019 | 2021 | 135 | KielStrand Capital LLC (family office and merchant bank), Chief Executive Officer (since 2016); Morgan Stanley & Co. (financial services), Vice Chairman of Investment Banking, Co-Head of Diversified Financials Coverage – Financial Institutions Investment Banking Group (until 2016) | alpha-En Corporation, Director (since 2016) |
83
Table of Contents
Trustees and Officers – continued
| Name, Age |
Position(s) with Fund |
Trustee/ Officer Since (h) |
Term Expiring |
Number by the Trustee |
Principal During the Past Five Years |
Other Directorships During the Past Five Years (j) | ||||||
| Clarence Otis, Jr. (age 62) |
Trustee | March 2017 | 2021 | 135 | Darden Restaurants, Inc., Chief Executive Officer (until 2014) | VF Corporation, Director; Verizon Communications, Inc., Director; The Travelers Companies, Director; Federal Reserve Bank of Atlanta, Director (until 2015) | ||||||
| Maryanne L. Roepke (age 62) |
Trustee | May 2014 |
2019 | 135 | American Century Investments (investment management), Senior Vice President and Chief Compliance Officer (until 2014) | N/A | ||||||
| Laurie J. Thomsen (age 61) |
Trustee | March 2005 | 2019 | 135 | Private investor | The Travelers Companies, Director; Dycom Industries, Inc., Director (since 2015) |
| Name, Age |
Position(s) with Fund |
Trustee/Officer Since (h) |
Term Expiring |
Number of MFS Funds for which |
Principal the Past Five Years | |||||
| OFFICERS | ||||||||||
| Christopher R. Bohane (k) (age 44) |
Assistant Secretary and Assistant Clerk | July 2005 | N/A | 135 | Massachusetts Financial Services Company, Vice President and Assistant General Counsel | |||||
| Kino Clark (k) (age 50) |
Assistant Treasurer |
January 2012 | N/A | 135 | Massachusetts Financial Services Company, Vice President | |||||
| John W. Clark, Jr. (k) (age 51) |
Assistant Treasurer | April 2017 | N/A | 135 | Massachusetts Financial Services Company, Vice President (since March 2017); Deutsche Bank (financial services), Department Head – Treasurer’s Office (until February 2017) | |||||
84
Table of Contents
Trustees and Officers – continued
| Name, Age |
Position(s) with Fund |
Trustee/Officer Since (h) |
Term Expiring |
Number of MFS Funds for which |
Principal the Past Five Years | |||||
| Thomas H. Connors (k) (age 59) |
Assistant Secretary and Assistant Clerk |
September 2012 | N/A | 135 | Massachusetts Financial Services Company, Vice President and Senior Counsel | |||||
| Ethan D. Corey (k) (age 55) |
Assistant Secretary and Assistant Clerk |
July 2005 | N/A | 135 | Massachusetts Financial Services Company, Senior Vice President and Associate General Counsel | |||||
| David L. DiLorenzo (k) (age 50) |
President | July 2005 | N/A | 135 | Massachusetts Financial Services Company, Senior Vice President | |||||
| Heidi W. Hardin (k) (age 51) |
Secretary and Clerk | April 2017 | N/A | 135 | Massachusetts Financial Services Company, Executive Vice President and General Counsel (since March 2017); Harris Associates (investment management), General Counsel (from September 2015 to January 2017); Janus Capital Management LLC (investment management), Senior Vice President and General Counsel (until September 2015) | |||||
| Brian E. Langenfeld (k) (age 45) |
Assistant Secretary and Assistant Clerk |
June 2006 | N/A | 135 | Massachusetts Financial Services Company, Vice President and Senior Counsel | |||||
| Amanda S. Mooradian (k) (age 39) |
Assistant Secretary and Assistant Clerk |
September 2018 | N/A | 135 | Massachusetts Financial Services Company, Assistant Vice President and Counsel | |||||
| Susan A. Pereira (k) (age 48) |
Assistant Secretary and Assistant Clerk |
July 2005 | N/A | 135 | Massachusetts Financial Services Company, Vice President and Senior Counsel | |||||
| Kasey L. Phillips (k) (age 48) |
Assistant Treasurer | September 2012 | N/A | 135 | Massachusetts Financial Services Company, Vice President |
85
Table of Contents
Trustees and Officers – continued
| Name, Age |
Position(s) with Fund |
Trustee/Officer Since (h) |
Term Expiring |
Number of MFS Funds for which |
Principal the Past Five Years | |||||
| Matthew A. Stowe (k) (age 44) |
Assistant Secretary and Assistant Clerk | October 2014 | N/A | 135 | Massachusetts Financial Services Company, Vice President and Assistant General Counsel | |||||
| Frank L. Tarantino (age 74) |
Independent Senior Officer |
June 2004 | N/A | 135 | Tarantino LLC (provider of compliance services), Principal | |||||
| Richard S. Weitzel (k) (age 48) |
Assistant Secretary and Assistant Clerk | October 2007 | N/A | 135 | Massachusetts Financial Services Company, Senior Vice President and Associate General Counsel | |||||
| Martin J. Wolin (k) (age 51) |
Chief Compliance Officer | July 2015 | N/A | 135 | Massachusetts Financial Services Company, Senior Vice President and Chief Compliance Officer (since July 2015); Mercer (financial service provider), Chief Risk and Compliance Officer, North America and Latin America (until June 2015) | |||||
| James O. Yost (k) (age 58) |
Treasurer | September 1990 | N/A | 135 | Massachusetts Financial Services Company, Senior Vice President |
| (h) | Date first appointed to serve as Trustee/officer of an MFS Fund. Each Trustee has served continuously since appointment unless indicated otherwise. For the period from December 15, 2004 until February 22, 2005, Mr. Manning served as Advisory Trustee. From January 2012 through December 2016, Messrs. DiLorenzo and Yost served as Treasurer and Deputy Treasurer of the Funds, respectively. |
| (j) | Directorships or trusteeships of companies required to report to the Securities and Exchange Commission (i.e., “public companies”). |
| (k) | “Interested person” of the Trust within the meaning of the Investment Company Act of 1940 (referred to as the 1940 Act), which is the principal federal law governing investment companies like the fund, as a result of a position with MFS. The address of MFS is 111 Huntington Avenue, Boston, Massachusetts 02199-7618. |
The Trust holds annual shareholder meetings for the purpose of electing Trustees, and Trustees are elected for fixed terms. Two Trustees, each holding a term of one year, are elected annually by holders of the Trust’s preferred shares. The remaining Trustees are currently divided into three classes, each having a term of three years which term expires on the date of the third annual meeting following the election to office of the Trustee’s class. Each year the term of one class expires. Each Trustee and officer will
86
Table of Contents
Trustees and Officers – continued
serve until next elected or his or her earlier death, resignation, retirement or removal. Under the terms of the Board’s retirement policy, an Independent Trustee shall retire at the end of the calendar year in which he or she reaches the earlier of 75 years of age or 15 years of service on the Board (or, in the case of any Independent Trustee who joined the Board prior to 2015, 20 years of service on the Board).
Messrs. Buller, Hegarty, Kilman and Otis and Ms. Roepke are members of the Trust’s Audit Committee.
Each of the Interested Trustees and certain Officers hold comparable officer positions with certain affiliates of MFS.
| Investment Adviser | Custodian | |
| Massachusetts Financial Services Company 111 Huntington Avenue Boston, MA 02199-7618 |
State Street Bank and Trust Company 1 Lincoln Street Boston, MA 02111-2900 | |
| Portfolio Manager(s) | Independent Registered Public Accounting Firm | |
| Gary Lasman Geoffrey Schechter |
Ernst & Young LLP 200 Clarendon Street Boston, MA 02116 |
87
Table of Contents
BOARD REVIEW OF INVESTMENT ADVISORY AGREEMENT
The Investment Company Act of 1940 requires that both the full Board of Trustees and a majority of the non-interested (“independent”) Trustees, voting separately, annually approve the continuation of the Fund’s investment advisory agreement with MFS. The Trustees consider matters bearing on the Fund and its advisory arrangements at their meetings throughout the year, including a review of performance data at each regular meeting. In addition, the independent Trustees met several times over the course of three months beginning in May and ending in July, 2018 (“contract review meetings”) for the specific purpose of considering whether to approve the continuation of the investment advisory agreement for the Fund and the other investment companies that the Board oversees (the “MFS Funds”). The independent Trustees were assisted in their evaluation of the Fund’s investment advisory agreement by independent legal counsel, from whom they received separate legal advice and with whom they met separately from MFS during various contract review meetings. The independent Trustees were also assisted in this process by the MFS Funds’ Independent Senior Officer, a senior officer appointed by and reporting to the independent Trustees.
In connection with their deliberations regarding the continuation of the investment advisory agreement, the Trustees, including the independent Trustees, considered such information and factors as they believed, in light of the legal advice furnished to them and their own business judgment, to be relevant. The investment advisory agreement for the Fund was considered separately, although the Trustees also took into account the common interests of all MFS Funds in their review. As described below, the Trustees considered the nature, quality, and extent of the various investment advisory, administrative, and shareholder services performed by MFS under the existing investment advisory agreement and other arrangements with the Fund.
In connection with their contract review meetings, the Trustees received and relied upon materials that included, among other items: (i) information provided by Broadridge Financial Solutions, Inc. (“Broadridge”), an independent third party, on the investment performance (based on net asset value) of the Fund for various time periods ended December 31, 2017 and the investment performance (based on net asset value) of a group of funds with substantially similar investment classifications/objectives (the “Broadridge performance universe”), (ii) information provided by Broadridge on the Fund’s advisory fees and other expenses and the advisory fees and other expenses of comparable funds identified by Broadridge (the “Broadridge expense group”), (iii) information provided by MFS on the advisory fees of portfolios of other clients of MFS, including institutional separate accounts and other clients, (iv) information as to whether and to what extent applicable expense waivers, reimbursements or fee “breakpoints” are observed for the Fund, (v) information regarding MFS’ financial results and financial condition, including MFS’ and certain of its affiliates’ estimated profitability from services performed for the Fund and the MFS Funds as a whole, and compared to MFS’ institutional business, (vi) MFS’ views regarding the outlook for the mutual fund industry and the strategic business plans of MFS, (vii) descriptions of various functions performed by MFS for the Funds, such as compliance monitoring and portfolio trading practices, and (viii) information regarding the overall organization of MFS, including information about MFS’ senior management and other personnel
88
Table of Contents
Board Review of Investment Advisory Agreement – continued
providing investment advisory, administrative and other services to the Fund and the other MFS Funds. The comparative performance, fee and expense information prepared and provided by Broadridge was not independently verified and the independent Trustees did not independently verify any information provided to them by MFS.
The Trustees’ conclusion as to the continuation of the investment advisory agreement was based on a comprehensive consideration of all information provided to the Trustees and not the result of any single factor. Some of the factors that figured particularly in the Trustees’ deliberations are described below, although individual Trustees may have evaluated the information presented differently from one another, giving different weights to various factors. It is also important to recognize that the fee arrangements for the Fund and other MFS Funds are the result of years of review and discussion between the independent Trustees and MFS, that certain aspects of such arrangements may receive greater scrutiny in some years than in others, and that the Trustees’ conclusions may be based, in part, on their consideration of these same arrangements during the course of the year and in prior years.
Based on information provided by Broadridge and MFS, the Trustees reviewed the Fund’s total return investment performance as well as the Broadridge performance universe over various time periods. The Trustees placed particular emphasis on the total return performance of the Fund’s common shares in comparison to the performance of funds in its Broadridge performance universe over the three-year period ended December 31, 2017, which the Trustees believed was a long enough period to reflect differing market conditions. The total return performance of the Fund’s common shares ranked 2nd out of a total of 10 funds in the Broadridge performance universe for this three-year period (a ranking of first place out of the total number of funds in the performance universe indicating the best performer and a ranking of last place out of the total number of funds in the performance universe indicating the worst performer). The total return performance of the Fund’s common shares ranked 5th out of a total of 10 funds for the one-year period and 3rd out of a total of 10 funds for the five-year period ended December 31, 2017. Given the size of the Broadridge performance universe and information previously provided by MFS regarding differences between the Fund and the other funds in its Broadridge performance universe, the Trustees also reviewed the Fund’s performance in comparison to the Bloomberg Barclays Municipal Bond Index. The Fund out-performed the Bloomberg Barclays Municipal Bond Index for the one-, three- and five-year periods ended December 31, 2017 (one-year: 8.7% total return for the Fund versus 5.4% total return for the benchmark; three-year: 5.8% total return for the Fund versus 3.0% total return for the benchmark; five-year: 5.8% total return for the Fund versus 3.0% total return for the benchmark). Because of the passage of time, these performance results may differ from the performance results for more recent periods, including those shown elsewhere in this report.
In the course of their deliberations, the Trustees took into account information provided by MFS in connection with the contract review meetings, as well as during investment review meetings conducted with portfolio management personnel during the course of the year regarding the Fund’s performance. After reviewing these and related factors, the Trustees concluded, within the context of their overall conclusions
89
Table of Contents
Board Review of Investment Advisory Agreement – continued
regarding the investment advisory agreement, that they were satisfied with MFS’ responses and efforts relating to investment performance.
In assessing the reasonableness of the Fund’s advisory fee, the Trustees considered, among other information, the Fund’s advisory fee and the total expense ratio of the Fund’s common shares as a percentage of average daily net assets (including preferred shares) and the advisory fee and total expense ratios of peer groups of funds based on information provided by Broadridge. The Trustees considered that MFS currently observes an expense limitation for the Fund, which may not be changed without the Trustees’ approval. The Trustees also considered that, according to the Broadridge data (which takes into account any fee reductions or expense limitations that were in effect during the Fund’s last fiscal year), the Fund’s effective advisory fee rate and total expense ratio were each higher than the Broadridge expense group median.
The Trustees also considered the advisory fees charged by MFS to any institutional separate accounts advised by MFS (“separate accounts”) and unaffiliated investment companies for which MFS serves as subadviser (“subadvised funds”) that have comparable investment strategies to the Fund, if any. In comparing these fees, the Trustees considered information provided by MFS as to the generally broader scope of services provided by MFS to the Fund, as well as the more extensive regulatory burdens imposed on MFS in managing the Fund, in comparison to separate accounts and subadvised funds.
The Trustees considered that, as a closed-end fund, the Fund is unlikely to experience meaningful asset growth. As a result, the Trustees did not view the potential for realization of economies of scale as the Fund’s assets grow to be a material factor in their deliberations. The Trustees noted that they would consider economies of scale in the future in the event the Fund experiences significant asset growth, such as through a material increase in the market value of the Fund’s portfolio securities.
The Trustees also considered information prepared by MFS relating to MFS’ costs and profits with respect to the Fund, the MFS Funds considered as a group, and other investment companies and accounts advised by MFS, as well as MFS’ methodologies used to determine and allocate its costs to the MFS Funds, the Fund and other accounts and products for purposes of estimating profitability.
After reviewing these and other factors described herein, the Trustees concluded, within the context of their overall conclusions regarding the investment advisory agreement, that the advisory fees charged to the Fund represent reasonable compensation in light of the services being provided by MFS to the Fund.
In addition, the Trustees considered MFS’ resources and related efforts to continue to retain, attract and motivate capable personnel to serve the Fund. The Trustees also considered current and developing conditions in the financial services industry, including the presence of large and well-capitalized companies which are spending, and appear to be prepared to continue to spend, substantial sums to engage personnel and to provide services to competing investment companies. In this regard, the Trustees also considered the financial resources of MFS and its ultimate parent, Sun Life Financial Inc. The Trustees also considered the advantages and possible disadvantages to the Fund of having an adviser that also serves other investment companies as well as other accounts.
90
Table of Contents
Board Review of Investment Advisory Agreement – continued
The Trustees also considered the nature, quality, cost, and extent of administrative services provided to the Fund by MFS under agreements other than the investment advisory agreement. The Trustees also considered the nature, extent and quality of certain other services MFS performs or arranges for on the Fund’s behalf, which may include securities lending programs, directed expense payment programs, class action recovery programs, and MFS’ interaction with third-party service providers, principally custodians and sub-custodians. The Trustees concluded that the various non-advisory services provided by MFS and its affiliates on behalf of the Fund were satisfactory.
The Trustees considered so-called “fall-out benefits” to MFS such as reputational value derived from serving as investment manager to the MFS Funds. The Trustees also considered that, effective January 3, 2018, MFS had discontinued its historic practice of obtaining investment research from portfolio brokerage commissions paid by certain MFS Funds and would thereafter voluntarily reimburse a Fund, if applicable, for the costs of external research acquired through the use of the Fund’s portfolio brokerage commissions.
Based on their evaluation of factors that they deemed to be material, including those factors described above, the Board of Trustees, including the independent Trustees, concluded that the Fund’s investment advisory agreement with MFS should be continued for an additional one-year period, commencing August 1, 2018.
91
Table of Contents
PROXY VOTING POLICIES AND INFORMATION
MFS votes proxies on behalf of the fund pursuant to proxy voting policies and procedures that are available without charge, upon request, by calling 1-800-225-2606, by visiting mfs.com/proxyvoting, or by visiting the SEC’s Web site at http://www.sec.gov.
Information regarding how the fund voted proxies relating to portfolio securities during the most recent twelve-month period ended June 30 is available by August 31 of each year without charge by visiting mfs.com/proxyvoting, or by visiting the SEC’s Web site at http://www.sec.gov.
QUARTERLY PORTFOLIO DISCLOSURE
The fund files a complete schedule of portfolio holdings with the SEC for the first and third quarters of each fiscal year on Form N-Q. The fund’s Form N-Q is available on the SEC’s website at http://www.sec.gov. A shareholder can obtain the portfolio holdings report for the first and third quarters of the fund’s fiscal year at mfs.com/closedendfunds by choosing the fund’s name and then selecting the “Resources” tab and clicking on “Prospectus and Reports”.
From time to time, MFS may post important information about the fund or the MFS funds on the MFS web site (mfs.com). This information is available at https://www.mfs.com/en-us/what-we-do/announcements.html or at mfs.com/closedendfunds by choosing the fund’s name.
Additional information about the fund (e.g. performance, dividends and the fund’s price history) is also available by clicking on the fund’s name under “Closed-End Funds” in the “Products” section of mfs.com.
INFORMATION ABOUT FUND CONTRACTS AND LEGAL CLAIMS
The fund has entered into contractual arrangements with an investment adviser, administrator, transfer agent, and custodian who each provide services to the fund. Unless expressly stated otherwise, shareholders are not parties to, or intended beneficiaries of these contractual arrangements, and these contractual arrangements are not intended to create any shareholder right to enforce them against the service providers or to seek any remedy under them against the service providers, either directly or on behalf of the fund.
Under the Trust’s By-Laws, any claims asserted against or on behalf of the MFS Funds, including claims against Trustees and Officers, must be brought in state and federal courts located within the Commonwealth of Massachusetts.
FEDERAL TAX INFORMATION (unaudited)
The fund will notify shareholders of amounts for use in preparing 2018 income tax forms in January 2019. The following information is provided pursuant to provisions of the Internal Revenue Code.
Of the dividends paid from net investment income during the fiscal year, 98.94% is designated as exempt interest dividends for federal income tax purposes. If the fund has earned income on private activity bonds, a portion of the dividends paid may be considered a tax preference item for purposes of computing a shareholder’s alternative minimum tax.
92
Table of Contents
rev. 3/16
|
|
WHAT DOES MFS DO WITH YOUR PERSONAL INFORMATION? |

| ||
| Why? | Financial companies choose how they share your personal information. Federal law gives consumers the right to limit some but not all sharing. Federal law also requires us to tell you how we collect, share, and protect your personal information. Please read this notice carefully to understand what we do. |
| What? | The types of personal information we collect and share depend on the product or service you have with us. This information can include:
• Social Security number and account balances • Account transactions and transaction history • Checking account information and wire transfer instructions
When you are no longer our customer, we continue to share your information as described in this notice. |
| How? | All financial companies need to share customers’ personal information to run their everyday business. In the section below, we list the reasons financial companies can share their customers’ personal information; the reasons MFS chooses to share; and whether you can limit this sharing. |
| Reasons we can share your personal information |
Does
MFS share? |
Can you limit this sharing? | ||
| For our everyday business purposes – such as to process your transactions, maintain your account(s), respond to court orders and legal investigations, or report to credit bureaus |
Yes | No | ||
| For our marketing purposes – to offer our products and services to you |
No | We don’t share | ||
| For joint marketing with other financial companies |
No | We don’t share | ||
| For our affiliates’ everyday business purposes – information about your transactions and experiences |
No | We don’t share | ||
| For our affiliates’ everyday business purposes – information about your creditworthiness |
No | We don’t share | ||
| For nonaffiliates to market to you | No | We don’t share |
| Questions? | Call 800-225-2606 or go to mfs.com. |
93
Table of Contents
| Page 2 |
| Who we are | ||
| Who is providing this notice? | MFS Funds, MFS Investment Management, MFS Institutional Advisors, Inc., and MFS Heritage Trust Company. | |
| What we do | ||
| How does MFS protect my personal information? | To protect your personal information from unauthorized access and use, we use security measures that comply with federal law. These measures include procedural, electronic, and physical safeguards for the protection of the personal information we collect about you. | |
| How does MFS collect my personal information? | We collect your personal information, for example, when you
• open an account or provide account information • direct us to buy securities or direct us to sell your securities • make a wire transfer
We also collect your personal information from others, such as credit bureaus, affiliates, or other companies. | |
| Why can’t I limit all sharing? | Federal law gives you the right to limit only
• sharing for affiliates’ everyday business purposes – information about your creditworthiness • affiliates from using your information to market to you • sharing for nonaffiliates to market to you
State laws and individual companies may give you additional rights to limit sharing. | |
| Definitions | ||
| Affiliates | Companies related by common ownership or control. They can be financial and nonfinancial companies.
• MFS does not share personal information with affiliates, except for everyday business purposes as described on page one of this notice. | |
| Nonaffiliates | Companies not related by common ownership or control. They can be financial and nonfinancial companies.
• MFS does not share with nonaffiliates so they can market to you. | |
| Joint marketing | A formal agreement between nonaffiliated financial companies that together market financial products or services to you.
• MFS doesn’t jointly market. | |
| Other important information | ||
| If you own an MFS product or receive an MFS service in the name of a third party such as a bank or broker-dealer, their privacy policy may apply to you instead of ours. | ||
94
Table of Contents
TRANSFER AGENT, REGISTRAR, AND
DIVIDEND DISBURSING AGENT
CALL
1-800-637-2304
9 a.m. to 5 p.m. Eastern time
WRITE
Computershare Trust Company, N.A.
P.O. Box 43078
Providence, RI 02940-3078
New York Stock Exchange Symbol: CXE
Table of Contents
| ITEM 2. | CODE OF ETHICS. |
The Registrant has adopted a Code of Ethics (the “Code”) pursuant to Section 406 of the Sarbanes-Oxley Act and as defined in Form N-CSR that applies to the Registrant’s principal executive officer and principal financial and accounting officer. During the period covered by this report, the Registrant has not amended any provision in the Code that relates to an element of the Code’s definition enumerated in paragraph (b) of Item 2 of this Form N-CSR. During the period covered by this report, the Registrant did not grant a waiver, including an implicit waiver, from any provision of the Code.
A copy of the Code is filed as an exhibit to this Form N-CSR.
| ITEM 3. | AUDIT COMMITTEE FINANCIAL EXPERT. |
Messrs. Steven E. Buller and Clarence Otis, Jr. and Ms. Maryanne L. Roepke, members of the Audit Committee, have been determined by the Board of Trustees in their reasonable business judgment to meet the definition of “audit committee financial expert” as such term is defined in Form N-CSR. In addition, Messrs. Buller and Otis and Ms. Roepke are “independent” members of the Audit Committee (as such term has been defined by the Securities and Exchange Commission in regulations implementing Section 407 of the Sarbanes-Oxley Act of 2002). The Securities and Exchange Commission has stated that the designation of a person as an audit committee financial expert pursuant to this Item 3 on the Form N-CSR does not impose on such a person any duties, obligations or liability that are greater than the duties, obligations or liability imposed on such person as a member of the Audit Committee and the Board of Trustees in the absence of such designation or identification.
| ITEM 4. | PRINCIPAL ACCOUNTANT FEES AND SERVICES. |
Items 4(a) through 4(d) and 4(g):
The Board of Trustees has appointed Ernst & Young LLP (“E&Y”) to serve as independent accountants to the Registrant (hereinafter the “Registrant” or the “Fund”). The tables below set forth the audit fees billed to the Fund as well as fees for non-audit services provided to the Fund and/or to the Fund’s investment adviser, Massachusetts Financial Services Company (“MFS”), and to various entities either controlling, controlled by, or under common control with MFS that provide ongoing services to the Fund (“MFS Related Entities”).
For the fiscal years ended November 30, 2018 and 2017, audit fees billed to the Fund by E&Y were as follows:
| Audit Fees | ||||||||
| 2018 | 2017 | |||||||
| Fees billed by E&Y: |
||||||||
| MFS High Income Municipal Trust |
59,606 | 58,340 | ||||||
Table of Contents
For the fiscal years ended November 30, 2018 and 2017, fees billed by E&Y for audit-related, tax and other services provided to the Fund and for audit-related, tax and other services provided to MFS and MFS Related Entities were as follows:
| Audit-Related Fees1 | Tax Fees2 | All Other Fees3 | ||||||||||||||||||||||
| 2018 | 2017 | 2018 | 2017 | 2018 | 2017 | |||||||||||||||||||
| Fees billed by E&Y: |
||||||||||||||||||||||||
| To MFS High Income Municipal Trust |
11,608 | 11,358 | 10,324 | 10,102 | 1,050 | 1,058 | ||||||||||||||||||
| Audit-Related Fees1 | Tax Fees2 | All Other Fees3 | ||||||||||||||||||||||
| 2018 | 2017 | 2018 | 2017 | 2018 | 2017 | |||||||||||||||||||
| Fees billed by E&Y: |
||||||||||||||||||||||||
| To MFS and MFS Related Entities of MFS High Income Municipal Trust* |
1,728,076 | 1,603,983 | 0 | 0 | 103,950 | 101,450 | ||||||||||||||||||
| Aggregate Fees for Non-audit Services | ||||||||
| 2018 | 2017 | |||||||
| Fees Billed by E&Y: |
||||||||
| To MFS High Income Municipal Trust, MFS and MFS Related Entities# |
2,134,908 | 1,859,951 | ||||||
| * | This amount reflects the fees billed to MFS and MFS Related Entities for non-audit services relating directly to the operations and financial reporting of the Fund (portions of which services also related to the operations and financial reporting of other funds within the MFS Funds complex). |
| # | This amount reflects the aggregate fees billed by E&Y for non-audit services rendered to the Fund and for non-audit services rendered to MFS and the MFS Related Entities. |
| 1 | The fees included under “Audit-Related Fees” are fees related to assurance and related services that are reasonably related to the performance of the audit or review of financial statements, but not reported under ‘‘Audit Fees,’’ including accounting consultations, agreed-upon procedure reports, attestation reports, comfort letters and internal control reviews. |
| 2 | The fees included under “Tax Fees” are fees associated with tax compliance, tax advice and tax planning, including services relating to the filing or amendment of federal, state or local income tax returns, regulated investment company qualification reviews and tax distribution and analysis. |
| 3 | The fees included under “All Other Fees” are fees for products and services provided by E&Y other than those reported under “Audit Fees,” “Audit-Related Fees” and “Tax Fees,” including fees for services related to review of internal controls and review of Rule 38a-1 compliance program. |
Item 4(e)(1):
Set forth below are the policies and procedures established by the Audit Committee of the Board of Trustees relating to the pre-approval of audit and non-audit related services:
To the extent required by applicable law, pre-approval by the Audit Committee of the Board is needed for all audit and permissible non-audit services rendered to the Fund and all permissible non-audit services rendered to MFS or MFS Related Entities if the services relate directly to the operations and financial reporting of the Registrant. Pre-approval is currently on an engagement-by-engagement basis. In the event pre-approval of such services is necessary between regular meetings of the Audit Committee and it is not practical to wait to seek pre-approval at the next regular meeting of the Audit Committee, pre-approval of such services may be referred to the Chair of the Audit Committee for approval; provided that the Chair may not pre-approve any individual engagement for such services exceeding $50,000 or multiple engagements for such services in the aggregate
Table of Contents
exceeding $100,000 between such regular meetings of the Audit Committee. Any engagement pre-approved by the Chair between regular meetings of the Audit Committee shall be presented for ratification by the entire Audit Committee at its next regularly scheduled meeting.
Item 4(e)(2):
None, or 0%, of the services relating to the Audit-Related Fees, Tax Fees and All Other Fees paid by the Fund and MFS and MFS Related Entities relating directly to the operations and financial reporting of the Registrant disclosed above were approved by the audit committee pursuant to paragraphs (c)(7)(i)(C) of Rule 2-01 of Regulation S-X (which permits audit committee approval after the start of the engagement with respect to services other than audit, review or attest services, if certain conditions are satisfied).
Item 4(f):
Not applicable.
Item 4(h):
The Registrant’s Audit Committee has considered whether the provision by a Registrant’s independent registered public accounting firm of non-audit services to MFS and MFS Related Entities that were not pre-approved by the Committee (because such services were provided prior to the effectiveness of SEC rules requiring pre-approval or because such services did not relate directly to the operations and financial reporting of the Registrant) was compatible with maintaining the independence of the independent registered public accounting firm as the Registrant’s principal auditors.
| ITEM 5. | AUDIT COMMITTEE OF LISTED REGISTRANTS. |
The Registrant has an Audit Committee established in accordance with Section 3(a)(58)(A) of the Securities Exchange Act of 1934. Effective January 1, 2019, the members of the Audit Committee are Messrs. Steven E. Buller, Clarence Otis Jr., James W. Kilman, Jr., and Michael Hegarty and Ms. Maryanne L. Roepke.
| ITEM 6. | SCHEDULE OF INVESTMENTS |
A schedule of investments of the Registrant is included as part of the report to shareholders of the Registrant under Item 1 of this Form N-CSR.
| ITEM 7. | DISCLOSURE OF PROXY VOTING POLICIES AND PROCEDURES FOR CLOSED-END MANAGEMENT INVESTMENT COMPANIES. |
A copy of the proxy voting policies and procedures are attached hereto as EX-99.PROXYPOL.
Table of Contents
| ITEM 8. | PORTFOLIO MANAGERS OF CLOSED-END MANAGEMENT INVESTMENT COMPANIES. |
Portfolio Manager(s)
Information regarding the portfolio manager(s) of the MFS High Income Municipal Trust (the “Fund”) is set forth below. Each portfolio manager is primarily responsible for the day-to-day management of the Fund.
| Portfolio Manager |
Primary Role |
Since | Title and Five Year History | |||
| Gary Lasman | Portfolio Manager | 2007 | Investment Officer of MFS; employed in the investment area of MFS since 2002. | |||
| Geoffrey Schechter | Portfolio Manager | 2007 | Investment Officer of MFS; employed in the investment area of MFS since 1993. |
Compensation
MFS’ philosophy is to align portfolio manager compensation with the goal to provide shareholders with long-term value through a collaborative investment process. Therefore, MFS uses long-term investment performance as well as contribution to the overall investment process and collaborative culture as key factors in determining portfolio manager compensation. In addition, MFS seeks to maintain total compensation programs that are competitive in the asset management industry in each geographic market where it has employees. MFS uses competitive compensation data to ensure that compensation practices are aligned with its goals of attracting, retaining, and motivating the highest-quality professionals.
MFS reviews portfolio manager compensation annually. In determining portfolio manager compensation, MFS uses quantitative means and qualitative means to help ensure a sustainable investment process. As of December 31, 2017, portfolio manager total cash compensation is a combination of base salary and performance bonus:
Base Salary – Base salary generally represents a smaller percentage of portfolio manager total cash compensation than performance bonus.
Performance Bonus – Generally, the performance bonus represents more than a majority of portfolio manager total cash compensation.
The performance bonus is based on a combination of quantitative and qualitative factors, generally with more weight given to the former and less weight given to the latter.
The quantitative portion is primarily based on the pre-tax performance of accounts managed by the portfolio manager over a range of fixed-length time periods, intended to provide the ability to assess performance over time periods consistent with a full market cycle and a strategy’s investment horizon. The fixed-length time periods include the portfolio manager’s full tenure on each fund and, when available, ten-, five-, and three-year periods. For portfolio managers who have served for less than three years, shorter-term periods, including the one-year period, will also be considered, as will performance in previous roles, if any, held at the firm. Emphasis is generally placed on longer performance periods when multiple performance periods are available. Performance is evaluated across the full set of strategies and portfolios managed by a given portfolio manager, relative to appropriate peer group universes and/or representative indices (“benchmarks”). As of December 31, 2017, the following benchmarks were used to measure the following portfolio manager’s performance for the Fund:
| Fund |
Portfolio Manager |
Benchmark(s) | ||
| MFS High Income Municipal Trust | Gary Lasman | Bloomberg Barclays Municipal Bond Index | ||
| Geoffrey Schechter | Bloomberg Barclays Municipal Bond Index |
Table of Contents
Benchmarks may include versions and components of indices, custom indices, and linked indices that combine performance of different indices for different portions of the time period, where appropriate.
The qualitative portion is based on the results of an annual internal peer review process (where portfolio managers are evaluated by other portfolio managers, analysts, and traders) and management’s assessment of overall portfolio manager contribution to the MFS investment process and the client experience (distinct from fund and other account performance).
The performance bonus is generally a combination of cash and a deferred cash award. A deferred cash award is issued for a cash value and becomes payable over a three-year vesting period if the portfolio manager remains in the continuous employ of MFS or its affiliates. During the vesting period, the value of the unfunded deferred cash award will fluctuate as though the portfolio manager had invested the cash value of the award in an MFS Fund(s) selected by the portfolio manager.
MFS Equity Plan – Portfolio managers also typically benefit from the opportunity to participate in the MFS Equity Plan. Equity interests are awarded by management, on a discretionary basis, taking into account tenure at MFS, contribution to the investment process, and other factors.
Finally, portfolio managers also participate in benefit plans (including a defined contribution plan and health and other insurance plans) and programs available generally to other employees of MFS. The percentage such benefits represent of any portfolio manager’s compensation depends upon the length of the individual’s tenure at MFS and salary level, as well as other factors.
Ownership of Fund Shares
The following table shows the dollar range of equity securities of the Fund beneficially owned by the Fund’s portfolio manager(s) as of the Fund’s fiscal year ended November 30, 2018. The following dollar ranges apply:
N. None
A. $1 – $10,000
B. $10,001 – $50,000
C. $50,001 – $100,000
D. $100,001 – $500,000
E. $500,001 – $1,000,000
F. Over $1,000,000
| Name of Portfolio Manager |
Dollar Range of Equity Securities in Fund | |
| Gary Lasman | N | |
| Geoffrey Schechter | N |
Table of Contents
Other Accounts
In addition to the Fund, each portfolio manager of the Fund is named as a portfolio manager of certain other accounts managed or sub-advised by MFS or an affiliate. The number and assets of these accounts were as follows as of the Fund’s fiscal year ended November 30, 2018:
| Registered Investment Companies* | Other Pooled Investment Vehicles |
Other Accounts | ||||||||||||||||||||||
| Name |
Number of Accounts |
Total Assets |
Number of Accounts |
Total Assets |
Number of Accounts |
Total Assets |
||||||||||||||||||
| Gary Lasman |
4 | $ | 5.6 billion | 0 | N/A | 0 | N/A | |||||||||||||||||
| Geoffrey Schechter |
14 | $ | 18.7 billion | 4 | $ | 629.9 million | 0 | N/A | ||||||||||||||||
| * | Includes the Fund. |
Advisory fees are not based upon performance of any of the accounts identified in the table above.
Potential Conflicts of Interest
MFS seeks to identify potential conflicts of interest resulting from a portfolio manager’s management of both the Fund and other accounts, and has adopted policies and procedures designed to address such potential conflicts.
The management of multiple funds and accounts (including proprietary accounts) gives rise to conflicts of interest if the funds and accounts have different objectives and strategies, benchmarks, time horizons and fees as a portfolio manager must allocate his or her time and investment ideas across multiple funds and accounts. In certain instances, there are securities which are suitable for the Fund’s portfolio as well as for accounts of MFS or its subsidiaries with similar investment objectives. MFS’ trade allocation policies may give rise to conflicts of interest if the Fund’s orders do not get fully executed or are delayed in getting executed due to being aggregated with those of other accounts of MFS or its subsidiaries. A portfolio manager may execute transactions for another fund or account that may adversely affect the value of the Fund’s investments. Investments selected for funds or accounts other than the Fund may outperform investments selected for the Fund.
When two or more clients are simultaneously engaged in the purchase or sale of the same security, the securities are allocated among clients in a manner believed by MFS to be fair and equitable to each. Allocations may be based on many factors and may not always be pro rata based on assets managed. The allocation methodology could have a detrimental effect on the price or volume of the security as far as the Fund is concerned.
MFS and/or a portfolio manager may have a financial incentive to allocate favorable or limited opportunity investments or structure the timing of investments to favor accounts other than the Fund, for instance, those that pay a higher advisory fee and/or have a performance adjustment and/or include an investment by the portfolio manager.
Table of Contents
| ITEM 9. | PURCHASES OF EQUITY SECURITIES BY CLOSED-END MANAGEMENT INVESTMENT COMPANY AND AFFILIATED PURCHASERS. |
| MFS High Income Municipal Trust |
||||||||||||||||
| Period |
(a) Total number of Shares Purchased |
(b) Average Price Paid per Share |
(c) Total Number of Shares Purchased as Part of Publicly Announced Plans or Programs |
(d) Maximum Number (or Approximate Dollar Value) of Shares that May Yet Be Purchased under the Plans or Programs |
||||||||||||
| 12/01/17-12/31/17 |
0 | N/A | 0 | 3,150,648 | ||||||||||||
| 1/01/18-1/31/18 |
0 | N/A | 0 | 3,150,648 | ||||||||||||
| 2/01/18-2/28/18 |
0 | N/A | 0 | 3,150,648 | ||||||||||||
| 3/01/18-3/31/18 |
0 | N/A | 0 | 3,150,648 | ||||||||||||
| 4/01/18-4/30/18 |
0 | N/A | 0 | 3,150,648 | ||||||||||||
| 5/01/18-5/31/18 |
0 | N/A | 0 | 3,150,648 | ||||||||||||
| 6/01/18-6/30/18 |
0 | N/A | 0 | 3,150,648 | ||||||||||||
| 7/01/18-7/31/18 |
0 | N/A | 0 | 3,150,648 | ||||||||||||
| 8/01/18-8/31/18 |
0 | N/A | 0 | 3,150,648 | ||||||||||||
| 9/01/18-9/30/18 |
0 | N/A | 0 | 3,150,648 | ||||||||||||
| 10/1/18-10/31/18 |
0 | N/A | 0 | 3,151,210 | ||||||||||||
| 11/1/18-11/30/18 |
0 | N/A | 0 | 3,151,210 | ||||||||||||
|
|
|
|
|
|||||||||||||
| Total |
0 | 0 | ||||||||||||||
|
|
|
|
|
|||||||||||||
Note: The Board approved procedures to repurchase shares and reviews the results periodically. The notification to shareholders of the program is part of the semi-annual and annual reports sent to shareholders. These annual programs begin on October 1st of each year. The programs conform to the conditions of Rule 10b-18 of the Securities Exchange Act of 1934 and limit the aggregate number of shares that may be purchased in each annual period (October 1 through the following September 30) to 10% of the Registrant’s outstanding shares as of the first day of the plan year (October 1). The aggregate number of shares available for purchase for the October 1, 2018 plan year is 3,151,210.
| ITEM 10. | SUBMISSION OF MATTERS TO A VOTE OF SECURITY HOLDERS. |
There were no material changes to the procedures by which shareholders may send recommendations to the Board for nominees to the Registrant’s Board since the Registrant last provided disclosure as to such procedures in response to the requirements of Item 407 (c)(2)(iv) of Regulation S-K or this Item.
Table of Contents
| ITEM 11. | CONTROLS AND PROCEDURES. |
| (a) | Based upon their evaluation of the registrant’s disclosure controls and procedures (as defined in Rule 30a-3(c) under the Investment Company Act of 1940 (the “Act”)) as conducted within 90 days of the filing date of this Form N-CSR, the registrant’s principal financial officer and principal executive officer have concluded that those disclosure controls and procedures provide reasonable assurance that the material information required to be disclosed by the registrant on this report is recorded, processed, summarized and reported within the time periods specified in the Securities and Exchange Commission’s rules and forms. |
| (b) | There were no changes in the registrant’s internal controls over financial reporting (as defined in Rule 30a-3(d) under the Act) that occurred during the second fiscal quarter covered by the report that has materially affected, or is reasonably likely to materially affect, the registrant’s internal control over financial reporting. |
| ITEM 12. | DISCLOSURE OF SECURITIES LENDING ACTIVITIES FOR CLOSED-END MANAGEMENT INVESTMENT COMPANIES. |
During the fiscal year ended November 30, 2018, there were no fees or income related to securities lending activities of the Registrant.
Table of Contents
| ITEM 13. | EXHIBITS. |
| (a) (1) | Any code of ethics, or amendment thereto, that is the subject of the disclosure required by Item 2, to the extent that the registrant intends to satisfy the Item 2 requirements through filing of an exhibit: Attached hereto as EX-99.COE. |
| (2) | A separate certification for each principal executive officer and principal financial officer of the registrant as required by Rule 30a-2(a) under the Act (17 CFR 270.30a-2): Attached hereto as EX-99.302CERT. |
| (3) | Any written solicitation to purchase securities under Rule 23c-1 under the Act (17 CFR 270.23c-1) sent or given during the period covered by the report by or on behalf of the registrant to 10 or more persons. Not applicable. |
| (4) | Change in the registrant’s independent public accountant. Not applicable. |
| (b) | If the report is filed under Section 13(a) or 15(d) of the Exchange Act, provide the certifications required by Rule 30a-2(b) under the Act (17 CFR 270.30a-2(b)), Rule 13a-14(b) or Rule 15d-14(b) under the Exchange Act (17 CFR 240.13a-14(b) or 240.15d-14(b)) and Section 1350 of Chapter 63 of Title 18 of the United States Code (18 U.S.C. 1350) as an exhibit. A certification furnished pursuant to this paragraph will not be deemed “filed” for the purposes of Section 18 of the Exchange Act (15 U.S.C. 78r), or otherwise subject to the liability of that section. Such certification will not be deemed to be incorporated by reference into any filing under the Securities Act of 1933 or the Exchange Act, except to the extent that the registrant specifically incorporates it by reference. Attached hereto as EX-99.906CERT. |
| (c) | Proxy Voting Policies and Procedures pursuant to Item 7 of Form N-CSR. Attached hereto as EX-99.PROXYPOL. |
Table of Contents
Notice
A copy of the Agreement and Declaration of Trust, as amended, of the Registrant is on file with the Secretary of State of the Commonwealth of Massachusetts and notice is hereby given that this instrument is executed on behalf of the Registrant by an officer of the Registrant as an officer and not individually and the obligations of or arising out of this instrument are not binding upon any of the Trustees or shareholders individually, but are binding only upon the assets and property of the respective constituent series of the Registrant.
Table of Contents
SIGNATURES
Pursuant to the requirements of the Securities Exchange Act of 1934 and the Investment Company Act of 1940, the registrant has duly caused this report to be signed on its behalf by the undersigned, thereunto duly authorized.
Registrant: MFS HIGH INCOME MUNICIPAL TRUST
| By (Signature and Title)* | DAVID L. DILORENZO | |
| David L. DiLorenzo, President |
Date: January 17, 2019
Pursuant to the requirements of the Securities Exchange Act of 1934 and the Investment Company Act of 1940, this report has been signed below by the following persons on behalf of the registrant and in the capacities and on the dates indicated.
| By (Signature and Title)* | DAVID L. DILORENZO | |
| David L. DiLorenzo, President (Principal Executive Officer) |
Date: January 17, 2019
| By (Signature and Title)* | JAMES O. YOST | |
| James O. Yost, Treasurer (Principal Financial Officer and Accounting Officer) |
Date: January 17, 2019
| * | Print name and title of each signing officer under his or her signature. |
EX-99.COE

Code of Ethics for Principal Executive and Principal Financial Officers
Effective February 13, 2018
| I. | Policy Purpose and Summary |
Section 406 of the Sarbanes-Oxley Act requires that each MFS Fund registered under the Investment Company Act of 1940 disclose whether or not it has adopted a code of ethics for senior financial officers, applicable to its principal financial officer and principal accounting officer.
| II. | Overview |
| A. | Covered Officers/Purpose of the Code |
This code of ethics (this “Code”) has been adopted by the funds (collectively, “Funds” and each, “Fund”) under supervision of the MFS Funds Board (the “Board”) and applies to the Funds’ Principal Executive Officer and Principal Financial Officer (the “Covered Officers” each of whom is set forth in Exhibit A) for the purpose of promoting:
| • | honest and ethical conduct, including the ethical handling of actual or apparent conflicts of interest between personal and professional relationships; |
| • | full, fair, accurate, timely and understandable disclosure in reports and documents that the Funds file with, or submit to, the Securities and Exchange Commission (“SEC”) and in other public communications made by the Funds; |
| • | compliance by the Funds with applicable laws and governmental rules and regulations; |
| • | the prompt internal reporting of violations of the Code to an appropriate person or persons identified in the Code; and |
| • | accountability for adherence to the Code. |
| B. | Conduct Guidelines |
Each Covered Officer should adhere to a high standard of business ethics and should be sensitive to situations that may give rise to actual as well as apparent conflicts of interest. In addition, each Covered Officer should not place his or her personal interests ahead of the Funds’ interests and should endeavor to act honestly and ethically. In furtherance of the foregoing, each Covered Officer must:
| • | not use his or her personal influence or personal relationships improperly to influence investment decisions or financial reporting for any Fund whereby the Covered Officer would benefit personally to the detriment of the Fund; and |
| • | not cause a Fund to take action, or fail to take action, for the individual personal benefit of the Covered Officer rather than the benefit the Fund. |
The following activities, which could create the appearance of a conflict of interest, are permitted only with the approval of the Funds’ Chief Legal Officer (“CLO”):
| • | service as a director on the board of any “for profit” company other than the board of the Funds’ investment adviser or its subsidiaries or board of a pooled investment vehicle sponsored by the Funds’ investment adviser or its subsidiaries; |
| • | running for political office; |
| • | the receipt of any Fund business-related gift or any entertainment from any company with which a Fund has current or prospective business dealings unless such gift or entertainment is permitted by the gifts and entertainment policy of the Funds’ investment adviser; |
| • | any material ownership interest in, or any consulting or employment relationship with, any Fund service providers (e.g., custodian banks, audit firms), other than the Funds’ investment adviser, principal underwriter, administrator or any affiliated person thereof; |
| • | a direct or indirect financial interest in commissions, transaction charges or spreads paid by a Fund for effecting portfolio transactions or for selling or redeeming shares, other than an interest arising from the Covered Officer’s employment or securities ownership. |
| C. | Disclosure and Compliance |
| • | Each Covered Officer should familiarize himself or herself with the disclosure requirements generally applicable to the Funds; |
| • | each Covered Officer should not knowingly misrepresent, or cause others to misrepresent, facts about a Fund to others, whether within or outside the Fund, including to the Fund’s trustees and auditors, and to governmental regulators and self-regulatory organizations; |
| • | each Covered Officer should, to the extent appropriate within his or her area of Fund responsibility, consult with other officers and employees of the Funds and the adviser with the goal of promoting full, fair, accurate, timely and understandable disclosure in the reports and documents the Funds file with, or submit to, the SEC and in other public communications made by the Funds; and |
| • | it is the responsibility of each Covered Officer to promote compliance within his or her area of Fund responsibility with the standards and restrictions imposed by applicable laws, rules and regulations. |
| D. | Reporting and Accountability |
Each Covered Officer must:
| • | upon adoption of the Code (or thereafter as applicable, upon becoming a Covered Officer), affirm in writing to the Board that he or she has received, read, and understands the Code; |
| • | annually thereafter affirm to the Board that he or she has complied with the requirements of the Code; |
| • | annually report to the CLO affiliations and relationships which are or may raise the appearance of a conflict of interest with the Covered Officer’s duties to the Funds, as identified in the annual Trustee and Officer Questionnaire; |
| • | not retaliate against any other Covered Officer or any officer or employee of the Funds or their affiliated persons for reports of potential violations that are made in good faith; and |
| • | notify the CLO promptly if he or she knows of any violation of this Code. Failure to do so is itself a violation of this Code. |
The CLO is responsible for applying this Code to specific situations in which questions are presented under it, granting waivers upon consultation with the Board or its designee, investigating violations, and has the authority to interpret this Code in any particular situation. The CLO will report requests for waivers to the Board (or a designee thereof) promptly upon receipt of a waiver request and will periodically report to the Board any approvals granted since the last report.
The CLO will take all appropriate action to investigate any potential violations reported to him or her and to report any violations to the Board. If the Board concurs that a violation has occurred, it will consider appropriate action, which may include review of, and appropriate modifications to, applicable policies and procedures; notification to appropriate personnel of the investment adviser or its board; or a recommendation to dismiss the Covered Officer.
Any changes to or waivers of this Code will, to the extent required, be disclosed as provided by SEC rules.
| E. | Confidentiality |
All reports and records prepared or maintained pursuant to this Code and under the direction of the CLO will be considered confidential and shall be maintained and protected accordingly. Except as otherwise required by law or this Code, such matters shall not be disclosed to anyone other than the Funds’ Board, its counsel, counsel to the Board’s independent trustees and senior management and the board of directors of the Fund’s investment adviser and its counsel.
| F. | Internal Use |
The Code is intended solely for the internal use by the Funds and does not constitute an admission, by or on behalf of any Fund, as to any fact, circumstance, or legal conclusion.
| III. | Supervision |
The Board of Trustees of the Funds, including a majority of the Trustees who are not “interested persons” (as defined in the 1940 Act) of the Funds, shall review no less frequently than annually, a report from the CLO regarding the affirmations of the principal executive officer and the principal financial officer as to compliance with this Code.
| IV. | Interpretation and Escalation |
Breaches of the Code are reviewed by the CLO and communicated to the Board of Trustees of the affected Fund(s). Interpretations of this Policy shall be made from time to time by the CLO, as needed, and questions regarding the application of this Policy to a specific set of facts are escalated to the CLO.
| V. | Authority |
Section 406 of the Sarbanes-Oxley Act.
| VI. | Monitoring |
Adherence to this policy is monitored by the CLO.
| VII. | Related Policies |
This Code shall be the sole code of ethics adopted by the Funds for purposes of Section 406 of the Sarbanes-Oxley Act and the rules and forms applicable to registered investment companies thereunder. Insofar as other policies or procedures of the Funds, the Funds’ adviser, principal underwriter, or other service providers govern or purport to govern the behavior or activities of the Covered Officers who are subject to this Code, they are superseded by this Code to the extent that they overlap or conflict with the provisions of this Code. The Funds’ and their investment adviser’s codes of ethics under Rule 17j-1 under the Investment Company Act and any other codes or policies or procedures adopted by the Funds or their investment adviser or other service providers are separate requirements and are not part of this Code.
| VIII. | Amendment |
Any amendments to this Code, other than amendments to Exhibit A, must be approved or ratified by a majority vote of the Board, including a majority of independent trustees.
| IX. | Recordkeeping |
All required books, records and other documentation shall be retained in accordance with MFS’ related record retention policy.
Additional procedures may need to be implemented by departments to properly comply with this policy.
Exhibit A
As of January 1, 2017
Persons Covered by this Code of Ethics
Funds’ Principal Executive Officer: David L. DiLorenzo
Funds’ Principal Financial Officer: James O. Yost
EX-99.302CERT
MFS HIGH INCOME MUNICIPAL TRUST
CERTIFICATION PURSUANT TO SECTION 302 OF THE SARBANES-OXLEY ACT
I, James O. Yost, certify that:
| 1. | I have reviewed this report on Form N-CSR of MFS High Income Municipal Trust; |
| 2. | Based on my knowledge, this report does not contain any untrue statement of a material fact or omit to state a material fact necessary to make the statements made, in light of the circumstances under which such statements were made, not misleading with respect to the period covered by this report; |
| 3. | Based on my knowledge, the financial statements, and other financial information included in this report, fairly present in all material respects the financial condition, results of operations, changes in net assets, and cash flows (if the financial statements are required to include a statement of cash flows) of the registrant as of, and for, the periods presented in this report; |
| 4. | The registrant’s other certifying officer and I are responsible for establishing and maintaining disclosure controls and procedures (as defined in Rule 30a-3(c) under the Investment Company Act of 1940) and internal control over financial reporting (as defined in Rule 30a-3(d) under the Investment Company Act of 1940) for the registrant and have: |
| a. | designed such disclosure controls and procedures, or caused such disclosure controls and procedures to be designed under our supervision, to ensure that material information relating to the registrant, including its consolidated subsidiaries, is made known to us by others within those entities, particularly during the period in which this report is being prepared; |
| b. | designed such internal control over financial reporting, or caused such internal control over financial reporting to be designed under our supervision, to provide reasonable assurance regarding the reliability of financial reporting and the preparation of financial statements for external purposes in accordance with generally accepted accounting principles; |
| c. | evaluated the effectiveness of the registrant’s disclosure controls and procedures and presented in this report our conclusions about the effectiveness of the disclosure controls and procedures as of a date within 90 days prior to the filing date of this report based on such evaluation; and |
| d. | disclosed in this report any change in the registrant’s internal control over financial reporting that occurred during the second fiscal quarter of the period covered by the report that has materially affected, or is reasonably likely to materially affect, the registrant’s internal control over financial reporting; and |
| 5. | The registrant’s other certifying officer and I have disclosed to the registrant’s auditors and the audit committee of the registrant’s board of directors (or persons performing the equivalent functions): |
| a. | all significant deficiencies and material weaknesses in the design or operation of internal control over financial reporting which are reasonably likely to adversely affect the registrant’s ability to record, process, summarize, and report financial information; and |
| b. | any fraud, whether or not material, that involves management or other employees who have a significant role in the registrant’s internal control over financial reporting. |
| Date: January 17, 2019 | JAMES O. YOST | |||
| James O. Yost | ||||
| Treasurer (Principal Financial Officer and Accounting Officer) |
EX-99.302CERT
MFS HIGH INCOME MUNICIPAL TRUST
CERTIFICATION PURSUANT TO SECTION 302 OF THE SARBANES-OXLEY ACT
I, David L. DiLorenzo, certify that:
| 1. | I have reviewed this report on Form N-CSR of MFS High Income Municipal Trust; |
| 2. | Based on my knowledge, this report does not contain any untrue statement of a material fact or omit to state a material fact necessary to make the statements made, in light of the circumstances under which such statements were made, not misleading with respect to the period covered by this report; |
| 3. | Based on my knowledge, the financial statements, and other financial information included in this report, fairly present in all material respects the financial condition, results of operations, changes in net assets, and cash flows (if the financial statements are required to include a statement of cash flows) of the registrant as of, and for, the periods presented in this report; |
| 4. | The registrant’s other certifying officer and I are responsible for establishing and maintaining disclosure controls and procedures (as defined in Rule 30a-3(c) under the Investment Company Act of 1940) and internal control over financial reporting (as defined in Rule 30a-3(d) under the Investment Company Act of 1940) for the registrant and have: |
| a. | designed such disclosure controls and procedures, or caused such disclosure controls and procedures to be designed under our supervision, to ensure that material information relating to the registrant, including its consolidated subsidiaries, is made known to us by others within those entities, particularly during the period in which this report is being prepared; |
| b. | designed such internal control over financial reporting, or caused such internal control over financial reporting to be designed under our supervision, to provide reasonable assurance regarding the reliability of financial reporting and the preparation of financial statements for external purposes in accordance with generally accepted accounting principles; |
| c. | evaluated the effectiveness of the registrant’s disclosure controls and procedures and presented in this report our conclusions about the effectiveness of the disclosure controls and procedures as of a date within 90 days prior to the filing date of this report based on such evaluation; and |
| d. | disclosed in this report any change in the registrant’s internal control over financial reporting that occurred during the second fiscal quarter of the period covered by the report that has materially affected, or is reasonably likely to materially affect, the registrant’s internal control over financial reporting; and |
| 5. | The registrant’s other certifying officer and I have disclosed to the registrant’s auditors and the audit committee of the registrant’s board of directors (or persons performing the equivalent functions): |
| a. | all significant deficiencies and material weaknesses in the design or operation of internal control over financial reporting which are reasonably likely to adversely affect the registrant’s ability to record, process, summarize, and report financial information; and |
| b. | any fraud, whether or not material, that involves management or other employees who have a significant role in the registrant’s internal control over financial reporting. |
| Date: January 17, 2019 | DAVID L. DILORENZO | |||
| David L. DiLorenzo | ||||
| President (Principal Executive Officer) |
EX-99.906CERT
MFS HIGH INCOME MUNICIPAL TRUST
CERTIFICATION PURSUANT TO SECTION 906 OF THE SARBANES-OXLEY ACT
I, James O. Yost, certify that, to my knowledge:
| 1. | The Form N-CSR (the “Report”) of MFS High Income Municipal Trust (the “Registrant”) fully complies for the period covered by the Report with the requirements of Section 13(a) or 15(d) of the Securities Exchange Act of 1934; and |
| 2. | The information contained in the Report fairly presents, in all material respects, the financial condition and results of operations of the Registrant. |
| Date: January 17, 2019 | JAMES O. YOST | |||
| James O. Yost | ||||
| Treasurer (Principal Financial Officer and |
A signed original of this written statement required by Section 906 has been provided to the Registrant and will be retained by the Registrant and furnished to the Securities and Exchange Commission or its staff upon request.
EX-99.906CERT
MFS HIGH INCOME MUNICIPAL TRUST
CERTIFICATION PURSUANT TO SECTION 906 OF THE SARBANES-OXLEY ACT
I, David L. DiLorenzo, certify that, to my knowledge:
| 1. | The Form N-CSR (the “Report”) of MFS High Income Municipal Trust (the “Registrant”) fully complies for the period covered by the Report with the requirements of Section 13(a) or 15(d) of the Securities Exchange Act of 1934; and |
| 2. | The information contained in the Report fairly presents, in all material respects, the financial condition and results of operations of the Registrant. |
| Date: January 17, 2019 | DAVID L. DILORENZO | |||
| David L. DiLorenzo | ||||
| President (Principal Executive Officer) |
A signed original of this written statement required by Section 906 has been provided to the Registrant and will be retained by the Registrant and furnished to the Securities and Exchange Commission or its staff upon request.
EX-99.PROXYPOL
MASSACHUSETTS FINANCIAL SERVICES COMPANY
PROXY VOTING POLICIES AND PROCEDURES
March 1, 2018
Massachusetts Financial Services Company, MFS Institutional Advisors, Inc., MFS International (UK) Limited, MFS Heritage Trust Company, MFS Investment Management (Canada) Limited, MFS Investment Management Company (Lux) S.à r.l., MFS International Singapore Pte. Ltd., MFS Investment Management K.K., MFS International Australia Pty. Ltd.; and MFS’ other subsidiaries that perform discretionary investment management activities (collectively, “MFS”) have adopted proxy voting policies and procedures, as set forth below (“MFS Proxy Voting Policies and Procedures”), with respect to securities owned by the clients for which MFS serves as investment adviser and has the power to vote proxies, including the pooled investment vehicles sponsored by MFS (the “MFS Funds”). References to “clients” in these policies and procedures include the MFS Funds and other clients of MFS, such as funds organized offshore, sub-advised funds and separate account clients, to the extent these clients have delegated to MFS the responsibility to vote proxies on their behalf under the MFS Proxy Voting Policies and Procedures.
The MFS Proxy Voting Policies and Procedures include:
| A. | Voting Guidelines; |
| B. | Administrative Procedures; |
| C | Records Retention; and |
| D. | Reports. |
| A. | VOTING GUIDELINES |
| 1. | General Policy; Potential Conflicts of Interest |
MFS’ policy is that proxy voting decisions are made in what MFS believes to be the best long-term economic interests of MFS’ clients, and not in the interests of any other party or in MFS’ corporate interests, including interests such as the distribution of MFS Fund shares and institutional client relationships.
MFS reviews corporate governance issues and proxy voting matters that are presented for shareholder vote by either management or shareholders of public companies. Based on the overall principle that all votes cast by MFS on behalf of its clients must be in what MFS believes to be the best long-term economic interests of such clients, MFS has adopted proxy voting guidelines, set forth below, that govern how MFS generally will vote on specific matters presented for shareholder vote.
As a general matter, MFS votes consistently on similar proxy proposals across all shareholder meetings. However, some proxy proposals, such as certain excessive executive compensation, environmental, social and governance matters, are analyzed on a case-by-case basis in light of all the relevant facts and circumstances of the proposal. Therefore, MFS may vote similar proposals differently at different shareholder meetings based on the specific facts and circumstances of the issuer or the terms of the proposal. In addition, MFS also reserves the right to override the guidelines with respect to a particular proxy proposal when such an override is, in MFS’ best judgment, consistent with the overall principle of voting proxies in the best long-term economic interests of MFS’ clients.
MFS also generally votes consistently on the same matter when securities of an issuer are held by multiple client accounts, unless MFS has received explicit voting instructions to vote differently from a client for its own account. From time to time, MFS may also receive comments on the MFS Proxy Voting Policies and Procedures from its clients. These comments are carefully considered by MFS when it reviews these guidelines and revises them as appropriate, in MFS’ sole judgment.
These policies and procedures are intended to address any potential material conflicts of interest on the part of MFS or its subsidiaries that are likely to arise in connection with the voting of proxies on behalf of MFS’ clients. If such potential material conflicts of interest do arise, MFS will analyze, document and report on such potential material conflicts of interest (see Sections B.2 and D below), and shall ultimately vote the relevant proxies in what MFS believes to be the best long-term economic interests of its clients. The MFS Proxy Voting Committee is responsible for monitoring and reporting with respect to such potential material conflicts of interest.
MFS is also a signatory to the Principles for Responsible Investment. In developing these guidelines, MFS considered environmental, social and corporate governance issues in light of MFS’ fiduciary obligation to vote proxies in the best long-term economic interest of its clients.
| 2. | MFS’ Policy on Specific Issues |
Election of Directors
MFS believes that good governance should be based on a board with at least a simple majority of directors who are “independent” of management, and whose key committees (e.g., compensation, nominating, and audit committees) consist entirely of “independent” directors. While MFS generally supports the board’s nominees in uncontested or non-contentious elections, we will not support a nominee to a board of a U.S. issuer (or issuer listed on a U.S. exchange) if, as a result of such nominee being elected to the board, the board would consist of a simple majority of members who are not “independent” or, alternatively, the compensation, nominating (including instances in which the full board serves as the compensation or nominating committee) or audit committees would include members who are not “independent.”
MFS will also not support a nominee to a board if we can determine that he or she attended less than 75% of the board and/or relevant committee meetings in the previous year without a valid reason stated in the proxy materials or other company communications. In addition, MFS may not support some or all nominees standing for re-election to a board if we can determine: (1) the board or its compensation committee has re-priced or exchanged underwater stock options since the last annual meeting of shareholders and without shareholder approval; (2) the board or relevant committee has not taken adequately responsive action to an issue that received majority support or opposition from shareholders; (3) the board has implemented a poison pill without shareholder approval since the last annual meeting and such poison pill is not on the subsequent shareholder meeting’s agenda, (including those related to net-operating loss carry-forwards); (4) the board or relevant committee has failed to adequately oversee risk by allowing the hedging and/or significant pledging of company shares by executives; or (5) there are governance concerns with a director or issuer.
MFS also believes that a well-balanced board with diverse perspectives is a foundation for sound corporate governance. MFS will generally vote against the chair of the nominating & governance committee at any U.S. company whose board is comprised of less than 10% female directors. MFS may consider, among other factors, whether the company is transitioning towards increased board gender diversity in determining MFS’ final voting decision.
For directors who are not a CEO of a public company, MFS will vote against a nominee who serves on more than four (4) public company boards in total, and for a director who is also a CEO of a public company, MFS will vote against a nominee who serves on more than two (2) public-company boards in total. MFS may consider exceptions to this policy if (i) the company has disclosed the director’s plans to step down from the number of public company boards exceeding four (4) or two (2), as applicable, within a reasonable time; or (ii) the director exceeds the permitted number of public company board seats solely due to either his/her board service on an affiliated company (e.g., a subsidiary), or service on more than one investment company within the same investment company complex (as defined by applicable law). With respect to a director who serves as a CEO of a public company, MFS will support his or her re-election to the board of the company for which he or she serves as CEO.
MFS may not support certain board nominees of U.S. issuers under certain circumstances where MFS deems compensation to be egregious due to pay-for-performance issues and/or poor pay practices. Please see the section below titled “MFS’ Policy on Specific Issues - Advisory Votes on Executive Compensation” for further details.
MFS evaluates a contested or contentious election of directors on a case-by-case basis considering the long-term financial performance of the company relative to its industry, management’s track record, the qualifications of all nominees, and an evaluation of what each side is offering shareholders.
Majority Voting and Director Elections
MFS votes for reasonably crafted proposals calling for directors to be elected with an affirmative majority of votes cast and/or the elimination of the plurality standard for electing directors (including binding resolutions requesting that the board amend the company’s bylaws), provided the proposal includes a carve-out for a plurality voting standard when there are more director nominees than board seats (e.g., contested elections) (“Majority Vote Proposals”).
Classified Boards
MFS generally supports proposals to declassify a board (i.e.; a board in which only one-third of board members is elected each year) for all issuers other than for certain closed-end investment companies. MFS generally opposes proposals to classify a board for issuers other than for certain closed-end investment companies.
Proxy Access
MFS believes that the ability of qualifying shareholders to nominate a certain number of directors on the company’s proxy statement (“Proxy Access”) may have corporate governance benefits. However, such potential benefits must be balanced by its potential misuse by shareholders. Therefore, we support Proxy Access proposals at U.S. issuers that establish an ownership criteria of 3% of the company held continuously for a period of 3 years. In our view, such qualifying shareholders should have the ability to nominate at least 2 directors. Companies should be mindful of imposing any undue impediments within its bylaws that may render Proxy Access impractical, including re-submission thresholds for director nominees via Proxy Access.
MFS analyzes all other proposals seeking Proxy Access on a case-by-case basis. In its analysis, MFS will consider the proposed ownership criteria for qualifying shareholders (such as ownership threshold and holding period) as well as the proponent’s rationale for seeking Proxy Access.
Stock Plans
MFS opposes stock option programs and restricted stock plans that provide unduly generous compensation for officers, directors or employees, or that could result in excessive dilution to other shareholders. As a general guideline, MFS votes against restricted stock, stock option, non-employee director, omnibus stock plans and any other stock plan if all such plans for a particular company involve potential dilution, in the aggregate, of more than 15%. However, MFS will also vote against stock plans that involve potential dilution, in aggregate, of more than 10% at U.S. issuers that are listed in the Standard and Poor’s 100 index as of December 31 of the previous year. In the cases where a stock plan amendment is seeking qualitative changes and not additional shares, MFS will vote its shares on a case-by-case basis.
MFS also opposes stock option programs that allow the board or the compensation committee to re-price underwater options or to automatically replenish shares without shareholder approval. MFS also votes against stock option programs for officers, employees or non-employee directors that do not require an investment by the optionee, that give “free rides” on the stock price, or that permit grants of stock options with an exercise price below fair market value on the date the options are granted. MFS will consider proposals to exchange existing options for newly issued options, restricted stock or cash on a case-by-case basis, taking into account certain factors, including, but not limited to, whether there is a reasonable value-for-value exchange and whether senior executives are excluded from participating in the exchange.
MFS supports the use of a broad-based employee stock purchase plans to increase company stock ownership by employees, provided that shares purchased under the plan are acquired for no less than 85% of their market value and do not result in excessive dilution.
Shareholder Proposals on Executive Compensation
MFS believes that competitive compensation packages are necessary to attract, motivate and retain executives. However, MFS also recognizes that certain executive compensation practices can be “excessive” and not in the best, long-term economic interest of a company’s shareholders. We believe that the election of an issuer’s board of directors (as outlined above), votes on stock plans (as outlined above) and advisory votes on pay (as outlined below) are typically the most effective mechanisms to express our view on a company’s compensation practices.
MFS generally opposes shareholder proposals that seek to set rigid restrictions on executive compensation as MFS believes that compensation committees should retain some flexibility to determine the appropriate pay package for executives. Although we support linking executive stock option grants to a company’s performance, MFS also opposes shareholder proposals that mandate a link of performance-based pay to a specific metric. MFS generally supports reasonably crafted shareholder proposals that (i) require the issuer to adopt a policy to recover the portion of performance-based bonuses and awards paid to senior executives that were not earned based upon a significant negative restatement of earnings unless the company already has adopted a satisfactory policy on the matter, (ii) expressly prohibit the backdating of stock options, and (iii) prohibit the acceleration of vesting of equity awards upon a broad definition of a “change-in-control” (e.g.; single or modified single-trigger).
Advisory Votes on Executive Compensation
MFS will analyze advisory votes on executive compensation on a case-by-case basis. MFS will vote against an issuer’s executive compensation practices if MFS determines that such practices are excessive or include incentive metrics or structures that are poorly aligned with the best, long-term economic interest of a company’s shareholders. MFS will vote in favor of executive compensation practices if MFS has not determined that these practices are excessive or that the practices include incentive metrics or structures that are poorly aligned with the best, long-term economic interest of a company’s shareholders. Examples of excessive executive compensation practices or poorly aligned incentives may include, but are not limited to, a pay-for-performance disconnect, a set of incentive metrics or a compensation plan structure that MFS believes may lead to a future pay-for-performance disconnect, employment contract terms such as guaranteed bonus provisions, unwarranted pension payouts, backdated stock options, overly generous hiring bonuses for chief executive officers, significant perquisites, or the potential reimbursement of excise taxes to an executive in regards to a severance package. In cases where MFS (i) votes against consecutive advisory pay votes, or (ii) determines that a particularly egregious excessive executive compensation practice has occurred, then MFS may also vote against certain or all board nominees. MFS may also vote against certain or all board nominees if an advisory pay vote for a U.S. issuer is not on the agenda, or the company has not implemented the advisory vote frequency supported by a plurality/ majority of shareholders.
MFS generally supports proposals to include an advisory shareholder vote on an issuer’s executive compensation practices on an annual basis.
“Golden Parachutes”
From time to time, MFS may evaluate a separate, advisory vote on severance packages or “golden parachutes” to certain executives at the same time as a vote on a proposed merger or acquisition. MFS will support an advisory vote on a severance package on a case-by-case basis, and MFS may vote against the severance package regardless of whether MFS supports the proposed merger or acquisition.
Shareholders of companies may also submit proxy proposals that would require shareholder approval of severance packages for executive officers that exceed certain predetermined thresholds. MFS votes in favor of such shareholder proposals when they would require shareholder approval of any severance package for an executive officer that exceeds a certain multiple of such officer’s annual compensation that is not determined in MFS’ judgment to be excessive.
Anti-Takeover Measures
In general, MFS votes against any measure that inhibits capital appreciation in a stock, including proposals that protect management from action by shareholders. These types of proposals take many forms, ranging from “poison pills” and “shark repellents” to super-majority requirements.
MFS generally votes for proposals to rescind existing “poison pills” and proposals that would require shareholder approval to adopt prospective “poison pills,” unless the company already has adopted a clearly satisfactory policy on the matter. MFS may consider the adoption of a prospective “poison pill” or the continuation of an existing “poison pill” if we can determine that the following two conditions are met: (1) the “poison pill” allows MFS clients to hold an aggregate position of up to 15% of a company’s total voting securities (and of any class of voting securities); and (2) either (a) the “poison pill” has a term of not longer than five years, provided that MFS will consider voting in favor of the “poison pill” if the term does not exceed seven years and the “poison pill” is linked to a business strategy or purpose that MFS believes is likely to result in greater value for shareholders; or (b) the terms of the “poison pill” allow MFS clients the opportunity to accept a fairly structured and attractively priced tender offer (e.g. a “chewable poison pill” that automatically dissolves in the event of an all cash, all shares tender offer at a premium price). MFS will also consider on a case-by-case basis proposals designed to prevent tenders which are disadvantageous to shareholders such as tenders at below market prices and tenders for substantially less than all shares of an issuer.
MFS will consider any poison pills designed to protect a company’s net-operating loss carryforwards on a case-by-case basis, weighing the accounting and tax benefits of such a pill against the risk of deterring future acquisition candidates.
Proxy Contests
From time to time, a shareholder may express alternative points of view in terms of a company’s strategy, capital allocation, or other issues. Such shareholder may also propose a slate of director nominees different than the slate of director
nominees proposed by the company (a “Proxy Contest”). MFS will analyze Proxy Contests on a case-by-case basis, taking into consideration the track record and current recommended initiatives of both company management and the dissident shareholder(s). Like all of our proxy votes, MFS will support the slate of director nominees that we believe is in the best, long-term economic interest of our clients.
Reincorporation and Reorganization Proposals
When presented with a proposal to reincorporate a company under the laws of a different state, or to effect some other type of corporate reorganization, MFS considers the underlying purpose and ultimate effect of such a proposal in determining whether or not to support such a measure. MFS generally votes with management in regards to these types of proposals, however, if MFS believes the proposal is in the best long-term economic interests of its clients, then MFS may vote against management (e.g. the intent or effect would be to create additional inappropriate impediments to possible acquisitions or takeovers).
Issuance of Stock
There are many legitimate reasons for the issuance of stock. Nevertheless, as noted above under “Stock Plans,” when a stock option plan (either individually or when aggregated with other plans of the same company) would substantially dilute the existing equity (e.g. by approximately 10-15% as described above), MFS generally votes against the plan. In addition, MFS typically votes against proposals where management is asking for authorization to issue common or preferred stock with no reason stated (a “blank check”) because the unexplained authorization could work as a potential anti-takeover device. MFS may also vote against the authorization or issuance of common or preferred stock if MFS determines that the requested authorization is excessive or not warranted.
Repurchase Programs
MFS supports proposals to institute share repurchase plans in which all shareholders have the opportunity to participate on an equal basis. Such plans may include a company acquiring its own shares on the open market, or a company making a tender offer to its own shareholders.
Cumulative Voting
MFS opposes proposals that seek to introduce cumulative voting and for proposals that seek to eliminate cumulative voting. In either case, MFS will consider whether cumulative voting is likely to enhance the interests of MFS’ clients as minority shareholders.
Written Consent and Special Meetings
The right to call a special meeting or act by written consent can be a powerful tool for shareholders. As such, MFS supports proposals requesting the right for shareholders who hold at least 10% of the issuer’s outstanding stock to call a special meeting. MFS also supports proposals requesting the right for shareholders to act by written consent.
Independent Auditors
MFS believes that the appointment of auditors for U.S. issuers is best left to the board of directors of the company and therefore supports the ratification of the board’s selection of an auditor for the company. Some shareholder groups have submitted proposals to limit the non-audit activities of a company’s audit firm or prohibit any non-audit services by a company’s auditors to that company. MFS opposes proposals recommending the prohibition or limitation of the performance of non-audit services by an auditor, and proposals recommending the removal of a company’s auditor due to the performance of non-audit work for the company by its auditor. MFS believes that the board, or its audit committee, should have the discretion to hire the company’s auditor for specific pieces of non-audit work in the limited situations permitted under current law.
Other Business
MFS generally votes against “other business” proposals as the content of any such matter is not known at the time of our vote.
Adjourn Shareholder Meeting
MFS generally supports proposals to adjourn a shareholder meeting if we support the other ballot items on the meeting’s agenda. MFS generally votes against proposals to adjourn a meeting if we do not support the other ballot items on the meeting’s agenda.
Environmental, Social and Governance (“ESG”) Issues
MFS believes that a company’s ESG practices may have an impact on the company’s long-term economic financial performance and will generally support proposals relating to ESG issues that MFS believes are in the best long-term economic interest of the company’s shareholders. For those ESG proposals for which a specific policy has not been adopted, MFS considers such ESG proposals on a case-by-case basis. As a result, it may vote similar proposals differently at various shareholder meetings based on the specific facts and circumstances of such proposal.
MFS generally supports proposals that seek to remove governance structures that insulate management from shareholders (i.e., anti-takeover measures) or that seek to enhance shareholder rights. Many of these governance-related issues, including compensation issues, are outlined within the context of the above guidelines. In addition, MFS typically supports proposals that require an issuer to reimburse successful dissident shareholders (who are not seeking control of the company) for reasonable expenses that such dissident incurred in soliciting an alternative slate of director candidates. MFS also generally supports reasonably crafted shareholder proposals requesting increased disclosure around the company’s use of collateral in derivatives trading. MFS typically supports proposals for an independent board chairperson. However, we may not support such proposals if we determine there to be an appropriate and effective counter-balancing leadership structure in place (e.g.; a strong, independent lead director with an appropriate level of powers and duties). For any governance-related proposal for which an explicit guideline is not provided above, MFS will consider such proposals on a case-by-case basis and will support such proposals if MFS believes that it is in the best long-term economic interest of the company’s shareholders.
MFS generally supports proposals that request disclosure on the impact of environmental issues on the company’s operations, sales, and capital investments. However, MFS may not support such proposals based on the facts and circumstances surrounding a specific proposal, including, but not limited to, whether (i) the proposal is unduly costly, restrictive, or burdensome, (ii) the company already provides publicly-available information that is sufficient to enable shareholders to evaluate the potential opportunities and risks that environmental matters pose to the company’s operations, sales and capital investments, or (iii) the proposal seeks a level of disclosure that exceeds that provided by the company’s industry peers. MFS will analyze all other environmental proposals on a case-by-case basis and will support such proposals if MFS believes such proposal is in the best long-term economic interest of the company’s shareholders.
MFS will analyze social proposals on a case-by-case basis. MFS will support such proposals if MFS believes that such proposal is in the best long-term economic interest of the company’s shareholders. Generally, MFS will support shareholder proposals that (i) seek to amend a company’s equal employment opportunity policy to prohibit discrimination based on sexual orientation and gender identity; and (ii) request additional disclosure regarding a company’s political contributions (including trade organizations and lobbying activity) (unless the company already provides publicly-available information that is sufficient to enable shareholders to evaluate the potential opportunities and risks that such contributions pose to the company’s operations, sales and capital investments).
The laws of various states or countries may regulate how the interests of certain clients subject to those laws (e.g. state pension plans) are voted with respect to social issues. Thus, it may be necessary to cast ballots differently for certain clients than MFS might normally do for other clients.
Foreign Issuers
MFS generally supports the election of a director nominee standing for re-election in uncontested or non-contentious elections unless it can be determined that (1) he or she failed to attend at least 75% of the board and/or relevant committee meetings in the previous year without a valid reason given in the proxy materials; (2) since the last annual meeting of shareholders and without shareholder approval, the board or its compensation committee has re-priced underwater stock options; or (3) since the last annual meeting, the board has either implemented a poison pill without shareholder approval or has not taken responsive action to a majority shareholder approved resolution recommending that the “poison pill” be rescinded. In such circumstances, we will vote against director nominee(s). Also, certain markets outside of the U.S. have adopted best practice guidelines relating to corporate governance matters (e.g. the United Kingdom’s and Japan Corporate Governance Codes). Many of these guidelines operate on a “comply or explain” basis. As such, MFS will evaluate any explanations by companies relating to their compliance with a particular corporate governance guideline on a case-by-case basis and may vote against the board nominees or other relevant ballot item if such explanation is not satisfactory. In some circumstances, MFS may submit a vote to abstain from certain director nominees or the relevant ballot items if we have concerns with the nominee or ballot item, but do not believe these concerns rise to the level where a vote against is warranted.
MFS generally supports the election of auditors, but may determine to vote against the election of a statutory auditor in certain markets if MFS reasonably believes that the statutory auditor is not truly independent.
Some international markets have also adopted mandatory requirements for all companies to hold shareholder votes on executive compensation. MFS will vote against such proposals if MFS determines that a company’s executive compensation practices are excessive, considering such factors as the specific market’s best practices that seek to maintain appropriate pay-for-performance alignment and to create long-term shareholder value. We may alternatively submit an abstention vote on such proposals in circumstances where our executive compensation concerns are not as severe.
Many other items on foreign proxies involve repetitive, non-controversial matters that are mandated by local law. Accordingly, the items that are generally deemed routine and which do not require the exercise of judgment under these guidelines (and therefore voted with management) for foreign issuers include, but are not limited to, the following: (i) receiving financial statements or other reports from the board; (ii) approval of declarations of dividends; (iii) appointment of shareholders to sign board meeting minutes; (iv) discharge of management and supervisory boards; and (v) approval of share repurchase programs (absent any anti-takeover or other concerns). MFS will evaluate all other items on proxies for foreign companies in the context of the guidelines described above, but will
generally vote against an item if there is not sufficient information disclosed in order to make an informed voting decision. For any ballot item where MFS wishes to express a more moderate level of concern than a vote of against, we will cast a vote to abstain.
In accordance with local law or business practices, some foreign companies or custodians prevent the sale of shares that have been voted for a certain period beginning prior to the shareholder meeting and ending on the day following the meeting (“share blocking”). Depending on the country in which a company is domiciled, the blocking period may begin a stated number of days prior or subsequent to the meeting (e.g. one, three or five days) or on a date established by the company. While practices vary, in many countries the block period can be continued for a longer period if the shareholder meeting is adjourned and postponed to a later date. Similarly, practices vary widely as to the ability of a shareholder to have the “block” restriction lifted early (e.g. in some countries shares generally can be “unblocked” up to two days prior to the meeting whereas in other countries the removal of the block appears to be discretionary with the issuer’s transfer agent). Due to these restrictions, MFS must balance the benefits to its clients of voting proxies against the potentially serious portfolio management consequences of a reduced flexibility to sell the underlying shares at the most advantageous time. For companies in countries with share blocking periods or in markets where some custodians may block shares, the disadvantage of being unable to sell the stock regardless of changing conditions generally outweighs the advantages of voting at the shareholder meeting for routine items. Accordingly, MFS will not vote those proxies in the absence of an unusual, significant vote that outweighs the disadvantage of being unable to sell the stock.
From time to time, governments may impose economic sanctions which may prohibit us from transacting business with certain companies or individuals. These sanctions may also prohibit the voting of proxies at certain companies or on certain individuals. In such instances, MFS will not vote at certain companies or on certain individuals if it determines that doing so is in violation of the sanctions.
In limited circumstances, other market specific impediments to voting shares may limit our ability to cast votes, including, but not limited to, late delivery of proxy materials, untimely vote cut-off dates, power of attorney and share re-registration requirements, or any other unusual voting requirements. In these limited instances, MFS votes securities on a best efforts basis in the context of the guidelines described above.
| B. | ADMINISTRATIVE PROCEDURES |
| 1. | MFS Proxy Voting Committee |
The administration of these MFS Proxy Voting Policies and Procedures is overseen by the MFS Proxy Voting Committee, which includes senior personnel from the MFS Legal and Global Investment and Client Support Departments as well as members of the investment team. The Proxy Voting Committee does not include individuals whose primary duties relate to client relationship management, marketing, or sales. The MFS Proxy Voting Committee:
| a. | Reviews these MFS Proxy Voting Policies and Procedures at least annually and recommends any amendments considered to be necessary or advisable; |
| b. | Determines whether any potential material conflict of interest exists with respect to instances in which MFS (i) seeks to override these MFS Proxy Voting Policies and Procedures; (ii) votes on ballot items not governed by these MFS Proxy Voting Policies and Procedures; (iii) evaluates an excessive executive compensation issue in relation to the election of directors; or (iv) requests a vote recommendation from an MFS portfolio manager or investment analyst (e.g. mergers and acquisitions); |
| c. | Considers special proxy issues as they may arise from time to time; and |
| d. | Determines engagement priorities and strategies with respect to MFS’ proxy voting activities |
| 2. | Potential Conflicts of Interest |
The MFS Proxy Voting Committee is responsible for monitoring potential material conflicts of interest on the part of MFS or its subsidiaries that could arise in connection with the voting of proxies on behalf of MFS’ clients. Due to the client focus of our investment management business, we believe that the potential for actual material conflict of interest issues is small. Nonetheless, we have developed precautions to assure that all proxy votes are cast in the best long-term economic interest of shareholders.1 Other MFS internal policies require all MFS employees to avoid actual and potential conflicts of interests between personal activities and MFS’ client activities. If an employee (including investment professionals) identifies an actual or potential conflict of interest with respect to any voting decision (including the ownership of securities in their individual portfolio), then that employee must recuse himself/herself from participating in the voting process. Any significant attempt by an employee of MFS or its subsidiaries to unduly influence MFS’ voting on a particular proxy matter should also be reported to the MFS Proxy Voting Committee.
| 1 | For clarification purposes, note that MFS votes in what we believe to be the best, long-term economic interest of our clients entitled to vote at the shareholder meeting, regardless of whether other MFS clients hold “short” positions in the same issuer. |
In cases where proxies are voted in accordance with these MFS Proxy Voting Policies and Procedures, no material conflict of interest will be deemed to exist. In cases where (i) MFS is considering overriding these MFS Proxy Voting Policies and Procedures, (ii) matters presented for vote are not governed by these MFS Proxy Voting Policies and Procedures, (iii) MFS evaluates a potentially excessive executive compensation issue in relation to the election of directors or advisory pay or severance package vote, or (iv) a vote recommendation is requested from an MFS portfolio manager or investment analyst (e.g. mergers and acquisitions); (collectively, “Non-Standard Votes”); the MFS Proxy Voting Committee will follow these procedures:
| a. | Compare the name of the issuer of such proxy against a list of significant current (i) distributors of MFS Fund shares, and (ii) MFS institutional clients (the “MFS Significant Distributor and Client List”); |
| b. | If the name of the issuer does not appear on the MFS Significant Distributor and Client List, then no material conflict of interest will be deemed to exist, and the proxy will be voted as otherwise determined by the MFS Proxy Voting Committee; |
| c. | If the name of the issuer appears on the MFS Significant Distributor and Client List, then the MFS Proxy Voting Committee will be apprised of that fact and each member of the MFS Proxy Voting Committee will carefully evaluate the proposed vote in order to ensure that the proxy ultimately is voted in what MFS believes to be the best long-term economic interests of MFS’ clients, and not in MFS’ corporate interests; and |
| d. | For all potential material conflicts of interest identified under clause (c) above, the MFS Proxy Voting Committee will document: the name of the issuer, the issuer’s relationship to MFS, the analysis of the matters submitted for proxy vote, the votes as to be cast and the reasons why the MFS Proxy Voting Committee determined that the votes were cast in the best long-term economic interests of MFS’ clients, and not in MFS’ corporate interests. A copy of the foregoing documentation will be provided to MFS’ Conflicts Officer. |
The members of the MFS Proxy Voting Committee are responsible for creating and maintaining the MFS Significant Distributor and Client List, in consultation with MFS’ distribution and institutional business units. The MFS Significant Distributor and Client List will be reviewed and updated periodically, as appropriate.
For instances where MFS is evaluating a director nominee who also serves as a director of the MFS Funds, then the MFS Proxy Voting Committee will adhere to the procedures described in section (d) above regardless of whether the portfolio company appears on our Significant Distributor and Client List.
If an MFS client has the right to vote on a matter submitted to shareholders by Sun Life Financial, Inc. or any of its affiliates (collectively “Sun Life”), MFS will cast a vote on behalf of such MFS client pursuant to the recommendations of Institutional Shareholder Services, Inc.‘s (“ISS”) benchmark policy, or as required by law.
Except as described in the MFS Fund’s Prospectus, from time to time, certain MFS Funds (the “top tier fund”) may own shares of other MFS Funds (the “underlying fund”). If an underlying fund submits a matter to a shareholder vote, the top tier fund will generally vote its shares in the same proportion as the other shareholders of the underlying fund. If there are no other shareholders in the underlying fund, the top tier fund will vote in what MFS believes to be in the top tier fund’s best long-term economic interest. If an MFS client has the right to vote on a matter submitted to shareholders by a pooled investment vehicle advised by MFS, MFS will cast a vote on behalf of such MFS client in the same proportion as the other shareholders of the pooled investment vehicle.
| 3. | Gathering Proxies |
Most proxies received by MFS and its clients originate at Broadridge Financial Solutions, Inc. (“Broadridge”). Broadridge and other service providers, on behalf of custodians, send proxy related material to the record holders of the shares beneficially owned by MFS’ clients, usually to the client’s proxy voting administrator or, less commonly, to the client itself. This material will include proxy ballots reflecting the shareholdings of Funds and of clients on the record dates for such shareholder meetings, as well as proxy materials with the issuer’s explanation of the items to be voted upon.
MFS, on behalf of itself and certain of its clients (including the MFS Funds) has entered into an agreement with an independent proxy administration firm pursuant to which the proxy administration firm performs various proxy vote related administrative services such as vote processing and recordkeeping functions. Except as noted below, the proxy administration firm for MFS and its clients, including the MFS Funds, is ISS. The proxy administration firm for MFS Development Funds, LLC is Glass, Lewis & Co., Inc. (“Glass Lewis”; Glass Lewis and ISS are each hereinafter referred to as the “Proxy Administrator”).
The Proxy Administrator receives proxy statements and proxy ballots directly or indirectly from various custodians, logs these materials into its database and matches upcoming meetings with MFS Fund and client portfolio holdings, which are input into the Proxy Administrator’s system by an MFS holdings data-feed. Through the use of the Proxy Administrator system, ballots and proxy material summaries for all upcoming shareholders’ meetings are available on-line to certain MFS employees and members of the MFS Proxy Voting Committee.
It is the responsibility of the Proxy Administrator and MFS to monitor the receipt of ballots. When proxy ballots and materials for clients are received by the Proxy Administrator, they are input into the Proxy Administrator’s on-line system. The Proxy Administrator then reconciles a list of all MFS accounts that hold shares of a company’s stock and the number of shares held on the record date by these accounts with the Proxy Administrator’s list of any upcoming shareholder’s meeting of that company. If a proxy ballot has not been received, the Proxy Administrator contacts the custodian requesting the reason as to why a ballot has not been received.
| 4. | Analyzing Proxies |
Proxies are voted in accordance with these MFS Proxy Voting Policies and Procedures. The Proxy Administrator, at the prior direction of MFS, automatically votes all proxy matters that do not require the particular exercise of discretion or judgment with respect to these MFS Proxy Voting Policies and Procedures as determined by MFS. With respect to proxy matters that require the particular exercise of discretion or judgment, the MFS Proxy Voting Committee or its representatives considers and votes on those proxy matters. MFS also receives research and recommendations from the Proxy Administrator which it may take into account in deciding how to vote. MFS uses its own internal research, the research of Proxy Administrators and/or other 3rd party research tools and vendors to identify (i) circumstances in which a board may have approved an executive compensation plan that is excessive or poorly aligned with the portfolio company’s business or its shareholders, (ii) environmental and social proposals that warrant further consideration or (iii) circumstances in which a non-U.S. company is not in compliance with local governance or compensation best practices. In those situations where the only MFS fund that is eligible to vote at a shareholder meeting has Glass Lewis as its Proxy Administrator, then we will utilize research from Glass Lewis to identify such issues. MFS analyzes such issues independently and does not necessarily vote with the ISS or Glass Lewis recommendations on these issues. Representatives of the MFS Proxy Voting Committee review, as appropriate, votes cast to ensure conformity with these MFS Proxy Voting Policies and Procedures.
For votes that require a case-by-case analysis per the MFS Proxy Policies (e.g. proxy contests, potentially excessive executive compensation issues, or certain shareholder proposals), a member of the proxy voting team will consult with or seek recommendations from MFS investment analysts and/or portfolio managers.2 However, the MFS Proxy Voting Committee will ultimately determine the manner in which such proxies are voted.
| 2 | From time to time, due to travel schedules and other commitments, an appropriate portfolio manager or research analyst may not be available to provide a vote recommendation. If such a recommendation cannot be obtained within a reasonable time prior to the cut-off date of the shareholder meeting, the MFS Proxy Voting Committee may determine to abstain from voting. |
As noted above, MFS reserves the right to override the guidelines when such an override is, in MFS’ best judgment, consistent with the overall principle of voting proxies in the best long-term economic interests of MFS’ clients. Any such override of the guidelines shall be analyzed, documented and reported in accordance with the procedures set forth in these policies.
| 5. | Voting Proxies |
In accordance with its contract with MFS, the Proxy Administrator also generates a variety of reports for the MFS Proxy Voting Committee, and makes available on-line various other types of information so that the MFS Proxy Voting Committee or proxy voting team may review and monitor the votes cast by the Proxy Administrator on behalf of MFS’ clients.
For those markets that utilize a “record date” to determine which shareholders are eligible to vote, MFS generally will vote all eligible shares pursuant to these guidelines regardless of whether all (or a portion of) the shares held by our clients have been sold prior to the meeting date.
| 6. | Securities Lending |
From time to time, the MFS Funds or other pooled investment vehicles sponsored by MFS may participate in a securities lending program. In the event MFS or its agent receives timely notice of a shareholder meeting for a U.S. security, MFS and its agent will attempt to recall any securities on loan before the meeting’s record date so that MFS will be entitled to vote these shares. However, there may be instances in which MFS is unable to timely recall securities on loan for a U.S. security, in which cases MFS will not be able to vote these shares. MFS will report to the appropriate board of the MFS Funds those instances in which MFS is not able to timely recall the loaned securities. MFS generally does not recall non-U.S. securities on loan because there may be insufficient advance notice of proxy materials, record dates, or vote cut-off dates to allow MFS to timely recall the shares in certain markets on an automated basis. As a result, non-U.S. securities that are on loan will not generally be voted. If MFS receives timely notice of what MFS determines to be an unusual, significant vote for a non-U.S. security whereas MFS shares are on loan, and determines that voting is in the best long-term economic interest of shareholders, then MFS will attempt to timely recall the loaned shares.
| 7. | Engagement |
The MFS Proxy Voting Policies and Procedures are available on www.mfs.com and may be accessed by both MFS’ clients and the companies in which MFS’ clients invest. From time to time, MFS may determine that it is appropriate and beneficial for members of the MFS Proxy Voting Committee or proxy voting team to engage in a dialogue or written communication with a company or other shareholders regarding certain matters on the company’s proxy statement that are of concern to shareholders, including environmental, social and governance matters. A company or shareholder may also seek to engage with members of the MFS Proxy Voting Committee or proxy voting team in advance of the company’s formal proxy solicitation to review issues more generally or gauge support for certain contemplated proposals. The MFS Proxy Voting Committee, in consultation with members of the investment team, establish proxy voting engagement goals and priorities for the year. For further information on requesting engagement with MFS on proxy voting issues or information about MFS’ engagement priorities, please visit www.mfs.com and refer to our most recent proxy season preview and engagement priorities report.
| C. | RECORDS RETENTION |
MFS will retain copies of these MFS Proxy Voting Policies and Procedures in effect from time to time and will retain all proxy voting reports submitted to the Board of Trustees of the MFS Funds for the period required by applicable law. Proxy solicitation materials, including electronic versions of the proxy ballots completed by representatives of the MFS Proxy Voting Committee, together with their respective notes and comments, are maintained in an electronic format by the Proxy Administrator and are accessible on-line by the MFS Proxy Voting Committee. All proxy voting materials and supporting documentation, including records generated by the Proxy Administrator’s system as to proxies processed, including the dates when proxy ballots were received and submitted, and the votes on each company’s proxy issues, are retained as required by applicable law.
| D. | REPORTS |
U.S. Registered MFS Funds
MFS publicly discloses the proxy voting records of the U.S. registered MFS Funds on a quarterly basis. MFS will also report the results of its voting to the Board of Trustees of the U.S. registered MFS Funds. These reports will include: (i) a summary of how votes were cast (including advisory votes on pay and “golden parachutes”); (ii) a summary of votes against management’s recommendation; (iii) a review of situations where MFS did not vote in accordance with the guidelines and the rationale therefore; (iv) a review of the procedures used by MFS to identify material conflicts of interest and any matters identified as a material conflict of interest; (v) a review of these policies and the guidelines; (vi) a review of our proxy engagement activity; (vii) a report and impact assessment of instances in which the recall of loaned securities of a U.S. issuer was unsuccessful; and (viii) as necessary
or appropriate, any proposed modifications thereto to reflect new developments in corporate governance and other issues. Based on these reviews, the Trustees of the U.S. registered MFS Funds will consider possible modifications to these policies to the extent necessary or advisable.
Other MFS Clients
MFS may publicly disclose the proxy voting records of certain other clients (including certain MFS Funds) or the votes it casts with respect to certain matters as required by law. A report can also be printed by MFS for each client who has requested that MFS furnish a record of votes cast. The report specifies the proxy issues which have been voted for the client during the year and the position taken with respect to each issue and, upon request, may identify situations where MFS did not vote in accordance with the MFS Proxy Voting Policies and Procedures.
Except as described above, MFS generally will not divulge actual voting practices to any party other than the client or its representatives because we consider that information to be confidential and proprietary to the client. However, as noted above, MFS may determine that it is appropriate and beneficial to engage in a dialogue with a company regarding certain matters. During such dialogue with the company, MFS may disclose the vote it intends to cast in order to potentially effect positive change at a company in regards to environmental, social or governance issues.
Serious News for Serious Traders! Try StreetInsider.com Premium Free!
You May Also Be Interested In
- Western Alaska Minerals Announces $5 Million Brokered and $1.5 Million Non-Brokered Offering
- LifeWallet Announces a Comprehensive Settlement with 10 Affiliated Property & Casualty Insurers, Doing Business in 15 States
- Epique Realty Sets New Industry Standard with Epique PowerCON 2024 Event FREE For Epique Agents
Create E-mail Alert Related Categories
SEC FilingsSign up for StreetInsider Free!
Receive full access to all new and archived articles, unlimited portfolio tracking, e-mail alerts, custom newswires and RSS feeds - and more!
