

Form N-CSR Legg Mason Global Asset For: Sep 30
 Tweet
Tweet Share
Share
UNITED STATES
SECURITIES AND EXCHANGE COMMISSION
Washington, D.C. 20549
FORM N-CSR
CERTIFIED SHAREHOLDER REPORT OF REGISTERED
MANAGEMENT INVESTMENT COMPANIES
Investment Company Act file number 811-22338
Legg Mason Global Asset Management Trust
(Exact name of registrant as specified in charter)
620 Eighth Avenue, 47th Floor, New York, NY 10018
(Address of principal executive offices) (Zip code)
Marc A. De Oliveira
Franklin Templeton
100 First Stamford Place
Stamford, CT 06902
(Name and address of agent for service)
Registrant’s telephone number, including area code: 877-6LM-FUND/656-3863
Date of fiscal year end: September 30
Date of reporting period: September 30, 2022
| ITEM 1. | REPORT TO STOCKHOLDERS |
The Annual Report to Stockholders is filed herewith.
![]()
| Annual Report | September 30, 2022 |
CLEARBRIDGE
GLOBAL INFRASTRUCTURE INCOME FUND

| INVESTMENT PRODUCTS: NOT FDIC INSURED • NO BANK GUARANTEE • MAY LOSE VALUE |
Fund objective
The Fund seeks to provide income and capital appreciation.

Dear Shareholder,
We are pleased to provide the annual report of ClearBridge Global Infrastructure Income Fund for the twelve-month reporting period ended September 30, 2022. Please read on for a detailed look at prevailing economic and market conditions during the Fund’s reporting period and to learn how those conditions have affected Fund performance.
As always, we remain committed to providing you with excellent service and a full spectrum of investment choices. We also remain committed to supplementing the support you receive from your financial advisor. One way we accomplish this is through our website, www.franklintempleton.com. Here you can gain immediate access to market and investment information, including:
| • | Fund prices and performance, |
| • | Market insights and commentaries from our portfolio managers, and |
| • | A host of educational resources. |
We look forward to helping you meet your financial goals.
Sincerely,

Jane Trust, CFA
President and Chief Executive Officer
October 31, 2022
|
II |
ClearBridge Global Infrastructure Income Fund |
Q. What is the Fund’s investment strategy?
A. The Fund seeks to provide income and capital appreciation. Under normal circumstances, the Fund invests at least 80% of its net assets, plus the amount of borrowings for investment purposes, if any, in securities issued by companies that are engaged in the infrastructure business and other investments with similar economic characteristics.
We, at ClearBridge Investments (North America) Pty Limited (formerly known as ClearBridge RARE Infrastructure (North America) Pty Limited), the Fund’s subadviser, consider companies to be engaged in the infrastructure business if at least 50% or more of their assets, income, sales or profits are committed to, derived from or related to, the construction, renovation, ownership, development, financing, management or operation of infrastructure assets or the provision of raw materials necessary for the construction and maintenance of infrastructure assets. Infrastructure assets include physical structures, networks, developments and projects that communities and economies require to function and grow, including transportation-related infrastructure (airports, roads, railroads, and ports), energy-related infrastructure (gas pipelines, alternative energy and electrical plants), water and sewage infrastructure, communications infrastructure (fiber, copper, wireless and cable networks, broadcast towers and satellites), and social services-related infrastructure (hospitals, healthcare facilities, educational facilities, prisons, sports and entertainment facilities and stadiums) and other resources and services necessary for the construction and maintenance of infrastructure assets. The Fund concentrates its investments in companies that are engaged in the infrastructure business.
The Fund invests primarily in income paying equity and equity-related securities of exchange-traded infrastructure companies, which may include common stocks, preferred stocks, convertible stocks and other securities convertible into equity securities, publicly-traded units of master limited partnerships (MLPs), and securities of other investment companies, exchange traded funds (ETFs) and real estate investment trusts (REITs). The Fund may invest in companies of any size and market capitalization, including small and mid-capitalization companies. These issuers may be newer or less-seasoned companies, including companies making initial public offerings (IPOs). The Fund’s portfolio is expected to be highly concentrated, with approximately 30 to 60 holdings.
The Fund may seek investment opportunities in any foreign country and may invest a significant portion of its assets in foreign securities. Under normal market conditions, the Fund will invest in or have exposure to securities of companies located in at least three countries (which may include the United States). The Fund may invest up to 20% of its assets in securities of companies located in countries with developing or emerging markets.
The Fund may engage in forward foreign currency contracts and may use derivatives such as options and futures contracts to hedge investments or to gain exposure to the market for the underlying investments. Derivative instruments are taken into account when determining compliance with the Fund’s 80% policy. It is not anticipated that the Fund will hedge currency exposure to non-U.S. dollar denominated investments, but we reserve the right to do so.
| ClearBridge Global Infrastructure Income Fund 2022 Annual Report |
|
1 |
|
Fund overview (cont’d)
We use various quantitative and qualitative measures to analyze global equity securities. We apply a proprietary screening methodology to develop an investment universe of securities of companies that are engaged in the infrastructure business and provide sustainable income distributions. This process focuses on identifying companies with long term cash flows from regulatory and/or contractual frameworks and where cash flows are believed to be relatively sustainable. We also focus on companies that we believe are attractively valued relative to other companies in the same industry or market. We may sell a portfolio holding if the anticipated return falls below predetermined required return bands that prompt a review of the portfolio position.
Q. What were the overall market conditions during the Fund’s reporting period?
A. Market volatility rose in the fourth quarter of 2021, with the Omicron variant emerging as the latest threat from the COVID-19 pandemic. A spike in cases around the world caused many developed markets to re-impose restrictions on mobility and close borders to contain the spread. These moves slowed the reopening process and put further pressure on already constrained global supply chains. At the same time, amid rising inflation, the Federal Reserve Board (the “Fed”) gave its strongest signals since the start of the pandemic that accommodative monetary policy would soon be going away. At its December meeting, Fed Chair Jerome Powell announced that the central bank would be accelerating its tapering of government bond purchases and indicated several interest rate hikes were on the table for 2022. These hikes came through beginning in March, commencing a tightening regime for central banks globally, and quickly ratcheted up in with larger rate hikes in June, July and September.
Russia’s invasion of Ukraine in February further disrupted global supply chains and reduced global commodity reserves due to the sanctions levied on Russia, the world’s 11th largest economy. The conflict increased the probability of a recession in Europe, which investors feared could spread to other developed economies. Oil and natural gas prices spiked amid an increasing energy crisis, in particular in Europe, while surges in COVID-19 cases in China led to lockdowns there, keeping pressure on supply chains and crimping some overall demand. Leadership changes in the U.K. and Italy added to political uncertainty in those regions, while in the U.S., the largest piece of climate legislation in U.S. history was passed; the U.S. Inflation Reduction Act should be a major tailwind to contracted renewables and utilities globally.
Overall, rising bond yields, persistent inflation, growing fears of a recession and an ongoing energy crisis in Europe pressured gains for both equities and infrastructure, with infrastructure’s defensive characteristics leading to its outperformance versus global equities.
|
2 |
ClearBridge Global Infrastructure Income Fund 2022 Annual Report |
Q. How did we respond to these changing market conditions?
A. The majority of portfolio activity was driven by stock-specific factors. Broadly, however, entering 2022, our base case was for slowing growth and higher inflation, with a playbook to transition exposure from a growth orientation to a more defensive positioning. This largely played out as we responded to rising recession risks over the period, for example with the sale of Mexico’s largest airport operator Grupo Aeroportuario del Pacifico, on the expectation of slowdown in travel due to economic impacts of higher costs of living. New positions over the period were concentrated in the more defensive utilities sector, such as North American electric utilities OGE Energy, where we are positive on a strong dividend yield in the current environment, Emera, and FirstEnergy, which hit our valuation target and was sold. We also added to Spanish electric utility Iberdrola, viewed as a beneficiary of Europe’s recent REPowerEU plan driving investments in renewables and network infrastructures in order to reduce reliance on Russian gas, as well as U.S. electric utility Entergy and Energias de Portugal, an integrated utility based in Iberia. We also added to growth-oriented contracted renewables company NextEra Energy Partners on its positive leverage to the Inflation Reduction Act, which includes support for renewable energy.
Performance review
For the twelve months ended September 30, 2022, Class IS shares of ClearBridge Global Infrastructure Income Fund, returned -6.94%. The Fund’s unmanaged benchmark, the S&P Global Infrastructure Index (NR)i, returned -6.72% for the same period. The Lipper Global Infrastructure Funds Category Averageii returned -10.49% over the same time frame.
|
Performance Snapshot as of September 30, 2022 (unaudited) |
||||||||
| (excluding sales charges) | 6 months | 12 months | ||||||
| ClearBridge Global Infrastructure Income Fund: | ||||||||
| Class A |
-18.72 | % | -7.22 | % | ||||
| Class I |
-18.62 | % | -7.02 | % | ||||
| Class IS |
-18.61 | % | -6.94 | % | ||||
| S&P Global Infrastructure Index (NR) | -16.72 | % | -6.72 | % | ||||
| Lipper Global Infrastructure Funds Category Average | -17.68 | % | -10.49 | % | ||||
The performance shown represents past performance. Past performance is no guarantee of future results and current performance may be higher or lower than the performance shown above. Principal value and investment returns will fluctuate and investors’ shares, when redeemed, may be worth more or less than their original cost. To obtain performance data current to the most recent month-end, please visit our website at www.franklintempleton.com.
All share class returns assume the reinvestment of all distributions at net asset value and the deduction of all Fund expenses. Returns have not been adjusted to include sales charges that may apply or the deduction of taxes that a shareholder would pay on Fund distributions. If sales charges were reflected, the performance quoted would be lower. Performance figures for periods shorter than one year represent cumulative figures and are not annualized.
Fund performance figures reflect fee waivers and/or expense reimbursements, without which the performance would have been lower.
| ClearBridge Global Infrastructure Income Fund 2022 Annual Report |
|
3 |
|
Fund overview (cont’d)
| Total Annual Operating Expenses (unaudited) |
As of the Fund’s current prospectus dated January 28, 2022, as supplemented July 01, 2022, the gross total annual fund operating expense ratios for Class A, Class I and Class IS shares were 1.44%, 1.15% and 1.08%, respectively.
Actual expenses may be higher. For example, expenses may be higher than those shown if average net assets decrease. Net assets are more likely to decrease and Fund expense ratios are more likely to increase when markets are volatile.
As a result of expense limitation arrangements, the ratio of total annual fund operating expenses, other than interest, brokerage commissions, taxes, extraordinary expenses and acquired fund fees and expenses, to average net assets will not exceed 1.30% for Class A shares, 0.95% for Class I shares and 0.85% for Class IS shares. In addition, the ratio of total annual fund operating expenses for Class IS shares will not exceed the ratio of total annual fund operating expenses for Class I shares. These expense limitation arrangements cannot be terminated prior to December 31, 2023 without the Board of Trustees’ consent.
The manager is permitted to recapture amounts waived and/or reimbursed to a class within three years after the fiscal year in which the manager earned the fee or incurred the expense if the class’ total annual fund operating expenses have fallen to a level below the expense limitation (“expense cap”) in effect at the time the fees were earned or the expenses incurred. In no case will the manager recapture any amount that would result, on any particular business day of the Fund, in the class’ total annual fund operating expenses exceeding the expense cap or any other lower limit then in effect.
Q. What were the leading contributors to performance?
A. During the reporting period, regional contribution was led by Latin America, the U.S. and Canada. On a sector level, other infrastructure, energy infrastructure and rail contributed the most to Fund performance. On a stock level, Exelon, Clearway Energy and CPFL Energia were the top contributors to performance.
U.S. electric utility Exelon is a U.S. energy provider with one of the cleanest and lowest-cost power generation fleets. Its utilities serve millions of electric and gas customers across Delaware, Illinois, Maryland, New Jersey, Pennsylvania and the District of Columbia. Shares outperformed along with the utilities sector; Exelon is also starting to be viewed as a premium name after its recently completed spin-off of power generation business Constellation Energy. The recognition of value in its nuclear business, approaching the passage of and confirmed in the final U.S. Inflation Reduction Act, was also positive for Exelon.
Clearway Energy primarily owns and operates contracted renewable generation assets in the U.S. It also owns and operates conventional generation and thermal infrastructure assets. Shares rose on the announcement that TotalEnergies and Global Infrastructure Partners are partnering to acquire 50% of Clearway, helping to provide a longer runway for growth projects.
|
4 |
ClearBridge Global Infrastructure Income Fund 2022 Annual Report |
CPFL Energia is one of Brazil’s largest distribution and generation companies, with a 13% market share in distribution and a 3% market share in generation. CPFL’s distribution assets include eight separate federally regulated concessions and generation assets consisting of a mix of hydro and renewable assets that are underpinned by long-term take-or-pay contracts. CPFL was up due to a combination of the Brazilian market rebound and improved hydrological conditions: rain is essential for CPFL’s hydro power plants and, after a severe period of drought, Brazil started off its rainy season with exceptionally good precipitation in early 2022. In the third quarter of 2022, lower than expected interest rate hikes in Brazil were positive for CPFL, as many now anticipate lower inflation and an easing rate cycle in 2023.
Q. What were the leading detractors from performance?
A. During the reporting period, the main regional detractor was Western Europe. On a sector level, the gas, toll roads and water sectors were the main detractors from Fund performance. On a stock level, Aena, Snam and United Utilities were the top detractors from performance. Aena is the monopoly owner of the Spanish airport system, operating the 46 airports under a dual-till regulatory regime. Aena also manages London Luton Airport, with a 51% stake. Aena’s share price declined as the spread of the COVID-19 Delta variant created concerns around air travel recovery. Later, the expected summer passenger recovery was curtailed by increased flight cancellations owing largely to staffing limitations combined with increasing fears of a recession and its potential impacts on future passenger volumes.
Snam, an Italian gas utility, is the owner and operator of gas transport, distribution, storage and regasification infrastructure in Italy and its neighboring European countries. Shares were lower due to rising bond yields in Europe, coupled with energy crisis and recession fears, as the Russia-Ukraine conflict escalated and the global growth outlook worsened.
Political uncertainty in the U.K., amid negative headlines of high costs of living and drought, also combined to create risks for water companies, the most severe of which is nationalization. This environment weighed on U.K. water companies such as United Utilities.
Q. Were there any significant changes to the Fund during the period?
A. Underpinned by valuation, a solid investment thesis and clear catalysts, the Fund initiated positions in the several stocks during the reporting period, most significantly in: Emera, a Canadian electric utility, OGE Energy, a U.S. electric utility, United Utilities, a U.K. water utility, Pennon, a U.K. water utility and ENGIE Brasil Energia, a Brazilian electric utility.
Driven by concerns over valuation or the investment thesis or catalysts not playing out, we exited several positions, most significantly: Exelon, a U.S. energy provider, AusNet Services, an Australian electric utility, Southern Company, a U.S. electric utility, Sydney Airport, an Australian airport operator and Grupo Aeroportuario del Pacifico, a Mexican airport operator.
| ClearBridge Global Infrastructure Income Fund 2022 Annual Report |
|
5 |
|
Fund overview (cont’d)
Thank you for your investment in ClearBridge Global Infrastructure Income Fund. As always, we appreciate that you have chosen us to manage your assets and we remain focused on achieving the Fund’s investment goals.
Sincerely,

Nick Langley
Portfolio Manager
ClearBridge RARE Infrastructure (North America) Pty Limited

Charles Hamieh
Portfolio Manager
ClearBridge RARE Infrastructure (North America) Pty Limited

Shane Hurst
Portfolio Manager
ClearBridge RARE Infrastructure (North America) Pty Limited
|
6 |
ClearBridge Global Infrastructure Income Fund 2022 Annual Report |

Daniel Chu
Portfolio Manager
ClearBridge RARE Infrastructure (North America) Pty Limited
October 14, 2022
RISKS: Equity securities are subject to market and price fluctuations. Small- and mid-cap stocks involve greater risks and volatility than large-cap stocks. Because the Fund invests significantly in companies that are engaged in the infrastructure business, the Fund is more susceptible to adverse economic, regulatory, political, legal and other changes affecting such companies. International investments are subject to special risks including currency fluctuations and social, economic and political uncertainties, which could increase volatility. These risks are magnified in emerging markets. Emerging markets countries tend to have economic, political and legal systems that are less developed and are less stable than those of more developed countries. Because this Fund holds a concentrated portfolio of securities and invests in certain regions or industries, it has increased vulnerability to market volatility. The Fund may invest in real estate investment trusts (REITs), which are closely linked to the performance of the real estate markets. REITs are subject to illiquidity, credit and interest rate risks, as well as risks associated with small- and mid-cap investments. Investments in master limited partnerships (MLPs) include the risks of declines in energy and commodity prices, decreases in energy demand, adverse weather conditions, natural or other disasters, changes in government regulation, changes in tax laws, and other risks of the MLP and energy sector. Derivatives, such as options and futures, can be illiquid, may disproportionately increase losses and have a potentially large impact on Fund performance. Please see the Fund’s prospectus for a more complete discussion of these and other risks and the Fund’s investment strategies.
Portfolio holdings and breakdowns are as of September 30, 2022 and are subject to change and may not be representative of the portfolio managers’ current or future investments. The Fund’s top ten holdings (as a percentage of net assets) as of September 30, 2022 were: Iberdrola SA (5.1%), Enbridge Inc. (4.8%), Public Service Enterprise Group Inc. (4.6%), EDP - Energias de Portugal SA (4.5%), National Grid PLC (4.4%), SSE PLC (4.2%), Emera Inc. (4.1%), APA Group (3.9%), NextEra Energy Partners LP (3.6%) and Entergy Corp. (3.6%). Please refer to pages 15 through 17 for a list and percentage breakdown of the Fund’s holdings.
The mention of sector breakdowns is for informational purposes only and should not be construed as a recommendation to purchase or sell any securities. The information provided regarding such sectors is not a sufficient basis upon which to make an investment decision. Investors seeking financial advice regarding the appropriateness of investing in any securities or investment strategies discussed should consult their financial professional. The Fund’s top four sector holdings (as a percentage of net assets) as of September 30, 2022 were: utilities (65.1%), industrials (14.7%), energy (12.6%) and real estate (3.4%). The Fund’s portfolio composition is subject to change at any time.
| ClearBridge Global Infrastructure Income Fund 2022 Annual Report |
|
7 |
|
Fund overview (cont’d)
All investments are subject to risk including the possible loss of principal. Past performance is no guarantee of future results. All index performance reflects no deduction for fees, expenses or taxes. Please note that an investor cannot invest directly in an index.
The information provided is not intended to be a forecast of future events, a guarantee of future results or investment advice. Views expressed may differ from those of the firm as a whole.
| i | The S&P Global Infrastructure Index (NR) is designed to track 75 companies from around the world chosen to represent the listed infrastructure industry while maintaining liquidity and tradability. Net Returns (NR) include income net of tax withholding when dividends are paid. |
| ii | Lipper, Inc., a wholly-owned subsidiary of Refinitiv, provides independent insight on global collective investments. Returns are based on the period ended September 30, 2022, including the reinvestment of all distributions, including returns of capital, if any, calculated among the 96 funds for the six-month period and among the 94 funds for the twelve-month period in the Fund’s Lipper category, and excluding sales charges, if any. |
|
8 |
ClearBridge Global Infrastructure Income Fund 2022 Annual Report |
Investment breakdown (%) as a percent of total investments
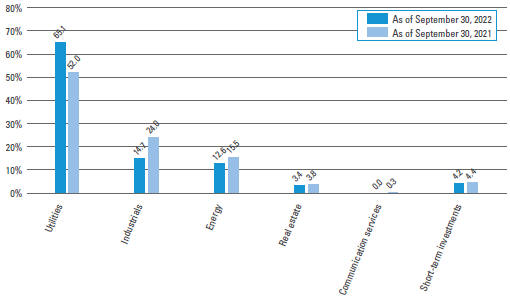
| † | The bar graph above represents the composition of the Fund’s investments as of September 30, 2022 and September 30, 2021. The Fund is actively managed. As a result, the composition of the Fund’s investments is subject to change at any time. |
| ClearBridge Global Infrastructure Income Fund 2022 Annual Report |
|
9 |
|
Example
As a shareholder of the Fund, you may incur two types of costs: (1) transaction costs, including front-end and back-end sales charges (loads) on purchase payments; and (2) ongoing costs, including management fees; service and/or distribution (12b-1) fees; and other Fund expenses. This example is intended to help you understand your ongoing costs (in dollars) of investing in the Fund and to compare these costs with the ongoing costs of investing in other mutual funds.
This example is based on an investment of $1,000 invested on April 1, 2022 and held for the six months ended September 30, 2022.
Actual expenses
The table below titled “Based on actual total return” provides information about actual account values and actual expenses. You may use the information provided in this table, together with the amount you invested, to estimate the expenses that you paid over the period. To estimate the expenses you paid on your account, divide your ending account value by $1,000 (for example, an $8,600 ending account value divided by $1,000 = 8.6), then multiply the result by the number under the heading entitled “Expenses Paid During the Period”.
Hypothetical example for comparison purposes
The table below titled “Based on hypothetical total return” provides information about hypothetical account values and hypothetical expenses based on the actual expense ratio and an assumed rate of return of 5.00% per year before expenses, which is not the Fund’s actual return. The hypothetical account values and expenses may not be used to estimate the actual ending account balance or expenses you paid for the period. You may use the information provided in this table to compare the ongoing costs of investing in the Fund and other funds. To do so, compare the 5.00% hypothetical example relating to the Fund with the 5.00% hypothetical examples that appear in the shareholder reports of the other funds.
Please note that the expenses shown in the table below are meant to highlight your ongoing costs only and do not reflect any transactional costs, such as front-end or back-end sales charges (loads). Therefore, the table is useful in comparing ongoing costs only, and will not help you determine the relative total costs of owning different funds. In addition, if these transaction costs were included, your costs would have been higher.
| Based on actual total return1 | Based on hypothetical total return1 | |||||||||||||||||||||||||||||||||||||||||||||
| Actual Total Return Without Sales Charge2 |
Beginning Account Value |
Ending Account Value |
Annualized Expense Ratio |
Expenses Paid During the Period3 |
Hypothetical Annualized Total Return |
Beginning Account Value |
Ending Account Value |
Annualized Expense Ratio |
Expenses Paid During the Period3 |
|||||||||||||||||||||||||||||||||||||
| Class A | -18.72 | % | $ | 1,000.00 | $ | 812.80 | 1.21 | % | $ | 5.50 | Class A | 5.00 | % | $ | 1,000.00 | $ | 1,019.00 | 1.21 | % | $ | 6.12 | |||||||||||||||||||||||||
| Class I | -18.62 | 1,000.00 | 813.80 | 0.95 | 4.32 | Class I | 5.00 | 1,000.00 | 1,020.31 | 0.95 | 4.81 | |||||||||||||||||||||||||||||||||||
| Class IS | -18.61 | 1,000.00 | 813.90 | 0.88 | 4.00 | Class IS | 5.00 | 1,000.00 | 1,020.66 | 0.88 | 4.46 | |||||||||||||||||||||||||||||||||||
|
10 |
ClearBridge Global Infrastructure Income Fund 2022 Annual Report |
| 1 | For the six months ended September 30, 2022. |
| 2 | Assumes the reinvestment of all distributions, including returns of capital, if any, at net asset value and does not reflect the deduction of the applicable sales charge with respect to Class A shares. Total return is not annualized, as it may not be representative of the total return for the year. Performance figures may reflect compensating balance arrangements, fee waivers and/or expense reimbursements. In the absence of compensating balance arrangements, fee waivers and/or expense reimbursements, the total return would have been lower. Past performance is no guarantee of future results. |
| 3 | Expenses (net of compensating balance arrangements, fee waivers and/or expense reimbursements) are equal to each class’ respective annualized expense ratio multiplied by the average account value over the period, multiplied by the number of days in the most recent fiscal half-year (183), then divided by 365. |
| ClearBridge Global Infrastructure Income Fund 2022 Annual Report |
|
11 |
|
| Average annual total returns | ||||||||||||
| Without sales charges1 | Class A | Class I | Class IS | |||||||||
| Twelve Months Ended 9/30/22 | -7.22 | % | -7.02 | % | -6.94 | % | ||||||
| Five Years Ended 9/30/22 | 4.00 | 4.34 | 4.44 | |||||||||
| Inception* through 9/30/22 | 6.08 | 6.41 | 6.52 | |||||||||
| With sales charges2 | Class A | Class I | Class IS | |||||||||
| Twelve Months Ended 9/30/22 | -12.56 | % | -7.02 | % | -6.94 | % | ||||||
| Five Years Ended 9/30/22 | 2.77 | 4.34 | 4.44 | |||||||||
| Inception* through 9/30/22 | 5.12 | 6.41 | 6.52 | |||||||||
| Cumulative total returns | ||||
| Without sales charges1 | ||||
| Class A (Inception date of 3/31/16 through 9/30/22) | 46.81 | % | ||
| Class I (Inception date of 3/31/16 through 9/30/22) | 49.77 | |||
| Class IS (Inception date of 3/31/16 through 9/30/22) | 50.74 | |||
All figures represent past performance and are not a guarantee of future results. Investment return and principal value of an investment will fluctuate so that an investor’s shares, when redeemed, may be worth more or less than their original cost. The returns shown do not reflect the deduction of taxes that a shareholder would pay on Fund distributions or the redemption of Fund shares. Performance figures may reflect compensating balance arrangements, fee waivers and/or expense reimbursements. In the absence of compensating balance arrangements, fee waivers and/or expense reimbursements, the total return would have been lower.
| 1 | Assumes the reinvestment of all distributions, including returns of capital, if any, at net asset value and does not reflect the deduction of the applicable sales charge with respect to Class A shares. |
| 2 | Assumes the reinvestment of all distributions, including returns of capital, if any, at net asset value. In addition, Class A shares reflect the deduction of the maximum initial sales charge of 5.50% (5.75% prior to August 15, 2022). |
| * | Inception date for Class A, I and IS shares is March 31, 2016. |
|
12 |
ClearBridge Global Infrastructure Income Fund 2022 Annual Report |
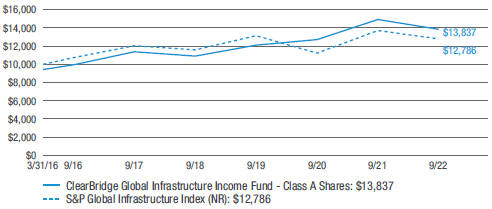
Historical performance
Value of $10,000 invested in
Class A Shares of ClearBridge Global Infrastructure Income Fund vs. S&P Global Infrastructure Index (NR)† — March 31, 2016 — September 30, 2022
Value of $1,000,000 invested in
Class I and Class IS Shares of ClearBridge Global Infrastructure Income Fund vs. S&P Global Infrastructure Index (NR)† — March 31, 2016 — September 30, 2022
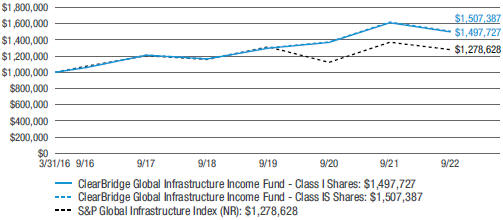
All figures represent past performance and are not a guarantee of future results. Investment return and principal value of an investment will fluctuate so that an investor’s shares, when redeemed, may be worth more or less than their original cost. The returns shown do not reflect the deduction of taxes that a shareholder would pay on Fund distributions or the redemption of Fund shares. Performance figures may reflect compensating balance arrangements, fee waivers and/or expense reimbursements. In the absence of compensating balance arrangements, fee waivers and/or expense reimbursements, the total return would have been lower.
| ClearBridge Global Infrastructure Income Fund 2022 Annual Report |
|
13 |
|
Fund performance (unaudited) (cont’d)
| † | Hypothetical illustration of $10,000 invested in Class A shares and $1,000,000 invested in Class I and Class IS shares of ClearBridge Global Infrastructure Income Fund on March 31, 2016 (inception date), assuming the deduction of the maximum initial sales charge of 5.50% (5.75% prior to August 15, 2022) at the time of investment for Class A shares and the reinvestment of all distributions, including returns of capital, if any, at net asset value through September 30, 2022. The hypothetical illustration also assumes a $10,000 or $1,000,000 investment, as applicable, in the S&P Global Infrastructure Index (NR). The S&P Global Infrastructure Index (NR) (the “Index”) is designed to track 75 companies from around the world chosen to represent the listed infrastructure industry while maintaining liquidity and tradability. Net Returns (NR) include income net of tax withholding when dividends are paid. The Index is unmanaged and not subject to the same management and trading expenses as a mutual fund. Please note that an investor cannot invest directly in an index. |
|
14 |
ClearBridge Global Infrastructure Income Fund 2022 Annual Report |
September 30, 2022
ClearBridge Global Infrastructure Income Fund
(Percentages shown based on Fund net assets)
| Security | Shares | Value | ||||||||||||||
| Common Stocks — 95.8% | ||||||||||||||||
| Energy — 12.6% | ||||||||||||||||
| Oil, Gas & Consumable Fuels — 12.6% |
||||||||||||||||
| Enbridge Inc. |
186,954 | $ | 6,932,192 | |||||||||||||
| Gibson Energy Inc. |
196,330 | 3,122,576 | ||||||||||||||
| Pembina Pipeline Corp. |
157,042 | 4,770,321 | ||||||||||||||
| TC Energy Corp. |
30,865 | 1,243,225 | ||||||||||||||
| Williams Cos. Inc. |
79,092 | 2,264,404 | ||||||||||||||
| Total Energy |
|
18,332,718 | ||||||||||||||
| Industrials — 14.7% | ||||||||||||||||
| Construction & Engineering — 3.6% |
||||||||||||||||
| Ferrovial SA |
165,788 | 3,763,159 | (a) | |||||||||||||
| Vinci SA |
18,168 | 1,469,078 | (a) | |||||||||||||
| Total Construction & Engineering |
5,232,237 | |||||||||||||||
| Transportation Infrastructure — 11.1% |
||||||||||||||||
| Aena SME SA |
22,636 | 2,349,156 | *(a)(b) | |||||||||||||
| Atlas Arteria Ltd. |
894,498 | 3,561,942 | (a) | |||||||||||||
| CCR SA |
1,231,922 | 2,868,361 | ||||||||||||||
| Getlink SE |
138,548 | 2,148,511 | (a) | |||||||||||||
| Transurban Group |
650,377 | 5,136,300 | (a) | |||||||||||||
| Total Transportation Infrastructure |
16,064,270 | |||||||||||||||
| Total Industrials |
21,296,507 | |||||||||||||||
| Real Estate — 3.4% | ||||||||||||||||
| Equity Real Estate Investment Trusts (REITs) — 3.4% |
||||||||||||||||
| Crown Castle Inc. |
34,406 | 4,973,387 | ||||||||||||||
| Utilities — 65.1% | ||||||||||||||||
| Electric Utilities — 29.1% |
||||||||||||||||
| CPFL Energia SA |
625,451 | 3,914,323 | ||||||||||||||
| EDP - Energias de Portugal SA |
1,507,537 | 6,542,731 | (a) | |||||||||||||
| Emera Inc. |
146,813 | 5,940,115 | ||||||||||||||
| Entergy Corp. |
51,303 | 5,162,621 | ||||||||||||||
| Iberdrola SA |
795,557 | 7,417,920 | (a) | |||||||||||||
| OGE Energy Corp. |
124,144 | 4,526,290 | ||||||||||||||
| Red Electrica Corp. SA |
165,715 | 2,542,995 | (a) | |||||||||||||
| SSE PLC |
364,254 | 6,150,793 | (a) | |||||||||||||
| Total Electric Utilities |
42,197,788 | |||||||||||||||
| Gas Utilities — 11.6% |
||||||||||||||||
| APA Group |
925,138 | 5,692,323 | (a) | |||||||||||||
| Enagas SA |
260,462 | 4,031,679 | (a) | |||||||||||||
See Notes to Financial Statements.
| ClearBridge Global Infrastructure Income Fund 2022 Annual Report |
|
15 |
|
Schedule of investments (cont’d)
September 30, 2022
ClearBridge Global Infrastructure Income Fund
(Percentages shown based on Fund net assets)
| Security | Shares | Value | ||||||||||||||
| Gas Utilities — continued |
||||||||||||||||
| Italgas SpA |
464,594 | $ | 2,157,459 | (a) | ||||||||||||
| Snam SpA |
1,219,335 | 4,928,472 | (a) | |||||||||||||
| Total Gas Utilities |
16,809,933 | |||||||||||||||
| Independent Power and Renewable Electricity Producers — 10.5% |
||||||||||||||||
| Brookfield Renewable Corp., Class A Shares |
102,557 | 3,351,563 | ||||||||||||||
| Clearway Energy Inc., Class C Shares |
121,868 | 3,881,496 | ||||||||||||||
| Engie Brasil Energia SA |
389,238 | 2,783,080 | ||||||||||||||
| NextEra Energy Partners LP |
72,603 | 5,249,923 | ||||||||||||||
| Total Independent Power and Renewable Electricity Producers |
15,266,062 | |||||||||||||||
| Multi-Utilities — 9.0% |
||||||||||||||||
| National Grid PLC |
619,567 | 6,377,891 | (a) | |||||||||||||
| Public Service Enterprise Group Inc. |
119,774 | 6,734,892 | ||||||||||||||
| Total Multi-Utilities |
13,112,783 | |||||||||||||||
| Water Utilities — 4.9% |
||||||||||||||||
| Pennon Group PLC |
344,164 | 3,002,909 | (a) | |||||||||||||
| United Utilities Group PLC |
416,121 | 4,108,844 | (a) | |||||||||||||
| Total Water Utilities |
7,111,753 | |||||||||||||||
| Total Utilities |
|
94,498,319 | ||||||||||||||
| Total Common Stocks (Cost — $156,606,997) |
|
139,100,931 | ||||||||||||||
| Expiration Date |
Rights | |||||||||||||||
| Rights — 0.0%†† | ||||||||||||||||
| Industrials — 0.0%†† | ||||||||||||||||
| Transportation Infrastructure — 0.0%†† |
||||||||||||||||
| Atlas Arteria Ltd. (Cost — $0) |
10/6/22 | 236,955 | 0 | *(a)(c) | ||||||||||||
| Total Investments before Short-Term Investments (Cost — $156,606,997) |
|
139,100,931 | ||||||||||||||
| Rate | Shares | |||||||||||||||
| Short-Term Investments — 4.2% | ||||||||||||||||
| Invesco Government & Agency Portfolio, Institutional Class (Cost — $6,098,001) |
2.849% | 6,098,001 | 6,098,001 | |||||||||||||
| Total Investments — 100.0% (Cost — $162,704,998) |
|
145,198,932 | ||||||||||||||
| Liabilities in Excess of Other Assets — (0.0)%†† |
(51,062 | ) | ||||||||||||||
| Total Net Assets — 100.0% |
|
$ | 145,147,870 | |||||||||||||
See Notes to Financial Statements.
|
16 |
ClearBridge Global Infrastructure Income Fund 2022 Annual Report |
ClearBridge Global Infrastructure Income Fund
| †† | Represents less than 0.1%. |
| * | Non-income producing security. |
| (a) | Security is valued in good faith in accordance with procedures approved by the Board of Trustees (Note 1). |
| (b) | Security is exempt from registration under Rule 144A of the Securities Act of 1933. This security may be resold in transactions that are exempt from registration, normally to qualified institutional buyers. This security has been deemed liquid pursuant to guidelines approved by the Board of Trustees. |
| (c) | Value is less than $1. |
| Summary of Investments by Country** (unaudited) | ||||
| United States | 24.9 | % | ||
| Canada | 15.2 | |||
| Spain | 13.8 | |||
| United Kingdom | 13.5 | |||
| Australia | 9.9 | |||
| Brazil | 6.6 | |||
| Italy | 4.9 | |||
| Portugal | 4.5 | |||
| France | 2.5 | |||
| Short-Term Investments | 4.2 | |||
| 100.0 | % | |||
| ** | As a percentage of total investments. Please note that the Fund holdings are as of September 30, 2022 and are subject to change. |
See Notes to Financial Statements.
| ClearBridge Global Infrastructure Income Fund 2022 Annual Report |
|
17 |
|
Statement of assets and liabilities
September 30, 2022
| Assets: | ||||
| Investments, at value (Cost — $162,704,998) |
$ | 145,198,932 | ||
| Foreign currency, at value (Cost — $384,745) |
385,991 | |||
| Dividends receivable |
460,488 | |||
| Receivable for Fund shares sold |
215,504 | |||
| Prepaid expenses |
19,535 | |||
| Total Assets |
146,280,450 | |||
| Liabilities: | ||||
| Payable for securities purchased |
630,105 | |||
| Payable for Fund shares repurchased |
274,670 | |||
| Investment management fee payable |
78,345 | |||
| Distributions payable |
75,409 | |||
| Service and/or distribution fees payable |
3,647 | |||
| Trustees’ fees payable |
1,328 | |||
| Accrued expenses |
69,076 | |||
| Total Liabilities |
1,132,580 | |||
| Total Net Assets | $ | 145,147,870 | ||
| Net Assets: | ||||
| Par value (Note 7) |
$ | 121 | ||
| Paid-in capital in excess of par value |
162,943,318 | |||
| Total distributable earnings (loss) |
(17,795,569) | |||
| Total Net Assets | $ | 145,147,870 | ||
| Net Assets: | ||||
| Class A |
$16,468,586 | |||
| Class I |
$81,267,717 | |||
| Class IS |
$47,411,567 | |||
| Shares Outstanding: | ||||
| Class A |
1,381,673 | |||
| Class I |
6,806,058 | |||
| Class IS |
3,960,605 | |||
| Net Asset Value: | ||||
| Class A (and redemption price) |
$11.92 | |||
| Class I (and redemption price) |
$11.94 | |||
| Class IS (and redemption price) |
$11.97 | |||
| Maximum Public Offering Price Per Share: | ||||
| Class A (based on maximum initial sales charge of 5.50%; 5.75% prior to August 15, 2022) |
$12.61 | |||
See Notes to Financial Statements.
|
18 |
ClearBridge Global Infrastructure Income Fund 2022 Annual Report |
For the Year Ended September 30, 2022
| Investment Income: | ||||
| Dividends |
$ | 4,153,443 | ||
| Interest |
5,585 | |||
| Less: Foreign taxes withheld |
(363,872) | |||
| Total Investment Income |
3,795,156 | |||
| Expenses: | ||||
| Investment management fee (Note 2) |
810,473 | |||
| Fund accounting fees |
76,532 | |||
| Registration fees |
53,036 | |||
| Audit and tax fees |
41,487 | |||
| Legal fees |
30,785 | |||
| Transfer agent fees (Note 5) |
28,055 | |||
| Service and/or distribution fees (Notes 2 and 5) |
16,183 | |||
| Shareholder reports |
13,265 | |||
| Custody fees |
7,194 | |||
| Trustees’ fees |
7,075 | |||
| Fees recaptured by investment manager (Note 2) |
953 | |||
| Interest expense |
770 | |||
| Commitment fees (Note 8) |
267 | |||
| Insurance |
267 | |||
| Miscellaneous expenses |
5,189 | |||
| Total Expenses |
1,091,531 | |||
| Less: Fee waivers and/or expense reimbursements (Notes 2 and 5) |
(153,755) | |||
| Net Expenses |
937,776 | |||
| Net Investment Income | 2,857,380 | |||
| Realized and Unrealized Gain (Loss) on Investments and Foreign Currency Transactions (Notes 1 and 3): | ||||
| Net Realized Gain (Loss) From: |
||||
| Investment transactions |
1,001,035 | |||
| Foreign currency transactions |
(90,517) | |||
| Net Realized Gain |
910,518 | |||
| Change in Net Unrealized Appreciation (Depreciation) From: |
||||
| Investments |
(22,362,846) | |||
| Foreign currencies |
(26,666) | |||
| Change in Net Unrealized Appreciation (Depreciation) |
(22,389,512) | |||
| Net Loss on Investments and Foreign Currency Transactions | (21,478,994) | |||
| Decrease in Net Assets From Operations | $ | (18,621,614) | ||
See Notes to Financial Statements.
| ClearBridge Global Infrastructure Income Fund 2022 Annual Report |
|
19 |
|
Statements of changes in net assets
| For the Years Ended September 30, | 2022 | 2021 | ||||||
| Operations: | ||||||||
| Net investment income |
$ | 2,857,380 | $ | 2,241,675 | ||||
| Net realized gain |
910,518 | 1,291,564 | ||||||
| Change in net unrealized appreciation (depreciation) |
(22,389,512) | 2,999,359 | ||||||
| Increase (Decrease) in Net Assets From Operations |
(18,621,614) | 6,532,598 | ||||||
| Distributions to Shareholders From (Notes 1 and 6): | ||||||||
| Total distributable earnings |
(4,414,333) | (2,295,943) | ||||||
| Decrease in Net Assets From Distributions to Shareholders |
(4,414,333) | (2,295,943) | ||||||
| Fund Share Transactions (Note 7): | ||||||||
| Net proceeds from sale of shares |
144,591,637 | 44,892,802 | ||||||
| Reinvestment of distributions |
3,472,585 | 1,593,878 | ||||||
| Cost of shares repurchased |
(54,646,500) | (3,592,237) | ||||||
| Increase in Net Assets From Fund Share Transactions |
93,417,722 | 42,894,443 | ||||||
| Increase in Net Assets |
70,381,775 | 47,131,098 | ||||||
| Net Assets: | ||||||||
| Beginning of year |
74,766,095 | 27,634,997 | ||||||
| End of year |
$ | 145,147,870 | $ | 74,766,095 | ||||
See Notes to Financial Statements.
|
20 |
ClearBridge Global Infrastructure Income Fund 2022 Annual Report |
| For a share of each class of beneficial interest outstanding throughout each year ended September 30: | ||||||||||||||||||||
| Class A Shares1 | 2022 | 2021 | 2020 | 2019 | 2018 | |||||||||||||||
| Net asset value, beginning of year | $13.43 | $11.87 | $11.68 | $10.77 | $11.65 | |||||||||||||||
| Income (loss) from operations: | ||||||||||||||||||||
| Net investment income |
0.40 | 0.53 | 0.44 | 0.24 | 0.28 | |||||||||||||||
| Net realized and unrealized gain (loss) |
(1.31) | 1.51 | 0.14 | 0.94 | (0.77) | |||||||||||||||
| Total income (loss) from operations |
(0.91) | 2.04 | 0.58 | 1.18 | (0.49) | |||||||||||||||
| Less distributions from: | ||||||||||||||||||||
| Net investment income |
(0.40) | (0.48) | (0.39) | (0.27) | (0.26) | |||||||||||||||
| Net realized gains |
(0.20) | — | — | — | (0.13) | |||||||||||||||
| Total distributions |
(0.60) | (0.48) | (0.39) | (0.27) | (0.39) | |||||||||||||||
| Net asset value, end of year | $11.92 | $13.43 | $11.87 | $11.68 | $10.77 | |||||||||||||||
| Total return2 |
(7.22) | % | 17.31 | % | 5.07 | % | 11.02 | % | (4.18) | % | ||||||||||
| Net assets, end of year (000s) | $16,469 | $1,035 | $153 | $123 | $194 | |||||||||||||||
| Ratios to average net assets: | ||||||||||||||||||||
| Gross expenses |
1.36 | % | 1.70 | %3 | 2.17 | %3 | 2.13 | %3 | 2.11 | % | ||||||||||
| Net expenses4,5 |
1.21 | 1.35 | 3 | 1.35 | 3 | 1.35 | 3 | 1.44 | ||||||||||||
| Net investment income |
2.90 | 3.98 | 3.78 | 2.13 | 2.50 | |||||||||||||||
| Portfolio turnover rate | 95 | % | 86 | % | 130 | % | 67 | % | 58 | % | ||||||||||
| 1 | Per share amounts have been calculated using the average shares method. |
| 2 | Performance figures, exclusive of sales charges, may reflect compensating balance arrangements, fee waivers and/or expense reimbursements. In the absence of compensating balance arrangements, fee waivers and/or expense reimbursements, the total return would have been lower. Past performance is no guarantee of future results. |
| 3 | Reflects recapture of fees waived and/or expenses reimbursed from prior fiscal years. |
| 4 | Reflects fee waivers and/or expense reimbursements. |
| 5 | As a result of an expense limitation arrangement, effective July 1, 2022, the ratio of total annual fund operating expenses, other than interest, brokerage commissions, taxes, extraordinary expenses and acquired fund fees and expenses, to average net assets of Class A shares did not exceed 1.30%. This expense limitation arrangement cannot be terminated prior to December 31, 2023 without the Board of Trustees’ consent. Prior to July 1, 2022, the expense limitation was 1.35%. Prior to September 14, 2018, the expense limitation was 1.50%. |
See Notes to Financial Statements.
| ClearBridge Global Infrastructure Income Fund 2022 Annual Report |
|
21 |
|
Financial highlights (cont’d)
| For a share of each class of beneficial interest outstanding throughout each year ended September 30: | ||||||||||||||||||||
| Class I Shares1 | 2022 | 2021 | 2020 | 2019 | 2018 | |||||||||||||||
| Net asset value, beginning of year | $13.45 | $11.88 | $11.68 | $10.78 | $11.65 | |||||||||||||||
| Income (loss) from operations: | ||||||||||||||||||||
| Net investment income |
0.39 | 0.56 | 0.48 | 0.28 | 0.30 | |||||||||||||||
| Net realized and unrealized gain (loss) |
(1.27) | 1.53 | 0.15 | 0.93 | (0.75) | |||||||||||||||
| Total income (loss) from operations |
(0.88) | 2.09 | 0.63 | 1.21 | (0.45) | |||||||||||||||
| Less distributions from: | ||||||||||||||||||||
| Net investment income |
(0.43) | (0.52) | (0.43) | (0.31) | (0.29) | |||||||||||||||
| Net realized gains |
(0.20) | — | — | — | (0.13) | |||||||||||||||
| Total distributions |
(0.63) | (0.52) | (0.43) | (0.31) | (0.42) | |||||||||||||||
| Net asset value, end of year | $11.94 | $13.45 | $11.88 | $11.68 | $10.78 | |||||||||||||||
| Total return2 |
(7.02) | % | 17.74 | % | 5.52 | % | 11.33 | % | (3.83) | % | ||||||||||
| Net assets, end of year (000s) | $81,268 | $3,129 | $314 | $226 | $295 | |||||||||||||||
| Ratios to average net assets: | ||||||||||||||||||||
| Gross expenses |
1.10 | %3 | 1.35 | %3 | 2.02 | %3 | 2.21 | %3 | 1.80 | % | ||||||||||
| Net expenses4,5 |
0.95 | 3 | 1.00 | 3 | 1.00 | 3 | 1.00 | 3 | 1.12 | |||||||||||
| Net investment income |
2.84 | 4.24 | 4.15 | 2.57 | 2.72 | |||||||||||||||
| Portfolio turnover rate | 95 | % | 86 | % | 130 | % | 67 | % | 58 | % | ||||||||||
| 1 | Per share amounts have been calculated using the average shares method. |
| 2 | Performance figures may reflect compensating balance arrangements, fee waivers and/or expense reimbursements. In the absence of compensating balance arrangements, fee waivers and/or expense reimbursements, the total return would have been lower. Past performance is no guarantee of future results. |
| 3 | Reflects recapture of fees waived and/or expenses reimbursed from prior fiscal years. |
| 4 | Reflects fee waivers and/or expense reimbursements. |
| 5 | As a result of an expense limitation arrangement, effective July 1, 2022, the ratio of total annual fund operating expenses, other than interest, brokerage commissions, taxes, extraordinary expenses and acquired fund fees and expenses, to average net assets of Class I shares did not exceed 0.95%. This expense limitation arrangement cannot be terminated prior to December 31, 2023 without the Board of Trustees’ consent. Prior to July 1, 2022, the expense limitation was 1.00%. Prior to September 14, 2018, the expense limitation was 1.15%. |
See Notes to Financial Statements.
|
22 |
ClearBridge Global Infrastructure Income Fund 2022 Annual Report |
| For a share of each class of beneficial interest outstanding throughout each year ended September 30: | ||||||||||||||||||||
| Class IS Shares1 | 2022 | 2021 | 2020 | 2019 | 2018 | |||||||||||||||
| Net asset value, beginning of year | $13.48 | $11.90 | $11.71 | $10.79 | $11.67 | |||||||||||||||
| Income (loss) from operations: | ||||||||||||||||||||
| Net investment income |
0.40 | 0.58 | 0.50 | 0.31 | 0.31 | |||||||||||||||
| Net realized and unrealized gain (loss) |
(1.27) | 1.53 | 0.13 | 0.93 | (0.76) | |||||||||||||||
| Total income (loss) from operations |
(0.87) | 2.11 | 0.63 | 1.24 | (0.45) | |||||||||||||||
| Less distributions from: | ||||||||||||||||||||
| Net investment income |
(0.44) | (0.53) | (0.44) | (0.32) | (0.30) | |||||||||||||||
| Net realized gains |
(0.20) | — | — | — | (0.13) | |||||||||||||||
| Total distributions |
(0.64) | (0.53) | (0.44) | (0.32) | (0.43) | |||||||||||||||
| Net asset value, end of year | $11.97 | $13.48 | $11.90 | $11.71 | $10.79 | |||||||||||||||
| Total return2 |
(6.94) | % | 17.88 | % | 5.52 | % | 11.63 | % | (3.85) | % | ||||||||||
| Net assets, end of year (000s) | $47,412 | $70,602 | $27,168 | $22,962 | $28,095 | |||||||||||||||
| Ratios to average net assets: | ||||||||||||||||||||
| Gross expenses |
1.04 | % | 1.25 | % | 1.71 | %3 | 1.69 | %3 | 1.72 | %3 | ||||||||||
| Net expenses4,5 |
0.89 | 0.90 | 0.90 | 3 | 0.90 | 3 | 1.04 | 3 | ||||||||||||
| Net investment income |
2.81 | 4.38 | 4.24 | 2.81 | 2.79 | |||||||||||||||
| Portfolio turnover rate | 95 | % | 86 | % | 130 | % | 67 | % | 58 | % | ||||||||||
| 1 | Per share amounts have been calculated using the average shares method. |
| 2 | Performance figures may reflect compensating balance arrangements, fee waivers and/or expense reimbursements. In the absence of compensating balance arrangements, fee waivers and/or expense reimbursements, the total return would have been lower. Past performance is no guarantee of future results. |
| 3 | Reflects recapture of fees waived and/or expenses reimbursed from prior fiscal years. |
| 4 | Reflects fee waivers and/or expense reimbursements. |
| 5 | As a result of an expense limitation arrangement, effective July 1, 2022, the ratio of total annual fund operating expenses, other than interest, brokerage commissions, taxes, extraordinary expenses and acquired fund fees and expenses, to average net assets of Class IS shares did not exceed 0.85%. In addition, the ratio of total annual fund operating expenses for Class IS shares did not exceed the ratio of total annual fund operating expenses for Class I shares. These expense limitation arrangements cannot be terminated prior to December 31, 2023 without the Board of Trustees’ consent. Prior to July 1, 2022, the expense limitation was 0.90% and the ratio of total annual fund operating expenses for Class IS shares did not exceed the ratio of total annual fund operating expenses of Class I shares. Prior to September 14, 2018, the expense limitation was 1.05% and the ratio of total annual fund operating expenses for Class IS shares did not exceed the ratio of total annual fund operating expenses of Class I shares. |
See Notes to Financial Statements.
| ClearBridge Global Infrastructure Income Fund 2022 Annual Report |
|
23 |
|
1. Organization and significant accounting policies
ClearBridge Global Infrastructure Income Fund (the “Fund”) is a separate diversified investment series of Legg Mason Global Asset Management Trust (the “Trust”). The Trust, a Maryland statutory trust, is registered under the Investment Company Act of 1940, as amended (the “1940 Act”), as an open-end management investment company.
The following are significant accounting policies consistently followed by the Fund and are in conformity with U.S. generally accepted accounting principles (“GAAP”). Estimates and assumptions are required to be made regarding assets, liabilities and changes in net assets resulting from operations when financial statements are prepared. Changes in the economic environment, financial markets and any other parameters used in determining these estimates could cause actual results to differ. Subsequent events have been evaluated through the date the financial statements were issued.
(a) Investment valuation. Equity securities for which market quotations are available are valued at the last reported sales price or official closing price on the primary market or exchange on which they trade. The valuations for fixed income securities (which may include, but are not limited to, corporate, government, municipal, mortgage-backed, collateralized mortgage obligations and asset-backed securities) and certain derivative instruments are typically the prices supplied by independent third party pricing services, which may use market prices or broker/dealer quotations or a variety of valuation techniques and methodologies. The independent third party pricing services typically use inputs that are observable such as issuer details, interest rates, yield curves, prepayment speeds, credit risks/spreads, default rates and quoted prices for similar securities. Investments in open-end funds are valued at the closing net asset value per share of each fund on the day of valuation. When the Fund holds securities or other assets that are denominated in a foreign currency, the Fund will normally use the currency exchange rates as of 4:00 p.m. (Eastern Time). If independent third party pricing services are unable to supply prices for a portfolio investment, or if the prices supplied are deemed by the manager to be unreliable, the market price may be determined by the manager using quotations from one or more broker/dealers or at the transaction price if the security has recently been purchased and no value has yet been obtained from a pricing service or pricing broker. When reliable prices are not readily available, such as when the value of a security has been significantly affected by events after the close of the exchange or market on which the security is principally traded, but before the Fund calculates its net asset value, the Fund values these securities as determined in accordance with procedures approved by the Fund’s Board of Trustees. This may include using an independent third party pricing service to adjust the value of such securities to the latest indications of fair value at 4:00 p.m. (Eastern Time).
Pursuant to policies adopted by the Board of Trustees, the Fund’s manager has been designated as the valuation designee and is responsible for the oversight of the daily valuation process. The Fund’s manager is assisted by the Global Fund Valuation Committee
|
24 |
ClearBridge Global Infrastructure Income Fund 2022 Annual Report |
(the “Valuation Committee”). The Valuation Committee is responsible for making fair value determinations, evaluating the effectiveness of the Fund’s pricing policies, and reporting to the Fund’s manager and the Board of Trustees. When determining the reliability of third party pricing information for investments owned by the Fund, the Valuation Committee, among other things, conducts due diligence reviews of pricing vendors, monitors the daily change in prices and reviews transactions among market participants.
The Valuation Committee will consider pricing methodologies it deems relevant and appropriate when making fair value determinations. Examples of possible methodologies include, but are not limited to, multiple of earnings; discount from market of a similar freely traded security; discounted cash-flow analysis; book value or a multiple thereof; risk premium/yield analysis; yield to maturity; and/or fundamental investment analysis. The Valuation Committee will also consider factors it deems relevant and appropriate in light of the facts and circumstances. Examples of possible factors include, but are not limited to, the type of security; the issuer’s financial statements; the purchase price of the security; the discount from market value of unrestricted securities of the same class at the time of purchase; analysts’ research and observations from financial institutions; information regarding any transactions or offers with respect to the security; the existence of merger proposals or tender offers affecting the security; the price and extent of public trading in similar securities of the issuer or comparable companies; and the existence of a shelf registration for restricted securities.
For each portfolio security that has been fair valued pursuant to the policies adopted by the Board of Trustees, the fair value price is compared against the last available and next available market quotations. The Valuation Committee reviews the results of such back testing monthly and fair valuation occurrences are reported to the Board of Trustees quarterly.
The Fund uses valuation techniques to measure fair value that are consistent with the market approach and/or income approach, depending on the type of security and the particular circumstance. The market approach uses prices and other relevant information generated by market transactions involving identical or comparable securities. The income approach uses valuation techniques to discount estimated future cash flows to present value.
| ClearBridge Global Infrastructure Income Fund 2022 Annual Report |
25 |
Notes to financial statements (cont’d)
GAAP establishes a disclosure hierarchy that categorizes the inputs to valuation techniques used to value assets and liabilities at measurement date. These inputs are summarized in the three broad levels listed below:
| • | Level 1 — unadjusted quoted prices in active markets for identical investments |
| • | Level 2 — other significant observable inputs (including quoted prices for similar investments, interest rates, prepayment speeds, credit risk, etc.) |
| • | Level 3 — significant unobservable inputs (including the Fund’s own assumptions in determining the fair value of investments) |
The inputs or methodologies used to value securities are not necessarily an indication of the risk associated with investing in those securities.
The following is a summary of the inputs used in valuing the Fund’s assets carried at fair value:
| ASSETS | ||||||||||||||||
| Description | Quoted Prices (Level 1) |
Other Significant Observable Inputs (Level 2)* |
Significant Unobservable Inputs (Level 3) |
Total | ||||||||||||
| Long-Term Investments†: | ||||||||||||||||
| Common Stocks: |
||||||||||||||||
| Industrials |
$ | 2,868,361 | $ | 18,428,146 | — | $ | 21,296,507 | |||||||||
| Utilities |
41,544,303 | 52,954,016 | — | 94,498,319 | ||||||||||||
| Other Common Stocks |
23,306,105 | — | — | 23,306,105 | ||||||||||||
| Rights |
— | 0 | ** | — | 0 | ** | ||||||||||
| Total Long-Term Investments | 67,718,769 | 71,382,162 | — | 139,100,931 | ||||||||||||
| Short-Term Investments† | 6,098,001 | — | — | 6,098,001 | ||||||||||||
| Total Investments | $ | 73,816,770 | $ | 71,382,162 | — | $ | 145,198,932 | |||||||||
| * | As a result of the fair value pricing procedures for international equities utilized by the Fund, which account for events occurring after the close of the principal market of the security but prior to the calculation of the Fund’s net asset value, certain securities were classified as Level 2 within the fair value hierarchy. |
| † | See Schedule of Investments for additional detailed categorizations. |
| ** | Amount represents less than $1. |
(b) Foreign currency translation. Investment securities and other assets and liabilities denominated in foreign currencies are translated into U.S. dollar amounts based upon prevailing exchange rates on the date of valuation. Purchases and sales of investment securities and income and expense items denominated in foreign currencies are translated into U.S. dollar amounts based upon prevailing exchange rates on the respective dates of such transactions.
The Fund does not isolate that portion of the results of operations resulting from fluctuations in foreign exchange rates on investments from the fluctuations arising from changes in market prices of securities held. Such fluctuations are included with the net realized and unrealized gain or loss on investments.
|
26 |
ClearBridge Global Infrastructure Income Fund 2022 Annual Report |
Net realized foreign exchange gains or losses arise from sales of foreign currencies, including gains and losses on forward foreign currency contracts, currency gains or losses realized between the trade and settlement dates on securities transactions, and the difference between the amounts of dividends, interest, and foreign withholding taxes recorded on the Fund’s books and the U.S. dollar equivalent of the amounts actually received or paid. Net unrealized foreign exchange gains and losses arise from changes in the values of assets and liabilities, other than investments in securities, on the date of valuation, resulting from changes in exchange rates.
Foreign security and currency transactions may involve certain considerations and risks not typically associated with those of U.S. dollar denominated transactions as a result of, among other factors, the possibility of lower levels of governmental supervision and regulation of foreign securities markets and the possibility of political or economic instability.
(c) Foreign investment risks. The Fund’s investments in foreign securities may involve risks not present in domestic investments. Since securities may be denominated in foreign currencies, may require settlement in foreign currencies or may pay interest or dividends in foreign currencies, changes in the relationship of these foreign currencies to the U.S. dollar can significantly affect the value of the investments and earnings of the Fund. Foreign investments may also subject the Fund to foreign government exchange restrictions, expropriation, taxation or other political, social or economic developments, all of which affect the market and/or credit risk of the investments.
(d) Concentration risk. The Fund invests significantly in companies that are engaged in the infrastructure business and is therefore more susceptible to adverse economic, regulatory, political, legal and other changes affecting such companies.
(e) Security transactions and investment income. Security transactions are accounted for on a trade date basis. Interest income (including interest income from payment-in-kind securities), adjusted for amortization of premium and accretion of discount, is recorded on the accrual basis. Dividend income is recorded on the ex-dividend date for dividends received in cash and/or securities. Foreign dividend income is recorded on the ex-dividend date or as soon as practicable after the Fund determines the existence of a dividend declaration after exercising reasonable due diligence. The cost of investments sold is determined by use of the specific identification method. To the extent any issuer defaults or a credit event occurs that impacts the issuer, the Fund may halt any additional interest income accruals and consider the realizability of interest accrued up to the date of default or credit event.
| ClearBridge Global Infrastructure Income Fund 2022 Annual Report |
27 |
Notes to financial statements (cont’d)
(f) REIT distributions. The character of distributions received from Real Estate Investment Trusts (‘‘REITs’’) held by the Fund is generally comprised of net investment income, capital gains, and return of capital. It is the policy of the Fund to estimate the character of distributions received from underlying REITs based on historical data provided by the REITs. After each calendar year end, REITs report the actual tax character of these distributions. Differences between the estimated and actual amounts reported by the REITs are reflected in the Fund’s records in the year in which they are reported by the REITs by adjusting related investment cost basis, capital gains and income, as necessary.
(g) Distributions to shareholders. Distributions from net investment income of the Fund, if any, are declared and paid on a quarterly basis. Distributions of net realized gains, if any, are declared at least annually. Distributions to shareholders of the Fund are recorded on the ex-dividend date and are determined in accordance with income tax regulations, which may differ from GAAP.
(h) Share class accounting. Investment income, common expenses and realized/ unrealized gains (losses) on investments are allocated to the various classes of the Fund on the basis of daily net assets of each class. Fees relating to a specific class are charged directly to that share class.
(i) Compensating balance arrangements. The Fund has an arrangement with its custodian bank whereby a portion of the custodian’s fees is paid indirectly by credits earned on the Fund’s cash on deposit with the bank.
(j) Federal and other taxes. It is the Fund’s policy to comply with the federal income and excise tax requirements of the Internal Revenue Code of 1986 (the “Code”), as amended, applicable to regulated investment companies. Accordingly, the Fund intends to distribute its taxable income and net realized gains, if any, to shareholders in accordance with timing requirements imposed by the Code. Therefore, no federal or state income tax provision is required in the Fund’s financial statements.
Management has analyzed the Fund’s tax positions taken on income tax returns for all open tax years and has concluded that as of September 30, 2022, no provision for income tax is required in the Fund’s financial statements. The Fund’s federal and state income and federal excise tax returns for tax years for which the applicable statutes of limitations have not expired are subject to examination by the Internal Revenue Service and state departments of revenue.
Under the applicable foreign tax laws, a withholding tax may be imposed on interest, dividends and capital gains at various rates.
(k) Reclassification. GAAP requires that certain components of net assets be reclassified to reflect permanent differences between financial and tax reporting. These reclassifications have no effect on net assets or net asset value per share. During the current year, the Fund had no reclassifications.
|
28 |
ClearBridge Global Infrastructure Income Fund 2022 Annual Report |
2. Investment management agreement and other transactions with affiliates
Legg Mason Partners Fund Advisor, LLC (“LMPFA”) is the Fund’s investment manager and ClearBridge Investments (North America) Pty Limited (formerly known as ClearBridge RARE Infrastructure (North America) Pty Limited) (“ClearBridge”) is the Fund’s subadviser. Western Asset Management Company, LLC (“Western Asset”) manages the portion of the Fund’s cash and short-term instruments allocated to it. LMPFA, ClearBridge and Western Asset are indirect, wholly-owned subsidiaries of Franklin Resources, Inc. (“Franklin Resources”).
Under the investment management agreement, the Fund pays an investment management fee, calculated daily and paid monthly, at a rate of 0.80% of the Fund’s average daily net assets.
LMPFA provides administrative and certain oversight services to the Fund. LMPFA delegates to the subadviser the day-to-day portfolio management of the Fund, except for the management of the portion of the cash and short-term instruments allocated to Western Asset. For its services, LMPFA pays ClearBridge a fee monthly, at an annual rate equal to 70% of the net management fee it receives from the Fund. For Western Asset’s services to the Fund, LMPFA pays Western Asset monthly 0.02% of the portion of the Fund’s average daily net assets that are allocated to Western Asset by LMPFA.
As a result of expense limitation arrangements between the Fund and LMPFA, the ratio of total annual fund operating expenses, other than interest, brokerage commissions, taxes, extraordinary expenses and acquired fund fees and expenses, to average net assets of Class A, Class I and Class IS shares did not exceed 1.30%, 0.95% and 0.85%, respectively. In addition, the ratio of total annual fund operating expenses for Class IS shares did not exceed the ratio of total annual fund operating expenses for Class I shares. These expense limitation arrangements cannot be terminated prior to December 31, 2023 without the Board of Trustees’ consent.
Prior to July 1, 2022, as a result of expense limitation arrangements between the Fund and LMPFA, the ratio of expenses, other than interest, brokerage commissions, taxes, extraordinary expenses and acquired fund fees and expenses, to average net assets of Class A, Class I and Class IS shares did not exceed 1.35%, 1.00%, and 0.90%, respectively. In addition, total annual fund operating expenses for Class IS shares did not exceed the total annual fund operating expenses for Class I shares.
During the year ended September 30, 2022, fees waived and/or expenses reimbursed amounted to $153,755.
LMPFA is permitted to recapture amounts waived and/or reimbursed to a class within three years after the fiscal year in which LMPFA earned the fee or incurred the expense if the class’ total annual fund operating expenses have fallen to a level below the expense limitation (“expense cap”) in effect at the time the fees were earned or the expenses incurred. In no case will LMPFA recapture any amount that would result, on any particular business day of the Fund, in the class’ total annual fund operating expenses exceeding the expense cap or any other lower limit then in effect.
| ClearBridge Global Infrastructure Income Fund 2022 Annual Report |
29 |
Notes to financial statements (cont’d)
Pursuant to these arrangements, at September 30, 2022, the Fund had remaining fee waivers and/or expense reimbursements subject to recapture by LMPFA and respective dates of expiration as follows:
| Class A | Class I | Class IS | ||||||||||
| Expires September 30, 2023 | $ | 1,106 | $ | 2,801 | $ | 208,331 | ||||||
| Expires September 30, 2024 | 1,902 | 4,393 | 173,458 | |||||||||
| Expires September 30, 2025 | 9,557 | 36,680 | 107,392 | |||||||||
| Total fee waivers/expense reimbursements subject to recapture | $ | 12,565 | $ | 43,874 | $ | 489,181 | ||||||
For the year ended September 30, 2022, fee waivers and/or expense reimbursements recaptured by LMPFA, if any, were as follows:
| Class I | ||||
| LMPFA recaptured | $ | 953 | ||
Franklin Distributors, LLC (“Franklin Distributors”) serves as the Fund’s sole and exclusive distributor. Franklin Distributors is an indirect, wholly-owned broker-dealer subsidiary of Franklin Resources.
There is a maximum initial sales charge of 5.50% (5.75% prior to August 15, 2022) for Class A shares. In certain cases, Class A shares have a contingent deferred sales charge (“CDSC”) of 1.00%, which applies if redemption occurs within 18 months from purchase payment. This CDSC only applies to those purchases of Class A shares, which, when combined with current holdings of other shares of funds sold by Franklin Distributors, equal or exceed $1,000,000 in the aggregate. These purchases do not incur an initial sales charge.
For the year ended September 30, 2022, sales charges retained by and CDSCs paid to Franklin Distributors and its affiliates, if any, were as follows:
| Class A | ||||
| Sales charges | $ | 31,139 | ||
| CDSCs | — | |||
All officers and one Trustee of the Trust are employees of Franklin Resources or its affiliates and do not receive compensation from the Trust.
3. Investments
During the year ended September 30, 2022, the aggregate cost of purchases and proceeds from sales of investments (excluding short-term investments) were as follows:
| Purchases | $182,605,629 | |||
| Sales | 93,026,010 | |||
|
30 |
ClearBridge Global Infrastructure Income Fund 2022 Annual Report |
At September 30, 2022, the aggregate cost of investments and the aggregate gross unrealized appreciation and depreciation of investments for federal income tax purposes were as follows:
| Cost | Gross Unrealized Appreciation |
Gross Unrealized Depreciation |
Net Unrealized Depreciation |
|||||||||||||
| Securities | $ | 166,517,359 | $ | 1,815,225 | $ | (23,133,652) | $ | (21,318,427) | ||||||||
4. Derivative instruments and hedging activities
During the year ended September 30, 2022, the Fund did not invest in derivative instruments.
5. Class specific expenses, waivers and/or expense reimbursements
The Fund has adopted a Rule 12b-1 shareholder services and distribution plan and under that plan the Fund pays service and/or distribution fees with respect to its Class A shares calculated at the annual rate of 0.25% of the average daily net assets of the class. Service and/or distribution fees are accrued daily and paid monthly.
For the year ended September 30, 2022, class specific expenses were as follows:
| Service and/or Distribution Fees |
Transfer Agent Fees |
|||||||
| Class A | $ | 16,183 | $ | 5,832 | ||||
| Class I | — | 18,158 | ||||||
| Class IS | — | 4,065 | ||||||
| Total | $ | 16,183 | $ | 28,055 | ||||
For the year ended September 30, 2022, waivers and/or expense reimbursements by class were as follows:
| Waivers/Expense Reimbursements |
||||
| Class A | $ | 9,559 | ||
| Class I | 36,686 | |||
| Class IS | 107,510 | |||
| Total | $ | 153,755 | ||
6. Distributions to shareholders by class
| Year Ended September 30, 2022 |
Year Ended September 30, 2021 |
|||||||
| Net Investment Income: |
|
|||||||
| Class A | $ | 268,942 | $ | 23,287 | ||||
| Class I | 1,054,790 | 64,098 | ||||||
| Class IS | 1,965,108 | 2,208,558 | ||||||
| Total | $ | 3,288,840 | $ | 2,295,943 | ||||
| ClearBridge Global Infrastructure Income Fund 2022 Annual Report |
31 |
Notes to financial statements (cont’d)
| Year Ended September 30, 2022 |
Year Ended September 30, 2021 |
|||||||
| Net Realized Gains: | ||||||||
| Class A | $ | 18,947 | — | |||||
| Class I | 60,826 | — | ||||||
| Class IS | 1,045,720 | — | ||||||
| Total | $ | 1,125,493 | — | |||||
7. Shares of beneficial interest
At September 30, 2022, the Trust had an unlimited number of shares of beneficial interest authorized with a par value of $0.00001 per share. The Fund has the ability to issue multiple classes of shares. Each class of shares represents an identical interest and has the same rights, except that each class bears certain direct expenses, including those specifically related to the distribution of its shares.
Transactions in shares of each class were as follows:
| Year Ended September 30, 2022 |
Year Ended September 30, 2021 |
|||||||||||||||
| Shares | Amount | Shares | Amount | |||||||||||||
| Class A | ||||||||||||||||
| Shares sold | 1,564,616 | $ | 22,354,152 | 73,382 | $ | 990,023 | ||||||||||
| Shares issued on reinvestment | 21,893 | 285,435 | 1,723 | 22,860 | ||||||||||||
| Shares repurchased | (281,900) | (3,919,845) | (10,930) | (145,883) | ||||||||||||
| Net increase | 1,304,609 | $ | 18,719,742 | 64,175 | $ | 867,000 | ||||||||||
| Class I | ||||||||||||||||
| Shares sold | 7,501,425 | $ | 106,225,852 | 221,707 | $ | 2,990,952 | ||||||||||
| Shares issued on reinvestment | 87,217 | 1,111,079 | 4,817 | 64,098 | ||||||||||||
| Shares repurchased | (1,015,171) | (14,247,024) | (20,384) | (272,600) | ||||||||||||
| Net increase | 6,573,471 | $ | 93,089,907 | 206,140 | $ | 2,782,450 | ||||||||||
| Class IS | ||||||||||||||||
| Shares sold | 1,125,790 | $ | 16,011,633 | 3,077,763 | $ | 40,911,827 | ||||||||||
| Shares issued on reinvestment | 152,184 | 2,076,071 | 113,587 | 1,506,920 | ||||||||||||
| Shares repurchased | (2,554,104) | (36,479,631) | (236,759) | (3,173,754) | ||||||||||||
| Net increase (decrease) | (1,276,130) | $ | (18,391,927) | 2,954,591 | $ | 39,244,993 | ||||||||||
8. Redemption facility
On February 4, 2022, the Fund, together with other U.S. registered and foreign investment funds (collectively, the “Borrowers”) managed by Franklin Resources or its affiliates, became a borrower in a joint syndicated senior unsecured credit facility totaling $2.675 billion (the “Global Credit Facility”). The Global Credit Facility provides a source of funds to the Borrowers for temporary and emergency purposes, including the ability to meet future unanticipated or unusually large redemption requests. Unless renewed, the Global Credit Facility will terminate on February 3, 2023.
|
32 |
ClearBridge Global Infrastructure Income Fund 2022 Annual Report |
Under the terms of the Global Credit Facility, the Fund shall, in addition to interest charged on any borrowings made by the Fund and other costs incurred by the Fund, pay its share of fees and expenses incurred in connection with the implementation and maintenance of the Global Credit Facility, based upon its relative share of the aggregate net assets of all the Borrowers, including an annual commitment fee of 0.15% based upon the unused portion of the Global Credit Facility. These fees are reflected in the Statement of Operations. The Fund did not utilize the Global Credit Facility during the year ended September 30, 2022.
9. Income tax information and distributions to shareholders
The tax character of distributions paid during the fiscal years ended September 30, was as follows:
| 2022 | 2021 | |||||||
| Distributions paid from: | ||||||||
| Ordinary income | $ | 4,160,676 | $ | 2,295,943 | ||||
| Net long-term capital gains | 253,657 | — | ||||||
| Total distributions paid | $ | 4,414,333 | $ | 2,295,943 | ||||
As of September 30, 2022, the components of distributable earnings (loss) on a tax basis were as follows:
| Undistributed ordinary income — net | $ | 1,287,450 | ||
| Undistributed long-term capital gains — net | 2,311,888 | |||
| Total undistributed earnings | $ | 3,599,338 | ||
| Other book/tax temporary differences(a) | (42,047) | |||
| Unrealized appreciation (depreciation)(b) | (21,352,860) | |||
| Total distributable earnings (loss) — net | $ | (17,795,569) |
| (a) | Other book/tax temporary differences are attributable to book/tax differences in the timing of the deductibility of various expenses. |
| (b) | The difference between book-basis and tax-basis unrealized appreciation (depreciation) is attributable to the tax deferral of losses on wash sales. |
10. Recent accounting pronouncements
In June 2022, the Financial Accounting Standards Board (FASB) issued Accounting Standards Update (ASU) No. 2022-03, Fair Value Measurement (Topic 820) – Fair Value Measurement of Equity Securities Subject to Contractual Sale Restrictions. The amendments in the ASU clarify that a contractual restriction on the sale of an equity security is not considered part of the unit of account of the equity security and, therefore, should not be considered in measuring fair value. The ASU is effective for interim and annual reporting periods beginning after December 15, 2023, with the option of early adoption. Management is currently evaluating the impact, if any, of applying this ASU.
* * *
| ClearBridge Global Infrastructure Income Fund 2022 Annual Report |
|
33 |
|
Notes to financial statements (cont’d)
In March 2020, the Financial Accounting Standards Board (FASB) issued Accounting Standards Update (ASU) No. 2020-04, Reference Rate Reform (Topic 848) – Facilitation of the Effects of Reference Rate Reform on Financial Reporting. In January 2021, the FASB issued ASU No. 2021-01, with further amendments to Topic 848. The amendments in the ASUs provide optional temporary accounting recognition and financial reporting relief from the effect of certain types of contract modifications due to the planned discontinuation of the LIBOR and other interbank-offered based reference rates as of the end of 2021 and 2023. The ASUs are effective for certain reference rate-related contract modifications that occur during the period March 12, 2020 through December 31, 2022. Management has reviewed the requirements and believes the adoption of these ASUs will not have a material impact on the financial statements.
11. Other matters
The outbreak of the respiratory illness COVID-19 (commonly referred to as “coronavirus”) has continued to rapidly spread around the world, causing considerable uncertainty for the global economy and financial markets. The ultimate economic fallout from the pandemic, and the long-term impact on economies, markets, industries and individual issuers, are not known. The COVID-19 pandemic could adversely affect the value and liquidity of the Fund’s investments, impair the Fund’s ability to satisfy redemption requests, and negatively impact the Fund’s performance. In addition, the outbreak of COVID-19, and measures taken to mitigate its effects, could result in disruptions to the services provided to the Fund by its service providers.
* * *
On February 24, 2022, Russia engaged in military actions in the sovereign territory of Ukraine. The current political and financial uncertainty surrounding Russia and Ukraine may increase market volatility and the economic risk of investing in securities in these countries and may also cause uncertainty for the global economy and broader financial markets. The ultimate fallout and long-term impact from these events are not known. The Fund will continue to assess the impact on valuations and liquidity and will take any potential actions needed in accordance with procedures approved by the Board of Trustees.
|
34 |
ClearBridge Global Infrastructure Income Fund 2022 Annual Report |
Report of independent registered public accounting firm
To the Board of Trustees of Legg Mason Global Asset Management Trust and Shareholders of ClearBridge Global Infrastructure Income Fund
Opinion on the Financial Statements
We have audited the accompanying statement of assets and liabilities, including the schedule of investments, of ClearBridge Global Infrastructure Income Fund (one of the funds constituting Legg Mason Global Asset Management Trust, referred to hereafter as the “Fund”) as of September 30, 2022, the related statement of operations for the year ended September 30, 2022, the statement of changes in net assets for each of the two years in the period ended September 30, 2022, including the related notes, and the financial highlights for each of the five years in the period ended September 30, 2022 (collectively referred to as the “financial statements”). In our opinion, the financial statements present fairly, in all material respects, the financial position of the Fund as of September 30, 2022, the results of its operations for the year then ended, the changes in its net assets for each of the two years in the period ended September 30, 2022 and the financial highlights for each of the five years in the period ended September 30, 2022 in conformity with accounting principles generally accepted in the United States of America.
Basis for Opinion
These financial statements are the responsibility of the Fund’s management. Our responsibility is to express an opinion on the Fund’s financial statements based on our audits. We are a public accounting firm registered with the Public Company Accounting Oversight Board (United States) (PCAOB) and are required to be independent with respect to the Fund in accordance with the U.S. federal securities laws and the applicable rules and regulations of the Securities and Exchange Commission and the PCAOB.
We conducted our audits of these financial statements in accordance with the standards of the PCAOB. Those standards require that we plan and perform the audit to obtain reasonable assurance about whether the financial statements are free of material misstatement, whether due to error or fraud.
Our audits included performing procedures to assess the risks of material misstatement of the financial statements, whether due to error or fraud, and performing procedures that respond to those risks. Such procedures included examining, on a test basis, evidence regarding the amounts and disclosures in the financial statements. Our audits also included evaluating the accounting principles used and significant estimates made by management, as well as evaluating the overall presentation of the financial statements. Our procedures included confirmation of securities owned as of September 30, 2022 by correspondence with the custodian and brokers; when replies were not received from brokers, we performed other auditing procedures. We believe that our audits provide a reasonable basis for our opinion.
/s/PricewaterhouseCoopers LLP
Baltimore, Maryland
November 17, 2022
We have served as the auditor of one or more investment companies in the Franklin Templeton Group of Funds since 1948.
| ClearBridge Global Infrastructure Income Fund 2022 Annual Report |
|
35 |
|
Board approval of management and subadvisory agreements (unaudited)
At an in-person meeting of the Board of Trustees of Legg Mason Global Asset Management Trust (the “Trust”) held on May 4 and 5, 2022, the Board, including the Trustees who are not considered to be “interested persons” of the Trust (the “Independent Trustees”) under the Investment Company Act of 1940, as amended (the “1940 Act”), approved for an annual period the continuation of the management agreement (the “Management Agreement”) between the Trust and Legg Mason Partners Fund Advisor, LLC (the “Manager”) with respect to ClearBridge Global Infrastructure Income Fund, a series of the Trust (the “Fund”), and the sub-advisory agreement pursuant to which ClearBridge Investments (North America) Pty Limited (“ClearBridge”) provides day-to-day management of the Fund’s portfolio, and the sub-advisory agreement pursuant to which Western Asset Management Company, LLC (“Western Asset” and, together with ClearBridge, the “Sub-Advisers”) provides day-to-day management of the Fund’s cash and short-term instruments allocated to it by the Manager. The management agreement and sub-advisory agreements are collectively referred to as the “Agreements.”
Background
The Board received extensive information in advance of the meeting to assist it in its consideration of the Agreements and asked questions and requested additional information from management. Throughout the year, the Board (including its various committees) had met with representatives of the Manager and the Subadvisers, and had received information relevant to the renewal of the Agreements. Prior to the meeting the Independent Trustees met with their independent legal counsel to discuss and consider the information provided and submitted questions to management, and they considered the responses provided. The Board received and considered a variety of information about the Manager and the Subadvisers, as well as the management, advisory and sub-advisory arrangements for the Fund and other funds overseen by the Board, certain portions of which are discussed below. The information received and considered by the Board both in conjunction with the May 2022 meeting and throughout the year was both written and oral. The contractual arrangements discussed below are the product of multiple years of review and negotiation and information received and considered by the Board during those years.
The information provided and presentations made to the Board encompassed the Fund and all funds for which the Board has responsibility. The discussion below covers both the advisory and the administrative functions being rendered by the Manager, both of which functions are encompassed by the Management Agreement, as well as the advisory functions rendered by the Subadvisers pursuant to the Sub-Advisory Agreements.
|
36 |
ClearBridge Global Infrastructure Income Fund |
Board approval of management agreement and sub-advisory agreements
The Independent Trustees were advised by separate independent legal counsel throughout the process. Prior to voting, the Independent Trustees received a memorandum from their independent legal counsel discussing the legal standards for their consideration of the proposed continuation of the Agreements. The Independent Trustees also reviewed the proposed continuation of the Management Agreement and the Sub-Advisory Agreements in private sessions with their independent legal counsel at which no representatives of the Manager and Subadvisers were present. The Independent Trustees considered the Management Agreement and each Sub-Advisory Agreement separately in the course of their review. In doing so, they noted the respective roles of the Manager and the Subadvisers in providing services to the Fund.
In approving the Agreements, the Board, including the Independent Trustees, considered a variety of factors, including those factors discussed below. No single factor reviewed by the Board was identified by the Board as the principal factor in determining whether to approve the Management Agreement and the Sub-Advisory Agreements. Each Trustee may have attributed different weight to the various factors in evaluating the Management Agreement and each Sub-Advisory Agreement.
After considering all relevant factors and information, the Board, exercising its business judgment, determined that the continuation of the Agreements was in the best interests of the Fund and its shareholders and approved the continuation of each such agreement for another year.
Nature, extent and quality of the services under the management agreement and sub-advisory agreements
The Board received and considered information regarding the nature, extent and quality of services provided to the Fund by the Manager and the Subadvisers under the Management Agreement and the Sub-Advisory Agreements, respectively, during the past year. The Board noted information received at regular meetings throughout the year related to the services rendered by the Manager in its management of the Fund’s affairs and the Manager’s role in coordinating the activities of the Fund’s other service providers. The Board’s evaluation of the services provided by the Manager and the Subadvisers took into account the Board’s knowledge gained as Trustees of funds in the fund complex overseen by the Trustees, including knowledge gained regarding the scope and quality of the investment management and other capabilities of the Manager and the Subadvisers, and the quality of the Manager’s administrative and other services. The Board observed that the scope of services provided by the Manager and the Subadvisers, and of the undertakings required of the Manager and Subadvisers in connection with those services, including maintaining and monitoring their own and the Fund’s compliance programs, liquidity management programs and cybersecurity programs, had expanded over time as a result of regulatory, market and other developments. The Board also noted that on a regular basis it received and reviewed information from the Manager regarding the Fund’s compliance policies and procedures established pursuant to Rule 38a-1 under the 1940 Act. The Board also considered the risks associated with the Fund borne by the Manager and its affiliates (such as entrepreneurial, operational, reputational, litigation and regulatory risk), as well as the Manager’s and each Subadviser’s risk management processes.
| ClearBridge Global Infrastructure Income Fund |
|
37 |
|
Board approval of management and subadvisory agreements (unaudited) (cont’d)
The Board reviewed the qualifications, backgrounds and responsibilities of the Manager’s and each Subadviser’s senior personnel and the team of investment professionals primarily responsible for the day-to-day portfolio management of the Fund. The Board also considered, based on its knowledge of the Manager and the Manager’s affiliates, the financial resources of Franklin Resources, Inc., the parent organization of the Manager and the Subadvisers. The Board recognized the importance of having a fund manager with significant resources.
The Board considered the division of responsibilities among the Manager and the Subadvisers and the oversight provided by the Manager. The Board also considered the policies and practices of the Manager and the Subadvisers regarding the selection of brokers and dealers and the execution of portfolio transactions. The Board considered management’s periodic reports to the Board on, among other things, its business plans, any organizational changes and portfolio manager compensation.
The Board received and considered performance information for the Fund as well as for a group of funds (the “Performance Universe”) selected by Broadridge Financial Solutions, Inc. (“Broadridge”), an independent provider of investment company data, based on classifications provided by Thomson Reuters Lipper (“Lipper”). The Board was provided with a description of the methodology used to determine the similarity of the Fund with the funds included in the Performance Universe. It was noted that while the Board found the Broadridge data generally useful, they recognized its limitations, including that the data may vary depending on the end date selected and that the results of the performance comparisons may vary depending on the selection of the peer group and its composition over time. The Board also noted that it had received and discussed with management information throughout the year at periodic intervals comparing the Fund’s performance against its benchmark and against the Fund’s peers. The Board also considered the Fund’s performance in light of overall financial market conditions.
The information comparing the Fund’s performance to that of its Performance Universe, consisting of all retail and institutional funds (including the Fund) classified as global infrastructure funds by Lipper, showed, among other data, that the performance of the Fund’s Class I shares for the 1-, 3- and 5-year periods ended December 31, 2021 and since inception of the Fund’s Class I shares (March 31, 2016) through December 31, 2021 was below the median performance of the funds in the Performance Universe for the 1-year period and was above the median performance of the funds in the Performance Universe for the since inception, 3- and 5-year periods, and ranked in the first quintile of the funds in the Performance Universe for the since inception, 3- and 5-year periods. The Board noted the
|
38 |
ClearBridge Global Infrastructure Income Fund |
explanations from the Manager and ClearBridge concerning the reasons for the Fund’s relative performance versus the peer group for the various periods. The Board also noted that the Fund’s performance was ahead of its peer group for the quarter ended March 31, 2022.
The Board concluded that, overall, the nature, extent and quality of services provided (and expected to be provided), including performance, under the Management Agreement and each Sub-Advisory Agreement were sufficient for renewal.
Management fees and expense ratios
The Board reviewed and considered the contractual management fee payable by the Fund to the Manager (the “Contractual Management Fee”) and the actual management fees paid by the Fund to the Manager (the “Actual Management Fee”) in light of the nature, extent and quality of the management and sub-advisory services provided by the Manager and the Subadvisers, respectively. The Board also considered that fee waiver and/or expense reimbursement arrangements are currently in place for the Fund. The Board also noted that the compensation paid to the Subadvisers is the responsibility and expense of the Manager, not the Fund.
The Board received and considered information provided by Broadridge comparing the Contractual Management Fee and the Actual Management Fee and the Fund’s total actual expenses with those of funds in both the relevant expense group and a broader group of funds, each selected by Broadridge based on classifications provided by Lipper. It was noted that while the Board found the Broadridge data generally useful, they recognized its limitations, including that the data may vary depending on the selection of the peer group. The Board also reviewed information regarding fees charged by the Manager and/or the Subadvisers to other U.S. clients investing primarily in an asset class similar to that of the Fund, including, where applicable, institutional separate and commingled accounts and retail managed accounts.
The Manager reviewed with the Board the differences in services provided to these different types of accounts, noting that the Fund is provided with certain administrative services, office facilities, and Fund officers (including the Fund’s chief executive, chief financial and chief compliance officers), and that the Manager coordinates and oversees the provision of services to the Fund by other Fund service providers. The Board considered the fee comparisons in light of the differences in management of these different types of accounts, and the differences in the degree of entrepreneurial and other risks borne by the Manager in managing the Fund and in managing other types of accounts.
The Board considered the overall management fee, the fees of each of the Subadvisers and the amount of the management fee retained by the Manager after payment of the subadvisory fees, in each case in light of the services rendered for those amounts. The Board also received an analysis of complex-wide management fees provided by the Manager, which, among other things, set out a framework of fees based on asset classes.
| ClearBridge Global Infrastructure Income Fund |
|
39 |
|
Board approval of management and subadvisory agreements (unaudited) (cont’d)
The Board also received and considered information comparing the Fund’s Contractual Management Fee and Actual Management Fee as well as its actual total expense ratio with those of a group of institutional funds consisting of 10 global infrastructure funds (including the Fund) selected by Broadridge to be comparable to the Fund (the “Expense Group”), and a broader group of funds selected by Broadridge consisting of all institutional global infrastructure funds (including the Fund) (the “Expense Universe”). This information showed that the Fund’s Contractual Management Fee was below the median of management fees payable by the funds in the Expense Group and that the Fund’s Actual Management Fee was below the median of management fees paid by the funds in the Expense Group and below the median of management fees paid by the funds in the Expense Universe. This information also showed that the Fund’s actual total expense ratio was approximately equivalent to the median of the total expense ratios of the funds in the Expense Group and approximately equivalent to the median of the actual total expense ratios of the funds in the Expense Universe. The Board also considered that the current limitation on the Fund’s expenses is expected to continue until and expire on December 31, 2023.
Taking all of the above into consideration, as well as the factors identified below, the Board determined that the management fee and the subadvisory fees for the Fund were reasonable in light of the nature, extent and quality of the services provided to the Fund under the Management Agreement and the Sub-Advisory Agreements.
Manager profitability
The Board received and considered an analysis of the profitability of the Manager and its affiliates in providing services to the Fund. The Board also received profitability information with respect to the Legg Mason Funds complex as a whole. The Board received information with respect to the Manager’s allocation methodologies used in preparing this profitability data. It was noted that the allocation methodologies had been reviewed by an outside consultant. The profitability of the Manager and its affiliates was considered by the Board not excessive in light of the nature, extent and quality of the services provided to the Fund.
Economies of scale
The Board received and discussed information concerning whether the Manager realizes economies of scale with respect to the management of the Fund as the Fund’s assets grow. The Board also noted the size of the Fund.
The Board determined that the management fee structure for the Fund was reasonable.
|
40 |
ClearBridge Global Infrastructure Income Fund |
Other benefits to the manager and the subadvisers
The Board considered other benefits received by the Manager, the Subadvisers and their affiliates as a result of their relationship with the Fund, including the opportunity to offer additional products and services to Fund shareholders, including the recent appointment of an affiliate of the Manager as the transfer agent of the Fund.
In light of the costs of providing investment management and other services to the Fund and the ongoing commitment of the Manager and the Subadvisers to the Fund, the Board considered that the ancillary benefits that the Manager, the Subadvisers and their affiliates received were reasonable.
| ClearBridge Global Infrastructure Income Fund |
|
41 |
|
Statement regarding liquidity risk management program (unaudited)
Each Fund has adopted and implemented a written Liquidity Risk Management Program (the “LRMP”) as required by Rule 22e-4 under the Investment Company Act of 1940 (the “Liquidity Rule”). The LRMP for the Franklin Templeton and Legg Mason Funds is designed to assess and manage each Fund’s liquidity risk, which is defined as the risk that the Fund could not meet requests to redeem shares issued by the Fund without significant dilution of remaining investors’ interests in the Fund. In accordance with the Liquidity Rule, the LRMP includes policies and procedures that provide for: (1) assessment, management, and review (no less frequently than annually) of each Fund’s liquidity risk; (2) classification of each Fund’s portfolio holdings into one of four liquidity categories (Highly Liquid, Moderately Liquid, Less Liquid, and Illiquid); (3) for Funds that do not primarily hold assets that are Highly Liquid, establishing and maintaining a minimum percentage of the Fund’s net assets in Highly Liquid investments (called a “Highly Liquid Investment Minimum” or “HLIM”); and (4) prohibiting the Fund’s acquisition of Illiquid investments that would result in the Fund holding more than 15% of its net assets in Illiquid assets. The LRMP also requires reporting to the Securities and Exchange Commission (“SEC”) (on a non-public basis) and to the Board if the Fund’s holdings of Illiquid assets exceed 15% of the Fund’s net assets. Funds with HLIMs must have procedures for addressing HLIM shortfalls, including reporting to the Board and, with respect to HLIM shortfalls lasting more than seven consecutive calendar days, reporting to the SEC (on a non-public basis).
The Director of Liquidity Risk within the Investment Risk Management Group (the “IRMG”) is the appointed Administrator of the LRMP. The IRMG maintains the Investment Liquidity Committee (the “ILC”) to provide oversight and administration of policies and procedures governing liquidity risk management for Franklin Templeton and Legg Mason products and portfolios. The ILC includes representatives from Franklin Templeton’s Risk, Trading, Global Compliance, Legal, Investment Compliance, Investment Operations, Valuation Committee, Product Management and Global Product Strategy.
In assessing and managing each Fund’s liquidity risk, the ILC considers, as relevant, a variety of factors, including the Fund’s investment strategy and the liquidity of its portfolio investments during both normal and reasonably foreseeable stressed conditions; its short and long-term cash flow projections; and its cash holdings and access to other funding sources including the Funds’ interfund lending facility and line of credit. Classification of the Fund’s portfolio holdings in the four liquidity categories is based on the number of days it is reasonably expected to take to convert the investment to cash (for Highly Liquid and Moderately Liquid holdings) or sell or dispose of the investment (for Less Liquid and Illiquid investments), in current market conditions without significantly changing the investment’s market value.
|
42 |
ClearBridge Global Infrastructure Income Fund |
Each Fund primarily holds liquid assets that are defined under the Liquidity Rule as “Highly Liquid Investments,” and therefore is not required to establish an HLIM. Highly Liquid Investments are defined as cash and any investment reasonably expected to be convertible to cash in current market conditions in three business days or less without the conversion to cash significantly changing the market value of the investment.
At meetings of the Funds’ Board of Trustees/Directors held in May 2022, the Program Administrator provided a written report to the Board addressing the adequacy and effectiveness of the program for the year ended December 31, 2021. The Program Administrator report concluded that (i.) the LRMP, as adopted and implemented, remains reasonably designed to assess and manage each Fund’s liquidity risk; (ii.) the LRMP, including the Highly Liquid Investment Minimum (“HLIM”) where applicable, was implemented and operated effectively to achieve the goal of assessing and managing each Fund’s liquidity risk; and (iii.) each Fund was able to meet requests for redemption without significant dilution of remaining investors’ interests in the Fund.
| ClearBridge Global Infrastructure Income Fund |
|
43 |
|
Additional information (unaudited)
Information about Trustees and Officers
The business and affairs of ClearBridge Global Infrastructure Income Fund (the “Fund”) are conducted by management under the supervision and subject to the direction of its Board of Trustees. The business address of each Trustee is c/o Jane Trust, Franklin Templeton, 100 International Drive, 11th Floor, Baltimore, Maryland 21202.
Information pertaining to the Trustees and officers of the Fund is set forth below. The Statement of Additional Information includes additional information about Trustees and is available, without charge, upon request by calling the Fund at 877-6LM-FUND/656-3863.
| Independent Trustees† | ||
| Paul R. Ades | ||
| Year of birth | 1940 | |
| Position(s) with Trust | Trustee | |
| Term of office1 and length of time served2 | Since 1983 | |
| Principal occupation(s) during the past five years | Paul R. Ades, PLLC (law firm) (since 2000) | |
| Number of funds in fund complex overseen by Trustee | 59 | |
| Other board memberships held by Trustee during the past five years | None | |
| Andrew L. Breech | ||
| Year of birth | 1952 | |
| Position(s) with Trust | Trustee | |
| Term of office1 and length of time served2 | Since 1991 | |
| Principal occupation(s) during the past five years | President, Dealer Operating Control Service, Inc. (automotive retail management) (since 1985) | |
| Number of funds in fund complex overseen by Trustee | 59 | |
| Other board memberships held by Trustee during the past five years | None | |
| Althea L. Duersten | ||
| Year of birth | 1951 | |
| Position(s) with Trust | Trustee and Chair of the Board | |
| Term of office1 and length of time served2 | Since 2014 (Chair of the Board since 2021) | |
| Principal occupation(s) during the past five years | Retired (since 2011); formerly, Chief Investment Officer, North America, JPMorgan Chase (investment bank) and member of JPMorgan Executive Committee (2007 to 2011) | |
| Number of funds in fund complex overseen by Trustee | 59 | |
| Other board memberships held by Trustee during the past five years | Formerly, Non-Executive Director, Rokos Capital Management LLP (2019 to 2020) | |
|
44 |
ClearBridge Global Infrastructure Income Fund |
| Independent Trustees† (cont’d) | ||
| Stephen R. Gross | ||
| Year of birth | 1947 | |
| Position(s) with Trust | Trustee | |
| Term of office1 and length of time served2 | Since 1986 | |
| Principal occupation(s) during the past five years | Chairman Emeritus (since 2011) and formerly, Chairman, HLB Gross Collins, P.C. (accounting and consulting firm) (1979 to 2011); Executive Director of Business Builders Team, LLC (since 2005); Principal, Gross Consulting Group, LLC (since 2011); CEO, Gross Capital Partners, LLC (since 2014); CEO, Trusted CFO Solutions, LLC (since 2011) | |
| Number of funds in fund complex overseen by Trustee | 59 | |
| Other board memberships held by Trustee during the past five years | None | |
| Susan M. Heilbron | ||
| Year of birth | 1945 | |
| Position(s) with Trust | Trustee | |
| Term of office1 and length of time served2 | Since 1991 | |
| Principal occupation(s) during the past five years | Retired; formerly, President, Lacey & Heilbron (communications consulting) (1990 to 2002); General Counsel and Executive Vice President, The Trump Organization (1986 to 1990); Senior Vice President, New York State Urban Development Corporation (1984 to 1986); Associate, Cravath, Swaine & Moore LLP (1980 to 1984 and 1977 to 1979) | |
| Number of funds in fund complex overseen by Trustee | 59 | |
| Other board memberships held by Trustee during the past five years | Formerly, Director, Lincoln Savings Bank FSB (1991 to 1994); Director, Trump Shuttle, Inc. (air transportation) (1989 to 1990); Director, Alexander’s Inc. (department store) (1987 to 1990) | |
| Howard J. Johnson | ||
| Year of birth | 1938 | |
| Position(s) with Trust | Trustee | |
| Term of office1 and length of time served2 | From 1981 to 1998 and since 2000 | |
| Principal occupation(s) during the past five years | Retired; formerly, Chief Executive Officer, Genesis Imaging LLC (technology company) (2003 to 2012) | |
| Number of funds in fund complex overseen by Trustee | 59 | |
| Other board memberships held by Trustee during the past five years | None | |
| ClearBridge Global Infrastructure Income Fund |
|
45 |
|
Additional information (unaudited) (cont’d)
Information about Trustees and Officers
| Independent Trustees† (cont’d) | ||
| Arnold L. Lehman | ||
| Year of birth | 1944 | |
| Position(s) with Trust | Trustee | |
| Term of office1 and length of time served2 | Since 1982 | |
| Principal occupation(s) during the past five years | Senior Advisor, Phillips (auction house) (since 2015); formerly, Fellow, Ford Foundation (2015 to 2016); Director of the Brooklyn Museum (1997 to 2015) | |
| Number of funds in fund complex overseen by Trustee | 59 | |
| Other board memberships held by Trustee during the past five years | Trustee of American Federation of Arts (since 2002) | |
| Robin J. W. Masters | ||
| Year of birth | 1955 | |
| Position(s) with Trust | Trustee | |
| Term of office1 and length of time served2 | Since 2002 | |
| Principal occupation(s) during the past five years | Retired; formerly, Chief Investment Officer of ACE Limited (insurance) (1986 to 2000) | |
| Number of funds in fund complex overseen by Trustee | 59 | |
| Other board memberships held by Trustee during the past five years | Director of HSBC Managed Portfolios Limited and HSBC Specialist Funds Limited (since 2020); formerly, Director of Cheyne Capital International Limited (investment advisory firm) (2005 to 2020); Director/ Trustee of Legg Mason Institutional Funds plc, Western Asset Fixed Income Funds plc and Western Asset Debt Securities Fund plc. (2007 to 2011) | |
| Jerome H. Miller | ||
| Year of birth | 1938 | |
| Position(s) with Trust | Trustee | |
| Term of office1 and length of time served2 | Since 1995 | |
| Principal occupation(s) during the past five years | Retired; formerly, President, Shearson Lehman Asset Management (1991 to 1993), Vice Chairman, Shearson Lehman Hutton Inc. (1989 to 1992) and Senior Executive Vice President, E.F. Hutton Group Inc. (1986 to 1989) | |
| Number of funds in fund complex overseen by Trustee | 59 | |
| Other board memberships held by Trustee during the past five years | None | |
| Ken Miller | ||
| Year of birth | 1942 | |
| Position(s) with Trust | Trustee | |
| Term of office1 and length of time served2 | Since 1983 | |
| Principal occupation(s) during the past five years | Retired; formerly, President, Young Stuff Apparel Group, Inc. (apparel manufacturer), division of Li & Fung (1963 to 2012) | |
| Number of funds in fund complex overseen by Trustee | 59 | |
| Other board memberships held by Trustee during the past five years | None | |
|
46 |
ClearBridge Global Infrastructure Income Fund |
| Independent Trustees† (cont’d) | ||
| G. Peter O’Brien | ||
| Year of birth | 1945 | |
| Position(s) with Trust | Trustee | |
| Term of office1 and length of time served2 | Since 1999 | |
| Principal occupation(s) during the past five years | Retired, Trustee Emeritus of Colgate University (since 2005); Board Member, Hill House, Inc. (residential home care) (since 1999); formerly, Board Member, Bridges School (pre-school) (2006 to 2017); Managing Director, Equity Capital Markets Group of Merrill Lynch & Co. (1971 to 1999) | |
| Number of funds in fund complex overseen by Trustee | Trustee of Legg Mason funds consisting of 59 portfolios; Director/Trustee of the Royce Family of Funds consisting of 16 portfolios | |
| Other board memberships held by Trustee during the past five years | Formerly, Director of TICC Capital Corp. (2003 to 2017) | |
| Thomas F. Schlafly | ||
| Year of birth | 1948 | |
| Position(s) with Trust | Trustee | |
| Term of office1 and length of time served2 | Since 1983 | |
| Principal occupation(s) during the past five years | Chairman, The Saint Louis Brewery, LLC (brewery) (since 2012); formerly, President, The Saint Louis Brewery, Inc. (1989 to 2012); Senior Counsel (since 2017) and formerly, Partner (2009 to 2016), Thompson Coburn LLP (law firm) | |
| Number of funds in fund complex overseen by Trustee | 59 | |
| Other board memberships held by Trustee during the past five years | Director, CNB St. Louis Bank (since 2020); formerly, Director, Citizens National Bank of Greater St. Louis (2006 to 2020) | |
| Interested Trustee and Officer | ||
| Jane Trust, CFA3 | ||
| Year of birth | 1962 | |
| Position(s) with Trust | Trustee, President and Chief Executive Officer | |
| Term of office1 and length of time served2 | Since 2015 | |
| Principal occupation(s) during the past five years | Senior Vice President, Fund Board Management, Franklin Templeton (since 2020); Officer and/or Trustee/Director of 130 funds associated with LMPFA or its affiliates (since 2015); President and Chief Executive Officer of LMPFA (since 2015); formerly, Senior Managing Director (2018 to 2020) and Managing Director (2016 to 2018) of Legg Mason & Co., LLC (“Legg Mason & Co.”); Senior Vice President of LMPFA (2015) | |
| Number of funds in fund complex overseen by Trustee | 130 | |
| Other board memberships held by Trustee during the past five years | None | |
| ClearBridge Global Infrastructure Income Fund |
|
47 |
|
Additional information (unaudited) (cont’d)
Information about Trustees and Officers
| Additional Officers | ||
| Ted P. Becker 280 Park Avenue, 8th Floor, New York, NY 10017 | ||
| Year of birth | 1951 | |
| Position(s) with Trust | Chief Compliance Officer | |
| Term of office1 and length of time served2 | Since 2007 | |
| Principal occupation(s) during the past five years | Vice President, Global Compliance of Franklin Templeton (since 2020); Chief Compliance Officer of LMPFA (since 2006); Chief Compliance Officer of certain funds associated with Legg Mason & Co. or its affiliates (since 2006); formerly, Director of Global Compliance at Legg Mason, Inc. (2006 to 2020); Managing Director of Compliance of Legg Mason & Co. (2005 to 2020) | |
| Susan Kerr 280 Park Avenue, 8th Floor, New York, NY 10017 | ||
| Year of birth | 1949 | |
| Position(s) with Trust | Chief Anti-Money Laundering Compliance Officer | |
| Term of office1 and length of time served2 | Since 2013 | |
| Principal occupation(s) during the past five years | Senior Compliance Analyst, Franklin Templeton (since 2020); Chief Anti-Money Laundering Compliance Officer of certain funds associated with Legg Mason & Co. or its affiliates (since 2013) and Anti-Money Laundering Compliance Officer (since 2012), Senior Compliance Officer (since 2011) and Assistant Vice President (since 2010) of Franklin Distributors, LLC; formerly, Assistant Vice President of Legg Mason & Co. (2010 to 2020) | |
| Marc A. De Oliveira 100 First Stamford Place, 6th Floor, Stamford, CT 06902 | ||
| Year of birth | 1971 | |
| Position(s) with Trust | Secretary and Chief Legal Officer | |
| Term of office1 and length of time served2 | Since 2020 | |
| Principal occupation(s) during the past five years | Associate General Counsel of Franklin Templeton (since 2020); Assistant Secretary of certain funds associated with Legg Mason & Co. or its affiliates (since 2006); formerly, Managing Director (2016 to 2020) and Associate General Counsel of Legg Mason & Co. (2005 to 2020) | |
|
48 |
ClearBridge Global Infrastructure Income Fund |
| Additional Officers (cont’d) | ||
| Thomas C. Mandia 100 First Stamford Place, 6th Floor, Stamford, CT 06902 | ||
| Year of birth | 1962 | |
| Position(s) with Trust | Senior Vice President | |
| Term of office1 and length of time served2 | Since 2020 | |
| Principal occupation(s) during the past five years | Senior Associate General Counsel of Franklin Templeton (since 2020); Secretary of LMPFA (since 2006); Assistant Secretary of certain funds associated with Legg Mason & Co. or its affiliates (since 2006); Secretary of LM Asset Services, LLC (“LMAS”) (since 2002) and Legg Mason Fund Asset Management, Inc. (“LMFAM”) (since 2013) (formerly registered investment advisers); formerly, Managing Director and Deputy General Counsel of Legg Mason & Co. (2005 to 2020) | |
| Christopher Berarducci 280 Park Avenue, 8th Floor, New York, NY 10017 | ||
| Year of birth | 1974 | |
| Position(s) with Trust | Treasurer and Principal Financial Officer | |
| Term of office1 and length of time served2 | Since 2010 and 2019 | |
| Principal occupation(s) during the past five years | Vice President, Fund Administration and Reporting, Franklin Templeton (since 2020); Treasurer (since 2010) and Principal Financial Officer (since 2019) of certain funds associated with Legg Mason & Co. or its affiliates; formerly, Managing Director (2020), Director (2015 to 2020), and Vice President (2011 to 2015) of Legg Mason & Co. | |
| Jeanne M. Kelly 280 Park Avenue, 8th Floor, New York, NY 10017 | ||
| Year of birth | 1951 | |
| Position(s) with Trust | Senior Vice President | |
| Term of office1 and length of time served2 | Since 2007 | |
| Principal occupation(s) during the past five years | U.S. Fund Board Team Manager, Franklin Templeton (since 2020); Senior Vice President of certain funds associated with Legg Mason & Co. or its affiliates (since 2007); Senior Vice President of LMPFA (since 2006); President and Chief Executive Officer of LMAS and LMFAM (since 2015); formerly, Managing Director of Legg Mason & Co. (2005 to 2020); Senior Vice President of LMFAM (2013 to 2015) | |
| † | Trustees who are not “interested persons” of the Fund within the meaning of Section 2(a)(19) of the Investment Company Act of 1940, as amended (the “1940 Act”). |
| 1 | Each Trustee and officer serves until his or her respective successor has been duly elected and qualified or until his or her earlier death, resignation, retirement or removal. |
| 2 | Indicates the earliest year in which the Trustee became a board member for a fund in the Legg Mason fund complex or the officer took such office. |
| 3 | Ms. Trust is an “interested person” of the Fund, as defined in the 1940 Act, because of her position with LMPFA and/or certain of its affiliates. |
| ClearBridge Global Infrastructure Income Fund |
|
49 |
|
Important tax information (unaudited)
By mid-February, tax information related to a shareholder’s proportionate share of distributions paid during the preceding calendar year will be received, if applicable. Please also refer to www.franklintempleton.com for per share tax information related to any distributions paid during the preceding calendar year. Shareholders are advised to consult with their tax advisors for further information on the treatment of these amounts on their tax returns.
The following tax information for the Fund is required to be furnished to shareholders with respect to income earned and distributions paid during its fiscal year.
The Fund hereby reports the following amounts, or if subsequently determined to be different, the maximum allowable amounts, for the fiscal year ended September 30, 2022:
| Pursuant to: | Amount Reported | |||||
| Long-Term Capital Gain Dividends Distributed | §852(b)(3)(C) | $ | 253,657 | |||
| Income Eligible for Dividends Received Deduction (DRD) | §854(b)(1)(A) | $ | 383,341 | |||
| Qualified Dividend Income Earned (QDI) | §854(b)(1)(B) | $ | 3,477,723 | |||
| Short-Term Capital Gain Dividends Distributed | §871(k)(2)(C) | $ | 1,241,555 | |||
| Qualified Business Income Dividends Earned | §199A | $ | 61,846 | |||
Note (1) - The law varies in each state as to whether and what percentage of dividend income attributable to Federal obligations is exempt from state income tax. Shareholders are advised to consult with their tax advisors to determine if any portion of the dividends received is exempt from state income taxes.
Under Section 853 of the Internal Revenue Code, the Fund intends to elect to pass through to its shareholders the following amounts, or amounts as finally determined, of foreign taxes paid and foreign source income earned by the Fund during the fiscal year ended September 30, 2022:
| Foreign Taxes Paid | $ | 352,567 | ||
| Foreign Source Income Earned | $ | 3,883,897 |
|
50 |
ClearBridge Global Infrastructure Income Fund |
ClearBridge
Global Infrastructure Income Fund
Trustees
Paul R. Ades
Andrew L. Breech
Althea L. Duersten
Chair
Stephen R. Gross
Susan M. Heilbron
Howard J. Johnson
Arnold L. Lehman
Robin J. W. Masters
Jerome H. Miller
Ken Miller
G. Peter O’Brien
Thomas F. Schlafly
Jane Trust
Investment manager
Legg Mason Partners Fund Advisor, LLC
Subadviser
ClearBridge Investments (North America) Pty Limited
Distributor
Franklin Distributors, LLC
Custodian
The Bank of New York Mellon
Transfer agent#
Franklin Templeton Investor Services, LLC
3344 Quality Drive
Rancho Cordova, CA 95670-7313
Independent registered public accounting firm
PricewaterhouseCoopers LLP
Baltimore, MD
| # | Effective February 22, 2022, Franklin Templeton Investor Services, LLC replaced BNY Mellon Investment Servicing (US) Inc. as Transfer Agent. |
ClearBridge Global Infrastructure Income Fund
The Fund is a separate investment series of Legg Mason Global Asset Management Trust, a Maryland statutory trust.
ClearBridge Global Infrastructure Income Fund
Legg Mason Funds
100 International Drive
Baltimore, MD 21202
The Fund files its complete schedule of portfolio holdings with the Securities and Exchange Commission (“SEC”) for the first and third quarters of each fiscal year as an exhibit to its reports on Form N-PORT. The Fund’s Forms N-PORT are available on the SEC’s website at www.sec.gov. To obtain information on Form N-PORT, shareholders can call the Fund at 877-6LM-FUND/656-3863.
Information on how the Fund voted proxies relating to portfolio securities during the prior 12-month period ended June 30th of each year and a description of the policies and procedures that the Fund uses to determine how to vote proxies related to portfolio transactions are available (1) without charge, upon request, by calling the Fund at 877-6LM-FUND/656- 3863, (2) at www.franklintempleton.com and (3) on the SEC’s website at www.sec.gov.
This report is submitted for the general information of the shareholders of ClearBridge Global Infrastructure Income Fund. This report is not authorized for distribution to prospective investors in the Fund unless preceded or accompanied by a current prospectus.
Investors should consider the Fund’s investment objectives, risks, charges and expenses carefully before investing. The prospectus contains this and other important information about the Fund. Please read the prospectus carefully before investing.
www.franklintempleton.com
© 2022 Franklin Distributors, LLC, Member FINRA/SIPC. All rights reserved.
Legg Mason Funds Privacy and Security Notice
Your Privacy Is Our Priority
Franklin Templeton* is committed to safeguarding your personal information. This notice is designed to provide you with a summary of the non-public personal information Franklin Templeton may collect and maintain about current or former individual investors; our policy regarding the use of that information; and the measures we take to safeguard the information. We do not sell individual investors’ non-public personal information to anyone and only share it as described in this notice.
Information We Collect
When you invest with us, you provide us with your non-public personal information. We collect and use this information to service your accounts and respond to your requests. The non-public personal information we may collect falls into the following categories:
| • | Information we receive from you or your financial intermediary on applications or other forms, whether we receive the form in writing or electronically. For example, this information may include your name, address, tax identification number, birth date, investment selection, beneficiary information, and your personal bank account information and/or email address if you have provided that information. |
| • | Information about your transactions and account history with us, or with other companies that are part of Franklin Templeton, including transactions you request on our website or in our app. This category also includes your communications to us concerning your investments. |
| • | Information we receive from third parties (for example, to update your address if you move, obtain or verify your email address or obtain additional information to verify your identity). |
| • | Information collected from you online, such as your IP address or device ID and data gathered from your browsing activity and location. (For example, we may use cookies to collect device and browser information so our website recognizes your online preferences and device information.) Our website contains more information about cookies and similar technologies and ways you may limit them. |
| • | Other general information that we may obtain about you such as demographic information. |
Disclosure Policy
To better service your accounts and process transactions or services you requested, we may share non-public personal information with other Franklin Templeton companies. From time to time we may also send you information about products/services offered by other Franklin Templeton companies although we will not share your non-public personal information with these companies without first offering you the opportunity to prevent that sharing.
We will only share non-public personal information with outside parties in the limited circumstances permitted by law. For example, this includes situations where we need to share information with companies who work on our behalf to service or maintain your account or process transactions you requested, when the disclosure is to companies assisting us with our own marketing efforts, when the disclosure is to a party representing you, or when required by law (for example, in response to legal process). Additionally, we will ensure that any outside companies working on our behalf, or with whom we have joint marketing agreements, are under contractual obligations to protect the confidentiality of your information, and to use it only to provide the services we asked them to perform.
| NOT PART OF THE ANNUAL REPORT |
Legg Mason Funds Privacy and Security Notice (cont’d)
Confidentiality and Security
Our employees are required to follow procedures with respect to maintaining the confidentiality of our investors’ non-public personal information. Additionally, we maintain physical, electronic and procedural safeguards to protect the information. This includes performing ongoing evaluations of our systems containing investor information and making changes when appropriate.
At all times, you may view our current privacy notice on our website at franklintempleton.com or contact us for a copy at (800) 632-2301.
*For purposes of this privacy notice Franklin Templeton shall refer to the following entities:
Fiduciary Trust International of the South (FTIOS), as custodian for individual retirement plans
Franklin Advisers, Inc.
Franklin Distributors, LLC, including as program manager of the Franklin Templeton 529 College Savings Plan and the NJBEST 529 College Savings Plan
Franklin Mutual Advisers, LLC
Franklin, Templeton and Mutual Series Funds
Franklin Templeton Institutional, LLC
Franklin Templeton Investments Corp., Canada
Franklin Templeton Investments Management, Limited UK
Franklin Templeton Portfolio Advisors, Inc.
Legg Mason Funds serviced by Franklin Templeton Investor Services, LLC
Templeton Asset Management, Limited
Templeton Global Advisors, Limited
Templeton Investment Counsel, LLC
If you are a customer of other Franklin Templeton affiliates and you receive notices from them, you will need to read those notices separately.
| NOT PART OF THE ANNUAL REPORT |
www.franklintempleton.com
© 2022 Franklin Distributors, LLC, Member FINRA/SIPC. All rights reserved.
RARE314422 11/22 SR22-4522
| ITEM 2. | CODE OF ETHICS. |
The registrant has adopted a code of ethics that applies to the registrant’s principal executive officer, principal financial officer, principal accounting officer or controller.
| ITEM 3. | AUDIT COMMITTEE FINANCIAL EXPERT. |
The Board of Trustees of the registrant has determined that Stephen R. Gross possesses the technical attributes identified in Instruction 2(b) of Item 3 to Form N-CSR to qualify as an “audit committee financial expert,” and has designated Stephen R. Gross as the Audit Committee’s financial expert. Stephen R. Gross is an “independent” Trustees pursuant to paragraph (a)(2) of Item 3 to Form N-CSR.
| ITEM 4. | PRINCIPAL ACCOUNTANT FEES AND SERVICES. |
(a) Audit Fees. The aggregate fees billed in the last two fiscal years ending September 30, 2021 and September 30, 2022 (the “Reporting Periods”) for professional services rendered by the Registrant’s principal accountant (the “Auditor”) for the audit of the Registrant’s annual financial statements, or services that are normally provided by the Auditor in connection with the statutory and regulatory filings or engagements for the Reporting Periods, were $322,330 in September 30, 2021 and $279,112 in September 30, 2022.
(b) Audit-Related Fees. The aggregate fees billed in the Reporting Period for assurance and related services by the Auditor that are reasonably related to the performance of the Registrant’s financial statements were $0 in September 30, 2021 and $0 in September 30, 2022.
(c) Tax Fees. The aggregate fees billed in the Reporting Periods for professional services rendered by the Auditor for tax compliance, tax advice and tax planning (“Tax Services”) were $80,500 in September 30, 2021 and $70,500 in September 30, 2022. These services consisted of (i) review or preparation of U.S. federal, state, local and excise tax returns; (ii) U.S. federal, state and local tax planning, advice and assistance regarding statutory, regulatory or administrative developments, and (iii) tax advice regarding tax qualification matters and/or treatment of various financial instruments held or proposed to be acquired or held.
There were no fees billed for tax services by to the service affiliates during the Reporting Periods that required pre-approval by the Audit Auditors Committee.
(d) All Other Fees. The aggregate fees for other fees billed in the Reporting Periods for products and services provided by the Auditor were $0 in September 30, 2021 and $0 in September 30, 2022, other than the services reported in paragraphs (a) through (c) of this item for the Legg Mason Global Asset Management Trust.
All Other Fees. There were no other non-audit services rendered by the Auditor to Legg Mason Partners Fund Advisors, LLC (“LMPFA”), and any entity controlling, controlled by or under common control with LMPFA that provided ongoing services to Legg Mason Global Asset Management Trust requiring pre-approval by the Audit Committee in the Reporting Period.
(e) Audit Committee’s pre–approval policies and procedures described in paragraph (c) (7) of Rule 2-01 of Regulation S-X.
(1) The Charter for the Audit Committee (the “Committee”) of the Board of each registered investment company (the “Fund”) advised by LMPFA or one of their affiliates (each, an “Adviser”) requires that the Committee shall approve (a) all audit and permissible non-audit services to be provided to the Fund and (b) all permissible non-audit services to be provided by the Fund’s independent auditors to the Adviser and any Covered Service Providers if the engagement relates directly to the operations and financial reporting of the Fund. The Committee may implement policies and procedures by which such services are approved other than by the full Committee.
The Committee shall not approve non-audit services that the Committee believes may impair the independence of the auditors. As of the date of the approval of this Audit Committee Charter, permissible non-audit services include any professional services (including tax services), that are not prohibited services as described below, provided to the Fund by the independent auditors, other than those provided to the Fund in connection with an audit or a review of the financial statements of the Fund. Permissible non-audit services may not include: (i) bookkeeping or other services related to the accounting records or financial statements of the Fund; (ii) financial information systems design and implementation; (iii) appraisal or valuation services, fairness opinions or contribution-in-kind reports; (iv) actuarial services; (v) internal audit outsourcing services; (vi) management functions or human resources; (vii) broker or dealer, investment adviser or investment banking services; (viii) legal services and expert services unrelated to the audit; and (ix) any other service the Public Company Accounting Oversight Board determines, by regulation, is impermissible.
Pre-approval by the Committee of any permissible non-audit services is not required so long as: (i) the aggregate amount of all such permissible non-audit services provided to the Fund, the Adviser and any service providers controlling, controlled by or under common control with the Adviser that provide ongoing services to the Fund (“Covered Service Providers”) constitutes not more than 5% of the total amount of revenues paid to the independent auditors during the fiscal year in which the permissible non-audit services are provided to (a) the Fund, (b) the Adviser and (c) any entity controlling, controlled by or under common control with the Adviser that provides ongoing services to the Fund during the fiscal year in which the services are provided that would have to be approved by the Committee; (ii) the permissible non-audit services were not recognized by the Fund at the time of the engagement to be non-audit services; and (iii) such services are promptly brought to the attention of the Committee and approved by the Committee (or its delegate(s)) prior to the completion of the audit.
(2) For the Legg Mason Global Asset Management Trust, the percentage of fees that were approved by the audit committee, with respect to: Audit-Related Fees were 100% and 100% for September 30, 2021 and September 30, 2022; Tax Fees were 100% and 100% for September 30, 2021 and September 30, 2022; and Other Fees were 100% and 100% for September 30, 2021 and September 30, 2022.
(f) N/A
(g) Non-audit fees billed by the Auditor for services rendered to Legg Mason Global Asset Management Trust, LMPFA and any entity controlling, controlled by, or under common control with LMPFA that provides ongoing services to Legg Mason Global Asset Management Trust during the reporting period were $1,124,357 in September 30, 2021 and $1,253,103 in September 30, 2022.
(h) Yes. Legg Mason Global Asset Management Trust’s Audit Committee has considered whether the provision of non-audit services that were rendered to Service Affiliates, which were not pre-approved (not requiring pre-approval), is compatible with maintaining the Accountant’s independence. All services provided by the Auditor to the Legg Mason Global Asset Management Trust or to Service Affiliates, which were required to be pre-approved, were pre-approved as required.
| ITEM 5. | AUDIT COMMITTEE OF LISTED REGISTRANTS. |
| a) | The independent board members are acting as the registrant’s audit committee as specified in Section 3(a)(58)(B) of the Exchange Act. The Audit Committee consists of the following Board members: |
Paul R. Ades
Andrew L. Breech
Althea L. Duersten
Stephen R. Gross
Susan M. Heilbron
Howard J. Johnson
Arnold L. Lehman
Robin J. W. Masters
Jerome H. Miller
Ken Miller
G. Peter O’Brien
Thomas F. Schlafly
| b) | Not applicable |
| ITEM 6. | SCHEDULE OF INVESTMENTS. |
Included herein under Item 1.
| ITEM 7. | DISCLOSURE OF PROXY VOTING POLICIES AND PROCEDURES FOR CLOSED-END MANAGEMENT INVESTMENT COMPANIES. |
Not applicable.
| ITEM 8. | PORTFOLIO MANAGERS OF CLOSED-END MANAGEMENT INVESTMENT COMPANIES. |
Not applicable.
| ITEM 9. | PURCHASES OF EQUITY SECURITIES BY CLOSED-END MANAGEMENT INVESTMENT COMPANY AND AFFILIATED PURCHASERS. |
Not applicable.
| ITEM 10. | SUBMISSION OF MATTERS TO A VOTE OF SECURITY HOLDERS. |
Not applicable.
| ITEM 11. | CONTROLS AND PROCEDURES. |
| (a) | The registrant’s principal executive officer and principal financial officer have concluded that the registrant’s disclosure controls and procedures (as defined in Rule 30a- 3(c) under the Investment Company Act of 1940, as amended (the “1940 Act”)) are effective as of a date within 90 days of the filing date of this report that includes the disclosure required by this paragraph, based on their evaluation of the disclosure controls and procedures required by Rule 30a-3(b) under the 1940 Act and 15d-15(b) under the Securities Exchange Act of 1934. |
| (b) | There were no changes in the registrant’s internal control over financial reporting (as defined in Rule 30a-3(d) under the 1940 Act) that occurred during the second fiscal quarter of the period covered by this report that have materially affected, or are likely to materially affect the registrant’s internal control over financial reporting. |
| ITEM 12. | DISCLOSURE OF SECURITIES LENDING ACTIVITIES FOR CLOSED-END MANAGEMENT INVESTMENT COMPANIES. |
Not applicable.
| ITEM 13. | EXHIBITS. |
(a) (1) Code of Ethics attached hereto.
Exhibit 99.CODE ETH
(a) (2) Certifications pursuant to section 302 of the Sarbanes-Oxley Act of 2002 attached hereto.
Exhibit 99.CERT
(b) Certifications pursuant to Section 906 of the Sarbanes-Oxley Act of 2002 attached hereto.
Exhibit 99.906CERT
SIGNATURES
Pursuant to the requirements of the Securities Exchange Act of 1934 and the Investment Company Act of 1940, the registrant has duly caused this Report to be signed on its behalf by the undersigned, there unto duly authorized.
Legg Mason Global Asset Management Trust
| By: | /s/ Jane Trust | |
| Jane Trust | ||
| Chief Executive Officer |
| Date: | November 23, 2022 | |
Pursuant to the requirements of the Securities Exchange Act of 1934 and the Investment Company Act of 1940, this report has been signed below by the following persons on behalf of the registrant and in the capacities and on the dates indicated.
| By: | /s/ Jane Trust | |
| Jane Trust | ||
| Chief Executive Officer | ||
| Date: | November 23, 2022 | |
| By: | /s/ Christopher Berarducci | |
| Christopher Berarducci | ||
| Principal Financial Officer | ||
| Date: | November 23, 2022 | |
ATTACHMENTS / EXHIBITS
Serious News for Serious Traders! Try StreetInsider.com Premium Free!
You May Also Be Interested In
- Full Line Stencil Introduces Transformative Quilting Designs for Modern Quilters
- Attorneys File Sexual Assault Lawsuit Against Fort Worth Massage Envy
- MODE Launches BizStack AI Assistant - The World's First IoT Solution With Generative AI
Create E-mail Alert Related Categories
SEC FilingsSign up for StreetInsider Free!
Receive full access to all new and archived articles, unlimited portfolio tracking, e-mail alerts, custom newswires and RSS feeds - and more!
