

Form N-CSR Legg Mason ETF Investmen For: Nov 30
 Tweet
Tweet Share
Share
UNITED STATES
SECURITIES AND EXCHANGE COMMISSION
Washington, D.C. 20549
FORM N-CSR
CERTIFIED SHAREHOLDER REPORT OF REGISTERED
MANAGEMENT INVESTMENT COMPANIES
Investment Company Act file number 811-23096
Legg Mason ETF Investment Trust
(Exact name of registrant as specified in charter)
620 Eighth Avenue, 47th Floor, New York, NY 10018
(Address of principal executive offices) (Zip code)
Marc A. De Oliveira
Franklin Templeton
100 First Stamford Place
Stamford, CT 06902
(Name and address of agent for service)
Registrant’s telephone number, including area code: 1-877-721-1926
Date of fiscal year end: November 30
Date of reporting period: November 30, 2021
| ITEM 1. | REPORT TO STOCKHOLDERS. |
The Annual Report to Stockholders is filed herewith.
![]()
| Annual Report | November 30, 2021 |
CLEARBRIDGE
LARGE CAP GROWTH ESG ETF
LRGE

| INVESTMENT PRODUCTS: NOT FDIC INSURED • NO BANK GUARANTEE • MAY LOSE VALUE |
Fund objective
The Fund seeks long-term capital appreciation through investing in large-capitalization companies with the potential for high future earnings growth.

Dear Shareholder,
We are pleased to provide the annual report of ClearBridge Large Cap Growth ESG ETF for the twelve-month reporting period ended November 30, 2021. Please read on for a detailed look at prevailing economic and market conditions during the Fund’s reporting period and to learn how those conditions have affected Fund performance.
Special shareholder notice
On or about November 22, 2021, ClearBridge Large Cap Growth ESG ETF (the “Fund”) implemented revisions to the Fund’s principal investment strategies to remove certain portfolio constraints relating to individual securities and sector exposure. The Fund’s investment objective and its fees and expenses did not change as a result of the revisions to the Fund’s principal investment strategies. For additional information, please see the Fund’s prospectus supplement dated November 22, 2021.
Subsequent event notice
It is anticipated that Mary Jane McQuillen will step down as a member of the fund’s portfolio management team effective December 31, 2021. Thereafter, Ms. McQuillen will continue as Head of the Environmental, Social and Governance Investment Program at ClearBridge Investments, LLC. For additional information, please see the Fund’s prospectus supplement dated October 5, 2021.
|
II |
ClearBridge Large Cap Growth ESG ETF |
As always, we remain committed to providing you with excellent service and a full spectrum of investment choices. We also remain committed to supplementing the support you receive from your financial advisor. One way we accomplish this is through our website, www.franklintempleton.com. Here you can gain immediate access to market and investment information, including:
• Fund net asset value and market price,
• Market insights and commentaries from our portfolio managers, and
• A host of educational resources.
We look forward to helping you meet your financial goals.
Sincerely,

Patrick O’Connor
President and Chief Executive Officer — Investment Management President
December 31, 2021
| ClearBridge Large Cap Growth ESG ETF |
III |
Q. What is the Fund’s investment strategy?
A. ClearBridge Large Cap Growth ESG ETF (the “Fund”) seeks long-term capital appreciation through investing in large-capitalization companies with the potential for high future earnings growth.
Under normal circumstances, the Fund seeks to meet its investment objective by investing at least 80% of its net assets, plus borrowings for investment purposes, if any, in equity securities or other instruments with similar economic characteristics of U.S. companies with large market capitalizations that meet its financial and environmental, social and governance (“ESG”) criteria.
Large-capitalization companies are those companies with market capitalizations similar to companies in the Russell 1000 Growth Indexi. The size of the companies in the Russell 1000 Growth Index changes with market conditions and its composition. The Fund may also invest in companies that we at ClearBridge Investments, LLC (“ClearBridge”), the Fund’s subadviser, believe are making substantial progress toward becoming a leader in ESG policies. The Fund’s investment strategy focuses on consistent growth of capital while managing volatility.
Determination of a company’s ESG standards is based on the ClearBridge’s proprietary research approach. We will exercise judgment to determine ESG best practices based on our over twenty-five year history of managing ESG investment strategies through an established proprietary process. We utilize a fundamental, bottom-up research approach that emphasizes company analysis, management and stock selection.
The ESG evaluation is integrated into a thorough assessment of investment worthiness based on financial criteria as well as ESG considerations including innovative workplace policies, employee benefits and programs; environmental management system strength, eco-efficiency and life-cycle analysis; community involvement, strategic philanthropy and reputation management; and strong corporate governance and independence of the board. The ESG analysis is conducted by the fundamental analyst platform on a sector-specific basis, and a proprietary ESG rating is assigned to each company. We seek to invest over the long term in large-capitalization companies that are considered to be of high quality with sustainable competitive advantages as evidenced by high returns on capital, strong balance sheets, and capable management teams that allocate capital in an efficient manner.
We use fundamental analysis to identify investment candidates with these attributes, and evaluate industry dynamics, the strength of the business model and management skill. Valuation will be carefully examined using a variety of techniques that depend on the type of company being researched. Methods typically used are discounted cash flow analysis, market implied growth and returns relative to the ClearBridge’s expectations, multiple comparisons and scenario analysis. It is also ClearBridge’s intention to engage and encourage management to improve in certain ESG areas identified by ClearBridge through the sector analysts’ lead engagements. We will sell a security if the issuer no longer meets
| ClearBridge Large Cap Growth ESG ETF 2021 Annual Report |
1 |
Fund overview (cont’d)
ClearBridge’s financial or ESG criteria. In addition, we will seek to replace securities when the company’s risk/reward profile is no longer favorable due to price appreciation or if the company’s investment fundamentals have deteriorated meaningfully relative to original expectations. Securities may also be sold to permit investment in an issuer considered by the subadviser to be a more attractive alternative.
The Fund emphasizes investments in equity securities or related instruments of U.S. large-capitalization companies; however, it may invest in equity securities of foreign issuers with similar characteristics.
Q. What were the overall market conditions during the Fund’s reporting period?
A. Equities generally delivered robust performance during the twelve-month reporting period ended November 30, 2021, as the approval and subsequent rollout of multiple COVID-19 vaccines combined with accommodative monetary policy and ambitious fiscal spending helped the S&P 500 Indexii to a gain of 27.92%. The market was led by cyclical1 stocks benefiting from the economic recovery, as reopened businesses, greater mobility and a healthy consumer encouraged spending and production, and high-growth technology stocks benefiting from strong secular trends as well as a lingering stay-at-home environment. The benchmark Russell 1000 Growth Index advanced 30.70% for the year, outperforming the Russell 1000 Value Indexiii (+22.25%) by over 845 basis points.
The reporting period began with emergency authorization approval of COVID-19 vaccines, which led to a broadening of market leadership from the mega cap growth stocks that had soared during the height of pandemic lockdowns. FDA approvals of vaccines from Pfizer/ BioNTech and Moderna increased optimism about an eventual return to normal economic activity, sparking a rally in cyclical areas of the market.
Aggressive fiscal and monetary policies continued unabated in early 2021, helping support consumer demand that, combined with stop-and-start supply chain recovery as COVID-19 rippled through global regions, raised inflation concerns and led to soaring commodity prices. Despite waves of COVID-19 periodically offering a bid to tech stocks that would benefit from a stay-at-home environment, inflation worries led to a steepening yield curve, weighing on high-multiple growth stocks and supporting cyclicals. Amid easing business restrictions and accommodating fiscal and monetary policies, the U.S. economy picked up steam, with business confidence and new jobs numbers increasing steadily.
Markets wavered in September after the Delta variant of COVID-19 put a pause on recovery plays and higher inflation coincided with signals from the Federal Reserve Board that it would reduce its bond buying as early as November and potentially raise the federal funds rate in 2022. Equities delivered a flattish third quarter of 2021, as already-challenging labor and supply shortages and broad-based inflationary pressures intensified, weighing on industrials and materials companies. Robust third quarter corporate earnings, however, suggesting companies have largely been able to absorb inflationary pressures, led to strong
| 1 | Cyclicals consists of the following industries: automotive, entertainment, gaming, home construction, lodging, retailers, restaurants, textiles, and other consumer services. |
|
2 |
ClearBridge Large Cap Growth ESG ETF 2021 Annual Report |
gains in October. Much of those advances were erased, however, by the emergence of a new COVID-19 variant, Omicron, late in the period that pushed the S&P 500 Index to its biggest single-day loss in over a year. Omicron reminded investors that the pandemic may continue to impact markets and the global economy for the foreseeable future.
On a sector basis, energy (+62.59%), which maintains a minimal weighting in the benchmark, and information technology (“IT”) (+38.22%) were the best performers while financials (+33.47%) and communication services (+32.65%) also outperformed. Meanwhile, materials (+11.20%), industrials (12.79%), consumer staples (+12.15%) and health care (+20.87%) underperformed.
Q. How did we respond to these changing market conditions?
A. We have carefully constructed the Fund so that it may thrive during different stages of a market cycle, diversifying across three types of growth companies – stable, cyclical and select – and that we believe are driven more by their own execution than broad, macroeconomic forces. In addition, we believe our focus on companies that proactively integrate ESG considerations into their business models or demonstrate commitment to improve their practices may promote consistent results.
ClearBridge’s ESG mission for over 30 years has been to continually improve the integration of our ESG analysis into fundamental research and portfolio construction, as well as use engagements with companies and proxy voting to drive positive change and reduce risks. During the reporting period, greater emphasis was placed on data privacy as more consumers use digital devices, employee and stakeholder safety as the COVID-19 pandemic spread, as well as climate change as the U.S. rejoined the Paris Agreement and COP26 renewed a global focus on lowering carbon emissions and accelerating the transition to renewable energy sources.
We have been looking for multiyear secular trends outside of the IT and internet sectors to help us maintain a portfolio that can perform well in markets with varied sector or factor leadership. In particular, electrification of the global economy and the transition to electric vehicles (“EVs”) are areas where we continue to add exposure. We are investing in the brains behind EVs through NXP in the control center and Aptiv for safety features. We think global rideshare leader Uber will also be a key player in the transition from internal combustion engines to EVs. We extended the Fund’s exposure to electricity infrastructure critical to power EVs with the purchase of Eaton, a manufacturer of power management products for a variety of end markets, a position we added to during the quarter. We believe upgrading the power grid to be more resilient and capable of handling the increasing needs of EVs through the two-way flow of electricity is a decade-long trend. For the U.S. and Europe to meet aggressive EV production goals, existing EV infrastructure must be upgraded to enable home and commercial car charging much more broadly. Eaton has 30% share of the equipment needed to satisfy many of these residential and commercial upgrades. November passage of $1.2 trillion infrastructure should support this trend.
| ClearBridge Large Cap Growth ESG ETF 2021 Annual Report |
3 |
Fund overview (cont’d)
A diversified mega cap company like portfolio holding Amazon.com could also be a large contributor, given its reliance on and involvement in heavy transport. The company is creating a fleet of 100,000 electric delivery vehicles to help reach a goal of at least 50% of all shipments being net-zero carbon emissions by 2030, and it has a clear opportunity, given its volume and reach, to implement climate-friendly changes to delivery infrastructure, including air and rail, that would benefit all e-commerce and society at large.
Cost pressures in a reopening U.S. economy are coming from a variety of sources, including a tight labor market as demand for goods and services outpaces labor supply. Managing human capital — a mixture of employee skills, wellness, productivity and innovative ability — through a pandemic and recovery is requiring approaches focused on the long-term success of both employees and the bottom line. Among these, wage inflation is conducive to reducing economic inequality in many industries.
As the pandemic wanes and the labor market tightens, Fund holdings in essential retail, rideshare and logistics businesses are balancing labor and shareholder interests by proactively developing forward-thinking solutions that foster stronger hiring and retention cultures, helping to ensure the businesses remain competitive for years to come.
Portfolio holding Home Depot has been ensuring adequate staffing to meet demand under trying conditions, instituting enhanced pay practices during the pandemic, with raises, unplanned bonuses and other benefits helping to compensate employees for their efforts in a difficult environment. Over the course of the pandemic, for example, Home Depot has invested $2 billion in expanded benefits for employees. These have included extra weeks of paid time off that employees could use either as vacation time or supplementary pay, paid time off for employees contracting COVID-19 or requiring to be quarantined, and relaxed time off polices. Expanded benefits include $1 billion a year in permanent raises for hourly workers.
Under new CEO, Carol Tomé, the United Parcel Service (“UPS”) has increased its focus on ESG to retain and attract the next generation of workers. The goal is to move from being a “trusted but stodgy” shipper to a modern innovative company through greater attention to sustainability as well as diversity and inclusion. Seeking to be a “people-led” company, UPS has been tracking the employee experience in order to understand and improve employee engagement. UPS measures its employee experience by asking how likely employees are to recommend others work there. That metric stood at 51% globally at the end of 2019 but has improved by six percentage points under Tomé’s leadership as UPS drives diversity and inclusion efforts across the company, including investing in training, modernizing appearance standards, and adding a Chief Diversity, Equity, and Inclusion Officer on the executive leadership team. Ultimately, UPS hopes to get this “likely to recommend” metric up to 80%. UPS is also driving environmental goals through its recent pledge to be carbon neutral in all of its operations by 2050. This aligns with the company’s mission to attract next-generation talent.
|
4 |
ClearBridge Large Cap Growth ESG ETF 2021 Annual Report |
The pandemic has also brought attention to the question of gig worker employment status for companies, including Uber. In the U.K., Uber proactively classified its driver as “workers” ahead of final rulings from the British court system. The worker status in the U.K. is a designation between self-employed and employed status that entitles drivers to minimum wage, holiday pay and in some cases a pension. ClearBridge has engaged with Uber on labor issues since its IPO, and we have given feedback over that time to the CEO, CFO, Chief Legal Officer and Investor Relations on labor relations as well as strategy and communications. Uber’s agreement on this designation is ahead of other competitors in the market and the legal mandate represents a step forward in the company’s thinking about labor. The agreement represents a short-term hit to earnings, yet in some ways it places Uber ahead of the market in its ability to balance labor and shareholder interests.
We have added a number of new names to the portfolio over the last year and continue to populate our white board with quality growth franchises with strong ESG characteristics we are ready to own at the right price. Despite the recent resurgence of mega cap growth stocks, we are sticking to our process and maintaining balance across the spectrum of growth. The Fund held up better than the benchmark during the most turbulent periods in the last twelve-months and we believe remains well-positioned for lower growth or down markets. Given the moves we have made to increase our weighting to select growth companies, we also expect the Fund to keep up better in stronger markets and provide a more balanced distribution of returns going forward.
Performance review
For the twelve months ended November 30, 2021, ClearBridge Large Cap Growth ESG ETF generated a 24.44% return on a net asset value (“NAV”)iv basis and 24.15% based on its market pricev per share.
The performance table shows the Fund’s total return for the twelve months ended November 30, 2021 based on its NAV and market price as of November 30, 2021. The Fund’s broad-based market index, the Russell 1000 Growth Index, returned 30.70% over the same time frame. The Lipper Large-Cap Growth Funds Category Averagevi returned 24.91% for the period. Please note that Lipper performance returns are based on each fund’s NAV.
| Performance Snapshot as of November 30, 2021 (unaudited) | ||||||||
| 6 months | 12 months | |||||||
| ClearBridge Large Cap Growth ESG ETF: | ||||||||
| $60.55 (NAV) |
13.22 | % | 24.44 | %*† | ||||
| $60.47 (Market Price) |
13.01 | % | 24.15 | %*‡ | ||||
| Russell 1000 Growth Index | 17.53 | % | 30.70 | % | ||||
| Lipper Large-Cap Growth Funds Category Average | 12.48 | % | 24.91 | % | ||||
| ClearBridge Large Cap Growth ESG ETF 2021 Annual Report |
5 |
Fund overview (cont’d)
The performance shown represents past performance. Past performance is no guarantee of future results and current performance may be higher or lower than the performance shown above. Principal value and investment returnswill fluctuate so shares, when sold,may be worth more or less than their original cost. Performance data current to the most recent month-end is available at www.franklintempleton.com.
Investors buy and sell shares of an exchange-traded fund (“ETF”)at market price (notNAV)in the secondary market throughout the trading day.These shares are not individually available for direct purchase from or direct redemption to the ETF.Market price returns are typically based upon the official closing price of the Fund’s shares.These returns do not represent investors’ returns had they traded shares at other times.Performance figures for periods shorter than one year represent cumulative figures and are not annualized.
Information showing the Fund’s net asset value,market price,premiums and discounts,and bid-ask spreads for various time periods is available by visiting the Fund’s website at www.franklintempleton.com.
As of the Fund’s current prospectus dated March 31, 2021, the gross total annual fund operating expense ratio for the Fund was 0.60%.
* Total returns are based on changes in NAV or market price,respectively.Returns reflect the deduction of all Fund expenses. Returns do not reflect the deduction of brokerage commissions or taxes that investors pay on distributions or the sale of shares.
† Total return assumes the reinvestment of all distributions at NAV.
‡ Total return assumes the reinvestment of all distributions at market price, which typically is based upon the official closing price of the Fund’s shares.
Q. What were the leading contributors to performance?
A. On an absolute basis, the Fund had positive returns in eight of the nine economic sectors in which it was invested (among eleven sectors in total) during the reporting period. The greatest contributions to absolute returns came from the IT, health care and consumer discretionary sectors. In terms of individual Fund holdings, leading contributors to performance for the period included Nvidia, Microsoft, Apple, Palo Alto Networks and Facebook (now called Meta Platforms) in the IT sector.
Relative to the benchmark, stock selection in the health care sector and an underweight allocation to consumer staples sector were the primary contributors to performance.
Q. What were the leading detractors from performance?
A. On an absolute basis, the consumer staples sector was a detractor from performance. In terms of individual Fund holdings, the leading detractors for the period were Splunk, Fidelity National Information Services and UiPath in the IT sector, Uber Technologies in the industrials sector and Costco Wholesale in the consumer staples sector.
|
6 |
ClearBridge Large Cap Growth ESG ETF 2021 Annual Report |
Relative to the benchmark, overall stock selection and sector allocation had negative impacts on performance. In particular, stock selection in the IT and communication services sectors and an overweight to the industrials sector were the primary detractors from returns for the period.
Q. Were there any significant changes to the Fund during the reporting period?
A. Significant changes to the Fund’s portfolio during the reporting period included the initiation of new positions in Netflix in the communication services sector, Nike and Tractor Supply Company in the consumer discretionary sector, Workday in the IT sector and Eaton in the industrials sector. During the reporting period, we also closed a number of the Fund’s existing positions, the largest being Comcast in the communication services sector, Amgen in the health care sector, Costco Wholesale in the consumer staples sector as well as Akamai Technologies and Texas Instruments in the IT sector.
Looking for additional information?
The Fund’s daily NAV is available online at www.franklintempleton.com. The Fund is traded under the symbol “LRGE” and its closing market price is available on most financial websites. In a continuing effort to provide information concerning the Fund, shareholders may call 1-877-721-1926 (toll free), Monday through Friday from 8:00 a.m. to 5:30 p.m. Eastern time, for the Fund’s current NAV, market price and other information.
| ClearBridge Large Cap Growth ESG ETF 2021 Annual Report |
7 |
Fund overview (cont’d)
Thank you for your investment in ClearBridge Large Cap Growth ESG ETF. As always, we appreciate that you have chosen us to manage your assets and we remain focused on achieving the Fund’s investment goals.
Sincerely,

Peter Bourbeau
Portfolio Manager
ClearBridge Investments, LLC

Mary Jane McQuillen
Portfolio Manager
ClearBridge Investments, LLC

Margaret Vitrano
Portfolio Manager
ClearBridge Investments, LLC
December 14, 2021
RISKS: Equity securities are subject to market and price fluctuations. Large-capitalization companies may fall out of favor with investors based on market and economic conditions. The Fund’s environmental, social and governance (“ESG”) investment strategy may limit the types and number of investment opportunities available to the Fund and, as a result, the Fund may underperform funds that are not subject to such criteria. The Fund’s ESG investment strategy may result in the Fund investing in securities or industry sectors that underperform the market as a whole, or forgoing opportunities to invest in securities that might otherwise be advantageous to buy. The Fund may also underperform other funds screened for different ESG standards. In addition, the subadviser may be unsuccessful in creating a portfolio composed of companies that exhibit positive ESG characteristics.
The Fund’s growth-oriented investment style may increase the risks of investing in the Fund. Growth securities typically are very sensitive to market movements because their market prices tend to reflect future expectations. Growth stocks as a group may be out of favor and underperform the overall equity market while the market concentrates on value stocks. Securities or other assets in the Fund’s portfolio may underperform in comparison to the general
|
8 |
ClearBridge Large Cap Growth ESG ETF 2021 Annual Report |
financial markets, a particular financial market or other asset classes. Please see the Fund’s prospectus for a more complete discussion of these and other risks and the Fund’s investment strategies.
All investments are subject to risk including the possible loss of principal. Past performance is no guarantee of future results. An index is a statistical composite that tracks a specified financial market, sector or rule-based investment process. Unlike a fund, an index does not actually hold a portfolio of securities and therefore does not incur the expenses incurred by a fund. These expenses negatively impact fund performance. All index performance reflects no deduction for fees, expenses or taxes. Please note that an investor cannot invest directly in an index.
The mention of sector breakdowns is for informational purposes only and should not be construed as a recommendation to purchase or sell any securities. The information provided regarding such sectors is not a sufficient basis upon which to make an investment decision. Investors seeking financial advice regarding the appropriateness of investing in any securities or investment strategies discussed should consult their financial professional. The Fund’s top five sector holdings (as a percentage of net assets) as of November 30, 2021 were: information technology (41.3%), consumer discretionary (18.2%), health care (12.4%), communication services (11.2%) and industrials (11.0%). The Fund’s composition may differ over time.
The information provided is not intended to be a forecast of future events, a guarantee of future results or investment advice. Views expressed may differ from those of the firm as a whole.
| i | The Russell 1000 Growth Index measures the performance of those Russell 1000 Index companies with higher price-to-book ratios and higher forecasted growth values. (A price-to-book ratio is the price of a stock compared to the difference between a company’s assets and liabilities). |
| ii | The S&P 500 Index is an unmanaged index of the stocks of 500 leading companies, and is generally representative of the performance of larger companies in the U.S. |
| iii | The Russell 1000 Value Index measures the performance of the large-cap value segment of the U.S.equity universe. It includes those Russell 1000 Index companies with lower price-to-book ratios and lower expected growth values. The Russell 1000 Index measures the performance of the large-cap segment of the U.S.equity universe.It is a subset of the Russell 3000 Index and includes approximately 1,000 of the largest securities based on a combination of their market cap and current index membership.The Russell 1000 represents approximately 90% of the U.S. market.The Russell 3000 Index measures the performance of the 3,000 largest U.S.companies based on total market capitalization,which represents approximately 98% of the U.S. equity market. |
| iv | Net Asset Value (NAV) is calculated by subtracting total liabilities from total assets and dividing the results by the number of shares outstanding. |
| v | Market price is determined by supply and demand.It is the price at which an investor purchases or sells shares of the Fund. The market price may differ from the Fund’s NAV. |
| vi | Lipper,Inc.,a wholly-owned subsidiary of Refinitiv, provides independent insight on global collective investments. Returns are based on the period ended November 30, 2021, including the reinvestment of all distributions, including returns of capital, if any, calculated among the 687 funds for the six-month period and 680 funds for the twelve-month period in the Fund’s Lipper category. |
| ClearBridge Large Cap Growth ESG ETF 2021 Annual Report |
9 |
| Investment breakdown (%) as a percent of total investment |
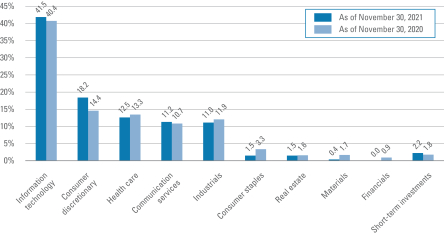
| † | The bar graph above represents the composition of the Fund’s investments as of November 30, 2021 and November 30, 2020. The composition of the Fund’s investments is subject to change at any time. |
|
10 |
ClearBridge Large Cap Growth ESG ETF 2021 Annual Report |
Example
As a shareholder of the Fund, you may incur two types of costs: (1) transaction costs, such as brokerage commissions paid on purchases and sales of Fund shares; and (2) ongoing costs, including management fees; and other Fund expenses. This example is intended to help you understand your ongoing costs (in dollars) of investing in the Fund and to compare these costs with the ongoing costs of investing in other funds.
This example is based on an investment of $1,000 invested on June 1, 2021 and held for the six months ended November 30, 2021.
Actual expenses
The table below titled “Based on Actual Total Return” provides information about actual account values and actual expenses. You may use the information provided in this table, together with the amount you invested, to estimate the expenses that you paid over the period. To estimate the expenses you paid on your account, divide your ending account value by $1,000 (for example, an $8,600 ending account value divided by $1,000 = 8.6), then multiply the result by the number under the heading entitled “Expenses Paid During the Period”.
Hypothetical example for comparison purposes
The table below titled“ Based on Hypothetical Total Return” provides information about hypothetical account values and hypothetical expenses based on the actual expense ratio and an assumed rate of return of 5.00% per year before expenses, which is not the Fund’s actual return. The hypothetical account values and expenses may not be used to estimate the actual ending account balance or expenses you paid for the period. You may use the information provided in this table to compare the ongoing costs of investing in the Fund and other funds. To do so, compare the 5.00% hypothetical example relating to the Fund with the 5.00% hypothetical examples that appear in the shareholder reports of the other funds.
Please note that the expenses shown in the table below are meant to highlight your ongoing costs only and do not reflect any transactional costs, such as brokerage commissions paid on purchases and sales of Fund shares. Therefore, the table is useful in comparing ongoing costs only, and will not help you determine the relative total costs of owning different funds. In addition, if these transaction costs were included, your costs would have been higher.
| Based on actual total return1 | Based on hypothetical total return1 | |||||||||||||||||||||||||||||||||||||||||||||||||
| Actual Total Return2 |
Beginning Account Value |
Ending Account Value |
Annualized Expense Ratio |
Expenses Paid During the Period3 |
Hypothetical Annualized Total Return |
Beginning Account Value |
Ending Account Value |
Annualized Expense Ratio |
Expenses Paid During the Period3 | |||||||||||||||||||||||||||||||||||||||||
| 13.22% | $ | 1,000.00 | $ | 1,132.20 | 0.59 | % | $ | 3.15 | 5.00 | % | $1,000.00 | $ | 1,022.11 | 0.59 | % | $ | 2.99 | |||||||||||||||||||||||||||||||||
| 1 | For the six months ended November 30, 2021. |
| 2 | Assumes the reinvestment of all distributions, including returns of capital, if any, at net asset value. Total return is not annualized, as it may not be representative of the total return for the year. Performance figures may reflect fee waivers and/or expense reimbursements. In the absence of fee waivers and/or expense reimbursements, the total return would have been lower. Past performance is no guarantee of future results. |
| 3 | Expenses (net of fee waivers and/or expense reimbursements) are equal to the Fund’s annualized expense ratio multiplied by the average account value over the period, multiplied by the number of days in the most recent fiscal half-year (183), then divided by 365. |
| ClearBridge Large Cap Growth ESG ETF 2021 Annual Report |
11 |
| Net Asset Value | ||||
| Average annual total returns1 | ||||
| Twelve Months Ended 11/30/21 | 24.44 | % | ||
| Inception* through 11/30/21 | 22.27 | |||
| Cumulative total returns1 | ||||
| Inception date of 5/22/17 through 11/30/21 | 148.39 | % | ||
| Market Price | ||||
| Average annual total returns2 | ||||
| Twelve Months Ended 11/30/21 | 24.15 | % | ||
| Inception* through 11/30/21 | 22.23 | |||
| Cumulative total returns2 | ||||
| Inception date of 5/22/17 through 11/30/21 | 148.07 | % | ||
All figures represent past performance and are not a guarantee of future results. Investment returns and principal value of an investment will fluctuate so that an investor’s shares, when sold, may be worth more or less than their original cost. The returns shown do not reflect the deduction of brokerage commissions or taxes that investors would pay on distributions or the sale of shares. Performance figures may reflect fee waivers and/or expense reimbursements. In the absence of fee waivers and/or expense reimbursements, the total return would have been lower.
Investors buy and sell shares of the Fund at market price, not NAV, in the secondary market throughout the trading day. These shares are not individually available for direct purchase from or direct redemption to the Fund. The Fund’s per share NAV is the value of one share of the Fund and is calculated by dividing the value of total assets less total liabilities by the number of shares outstanding. The NAV return is based on the NAV of the Fund and effective July 1, 2020, market price returns typically are based upon the official closing price of the Fund’s shares. Prior to July 1, 2020, market price returns generally were based upon the mid-point between the bid and ask on the Fund’s principal trading market when the Fund’s NAV was determined, which was typically 4:00 p.m. Eastern time (U.S.). Market price performance reported for periods prior to July 1, 2020 continue to reflect market prices calculated based upon the mid-point between the bid and ask on the Fund’s principal trading market typically as of 4:00 p.m. Eastern time (U.S.). These returns do not represent investors’ returns had they traded shares at other times. NAV and market price returns assume that dividends and capital gain distributions have been reinvested in the Fund at NAV and market price, respectively. As with other exchange-traded funds, NAV returns and market price returns may differ because of factors such as the supply and demand for Fund shares and investors’ assessment of the underlying value of the Fund’s portfolio securities.
| 1 | Assumes the reinvestments of all distributions, including returns of capital, if any, at net asset value. |
| 2 | Assumes the reinvestment of all distributions, including returns of capital, if any, at market price. |
* Inception date of the Fund is May 22, 2017
|
12 |
ClearBridge Large Cap Growth ESG ETF 2021 Annual Report |
Historical performance
Value of $10,000 invested in
ClearBridge Large Cap Growth ESG ETF vs Russell 1000 Growth Index† — May 22, 2017 - November 30, 2021
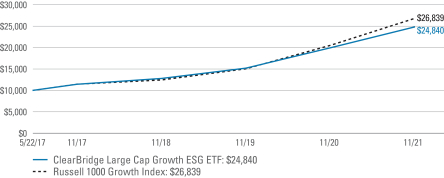
All figures represent past performance and are not a guarantee of future results. Investment returns and principal value of an investment will fluctuate so that an investor’s shares, when sold, may be worth more or less than their original cost. NAV returns assume that dividends and capital gain distributions have been reinvested in the Fund at NAV. The returns shown do not reflect the deduction of brokerage commissions or taxes that investors would pay on distributions or the sale of shares. Performance figures may reflect fee waivers and/or expense reimbursements. In the absence of fee waivers and/or expense reimbursements, the total return would have been lower.
| † | Hypothetical illustration of $10,000 invested in ClearBridge Large Cap Growth ESG ETF on May 22, 2017 (inception date), assuming the reinvestment of all distributions, including returns of capital, if any, at net asset value through November 30, 2021. The hypothetical illustration also assumes a $10,000 investment in the Russell 1000 Growth Index (the “Index”). The Fund’s per share NAV is the value of one share of the Fund and is calculated by dividing the value of total assets less total liabilities by the number of shares outstanding. The NAV return is based on the NAV of the Fund. The Russell 1000 Growth Index measures the performance of those Russell 1000 Index companies with the higher price-to book ratios and higher forecasted growth values. (A price-to book ratio is the ratio is the price of a stock compared to the difference between a company’s assets and liabilities.) The Russell 1000 Index measures the performance of the large-cap segment of the U.S. equity universe. It is a subset of the Russell 3000 Index and includes approximately 1,000 of the largest securities based on a combination of their market cap and current index membership. The Russell 1000 Index represents approximately 90% of the U.S market. The Index is not subject to the same management and trading expenses as a fund. An index is a statistical composite that tracks a specified financial market, sector, or rules-based investment process. Unlike a fund, an index does not actually hold a portfolio of securities and therefore does not incur the expenses incurred by a fund. These expenses negatively impact fund performance. All index performance reflects no deductions for fees, expenses or taxes. Please note that an investor cannot invest directly in an index. |
| ClearBridge Large Cap Growth ESG ETF 2021 Annual Report |
13 |
November 30, 2021
ClearBridge Large Cap Growth ESG ETF
(Percentages shown based on Fund net assets)
| Security | Shares | Value | ||||||
| Common Stocks — 97.4% | ||||||||
| Communication Services — 11.2% | ||||||||
| Entertainment — 5.4% |
||||||||
| Netflix Inc. |
6,610 | $ 4,242,959 | * | |||||
| Sea Ltd., ADR |
7,675 | 2,210,937 | * | |||||
| Walt Disney Co. |
22,764 | 3,298,504 | * | |||||
| Total Entertainment |
9,752,400 | |||||||
| Interactive Media & Services — 5.8% |
||||||||
| Meta Platforms Inc., Class A Shares |
32,647 | 10,592,645 | * | |||||
| Total Communication Services |
20,345,045 | |||||||
| Consumer Discretionary — 18.2% | ||||||||
| Auto Components — 1.4% |
||||||||
| Aptiv PLC |
16,280 | 2,610,498 | * | |||||
| Internet & Direct Marketing Retail — 8.1% |
||||||||
| Amazon.com Inc. |
4,186 | 14,680,595 | * | |||||
| Specialty Retail — 6.9% |
||||||||
| Advance Auto Parts Inc. |
11,946 | 2,636,721 | ||||||
| Home Depot Inc. |
11,273 | 4,516,077 | ||||||
| Tractor Supply Co. |
10,837 | 2,441,901 | ||||||
| Ulta Beauty Inc. |
7,623 | 2,926,851 | * | |||||
| Total Specialty Retail |
12,521,550 | |||||||
| Textiles, Apparel & Luxury Goods — 1.8% |
||||||||
| NIKE Inc., Class B Shares |
18,915 | 3,201,174 | ||||||
| Total Consumer Discretionary |
33,013,817 | |||||||
| Consumer Staples — 1.4% | ||||||||
| Beverages — 1.4% |
||||||||
| Monster Beverage Corp. |
31,818 | 2,665,712 | * | |||||
| Health Care — 12.4% | ||||||||
| Biotechnology — 0.7% |
||||||||
| BioMarin Pharmaceutical Inc. |
15,346 | 1,324,206 | * | |||||
| Health Care Equipment & Supplies — 3.6% |
||||||||
| Alcon Inc. |
28,720 | 2,251,648 | ||||||
| DexCom Inc. |
4,116 | 2,315,621 | * | |||||
| Intuitive Surgical Inc. |
6,203 | 2,011,881 | * | |||||
| Total Health Care Equipment & Supplies |
6,579,150 | |||||||
| Health Care Providers & Services — 4.8% |
||||||||
| CVS Health Corp. |
33,302 | 2,965,876 | ||||||
| UnitedHealth Group Inc. |
13,011 | 5,779,747 | ||||||
| Total Health Care Providers & Services |
8,745,623 | |||||||
See Notes to Financial Statements.
|
14 |
ClearBridge Large Cap Growth ESG ETF 2021 Annual Report |
ClearBridge Large Cap Growth ESG ETF
| (Percentages shown based on Fund net assets) | ||||||||
| Security | Shares | Value | ||||||
| Life Sciences Tools & Services — 3.3% |
||||||||
| Thermo Fisher Scientific Inc. |
9,286 | $ 5,876,459 | ||||||
| Total Health Care |
22,525,438 | |||||||
| Industrials — 11.0% | ||||||||
| Air Freight & Logistics — 2.5% |
||||||||
| United Parcel Service Inc., Class B Shares |
22,456 | 4,454,597 | ||||||
| Electrical Equipment — 1.5% |
||||||||
| Eaton Corp. PLC |
16,980 | 2,751,779 | ||||||
| Industrial Conglomerates — 1.7% |
||||||||
| Honeywell International Inc. |
15,341 | 3,102,564 | ||||||
| Professional Services — 2.2% |
||||||||
| IHS Markit Ltd. |
31,264 | 3,996,164 | ||||||
| Road & Rail — 1.4% |
||||||||
| Uber Technologies Inc. |
65,423 | 2,486,074 | * | |||||
| Trading Companies & Distributors — 1.7% |
||||||||
| W.W. Grainger Inc. |
6,505 | 3,131,572 | ||||||
| Total Industrials |
19,922,750 | |||||||
| Information Technology — 41.3% | ||||||||
| IT Services — 4.7% |
||||||||
| Fidelity National Information Services Inc. |
22,834 | 2,386,153 | ||||||
| Visa Inc., Class A Shares |
31,780 | 6,158,011 | ||||||
| Total IT Services |
8,544,164 | |||||||
| Semiconductors & Semiconductor Equipment — 9.7% |
||||||||
| ASML Holding NV, Registered Shares |
3,290 | 2,604,068 | ||||||
| NVIDIA Corp. |
28,298 | 9,246,654 | ||||||
| NXP Semiconductors NV |
10,622 | 2,372,530 | ||||||
| QUALCOMM Inc. |
19,144 | 3,456,641 | ||||||
| Total Semiconductors & Semiconductor Equipment |
17,679,893 | |||||||
| Software — 22.1% |
||||||||
| Adobe Inc. |
8,964 | 6,004,535 | * | |||||
| Atlassian Corp. PLC, Class A Shares |
9,788 | 3,683,420 | * | |||||
| Microsoft Corp. |
36,962 | 12,219,268 | ||||||
| Palo Alto Networks Inc. |
9,418 | 5,151,081 | * | |||||
| salesforce.com Inc. |
25,161 | 7,169,879 | * | |||||
| Splunk Inc. |
17,143 | 2,074,303 | * | |||||
| UiPath Inc., Class A Shares |
20,861 | 1,006,543 | * | |||||
| Workday Inc., Class A Shares |
10,048 | 2,755,463 | * | |||||
| Total Software |
40,064,492 | |||||||
See Notes to Financial Statements.
| ClearBridge Large Cap Growth ESG ETF 2021 Annual Report |
15 |
Schedule of investments (cont’d)
November 30, 2021
ClearBridge Large Cap Growth ESG ETF
| (Percentages shown based on Fund net assets)
|
||||||||||||
| Security | Shares | Value | ||||||||||
| Technology Hardware, Storage & Peripherals — 4.8% |
||||||||||||
| Apple Inc. |
53,085 | $ | 8,774,950 | |||||||||
| Total Information Technology |
75,063,499 | |||||||||||
| Materials — 0.4% | ||||||||||||
| Chemicals — 0.4% |
||||||||||||
| Ecolab Inc. |
3,146 | 696,745 | ||||||||||
| Real Estate — 1.5% | ||||||||||||
| Equity Real Estate Investment Trusts (REITs) — 1.5% |
||||||||||||
| Equinix Inc. |
3,324 | 2,699,753 | ||||||||||
| Total Investments before Short-Term Investments (Cost — $117,982,017) |
176,932,759 | |||||||||||
| Rate | ||||||||||||
| Short-Term Investments — 2.2% | ||||||||||||
| JPMorgan 100% U.S. Treasury Securities Money Market Fund, Institutional Class (Cost — $3,931,860) |
0.006 | % | 3,931,860 | 3,931,860 | ||||||||
| Total Investments — 99.6% (Cost — $121,913,877) |
180,864,619 | |||||||||||
| Other Assets in Excess of Liabilities — 0.4% |
780,669 | |||||||||||
| Total Net Assets — 100.0% |
$ | 181,645,288 | ||||||||||
| * | Non-income producing security. |
| Abbreviation(s) used in this schedule: |
| ADR — American Depositary Receipts |
See Notes to Financial Statements.
|
16 |
ClearBridge Large Cap Growth ESG ETF 2021 Annual Report |
Statement of assets and liabilities
November 30, 2021
| Assets: | ||||
| Investments, at value (Cost — $121,913,877) |
$ | 180,864,619 | ||
| Cash |
12,690 | |||
| Receivable for securities sold |
692,731 | |||
| Dividends and interest receivable |
97,248 | |||
| Receivable for Fund shares sold |
66,617 | |||
| Total Assets |
181,733,905 | |||
| Liabilities: | ||||
| Investment management fee payable |
88,617 | |||
| Total Liabilities |
88,617 | |||
| Total Net Assets | $ | 181,645,288 | ||
| Net Assets: | ||||
| Par value (Note 5) |
$ | 30 | ||
| Paid-in capital in excess of par value |
120,246,943 | |||
| Total distributable earnings (loss) |
61,398,315 | |||
| Total Net Assets | $ | 181,645,288 | ||
| Shares Outstanding | 3,000,000 | |||
| Net Asset Value | $60.55 | |||
See Notes to Financial Statements.
| ClearBridge Large Cap Growth ESG ETF 2021 Annual Report |
17 |
For the Year Ended November 30, 2021
| Investment Income: | ||||
| Dividends |
$ | 1,025,075 | ||
| Interest |
212 | |||
| Less: Foreign taxes withheld |
(5,655) | |||
| Total Investment Income |
1,019,632 | |||
| Expenses: | ||||
| Investment management fee (Note 2) |
906,352 | |||
| Total Expenses |
906,352 | |||
| Net Investment Income | 113,280 | |||
| Realized and Unrealized Gain on Investments (Notes 1 and 3): | ||||
| Net Realized Gain From Investment Transactions |
5,530,533 | |||
| Change in Net Unrealized Appreciation (Depreciation) From Investments |
28,210,940 | |||
| Net Gain on Investments | 33,741,473 | |||
| Increase in Net Assets From Operations | $ | 33,854,753 | ||
See Notes to Financial Statements.
|
18 |
ClearBridge Large Cap Growth ESG ETF 2021 Annual Report |
Statements of changes in net assets
| For the Years Ended November 30, | 2021 | 2020 | ||||||
| Operations: | ||||||||
| Net investment income |
$ | 113,280 | $ | 510,727 | ||||
| Net realized gain |
5,530,533 | 24,816,779 | ||||||
| Change in net unrealized appreciation (depreciation) |
28,210,940 | 7,864,336 | ||||||
| Increase in Net Assets From Operations |
33,854,753 | 33,191,842 | ||||||
| Distributions to Shareholders From (Note 1): | ||||||||
| Total distributable earnings |
(490,001) | (735,000) | ||||||
|
Decrease in Net Assets From Distributions to Shareholders |
(490,001) | (735,000) | ||||||
| Fund Share Transactions (Note 5): | ||||||||
| Net proceeds from sale of shares (550,000 and 1,150,000 shares issued, respectively) |
28,894,189 | 41,397,857 | ||||||
| Cost of shares repurchased (100,000 and 3,750,000 shares repurchased, respectively) |
(5,158,502) | (141,506,206) | ||||||
| Increase (Decrease) in Net Assets From Fund Share Transactions |
23,735,687 | (100,108,349) | ||||||
| Increase (Decrease) in Net Assets |
57,100,439 | (67,651,507) | ||||||
| Net Assets: | ||||||||
| Beginning of year |
124,544,849 | 192,196,356 | ||||||
| End of year |
$ | 181,645,288 | $124,544,849 | |||||
See Notes to Financial Statements.
| ClearBridge Large Cap Growth ESG ETF 2021 Annual Report |
19 |
| For a share of beneficial interest outstanding throughout each year ended November 30, unless otherwise noted: |
||||||||||||||||||||
| 20211 | 20201 | 20191 | 20181 | 20171,2 | ||||||||||||||||
| Net asset value, beginning of year | $48.84 | $37.32 | $32.09 | $28.80 | $25.18 | |||||||||||||||
| Income from operations: | ||||||||||||||||||||
| Net investment income |
0.04 | 0.13 | 0.18 | 0.16 | 0.08 | |||||||||||||||
| Net realized and unrealized gain |
11.85 | 11.53 | 5.66 | 3.24 | 3.54 | |||||||||||||||
| Total income from operations |
11.89 | 11.66 | 5.84 | 3.40 | 3.62 | |||||||||||||||
| Less distributions from: | ||||||||||||||||||||
| Net investment income |
(0.18) | (0.14) | (0.16) | (0.11) | — | |||||||||||||||
| Net realized gains |
— | — | (0.45) | — | — | |||||||||||||||
| Total distributions |
(0.18) | (0.14) | (0.61) | (0.11) | — | |||||||||||||||
| Net asset value, end of year | $60.55 | $48.84 | $37.32 | $32.09 | $28.80 | |||||||||||||||
| Total return, based on NAV3 |
24.44 | % | 31.35 | % | 18.80 | % | 11.84 | % | 14.38 | % | ||||||||||
| Net assets, end of year (000s) | $181,645 | $124,545 | $192,196 | $6,419 | $2,880 | |||||||||||||||
| Ratios to average net assets: | ||||||||||||||||||||
| Gross expenses |
0.59 | % | 0.59 | % | 0.59 | % | 0.59 | % | 0.59 | %4 | ||||||||||
| Net expenses |
0.59 | 0.59 | 0.59 | 0.59 | 0.59 | 4 | ||||||||||||||
| Net investment income |
0.07 | 0.34 | 0.53 | 0.52 | 0.54 | 4 | ||||||||||||||
| Portfolio turnover rate5 | 18 | % | 21 | % | 21 | % | 20 | % | 7 | % | ||||||||||
| 1 | Per share amounts have been calculated using the average shares method. |
| 2 | For the period May 22, 2017 (inception date) to November 30, 2017. |
| 3 | Performance figures may reflect fee waivers and/or expense reimbursements. In the absence of fee waivers and/or expense reimbursements, the total return would have been lower. The total return calculation assumes that distributions are reinvested at NAV. Past performance is no guarantee of future results. Total returns for periods of less than one year are not annualized. |
| 4 | Annualized. |
| 5 | Portfolio turnover excludes the value of portfolio securities received or delivered as a result of in-kind fund share transactions. |
See Notes to Financial Statements.
|
20 |
ClearBridge Large Cap Growth ESG ETF 2021 Annual Report |
1.Organization and significant accounting policies
ClearBridge Large Cap Growth ESG ETF (the “Fund”) is a separate diversified investment series of Legg Mason ETF Investment Trust (the “Trust”). The Trust, a Maryland statutory trust, is registered under the Investment Company Act of 1940, as amended (the “1940 Act”), as an open-end management investment company.
The Fund is an actively managed exchange-traded fund (“ETF”). ETFs are funds that trade like other publicly-traded securities. Unlike shares of a mutual fund, which can be bought from and redeemed by the issuing fund by all shareholders at a price based on net asset value (“NAV”), shares of the Fund may be directly purchased from and redeemed by the Fund at NAV solely by certain large institutional investors who have entered into agreements with the Fund’s distributor (“Authorized Participants”). Also unlike shares of a mutual fund, shares of the Fund are listed on a national securities exchange and trade in the secondary market at market prices that change throughout the day.
Shares of the Fund are listed and traded at market prices on NASDAQ. The market price for the Fund’s shares may be different from the Fund’s NAV. The Fund issues and redeems shares at NAV only in blocks of a specified number of shares or multiples thereof (“Creation Units”). Only Authorized Participants may purchase or redeem Creation Units directly with the Fund at NAV. Creation Units are created and redeemed principally in-kind (although under some circumstances its shares are created and redeemed partially for cash). Except when aggregated in Creation Units, shares of the Fund are not redeemable securities. Shareholders who are not Authorized Participants may not redeem shares directly from the Fund at NAV.
The Fund seeks long-term capital appreciation through investing in large-capitalization companies with the potential for high future earnings growth.
The following are significant accounting policies consistently followed by the Fund and are in conformity with U.S. generally accepted accounting principles (“GAAP”). Estimates and assumptions are required to be made regarding assets, liabilities and changes in net assets resulting from operations when financial statements are prepared. Changes in the economic environment, financial markets and any other parameters used in determining these estimates could cause actual results to differ. Subsequent events have been evaluated through the date the financial statements were issued.
(a) Investment valuation. Equity securities for which market quotations are available are valued at the last reported sales price or official closing price on the primary market or exchange on which they trade. The valuations for fixed income securities (which may include, but are not limited to, corporate, government, municipal, mortgage-backed, collateralized mortgage obligations and asset-backed securities) and certain derivative instruments are typically the prices supplied by independent third party pricing services, which may use market prices or broker/dealer quotations or a variety of valuation techniques and methodologies. The independent third party pricing services typically use inputs that are observable such as issuer details, interest rates, yield curves, prepayment speeds, credit risks/spreads, default rates and quoted prices for similar securities. Investments in open-end funds are valued at the closing net asset value per share of each fund on the day of valuation. When the Fund holds securities or other assets that are denominated in a foreign currency, the Fund will use the currency exchange rates, generally determined as of 4:00 p.m. (London Time). If independent third party pricing services are
| ClearBridge Large Cap Growth ESG ETF 2021 Annual Report |
21 |
Notes to financial statements (cont’d)
unable to supply prices for a portfolio investment, or if the prices supplied are deemed by the manager to be unreliable, the market price may be determined by the manager using quotations from one or more broker/dealers or at the transaction price if the security has recently been purchased and no value has yet been obtained from a pricing service or pricing broker. When reliable prices are not readily available, such as when the value of a security has been significantly affected by events after the close of the exchange or market on which the security is principally traded, but before the Fund calculates its net asset value, the Fund values these securities as determined in accordance with procedures approved by the Fund’s Board of Trustees.
The Board of Trustees is responsible for the valuation process and has delegated the supervision of the daily valuation process to the Global Fund Valuation Committee (known as Legg Mason North Atlantic Fund Valuation Committee prior to March 1, 2021) (the “Valuation Committee”). The Valuation Committee, pursuant to the policies adopted by the Board of Trustees, is responsible for making fair value determinations, evaluating the effectiveness of the Fund’s pricing policies, and reporting to the Board of Trustees. When determining the reliability of third party pricing information for investments owned by the Fund, the Valuation Committee, among other things, conducts due diligence reviews of pricing vendors, monitors the daily change in prices and reviews transactions among market participants.
The Valuation Committee will consider pricing methodologies it deems relevant and appropriate when making fair value determinations. Examples of possible methodologies include, but are not limited to, multiple of earnings; discount from market of a similar freely traded security; discounted cash-flow analysis; book value or a multiple thereof; risk premium/yield analysis; yield to maturity; and/or fundamental investment analysis. The Valuation Committee will also consider factors it deems relevant and appropriate in light of the facts and circumstances. Examples of possible factors include, but are not limited to, the type of security; the issuer’s financial statements; the purchase price of the security; the discount from market value of unrestricted securities of the same class at the time of purchase; analysts’ research and observations from financial institutions; information regarding any transactions or offers with respect to the security; the existence of merger proposals or tender offers affecting the security; the price and extent of public trading in similar securities of the issuer or comparable companies; and the existence of a shelf registration for restricted securities.
For each portfolio security that has been fair valued pursuant to the policies adopted by the Board of Trustees, the fair value price is compared against the last available and next available market quotations. The Valuation Committee reviews the results of such back testing monthly and fair valuation occurrences are reported to the Board of Trustees quarterly.
The Fund uses valuation techniques to measure fair value that are consistent with the market approach and/or income approach, depending on the type of security and the particular circumstance. The market approach uses prices and other relevant information generated by market transactions involving identical or comparable securities. The income approach uses valuation techniques to discount estimated future cash flows to present value.
|
22 |
ClearBridge Large Cap Growth ESG ETF 2021 Annual Report |
GAAP establishes a disclosure hierarchy that categorizes the inputs to valuation techniques used to value assets and liabilities at measurement date. These inputs are summarized in the three broad levels listed below:
| • | Level 1 — quoted prices in active markets for identical investments |
| • | Level 2 — other significant observable inputs (including quoted prices for similar investments, interest rates, prepayment speeds, credit risk, etc.) |
| • | Level 3 — significant unobservable inputs (including the Fund’s own assumptions in determining the fair value of investments) |
The inputs or methodologies used to value securities are not necessarily an indication of the risk associated with investing in those securities.
The following is a summary of the inputs used in valuing the Fund’s assets carried at fair value:
| ASSETS |
||||||||||||
| Description | Quoted Prices (Level 1) |
Other Significant Observable Inputs (Level 2) |
Significant Unobservable Inputs (Level 3) |
Total | ||||||||
| Common Stocks† | $ | 176,932,759 | — | — | $ | 176,932,759 | ||||||
| Short-Term Investments† | 3,931,860 | — | — | 3,931,860 | ||||||||
| Total Investments | $ | 180,864,619 | — | — | $ | 180,864,619 | ||||||
| † | See Schedule of Investments for additional detailed categorizations. |
(b) Foreign investment risks. The Fund’s investments in foreign securities may involve risks not present in domestic investments. Since securities may be denominated in foreign currencies, may require settlement in foreign currencies or may pay interest or dividends in foreign currencies, changes in the relationship of these foreign currencies to the U.S. dollar can significantly affect the value of the investments and earnings of the Fund. Foreign investments may also subject the Fund to foreign government exchange restrictions, expropriation, taxation or other political, social or economic developments, all of which affect the market and/or credit risk of the investments.
(c) Security transactions and investment income. Security transactions are accounted for on a trade date basis. Interest income (including interest income from payment-in-kind securities), adjusted for amortization of premium and accretion of discount, is recorded on the accrual basis. Dividend income is recorded on the ex-dividend date for dividends received in cash and/or securities. The cost of investments sold is determined by use of the specific identification method. To the extent any issuer defaults or a credit event occurs that impacts the issuer, the Fund may halt any additional interest income accruals and consider the realizability of interest accrued up to the date of default or credit event.
(d) REIT distributions. The character of distributions received from Real Estate Investment Trusts (‘‘REITs’’) held by the Fund is generally comprised of net investment income, capital gains, and return of capital. It is the policy of the Fund to estimate the character of distributions received from underlying REITs based on historical data provided by the REITs. After each calendar year end, REITs report the actual tax character of these distributions. Differences between the estimated and actual amounts reported by the REITs are reflected
| ClearBridge Large Cap Growth ESG ETF 2021 Annual Report |
23 |
Notes to financial statements (cont’d)
in the Fund’s records in the year in which they are reported by the REITs by adjusting related investment cost basis, capital gains and income, as necessary.
(e) Distributions to shareholders. Distributions from net investment income and distributions of net realized gains, if any, are declared at least annually. Distributions to shareholders of the Fund are recorded on the ex-dividend date and are determined in accordance with income tax regulations, which may differ from GAAP.
(f) Federal and other taxes. It is the Fund’s policy to comply with the federal income and excise tax requirements of the Internal Revenue Code of 1986 (the “Code”), as amended, applicable to regulated investment companies. Accordingly, the Fund intends to distribute its taxable income and net realized gains, if any, to shareholders in accordance with timing requirements imposed by the Code. Therefore, no federal or state income tax provision is required in the Fund’s financial statements.
Management has analyzed the Fund’s tax positions taken on income tax returns for all open tax years and has concluded that as of November 30, 2021, no provision for income tax is required in the Fund’s financial statements. The Fund’s federal and state income and federal excise tax returns for tax years for which the applicable statutes of limitations have not expired are subject to examination by the Internal Revenue Service and state departments of revenue.
Under the applicable foreign tax laws, a withholding tax may be imposed on interest, dividends and capital gains at various rates.
(g) Reclassification. GAAP requires that certain components of net assets be reclassified to reflect permanent differences between financial and tax reporting. These reclassifications have no effect on net assets or net asset value per share. During the current year, the following reclassifications have been made:
| Total Distributable Earnings (Loss) |
Paid-in Capital |
|||||||
| (a) | $ | (1,825,659) | $ | 1,825,659 | ||||
| (a) | Reclassifications are due to book/tax differences in the treatment of an in-kind distribution of securities. |
2. Investment management agreement and other transactions with affiliates
Legg Mason Partners Fund Advisor, LLC (“LMPFA”) is the Fund’s investment manager and ClearBridge Investments, LLC (“ClearBridge”) is the Fund’s subadviser. Western Asset Management Company, LLC (“Western Asset”) manages the portion of the Fund’s cash and short-term instruments allocated to it. LMPFA, ClearBridge and Western Asset are indirect, wholly-owned subsidiaries of Franklin Resources, Inc. (“Franklin Resources”).
LMPFA provides administrative and certain oversight services to the Fund. LMPFA delegates to the subadviser the day-to-day portfolio management of the Fund. The Fund is responsible for paying interest expenses, taxes, brokerage expenses, future 12b-1 fees (if any), acquired fund fees and expenses, extraordinary expenses and the management fee payable to LMPFA under the investment management agreement.
Under the investment management agreement and subject to the general supervision of the Fund’s Board of Trustees, LMPFA provides or causes to be furnished all investment management, supervisory, administrative and other services reasonably necessary for the
|
24 |
ClearBridge Large Cap Growth ESG ETF 2021 Annual Report |
operation of the Fund, including certain distribution services (provided pursuant to a separate distribution agreement) and investment advisory services (provided pursuant to separate subadvisory agreements) under a unitary fee structure. The Fund pays an investment management fee, calculated daily and paid monthly, at an annual rate of 0.59% of the Fund’s average daily net assets.
As compensation for its subadvisory services, LMPFA pays ClearBridge a fee monthly, at an annual rate equal to 70% of the management fee paid by the Fund to LMPFA, net of (i) all fees and expenses incurred by LMPFA under the investment management agreement (including without limitation any subadvisory fee paid to another subadviser to the Fund) and (ii) expense waivers, if any, and reimbursements. LMPFA pays Western Asset monthly a fee of 0.02% of the portion of the Fund’s average daily net assets allocated to Western Asset for the management of cash and other short-term instruments, net of expense waivers, if any, and reimbursements.
Franklin Distributors, LLC (known as Legg Mason Investor Services, LLC prior to July 7, 2021) (“Franklin Distributors”) serves as the distributor of Creation Units for the Fund on an agency basis. Franklin Distributors is an indirect, wholly-owned broker-dealer subsidiary of Franklin Resources.
The Fund’s Board of Trustees has adopted a Rule 12b-1 shareholder services and distribution plan and under that plan, the Fund is authorized to pay service and/or distribution fees calculated at an annual rate of up to 0.25% of its average daily net assets. No service and/or distribution fees are currently paid by the Fund, and there are no current plans to impose these fees.
All officers and one Trustee of the Trust are employees of Franklin Resources or its affiliates and do not receive compensation from the Trust.
3. Investments
During the year ended November 30, 2021, the aggregate cost of purchases and proceeds from sales of investments (excluding in-kind transactions and short-term investments) were as follows:
| Purchases | $ | 27,445,101 | ||
| Sales | 29,825,849 |
During the year ended November 30, 2021, in-kind transactions (Note 5) were as follows:
| Contributions | $ | 28,284,855 | ||
| Redemptions | 5,011,763 | |||
| Realized gain (loss)* | 1,831,208 |
| * | Net realized gains on redemptions in-kind are not taxable to the remaining shareholders of the Fund. |
The in-kind contributions and in-kind redemptions shown in this table may not agree with the Fund Share Transactions on the Statement of Changes in Net Assets. This table represents the accumulation of the Fund’s daily net shareholder transactions while the Statement of Changes in Net Assets reflects gross shareholder transactions including any cash component of the transactions.
| ClearBridge Large Cap Growth ESG ETF 2021 Annual Report |
25 |
Notes to financial statements (cont’d)
At November 30, 2021, the aggregate cost of investments and the aggregate gross unrealized appreciation and depreciation of investments for federal income tax purposes were as follows:
| Cost | Gross Unrealized Appreciation |
Gross Unrealized Depreciation |
Net Unrealized Appreciation |
|||||||||||||
| Securities | $ | 121,990,858 | $ | 61,010,562 | $ | (2,136,801) | $ | 58,873,761 | ||||||||
4. Derivative instruments and hedging activities
During the year ended November 30, 2021, the Fund did not invest in derivative instruments.
5. Fund share transactions
At November 30, 2021, the Trust had an unlimited number of shares of beneficial interest authorized with a par value of $0.00001 per share. Fund shares are issued and redeemed by the Fund only in Creation Units or Creation Unit aggregations, where 50,000 shares of the Fund constitute a Creation Unit. Such transactions are made principally on an in-kind basis and, under some circumstances partially on a cash basis, with a separate cash payment, which is a balancing cash component to equate the transaction to the net asset value per share of the Fund on the transaction date. Transactions in capital shares of the Fund are disclosed in detail in the Statement of Changes in Net Assets. Authorized Participants are subject to standard creation and redemption transaction fees to offset transfer and other transaction costs associated with the issuance and redemption of Creation Units. Creations and redemptions for cash (when cash creations and redemptions are available or specified) may be subject to an additional variable fee.
6. Income tax information and distributions to shareholders
The tax character of distributions paid during the fiscal years ended November 30, was as follows:
| 2021 | 2020 | |||||||
| Distributions paid from: | ||||||||
| Ordinary income | $ | 490,001 | $ | 735,000 | ||||
As of November 30, 2021, the components of distributable earnings (loss) on a tax basis were as follows:
| Undistributed ordinary income — net | $ | 691,875 | ||
| Undistributed long-term capital gains — net | 1,832,679 | |||
| Total undistributed earnings | $ | 2,524,554 | ||
| Unrealized appreciation (depreciation)(a) | 58,873,761 | |||
| Total distributable earnings (loss) — net | $ | 61,398,315 |
| (a) | The difference between book-basis and tax-basis unrealized appreciation (depreciation) is attributable to the tax deferral of losses on wash sales. |
7. Recent accounting pronouncement
In March 2020, the Financial Accounting Standards Board (FASB) issued Accounting Standards Update (ASU) No. 2020-04, Reference Rate Reform (Topic 848) – Facilitation of the Effects of Reference Rate Reform on Financial Reporting. In January 2021, the FASB
|
26 |
ClearBridge Large Cap Growth ESG ETF 2021 Annual Report |
issued ASU No. 2021-01, with further amendments to Topic 848. The amendments in the ASUs provide optional temporary accounting recognition and financial reporting relief from the effect of certain types of contract modifications due to the planned discontinuation of the LIBOR and other interbank-offered based reference rates as of the end of 2021 and 2023. The ASUs are effective for certain reference rate-related contract modifications that occur during the period March 12, 2020 through December 31, 2022. Management has reviewed the requirements and believes the adoption of these ASUs will not have a material impact on the financial statements.
8. Other matter
The outbreak of the respiratory illness COVID-19 (commonly referred to as “coronavirus”) has continued to rapidly spread around the world, causing considerable uncertainty for the global economy and financial markets. The ultimate economic fallout from the pandemic, and the long-term impact on economies, markets, industries and individual issuers, are not known. The COVID-19 pandemic could adversely affect the value and liquidity of the Fund’s investments, impair the Fund’s ability to satisfy redemption requests, and negatively impact the Fund’s performance. In addition, the outbreak of COVID-19, and measures taken to mitigate its effects, could result in disruptions to the services provided to the Fund by its service providers.
9. Subsequent event
In September 2021, the Fund’s Board of Trustees approved changing the Fund’s fiscal year end from November 30th to March 31st.
| ClearBridge Large Cap Growth ESG ETF 2021 Annual Report |
27 |
Report of independent registered public accounting firm
To the Board of Trustees of Legg Mason ETF Investment Trust and Shareholders of ClearBridge Large Cap Growth ESG ETF
Opinion on the Financial Statements
We have audited the accompanying statement of assets and liabilities, including the schedule of investments, of ClearBridge Large Cap Growth ESG ETF (one of the funds constituting Legg Mason ETF Investment Trust, referred to hereafter as the “Fund”) as of November 30, 2021, the related statement of operations for the year ended November 30, 2021, the statement of changes in net assets for each of the two years in the period ended November 30, 2021, including the related notes, and the financial highlights for each of the four years in the period ended November 30, 2021 and for the period May 22, 2017 (inception date) through November 30, 2017 (collectively referred to as the “financial statements”). In our opinion, the financial statements present fairly, in all material respects, the financial position of the Fund as of November 30, 2021, the results of its operations for the year then ended, the changes in its net assets for each of the two years in the period ended November 30,2021 and the financial highlights for each of the four years in the period ended November 30, 2021 and for the period May 22, 2017 (inception date) through November 30, 2017 in conformity with accounting principles generally accepted in the United States of America.
Basis for Opinion
These financial statements are the responsibility of the Fund’s management. Our responsibility is to express an opinion on the Fund’s financial statements based on our audits. We are a public accounting firm registered with the Public Company Accounting Oversight Board (United States) (PCAOB) and are required to be independent with respect to the Fund in accordance with the U.S. federal securities laws and the applicable rules and regulations of the Securities and Exchange Commission and the PCAOB.
We conducted our audits of these financial statements in accordance with the standards of the PCAOB. Those standards require that we plan and perform the audit to obtain reasonable assurance about whether the financial statements are free of material misstatement, whether due to error or fraud.
Our audits included performing procedures to assess the risks of material misstatement of the financial statements, whether due to error or fraud, and performing procedures that respond to those risks. Such procedures included examining, on a test basis, evidence regarding the amounts and disclosures in the financial statements. Our audits also included evaluating the accounting principles used and significant estimates made by management, as well as evaluating the overall presentation of the financial statements. Our procedures included confirmation of securities owned as of November 30, 2021 by correspondence with the custodian. We believe that our audits provide a reasonable basis for our opinion.
PricewaterhouseCoopers LLP
Baltimore, Maryland
January 19, 2022
We have served as the auditor of one or more investment companies in the Franklin Templeton Group of Funds since 1948.
|
28 |
ClearBridge Large Cap Growth ESG ETF 2021 Annual Report |
Statement regarding liquidity risk management program (unaudited)
Each of the Funds has adopted and implemented a written Liquidity Risk Management Program (the “LRMP”) as required by Rule 22e-4 under the Investment Company Act of 1940 (the “Liquidity Rule”). The LRMP is designed to assess and manage each Fund’s liquidity risk, which is defined as the risk that the Fund could not meet requests to redeem shares issued by the Fund without significant dilution of remaining investors’ interests in the Fund. Each of the Funds is an exchange-traded fund (“ETF”) that is considered an “In-Kind ETF” under the Liquidity Rule, which means that the Fund satisfies requests for redemption through in-kind transfers of portfolio securities, positions, and other assets, except for a de minimis amount of cash, and publishes its portfolio holdings daily. In accordance with the Liquidity Rule, the LRMP includes policies and procedures that provide for: (1) assessment, management, and review (no less frequently than annually) of each Fund’s liquidity risk; (2) prohibiting the Fund’s acquisition of Illiquid investments that would result in the Fund holding more than 15% of its net assets in Illiquid assets. The LRMP also requires reporting to the SEC (on a non-public basis) and to the Board if the Fund’s holdings of Illiquid assets exceed 15% of the Fund’s net assets. As an In-Kind ETF, the Fund is not required to include in the LRMP policies and procedures relating to classification of portfolio holdings into four liquidity categories or establishing a highly liquid investment minimum (“HLIM”).
The Funds’ Board of Trustees approved the appointment of the Director of Liquidity Risk within the Investment Risk Management Group (the “IRMG”) as the Administrator of the LRMP. The IRMG maintains the Investment Liquidity Committee (the “ILC”) to provide oversight and administration of policies and procedures governing liquidity risk management for FT products and portfolios. The ILC includes representatives from Franklin Templeton’s Risk, Trading, Global Compliance, Legal, Investment Compliance, Investment Operations, Valuation Committee, Product Management and Global Product Strategy.
In assessing and managing each Fund’s liquidity risk, the ILC considers, as relevant, a variety of factors, including the Fund’s investment strategy and the liquidity of its portfolio investments during both normal and reasonably foreseeable stressed conditions; its short and long-term cash flow projections; and its cash holdings and access to other funding sources including the Funds’ interfund lending facility and line of credit. Because the Funds are ETFs, the ILC also considers, as relevant, (1) the relationship between the Fund’s portfolio liquidity and the way in which, and the prices and spread at which, Fund shares trade, including the efficiency of the arbitrage function and the level of active participation by market participants, including authorized participants and (2) the effect of the composition of baskets on the overall liquidity of the Fund’s portfolio.
| ClearBridge Large Cap Growth ESG ETF |
29 |
Additional information (unaudited)
Information about Trustees and Officers
The business and affairs of ClearBridge Large Cap Growth ESG ETF (the “Fund”) are conducted by management under the supervision and subject to the direction of its Board of Trustees. The business address of each Trustee is One Franklin Parkway, San Mateo, California 94403-1906. Information pertaining to the Trustees and officers of the Fund is set forth below.
The Statement of Additional Information includes additional information about Trustees and is available, without charge, upon request by calling the Fund at 1-877-721-1926.
| Independent Trustees† | ||
| Rohit Bhagat | ||
| Year of birth | 1964 | |
| Position(s) with Trust | Lead Independent Trustee | |
| Term of office1 and length of time served2 | Since July 2021 | |
| Principal occupation(s) during the past five years | Managing Member, Mukt Capital, LLC (private investment firm) (2014-present); Advisor, Optimal Asset Management (investment technology and advisory services company) (2015- present); and formerly, Chairman, Asia Pacific, BlackRock (2009- 2012); Global Chief Operating Officer, Barclays Global Investors (investment management) (2005-2009); and Senior Partner, The Boston Consulting Group (management consulting) (1992-2005). | |
| Number of funds in fund complex overseen by Trustee | 59 | |
| Other Directorships held by Trustee during the past five years | AssetMark Financial Holdings, Inc. (investment solutions) (2018- present) and PhonePe (payment and financial services) (2020- present); and formerly, Axis Bank (financial) (2013-2021), FlipKart Limited (eCommerce company) (2019-2020), CapFloat Financial Services Pvt., Ltd. (non-banking finance company) (2018) and Zentific Investment Management (hedge fund) (2015-2018). | |
| Deborah D. McWhinney | ||
| Year of birth | 1955 | |
| Position(s) with Trust | Trustee | |
| Term of office1 and length of time served2 | Since July 2021 | |
| Principal occupation(s) during the past five years | Director of various companies; and formerly, Board Member, Lloyds Banking Group (2015-2018) (financial institution) and Fresenius Medical Group (2016-2018) (healthcare); Chief Executive Officer (2013-2014) and Chief Operating Officer (2011- 2013), CitiGroup Global Enterprise Payments (financial services); and President, Citi’s Personal Banking and Wealth Management (2009-2011). | |
| Number of funds in fund complex overseen by Trustee | 59 | |
| Other Directorships held by Trustee during the past five years | IHS Markit (information services) (2015-present), Borg Warner (automotive) (2018-present) and LegalShield (consumer services) (2020-present); and formerly, Fluor Corporation (construction and engineering) (2014-2020) and Focus Financial Partners, LLC (financial services) (2018-2020). | |
|
30 |
ClearBridge Large Cap Growth ESG ETF |
| Independent Trustees† (cont’d) | ||
| Anantha K. Pradeep | ||
| Year of birth | 1963 | |
| Position(s) with Trust | Trustee | |
| Term of office1 and length of time served2 | Since July 2021 | |
| Principal occupation(s) during the past five years | Chief Executive Officer, Smilable, Inc. (technology company) (2014-present); Chief Executive Officer, MachineVantage (technology company) (2018-present); Founder and Managing Partner, Consult Meridian, LLC (consulting company) (2009- present); and formerly, Founder, BoardVantage (board portal solutions provider delivering paperless process for boards and leadership) (2000-2002). | |
| Number of funds in fund complex overseen by Trustee | 59 | |
| Other Directorships held by Trustee during the past five years | None | |
| Interested Trustee and Officer | ||
| Jennifer M. Johnson3* | ||
| Year of birth | 1964 | |
| Position(s) with Trust | Trustee and Chairperson of the Board | |
| Term of office1 and length of time served2 | Since July 2021 | |
| Principal occupation(s) during the past five years | Chief Executive Officer, President and Director, Franklin Resources, Inc.; officer and/or director or trustee, as the case may be, of some of the other subsidiaries of Franklin Resources, Inc. and of eight of the investment companies in Franklin Templeton; and formerly, Chief Operating Officer and Executive Vice President, Franklin Resources, Inc. (1994-2015); Executive Vice President of Operations and Technology, Franklin Resources, Inc. (2005-2010); and Senior Vice President, Franklin Resources, Inc. (2003-2005). | |
| Number of funds in fund complex overseen by Trustee | 70 | |
| Other Directorships held by Trustee during the past five years | None | |
| Additional Officers | ||
| Alison E. Baur Franklin Templeton One Franklin Parkway, San Mateo, CA 94403-1906 | ||
| Year of birth | 1964 | |
| Position(s) with Trust | Vice President | |
| Term of office1 and length of time served2 | Since July 2021 | |
| Principal occupation(s) during the past five years | Deputy General Counsel, Franklin Templeton; and officer of some of the other subsidiaries of Franklin Resources, Inc. and of 44 of the investment companies in Franklin Templeton. | |
| ClearBridge Large Cap Growth ESG ETF |
31 |
Additional information (unaudited) (cont’d)
Information about Trustees and Officers
| Additional Officers (cont’d) | ||
| Fred Jensen Franklin Templeton 620 Eighth Avenue, 47th Floor, New York, NY 10018 | ||
| Year of birth | 1963 | |
| Position(s) with Trust | Chief Compliance Officer | |
| Term of office1 and length of time served2 | Since July 2021 | |
| Principal occupation(s) during the past five years | Director — Global Compliance of Franklin Templeton (since 2020); Managing Director of Legg Mason & Co. (2006 to 2020); Director of Compliance, Legg Mason Office of the Chief Compliance Officer (2006 to 2020); formerly, Chief Compliance Officer of Legg Mason Global Asset Allocation (prior to 2014); Chief Compliance Officer of Legg Mason Private Portfolio Group (prior to 2013); formerly, Chief Compliance Officer of The Reserve Funds (investment adviser, funds and broker-dealer) (2004) and Ambac Financial Group (investment adviser, funds and broker-dealer) (2000 to 2003). | |
| Harris Goldblat Franklin Templeton 100 First Stamford Place, 6th Floor, Stamford, CT 06902 | ||
| Year of birth | 1969 | |
| Position(s) with Trust | Vice President and Assistant Secretary | |
| Term of office1 and length of time served2 | Since July 2021 | |
| Principal occupation(s) during the past five years | Associate General Counsel to Franklin Templeton (since 2020); Assistant Secretary of certain funds associated with Legg Mason & Co. or its affiliates (since 2006); formerly, Managing Director and Associate General Counsel of Legg Mason & Co. (2005 to 2020). | |
| Steven J. Gray Franklin Templeton One Franklin Parkway, San Mateo, CA 94403-1906 | ||
| Year of birth | 1955 | |
| Position(s) with Trust | Vice President | |
| Term of office1 and length of time served2 | Since July 2021 | |
| Principal occupation(s) during the past five years | Senior Associate General Counsel, Franklin Templeton; Vice President, Franklin Templeton Distributors, Inc. and FASA, LLC; and officer of 44 of the investment companies in Franklin Templeton. | |
|
32 |
ClearBridge Large Cap Growth ESG ETF |
| Additional Officers (cont’d) | ||
| Matthew T. Hinkle Franklin Templeton One Franklin Parkway, San Mateo, CA 94403-1906 | ||
| Year of birth | 1971 | |
| Position(s) with Trust | Chief Executive Officer – Finance and Administration | |
| Term of office1 and length of time served2 | Since July 2021 | |
| Principal occupation(s) during the past five years | Senior Vice President, Franklin Templeton Services, LLC; officer of 44 of the investment companies in Franklin Templeton; and formerly, Vice President, Global Tax (2012-April 2017) and Treasurer/Assistant Treasurer, Franklin Templeton (2009-2017). | |
| Susan Kerr Franklin Templeton 620 Eighth Avenue, 47th Floor, New York, NY 10018 | ||
| Year of birth | 1949 | |
| Position(s) with Trust | Vice President – AML Compliance | |
| Term of office1 and length of time served2 | Since July 2021 | |
| Principal occupation(s) during the past five years | Senior Compliance Analyst, Franklin Templeton (since 2020); Chief Anti-Money Laundering Compliance Officer of certain funds associated with Legg Mason & Co. or its affiliates (since 2013) and Anti-Money Laundering Compliance Officer (since 2012), Senior Compliance Officer (since 2011) and Assistant Vice President (since 2010) of Franklin Distributors, LLC; formerly, Assistant Vice President of Legg Mason & Co. (2010 to 2020) | |
| Thomas C. Mandia Franklin Templeton 100 First Stamford Place, 6th Floor, Stamford, CT 06902 | ||
| Year of birth | 1962 | |
| Position(s) with Trust | Vice President and Assistant Secretary | |
| Term of office1 and length of time served2 | Since July 2021 | |
| Principal occupation(s) during the past five years | Senior Associate General Counsel to Franklin Templeton (since 2020); Secretary of LMPFA (since 2006); Assistant Secretary of certain funds associated with Legg Mason & Co. or its affiliates (since 2006); Secretary of LMAS (since 2002) and LMFAM (formerly registered investment advisers) (since 2013); formerly, Managing Director and Deputy General Counsel of Legg Mason & Co. (2005 to 2020). | |
| ClearBridge Large Cap Growth ESG ETF |
33 |
Additional information (unaudited) (cont’d)
Information about Trustees and Officers
| Additional Officers (cont’d) | ||
| Patrick O’Connor One Franklin Parkway, San Mateo, CA 94403-1906 |
||
| Year of birth | 1967 | |
| Position(s) with Trust | President and Chief Executive Officer – Investment Management | |
| Term of office1 and length of time served2 | Since July 2021 | |
| Principal occupation(s) during the past five years | President and Chief Investment Officer, Franklin Advisory Services, LLC; Senior Vice President, Franklin Advisers, Inc.; officer of five of the investment companies in Franklin Templeton; and formerly, Managing Director, Head of iShares Product Canada, BlackRock (1998-2014). | |
| Vivek Pai 300 S.E. 2nd Street, Fort Lauderdale, FL 33301-1923 |
||
| Year of birth | 1970 | |
| Position(s) with Trust | Treasurer, Chief Financial Officer and Chief Accounting Officer | |
| Term of office1 and length of time served2 | Since July 2021 | |
| Principal occupation(s) during the past five years | Treasurer, U.S. Fund Administration & Reporting and officer of five of the investment companies in Franklin Templeton. | |
| Navid J. Tofigh One Franklin Parkway, San Mateo, CA 94403-1906 |
||
| Year of birth | 1972 | |
| Position(s) with Trust | Vice President and Secretary | |
| Term of office1 and length of time served2 | Since July 2021 | |
| Principal occupation(s) during the past five years | Associate General Counsel and officer of 44 of the investment companies in Franklin Templeton. | |
| Craig S. Tyle Franklin Templeton One Franklin Parkway, San Mateo, CA 94403-1906 | ||
| Year of birth | 1960 | |
| Position(s) with Trust | Vice President | |
| Term of office1 and length of time served2 | Since July 2021 | |
| Principal occupation(s) during the past five years | General Counsel and Executive Vice President, Franklin Resources, Inc.; and officer of some of the other subsidiaries of Franklin Resources, Inc. and of 44 of the investment companies in Franklin Templeton. | |
|
34 |
ClearBridge Large Cap Growth ESG ETF |
| Additional Officers (cont’d) | ||
| Lori A. Weber 300 S.E. 2nd Street, Fort Lauderdale, FL 33301-1923 |
||
| Year of birth | 1964 | |
| Position(s) with Trust | Vice President | |
| Term of office1 and length of time served2 | Since July 2021 | |
| Principal occupation(s) during the past five years | Senior Associate General Counsel, Franklin Templeton; Assistant Secretary, Franklin Resources, Inc.; Vice President and Secretary, Templeton Investment Counsel, LLC; and officer of 44 of the investment companies in Franklin Templeton. | |
| ClearBridge Large Cap Growth ESG ETF |
35 |
Additional information (unaudited) (cont’d)
Information about Trustees and Officers
| † | Trustees who are not “interested persons” of the Fund within the meaning of Section 2(a)(19) of the Investment Company Act of 1940, as amended (the “1940 Act”). |
| * | Effective July 1, 2021, Ms. Johnson became Chair. |
| 1 | Each Trustee and officer serves until his or her respective successor has been duly elected and qualified or until his or her earlier death, resignation, retirement or removal. |
| 2 | Indicates the earliest year in which the Trustee became a board member for a fund in the Legg Mason fund complex or the officer took such office. |
| 3 | Ms. Johnson is an “interested person” of the Fund, as defined in the 1940 Act, because of her position with LMPFA and/or certain of its affiliates. |
|
36 |
ClearBridge Large Cap Growth ESG ETF |
Important tax information (unaudited)
By mid-February, tax information related to a shareholder’s proportionate share of distributions paid during the preceding calendar year will be received, if applicable. Please also refer to www.franklintempleton.com for per share tax information related to any distributions paid during the preceding calendar year. Shareholders are advised to consult with their tax advisors for further information on the treatment of these amounts on their tax returns.
The following tax information for the Fund is required to be furnished to shareholders with respect to income earned and distributions paid during its fiscal year.
The Fund hereby reports the following amounts, or if subsequently determined to be different, the maximum allowable amounts, for the fiscal year ended November 30, 2021:
| Pursuant to: | Amount Reported | |||||
| Income Eligible for Dividends Received Deduction (DRD) | §854(b)(1)(A) | $ | 897,629 | |||
| Qualified Dividend Income Earned (QDI) | §854(b)(1)(B) | $ | 956,520 | |||
| Qualified Business Income Dividends Earned | §199A | $ | 36,265 | |||
| ClearBridge Large Cap Growth ESG ETF |
37 |
ClearBridge
Large Cap Growth ESG ETF
Trustees*
Rohit Bhagat
Deborah D. McWhinney
Anantha K. Pradeep
Jennifer M. Johnson**
Chair
Investment manager
Legg Mason Partners Fund Advisor, LLC
Subadviser
ClearBridge Investments, LLC
Custodian
The Bank of New York Mellon
Transfer agent
The Bank of New York Mellon
240 Greenwich Street
New York, NY 10286
Independent registered public accounting firm
PricewaterhouseCoopers LLP Baltimore, MD
| * | During a June 15, 2021 special meeting of shareholders, a new group of Trustees were elected to oversee the funds of Legg Mason ETF Investment Trust, effective July 1, 2021. |
**Effective July 1, 2021, Ms. Johnson became Chair.
ClearBridge Large Cap Growth ESG ETF
The Fund is a separate investment series of Legg Mason ETF Investment Trust,a Maryland statutory trust.
ClearBridge Large Cap Growth ESG ETF
Legg Mason Funds
620 Eighth Avenue, 47th Floor
New York, NY 10018
The Fund files its complete schedule of portfolio holdings with the Securities and Exchange Commission (“SEC”) for the first and third quarters of each fiscal year as an exhibit to its reports on Form N-PORT. The Fund’s Forms N-PORT are available on the SEC’s website at www.sec.gov. To obtain information on Form N-PORT, shareholders can call the Fund at 1-877-721-1926.
Information on how the Fund voted proxies relating to portfolio securities during the prior 12-month period ended June 30th of each year and a description of the policies and procedures that the Fund uses to determine how to vote proxies related to portfolio transactions are available (1) without charge, upon request, by calling the Fund at 1-877-721-1926, (2) at www.franklintempleton.com and (3) on the SEC’s website at www.sec.gov.
This report is submitted for the general information of the shareholders of ClearBridge Large Cap Growth ESG ETF.This report is not authorized for distribution to prospective investors in the Fund unless preceded or accompanied by a current prospectus.
Investors should consider the Fund’s investment objectives,risks,charges and expenses carefully before investing. The prospectus contains this and other important information about the Fund.Please read the prospectus carefully before investing.
www.franklintempleton.com
© 2022 Franklin Distributors, LLC, Member FINRA/SIPC. All rights reserved.
www.franklintempleton.com
© 2022 Franklin Distributors, LLC, Member FINRA/SIPC. All rights reserved.
ETFF425113 1/22 SR21-4310
| ITEM 2. | CODE OF ETHICS. |
The registrant has adopted a code of ethics that applies to the registrant’s principal executive officer, principal financial officer, principal accounting officer or controller.
| ITEM 3. | AUDIT COMMITTEE FINANCIAL EXPERT. |
The Board of Trustees of the registrant has determined that Rohit Bhagat possesses the technical attributes identified in Instruction 2(b) of Item 3 to Form N-CSR to qualify as an “audit committee financial expert,” and has designated Rohit Bhagat as the Audit Committee’s financial expert. Rohit Bhagat is an “independent” Trustees pursuant to paragraph (a)(2) of Item 3 to Form N-CSR.
| ITEM 4. | PRINCIPAL ACCOUNTANT FEES AND SERVICES. |
a) Audit Fees. The aggregate fees billed in the last two fiscal years ending November 30, 2020 and November 30, 2021 (the “Reporting Periods”) for professional services rendered by the Registrant’s principal accountant (the “Auditor”) for the audit of the Registrant’s annual financial statements, or services that are normally provided by the Auditor in connection with the statutory and regulatory filings or engagements for the Reporting Periods, were $40,800 in November 30, 2020 and $40,800 in November 30, 2021.
b) Audit-Related Fees. The aggregate fees billed in the Reporting Period for assurance and related services by the Auditor that are reasonably related to the performance of the Registrant’s financial statements were $0 in November 30, 2020 and $0 in November 30, 2021.
(c) Tax Fees. The aggregate fees billed in the Reporting Periods for professional services rendered by the Auditor for tax compliance, tax advice and tax planning (“Tax Services”) were $0 in November 30, 2020 and $20,000 in November 30, 2021. These services consisted of (i) review or preparation of U.S. federal, state, local and excise tax returns; (ii) U.S. federal, state and local tax planning, advice and assistance regarding statutory, regulatory or administrative developments, and (iii) tax advice regarding tax qualification matters and/or treatment of various financial instruments held or proposed to be acquired or held.
There were no fees billed for tax services by the Auditors to service affiliates during the Reporting Periods that required pre-approval by the Audit Committee.
d) All Other Fees.
The aggregate fees billed in the Reporting Periods for products and services provided by the Auditor, other than the services reported in paragraphs (a) through (c) for the Item 4 for the Legg Mason ETF Investment Trust, were $0 in November 30, 2020 and $0 in November 30, 2021.
All Other Fees. There were no other non-audit services rendered by the Auditor to Legg Mason Partners Fund Advisors, LLC (“LMPFA”), and any entity controlling, controlled by or under common control with LMPFA that provided ongoing services to Legg Mason ETF Investment Trust requiring pre-approval by the Audit Committee in the Reporting Period.
(e) Audit Committee’s pre–approval policies and procedures described in paragraph (c) (7) of Rule 2-01 of Regulation S-X.
(1) The Charter for the Audit Committee (the “Committee”) of the Board of each registered investment company (the “Fund”) advised by LMPFA or one of their affiliates (each, an “Adviser”) requires that the Committee shall approve (a) all audit and permissible non-audit services to be provided to the Fund and (b) all permissible non-audit services to be provided by the Fund’s independent auditors to the Adviser and any Covered Service Providers if the
engagement relates directly to the operations and financial reporting of the Fund. The Committee may implement policies and procedures by which such services are approved other than by the full Committee.
The Committee shall not approve non-audit services that the Committee believes may impair the independence of the auditors. As of the date of the approval of this Audit Committee Charter, permissible non-audit services include any professional services (including tax services), that are not prohibited services as described below, provided to the Fund by the independent auditors, other than those provided to the Fund in connection with an audit or a review of the financial statements of the Fund. Permissible non-audit services may not include: (i) bookkeeping or other services related to the accounting records or financial statements of the Fund; (ii) financial information systems design and implementation; (iii) appraisal or valuation services, fairness opinions or contribution-in-kind reports; (iv) actuarial services; (v) internal audit outsourcing services; (vi) management functions or human resources; (vii) broker or dealer, investment adviser or investment banking services; (viii) legal services and expert services unrelated to the audit; and (ix) any other service the Public Company Accounting Oversight Board determines, by regulation, is impermissible.
Pre-approval by the Committee of any permissible non-audit services is not required so long as: (i) the aggregate amount of all such permissible non-audit services provided to the Fund, the Adviser and any service providers controlling, controlled by or under common control with the Adviser that provide ongoing services to the Fund (“Covered Service Providers”) constitutes not more than 5% of the total amount of revenues paid to the independent auditors during the fiscal year in which the permissible non-audit services are provided to (a) the Fund, (b) the Adviser and (c) any entity controlling, controlled by or under common control with the Adviser that provides ongoing services to the Fund during the fiscal year in which the services are provided that would have to be approved by the Committee; (ii) the permissible non-audit services were not recognized by the Fund at the time of the engagement to be non-audit services; and (iii) such services are promptly brought to the attention of the Committee and approved by the Committee (or its delegate(s)) prior to the completion of the audit.
(2) For the Legg Mason ETF Investment Trust, the percentage of fees that were approved by the audit committee, with respect to: Audit-Related Fees were 100% and 100% for November 30, 2020 and November 30, 2021; Tax Fees were 100% and 100% for November 30, 2020 and November 30, 2021; and Other Fees were 100% and 100% for November 30, 2020 and November 30, 2021.
(f) N/A
(g) Non-audit fees billed by the Auditor for services rendered to Legg Mason ETF Investment Trust, LMPFA and any entity controlling, controlled by, or under common control with LMPFA that provides ongoing services to Legg Mason ETF Investment Trust during the reporting period were $707,834 in November 30, 2020 and $643,089 in November 30, 2021.
(h) Yes. Legg Mason ETF Investment Trust’s Audit Committee has considered whether the provision of non-audit services that were rendered to Service Affiliates, which were not pre-approved (not requiring pre-approval), is compatible with maintaining the Accountant’s independence. All services provided by the Auditor to the Legg Mason ETF Investment Trust or to Service Affiliates, which were required to be pre-approved, were pre-approved as required.
| ITEM 5. | AUDIT COMMITTEE OF LISTED REGISTRANTS. |
| a) | The independent board members are acting as the registrant’s audit committee as specified in Section 3(a)(58)(B) of the Exchange Act. The Audit Committee consists of the following Board members: |
Rohit Bhagat
Deborah D. McWhinney
Anantha K. Pradeep
Jennifer M. Johnson**
| * | During a June 15, 2021 special meeting of shareholders, a new group of Trustees were elected to oversee the funds of Legg Mason ETF Investment Trust, effective July 1, 2021. |
| ** | Effective July 1, 2021, Ms. Johnson became Chair. |
b) Not applicable.
| ITEM 6. | SCHEDULE OF INVESTMENTS. |
Included herein under Item 1.
| ITEM 7. | DISCLOSURE OF PROXY VOTING POLICIES AND PROCEDURES FOR CLOSED-END MANAGEMENT INVESTMENT COMPANIES. |
Not applicable.
| ITEM 8. | PORTFOLIO MANAGERS OF CLOSED-END MANAGEMENT INVESTMENT COMPANIES. |
Not applicable.
| ITEM 9. | PURCHASES OF EQUITY SECURITIES BY CLOSED-END MANAGEMENT INVESTMENT COMPANY AND AFFILIATED PURCHASERS. |
Not applicable.
| ITEM 10. | SUBMISSION OF MATTERS TO A VOTE OF SECURITY HOLDERS. |
Not applicable.
| ITEM 11. | CONTROLS AND PROCEDURES. |
| (a) | The registrant’s principal executive officer and principal financial officer have concluded that the registrant’s disclosure controls and procedures (as defined in Rule 30a- 3(c) under the Investment Company Act of 1940, as amended (the “1940 Act”)) are effective as of a date within 90 days of the filing date of this report that includes the disclosure required by this paragraph, based on their evaluation of the disclosure controls and procedures required by Rule 30a-3(b) under the 1940 Act and 15d-15(b) under the Securities Exchange Act of 1934. |
| (b) | There were no changes in the registrant’s internal control over financial reporting (as defined in Rule 30a-3(d) under the 1940 Act) that occurred during the second fiscal quarter of the period covered by this report that have materially affected, or are likely to materially affect the registrant’s internal control over financial reporting. |
| ITEM 12. | DISCLOSURE OF SECURITIES LENDING ACTIVITIES FOR CLOSED-END MANAGEMENT INVESTMENT COMPANIES. |
Not applicable.
| ITEM 13. | EXHIBITS. |
Exhibit 99.CODE ETH
(a) (2) Certifications pursuant to section 302 of the Sarbanes-Oxley Act of 2002 attached hereto.
Exhibit 99.CERT
(b) Certifications pursuant to Section 906 of the Sarbanes-Oxley Act of 2002 attached hereto.
Exhibit 99.906CERT
SIGNATURES
Pursuant to the requirements of the Securities Exchange Act of 1934 and the Investment Company Act of 1940, the registrant has duly caused this Report to be signed on its behalf by the undersigned, there unto duly authorized.
| Legg Mason ETF Investment Trust | ||
| By: | /s/ Matthew T. Hinkle | |
| Matthew T. Hinkle | ||
| Chief Executive Officer | ||
| Date: | January 26, 2022 | |
Pursuant to the requirements of the Securities Exchange Act of 1934 and the Investment Company Act of 1940, this report has been signed below by the following persons on behalf of the registrant and in the capacities and on the dates indicated.
| By: | /s/ Matthew T. Hinkle | |
| Matthew T. Hinkle | ||
| Chief Executive Officer | ||
| Date: | January 26, 2022 | |
| By: | /s/ Vivek Pai | |
| Vivek Pai | ||
| Principal Financial Officer | ||
| Date: | January 26, 2022 | |
Code of Conduct for Principal Executive and Financial Officers (SOX)
Covered Officers and Purpose of the Code
The Funds’ code of ethics (the “Code”) for investment companies within the Legg Mason family of mutual funds (each a “Fund,” and collectively, the “Funds”) applies to each Fund’s Principal Executive Officer, Principal Financial Officer, and Controller (the “Covered Officers”) for the purpose of promoting:
| • | honest and ethical conduct, including ethical handling of actual or apparent conflicts of interest between personal and professional relationships; |
| • | full, fair, accurate, timely and understandable disclosure in reports and documents a registrant files with, or submits to, the Securities and Exchange Commission (“SEC”) and in other public communications made by the Funds; |
| • | compliance with applicable laws and governmental rules and regulations; |
| • | prompt internal reporting of Code violations to appropriate persons identified in the Code; and |
| • | accountability for adherence to the Code. |
Each Covered Officer should adhere to a high standard of business ethics and should be sensitive to situations that may give rise to actual as well as apparent conflicts of interest.
Covered Officers Should Ethically Handle Actual and Apparent Conflicts of Interest
A “conflict of interest” occurs when a Covered Officer’s private interest interferes with the interests of, or his or her service to, a Fund. For example, a conflict of interest would arise if a Covered Officer, or a member of his or her family, receives improper personal benefits as a result of his or her position with a Fund.
Certain conflicts of interest arise out of the relationships between Covered Officers and a Fund and already are subject to conflict of interest provisions in the Investment Company Act of 1940 (“Investment Company Act”) and the Investment Advisers Act of 1940 (“Investment Advisers Act”). For example, Covered Officers may not individually engage in certain transactions (such as the purchase or sale of securities or other property) with a Fund because of their status as “affiliated persons” of the Fund. The Funds’ and the investment advisers’ compliance programs and procedures are designed to prevent, or identify and correct, violations of these provisions. This Code does not, and is not intended to, repeat or replace these programs and procedures, and such conflicts fall outside of the parameters of this Code.
Although typically not presenting an opportunity for improper personal benefit, conflicts arise from, or as a result of, the contractual relationship between a Fund and an investment adviser of which Covered Officers are also officers or employees. As a result, this Code recognizes Covered Officers will, in the normal course of their duties (whether formally for a Fund or for the adviser, or for both), be involved in establishing policies and
implementing decisions that will have different effects on the adviser and the Funds. The participation of Covered Officers in such activities is inherent in the contractual relationship between a Fund and an adviser and is consistent with the performance by Covered Officers of their duties as officers of the Funds. Thus, if performed in conformity with the provisions of the Investment Company Act and the Investment Advisers Act, such activities will be deemed to have been handled ethically. In addition, it is recognized by the Funds’ Boards of Directors/Trustees (“Boards”) that Covered Officers may also be officers or employees of one or more other investment companies covered by this or other codes and that such service, by itself does not give rise to a conflict of interest.
Other conflicts of interest are covered by the Code, even if such conflicts of interest are not subject to provisions in the Investment Company Act and the Investment Advisers Act. The following list provides examples of conflicts of interest under the Code, but Covered Officers should keep in mind these examples are not exhaustive. The overarching principle is that the personal interest of a Covered Officer should not be placed improperly before the interest of a Fund.
Each Covered Officer must:
| • | not use his or her personal influence or personal relationships improperly to influence investment decisions or financial reporting by a Fund; |
| • | not cause a Fund to take action, or fail to take action, for the individual personal benefit of the Covered Officer rather than the benefit the Fund; and, |
| • | not use material non-public knowledge of portfolio transactions made or contemplated for the Trust to trade personally or cause others to trade personally in contemplation of the market effect of such transactions. |
There are some actual or potential conflict of interest situations that, if material, should always be discussed with the Chief Compliance Officer (“CCO”) or designate that has been appointed by the Board of the Funds. Examples of these include:
| • | service as a director on the board of any public company (other than the Funds or their investment advisers or any affiliated person thereof); |
| • | the receipt of any non-nominal gifts (i.e., in excess of $100); |
| • | the receipt of any entertainment from any company with which a Fund has current or prospective business dealings unless such entertainment is business-related, reasonable in cost, appropriate as to time and place, and not so frequent as to raise any question of impropriety; |
| • | any ownership interest in, or any consulting or employment relationship with, any of the Funds’ service providers (other than their investment advisers, or principal underwriter, or any affiliated person thereof); |
| • | a direct or indirect financial interest in commissions, transaction charges or spreads paid by a Fund for effecting portfolio transactions or for selling or redeeming shares other than an interest arising from the Covered Officer’s employment, such as compensation or equity ownership. |
Disclosure and Compliance
Each Covered Officer should:
| • | familiarize him or herself with the disclosure requirements generally applicable to the Funds; |
| • | not knowingly misrepresent, or cause others to misrepresent, facts about a Fund to others, whether within or outside the Fund, including to the Fund’s Directors/Trustees and auditors, and to governmental regulators and self-regulatory organizations; and |
| • | to the extent appropriate within his or her area of responsibility, consult with other officers and employees of the Funds and the advisers with the goal of promoting full, fair, accurate, timely and understandable disclosure in the reports and documents the Funds file with, or submit to, the SEC and in other public communications made by the Funds. |
It is the responsibility of each Covered Officer to promote compliance with the standards and restrictions imposed by applicable laws, rules and regulations.
Reporting and Accountability
Each Covered Officer must:
| • | upon adoption of the Code (or thereafter as applicable, upon becoming a Covered Officer), affirm in writing to the Board that he or she has received, read, and understands the Code; |
| • | annually thereafter affirm to the Board that he or she has complied with the requirements of the Code; |
| • | not retaliate against any other Covered Officer or any employee of the Funds or their advisers or any affiliated persons thereof or service providers of the Funds for reports of potential violations that are made in good faith; |
| • | notify the CCO promptly if he or she knows of any violation of this Code, of which failure to do so is itself a violation; and |
| • | report at least annually, if necessary, any employment position, including officer or directorships, held by the Covered Officer or any immediate family member of a Covered Officer with affiliated persons of or Service Providers to the Funds. |
The CCO is responsible for applying this Code to specific situations in which questions are presented and has the authority to interpret this Code in any particular situation. However, approvals or waivers sought by a Covered Officer will be considered by the Compliance Committee or Audit Committee, (the “Committee”) responsible for oversight of the Fund’s code of ethics under Rule 17j-1 under the Investment Company Act. If a Covered Officer seeking an approval or waiver sits on the Committee, the Covered Person shall recuse him or herself from any such deliberations. Any approval or waiver granted by the Committee will be reported promptly to the Chair of the Audit Committees of the Funds.
The Funds will follow these procedures in investigating and enforcing this Code:
| • | the CCO will take all appropriate action to investigate any potential violations reported to him, which actions may include the use of internal or external counsel, accountants or other personnel; |
| • | if, after such investigation, the CCO believes that no violation has occurred, the CCO is not required to take any further action; |
| • | any matter that the CCO believes is a violation will be reported to the Committee; |
| • | if the Committee concurs that a violation has occurred, it will inform the Board, which will consider appropriate action, which may include review of, and appropriate modifications to, applicable policies and procedures; notification to appropriate personnel of the investment adviser or its board; or a recommendation to dismiss the Covered Officer; |
| • | the Committee will be responsible for granting waivers, as appropriate; and, |
| • | any changes to or waivers of this Code will, to the extent required, be disclosed as provided by SEC rules. |
Other Policies and Procedures
This Code shall be the sole code of ethics adopted by the Funds for purposes of Section 406 of the Sarbanes-Oxley Act and the rules and forms applicable to registered investment companies thereunder. Insofar as other policies or procedures of the Funds, the Funds’ advisers, principal underwriter, or other service providers govern or purport to govern the behavior or activities of Covered Officers subject to this Code, they are superseded by this Code to the extent they overlap or conflict with the provisions of this Code. The Funds’ and their investment advisers’ and principal underwriter’s codes of
ethics under Rule 17j-1 under the Investment Company Act are separate requirements applying to Covered Officers and others, and are not part of this Code.
Confidentiality
All reports and records prepared or maintained pursuant to this Code will be considered confidential and shall be maintained and protected accordingly. Except as otherwise required by law or this Code, such matters shall not be disclosed to anyone other than the appropriate Board and Fund counsel, and the board of Directors/Trustees and fund counsel of any other investment company for whom a Covered Officer serves in a similar capacity.
Annual Report
No less than annually, the CCO shall provide the Board with a written report describing any issues having arisen since the prior year’s report.
Internal Use
This Code is intended solely for the internal use by the Funds and does not constitute an admission by or on behalf of any Fund, as to any fact, circumstance or legal consideration.
CERTIFICATIONS PURSUANT TO SECTION 302
EX-99.CERT
CERTIFICATIONS
I, Matthew T. Hinkle, certify that:
| 1. | I have reviewed this report on Form N-CSR of Legg Mason ETF Investment Trust – ClearBridge Large Cap Growth ESG ETF; |
| 2. | Based on my knowledge, this report does not contain any untrue statement of a material fact or omit to state a material fact necessary to make the statements made, in light of the circumstances under which such statements were made, not misleading with respect to the period covered by this report; |
| 3. | Based on my knowledge, the financial statements, and other financial information included in this report, fairly present in all material respects the financial condition, results of operations, changes in net assets, and cash flows (if the financial statements are required to include a statement of cash flows) of the registrant as of, and for, the periods presented in this report; |
| 4. | The registrant’s other certifying officers and I are responsible for establishing and maintaining disclosure controls and procedures (as defined in Rule 30a-3(c) under the Investment Company Act of 1940) and internal control over financial reporting (as defined in Rule 30a-3(d) under the Investment Company Act of 1940) for the registrant and have: |
| a) | Designed such disclosure controls and procedures, or caused such disclosure controls and procedures to be designed under our supervision, to ensure that material information relating to the registrant, including its consolidated subsidiaries, is made known to us by others within those entities, particularly during the period in which this report is being prepared; |
| b) | Designed such internal control over financial reporting, or caused such internal control over financial reporting to be designed under our supervision, to provide reasonable assurance regarding the reliability of financial reporting and the preparation of financial statements for external purposes in accordance with generally accepted accounting principles; |
| c) | Evaluated the effectiveness of the registrant’s disclosure controls and procedures and presented in this report our conclusions about the effectiveness of the disclosure controls and procedures, as of a date within 90 days prior to the filing date of this report based on such evaluation; and |
| d) | Disclosed in this report any change in the registrant’s internal control over financial reporting that occurred during the second fiscal quarter of the period covered by this report that has materially affected, or is reasonably likely to materially affect, the registrant’s internal control over financial reporting; and |
| 5. | The registrant’s other certifying officers and I have disclosed to the registrant’s auditors and the audit committee of the registrant’s board of directors (or persons performing the equivalent functions): |
| a) | All significant deficiencies and material weaknesses in the design or operation of internal control over financial reporting which are reasonably likely to adversely affect the registrant’s ability to record, process, summarize, and report financial information; and |
| b) | Any fraud, whether or not material, that involves management or other employees who have a significant role in the registrant’s internal control over financial reporting. |
| Date: January 26, 2022 | /s/ Matthew T. Hinkle | |||||
| Matthew T. Hinkle | ||||||
| Chief Executive Officer |
CERTIFICATIONS
I, Vivek Pai, certify that:
| 1. | I have reviewed this report on Form N-CSR of Legg Mason ETF Investment Trust – ClearBridge Large Cap Growth ESG ETF; |
| 2. | Based on my knowledge, this report does not contain any untrue statement of a material fact or omit to state a material fact necessary to make the statements made, in light of the circumstances under which such statements were made, not misleading with respect to the period covered by this report; |
| 3. | Based on my knowledge, the financial information included in this report, and the financial statements on which the financial information is based, fairly present in all material respects the financial condition, results of operations, changes in net assets, and cash flows (if the financial statements are required to include a statement of cash flows) of the registrant as of, and for, the periods presented in this report; |
| 4. | The registrant’s other certifying officers and I are responsible for establishing and maintaining disclosure controls and procedures (as defined in Rule 30a-3(c) under the Investment Company Act of 1940) and internal control over financial reporting (as defined in Rule 30a-3(d) under the Investment Company Act of 1940) for the registrant and have: |
| a) | Designed such disclosure controls and procedures, or caused such disclosure controls and procedures to be designed under our supervision, to ensure that material information relating to the registrant, including its consolidated subsidiaries, is made known to us by others within those entities, particularly during the period in which this report is being prepared; |
| b) | Designed such internal control over financial reporting, or caused such internal control over financial reporting to be designed under our supervision, to provide reasonable assurance regarding the reliability of financial reporting and the preparation of financial statements for external purposes in accordance with generally accepted accounting principles; |
| c) | Evaluated the effectiveness of the registrant’s disclosure controls and procedures and presented in this report our conclusions about the effectiveness of the disclosure controls and procedures, as of a date within 90 days prior to the filing date of this report based on such evaluation; and |
| d) | Disclosed in this report any change in the registrant’s internal control over financial reporting that occurred during the second fiscal quarter of the period covered by this report that has materially affected, or is reasonably likely to materially affect, the registrant’s internal control over financial reporting; and |
| 5. | The registrant’s other certifying officers and I have disclosed to the registrant’s auditors and the audit committee of the registrant’s board of directors (or persons performing the equivalent functions): |
| a) | All significant deficiencies and material weaknesses in the design or operation of internal control over financial reporting which are reasonably likely to adversely affect the registrant’s ability to record, process, summarize, and report financial information; and |
| b) | Any fraud, whether or not material, that involves management or other employees who have a significant role in the registrant’s internal control over financial reporting. |
| Date: January 26, 2022 | /s/ Vivek Pai | |||||
| Vivek Pai | ||||||
| Principal Financial Officer | ||||||
CERTIFICATIONS PURSUANT TO SECTION 906
EX-99.906CERT
CERTIFICATION
Matthew T. Hinkle, Chief Executive Officer, and Vivek Pai, Principal Financial Officer of Legg Mason ETF Investment Trust – ClearBridge Large Cap Growth ESG ETF (the “Registrant”), each certify to the best of their knowledge that:
1. The Registrant’s periodic report on Form N-CSR for the period ended November 30, 2021 (the “Form N-CSR”) fully complies with the requirements of section 15(d) of the Securities Exchange Act of 1934, as amended; and
2. The information contained in the Form N-CSR fairly presents, in all material respects, the financial condition and results of operations of the Registrant.
| Chief Executive Officer | Principal Financial Officer | |
| Legg Mason ETF Investment Trust - | Legg Mason ETF Investment Trust - | |
| ClearBridge Large Cap Growth ESG ETF | ClearBridge Large Cap Growth ESG ETF |
| /s/ Matthew T. Hinkle | /s/ Vivek Pai | |||
| Matthew T. Hinkle | Vivek Pai | |||
| Date: January 26, 2022 | Date: January 26, 2022 |
This certification is being furnished to the Securities and Exchange Commission solely pursuant to 18 U.S.C. § 1350 and is not being filed as part of the Form N-CSR with the Commission.
Serious News for Serious Traders! Try StreetInsider.com Premium Free!
You May Also Be Interested In
- Hemogenyx Pharmaceuticals PLC Announces Final Results
- Canadian Pink Floyd Tribute Band Floydium Performance At Summer Venues Announced
- i3 Energy PLC Announces 2024 Capital Budget and Production Guidance
Create E-mail Alert Related Categories
SEC FilingsSign up for StreetInsider Free!
Receive full access to all new and archived articles, unlimited portfolio tracking, e-mail alerts, custom newswires and RSS feeds - and more!
