

Form N-CSR JOHCM Funds Trust For: Sep 30
 Tweet
Tweet Share
Share
UNITED STATES
SECURITIES AND EXCHANGE COMMISSION
Washington, D.C. 20549
FORM N-CSR
CERTIFIED SHAREHOLDER REPORT OF REGISTERED
MANAGEMENT INVESTMENT COMPANIES
Investment Company Act file number: 811-23615
JOHCM Funds Trust
(Exact name of registrant as specified in charter)
53 State Street, 13th Floor
Boston, Massachusetts 02109
(Address of principal executive offices) (Zip code)
Mary Lomasney
53 State Street, 13th Floor
Boston, Massachusetts 02109
(Name and address of agent for service)
Registrant’s telephone number, including area code: (617) 933-0712
Date of fiscal year end: September 30
Date of reporting period: September 30, 2021
Form N-CSR is to be used by management investment companies to file reports with the Commission not later than 10 days after the transmission to stockholders of any report that is required to be transmitted to stockholders under Rule 30e-1 under the Investment Company Act of 1940 (17 CFR 270.30e-1). The Commission may use the information provided on Form N-CSR in its regulatory, disclosure review, inspection, and policymaking roles.
A registrant is required to disclose the information specified by Form N-CSR, and the Commission will make this information public. A registrant is not required to respond to the collection of information contained in Form N-CSR unless the Form displays a currently valid Office of Management and Budget (“OMB”) control number. Please direct comments concerning the accuracy of the information collection burden estimate and any suggestions for reducing the burden to Secretary, Securities and Exchange Commission, 450 Fifth Street, NW, Washington, DC 20549-0609. The OMB has reviewed this collection of information under the clearance requirements of 44 U.S.C. § 3507.
Item 1. Reports to Stockholders.
(a) The following is a copy of the report transmitted to shareholders pursuant to Rule 30e-1 under the Investment Company Act of 1940 (17 CFR 270.30e-1).

ANNUAL REPORT
SEPTEMBER 30, 2021
This report is submitted for the general information of the shareholders of the Funds. It is not authorized for the distribution to prospective investors unless preceded or accompanied by an effective prospectus.
JOHCM FUNDS TRUST
September 30, 2021
| i | ||||
| iii | ||||
| 1 | ||||
| 37 | ||||
| 39 | ||||
| 41 | ||||
| 44 | ||||
| 60 | ||||
| 78 | ||||
| 80 | ||||
JOHCM FUNDS TRUST
September 30, 2021 (Unaudited)


DEAR SHAREHOLDER:
I am pleased to present the inaugural JOHCM Funds Trust Annual Report for the 12-months ended September 30, 2021. As you are aware, and thanks to your approval, the JOHCM Funds were reorganized into JOHCM Funds Trust in July. We believe the reorganizations were in the best interests of shareholders by providing each fund with oversight by a dedicated board of trustees with responsibility for a smaller number of funds. It also allowed us to directly engage with key third party service providers and negotiate lower fees for the services they perform. As part of our ongoing commitment to shareholders, JOHCM also agreed to lower the contractual expense limitations for each of the JOHCM Funds. We believe the reorganizations are a natural progression for the JOHCM Funds as assets have grown by 25% year over year to $14.6B and better position JOHCM to be able to capitalize on new opportunities to expand our product range to better serve our shareholders.
In light of the above and in line with our strategic priorities, JOHCM’s parent company, Pendal Group Limited, closed on the acquisition of Thompson, Siegel and Walmsley (“TSW”) on July 22nd. TSW is a Richmond, Virginia based value-oriented investment manager with over 50 years of operating history, and $23.9B in assets under management. TSW’s strategy range includes International and Domestic equity, as well as Multi-Asset and Fixed Income capabilities. This strategic acquisition significantly broadens the range of investment solutions that we can offer to clients across the U.S. market. As complementary businesses with almost no overlap of investment strategies, we will be better placed to take advantage of the growth opportunities we see in the U.S. market.
Since the TSW acquisition, we have been focused on bringing select TSW strategies to market under JOHCM Funds Trust. The first step in this product evolution was the launch of the TSW High Yield Bond Fund in late October. In addition, we expect to launch the TSW Emerging Markets Fund by year-end. We also expect, subject to shareholder approval, to reorganize the existing TS&W Equity Portfolio (Large Cap Value) into a newly established fund of JOHCM Funds Trust in December 2021. These new TSW branded funds, in conjunction with the August launch of our first fund under the Regnan brand - Regnan Global Equity Impact Solutions, which focuses on responsible investing solutions, will provide an enhanced product range to help clients meet the challenges of an ever-evolving investment landscape.
i
JOHCM FUNDS TRUST
SHAREHOLDER LETTER
September 30, 2021 (Unaudited)
Our success is ultimately determined by our ability to attract, develop and retain the very best talent. Many of our fund managers are regarded as thought leaders within our industry. We actively recruit investment talent with deep expertise and a strong sense of conviction, and we deliberately create an environment of independence and autonomy in which they can thrive. Our investment teams are supported by dedicated and highly experienced specialists across our business who share the same commitment to excellence and a “can do” mindset.
As we look to the future, we will be focused on the delivery of our core principles. We are a company that is talent-led, defined by conviction, and deeply connected with our clients. We have a spirit of entrepreneurialism that compels us to grow, build and to seek opportunity. Our commitment to delivering consistent performance and a superior experience for our clients has been, and will continue to be, our ongoing priority.
We thank you for the trust and confidence you place in us by choosing to invest in the JOHCM Funds.
| Respectfully submitted, |
||
|
|
||
| Nicholas Good |
||
| Chairman of the Board of Trustees |
||

ii
JOHCM FUNDS TRUST
September 30, 2021 (Unaudited)
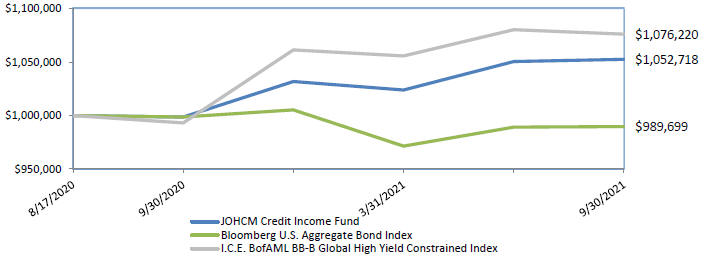
JOHCM Credit Income Fund
Change in value of a hypothetical $1,000,000 investment in the Fund’s Institutional Shares from August 17, 2020 to September 30, 2021
Average Annual Total Returns as of September 30, 2021
| One Year Return |
Since Inception Return |
Gross Expense Ratio * |
Net Expense Ratio * | |||||
|
Institutional Shares |
5.42% | 5.27% | 1.99% | 0.58% | ||||
| Advisor Shares |
4.54% | 4.37% | 2.09% | 0.68% | ||||
| Bloomberg U.S. Aggregate Bond Index |
(0.90%) | (1.03%) | - | - | ||||
| I.C.E. BofAML BB-B Global High Yield Constrained Index | 8.37% | 7.62% | - | - |
Data as of September 30, 2021. The Fund’s performance reflects the performance of the predecessor JOHCM Credit Income Fund of the Advisers Investment Trust for periods prior to the reorganization into the JOHCM Funds Trust on July 19, 2021. The performance also reflects the reinvestment of dividends as well as the impact of transaction costs and the deduction of fees and expenses. The performance does not reflect taxes that a shareholder would pay on Fund distributions or on the redemption of Fund shares.
The Institutional Shares and Advisor Shares of the Fund commenced operations on July 19, 2021. Historical performance for Institutional Shares and Advisor Shares prior to their inception is based on performance of predecessor share classes of the JOHCM Credit Income Fund of the Advisers Investment Trust.
Historical performance for Advisor Shares prior to its inception is based on the performance of the Class I Shares predecessor share class. Class I Shares predecessor share class performance is based on performance of the Institutional Shares predecessor share class prior to the Class I Shares predecessor share class inception date. Performance of the Class I Shares predecessor share class was adjusted to reflect differences in expense.
* Expense ratios are per the most recent Fund Prospectus dated February 12, 2021, as revised July 19, 2021. The Adviser has entered into a contractual expense limitation agreement with respect to Fund until June 30, 2022.
iii
JOHCM FUNDS TRUST
PORTFOLIO COMMENTARY
September 30, 2021 (Unaudited)
The performance data quoted represents past performance; past performance does not guarantee future results. The investment return and principal value of an investment will fluctuate so that an investor’s shares, when redeemed, may be worth more or less than their original cost. The Fund’s current performance may be lower or higher than the performance data quoted. Investors may obtain performance information current to the most recent month-end, within 7 business days, by calling 866-260-9549 or 312-557-5913.
The Fund’s benchmarks for performance comparison purposes are the: Bloomberg US Aggregate Bond Index and the I.C.E. BofAML BB-B Global High Yield Constrained Index. The Bloomberg US Aggregate Bond Index is a broad-based benchmark that measures the investment grade U.S. dollar-denominated, fixed-rate taxable bond market, including Treasuries, government-related and corporate securities, MBS (agency fixed-rate and hybrid ARM passthroughs), ABS, and CMBS. The I.C.E. BofAML BB-B Global High Yield Constrained Index contains all securities in The I.C.E. BofAML Global High Yield Index rated BB1 through B3, based on an average of Moody’s, S&P and Fitch, but caps issuer exposure at 2%. The table reflects the theoretical reinvestment of dividends on securities in the indices. The impact of transaction costs and the deduction of expenses associated with a mutual fund, such as investment management and administration fees, are not reflected in the indices calculations. It is not possible to invest directly in an index.
Investment Philosophy and Process
The Fund aims to preserve capital and deliver returns through a combination of income and modest capital appreciation. The Fund invests, under normal circumstances, at least 80% of its net assets in fixed income securities across a wide range of maturities. The securities can include investment grade corporate debt, high yield securities, convertible bonds (including contingent convertible bonds), preferred stock, floating-rate debt, collateralized debt, municipal debt, foreign debt (including emerging markets), commercial paper, loans and loan participations. The Fund may also invest up to 10% of its net assets in dividend paying equities of companies of any size.
Performance
The Fund’s Institutional share class returned 5.42% for the 12-month period to September 30, 2021. Inflation fears and the Federal Reserve response function were the primary topic in markets for much of the year. Federal Reserve Bank Governors, CEOs, and investors alike have weighed in on the shades of meaning of the word “transitory”. One thing is certain, transitory inflation looks like persistent inflation until it wanes. With the tapering timeline now clearer, the open question is when the Federal Reserve will begin raising rates. We have seen increasing focus on the disfunction of our once tightly orchestrated logistics chain. The problems do not just stem from restarting a supply chain that was shut down during the pandemic – though there are clearly periodic areas globally where COVID causes delays as we have recently seen in Vietnam – but inbound containers at ports like Los Angeles and Long Beach are nearly 20% higher than during similar periods of 2019.
The top performers over the period were Innoviva convertible bonds, Kraft Heinz Food long dated bonds and Eagle Point. On the flip side, Fastly convertible bonds, Spotify and Twitter were the main laggards.
In terms of our outlook, our base case remains as follows, but we are vigilant for disconfirming evidence:
| • | The reflationary regime continues |
| • | Interest rates continue to normalize |
| • | The Fed will begin to taper its quantitative easing measures on schedule, but will continue to distance itself from the threat of rate increases |
| • | Supply chain-based shortages are likely to get worse before they get better, but a persistent consumer will find a way to fight through the disruption to spend strongly on the holidays. |
iv
JOHCM FUNDS TRUST
PORTFOLIO COMMENTARY
September 30, 2021 (Unaudited)
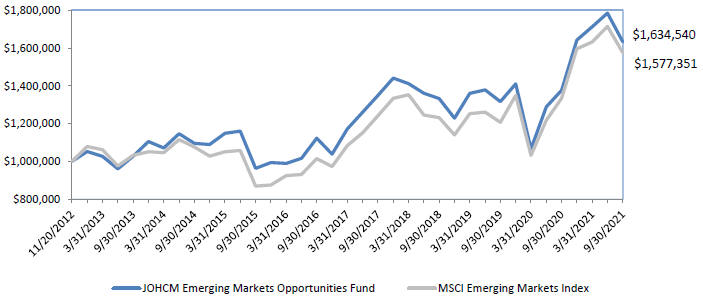
JOHCM Emerging Markets Opportunities Fund
Change in value of a hypothetical $1,000,000 investment in the Fund’s Institutional Shares from November 20, 2012 to September 30, 2021
Average Annual Total Returns as of September 30, 2021
|
One Year Return |
Five Year Return |
Since Inception Return |
Gross Expense Ratio * |
Net Expense Ratio * | ||||||
| Institutional Shares |
18.70% | 7.80% | 5.70% | 1.04% | 1.04% | |||||
| Advisor Shares |
18.64% | 7.69% | 5.61% | 1.12% | 1.12% | |||||
| Investor Shares |
18.42% | 7.54% | 5.47% | 1.27% | 1.27% | |||||
| MSCI Emerging Markets Index |
18.20% | 9.23% | 5.28% | - | - |
Data as of September 30, 2021. The Fund’s performance reflects the performance of the predecessor JOHCM Emerging Markets Opportunities Fund of the Advisers Investment Trust and the predecessor JOHCM Emerging Markets Opportunities Fund of the Scotia Institutional Fund for periods prior to the reorganization into the JOHCM Funds Trust on July 19, 2021. The performance also reflects the reinvestment of dividends as well as the impact of transaction costs and the deduction of fees and expenses. The performance does not reflect taxes that a shareholder would pay on Fund distributions or on the redemption of Fund shares.
The Institutional Shares, Advisor Shares, and Investor Shares of the Fund commenced operations on July 19, 2021. Historical performance for Institutional Shares, Advisor Shares, and Investor Shares prior to their inception is based on performance of predecessor share classes of the predecessor JOHCM Emerging Markets Opportunities Fund of the Advisers Investment Trust and the predecessor JOHCM Emerging Markets Opportunities Fund of the Scotia Institutional Fund.
Historical performance for Investor Shares prior to its inception is based on the performance of the Class II Shares predecessor share class. Class II Shares predecessor share class performance is based on performance of the Class I Shares predecessor share class, the share class most similar to the Class II Shares predecessor share class, prior to the Class II Shares predecessor share class inception date. Performance of the Class II Shares predecessor share class was adjusted to reflect differences in expense.
* Expense ratios are per the most recent Fund Prospectus dated February 12, 2021, as revised July 19, 2021. The Adviser has entered into a contractual expense limitation agreement with respect to Fund until June 30, 2022.
v
JOHCM FUNDS TRUST
PORTFOLIO COMMENTARY
September 30, 2021 (Unaudited)
The performance data quoted represents past performance; past performance does not guarantee future results. The investment return and principal value of an investment will fluctuate so that an investor’s shares, when redeemed, may be worth more or less than their original cost. The Fund’s current performance may be lower or higher than the performance data quoted. Investors may obtain performance information current to the most recent month-end, within 7 business days, by calling 866-260-9549 or 312-557-5913.
The Fund’s benchmark for performance comparison purposes is the Morgan Stanley Capital International (“MSCI”) Emerging Markets Index. The Index is a free float-adjusted market capitalization index that is designed to measure equity market performance in the global emerging markets. The table reflects the theoretical reinvestment of dividends on securities in the Index. The impact of transaction costs and the deduction of expenses associated with a mutual fund, such as investment management and administration fees, are not reflected in the Index calculations. It is not possible to invest directly in an index.
Investment Philosophy and Process
The Fund seeks to outperform its benchmark through a combination of top-down (country level) and bottom-up (stock level) active positions. The fund managers believe in the importance of understanding the investment drivers and risks at the country level. They believe in only investing in companies that benefit from the top-down environment that they can foresee. The Fund buys quality growth stocks at attractive valuations leading to a focused portfolio of 40-60 emerging markets stocks.
Performance
The Fund’s Institutional share class returned 18.70% for the 12-month period to September 30, 2021 versus a return of 18.20% achieved by its benchmark, the MSCI Emerging Markets NR Index, for the same period.
The portfolio modestly outperformed over the year with our country allocation calls and stock selection both contributing positively. At the country level our underweight in China and overweight in India proved beneficial and stock selection in both countries was strong. We suffered from our underweight in Russia as rising oil prices benefited the market here. Not owning Alibaba proved beneficial given the regulatory clampdown in China. Our Indian financials were strong with State Bank of India and HDFC Bank among the top performers. Barrick Gold and Prosus were the main laggards.
With economies now largely recovering from the pandemic, policy focus is turning to ending quantitative easing and tightening policy, but this, in our opinion, is deliberately being done slowly. The sheer size of the stimulus will sit on government and central bank balance sheets for years to come, but the tapering is being done with an eye on allowing inflation to run at higher levels.
This tolerance of inflation should be a net positive for nominal GDP growth around the world, and also for commodity prices, which, in turn, should create a different, more positive, economic environment for more indebted and more commodity-intensive emerging economies.
Global growth remains strong, and emerging markets are still essentially cyclical assets. In 2005-8, price pressures from strong growth coincided with strong returns from emerging market equities. In addition, the US Federal Reserve’s policy tools have been expanded in recent years to reduce tail liquidity risks for emerging economies, for example, the swap lines and repo facilities available to some emerging market central banks.
Rising US yields and a stronger dollar are generally headwinds for some of our preferred markets, but we believe that country-level conditions remain the key driver, and these we see as positive enough to overcome these headwinds.
vi
JOHCM FUNDS TRUST
PORTFOLIO COMMENTARY
September 30, 2021 (Unaudited)
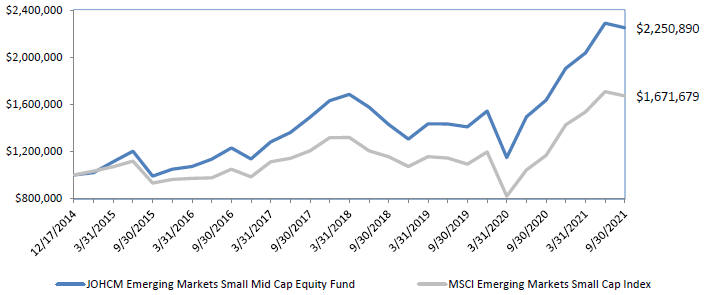
JOHCM Emerging Markets Small Mid Cap Equity Fund
Change in value of a hypothetical $1,000,000 investment in the Fund’s Institutional Shares from December 17, 2014 to September 30, 2021
Average Annual Total Returns as of September 30, 2021
|
One Year Return |
Five Year Return |
Since Inception Return |
Gross Expense Ratio * |
Net Expense Ratio * | ||||||
| Institutional Shares |
37.60% | 12.85% | 12.70% | 1.88% | 1.49% | |||||
| Advisor Shares |
37.50% | 12.72% | 12.59% | 1.98% | 1.59% | |||||
| MSCI Emerging Markets Small Cap Index | 43.24% | 9.75% | 7.87% | - | - |
Data as of September 30, 2021. The Fund’s performance reflects the performance of the predecessor JOHCM Emerging Markets Small Mid Cap Equity Fund of the Advisers Investment Trust for periods prior to the reorganization into the JOHCM Funds Trust on July 19, 2021. The performance also reflects the reinvestment of dividends as well as the impact of transaction costs and the deduction of fees and expenses. The performance does not reflect taxes that a shareholder would pay on Fund distributions or on the redemption of Fund shares.
The Institutional Shares and Advisor Shares of the Fund commenced operations on July 19, 2021. Historical performance for Institutional Shares and Advisor Shares prior to their inception is based on performance of predecessor share classes of the JOHCM Emerging Markets Small Mid Cap Equity Fund of the Advisers Investment Trust.
Historical performance for Advisor Shares prior to its inception is based on the performance of the Class I Shares predecessor share class. Class I Shares predecessor share class performance is based on performance of the Institutional Shares predecessor share class prior to the Class I Shares predecessor share class inception date. Performance of the Class I Shares predecessor share class was adjusted to reflect differences in expense.
* Expense ratios are per the most recent Fund Prospectus dated February 12, 2021, as revised July 19, 2021. The Adviser has entered into a contractual expense limitation agreement with respect to Fund until June 30, 2022.
The performance data quoted represents past performance; past performance does not guarantee future results. The investment return and principal value of an investment will fluctuate so that an investor’s shares, when redeemed, may be worth more or less than their original cost. The Fund’s current performance may be lower or higher than the performance data quoted. Investors may
vii
JOHCM FUNDS TRUST
PORTFOLIO COMMENTARY
September 30, 2021 (Unaudited)
obtain performance information current to the most recent month-end, within 7 business days, by calling 866-260-9549 or 312-557-5913.
The Fund’s benchmark for performance comparison purposes is the Morgan Stanley Capital International (“MSCI”) Emerging Markets Small Cap Index. The Index includes small cap representation across 26 Emerging Markets countries and covers approximately 14% of the free float-adjusted market capitalization in each country. The table reflects the theoretical reinvestment of dividends on securities in the Index. The impact of transaction costs and the deduction of expenses associated with a mutual fund, such as investment management and administration fees, are not reflected in the Index calculations. It is not possible to invest directly in an index.
Investment Philosophy and Process
The investment objective of the JOHCM Emerging Markets Small Mid Cap Equity Fund (the “Fund”) is to seek long-term capital appreciation. The Fund invests, under normal market conditions, at least 80% of its assets (net assets plus the amount of borrowings for investment purposes) in equity securities issued by small and medium capitalization companies that are listed in, or whose principal business activities are located in, emerging markets, including frontier markets.
Performance
The Fund’s Institutional share class returned 37.60% for the 12-month period to September 30, 2021 versus a return of 43.24% achieved by its benchmark, the MSCI Emerging Markets Small Cap NR Index, for the same period.
The portfolio underperformed over the year with stock selection, chiefly within the materials sector, weighing on relative returns. There were positives, however, with strength among our healthcare, consumer discretionary and industrials holdings going some way to offset this weakness. Sector allocation effects were broadly neutral over the period.
Chinese sports shoe retailer Xtep was the top performer, benefiting from strong sales growth. This was partly due to the success of its new professional running shoes which are popular among professional marathon runners in China. Indian Energy exchange also did well on the back of increasing market share and the successful launch of new products.
Turning to the laggards, New Horizon Health, a Chinese developer of cancer screening technology, suffered on the back of fears over increasing regulations within the Chinese pharma sector.
We have been approaching our top-down framework from the point of view of rising inflation, and the need for central banks to take action. No doubt the can will be kicked further down the road but yields are rising again and another rotation towards cyclicals is beginning. From a country perspective, India has been a strong performer, benefiting from capital flows out of China. Today though, the market is somewhat extended, in our view, while the country currently faces the tough reality of a higher oil price. We are therefore becoming more selective whilst also looking at countries which are beneficiaries of the current oil and gas situation.
viii
JOHCM FUNDS TRUST
PORTFOLIO COMMENTARY
September 30, 2021 (Unaudited)
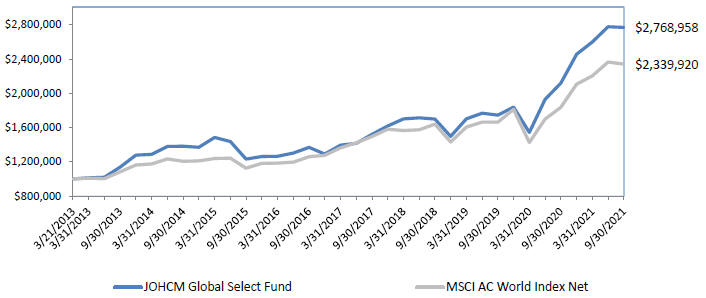
JOHCM Global Select Fund
Change in value of a hypothetical $1,000,000 investment in the Fund’s Institutional Shares from March 21, 2013 to September 30, 2021
Average Annual Total Returns as of September 30, 2021
| One Year Return |
Five Year Return |
Since Inception Return |
Gross Expense Ratio * |
Net Expense Ratio * | ||||||
| Institutional Shares
|
30.71%
|
15.15%
|
12.68%
|
0.98%
|
0.98%
| |||||
| Advisor Shares
|
30.60%
|
15.04%
|
12.59%
|
1.08%
|
1.08%
| |||||
| MSCI ACWI
|
27.44%
|
13.20%
|
10.48%
|
-
|
-
|
Data as of September 30, 2021. The Fund’s performance reflects the performance of the predecessor JOHCM Global Equity Fund of the Advisers Investment Trust and the predecessor JOHCM Global Equity Fund of the Scotia Institutional Fund for periods prior to the reorganization into the JOHCM Funds Trust on July 19, 2021. The performance also reflects the reinvestment of dividends as well as the impact of transaction costs and the deduction of fees and expenses. The performance does not reflect taxes that a shareholder would pay on Fund distributions or on the redemption of Fund shares.
The Institutional Shares and Advisor Shares of the Fund commenced operations on July 19, 2021. Historical performance for Institutional Shares and Advisor Shares prior to their inception is based on performance of predecessor share classes of the predecessor JOHCM Global Equity Fund of the Advisers Investment Trust and the predecessor JOHCM Global Equity Fund of the Scotia Institutional Fund.
* Expense ratios are per the most recent Fund Prospectus dated February 12, 2021, as revised July 19, 2021. The Adviser has entered into a contractual expense limitation agreement with respect to Fund until June 30, 2022.
The performance data quoted represents past performance; past performance does not guarantee future results. The investment return and principal value of an investment will fluctuate so that an investor’s shares, when redeemed, may be worth more or less than their original cost. The Fund’s current performance may be lower or higher than the performance data quoted. Investors may obtain performance information current to the most recent month-end, within 7 business days, by calling 866-260-9549 or 312-557-5913.
ix
JOHCM FUNDS TRUST
PORTFOLIO COMMENTARY
September 30, 2021 (Unaudited)
The Fund’s benchmark for performance comparison purposes is the Morgan Stanley Capital International (“MSCI”) All Country World Index (ACWI). The Index is a free float-adjusted market capitalization weighted index that is designed to measure the equity market performance of developed and emerging markets. The table reflects the theoretical reinvestment of dividends on securities in the Index. The impact of transaction costs and the deduction of expenses associated with a mutual fund, such as investment management and administration fees, are not reflected in the Index calculations. It is not possible to invest directly in an index.
Investment Philosophy and Process
To seek to achieve its investment objective of long-term capital appreciation, the Fund employs a growth at a reasonable price (GARP) investment philosophy, which is sometimes described as a core focus with a growth bias. The Fund seeks to own stocks, sectors and countries with positive earnings surprise, sustainably high or increasing return on equity, and attractive valuations. The Fund managers believe they can increase the probability of finding an attractive stock by looking where traditional growth investors tend to ignore. While the Fund’s managers seek to own stocks with idiosyncratic return patterns, they also recognize that many stocks have varying degrees of beta or correlation to their sector or country, so they also maintain a top-down research focus when constructing the portfolio. The Fund’s management team offers the unique capability of blending both a bottom-up and a top-down investment research approach to the portfolio construction process.
Performance
The Fund’s Institutional share class returned 30.71% for the 12-month period to September 30, 2021 versus a return of 27.44% achieved by its benchmark, the MSCI AC World NR Index, for the same period. The Fund performed well over the year with stock selection, particularly within technology, healthcare and industrials, driving relative returns. These positives offset modest weakness among our financials and materials holdings. Sector allocation effects weighed on relative returns as our zero-weighting in energy provided a drag given surging prices towards the end of the period.
Looking at individual stock performers, technology holdings Atlassian, ASML and Keysight Technologies added value. Chart Industries was the top performer. On the negative side of the ledger The a2 Milk Company and Peptidream lagged.
Many investors seem dogmatically stuck on the ‘Value’ versus ‘Growth’ debate when the truth is pragmatically somewhere in the middle, depending on the business cycle. This is why we combine Growth, Value and Momentum factors over the cycle. Value usually performs best during the first year of an economic recovery, when earnings growth rates are accelerating. Growth then usually performs better after that, as earnings growth rates start to decelerate - which appears to be what is now starting to happen. Year to date, Value and Growth performance has been roughly equal, while the Momentum factor has significantly underperformed as it was whipsawed by several rotations between Value and Growth.
We were buyers of September’s dip, moving to 75% bullish and 25% bearish. The highest probability outcome is still “one of the biggest ever equity bull markets, followed by one of the biggest ever equity bear markets” but some early warning signs are flashing so we will keep an open mind in a fast changing world. We are positioned for a Q4 rally, and expect continued volatility and market rotations in 2022.
If policy makers recognise and react to slowing growth, we will probably move to 80% bullish, 20% bearish, if not, we will probably get more bearish.
x
JOHCM FUNDS TRUST
PORTFOLIO COMMENTARY
September 30, 2021 (Unaudited)
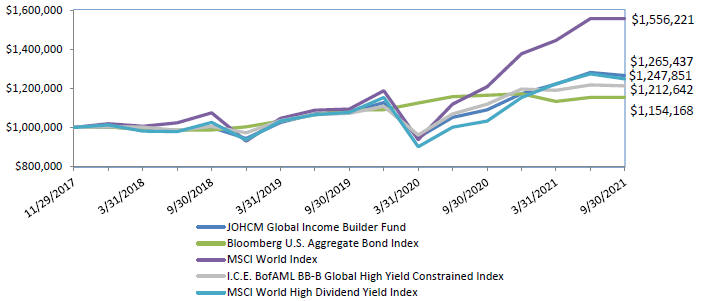
JOHCM Global Income Builder
Change in value of a hypothetical $1,000,000 investment in the Fund’s Institutional Shares from November 29, 2017 to September 30, 2021
Average Annual Total Returns as of September 30, 2021
| One Year Return |
Since Inception Return |
Gross Expense Ratio * |
Net Expense Ratio * | |||||
| Institutional Shares
|
16.12%
|
6.33%
|
0.89%
|
0.74%
| ||||
| Advisor Shares
|
16.01%
|
6.22%
|
0.99%
|
0.84%
| ||||
| Investor Shares
|
15.88%
|
6.09%
|
1.14%
|
0.99%
| ||||
| Bloomberg US Aggregate Bond Index
|
(0.90%)
|
3.81%
|
-
|
-
| ||||
| I.C.E. BofAML BB-B Global High Yield Constrained Index
|
8.37%
|
5.16%
|
-
|
- | ||||
| MSCI World Index
|
28.82%
|
12.22%
|
-
|
-
| ||||
| MSCI World High Dividend Yield Index
|
20.84%
|
5.94%
|
-
|
-
|
Data as of September 30, 2021. The Fund’s performance reflects the performance of the predecessor JOHCM Global Income Builder Fund of the Advisers Investment Trust for periods prior to the reorganization into the JOHCM Funds Trust on July 19, 2021. The performance also reflects the reinvestment of dividends as well as the impact of transaction costs and the deduction of fees and expenses. The performance does not reflect taxes that a shareholder would pay on Fund distributions or on the redemption of Fund shares.
The Institutional Shares, Advisor Shares, and Investor Shares of the Fund commenced operations on July 19, 2021. Historical performance for Institutional Shares, Advisor Shares, and Investor Shares prior to their inception is based on performance of predecessor share classes of the JOHCM Global Income Builder Fund of the Advisers Investment Trust.
Historical performance for Investor Shares prior to its inception is based on the performance of the Class II Shares predecessor share class. Class II Shares predecessor share class performance is based on performance of the Institutional Shares predecessor share class prior to the Class II Shares predecessor share class inception date. Performance of the Class II Shares predecessor share class was adjusted to reflect differences in expense.
xi
JOHCM FUNDS TRUST
PORTFOLIO COMMENTARY
September 30, 2021 (Unaudited)
* Expense ratios are per the most recent Fund Prospectus dated February 12, 2021, as revised July 19, 2021. The Adviser has entered into a contractual expense limitation agreement with respect to Fund until June 30, 2022.
The performance data quoted represents past performance; past performance does not guarantee future results. The investment return and principal value of an investment will fluctuate so that an investor’s shares, when redeemed, may be worth more or less than their original cost. The Fund’s current performance may be lower or higher than the performance data quoted. Investors may obtain performance information current to the most recent month-end, within 7 business days, by calling 866-260-9549 or 312-557-5913.
The Fund’s benchmarks for performance comparison purposes are the: Bloomberg US Aggregate Bond Index, I.C.E. BofAML BB-B Global High Yield Constrained Index, Morgan Stanley Capital International (“MSCI”) World Index and MSCI World High Dividend Yield Index. The Bloomberg US Aggregate Bond Index is a broad-based benchmark that measures the investment grade U.S. dollar-denominated, fixed-rate taxable bond market, including Treasuries, government-related and corporate securities, MBS (agency fixed-rate and hybrid ARM passthroughs), ABS, and CMBS. The I.C.E. BofAML BB-B Global High Yield Constrained Index contains all securities in The I.C.E. BofAML Global High Yield Index rated BB1 through B3, based on an average of Moody’s, S&P and Fitch, but caps issuer exposure at 2%. The MSCI World Index is a broad global equity index that represents large and mid-cap equity performance across 23 developed market countries. The MSCI World High Dividend Yield Index is based on the MSCI World Index, its parent index, and includes large and mid-cap stocks across 23 developed markets countries. The index is designed to reflect the performance of equities in the parent index (excluding REITs) with higher dividend income and quality characteristics than average dividend yields that are both sustainable and persistent. The table reflects the theoretical reinvestment of dividends on securities in the Indices. The impact of transaction costs and the deduction of expenses associated with a mutual fund, such as investment management and administration fees, are not reflected in the Indices calculations. It is not possible to invest directly in an index.
Investment Philosophy and Process
The Fund aims to generate meaningful monthly income distributions and long-term capital appreciation by applying a global value investment philosophy to income-generative assets. The Fund invests in global equities and fixed income but may also hold cash and hedging assets e.g. commodity-linked investment instruments such as exchange traded funds that invest in gold and precious metals. The investment team has a long-term, absolute return-oriented investment philosophy and believes their highest priority is to protect the capital they manage from permanent impairment.
Performance
The Fund’s Institutional share class returned 16.12% for the 12-month period to September 30, 2021. Our top contributors among our equity holdings included several technology shares, namely Oracle, which benefited from its strong earnings and outlook. Microsoft and Alphabet also performed well. A commercial real estate REIT, Columbia Property Trust, also contributed positively, thanks to the announcement of a go-private transaction following a strategic review. Italian asset manager Azimut advanced with strong AUM development.
Our top detractor among our equity holdings was European utility Enel, which was negatively impacted by Spanish government actions against certain power generation businesses. Tencent Holdings was in the crosshairs of Chinese regulation seeking to prevent excessive youth involvement with video games. Elsewhere Samsung Electronics lost some ground amid concerns of supply-chain impacts.
While risk assets have generally performed extremely well from the depths of the pandemic market crisis of 2020, and in this later phase of post-vaccine recovery, we continue to see upside potential and reasonably attractive valuation in many areas. Strong demand paired with supply-side shortages may benefit a wide range of businesses, as we continue to identify a generally reflationary market regime. At the same time, we are cautious about the potential for rising interest rates, which could undermine the positive impact of earnings growth. We continue to have relatively more exposure to the opportunity set in equity markets, given the low interest rate and tight credit spread environment. However, we continue to see pockets of opportunity in credit, by taking advantage of equity optionality within certain convertible bonds, for example.
xii
JOHCM FUNDS TRUST
PORTFOLIO COMMENTARY
September 30, 2021 (Unaudited)
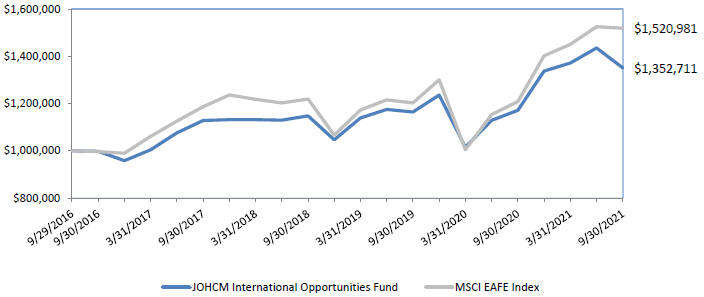
JOHCM International Opportunities Fund
Change in value of a hypothetical $1,000,000 investment in the Fund’s Institutional Shares from September 29, 2016 to September 30, 2021
Average Annual Total Returns as of September 30, 2021
| One Year Return |
Five Year Return |
Since Inception Return |
Gross Expense Ratio * |
Net Expense Ratio * | ||||||
|
Institutional Shares |
15.39% | 6.27% | 6.22% | 3.17% | 0.88% | |||||
|
MSCI EAFE Index |
25.73% | 8.81% | 8.74% | - | - |
Data as of September 30, 2021. The Fund’s performance reflects the performance of the predecessor JOHCM International Opportunities Fund of the Advisers Investment Trust for periods prior to the reorganization into the JOHCM Funds Trust on July 19, 2021. The performance also reflects the reinvestment of dividends as well as the impact of transaction costs and the deduction of fees and expenses. The performance does not reflect taxes that a shareholder would pay on Fund distributions or on the redemption of Fund shares.
The Institutional Shares of the Fund commenced operations on July 19, 2021. Historical performance for Institutional Shares prior to their inception is based on performance of the predecessor share class of the JOHCM International Opportunities Fund of the Advisers Investment Trust.
* Expense ratios are per the most recent Fund Prospectus dated February 12, 2021, as revised July 19, 2021. The Adviser has entered into a contractual expense limitation agreement with respect to Fund until June 30, 2022.
The performance data quoted represents past performance; past performance does not guarantee future results. The investment return and principal value of an investment will fluctuate so that an investor’s shares, when redeemed, may be worth more or less than their original cost. The Fund’s current performance may be lower or higher than the performance data quoted. Investors may obtain performance information current to the most recent month-end, within 7 business days, by calling 866-260-9549 or 312-557-5913.
The Fund’s benchmark for performance comparison purposes is the Morgan Stanley Capital International (“MSCI”) Europe, Australasia and Far East (“EAFE”) Index. The Index is a free float-adjusted market capitalization index that is designed to measure the equity market performance of developed markets, excluding the US & Canada. The table reflects the theoretical reinvestment of
xiii
JOHCM FUNDS TRUST
PORTFOLIO COMMENTARY
September 30, 2021 (Unaudited)
dividends on securities in the Index. The impact of transaction costs and the deduction of expenses associated with a mutual fund, such as investment management and administration fees, are not reflected in the Index calculations. It is not possible to invest directly in an index.
Investment Philosophy and Process
The investment objective of the JOHCM International Opportunities Fund (the “Fund”) is to achieve long-term total return by investing in a focused portfolio of international equity securities. The Fund invests, under normal market conditions, primarily in equity securities of companies headquartered outside the US, including those in emerging markets. The Fund may invest in foreign companies of any size, including small- and mid-capitalisation companies, in order to achieve its objective. Equity securities include common and preferred stocks, rights and warrants. The Fund may also invest in equity related instruments, such as equity linked notes and participation notes, all of which derive their value from equities. The portfolio typically contains 25 to 40 stocks.
Performance
The Fund’s Institutional share class returned 15.39% for the 12-month period to September 30, 2021 versus a return of 25.73% achieved by its benchmark, the MSCI EAFE NR Index, for the same period. The portfolio underperformed over the year with our utilities the main source of weakness as Enel and Iberdrola lagging amidst surging gas and electricity prices. Enel also suffered on the back of negative regulatory developments in Spain.
Strong market leadership by market extremes tends to be a clear headwind for relative performance. Banks, energy and miners tend to be the most geared beneficiaries of an inflationary environment. On the other hand recent history provides plenty of examples of a narrowly tech/growth-led market which we have tended to underperform despite the solid growth profile of many of the companies in the portfolio. Clearly in absolute terms there is always risk from poor operational execution by any of our portfolio companies, although we mitigate this risk by focusing on diversified businesses with low operational and/or financial gearing. Finally, again in absolute terms, it is almost impossible to predict how we will perform in a disorderly market sell-off after a long period of complacency – although we would expect to perform well in relative terms, as we have done in previous periods.
The equity market has moved into “shoot first, ask questions later” mode. This reflects the combination of complacency and “no alternative” reluctance which had supported the unbroken rally from November to August. The major macro concern currently is stagflation, where inflation is driven by supply-side weakness, not demand-side strength. The difference is particularly important for cyclicals, which is why there are currently few hiding places. There are plenty of sector-specific issues emerging, which the market is having to digest - not least political and regulatory. The challenge is to work out which are genuine buying opportunities and which are value traps. As ever, diversification and balance sheet strength will be important differentiators.
The outlook for inflation and monetary policy is clearly going to be critical, as well as the ongoing post-Covid recovery. A calm ‘mid-cycle’ environment of gentle economic recovery likely allows for outperformance of quality names with idiosyncratic growth potential, as market leadership by either extreme growth or geared cyclicals becomes less dominant. There is plenty of potential for much greater volatility, especially if supply side tightness and disruption creates extreme commodity-led inflation and concerns about stagflation.
xiv
JOHCM FUNDS TRUST
PORTFOLIO COMMENTARY
September 30, 2021 (Unaudited)
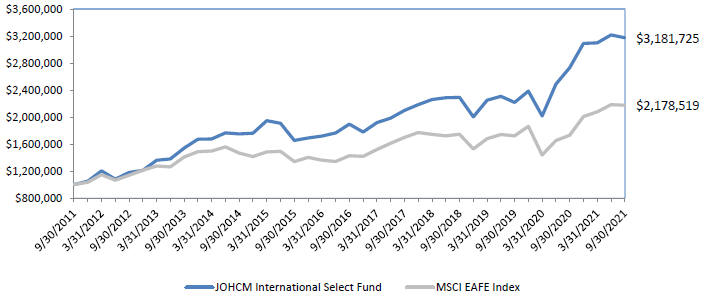
JOHCM International Select Fund
Change in value of a hypothetical $1,000,000 investment in the Fund’s Institutional Shares from September 30, 2011 to September 30, 2021
Average Annual Total Returns as of September 30, 2021
| One Year Return |
Five Year Return |
Ten Year Return |
Gross Expense Ratio * |
Net Expense Ratio * | ||||||
|
Institutional Shares |
16.24% | 10.88% | 12.27% | 0.98% | 0.98% | |||||
|
Investor Shares |
15.94% | 10.60% | 11.99% | 1.21% | 1.21% | |||||
|
MSCI EAFE Index |
25.73% | 8.81% | 8.10% | - | - |
Data as of September 30, 2021. The Fund’s performance reflects the performance of the predecessor JOHCM International Select Fund of the Advisers Investment Trust and the predecessor JOHCM International Select Fund of the Scotia Institutional Fund for periods prior to the reorganization into the JOHCM Funds Trust on July 19, 2021. The performance also reflects the reinvestment of dividends as well as the impact of transaction costs and the deduction of fees and expenses. The performance does not reflect taxes that a shareholder would pay on Fund distributions or on the redemption of Fund shares.
The Institutional Shares and Investor Shares of the Fund commenced operations on July 19, 2021. Historical performance for Institutional Shares and Investor Shares prior to their inception is based on performance of predecessor share classes of the predecessor JOHCM International Select Fund of the Advisers Investment Trust and the predecessor JOHCM International Select Fund of the Scotia Institutional Fund.
Historical performance for Investor Shares prior to its inception is based on the performance of the Class II Shares predecessor share class. Class II Shares predecessor share class performance is based on performance of the Class I Shares predecessor share class prior to the Class II Shares predecessor share class inception date. Performance of the Class II Shares predecessor share class was adjusted to reflect differences in expense.
* Expense ratios are per the most recent Fund Prospectus dated February 12, 2021, as revised July 19, 2021. The Adviser has entered into a contractual expense limitation agreement with respect to Fund until June 30, 2022.
The performance data quoted represents past performance; past performance does not guarantee future results. The investment return and principal value of an investment will fluctuate so that an investor’s shares, when redeemed, may be worth more or less
xv
JOHCM FUNDS TRUST
PORTFOLIO COMMENTARY
September 30, 2021 (Unaudited)
than their original cost. The Fund’s current performance may be lower or higher than the performance data quoted. Investors may obtain performance information current to the most recent month-end, within 7 business days, by calling 866-260-9549 or 312-557-5913.
The Fund’s benchmark for performance comparison purposes is the Morgan Stanley Capital International (“MSCI”) Europe, Australasia and Far East (“EAFE”) Index. The Index is a free float-adjusted market capitalization index that is designed to measure the equity market performance of developed markets, excluding the US & Canada. The table reflects the theoretical reinvestment of dividends on securities in the Index. The impact of transaction costs and the deduction of expenses associated with a mutual fund, such as investment management and administration fees, are not reflected in the Index calculations. It is not possible to invest directly in an index.
Investment Philosophy and Process
To seek to achieve its investment objective of long-term capital appreciation, the Fund employs a growth at a reasonable price (GARP) investment philosophy, which is sometimes described as a core focus with a growth bias. The Fund seeks to own stocks, sectors and countries with positive earnings surprise, sustainably high or increasing return on equity, and attractive valuations. The Fund managers believe they can increase the probability of finding an attractive stock by looking where traditional growth investors tend to ignore. While the Fund’s managers seek to own stocks with idiosyncratic return patterns, they also recognize that many stocks have varying degrees of beta or correlation to their sector or country, so they also maintain a top-down research focus when constructing the portfolio. The Fund’s management team offers the unique capability of blending both a bottom-up and a top-down investment research approach to the portfolio construction process.
Performance
The Fund’s Institutional share class returned 16.24% for the 12-month period to September 30, 2021 versus a return of 25.73% achieved by its benchmark, the MSCI EAFE NR Index, for the same period.
Underperformance over the year came largely from challenging stock selection with our financials and consumer discretionary holdings the main source of weakness, offsetting strength in our technology holdings. Sector allocation effects were also negative as our zero-weighting in energy weighed on relative returns after the rally towards the end of the period. Individual stocks of note include our technology names, Advantest and MediaTek while auto parts company Aptiv also added value. On the negative side The a2 Milk Company and Peptidream were the main laggards.
Many investors seem dogmatically stuck on the ‘Value’ versus ‘Growth’ debate when the truth is pragmatically somewhere in the middle, depending on the business cycle. This is why we combine Growth, Value and Momentum factors over the cycle. Value usually performs best during the first year of an economic recovery, when earnings growth rates are accelerating. Growth then usually performs better after that, as earnings growth rates start to decelerate - which appears to be what is now starting to happen. Year to date, Value and Growth performance has been roughly equal, while the Momentum factor has significantly underperformed as it was whipsawed by several rotations between Value and Growth.
We were buyers of September’s dip, moving to 75% bullish and 25% bearish. The highest probability outcome is still “one of the biggest ever equity bull markets, followed by one of the biggest ever equity bear markets” but some early warning signs are flashing so we will keep an open mind in a fast changing world. We are positioned for a Q4 rally, and expect continued volatility and market rotations in 2022.
If policy makers recognise and react to slowing growth, we will probably move to 80% bullish, 20% bearish, if not, we will probably get more bearish.
xvi
JOHCM FUNDS TRUST
JOHCM CREDIT INCOME FUND
September 30, 2021
| Percentage Assets |
Shares | Value | ||||||||||
| COMMON STOCKS |
0.2% | |||||||||||
| Holding Companies-Diversified |
0.2% | |||||||||||
| Alpha Capital Acquisition Co.(a) |
428 | $ | 4,263 | |||||||||
| Austerlitz Acquisition Corp. II(a) |
634 | 6,245 | ||||||||||
| CC Neuberger Principal Holdings III(a) |
104 | 1,035 | ||||||||||
| Northern Star Investment Corp. III(a) |
211 | 2,080 | ||||||||||
|
|
|
|||||||||||
| 13,623 | ||||||||||||
|
|
|
|||||||||||
| TOTAL COMMON STOCKS (Cost $13,785) |
13,623 | |||||||||||
|
|
|
|||||||||||
| Percentage of Net Assets |
Principal Amount | Value | ||||||||||
| CONVERTIBLE BONDS |
15.9% | |||||||||||
| Biotechnology |
2.3% | |||||||||||
| Innoviva, Inc. |
$ | 100,000 | 120,108 | |||||||||
|
|
|
|||||||||||
| Internet |
3.0% | |||||||||||
| Airbnb, Inc. |
50,000 | 49,125 | ||||||||||
| Spotify U.S.A., Inc. |
70,000 | 63,070 | ||||||||||
| Twitter, Inc. |
50,000 | 46,417 | ||||||||||
|
|
|
|||||||||||
| 158,612 | ||||||||||||
|
|
|
|||||||||||
| Media |
5.7% | |||||||||||
| Liberty Broadband Corp. |
100,000 | 105,564 | ||||||||||
| Liberty Latin America Ltd. |
190,000 | 192,850 | ||||||||||
|
|
|
|||||||||||
| 298,414 | ||||||||||||
|
|
|
|||||||||||
| Software |
4.9% | |||||||||||
| Alteryx, Inc. |
70,000 | 64,575 | ||||||||||
| Envestnet, Inc. |
100,000 | 101,175 | ||||||||||
| Fastly, Inc. |
110,000 | 92,538 | ||||||||||
|
|
|
|||||||||||
| 258,288 | ||||||||||||
|
|
|
|||||||||||
| TOTAL CONVERTIBLE BONDS (Cost $819,862) |
835,422 | |||||||||||
|
|
|
|||||||||||
| CORPORATE BONDS |
60.8% | |||||||||||
| Advertising |
4.0% | |||||||||||
| Advantage Sales & Marketing, Inc. |
200,000 | 208,448 | ||||||||||
|
|
|
|||||||||||
| Aerospace/Defense |
4.1% | |||||||||||
| Boeing (The) Co. |
80,000 | 106,637 | ||||||||||
| Hexcel Corp. |
100,000 | 109,242 | ||||||||||
|
|
|
|||||||||||
| 215,879 | ||||||||||||
|
|
|
|||||||||||
See Notes to Financial Statements.
1
JOHCM FUNDS TRUST
JOHCM CREDIT INCOME FUND
SCHEDULE OF INVESTMENTS
September 30, 2021
| Percentage Assets |
Principal Amount | Value | ||||||||||
| Banks |
4.1% | |||||||||||
| Bank of America Corp. |
||||||||||||
| (Variable, ICE LIBOR USD 3M + 2.66%) 4.30%, 01/28/25(c) |
$ | 105,000 | $ | 106,838 | ||||||||
| JPMorgan Chase & Co. |
||||||||||||
| (Variable, U.S. SOFR + 2.75%) 4.00%, 04/01/25(c) |
105,000 | 105,446 | ||||||||||
|
|
|
|||||||||||
| 212,284 | ||||||||||||
|
|
|
|||||||||||
| Commercial Services |
2.0% | |||||||||||
| Graham Holdings Co. |
100,000 | 104,430 | ||||||||||
|
|
|
|||||||||||
| Diversified Financial Services |
3.2% | |||||||||||
| Charles Schwab Corp. (The) |
||||||||||||
| (Variable, U.S. Treasury Yield Curve Rate CMT 5Y + 4.97%) 5.38%, 06/01/25(c) |
150,000 | 166,688 | ||||||||||
|
|
|
|||||||||||
| Electrical Component & Equipments |
2.1% | |||||||||||
| WESCO Distribution, Inc. |
100,000 | 110,750 | ||||||||||
|
|
|
|||||||||||
| Food |
3.3% | |||||||||||
| JBS U.S.A. LUX S.A./JBS U.S.A. Food Co./JBS U.S.A. Finance, Inc. |
100,000 | 111,750 | ||||||||||
| Post Holdings, Inc. |
60,000 | 62,354 | ||||||||||
|
|
|
|||||||||||
| 174,104 | ||||||||||||
|
|
|
|||||||||||
| Healthcare-Services |
4.0% | |||||||||||
| Encompass Health Corp. |
150,000 | 157,657 | ||||||||||
| IQVIA, Inc. |
50,000 | 51,244 | ||||||||||
|
|
|
|||||||||||
| 208,901 | ||||||||||||
|
|
|
|||||||||||
| Internet |
13.9% | |||||||||||
| Go Daddy Operating Co. LLC/GD Finance Co., Inc. |
120,000 | 125,100 | ||||||||||
| GrubHub Holdings, Inc. |
100,000 | 103,750 | ||||||||||
| Netflix, Inc. |
110,000 | 139,150 | ||||||||||
| TripAdvisor, Inc. |
190,000 | 201,400 | ||||||||||
| Uber Technologies, Inc. |
150,000 | 158,531 | ||||||||||
|
|
|
|||||||||||
| 727,931 | ||||||||||||
|
|
|
|||||||||||
| Machinery-Diversified |
1.0% | |||||||||||
| Flowserve Corp. |
50,000 | 52,209 | ||||||||||
|
|
|
|||||||||||
See Notes to Financial Statements.
2
JOHCM FUNDS TRUST
JOHCM CREDIT INCOME FUND
SCHEDULE OF INVESTMENTS
September 30, 2021
| Percentage Assets |
Principal Amount | Value | ||||||||||
| Media |
6.4% | |||||||||||
| CCO Holdings LLC/CCO Holdings Capital Corp., |
||||||||||||
| 4.00%, 03/01/23(b) |
$ | 50,000 | $ | 50,234 | ||||||||
| 5.38%, 06/01/29(b) |
150,000 | 162,000 | ||||||||||
| ViacomCBS, Inc., |
||||||||||||
| (Variable, ICE LIBOR USD 3M + 3.90%) |
10,000 | 10,125 | ||||||||||
| (Variable, ICE LIBOR USD 3M + 3.90%) |
100,000 | 114,500 | ||||||||||
|
|
|
|||||||||||
| 336,859 | ||||||||||||
|
|
|
|||||||||||
| Packing & Containers |
2.0% | |||||||||||
| Berry Global, Inc. |
75,000 | 78,754 | ||||||||||
| Plastipak Holdings, Inc. |
25,000 | 25,453 | ||||||||||
|
|
|
|||||||||||
| 104,207 | ||||||||||||
|
|
|
|||||||||||
| Pipelines |
0.5% | |||||||||||
| DCP Midstream L.P. |
||||||||||||
| (Variable, ICE LIBOR USD 3M + 5.15%) 7.38%, 12/15/22(c) |
25,000 | 24,313 | ||||||||||
|
|
|
|||||||||||
| Real Estate |
2.1% | |||||||||||
| Realogy Group LLC/Realogy Co-Issuer Corp. |
100,000 | 109,875 | ||||||||||
|
|
|
|||||||||||
| Real Estate Investment Trusts |
4.1% | |||||||||||
| MGM Growth Properties Operating Partnership L.P./MGP Finance
Co-Issuer, Inc. |
160,000 | 184,000 | ||||||||||
| SBA Communications Corp. |
30,000 | 28,987 | ||||||||||
|
|
|
|||||||||||
| 212,987 | ||||||||||||
|
|
|
|||||||||||
| Software |
2.0% | |||||||||||
| SS&C Technologies, Inc. |
100,000 | 105,593 | ||||||||||
|
|
|
|||||||||||
| Transportation |
2.0% | |||||||||||
| XPO Logistics, Inc. |
100,000 | 105,548 | ||||||||||
|
|
|
|||||||||||
| TOTAL CORPORATE BONDS (Cost $3,172,925) |
3,181,006 | |||||||||||
|
|
|
|||||||||||
| FOREIGN ISSUER BONDS |
8.3% | |||||||||||
| Beverages |
2.2% | |||||||||||
| Bacardi Ltd. |
100,000 | 115,510 | ||||||||||
|
|
|
|||||||||||
| Oil & Gas |
2.0% | |||||||||||
| BP Capital Markets PLC |
||||||||||||
| (Variable, U.S. Treasury Yield Curve Rate CMT 5Y + 4.04%) 4.38%, 06/22/25(c) |
100,000 | 106,565 | ||||||||||
|
|
|
|||||||||||
| Packing & Containers |
1.7% | |||||||||||
| OI European Group B.V. |
85,000 | 86,700 | ||||||||||
|
|
|
|||||||||||
See Notes to Financial Statements.
3
JOHCM FUNDS TRUST
JOHCM CREDIT INCOME FUND
SCHEDULE OF INVESTMENTS
September 30, 2021
| Percentage Assets |
Principal Amount | Value | ||||||||||
| Telecommunications |
2.4% | |||||||||||
| Altice France S.A. 8.13%, 02/01/27(b) |
$ | 115,000 | $ | 123,740 | ||||||||
|
|
|
|||||||||||
| TOTAL FOREIGN ISSUER BONDS (Cost $431,383) |
432,515 | |||||||||||
|
|
|
|||||||||||
| Percentage of Net Assets |
Shares | Value | ||||||||||
| PREFERRED STOCKS |
5.4% | |||||||||||
| Banks |
1.0% | |||||||||||
| Morgan Stanley (Variable, ICE LIBOR USD 3M + 3.49%) 5.85%(c) |
1,679 | 49,748 | ||||||||||
|
|
|
|||||||||||
| Real Estate Investment Trusts |
1.4% | |||||||||||
| Vornado Realty Trust 5.70% |
3,000 | 75,060 | ||||||||||
|
|
|
|||||||||||
| Telecommunications |
3.0% | |||||||||||
| 2020 Cash Mandatory Exchangeable Trust (a)(b) |
140 | 158,308 | ||||||||||
|
|
|
|||||||||||
| PREFERRED STOCKS (Cost $276,405) |
283,116 | |||||||||||
|
|
|
|||||||||||
| CLOSED-END FUNDS |
1.2% | |||||||||||
| Eagle Point Credit Co., Inc. |
4,474 | 60,936 | ||||||||||
|
|
|
|||||||||||
| TOTAL CLOSED-END FUNDS (Cost $46,682) |
60,936 | |||||||||||
|
|
|
|||||||||||
| SHORT-TERM INVESTMENTS |
7.4% | |||||||||||
| Northern Institutional Treasury Portfolio (Premier Class), 0.01%(d) |
384,500 | 384,500 | ||||||||||
|
|
|
|||||||||||
| TOTAL SHORT-TERM INVESTMENTS (Cost $384,500) |
384,500 | |||||||||||
|
|
|
|||||||||||
| TOTAL INVESTMENTS |
99.2% | 5,191,118 | ||||||||||
| NET OTHER ASSETS (LIABILITIES) |
0.8% | 42,398 | ||||||||||
|
|
|
|||||||||||
| NET ASSETS |
100.0% | $ | 5,233,516 | |||||||||
|
|
|
|||||||||||
(a)Non-income producing security.
(b)Securities purchased in a transaction exempt from registration under Rule 144A of the Securities Act of 1933. These securities may not be publicly traded without registration under the Securities Act of 1933. The value of these securities is determined by valuations supplied by a pricing service or brokers.
(c)Floating rate security. The rate presented is the rate in effect at September 30, 2021, and the related index and spread are shown parenthetically for each security.
(d)7-day current yield as of September 30, 2021 is disclosed.
See Notes to Financial Statements.
4
JOHCM FUNDS TRUST
JOHCM CREDIT INCOME FUND
SCHEDULE OF INVESTMENTS
September 30, 2021
At September 30, 2021, the JOHCM Credit Income Fund’s investments were concentrated as follows:
| Country Allocation (Unaudited) | Percentage of Net Assets |
|||
| United States |
87.2 | % | ||
| Chile |
3.7 | |||
| France |
2.4 | |||
| Bermuda |
2.2 | |||
| United Kingdom |
2.0 | |||
| Netherlands |
1.7 | |||
| Total |
99.2 | % | ||
| 5 Largest Security Positions | ||||
| Issuer | % of Net Assets | |||
| Advantage Sales & Marketing, Inc. |
4.0 | % | ||
| TripAdvisor, Inc. |
3.9 | |||
| Liberty Latin America Ltd. |
3.7 | |||
| MGM Growth Properties Operating |
3.5 | |||
| Charles Schwab Corp. (The) |
3.2 | |||
| Total |
18.3 | % | ||
See Notes to Financial Statements.
5
JOHCM FUNDS TRUST
JOHCM EMERGING MARKETS OPPORTUNITIES FUND
SCHEDULE OF INVESTMENTS
September 30, 2021
| Percentage of Net Assets |
Shares | Value | ||||||||||
| COMMON STOCKS |
96.0% | |||||||||||
| Brazil |
7.7% | |||||||||||
| Ambev S.A. - ADR |
4,247,492 | $ | 11,723,078 | |||||||||
| B3 S.A. - Brasil Bolsa Balcao |
5,364,549 | 12,550,035 | ||||||||||
| Petroleo Brasileiro S.A. - ADR |
2,790,892 | 28,857,823 | ||||||||||
| Suzano S.A. - ADR(a) |
1,044,640 | 10,446,400 | ||||||||||
|
|
|
|||||||||||
| 63,577,336 | ||||||||||||
|
|
|
|||||||||||
| Canada |
2.3% | |||||||||||
| Barrick Gold Corp. |
1,051,451 | 18,978,691 | ||||||||||
|
|
|
|||||||||||
| China |
20.8% | |||||||||||
| Anhui Conch Cement Co. Ltd. - Class H |
3,278,109 | 17,632,643 | ||||||||||
| China Construction Bank Corp. - Class H |
11,205,502 | 7,948,605 | ||||||||||
| Country Garden Services Holdings Co. Ltd. |
1,470,000 | 11,536,092 | ||||||||||
| ENN Energy Holdings Ltd. |
1,770,016 | 28,985,490 | ||||||||||
| Jiangsu Expressway Co. Ltd. - Class H |
4,758,982 | 4,817,752 | ||||||||||
| Longfor Group Holdings Ltd.(b) |
5,373,372 | 24,693,746 | ||||||||||
| Proya Cosmetics Co. Ltd. - Class A |
421,792 | 11,325,893 | ||||||||||
| Proya Cosmetics Co. Ltd. - Class A (Shanghai Exchange) |
195,992 | 5,274,337 | ||||||||||
| TravelSky Technology Ltd. - Class H |
3,370,000 | 6,495,353 | ||||||||||
| Trip.com Group Ltd. - ADR(a) |
442,566 | 13,608,905 | ||||||||||
| Tsingtao Brewery Co. Ltd. - Class H |
991,536 | 7,737,203 | ||||||||||
| Xinyi Energy Holdings Ltd. |
1,654,948 | 965,248 | ||||||||||
| Xinyi Solar Holdings Ltd. |
10,723,440 | 21,834,036 | ||||||||||
| Zhejiang Expressway Co. Ltd. - Class H |
12,319,315 | 10,162,613 | ||||||||||
|
|
|
|||||||||||
| 173,017,916 | ||||||||||||
|
|
|
|||||||||||
| Hong Kong |
5.2% | |||||||||||
| China Resources Land Ltd. |
1,751,176 | 7,365,738 | ||||||||||
| Hong Kong Exchanges & Clearing Ltd. |
526,799 | 31,975,783 | ||||||||||
| Lee & Man Paper Manufacturing Ltd. |
5,748,000 | 4,221,659 | ||||||||||
|
|
|
|||||||||||
| 43,563,180 | ||||||||||||
|
|
|
|||||||||||
| India |
16.0% | |||||||||||
| Apollo Tyres Ltd. |
1,150,776 | 3,475,414 | ||||||||||
| Container Corp. of India Ltd. |
1,234,466 | 11,655,920 | ||||||||||
| HDFC Bank Ltd. - ADR |
303,582 | 22,188,808 | ||||||||||
| ICICI Bank Ltd. - ADR |
1,510,981 | 28,512,212 | ||||||||||
| Larsen & Toubro Ltd. |
848,782 | 19,371,990 | ||||||||||
| Mahindra & Mahindra Ltd. |
1,448,551 | 15,571,676 | ||||||||||
| State Bank of India |
5,202,967 | 31,780,824 | ||||||||||
|
|
|
|||||||||||
| 132,556,844 | ||||||||||||
|
|
|
|||||||||||
| Jersey |
0.6% | |||||||||||
| Centamin PLC |
4,193,722 | 5,404,577 | ||||||||||
|
|
|
|||||||||||
| Mexico |
5.8% | |||||||||||
| Bolsa Mexicana de Valores S.A.B. de C.V. |
2,708,622 | 5,212,144 | ||||||||||
| Cemex S.A.B. de C.V. - ADR(a) |
3,719,110 | 26,666,019 | ||||||||||
See Notes to Financial Statements.
6
JOHCM FUNDS TRUST
JOHCM EMERGING MARKETS OPPORTUNITIES FUND
SCHEDULE OF INVESTMENTS
September 30, 2021
| Percentage of Net Assets |
Shares | Value | ||||||||||
| Megacable Holdings S.A.B. de C.V. - CPO |
1,414,168 | $ | 4,323,038 | |||||||||
| Wal-Mart de Mexico S.A.B. de C.V. |
3,428,580 | 11,648,684 | ||||||||||
|
|
|
|||||||||||
| 47,849,885 | ||||||||||||
|
|
|
|||||||||||
| Netherlands |
4.3% | |||||||||||
| Prosus N.V.(a) |
452,402 | 35,630,370 | ||||||||||
|
|
|
|||||||||||
| Russia |
0.8% | |||||||||||
| Globaltrans Investment PLC - REG - GDR |
833,616 | 6,643,257 | ||||||||||
|
|
|
|||||||||||
| South Africa |
5.9% | |||||||||||
| FirstRand Ltd. |
5,042,370 | 21,385,458 | ||||||||||
| Mr Price Group Ltd. |
1,173,295 | 15,673,346 | ||||||||||
| Naspers Ltd. - Class N |
73,048 | 12,037,430 | ||||||||||
|
|
|
|||||||||||
| 49,096,234 | ||||||||||||
|
|
|
|||||||||||
| South Korea |
17.8% | |||||||||||
| Cheil Worldwide, Inc. |
537,733 | 10,199,389 | ||||||||||
| NCSoft Corp. |
21,082 | 10,673,516 | ||||||||||
| Samsung Electronics Co. Ltd. |
1,079,665 | 67,197,060 | ||||||||||
| Samsung Electronics Co. Ltd. - REG - GDR |
1,125 | 1,748,733 | ||||||||||
| SK Hynix, Inc. |
288,552 | 24,881,979 | ||||||||||
| SK Telecom Co. Ltd. |
120,163 | 32,766,565 | ||||||||||
|
|
|
|||||||||||
| 147,467,242 | ||||||||||||
|
|
|
|||||||||||
| Taiwan |
6.0% | |||||||||||
| Primax Electronics Ltd. |
6,944,384 | 12,717,850 | ||||||||||
| Taiwan Cement Corp. |
4,577,000 | 8,366,247 | ||||||||||
| Tong Yang Industry Co. Ltd. |
6,827,643 | 8,292,945 | ||||||||||
| Win Semiconductors Corp. |
522,000 | 5,755,833 | ||||||||||
| Yuanta Financial Holding Co. Ltd. |
17,186,000 | 15,126,517 | ||||||||||
|
|
|
|||||||||||
| 50,259,392 | ||||||||||||
|
|
|
|||||||||||
| United Arab Emirates |
2.8% | |||||||||||
| Emaar Malls PJSC(a) |
24,272,136 | 13,198,560 | ||||||||||
| Emaar Properties PJSC |
8,777,172 | 9,738,041 | ||||||||||
|
|
|
|||||||||||
| 22,936,601 | ||||||||||||
|
|
|
|||||||||||
| TOTAL COMMON STOCKS (Cost $692,301,791) |
796,981,525 | |||||||||||
|
|
|
|||||||||||
| PREFERRED STOCKS |
0.9% | |||||||||||
| Brazil |
0.9% | |||||||||||
| Azul S.A. - ADR(a) |
357,264 | 7,166,716 | ||||||||||
|
|
|
|||||||||||
| TOTAL PREFERRED STOCKS (Cost $8,707,149) |
7,166,716 | |||||||||||
|
|
|
|||||||||||
| TOTAL INVESTMENTS |
96.9% | 804,148,241 | ||||||||||
| NET OTHER ASSETS (LIABILITIES) |
3.1% | 25,701,629 | ||||||||||
|
|
|
|||||||||||
| NET ASSETS |
100.0% | $ | 829,849,870 | |||||||||
|
|
|
|||||||||||
(a)Non-income producing security.
(b)Securities purchased in a transaction exempt from registration under Rule 144A of the Securities Act of 1933. These securities may not be publicly traded without registration under the Securities Act of 1933. The value of these securities is determined by valuations supplied by a pricing service or brokers.
See Notes to Financial Statements.
7
JOHCM FUNDS TRUST
JOHCM EMERGING MARKETS OPPORTUNITIES FUND
SCHEDULE OF INVESTMENTS
September 30, 2021
Abbreviations:
ADR – American Depositary Receipt
CPO – Certificados de Partcipatión Ordinario
GDR – Global Depositary Receipt
REG – Registered
At September 30, 2021 the industry sectors for the JOHCM Emerging Markets Opportunities Fund were:
| Sector Allocation (Unaudited) | % of Net Assets | |||
| Communication Services |
7.0 | % | ||
| Consumer Discretionary |
12.6 | |||
| Consumer Staples |
5.7 | |||
| Energy |
3.5 | |||
| Financials |
21.3 | |||
| Industrials |
7.2 | |||
| Information Technology |
16.9 | |||
| Materials |
11.1 | |||
| Real Estate |
8.0 | |||
| Utilities |
3.6 | |||
| Total |
96.9 | % | ||
See Notes to Financial Statements.
8
JOHCM FUNDS TRUST
JOHCM EMERGING MARKETS OPPORTUNITIES FUND
SCHEDULE OF INVESTMENTS
September 30, 2021
At September 30, 2021, the JOHCM Emerging Markets Opportunities Fund’s investments were concentrated as follows:
| Market Exposure (Unaudited) | ||||
| Equity Securities | % of Net Assets | |||
| Banks |
13.5 | % | ||
| Semiconductors |
12.0 | |||
| Internet |
8.7 | |||
| Real Estate |
8.0 | |||
| Diversified Financial Services |
7.8 | |||
| Building Materials |
6.3 | |||
| Telecommunications |
4.5 | |||
| Gas |
3.5 | |||
| Oil & Gas |
3.5 | |||
| Retail |
3.3 | |||
| Mining |
2.9 | |||
| Energy-Alternate Sources |
2.8 | |||
| Commercial Services |
2.6 | |||
| Beverages |
2.3 | |||
| Engineering & Construction |
2.3 | |||
| Transportation |
2.2 | |||
| Cosmetics/Personal Care |
2.0 | |||
| Auto Manufacturers |
1.9 | |||
| Computers |
1.5 | |||
| Auto Parts & Equipment |
1.4 | |||
| Forest Products & Paper |
1.3 | |||
| Advertising |
1.2 | |||
| Airlines |
0.9 | |||
| Packing & Containers |
0.5 | |||
| Total |
96.9 | % | ||
| 5 Largest Security Positions | ||||
| Issuer | % of Net Assets | |||
| Samsung Electronics Co. Ltd. |
8.1 | % | ||
| Prosus N.V |
4.3 | |||
| SK Telecom Co. Ltd. |
4.0 | |||
| Hong Kong Exchanges & Clearing Ltd. |
3.9 | |||
| State Bank of India |
3.8 | |||
| Total |
24.1 | % | ||
See Notes to Financial Statements.
9
JOHCM FUNDS TRUST
JOHCM EMERGING MARKETS SMALL MID CAP EQUITY FUND
SCHEDULE OF INVESTMENTS
September 30, 2021
| Percentage of Net Assets |
Shares | Value | ||||||||||
| COMMON STOCKS |
94.5% | |||||||||||
| Brazil |
4.9% | |||||||||||
| Aeris Industria E Comercio De Equipamentos Para Geracao De Energia S.A.(a) |
144,300 | $ | 211,717 | |||||||||
| Aliansce Sonae Shopping Centers S.A. |
52,400 | 218,616 | ||||||||||
| Cia Brasileira de Aluminio(a) |
90,000 | 231,043 | ||||||||||
| Empreendimentos Pague Menos S.A.(a) |
108,000 | 246,511 | ||||||||||
| Lojas Quero Quero S.A. |
116,982 | 349,072 | ||||||||||
| Petroreconcavo S.A. (a) |
63,400 | 234,006 | ||||||||||
| Santos Brasil Participacoes S.A.(a) |
303,000 | 441,223 | ||||||||||
| Sinqia S.A. (a) |
43,400 | 168,635 | ||||||||||
| Zenvia, Inc. - Class A(a) |
16,325 | 224,469 | ||||||||||
|
|
|
|||||||||||
| 2,325,292 | ||||||||||||
|
|
|
|||||||||||
| Canada |
3.6% | |||||||||||
| Capstone Mining Corp.(a) |
87,963 | 342,379 | ||||||||||
| Dundee Precious Metals, Inc. |
69,974 | 420,971 | ||||||||||
| ERO Copper Corp.(a) |
14,848 | 263,292 | ||||||||||
| Neo Performance Materials, Inc. |
14,831 | 205,850 | ||||||||||
| Parex Resources, Inc. |
25,999 | 472,933 | ||||||||||
|
|
|
|||||||||||
| 1,705,425 | ||||||||||||
|
|
|
|||||||||||
| Chile |
0.8% | |||||||||||
| Cia Cervecerias Unidas S.A. - ADR |
22,396 | 387,227 | ||||||||||
|
|
|
|||||||||||
| China |
5.4% | |||||||||||
| China Datang Corp. Renewable Power Co. Ltd. - Class H |
1,484,000 | 661,843 | ||||||||||
| China Yongda Automobiles Services Holdings Ltd. |
154,500 | 222,413 | ||||||||||
| New Horizon Health Ltd.(a)(b) |
42,000 | 183,231 | ||||||||||
| Sany Heavy Equipment International Holdings Co. Ltd. |
211,000 | 249,147 | ||||||||||
| Silergy Corp. |
3,313 | 486,523 | ||||||||||
| Sinopec Engineering Group Co. Ltd. - Class H |
551,500 | 279,945 | ||||||||||
| Sinotrans Ltd. - Class H |
805,000 | 314,744 | ||||||||||
| Xtep International Holdings Ltd. |
128,000 | 176,768 | ||||||||||
|
|
|
|||||||||||
| 2,574,614 | ||||||||||||
|
|
|
|||||||||||
| Colombia |
0.4% | |||||||||||
| Tecnoglass, Inc. |
9,545 | 207,413 | ||||||||||
|
|
|
|||||||||||
| France |
0.6% | |||||||||||
| Vicat S.A. |
5,874 | 260,342 | ||||||||||
|
|
|
|||||||||||
| Greece |
2.6% | |||||||||||
| Eurobank Ergasias Services and Holdings S.A.(a) |
463,959 | 434,439 | ||||||||||
| Motor Oil Hellas Corinth Refineries S.A.(a) |
17,414 | 265,690 | ||||||||||
| Mytilineos S.A. |
13,339 | 217,636 | ||||||||||
| Star Bulk Carriers Corp. |
12,570 | 302,183 | ||||||||||
|
|
|
|||||||||||
| 1,219,948 | ||||||||||||
|
|
|
|||||||||||
| Hong Kong |
5.9% | |||||||||||
| Bosideng International Holdings Ltd. |
342,000 | 241,432 | ||||||||||
| China Power International Development Ltd. |
1,124,000 | 594,805 | ||||||||||
| CIMC Enric Holdings Ltd. |
540,000 | 642,804 | ||||||||||
See Notes to Financial Statements.
10
JOHCM FUNDS TRUST
JOHCM EMERGING MARKETS SMALL MID CAP EQUITY FUND
SCHEDULE OF INVESTMENTS
September 30, 2021
| Percentage of Net Assets |
Shares | Value | ||||||||||
| Pacific Basin Shipping Ltd. |
557,000 | $ | 257,949 | |||||||||
| Pax Global Technology Ltd. |
373,000 | 467,612 | ||||||||||
| Towngas China Co. Ltd.(a) |
988,000 | 614,821 | ||||||||||
|
|
|
|||||||||||
| 2,819,423 | ||||||||||||
|
|
|
|||||||||||
| Hungary |
0.9% | |||||||||||
| Richter Gedeon Nyrt |
16,430 | 447,222 | ||||||||||
|
|
|
|||||||||||
| India |
21.3% | |||||||||||
| Aditya Birla Capital Ltd.(a) |
163,092 | 246,385 | ||||||||||
| Aegis Logistics Ltd. |
61,992 | 188,323 | ||||||||||
| Apollo Tyres Ltd. |
90,190 | 272,379 | ||||||||||
| Aster DM Healthcare Ltd.(a)(b) |
119,015 | 328,082 | ||||||||||
| Astral Ltd. |
12,517 | 362,951 | ||||||||||
| Bajaj Consumer Care Ltd. |
87,565 | 297,358 | ||||||||||
| Bajaj Electricals Ltd.(a) |
21,463 | 376,325 | ||||||||||
| Computer Age Management Services Ltd. |
5,147 | 208,823 | ||||||||||
| Dr Lal PathLabs Ltd.(b) |
13,712 | 672,293 | ||||||||||
| Finolex Cables Ltd. |
62,347 | 404,686 | ||||||||||
| Godrej Properties Ltd.(a) |
16,604 | 516,035 | ||||||||||
| Indian Energy Exchange Ltd.(b) |
118,525 | 1,020,835 | ||||||||||
| Ipca Laboratories Ltd. |
16,191 | 526,731 | ||||||||||
| KPIT Technologies Ltd. |
142,719 | 646,361 | ||||||||||
| LIC Housing Finance Ltd. |
57,835 | 328,908 | ||||||||||
| NCC Ltd. |
248,902 | 273,403 | ||||||||||
| Persistent Systems Ltd. |
6,327 | 317,050 | ||||||||||
| PNC Infratech Ltd. |
115,481 | 595,420 | ||||||||||
| PTC India Ltd. |
379,295 | 589,710 | ||||||||||
| Quess Corp. Ltd.(b) |
45,835 | 562,832 | ||||||||||
| Shriram Transport Finance Co. Ltd. |
22,824 | 396,725 | ||||||||||
| Varun Beverages Ltd. |
60,812 | 734,146 | ||||||||||
| VST Tillers Tractors Ltd. |
6,447 | 233,613 | ||||||||||
|
|
|
|||||||||||
| 10,099,374 | ||||||||||||
|
|
|
|||||||||||
| Indonesia |
2.1% | |||||||||||
| Erajaya Swasembada Tbk PT |
8,529,900 | 356,307 | ||||||||||
| Matahari Department Store Tbk PT(a) |
1,667,700 | 323,442 | ||||||||||
| Merdeka Copper Gold Tbk PT(a) |
1,903,200 | 332,276 | ||||||||||
|
|
|
|||||||||||
| 1,012,025 | ||||||||||||
|
|
|
|||||||||||
| Mexico |
2.6% | |||||||||||
| Alpek S.A.B. de C.V. |
348,700 | 396,820 | ||||||||||
| Banco del Bajio S.A.(b) |
205,000 | 387,327 | ||||||||||
| GCC S.A.B de C.V. |
60,100 | 450,280 | ||||||||||
|
|
|
|||||||||||
| 1,234,427 | ||||||||||||
|
|
|
|||||||||||
| Netherlands |
0.5% | |||||||||||
| VEON Ltd. - ADR(a) |
122,456 | 254,708 | ||||||||||
|
|
|
|||||||||||
| Philippines |
0.9% | |||||||||||
| Wilcon Depot, Inc. |
798,200 | 427,610 | ||||||||||
|
|
|
|||||||||||
See Notes to Financial Statements.
11
JOHCM FUNDS TRUST
JOHCM EMERGING MARKETS SMALL MID CAP EQUITY FUND
SCHEDULE OF INVESTMENTS
September 30, 2021
| Percentage of Net Assets |
Shares | Value | ||||||||||
| Poland |
1.6% | |||||||||||
| Asseco Poland S.A. |
11,885 | $ | 261,632 | |||||||||
| Bank Polska Kasa Opieki S.A. |
18,778 | 486,271 | ||||||||||
|
|
|
|||||||||||
| 747,903 | ||||||||||||
|
|
|
|||||||||||
| Saudi Arabia |
0.9% | |||||||||||
| United Electronics Co. |
10,975 | 417,091 | ||||||||||
|
|
|
|||||||||||
| South Africa |
3.1% | |||||||||||
| Aspen Pharmacare Holdings Ltd. |
23,748 | 426,989 | ||||||||||
| AVI Ltd. |
41,640 | 236,542 | ||||||||||
| Barloworld Ltd. |
21,999 | 179,461 | ||||||||||
| Life Healthcare Group Holdings Ltd.(a) |
210,243 | 317,973 | ||||||||||
| Truworths International Ltd. |
80,923 | 298,529 | ||||||||||
|
|
|
|||||||||||
| 1,459,494 | ||||||||||||
|
|
|
|||||||||||
| South Korea |
19.9% | |||||||||||
| AfreecaTV Co. Ltd. |
2,685 | 337,523 | ||||||||||
| DB HiTek Co. Ltd. |
6,695 | 304,047 | ||||||||||
| Dentium Co. Ltd. |
7,341 | 468,396 | ||||||||||
| DGB Financial Group, Inc. |
78,270 | 648,769 | ||||||||||
| Doosan Bobcat, Inc.(a) |
6,864 | 228,083 | ||||||||||
| Duk San Neolux Co. Ltd.(a) |
14,503 | 759,869 | ||||||||||
| Ecopro BM Co. Ltd. |
2,088 | 815,054 | ||||||||||
| Eugene Technology Co. Ltd. |
8,147 | 272,893 | ||||||||||
| Hana Materials, Inc. |
11,613 | 475,929 | ||||||||||
| Hansol Chemical Co. Ltd. |
3,046 | 883,659 | ||||||||||
| Hyundai Mipo Dockyard Co. Ltd.(a) |
4,971 | 288,704 | ||||||||||
| Iljin Materials Co. Ltd. |
5,390 | 469,807 | ||||||||||
| KH Vatec Co. Ltd.(a) |
12,016 | 236,789 | ||||||||||
| Kolon Plastic, Inc.(a) |
11,287 | 185,949 | ||||||||||
| KoMiCo Ltd. |
8,437 | 541,109 | ||||||||||
| LX Semicon Co. Ltd. |
4,539 | 382,232 | ||||||||||
| Mando Corp.(a) |
6,784 | 324,725 | ||||||||||
| Meritz Fire & Marine Insurance Co. Ltd. |
14,475 | 370,594 | ||||||||||
| Pan Ocean Co. Ltd. |
30,007 | 187,835 | ||||||||||
| PSK, Inc. |
7,985 | 244,368 | ||||||||||
| SKC Co. Ltd. |
4,254 | 595,799 | ||||||||||
| SL Corp. |
18,828 | 428,235 | ||||||||||
|
|
|
|||||||||||
| 9,450,368 | ||||||||||||
|
|
|
|||||||||||
| Taiwan |
12.6% | |||||||||||
| Alchip Technologies Ltd. |
28,000 | 927,694 | ||||||||||
| Arcadyan Technology Corp. |
76,000 | 252,979 | ||||||||||
| Bora Pharmaceuticals Co. Ltd. |
51,106 | 400,604 | ||||||||||
| Chailease Holding Co. Ltd. |
62,307 | 547,493 | ||||||||||
| E Ink Holdings, Inc. |
109,000 | 285,284 | ||||||||||
| Innodisk Corp. |
46,000 | 296,416 | ||||||||||
| Makalot Industrial Co. Ltd. |
56,000 | 491,368 | ||||||||||
See Notes to Financial Statements.
12
JOHCM FUNDS TRUST
JOHCM EMERGING MARKETS SMALL MID CAP EQUITY FUND
SCHEDULE OF INVESTMENTS
September 30, 2021
| Percentage of Net Assets |
Shares | Value | ||||||||||
| Merida Industry Co. Ltd. |
35,000 | $ | 365,700 | |||||||||
| momo.com, Inc. |
4,700 | 272,923 | ||||||||||
| Realtek Semiconductor Corp. |
24,000 | 422,951 | ||||||||||
| Sino-American Silicon Products, Inc. |
63,000 | 404,806 | ||||||||||
| Taiwan Paiho Ltd. |
137,000 | 394,975 | ||||||||||
| Voltronic Power Technology Corp. |
10,850 | 658,674 | ||||||||||
| Winbond Electronics Corp. |
294,000 | 273,855 | ||||||||||
|
|
|
|||||||||||
| 5,995,722 | ||||||||||||
|
|
|
|||||||||||
| Thailand |
2.5% | |||||||||||
| Com7 PCL - REG |
72,000 | 143,106 | ||||||||||
| JMT Network Services PCL - REG |
311,200 | 409,292 | ||||||||||
| Mega Lifesciences PCL - REG |
248,000 | 366,485 | ||||||||||
| Siam City Cement PCL - REG |
52,700 | 250,767 | ||||||||||
|
|
|
|||||||||||
| 1,169,650 | ||||||||||||
|
|
|
|||||||||||
| Turkey |
0.5% | |||||||||||
| Tofas Turk Otomobil Fabrikasi A.S. |
44,435 | 259,669 | ||||||||||
|
|
|
|||||||||||
| United States |
0.9% | |||||||||||
| Parade Technologies Ltd. |
7,000 | 407,124 | ||||||||||
|
|
|
|||||||||||
| TOTAL COMMON STOCKS (Cost $38,710,547) |
44,882,071 | |||||||||||
|
|
|
|||||||||||
| EQUITY-LINKED SECURITIES |
1.1% | |||||||||||
| India |
1.1% | |||||||||||
| Voltas Ltd., Issued by CLSA Global Markets Pte. Ltd., Maturity Date 6/30/25(a)(b) |
31,898 | 521,725 | ||||||||||
|
|
|
|||||||||||
| TOTAL EQUITY-LINKED SECURITIES (Cost $262,114) |
521,725 | |||||||||||
|
|
|
|||||||||||
| PREFERRED STOCKS |
1.3% | |||||||||||
| Brazil |
1.3% | |||||||||||
| Banco ABC Brasil S.A.(a) |
71,200 | 194,678 | ||||||||||
| Gerdau S.A. - ADR, 8.33%(c) |
81,452 | 400,744 | ||||||||||
|
|
|
|||||||||||
| 595,422 | ||||||||||||
|
|
|
|||||||||||
| TOTAL PREFERRED STOCKS (Cost $453,008) |
595,422 | |||||||||||
|
|
|
|||||||||||
| TOTAL INVESTMENTS |
96.9% | 45,999,218 | ||||||||||
| NET OTHER ASSETS (LIABILITIES) |
3.1% | 1,488,284 | ||||||||||
|
|
|
|||||||||||
| NET ASSETS |
100.0% | $ | 47,487,502 | |||||||||
|
|
|
|||||||||||
(a)Non-income producing security.
(b)Securities purchased in a transaction exempt from registration under Rule 144A of the Securities Act of 1933. These securities may not be publicly traded without registration under the Securities Act of 1933. The value of these securities is determined by valuations supplied by a pricing service or brokers.
(c)Current yield is disclosed. Dividends are calculated based on a percentage of issuer’s net income.
Abbreviations:
ADR – American Depositary Receipt
REG – Registered
See Notes to Financial Statements.
13
JOHCM FUNDS TRUST
JOHCM EMERGING MARKETS SMALL MID CAP EQUITY FUND
SCHEDULE OF INVESTMENTS
September 30, 2021
At September 30, 2021 the industry sectors for the JOHCM Emerging Markets Small Mid Cap Equity Fund were:
| Sector Allocation (Unaudited) | % of Net Assets | |||
| Communication Services |
1.3 | % | ||
| Consumer Discretionary |
12.2 | |||
| Consumer Staples |
4.0 | |||
| Energy |
2.4 | |||
| Financials |
11.5 | |||
| Health Care |
8.7 | |||
| Industrials |
17.8 | |||
| Information Technology |
19.7 | |||
| Materials |
12.6 | |||
| Real Estate |
1.5 | |||
| Utilities |
5.2 | |||
| Total |
96.9 | % | ||
See Notes to Financial Statements.
14
JOHCM FUNDS TRUST
JOHCM EMERGING MARKETS SMALL MID CAP EQUITY FUND
SCHEDULE OF INVESTMENTS
September 30, 2021
At September 30, 2021, the JOHCM Emerging Markets Small Mid Cap Fund’s investments were concentrated as follows:
| Market Exposure (Unaudited) | ||||
| Equity and Equity-Linked Securities | % of Net Assets | |||
| Semiconductors |
11.4 | % | ||
| Electric |
6.5 | |||
| Retail |
6.0 | |||
| Pharmaceuticals |
4.6 | |||
| Diversified Financial Services |
4.5 | |||
| Electronics |
3.9 | |||
| Auto Parts & Equipment |
3.5 | |||
| Mining |
3.3 | |||
| Computers |
3.2 | |||
| Banks |
3.2 | |||
| Healthcare-Services |
3.2 | |||
| Commercial Services |
3.0 | |||
| Engineering & Construction |
2.9 | |||
| Chemicals |
2.7 | |||
| Electrical Component & Equipments |
2.6 | |||
| Building Materials |
2.5 | |||
| Beverages |
2.4 | |||
| Transportation |
2.2 | |||
| Miscellaneous Manufacturing |
2.1 | |||
| Oil & Gas |
2.1 | |||
| Oil & Gas Services |
1.9 | |||
| Real Estate |
1.5 | |||
| Home Furnishings |
1.4 | |||
| Insurance |
1.3 | |||
| Gas |
1.3 | |||
| Internet |
1.3 | |||
| Distribution/Wholesale |
1.1 | |||
| Telecommunications |
1.1 | |||
| Auto Manufacturers |
1.0 | |||
| Apparel |
1.0 | |||
| Machinery-Construction & Mining |
1.0 | |||
| Healthcare-Products |
1.0 | |||
| Iron/Steel |
0.8 | |||
| Textiles |
0.8 | |||
| Leisure Time |
0.8 | |||
| Metal Fabricate/Hardware |
0.8 | |||
| Cosmetics/Personal Care |
0.6 | |||
| Shipbuilding |
0.6 | |||
| Holding Companies-Diversified |
0.5 | |||
| Software |
0.5 | |||
| Energy-Alternate Sources |
0.4 | |||
| Storage/Warehousing |
0.4 | |||
| Total |
96.9 | % | ||
| 5 Largest Security Positions | ||||
| Issuer | % of Net Assets | |||
| Indian Energy Exchange Ltd. |
2.2 | % | ||
| Alchip Technologies Ltd. |
2.0 | |||
| Hansol Chemical Co. Ltd. |
1.9 | |||
| Ecopro BM Co. Ltd. |
1.7 | |||
| Duk San Neolux Co. Ltd. |
1.6 | |||
| Total |
9.4 | % | ||
See Notes to Financial Statements.
15
JOHCM FUNDS TRUST
JOHCM GLOBAL SELECT FUND
SCHEDULE OF INVESTMENTS
September 30, 2021
| Percentage of Net Assets |
Shares | Value | ||||||||||
| COMMON STOCKS |
94.9% | |||||||||||
| Australia |
3.9% | |||||||||||
| Atlassian Corp. PLC - Class A(a) |
36,789 | $ | 14,399,951 | |||||||||
| Fortescue Metals Group Ltd. |
773,900 | 8,161,196 | ||||||||||
|
|
|
|||||||||||
| 22,561,147 | ||||||||||||
|
|
|
|||||||||||
| Canada |
2.3% | |||||||||||
| Magna International, Inc. |
176,042 | 13,245,400 | ||||||||||
|
|
|
|||||||||||
| Denmark |
6.9% | |||||||||||
| Novo Nordisk A/S - Class B |
136,840 | 13,161,966 | ||||||||||
| Orsted A/S(b) |
93,841 | 12,381,432 | ||||||||||
| Vestas Wind Systems A/S |
350,418 | 14,029,530 | ||||||||||
|
|
|
|||||||||||
| 39,572,928 | ||||||||||||
|
|
|
|||||||||||
| Germany |
1.7% | |||||||||||
| BioNTech S.E. - ADR(a) |
36,114 | 9,858,761 | ||||||||||
|
|
|
|||||||||||
| Hong Kong |
2.2% | |||||||||||
| Hong Kong Exchanges & Clearing Ltd. |
209,544 | 12,718,956 | ||||||||||
|
|
|
|||||||||||
| Ireland |
4.7% | |||||||||||
| Accenture PLC - Class A |
41,676 | 13,332,986 | ||||||||||
| Aptiv PLC(a) |
92,758 | 13,818,159 | ||||||||||
|
|
|
|||||||||||
| 27,151,145 | ||||||||||||
|
|
|
|||||||||||
| Japan |
7.0% | |||||||||||
| Recruit Holdings Co. Ltd. |
219,300 | 13,371,883 | ||||||||||
| SBI Holdings, Inc. |
507,200 | 12,513,762 | ||||||||||
| Sony Group Corp. |
126,200 | 14,053,813 | ||||||||||
|
|
|
|||||||||||
| 39,939,458 | ||||||||||||
|
|
|
|||||||||||
| Netherlands |
6.2% | |||||||||||
| ASML Holding N.V. |
15,993 | 11,797,594 | ||||||||||
| Koninklijke DSM N.V. |
62,978 | 12,587,970 | ||||||||||
| Prosus N.V.(a) |
141,205 | 11,121,053 | ||||||||||
|
|
|
|||||||||||
| 35,506,617 | ||||||||||||
|
|
|
|||||||||||
| South Korea |
2.1% | |||||||||||
| NAVER Corp. |
37,043 | 12,070,250 | ||||||||||
|
|
|
|||||||||||
| Sweden |
2.3% | |||||||||||
| Boliden AB |
399,395 | 12,848,611 | ||||||||||
|
|
|
|||||||||||
| Taiwan |
2.3% | |||||||||||
| MediaTek, Inc. |
411,748 | 13,271,999 | ||||||||||
|
|
|
|||||||||||
| United Kingdom |
4.8% | |||||||||||
| CNH Industrial N.V. |
832,643 | 13,830,200 | ||||||||||
| IHS Markit Ltd. |
117,646 | 13,719,877 | ||||||||||
|
|
|
|||||||||||
| 27,550,077 | ||||||||||||
|
|
|
|||||||||||
| United States |
48.5% | |||||||||||
| Agilent Technologies, Inc. |
78,648 | 12,389,419 | ||||||||||
| Applied Materials, Inc. |
103,566 | 13,332,051 | ||||||||||
| Avantor, Inc.(a) |
332,860 | 13,613,974 | ||||||||||
| Catalent, Inc.(a) |
98,836 | 13,152,107 | ||||||||||
See Notes to Financial Statements.
16
JOHCM FUNDS TRUST
JOHCM GLOBAL SELECT FUND
SCHEDULE OF INVESTMENTS
September 30, 2021
| Percentage of Net Assets |
Shares | Value | ||||||||||
| Chart Industries, Inc.(a) |
72,756 | $ | 13,904,399 | |||||||||
| Cree, Inc.(a) |
156,627 | 12,644,498 | ||||||||||
| Estee Lauder Cos. (The), Inc. - Class A |
42,000 | 12,597,060 | ||||||||||
| Intercontinental Exchange, Inc. |
116,518 | 13,378,597 | ||||||||||
| Intuit, Inc. |
25,183 | 13,586,480 | ||||||||||
| Keysight Technologies, Inc.(a) |
77,940 | 12,804,763 | ||||||||||
| Lam Research Corp. |
23,026 | 13,105,248 | ||||||||||
| Linde PLC |
44,467 | 13,045,729 | ||||||||||
| Micron Technology, Inc. |
187,885 | 13,336,077 | ||||||||||
| Microsoft Corp. |
46,940 | 13,233,325 | ||||||||||
| Morningstar, Inc. |
49,546 | 12,833,900 | ||||||||||
| Nasdaq, Inc. |
71,008 | 13,705,964 | ||||||||||
| NVIDIA Corp. |
62,877 | 13,025,599 | ||||||||||
| PayPal Holdings, Inc.(a) |
48,543 | 12,631,374 | ||||||||||
| Thermo Fisher Scientific, Inc. |
24,705 | 14,114,708 | ||||||||||
| United Rentals, Inc.(a) |
39,446 | 13,842,785 | ||||||||||
| Visa, Inc. - Class A |
60,312 | 13,434,498 | ||||||||||
|
|
|
|||||||||||
| 277,712,555 | ||||||||||||
|
|
|
|||||||||||
| TOTAL COMMON STOCKS (Cost $372,536,246) |
544,007,904 | |||||||||||
|
|
|
|||||||||||
| TOTAL INVESTMENTS |
94.9% | 544,007,904 | ||||||||||
| NET OTHER ASSETS (LIABILITIES) |
5.1% | 28,983,223 | ||||||||||
|
|
|
|||||||||||
| NET ASSETS |
100.0% | $ | 572,991,127 | |||||||||
|
|
|
|||||||||||
(a)Non-income producing security.
(b)Securities purchased in a transaction exempt from registration under Rule 144A of the Securities Act of 1933. These securities may not be publicly traded without registration under the Securities Act of 1933. The value of these securities is determined by valuations supplied by a pricing service or brokers.
Abbreviations:
ADR – American Depositary Receipt
At September 30, 2021 the industry sectors for the JOHCM Global Select Fund were:
| Sector Allocation (Unaudited) | % of Net Assets | |||
| Communication Services |
2.1 | % | ||
| Consumer Discretionary |
9.1 | |||
| Consumer Staples |
2.2 | |||
| Financials |
11.4 | |||
| Health Care |
13.3 | |||
| Industrials |
14.4 | |||
| Information Technology |
32.1 | |||
| Materials |
8.1 | |||
| Utilities |
2.2 | |||
| Total |
94.9 | % | ||
See Notes to Financial Statements.
17
JOHCM FUNDS TRUST
JOHCM GLOBAL SELECT FUND
SCHEDULE OF INVESTMENTS
September 30, 2021
At September 30, 2021, the JOHCM Global Select Fund’s investments were concentrated as follows:
| Market Exposure (Unaudited) | ||||
| Equity Securities | % of Net Assets | |||
| Semiconductors |
15.8 | % | ||
| Commercial Services |
11.6 | |||
| Diversified Financial Services |
11.5 | |||
| Software |
7.2 | |||
| Machinery-Diversified |
4.8 | |||
| Healthcare-Products |
4.8 | |||
| Auto Parts & Equipment |
4.7 | |||
| Chemicals |
4.5 | |||
| Electronics |
4.4 | |||
| Internet |
4.0 | |||
| Home Furnishings |
2.5 | |||
| Energy-Alternate Sources |
2.5 | |||
| Computers |
2.3 | |||
| Pharmaceuticals |
2.3 | |||
| Healthcare-Services |
2.3 | |||
| Mining |
2.2 | |||
| Cosmetics/Personal Care |
2.2 | |||
| Electric |
2.2 | |||
| Biotechnology |
1.7 | |||
| Iron/Steel |
1.4 | |||
| Total |
94.9 | % | ||
| 5 Largest Security Positions | ||||
| Issuer | % of Net Assets | |||
| Atlassian Corp. PLC - Class A |
2.5 | % | ||
| Thermo Fisher Scientific, Inc. |
2.5 | |||
| Sony Group Corp. |
2.5 | |||
| Vestas Wind Systems A/S |
2.5 | |||
| Chart Industries, Inc. |
2.4 | |||
| Total |
12.4 | % | ||
See Notes to Financial Statements.
18
JOHCM FUNDS TRUST
JOHCM GLOBAL INCOME BUILDER FUND
SCHEDULE OF INVESTMENTS
September 30, 2021
| Percentage of Net Assets |
Shares | Value | ||||||||||
| COMMON STOCKS |
68.7% | |||||||||||
| Auto Manufacturers |
1.0% | |||||||||||
| Stellantis N.V. |
51,366 | $ | 980,832 | |||||||||
|
|
|
|||||||||||
| Auto Parts & Equipment |
0.0% | |||||||||||
| Faurecia S.E. |
5 | 233 | ||||||||||
| Faurecia S.E. |
679 | 32,227 | ||||||||||
|
|
|
|||||||||||
| 32,460 | ||||||||||||
|
|
|
|||||||||||
| Banks |
5.7% | |||||||||||
| DNB Bank ASA |
33,107 | 751,634 | ||||||||||
| FinecoBank Banca Fineco S.p.A.(a) |
14,472 | 262,270 | ||||||||||
| Intesa Sanpaolo S.p.A. |
345,660 | 980,643 | ||||||||||
| JPMorgan Chase & Co. |
9,150 | 1,497,764 | ||||||||||
| Lloyds Banking Group PLC |
1,224,697 | 761,823 | ||||||||||
| Truist Financial Corp. |
21,996 | 1,290,065 | ||||||||||
|
|
|
|||||||||||
| 5,544,199 | ||||||||||||
|
|
|
|||||||||||
| Beverages |
1.7% | |||||||||||
| Coca-Cola Europacific Partners PLC |
20,210 | 1,117,411 | ||||||||||
| Coca-Cola Femsa S.A.B. de C.V. - ADR |
10,169 | 572,210 | ||||||||||
|
|
|
|||||||||||
| 1,689,621 | ||||||||||||
|
|
|
|||||||||||
| Building Materials |
2.8% | |||||||||||
| Cie de Saint-Gobain |
18,573 | 1,250,930 | ||||||||||
| CRH PLC |
23,819 | 1,109,531 | ||||||||||
| Vulcan Materials Co. |
2,054 | 347,455 | ||||||||||
|
|
|
|||||||||||
| 2,707,916 | ||||||||||||
|
|
|
|||||||||||
| Chemicals |
2.2% | |||||||||||
| Air Products & Chemicals, Inc. |
3,646 | 933,777 | ||||||||||
| Linde PLC |
4,221 | 1,238,357 | ||||||||||
|
|
|
|||||||||||
| 2,172,134 | ||||||||||||
|
|
|
|||||||||||
| Commercial Services |
1.4% | |||||||||||
| Allfunds Group PLC(a) |
9,403 | 180,825 | ||||||||||
| Bureau Veritas S.A. |
15,732 | 482,844 | ||||||||||
| Laureate Education, Inc. - Class A(a) |
42,011 | 713,767 | ||||||||||
|
|
|
|||||||||||
| 1,377,436 | ||||||||||||
|
|
|
|||||||||||
| Diversified Financial Services |
6.2% | |||||||||||
| Azimut Holding S.p.A. |
31,230 | 856,756 | ||||||||||
| Charles Schwab (The) Corp. |
16,157 | 1,176,876 | ||||||||||
| CME Group, Inc. |
5,525 | 1,068,425 | ||||||||||
| Julius Baer Group Ltd. |
15,337 | 1,014,410 | ||||||||||
| Mastercard, Inc. - Class A |
1,311 | 455,808 | ||||||||||
| ORIX Corp. |
39,400 | 736,306 | ||||||||||
| Visa, Inc. - Class A |
3,376 | 752,004 | ||||||||||
|
|
|
|||||||||||
| 6,060,585 | ||||||||||||
|
|
|
|||||||||||
See Notes to Financial Statements.
19
JOHCM FUNDS TRUST
JOHCM GLOBAL INCOME BUILDER FUND
SCHEDULE OF INVESTMENTS
September 30, 2021
| Percentage of Net Assets |
Shares | Value | ||||||||||
| Electric |
0.8% | |||||||||||
| Enel S.p.A. |
25,359 | $ | 194,695 | |||||||||
| Terna Rete Elettrica Nazionale S.p.A. |
89,808 | 636,993 | ||||||||||
|
|
|
|||||||||||
| 831,688 | ||||||||||||
|
|
|
|||||||||||
| Electrical Component & Equipments |
0.5% | |||||||||||
| ABB Ltd. - REG |
15,282 | 509,382 | ||||||||||
|
|
|
|||||||||||
| Food |
4.2% | |||||||||||
| Danone S.A. |
16,794 | 1,146,274 | ||||||||||
| METRO A.G. |
19,913 | 259,154 | ||||||||||
| Mondelez International, Inc. - Class A |
12,774 | 743,191 | ||||||||||
| Nestle S.A. - REG |
10,036 | 1,207,521 | ||||||||||
| Sysco Corp. |
9,618 | 755,013 | ||||||||||
|
|
|
|||||||||||
| 4,111,153 | ||||||||||||
|
|
|
|||||||||||
| Food Service |
1.0% | |||||||||||
| Aramark |
14,549 | 478,080 | ||||||||||
| Compass Group PLC(a) |
24,830 | 508,030 | ||||||||||
|
|
|
|||||||||||
| 986,110 | ||||||||||||
|
|
|
|||||||||||
| Gas |
0.9% | |||||||||||
| Enagas S.A. |
38,201 | 849,004 | ||||||||||
|
|
|
|||||||||||
| Healthcare-Products |
0.7% | |||||||||||
| Thermo Fisher Scientific, Inc. |
1,253 | 715,877 | ||||||||||
|
|
|
|||||||||||
| Holding Companies-Diversified |
0.2% | |||||||||||
| Alpha Capital Acquisition Co.(a) |
7,360 | 73,306 | ||||||||||
| Austerlitz Acquisition Corp. II(a) |
11,063 | 108,970 | ||||||||||
| CC Neuberger Principal Holdings III(a) |
1,852 | 18,427 | ||||||||||
| Northern Star Investment Corp. III(a) |
3,687 | 36,354 | ||||||||||
|
|
|
|||||||||||
| 237,057 | ||||||||||||
|
|
|
|||||||||||
| Home Builders |
0.9% | |||||||||||
| Sekisui House Ltd. |
42,000 | 882,591 | ||||||||||
|
|
|
|||||||||||
| Insurance |
1.2% | |||||||||||
| Allianz S.E. - REG |
3,800 | 857,066 | ||||||||||
| AXA S.A. |
9,701 | 269,882 | ||||||||||
|
|
|
|||||||||||
| 1,126,948 | ||||||||||||
|
|
|
|||||||||||
| Internet |
4.4% | |||||||||||
| Alphabet, Inc. - Class C(a) |
535 | 1,425,941 | ||||||||||
| Amazon.com, Inc.(a) |
199 | 653,723 | ||||||||||
| Facebook, Inc. - Class A(a) |
3,572 | 1,212,301 | ||||||||||
| Naspers Ltd. - Class N |
6,462 | 1,064,860 | ||||||||||
|
|
|
|||||||||||
| 4,356,825 | ||||||||||||
|
|
|
|||||||||||
| Machinery-Diversified |
1.3% | |||||||||||
| Deere & Co. |
1,429 | 478,815 | ||||||||||
| Duerr A.G. |
12,943 | 557,466 | ||||||||||
| GrafTech International Ltd. |
26,221 | 270,601 | ||||||||||
|
|
|
|||||||||||
| 1,306,882 | ||||||||||||
|
|
|
|||||||||||
See Notes to Financial Statements.
20
JOHCM FUNDS TRUST
JOHCM GLOBAL INCOME BUILDER FUND
SCHEDULE OF INVESTMENTS
September 30, 2021
| Percentage of Net Assets |
Shares | Value | ||||||||||
| Media |
0.3% | |||||||||||
| NOS SGPS S.A. |
68,883 | $ | 275,953 | |||||||||
|
|
|
|||||||||||
| Mining |
1.4% | |||||||||||
| Franco-Nevada Corp. |
3,230 | 419,625 | ||||||||||
| Royal Gold, Inc. |
6,112 | 583,635 | ||||||||||
| Wheaton Precious Metals Corp. |
10,682 | 401,429 | ||||||||||
|
|
|
|||||||||||
| 1,404,689 | ||||||||||||
|
|
|
|||||||||||
| Oil & Gas |
3.4% | |||||||||||
| Eni S.p.A. |
78,282 | 1,042,267 | ||||||||||
| Repsol S.A. |
68,950 | 895,556 | ||||||||||
| TotalEnergies S.E. |
30,099 | 1,442,316 | ||||||||||
|
|
|
|||||||||||
| 3,380,139 | ||||||||||||
|
|
|
|||||||||||
| Pharmaceuticals |
5.4% | |||||||||||
| AstraZeneca PLC |
8,987 | 1,081,896 | ||||||||||
| GlaxoSmithKline PLC |
26,315 | 496,709 | ||||||||||
| Novartis A.G. - REG |
10,931 | 896,782 | ||||||||||
| Pfizer, Inc. |
20,955 | 901,275 | ||||||||||
| Roche Holding A.G. - ADR |
20,473 | 930,907 | ||||||||||
| Sanofi |
10,370 | 998,264 | ||||||||||
| Viatris, Inc. |
2,797 | 37,899 | ||||||||||
|
|
|
|||||||||||
| 5,343,732 | ||||||||||||
|
|
|
|||||||||||
| Pipelines |
1.9% | |||||||||||
| ONEOK, Inc. |
14,165 | 821,429 | ||||||||||
| Williams Cos. (The), Inc. |
39,861 | 1,033,994 | ||||||||||
|
|
|
|||||||||||
| 1,855,423 | ||||||||||||
|
|
|
|||||||||||
| Real Estate |
2.5% | |||||||||||
| Great Eagle Holdings Ltd. |
58,000 | 158,308 | ||||||||||
| Hang Lung Properties Ltd. |
160,343 | 364,489 | ||||||||||
| Hongkong Land Holdings Ltd. |
101,279 | 484,712 | ||||||||||
| Hysan Development Co. Ltd. |
57,000 | 185,499 | ||||||||||
| Kerry Properties Ltd. |
323,500 | 851,404 | ||||||||||
| Realogy Holdings Corp.(a) |
21,937 | 384,775 | ||||||||||
|
|
|
|||||||||||
| 2,429,187 | ||||||||||||
|
|
|
|||||||||||
| Real Estate Investment Trusts |
5.2% | |||||||||||
| Boston Properties, Inc. |
4,189 | 453,878 | ||||||||||
| Champion REIT |
923,000 | 483,102 | ||||||||||
| Columbia Property Trust, Inc. |
56,359 | 1,071,948 | ||||||||||
| Crown Castle International Corp. |
7,122 | 1,234,385 | ||||||||||
| Douglas Emmett, Inc. |
14,041 | 443,836 | ||||||||||
| Frasers Logistics & Commercial Trust |
424,749 | 473,828 | ||||||||||
| JBG SMITH Properties |
7,140 | 211,415 | ||||||||||
| Mapletree Industrial Trust |
245,080 | 501,047 | ||||||||||
| Suntec Real Estate Investment Trust |
217,400 | 225,776 | ||||||||||
|
|
|
|||||||||||
| 5,099,215 | ||||||||||||
|
|
|
|||||||||||
See Notes to Financial Statements.
21
JOHCM FUNDS TRUST
JOHCM GLOBAL INCOME BUILDER FUND
SCHEDULE OF INVESTMENTS
September 30, 2021
| Percentage of Net Assets |
Shares | Value | ||||||||||
| Retail |
0.6% | |||||||||||
| Cie Financiere Richemont S.A. - Class A - REG |
6,008 | $ | 619,505 | |||||||||
|
|
|
|||||||||||
| Semiconductors |
4.7% | |||||||||||
| Infineon Technologies A.G. |
18,669 | 767,467 | ||||||||||
| NXP Semiconductors N.V. |
4,746 | 929,599 | ||||||||||
| ON Semiconductor Corp.(a) |
22,327 | 1,021,907 | ||||||||||
| Taiwan Semiconductor Manufacturing Co. Ltd. - ADR |
8,403 | 938,195 | ||||||||||
| Texas Instruments, Inc. |
4,745 | 912,036 | ||||||||||
|
|
|
|||||||||||
| 4,569,204 | ||||||||||||
|
|
|
|||||||||||
| Software |
3.8% | |||||||||||
| Bill.com Holdings, Inc.(a) |
1,433 | 382,539 | ||||||||||
| DocuSign, Inc.(a) |
872 | 224,479 | ||||||||||
| Microsoft Corp. |
5,700 | 1,606,944 | ||||||||||
| Oracle Corp. |
11,751 | 1,023,865 | ||||||||||
| SAP S.E. |
3,455 | 468,061 | ||||||||||
|
|
|
|||||||||||
| 3,705,888 | ||||||||||||
|
|
|
|||||||||||
| Telecommunications |
2.4% | |||||||||||
| AT&T, Inc. |
16,150 | 436,211 | ||||||||||
| Cisco Systems, Inc. |
8,925 | 485,788 | ||||||||||
| Telefonica Deutschland Holding A.G. |
161,735 | 460,377 | ||||||||||
| Vodafone Group PLC |
616,285 | 932,218 | ||||||||||
|
|
|
|||||||||||
| 2,314,594 | ||||||||||||
|
|
|
|||||||||||
| TOTAL COMMON STOCKS (Cost $55,662,021) |
67,476,229 | |||||||||||
|
|
|
|||||||||||
| Percentage of Net Assets |
Principal Amount | Value | ||||||||||
| CONVERTIBLE BONDS |
4.0% | |||||||||||
| Internet |
1.7% | |||||||||||
| Airbnb, Inc. |
$ | 510,000 | 501,075 | |||||||||
| Spotify U.S.A., Inc. |
770,000 | 693,770 | ||||||||||
| Twitter, Inc. |
510,000 | 473,453 | ||||||||||
|
|
|
|||||||||||
| 1,668,298 | ||||||||||||
|
|
|
|||||||||||
| Media |
0.7% | |||||||||||
| Liberty Latin America Ltd. |
695,000 | 705,425 | ||||||||||
|
|
|
|||||||||||
| Software |
1.6% | |||||||||||
| Alteryx, Inc. |
760,000 | 701,100 | ||||||||||
| Fastly, Inc. |
1,010,000 | 849,663 | ||||||||||
|
|
|
|||||||||||
| 1,550,763 | ||||||||||||
|
|
|
|||||||||||
| TOTAL CONVERTIBLE BONDS (Cost $3,998,689) |
3,924,486 | |||||||||||
|
|
|
|||||||||||
See Notes to Financial Statements.
22
JOHCM FUNDS TRUST
JOHCM GLOBAL INCOME BUILDER FUND
SCHEDULE OF INVESTMENTS
September 30, 2021
| Percentage of Net Assets |
Principal Amount | Value | ||||||||||
| CORPORATE BONDS |
13.3% | |||||||||||
| Advertising |
1.3% | |||||||||||
| Advantage Sales & Marketing, Inc. |
$ | 1,200,000 | $ | 1,250,688 | ||||||||
|
|
|
|||||||||||
| Aerospace/Defense |
0.4% | |||||||||||
| Boeing (The) Co. |
320,000 | 426,551 | ||||||||||
|
|
|
|||||||||||
| Banks |
1.4% | |||||||||||
| Bank of America Corp. |
450,000 | 457,875 | ||||||||||
| JPMorgan Chase & Co. |
900,000 | 903,825 | ||||||||||
|
|
|
|||||||||||
| 1,361,700 | ||||||||||||
|
|
|
|||||||||||
| Diversified Financial Services |
0.6% | |||||||||||
| Charles Schwab Corp. (The) |
550,000 | 611,187 | ||||||||||
|
|
|
|||||||||||
| Electrical Component & Equipments |
0.5% | |||||||||||
| WESCO Distribution, Inc. |
400,000 | 443,000 | ||||||||||
|
|
|
|||||||||||
| Healthcare-Services |
0.6% | |||||||||||
| Encompass Health Corp. |
440,000 | 462,462 | ||||||||||
| IQVIA, Inc. |
150,000 | 153,730 | ||||||||||
|
|
|
|||||||||||
| 616,192 | ||||||||||||
|
|
|
|||||||||||
| Internet |
3.0% | |||||||||||
| Go Daddy Operating Co. LLC/GD Finance Co., Inc. |
420,000 | 437,850 | ||||||||||
| GrubHub Holdings, Inc. |
450,000 | 466,875 | ||||||||||
| Netflix, Inc. |
505,000 | 638,825 | ||||||||||
| TripAdvisor, Inc. |
655,000 | 694,300 | ||||||||||
| Uber Technologies, Inc. |
635,000 | 671,116 | ||||||||||
|
|
|
|||||||||||
| 2,908,966 | ||||||||||||
|
|
|
|||||||||||
| Media |
2.3% | |||||||||||
| CCO Holdings LLC/CCO Holdings Capital Corp. |
1,650,000 | 1,657,722 | ||||||||||
See Notes to Financial Statements.
23
JOHCM FUNDS TRUST
JOHCM GLOBAL INCOME BUILDER FUND
SCHEDULE OF INVESTMENTS
September 30, 2021
| Percentage of Net Assets |
Principal Amount | Value | ||||||||||
| ViacomCBS, Inc., |
||||||||||||
| (Variable, ICE LIBOR USD 3M + 3.90%) |
$ | 350,000 | $ | 354,392 | ||||||||
| (Variable, ICE LIBOR USD 3M + 3.90%) |
250,000 | 286,250 | ||||||||||
|
|
|
|||||||||||
| 2,298,364 | ||||||||||||
|
|
|
|||||||||||
| Packing & Containers |
0.5% | |||||||||||
| Berry Global, Inc. |
300,000 | 315,015 | ||||||||||
| Plastipak Holdings, Inc. |
200,000 | 203,625 | ||||||||||
|
|
|
|||||||||||
| 518,640 | ||||||||||||
|
|
|
|||||||||||
| Pipelines |
0.8% | |||||||||||
| DCP Midstream L.P. |
800,000 | 778,000 | ||||||||||
|
|
|
|||||||||||
| Real Estate |
0.5% | |||||||||||
| Realogy Group LLC/Realogy Co-Issuer Corp. |
475,000 | 521,906 | ||||||||||
|
|
|
|||||||||||
| Real Estate Investment Trusts |
1.0% | |||||||||||
| MGM Growth Properties Operating Partnership L.P./MGP Finance
Co-Issuer, Inc. |
700,000 | 805,000 | ||||||||||
| SBA Communications Corp. |
175,000 | 169,094 | ||||||||||
|
|
|
|||||||||||
| 974,094 | ||||||||||||
|
|
|
|||||||||||
| Software |
0.4% | |||||||||||
| SS&C Technologies, Inc. |
325,000 | 343,178 | ||||||||||
|
|
|
|||||||||||
| TOTAL CORPORATE BONDS (Cost $12,957,833) |
13,052,466 | |||||||||||
|
|
|
|||||||||||
| Percentage of Net Assets |
Shares | Value | ||||||||||
| EXCHANGE TRADED FUNDS |
3.0% | |||||||||||
| iShares Gold Trust(a) |
40,351 | 1,348,127 | ||||||||||
| iShares Hang Seng TECH ETF(a) |
141,100 | 229,381 | ||||||||||
| SPDR Gold Shares(a) |
8,208 | 1,347,918 | ||||||||||
|
|
|
|||||||||||
| TOTAL EXCHANGE TRADED FUNDS (Cost $2,531,880) |
2,925,426 | |||||||||||
|
|
|
|||||||||||
| Percentage of Net Assets |
Principal Amount | Value | ||||||||||
| FOREIGN ISSUER BONDS |
2.7% | |||||||||||
| Media |
0.7% | |||||||||||
| Videotron Ltd. |
700,000 | 724,500 | ||||||||||
|
|
|
|||||||||||
| Packing & Containers |
1.1% | |||||||||||
| OI European Group B.V. |
1,025,000 | 1,045,500 | ||||||||||
|
|
|
|||||||||||
See Notes to Financial Statements.
24
JOHCM FUNDS TRUST
JOHCM GLOBAL INCOME BUILDER FUND
SCHEDULE OF INVESTMENTS
September 30, 2021
| Percentage of Net Assets |
Principal Amount | Value | ||||||||||
| Telecommunications |
0.9% | |||||||||||
| Altice France S.A., |
$ | 650,000 | $ | 699,400 | ||||||||
| 5.50%, 01/15/28(b) |
200,000 | 203,345 | ||||||||||
|
|
|
|||||||||||
| 902,745 | ||||||||||||
|
|
|
|||||||||||
| TOTAL FOREIGN ISSUER BONDS (Cost $2,688,111) |
2,672,745 | |||||||||||
|
|
|
|||||||||||
| Percentage of Net Assets |
Shares | Value | ||||||||||
| PREFERRED STOCKS |
2.7% | |||||||||||
| Beverages |
0.4% | |||||||||||
| Embotelladora Andina S.A. - Class B 5.14%(d) |
167,691 | 361,959 | ||||||||||
|
|
|
|||||||||||
| Real Estate Investment Trusts |
0.5% | |||||||||||
| Vornado Realty Trust 5.70% |
20,375 | 509,782 | ||||||||||
|
|
|
|||||||||||
| Semiconductors |
0.9% | |||||||||||
| Samsung Electronics Co. Ltd. 2.10%(d) |
14,504 | 848,956 | ||||||||||
|
|
|
|||||||||||
| Telecommunications |
0.9% | |||||||||||
| 2020 Cash Mandatory Exchangeable Trust (a)(b) |
790 | 893,308 | ||||||||||
|
|
|
|||||||||||
| PREFERRED STOCKS (Cost $2,339,908) |
2,614,005 | |||||||||||
|
|
|
|||||||||||
| WARRANTS |
0.1% | |||||||||||
| Diversified Financial Services |
0.1% | |||||||||||
| Motive Capital Corp., Exp. 12/09/25, Strike $11.50(a) |
62,286 | 77,858 | ||||||||||
|
|
|
|||||||||||
| Retail |
0.0% | |||||||||||
| Cie Financiere Richemont S.A., Exp. 11/22/23, Strike $67.00(a) |
11,760 | 5,552 | ||||||||||
|
|
|
|||||||||||
| TOTAL WARRANTS (Cost $72,577) |
83,410 | |||||||||||
|
|
|
|||||||||||
| CLOSED-END FUNDS |
0.4% | |||||||||||
| Eagle Point Credit Co., Inc. |
33,024 | 449,787 | ||||||||||
|
|
|
|||||||||||
| TOTAL CLOSED-END FUNDS (Cost $345,233) |
449,787 | |||||||||||
|
|
|
|||||||||||
| SHORT-TERM INVESTMENTS |
2.5% | |||||||||||
| Northern Institutional Treasury Portfolio (Premier Class), 0.01%(e) |
2,393,587 | 2,393,587 | ||||||||||
|
|
|
|||||||||||
| TOTAL SHORT-TERM INVESTMENTS (Cost $2,393,587) |
2,393,587 | |||||||||||
|
|
|
|||||||||||
| TOTAL INVESTMENTS |
97.4% | 95,592,141 | ||||||||||
| NET OTHER ASSETS (LIABILITIES) |
2.6% | 2,578,624 | ||||||||||
|
|
|
|||||||||||
| NET ASSETS |
100.0% | $ | 98,170,765 | |||||||||
|
|
|
|||||||||||
(a)Non-income producing security.
(b)Securities purchased in a transaction exempt from registration under Rule 144A of the Securities Act of 1933. These securities may not be publicly traded without registration under the Securities Act of 1933. The value of these securities is determined by valuations supplied by a pricing service or brokers.
(c)Floating rate security. The rate presented is the rate in effect at September 30, 2021, and the related index and spread are shown parenthetically for each security.
(d)Current yield is disclosed. Dividends are calculated based on a percentage of the issuer’s net income.
(e)7-day current yield as of September 30, 2021 is disclosed.
Abbreviations:
ADR – American Depositary Receipt
REG – Registered
REIT – Real Estate Investment Trust
See Notes to Financial Statements.
25
JOHCM FUNDS TRUST
JOHCM GLOBAL INCOME BUILDER FUND
SCHEDULE OF INVESTMENTS
September 30, 2021
At September 30, 2021, the JOHCM Global Income Builder Fund’s investments were concentrated as follows:
| Country Allocation (Unaudited) | Percentage of Net Assets |
|||
| United States |
55.1 | % | ||
| France |
6.6 | |||
| Switzerland |
5.3 | |||
| Italy |
4.0 | |||
| United Kingdom |
3.9 | |||
| Germany |
3.4 | |||
| Netherlands |
3.2 | |||
| Hong Kong |
2.8 | |||
| Spain |
1.8 | |||
| Japan |
1.6 | |||
| Canada |
1.6 | |||
| Singapore |
1.2 | |||
| Ireland |
1.1 | |||
| Chile |
1.1 | |||
| South Africa |
1.1 | |||
| Taiwan |
1.0 | |||
| South Korea |
0.9 | |||
| Norway |
0.8 | |||
| Mexico |
0.6 | |||
| Portugal |
0.3 | |||
| Total |
97.4 | % | ||
| 5 Largest Security Positions | ||||
| Issuer | % of Net Assets | |||
| CCO Holdings LLC/CCO Holdings |
1.7 | % | ||
| Microsoft Corp. |
1.7 | |||
| JPMorgan Chase & Co. |
1.5 | |||
| TotalEnergies S.E |
1.5 | |||
| Alphabet, Inc. - Class C |
1.5 | |||
| Total |
7.9 | % | ||
See Notes to Financial Statements.
26
JOHCM FUNDS TRUST
JOHCM INTERNATIONAL OPPORTUNITIES FUND
SCHEDULE OF INVESTMENTS
September 30, 2021
| Percentage of Net Assets |
Shares | Value | ||||||||||
| COMMON STOCKS |
92.2% | |||||||||||
| Belgium |
2.4% | |||||||||||
| Proximus SADP |
4,232 | $ | 83,669 | |||||||||
|
|
|
|||||||||||
| Canada |
2.4% | |||||||||||
| Alimentation Couche-Tard, Inc. - Class B |
2,201 | 84,210 | ||||||||||
|
|
|
|||||||||||
| Denmark |
2.5% | |||||||||||
| Orsted A/S(a) |
649 | 85,629 | ||||||||||
|
|
|
|||||||||||
| Finland |
2.8% | |||||||||||
| Wartsila OYJ Abp |
8,207 | 98,279 | ||||||||||
|
|
|
|||||||||||
| France |
13.5% | |||||||||||
| Bureau Veritas S.A. |
1,422 | 43,644 | ||||||||||
| Coface S.A. |
5,909 | 74,410 | ||||||||||
| Safran S.A. |
453 | 56,797 | ||||||||||
| Sanofi |
1,773 | 170,677 | ||||||||||
| Thales S.A. |
1,282 | 123,806 | ||||||||||
|
|
|
|||||||||||
| 469,334 | ||||||||||||
|
|
|
|||||||||||
| Germany |
13.2% | |||||||||||
| Continental A.G.(b) |
1,031 | 113,030 | ||||||||||
| Deutsche Boerse A.G. |
750 | 122,090 | ||||||||||
| Henkel A.G. & Co. KGaA |
933 | 80,501 | ||||||||||
| SAP S.E. |
685 | 92,799 | ||||||||||
| Vitesco Technologies Group A.G.(b) |
797 | 47,095 | ||||||||||
|
|
|
|||||||||||
| 455,515 | ||||||||||||
|
|
|
|||||||||||
| Ireland |
1.4% | |||||||||||
| CRH PLC |
1,048 | 48,885 | ||||||||||
|
|
|
|||||||||||
| Italy |
4.0% | |||||||||||
| Enel S.p.A. |
17,842 | 136,983 | ||||||||||
|
|
|
|||||||||||
| Japan |
9.2% | |||||||||||
| KDDI Corp. |
3,083 | 101,886 | ||||||||||
| Nippon Gas Co. Ltd. |
4,100 | 56,547 | ||||||||||
| Nippon Telegraph & Telephone Corp. |
2,204 | 60,930 | ||||||||||
| Sugi Holdings Co. Ltd. |
1,360 | 98,930 | ||||||||||
|
|
|
|||||||||||
| 318,293 | ||||||||||||
|
|
|
|||||||||||
| Netherlands |
2.3% | |||||||||||
| SBM Offshore N.V. |
4,564 | 80,931 | ||||||||||
|
|
|
|||||||||||
| Portugal |
2.4% | |||||||||||
| Galp Energia SGPS S.A. |
7,448 | 84,348 | ||||||||||
|
|
|
|||||||||||
| Spain |
3.6% | |||||||||||
| Iberdrola S.A. |
12,311 | 122,957 | ||||||||||
|
|
|
|||||||||||
| Sweden |
3.1% | |||||||||||
| Svenska Handelsbanken AB - Class A |
9,602 | 107,712 | ||||||||||
|
|
|
|||||||||||
| Switzerland |
3.5% | |||||||||||
| Roche Holding A.G. (Genusschein) |
242 | 88,307 | ||||||||||
| Schindler Holding A.G. - REG |
125 | 32,137 | ||||||||||
|
|
|
|||||||||||
| 120,444 | ||||||||||||
|
|
|
|||||||||||
See Notes to Financial Statements.
27
JOHCM FUNDS TRUST
JOHCM INTERNATIONAL OPPORTUNITIES FUND
SCHEDULE OF INVESTMENTS
September 30, 2021
| Percentage of Net Assets |
Shares | Value | ||||||||||
| United Kingdom |
23.1% | |||||||||||
| B&M European Value Retail S.A. |
12,880 | $ | 102,257 | |||||||||
| Compass Group PLC(b) |
2,789 | 57,064 | ||||||||||
| Ferguson PLC |
335 | 46,439 | ||||||||||
| HomeServe PLC |
4,894 | 59,491 | ||||||||||
| Informa PLC(b) |
7,336 | 53,754 | ||||||||||
| Johnson Matthey PLC |
2,313 | 83,425 | ||||||||||
| Lancashire Holdings Ltd. |
12,581 | 94,765 | ||||||||||
| Reckitt Benckiser Group PLC |
1,123 | 87,896 | ||||||||||
| Rio Tinto PLC |
1,177 | 77,713 | ||||||||||
| Smith & Nephew PLC |
3,105 | 53,324 | ||||||||||
| Unilever PLC |
1,569 | 84,628 | ||||||||||
|
|
|
|||||||||||
| 800,756 | ||||||||||||
|
|
|
|||||||||||
| United States |
2.8% | |||||||||||
| Philip Morris International, Inc. |
1,033 | 97,918 | ||||||||||
|
|
|
|||||||||||
| TOTAL COMMON STOCKS (Cost $3,033,924) |
3,195,863 | |||||||||||
|
|
|
|||||||||||
| TOTAL INVESTMENTS |
92.2% | 3,195,863 | ||||||||||
| NET OTHER ASSETS (LIABILITIES) |
7.8% | 269,010 | ||||||||||
|
|
|
|||||||||||
| NET ASSETS |
100.0% | $ | 3,464,873 | |||||||||
|
|
|
|||||||||||
(a) Securities purchased in a transaction exempt from registration under Rule 144A of the Securities Act of 1933. These securities may not be publicly traded without registration under the Securities Act of 1933. The value of these securities is determined by valuations supplied by a pricing service or brokers.
(b) Non-income producing security.
Abbreviations:
REG – Registered
At September 30, 2021 the industry sectors for the JOHCM International Opportunities Fund were:
| Sector Allocation (Unaudited) | % of Net Assets | |||
| Communication Services |
8.7 | % | ||
| Consumer Discretionary |
9.2 | |||
| Consumer Staples |
15.4 | |||
| Energy |
4.8 | |||
| Financials |
11.5 | |||
| Health Care |
9.0 | |||
| Industrials |
13.3 | |||
| Information Technology |
2.7 | |||
| Materials |
6.0 | |||
| Utilities |
11.6 | |||
| Total |
92.2 | % | ||
See Notes to Financial Statements.
28
JOHCM FUNDS TRUST
JOHCM INTERNATIONAL OPPORTUNITIES FUND
SCHEDULE OF INVESTMENTS
September 30, 2021
At September 30, 2021, the JOHCM International Opportunities Fund’s investments were concentrated as follows:
| Market Exposure (Unaudited) | ||||
| Equity Securities | % of Net Assets | |||
| Electric |
10.0 | % | ||
| Retail |
8.2 | |||
| Pharmaceuticals |
7.5 | |||
| Telecommunications |
7.1 | |||
| Aerospace/Defense |
5.2 | |||
| Insurance |
4.9 | |||
| Household Products/Wares |
4.9 | |||
| Auto Parts & Equipment |
4.6 | |||
| Diversified Financial Services |
3.5 | |||
| Banks |
3.1 | |||
| Distribution/Wholesale |
3.0 | |||
| Shipbuilding |
2.8 | |||
| Agriculture |
2.8 | |||
| Software |
2.7 | |||
| Cosmetics/Personal Care |
2.4 | |||
| Oil & Gas |
2.4 | |||
| Chemicals |
2.4 | |||
| Oil & Gas Services |
2.3 | |||
| Mining |
2.3 | |||
| Engineering & Construction |
1.7 | |||
| Food Service |
1.7 | |||
| Media |
1.6 | |||
| Healthcare-Products |
1.5 | |||
| Building Materials |
1.4 | |||
| Commercial Services |
1.3 | |||
| Hand/Machine Tools |
0.9 | |||
| Total |
92.2 | % | ||
| 5 Largest Security Positions | ||||
| Issuer | % of Net Assets | |||
| Sanofi |
4.9 | % | ||
| Enel S.p.A |
4.0 | |||
| Thales S.A |
3.6 | |||
| Iberdrola S.A |
3.6 | |||
| Deutsche Boerse A.G |
3.5 | |||
| Total |
19.6 | % | ||
See Notes to Financial Statements.
29
JOHCM FUNDS TRUST
JOHCM INTERNATIONAL SELECT FUND
SCHEDULE OF INVESTMENTS
September 30, 2021
| Percentage of Net Assets |
Shares | Value | ||||||||||
| COMMON STOCKS |
95.7% | |||||||||||
| Australia |
1.4% | |||||||||||
| Fortescue Metals Group Ltd. |
17,705,978 | $ | 186,719,165 | |||||||||
|
|
|
|||||||||||
| Canada |
1.6% | |||||||||||
| Magna International, Inc. |
2,735,661 | 205,876,525 | ||||||||||
|
|
|
|||||||||||
| Denmark |
6.1% | |||||||||||
| Novo Nordisk A/S - Class B |
2,626,951 | 252,673,475 | ||||||||||
| Orsted A/S(a) |
1,874,054 | 247,263,696 | ||||||||||
| Vestas Wind Systems A/S |
7,320,494 | 293,087,377 | ||||||||||
|
|
|
|||||||||||
| 793,024,548 | ||||||||||||
|
|
|
|||||||||||
| France |
3.9% | |||||||||||
| L’Oreal S.A. |
561,577 | 231,775,348 | ||||||||||
| Schneider Electric S.E. |
1,649,891 | 274,311,186 | ||||||||||
|
|
|
|||||||||||
| 506,086,534 | ||||||||||||
|
|
|
|||||||||||
| Germany |
11.2% | |||||||||||
| BioNTech S.E. - ADR(b) |
836,252 | 228,288,433 | ||||||||||
| Continental A.G.(b) |
1,708,246 | 187,276,936 | ||||||||||
| Daimler A.G. - REG |
2,769,959 | 246,236,515 | ||||||||||
| Deutsche Boerse A.G. |
1,576,396 | 256,615,872 | ||||||||||
| Infineon Technologies A.G. |
6,410,514 | 263,530,798 | ||||||||||
| Merck KGaA |
1,208,723 | 262,847,621 | ||||||||||
| Vitesco Technologies Group A.G.(b) |
341,649 | 20,183,218 | ||||||||||
|
|
|
|||||||||||
| 1,464,979,393 | ||||||||||||
|
|
|
|||||||||||
| Hong Kong |
2.1% | |||||||||||
| Hong Kong Exchanges & Clearing Ltd. |
4,445,435 | 269,830,174 | ||||||||||
|
|
|
|||||||||||
| Ireland |
6.6% | |||||||||||
| Accenture PLC - Class A |
815,149 | 260,782,468 | ||||||||||
| Aptiv PLC(b) |
1,866,482 | 278,049,823 | ||||||||||
| ICON PLC(b) |
1,236,493 | 323,985,896 | ||||||||||
|
|
|
|||||||||||
| 862,818,187 | ||||||||||||
|
|
|
|||||||||||
| Italy |
3.9% | |||||||||||
| FinecoBank Banca Fineco S.p.A.(b) |
15,766,652 | 285,732,338 | ||||||||||
| Nexi S.p.A.(a)(b) |
12,292,078 | 229,330,255 | ||||||||||
|
|
|
|||||||||||
| 515,062,593 | ||||||||||||
|
|
|
|||||||||||
| Japan |
22.6% | |||||||||||
| Advantest Corp. |
3,202,800 | 286,944,747 | ||||||||||
| CyberAgent, Inc. |
13,144,500 | 254,570,454 | ||||||||||
| Fujitsu Ltd. |
1,503,300 | 273,015,185 | ||||||||||
| Japan Exchange Group, Inc. |
11,404,000 | 283,023,247 | ||||||||||
| ORIX Corp. |
15,390,800 | 287,622,811 | ||||||||||
| PeptiDream, Inc.(b) |
2,720,400 | 88,564,845 | ||||||||||
| Recruit Holdings Co. Ltd. |
5,097,579 | 310,826,413 | ||||||||||
| SBI Holdings, Inc. |
10,517,583 | 259,492,368 | ||||||||||
| Sony Group Corp. |
2,579,000 | 287,201,132 | ||||||||||
See Notes to Financial Statements.
30
JOHCM FUNDS TRUST
JOHCM INTERNATIONAL SELECT FUND
SCHEDULE OF INVESTMENTS
September 30, 2021
| Percentage of Net Assets |
Shares | Value | ||||||||||
| Tokyo Electron Ltd. |
599,868 | $ | 264,423,284 | |||||||||
| Z Holdings Corp. |
55,688,300 | 357,380,024 | ||||||||||
|
|
|
|||||||||||
| 2,953,064,510 | ||||||||||||
|
|
|
|||||||||||
| Netherlands |
10.1% | |||||||||||
| Adyen N.V.(a)(b) |
92,449 | 257,060,077 | ||||||||||
| ASML Holding N.V. |
376,903 | 278,030,930 | ||||||||||
| Koninklijke Ahold Delhaize N.V. |
8,813,198 | 292,186,708 | ||||||||||
| Koninklijke DSM N.V. |
1,424,337 | 284,694,843 | ||||||||||
| Prosus N.V.(b) |
2,596,761 | 204,516,236 | ||||||||||
|
|
|
|||||||||||
| 1,316,488,794 | ||||||||||||
|
|
|
|||||||||||
| South Korea |
1.5% | |||||||||||
| SK Hynix, Inc. |
2,316,016 | 199,711,186 | ||||||||||
|
|
|
|||||||||||
| Spain |
1.6% | |||||||||||
| Siemens Gamesa Renewable Energy S.A.(b) |
8,479,274 | 214,330,825 | ||||||||||
|
|
|
|||||||||||
| Switzerland |
4.4% | |||||||||||
| Lonza Group A.G. - REG |
360,542 | 270,114,788 | ||||||||||
| STMicroelectronics N.V. |
6,832,918 | 297,898,097 | ||||||||||
|
|
|
|||||||||||
| 568,012,885 | ||||||||||||
|
|
|
|||||||||||
| Taiwan |
1.8% | |||||||||||
| MediaTek, Inc. |
7,417,206 | 239,081,072 | ||||||||||
|
|
|
|||||||||||
| United Kingdom |
16.9% | |||||||||||
| Anglo American PLC |
6,108,753 | 210,720,589 | ||||||||||
| Ashtead Group PLC |
3,635,785 | 275,798,406 | ||||||||||
| B&M European Value Retail S.A. |
34,757,416 | 275,945,349 | ||||||||||
| Barclays PLC |
103,099,533 | 262,943,629 | ||||||||||
| CNH Industrial N.V. |
15,890,141 | 269,055,633 | ||||||||||
| Compass Group PLC(b) |
11,691,829 | 239,218,430 | ||||||||||
| IHS Markit Ltd. |
2,417,949 | 281,981,212 | ||||||||||
| Linde PLC |
934,456 | 277,842,184 | ||||||||||
| THG PLC(b) |
17,524,266 | 118,887,330 | ||||||||||
|
|
|
|||||||||||
| 2,212,392,762 | ||||||||||||
|
|
|
|||||||||||
| TOTAL COMMON STOCKS (Cost $9,573,215,353) |
12,507,479,153 | |||||||||||
|
|
|
|||||||||||
| TOTAL INVESTMENTS |
95.7% | 12,507,479,153 | ||||||||||
| NET OTHER ASSETS (LIABILITIES) |
4.3% | 566,796,776 | ||||||||||
|
|
|
|||||||||||
| NET ASSETS |
100.0% | $ | 13,074,275,929 | |||||||||
|
|
|
|||||||||||
(a)Securities purchased in a transaction exempt from registration under Rule 144A of the Securities Act of 1933. These securities may not be publicly traded without registration under the Securities Act of 1933. The value of these securities is determined by valuations supplied by a pricing service or brokers.
(b)Non-income producing security.
Abbreviations:
ADR – American Depositary Receipt
REG – Registered
See Notes to Financial Statements.
31
JOHCM FUNDS TRUST
JOHCM INTERNATIONAL SELECT FUND
SCHEDULE OF INVESTMENTS
September 30, 2021
At September 30, 2021 the industry sectors for the JOHCM International Select Fund were:
| Sector Allocation (Unaudited) | % of Net Assets | |||
| Communication Services |
4.7 | % | ||
| Consumer Discretionary |
15.8 | |||
| Consumer Staples |
4.0 | |||
| Financials |
14.6 | |||
| Health Care |
10.9 | |||
| Industrials |
14.7 | |||
| Information Technology |
21.8 | |||
| Materials |
7.3 | |||
| Utilities |
1.9 | |||
| Total |
95.7 | % | ||
See Notes to Financial Statements.
32
JOHCM FUNDS TRUST
JOHCM INTERNATIONAL SELECT FUND
SCHEDULE OF INVESTMENTS
September 30, 2021
At September 30, 2021, the JOHCM International Select Fund’s investments were concentrated as follows:
| Market Exposure (Unaudited) | ||||
| Equity Securities | % of Net Assets | |||
| Semiconductors |
14.0 | % | ||
| Diversified Financial Services |
10.4 | |||
| Commercial Services |
10.4 | |||
| Internet |
7.2 | |||
| Auto Parts & Equipment |
5.3 | |||
| Healthcare-Services |
5.2 | |||
| Chemicals |
4.3 | |||
| Banks |
4.2 | |||
| Computers |
4.1 | |||
| Pharmaceuticals |
3.9 | |||
| Energy-Alternate Sources |
3.9 | |||
| Food |
2.2 | |||
| Home Furnishings |
2.2 | |||
| Retail |
2.1 | |||
| Electrical Component & Equipments |
2.1 | |||
| Machinery-Diversified |
2.1 | |||
| Electric |
1.9 | |||
| Auto Manufacturers |
1.9 | |||
| Food Service |
1.8 | |||
| Cosmetics/Personal Care |
1.8 | |||
| Biotechnology |
1.7 | |||
| Mining |
1.6 | |||
| Iron/Steel |
1.4 | |||
| Total |
95.7 | % | ||
| 5 Largest Security Positions | ||||
| Issuer | % of Net Assets | |||
| Z Holdings Corp. |
2.7 | % | ||
| ICON PLC |
2.5 | |||
| Recruit Holdings Co. Ltd. |
2.4 | |||
| STMicroelectronics N.V |
2.3 | |||
| Vestas Wind Systems A/S |
2.3 | |||
| Total |
12.2 | % | ||
See Notes to Financial Statements.
33
JOHCM FUNDS TRUST
REGNAN GLOBAL EQUITY IMPACT SOLUTIONS
SCHEDULE OF INVESTMENTS
September 30, 2021
| Percentage of Net Assets |
Shares | Value | ||||||||||
| CLOSED-END FUNDS |
1.1% | |||||||||||
| United Kingdom |
1.1% | |||||||||||
| Syncona Ltd.(a) |
9,289 | $ | 21,155 | |||||||||
|
|
|
|||||||||||
| TOTAL CLOSED-END FUNDS (Cost $24,953) |
21,155 | |||||||||||
|
|
|
|||||||||||
| COMMON STOCKS |
98.5% | |||||||||||
| Australia |
1.5% | |||||||||||
| Brambles Ltd. |
3,657 | 28,444 | ||||||||||
|
|
|
|||||||||||
| Austria |
4.3% | |||||||||||
| Lenzing A.G.(a) |
671 | 81,078 | ||||||||||
|
|
|
|||||||||||
| Belgium |
3.7% | |||||||||||
| Umicore S.A. |
1,180 | 69,925 | ||||||||||
|
|
|
|||||||||||
| Brazil |
6.0% | |||||||||||
| Afya Ltd. - Class A(a) |
3,148 | 62,142 | ||||||||||
| YDUQS Participacoes S.A. |
11,311 | 49,350 | ||||||||||
|
|
|
|||||||||||
| 111,492 | ||||||||||||
|
|
|
|||||||||||
| Denmark |
7.4% | |||||||||||
| Novo Nordisk A/S - Class B |
854 | 82,142 | ||||||||||
| Orsted A/S(b) |
425 | 56,075 | ||||||||||
|
|
|
|||||||||||
| 138,217 | ||||||||||||
|
|
|
|||||||||||
| France |
8.6% | |||||||||||
| Hoffmann Green Cement Technologies S.A.S.(a) |
170 | 5,769 | ||||||||||
| Sartorius Stedim Biotech |
138 | 77,029 | ||||||||||
| Valeo |
2,801 | 78,165 | ||||||||||
|
|
|
|||||||||||
| 160,963 | ||||||||||||
|
|
|
|||||||||||
| Germany |
13.4% | |||||||||||
| Befesa S.A.(b) |
1,115 | 85,097 | ||||||||||
| Carl Zeiss Meditec A.G. - Bearer |
261 | 50,172 | ||||||||||
| Duerr A.G. |
1,768 | 76,149 | ||||||||||
| Hella GmbH & Co. KGaA |
324 | 22,681 | ||||||||||
| ProCredit Holding A.G. & Co. KGaA |
1,642 | 15,141 | ||||||||||
|
|
|
|||||||||||
| 249,240 | ||||||||||||
|
|
|
|||||||||||
| Indonesia |
3.9% | |||||||||||
| Bank Rakyat Indonesia Persero Tbk PT |
271,311 | 72,107 | ||||||||||
|
|
|
|||||||||||
| Japan |
4.1% | |||||||||||
| Horiba Ltd. |
1,091 | 76,397 | ||||||||||
|
|
|
|||||||||||
| Netherlands |
7.2% | |||||||||||
| Alfen Beheer B.V.(a)(b) |
701 | 73,693 | ||||||||||
| QIAGEN N.V.(a) |
1,159 | 60,262 | ||||||||||
|
|
|
|||||||||||
| 133,955 | ||||||||||||
|
|
|
|||||||||||
| Norway |
2.8% | |||||||||||
| TOMRA Systems ASA |
1,011 | 52,782 | ||||||||||
|
|
|
|||||||||||
| Spain |
1.7% | |||||||||||
| Siemens Gamesa Renewable Energy S.A.(a) |
1,262 | 31,899 | ||||||||||
|
|
|
|||||||||||
| Switzerland |
4.2% | |||||||||||
| Lonza Group A.G. - REG |
104 | 77,916 | ||||||||||
|
|
|
|||||||||||
See Notes to Financial Statements.
34
JOHCM FUNDS TRUST
REGNAN GLOBAL EQUITY IMPACT SOLUTIONS
SCHEDULE OF INVESTMENTS
September 30, 2021
| Percentage of Net Assets |
Shares | Value | ||||||||||
| United Kingdom |
3.9% | |||||||||||
| Abcam PLC(a) |
1,074 | $ | 21,358 | |||||||||
| Autolus Therapeutics PLC - ADR(a) |
6,457 | 42,293 | ||||||||||
| Home REIT PLC |
3,896 | 5,694 | ||||||||||
| Ilika PLC(a) |
1,973 | 3,700 | ||||||||||
|
|
|
|||||||||||
| 73,045 | ||||||||||||
|
|
|
|||||||||||
| United States |
25.8% | |||||||||||
| Agilent Technologies, Inc. |
451 | 71,046 | ||||||||||
| ANSYS, Inc.(a) |
215 | 73,197 | ||||||||||
| Ecolab, Inc. |
90 | 18,776 | ||||||||||
| Evoqua Water Technologies Corp.(a) |
2,457 | 92,285 | ||||||||||
| Hannon Armstrong Sustainable Infrastructure Capital, Inc. |
1,350 | 72,198 | ||||||||||
| PTC, Inc.(a) |
656 | 78,582 | ||||||||||
| Xylem, Inc. |
609 | 75,321 | ||||||||||
|
|
|
|||||||||||
| 481,405 | ||||||||||||
|
|
|
|||||||||||
| TOTAL COMMON STOCKS (Cost $1,988,966) |
1,838,865 | |||||||||||
|
|
|
|||||||||||
| TOTAL INVESTMENTS |
99.6% | 1,860,020 | ||||||||||
| NET OTHER ASSETS (LIABILITIES) |
0.4% | 7,675 | ||||||||||
|
|
|
|||||||||||
| NET ASSETS |
100.0% | $ | 1,867,695 | |||||||||
|
|
|
|||||||||||
(a)Non-income producing security.
(b)Securities purchased in a transaction exempt from registration under Rule 144A of the Securities Act of 1933. These securities may not be publicly traded without registration under the Securities Act of 1933. The value of these securities is determined by valuations supplied by a pricing service or brokers.
Abbreviations:
ADR – American Depositary Receipt .
REG – Registered
REIT – Real Estate Investment Trust
At September 30, 2021 the industry sectors for the Regnan Global Equity Impact Solutions were:
| Sector Allocation (Unaudited) | % of Net Assets | |||
| Consumer Discretionary |
11.4 | % | ||
| Financials |
9.7 | |||
| Health Care |
25.8 | |||
| Industrials |
27.8 | |||
| Information Technology |
12.2 | |||
| Materials |
9.4 | |||
| Real Estate |
0.3 | |||
| Utilities |
3.0 | |||
| Total |
99.6 | % | ||
See Notes to Financial Statements.
35
JOHCM FUNDS TRUST
REGNAN GLOBAL EQUITY IMPACT SOLUTIONS
SCHEDULE OF INVESTMENTS
September 30, 2021
At September 30, 2021, the Regnan Global Equity Impact Solutions’ investments were concentrated as follows:
| Market Exposure (Unaudited) | ||||
| Equity Securities | % of Net Assets | |||
| Healthcare-Products |
10.0 | % | ||
| Chemicals |
9.1 | |||
| Software |
8.1 | |||
| Machinery-Diversified |
8.1 | |||
| Electronics |
8.1 | |||
| Electric |
7.9 | |||
| Commercial Services |
7.5 | |||
| Environmental Control |
7.4 | |||
| Auto Parts & Equipment |
5.4 | |||
| Diversified Financial Services |
4.7 | |||
| Pharmaceuticals |
4.4 | |||
| Healthcare-Services |
4.2 | |||
| Engineering & Construction |
4.0 | |||
| Banks |
3.9 | |||
| Biotechnology |
3.4 | |||
| Energy-Alternate Sources |
1.7 | |||
| Closed-End Funds |
1.1 | |||
| Building Materials |
0.3 | |||
| Real Estate Investment Trusts |
0.3 | |||
| Total |
99.6 | % | ||
| 5 Largest Security Positions | ||||
| Issuer | % of Net Assets | |||
| Evoqua Water Technologies Corp. |
5.0 | % | ||
| Befesa S.A |
4.6 | |||
| Novo Nordisk A/S - Class B |
4.4 | |||
| Lenzing A.G |
4.3 | |||
| PTC, Inc. |
4.2 | |||
| Total |
22.5 | % | ||
See Notes to Financial Statements.
36
JOHCM FUNDS TRUST
STATEMENTS OF ASSETS & LIABILITIES
September 30, 2021
| JOHCM Credit Income Fund |
JOHCM Emerging Markets |
JOHCM Emerging Markets Small Mid Cap Equity Fund |
JOHCM Global Select Fund |
|||||||||||||
| Assets: |
||||||||||||||||
| Investments, at cost |
$ | 5,145,542 | $ | 701,008,940 | $ | 39,425,669 | $ | 372,536,246 | ||||||||
| Investments, at value |
5,191,118 | 804,148,241 | 45,999,218 | 544,007,904 | ||||||||||||
| Cash |
— | 25,868,209 | 1,814,174 | 28,062,452 | ||||||||||||
| Foreign currency (Cost: $0, $163,401, $108,273, $1,157,534, $498,955, $0, $22,742,234 and $0, respectively) |
— | 163,401 | 107,649 | 1,157,534 | ||||||||||||
| Receivable for interest |
57,191 | — | — | — | ||||||||||||
| Receivable for dividends |
1,685 | 604,890 | 73,274 | 182,942 | ||||||||||||
| Reclaims receivable |
— | — | 5,840 | 332,443 | ||||||||||||
| Receivable for investments sold |
114,045 | — | 478,013 | — | ||||||||||||
| Receivable for capital shares sold |
— | 972,069 | 130 | — | ||||||||||||
| Receivable from service providers |
97,145 | 105,051 | 34,812 | 33,522 | ||||||||||||
| Receivable from investment adviser |
3,074 | — | 37,699 | — | ||||||||||||
| Prepaid expenses |
40,439 | 20,485 | 4,606 | 26,882 | ||||||||||||
|
|
|
|
|
|
|
|
|
|||||||||
| Total Assets |
5,504,697 | 831,882,346 | 48,555,415 | 573,803,679 | ||||||||||||
|
|
|
|
|
|
|
|
|
|||||||||
| Liabilities: |
||||||||||||||||
| Securities purchased payable |
153,298 | — | 615,930 | 3,098 | ||||||||||||
| Capital shares redeemed payable |
— | 263,438 | 3,741 | 69,222 | ||||||||||||
| Distributions payable to shareholders |
2,207 | — | — | — | ||||||||||||
| Investment advisory fees payable |
2,372 | 632,136 | 51,640 | 440,597 | ||||||||||||
| Accounting and Administration fees payable |
100,944 | 593,229 | 146,386 | 248,829 | ||||||||||||
| Distribution (Rule 12b-1) fees payable |
1 | 9,102 | 1,279 | 4,297 | ||||||||||||
| Regulatory and Compliance fees payable |
78 | 13,021 | 727 | 9,141 | ||||||||||||
| Risk Officer fees payable |
1 | 215 | 12 | 149 | ||||||||||||
| Trustee fees payable |
— | 5 | — | 4 | ||||||||||||
| Deferred foreign capital gains tax payable |
— | 445,963 | 210,721 | — | ||||||||||||
| Accrued expenses and other payables |
12,280 | 75,367 | 37,477 | 37,215 | ||||||||||||
|
|
|
|
|
|
|
|
|
|||||||||
| Total Liabilities |
271,181 | 2,032,476 | 1,067,913 | 812,552 | ||||||||||||
|
|
|
|
|
|
|
|
|
|||||||||
| Net Assets |
$ | 5,233,516 | $ | 829,849,870 | $ | 47,487,502 | $ | 572,991,127 | ||||||||
|
|
|
|
|
|
|
|
|
|||||||||
| Net Assets: |
||||||||||||||||
| Paid in capital |
$ | 5,158,674 | $ | 718,156,868 | $ | 29,115,907 | $ | 306,312,145 | ||||||||
| Distributable earnings (loss) |
74,842 | 111,693,002 | 18,371,595 | 266,678,982 | ||||||||||||
|
|
|
|
|
|
|
|
|
|||||||||
| Net Assets |
$ | 5,233,516 | $ | 829,849,870 | $ | 47,487,502 | $ | 572,991,127 | ||||||||
|
|
|
|
|
|
|
|
|
|||||||||
| Net Assets: |
||||||||||||||||
| Advisor |
$ | 10,208 | $ | 81,461,946 | $ | 15,208,774 | $ | 49,720,638 | ||||||||
| Investor |
— | 9,853,617 | — | — | ||||||||||||
| Institutional |
5,223,308 | 738,534,307 | 32,278,728 | 523,270,489 | ||||||||||||
| Share of Common Stock Outstanding: |
||||||||||||||||
| Advisor |
1,008 | 6,417,768 | 828,811 | 2,324,448 | ||||||||||||
| Investor |
— | 777,459 | — | — | ||||||||||||
| Institutional |
514,797 | 58,005,036 | 1,756,341 | 24,384,065 | ||||||||||||
| Net Asset Value per Share: |
||||||||||||||||
| Advisor |
$ | 10.13 | $ | 12.69 | $ | 18.35 | $ | 21.39 | ||||||||
| Investor |
— | 12.67 | — | — | ||||||||||||
| Institutional |
10.15 | 12.73 | 18.38 | 21.46 | ||||||||||||
|
|
|
|
|
|
|
|
|
|||||||||
|
| ||||||||||||||||
|
|
||||||||||||||||
See Notes to Financial Statements.
37
| JOHCM Global Income Builder Fund |
JOHCM International Opportunities Fund |
JOHCM International Select Fund |
Regnan Global Equity Impact Solutions |
|||||||||||
| $ | 82,989,839 | $ | 3,033,924 | $ | 9,573,215,353 | $ | 2,013,919 | |||||||
| 95,592,141 | 3,195,863 | 12,507,479,153 | 1,860,020 | |||||||||||
| — | 291,111 | 522,102,237 | 9,238 | |||||||||||
| |
490,314 |
|
— | 22,742,150 | — | |||||||||
| 241,140 | — | — | — | |||||||||||
| 204,995 | 5,254 | 15,562,118 | 888 | |||||||||||
| 223,563 | 12,199 | 15,097,299 | — | |||||||||||
| 2,024,443 | — | 2,281,788 | — | |||||||||||
| 19,985 | — | 7,753,804 | — | |||||||||||
| 63,851 | 90,669 | 673,567 | — | |||||||||||
| — | — | — | 12,993 | |||||||||||
| 41,503 | 1,984 | 205,767 | — | |||||||||||
|
|
|
|
|
|
|
|
|
|||||||
| 98,901,935 | 3,597,080 | 13,093,897,883 | 1,883,139 | |||||||||||
|
|
|
|
|
|
|
|
|
|||||||
| 406,445 | 12,170 | — | — | |||||||||||
| 16,225 | — | 2,984,604 | — | |||||||||||
| 105,543 | — | — | — | |||||||||||
| 66,876 | 5,797 | 10,047,799 | 1,227 | |||||||||||
| 115,512 | 103,085 | 5,492,319 | 2,306 | |||||||||||
| 701 | — | 173,458 | — | |||||||||||
| 1,505 | 54 | 205,349 | 12 | |||||||||||
| 24 | 1 | 3,288 | — | |||||||||||
| 1 | — | 84 | — | |||||||||||
| — | — | — | — | |||||||||||
| 18,338 | 11,100 | 715,053 | 11,899 | |||||||||||
|
|
|
|
|
|
|
|
|
|||||||
| 731,170 | 132,207 | 19,621,954 | 15,444 | |||||||||||
|
|
|
|
|
|
|
|
|
|||||||
| $ | 98,170,765 | $ | 3,464,873 | $ | 13,074,275,929 | $ | 1,867,695 | |||||||
|
|
|
|
|
|
|
|
|
|||||||
| $ | 84,613,089 | $ | 2,996,831 | $ | 8,936,626,644 | $ | 2,021,847 | |||||||
| 13,557,676 | 468,042 | 4,137,649,285 | (154,152 | ) | ||||||||||
|
|
|
|
|
|
|
|
|
|||||||
| $ | 98,170,765 | $ | 3,464,873 | $ | 13,074,275,929 | $ | 1,867,695 | |||||||
|
|
|
|
|
|
|
|
|
|||||||
| $ | 8,213,171 | $ | — | $ | — | $ | — | |||||||
| 61,056 | — | 800,457,226 | — | |||||||||||
| 89,896,538 | 3,464,873 | 12,273,818,703 | 1,867,695 | |||||||||||
| 739,789 | — | — | — | |||||||||||
| 5,503 | — | 25,762,762 | — | |||||||||||
| 8,096,276 | 293,022 | 394,919,442 | 202,493 | |||||||||||
| $ | 11.10 | $ | — | $ | — | $ | — | |||||||
| 11.10 | — | 31.07 | — | |||||||||||
| 11.10 | 11.82 | 31.08 | 9.22 | |||||||||||
|
|
|
|
|
|
|
|
|
|||||||
|
|
|
|||||||||||||
See Notes to Financial Statements.
38
JOHCM FUNDS TRUST
For the year ended September 30, 2021
| JOHCM Credit Income |
JOHCM Emerging Markets |
JOHCM Emerging Markets Small Mid Cap Equity Fund |
JOHCM Global Select Fund |
|||||||||||||
| Investment Income: |
||||||||||||||||
| Dividend income (Net of foreign withholding tax of $341, $2,722,139, $118,731, $330,905, $210,216, $12,081, $17,542,311 and $0) |
$ | 15,550 | $ | 20,913,654 | $ | 848,243 | $ | 6,189,482 | ||||||||
| Interest income |
175,086 | — | — | — | ||||||||||||
|
|
|
|
|
|
|
|
|
|||||||||
| Total investment income |
190,636 | 20,913,654 | 848,243 | 6,189,482 | ||||||||||||
|
|
|
|
|
|
|
|
|
|||||||||
| Operating expenses: |
||||||||||||||||
| Investment advisory |
28,287 | 7,143,120 | 648,263 | 5,005,998 | ||||||||||||
| Distribution (Rule 12b-1) fees - Advisor Shares |
6 | 87,880 | 16,170 | 47,457 | ||||||||||||
| Distribution (Rule 12b-1) fees - Investor Shares |
— | 44,882 | — | — | ||||||||||||
| Accounting and Administration |
141,815 | 708,071 | 161,251 | 267,318 | ||||||||||||
| Regulatory and Treasurer Service fees |
553 | 81,373 | 5,230 | 56,998 | ||||||||||||
| Shareholder Services - Institutional Shares |
— | 3,853 | — | 23,818 | ||||||||||||
| JOHCM Compliance |
17 | 3,064 | 173 | 2,183 | ||||||||||||
| Trustees |
198 | 32,320 | 2,006 | 22,490 | ||||||||||||
| Legal |
21,343 | 6,150 | 356 | 4,351 | ||||||||||||
| Risk Officer |
— | 3,928 | 254 | 2,756 | ||||||||||||
| Registration |
21,868 | 91,734 | 33,038 | 36,539 | ||||||||||||
| Printing |
9,057 | 41,654 | 1,076 | 7,183 | ||||||||||||
| Interest expense |
— | — | 734 | 953 | ||||||||||||
| Other |
2,609 | 83,856 | 67,370 | 41,778 | ||||||||||||
|
|
|
|
|
|
|
|
|
|||||||||
| Total expenses before reductions |
225,753 | 8,331,885 | 935,921 | 5,519,822 | ||||||||||||
|
|
|
|
|
|
|
|
|
|||||||||
| Expenses reimbursed by investment advisor |
(72,630 | ) | (1,430 | ) | (121,435 | ) | (989 | ) | ||||||||
| Expenses reduced by service providers |
(122,906 | ) | (103,301 | ) | (34,726 | ) | (31,772 | ) | ||||||||
|
|
|
|
|
|
|
|
|
|||||||||
| Total expense reimbursements |
(195,536 | ) | (104,731 | ) | (156,161 | ) | (32,761 | ) | ||||||||
|
|
|
|
|
|
|
|
|
|||||||||
| Net expenses |
30,217 | 8,227,154 | 779,760 | 5,487,061 | ||||||||||||
|
|
|
|
|
|
|
|
|
|||||||||
| Net investment income (loss) |
160,419 | 12,686,500 | 68,483 | 702,421 | ||||||||||||
|
|
|
|
|
|
|
|
|
|||||||||
| Realized and Unrealized Gains (Losses) from Investment Activities: |
||||||||||||||||
| Net realized gains (losses) from investment transactions |
36,684 | 54,573,110 | 16,377,446 | 99,867,327 | ||||||||||||
| Net realized gains (losses) from foreign currency transactions |
— | (63,045 | ) | (43,898 | ) | (111,062 | ) | |||||||||
| Net realized gains from forward foreign currency exchange contracts |
— | — | — | — | ||||||||||||
| Change in unrealized appreciation (depreciation) on investments |
72,894 | 46,868,846 | (249,338 | ) | 40,168,019 | |||||||||||
| Change in unrealized appreciation (depreciation) on foreign currency |
— | 7,294 | 3,060 | (22,986 | ) | |||||||||||
| Change in unrealized appreciation (depreciation) on forward foreign currency exchange contracts |
— | — | — | — | ||||||||||||
|
|
|
|
|
|
|
|
|
|||||||||
| Net realized and unrealized gains (losses) from investment activities |
109,578 | 101,386,205 | 16,087,270 | 139,901,298 | ||||||||||||
|
|
|
|
|
|
|
|
|
|||||||||
| Change in Net Assets Resulting from Operations |
$ | 269,997 | $ | 114,072,705 | $ | 16,155,753 | $ | 140,603,719 | ||||||||
|
|
|
|
|
|
|
|
|
|||||||||
|
| ||||||||||||||||
|
|
||||||||||||||||
See Notes to Financial Statements.
39
| JOHCM Global Income Builder Fund |
JOHCM International Opportunities Fund |
JOHCM International Select Fund |
Regnan Global Equity Impact Solutions(a) |
|||||||||||
| $ |
2,516,398 |
|
$ | 95,304 | $ | 187,531,286 | $ | 581 | ||||||
| 852,897 | — | — | — | |||||||||||
|
|
|
|
|
|
|
|
|
|||||||
| 3,369,295 | 95,304 | 187,531,286 | 581 | |||||||||||
|
|
|
|
|
|
|
|
|
|||||||
| 611,230 | 26,240 | 108,677,435 | 1,555 | |||||||||||
| 7,968 | — | — | — | |||||||||||
| 193 | — | 1,839,201 | — | |||||||||||
| 155,782 | 145,756 | 5,829,086 | 3,165 | |||||||||||
| 9,344 | 381 | 1,245,133 | 7 | |||||||||||
| — | — | 499,931 | — | |||||||||||
| 363 | 11 | 50,003 | 6 | |||||||||||
| 3,648 | 161 | 491,095 | 13 | |||||||||||
| 714 | 22 | 98,633 | 2,620 | |||||||||||
| 449 | 18 | 59,440 | — | |||||||||||
| 29,564 | 19,831 | 289,196 | 6,301 | |||||||||||
| 7,824 | 654 | 200,651 | 1,080 | |||||||||||
| — | — | 19,444 | — | |||||||||||
| 12,018 | 7,682 | 775,061 | 3,437 | |||||||||||
|
|
|
|
|
|
|
|
|
|||||||
| 839,097 | 200,756 | 120,074,309 | 18,184 | |||||||||||
|
|
|
|
|
|
|
|
|
|||||||
| (64,790 | ) | (47,718 | ) | (21,314 | ) | (16,338 | ) | |||||||
| (102,436 | ) | (121,852 | ) | (671,811 | ) | — | ||||||||
|
|
|
|
|
|
|
|
|
|||||||
| (167,226 | ) | (169,570 | ) | (693,125 | ) | (16,338 | ) | |||||||
|
|
|
|
|
|
|
|
|
|||||||
| 671,871 | 31,186 | 119,381,184 | 1,846 | |||||||||||
|
|
|
|
|
|
|
|
|
|||||||
| 2,697,424 | 64,118 | 68,150,102 | (1,265 | ) | ||||||||||
|
|
|
|
|
|
|
|
|
|||||||
| |
|
|
||||||||||||
| 3,633,748 | 309,774 | 1,247,709,705 | (246 | ) | ||||||||||
| |
34,981 |
|
(160 | ) | 997,983 | (1,893 | ) | |||||||
| |
4,605 |
|
— | — | — | |||||||||
| |
6,624,010 |
|
81,165 | 350,589,516 | (153,899 | ) | ||||||||
| |
(18,256 |
) |
(330 | ) | (466,350 | ) | (7 | ) | ||||||
| |
(17,209 |
) |
— | — | — | |||||||||
|
|
|
|
|
|
|
|
|
|||||||
| |
10,261,879 |
|
390,449 | 1,598,830,854 | (156,045 | ) | ||||||||
|
|
|
|
|
|
|
|
|
|||||||
| $ | 12,959,303 | $ | 454,567 | $ | 1,666,980,956 | $ | (157,310 | ) | ||||||
|
|
|
|
|
|
|
|
|
|||||||
|
|
|
|||||||||||||
| (a) | For the period from August 23, 2021, commencement of operations, to September 30, 2021. |
See Notes to Financial Statements.
40
JOHCM FUNDS TRUST
STATEMENTS OF CHANGES IN NET ASSETS
For the years ended September 30, 2021 and 2020
| JOHCM Credit Income Fund |
JOHCM Emerging Markets Opportunities Fund |
JOHCM Emerging Markets Small Mid Cap Equity Fund |
||||||||||||||||||||||
| 2021 | 2020(a) | 2021 | 2020 | 2021 | 2020 | |||||||||||||||||||
| Increase (decrease) in net assets: |
||||||||||||||||||||||||
| Operations: |
||||||||||||||||||||||||
| Net investment income (loss) |
$ | 160,419 | $ | 17,097 | $ | 12,686,500 | $ | 5,928,823 | $ | 68,483 | $ | 156,185 | ||||||||||||
| Net realized gains (losses) from investments and foreign currency transactions |
36,684 | 1,801 | 54,510,065 | (51,111,188 | ) | 16,333,548 | 2,217,497 | |||||||||||||||||
| Change in unrealized appreciation (depreciation) on investments and foreign currency |
72,894 | (27,318 | ) | 46,876,140 | 71,492,587 | (246,278 | ) | 4,804,461 | ||||||||||||||||
|
|
|
|
|
|
|
|
|
|
|
|
|
|||||||||||||
| Change in net assets resulting from operations |
269,997 | (8,420 | ) | 114,072,705 | 26,310,222 | 16,155,753 | 7,178,143 | |||||||||||||||||
|
|
|
|
|
|
|
|
|
|
|
|
|
|||||||||||||
| Dividends paid to shareholders: |
||||||||||||||||||||||||
| From distributable earnings: |
||||||||||||||||||||||||
| Advisor Shares |
(191 | ) | — | (880,457 | ) | (3,215,212 | ) | (66,920 | ) | (2,460 | ) | |||||||||||||
| Investor Shares |
— | — | (172,913 | ) | (513,302 | ) | — | — | ||||||||||||||||
| Institutional Shares |
(169,720 | ) | (17,962 | ) | (7,218,773 | ) | (19,514,553 | ) | (154,806 | ) | (175,677 | ) | ||||||||||||
|
|
|
|
|
|
|
|
|
|
|
|
|
|||||||||||||
| Total dividends paid to shareholders |
(169,911 | ) | (17,962 | ) | (8,272,143 | ) | (23,243,067 | ) | (221,726 | ) | (178,137 | ) | ||||||||||||
|
|
|
|
|
|
|
|
|
|
|
|
|
|||||||||||||
| Capital Transactions: |
||||||||||||||||||||||||
| Advisor Shares |
10,160 | — | (7,468,006 | ) | (3,464,722 | ) | (4,406,194 | ) | 10,867,243 | |||||||||||||||
| Investor Shares |
— | — | (7,024,857 | ) | 960,552 | — | — | |||||||||||||||||
| Institutional Shares |
134,384 | 5,015,268 | 104,316,360 | 50,387,584 | (7,687,431 | ) | 1,495,200 | |||||||||||||||||
|
|
|
|
|
|
|
|
|
|
|
|
|
|||||||||||||
| Change in net assets from capital transactions |
144,544 | 5,015,268 | 89,823,497 | 47,883,414 | (12,093,625 | ) | 12,362,443 | |||||||||||||||||
|
|
|
|
|
|
|
|
|
|
|
|
|
|||||||||||||
| Change in net assets |
244,630 | 4,988,886 | 195,624,059 | 50,950,569 | 3,840,402 | 19,362,449 | ||||||||||||||||||
| Net assets: |
||||||||||||||||||||||||
| Beginning of year |
4,988,886 | — | 634,225,811 | 583,275,242 | 43,647,100 | 24,284,651 | ||||||||||||||||||
|
|
|
|
|
|
|
|
|
|
|
|
|
|||||||||||||
| End of year |
$ | 5,233,516 | $ | 4,988,886 | $ | 829,849,870 | $ | 634,225,811 | $ | 47,487,502 | $ | 43,647,100 | ||||||||||||
|
|
|
|
|
|
|
|
|
|
|
|
|
|||||||||||||
|
|
||||||||||||||||||||||||
| (a) | For the period from August 17, 2020, commencement of operations, to September 30, 2020. |
See Notes to Financial Statements.
41
| JOHCM Global Select Fund |
JOHCM Global Income Builder Fund |
JOHCM International Opportunities Fund |
JOHCM International Select Fund |
|||||||||||||||||||||||||||
| 2021 | 2020 | 2021 | 2020 | 2021 | 2020 | 2021 | 2020 | |||||||||||||||||||||||
| |
|
|
||||||||||||||||||||||||||||
| $ |
702,421 |
|
$ | (160,367 | ) | $ | 2,697,424 | $ | 2,005,315 | $ | 64,118 | $ | 37,706 | $ | 68,150,102 | $ | 37,829,061 | |||||||||||||
| |
99,756,265 |
|
26,067,936 | 3,673,334 | (1,239,550 | ) | 309,614 | (24,000 | ) | 1,248,707,688 | 310,825,367 | |||||||||||||||||||
| |
40,145,033 |
|
60,644,040 | 6,588,545 | 2,561,705 | 80,835 | (16,010 | ) | 350,123,166 | 1,522,978,530 | ||||||||||||||||||||
|
|
|
|
|
|
|
|
|
|
|
|
|
|
|
|
|
|||||||||||||||
| |
140,603,719 |
|
86,551,609 | 12,959,303 | 3,327,470 | 454,567 | (2,304 | ) | 1,666,980,956 | 1,871,632,958 | ||||||||||||||||||||
|
|
|
|
|
|
|
|
|
|
|
|
|
|
|
|
|
|||||||||||||||
| |
|
|
||||||||||||||||||||||||||||
| |
|
|
||||||||||||||||||||||||||||
| (2,257,927 | ) | (21,676,588 | ) | (264,475 | ) | (216,406 | ) | — | — | — | (78,543,873 | ) | ||||||||||||||||||
| — | — | (2,524 | ) | (3,037 | ) | — | — | (18,199,079 | ) | (4,463,461 | ) | |||||||||||||||||||
| (24,723,249 | ) | (31,391,428 | ) | (2,838,902 | ) | (2,660,890 | ) | (76,392 | ) | (53,453 | ) | (309,630,745 | ) | — | ||||||||||||||||
|
|
|
|
|
|
|
|
|
|
|
|
|
|
|
|
|
|||||||||||||||
| |
(26,981,176 |
) |
(53,068,016 | ) | (3,105,901 | ) | (2,880,333 | ) | (76,392 | ) | (53,453 | ) | (327,829,824 | ) | (83,007,334 | ) | ||||||||||||||
|
|
|
|
|
|
|
|
|
|
|
|
|
|
|
|
|
|||||||||||||||
| |
734,630 |
|
(113,508,495 | ) | 45,443 | 490,238 | — | — | — | — | ||||||||||||||||||||
| — | — | (30,476 | ) | 12,370 | — | — | 74,878,491 | (58,985,362 | ) | |||||||||||||||||||||
| (3,324,905 | ) | 158,647,691 | 5,101,698 | (30,393,091 | ) | 151,228 | 690,598 | 1,384,755,982 | 134,382,072 | |||||||||||||||||||||
|
|
|
|
|
|
|
|
|
|
|
|
|
|
|
|
|
|||||||||||||||
| |
(2,590,275 |
) |
45,139,196 | 5,116,665 | (29,890,483 | ) | 151,228 | 690,598 | 1,459,634,473 | 75,396,710 | ||||||||||||||||||||
|
|
|
|
|
|
|
|
|
|
|
|
|
|
|
|
|
|||||||||||||||
| 111,032,268 | 78,622,789 | 14,970,067 | (29,443,346 | ) | 529,403 | 634,841 | 2,798,785,605 | 1,864,022,334 | ||||||||||||||||||||||
| 461,958,859 | 383,336,070 | 83,200,698 | 112,644,044 | 2,935,470 | 2,300,629 | 10,275,490,324 | 8,411,467,990 | |||||||||||||||||||||||
|
|
|
|
|
|
|
|
|
|
|
|
|
|
|
|
|
|||||||||||||||
| $ | 572,991,127 | $ | 461,958,859 | $ | 98,170,765 | $ | 83,200,698 | $ | 3,464,873 | $ | 2,935,470 | $ | 13,074,275,929 | $ | 10,275,490,324 | |||||||||||||||
|
|
|
|
|
|
|
|
|
|
|
|
|
|
|
|
|
|||||||||||||||
See Notes to Financial Statements.
42
JOHCM FUNDS TRUST
STATEMENTS OF CHANGES IN NET ASSETS
For the years ended September 30, 2021 and 2020
| Regnan Global Equity Impact Solutions |
||||
| 2021(b) | ||||
|
|
||||
| Increase (decrease) in net assets: |
||||
| Operations: |
||||
| Net investment income (loss) |
$ | (1,265 | ) | |
| Net realized gains (losses) from investments and foreign currency transactions |
(2,139 | ) | ||
| Change in unrealized appreciation (depreciation) on investments and foreign currency |
(153,906 | ) | ||
|
|
|
|||
| Change in net assets resulting from operations |
(157,310 | ) | ||
|
|
|
|||
| Dividends paid to shareholders: |
||||
| From distributable earnings: |
||||
| Institutional Shares |
— | |||
|
|
|
|||
| Total dividends paid to shareholders |
— | |||
|
|
|
|||
| Capital Transactions: |
||||
| Institutional Shares |
2,025,005 | |||
|
|
|
|||
| Change in net assets from capital transactions |
2,025,005 | |||
|
|
|
|||
| Change in net assets |
1,867,695 | |||
| Net assets: |
||||
| Beginning of year |
— | |||
|
|
|
|||
| End of year |
$ | 1,867,695 | ||
|
|
|
|||
|
|
||||
| (b) | For the period from August 23, 2021, commencement of operations, to September 30, 2021. |
See Notes to Financial Statements.
43
JOHCM FUNDS TRUST
JOHCM FUNDS
For the periods indicated
| Advisor Shares | ||||
| JOHCM Credit Income Fund | Period Ended September 30, 2021(a) |
|||
|
|
||||
| Net asset value, beginning of year |
$ | 10.16 | ||
|
|
|
|||
| Income (loss) from investment operations: |
||||
| Net investment income(b) |
0.24 | |||
| Net realized and unrealized losses from investments and foreign currency |
(0.08 | ) | ||
|
|
|
|||
| Total from investment operations |
0.16 | |||
|
|
|
|||
| Less distributions paid: |
||||
| From net investment income |
(0.19 | ) | ||
|
|
|
|||
| Total distributions paid |
(0.19 | ) | ||
|
|
|
|||
| Change in net asset value |
(0.03 | ) | ||
|
|
|
|||
| Net asset value, end of year |
$ | 10.13 | ||
|
|
|
|||
| Total return(c) |
1.61 | % | ||
| Ratios/Supplemental data: |
||||
|
|
||||
| Net assets, end of year (000’s) |
$ | 10 | ||
| Ratio of net expenses to average net assets |
0.69 | %(d) | ||
| Ratio of net investment income to average net assets |
3.03 | %(d) | ||
| Ratio of gross expenses to average net assets |
4.39 | %(d) | ||
| Portfolio turnover rate(e) |
84.76 | %(c) | ||
|
|
||||
| (a) | For the period from December 18, 2020, commencement of operations, to September 30, 2021. |
| (b) | Net investment income (loss) for the period ended was calculated using the average shares outstanding method. |
| (c) | Not annualized for periods less than one year. |
| (d) | Annualized for periods less than one year. |
| (e) | Portfolio turnover is calculated at the fund level without regard to each class of shares. |
See Notes to Financial Statements.
44
JOHCM FUNDS TRUST
JOHCM FUNDS
FINANCIAL HIGHLIGHTS
For the periods indicated
| Institutional Shares | ||||||||
| JOHCM Credit Income Fund | Year Ended September 30, 2021 |
Period Ended 2020(a) |
||||||
|
|
||||||||
| Net asset value, beginning of year |
$ | 9.95 | $ | 10.00 | ||||
|
|
|
|
|
|||||
| Income (loss) from investment operations: |
||||||||
| Net investment income(b) |
0.32 | 0.03 | ||||||
| Net realized and unrealized gains (losses) from investments and foreign currency |
0.21 | (0.04 | ) | |||||
|
|
|
|
|
|||||
| Total from investment operations |
0.53 | (0.01 | ) | |||||
|
|
|
|
|
|||||
| Less distributions paid: |
||||||||
| From net investment income |
(0.32 | ) | (0.04 | ) | ||||
| From net realized gains |
(0.01 | ) | — | |||||
|
|
|
|
|
|||||
| Total distributions paid |
(0.33 | ) | (0.04 | ) | ||||
|
|
|
|
|
|||||
| Change in net asset value |
0.20 | (0.05 | ) | |||||
|
|
|
|
|
|||||
| Net asset value, end of year |
$ | 10.15 | $ | 9.95 | ||||
|
|
|
|
|
|||||
| Total return(c) |
5.27 | % | (0.14 | %) | ||||
| Ratios/Supplemental data: |
||||||||
|
|
||||||||
| Net assets, end of year (000’s) |
$ | 5,224 | $ | 4,989 | ||||
| Ratio of net expenses to average net assets |
0.59 | % | 0.65 | %(d) | ||||
| Ratio of net investment income to average net assets |
3.11 | % | 2.85 | %(d) | ||||
| Ratio of gross expenses to average net assets |
4.39 | % | 5.47 | %(d) | ||||
| Portfolio turnover rate(e) |
84.76 | % | 5.72 | %(c) | ||||
|
|
||||||||
| (a) | For the period from August 17, 2020, commencement of operations, to September 30, 2020. |
| (b) | Net investment income (loss) for the period ended was calculated using the average shares outstanding method. |
| (c) | Not annualized for periods less than one year. |
| (d) | Annualized for periods less than one year. |
| (e) | Portfolio turnover is calculated at the fund level without regard to each class of shares. |
See Notes to Financial Statements.
45
JOHCM FUNDS TRUST
JOHCM FUNDS
FINANCIAL HIGHLIGHTS
For the periods indicated
| Advisor Shares | ||||||||||||||||||||
| JOHCM Emerging Markets Opportunities Fund |
Year Ended September 30, 2021 |
Year Ended September 30, 2020 |
Year Ended September 30, 2019 |
Year Ended September 30, 2018 |
Year Ended September 30, 2017 |
|||||||||||||||
| Net asset value, beginning of year |
$ | 10.81 | $ | 10.75 | $ | 11.38 | $ | 11.96 | $ | 10.04 | ||||||||||
|
|
|
|
|
|
|
|
|
|
|
|||||||||||
| Income (loss) from investment operations: |
||||||||||||||||||||
| Net investment income(a) |
0.20 | 0.08 | 0.40 | 0.14 | 0.10 | |||||||||||||||
| Net realized and unrealized gains (losses) from investments and foreign currency |
1.81 | 0.40 | (0.59 | ) | (0.27 | ) | 1.89 | |||||||||||||
|
|
|
|
|
|
|
|
|
|
|
|||||||||||
| Total from investment operations |
2.01 | 0.48 | (0.19 | ) | (0.13 | ) | 1.99 | |||||||||||||
|
|
|
|
|
|
|
|
|
|
|
|||||||||||
| Less distributions paid: |
||||||||||||||||||||
| From net investment income |
(0.13 | ) | (0.42 | ) | (0.10 | ) | (0.07 | ) | (0.07 | ) | ||||||||||
| From net realized gains |
— | — | (0.34 | ) | (0.38 | ) | — | |||||||||||||
|
|
|
|
|
|
|
|
|
|
|
|||||||||||
| Total distributions paid |
(0.13 | ) | (0.42 | ) | (0.44 | ) | (0.45 | ) | (0.07 | ) | ||||||||||
|
|
|
|
|
|
|
|
|
|
|
|||||||||||
| Change in net asset value |
1.88 | 0.06 | (0.63 | ) | (0.58 | ) | 1.92 | |||||||||||||
|
|
|
|
|
|
|
|
|
|
|
|||||||||||
| Net asset value, end of year |
$ | 12.69 | $ | 10.81 | $ | 10.75 | $ | 11.38 | $ | 11.96 | ||||||||||
|
|
|
|
|
|
|
|
|
|
|
|||||||||||
| Total return |
18.64 | % | 4.37 | % | (1.31 | %) | (1.30 | %) | 20.09 | % | ||||||||||
| Ratios/Supplemental data: |
||||||||||||||||||||
| Net assets, end of year (000’s) |
$ | 81,462 | $ | 75,971 | $ | 83,555 | $ | 99,577 | $ | 71,650 | ||||||||||
| Ratio of net expenses to average net assets |
1.12 | % | 1.20 | % | 1.32 | % | 1.34 | % | 1.38 | % | ||||||||||
| Ratio of net investment income to average net assets |
1.51 | % | 0.81 | % | 3.71 | % | 1.15 | % | 0.92 | % | ||||||||||
| Ratio of gross expenses to average net assets |
1.13 | % | 1.20 | % | 1.32 | % | 1.34 | % | 1.38 | % | ||||||||||
| Ratio of expense recoupment to average net assets |
— | — | — | (b) | 0.02 | % | 0.01 | % | ||||||||||||
| Portfolio turnover rate(c) |
38.60 | % | 53.30 | % | 35.35 | % | 31.87 | % | 22.62 | % | ||||||||||
| (a) | Net investment income (loss) for the period ended was calculated using the average shares outstanding method. |
| (b) | Amount rounds to less 0.005%. |
| (c) | Portfolio turnover is calculated at the fund level without regard to each class of shares. |
See Notes to Financial Statements.
46
JOHCM FUNDS TRUST
JOHCM FUNDS
FINANCIAL HIGHLIGHTS
For the periods indicated
| Investor Shares | ||||||||||||||||||||
| JOHCM Emerging Markets Opportunities Fund |
Year Ended September 30, 2021 |
Year Ended September 30, 2020 |
Year Ended September 30, 2019 |
Year Ended September 30, 2018 |
Year Ended September 30, 2017 |
|||||||||||||||
| Net asset value, beginning of year |
$ | 10.80 | $ | 10.74 | $ | 11.36 | $ | 11.95 | $ | 10.03 | ||||||||||
|
|
|
|
|
|
|
|
|
|
|
|||||||||||
| Income (loss) from investment operations: |
||||||||||||||||||||
| Net investment income(a) |
0.19 | 0.08 | 0.41 | 0.12 | 0.08 | |||||||||||||||
| Net realized and unrealized gains (losses) from investments and foreign currency |
1.80 | 0.38 | (0.60 | ) | (0.27 | ) | 1.90 | |||||||||||||
|
|
|
|
|
|
|
|
|
|
|
|||||||||||
| Total from investment operations |
1.99 | 0.46 | (0.19 | ) | (0.15 | ) | 1.98 | |||||||||||||
|
|
|
|
|
|
|
|
|
|
|
|||||||||||
| Less distributions paid: |
||||||||||||||||||||
| From net investment income |
(0.12 | ) | (0.40 | ) | (0.09 | ) | (0.06 | ) | (0.06 | ) | ||||||||||
| From net realized gains |
— | — | (0.34 | ) | (0.38 | ) | — | |||||||||||||
|
|
|
|
|
|
|
|
|
|
|
|||||||||||
| Total distributions paid |
(0.12 | ) | (0.40 | ) | (0.43 | ) | (0.44 | ) | (0.06 | ) | ||||||||||
|
|
|
|
|
|
|
|
|
|
|
|||||||||||
| Change in net asset value |
1.87 | 0.06 | (0.62 | ) | (0.59 | ) | 1.92 | |||||||||||||
|
|
|
|
|
|
|
|
|
|
|
|||||||||||
| Net asset value, end of year |
$ | 12.67 | $ | 10.80 | $ | 10.74 | $ | 11.36 | $ | 11.95 | ||||||||||
|
|
|
|
|
|
|
|
|
|
|
|||||||||||
| Total return |
18.42 | % | 4.26 | % | (1.37 | %) | (1.47 | %) | 19.89 | % | ||||||||||
| Ratios/Supplemental data: |
||||||||||||||||||||
| Net assets, end of year (000’s) |
$ | 9,854 | $ | 14,268 | $ | 13,348 | $ | 8,020 | $ | 5,668 | ||||||||||
| Ratio of net expenses to average net assets |
1.27 | % | 1.35 | % | 1.47 | % | 1.49 | % | 1.54 | % | ||||||||||
| Ratio of net investment income to average net assets |
1.47 | % | 0.76 | % | 3.86 | % | 1.01 | % | 0.71 | % | ||||||||||
| Ratio of gross expenses to average net assets |
1.28 | % | 1.35 | % | 1.47 | % | 1.49 | % | 1.54 | % | ||||||||||
| Ratio of expense recoupment to average net assets |
— | — | — | (b) | 0.02 | % | 0.02 | % | ||||||||||||
| Portfolio turnover rate(c) |
38.60 | % | 53.30 | % | 35.35 | % | 31.87 | % | 22.62 | % | ||||||||||
| (a) | Net investment income (loss) for the period ended was calculated using the average shares outstanding method. |
| (b) | Amount rounds to less 0.005%. |
| (c) | Portfolio turnover is calculated at the fund level without regard to each class of shares. |
See Notes to Financial Statements.
47
JOHCM FUNDS TRUST
JOHCM FUNDS
FINANCIAL HIGHLIGHTS
For the periods indicated
| Institutional Shares | ||||||||||||||||||||
| JOHCM Emerging Markets Opportunities Fund |
Year Ended 2021 |
Year Ended 2020 |
Year Ended 2019 |
Year Ended 2018 |
Year Ended 2017 |
|||||||||||||||
| Net asset value, beginning of year |
$ | 10.85 | $ | 10.78 | $ | 11.41 | $ | 11.99 | $ | 10.06 | ||||||||||
|
|
|
|
|
|
|
|
|
|
|
|||||||||||
| Income (loss) from investment operations: |
||||||||||||||||||||
| Net investment income(a) |
0.21 | 0.11 | 0.48 | 0.15 | 0.13 | |||||||||||||||
| Net realized and unrealized gains (losses) from investments and foreign currency |
1.81 | 0.39 | (0.66 | ) | (0.27 | ) | 1.88 | |||||||||||||
|
|
|
|
|
|
|
|
|
|
|
|||||||||||
| Total from investment operations |
2.02 | 0.50 | (0.18 | ) | (0.12 | ) | 2.01 | |||||||||||||
|
|
|
|
|
|
|
|
|
|
|
|||||||||||
| Less distributions paid: |
||||||||||||||||||||
| From net investment income |
(0.14 | ) | (0.43 | ) | (0.11 | ) | (0.08 | ) | (0.08 | ) | ||||||||||
| From net realized gains |
— | — | (0.34 | ) | (0.38 | ) | — | |||||||||||||
|
|
|
|
|
|
|
|
|
|
|
|||||||||||
| Total distributions paid |
(0.14 | ) | (0.43 | ) | (0.45 | ) | (0.46 | ) | (0.08 | ) | ||||||||||
|
|
|
|
|
|
|
|
|
|
|
|||||||||||
| Change in net asset value |
1.88 | 0.07 | (0.63 | ) | (0.58 | ) | 1.93 | |||||||||||||
|
|
|
|
|
|
|
|
|
|
|
|||||||||||
| Net asset value, end of year |
$ | 12.73 | $ | 10.85 | $ | 10.78 | $ | 11.41 | $ | 11.99 | ||||||||||
|
|
|
|
|
|
|
|
|
|
|
|||||||||||
| Total return |
18.70 | % | 4.56 | % | (1.21 | %) | (1.23 | %) | 20.21 | % | ||||||||||
| Ratios/Supplemental data: |
||||||||||||||||||||
| Net assets, end of year (000’s) |
$ | 738,534 | $ | 543,987 | $ | 486,372 | $ | 388,129 | $ | 269,622 | ||||||||||
| Ratio of net expenses to average net assets |
1.02 | % | 1.10 | % | 1.22 | % | 1.24 | % | 1.29 | % | ||||||||||
| Ratio of net investment income to average net assets |
1.61 | % | 1.04 | % | 4.46 | % | 1.26 | % | 1.23 | % | ||||||||||
| Ratio of gross expenses to average net assets |
1.03 | % | 1.10 | % | 1.22 | % | 1.24 | % | 1.29 | % | ||||||||||
| Ratio of expense recoupment to average net assets |
— | — | — | (b) | 0.02 | % | 0.01 | % | ||||||||||||
| Portfolio turnover rate(c) |
38.60 | % | 53.30 | % | 35.35 | % | 31.87 | % | 22.62 | % | ||||||||||
| (a) | Net investment income (loss) for the period ended was calculated using the average shares outstanding method. |
| (b) | Amount rounds to less 0.005%. |
| (c) | Portfolio turnover is calculated at the fund level without regard to each class of shares. |
See Notes to Financial Statements.
48
JOHCM FUNDS TRUST
JOHCM FUNDS
FINANCIAL HIGHLIGHTS
For the periods indicated
| Advisor Shares | ||||||||||||||||||||
| JOHCM Emerging Markets Small Mid Cap Equity Fund |
Year Ended September 30, 2021 |
Year Ended September 30, 2020 |
Year Ended September 30, 2019 |
Year Ended September 30, 2018 |
Year Ended September 30, 2017 |
|||||||||||||||
| Net asset value, beginning of year |
$ | 13.40 | $ | 11.62 | $ | 11.85 | $ | 14.00 | $ | 11.78 | ||||||||||
|
|
|
|
|
|
|
|
|
|
|
|||||||||||
| Income (loss) from investment operations: |
||||||||||||||||||||
| Net investment income(a) |
0.01 | 0.15 | 0.02 | 0.09 | 0.06 | |||||||||||||||
| Net realized and unrealized gains (losses) from investments and foreign currency |
5.00 | 1.70 | (0.20 | ) | (0.56 | ) | 2.38 | |||||||||||||
|
|
|
|
|
|
|
|
|
|
|
|||||||||||
| Total from investment operations |
5.01 | 1.85 | (0.18 | ) | (0.47 | ) | 2.44 | |||||||||||||
|
|
|
|
|
|
|
|
|
|
|
|||||||||||
| Less distributions paid: |
||||||||||||||||||||
| From net investment income |
(0.06 | ) | (0.07 | ) | (0.05 | ) | (0.13 | ) | (0.22 | ) | ||||||||||
| From net realized gains |
— | — | — | (1.55 | ) | — | ||||||||||||||
|
|
|
|
|
|
|
|
|
|
|
|||||||||||
| Total distributions paid |
(0.06 | ) | (0.07 | ) | (0.05 | ) | (1.68 | ) | (0.22 | ) | ||||||||||
|
|
|
|
|
|
|
|
|
|
|
|||||||||||
| Change in net asset value |
4.95 | 1.78 | (0.23 | ) | (2.15 | ) | 2.22 | |||||||||||||
|
|
|
|
|
|
|
|
|
|
|
|||||||||||
| Net asset value, end of year |
$ | 18.35 | $ | 13.40 | $ | 11.62 | $ | 11.85 | $ | 14.00 | ||||||||||
|
|
|
|
|
|
|
|
|
|
|
|||||||||||
| Total return |
37.50 | % | 15.95 | % | (1.51 | %) | (4.50 | %) | 21.37 | % | ||||||||||
| Ratios/Supplemental data: |
||||||||||||||||||||
| Net assets, end of year (000’s) |
$ | 15,209 | $ | 14,365 | $ | 415 | $ | 751 | $ | 149 | ||||||||||
| Ratio of net expenses to average net assets |
1.63 | % | 1.64 | % | 1.64 | % | 1.64 | % | 1.64 | % | ||||||||||
| Ratio of net investment income to average net assets |
0.06 | % | 1.21 | % | 0.15 | % | 0.69 | % | 0.47 | % | ||||||||||
| Ratio of gross expenses to average net assets |
1.94 | % | 2.29 | % | 2.66 | % | 2.65 | % | 4.37 | % | ||||||||||
| Portfolio turnover rate(b) |
163.54 | % | 136.73 | % | 133.43 | % | 127.34 | % | 174.08 | % | ||||||||||
| (a) | Net investment income (loss) for the period ended was calculated using the average shares outstanding method. |
| (b) | Portfolio turnover is calculated at the fund level without regard to each class of shares. |
See Notes to Financial Statements.
49
JOHCM FUNDS TRUST
JOHCM FUNDS
FINANCIAL HIGHLIGHTS
For the periods indicated
| Institutional Shares | ||||||||||||||||||||
| JOHCM Emerging Markets Small Mid Cap Equity Fund |
Year Ended September 30, 2021 |
Year Ended September 30, 2020 |
Year Ended September 30, 2019 |
Year Ended September 30, 2018 |
Year Ended September 30, 2017 |
|||||||||||||||
| Net asset value, beginning of year |
$ | 13.42 | $ | 11.64 | $ | 11.87 | $ | 14.02 | $ | 11.78 | ||||||||||
|
|
|
|
|
|
|
|
|
|
|
|||||||||||
| Income (loss) from investment operations: |
||||||||||||||||||||
| Net investment income(a) |
0.03 | 0.04 | 0.04 | 0.09 | 0.05 | |||||||||||||||
| Net realized and unrealized gains (losses) from investments and foreign currency |
5.00 | 1.83 | (0.21 | ) | (0.55 | ) | 2.42 | |||||||||||||
|
|
|
|
|
|
|
|
|
|
|
|||||||||||
| Total from investment operations |
5.03 | 1.87 | (0.17 | ) | (0.46 | ) | 2.47 | |||||||||||||
|
|
|
|
|
|
|
|
|
|
|
|||||||||||
| Less distributions paid: |
||||||||||||||||||||
| From net investment income |
(0.07 | ) | (0.09 | ) | (0.06 | ) | (0.14 | ) | (0.23 | ) | ||||||||||
| From net realized gains |
— | — | — | (1.55 | ) | — | ||||||||||||||
|
|
|
|
|
|
|
|
|
|
|
|||||||||||
| Total distributions paid |
(0.07 | ) | (0.09 | ) | (0.06 | ) | (1.69 | ) | (0.23 | ) | ||||||||||
|
|
|
|
|
|
|
|
|
|
|
|||||||||||
| Change in net asset value |
4.96 | 1.78 | (0.23 | ) | (2.15 | ) | 2.24 | |||||||||||||
|
|
|
|
|
|
|
|
|
|
|
|||||||||||
| Net asset value, end of year |
$ | 18.38 | $ | 13.42 | $ | 11.64 | $ | 11.87 | $ | 14.02 | ||||||||||
|
|
|
|
|
|
|
|
|
|
|
|||||||||||
| Total return |
37.60 | % | 16.09 | % | (1.42 | %) | (4.43 | %) | 21.59 | % | ||||||||||
| Ratios/Supplemental data: |
||||||||||||||||||||
| Net assets, end of year (000’s) |
$ | 32,279 | $ | 29,282 | $ | 23,870 | $ | 24,093 | $ | 7,406 | ||||||||||
| Ratio of net expenses to average net assets |
1.53 | % | 1.54 | % | 1.54 | % | 1.54 | % | 1.54 | % | ||||||||||
| Ratio of net investment income to average net assets |
0.18 | % | 0.33 | % | 0.36 | % | 0.69 | % | 0.40 | % | ||||||||||
| Ratio of gross expenses to average net assets |
1.84 | % | 2.19 | % | 2.56 | % | 2.48 | % | 4.38 | % | ||||||||||
| Portfolio turnover rate(b) |
163.54 | % | 136.73 | % | 133.43 | % | 127.34 | % | 174.08 | % | ||||||||||
| (a) | Net investment income (loss) for the period ended was calculated using the average shares outstanding method. |
| (b) | Portfolio turnover is calculated at the fund level without regard to each class of shares. |
See Notes to Financial Statements.
50
JOHCM FUNDS TRUST
JOHCM FUNDS
FINANCIAL HIGHLIGHTS
For the periods indicated
| Advisor Shares | ||||||||||||||||||||
| JOHCM Global Select Fund | Year Ended September 30, 2021 |
Year Ended September 30, 2020 |
Year Ended September 30, 2019 |
Year Ended September 30, 2018 |
Year Ended September 30, 2017 |
|||||||||||||||
| Net asset value, beginning of year |
$ | 17.28 | $ | 16.41 | $ | 16.73 | $ | 15.05 | $ | 13.58 | ||||||||||
|
|
|
|
|
|
|
|
|
|
|
|||||||||||
| Income (loss) from investment operations: |
||||||||||||||||||||
| Net investment income (loss)(a) |
0.01 | (0.04 | ) | 0.10 | 0.07 | 0.07 | ||||||||||||||
| Net realized and unrealized gains from investments and foreign currency |
5.12 | 3.17 | 0.25 | 1.67 | 1.43 | |||||||||||||||
|
|
|
|
|
|
|
|
|
|
|
|||||||||||
| Total from investment operations |
5.13 | 3.13 | 0.35 | 1.74 | 1.50 | |||||||||||||||
|
|
|
|
|
|
|
|
|
|
|
|||||||||||
| Less distributions paid: |
||||||||||||||||||||
| From net investment income |
— | (0.02 | ) | (0.18 | ) | (0.06 | ) | (0.03 | ) | |||||||||||
| From net realized gains |
(1.02 | ) | (2.24 | ) | (0.49 | ) | — | — | ||||||||||||
|
|
|
|
|
|
|
|
|
|
|
|||||||||||
| Total distributions paid |
(1.02 | ) | (2.26 | ) | (0.67 | ) | (0.06 | ) | (0.03 | ) | ||||||||||
|
|
|
|
|
|
|
|
|
|
|
|||||||||||
| Change in net asset value |
4.11 | 0.87 | (0.32 | ) | 1.68 | 1.47 | ||||||||||||||
|
|
|
|
|
|
|
|
|
|
|
|||||||||||
| Net asset value, end of year |
$ | 21.39 | $ | 17.28 | $ | 16.41 | $ | 16.73 | $ | 15.05 | ||||||||||
|
|
|
|
|
|
|
|
|
|
|
|||||||||||
| Total return |
30.60 | % | 21.26 | % | 2.66 | % | 11.61 | % | 11.06 | % | ||||||||||
| Ratios/Supplemental data: |
||||||||||||||||||||
| Net assets, end of year (000’s) |
$ | 49,721 | $ | 39,213 | $ | 157,452 | $ | 189,317 | $ | 216,867 | ||||||||||
| Ratio of net expenses to average net assets |
1.07 | % | 1.16 | % | 1.16 | % | 1.17 | % | 1.18 | % | ||||||||||
| Ratio of net investment income (loss) to average net assets |
0.04 | % | (0.28 | %) | 0.63 | % | 0.39 | % | 0.49 | % | ||||||||||
| Ratio of gross expenses to average net assets |
1.08 | % | 1.16 | % | 1.17 | % | 1.17 | % | 1.18 | % | ||||||||||
| Ratio of expense recoupment to average net assets |
— | — | — | (b) | — | (b) | — | (b) | ||||||||||||
| Portfolio turnover rate(c) |
53.91 | % | 40.21 | % | 46.36 | % | 24.81 | % | 51.44 | % | ||||||||||
| (a) | Net investment income (loss) for the period ended was calculated using the average shares outstanding method. |
| (b) | Amount rounds to less 0.005%. |
| (c) | Portfolio turnover is calculated at the fund level without regard to each class of shares. |
See Notes to Financial Statements.
51
JOHCM FUNDS TRUST
JOHCM FUNDS
FINANCIAL HIGHLIGHTS
For the periods indicated
| Institutional Shares | ||||||||||||||||||||
| JOHCM Global Select Fund | Year Ended September 30, 2021 |
Year Ended September 30, 2020 |
Year Ended September 30, 2019 |
Year Ended September 30, 2018 |
Year Ended September 30, 2017 |
|||||||||||||||
| Net asset value, beginning of year |
$ | 17.32 | $ | 16.44 | $ | 16.76 | $ | 15.08 | $ | 13.61 | ||||||||||
|
|
|
|
|
|
|
|
|
|
|
|||||||||||
| Income from investment operations: |
||||||||||||||||||||
| Net investment income(a) |
0.03 | — | (b) | 0.10 | 0.09 | 0.08 | ||||||||||||||
| Net realized and unrealized gains from investments and foreign currency |
5.13 | 3.15 | 0.26 | 1.67 | 1.43 | |||||||||||||||
|
|
|
|
|
|
|
|
|
|
|
|||||||||||
| Total from investment operations |
5.16 | 3.15 | 0.36 | 1.76 | 1.51 | |||||||||||||||
|
|
|
|
|
|
|
|
|
|
|
|||||||||||
| Less distributions paid: |
||||||||||||||||||||
| From net investment income |
— | (0.04 | ) | (0.19 | ) | (0.08 | ) | (0.04 | ) | |||||||||||
| From net realized gains |
(1.02 | ) | (2.23 | ) | (0.49 | ) | — | — | ||||||||||||
|
|
|
|
|
|
|
|
|
|
|
|||||||||||
| Total distributions paid |
(1.02 | ) | (2.27 | ) | (0.68 | ) | (0.08 | ) | (0.04 | ) | ||||||||||
|
|
|
|
|
|
|
|
|
|
|
|||||||||||
| Change in net asset value |
4.14 | 0.88 | (0.32 | ) | 1.68 | 1.47 | ||||||||||||||
|
|
|
|
|
|
|
|
|
|
|
|||||||||||
| Net asset value, end of year |
$ | 21.46 | $ | 17.32 | $ | 16.44 | $ | 16.76 | $ | 15.08 | ||||||||||
|
|
|
|
|
|
|
|
|
|
|
|||||||||||
| Total return |
30.71 | % | 21.43 | % | 2.76 | % | 11.76 | % | 11.15 | % | ||||||||||
| Ratios/Supplemental data: |
||||||||||||||||||||
| Net assets, end of year (000’s) |
$ | 523,270 | $ | 422,745 | $ | 225,884 | $ | 335,636 | $ | 287,089 | ||||||||||
| Ratio of net expenses to average net assets |
0.98 | % | 1.06 | % | 1.06 | % | 1.07 | % | 1.08 | % | ||||||||||
| Ratio of net investment income to average net assets |
0.13 | % | 0.01 | % | 0.66 | % | 0.57 | % | 0.57 | % | ||||||||||
| Ratio of gross expenses to average net assets |
0.98 | % | 1.06 | % | 1.07 | % | 1.07 | % | 1.08 | % | ||||||||||
| Ratio of expense recoupment to average net assets |
— | — | — | (c) | — | (c) | — | (c) | ||||||||||||
| Portfolio turnover rate(d) |
53.91 | % | 40.21 | % | 46.36 | % | 24.81 | % | 51.44 | % | ||||||||||
| (a) | Net investment income (loss) for the period ended was calculated using the average shares outstanding method. |
| (b) | Amount is less than $0.005 per share. |
| (c) | Amount rounds to less 0.005%. |
| (d) | Portfolio turnover is calculated at the fund level without regard to each class of shares. |
See Notes to Financial Statements.
52
JOHCM FUNDS TRUST
JOHCM FUNDS
FINANCIAL HIGHLIGHTS
For the periods indicated
| Advisor Shares | ||||||||||||||||
| JOHCM Global Income Builder Fund | Year Ended September 30, 2021 |
Year Ended September 30, 2020 |
Year Ended September 30, 2019 |
Period Ended September 30, 2018(a) |
||||||||||||
| Net asset value, beginning of year |
$ | 9.89 | $ | 10.09 | $ | 9.71 | $ | 10.00 | ||||||||
|
|
|
|
|
|
|
|
|
|||||||||
| Income (loss) from investment operations: |
||||||||||||||||
| Net investment income(b) |
0.31 | 0.21 | 0.31 | 0.29 | ||||||||||||
| Net realized and unrealized gains (losses) from investments and foreign currency |
1.26 | (0.11 | ) | 0.41 | (0.30 | ) | ||||||||||
|
|
|
|
|
|
|
|
|
|||||||||
| Total from investment operations |
1.57 | 0.10 | 0.72 | (0.01 | ) | |||||||||||
|
|
|
|
|
|
|
|
|
|||||||||
| Less distributions paid: |
||||||||||||||||
| From net investment income |
(0.36 | ) | (0.25 | ) | (0.34 | ) | (0.28 | ) | ||||||||
| From net realized gains |
— | (0.05 | ) | — | — | |||||||||||
|
|
|
|
|
|
|
|
|
|||||||||
| Total distributions paid |
(0.36 | ) | (0.30 | ) | (0.34 | ) | (0.28 | ) | ||||||||
|
|
|
|
|
|
|
|
|
|||||||||
| Change in net asset value |
1.21 | (0.20 | ) | 0.38 | (0.29 | ) | ||||||||||
|
|
|
|
|
|
|
|
|
|||||||||
| Net asset value, end of year |
$ | 11.10 | $ | 9.89 | $ | 10.09 | $ | 9.71 | ||||||||
|
|
|
|
|
|
|
|
|
|||||||||
| Total return |
16.01 | % | 0.99 | % | 7.66 | % | (0.06 | %)(c) | ||||||||
| Ratios/Supplemental data: |
||||||||||||||||
| Net assets, end of year (000’s) |
$ | 8,213 | $ | 7,285 | $ | 6,933 | $ | 5,516 | ||||||||
| Ratio of net expenses to average net assets |
0.83 | % | 0.93 | % | 0.98 | % | 0.98 | %(d) | ||||||||
| Ratio of net investment income to average net assets |
2.86 | % | 2.14 | % | 3.14 | % | 3.50 | %(d) | ||||||||
| Ratio of gross expenses to average net assets |
1.01 | % | 1.08 | % | 1.18 | % | 1.56 | %(d) | ||||||||
| Portfolio turnover rate(e) |
92.03 | % | 141.42 | % | 54.70 | % | 41.93 | %(c) | ||||||||
| (a) | For the period from November 29, 2017, commencement of operations, to September 30, 2018. |
| (b) | Net investment income (loss) for the year ended was calculated using the average shares outstanding method. |
| (c) | Not annualized for periods less than one year. |
| (d) | Annualized for periods less than one year. |
| (e) | Portfolio turnover is calculated at the fund level without regard to each class of shares. |
See Notes to Financial Statements.
53
JOHCM FUNDS TRUST
JOHCM FUNDS
FINANCIAL HIGHLIGHTS
For the periods indicated
| Investor Shares | ||||||||||||
| JOHCM Global Income Builder Fund | Year Ended September 30, 2021 |
Year Ended September 30, 2020 |
Period Ended September 30, 2019(a) |
|||||||||
| Net asset value, beginning of year |
$ | 9.89 | $ | 10.09 | $ | 10.08 | ||||||
|
|
|
|
|
|
|
|||||||
| Income (loss) from investment operations: |
||||||||||||
| Net investment income(b) |
0.30 | 0.20 | 0.06 | |||||||||
| Net realized and unrealized gains (losses) from investments and foreign currency |
1.26 | (0.12 | ) | 0.01 | ||||||||
|
|
|
|
|
|
|
|||||||
| Total from investment operations |
1.56 | 0.08 | 0.07 | |||||||||
|
|
|
|
|
|
|
|||||||
| Less distributions paid: |
||||||||||||
| From net investment income |
(0.35 | ) | (0.23 | ) | (0.06 | ) | ||||||
| From net realized gains |
— | (0.05 | ) | — | ||||||||
|
|
|
|
|
|
|
|||||||
| Total distributions paid |
(0.35 | ) | (0.28 | ) | (0.06 | ) | ||||||
|
|
|
|
|
|
|
|||||||
| Change in net asset value |
1.21 | (0.20 | ) | 0.01 | ||||||||
|
|
|
|
|
|
|
|||||||
| Net asset value, end of year |
$ | 11.10 | $ | 9.89 | $ | 10.09 | ||||||
|
|
|
|
|
|
|
|||||||
| Total return |
15.88 | % | 0.86 | % | 0.75 | %(c) | ||||||
| Ratios/Supplemental data: |
||||||||||||
| Net assets, end of year (000’s) |
$ | 61 | $ | 81 | $ | 77 | ||||||
| Ratio of net expenses to average net assets |
0.98 | % | 1.08 | % | 1.13 | %(d) | ||||||
| Ratio of net investment income to average net assets |
2.73 | % | 2.01 | % | 2.70 | %(d) | ||||||
| Ratio of gross expenses to average net assets |
1.16 | % | 1.23 | % | 1.63 | %(d) | ||||||
| Portfolio turnover rate(e) |
92.03 | % | 141.42 | % | 54.70 | %(c) | ||||||
| (a) | For the period from June 28, 2019, commencement of operations, to September 30, 2019. |
| (b) | Net investment income (loss) for the year ended was calculated using the average shares outstanding method. |
| (c) | Not annualized for periods less than one year. |
| (d) | Annualized for periods less than one year. |
| (e) | Portfolio turnover is calculated at the fund level without regard to each class of shares. |
See Notes to Financial Statements.
54
JOHCM FUNDS TRUST
JOHCM FUNDS
FINANCIAL HIGHLIGHTS
For the periods indicated
| Institutional Shares | ||||||||||||||||
| JOHCM Global Income Builder Fund | Year Ended September 30, 2021 |
Year Ended September 30, 2020 |
Year Ended September 30, 2019 |
Period Ended September 30, 2018(a) |
||||||||||||
| Net asset value, beginning of year |
$ | 9.89 | $ | 10.09 | $ | 9.71 | $ | 10.00 | ||||||||
|
|
|
|
|
|
|
|
|
|||||||||
| Income (loss) from investment operations: |
||||||||||||||||
| Net investment income(b) |
0.32 | 0.22 | 0.33 | 0.30 | ||||||||||||
| Net realized and unrealized gains (losses) from investments and foreign currency |
1.26 | (0.11 | ) | 0.40 | (0.30 | ) | ||||||||||
|
|
|
|
|
|
|
|
|
|||||||||
| Total from investment operations |
1.58 | 0.11 | 0.73 | — | ||||||||||||
|
|
|
|
|
|
|
|
|
|||||||||
| Less distributions paid: |
||||||||||||||||
| From net investment income |
(0.37 | ) | (0.26 | ) | (0.35 | ) | (0.29 | ) | ||||||||
| From net realized gains |
— | (0.05 | ) | — | — | |||||||||||
|
|
|
|
|
|
|
|
|
|||||||||
| Total distributions paid |
(0.37 | ) | (0.31 | ) | (0.35 | ) | (0.29 | ) | ||||||||
|
|
|
|
|
|
|
|
|
|||||||||
| Change in net asset value |
1.21 | (0.20 | ) | 0.38 | (0.29 | ) | ||||||||||
|
|
|
|
|
|
|
|
|
|||||||||
| Net asset value, end of year |
$ | 11.10 | $ | 9.89 | $ | 10.09 | $ | 9.71 | ||||||||
|
|
|
|
|
|
|
|
|
|||||||||
| Total return |
16.12 | % | 1.09 | % | 7.77 | % | 0.03 | %(c) | ||||||||
| Ratios/Supplemental data: |
||||||||||||||||
| Net assets, end of year (000’s) |
$ | 89,897 | $ | 75,835 | $ | 105,634 | $ | 28,206 | ||||||||
| Ratio of net expenses to average net assets |
0.73 | % | 0.83 | % | 0.88 | % | 0.88 | %(d) | ||||||||
| Ratio of net investment income to average net assets |
2.96 | % | 2.19 | % | 3.42 | % | 3.62 | %(d) | ||||||||
| Ratio of gross expenses to average net assets |
0.91 | % | 0.98 | % | 1.08 | % | 1.47 | %(d) | ||||||||
| Portfolio turnover rate(e) |
92.03 | % | 141.42 | % | 54.70 | % | 41.93 | %(c) | ||||||||
| (a) | For the period from November 29, 2017, commencement of operations, to September 30, 2018. |
| (b) | Net investment income (loss) for the year ended was calculated using the average shares outstanding method. |
| (c) | Not annualized for periods less than one year. |
| (d) | Annualized for periods less than one year. |
| (e) | Portfolio turnover is calculated at the fund level without regard to each class of shares. |
See Notes to Financial Statements.
55
JOHCM FUNDS TRUST
JOHCM FUNDS
FINANCIAL HIGHLIGHTS
For the periods indicated
| Institutional Shares | ||||||||||||||||||||
| JOHCM International Opportunities Fund | Year Ended September 30, 2021 |
Year Ended September 30, 2020 |
Year Ended September 30, 2019 |
Year Ended September 30, 2018 |
Year Ended September 30, 2017 |
|||||||||||||||
| Net asset value, beginning of year |
$ | 10.48 | $ | 10.65 | $ | 10.71 | $ | 11.19 | $ | 9.98 | ||||||||||
|
|
|
|
|
|
|
|
|
|
|
|||||||||||
| Income (loss) from investment operations: |
||||||||||||||||||||
| Net investment income(a) |
0.22 | 0.17 | 0.24 | 0.20 | 0.20 | |||||||||||||||
| Net realized and unrealized gains (losses) from investments and foreign currency |
1.39 | (0.09 | ) | (0.10 | ) | (0.02 | ) | 1.09 | ||||||||||||
|
|
|
|
|
|
|
|
|
|
|
|||||||||||
| Total from investment operations |
1.61 | 0.08 | 0.14 | 0.18 | 1.29 | |||||||||||||||
|
|
|
|
|
|
|
|
|
|
|
|||||||||||
| Less distributions paid: |
||||||||||||||||||||
| From net investment income |
(0.17 | ) | (0.23 | ) | (0.18 | ) | (0.29 | ) | (0.08 | ) | ||||||||||
| From net realized gains |
(0.10 | ) | (0.02 | ) | (0.02 | ) | (0.37 | ) | — | |||||||||||
|
|
|
|
|
|
|
|
|
|
|
|||||||||||
| Total distributions paid |
(0.27 | ) | (0.25 | ) | (0.20 | ) | (0.66 | ) | (0.08 | ) | ||||||||||
|
|
|
|
|
|
|
|
|
|
|
|||||||||||
| Change in net asset value |
1.34 | (0.17 | ) | (0.06 | ) | (0.48 | ) | 1.21 | ||||||||||||
|
|
|
|
|
|
|
|
|
|
|
|||||||||||
| Net asset value, end of year |
$ | 11.82 | $ | 10.48 | $ | 10.65 | $ | 10.71 | $ | 11.19 | ||||||||||
|
|
|
|
|
|
|
|
|
|
|
|||||||||||
| Total return |
15.39 | % | 0.62 | % | 1.42 | % | 1.76 | % | 13.12 | % | ||||||||||
| Ratios/Supplemental data: |
||||||||||||||||||||
| Net assets, end of year (000’s) |
$ | 3,465 | $ | 2,935 | $ | 2,301 | $ | 2,276 | $ | 2,254 | ||||||||||
| Ratio of net expenses to average net assets |
0.89 | % | 0.89 | % | 0.89 | % | 0.89 | % | 0.89 | % | ||||||||||
| Ratio of net investment income to average net assets |
1.83 | % | 1.60 | % | 2.29 | % | 1.86 | % | 1.94 | % | ||||||||||
| Ratio of gross expenses to average net assets |
5.73 | % | 9.42 | % | 8.61 | % | 8.23 | % | 9.03 | % | ||||||||||
| Portfolio turnover rate(b) |
47.85 | % | 64.62 | % | 34.58 | % | 57.05 | % | 68.89 | % | ||||||||||
| (a) | Net investment income (loss) for the year ended was calculated using the average shares outstanding method. |
| (b) | Portfolio turnover is calculated at the fund level without regard to each class of shares. |
See Notes to Financial Statements.
56
JOHCM FUNDS TRUST
JOHCM FUNDS
FINANCIAL HIGHLIGHTS
For the periods indicated
| Investor Shares | ||||||||||||||||||||
| JOHCM International Select Fund | Year Ended September 30, 2021 |
Year Ended September 30, 2020 |
Year Ended September 30, 2019 |
Year Ended September 30, 2018 |
Year Ended September 30, 2017 |
|||||||||||||||
| Net asset value, beginning of year |
$ | 27.53 | $ | 22.54 | $ | 23.68 | $ | 21.93 | $ | 19.96 | ||||||||||
|
|
|
|
|
|
|
|
|
|
|
|||||||||||
| Income (loss) from investment operations: |
||||||||||||||||||||
| Net investment income(a) |
0.10 | 0.05 | 0.23 | 0.19 | 0.26 | |||||||||||||||
| Net realized and unrealized gains (losses) from investments and foreign currency |
4.25 | 5.11 | (1.10 | ) | 1.76 | 1.81 | ||||||||||||||
|
|
|
|
|
|
|
|
|
|
|
|||||||||||
| Total from investment operations |
4.35 | 5.16 | (0.87 | ) | 1.95 | 2.07 | ||||||||||||||
|
|
|
|
|
|
|
|
|
|
|
|||||||||||
| Less distributions paid: |
||||||||||||||||||||
| From net investment income |
(0.04 | ) | (0.17 | ) | (0.27 | ) | (0.20 | ) | (0.10 | ) | ||||||||||
| From net realized gains |
(0.77 | ) | — | — | — | — | ||||||||||||||
|
|
|
|
|
|
|
|
|
|
|
|||||||||||
| Total distributions paid |
(0.81 | ) | (0.17 | ) | (0.27 | ) | (0.20 | ) | (0.10 | ) | ||||||||||
|
|
|
|
|
|
|
|
|
|
|
|||||||||||
| Change in net asset value |
3.54 | 4.99 | (1.14 | ) | 1.75 | 1.97 | ||||||||||||||
|
|
|
|
|
|
|
|
|
|
|
|||||||||||
| Net asset value, end of year |
$ | 31.07 | $ | 27.53 | $ | 22.54 | $ | 23.68 | $ | 21.93 | ||||||||||
|
|
|
|
|
|
|
|
|
|
|
|||||||||||
| Total return |
15.94 | % | 23.02 | % | (3.59 | %) | 8.97 | % | 10.45 | % | ||||||||||
| Ratios/Supplemental data: |
||||||||||||||||||||
| Net assets, end of year (000’s) |
$ | 800,457 | $ | 643,607 | $ | 588,729 | $ | 551,489 | $ | 400,294 | ||||||||||
| Ratio of net expenses to average net assets |
1.21 | % | 1.23 | % | 1.24 | % | 1.25 | % | 1.27 | % | ||||||||||
| Ratio of net investment income to average net assets |
0.33 | % | 0.20 | % | 1.03 | % | 0.83 | % | 1.29 | % | ||||||||||
| Ratio of gross expenses to average net assets |
1.21 | % | 1.23 | % | 1.24 | % | 1.25 | % | 1.27 | % | ||||||||||
| Ratio of expense recoupment to average net assets |
— | — | — | — | 0.01 | % | ||||||||||||||
| Portfolio turnover rate(b) |
53.34 | % | 43.51 | % | 33.06 | % | 26.06 | % | 34.96 | % | ||||||||||
| (a) | Net investment income (loss) for the period ended was calculated using the average shares outstanding method. |
| (b) | Portfolio turnover is calculated at the fund level without regard to each class of shares. |
See Notes to Financial Statements.
57
JOHCM FUNDS TRUST
JOHCM FUNDS
FINANCIAL HIGHLIGHTS
For the periods indicated
| Institutional Shares | ||||||||||||||||||||
| JOHCM International Select Fund | Year Ended September 30, 2021 |
Year Ended September 30, 2020 |
Year Ended September 30, 2019 |
Year Ended September 30, 2018 |
Year Ended September 30, 2017 |
|||||||||||||||
| Net asset value, beginning of year |
$ | 27.53 | $ | 22.54 | $ | 23.66 | $ | 21.92 | $ | 19.94 | ||||||||||
|
|
|
|
|
|
|
|
|
|
|
|||||||||||
| Income (loss) from investment operations: |
||||||||||||||||||||
| Net investment income |
0.18 | 0.11 | 0.28 | 0.27 | 0.30 | |||||||||||||||
| Net realized and unrealized gains (losses) from investments and foreign currency |
4.24 | 5.11 | (1.09 | ) | 1.73 | 1.81 | ||||||||||||||
|
|
|
|
|
|
|
|
|
|
|
|||||||||||
| Total from investment operations |
4.42 | 5.22 | (0.81 | ) | 2.00 | 2.11 | ||||||||||||||
|
|
|
|
|
|
|
|
|
|
|
|||||||||||
| Less distributions paid: |
||||||||||||||||||||
| From net investment income |
(0.10 | ) | (0.23 | ) | (0.31 | ) | (0.26 | ) | (0.13 | ) | ||||||||||
| From net realized gains |
(0.77 | ) | — | — | — | — | ||||||||||||||
|
|
|
|
|
|
|
|
|
|
|
|||||||||||
| Total distributions paid |
(0.87 | ) | (0.23 | ) | (0.31 | ) | (0.26 | ) | (0.13 | ) | ||||||||||
|
|
|
|
|
|
|
|
|
|
|
|||||||||||
| Change in net asset value |
3.55 | 4.99 | (1.12 | ) | 1.74 | 1.98 | ||||||||||||||
|
|
|
|
|
|
|
|
|
|
|
|||||||||||
| Net asset value, end of year |
$ | 31.08 | $ | 27.53 | $ | 22.54 | $ | 23.66 | $ | 21.92 | ||||||||||
|
|
|
|
|
|
|
|
|
|
|
|||||||||||
| Total return |
16.24 | % | 23.30 | % | (3.31 | %) | 9.22 | % | 10.72 | % | ||||||||||
| Ratios/Supplemental data: |
||||||||||||||||||||
| Net assets, end of year (000’s) |
$ | 12,273,819 | $ | 9,631,884 | $ | 7,822,739 | $ | 7,619,731 | $ | 6,081,384 | ||||||||||
| Ratio of net expenses to average net assets |
0.96 | % | 0.98 | % | 0.99 | % | 1.00 | % | 1.01 | % | ||||||||||
| Ratio of net investment income to average net assets |
0.57 | % | 0.45 | % | 1.27 | % | 1.16 | % | 1.49 | % | ||||||||||
| Ratio of gross expenses to average net assets |
0.97 | % | 0.98 | % | 0.99 | % | 1.00 | % | 1.01 | % | ||||||||||
| Portfolio turnover rate(a) |
53.34 | % | 43.51 | % | 33.06 | % | 26.06 | % | 34.96 | % | ||||||||||
| (a) | Portfolio turnover is calculated at the fund level without regard to each class of shares. |
See Notes to Financial Statements.
58
JOHCM FUNDS TRUST
JOHCM FUNDS
FINANCIAL HIGHLIGHTS
For the periods indicated
| Institutional Shares | ||||
| Regnan Global Equity Impact Solutions | Period Ended 2021(a) |
|||
| Net asset value, beginning of year |
$ | 10.00 | ||
|
|
|
|||
| Loss from investment operations: |
||||
| Net investment income(b) |
(— | )(c) | ||
| Net realized and unrealized losses from investments and foreign currency |
(0.78 | ) | ||
|
|
|
|||
| Total from investment operations |
(0.78 | ) | ||
|
|
|
|||
| Less distributions paid: |
||||
| Change in net asset value |
(0.78 | ) | ||
|
|
|
|||
| Net asset value, end of year |
$ | 9.22 | ||
|
|
|
|||
| Total return(d) |
(7.80 | %) | ||
| Ratios/Supplemental data: |
||||
| Net assets, end of year (000’s) |
$ | 1,868 | ||
| Ratio of net expenses to average net assets |
0.89 | %(e) | ||
| Ratio of net investment loss to average net assets |
(0.61 | %)(e) | ||
| Ratio of gross expenses to average net assets |
8.76 | %(e) | ||
| Portfolio turnover rate(f) |
4.30 | %(d) | ||
| (a) | For the period from August 23, 2021, commencement of operations, to September 30, 2021. |
| (b) | Net investment income (loss) for the period ended was calculated using the average shares outstanding method. |
| (c) | Amount is less than $0.005 per share. |
| (d) | Not annualized for periods less than one year. |
| (e) | Annualized for periods less than one year. |
| (f) | Portfolio turnover is calculated at the fund level without regard to each class of shares. |
See Notes to Financial Statements.
59
JOHCM FUNDS TRUST
September 30, 2021
JOHCM Funds Trust (the “Trust”) is a Massachusetts business trust operating under an Amended and Restated Agreement and Declaration of Trust (the “Trust Agreement”) dated December 4, 2020. As an open-end registered investment company (as defined in Financial Accounting Standards Board (“FASB”) Accounting Standards Update (“ASU”) 2013-08), the Trust follows accounting and reporting guidance under FASB Accounting Standards Codification (“ASC”) Topic 946, “Financial Services - Investment Companies”). The JOHCM Credit Income Fund, the JOHCM Emerging Markets Opportunities Fund, the JOHCM Emerging Markets Small Mid Cap Equity Fund, the JOHCM Global Select Fund (formerly the JOHCM Global Equity Fund), the JOHCM Global Income Builder Fund, the JOHCM International Opportunities Fund, the JOHCM International Select Fund, and the Regnan Global Equity Impact Solutions (referred to individually as a “Fund” and collectively as the “Funds” or the “JOHCM Funds”) are each a diversified fund and a series of the Trust. The Trust Agreement permits the Board of Trustees (the “Trustees” or “Board”) to authorize and issue an unlimited number of shares of beneficial interest in separate series of the Trust.
Each Fund is authorized to issue up to four classes of shares as follows: Advisor, Investor, Institutional and Z shares. Each class of shares is distinguished by the class-specific shareholder servicing and distribution (Rule 12b-1) fees and/or sub-transfer agency fees incurred, as applicable. As of September 30, 2021, the following classes of shares were in operation:
| Fund | Commencement Date | Investment Objective | ||
| JOHCM Credit Income Fund | Advisor Shares: December 18, 2020 Institutional Shares: August 17, 2020 | to preserve capital and deliver returns through a combination of income and modest capital appreciation. | ||
| JOHCM Emerging Markets Opportunities Fund | Advisor Shares: November 21, 2012 Investor Shares: December 18, 2013 Institutional Shares: November 21, 2012 | to seek long-term capital appreciation | ||
| JOHCM Emerging Markets Small Mid Cap Equity Fund | Advisor Shares: January 28, 2016 Institutional Shares: December 17, 2014 | to seek long-term capital appreciation | ||
| JOHCM Global Select Fund | Advisor Shares: March 22, 2013 Institutional Class Shares: March 22, 2013 | to seek long-term capital appreciation | ||
| JOHCM Global Income Builder Fund | Advisor Shares: November 29, 2017 Investor Shares: June 28, 2019 Institutional Shares: November 29, 2017 |
to seek a level of current income that is consistent with the preservation and long-term growth of capital in inflation-adjusted terms | ||
| JOHCM International Opportunities Fund | Institutional Shares: September 29, 2016 | to achieve long-term total return by investing in a focused portfolio of international equity securities | ||
| JOHCM International Select Fund | Investor Shares: March 31, 2010 Institutional Shares: July 29, 2009 | to seek long-term capital appreciation | ||
| Regnan Global Equity Impact Solutions | Institutional Shares: August 23, 2021 | to seek long-term capital appreciation by investing in companies that contribute solutions to addressing the world’s major social and environmental challenges |
60
JOHCM FUNDS TRUST
NOTES TO FINANCIAL STATEMENTS
September 30, 2021
Under the Trust’s organizational documents, its officers and Trustees are indemnified against certain liabilities arising out of the performance of their duties to the Trust and Funds. In addition, in the normal course of business, the Trust enters into contracts with its vendors and others that provide for general indemnifications. The Funds’ maximum exposure under these arrangements is unknown, as this would involve future claims that may be made against the Funds.
Prior to July 19, 2021, the JOHCM Credit Income Fund, the JOHCM Emerging Markets Opportunities Fund, the JOHCM Emerging Markets Small Mid Cap Equity Fund, the JOHCM Global Select Fund, the JOHCM Global Income Builder Fund, the JOHCM International Opportunities Fund, and the JOHCM International Select Fund operated as the JOHCM Credit Income Fund, the JOHCM Emerging Markets Opportunities Fund, the JOHCM Emerging Markets Small Mid Cap Equity Fund, the JOHCM Global Equity Fund, the JOHCM Global Income Builder Fund, the JOHCM International Opportunities Fund, and the JOHCM International Select Fund, each a series of Advisers Investment Trust (together the “Predecessor Funds”; each a “Predecessor Fund”). Each Predecessor Fund, except for the JOHCM Emerging Markets Small Mid Cap Equity Fund and the JOHCM International Select Fund, were authorized to issue three classes of shares: Class I Shares, Class II Shares, and Institutional Shares. The JOHCM Credit Income was authorized to issue three classes of shares: Class I Shares, Class II shares and Institutional shares. The JOHCM International Select Fund was authorized to issue two classes of shares: Class I Shares and Class II Shares. The JOHCM Emerging Markets Small Mid Cap Equity Fund was authorized to issue four classes of shares: Class I Shares, Class II Shares, Class III Shares, and Institutional Shares. Each class was distinguished by the class-specific shareholder servicing and distribution (Rule 12b-1) fees incurred, as applicable.
On July 19, 2021 the Predecessor Funds were reorganized into JOHCM Funds Trust, pursuant to a Plan of Reorganization approved by the Advisers Investment Trust’s Board of Trustees on December 10, 2020 and by the Predecessor Funds’ shareholders on June 2, 2021 and July 9, 2021 (the “Reorganizations”). At the time of the Reorganizations, each Predecessor Fund transferred all of its assets to its corresponding Fund in exchange for shares of the corresponding JOHCM Fund and the assumption of all of the liabilities of the Predecessor Fund by the corresponding JOHCM Fund. Upon closing of the Reorganizations, holders of a Predecessor Fund’s shares received shares of the corresponding JOHCM Fund’s shares. The Reorganizations were tax-free for U.S federal income tax purposes.
A. Significant accounting policies related to Investments are as follows:
INVESTMENT VALUATION
Investments are recorded at fair value. Fair value is defined as the price that would be received to sell an asset or paid to transfer a liability in an orderly transaction between market participants at the measurement date. The valuation techniques employed by the Funds, as described below, maximize the use of observable inputs and minimize the use of unobservable inputs in determining fair value. These inputs are summarized in the following three broad levels:
• Level 1 — quoted prices in active markets for identical assets
• Level 2 — other significant observable inputs (including quoted prices of similar securities, interest rates, prepayment speeds, credit risk, etc.)
• Level 3 — significant unobservable inputs (including the Fund’s own assumptions in determining the fair value of investments)
The inputs or methodology used for valuing securities are not necessarily an indication of the risk associated with investing in those securities. For example, certain short-term debt securities may be valued using amortized cost. Generally, amortized cost approximates the current value of a security, but since this valuation is not obtained from a quoted price in an active market, such securities would be reflected as Level 2 in the fair value hierarchy.
Security prices are generally provided by an independent third party pricing service approved by the Trustees as of the close of the New York Stock Exchange, normally at 4:00 p.m. Eastern Time, each business day on which the share price of the Funds are calculated. Equity securities listed or traded on a primary exchange are valued at the closing price, if available, or the last sales price on the primary exchange.
61
JOHCM FUNDS TRUST
NOTES TO FINANCIAL STATEMENTS
September 30, 2021
If no sale occurred on the valuation date, the securities will be valued at the latest quotations as of the close of the primary exchange. Investments in other open-end registered investment companies are valued at their respective net asset value as reported by such companies. In these types of situations, valuations are typically categorized as Level 1 in the fair value hierarchy.
Debt and other fixed income securities, if any, are generally valued at an evaluated price provided by an independent pricing source approved by the Trustees. To value debt securities, pricing services may use various pricing techniques, which take into account appropriate factors such as market activity, yield, quality, coupon rate, maturity, type of issue, trading characteristics, call features, credit ratings and other data, as well as broker quotes. Short-term debt securities of sufficient credit quality that mature within sixty days may be valued at amortized cost, which approximates fair value. In each of these situations, valuations are typically categorized as Level 2 in the fair value hierarchy.
When the price of a security is not readily available or deemed unreliable (e.g., an approved pricing service does not provide a price, a furnished price is in error, certain stale prices, or an event occurs that materially affects the furnished price), a Funds’ Fair Value Committee may in good faith establish a fair value for that security in accordance with procedures established by and under the general supervision of the Trustees. In addition, fair value pricing may be used if events materially affecting the value of foreign securities occur between the time when the exchange on which they are traded closes and the time when a Funds’ net asset value is calculated. The Funds identify possible fluctuations in international securities by monitoring the increase or decrease in the value of a designated benchmark index. In the event of an increase or decrease greater than predetermined levels, the Funds may use a systematic valuation model provided by an independent third party pricing service to fair value their international equity securities.
In the fair value situations noted above, while the Trust’s valuation policy is intended to result in a calculation of each Fund’s net asset value that fairly reflects security values as of the time of pricing, the Trust cannot ensure that fair values determined pursuant to these guidelines would accurately reflect the price that the Fund could obtain for a security if it were to dispose of that security as of the time of pricing (for instance, in a forced or distressed sale). The prices used by the Funds may differ from the value that would be realized if the securities were sold, and these differences could be material to the financial statements. Depending on the source and relative significance of the valuation inputs in these instances, the instruments may be classified as Level 2 or Level 3 in the fair value hierarchy.
The following is a summary of the valuation inputs used as of September 30, 2021 in valuing each Fund’s investments based upon the three fair value levels defined above:
| Fund | Level 1 - Quoted Prices |
Level 2 - Other Significant Observable Inputs |
Level 3 - Significant Inputs |
Total | ||||||||||||
| JOHCM Credit Income Fund |
||||||||||||||||
| Closed-End Funds |
$ | 60,936 | $ | — | $ | — | $ | 60,936 | ||||||||
| Common Stocks |
9,360 | 4,263 | — | 13,623 | ||||||||||||
| Convertible Bonds* |
— | 835,422 | — | 835,422 | ||||||||||||
| Corporate Bonds* |
— | 3,181,006 | — | 3,181,006 | ||||||||||||
| Foreign Issuer Bonds* |
— | 432,515 | — | 432,515 | ||||||||||||
| Preferred stocks* |
124,808 | 158,308 | — | 283,116 | ||||||||||||
| Short-Term Investments |
384,500 | — | — | 384,500 | ||||||||||||
|
|
|
|||||||||||||||
| Total Investments |
$ | 579,604 | $ | 4,611,514 | $ | — | $ | 5,191,118 | ||||||||
|
|
|
|||||||||||||||
| JOHCM Emerging Markets Opportunities Fund |
||||||||||||||||
| Common Stocks: |
||||||||||||||||
| Brazil |
$ | 63,577,336 | $ | — | $ | — | $ | 63,577,336 | ||||||||
| Canada |
18,978,691 | — | — | 18,978,691 | ||||||||||||
| China |
13,608,905 | 159,409,011 | — | 173,017,916 | ||||||||||||
| India |
50,701,020 | 81,855,824 | — | 132,556,844 | ||||||||||||
| Mexico |
47,849,885 | — | — | 47,849,885 | ||||||||||||
| Other* |
— | 361,000,853 | — | 361,000,853 | ||||||||||||
|
|
|
|||||||||||||||
| Total common stocks |
$ | 194,715,837 | $ | 602,265,688 | $ | — | $ | 796,981,525 | ||||||||
|
|
|
|||||||||||||||
62
JOHCM FUNDS TRUST
NOTES TO FINANCIAL STATEMENTS
September 30, 2021
| Fund | Level 1 - Quoted Prices |
Level 2 - Other Significant Observable Inputs |
Level 3 - Significant Inputs |
Total | ||||||||||||
| Preferred stocks |
$ | 7,166,716 | $ | — | $ | — | $ | 7,166,716 | ||||||||
|
|
|
|||||||||||||||
| Total Investments |
$ | 201,882,553 | $ | 602,265,688 | $ | — | $ | 804,148,241 | ||||||||
|
|
|
|||||||||||||||
| JOHCM Emerging Markets Small Mid Cap Equity Fund |
||||||||||||||||
| Common Stocks: |
||||||||||||||||
| Brazil |
$ | 2,325,292 | $ | — | $ | — | $ | 2,325,292 | ||||||||
| Canada |
1,705,425 | — | — | 1,705,425 | ||||||||||||
| Chile |
387,227 | — | — | 387,227 | ||||||||||||
| Colombia |
207,413 | — | — | 207,413 | ||||||||||||
| Greece |
302,183 | 917,765 | — | 1,219,948 | ||||||||||||
| Mexico |
1,234,427 | — | — | 1,234,427 | ||||||||||||
| Netherlands |
254,708 | — | — | 254,708 | ||||||||||||
| Other* |
— | 37,547,631 | — | 37,547,631 | ||||||||||||
|
|
|
|||||||||||||||
| Total common stocks |
$ | 6,416,675 | $ | 38,465,396 | $ | — | $ | 44,882,071 | ||||||||
|
|
|
|||||||||||||||
| Equity-Linked Securities |
$ | — | $ | 521,725 | $ | — | $ | 521,725 | ||||||||
| Preferred stocks |
595,422 | — | — | 595,422 | ||||||||||||
|
|
|
|||||||||||||||
| Total Investments |
$ | 7,012,097 | $ | 38,987,121 | $ | — | $ | 45,999,218 | ||||||||
|
|
|
|||||||||||||||
| JOHCM Global Select Fund |
||||||||||||||||
| Common Stocks: |
||||||||||||||||
| Australia |
$ | 14,399,951 | $ | 8,161,196 | $ | — | $ | 22,561,147 | ||||||||
| Canada |
13,245,400 | — | — | 13,245,400 | ||||||||||||
| Germany |
9,858,761 | — | — | 9,858,761 | ||||||||||||
| Ireland |
27,151,145 | — | — | 27,151,145 | ||||||||||||
| United Kingdom |
27,550,077 | — | — | 27,550,077 | ||||||||||||
| United States |
277,712,555 | — | — | 277,712,555 | ||||||||||||
| Other* |
— | 165,928,819 | — | 165,928,819 | ||||||||||||
|
|
|
|||||||||||||||
| Total common stocks |
$ | 369,917,889 | $ | 174,090,015 | $ | — | $ | 544,007,904 | ||||||||
|
|
|
|||||||||||||||
| Total Investments |
$ | 369,917,889 | $ | 174,090,015 | $ | — | $ | 544,007,904 | ||||||||
|
|
|
|||||||||||||||
| JOHCM Global Income Builder Fund |
||||||||||||||||
| Closed-End Funds |
$ | 449,787 | $ | — | $ | — | $ | 449,787 | ||||||||
| Common Stocks: |
||||||||||||||||
| Canada |
821,054 | — | — | 821,054 | ||||||||||||
| Mexico |
572,210 | — | — | 572,210 | ||||||||||||
| Netherlands |
929,599 | 1,161,658 | — | 2,091,257 | ||||||||||||
| Switzerland |
930,907 | 4,247,600 | — | 5,178,507 | ||||||||||||
| Taiwan |
938,195 | — | — | 938,195 | ||||||||||||
| United States |
30,761,240 | 73,306 | — | 30,834,546 | ||||||||||||
| Other* |
— | 27,040,460 | — | 27,040,460 | ||||||||||||
|
|
|
|||||||||||||||
| Total common stocks |
$ | 34,953,205 | $ | 32,523,024 | $ | — | $ | 67,476,229 | ||||||||
|
|
|
|||||||||||||||
| Convertible Bonds* |
$ | — | $ | 3,924,486 | $ | — | $ | 3,924,486 | ||||||||
| Corporate Bonds |
— | 13,052,466 | — | 13,052,466 | ||||||||||||
| Exchange Traded Funds: |
||||||||||||||||
| Hong Kong |
— | 229,381 | — | 229,381 | ||||||||||||
| United States |
2,696,045 | — | — | 2,696,045 | ||||||||||||
|
|
|
|||||||||||||||
| Total Exchange Traded Funds |
$ | 2,696,045 | $ | 229,381 | $ | — | $ | 2,925,426 | ||||||||
|
|
|
|||||||||||||||
| Foreign Issuer Bonds* |
$ | — | $ | 2,672,745 | $ | — | $ | 2,672,745 | ||||||||
63
JOHCM FUNDS TRUST
NOTES TO FINANCIAL STATEMENTS
September 30, 2021
| Fund | Level 1 - Quoted Prices |
Level 2 - Other Significant Observable Inputs |
Level 3 - Significant Unobservable Inputs |
Total | ||||||||||||
| Preferred stocks: |
||||||||||||||||
| Chile |
$ | 361,958 | $ | — | $ | — | $ | 361,958 | ||||||||
| South Korea |
— | 848,956 | — | 848,956 | ||||||||||||
| United States |
509,783 | 893,308 | — | 1,403,091 | ||||||||||||
|
|
|
|||||||||||||||
| Total preferred stocks |
$ | 871,741 | $ | 1,742,264 | $ | — | $ | 2,614,005 | ||||||||
|
|
|
|||||||||||||||
| Warrants* |
$ | 83,410 | $ | — | $ | — | $ | 83,410 | ||||||||
| Short-Term Investments |
2,393,587 | — | — | 2,393,587 | ||||||||||||
|
|
|
|||||||||||||||
| Total Investments |
$ | 41,447,775 | $ | 54,144,366 | $ | — | $ | 95,592,141 | ||||||||
|
|
|
|||||||||||||||
| JOHCM International Opportunities Fund |
||||||||||||||||
| Common Stocks: |
||||||||||||||||
| Canada |
$ | 84,210 | $ | — | $ | — | $ | 84,210 | ||||||||
| Germany |
47,095 | 408,420 | — | 455,515 | ||||||||||||
| United States |
97,918 | — | — | 97,918 | ||||||||||||
| Other* |
— | 2,558,220 | — | 2,558,220 | ||||||||||||
|
|
|
|||||||||||||||
| Total common stocks |
$ | 229,223 | $ | 2,966,640 | $ | — | $ | 3,195,863 | ||||||||
|
|
|
|||||||||||||||
| Total Investments |
$ | 229,223 | $ | 2,966,640 | $ | — | $ | 3,195,863 | ||||||||
|
|
|
|||||||||||||||
| JOHCM International Select Fund |
||||||||||||||||
| Common Stocks: |
||||||||||||||||
| Canada |
$ | 205,876,525 | $ | — | $ | — | $ | 205,876,525 | ||||||||
| Germany |
248,471,651 | 1,216,507,742 | — | 1,464,979,393 | ||||||||||||
| Ireland |
862,818,187 | — | — | 862,818,187 | ||||||||||||
| United Kingdom |
281,981,212 | 1,930,411,550 | — | 2,212,392,762 | ||||||||||||
| Other* |
— | 7,761,412,286 | — | 7,761,412,286 | ||||||||||||
|
|
|
|||||||||||||||
| Total common stocks |
$ | 1,599,147,575 | $ | 10,908,331,578 | $ | — | $ | 12,507,479,153 | ||||||||
|
|
|
|||||||||||||||
| Total Investments |
$ | 1,599,147,575 | $ | 10,908,331,578 | $ | — | $ | 12,507,479,153 | ||||||||
|
|
|
|||||||||||||||
| Regnan Global Equity Impact Solutions |
||||||||||||||||
| Closed-End Funds |
$ | — | $ | 21,155 | $ | — | $ | 21,155 | ||||||||
| Common Stocks: |
||||||||||||||||
| Brazil |
111,492 | — | — | 111,492 | ||||||||||||
| United Kingdom |
42,293 | 30,752 | — | 73,045 | ||||||||||||
| United States |
481,405 | — | — | 481,405 | ||||||||||||
| Other* |
— | 1,172,923 | — | 1,172,923 | ||||||||||||
|
|
|
|||||||||||||||
| Total common stocks |
$ | 635,190 | $ | 1,203,675 | $ | — | $ | 1,838,865 | ||||||||
|
|
|
|||||||||||||||
| Total Investments |
$ | 635,190 | $ | 1,224,830 | $ | — | $ | 1,860,020 | ||||||||
|
|
|
|||||||||||||||
* See additional categories in the Schedule of Investments.
As of September 30, 2021 there were no Level 3 securities held by the Funds. There were no transfers to or from Level 3 during the year ended September 30, 2021.
EQUITY-LINKED SECURITIES
The Funds may invest in equity-linked securities, also known as participation notes. The Funds may use these instruments as an alternate means to gain exposure to what is generally an emerging securities market, such as countries in which it does not have local accounts. These instruments represent interests in securities listed on certain foreign exchanges, and thus present similar risks to investing directly
64
JOHCM FUNDS TRUST
NOTES TO FINANCIAL STATEMENTS
September 30, 2021
in such equity securities. These instruments are generally issued by the associates of foreign-based foreign brokerages and domestic institutional brokerages. Accordingly, the equity-linked securities also expose investors to counterparty risk, which is the risk that the entity issuing the note may not be able to honor its financial commitments.
At September 30, 2021, the Funds held equity-linked securities issued by counterparties as follows:
| Fund | Counterparty | Fair value | % of Net Assets | |||
| JOHCM Emerging Markets Small Mid Cap Equity Fund | CLSA Global Markets Pte. Ltd. | $ 521,725 | 1.1% |
CURRENCY TRANSACTIONS
The functional and reporting currency for the Funds is the U.S. dollar. The market values of foreign securities, currency holdings and other assets and liabilities are translated into U.S. dollars based on the current exchange rates each business day. Purchases and sales of securities and income and expense items denominated in foreign currencies are translated into U.S. dollars at the exchange rate in effect on the transaction date. The Funds do not separately report the effects of changes in foreign exchange rates from changes in market prices on securities held. Such changes are included in Net realized and unrealized gains (losses) from investment activities on the Statements of Operations. The Funds may invest in foreign currency-denominated securities and may engage in foreign currency transactions either on a spot (cash) basis at the rate prevailing in the currency exchange market at the time or through a forward foreign currency contract. Realized foreign exchange gains or losses arising from sales of spot foreign currencies, currency gains or losses realized between the trade and settlement dates on securities transactions and the difference between the recorded amounts of dividends, interest, and foreign withholding taxes and the U.S. dollar equivalent of the amounts actually received or paid are included in Net realized gains (losses) from foreign currency transactions on the Statements of Operations. Net unrealized foreign exchange gains (losses) arising from changes in foreign exchange rates on foreign denominated assets and liabilities other than investments in securities held at the end of the reporting period are included in Change in unrealized appreciation (depreciation) on foreign currency on the Statements of Operations.
The Funds may engage in spot currency transactions for the purpose of foreign security settlement and operational processes. Certain Funds are authorized to enter into forward foreign currency exchange contracts, for the purchase or sale of a specific foreign currency at a specified exchange rate on a future date as a hedge against either specific transactions or portfolio positions, or as a cross-hedge transaction or for speculative purposes. The objective of a Fund’s foreign currency hedging transactions is to reduce the risk that the U.S. dollar value of a Fund’s foreign currency denominated securities will decline in value due to change in foreign currency exchange rates. Changes in foreign currency exchange rates will affect the value of a Funds’ securities and the price of a Funds’ shares. Generally, when the value of the U.S. dollar rises in value relative to a foreign currency, an investment in that country loses value because that currency is worth fewer U.S. dollars. Devaluation of a currency by a country’s government or banking authority also may have a significant impact on the value of any investments denominated in that currency. Currency markets generally are not as regulated as securities markets.
All forward foreign currency exchange contracts are marked-to-market daily at the applicable exchange rates. Any unrealized gains or losses are recorded in Net change in unrealized appreciation (depreciation) on forward foreign currency exchange contracts in the Statements of Operations. Gains or losses are recorded for financial statement purposes as unrealized until settlement date. Realized gains or losses, if any, are included in Net realized gains (losses) on forward foreign exchange contracts in the Statements of Operations.
Risks may arise upon entering into these contracts from the potential inability of counterparties to meet the terms of their contracts and from unanticipated movements in the value of a foreign currency relative to the U.S. dollar. The contractual amounts of forward foreign currency exchange contracts do not necessarily represent the amounts potentially subject to risk. The Funds bear the market risk from changes in forward foreign currency exchange rates and the credit risk if the counterparty to the contract fails to perform. The institutions that deal in forward foreign currency exchange contracts are not required to continue to make markets in the currencies they trade and these markets can experience periods of illiquidity.
The following table, set forth by primary risk exposure, displays the Funds’ realized gains (losses) and change in unrealized appreciation (depreciation) by type of derivative contract for the year ended September 30, 2021:
65
JOHCM FUNDS TRUST
NOTES TO FINANCIAL STATEMENTS
September 30, 2021
| Fund | Contract Type | Statement of Operations Location | Amount of Realized Gain (Loss) on Derivative Contracts | |||
| JOHCM Global Income Builder Fund | Foreign exchange contracts |
Net realized gains (losses) on forward foreign currency exchange contracts |
$ 4,605 |
| Fund | Contract Type | Statement of Operations Location | Change in Unrealized (Depreciation) Derivative | |||
| JOHCM Global Income Builder Fund | Foreign exchange contracts |
Change in unrealized appreciation (depreciation) on forward foreign currency exchange contracts |
$ (17,209) |
Volume of derivative activity for the fiscal year ended September 30, 2021*:
| Foreign Exchange Contracts |
||||||
| Fund | Number Of Trades |
Average Notional Amount |
||||
| JOHCM Global Income Builder Fund |
2 | $ | 2,163,655 | |||
* Activity for the period is measured by number of trades during the period and average notional amount for foreign currency exchange.
INVESTMENT TRANSACTIONS AND INCOME
Investment transactions are accounted for no later than one business day after trade date. For financial reporting purposes, investments are reported as of the trade date. The Funds determines the gain or loss realized from investment transactions by using an identified cost basis method. Interest income is recognized on an accrual basis and includes, where applicable, the amortization of premium or accretion of discount. Dividend income is recognized on the ex-dividend date. Dividends from foreign securities are recorded on the ex-dividend date, or as soon as the information is available.
EXPENSE ALLOCATIONS
Expenses directly attributable to a fund in the Trust are charged to that fund, while expenses that are attributable to more than one fund in the Trust are allocated among the applicable funds on a pro-rata basis based on relative net assets or another reasonable basis. Certain expenses that arise in connection with a class of shares are charged to that class of shares.
The investment income, expenses (other than class-specific expenses charged to a class), and realized/unrealized gains/losses on investments are allocated to each class of shares based upon relative net assets on the date income is earned or expenses and realized/unrealized gains/losses are incurred.
DIVIDENDS AND DISTRIBUTIONS
Distributions of dividends from net investment income, if any, are declared and paid as follows:
66
JOHCM FUNDS TRUST
NOTES TO FINANCIAL STATEMENTS
September 30, 2021
| Declaration and Payment Frequency |
||||
| JOHCM Credit Income Fund |
Daily/Monthly | |||
| JOHCM Emerging Markets Opportunities Fund |
Annually | |||
| JOHCM Emerging Markets Small Mid Cap Equity Fund |
Annually | |||
| JOHCM Global Select Fund |
Annually | |||
| JOHCM Global Income Builder Fund |
Daily/Monthly | |||
| JOHCM International Opportunities Fund |
Annually | |||
| JOHCM International Select Fund |
Annually | |||
| Regnan Global Equity Impact Solutions |
Annually | |||
The Funds intend to distribute their net realized long-term capital gains and their net realized short-term capital gains at least once a year.
Distributions from net investment income and from net realized capital gain are determined in accordance with Federal income tax regulations, which may differ from accounting principles generally accepted in the United States of America (“GAAP”).These “book/tax” differences are either considered temporary or permanent in nature. To the extent these differences are permanent in nature (e.g. treatment of certain dividend distributions, gains/losses, return of capital etc.), such amounts are reclassified within the composition of net assets based on their federal tax-basis treatment; temporary differences do not require reclassification. Distributions to shareholders that exceed net investment income and net realized capital gains for tax purposes are reported as return of capital.
FEDERAL INCOME TAX INFORMATION
No provision is made for Federal income taxes as each Fund intends to qualify each year as a “regulated investment company” under Subchapter M of the Internal Revenue Code of 1986, as amended (the “Code”), and distribute substantially all of its net investment income and net realized capital gain in accordance with the Code.
The Funds analyzed all open tax years, as defined by the Statute of Limitations, for all major jurisdictions that remain subject to examination. The Funds’ Federal tax returns for the tax years ended September 30, 2018 through September 30, 2021, as applicable, remain subject to examination by the Internal Revenue Service. Interest or penalties incurred, if any, on future unknown or uncertain tax positions taken by the Funds will be recorded as interest expense on the Statements of Operations.
Management is not aware of any tax positions for which it is reasonably possible that the total amounts of unrecognized tax benefits will significantly change in the next twelve months.
USE OF ESTIMATES
The preparation of financial statements in conformity with GAAP requires management to make estimates and assumptions that affect the reported amounts of assets and liabilities and disclosure of contingent assets and liabilities at the date of the financial statements and the reported amounts of revenues and expenses during the reporting period. Actual results could differ from these estimates.
CAPITAL GAIN TAXES
Investments in certain foreign securities may subject the Funds to capital gain taxes on the disposal of those securities. Any capital gains assessed will reduce the proceeds received on the sale and be reflected in net realized gain/loss on the transaction. The Funds estimate and accrue foreign capital gain taxes on certain investments held which impact the amount of unrealized appreciation/depreciation on such investments. The JOHCM Emerging Markets Small Mid Cap Fund paid $328,693 in capital gain taxes during the year. This amounts is included in the net realized gains (losses) from investment transactions on the Statement of Operations.
67
JOHCM FUNDS TRUST
NOTES TO FINANCIAL STATEMENTS
September 30, 2021
OTHER RISKS
Securities markets outside the United States (“U.S.”), while growing in volume, have for the most part substantially less volume than U.S. markets, and many securities traded on these foreign markets are less liquid and their prices are more volatile than securities of comparable U.S. companies. In addition, settlement of trades in some non-U.S. markets is much slower and more subject to failure than in U.S. markets. Other risks associated with investing in foreign securities include, among other things, imposition of exchange control regulation by the U.S. or foreign governments, U.S. and foreign withholding taxes, limitations on the removal of funds or other assets, policies of governments with respect to possible nationalization of their industries, and economic or political instability in foreign nations. There may be less publicly available information about certain foreign companies than would be the case for comparable companies in the U.S., and certain foreign companies may not be subject to accounting, auditing and financial reporting standards and requirements comparable to or as uniform as those of U.S. companies.
Certain Funds may invest in emerging market securities. Investing in emerging market securities involves risks which are in addition to the usual risks inherent in foreign investments. These countries generally are located in the Asia and Pacific regions, the Middle East, Eastern Europe, Central America, South America and Africa. Some countries with emerging securities markets have experienced substantial, and in some periods extremely high, rates of inflation for many years. Inflation and rapid fluctuations in inflation rates have had and may continue to have negative effects on the economies and securities markets of certain countries. Moreover, the economies of some countries may differ favorably or unfavorably from the U.S. economy in such respects as rate of growth of gross domestic product, rate of inflation, capital reinvestment, resource self-sufficiency, number and depth of industries forming the economy’s base, condition and stability of financial institutions, governmental controls and investment restrictions that are subject to political change and balance of payments position. Further, a Fund may face greater difficulties or restrictions with respect to investments made in emerging markets countries than in the U.S. Satisfactory custodial services may not be available in some emerging markets countries, which may result in a Fund incurring additional costs and delays in the trading and custody of such securities.
Natural or environmental disasters, such as earthquakes, fires, floods, hurricanes, tsunamis and other severe weather-related phenomena generally, and widespread disease, including pandemics and epidemics, have been and may be highly disruptive to economies and markets, adversely impacting individual companies, sectors, industries, markets, currencies, interest and inflation rates, credit ratings, investor sentiment, and other factors affecting the value of a Fund’s investments. Given the increasing interdependence among global economies and markets, conditions in one country, market, or region are increasingly likely to adversely affect markets, issuers, and/or foreign exchange rates in other countries, for example, an epidemic or pandemic can result in travel restrictions, closed international borders, enhanced health screenings at ports of entry and elsewhere, disruption of and delays in healthcare service preparation and delivery, prolonged quarantines, cancellations, supply chain disruptions, and lower consumer demand, as well as general concern and uncertainty. All of these disruptive effects were present, for example, in the global pandemic linked to the outbreak of respiratory disease caused by a novel coronavirus designated as COVID-19 that was first reported in China in December 2019. The effects of any disease outbreak may be greater in countries with less developed disease prevention and control programs and may also exacerbate other pre-existing political, social, economic, market and financial risks. A pandemic and its effects may be short term or may last for an extended period of time, and in either case can result in significant market volatility, exchange trading suspensions and closures, declines in global financial markets, higher default rates, and a substantial economic downturn or recession. Infectious illness outbreaks can adversely affect the economies of many nations or the entire global economy, individual issuers and capital markets in ways that cannot necessarily be foreseen. Any such events could have a significant adverse impact on the value of a Fund’s investments.
Instruments in which the Funds invest may pay interest at floating rates based on the London Interbank Offered Rate (“LIBOR”) or may be subject to interest caps or floors based on LIBOR. The use of LIBOR will be phased out by the end of 2021. Abandonment of or modifications to LIBOR could have adverse impacts on newly issued financial instruments and existing financial instruments which reference LIBOR and lead to significant short-term and long-term uncertainty and market instability.
68
JOHCM FUNDS TRUST
NOTES TO FINANCIAL STATEMENTS
September 30, 2021
| B. | Fees and Transactions with Affiliates and Other Parties |
The Funds are a party to an Investment Advisory Agreement with JOHCM (USA) Inc. (the “Adviser” or “JOHCM USA”) and prior to the Reorganizations, the Predecessor Funds had entered into an Investment Advisory Agreement (together the “Agreements”) with J O Hambro Capital Management Limited (the “Previous Adviser”) to provide investment management services to the Predecessor Funds. The Regnan Global Equity Impact Solutions entered into an Investment Advisory Agreement with the Adviser on June 21, 2021.
JOHCM USA is wholly owned by the Previous Adviser (together with JOHCM USA, “JOHCM”). Total fees incurred pursuant to the Agreements are reflected as “Investment Advisory” fees on the Statement of Operations. Under the terms of the Agreements, JOHCM receives an annual fee, computed daily and payable monthly, at the annual rates set forth in the following table (expressed as a percentage of each Fund’s respective average daily net assets). JOHCM has contractually agreed to waive fees and reimburse expenses to the extent that Total Annual Operating Expenses (excluding taxes, extraordinary expenses, expenses associated with investments in underlying investment companies, brokerage commissions, interest, dividends, litigation and indemnification expenses) exceed the rates in the table below (expressed as a percentage of each Fund’s respective average daily net assets).
| Fund | Class | Advisory Fee | Expense Limitation |
Expense Limitation Prior to July 19, 2021 | ||||
| JOHCM Credit Income Fund |
Advisor Shares | 0.55% | 0.68% | 0.69% | ||||
| JOHCM Credit Income Fund |
Institutional Shares | 0.55% | 0.58% | 0.59% | ||||
| JOHCM Emerging Markets Opportunities Fund |
Advisor Shares | 0.90% | 1.12% | 1.19% | ||||
| JOHCM Emerging Markets Opportunities Fund |
Investor Shares | 0.90% | 1.27% | 1.34% | ||||
| JOHCM Emerging Markets Opportunities Fund |
Institutional Shares | 0.90% | 1.04% | 1.09% | ||||
| JOHCM Emerging Markets Small Mid Cap Equity Fund |
Advisor Shares | 1.30% | 1.59% | 1.64% | ||||
| JOHCM Emerging Markets Small Mid Cap Equity Fund |
Institutional Shares | 1.30% | 1.49% | 1.54% | ||||
| JOHCM Global Select Fund |
Advisor Shares | 0.89%(a) | 1.08% | 1.09%(b) | ||||
| JOHCM Global Select Fund |
Institutional Shares | 0.89%(a) | 0.98% | 0.99%(b) | ||||
| JOHCM Global Income Builder Fund |
Advisor Shares | 0.67% | 0.82% | 0.83% | ||||
| JOHCM Global Income Builder Fund |
Investor Shares | 0.67% | 0.97% | 0.98% | ||||
| JOHCM Global Income Builder Fund |
Institutional Shares | 0.67% | 0.72% | 0.73% | ||||
| JOHCM International Opportunities Fund |
Institutional Shares | 0.75% | 0.88% | 0.89% | ||||
| JOHCM International Select Fund |
Investor Shares | 0.89% | 1.21% | 1.30% | ||||
| JOHCM International Select Fund |
Institutional Shares | 0.89% | 0.98% | 1.05% | ||||
| Regnan Global Equity Impact Solutions |
Institutional Shares | 0.75% | 0.89% | — |
(a) Prior to December 11, 2020 the advisory fee was 0.95%.
(b) Prior to December 11, 2020 the expense limits were 1.18% and 1.08% for the Advisor shares and Institutional shares, respectively.
The expense limitation agreement is effective until June 30, 2022 for the Funds, except for the Regnan Global Equity Impact Solutions which is effective until July 31, 2022, at which time it will be subject to automatic renewal upon the effective date of the annual update to the a Funds’ registration statement. If it becomes unnecessary for the Adviser to waive fees or make reimbursements, the Adviser may recapture any of its prior waivers or reimbursements for a period not to exceed three years from the date on which the waiver or reimbursement was made to the extent that such a recapture does not cause the Total Annual Fund Operating Expenses (exclusive of
69
JOHCM FUNDS TRUST
NOTES TO FINANCIAL STATEMENTS
September 30, 2021
brokerage and other transaction expenses relating to the purchase or sale of portfolio investments, interest, taxes, short sale dividends and financing costs associated with the use of the cash proceeds on securities sold short, litigation and indemnification expenses, expenses associated with the investments in underlying investment companies and extraordinary expenses) to exceed the current expense limitation at the time of repayment or the applicable expense limitation that was in effect at the time of the waiver or reimbursement. The agreement to waive fees and reimburse expenses may be terminated by the Board at any time and will terminate automatically upon termination of the Agreement.
Prior to the Reorganizations, JOHCM USA served as the investment sub-adviser to the JOHCM Credit Income Fund, the JOHCM Global Income Builder Fund and the JOHCM International Small Cap Equity Fund. For its services, JOCHM USA as sub-adviser was paid a fee of 0.55%, 0.67% and 1.05%, based on average daily net assets of the JOHCM Credit Income Fund, the JOHCM Global Income Builder Fund and the JOHCM International Small Cap Equity Fund, respectively, by J O Hambro Capital Management Limited.
For the year ended September 30, 2021, the JOHCM Funds incurred advisory fees payable to JOHCM, expense waivers/reimbursements from JOHCM, and paid expense recoupments to JOHCM as follows:
| Fund | Advisory Fee to JOHCM |
Expenses Reduced by JOHCM |
Advisory Fees Recouped by JOHCM |
|||||||||
| JOHCM Credit Income Fund |
$ | 28,287 | $ | 72,630 | $ | — | ||||||
| JOHCM Emerging Markets Opportunities Fund |
7,143,120 | 1,430 | — | |||||||||
| JOHCM Emerging Markets Small Mid Cap Equity Fund |
648,263 | 121,435 | — | |||||||||
| JOHCM Global Select Fund |
5,005,998 | 989 | — | |||||||||
| JOHCM Global Income Builder Fund |
611,230 | 64,790 | — | |||||||||
| JOHCM International Opportunities Fund |
26,240 | 47,718 | — | |||||||||
| JOHCM International Select Fund |
108,677,435 | 21,314 | — | |||||||||
| Regnan Global Equity Impact Solutions* |
1,555 | 16,338 | — | |||||||||
| * | For the period from August 23, 2021, commencement of operations, to September 30, 2021 |
The balances of recoverable expenses to JOHCM by Funds at September 30, 2021 were as follows:
| For the year ended: | Expiring | JOHCM Credit Income Fund |
JOHCM Opportunities |
JOHCM Mid Cap |
JOHCM Global Select Fund |
JOHCM Global Income Builder Fund |
JOHCM Opportunities |
JOHCM Fund |
Regnan Global Equity Impact Solutions |
|||||||||||||||||||||||||||
| September 30, 2019 |
September 30, 2022 | $ | — | $ | — | $ | 238,798 | $ | — | $ | 28,639 | $ | 21,181 | $ | — | $ | — | |||||||||||||||||||
| September 30, 2020 |
September 30, 2023 | 10,656 | — | 201,003 | — | 123,468 | 80,299 | — | — | |||||||||||||||||||||||||||
| September 30, 2021 |
September 30, 2024 | 72,620 | — | 121,344 | — | 64,632 | 47,711 | — | 16,338 | * | ||||||||||||||||||||||||||
|
|
|
|
|
|
|
|
|
|
|
|
|
|
|
|
|
|||||||||||||||||||||
| Balances of Recoverable Expenses to JOHCM |
$ | 83,276 | $ | — | $ | 561,145 | $ | — | $ | 216,739 | $ | 149,191 | $ | — | $ | 16,338 | ||||||||||||||||||||
|
|
|
|
|
|
|
|
|
|
|
|
|
|
|
|
|
|||||||||||||||||||||
| * | For the period from August 23, 2021, commencement of operations, to September 30, 2021 |
As of July 19, 2021 JOHCM Funds Distributors, LLC (the “Distributor”), provides distribution services to the Funds pursuant to a distribution agreement with the Trust, on behalf of the Funds. Prior to the Reorganizations Foreside Financial Services, LLC ( the “Former Distributor”) provided distribution services to the Predecessor Funds pursuant to a distribution agreement with the Advisers Investment Trust, on behalf of the Predecessor Funds. The Distributor acts as an agent of the Trust in connection with the offering of the shares of the
70
JOHCM FUNDS TRUST
NOTES TO FINANCIAL STATEMENTS
September 30, 2021
Funds on a continuous basis. JOHCM, at its own expense, pays the Distributor an annual base fee, an asset-based fee and reimbursement for certain expenses and out-of-pocket costs incurred on behalf of the Funds. Prior to July 19, 2021, the Former Distributor provided these distribution services to the Predecessor Funds under similar compensation arrangements and such amounts were also paid directly by the Previous Adviser.
The Northern Trust Company (“Northern Trust”) serves as the administrator, transfer agent, custodian and fund accounting agent for the Funds pursuant to written agreements with the Trust on behalf of the Funds. Prior to the Reorganizations, Northern Trust served as the administrator, transfer agent, custodian and fund accounting agent for the Predecessor Funds pursuant to written agreements with the Advisers Investment Trust, on behalf of the Predecessor Funds. The Funds have agreed to pay Northern Trust a tiered basis-point fee based on the JOHCM Funds’ complex level net assets, certain per account and transaction charges, other fees for additional service activities, and reimbursement of certain expense. As of July 19, 2021 the total fee is not subject to a minimum annual fee. Prior to the Reorganizations, the fees to Northern Trust were subject to similar compensation arrangements but were also subject to a minimum annual fee of $160,000 per Fund relating to these services. Total fees paid to Northern Trust for their services are reflected as “Accounting and Administration” fees on the Statements of Operations. Northern Trust agreed to voluntarily waive its prior minimum fees and certain other expenses. This voluntary waiver agreement terminated at the time of the Reorganizations, and the waivers were not subject to recoupment. Amounts waived by Northern Trust are included in “Expenses reduced by Service Providers” on the Statements of Operations.
For the year ended September 30, 2021, Northern Trust voluntarily waived expenses as follows:
| Fund | Expenses Waived by Northern Trust |
|||
| JOHCM Credit Income Fund |
$ | 122,906 | ||
| JOHCM Emerging Markets Opportunities Fund |
103,301 | |||
| JOHCM Emerging Markets Small Mid Cap Equity Fund |
34,726 | |||
| JOHCM Global Select Fund |
31,772 | |||
| JOHCM Global Income Builder Fund |
102,436 | |||
| JOHCM International Opportunities Fund |
121,852 | |||
| JOHCM International Select Fund |
671,811 | |||
Beginning July 19, 2021, Foreside Fund Officer Services, LLC (“Foreside”) provides principal financial officer and treasurer services for the Funds pursuant to a written agreement with the Trust on behalf of the Funds. Prior to the Reorganizations, Foreside provided compliance and financial control services for the Predecessor Funds pursuant to a written agreement with the Advisers Investment Trust on behalf of the Predecessor Funds, including providing certain officers to the Predecessor Funds. The Funds have agreed to pay, and the Predecessor Funds paid, Foreside an annual fee based on the JOHCM Funds’ complex level net assets, subject to an overall minimum annual fee of $200,000 for these services, and reimburse for certain expenses incurred on behalf of the Funds. Total fees paid to Foreside pursuant to these agreements are reflected as “Regulatory and Treasurer Service” fees on the Statements of Operations.
JOHCM and the Trust have entered into an Administration and Compliance Support Services Agreement (the “ACSS Agreement”) pursuant to which JOHCM provides, coordinates or otherwise supports the provision of, administration and compliance services for the Trust. The Trust began receiving services, and accruing payment obligations, under the ACSS Agreement on July 19, 2021. As full compensation for the services rendered and expenses borne by JOHCM in connection with the services JOHCM provides under the ACSS Agreement, the Trust, on behalf of each Fund, agrees to reimburse JOHCM in such amounts as are approved by the Board of Trustees of the Trust (the “Board”) from time to time. Total fees paid to JOHCM pursuant to the ACSS Agreement are reflected as “JOHCM Compliance” fees in the Statements of Operations.
JOHCM and the Trust have entered into an Institutional Class Shareholder Services, Recordkeeping and Sub-Transfer Agency Agreement (the “Shareholder Services Agreement”). The Trust began receiving services, and accruing payment obligations, under the Shareholder Services Agreement on July 19, 2021. Pursuant to the Shareholder Services Agreement, the Trust, on behalf of each Fund, agrees that Institutional Class shares of each Fund shall reimburse JOHCM or its designee for any payments JOHCM or such designee makes to
71
JOHCM FUNDS TRUST
NOTES TO FINANCIAL STATEMENTS
September 30, 2021
third-party service providers for personal services, accounting or subaccounting, recordkeeping and/or other administrative services provided to beneficial holders of Institutional Class shares of the Funds. Payments by a Fund pursuant to the Shareholder Services Agreement shall not exceed such amounts as are approved by the Board from time to time. Total fees reimbursed to JOHCM pursuant to the Shareholder Services Agreement are reflected as “Shareholder Services - Institutional” fees in the Statements of Operations.
Prior to July 19, 2021, Carne Global Financial Services (US) LLC (“Carne”) provided Risk Management and Oversight Services for the Predecessor Funds pursuant to a written agreement with the Advisers Investment Trust, on behalf of the Predecessor Funds, including providing a Risk Officer to the Predecessor Funds to administer the Fund risk program and oversee the analysis of investment performance and performance of service providers. The Predecessor Funds paid Carne an annual fee of $50,000 for the first fund and an additional $5,000 per fund thereafter for these services, and reimburse for certain expenses incurred on behalf of the Predecessor Funds. Total fees paid to Carne pursuant to this agreement are reflected as “Risk Officer” fees on the Statements of Operations. Following the Reorganizations, the services previously provided by Carne were assumed by JOHCM.
Certain officers and Trustees of the Trust are affiliated with JOHCM, Foreside, Northern Trust, or the Distributor and receive no compensation directly from the Funds for serving in their respective roles. Beginning July 19, 2021, the Trust paid each Independent Trustee compensation for their services based on an annual retainer of $105,000, certain committee and chairperson retainers and reimbursement for certain expenses. For the year ended September 30, 2021, the aggregate Trustee compensation paid by the Trust was $426,000. Prior to the Reorganizations, the Advisers Investment Trust paid each Independent Trustee compensation for their services based on an annual retainer of $125,000 and reimbursement for certain expenses. For the year ended September 30, 2021, the aggregate Trustee compensation paid by the Advisers Investment Trust was $379,000. The amount of total Trustee compensation and reimbursement of out-of-pocket expenses allocated from the Trust and the Advisers Investment Trust to the Funds and Predecessor Funds are reflected as “Trustees” expenses on the Statements of Operations.
| C. | Rule 12b-1 Plan |
The JOHCM Funds adopted an amended plan under Rule 12b-1 that is applicable to Advisor Shares and Investor Shares to pay for certain distribution and promotion activities related to marketing of their shares. Each Fund will pay the Distributor a fee for the principal underwriter’s services in connection with the sales and promotion of the Funds, including its expenses in connection there with at annual rates of 0.10% and 0.25% of the average daily net assets of the outstanding Advisor Shares and Investor Shares, respectively. The Predecessor Funds had a similar plan with the Former Distributor and identical fee arrangements with the Predecessor Share Classes. Total fees paid pursuant to these plans are reflected as “12b-1 Fees” on the Statements of Operations.
| D. | Credit Agreements |
The Trust, on behalf of the JOHCM Funds, entered into a $100 million revolving credit facility agreement (the “Credit Agreement”) with the Northern Trust for liquidity or for other temporary or emergency purposes effective July 19, 2021. The Credit Agreement permits the JOHCM Funds to borrow up to an aggregate amount of $100 million, $50 million of which is committed and $50 million of which is uncommitted. Any advance under the Credit Agreement will accrue interest at a rate per annum equivalent to the sum of the U.S. Federal Fund Target Rate plus 1.50% per annum.
Prior to July 19, 2021 the Advisers Investment Trust, on behalf of the Predecessor Funds and Northern Trust, had entered into a $100 million revolving Credit Agreement (the “Previous Credit Agreement” and the “Credit Agreements”) for liquidity and other purposes effective as of December 22, 2017 and amended December 20, 2020.
Advances under the Previous Credit Agreement accrued interest at a rate that was equal to the greater of (i) the Predecessor Funds’ option of the daily London Interbank Offered Rate plus 1.50% or the Federal funds (effective) interest rate plus 1.50% and (ii) 2.00%. In addition, there was a commitment fee on the undrawn portion of the $100 million maximum commitment amount in an amount equal to the product of the difference between the maximum commitment amount and the sum of the average daily balance of the loans multiplied by 0.30% per annum.
72
JOHCM FUNDS TRUST
NOTES TO FINANCIAL STATEMENTS
September 30, 2021
During the year ended September 30, 2021, the following Funds had borrowings with the average loan and weighted interest rate as disclosed below:
| Fund | Dollar Amount | Days Outstanding | Rate | |||||||||
| JOHCM Emerging Markets Small Mid Cap Equity Fund |
$ | 2,410,286 | 7 | 2.00 | % | |||||||
| JOHCM Global Select Fund |
4,290,000 | 4 | 2.00 | |||||||||
| JOHCM International Select Fund |
70,000,000 | 5 | 2.00 | |||||||||
The JOHCM Emerging Markets Small Mid Cap Equity Fund, the JOHCM Global Select Fund and the JOHCM International Select Fund incurred interest expense of $733, $953 and $19,445, respectively, related to borrowings under the Credit Agreements during the year ended September 30, 2021 respectively. The amounts are included in the “Interest Expense” on the Statements of Operations.
| E. | Investment Transactions |
For the year ended September 30, 2021, the aggregate cost of purchases and proceeds from sales of securities (excluding short-term investments) for the Funds were as follows:
| Fund | Cost of Purchases | Proceeds from sales | ||||||
| JOHCM Credit Income Fund |
$ | 4,098,805 | $ | 4,047,936 | ||||
| JOHCM Emerging Markets Opportunities Fund |
387,228,232 | 292,414,491 | ||||||
| JOHCM Emerging Markets Small Mid Cap Equity Fund |
78,294,056 | 90,873,407 | ||||||
| JOHCM Global Select Fund |
287,196,951 | 338,440,837 | ||||||
| JOHCM Global Income Builder Fund |
83,577,947 | 79,992,649 | ||||||
| JOHCM International Opportunities Fund |
1,694,357 | 1,470,827 | ||||||
| JOHCM International Select Fund |
7,042,378,799 | 6,200,671,933 | ||||||
| Regnan Global Equity Impact Solutions* |
2,097,531 | 82,894 | ||||||
| * | For the period from August 23, 2021, commencement of operations, to September 30, 2021 |
| F. | Federal Income Tax |
As of September 30, 2021, the cost, gross unrealized appreciation and gross unrealized depreciation on investments, for Federal income tax purposes, were as follows:
| Fund | Tax Cost | Tax Unrealized |
Tax Unrealized |
Net Unrealized Appreciation (Depreciation) |
||||||||||||
| JOHCM Credit Income Fund |
$ | 5,145,542 | $ | 81,010 | $ | (35,434 | ) | $ | 45,576 | |||||||
| JOHCM Emerging Markets Opportunities Fund |
703,504,639 | 137,944,041 | (37,300,439 | ) | 100,643,602 | |||||||||||
| JOHCM Emerging Markets Small Mid Cap Equity Fund |
39,512,792 | 8,393,751 | (1,907,325 | ) | 6,486,426 | |||||||||||
| JOHCM Global Select Fund |
372,748,217 | 186,302,825 | (15,043,138 | ) | 171,259,687 | |||||||||||
| JOHCM Global Income Builder Fund |
83,524,679 | 12,989,258 | (921,796 | ) | 12,067,462 | |||||||||||
| JOHCM International Opportunities Fund |
3,057,685 | 279,964 | (141,786 | ) | 138,178 | |||||||||||
| JOHCM International Select Fund |
9,632,530,510 | 3,337,809,246 | (462,860,603 | ) | 2,874,948,643 | |||||||||||
| Regnan Global Equity Impact Solutions |
2,014,128 | 3,365 | (157,473 | ) | (154,108 | ) | ||||||||||
The tax character of distributions paid by the Funds during the latest tax years ended September 30, 2021 and September 30, 2020 were as follows:
73
JOHCM FUNDS TRUST
NOTES TO FINANCIAL STATEMENTS
September 30, 2021
| Distributions From | ||||||||||||||||
| Fund | Ordinary Income* 2021 |
Long-Term Capital Gains 2021 |
Ordinary Income* 2020 |
Long-Term Capital Gains 2020 |
||||||||||||
| JOHCM Credit Income Fund |
$ | 169,004 | $ | 754 | $ | 15,908 | $ | — | ||||||||
| JOHCM Emerging Markets Opportunities Fund |
8,272,143 | — | 23,243,067 | — | ||||||||||||
| JOHCM Emerging Markets Small Mid Cap Equity Fund |
221,726 | ** | — | ** | 178,137 | — | ||||||||||
| JOHCM Global Select Fund |
202,822 | 26,778,354 | 4,522,375 | 48,545,641 | ||||||||||||
| JOHCM Global Income Builder Fund |
3,063,276 | — | 2,723,962 | 93,453 | ||||||||||||
| JOHCM International Opportunities Fund |
48,597 | 27,795 | 49,029 | 4,424 | ||||||||||||
| JOHCM International Select Fund |
60,638,266 | 267,191,558 | 83,007,334 | — | ||||||||||||
| * | Ordinary income includes short-term capital gains, if any. |
| ** | The amounts do not include tax equalization utilized of $1,962,464 and $904,584 in ordinary income and net long term capital gains, respectively, in which the Fund designated as being distributed to shareholders on their redemption of shares. |
As of the tax year ended September 30, 2021, the components of accumulated earnings on a tax basis were as follows:
| JOHCM Credit Income Fund |
JOHCM Emerging Markets Opportunities Fund |
JOHCM Mid Cap |
JOHCM Global Select Fund |
JOHCM Fund |
JOHCM International Opportunities Fund |
JOHCM Fund |
Regnan Global Equity Impact Solutions |
|||||||||||||||||||||||||
| Undistributed Ordinary Income |
$ | 31,473 | $ | 12,919,444 | $ | 8,278,249 | $ | 10,311,059 | $ | 872,557 | $ | 257,188 | $ | 234,506,676 | $ | — | ||||||||||||||||
| Undistributed Long-Term Capital Gains |
— | — | 3,815,803 | 85,105,952 | 730,529 | 72,706 | 1,028,090,909 | — | ||||||||||||||||||||||||
| Accumulated Capital and Other Losses |
(2,207 | ) | (1,431,457 | ) | — | — | (105,543 | ) | — | — | (37 | ) | ||||||||||||||||||||
| Unrealized Appreciation (Depreciation) |
45,576 | 100,205,015 | 6,277,543 | 171,261,971 | 12,060,133 | 138,148 | 2,875,051,700 | (154,115 | ) | |||||||||||||||||||||||
|
|
|
|
|
|
|
|
|
|
|
|
|
|
|
|
|
|||||||||||||||||
| Total Accumulated Earnings (Deficit) |
$ | 74,842 | $ | 111,693,002 | $ | 18,371,595 | $ | 266,678,982 | $ | 13,557,676 | $ | 468,042 | $ | 4,137,649,285 | $ | (154,152 | ) | |||||||||||||||
|
|
|
|
|
|
|
|
|
|
|
|
|
|
|
|
|
|||||||||||||||||
As of the tax year ended September 30, 2021, capital losses incurred by the Funds are carried forward indefinitely under the provisions of the Regulated Investment Company Modernization Act of 2010 and are as follows:
| Fund | Short-Term Capital Loss Carry-Forward |
Long-Term Capital Loss Carry-Forward |
||||||
| JOHCM Emerging Markets Opportunities Fund |
$ | 1,431,457 | $ | — | ||||
| Regnan Global Equity Impact Solutions |
37 | — | ||||||
74
JOHCM FUNDS TRUST
NOTES TO FINANCIAL STATEMENTS
September 30, 2021
During the tax year ended September 30, 2021, the JOHCM Emerging Markets Opportunities and JOHCM Emerging Markets Small Mid Cap Equity Funds utilized $51,880,809 and $1,104,666, respectively, in capital loss carry forwards.
Primarily as a result of differing book/tax treatment of foreign currency transactions and tax equalization, the Funds made reclassifications among certain capital accounts. These reclassifications have no effect on net assets or net asset value per share. As of September 30, 2021, the following reclassifications were made to the Funds’ Statements of Assets and Liabilities:
| Fund | Distributable Earnings (Loss) |
Paid-in Capital |
||||||
| JOHCM Credit Income Fund |
$ | 428 | $ | (428 | ) | |||
| JOHCM Emerging Markets Small Mid Cap Equity Fund |
(2,867,048 | ) | 2,867,048 | |||||
| Regnan Global Equity Impact Solutions |
3,158 | (3,158 | ) | |||||
| G. | Capital Share Transactions |
Transactions in dollars for fund shares for the year ended September 30, 2021, were as follows:
| Fund | Class | Proceeds from Shares Sold |
Reinvestments of Dividends |
Payments for Shares Redeemed |
Net Increase (Decrease) in Net Assets |
|||||||||||||
| JOHCM Credit Income Fund |
Advisor Shares | $ | 10,009 | $ | 161 | $ | (10 | ) | $ | 10,160 | ||||||||
| JOHCM Credit Income Fund |
Institutional Shares | — | 144,384 | (10,000 | ) | 134,384 | ||||||||||||
| JOHCM Emerging Markets Opportunities Fund |
Advisor Shares | 11,346,933 | 583,877 | (19,398,816 | ) | (7,468,006 | ) | |||||||||||
| JOHCM Emerging Markets Opportunities Fund |
Investor Shares | 7,276,833 | 169,599 | (14,471,289 | ) | (7,024,857 | ) | |||||||||||
| JOHCM Emerging Markets Opportunities Fund |
Institutional Shares | 245,052,553 | 6,294,356 | (147,030,549 | ) | 104,316,360 | ||||||||||||
| JOHCM Emerging Markets Small Mid Cap Equity Fund |
Advisor Shares | 2,350,298 | 48,955 | (6,805,447 | ) | (4,406,194 | ) | |||||||||||
| JOHCM Emerging Markets Small Mid Cap Equity Fund |
Institutional Shares | 2,498,407 | 133,054 | (10,318,892 | ) | (7,687,431 | ) | |||||||||||
| JOHCM Global Select Fund |
Advisor Shares | 5,687,570 | 2,248,961 | (7,201,901 | ) | 734,630 | ||||||||||||
| JOHCM Global Select Fund |
Institutional Shares | 28,533,160 | 21,990,488 | (53,848,553 | ) | (3,324,905 | ) | |||||||||||
| JOHCM Global Income Builder Fund |
Advisor Shares | 75,195 | 223,080 | (252,832 | ) | 45,443 | ||||||||||||
| JOHCM Global Income Builder Fund |
Investor Shares | 29,899 | 2,518 | (62,893 | ) | (30,476 | ) | |||||||||||
| JOHCM Global Income Builder Fund |
Institutional Shares | 11,176,286 | 1,820,345 | (7,894,933 | ) | 5,101,698 | ||||||||||||
| JOHCM International Opportunities Fund |
Institutional Shares | 104,634 | 70,716 | (24,122 | ) | 151,228 | ||||||||||||
| JOHCM International Select Fund |
Investor Shares | 124,252,054 | 17,935,746 | (67,309,309 | ) | 74,878,491 | ||||||||||||
| JOHCM International Select Fund |
Institutional Shares | 2,936,315,988 | 190,985,805 | (1,742,545,811 | ) | 1,384,755,982 | ||||||||||||
| Regnan Global Equity Impact Solutions* |
Institutional Shares | 2,025,005 | — | — | 2,025,005 | |||||||||||||
| * | For the period from August 23, 2021, commencement of operations, to September 30, 2021 |
75
JOHCM FUNDS TRUST
NOTES TO FINANCIAL STATEMENTS
September 30, 2021
Transactions in shares of fund shares for the year ended September 30, 2021, were as follows:
| Fund | Class | Shares Sold |
Shares From Reinvested Dividends |
Shares Redeemed |
Net in Shares |
|||||||||||||
| JOHCM Credit Income Fund |
Advisor Shares | 993 | 16 | (1 | ) | 1,008 | ||||||||||||
| JOHCM Credit Income Fund |
Institutional Shares | — | 14,255 | (990 | ) | 13,265 | ||||||||||||
| JOHCM Emerging Markets Opportunities Fund |
Advisor Shares | 880,244 | 47,393 | (1,537,226 | ) | (609,589 | ) | |||||||||||
| JOHCM Emerging Markets Opportunities Fund |
Investor Shares | 572,921 | 13,766 | (1,130,536 | ) | (543,849 | ) | |||||||||||
| JOHCM Emerging Markets Opportunities Fund |
Institutional Shares | 18,609,679 | 509,664 | (11,273,794 | ) | 7,845,549 | ||||||||||||
| JOHCM Emerging Markets Small Mid Cap Equity Fund |
Advisor Shares | 145,454 | 3,234 | (391,679 | ) | (242,991 | ) | |||||||||||
| JOHCM Emerging Markets Small Mid Cap Equity Fund |
Institutional Shares | 146,737 | 8,782 | (581,633 | ) | (426,114 | ) | |||||||||||
| JOHCM Global Select Fund |
Advisor Shares | 285,151 | 121,829 | (351,752 | ) | 55,228 | ||||||||||||
| JOHCM Global Select Fund |
Institutional Shares | 1,440,998 | 1,188,675 | (2,656,545 | ) | (26,872 | ) | |||||||||||
| JOHCM Global Income Builder Fund |
Advisor Shares | 6,723 | 20,493 | (24,090 | ) | 3,126 | ||||||||||||
| JOHCM Global Income Builder Fund |
Investor Shares | 2,856 | 233 | (5,775 | ) | (2,686 | ) | |||||||||||
| JOHCM Global Income Builder Fund |
Institutional Shares | 1,002,710 | 167,097 | (741,423 | ) | 428,384 | ||||||||||||
| JOHCM International Opportunities Fund |
Institutional Shares | 8,859 | 6,060 | (2,018 | ) | 12,901 | ||||||||||||
| JOHCM International Select Fund |
Investor Shares | 3,995,758 | 609,023 | (2,221,380 | ) | 2,383,401 | ||||||||||||
| JOHCM International Select Fund |
Institutional Shares | 95,831,511 | 6,496,116 | (57,258,676 | ) | 45,068,951 | ||||||||||||
| Regnan Global Equity Impact Solutions* |
Institutional Shares | 202,493 | — | — | 202,493 | |||||||||||||
| * | For the period from August 23, 2021, commencement of operations, to September 30, 2021 |
Transactions in dollars for fund shares for the year ended September 30, 2020, were as follows:
| Fund | Class | Proceeds from Shares Sold |
Reinvestments of Dividends |
Payments for Shares Redeemed |
Net Increase (Decrease) in Net Assets |
|||||||||||||
| JOHCM Credit Income Fund |
Institutional Shares | $ | 5,000,000 | $ | 15,268 | $ | — | $ | 5,015,268 | |||||||||
| JOHCM Emerging Markets Opportunities Fund |
Advisor Shares | 42,325,858 | 2,251,441 | (48,042,021 | ) | (3,464,722 | ) | |||||||||||
| JOHCM Emerging Markets Opportunities Fund |
Investor Shares | 4,664,808 | 490,550 | (4,194,806 | ) | 960,552 | ||||||||||||
| JOHCM Emerging Markets Opportunities Fund |
Institutional Shares | 207,211,534 | 16,812,678 | (173,636,628 | ) | 50,387,584 | ||||||||||||
| JOHCM Emerging Markets Small Mid Cap Equity Fund |
Advisor Shares | 12,428,029 | 2,281 | (1,563,067 | ) | 10,867,243 | ||||||||||||
| JOHCM Emerging Markets Small Mid Cap Equity Fund |
Institutional Shares | 1,440,265 | 149,464 | (94,529 | ) | 1,495,200 | ||||||||||||
| JOHCM Global Select Fund |
Advisor Shares | 3,519,510 | 21,656,693 | (138,684,698 | ) | (113,508,495 | ) | |||||||||||
| JOHCM Global Select Fund |
Institutional Shares | 180,931,654 | 24,584,456 | (46,868,419 | ) | 158,647,691 | ||||||||||||
| JOHCM Global Income Builder Fund |
Advisor Shares | 529,712 | 183,020 | (222,494 | ) | 490,238 | ||||||||||||
| JOHCM Global Income Builder Fund |
Investor Shares | 50,021 | 3,030 | (40,681 | ) | 12,370 | ||||||||||||
| JOHCM Global Income Builder Fund |
Institutional Shares | 41,158,360 | 1,535,764 | (73,087,215 | ) | (30,393,091 | ) | |||||||||||
| JOHCM International Opportunities Fund |
Institutional Shares | 644,500 | 46,098 | — | 690,598 | |||||||||||||
| JOHCM International Select Fund |
Investor Shares | 30,925,107 | 4,417,494 | (94,327,963 | ) | (58,985,362 | ) | |||||||||||
| JOHCM International Select Fund |
Institutional Shares | 2,271,244,666 | 44,215,407 | (2,181,078,001 | ) | 134,382,072 | ||||||||||||
76
JOHCM FUNDS TRUST
NOTES TO FINANCIAL STATEMENTS
September 30, 2021
Transactions in shares of fund shares for the year ended September 30, 2020, were as follows:
| Fund | Class | Shares Sold |
Shares From Reinvested Dividends |
Shares Redeemed |
Net Increase (Decrease) in Shares |
|||||||||||||
| JOHCM Credit Income Fund |
Institutional Shares | 499,999 | 1,533 | — | 501,532 | |||||||||||||
| JOHCM Emerging Markets Opportunities Fund |
Advisor Shares | 4,379,135 | 204,863 | (5,332,623 | ) | (748,625 | ) | |||||||||||
| JOHCM Emerging Markets Opportunities Fund |
Investor Shares | 464,763 | 44,636 | (431,403 | ) | 77,996 | ||||||||||||
| JOHCM Emerging Markets Opportunities Fund |
Institutional Shares | 20,713,201 | 1,525,651 | (17,205,000 | ) | 5,033,852 | ||||||||||||
| JOHCM Emerging Markets Small Mid Cap Equity Fund |
Advisor Shares | 1,160,131 | 184 | (124,216 | ) | 1,036,099 | ||||||||||||
| JOHCM Emerging Markets Small Mid Cap Equity Fund |
Institutional Shares | 126,808 | 12,015 | (7,448 | ) | 131,375 | ||||||||||||
| JOHCM Global Select Fund |
Advisor Shares | 238,693 | 1,454,445 | (9,021,228 | ) | (7,328,090 | ) | |||||||||||
| JOHCM Global Select Fund |
Institutional Shares | 11,976,963 | 1,648,857 | (2,953,515 | ) | 10,672,305 | ||||||||||||
| JOHCM Global Income Builder Fund |
Advisor Shares | 53,475 | 18,484 | (22,580 | ) | 49,379 | ||||||||||||
| JOHCM Global Income Builder Fund |
Investor Shares | 4,861 | 305 | (4,609 | ) | 557 | ||||||||||||
| JOHCM Global Income Builder Fund |
Institutional Shares | 4,191,551 | 154,829 | (7,150,407 | ) | (2,804,027 | ) | |||||||||||
| JOHCM International Opportunities Fund |
Institutional Shares | 59,897 | 4,192 | — | 64,089 | |||||||||||||
| JOHCM International Select Fund |
Investor Shares | 1,294,591 | 184,524 | (4,214,374 | ) | (2,735,259 | ) | |||||||||||
| JOHCM International Select Fund |
Institutional Shares | 96,311,415 | 1,850,017 | (95,350,810 | ) | 2,810,622 | ||||||||||||
| H. | Concentration of Ownership |
A significant portion of a Fund’s shares may be held in a limited number of shareholder accounts, including in certain omnibus or institutional accounts which typically hold shares for the benefit of other underlying investors. To the extent that a shareholder or group of shareholders redeem a significant portion of the shares issued by a Fund, this could have a disruptive impact on the efficient implementation of a Fund’s investment strategy.
In addition, as of September 30, 2021, JOHCM or JOHCM affiliates held outstanding shares of the Funds as follows:
| Fund | Class | % Ownership |
||||
| JOHCM Credit Income Fund |
Advisor Shares | 100.0 | ||||
| JOHCM Credit Income Fund |
Institutional Shares | 100.0 | ||||
| JOHCM Emerging Markets Small Mid Cap Equity Fund |
Institutional Shares | 85.0 | ||||
| JOHCM Global Income Builder Fund |
Advisor Shares | 80.3 | ||||
| JOHCM Global Income Builder Fund |
Institutional Shares | 37.5 | ||||
| JOHCM International Opportunities Fund |
Institutional Shares | 76.7 | ||||
| Regnan Global Equity Impact Solutions |
Institutional Shares | 98.8 | ||||
77

Report of Independent Registered Public Accounting Firm
To the Board of Trustees of JOHCM Funds Trust and Shareholders of each of the eight funds listed in the table below
Opinions on the Financial Statements
We have audited the accompanying statements of assets and liabilities, including the schedules of investments, of each of the funds listed in the table below (constituting JOHCM Funds Trust, hereafter collectively referred to as the “Funds”) as of September 30, 2021, the related statements of operations for each of the periods indicated in the table below, the statements of changes in net assets for each of the periods indicated in the table below, including the related notes, and the financial highlights for each of the periods indicated therein (collectively referred to as the “financial statements”). In our opinion, the financial statements present fairly, in all material respects, the financial position of each of the Funds as of September 30, 2021, the results of each of their operations for each of the periods indicated in the table below, the changes in each of their net assets for each of the periods indicated in the table below and each of the financial highlights for each of the periods indicated therein in conformity with accounting principles generally accepted in the United States of America.
| JOHCM Credit Income Fund (1) | JOHCM Global Income Builder Fund (2) | |
| JOHCM Emerging Markets Opportunities Fund (2) | JOHCM International Opportunities Fund (2) | |
| JOHCM Emerging Markets Small Mid Cap Equity Fund (2) | JOHCM International Select Fund (2) | |
| JOHCM Global Select Fund (2) | Regnan Global Equity Impact Solutions (3) | |
|
(1) Statement of operations for the year ended September 30, 2021 and statement of changes in net assets for the year ended September 30, 2021 and for the period from August 17, 2020 (commencement of operations) through September 30, 2020 (2) Statement of operations for the year ended September 30, 2021 and statement of changes in net assets for each of the two years in the period ended September 30, 2021 (3) Statement of operations and statement of changes in net assets for the period August 23, 2021 (commencement of operations) through September 30, 2021 | ||
Basis for Opinions
These financial statements are the responsibility of the Funds’ management. Our responsibility is to express an opinion on the Funds’ financial statements based on our audits. We are a public accounting firm registered with the Public Company Accounting Oversight Board (United States) (PCAOB) and are required to be independent with respect to the Funds in accordance with the U.S. federal securities laws and the applicable rules and regulations of the Securities and Exchange Commission and the PCAOB.
We conducted our audits of these financial statements in accordance with the standards of the PCAOB. Those standards require that we plan and perform the audit to obtain reasonable assurance about whether the financial statements are free of material misstatement, whether due to error or fraud.
PricewaterhouseCoopers LLP, One North Wacker, Chicago, IL 60606
T: (312) 298 2000, www.pwc.com/us
78
Our audits included performing procedures to assess the risks of material misstatement of the financial statements, whether due to error or fraud, and performing procedures that respond to those risks. Such procedures included examining, on a test basis, evidence regarding the amounts and disclosures in the financial statements. Our audits also included evaluating the accounting principles used and significant estimates made by management, as well as evaluating the overall presentation of the financial statements. Our procedures included confirmation of securities owned as of September 30, 2021 by correspondence with the custodian and brokers; when replies were not received from brokers, we performed other auditing procedures. We believe that our audits provide a reasonable basis for our opinions.
Chicago, IL
November 22, 2021
We have served as the auditor of one or more investment companies in JOHCM Funds Trust since 2014.
79
JOHCM FUNDS TRUST
September 30, 2021 (Unaudited)
| A. | Board Approval of Investment Advisory Agreement |
Section 15(c) of the Investment Company Act of 1940 (the “1940 Act”) requires that the investment advisory agreement between JOHCM Funds Trust (the “Trust”) and JOHCM (USA) Inc. (the “Investment Advisor”) with respect to the JOHCM Credit Income Fund, the JOHCM Emerging Markets Opportunities Fund, the JOHCM Emerging Markets Small Mid Cap Equity Fund, the JOHCM Global Income Builder Fund, the JOHCM Global Select Fund, the JOHCM International Opportunities Fund, and the JOHCM International Select Fund (collectively, the “Funds”) be approved by the vote of a majority of the Board of Trustees of the Trust (the “Board”), including a majority of the Trustees who are not “interested persons,” as that term is defined in the 1940 Act (“Independent Trustees”), cast in person at a meeting called for the purpose of voting on such approval. It is the duty of the Board to request and evaluate, and the duty of the Investment Advisor to furnish, such information as may reasonably be necessary to evaluate the terms of the Investment Advisory Agreement. At a meeting held via videoconference on December 4, 2020 in reliance on an order of the United States Securities and Exchange Commission providing temporary relief from the 1940 Act’s in-person voting requirements relating to investment company board approvals of advisory agreements, the Board formally considered and approved the investment advisory agreement between the Trust, on behalf of the Funds, and the Investment Advisor, dated January 8, 2021, for an initial two-year term (the “Investment Advisory Agreement”).
The Investment Advisory Agreement while dated January 8, 2021 was effective July 19, 2021 following the acquisition by the Funds of all of the assets of corresponding existing series (the “Predecessor Funds”) of Advisers Investment Trust (collectively, the “Reorganizations”). As part of the Reorganizations, the Investment Advisor became the investment adviser to each of the Funds.
Prior to the December 4, 2020 meeting, the Board requested, and the Investment Advisor provided, both written and oral reports containing information and data relating to the following: (i) the nature, extent, and quality of the services expected to be provided by the Investment Advisor to the Funds; (ii) the investment performance of the Funds as measured by the Predecessor Funds; (iii) the costs of the services expected to be provided and the profits to be realized by the Investment Advisor from its relationship with the Funds; (iv) the extent to which economies of scale will be realized as the Funds grow; and (v) whether the proposed fee levels reflect these economies of scale to the benefit of the Funds’ potential shareholders. The Board also received and reviewed a memorandum from counsel to the Independent Trustees regarding the Board’s responsibilities in evaluating the Investment Advisory Agreement.
The Board examined the nature, extent, and quality of services to be provided to each Fund by the Investment Advisor. The Board noted that the Investment Advisor was a wholly-owned subsidiary of, and part of the same globally integrated investment organization as J O Hambro Capital Management Limited (“JOH Ltd”) and that the Investment Advisor served as investment sub-advisor to three of the Predecessor Funds. The Board considered the terms of the Investment Advisory Agreement, information and reports provided by the Investment Advisor on its personnel and operations, and the Investment Advisor’s experience with the investment strategy and risks of each Fund. The Board reviewed the Investment Advisor’s investment philosophy and portfolio construction process and the Investment Advisor’s compliance program, pending litigation, insurance coverage, business continuity program, and information security practices. The Board noted that, as set forth in the reports provided by the Investment Advisor, there had been no material compliance issues in the last twelve months with respect to the Predecessor Funds. The Board then considered key risks associated with the Funds and ways in which those risks were expected to be mitigated. Taking into account the personnel expected to be involved in servicing the Funds as well as the fact that the anticipated Reorganizations will not result in any changes in the portfolio management or support teams currently providing services to the Predecessor Funds, the Board expressed satisfaction with the quality, extent, and nature of the services expected from the Investment Advisor.
The Board reviewed the investment performance for each Fund’s Predecessor Fund compared to the performance of each Fund’s benchmark index and respective Morningstar category as well as similar comparable accounts advised by JOHCM or JOH Ltd. The Board determined that, while this information was helpful in its determinations, the Board would review performance over time following the Reorganizations. Taking into account the experience and qualifications of the personnel proposed to be involved in managing each Fund as well as the other information provided by the Investment Advisor, the Board expressed satisfaction with the quality, extent, and nature of the services expected from the Investment Advisor.
80
JOHCM FUNDS TRUST
ADDITIONAL INFORMATION
September 30, 2021 (Unaudited)
The Board considered the cost of services proposed to be provided and the profits projected to be realized by the Investment Advisor. The Board reviewed the management fee proposed to be paid by each Fund and the total operating expenses of each Fund versus its respective Morningstar category as well as the management fee of similar comparable accounts advised by JOHCM or JOH Ltd. The Board noted that the Investment Advisor would receive a management fee calculated on the average daily net assets of each Fund and that, under a proposed Expense Limitation Agreement, the Investment Advisor would contractually agree to waive fees and/or reimburse expenses to the extent necessary to limit each Fund’s total operating expenses through June 30, 2022. The Board considered the projected profitability of the Investment Advisor’s future relationship with each Fund. The Board concluded that the proposed advisory fees and anticipated expense ratio of each Fund were reasonable.
In considering the economies of scale for the Funds, the Board considered the marketing and distribution plans for the Funds, each Fund’s capacity, and its breakeven point. The Board noted that, other than the investment advisory fees, JOHCM’s relationship with the Funds raises its profile within the United States and provides additional business opportunities.
In its deliberations, the Board did not identify any particular factor or factors that were all-important or controlling, and each Trustee may have assigned different weights to the various factors considered.
B. Board Approval of Investment Advisory Agreement for the Regnan Global Equity Impact Solutions
Section 15(c) of the 1940 Act requires that the investment advisory agreement between the Trust and the Investment Advisor with respect to Regnan Global Equity Impact Solutions (the “Fund”) be approved by the vote of a majority of the Board, including a majority of Independent Trustees, cast in person at a meeting called for the purpose of voting on such approval. It is the duty of the Board to request and evaluate, and the duty of the Investment Advisor to furnish, such information as may reasonably be necessary to evaluate the terms of the Investment Advisory Agreement. At a meeting held on June 15, 2021, the Board formally considered and approved an amendment dated June 21, 2021 to the investment advisory agreement dated January 8, 2021 between the Trust, on behalf of the Fund, and the Investment Advisory Agreement.
Prior to the June 15, 2021 meeting, the Board requested, and the Investment Advisor provided, both written and oral reports containing information and data relating to the following: (i) the nature and quality of services, especially investment performance, to be furnished by the Investment Advisor, the Investment Advisor’s cost in providing the services and possible economies of scale as the Fund grows larger, and whether and how those benefits of scale may be shared with the Fund; (ii) the shareholders’ interests in having a financially strong investment manager capable of competing with other investment managers and financial institutions in terms of attracting and retaining high quality investment personnel and investigating and employing new investment techniques, and the need to provide staff capable of administering a developing and expanding investment advisory and administrative business; (iii) the risks assumed by the Investment Advisor in complying with investment restrictions and applicable securities and tax laws, and its possible substantial liabilities to the Fund for failure to comply; (iv) the volatility of the financial markets and thus of investment management fee income; (v) comparative expense ratios and management fees of competitive funds; (vi) fall-out financial benefits to the Investment Advisor and its affiliates, if any; and (vii) the profitability of the Investment Advisor and its affiliates from providing services to the Fund. The Board also reviewed with counsel to the Independent Trustees its responsibilities in evaluating the Investment Advisory Agreement.
The Board examined the nature and quality of services to be provided to the Fund by the Investment Advisor. The Board considered the terms of the Investment Advisory Agreement, information and reports provided by the Investment Advisor on its personnel and operations, and the Investment Advisor’s experience managing assets using an investment strategy similar to the Fund’s. The Board reviewed the Investment Advisor’s investment philosophy and portfolio construction process and the Investment Advisor’s compliance program, pending litigation (if any), insurance coverage, business continuity program, and information security practices. Taking into account the personnel anticipated to be involved in servicing the Fund as well as the anticipated services to be provided by the Investment Advisor, the Board expressed satisfaction with the quality, extent, and nature of the services expected from the Investment Advisor.
The Board noted that, because the Fund was not yet in operation, it had no performance history. The Board noted, however, that the personnel that would be involved in managing the Fund manage a United Kingdom domiciled fund, an Ireland domiciled fund and an Australia domiciled open-end fund in a strategy that utilizes a substantially similar investment strategy (the “Comparable Accounts”) to that proposed for the Fund.
81
JOHCM FUNDS TRUST
ADDITIONAL INFORMATION
September 30, 2021 (Unaudited)
The Board then considered the proposed advisory fee to be paid by the Fund and the projected total operating expenses of the Fund.
The Board noted that the Investment Advisor would receive an advisory fee of 0.75% of the average daily net assets of the Fund and that, under a proposed Expense Limitation Agreement, the Investment Advisor would contractually agree to waive fees and/or reimburse expenses to the extent necessary to limit the total annual operating expenses (exclusive of brokerage costs, interest, taxes, dividends, litigation and indemnification expenses, expenses associated with the investments in underlying investment companies and extraordinary expenses (as determined under generally accepted principles)) of Institutional Shares, Advisor Shares, Investor Shares, and Class Z Shares of the Fund to 0.89%, 0.99%, 1.14%, and 0.89% respectively through July 31, 2022. The Board also reviewed comparative data on investment management fees received by JOHCM as the adviser to the Comparable Accounts as well as investment management fees and net total operating expenses of self-identified peer funds and the Fund’s anticipated Morningstar category. After considering the comparative data provided by the Investment Advisor, the Board concluded that the Fund’s proposed investment management fee and expense ratios after waiver or reimbursement were reasonable.
In considering the anticipated economies of scale for the Fund, the Board considered the proposed marketing and distribution plans for the Fund, its capacity, and its anticipated breakeven point.
In its deliberations, the Board did not identify any particular factor or factors that were all-important or controlling, and each Trustee may have assigned different weights to the various factors considered.
C. Shareholder Meeting Results
Prior to July 19, 2021, each of the JOHCM Credit Income Fund, the JOHCM Emerging Markets Opportunities Fund, the JOHCM Emerging Markets Small Mid Cap Equity Fund, the JOHCM Global Select Fund, the JOHCM Global Income Builder Fund, the JOHCM International Opportunities Fund, and the JOHCM International Select Fund operated as a series of Advisers Investment Trust (together the “Predecessor Funds”; each a “Predecessor Fund”). Each Predecessor Fund had a name identical to its corresponding Fund, other than Predecessor Fund to JOHCM Global Select Fund, which was named JOHCM Global Equity Fund. On July 19, 2021, the Predecessor Funds were reorganized into JOHCM Funds Trust, pursuant to a Plan of Reorganization approved by the Advisers Investment Trust’s Board of Trustees on December 9, 2020 and by the Predecessor Funds’ shareholders on June 2, 2021 and July 9, 2021 (the “Reorganizations”). The results of the Predecessor Funds’ shareholder meeting in connection with the Reorganizations are provided below:
| Fund Name | Record Date Outstanding Shares |
Total Voted Shares |
% of Outstanding Shares Voted |
% of Voted Shares “FOR” Proposal | ||||
| JOHCM Credit Income Fund |
507,541 | 507,540 | 100.00% | 100.00% | ||||
| JOHCM Emerging Markets Opportunities Fund |
61,492,433 | 38,816,443 | 63.12% | 95.14% | ||||
| JOHCM Emerging Markets Small-Mid Cap Equity Fund |
3,343,782 | 2,355,623 | 70.45% | 99.87% | ||||
| JOHCM Global Equity Fund |
28,068,316 | 16,121,519 | 57.44% | 97.81% | ||||
| JOHCM Global Income Builder Fund |
8,245,570 | 6,433,087 | 78.02% | 99.68% | ||||
| JOHCM International Opportunities Fund |
292,110 | 228,695 | 78.29% | 100.00% | ||||
| JOHCM International Select Fund |
394,367,789 | 257,067,521 | 65.18% | 99.59% |
D. Expense Examples
As a Fund shareholder, you may incur two types of costs: (1) transaction costs, and (2) ongoing costs, including management fees and other Fund expenses. The examples below are intended to help you understand your ongoing costs (in dollars) of investing in the Funds and to compare these costs with the ongoing costs of investing in other mutual funds. Please note that the expenses shown in the tables are meant
82
JOHCM FUNDS TRUST
ADDITIONAL INFORMATION
September 30, 2021 (Unaudited)
to highlight your ongoing costs only and do not reflect any transactional costs. Therefore, the examples are useful in comparing ongoing costs only and will not help you determine the relative total cost of owning different funds. In addition, if these transactional costs were included, your costs would have been higher.
The examples below are based on an investment of $1,000 invested at April 1, 2021 and held for the entire period through September 30, 2021.
The Actual Expense Example below provides information about actual account values and actual expenses. You may use this information, together with the amount you invested, to estimate the expenses that you paid over the period. Simply divide your account value by $1,000 (for example, an $8,600 account value divided by $1,000 = 8.6), then multiply the result by the number in the table under the heading entitled “Expenses Paid” to estimate the expenses you paid on your account during this period.
The Hypothetical Expense Example below provides information about hypothetical account values and hypothetical expenses based on a Funds’ actual expense ratio and an assumed rate of return of 5% per year before expenses, which is not a Funds’ actual return. The hypothetical account values and expenses may not be used to estimate the actual ending account balance or expenses you paid for the period. You may use this information to compare the ongoing costs of investing in the Funds and other funds. To do so, compare this 5% hypothetical example with the 5% hypothetical examples that appear in the shareholder reports of the other funds.
Actual Expense Example
| Fund | Class | Expense Ratio |
Beginning Account Value 4/1/2021 |
Ending Account Value |
Expenses 4/1/21–9/30/21 |
|||||||||||
| JOHCM Credit Income Fund |
Advisor Shares | 0.69% | $ | 1,000.00 | $ | 1,027.60 | $ | 3.51 | ||||||||
| JOHCM Credit Income Fund |
Institutional Shares | 0.59% | 1,000.00 | 1,028.10 | 3.00 | |||||||||||
| JOHCM Emerging Markets Opportunities Fund |
Advisor Shares | 1.12% | 1,000.00 | 953.40 | 5.48 | |||||||||||
| JOHCM Emerging Markets Opportunities Fund |
Investor Shares | 1.27% | 1,000.00 | 951.90 | 6.21 | |||||||||||
| JOHCM Emerging Markets Opportunities Fund |
Institutional Shares | 1.02% | 1,000.00 | 953.60 | 5.00 | |||||||||||
| JOHCM Emerging Markets Small Mid Cap Equity Fund |
Advisor Shares | 1.62% | 1,000.00 | 1,104.10 | 8.54 | |||||||||||
| JOHCM Emerging Markets Small Mid Cap Equity Fund |
Institutional Shares | 1.52% | 1,000.00 | 1,105.20 | 8.02 | |||||||||||
| JOHCM Global Select Fund |
Advisor Shares | 1.06% | 1,000.00 | 1,065.20 | 5.49 | |||||||||||
| JOHCM Global Select Fund |
Institutional Shares | 0.97% | 1,000.00 | 1,065.50 | 5.02 | |||||||||||
| JOHCM Global Income Builder Fund |
Advisor Shares | 0.83% | 1,000.00 | 1,035.40 | 4.24 | |||||||||||
| JOHCM Global Income Builder Fund |
Investor Shares | 0.98% | 1,000.00 | 1,034.90 | 5.00 | |||||||||||
| JOHCM Global Income Builder Fund |
Institutional Shares | 0.73% | 1,000.00 | 1,035.90 | 3.73 | |||||||||||
| JOHCM International Opportunities Fund |
Institutional Shares | 0.89% | 1,000.00 | 985.00 | 4.43 | |||||||||||
| JOHCM International Select Fund |
Investor Shares | 1.21% | 1,000.00 | 1,023.00 | 6.14 | |||||||||||
| JOHCM International Select Fund |
Institutional Shares | 0.96% | 1,000.00 | 1,024.40 | 4.87 | |||||||||||
| Regnan Global Equity Impact Solutions |
Institutional Shares | 0.89% | 1,000.00 | 922.00 | 0.89 | |||||||||||
| * | Actual expenses are calculated using each Fund’s annualized expense ratio (as disclosed in the table), multiplied by the average account value for the period, multiplied by the actual number of operational days in the most recent half fiscal year (183 days, except for Regnan Global Equity Impact Solutions which was 38 days) and divided by the number of days in the current year (365). |
Hypothetical Expense Example
| Fund | Class | Expense Ratio |
Beginning Account Value 4/1/2021 |
Ending Account Value 9/30/2021 |
Expenses Paid 4/1/21–9/30/21 |
|||||||||||||
| JOHCM Credit Income Fund |
Advisor Shares | 0.69 | % | $ | 1,000.00 | $ | 1,021.61 | $ | 3.50 | |||||||||
| JOHCM Credit Income Fund |
Institutional Shares | 0.59 | % | 1,000.00 | 1,022.11 | 2.99 | ||||||||||||
| JOHCM Emerging Markets Opportunities Fund |
Advisor Shares | 1.12 | % | 1,000.00 | 1,019.45 | 5.67 | ||||||||||||
83
JOHCM FUNDS TRUST
ADDITIONAL INFORMATION
September 30, 2021 (Unaudited)
| Fund | Class | Expense Ratio |
Beginning Account Value 4/1/2021 |
Ending Account Value 9/30/2021 |
Expenses Paid 4/1/21–9/30/21 |
|||||||||||||
| JOHCM Emerging Markets Opportunities Fund |
Investor Shares | 1.27 | % | $ | 1,000.00 | $ | 1,018.70 | $ | 6.43 | |||||||||
| JOHCM Emerging Markets Opportunities Fund |
Institutional Shares | 1.02 | % | 1,000.00 | 1,019.95 | 5.16 | ||||||||||||
| JOHCM Emerging Markets Small Mid Cap Equity Fund |
Advisor Shares | 1.62 | % | 1,000.00 | 1,016.95 | 8.19 | ||||||||||||
| JOHCM Emerging Markets Small Mid Cap Equity Fund |
Institutional Shares | 1.52 | % | 1,000.00 | 1,017.45 | 7.69 | ||||||||||||
| JOHCM Global Select Fund |
Advisor Shares | 1.06 | % | 1,000.00 | 1,019.75 | 5.37 | ||||||||||||
| JOHCM Global Select Fund |
Institutional Shares | 0.97 | % | 1,000.00 | 1,020.21 | 4.91 | ||||||||||||
| JOHCM Global Income Builder Fund |
Advisor Shares | 0.83 | % | 1,000.00 | 1,020.91 | 4.20 | ||||||||||||
| JOHCM Global Income Builder Fund |
Investor Shares | 0.98 | % | 1,000.00 | 1,020.16 | 4.96 | ||||||||||||
| JOHCM Global Income Builder Fund |
Institutional Shares | 0.73 | % | 1,000.00 | 1,021.41 | 3.70 | ||||||||||||
| JOHCM International Opportunities Fund |
Institutional Shares | 0.89 | % | 1,000.00 | 1,020.61 | 4.51 | ||||||||||||
| JOHCM International Select Fund |
Investor Shares | 1.21 | % | 1,000.00 | 1,019.00 | 6.12 | ||||||||||||
| JOHCM International Select Fund |
Institutional Shares | 0.96 | % | 1,000.00 | 1,020.26 | 4.86 | ||||||||||||
| Regnan Global Equity Impact Solutions |
Institutional Shares | 0.89 | % | 1,000.00 | 1,020.61 | 4.51 | ||||||||||||
84
JOHCM FUNDS TRUST
ADDITIONAL INFORMATION
September 30, 2021 (Unaudited)
E. Qualified Dividend Income (QDI)
Under the Jobs and Growth Tax Relief Reconciliation Act of 2003 (the “Act”), the following percentages of ordinary dividends paid during the fiscal year ended September 30, 2021 are designated as Qualified Dividend Income (“QDI”), as defined in the Act, subject to reduced tax rates in 2021:
| Fund | QDI Percentage | |||
| JOHCM Credit Income Fund |
3.73 | % | ||
| JOHCM Emerging Markets Opportunities Fund |
100.00 | % | ||
| JOHCM Emerging Markets Small Mid Cap Equity Fund |
54.54 | % | ||
| JOHCM Global Income Builder Fund |
57.59 | % | ||
| JOHCM International Opportunities Fund |
89.65 | % | ||
| JOHCM International Select Fund |
62.73 | % | ||
F. Corporate Dividends Received Deduction (DRD)
A percentage of the dividends distributed during the fiscal year for the Fund qualifies for the Dividends-Received Deduction (“DRD”) for corporate shareholders:
| Fund | Corporate DRD Percentage | |||
| JOHCM Credit Income Fund |
4.03 | % | ||
| JOHCM Global Income Builder Fund |
16.79 | % | ||
| JOHCM International Opportunities Fund |
10.47 | % | ||
G. Foreign Tax Credit
The Funds below intends to make an election that will allow shareholders to treat their proportionate share of foreign taxes paid by the Funds as having been paid by them. The amounts per share which represent income from sources within, and taxes paid to, foreign countries are as follows:
| Fund | Foreign Tax Credit | Foreign Source Income | ||||||
| JOHCM Emerging Markets Opportunities Fund |
$0.0418 | $0.2363 | ||||||
| JOHCM Emerging Markets Small Mid Cap Equity Fund |
$0.1713 | $0.0724 | ||||||
| JOHCM International Opportunities Fund |
$0.0386 | $0.2534 | ||||||
| JOHCM International Select Fund |
$0.0339 | $0.2038 | ||||||
H. Other Information
Investors may obtain, without charge, a copy of the proxy voting policies and procedures by writing to the Trust in the name of the Fund c/o The Northern Trust Company, P.O. Box 4766, Chicago, Illinois 60680-4766, or by calling the Fund at 866-260-9549 (toll free) or 312-557-5913 and on the U.S. Securities and Exchange Commission’s (The “SEC”) website at www.sec.gov. Information about how the Funds voted proxies relating to portfolio securities for each 12 month period ending June 30 is available without charge, upon request, by calling the Trust at 866-260-9549 (toll free) or 312-557-5913 and on the The SEC’s website at www.sec.gov.
The Funds file their complete schedule of portfolio holdings with the SEC for the first and third quarters of each fiscal year as an exhibit to their reports on Form N-PORT. The Funds’ Form N-PORT reports are available on the SEC website at www.sec.gov.
85
JOHCM FUNDS TRUST
ADDITIONAL INFORMATION
September 30, 2021 (Unaudited)
I. Trustees and Officers
The following table provides information regarding each Trustee who is not an “interested person” of the Trust, as defined in the 1940 Act (each an “Independent Trustee”).
| Name, Address and Year of Birth1 |
Position(s) Held with the Trust |
Term of Office/Length of Time Served |
Principal Occupation(s) During Past 5 Years |
Number of Trustee |
Other Directorships Held by Trustee During Past 5 Years | |||||
| Joseph P. Gennaco (1961) |
Trustee | Since inception | Sole Principal at JPG Consulting, LLC (April 2019 – present); Independent Non-Executive Director at BNY Mellon International Limited (January 2019 – present); Executive at BNY Mellon (July 2005 – December 2018). | 8 | None | |||||
| Barbara A. McCann (1961) |
Trustee | Since inception | None | 8 | None | |||||
| Kevin J. McKenna (1957) |
Trustee | Since Inception | Chief Operating Officer and Managing Director of BlackRock Global Allocation Fund Team at BlackRock, Inc. (January 2011 – September 2016). | 8 | None | |||||
| Beth K. Werths (1968) |
Trustee | Since Inception | Executive Vice President and International General Counsel at Natixis Investment Management (February 2007 - November 2020). | 8 | None | |||||
1 The mailing address of each Trustee is 53 State Street, 13th Floor Boston, MA, 02109.
The following table provides information regarding each Trustee who is an “interested person” of the Trust, as defined in the 1940 Act and each officer of the Trust.
86
JOHCM FUNDS TRUST
ADDITIONAL INFORMATION
September 30, 2021 (Unaudited)
| Name, Address and Year of Birth1 |
Position(s) Held with the Trust |
Term of Office/Length of Time Served |
Principal Occupation(s) During Past 5 Years |
Number of Portfolios in the Trust Overseen by Trustee |
Other Directorships Held by Trustee During Past 5 Years | |||||
| Nicholas Good (1973) |
Trustee | Since inception | Chief Executive Officer of Pendal Group Limited (March 2021 – present); Chief Executive Officer of JOHCM (USA) Inc. (December 2019 – March 2021); Executive Vice President and Chief Growth & Strategy Officer at State Street Global Advisors (April 2018 – November 2019); Co-Head of Global SPDR Business at State Street Global Advisors (May 2016 – April 2018). | 8 | None | |||||
| Jonathan Weitz (1976) |
President and Chief Executive Officer | Since inception | Chief Operating Officer, US JOHCM (USA) Inc. 2020 to present; Senior Vice President—Business Manager JOHCM (USA) Inc. 2016 to 2020; Partner and Management Committee Member Century Capital Management 2003 to 2016. | N/A | N/A | |||||
| Troy Sheets (1971) |
Treasurer | Since inception | Senior Director, Foreside Financial Group, LLC 2016 to present; Director, Beacon Hill Fund Services, Inc. 2009 to 2016. | N/A | N/A | |||||
| David Lebisky (1972) |
Chief Compliance Officer | Since 2021 | Compliance Manager, US JOHCM (USA) Inc. (March 2021 to present); President, Lebisky Compliance Consulting LLC (2015 to 2020) | N/A | N/A | |||||
| Mary Lomasney (1957) |
Secretary | Since inception | Head of Legal and Compliance, US, JOHCM (USA) Inc. 2016 to present; Managing Director BNY Mellon 2007 to 2015. | N/A | N/A | |||||
| Matthew J. Broucek (1988) |
Assistant Secretary | Since inception | Vice President, Northern Trust Global Fund Services Fund Governance Solutions 2016 to present; Associate, RSM US LLP, 2015 to 2016. | N/A | N/A | |||||
1 The mailing address of each Trustee is 53 State Street, 13th Floor Boston, MA, 02109.
The Funds’ Statement of Additional Information includes additional information about the Trust’s Trustees and Officers. To receive your free copy of the Statement of Additional Information, call toll-free 866-260-9549.
87
JOHCM Funds Trust
Notice of Privacy Policy & Practices
SAFEGUARDING PRIVACY
The Funds recognizes and respects the privacy concerns and expectations of our customers1. We are committed to maintaining the privacy and security of the personal confidential information we collect about you. We provide this notice so that you will know what kinds of information we collect and the circumstances in which that information may be disclosed to third parties.
INFORMATION WE COLLECT AND SOURCES OF INFORMATION
We collect nonpublic personal information about our customers from the following sources:
| • | Account Applications and other forms, which may include a customer’s name, address, social security number, and information about a customer’s investment goals and risk tolerance; |
| • | Account History, including information about the transactions and balances in a customer’s account(s); and |
| • | Correspondences including written, telephonic or electronic between a customer and the Funds or service providers to the Funds. |
INFORMATION WE SHARE WITH SERVICE PROVIDERS
The Funds may disclose all non-public personal information we collect, as described above, to companies that perform services on our behalf, including those that assist us in responding to inquiries, processing transactions, preparing and mailing account statements and other forms of shareholder services, provided they use the information solely for these purposes and they enter into a confidentiality agreement regarding the information. The Funds also may disclose non-public personal information as otherwise permitted by law.
SAFEGUARDING CUSTOMER INFORMATION
We will safeguard, according to federal standards of security and confidentiality, any non-public personal information our customers share with us.
We require service providers to the Funds:
| • | to maintain policies and procedures designed to assure only appropriate access to, and use of information about customers of the Funds; and |
| • | to maintain physical, electronic and procedural safeguards that comply with federal standards to guard nonpublic personal information of customers of the Funds. |
We will adhere to the policies and practices described in this notice regardless of whether you are a current or former shareholder of the Funds.
| 1 | For purposes of this notice, the term “customer” or “customers” include individuals who provide nonpublic personal information to the Funds, but do not invest in Fund shares. |
Investment Adviser
JOHCM (USA) Inc.
53 State Street, 13th Floor
Boston, Massachusetts 02109
Custodian
The Northern Trust Company
50 South LaSalle Street
Chicago, Illinois 60603
Independent Registered Public Accounting Firm
PricewaterhouseCoopers LLP
One North Wacker Drive
Chicago, IL 60606
Legal Counsel
Ropes & Gray LLP
Prudential Tower, 800 Boylston Street
Boston, MA 02199
Distributor
JOHCM Funds Distributors, LLC
3 Canal Plaza, Suite 100
Portland, Maine 04101
For Additional Information, call
866-260-9549 (toll free) or 312-557-5913
JFT 09/21
(b) Not applicable.
Item 2. Code of Ethics.
As of September 30, 2021, the registrant had adopted a “code of ethics” (as such term is defined in Item 2 of Form N-CSR) that applies to the registrant’s principal executive officer and principal financial officer. This code is filed as Exhibit 13(a)(1) hereto. There were no substantive amendments or waivers to the code of ethics during the period covered by this report.
Item 3. Audit Committee Financial Expert.
The registrant’s Board of Trustees has determined the registrant has at least one “audit committee financial expert” (as such term is defined in Item 3 of Form N-CSR) serving on its Audit Committee. The “audit committee financial expert” is Joseph P. Gennaco, who is “independent” for purposes of this Item 3 of Form N-CSR.
Item 4. Principal Accountant Fees and Services.
| (a) | Audit Fees |
2021: $220,000
2020: $220,000
The fees paid to PricewaterhouseCoopers LLP relate to the audit of the registrant’s annual financial statements and letters for filings of the registrant’s Form N-CEN and N-1A.
| (b) | Audit-Related Fees |
2021: $0
2020: $0
| (c) | Tax Fees |
2021: $48,720
2020: $56,745
The fees to PricewaterhouseCoopers LLP relate to the preparation of the registrant’s tax returns, review of annual distributions, and additional tax provision support fees.
| (d) | All Other Fees |
2021: $0
2020: $0
(e)(1)
Except as permitted by rule 2-01(c)(7)(i)(C) of regulation S-X the registrant’s audit committee must pre-approve all audit and non-audit services provided by the independent accountants relating to the operations or financial reporting of the registrant. Prior to the commencement of any audit or non-audit services to the registrant, the audit committee reviews the services to determine whether they are appropriate and permissible under applicable law.
(e)(2)
2021: 0%
2020: 0%
(f)
Not applicable.
(g)
2021: $220,391
2020: $56,745
(h)
The Audit Committee considered the non-audit services rendered to the registrant’s investment adviser and believes the services are compatible with the principal accountant’s independence.
Item 5. Audit Committee of Listed Registrants.
Not applicable.
Item 6. Investments.
| (a) | The Schedule of Investments in securities of unaffiliated issuers is included in the report to shareholders filed under Item 1 of this Form. |
| (b) | Not applicable. |
Item 7. Disclosure of Proxy Voting Policies and Procedures for Closed-End Management Investment Companies.
Not applicable.
Item 8. Portfolio Managers of Closed-End Management Investment Companies.
Not applicable.
Item 9. Purchases of Equity Securities by Closed-End Management Investment Company and Affiliated Purchasers.
Not applicable.
Item 10. Submission of Matters to a Vote of Security Holders.
Not applicable.
Item 11. Controls and Procedures.
| (a) | The registrant’s principal executive officer and principal financial officer have concluded, based on their evaluation of the registrant’s disclosure controls and procedures as conducted within 90 days of the filing date of this report, that these disclosure controls and procedures are adequately designed and are operating effectively to ensure that information required to be disclosed by the registrant on Form N-CSR is recorded, processed, summarized and reported within the time periods specified in the Securities and Exchange Commission’s rules and forms. |
| (b) | There were no changes in the registrant’s internal control over financial reporting (as defined in Rule 30a-3(d) under the Investment Company Act of 1940) that occurred during the period covered by this report that have materially affected or are reasonably likely to materially affect, the registrant’s internal control over financial reporting. |
Item 12. Disclosure of Securities Lending Activities for Closed-End Management Investment Companies.
Not applicable.
Item 13. Exhibits.
| (a)(1) | The Code of Ethics that is the subject of the disclosure required by Item 2 is filed herewith. | |
| (a)(2) | Certifications pursuant to Rule 30a-2(a) are filed herewith. | |
| (a)(3) | Not applicable. | |
| (a)(4) | Not applicable. | |
| (b) | Certification pursuant to Rule 30a-2(b) is filed herewith. | |
SIGNATURES
Pursuant to the requirements of the Securities Exchange Act of 1934 and the Investment Company Act of 1940, the registrant has duly caused this report to be signed on its behalf by the undersigned, thereunto duly authorized.
| JOHCM Funds Trust | ||
| By: | /s/ Troy Sheets | |
| Troy Sheets | ||
| Treasurer and Principal Financial Officer | ||
| Date: | December 3, 2021 | |
Pursuant to the requirements of the Securities Exchange Act of 1934 and the Investment Company Act of 1940, this report has been signed below by the following persons on behalf of the registrant and in the capacities and on the dates indicated.
| By: | /s/ Jonathan Weitz | |
| Jonathan Weitz | ||
| President and Principal Executive Officer | ||
| Date: | December 3, 2021 | |
| By: | /s/ Troy Sheets | |
| Troy Sheets | ||
| Treasurer and Principal Financial Officer | ||
| Date: | December 3, 2021 | |
JOHCM FUNDS TRUST
17 - PRINCIPAL EXECUTIVE AND PRINCIPAL FINANCIAL OFFICERS
CODE OF ETHICS
| I. | Covered Officers/Purpose of the Code |
This code of ethics (this “Code”) pursuant to Section 406 of the Sarbanes-Oxley Act of 2002 has been adopted by the Trust and applies to the Trust’s Principal Executive Officer, Principal Financial Officer, or other Trust officer performing similar functions (the “Covered Officers” each of whom is set forth in Exhibit A) for the purpose of promoting:
| • | honest and ethical conduct, including the ethical handling of actual or apparent conflicts of interest between personal and professional relationships; |
| • | full, fair, accurate, timely and understandable disclosure in reports and documents that the Trust files with, or submits to, the SEC and in other public communications made by the Trust; |
| • | compliance with applicable laws and governmental rules and regulations; |
| • | the prompt internal reporting of violations of this Code to an appropriate person or persons identified in this Code; and |
| • | accountability for adherence to this Code. |
Each Covered Officer should adhere to a high standard of business ethics and should be sensitive to situations that may give rise to actual as well as apparent conflicts of interest.
The overarching principle is that the personal interest of a Covered Officer should not be placed improperly before the interest of the Trust.
| II. | Covered Officers Should Handle Ethically Actual and Apparent Conflicts of Interest |
Overview. A “conflict of interest” occurs when a Covered Officer’s private interest interferes with the interests of, or the Covered Officer’s service to, the Trust. For example, a conflict of interest would arise if a Covered Officer, or a member of the Covered Officer’s family, receives improper personal benefits as a result of the Covered Officer’s position with the Trust.
Certain conflicts of interest arise out of the relationships between Covered Officers and the Trust and already are subject to conflict of interest provisions in the 1940 Act and the Investment Advisers Act of 1940 (“Investment Advisers Act”). For example, Covered Officers may not individually engage in certain transactions (such as the purchase or sale of securities or other property) with the Trust because of their status as “affiliated persons” of the Trust. The compliance programs and procedures of the Trust and the compliance programs and procedures of the Trust’s investment adviser and of such other entity of which a Covered Officer is also an officer or employee (each a “Service Provider” and, collectively, the “Service Providers”) are designed to prevent, or identify and correct, violations of these provisions. This Code does not, and is not intended to, repeat or replace any compliance programs and procedures of the Trust or the
17-1
investment adviser designed to prevent, or identify and correct, violations of the 1940 Act and the Investment Advisers Act, and such conflicts fall outside of the parameters of this Code.
Although typically not presenting an opportunity for improper personal benefit, conflicts arise from, or as a result of, the contractual relationship between the Trust and its Service Providers of which a Covered Officer is also an officer or employee. As a result, this Code recognizes that the Covered Officers will, in the normal course of their duties, whether formally for the Trust and/or for a Service Provider, be involved in establishing policies and implementing decisions that will have different effects on the Service Providers and the Trust. The participation of the Covered Officers in such activities is inherent in the contractual relationship between the Trust and its Service Providers and is consistent with the performance by the Covered Officers of their duties as officers of the Trust. Thus, if performed in conformity with the provisions of the 1940 Act and the Investment Advisers Act, such activities will be deemed to have been handled ethically. In addition, it is recognized by the Board that the Covered Officers may also be officers or employees of one or more investment companies covered by other codes.
Other conflicts of interest are covered by this Code, even if such conflicts of interest are not subject to provisions in the 1940 Act and the Investment Advisers Act. The following list provides examples of conflicts of interest under this Code, but Covered Officers should keep in mind that these examples are not exhaustive.
Each Covered Officer must:
| • | not use personal influence or personal relationships to influence investment decisions or financial reporting by the Trust whereby the Covered Officer would benefit personally to the detriment of the Trust; |
| • | not cause the Trust to take action, or fail to take action, for the individual personal benefit of the Covered Officer rather than the benefit of the Trust; |
| • | not use material non-public information of portfolio transactions made or contemplated for the Trust to trade personally or cause others to trade personally in contemplation of the market effect of such transactions; |
| • | report at least annually any affiliations or other relationships related to conflicts of interest that the Trust’s Trustees and Officers Questionnaire covers and provide full and fair responses to all questions asked in such Trustees and Officers Questionnaire and any supplemental request for information. |
There are some conflict of interest situations that should always be discussed with the chief compliance officer of the Trust (the “Compliance Officer”). Examples of these include:
| • | any outside business activity other than with a Service Provider or its affiliates that detracts from an individual’s ability to devote appropriate time and attention to his or her responsibilities with the Trust; |
| • | service as a director on the board of any company that files periodic reports with the SEC; |
17-2
| • | service on the board of directors or governing board of any organization, public or private, including non-profits; |
| • | the receipt of any non-nominal gifts; |
| • | the receipt of any entertainment from any company with which the Trust has current or prospective business dealings unless such entertainment is business-related, reasonable in cost, appropriate as to time and place, and not so frequent as to raise any question of impropriety; |
| • | any ownership interest in, or any consulting or employment relationship with, any of entities doing business with the Trust, other than a Service Provider or any affiliated person thereof; and |
| • | a direct or indirect financial interest in commissions, transaction charges or spreads paid by the Trust for effecting portfolio transactions or for selling or redeeming shares other than an interest arising from the Covered Officer’s employment with the a Service Provider or its affiliates, such as compensation or equity ownership. |
| III. | Disclosure and Compliance |
| • | Each Covered Officer should familiarize himself or herself with the disclosure requirements generally applicable to the Trust. |
| • | Each Covered Officer should not knowingly misrepresent, or cause others to misrepresent, facts about the Trust to others, whether within or outside the Trust, including to the Trust’s directors and auditors, and to governmental regulators and self-regulatory organizations. |
| • | Each Covered Officer should, to the extent appropriate within the Covered Officer’s area of responsibility, consult with other officers and employees of the Trust or the Service Providers or with counsel to the Trust with the goal of promoting full, fair, accurate, timely and understandable disclosure in the reports and documents the Trust files with, or submits to, the SEC and in other public communications made by the Trust. |
| • | It is the responsibility of each Covered Officer to promote compliance with the standards and restrictions imposed by applicable laws, rules and regulations. |
| IV. | Reporting and Accountability |
Each Covered Officer must:
| • | upon adoption of this Code (or thereafter as applicable, upon becoming a Covered Officer), affirm in writing to the Trust, in substantially the form set forth on Exhibit B, that the Covered Officer has received, read, and understands this Code; |
| • | annually thereafter affirm to the Trust, in substantially the form set forth on Exhibit C, that the Covered Officer has complied with the requirements of this Code; |
17-3
| • | not retaliate against any other Covered Officer or any employee of the Trust, the Service Providers or their affiliated persons for reports of potential violations that are made in good faith; and |
| • | notify the Compliance Officer promptly if the Covered Officer knows of any violation of this Code. Failure to do so is itself a violation of this Code. |
The Compliance Officer is responsible for applying this Code to specific situations in which questions are presented under it and has the authority to interpret this Code in any particular situation. However, any approvals or waivers sought by a Covered Officer will be considered by the Audit Committee (the “Committee”), which will make recommendations to the Board.
The Trust will follow these procedures in investigating and enforcing this Code:
| • | the Compliance Officer for the Trust will take all appropriate action to investigate any potential violations reported to the Compliance Officer; |
| • | the Compliance Officer will review with the outside legal counsel to the Trust the findings and conclusions of such investigation; |
| • | if, after such investigation and review, the Compliance Officer believes that no violation has occurred, the Compliance Officer is not required to take any further action; |
| • | any matter that the Compliance Officer believes is a violation will be reported to the Committee; |
| • | if the Committee concurs that a violation has occurred, it will inform and make a recommendation to the Board, which will consider appropriate action, which may include review of, and appropriate modifications to, applicable policies and procedures (including changes to this Code); notification of the violation to appropriate personnel of a Service Provider or its board; or a recommendation to take disciplinary action against the Covered Officer, which may include, without limitation, dismissal; |
| • | the Board will be responsible for granting waivers, as appropriate; and |
| • | any changes to or waivers of this Code will, to the extent required, be disclosed as provided by SEC rules. |
| V. | Other Policies and Procedures |
This Code shall be the sole code of ethics adopted by the Trust for purposes of Section 406 of the Sarbanes-Oxley Act and the rules and forms applicable to registered investment companies thereunder. Insofar as other policies or procedures of the Trust or the Service Providers govern or purport to govern the behavior or activities of the Covered Officers who are subject to this Code, they are superseded by this Code to the extent that they overlap or conflict with the provisions of this Code. The Trust’s and each Service Provider’s codes of ethics under Rule 17j- 1 under the 1940 Act are separate requirements applying to the Covered Officers and others, and are not part
17-4
of this Code. This Code does not, and is not intended to, repeat or replace these programs and procedures.
| VI. | Amendments |
Any amendments to this Code, other than amendments to Exhibit A, must be approved or ratified by a majority vote of the Board, including a majority of Independent Trustees.
| VII. | Confidentiality |
To the extent possible, all records, reports and other information prepared, maintained or acquired pursuant to this Code will be treated as confidential and shall be maintained and protected accordingly. Except as otherwise required by law or this Code, such matters shall not be disclosed to anyone other than the Board, the Trust, or counsel to the Trust and the Adviser, as authorized by the Board.
| VIII. | Internal Use |
This Code is intended solely for the internal use by the Trust and does not constitute an admission, by or on behalf of the Trust, as to any fact, circumstance, or legal conclusion and does not create any rights of third parties.
Adoption and Amendment History
Adopted as of December 4, 2020
Amended as of March 9, 2021
17-5
Exhibit A
Persons Covered by this Code of Ethics
Jonathan Weitz - President and Principal Executive Officer
Troy Sheets - Treasurer and Principal Financial Officer
17-A-1
Exhibit B-1
Covered Officer Affirmation of Understanding
In accordance with Section IV of the Code of Ethics for Principal Executive and Principal Financial Officers (the “Code”), the undersigned Covered Officer of the Trust (as defined in the Code) hereby affirms to the Board that the Covered Officer has received, read, and understands the Code.
| Date: ___________________ |
| |||
| Jonathan Weitz | ||||
| Principal Executive Officer | ||||
| JOHCM Funds Trust |
17-B-1
Exhibit B-2
Covered Officer Affirmation of Understanding
In accordance with Section IV of the Code of Ethics for Principal Executive and Principal Financial Officers (the “Code”), the undersigned Covered Officer of the Trust (as defined in the Code) hereby affirms to the Board that the Covered Officer has received, read, and understands the Code.
| Date: ___________________ |
| |||
| Troy Sheets | ||||
| Principal Financial Officer | ||||
| JOHCM Funds Trust |
17-B-2
Exhibit C-1
Covered Officer Annual Affirmation
For the fiscal period ending , ________
In accordance with Section IV of the Code of Ethics for Principal Executive and Principal Financial Officers (the “Code”), the undersigned Covered Officer of the Trust (as defined in the Code) hereby affirms to the Board that the Covered Officer, at all times during the period for which this affirmation is given, has complied with each of the requirements of the Code.
| Date: ___________________ |
| |||
| Jonathan Weitz | ||||
| Principal Executive Officer | ||||
| JOHCM Funds Trust |
17-C-1
Exhibit C-2
Covered Officer Annual Affirmation
For the fiscal period ending , ________
In accordance with Section IV of the Code of Ethics for Principal Executive and Principal Financial Officers (the “Code”), the undersigned Covered Officer of the Trust (as defined in the Code) hereby affirms to the Board that the Covered Officer, at all times during the period for which this affirmation is given, has complied with each of the requirements of the Code.
| Date: ___________________ |
| |||
| Troy Sheets | ||||
| Principal Financial Officer | ||||
| JOHCM Funds Trust |
17-C-2
Exhibit 13(a)(2)
Certification
I, Jonathan Weitz, certify that:
| 1. | I have reviewed this report on Form N-CSR of the JOHCM Funds Trust (the “registrant”); |
| 2. | Based on my knowledge, this report does not contain any untrue statement of a material fact or omit to state a material fact necessary to make the statements made, in light of the circumstances under which such statements were made, not misleading with respect to the period covered by this report; |
| 3. | Based on my knowledge, the financial statements, and other financial information included in this report, fairly present in all material respects the financial condition, results of operations, changes in net assets, and cash flows (if the financial statements are required to include a statement of cash flows) of the registrant as of, and for, the periods presented in this report; |
| 4. | The registrant’s other certifying officer(s) and I are responsible for establishing and maintaining disclosure controls and procedures (as defined in Rule 30a-3(c) under the Investment Company Act of 1940) and internal control over financial reporting (as defined in Rule 30a-3(d) under the Investment Company Act of 1940) for the registrant and have: |
| (a) | Designed such disclosure controls and procedures, or caused such disclosure controls and procedures to be designed under our supervision, to ensure that material information relating to the registrant, including its consolidated subsidiaries, is made known to us by others within those entities, particularly during the period in which this report is being prepared; |
| (b) | Designed such internal control over financial reporting, or caused such internal control over financial reporting to be designed under our supervision, to provide reasonable assurance regarding the reliability of financial reporting and the preparation of financial statements for external purposes in accordance with generally accepted accounting principles; |
| (c) | Evaluated the effectiveness of the registrant’s disclosure controls and procedures and presented in this report our conclusions about the effectiveness of the disclosure controls and procedures, as of a date within 90 days prior to the filing date of this report, based on such evaluation; and |
| (d) | Disclosed in this report any change in the registrant’s internal control over financial reporting that occurred during the period covered by this report that has materially affected, or is reasonably likely to materially affect, the registrant’s internal control over financial reporting; and |
| 5. | The registrant’s other certifying officer(s) and I have disclosed to the registrant’s auditors |
| and the audit committee of the registrant’s board of directors (or persons performing the equivalent functions): |
| (a) | All significant deficiencies and material weaknesses in the design or operation of internal control over financial reporting which are reasonably likely to adversely affect the registrant’s ability to record, process, summarize, and report financial information; and |
| (b) | Any fraud, whether or not material, that involves management or other employees who have a significant role in the registrant’s internal control over financial reporting. |
| Date: December 3, 2021 | /s/ Jonathan Weitz | |||||
| Jonathan Weitz | ||||||
| President and Principal Executive Officer |
Certification
I, Troy Sheets, certify that:
| 1. | I have reviewed this report on Form N-CSR of the JOHCM Funds Trust (the “registrant”); |
| 2. | Based on my knowledge, this report does not contain any untrue statement of a material fact or omit to state a material fact necessary to make the statements made, in light of the circumstances under which such statements were made, not misleading with respect to the period covered by this report; |
| 3. | Based on my knowledge, the financial statements, and other financial information included in this report, fairly present in all material respects the financial condition, results of operations, changes in net assets, and cash flows (if the financial statements are required to include a statement of cash flows) of the registrant as of, and for, the periods presented in this report; |
| 4. | The registrant’s other certifying officer(s) and I are responsible for establishing and maintaining disclosure controls and procedures (as defined in Rule 30a-3(c) under the Investment Company Act of 1940) and internal control over financial reporting (as defined in Rule 30a-3(d) under the Investment Company Act of 1940) for the registrant and have: |
| (a) | Designed such disclosure controls and procedures, or caused such disclosure controls and procedures to be designed under our supervision, to ensure that material information relating to the registrant, including its consolidated subsidiaries, is made known to us by others within those entities, particularly during the period in which this report is being prepared; |
| (b) | Designed such internal control over financial reporting, or caused such internal control over financial reporting to be designed under our supervision, to provide reasonable assurance regarding the reliability of financial reporting and the preparation of financial statements for external purposes in accordance with generally accepted accounting principles; |
| (c) | Evaluated the effectiveness of the registrant’s disclosure controls and procedures and presented in this report our conclusions about the effectiveness of the disclosure controls and procedures, as of a date within 90 days prior to the filing date of this report, based on such evaluation; and |
| (d) | Disclosed in this report any change in the registrant’s internal control over financial reporting that occurred during the period covered by this report that has materially affected, or is reasonably likely to materially affect, the registrant’s internal control over financial reporting; and |
| 5. | The registrant’s other certifying officer(s) and I have disclosed to the registrant’s auditors |
| and the audit committee of the registrant’s board of directors (or persons performing the equivalent functions): |
| (a) | All significant deficiencies and material weaknesses in the design or operation of internal control over financial reporting which are reasonably likely to adversely affect the registrant’s ability to record, process, summarize, and report financial information; and |
| (b) | Any fraud, whether or not material, that involves management or other employees who have a significant role in the registrant’s internal control over financial reporting. |
| Date: December 3, 2021 | /s/ Troy Sheets | |||||
| Troy Sheets | ||||||
| Treasurer and Principal Financial Officer |
EX- 99.906CERT
Certification
This certification is provided pursuant to Section 906 of the Sarbanes-Oxley Act of 2002, 18 U.S.C. § 1350, and accompanies the report on Form N-CSR for the period ended September 30, 2021 of the JOHCM Funds Trust (the “registrant”).
Jonathan Weitz, Principal Executive Officer, and Troy Sheets, Principal Financial Officer of registrant, each certify to the best of his or her knowledge that:
| 1. | The Form N-CSR fully complies with the requirements of Section 13(a) or 15(d) of the Securities Exchange Act of 1934, as amended; and |
| 2. | The information contained in the Form N-CSR fairly presents, in all material respects, the financial condition and results of operations of the registrant. |
| December 3, 2021 |
December 3, 2021 | |||
| Date | Date | |||
| /s/ Jonathan Weitz |
/s/ Troy Sheets | |||
| Jonathan Weitz | Troy Sheets | |||
| President and Principal Executive Officer | Treasurer and Principal Financial Officer | |||
This certification is being furnished solely pursuant to Section 906 of the Sarbanes-Oxley Act of 2002 and is not being filed as part of Form N-CSR or as a separate disclosure document. A signed original of this written statement required by Section 906 has been provided to the registrant and will be retained by the registrant and furnished to the Securities and Exchange Commission or its staff upon request.
Serious News for Serious Traders! Try StreetInsider.com Premium Free!
You May Also Be Interested In
- Jessie Nudelman Joins Habbas & Associates
- iQor Qares to Host 7th Annual Charity Golf Tournament
- TimelyCare Earns Recognition as One of the World's Best Digital Health Companies, Earns Five Top Workplace Awards
Create E-mail Alert Related Categories
SEC FilingsSign up for StreetInsider Free!
Receive full access to all new and archived articles, unlimited portfolio tracking, e-mail alerts, custom newswires and RSS feeds - and more!
