

Form N-CSR Investment Managers Seri For: Dec 31
 Tweet
Tweet Share
Share
UNITED
STATES
SECURITIES AND EXCHANGE COMMISSION
Washington, D.C. 20549
FORM N-CSR
CERTIFIED SHAREHOLDER REPORT OF REGISTERED MANAGEMENT INVESTMENT COMPANIES
Investment Company Act file number 811-21719
INVESTMENT
MANAGERS SERIES TRUST
(Exact name of registrant as specified in charter)
235 W. Galena Street
Milwaukee,
WI 53212
(Address of principal executive offices) (Zip code)
Diane J. Drake
Mutual Fund Administration, LLC
2220 E. Route 66, Suite 226
Glendora, CA 91740
(Name and address of agent for service)
(414) 299-2295
Registrant's telephone number, including area code
Date of fiscal year end: December 31,
Date of reporting period: December 31, 2021
Item 1. Report to Stockholders.
| (a) | The registrant’s annual report transmitted to shareholders pursuant to Rule 30e-1 under the Investment Company Act of 1940, as amended (the “Investment Company Act”), is as follows: |

Braddock Multi-Strategy Income Fund
(Class A: BDKAX)
(Class C: BDKCX)
(Institutional Class: BDKNX)
ANNUAL
REPORT
DECEMBER 31, 2021
Braddock Multi-Strategy Income Fund
A series of Investment Managers Series Trust
Table of Contents
| Shareholder Letter | 1 |
| Fund Performance | 7 |
| Schedule of Investments | 9 |
| Statement of Assets and Liabilities | 17 |
| Statement of Operations | 18 |
| Statements of Changes in Net Assets | 19 |
| Financial Highlights | 20 |
| Notes to Financial Statements | 23 |
| Report of Independent Registered Public Accounting Firm | 36 |
| Supplemental Information | 37 |
| Expense Example | 40 |
This report and the financial statements contained herein are provided for the general information of the shareholders of the Braddock Multi-Strategy Income Fund. This report is not authorized for distribution to prospective investors in the Fund unless preceded or accompanied by an effective prospectus.
www.libertystreetfunds.com

2021 Braddock Multi-Strategy Income Fund
February 1, 2022
To Our Shareholders:
The Braddock Multi-Strategy Income Fund (the “Fund”), as measured by the Fund’s Institutional Share Class (BDKNX), returned 5.71% in 2021, outperforming both the Bloomberg Aggregate Bond Index’s (the “Aggregate Index”) return of -1.54% by 725 basis points and the ICE BofAML U.S. Cash Pay High Yield Index’s (the “High Yield Index”) return of 5.29% by 42 basis points. The Fund ended the year with $569 million of assets. The Aggregate Index along with traditional total return bond funds were negatively impacted by 2021’s rising interest rates and by widening of credit spreads from historically tight levels. The High Yield Index, and many funds in that sector, benefited from healthy corporate fundamentals and were less affected by rising rates due to their lower duration versus the Aggregate Index and total return bond funds.

The economic recovery from the Covid-19 pandemic continued in 2021 with the first half of the year driven by the positive effects of vaccine rollouts and strong corporate earnings. Unfortunately, the pace of recovery slowed in the second half of the year in response to the emergence of two Covid-19 variants and continued supply chain problems. These variants, along with the highest levels of inflation since the early 1980s, led to increased volatility in both the equity and fixed income markets.
The Fund was tactical in these evolving markets. In anticipation of the removal of Covid-19 related monetary accommodation, the Fund’s floating rate allocation was increased from 56% to 75% in 2021. By focusing on a strategy that emphasized Modern Residential Mortgage-Backed Securities (Credit sensitive RMBS issued in 2013 or later) and floating rate securities, the Fund was able to bring its interest rate duration to a multi-year low of 0.86 years and maintain a low credit duration of 3.35 years. As a result, the Fund experienced less price volatility in 2021 versus the benchmarks.
1
Housing and mortgage fundamentals were very positive in during the year. U.S. home prices increased close to 20% in 20211 and mortgage delinquencies trended down throughout the year2. In the post-pandemic economy, residential housing has provided personal well-being and added a home office aspect with the emergence of “work from home.”
Housing and Mortgage Fundamentals

Demographic factors have also been a major contributor to housing demand over the last two years and are forecasted to continue in the future. The Millennial generation is the largest generation since the Baby Boomers and approximately 24 million more Millennials will enter first time home buying age over the next five years3.
The U.S. housing market faces a shortage of four to seven million single-family housing units4 as a result of a decade of below normal construction levels. After the great recession, homebuilders reduced speculative home building and concentrated new construction on larger homes with higher gross margins. It wasn’t until 2016 that homebuilders began to reduce average home size to meet millennial demand5. In 2021, homebuilders faced significant challenges that limited their ability to add housing units. The majority of builders have reported labor shortages, zoning issues, and supply chain issues that resulted in higher costs and longer construction timelines. With these conditions, it will take several years to balance supply and demand in the U.S. housing market.
This supply and demand imbalance has reduced credit risk in RMBS sectors. Higher home prices have translated into higher levels of borrower equity which reduces the probability of mortgage defaults and lowers loss levels on those mortgages that do go to foreclosure. Troubled borrowers are more likely to simply sell their home and avoid negative consequences of the foreclosure process.
The average mortgage backing the Fund’s Modern RMBS reflects this lower risk with a Loan-To-Value below 65% and the average borrower FICO above 7506 as of December 31, 2021.
Market Conditions – Securities Markets
Total RMBS issuance of over $200 billion, the highest in over twelve years7 provided ample opportunity for the Fund to make attractive investments and structure the portfolio to demonstrate low volatility. The Fund was active across eight Modern RMBS sectors in 2021. Modern RMBS securities have benefited from the high-quality underwriting standards that have been standard in the housing finance industry since the housing crisis. Pre-Covid-19 RMBS positions experienced decreasing levels of delinquency and forbearance throughout 20218 which has been consistent across RMBS sectors of Credit Risk Transfer, Mortgage Insurance Linked Notes, Prime Jumbo A, and Non-qualified Mortgage sectors. Post-Covid-19 investments have benefited from strong credit performance as a result of the stricter, post-pandemic mortgage underwriting standards. The Fund’s RMBS allocation remained in the 69%-73% range in 2021 and contributed 3.88% to the 5.71% yearly return.
2
Consumer Asset Backed Securities (ABS) markets experienced significant credit spread tightening and elevated credit rating upgrades over the year, attributable to the ability of the consumer to meet their financial obligations and supportive technical factors. The Fund sold a portion of these outperforming fixed rate bonds during a strong ABS market. Overall, the Consumer ABS allocation was tactically lowered from 22% to 13% in 2021. The Fund sold these fixed rate bonds and rotated into floating rate and higher yielding structured credit opportunities. The Fund’s ABS positions added 1.18% to the year’s return.
The Fund re-entered the Collateralized Loan Obligations (CLO) market in 2021 and finished the year with a 9% investment grade allocation. The purchases added floating rate coupon exposure to the Fund and significant yield pick-up over traditional corporate credit. The levered loan market, the collateral within CLOs, experienced improved fundamentals with declining tail risks that translated into historically low default rates and monthly inflows to the loan market throughout the year. The strong credit performance and floating rate nature of the securities attracted new investors to the asset class. The depth of the investor base absorbed a record $421 billion of issuance of both new issue and refinancing transactions in 20219.
Multifamily Commercial Mortgage-Backed Securities (Multi-family) positions contributed 0.41% to the 2021 return. These Multifamily bonds added constructive diversification with low interest rate sensitivity. The Fund was tactical in the sector with an allocation ranging from 5% to 8%, participating in both Agency Multi-family bonds and Multi-family Commercial Real Estate-CLO bonds. High Demand for housing coupled with rental assistance programs and extended eviction moratoriums kept occupancy rates at high levels. Rent collections rates were high within the properties in the bond’s collateral pools.
Fund Outlook
Braddock believes the Fund’s Modern RMBS and floating rate bond strategy is advantageous in today’s economic environment. The supply-demand shortfall of single-family homes discussed above provides a strong underpinning to home values over the long term.
We believe the Fund’s high percentage allocation to floating rate securities helps mitigate against rising rates in a market where expectations of high economic growth and higher than desired inflation are influencing investor sentiment. Per the December Federal Reserve (the Fed) minutes, the Fed has met the inflation target for liftoff and is monitoring the employment target with an increasingly hawkish eye:
“Many participants judged that, if the current pace of improvement continued, labor markets would fast approach maximum employment. Several participants remarked that they viewed labor market conditions as already largely consistent with maximum employment.”
The Fed Dots signal eight hikes, a 2% increase in the Fed Funds rate, by the end of 2023. Floating rate bonds, which are indexed to short term LIBOR (London Interbank Offered Rate) or SOFR (Secured Overnight Financing Rate) rates should experience a similar increase in bond coupons as the Fed Funds rate rises. This dynamic, if it occurs, would increase the Fund’s floating rate bond coupons thereby increasing the amount of interest available for distribution to the Fund’s investors, and helping to maintain bond values.
3
With the combination of investment opportunities and the fundamental strength of the U.S. consumer and housing markets, we believe the Fund’s focus provides access to some of the strongest sectors of the economy. In light of general fixed income yields, we consider the securitized credit markets (Modern RMBS, Consumer ABS and CLOs) to provide compelling value. The Fund’s low effective duration of 0.86 years as of year end may provide less interest rate risk versus the Aggregate Index and is a complement to the Fund’s credit profile. Additionally, as a growing and nimble fund, the Fund seems well positioned to capitalize on the new and evolving opportunities in these sectors.
We thank you for your investment in the Braddock Multi-Strategy Income Fund.
Best regards,
Garrett Tripp, CFA Senior Portfolio Manager
Toby Giordano, CFA Portfolio Manager
IMPORTANT RISKS AND DISCLOSURES
The views expressed in this report reflect those of the Fund’s Sub-Advisor as of the date this is written and may not reflect its views on the date this report is first published or anytime thereafter. These views are intended to assist shareholders in understanding the Fund’s investment methodology and do not constitute investment advice. This report may contain discussions about investments that may or may not be held by the Fund as of the date of this report. All current and future holdings are subject to risk and to change. To the extent this report contains forward looking statements, unforeseen circumstances may cause actual results to differ materially from the views expressed as of the date this is written.
The Fund commenced investment operations on December 31, 2015, after the conversion of a limited partnership Account, Braddock Structured Opportunities Fund Series A, L.P., which commenced operations on 7/31/2009, (the “Predecessor Account”), into shares of the Fund’s Institutional Class. Performance information prior to December 31, 2015 discussed in this report is for the Predecessor Account. The Fund’s objectives, policies, guidelines and restrictions are in all material respects equivalent to those of the Predecessor Account. The Predecessor Account was not registered under the Investment Company Act of 1940, as amended (the “1940 Act”), and therefore was not subject to certain restrictions imposed by the 1940 Act on registered investment companies and by the Internal Revenue Code of 1986 on regulated investment companies. If the Predecessor Account had been registered under the 1940 Act, the Predecessor Account’s performance may have been adversely affected.
An investment in the Braddock Multi-Strategy Income Fund is subject to risk, including the possible loss of principal amount invested and including, but not limited to, the following risks: COVID-19 Related Market Events: The outbreak of COVID-19 has caused major disruptions to the worldwide economy, including the U.S. The future impact of COVID-19 is currently unknown, and it may exacerbate other risks that apply to the Fund. Market Risk: the market price of a security may decline, sometimes rapidly or unpredictably, due to general market conditions that are not specifically related to a particular issuer, company, or asset class. Valuation: From time to time, the Fund will need to fair-value portfolio securities at prices that differ from third party pricing inputs. This may affect purchase price or redemption proceeds for investors who purchase or redeem Fund shares on days when the Fund is pricing or holding fair-valued securities. Such pricing differences can be significant and can occur quickly during times of market volatility. Fixed income/interest rate: Generally, fixed income securities decrease in value if interest rates rise, and increase in value if interest rates fall. Liquidity: the Fund may not be able to sell some or all of the invest-ments that it holds due to a lack of demand in the marketplace or it may only be able to sell those investments at a loss. Liquid investments may become illiquid or less liquid after purchase by the Fund, Illiquid investments may be harder to value, especially in changing markets. High Yield (“Junk”) bond: involve greater risk of default, downgrade, or price declines, can be more volatile and less liquid than investment-grade securities. Mortgage-backed and Asset-Backed securities: subject to prepayment risk, “extension risk” (repaid more slowly), credit risk, liquidity, and default risks. Management and Strategy: the evaluation and selection of the Fund’s investments depend on the judgment of the Fund’s Sub-Advisor about the quality, relative yield, value or market trends affecting a particular security, industry, sector or region, which may prove to be incorrect. Credit Risk: If an issuer or guarantor of a debt security held by the Fund or a counterparty to a financial contract with the Fund defaults or is downgraded or is perceived to be less creditworthy, the value of the Fund’s portfolio will typically decline. The Fund’s securities are generally not guaranteed by any governmental agency. Sector Focus: may present more risks than if broadly diversified. Real estate market: property values may fall due to various economic factors. Non-diversification: focus in the securities of fewer issuers, which exposes the Fund to greater market risk than if its assets were diversified among a greater number of issuers. Collateralized Loan Obligations: subject to interest rate, credit, asset manager, legal, regulatory, limited recourse, liquidity, redemption, and reinvestment risks. Repurchase agreement: may be subject to market and credit risk. Reverse repurchase agreement: risks of leverage and counterparty risk. Leverage: The use of leverage may magnify the Fund’s gains and losses and make the Fund more volatile. LIBOR: Many financial instruments use a floating rate based on the London Interbank Offered Rate (“LIBOR”), which is expected to expire by the end of 2021. Any effects of the transition away from LIBOR could result in losses. Derivatives: derivative instruments (e.g. short sells, options, futures) involve risks different from direct investment in the underlying assets, including possible losses in excess of amount invested or any gain in portfolio positions. ETF Risk: Investing in an ETF will provide the Fund with exposure to the securities comprising the index on which the ETF is based and will expose the Fund to risks similar to those of investing directly in those securities.
4
Basis points: one hundredth of one percent, used chiefly in expressing differences of interest rates. Dots: The Federal Reserve’s projections for interest rates that are published each quarter. Duration measures a portfolio’s sensitivity to changes in interest rates. Generally, the longer the effective duration, the greater the price change relative to interest rate movements. FICO Score: A measure of consumer credit quality that typically ranges from 300-850. Higher scores indicate more creditworthy borrowers. Investment grade is a rating that signifies a bond that presents a relatively low risk of default. Loan-to-Value ratio is an assessment of lending risk assessment that financial institutions and other lenders examine before approving a mortgage. Typically, assessments with high LTV ratios are higher risk. Secured Overnight Financing Rate (SOFR) is a broad measure of the cost of borrowing cash overnight collateralized by Treasury securities.
5
Bloomberg Aggregate Bond Index measures the investment grade, US dollar-denominated, fixed-rate taxable bond market. The index includes Treasuries, government-related and corporate securities, mortgage-backed securities, asset-backed securities and commercial mortgage-backed securities. ICE Bank of America Merrill Lynch U.S. Cash Pay U.S. High Yield Index tracks the performance of US dollar denominated below investment grade corporate debt publicly issued in the US domestic market. One cannot invest directly in an index. Bloomberg Barclays US Mortgage Backed Securities Index tracks fixed-rate agency mortgage backed pass-through securities guaranteed by Ginnie Mae (GNMA), Fannie Mae (FNMA), and Freddie Mac (FHLMC). The index is constructed by grouping individual TBA-deliverable MBS pools into aggregates or generics based on program, coupon and vintage. Bloomberg US Corporate Bond Index measures the investment grade, fixed-rate, taxable corporate bond market. It includes USD denominated securities publicly issued by US and non-US industrial, utility and financial issuers. The index is limited to investment grade bonds. Bloomberg US Treasury Index measures US dollar-denominated, fixed-rate, nominal debt issued by the US Treasury. Treasury bills are excluded by the maturity constraint, but are part of a separate Short Treasury Index. STRIPS are excluded from the index. One cannot invest directly in an index.
| 1 | S&P Case-Shiller. As of 1/25/2022 |
| 2 | Fannie Mae, Freddie Mac. As of 1/25/2022 |
| 3 | U.S. Census Bureau, National Association of Realtors. As of 11/11/2021 |
| 4 | National Association of Realtors, Morgan Stanley, Realtor.com/Move Inc. As of 11/17/2021 |
| 5 | U.S. Census Bureau. As of 6/1/2021 |
| 6 | Fannie Mae, Freddie Mac, DV01, Moody’s Analytics. As of 1/25/2022 |
| 7 | Bank of America. As of 12/31/2021 |
| 8 | Black Knight. As of 1/4/2022 |
| 9 | JP Morgan. As of 12/31/2021 |
6
Braddock Multi-Strategy Income Fund
FUND PERFORMANCE at December 31, 2021 (Unaudited)
The Fund commenced investment operations on December 31, 2015, after the conversion of a limited partnership account, Braddock Structured Opportunities Fund Series A, L.P., which commenced operations on July 31, 2009, (the "Predecessor Account"), into Institutional Class shares of the Fund. The Fund’s objectives, policies, guidelines and restrictions are, in all material respects, equivalent to those of the Predecessor Account.
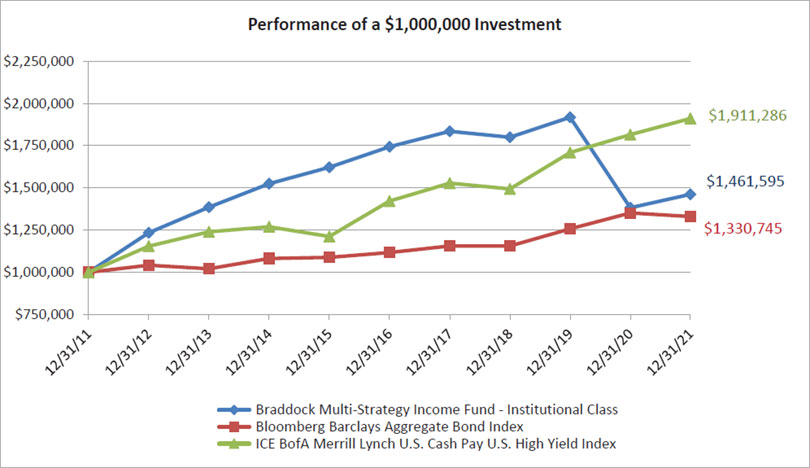
This graph compares a hypothetical $1,000,000 investment in the Fund’s Institutional Class during the periods shown with a similar investment in the Bloomberg Barclays Aggregate Bond Index and the ICE BofA Merrill Lynch U.S. Cash Pay U.S. High Yield Index. The performance graph above is shown for the Fund’s Institutional Class shares; Class A shares and Class C shares performance may vary. Results include the reinvestment of all dividends and capital gains.
The Bloomberg Barclays Aggregate Bond Index measures the investment grade, US dollar-denominated, fixed-rate taxable bond market. The ICE BofA Merrill Lynch U.S. Cash Pay U.S. High Yield Index tracks the performance of US dollar denominated below investment grade corporate debt publicly issued in the US domestic market. These indices do not reflect expenses, fees or sales charge, which would lower performance. The indices are unmanaged and it is not possible to invest in an index.
| Average Annual Total Return as of December 31, 2021 | 1 Year | 5 Years | 10 Years |
| Before deducting maximum sales charge | |||
| Class A1, * | 5.43% | -2.30% | 3.61% |
| Class C2, * | 4.64% | -3.03% | 2.84% |
| Institutional Class3 | 5.71% | -2.06% | 3.87% |
| After deducting maximum sales charge | |||
| Class A1, * | 0.93% | -3.15% | 3.00% |
| Class C2, * | 3.64% | -3.03% | 2.84% |
| Bloomberg Barclays Aggregate Bond Index | -1.54% | 3.57% | 2.90% |
| ICE BofA Merrill Lynch U.S. Cash Pay U.S. High Yield Index | 5.29% | 6.09% | 6.69% |
7
Braddock Multi-Strategy Income Fund
FUND PERFORMANCE at December 31, 2021 (Unaudited) - Continued
| * | The performance figures for Class A and Class C Shares include the performance for the Institutional Class for the period prior to December 31, 2015. Class A and Class C impose higher expenses than that of Institutional Class. |
| 1 | Maximum initial sales charge for Class A shares is 4.25%. No initial sales charge applies to purchase of $1 million or more, but a contingent deferred sales charge (“CDSC”) of 1.00% will be charged on certain Class A Share purchases of $1 million or more that are redeemed in whole or in part within 12 months of the date of purchase. |
| 2 | A CDSC of 1.00% will be charged on Class C share purchases that are redeemed in whole or in part within 12 months of purchase. |
| 3 | Institutional Class shares do not have any initial or contingent deferred sales charge. |
The performance data quoted here represents past performance and past performance is not a guarantee of future results. Investment return and principal value will fluctuate so that an investor's shares, when redeemed, may be worth more or less than their original cost. Current performance may be lower or higher than the performance information quoted. The most recent month end performance may be obtained by calling (800) 207-7108.
The expense ratio for Class A shares was 1.78%, for Class C shares was 2.53%, and for Institutional Class shares was 1.53%, which were stated in the current prospectus dated May 1, 2021. For the Fund’s most current one year expense ratios, please refer to the Financial Highlights section of this report. The Fund’s Advisor has contractually agreed to waive its fees and/or pay for operating expenses of the Fund to ensure that total annual fund operating expenses (excluding any taxes, leverage interest, brokerage commissions, dividend and interest expenses of short sales, acquired fund fees and expenses (as determined in accordance with Form N-1A), expenses incurred in connection with any merger or reorganization and extraordinary expenses such as litigation expenses) do not exceed 1.75%, 2.50%, and 1.50% of the average daily net assets of the Class A shares, Class C shares, and Institutional Class shares, respectively. This agreement is in effect until April 30, 2022, and it may be terminated before that date only by the Trust’s Board of Trustees. In the absence of such waivers, the Fund’s returns would be lower.
Returns reflect the reinvestment of distributions made by the Fund, if any. The graph and the performance table above do not reflect the deduction of taxes that a shareholder would pay on Fund distributions or the redemption of Fund shares.
8
Braddock Multi-Strategy Income Fund
SCHEDULE OF INVESTMENTS
As of December 31, 2021
| Principal Amount | Value | |||||||
| ASSET-BACKED SECURITIES — 80.6% | ||||||||
| ACC Auto Trust 2021-A | ||||||||
| $ | 6,000,000 | 6.100%, 6/15/20291,2 | $ | 5,940,690 | ||||
| Alternative Loan Trust 2005-62 | ||||||||
| 9,748,785 | 2.300%, 12/25/20352,3,4 | 515,676 | ||||||
| Aqua Finance Trust 2020-A | ||||||||
| 5,840,000 | 7.150%, 7/17/20461,2 | 6,074,020 | ||||||
| Arbor Realty Commercial Real Estate Notes 2021-FL1 Ltd. | ||||||||
| 3,570,000 | 3.510%, (1-Month USD Libor+340 basis points), 12/15/20351,2,5 | 3,565,021 | ||||||
| Arbor Realty Commercial Real Estate Notes 2021-FL4 Ltd. | ||||||||
| 4,000,000 | 3.490%, (1-Month USD Libor+340 basis points), 11/15/20361,2,5 | 3,996,680 | ||||||
| Atlas Senior Loan Fund XI Ltd. | ||||||||
| 5,000,000 | 3.175%, (3-Month USD Libor+305 basis points), 7/26/20311,2,5 | 4,766,643 | ||||||
| Avant Loans Funding Trust 2021-REV1 | ||||||||
| 3,931,000 | 6.410%, 7/15/20301,2 | 3,936,665 | ||||||
| Bellemeade Re 2019-1 Ltd. | ||||||||
| 3,731,000 | 4.102%, (1-Month USD Libor+400 basis points), 3/25/20291,2,5 | 3,749,684 | ||||||
| Bellemeade Re 2019-4 Ltd. | ||||||||
| 2,000,000 | 3.952%, (1-Month USD Libor+385 basis points), 10/25/20291,2,5 | 1,994,960 | ||||||
| Bellemeade Re 2020-2 Ltd. | ||||||||
| 7,880,000 | 6.101%, (1-Month USD Libor+600 basis points), 8/26/20301,2,5 | 8,273,823 | ||||||
| 8,066,000 | 8.601%, (1-Month USD Libor+850 basis points), 8/26/20301,2,5 | 8,860,302 | ||||||
| Bellemeade Re 2020-3 Ltd. | ||||||||
| 4,250,000 | 3.802%, (1-Month USD Libor+370 basis points), 10/25/20301,2,5 | 4,368,510 | ||||||
| 4,378,000 | 6.452%, (1-Month USD Libor+635 basis points), 10/25/20301,2,5 | 4,589,770 | ||||||
| Bellemeade Re 2020-4 Ltd. | ||||||||
| 2,269,000 | 5.102%, (1-Month USD Libor+500 basis points), 6/25/20301,2,5 | 2,296,542 | ||||||
| Bellemeade Re 2021-1 Ltd. | ||||||||
| 2,000,000 | 4.899%, (SOFR30A+485 basis points), 3/25/20311,2,5 | 2,123,548 | ||||||
| Bellemeade Re 2021-2 Ltd. | ||||||||
| 4,500,000 | 2.950%, (SOFR30A+290 basis points), 6/25/20311,2,5 | 4,365,402 | ||||||
| 3,000,000 | 4.200%, (SOFR30A+415 basis points), 6/25/20311,2,5 | 2,962,747 | ||||||
| Bellemeade RE 2021-3 Ltd. | ||||||||
| 3,000,000 | 3.200%, (SOFR30A+315 basis points), 9/25/20311,2,5 | 2,925,671 | ||||||
| Benefit Street Partners Clo XII Ltd. | ||||||||
| 3,919,000 | 3.174%, (3-Month USD Libor+305 basis points), 10/15/20301,2,5 | 3,879,976 | ||||||
| CAN Capital Funding LLC 2014-1A | ||||||||
| 535,925 | 4.257%, 4/15/20221,6 | – | ||||||
| Cathedral Lake V Ltd. | ||||||||
| 3,000,000 | 3.381%, (3-Month USD Libor+325 basis points), 10/21/20301,2,5 | 2,923,068 | ||||||
| Eagle RE 2019-1 Ltd. | ||||||||
| 5,910,000 | 4.602%, (1-Month USD Libor+450 basis points), 4/25/20291,2,5 | 5,976,875 | ||||||
| Eagle RE 2020-1 Ltd. | ||||||||
| 3,750,000 | 2.952%, (1-Month USD Libor+285 basis points), 1/25/20301,2,5 | 3,595,719 | ||||||
9
Braddock Multi-Strategy Income Fund
SCHEDULE OF INVESTMENTS - Continued
As of December 31, 2021
| Principal Amount | Value | |||||||
| ASSET-BACKED SECURITIES (Continued) | ||||||||
| Eagle RE 2021-1 Ltd. | ||||||||
| $ | 2,000,000 | 4.500%, (SOFR30A+445 basis points), 10/25/20331,2,5 | $ | 2,019,063 | ||||
| Eagle RE 2021-2 Ltd. | ||||||||
| 4,750,000 | 4.300%, (SOFR30A+425 basis points), 4/25/20341,2,5 | 4,760,000 | ||||||
| Finance of America HECM Buyout 2021-HB1 | ||||||||
| 3,500,000 | 3.640%, 2/25/20311,2,4,6 | 3,503,500 | ||||||
| 1,500,000 | 6.414%, 2/25/20311,2,4,6 | 1,526,100 | ||||||
| 5,000,000 | 9.000%, 2/25/20311,2,4,6 | 4,996,500 | ||||||
| FMC GMSR Issuer Trust | ||||||||
| 7,000,000 | 4.450%, 1/25/20261,2,4 | 7,029,708 | ||||||
| 4,500,000 | 4.360%, 7/25/20261,4 | 4,464,940 | ||||||
| Freddie Mac STACR REMIC Trust 2020-DNA5 | ||||||||
| 2,800,000 | 4.850%, (SOFR30A+480 basis points), 10/25/20501,2,5 | 2,974,959 | ||||||
| Freddie Mac STACR REMIC Trust 2021-DNA5 | ||||||||
| 8,500,000 | 5.549%, (SOFR30A+550 basis points), 1/25/20341,2,5 | 8,833,268 | ||||||
| Freddie Mac STACR REMIC Trust 2021-DNA6 | ||||||||
| 4,000,000 | 3.450%, (SOFR30A+340 basis points), 10/25/20411,2,5 | 4,032,384 | ||||||
| 5,000,000 | 7.549%, (SOFR30A+750 basis points), 10/25/20411,2,5 | 5,213,035 | ||||||
| Freddie Mac STACR REMIC Trust 2021-HQA2 | ||||||||
| 5,550,000 | 5.499%, (SOFR30A+545 basis points), 12/25/20331,2,5 | 5,802,755 | ||||||
| Freddie Mac STACR REMIC Trust 2021-HQA3 | ||||||||
| 5,500,000 | 6.299%, (SOFR30A+625 basis points), 9/25/20411,2,5 | 5,417,910 | ||||||
| Freddie Mac Structured Agency Credit Risk Debt Notes | ||||||||
| 579,311 | 10.853%, (1-Month USD Libor+1,075 basis points), 3/25/20252,5 | 593,442 | ||||||
| 4,795,654 | 9.303%, (1-Month USD Libor+920 basis points), 10/25/20272,5 | 5,504,144 | ||||||
| 1,682,902 | 7.653%, (1-Month USD Libor+755 basis points), 12/25/20272,5 | 1,807,686 | ||||||
| 3,141,490 | 2.603%, (1-Month USD Libor+250 basis points), 12/25/20422,5 | 3,087,293 | ||||||
| 222,742 | 3.103%, (1-Month USD Libor+300 basis points), 12/25/20422,5 | 149,249 | ||||||
| 9,569,000 | 3.730%, 2/25/20481,2,4 | 9,279,608 | ||||||
| 10,820,544 | 3.807%, 5/25/20481,2,4 | 10,432,563 | ||||||
| 5,212,650 | 4.146%, 8/25/20481,2,4 | 5,159,539 | ||||||
| 1,884,477 | 4.502%, 11/25/20481,2,4 | 1,861,809 | ||||||
| 2,127,000 | 4.303%, (1-Month USD Libor+420 basis points), 2/25/20471,2,5 | 2,247,977 | ||||||
| 1,000,000 | 8.453%, (1-Month USD Libor+835 basis points), 1/25/20481,2,5 | 1,104,597 | ||||||
| 5,100,000 | 4.153%, (1-Month USD Libor+405 basis points), 2/25/20491,2,5 | 5,293,883 | ||||||
| 3,449,065 | 9.453%, (1-Month USD Libor+935 basis points), 4/25/20282,5,6 | 3,708,058 | ||||||
| 4,600,000 | 4.753%, (1-Month USD Libor+465 basis points), 1/25/20491,2,5 | 4,806,184 | ||||||
| 1,486,109 | 8.703%, (1-Month USD Libor+860 basis points), 3/25/20292,5 | 1,585,987 | ||||||
| 5,250,000 | 7.849%, (SOFR30A+780 basis points), 11/25/20411,2,5 | 5,546,646 | ||||||
| Generate CLO 2 Ltd. | ||||||||
| 3,100,000 | 2.728%, (3-Month USD Libor+260 basis points), 1/22/20311,2,5 | 3,067,390 | ||||||
| Home Re 2019-1 Ltd. | ||||||||
| 7,000,000 | 4.452%, (1-Month USD Libor+435 basis points), 5/25/20291,2,5 | 7,105,628 | ||||||
10
Braddock Multi-Strategy Income Fund
SCHEDULE OF INVESTMENTS - Continued
As of December 31, 2021
| Principal Amount | Value | |||||||
| ASSET-BACKED SECURITIES (Continued) | ||||||||
| Home RE 2021-1 Ltd. | ||||||||
| $ | 4,000,000 | 2.952%, (1-Month USD Libor+285 basis points), 7/25/20331,2,5 | $ | 3,902,520 | ||||
| 4,000,000 | 3.752%, (1-Month USD Libor+365 basis points), 7/25/20331,2,5 | 3,847,245 | ||||||
| JP Morgan Wealth Management | ||||||||
| 1,249,154 | 2.800%, (SOFR30A+275 basis points), 3/25/20511,2,5 | 1,251,806 | ||||||
| 824,442 | 3.700%, (SOFR30A+365 basis points), 3/25/20511,2,5 | 835,300 | ||||||
| 1,576,000 | 6.949%, (SOFR30A+690 basis points), 3/25/20511,2,5 | 1,593,687 | ||||||
| JPMorgan Chase Bank N.A. - CACLN | ||||||||
| 3,850,000 | 8.482%, 12/26/20281,2 | 3,936,240 | ||||||
| 3,150,000 | 9.812%, 2/26/20291,2 | 3,109,595 | ||||||
| LL ABS Trust 2020-1 | ||||||||
| 2,200,000 | 6.540%, 1/17/20281,2 | 2,299,238 | ||||||
| LOANDEPOT GMSR Master Trust Seres 2018-GT1 | ||||||||
| 1,000,000 | 3.607%, (1-Month USD Libor+350 basis points), 10/16/20231,5 | 1,000,904 | ||||||
| Mosaic Solar Loan Trust 2018-2-GS | ||||||||
| 9,461,215 | 7.440%, 2/22/20441,2 | 8,770,188 | ||||||
| Mosaic Solar Loan Trust 2019-1 | ||||||||
| 681,414 | 0.000%, 12/21/20431,2 | 609,094 | ||||||
| Mosaic Solar Loan Trust 2019-2 | ||||||||
| 3,760,149 | 6.180%, 9/20/20401,2 | 3,607,271 | ||||||
| Multifamily Connecticut Avenue Securities Trust 2019-01 | ||||||||
| 6,412,000 | 3.352%, (1-Month USD Libor+325 basis points), 10/15/20491,2,5 | 6,328,703 | ||||||
| Multifamily Connecticut Avenue Securities Trust 2020-01 | ||||||||
| 5,000,000 | 3.852%, (1-Month USD Libor+375 basis points), 3/25/20501,2,5 | 5,085,740 | ||||||
| Oaktown Re IV Ltd. | ||||||||
| 5,651,000 | 11.602%, (1-Month USD Libor+1,150 basis points), 7/25/20301,2,5 | 5,744,718 | ||||||
| Oaktown Re V Ltd. | ||||||||
| 6,500,000 | 5.352%, (1-Month USD Libor+525 basis points), 10/25/20301,2,5 | 6,754,843 | ||||||
| 3,397,000 | 7.102%, (1-Month USD Libor+700 basis points), 10/25/20301,2,5 | 3,554,117 | ||||||
| Oaktown Re VI Ltd. | ||||||||
| 2,500,000 | 4.000%, (SOFR30A+395 basis points), 10/25/20331,2,5 | 2,508,991 | ||||||
| 1,500,000 | 5.549%, (SOFR30A+550 basis points), 10/25/20331,2,5 | 1,525,276 | ||||||
| Oaktown Re VII Ltd. | ||||||||
| 3,500,000 | 4.450%, (SOFR30A+440 basis points), 4/25/20341,2,5 | 3,468,641 | ||||||
| Oaktree CLO 2019-1 Ltd. | ||||||||
| 8,550,000 | 3.928%, (3-Month USD Libor+380 basis points), 4/22/20301,2,5 | 8,381,529 | ||||||
| Octane Receivables Trust 2019-1 | ||||||||
| 3,790,000 | 5.960%, 5/20/20271,2 | 3,833,630 | ||||||
| Octane Receivables Trust 2020-1 | ||||||||
| 4,717,000 | 5.450%, 3/20/20281,2 | 4,792,859 | ||||||
| Oportun Issuance Trust 2021-B | ||||||||
| 2,080,000 | 5.410%, 5/8/20311,2 | 2,083,349 | ||||||
| PNMAC FMSR Issuer Trust 2018-FT1 | ||||||||
| 2,800,000 | 2.452%, (1-Month USD Libor+235 basis points), 4/25/20231,2,5 | 2,800,536 | ||||||
11
Braddock Multi-Strategy Income Fund
SCHEDULE OF INVESTMENTS - Continued
As of December 31, 2021
| Principal Amount | Value | |||||||
| ASSET-BACKED SECURITIES (Continued) | ||||||||
| PNMAC GMSR Issuer Trust 2018-GT1 | ||||||||
| $ | 4,092,000 | 2.952%, (1-Month USD Libor+285 basis points), 2/25/20231,5 | $ | 4,103,626 | ||||
| PNMAC GMSR Issuer Trust 2018-GT2 | ||||||||
| 7,000,000 | 2.752%, (1-Month USD Libor+265 basis points), 8/25/20251,2,5 | 7,023,038 | ||||||
| Radnor RE 2019-1 Ltd. | ||||||||
| 10,300,000 | 4.553%, (1-Month USD Libor+445 basis points), 2/25/20291,2,5 | 10,412,586 | ||||||
| 5,350,000 | 2.802%, (1-Month USD Libor+270 basis points), 6/25/20291,2,5 | 5,357,998 | ||||||
| Radnor RE 2020-1 Ltd. | ||||||||
| 2,350,000 | 3.102%, (1-Month USD Libor+300 basis points), 1/25/20301,2,5 | 2,264,066 | ||||||
| Radnor RE 2020-2 Ltd. | ||||||||
| 2,000,000 | 7.702%, (1-Month USD Libor+760 basis points), 10/25/20301,2,5 | 2,048,671 | ||||||
| Radnor RE 2021-1 Ltd. | ||||||||
| 4,750,000 | 4.050%, (SOFR30A+400 basis points), 12/27/20331,2,5 | 4,626,290 | ||||||
| Radnor RE 2021-2 Ltd. | ||||||||
| 4,000,000 | 5.049%, (SOFR30A+500 basis points), 11/25/20311,2,5 | 4,114,352 | ||||||
| 4,000,000 | 6.049%, (SOFR30A+600 basis points), 11/25/20311,2,5 | 4,126,712 | ||||||
| Ready Capital Mortgage Financing 2021-FL7 LLC | ||||||||
| 5,000,000 | 3.502%, (1-Month USD Libor+340 basis points), 11/25/20361,2,5 | 5,001,011 | ||||||
| RESI Finance LP 2003-CB1 | ||||||||
| 1,050,323 | 1.751%, (1-Month USD Libor+165 basis points), 6/10/20351,2,5 | 862,635 | ||||||
| RMF Buyout Issuance Trust 2021-HB1 | ||||||||
| 3,500,000 | 6.000%, 11/25/20311,2,4,6 | 3,476,550 | ||||||
| Santander Bank N.A. - SBCLN | ||||||||
| 4,250,000 | 6.171%, 12/15/20311,2 | 4,250,506 | ||||||
| SolarCity FTE Series 2 LLC | ||||||||
| 8,234,152 | 7.500%, 9/20/20491,2 | 8,305,445 | ||||||
| Sound Point CLO V-R Ltd. | ||||||||
| 5,220,000 | 3.222%, (3-Month USD Libor+310 basis points), 7/18/20311,2,5 | 5,046,176 | ||||||
| STAR 2021-SFR1 Trust | ||||||||
| 6,000,000 | 3.309%, (1-Month USD Libor+320 basis points), 4/17/20381,5 | 6,028,410 | ||||||
| 3,633,000 | 4.559%, (1-Month USD Libor+445 basis points), 4/17/20381,5 | 3,676,901 | ||||||
| Steele Creek Clo 2018-2 Ltd. | ||||||||
| 4,500,000 | 3.560%, (3-Month USD Libor+340 basis points), 8/18/20311,2,5 | 4,426,666 | ||||||
| Triangle Re 2019-1 Ltd. | ||||||||
| 6,000,000 | 4.252%, (1-Month USD Libor+415 basis points), 11/26/20291,2,5 | 5,991,691 | ||||||
| 2,895,489 | 3.002%, (1-Month USD Libor+290 basis points), 11/26/20291,2,5 | 2,894,810 | ||||||
| Triangle Re 2020-1 Ltd. | ||||||||
| 2,123,000 | 7.852%, (1-Month USD Libor+775 basis points), 10/25/20301,2,5 | 2,232,861 | ||||||
| Triangle Re 2021-1 Ltd. | ||||||||
| 10,000,000 | 4.602%, (1-Month USD Libor+450 basis points), 8/25/20331,2,5 | 9,968,710 | ||||||
| Triangle Re 2021-2 Ltd. | ||||||||
| 2,000,000 | 5.602%, (1-Month USD Libor+550 basis points), 10/25/20331,2,5 | 2,122,202 | ||||||
| 2,000,000 | 7.602%, (1-Month USD Libor+750 basis points), 10/25/20331,2,5 | 2,190,128 | ||||||
12
Braddock Multi-Strategy Income Fund
SCHEDULE OF INVESTMENTS - Continued
As of December 31, 2021
| Principal Amount | Value | |||||||
| ASSET-BACKED SECURITIES (Continued) | ||||||||
| Triangle Re 2021-3 Ltd. | ||||||||
| $ | 5,104,000 | 4.999%, (SOFR30A+495 basis points), 2/25/20341,2,5 | $ | 5,003,472 | ||||
| Vibrant ClO VIII Ltd. | ||||||||
| 5,000,000 | 2.981%, (3-Month USD Libor+285 basis points), 1/20/20311,2,5 | 4,780,143 | ||||||
| Vivint Solar Financing VI LLC | ||||||||
| 9,012,924 | 4.871%, (3-Month USD Libor+475 basis points), 8/29/20231,2,5 | 8,938,589 | ||||||
| Voya CLO 2014-2 Ltd. | ||||||||
| 6,500,000 | 3.672%, (3-Month USD Libor+355 basis points), 4/17/20301,2,5 | 6,304,764 | ||||||
| Voya CLO 2014-4 Ltd. | ||||||||
| 7,000,000 | 3.477%, (3-Month USD Libor+335 basis points), 7/14/20311,2,5 | 6,697,781 | ||||||
| TOTAL ASSET-BACKED SECURITIES | ||||||||
| (Cost $447,486,711) | 458,500,607 | |||||||
| COLLATERALIZED MORTGAGE OBLIGATIONS — 13.8% | ||||||||
| CFMT 2020-HB4 LLC | ||||||||
| 3,250,000 | 4.948%, 12/26/20301,2,4,6 | 3,250,325 | ||||||
| 1,810,193 | 6.000%, 12/26/20301,2,4,6 | 1,809,288 | ||||||
| CFMT 2021-HB5 LLC | ||||||||
| 2,314,525 | 5.682%, 2/25/20311,2,4,6 | 2,313,136 | ||||||
| Chase Mortgage Finance Corp. | ||||||||
| 2,158,000 | 6.550%, (SOFR30A+650 basis points), 2/25/20501,2,5 | 2,157,360 | ||||||
| CHL Mortgage Pass-Through Trust 2005-3 | ||||||||
| 10,098,664 | 2.136%, 4/25/20352,3,4 | 470,656 | ||||||
| Dominion Mortgage Trust 2021-RTL1 | ||||||||
| 3,500,000 | 5.731%, 7/25/20271,2,7 | 3,499,428 | ||||||
| Fannie Mae Connecticut Avenue Securities | ||||||||
| 2,240,000 | 3.853%, (1-Month USD Libor+375 basis points), 3/25/20312,5 | 2,303,191 | ||||||
| 4,100,000 | 9.353%, (1-Month USD Libor+925 basis points), 11/25/20391,2,5 | 4,318,557 | ||||||
| 2,260,621 | 9.353%, (1-Month USD Libor+925 basis points), 4/25/20292,5 | 2,446,508 | ||||||
| 3,000,000 | 4.452%, (1-Month USD Libor+435 basis points), 4/25/20311,2,5 | 3,095,493 | ||||||
| 5,993,596 | 5.353%, (1-Month USD Libor+525 basis points), 10/25/20232,5 | 6,237,519 | ||||||
| 3,809,496 | 5.003%, (1-Month USD Libor+490 basis points), 11/25/20242,5 | 3,954,562 | ||||||
| 4,107,458 | 4.503%, (1-Month USD Libor+440 basis points), 1/25/20242,5 | 4,256,464 | ||||||
| 7,850,000 | 6.050%, (SOFR30A+600 basis points), 10/25/20411,2,5 | 8,057,617 | ||||||
| 2,800,000 | 5.550%, (SOFR30A+550 basis points), 12/25/20411,2,5 | 2,819,922 | ||||||
| FARM Mortgage Trust 2021-1 | ||||||||
| 1,770,280 | 3.249%, 1/25/20511,2,4 | 1,569,818 | ||||||
| FREMF 2020-KI05 Mortgage Trust | ||||||||
| 1,734,557 | 2.394%, (1-Month USD Libor+230 basis points), 7/25/20241,2,5 | 1,740,883 | ||||||
| JP Morgan Mortgage Trust 2020-8 | ||||||||
| 830,112 | 3.538%, 3/25/20511,2,4 | 792,272 | ||||||
| 855,000 | 3.538%, 3/25/20511,2,4 | 642,856 | ||||||
| 1,882,850 | 3.377%, 3/25/20511,2,4 | 861,545 | ||||||
| JP Morgan Seasoned Mortgage Trust 2014-1 | ||||||||
| 2,451,507 | 0.828%, 5/25/20331,2,4 | 2,160,272 | ||||||
13
Braddock Multi-Strategy Income Fund
SCHEDULE OF INVESTMENTS - Continued
As of December 31, 2021
| Principal Amount | Value | |||||||
| COLLATERALIZED MORTGAGE OBLIGATIONS (Continued) | ||||||||
| JP Morgan Trust 2015-1 | ||||||||
| $ | 2,731,957 | 2.115%, 12/25/20441,2,4 | $ | 2,739,942 | ||||
| LHOME Mortgage Trust 2019-RTL3 | ||||||||
| 2,800,000 | 5.682%, 7/25/20241,2,7 | 2,797,388 | ||||||
| Morgan Stanley Residential Mortgage Loan Trust 2021-2 | ||||||||
| 1,727,205 | 2.907%, 5/25/20511,2,4 | 1,449,144 | ||||||
| 1,500,000 | 2.907%, 5/25/20511,2,4 | 912,574 | ||||||
| 1,251,254 | 2.907%, 5/25/20511,2,4 | 485,160 | ||||||
| Oceanview Mortgage Trust 2021-1 | ||||||||
| 1,543,000 | 2.734%, 5/25/20511,2,4 | 1,102,020 | ||||||
| 772,000 | 2.734%, 5/25/20511,2,4 | 455,516 | ||||||
| Oceanview Mortgage Trust 2021-3 | ||||||||
| 1,406,000 | 2.728%, 6/25/20511,2,4 | 1,021,844 | ||||||
| 527,000 | 2.728%, 6/25/20511,2,4 | 316,956 | ||||||
| Sequoia Mortgage Trust 2017-3 | ||||||||
| 3,648,881 | 3.754%, 4/25/20471,2,4 | 3,714,565 | ||||||
| Sequoia Mortgage Trust 2017-4 | ||||||||
| 3,730,011 | 3.931%, 7/25/20471,2,4 | 3,769,564 | ||||||
| Western Mortgage Reference Notes Series 2021-CL2 | ||||||||
| 1,000,000 | 6.550%, (SOFR30A+650 basis points), 7/25/20591,2,5 | 1,000,000 | ||||||
| TOTAL COLLATERALIZED MORTGAGE OBLIGATIONS | ||||||||
| (Cost $74,814,798) | 78,522,345 | |||||||
| CORPORATE BONDS — 0.0% | ||||||||
| FINANCIALS — 0.0% | ||||||||
| First Matrix RMOF Trust | ||||||||
| 750,000 | 0.000% 10/1/20294,6,8,* | — | ||||||
| TOTAL FINANCIALS | ||||||||
| (Cost $6,456) | — | |||||||
| TOTAL CORPORATE BONDS | ||||||||
| (Cost $6,456) | — | |||||||
| Number of Shares | ||||||||
| SHORT-TERM INVESTMENTS — 5.8% | ||||||||
| 3,279,633 | Fidelity Institutional Government Portfolio, 0.010%9 | 3,279,633 | ||||||
| 29,826,515 | Morgan Stanley Institutional Liquidity Fund - Government Portfolio, 0.026%9 | 29,826,515 | ||||||
| TOTAL SHORT-TERM INVESTMENTS | ||||||||
| (Cost $33,106,148) | 33,106,148 | |||||||
| TOTAL INVESTMENTS — 100.2% | ||||||||
| (Cost $555,414,113) | 570,129,100 | |||||||
| Liabilities in Excess of Other Assets — 0.2% | (1,377,996 | ) | ||||||
| TOTAL NET ASSETS — 100.0% | $ | 568,751,104 | ||||||
14
Braddock Multi-Strategy Income Fund
SCHEDULE OF INVESTMENTS - Continued
As of December 31, 2021
REMIC – Real Estate Mortgage Investment Conduit
LLC – Limited Liability Company
LP – Limited Partnership
| 1 | Security exempt from registration under Rule 144A of the Securities Act of 1933. These securities are restricted and may be resold in transactions exempt from registration normally to qualified institutional buyers. The total value of these securities is $500,402,517, which represents 88.0% of total net assets of the Fund. |
| 2 | Callable. |
| 3 | Interest-only security. |
| 4 | Variable rate security. |
| 5 | Floating rate security. |
| 6 | Level 3 securities fair valued under procedures established by the Board of Trustees, represents 4.3% of Net Assets. The total value of these securities is $24,583,457. |
| 7 | Step rate security. |
| 8 | Security is in default. |
| 9 | The rate is the annualized seven-day yield at period end. |
| * | Non-income producing security. |
See accompanying Notes to Financial Statements.
15
Braddock Multi-Strategy Income Fund
SUMMARY OF INVESTMENTS
As of December 31, 2021
| Security Type/Sector | Percent of Total Net Assets | |||
| Corporate Bonds | 0.0 | % | ||
| Financials | 0.0 | % | ||
| Total Corporate Bonds | 0.0 | % | ||
| Asset-Backed Securities | 80.6 | % | ||
| Collateralized Mortgage Obligations | 13.8 | % | ||
| Short-Term Investments | 5.8 | % | ||
| Total Investments | 100.2 | % | ||
| Liabilities in Excess of Other Assets | (0.2 | )% | ||
| Total Net Assets | 100.0 | % | ||
See accompanying Notes to Financial Statements.
16
Braddock Multi-Strategy Income Fund
STATEMENT OF ASSETS AND LIABILITIES
As of December 31, 2021
| Assets: | ||||
| Investments, at value (cost $555,414,113) | $ | 570,129,100 | ||
| Receivables: | ||||
| Fund shares sold | 627,556 | |||
| Dividends and interest | 1,291,004 | |||
| Prepaid expenses | 73 | |||
| Callable bond proceeds (Note 11) | 24,547 | |||
| Total assets | 572,072,280 | |||
| Liabilities: | ||||
| Payables: | ||||
| Due to broker | 1,407,094 | |||
| Fund shares redeemed | 1,022,228 | |||
| Advisory fees | 600,952 | |||
| Shareholder servicing fees (Note 7) | 57,711 | |||
| Distribution fees - Class A & Class C (Note 6) | 11,942 | |||
| Fund services fees | 143,893 | |||
| Auditing fees | 22,970 | |||
| Commitment fees payable (Note 12) | 13,494 | |||
| Trustees' deferred compensation (Note 3) | 9,462 | |||
| Chief Compliance Officer fees | 5,383 | |||
| Trustees' fees and expenses | 3,911 | |||
| Accrued other expenses | 22,136 | |||
| Total liabilities | 3,321,176 | |||
| Net Assets | $ | 568,751,104 | ||
| Components of Net Assets: | ||||
| Paid-in capital (par value of $0.01 per share with an unlimited number of shares authorized) | $ | 575,833,468 | ||
| Total accumulated deficit | (7,082,364 | ) | ||
| Net Assets | $ | 568,751,104 | ||
| Maximum Offering Price per Share: | ||||
| Class A Shares: | ||||
| Net assets applicable to shares outstanding | $ | 11,016,687 | ||
| Shares of beneficial interest issued and outstanding | 1,507,782 | |||
| Redemption price1 | $ | 7.31 | ||
| Maximum sales charge (4.25% of offering price)2 | 0.32 | |||
| Maximum offering price to public | $ | 7.63 | ||
| Class C Shares: | ||||
| Net assets applicable to shares outstanding | $ | 10,346,120 | ||
| Shares of beneficial interest issued and outstanding | 1,419,411 | |||
| Redemption price3 | $ | 7.29 | ||
| Institutional Class Shares: | ||||
| Net assets applicable to shares outstanding | $ | 547,388,297 | ||
| Shares of beneficial interest issued and outstanding | 74,850,685 | |||
| Redemption price | $ | 7.31 | ||
| 1 | A Contingent Deferred Sales Charge ("CDSC") of 1.00% may be imposed on certain purchases of $1 million or more that are redeemed in whole or in part within 12 months of purchase. |
| 2 | On sales of $50,000 or more, the sales charge will be reduced and no initial sales charge is applied to purchases of $1 million or more. |
| 3 | A Contingent Deferred Sales Charge ("CDSC") of 1.00% may be imposed on certain purchases that are redeemed in whole or in part within 12 months of purchase. |
See accompanying Notes to Financial Statements.
17
Braddock Multi-Strategy Income Fund
STATEMENT OF OPERATIONS
For the Year Ended December 31, 2021
| Investment income: | ||||
| Interest | $ | 35,200,174 | ||
| Total investment income | 35,200,174 | |||
| Expenses: | ||||
| Advisory fees | 8,691,797 | |||
| Shareholder servicing fees (Note 7) | 514,516 | |||
| Distribution fees - Class A (Note 6) | 60,687 | |||
| Distribution fees - Class C (Note 6) | 129,636 | |||
| Fund services fees | 883,855 | |||
| Registration fees | 102,917 | |||
| Dividends and interest on securities sold short | 57,561 | |||
| Legal fees | 54,977 | |||
| Commitment fees (Note 12) | 24,444 | |||
| Auditing fees | 23,076 | |||
| Miscellaneous | 22,813 | |||
| Chief Compliance Officer fees | 18,114 | |||
| Trustees' fees and expenses | 17,507 | |||
| Shareholder reporting fees | 16,108 | |||
| Extraordinary Expense (Note 3) | 15,000 | |||
| Insurance fees | 3,604 | |||
| Total expenses | 10,636,612 | |||
| Advisory fees recovered | 65,672 | |||
| Net expenses | 10,702,284 | |||
| Net investment income | 24,497,890 | |||
| Realized and Unrealized Gain (Loss): | ||||
| Net realized gain (loss) on: | ||||
| Investments | 24,566,854 | |||
| Purchased options contracts | (365,166 | ) | ||
| Securities sold short | (389,472 | ) | ||
| Net realized gain | 23,812,216 | |||
| Net change in unrealized appreciation/depreciation on: | ||||
| Investments | (8,403,633 | ) | ||
| Purchased options contracts | 343,026 | |||
| Net change in unrealized appreciation/depreciation | (8,060,607 | ) | ||
| Net realized and unrealized gain | 15,751,609 | |||
| Net Increase in Net Assets from Operations | $ | 40,249,499 | ||
See accompanying Notes to Financial Statements.
18
Braddock Multi-Strategy Income Fund
STATEMENTS OF CHANGES IN NET ASSETS
| For the | For the | |||||||
| Year Ended | Year Ended | |||||||
| December 31, 2021 | December 31, 2020 | |||||||
| Increase (Decrease) in Net Assets from: | ||||||||
| Operations: | ||||||||
| Net investment income | $ | 24,497,890 | $ | 33,021,163 | ||||
| Net realized gain (loss) on investments, purchased options contracts and securities sold short | 23,812,216 | (43,142,189 | ) | |||||
| Net change in unrealized appreciation/depreciation on investments, purchased options contracts and securities sold short | (8,060,607 | ) | 11,813,705 | |||||
| Net increase in net assets resulting from operations | 40,249,499 | 1,692,679 | ||||||
| Distributions to Shareholders: | ||||||||
| Distributions: | ||||||||
| Class A | (793,806 | ) | (1,402,211 | ) | ||||
| Class C | (333,010 | ) | (533,914 | ) | ||||
| Institutional Class | (23,667,630 | ) | (31,709,024 | ) | ||||
| Total distributions to shareholders | (24,794,446 | ) | (33,645,149 | ) | ||||
| Capital Transactions: | ||||||||
| Net proceeds from shares sold: | ||||||||
| Class A | 9,258,822 | 46,335,618 | ||||||
| Class C | 162,600 | 7,278,672 | ||||||
| Institutional Class | 101,319,586 | 775,705,232 | ||||||
| Reinvestment of distributions: | ||||||||
| Class A | 641,912 | 1,163,118 | ||||||
| Class C | 307,717 | 454,599 | ||||||
| Institutional Class | 15,983,011 | 24,780,455 | ||||||
| Cost of shares redeemed: | ||||||||
| Class A | (34,359,865 | ) | (45,344,229 | ) | ||||
| Class C | (5,100,512 | ) | (7,222,115 | ) | ||||
| Institutional Class | (339,195,057 | ) | (600,027,003 | ) | ||||
| Net increase (decrease) in net assets from capital transactions | (250,981,786 | ) | 203,124,347 | |||||
| Total increase (decrease) in net assets | (235,526,733 | ) | 171,171,877 | |||||
| Net Assets: | ||||||||
| Beginning of period | 804,277,837 | 633,105,960 | ||||||
| End of period | $ | 568,751,104 | $ | 804,277,837 | ||||
| Capital Share Transactions: | ||||||||
| Shares sold: | ||||||||
| Class A | 1,268,252 | 7,177,211 | ||||||
| Class C | 22,362 | 1,024,936 | ||||||
| Institutional Class | 13,867,054 | 133,872,143 | ||||||
| Shares reinvested: | ||||||||
| Class A | 87,796 | 167,002 | ||||||
| Class C | 42,208 | 65,633 | ||||||
| Institutional Class | 2,184,616 | 3,647,516 | ||||||
| Shares redeemed: | ||||||||
| Class A | (4,702,238 | ) | (6,371,871 | ) | ||||
| Class C | (698,511 | ) | (1,021,460 | ) | ||||
| Institutional Class | (46,443,671 | ) | (87,317,318 | ) | ||||
| Net increase (decrease) in capital share transactions | (34,372,132 | ) | 51,243,792 | |||||
See accompanying Notes to Financial Statements.
19
Braddock Multi-Strategy Income Fund
FINANCIAL HIGHLIGHTS
Class A
Per share operating performance.
For a capital share outstanding throughout each period.
| For the Year Ended December 31, | ||||||||||||||||||||
| 2021 | 2020 | 2019 | 2018 | 2017 | ||||||||||||||||
| Net asset value, beginning of period | $ | 7.17 | $ | 10.39 | $ | 10.15 | $ | 10.27 | $ | 10.05 | ||||||||||
| Income from Investment Operations: | ||||||||||||||||||||
| Net investment income1 | 0.24 | 0.29 | 0.39 | 0.41 | 0.41 | |||||||||||||||
| Net realized and unrealized gain (loss) | 0.15 | (3.22 | ) | 0.24 | (0.11 | ) | 0.29 | |||||||||||||
| Total from investment operations | 0.39 | (2.93 | ) | 0.63 | 0.30 | 0.70 | ||||||||||||||
| Less Distributions: | ||||||||||||||||||||
| From net investment income | (0.25 | ) | (0.29 | ) | (0.39 | ) | (0.42 | ) | (0.48 | ) | ||||||||||
| Total distributions | (0.25 | ) | (0.29 | ) | (0.39 | ) | (0.42 | ) | (0.48 | ) | ||||||||||
| Net asset value, end of period | $ | 7.31 | $ | 7.17 | $ | 10.39 | $ | 10.15 | $ | 10.27 | ||||||||||
| Total return2 | 5.43 | % | (28.05 | )% | 6.34 | % | 2.99 | % | 7.13 | % | ||||||||||
| Ratios and Supplemental Data: | ||||||||||||||||||||
| Net assets, end of period (in thousands) | $ | 11,017 | $ | 34,785 | $ | 40,319 | $ | 19,620 | $ | 7,361 | ||||||||||
| Ratio of expenses to average net assets (including dividends and interest on securities sold short, extraordinary expenses and commitment fees): | ||||||||||||||||||||
| Before fees waived and expenses absorbed/recovered3 | 1.75 | % | 1.74 | % | 1.76 | % | 1.82 | % | 1.99 | % | ||||||||||
| After fees waived and expenses absorbed/recovered3 | 1.76 | % | 1.77 | % | 1.76 | % | 1.75 | % | 1.76 | % | ||||||||||
| Ratio of net investment income to average net assets (including dividends and interest on securities sold short, extraordinary expenses and commitment fees): | ||||||||||||||||||||
| Before fees waived and expenses absorbed/recovered | 3.31 | % | 4.07 | % | 3.78 | % | 3.87 | % | 3.78 | % | ||||||||||
| After fees waived and expenses absorbed/recovered | 3.30 | % | 4.04 | % | 3.78 | % | 3.94 | % | 4.01 | % | ||||||||||
| Portfolio turnover rate | 50 | % | 91 | % | 27 | % | 35 | % | 33 | % | ||||||||||
| 1 | Based on average shares outstanding for the period. |
| 2 | Total returns would have been higher/lower had expenses not been recovered/waived or absorbed by the Advisor. Returns shown include Rule 12b-1 fees of up to 0.25% and do not reflect the deduction of taxes that a shareholder would pay on Fund distributions or the redemption of Fund shares. Returns shown do not include payment of sales load of 4.25% of offering price which is waived on sales of $1 million or more. Returns do not include payment of Contingent Deferred Sales Charge ("CDSC") of 1.00% on certain redemptions of Class A shares made within 12 months of purchase. If the sales charge was included, total returns would be lower. |
| 3 | If commitment fees, and dividends and interest on securities sold short had been excluded, the expense ratios would have been lowered by 0.01% for the year ended December 31, 2021. For the prior years ended December 31, 2020, 2019, 2018, and 2017, the ratios would have been lowered by 0.02%, 0.01%, 0.00% and 0.01%, respectively. |
See accompanying Notes to Financial Statements.
20
Braddock Multi-Strategy Income Fund
FINANCIAL HIGHLIGHTS
Class C
Per share operating performance.
For a capital share outstanding throughout each period.
| For the Year Ended December 31, | ||||||||||||||||||||
| 2021 | 2020 | 2019 | 2018 | 2017 | ||||||||||||||||
| Net asset value, beginning of period | $ | 7.15 | $ | 10.36 | $ | 10.13 | $ | 10.25 | $ | 10.04 | ||||||||||
| Income from Investment Operations: | ||||||||||||||||||||
| Net investment income1 | 0.19 | 0.24 | 0.31 | 0.33 | 0.33 | |||||||||||||||
| Net realized and unrealized gain (loss) | 0.14 | (3.21 | ) | 0.24 | (0.10 | ) | 0.30 | |||||||||||||
| Total from investment operations | 0.33 | (2.97 | ) | 0.55 | 0.23 | 0.63 | ||||||||||||||
| Less Distributions: | ||||||||||||||||||||
| From net investment income | (0.19 | ) | (0.24 | ) | (0.32 | ) | (0.35 | ) | (0.42 | ) | ||||||||||
| Total distributions | (0.19 | ) | (0.24 | ) | (0.32 | ) | (0.35 | ) | (0.42 | ) | ||||||||||
| Net asset value, end of period | $ | 7.29 | $ | 7.15 | $ | 10.36 | $ | 10.13 | $ | 10.25 | ||||||||||
| Total return2 | 4.64 | % | (28.59 | )% | 5.49 | % | 2.26 | % | 6.38 | % | ||||||||||
| Ratios and Supplemental Data: | ||||||||||||||||||||
| Net assets, end of period (in thousands) | $ | 10,346 | $ | 14,675 | $ | 20,552 | $ | 9,833 | $ | 3,510 | ||||||||||
| Ratio of expenses to average net assets (including dividends and interest on securities sold short, extraordinary expenses and commitment fees): | ||||||||||||||||||||
| Before fees waived and expenses absorbed/recovered3 | 2.50 | % | 2.49 | % | 2.51 | % | 2.57 | % | 2.74 | % | ||||||||||
| After fees waived and expenses absorbed/recovered3 | 2.51 | % | 2.52 | % | 2.51 | % | 2.50 | % | 2.51 | % | ||||||||||
| Ratio of net investment income to average net assets (including dividends and interest on securities sold short, extraordinary expenses and commitment fees): | ||||||||||||||||||||
| Before fees waived and expenses absorbed/recovered | 2.56 | % | 3.32 | % | 3.03 | % | 3.12 | % | 3.03 | % | ||||||||||
| After fees waived and expenses absorbed/recovered | 2.55 | % | 3.29 | % | 3.03 | % | 3.19 | % | 3.26 | % | ||||||||||
| Portfolio turnover rate | 50 | % | 91 | % | 27 | % | 35 | % | 33 | % | ||||||||||
| 1 | Based on average shares outstanding for the period. |
| 2 | Total returns would have been higher/lower had expenses not been recovered/waived or absorbed by the Advisor. Returns shown include Rule 12b-1 fees of up to 1.00% and do not reflect the deduction of taxes that a shareholder would pay on Fund distributions or the redemption of Fund shares. Returns do not include payment of Contingent Deferred Sales Charge ("CDSC") of 1.00% on certain redemptions of Class C shares made within 12 months of purchase. If the sales charge was included, total returns would be lower. |
| 3 | If commitment fees, and dividends and interest on securities sold short had been excluded, the expense ratios would have been lowered by 0.01% for the year ended December 31, 2021. For the prior years ended December 31, 2020, 2019, 2018, and 2017, the ratios would have been lowered by 0.02%, 0.01%, 0.00% and 0.01%, respectively. |
See accompanying Notes to Financial Statements.
21
Braddock Multi-Strategy Income Fund
FINANCIAL HIGHLIGHTS
Institutional Class
Per share operating performance.
For a capital share outstanding throughout each period.
| For the Year Ended December 31, | ||||||||||||||||||||
| 2021 | 2020 | 2019 | 2018 | 2017 | ||||||||||||||||
| Net asset value, beginning of period | $ | 7.17 | $ | 10.40 | $ | 10.16 | $ | 10.28 | $ | 10.05 | ||||||||||
| Income from Investment Operations: | ||||||||||||||||||||
| Net investment income1 | 0.26 | 0.30 | 0.42 | 0.43 | 0.44 | |||||||||||||||
| Net realized and unrealized gain (loss) | 0.15 | (3.22 | ) | 0.24 | (0.10 | ) | 0.30 | |||||||||||||
| Total from investment operations | 0.41 | (2.92 | ) | 0.66 | 0.33 | 0.74 | ||||||||||||||
| Less Distributions: | ||||||||||||||||||||
| From net investment income | (0.27 | ) | (0.31 | ) | (0.42 | ) | (0.45 | ) | (0.51 | ) | ||||||||||
| Total distributions | (0.27 | ) | (0.31 | ) | (0.42 | ) | (0.45 | ) | (0.51 | ) | ||||||||||
| Net asset value, end of period | $ | 7.31 | $ | 7.17 | $ | 10.40 | $ | 10.16 | $ | 10.28 | ||||||||||
| Total return2 | 5.71 | % | (27.93 | )% | 6.60 | % | 3.24 | % | 7.50 | % | ||||||||||
| Ratios and Supplemental Data: | ||||||||||||||||||||
| Net assets, end of period (in thousands) | $ | 547,388 | $ | 754,817 | $ | 572,235 | $ | 306,520 | $ | 124,020 | ||||||||||
| Ratio of expenses to average net assets (including dividends and interest on securities sold short, extraordinary expenses and commitment fees): | ||||||||||||||||||||
| Before fees waived and expenses absorbed/recovered3 | 1.50 | % | 1.49 | % | 1.51 | % | 1.57 | % | 1.74 | % | ||||||||||
| After fees waived and expenses absorbed/recovered3 | 1.51 | % | 1.52 | % | 1.51 | % | 1.50 | % | 1.51 | % | ||||||||||
| Ratio of net investment income to average net assets (including dividends and interest on securities sold short, extraordinary expenses and commitment fees): | ||||||||||||||||||||
| Before fees waived and expenses absorbed/recovered | 3.56 | % | 4.32 | % | 4.03 | % | 4.12 | % | 4.03 | % | ||||||||||
| After fees waived and expenses absorbed/recovered | 3.55 | % | 4.29 | % | 4.03 | % | 4.19 | % | 4.26 | % | ||||||||||
| Portfolio turnover rate | 50 | % | 91 | % | 27 | % | 35 | % | 33 | % | ||||||||||
| 1 | Based on average shares outstanding for the period. |
| 2 | Total returns would have been higher/lower had expenses not been recovered/waived or absorbed by the Advisor. Returns shown do not reflect the deduction of taxes that a shareholder would pay on Fund distributions or the redemption of Fund shares. |
| 3 | If commitment fees, and dividends and interest on securities sold short had been excluded, the expense ratios would have been lowered by 0.01% for the year ended December 31, 2021. For the prior years ended December 31, 2020, 2019, 2018, and 2017, the ratios would have been lowered by 0.02%, 0.01%, 0.00% and 0.01%, respectively. |
See accompanying Notes to Financial Statements.
22
Braddock Multi-Strategy Income Fund
NOTES TO FINANCIAL STATEMENTS
December 31, 2021
Note 1 – Organization
The Braddock Multi-Strategy Income Fund (the ‘‘Fund’’) was organized as a non-diversified series of Investment Managers Series Trust, a Delaware statutory trust (the “Trust”) which is registered as an open-end management investment company under the Investment Company Act of 1940, as amended (the “1940 Act”). The Fund seeks total return with an emphasis on providing current income. The Fund currently offers four classes of shares: A shares, C shares, T shares, and Institutional shares. Class T shares are not currently available for purchase.
The Fund commenced investment operations on December 31, 2015, with Class A, Class C, and Institutional Class shares, prior to which its only activity was the receipt of a $10,000 investment from principals of the Fund’s advisor and a $49,561,285 transfer of shares of the Fund in exchange for the net assets of the Braddock Structured Opportunities Fund Series A, LP, a Delaware limited partnership (the “Company”). This exchange was nontaxable, whereby the Fund’s Institutional Class issued 4,933,206 shares for the net assets of the Company on December 31, 2015. Assets with a fair market value of $49,561,285 consisting of cash, interest receivable and securities of the Company with a fair value of $46,984,053 (identified costs of investments transferred were $44,433,272) and cash were the primary assets received by the Fund on January 1, 2016. For financial reporting purposes, assets received and shares issued by the Fund were recorded at fair value; however, the cost basis of the investments received from the Partnership was carried forward to align ongoing reporting of the Fund’s realized and unrealized gains and losses with amount distributable to shareholders for tax purposes.
The shares of each class represent an interest in the same portfolio of investments of the Fund and have equal rights as to voting, redemptions, dividends and liquidation, subject to the approval of the Trustees. Income, expenses (other than expenses attributable to a specific class) and realized and unrealized gains and losses on investments are allocated to each class of shares in proportion to their relative net assets. Shareholders of a class that bears distribution and service expenses under the terms of a distribution plan have exclusive voting rights to that distribution plan.
The Fund is an investment company and accordingly follows the investment company accounting and reporting guidance of the Financial Accounting Standards Board (FASB) Accounting Standard Codification, Financial Services – Investment Companies”, Topic 946 (ASC 946).
Note 2 – Accounting Policies
The following is a summary of the significant accounting policies consistently followed by the Fund in the preparation of its financial statements. The preparation of financial statements in conformity with accounting principles generally accepted in the United States of America (“GAAP”) requires management to make estimates and assumptions that affect the reported amounts and disclosures in the financial statements. Actual results could differ from these estimates.
(a) Valuation of Investments
The Fund values equity securities at the last reported sale price on the principal exchange or in the principal over the counter (“OTC”) market in which such securities are traded, as of the close of regular trading on the NYSE on the day the securities are being valued or, if there are no sales, at the mean between the last available bid and asked prices on that day. Securities traded on the NASDAQ are valued at the NASDAQ Official Closing Price (“NOCP”). Investments in open-end investment companies are valued at the daily closing net asset value of the respective investment company. Debt securities are valued by utilizing a price supplied by independent pricing service providers. The independent pricing service providers may use various valuation methodologies including matrix pricing and other analytical pricing models as well as market transactions and dealer quotations. These models generally consider such factors as yields or prices of bonds of comparable quality, type of issue, coupon, maturity, ratings and general market conditions. If a price is not readily available for a portfolio security, the security will be valued at fair value (the amount which the Fund might reasonably expect to receive for the security upon its current sale) as determined in good faith by the Fund’s sub-advisor, subject to review and approval by the Valuation Committee, pursuant to procedures adopted by the Board of Trustees. The actions of the Valuation Committee are subsequently reviewed by the Board at its next regularly scheduled board meeting. The Valuation Committee meets as needed. The Valuation Committee is comprised of all the Trustees, but action may be taken by any one of the Trustees.
23
Braddock Multi-Strategy Income Fund
NOTES TO FINANCIAL STATEMENTS – Continued
December 31, 2021
Trading in securities on many foreign securities exchanges and OTC markets is normally completed before the close of business on each U.S. business day. In addition, securities trading in a particular country or countries may not take place on all U.S. business days or may take place on days which are not U.S. business days. Changes in valuations on certain securities may occur at times or on days on which the Fund’s net asset values (“NAV”) are not calculated and on which the Fund does not affect sales and redemptions of its shares.
(b) Asset-Backed Securities
Asset-backed securities include pools of mortgages, loans, receivables or other assets. Payment of principal and interest may be largely dependent upon the cash flows generated by the assets backing the securities, and, in certain cases, supported by letters of credit, surety bonds, or other credit enhancements. The value of asset-backed securities may also be affected by the creditworthiness of the servicing agent for the pool, the originator of the loans or receivables, or the financial institution(s) providing the credit support. In addition, asset-backed securities are not backed by any governmental agency.
Collateralized Debt Obligations (“CDOs”) include Collateralized Bond Obligations (“CBOs”), Collateralized Loan Obligations (“CLOs”) and other similarly structured securities. CBOs and CLOs are types of asset backed securities. A CBO is a trust which is backed by a diversified pool of high risk, below investment grade fixed income securities. A CLO is a trust typically collateralized by a pool of loans, which may include, among others, domestic and foreign senior secured loans, senior unsecured loans, and subordinate corporate loans, including loans that may be rated below investment grade or equivalent unrated loans. The risks of an investment in a CDO depend largely on the type of the collateral securities and the class of the CDO in which a Fund invests. CDOs carry additional risks including, but not limited to, (i) the possibility that distributions from collateral securities will not be adequate to make interest or other payments, (ii) the collateral may decline in value or default, (iii) a Fund may invest in CDOs that are subordinate to other classes, and (iv) the complex structure of the security may not be fully understood at the time of investment and may produce disputes with the issuer or unexpected investment results.
(c) Short Sales
The Fund may sell securities short. Short sales are transactions under which the Fund sells a security it does not own in anticipation of a decline in the value of that security. To complete such a transaction, the Fund must borrow the security to make delivery to the buyer. The Fund then is obligated to replace the security borrowed by purchasing the security at market price at the time of replacement. The price at such time may be more or less than the price at which the security was sold by the Fund. When a security is sold short a decrease in the value of the security will be recognized as a gain and an increase in the value of the security will be recognized as a loss, which is potentially limitless. Until the security is replaced, the Fund is required to pay the lender amounts equal to dividend or interest that accrue during the period of the loan which is recorded as an expense. To borrow the security, the Fund also may be required to pay a premium or an interest fee, which are recorded as interest expense. Cash or securities are segregated for the broker to meet the necessary margin requirements. The Fund is subject to the risk that it may not always be able to close out a short position at a particular time or at an acceptable price.
24
Braddock Multi-Strategy Income Fund
NOTES TO FINANCIAL STATEMENTS – Continued
December 31, 2021
(d) Investment Transactions, Investment Income and Expenses
Investment transactions are accounted for on the trade date. Realized gains and losses on investments are determined on the identified cost basis. Dividend income is recorded net of applicable withholding taxes on the ex-dividend date and interest income is recorded on an accrual basis. Withholding taxes on foreign dividends, if applicable, are paid (a portion of which may be reclaimable) or provided for in accordance with the applicable country’s tax rules and rates and are disclosed in the Statement of Operations. Withholding tax reclaims are filed in certain countries to recover a portion of the amounts previously withheld. The Fund records a reclaim receivable based on a number of factors, including a jurisdiction’s legal obligation to pay reclaims as well as payment history and market convention. Discounts on debt securities are accreted or amortized to interest income over the lives of the respective securities using the effective interest method. Premiums for callable debt securities are amortized to the earliest call date, if the call price was less than the purchase price. If the call price was not at par and the security was not called, the security is amortized to the next call price and date. Income and expenses of the Fund is allocated on a pro rata basis to each class of shares relative net assets, except for distribution and service fees which are unique to each class of shares. Expenses incurred by the Trust with respect to more than one fund are allocated in proportion to the net assets of each fund except where allocation of direct expenses to each fund or an alternative allocation method can be more appropriately made.
(e) Reverse Repurchase Agreements
The Fund may enter into “reverse” repurchase agreements to seek to enhance the portfolio’s return. Pursuant to a reverse repurchase agreement, the Fund will sell portfolio securities and agree to repurchase them from the buyer at a particular date and price. When the Fund enters into a reverse repurchase agreement, it will establish a segregated account in which it will maintain liquid assets in an amount at least equal to the repurchase price marked to market daily (including accrued interest), and will subsequently monitor the account to ensure that such equivalent value is maintained. The Fund pays interest on amounts obtained pursuant to reverse repurchase agreements. Reverse repurchase agreements are considered to be borrowings by the Fund. Similar to borrowing, reverse repurchase agreements provide the Fund with cash for investment purposes, which creates leverage and subjects the Fund to the risks of leverage. Reverse repurchase agreements also involve the risk that the other party may fail to return the securities in a timely manner or at all. The Fund could lose money if it is unable to recover the securities and the value of collateral held by the Fund, including the value of the investments made with cash collateral, is less than the value of securities. Reverse repurchase agreements also create Fund expenses and require that the Fund have sufficient cash available to purchase the debt obligations when required. Reverse repurchase agreements also involve the risk that the market value of the debt obligation that is the subject of the reverse repurchase agreement could decline significantly below the price at which the Fund is obligated to repurchase the security.
(f) Federal Income Taxes
The Fund intends to comply with the requirements of Subchapter M of the Internal Revenue Code applicable to regulated investment companies and to distribute substantially all of its net investment income and any net realized gains to its shareholders. Therefore, no provision is made for federal income or excise taxes. Due to the timing of dividend distributions and the differences in accounting for income and realized gains and losses for financial statement and federal income tax purposes, the fiscal year in which amounts are distributed may differ from the year in which the income and realized gains and losses are recorded by the Fund.
FASB Accounting Standard Codification “Accounting for Uncertainty in Income Taxes”, Topic 740 (ASC 740) requires an evaluation of tax positions taken (or expected to be taken) in the course of preparing a Fund’s tax returns to determine whether these positions meet a “more-likely-than-not” standard that, based on the technical merits, have a more than fifty percent likelihood of being sustained by a taxing authority upon examination. A tax position that meets the “more-likely-than-not” recognition threshold is measured to determine the amount of benefit to recognize in the financial statements. The Fund recognizes interest and penalties, if any, related to unrecognized tax benefits as income tax expense in the Statement of Operations.
25
Braddock Multi-Strategy Income Fund
NOTES TO FINANCIAL STATEMENTS – Continued
December 31, 2021
ASC 740 requires management of the Fund to analyze tax positions taken in the prior three open tax years, if any, and tax positions expected to be taken in the Fund’s current tax year, as defined by the IRS statute of limitations for all major jurisdictions, including federal tax authorities and certain state tax authorities. As of and during the open tax periods ended December 31, 2018-2021, the Fund did not have a liability for any unrecognized tax benefits. The Fund has no examination in progress and is not aware of any tax positions for which it is reasonably possible that the total amounts of unrecognized tax benefits will significantly change in the next twelve months.
(g) Distributions to Shareholders
The Fund will make dividend distributions of net investment income, if any, monthly and net capital gains distributions, if any, at least annually, typically in December. The Fund may make an additional payment of dividends or distributions if it deems it desirable at any other time during the year. Distributions to shareholders are recorded on the ex-dividend date. The amount and timing of distributions are determined in accordance with federal income tax regulations, which may differ from GAAP.
The character of distributions made during the year from net investment income or net realized gains may differ from the characterization for federal income tax purposes due to differences in the recognition of income, expense and gain (loss) items for financial statement and tax purposes.
(h) Illiquid Securities
Pursuant to Rule 22e-4 under the 1940 Act, the Fund has adopted a Liquidity Risk Management Program (“LRMP”) that requires, among other things, that the Fund limits its illiquid investments that are assets to no more than 15% of net assets. An illiquid investment is any security which may not reasonably be expected to be sold or disposed of in current market conditions in seven calendar days or less without the sale or disposition significantly changing the market value of the investment. If the Advisor, at any time, determines that the value of illiquid securities held by the Fund exceeds 15% of its net asset value, the Advisor will take such steps as it considers appropriate to reduce them as soon as reasonably practicable in accordance with the Fund’s written LRMP.
(i) Use of Estimates
The presentation of financial statements in conformity with GAAP requires management to make estimates and assumptions that affect the reported amounts of assets and liabilities at the date of the financial statements and the reported amounts of income and expenses during the reporting period. Actual results could differ from those estimates.
(j) LIBOR Risk
Certain of the Fund’s investments, payment obligations and financing terms may be based on floating rates, such as LIBOR, Euro Interbank Offered Rate and other similar types of reference rates (each, a “Reference Rate”). On July 27, 2017, the Chief Executive of the UK Financial Conduct Authority (“FCA”), which regulates LIBOR, announced that the FCA will no longer persuade nor compel banks to submit rates for the calculation of LIBOR and certain other Reference Rates after 2021. Such announcement indicates that the continuation of LIBOR and other Reference Rates on the current basis cannot and will not be guaranteed after 2021. The transition away from Reference Rates may lead to increased volatility and illiquidity in markets that are tied to such Reference Rates and reduced values of Reference Rate-related instruments. This announcement and any additional regulatory or market changes that occur as a result of the transition away from Reference Rates may have an adverse impact on a Fund’s investments, performance or financial condition.
26
Braddock Multi-Strategy Income Fund
NOTES TO FINANCIAL STATEMENTS – Continued
December 31, 2021
Note 3 – Investment Advisory and Other Agreements
The Trust, on behalf of the Fund, entered into an Investment Advisory Agreement (the “Agreement”) with Liberty Street Advisors, Inc. (the “Advisor”). Under the terms of the Agreement, the Fund pays a monthly investment advisory fee to the Advisor at the annual rate of 1.25% of the Fund’s average daily net assets. The Advisor engages Braddock Financial LLC (the “Sub-Advisor”) to manage the Fund and pays the Sub-Advisor from its advisory fees.
The Advisor has contractually agreed to waive its fees and/or pay for operating expenses of the Fund to ensure that total annual fund operating expenses (excluding any front-end or contingent deferred loads, taxes, leverage interest, brokerage commissions, acquired fund fees and expenses (as determined in accordance with Form N-1A), expenses incurred in connection with any merger or reorganization and extraordinary expenses such as litigation expenses) do not exceed 1.75%, 2.50% and 1.50% of the Fund's average daily net assets for Class A, Class C, and Institutional Class shares, respectively. This agreement is in effect until April 30, 2022, and it may be terminated before that date only by the Trust’s Board of Trustees.
For the year ended December 31, 2021, the Advisor recovered $65,672 of its previously waived advisory fees. The Advisor may recover from the Fund fees and/or expenses previously waived and/or absorbed, if the Fund’s expense ratio, including the recovered expenses, falls below the expense limit at which they were waived. The Fund’s advisor is permitted to seek reimbursement from the Fund, subject to certain limitations, of fees waived or payments made to the Fund for a period ending three full fiscal years after the date of the waiver or payment. This reimbursement may be requested from the Fund if the reimbursement will not cause the Fund’s annual expense ratio to exceed the lesser of (a) the expense limitation amount in effect at the time such fees were waived or payments made, or (b) the expense limitation amount in effect at the time of the reimbursement. There were no recoverable expenses as of December 31, 2021.
For the year ended December 31, 2021, the Fund incurred extraordinary expenses of $15,000 in professional fees related to efforts to enhance its investments in certain mortgage backed securities.
UMB Fund Services, Inc. (“UMBFS”) serves as the Fund’s fund accountant, transfer agent and co-administrator; and Mutual Fund Administration, LLC (“MFAC”) serves as the Fund’s other co-administrator. UMB Bank, n.a., an affiliate of UMBFS, serves as the Fund’s custodian. The Fund’s allocated fees incurred for fund accounting, fund administration, transfer agency and custody services for the year ended December 31, 2021, are reported on the Statement of Operations as Fund services fees.
Foreside Fund Services, LLC serves as the Fund’s distributor (the “Distributor”). The Distributor does not receive compensation from the Fund for its distribution services; the Advisor pays the Distributor a fee for its distribution-related services.
Certain trustees and officers of the Trust are employees of UMBFS or MFAC. The Fund does not compensate trustees and officers affiliated with the Fund’s co-administrators. For the year ended December 31, 2021, the Fund’s allocated fees incurred to Trustees who are not affiliated with the Fund’s co-administrators are reported on the Statement of Operations.
The Fund’s Board of Trustees has adopted a Deferred Compensation Plan (the “Plan”) for the Independent Trustees that enables Trustees to elect to receive payment in cash or the option to select various fund(s) in the Trust in which their deferred accounts shall be deemed to be invested. If a trustee elects to defer payment, the Plan provides for the creation of a deferred payment account. The Fund’s liability for these amounts is adjusted for market value changes in the invested fund(s) and remains a liability to the Fund until distributed in accordance with the Plan. The Trustees Deferred compensation liability under the Plan constitutes a general unsecured obligation of the Fund and is disclosed in the Statement of Assets and Liabilities. Contributions made under the plan and the change in unrealized appreciation/depreciation and income are included in the Trustees’ fees and expenses in the Statement of Operations.
27
Braddock Multi-Strategy Income Fund
NOTES TO FINANCIAL STATEMENTS – Continued
December 31, 2021
Dziura Compliance Consulting, LLC provides Chief Compliance Officer (“CCO”) services to the Trust. The Fund’s allocated fees incurred for CCO services for the year ended December 31, 2021, are reported on the Statement of Operations.
Note 4 – Federal Income Taxes
At December 31, 2021, the cost of securities on a tax basis and gross unrealized appreciation and depreciation of investments for federal income tax purposes were as follows:
| Cost of investments | $ | 555,868,231 | ||
| Gross unrealized appreciation | $ | 20,989,280 | ||
| Gross unrealized depreciation | (6,728,411 | ) | ||
| Net unrealized appreciation on investments and securities sold short | $ | 14,260,869 |
GAAP requires that certain components of net assets be reclassified between financial and tax reporting. These reclassifications have no effect on net assets or net asset value per share. For the year ended December 31, 2021, permanent differences in book and tax accounting have been reclassified to paid-in capital and total distributable earnings (loss) as follows:
| Increase (Decrease) | |||||
| Paid-in Capital | Total Distributable Earnings (Loss) | ||||
| $1,141 | $(1,141) | ||||
As of December 31, 2021, the components of accumulated earnings (deficit) on a tax basis were as follows:
| Undistributed ordinary income | $ | 132,384 | ||
| Undistributed long-term capital gains | - | |||
| Tax accumulated earnings | 132,384 | |||
| Accumulated capital and other losses | (21,466,155 | ) | ||
| Unrealized appreciation on investments | 14,260,869 | |||
| Unrealized Deferred Compensation | (9,462 | ) | ||
| Total accumulated deficit | $ | (7,082,364 | ) |
As of December 31, 2021, the Fund had net capital loss carryovers as follows:
| Not subject to expiration: | ||||
| Short Term | $ | - | ||
| Long Term | 21,466,155 | |||
| Total | $ | 21,466,155 | ||
28
Braddock Multi-Strategy Income Fund
NOTES TO FINANCIAL STATEMENTS – Continued
December 31, 2021
To the extent that a fund may realize future net capital gains, those gains will be offset by any of its unused capital loss carryforward. Future capital loss carryover utilization in any given year may be subject to Internal Revenue Code limitations.
The tax character of the distributions paid during the fiscal years ended December 31, 2021 and December 31, 2020 were as follows:
| Distributions paid from: | 2021 | 2020 | ||||||
| Ordinary income | $ | 24,794,446 | $ | 33,645,149 | ||||
| Net long-term capital gains | - | - | ||||||
| Total distributions paid | $ | 24,794,446 | $ | 33,645,149 | ||||
Note 5 – Investment Transactions
For the year ended December 31, 2021, purchases and sales of investments, excluding short-term investments, were as follows:
| Purchases | Sales | Securities sold short | Cover short securities | |||||||||||
| $ | 327,883,596 | $ | 590,703,047 | $ | 8,029,552 | $ | 8,419,024 | |||||||
Note 6 – Distribution Plan
The Trust, on behalf of the Fund, has adopted a Distribution Plan (the “Plan”) pursuant to Rule 12b-1 under the 1940 Act, that allows the Fund to pay distribution fees for the sale and distribution of its Class A and Class C shares. For Class A shares, the maximum annual fee payable to the Distributor for such distribution and/or shareholder liaison services is 0.25% of the average daily net assets of such shares. For Class C shares, the maximum annual fees payable to the Distributor for distribution services and shareholder liaison services are 0.75% and 0.25%, respectively, of the average daily net assets of such shares. The Institutional Class does not pay any distribution fees.
For the year ended December 31, 2021, distribution fees incurred are disclosed on the Statement of Operations.
The Advisor’s affiliated broker-dealer, HRC Fund Associates, LLC (“HRC”), Member FINRA/SIPC, markets the Fund shares to financial intermediaries pursuant to a marketing agreement with the Advisor. The marketing agreement between the Advisor and HRC is not part of the Plan. The Advisor pays HRC out of its own resources and without additional cost to the Fund or its shareholders.
Note 7 – Shareholder Servicing Plan
The Trust, on behalf of the Fund, has adopted a Shareholder Servicing Plan to pay a fee at an annual rate of up to 0.15% of the Fund’s average daily net assets of its shares serviced by shareholder servicing agents who provide administrative and support services to their customers.
For the year ended December 31, 2021, shareholder servicing fees incurred are disclosed on the Statement of Operations.
Note 8 – Indemnifications
In the normal course of business, the Fund enters into contracts that contain a variety of representations which provide general indemnifications. The Fund’s maximum exposure under these arrangements is unknown, as this would involve future claims that may be made against the Fund’s that have not yet occurred. However, the Fund expects the risk of loss to be remote.
29
Braddock Multi-Strategy Income Fund
NOTES TO FINANCIAL STATEMENTS – Continued
December 31, 2021
Note 9 – Fair Value Measurements and Disclosure
FASB Accounting Standard Codification, “Fair Value Measurements and Disclosures”, Topic 820 (ASC 820) defines fair value, establishes a framework for measuring fair value in accordance with GAAP, and expands disclosure about fair value measurements. It also provides guidance on determining when there has been a significant decrease in the volume and level of activity for an asset or a liability, when a transaction is not orderly, and how that information must be incorporated into a fair value measurement.
Under ASC 820, various inputs are used in determining the value of the Fund’s investments. These inputs are summarized into three broad Levels as described below:
| ● | Level 1 – Unadjusted quoted prices in active markets for identical assets or liabilities that the Fund has the ability to access. |
| ● | Level 2 – Observable inputs other than quoted prices included in Level 1 that are observable for the asset or liability, either directly or indirectly. These inputs may include quoted prices for the identical instrument on an inactive market, prices for similar instruments, interest rates, prepayment speeds, credit risk, yield curves, default rates and similar data. |
| ● | Level 3 – Unobservable inputs for the asset or liability, to the extent relevant observable inputs are not available, representing the Fund’s own assumptions about the assumptions a market participant would use in valuing the asset or liability, and would be based on the best information available. |
The availability of observable inputs can vary from security to security and is affected by a wide variety of factors, including for example, the type of security, whether the security is new and not yet established in the marketplace, the liquidity of markets, and other characteristics particular to the security. To the extent that valuation is based on models or inputs that are less observable or unobservable in the market, the determination of fair value requires more judgment. Accordingly, the degree of judgment exercised in determining fair value is greatest for instruments categorized in Level 3.
The inputs to measure fair value may fall into different Levels of the fair value hierarchy. In such cases, for disclosure purposes, the Level in the fair value hierarchy within which the fair value measurement falls in its entirety, is determined based on the lowest Level input that is significant to the fair value measurement in its entirety.
30
Braddock Multi-Strategy Income Fund
NOTES TO FINANCIAL STATEMENTS – Continued
December 31, 2021
The inputs or methodology used for valuing securities are not an indication of the risk associated with investing in those securities. The following is a summary of the inputs used, as of December 31, 2021, in valuing the Fund’s assets and liabilities carried at fair value:
| Level 1 | Level 2 | Level 3 | Total | |||||||||||||
| Assets | ||||||||||||||||
| Investments | ||||||||||||||||
| Asset-Backed Securities* | $ | - | $ | 441,289,899 | $ | 17,210,708 | $ | 458,500,607 | ||||||||
| Collateralized Mortgage Obligations | - | 71,149,596 | 7,372,749 | 78,522,345 | ||||||||||||
| Corporate Bonds* | - | - | 0 | 0 | ||||||||||||
| Short-Term Investments | 33,106,148 | - | - | 33,106,148 | ||||||||||||
| Total Assets | $ | 33,106,148 | $ | 512,439,495 | $ | 24,583,457 | $ | 570,129,100 | ||||||||
| * | The Fund held a Level 3 security valued at zero at period end. |
The following is a reconciliation of assets in which significant unobservable inputs (Level 3) were used in determining value:
| Collateralized | ||||||||||||
| Asset-Backed | Mortgage | Corporate | ||||||||||
| Securities | Obligations | Bonds | ||||||||||
| Balance as of December 31, 2020 | $ | 52,245,835 | $ | 16,850,080 | $ | 0 | ||||||
| Transfers into Level 3(1) | 3,708,058 | - | - | |||||||||
| Transfers out of Level 3(2) | (9,326,249 | ) | - | - | ||||||||
| Total gains or losses for the period | ||||||||||||
| Included in earnings (or changes in net assets) | 896,309 | (37,853 | ) | - | ||||||||
| Included in other comprehensive income | - | - | - | |||||||||
| Net purchases | 18,205,669 | 2,314,522 | - | |||||||||
| Net sales | (48,518,914 | ) | (11,754,000 | ) | - | |||||||
| Balance as of December 31, 2021 | $ | 17,210,708 | $ | 7,372,749 | $ | 0 | ||||||
| Change in unrealized gains or losses for the period included in earnings (or changes in net assets) for assets held at the end of the reporting period | $ | 463,341 | $ | (56,903 | ) | - | ||||||
| (1) | Transferred from Level 2 to Level 3 because of a lack of observable market data, resulting from a decrease in market activity for the securities. |
| (2) | Transferred from Level 3 to Level 2 because observable market data became available for the securities. |
31
Braddock Multi-Strategy Income Fund
NOTES TO FINANCIAL STATEMENTS – Continued
December 31, 2021
The following table presents additional quantitative information about valuation methodologies and inputs used for investments that are measured at fair value and categorized within Level 3 as of December 31, 2021:
| Asset Class | Fair Value at 12/31/2021 | Valuation Technique(s) | Unobservable Input(1) | Range of Input | Weighted Average of Input | Impact to Valuation from an Increase in Input(2) | |
| Asset-Backed Securities | $17,210,708 | Market Approach | Indicative Dealer Quotes | $99.33 | $107.51 | $101.64 | Increase |
| Asset Approach | Estimated Recovery Proceeds | $0.00 | N/A | Increase | |||
| Collateralized Mortgage Obligations | $7,372,749 | Market Approach | Indicative Dealer Quotes | $99.94 | $100.01 | $99.97 | Increase |
| Corporate Bonds | $ 0 | Asset Approach | Estimated Recovery Proceeds | $0.00 | N/A | Increase | |
| (1) | The investment sub-advisor considers relevant indications of value that are reasonably and timely available to it in determining the fair value to be assigned to a particular security, such as the type and cost of the security; contractual or legal restrictions on resale of the security; relevant financial or business developments of the issuer; actively traded related securities; conversion or exchange rights on the security; related corporate actions; significant events occurring after the close of trading in the security; and changes in overall market conditions. The Fund’s use of fair value pricing may cause the net asset value of Fund shares to differ from the net asset value that would be calculated using market quotations. Fair value pricing involves subjective judgments and it is possible that the fair value determined for a security may be materially different than the value that could be realized upon the sale of that security. |
| (2) | This column represents the directional change in the fair value of the Level 3 investments that would result from an increase to the corresponding unobservable input. A decrease to the unobservable input would have the opposite effect. |
Note 10 – Derivative and Hedging Disclosure
The Fund has adopted the disclosure provisions of FASB Standard Codification 815, Derivatives and Hedging, which requires enhanced disclosures about the Fund’s derivative and hedging activities, including how such activities are accounted for and their effects on the Fund’s financial position, performance and cash flows.
For either investment or hedging purposes, the Fund may invest substantially in a broad range of derivative instruments, including structured products, swaps (including credit default swaps), futures and forward contracts, and options. Such derivatives may trade over-the-counter or on an exchange and may principally be used for one or more of the following purposes: speculation, currency hedging, duration management, or to pursue the Fund’s investment objective. The Fund’s derivative investments have risks, including the imperfect correlation between the value of such instruments and the underlying asset, rate or index, which creates the possibility that the loss on such instruments may be greater than the gain in the value of the underlying asset, rate or index; the loss of principal; the possible default of the other party to the transaction; and illiquidity of the derivative investments. The Fund invested in options contracts during the year ended December 31, 2021, which did not have a material impact on the Fund’s performance.
32
Braddock Multi-Strategy Income Fund
NOTES TO FINANCIAL STATEMENTS – Continued
December 31, 2021
The effects of these derivative instruments on the Fund’s financial position and financial performance as reflected on the Statement of Operations for the year ended December 31, 2021 are as follows:
| Amount of Realized Gain or (Loss) on Derivatives Recognized in Income | ||||
| Derivatives not designated as hedging instruments | Purchased Options Contracts | |||
| Equity price risk | $ | (365,166 | ) | |
| Total | $ | (365,166 | ) | |
Change in Unrealized Appreciation/Depreciation on Derivatives Recognized in Income | ||||
| Derivatives not designated as hedging instruments | Purchased Options Contracts | |||
| Equity price risk | $ | 343,026 | ||
| Total | $ | 343,026 | ||
The quarterly average volumes of derivative instruments as of December 31, 2021 are as follows:
| Derivative | Quarterly Average | Amount | ||||||
| Options Contracts - Purchased | Average Notional Value | $ | 2,052,000 | |||||
Note 11 – Callable Bond Proceeds
On November 25, 2019, Wells Fargo Bank, N.A. (Wells Fargo), the trustee for Wells Fargo Mortgage Backed Securities Trust, Series 2004-H, Class A-2 (CUSIP 94979TAB2) issued a call notice that funds received from this security will be withheld to establish a reserve account to meet its current and future expenses for litigation costs and potential judgements resulting from claims against Wells Fargo. Wells Fargo stated in its letter to certificate holders that this amount will be held for an unknown amount of time and any unused funds in reserve will be paid to certificate holders when Wells Fargo determines that such funds are no longer necessary to be held. The Fund expects payment to be received within the next three years and the estimated proceeds to be received from the callable bond is reported on the Statement of Assets and Liabilities.
Note 12 – Line of Credit
The Fund together with Robinson Tax Advantaged Income Fund and Robinson Opportunistic Income Fund managed by the Advisor (together “Liberty Street Funds”) has entered into a Senior Secured Revolving Credit Facility (“Facility”) of $25,000,000 (committed) and $25,000,000 (uncommitted) with UMB Bank, n.a. The Fund is permitted to borrow up to the lesser of 20.00% of its adjusted net assets with the cap limit of $25,000,000, or the maximum amount permitted subject to the Fund’s investment limitations. The purpose of the Facility is to finance temporarily the repurchase or redemption of shares of each fund. Borrowings under this agreement bear interest at the one-month London Interbank Offered Rate (LIBOR) plus 2.00%. As compensation for holding the lending commitment available, the Liberty Street Funds are charged a commitment fee on the average daily unused balance of the Facility at the rate of 0.20% per annum. Commitment fees for the year ended December 31, 2021 are disclosed in the Statement of Operations. The Fund did not borrow under the line of credit agreement during the year ended December 31, 2021.
33
Braddock Multi-Strategy Income Fund
NOTES TO FINANCIAL STATEMENTS – Continued
December 31, 2021
Note 13 – ReFlow liquidity program
The Fund may participate in the ReFlow Fund, LLC (“ReFlow”) liquidity program, which is designed to provide an alternative liquidity source for mutual funds experiencing redemptions of their shares. In order to pay cash to shareholders who redeem their shares on a given day, a mutual fund typically must hold cash in its portfolio, liquidate portfolio securities, or borrow money, all of which impose certain costs on the fund. ReFlow provides participating mutual funds with another source of cash by standing ready to purchase shares from the fund equal to the amount of the fund’s net redemptions on a given day. ReFlow will purchase Institutional Class Shares of the Fund at net asset value and will not be subject to any investment minimum applicable to such shares. ReFlow is prohibited from acquiring more than 3% of the outstanding voting securities of the Fund. ReFlow will periodically redeem its entire share position in the Fund. For use of the ReFlow service, the Fund will pay a fee to ReFlow at a rate determined by a daily auction with other participating mutual funds. During the year ended December 31, 2021, ReFlow was not utilized by the Fund.
Note 14 – COVID-19 Risks
In early 2020, an outbreak of a novel strain of coronavirus (COVID-19) emerged globally. This coronavirus has resulted in closing international borders, enhanced health screenings, healthcare service preparation and delivery, quarantines, cancellations, disruptions to supply chains and customer activity, as well as general public concern and uncertainty. The impact of this outbreak has negatively affected the worldwide economy, as well as the economies of individual countries, the financial health of individual companies and the market in general in significant and unforeseen ways. The future impact of COVID-19 is currently unknown, and it may exacerbate other risks that apply to the Fund, including political, social and economic risks. Any such impact could adversely affect the Fund’s performance, the performance of the securities in which the Fund invest and may lead to losses on your investment in the Fund. The ultimate impact of COVID-19 on the financial performance of the Fund’s investments is not reasonably estimable at this time.
Note 15 - Recently Issued Accounting Pronouncements
In October 2020, the SEC adopted new regulations governing the use of derivatives by registered investment companies (“Rule 18f-4”). Rule 18f-4 will impose limits on the amount of derivatives a Fund can enter into, eliminate the asset segregation framework currently used by funds to comply with Section 18 of the 1940 Act, and require funds whose use of derivatives is greater than a limited specified amount to establish and maintain a comprehensive derivatives risk management program and appoint a derivatives risk manager. Funds will be required to comply with Rule 18f-4 by August 19, 2022. It is not currently clear what impact, if any, Rule 18f-4 will have on the availability, liquidity or performance of derivatives. Management is currently evaluating the potential impact of Rule 18f-4 on the Fund(s). When fully implemented, Rule 18f-4 may require changes in how a Fund uses derivatives, adversely affect the Fund’s performance and increase costs related to the Fund’s use of derivatives.
In December 2020, the SEC adopted a new rule providing a framework for fund valuation practices (“Rule 2a-5”). Rule 2a-5 establishes requirements for determining fair value in good faith for purposes of the 1940 Act. Rule 2a-5 will permit fund boards to designate certain parties to perform fair value determinations, subject to board oversight and certain other conditions. Rule 2a-5 also defines when market quotations are “readily available” for purposes of the 1940 Act and the threshold for determining whether a fund must fair value a security. In connection with Rule 2a-5, the SEC also adopted related recordkeeping requirements and is rescinding previously issued guidance, including with respect to the role of a board in determining fair value and the accounting and auditing of fund investments. The Fund will be required to comply with the rules by September 8, 2022. Management is currently assessing the potential impact of the new rules on the Fund’s financial statements.
The SEC adopted new Rule 12d1-4, which will allow registered investment companies (including business development companies (“BDCs”), unit investment trusts (“UITs”), closed-end funds, exchange-traded funds (“ETFs”), and exchange-traded managed funds (“ETMFs”) (an “acquiring” fund), to invest in other investment companies (an “acquired fund”), including private funds under a specific exception, beyond the limits of Section 12(d)(1), subject to the conditions of the rule. Rule 12d1-4 became effective January 19, 2021. Funds electing to rely on Rule 12d1-4 will have to comply with the rules by January 19, 2022.
34
Braddock Multi-Strategy Income Fund
NOTES TO FINANCIAL STATEMENTS – Continued
December 31, 2021
In March 2020, FASB issued ASU 2020-04, Reference Rate Reform: Facilitation of the Effects of Reference Rate Reform on Financial Reporting. The main objective of the new guidance is to provide relief to companies that will be impacted by the expected change in benchmark interest rates at the end of 2021, when participating banks will no longer be required to submit London Interbank Offered Rate (“LIBOR”) quotes by the UK Financial Conduct Authority. The new guidance allows companies to, provided the only change to existing contracts are a change to an approved benchmark interest rate, account for modifications as a continuance of the existing contract without additional analysis. In addition, derivative contracts that qualified for hedge accounting prior to modification, will be allowed to continue to receive such treatment, even if critical terms change due to a change in the benchmark interest rate. For new and existing contracts, the Fund may elect to apply the amendments as of March 12, 2020 through December 31, 2022. Management is currently assessing the impact of the ASU’s adoption to the Fund’s financial statements and various filings.
Note 16 – Events Subsequent to the Fiscal Period End
The Fund has adopted financial reporting rules regarding subsequent events which require an entity to recognize in the financial statements the effects of all subsequent events that provide additional evidence about conditions that existed at the date of the balance sheet. Management has evaluated the Fund’s related events and transactions that occurred through the date of issuance of the Fund’s financial statements.
There were no events or transactions that occurred during this period that materially impacted the amounts or disclosures in the Fund’s financial statements.
35
REPORT OF INDEPENDENT REGISTERED PUBLIC ACCOUNTING FIRM
To the Board of Trustees of Investment Managers Series Trust and
Shareholders of Braddock Multi-Strategy Income Fund
Opinion on the Financial Statements
We have audited the accompanying statement of assets and liabilities of the Braddock Multi-Strategy Income Fund (the “Fund”), a series of Investment Managers Series Trust, including the schedule of investments, as of December 31, 2021, the related statement of operations for the year then ended, the statements of changes in net assets for each of the two years in the period then ended, and financial highlights for each of the five years in the period then ended, and the related notes (collectively referred to as the “financial statements”). In our opinion, the financial statements present fairly, in all material respects, the financial position of the Fund as of December 31, 2021, the results of its operations for the year then ended, the changes in its net assets for each of the two years in the period then ended, and the financial highlights for each of the five years in the period then ended, in conformity with accounting principles generally accepted in the United States of America.
Basis for Opinion
These financial statements are the responsibility of the Fund’s management. Our responsibility is to express an opinion on the Fund’s financial statements based on our audits. We are a public accounting firm registered with the Public Company Accounting Oversight Board (United States) (“PCAOB”) and are required to be independent with respect to the Fund in accordance with the U.S. federal securities laws and the applicable rules and regulations of the Securities and Exchange Commission and the PCAOB. We have served as the auditor of one or more of the funds in the Trust since 2007.
We conducted our audits in accordance with the standards of the PCAOB. Those standards require that we plan and perform the audit to obtain reasonable assurance about whether the financial statements are free of material misstatement, whether due to error or fraud. The Fund is not required to have, nor were we engaged to perform, an audit of its internal control over financial reporting. As part of our audits we are required to obtain an understanding of internal control over financial reporting, but not for the purpose of expressing an opinion on the effectiveness of the Fund’s internal control over financial reporting. Accordingly, we express no such opinion.
Our audits included performing procedures to assess the risks of material misstatement of the financial statements, whether due to error or fraud, and performing procedures that respond to those risks. Such procedures included examining, on a test basis, evidence regarding the amounts and disclosures in the financial statements. Our audits also included evaluating the accounting principles used and significant estimates made by management, as well as evaluating the overall presentation of the financial statements. Our procedures included confirmation of securities owned as of December 31, 2021 by correspondence with the custodian. We believe that our audits provide a reasonable basis for our opinion.
 | |
| TAIT, WELLER & BAKER LLP |
Philadelphia, Pennsylvania
March 1, 2022
36
Braddock Multi-Strategy Income Fund
SUPPLEMENTAL INFORMATION (Unaudited)
Tax Information
For the year ended December 31, 2021, 0% of dividends to be paid from net investment income, including short-term capital gains from the Fund (if any), is designated as qualified dividend income.
For the year ended December 31, 2021, 0% of the dividends to be paid from net investment income, including from short-term capital gains from the Fund (if any), is designated as dividends received deduction available to corporate shareholders.
Trustees and Officers Information
Additional information about the Trustees is included in the Fund’s Statement of Additional Information which is available, without charge, upon request by calling (800) 207-7108. The Trustees and officers of the Fund and their principal occupations during the past five years are as follows:
Name, Address, Year of Birth and Position(s) held with Trust |
Term of Officec and Length of Time Served |
Principal Occupation During the Past Five Years and Other Affiliations | Number of Portfolios in the Fund Complex Overseen by Trusteed |
Other Directorships Held During the Past Five Years by Trusteee |
| Independent Trustees: | ||||
Charles H. Miller a (born 1947) Trustee |
Since November 2007 |
Retired (2013 – present); Executive Vice President, Client Management and Development, Access Data, a Broadridge company, a provider of technology and services to asset management firms (1997 – 2012). | 7 | 361 Social Infrastructure Fund, a closed-end investment company. |
Ashley Toomey Rabun a (born 1952) Trustee and Chairperson of the Board |
Since November 2007 |
Retired (2016 – present); President and Founder, InvestorReach, Inc., a financial services consulting firm (1996 – 2015). | 7 | 361 Social Infrastructure Fund, a closed-end investment company; Select Sector SPDR Trust, a registered investment company (includes 11 portfolios). |
William H. Young a (born 1950) Trustee |
Since November 2007 |
Retired (2014 – present); Independent financial services consultant (1996 – 2014); Interim CEO, Unified Fund Services Inc. (now Huntington Fund Services), a mutual fund service provider (2003 – 2006); Senior Vice President, Oppenheimer Management Company (1983 – 1996); Chairman, NICSA, an investment management trade association (1993 – 1996). | 7 | 361 Social Infrastructure Fund, a closed-end investment company. |
37
Braddock Multi-Strategy Income Fund
SUPPLEMENTAL INFORMATION (Unaudited) - Continued
Name, Address, Year of Birth and Position(s) held with Trust |
Term of Officec and Length of Time Served |
Principal Occupation During the Past Five Years and Other Affiliations | Number of Portfolios in the Fund Complex Overseen by Trusteed |
Other Directorships Held During the Past Five Years by Trusteee |
| Independent Trustee: | ||||
|
John P. Zader a (born 1961) Trustee |
Since November 2007 |
Retired (June 2014 – present); CEO, UMB Fund Services, Inc., a mutual fund and hedge fund service provider, and the transfer agent, fund accountant, and co-administrator for the Fund (December 2006 – June 2014); President, Investment Managers Series Trust (December 2007 – June 2014). | 7 | Investment Managers Series Trust II, a registered investment company (includes 25 portfolios); 361 Social Infrastructure Fund, a closed-end investment company. |
| Interested Trustees: | ||||
Eric M. Banhazl b† (born 1957) Trustee |
Since January 2008 |
Chairman, Foothill Capital Management, LLC, a registered investment advisor (2018 – present); Chairman (2016 – present), and President (2006 – 2015), Mutual Fund Administration, LLC, co-administrator for the Fund. | 7 | Investment Managers Series Trust II, a registered investment company (includes 25 portfolios); 361 Social Infrastructure Fund, a closed-end investment company. |
Maureen Quill a* (born 1963) Trustee and President |
Since June 2019 |
President, Investment Managers Series Trust (June 2014 – present); President, UMB Distribution Services (March 2013 – present); EVP/Executive Director Registered Funds (January 2018 – present), Chief Operating Officer (June 2014 – January 2018), and Executive Vice President (January 2007 – June 2014), UMB Fund Services, Inc.; Vice President, Investment Managers Series Trust (December 2013 – June 2014). | 7 | 361 Social Infrastructure Fund, a closed-end investment company. |
| Officer of the Trust: | ||||
Rita Dam b (born 1966) Treasurer and Assistant Secretary |
Since December 2007 |
Co-Chief Executive Officer (2016 – present), and Vice President (2006 – 2015), Mutual Fund Administration, LLC; Co-President, Foothill Capital Management, LLC, a registered investment advisor (2018 – present); Treasurer, 361 Social Infrastructure Fund (December 2019 – January 2022). | N/A | N/A |
38
Braddock Multi-Strategy Income Fund
SUPPLEMENTAL INFORMATION (Unaudited) - Continued
Name, Address, Year of Birth and Position(s) held with Trust |
Term of Officec and Length of Time Served |
Principal Occupation During the Past Five Years and Other Affiliations | Number of Portfolios in the Fund Complex Overseen by Trusteed |
Other Directorships Held During the Past Five Years by Trusteee |
| Officers of the Trust: | ||||
Joy Ausili b (born 1966) Vice President, Assistant Secretary and Assistant Treasurer |
Since March 2016 |
Co-Chief Executive Officer (2016 – present), and Vice President (2006 – 2015), Mutual Fund Administration, LLC; Co-President, Foothill Capital Management, LLC, a registered investment advisor (2018 – present); Vice President and Assistant Secretary, 361 Social Infrastructure Fund (December 2019 – January 2022); Secretary and Assistant Treasurer, Investment Managers Series Trust (December 2007 – March 2016). | N/A | N/A |
Diane Drakeb (born 1967) Secretary |
Since March 2016 |
Senior Counsel, Mutual Fund Administration, LLC (October 2015 – present); Secretary, 361 Social Infrastructure Fund (December 2019 – January 2022); Chief Compliance Officer, Foothill Capital Management, LLC, a registered investment advisor (2018 – 2019). | N/A | N/A |
Martin Dziura b (born 1959) Chief Compliance Officer |
Since June 2014 |
Principal, Dziura Compliance Consulting, LLC (October 2014 – present); Managing Director, Cipperman Compliance Services (2010 – September 2014); Chief Compliance Officer, Hanlon Investment Management (2009 – 2010); Vice President – Compliance, Morgan Stanley Investment Management (2000 – 2009). | N/A | N/A |
| a | Address for certain Trustees and certain officers: 235 West Galena Street, Milwaukee, Wisconsin 53212. |
| b | Address for Mr. Banhazl, Ms. Ausili, Ms. Dam and Ms. Drake: 2220 E. Route 66, Suite 226, Glendora, California 91740. Address for Mr. Dziura: 309 Woodridge Lane, Media, Pennsylvania 19063. |
| c | Trustees and officers serve until their successors have been duly elected. |
| d | The Trust is comprised of 53 series managed by unaffiliated investment advisors. Each Trustee serves as Trustee of each series of the Trust. The term “Fund Complex” applies only to the Fund(s) managed by the same investment advisor. The Fund’s investment advisor also serves as the investment advisor to the Robinson Opportunistic Income Fund, Robinson Tax Advantaged Income Fund, Securian AM Balanced Stabilization Fund, Securian AM Equity Stabilization Fund, Securian AM Real Asset Income Fund and West Loop Realty Fund which are offered in separate prospectus. The Fund does not hold itself out as related to any other series within the Trust, for purposes of investment and investor services. |
| e | “Other Directorships Held” includes only directorship of companies required to register or file reports with the SEC under the Securities Exchange Act of 1934, as amended (that is, “public companies”) or other investment companies registered under the 1940 Act. |
| † | Mr. Banhazl is an “interested person” of the Trust by virtue of his position with Mutual Fund Administration, LLC. |
| * | Ms. Quill is an “interested person” of the Trust by virtue of her position with UMB Fund Services, Inc. |
39
Braddock Multi-Strategy Income Fund
EXPENSE EXAMPLE
For the Six Months Ended December 31, 2021 (Unaudited)
Expense Example
As a shareholder of the Fund, you incur two types of costs: (1) transaction costs, including sales charges (loads) on purchase of Class A shares; and (2) ongoing costs, including management fees; distribution and 12b-1 fees (Class A and Class C shares only) and other Fund expenses. The examples below are intended to help you understand your ongoing costs (in dollars) of investing in the Funds and to compare these costs with the ongoing costs of investing in other mutual funds.
These examples are based on an investment of $1,000 invested at the beginning of the period and held for the entire six month period from July 1, 2021 to December 31, 2021.
Actual Expenses
The information in the row titled “Actual Performance” of the table below provides actual account values and actual expenses. You may use the information in these columns, together with the amount you invested, to estimate the expenses that you paid over the period. Simply divide your account value by $1,000 (for example, an $8,600 account value divided by $1,000 = 8.6), then multiply the result by the number in the appropriate row for your share class, under the column titled “Expenses Paid During Period” to estimate the expenses you paid on your account during this period.
Hypothetical Example for Comparison Purposes
The information in the row titled “Hypothetical (5% annual return before expenses)” of the table below provides hypothetical account values and hypothetical expenses based on the Fund’s actual expense ratios and an assumed rate of return of 5% per year before expenses, which is not the Fund’s actual return. The hypothetical account values and expenses may not be used to estimate the actual ending account balance or expenses you paid for the period. You may use this information to compare the ongoing costs of investing in the Fund and other funds. To do so, compare these 5% hypothetical examples with the 5% hypothetical examples that appear in the shareholder reports of the other funds.
Please note that the expenses shown in the table are meant to highlight your ongoing costs only and do not reflect any transaction costs, such as sales charges (load) or contingent deferred sales charges. Therefore, the information in the row titled “Hypothetical (5% annual return before expenses)” is useful in comparing ongoing costs only, and will not help you determine the relative total costs of owning different funds. In addition, if these transactional costs were included, your costs would have been higher.
| Beginning | Ending Account | Expenses Paid | ||
| Account Value | Value | During Period* | ||
| 7/1/21 | 12/31/21 | 7/1/21 – 12/31/21 | ||
| Class A | Actual Performance | $1,000.00 | $1,012.50 | $8.95 |
| Hypothetical (5% annual | ||||
| return before expenses) | 1,000.00 | 1,016.32 | 8.96 | |
| Class C | Actual Performance | 1,000.00 | 1,008.60 | 12.72 |
| Hypothetical (5% annual | ||||
| return before expenses) | 1,000.00 | 1,012.54 | 12.75 | |
| Institutional Class | Actual Performance | 1,000.00 | 1,013.80 | 7.68 |
| Hypothetical (5% annual | ||||
| return before expenses) | 1,000.00 | 1,017.58 | 7.70 |
| * | Expenses are equal to the Fund’s annualized expense ratios of 1.76%, 2.51% and 1.51% for Class A, Class C and Institutional Class shares, respectively, multiplied by the average account values over the period, multiplied by 184/365 (to reflect the six month period). The expense ratios reflect a recovery of previously waived fees. Assumes all dividends and distributions were reinvested. |
40
Braddock Multi-Strategy Income Fund
A series of Investment Managers Series Trust
Investment Advisor
Liberty Street Advisors, Inc.
88 Pine Street 31st Floor, Suite 3101
New York, New York 10005
Sub-Advisor
Braddock Financial LLC
1200 17th Street, Suite 1210
Denver, Colorado 80202
Independent Registered Public Accounting Firm
Tait, Weller & Baker LLP
Two Liberty Place
50 South 16th Street, Suite 2900
Philadelphia, Pennsylvania 19102
Custodian
UMB Bank, n.a.
928 Grand Boulevard, 5th Floor
Kansas City, Missouri 64106
Fund Co-Administrator
Mutual Fund Administration, LLC
2220 East Route 66, Suite 226
Glendora, California 91740
Fund Co-Administrator, Transfer Agent and Fund Accountant
UMB Fund Services, Inc.
235 West Galena Street
Milwaukee, Wisconsin 53212
Distributor
Foreside Fund Services, LLC
Three Canal Plaza, Suite 100
Portland, Maine 04101
www.foreside.com
FUND INFORMATION
| TICKER | CUSIP | |
| Braddock Multi-Strategy Income Fund - Class A | BDKAX | 46141Q 618 |
| Braddock Multi-Strategy Income Fund - Class C | BDKCX | 46141Q 592 |
| Braddock Multi-Strategy Income Fund - Institutional Class | BDKNX | 46141Q 584 |
Privacy Principles of the Braddock Multi-Strategy Income Fund for Shareholders
The Fund is committed to maintaining the privacy of its shareholders and to safeguarding its non-public personal information. The following information is provided to help you understand what personal information the Fund collects, how we protect that information and why, in certain cases, we may share information with select other parties.
Generally, the Fund does not receive any non-public personal information relating to its shareholders, although certain non-public personal information of its shareholders may become available to the Fund. The Fund does not disclose any non-public personal information about its shareholders or former shareholders to anyone, except as permitted by law or as is necessary in order to service shareholder accounts (for example, to a transfer agent or third party administrator).
This report is sent to shareholders of the Braddock Multi-Strategy Income Fund for their information. It is not a Prospectus, circular or representation intended for use in the purchase or sale of shares of the Fund or of any securities mentioned in this report.
Proxy Voting
The Funds’ proxy voting policies and procedures, as well as information regarding how the Funds voted proxies for portfolio securities, if applicable, during the most recent 12-month period ended June 30, are also available, without charge and upon request by calling the Funds at (800) 207-7108, on the Funds’ website at https://libertystreetfunds.com/ or on the SEC’s website at www.sec.gov.
Fund Portfolio Holdings
The Funds file their complete schedule of portfolio holdings with the SEC for the first and third quarters of each fiscal year on Form N-PORT within 60 days of the end of such fiscal quarter. Shareholders may obtain the Funds’ Form N-PORT on the SEC’s website at www.sec.gov.
Prior to the use of Form N-PORT, the Funds filed their complete schedule of portfolio holdings with the SEC on Form N-Q, which is available online at www.sec.gov.
Householding
The Funds will mail only one copy of shareholder documents, including prospectuses, and notice of annual and semi-annual reports availability and proxy statements, to shareholders with multiple accounts at the same address. This practice is commonly called “householding” and is intended to reduce expenses and eliminate duplicate mailings of shareholder documents. Mailings of your shareholder documents may be householded indefinitely unless you instruct us otherwise. If you do not want the mailing of these documents to be combined with those for other members of your household, please call the Funds at (800) 207-7108.
Braddock Multi-Strategy Income Fund
P.O. Box 2175
Milwaukee, WI 53201
Toll Free: (800) 207-7108
Item 1. Report to Stockholders (Continued).
| (b) | Not Applicable |
Item 2. Code of Ethics.
The registrant has adopted a code of ethics that applies to the registrant's principal executive officer and principal financial officer. The registrant has not made any amendments to its code of ethics during the period covered by this report. The registrant has not granted any waivers from any provisions of the code of ethics during the period covered by this report.
The registrant undertakes to provide to any person without charge, upon request, a copy of its code of ethics by mail when they call the registrant at (800) 207-7108.
Item 3. Audit Committee Financial Expert.
The registrant’s board of trustees has determined that there is at least one audit committee financial expert serving on its audit committee. John P. Zader is the “audit committee financial expert” and is considered to be “independent” as each term is defined in Item 3 of Form N-CSR.
Item 4. Principal Accountant Fees and Services.
The registrant has engaged its principal accountant to perform audit services, audit-related services, tax services and other services during the past two fiscal years. "Audit services" refer to performing an audit of the registrant's annual financial statements or services that are normally provided by the accountant in connection with statutory and regulatory filings or engagements for those fiscal years. "Audit-related services" refer to the assurance and related services by the principal accountant that are reasonably related to the performance of the audit. "Tax services" refer to professional services rendered by the principal accountant for tax compliance, tax advice, and tax planning. There were no "other services" provided by the principal accountant. The following table details the aggregate fees billed or expected to be billed for each of the last two fiscal years for audit fees, audit-related fees, tax fees and other fees by the principal accountant.
| FYE 12/31/2021 | FYE 12/31/2020 | |
| Audit Fees | $20,700 | $20,300 |
| Audit-Related Fees | N/A | N/A |
| Tax Fees | $2,800 | $2,800 |
| All Other Fees | N/A | N/A |
The audit committee has adopted pre-approval policies and procedures that require the audit committee to pre-approve all audit and non-audit services of the registrant, including services provided to any entity affiliated with the registrant.
The percentage of fees billed by Tait Weller applicable to non-audit services pursuant to waiver of pre-approval requirement were as follows:
| FYE 12/31/2021 | FYE 12/31/2020 | |
| Audit-Related Fees | 0% | 0% |
| Tax Fees | 0% | 0% |
| All Other Fees | 0% | 0% |
All of the principal accountant's hours spent on auditing the registrant's financial statements were attributed to work performed by full-time permanent employees of the principal accountant.
The following table indicates the non-audit fees billed or expected to be billed by the registrant's accountant for services to the registrant and to the registrant's investment advisor (and any other controlling entity, etc.—not sub-advisor) for the last two years. The audit committee of the Board of Trustees has considered whether the provision of non-audit services that were rendered to the registrant's investment advisor is compatible with maintaining the principal accountant's independence and has concluded that the provision of such non-audit services by the accountant has not compromised the accountant's independence.
| Non-Audit Related Fees | FYE 12/31/2021 | FYE 12/31/2020 |
| Registrant | N/A | N/A |
| Registrant’s Investment Advisor | N/A | N/A |
Item 5. Audit Committee of Listed Registrants.
| (a) | Not applicable to registrants who are not listed issuers (as defined in Rule 10A-3 under the Securities Exchange Act of 1934). |
| (b) | Not applicable. |
Item 6. Investments.
| (a) | Schedule of Investments is included as part of the report to shareholders filed under Item 1 of this Form. |
| (b) | Not Applicable. |
Item 7. Disclosure of Proxy Voting Policies and Procedures for Closed-End Management Investment Companies.
Not applicable to open-end investment companies.
Item 8. Portfolio Managers of Closed-End Management Investment Companies.
Not applicable to open-end investment companies.
Item 9. Purchases of Equity Securities by Closed-End Management Investment Company and Affiliated Purchasers.
Not applicable.
Item 10. Submission of Matters to a Vote of Security Holders.
The registrant has not made any material changes to the procedures by which shareholders may recommend nominees to the registrant’s Board of Trustees.
Item 11. Controls and Procedures.
| (a) | The Registrant’s President/Chief Executive Officer and Treasurer/Chief Financial Officer have reviewed the Registrant's disclosure controls and procedures (as defined in Rule 30a-3(c) under the Investment Company Act of 1940 (the “Act”)) as of a date within 90 days of the filing of this report, as required by Rule 30a-3(b) under the Act and Rules 13a-15(b) or 15d-15(b) under the Securities Exchange Act of 1934. Based on their review, such officers have concluded that the disclosure controls and procedures are effective in ensuring that information required to be disclosed in this report is appropriately recorded, processed, summarized and reported and made known to them by others within the Registrant and by the Registrant’s service provider. |
| (b) | There were no changes in the Registrant's internal control over financial reporting (as defined in Rule 30a-3(d) under the Act) that occurred during the period covered by this report that has materially affected, or is reasonably likely to materially affect, the Registrant's internal control over financial reporting. |
Item 12. Disclosure of Securities Lending Activities for Closed-End Management Investment Companies.
Not applicable to open-end investment companies.
Item 13. Exhibits.
(2) Certifications pursuant to Section 302 of the Sarbanes-Oxley Act of 2002. Filed herewith.
(3) Any written solicitation to purchase securities under Rule 23c-1 under the Act sent or given during the period covered by the report by or on behalf of the registrant to 10 or more persons. Not applicable to open-end investment companies.
(4) Change in the registrant’s independent public accountant. There was no change in the registrant’s independent public accountant for the period covered by this report.
| (b) | Certification pursuant to Section 906 of the Sarbanes-Oxley Act of 2002. Filed herewith. |
SIGNATURES
Pursuant to the requirements of the Securities Exchange Act of 1934 and the Investment Company Act of 1940, the registrant has duly caused this report to be signed on its behalf by the undersigned, thereunto duly authorized.
| (Registrant) | Investment Managers Series Trust | |
| By (Signature and Title) | /s/ Maureen Quill | |
| Maureen Quill, President/Chief Executive Officer | ||
| Date | 3/11/22 |
Pursuant to the requirements of the Securities Exchange Act of 1934 and the Investment Company Act of 1940, this report has been signed below by the following persons on behalf of the registrant and in the capacities and on the dates indicated.
| By (Signature and Title) | /s/ Maureen Quill | |
| Maureen Quill, President/Chief Executive Officer | ||
| Date | 3/11/22 | |
| By (Signature and Title) | /s/ Rita Dam | |
| Rita Dam, Treasurer/Chief Financial Officer | ||
| Date | 3/11/22 |
EX.99.CERT
CERTIFICATIONS
I, Maureen Quill, certify that:
| 1. | I have reviewed this report on Form N-CSR of Braddock Multi-Strategy Income Fund, a series of Investment Managers Series Trust (the “Trust”); |
| 2. | Based on my knowledge, this report does not contain any untrue statement of a material fact or omit to state a material fact necessary to make the statements made, in light of the circumstances under which such statements were made, not misleading with respect to the period covered by this report; |
| 3. | Based on my knowledge, the financial statements, and other financial information included in this report, fairly present in all material respects the financial condition, results of operations, changes in net assets, and cash flows (if the financial statements are required to include a statement of cash flows) of the registrant as of, and for, the periods presented in this report; |
| 4. | The registrant's other certifying officer(s) and I are responsible for establishing and maintaining disclosure controls and procedures (as defined in Rule 30a-3(c) under the Investment Company Act of 1940) and internal control over financial reporting (as defined in Rule 30a-3(d) under the Investment Company Act of 1940) for the registrant and have: |
| (a) | Designed such disclosure controls and procedures, or caused such disclosure controls and procedures to be designed under our supervision, to ensure that material information relating to the registrant, including its consolidated subsidiaries, is made known to us by others within those entities, particularly during the period in which this report is being prepared; |
| (b) | Designed such internal control over financial reporting, or caused such internal control over financial reporting to be designed under our supervision, to provide reasonable assurance regarding the reliability of financial reporting and the preparation of financial statements for external purposes in accordance with generally accepted accounting principles; |
| (c) | Evaluated the effectiveness of the registrant's disclosure controls and procedures and presented in this report our conclusions about the effectiveness of the disclosure controls and procedures, as of a date within 90 days prior to the filing date of this report based on such evaluation; and |
| (d) | Disclosed in this report any change in the registrant’s internal control over financial reporting that occurred during the second fiscal quarter of the period covered by this report that has materially affected, or is reasonably likely to materially affect, the registrant’s internal control over financial reporting; and |
| 5. | The registrant's other certifying officer(s) and I have disclosed to the registrant's auditors and the audit committee of the registrant's board of directors (or persons performing the equivalent functions): |
| (a) | All significant deficiencies and material weaknesses in the design or operation of internal control over financial reporting which are reasonably likely to adversely affect the registrant's ability to record, process, summarize, and report financial information; and |
| (b) | Any fraud, whether or not material, that involves management or other employees who have a significant role in the registrant's internal control over financial reporting. |
| Date: | 3/11/22 | /s/ Maureen Quill | ||
| Maureen Quill | ||||
| President/Chief Executive Officer |
CERTIFICATIONS
I, Rita Dam, certify that:
| 1. | I have reviewed this report on Form N-CSR of Braddock Multi-Strategy Income Fund, a series of Investment Managers Series Trust (the “Trust”); |
| 2. | Based on my knowledge, this report does not contain any untrue statement of a material fact or omit to state a material fact necessary to make the statements made, in light of the circumstances under which such statements were made, not misleading with respect to the period covered by this report; |
| 3. | Based on my knowledge, the financial statements, and other financial information included in this report, fairly present in all material respects the financial condition, results of operations, changes in net assets, and cash flows (if the financial statements are required to include a statement of cash flows) of the registrant as of, and for, the periods presented in this report; |
| 4. | The registrant's other certifying officer(s) and I are responsible for establishing and maintaining disclosure controls and procedures (as defined in Rule 30a-3(c) under the Investment Company Act of 1940) and internal control over financial reporting (as defined in Rule 30a-3(d) under the Investment Company Act of 1940) for the registrant and have: |
| (a) | Designed such disclosure controls and procedures, or caused such disclosure controls and procedures to be designed under our supervision, to ensure that material information relating to the registrant, including its consolidated subsidiaries, is made known to us by others within those entities, particularly during the period in which this report is being prepared; |
| (b) | Designed such internal control over financial reporting, or caused such internal control over financial reporting to be designed under our supervision, to provide reasonable assurance regarding the reliability of financial reporting and the preparation of financial statements for external purposes in accordance with generally accepted accounting principles; |
| (c) | Evaluated the effectiveness of the registrant's disclosure controls and procedures and presented in this report our conclusions about the effectiveness of the disclosure controls and procedures, as of a date within 90 days prior to the filing date of this report based on such evaluation; and |
| (d) | Disclosed in this report any change in the registrant’s internal control over financial reporting that occurred during the second fiscal quarter of the period covered by this report that has materially affected, or is reasonably likely to materially affect, the registrant’s internal control over financial reporting; and |
| 5. | The registrant's other certifying officer(s) and I have disclosed to the registrant's auditors and the audit committee of the registrant's board of directors (or persons performing the equivalent functions): |
| (a) | All significant deficiencies and material weaknesses in the design or operation of internal control over financial reporting which are reasonably likely to adversely affect the registrant's ability to record, process, summarize, and report financial information; and |
| (b) | Any fraud, whether or not material, that involves management or other employees who have a significant role in the registrant's internal control over financial reporting. |
| Date | 3/11/22 | /s/ Rita Dam | ||
| Rita Dam | ||||
| Treasurer/Chief Financial Officer |
EX.99.906CERT
Certification of CEO and CFO Pursuant to
18 U.S.C. Section 1350,
as Adopted Pursuant to
Section 906 of the Sarbanes-Oxley Act of 2002
In connection with the report on Form N-CSR of Braddock Multi-Strategy Income Fund, a series of Investment Managers Series Trust (the “Trust”), for the year ended December 31, 2021 (the “Report”), Maureen Quill, as President/Chief Executive Officer of the Trust, and Rita Dam, as Treasurer/Chief Financial Officer of the Trust, each hereby certifies, pursuant to 18 U.S.C. Section 1350, as adopted pursuant to Section 906 of the Sarbanes-Oxley Act of 2002, that, to the best of his or her knowledge:
| (1) | the Report fully complies with the requirements of Section 13 (a) or 15 (d) of the Securities Exchange Act of 1934; and |
| (2) | the information contained in the Report fairly presents, in all material respects, the financial condition and results of operations of the Company. |
| Date | 3/11/22 |
| /s/ Maureen Quill | |
| Maureen Quill | |
| President/Chief Executive Officer | |
| /s/ Rita Dam | |
| Rita Dam | |
| Treasurer/Chief Financial Officer |
This statement accompanies this report on Form N-CSR pursuant to Section 906 of the Sarbanes-Oxley Act of 2002 and shall not be deemed as filed by Investment Managers Series Trust for purposes of Section 18 of the Securities Exchange Act of 1934.
Serious News for Serious Traders! Try StreetInsider.com Premium Free!
You May Also Be Interested In
- News Media Canada Welcomes Budget 2024’s Support for Local Journalism Initiative
- Madison's Event Planning in Hawaii Elevates Corporate Events to Unparalleled Heights With the Launch of Their Exclusive Corporate Event Planning Arm
- New MPP tracker reveals heavy industry transition has started but needs to accelerate sevenfold to meet 2030 climate targets
Create E-mail Alert Related Categories
SEC FilingsSign up for StreetInsider Free!
Receive full access to all new and archived articles, unlimited portfolio tracking, e-mail alerts, custom newswires and RSS feeds - and more!
