

Form N-CSR Fidelity Rutland Square For: Feb 29
 Tweet
Tweet Share
ShareUNITED STATES
SECURITIES AND EXCHANGE COMMISSION
Washington, D.C. 20549
FORM N-CSR
CERTIFIED SHAREHOLDER REPORT OF REGISTERED
MANAGEMENT INVESTMENT COMPANIES
Investment Company Act file number 811-21991
Fidelity Rutland Square Trust II
(Exact name of registrant as specified in charter)
245 Summer St., Boston, Massachusetts 02210
(Address of principal executive offices) (Zip code)
Christina H. Lee, Secretary
245 Summer St.
Boston, Massachusetts 02210
(Name and address of agent for service)
Registrant's telephone number, including area code:
617-563-7000
Date of fiscal year end: | February 29 |
Date of reporting period: | February 29, 2020 |
Item 1.
Reports to Stockholders
Strategic Advisers® Emerging Markets Fund
Offered exclusively to certain clients of Strategic Advisers LLC - not available for sale to the general public
February 29, 2020

See the inside front cover for important information about access to your fund’s shareholder reports.
Beginning on January 1, 2021, as permitted by regulations adopted by the Securities and Exchange Commission, paper copies of a fund’s shareholder reports will no longer be sent by mail, unless you specifically request paper copies of the reports from the fund or from your financial intermediary, such as a financial advisor, broker-dealer or bank. Instead, the reports will be made available on a website, and you will be notified by mail each time a report is posted and provided with a website link to access the report.
If you already elected to receive shareholder reports electronically, you will not be affected by this change and you need not take any action. You may elect to receive shareholder reports and other communications from a fund electronically, by contacting your financial intermediary. For Fidelity customers, visit Fidelity's web site or call Fidelity using the contact information listed below.
You may elect to receive all future reports in paper free of charge. If you wish to continue receiving paper copies of your shareholder reports, you may contact your financial intermediary or, if you are a Fidelity customer, visit Fidelity’s website, or call Fidelity at the applicable toll-free number listed below. Your election to receive reports in paper will apply to all funds held with the fund complex/your financial intermediary.
| Account Type | Website | Phone Number |
| Brokerage, Mutual Fund, or Annuity Contracts: | fidelity.com/mailpreferences | 1-800-343-3548 |
| Employer Provided Retirement Accounts: | netbenefits.fidelity.com/preferences (choose 'no' under Required Disclosures to continue to print) | 1-800-343-0860 |
| Advisor Sold Accounts Serviced Through Your Financial Intermediary: | Contact Your Financial Intermediary | Your Financial Intermediary's phone number |
| Advisor Sold Accounts Serviced by Fidelity: | institutional.fidelity.com | 1-877-208-0098 |
Contents
|
Board Approval of Investment Advisory Contracts and Management Fees | |
To view a fund's proxy voting record for the 12-month period ended June 30, visit http://www.fidelity.com/proxyvotingresults or visit the Securities and Exchange Commission's (SEC) web site at http://www.sec.gov.
You may also call 1-800-544-3455 to request a free copy of the proxy voting guidelines.
Standard & Poor's, S&P and S&P 500 are registered service marks of The McGraw-Hill Companies, Inc. and have been licensed for use by Fidelity Distributors Corporation.
Other third-party marks appearing herein are the property of their respective owners.
All other marks appearing herein are registered or unregistered trademarks or service marks of FMR LLC or an affiliated company. © 2020 FMR LLC. All rights reserved.
This report and the financial statements contained herein are submitted for the general information of the shareholders of the Fund. This report is not authorized for distribution to prospective investors in the Fund unless preceded or accompanied by an effective prospectus.
A fund files its complete schedule of portfolio holdings with the SEC for the first and third quarters of each fiscal year on Form N-PORT. Forms N-PORT are available on the SEC’s web site at http://www.sec.gov. A fund's Forms N-PORT may be reviewed and copied at the SEC’s Public Reference Room in Washington, DC. Information regarding the operation of the SEC's Public Reference Room may be obtained by calling 1-800-SEC-0330.
For a complete list of a fund's portfolio holdings, view the most recent holdings listing, semiannual report, or annual report on Fidelity's web site at http://www.fidelity.com, http://www.institutional.fidelity.com, or http://www.401k.com, as applicable.
NOT FDIC INSURED •MAY LOSE VALUE •NO BANK GUARANTEE
Neither the Fund nor Fidelity Distributors Corporation is a bank.
Note to Shareholders:
Early in 2020, the outbreak and spread of a new coronavirus emerged as a public health emergency that had a major influence on financial markets, primarily based on its impact on the global economy and corporate earnings. The virus causes a respiratory disease known as COVID-19. On March 11, the World Health Organization declared the COVID-19 outbreak a pandemic, citing sustained risk of further global spread.
In the weeks following the end of this reporting period, as the crisis worsened, we witnessed an escalating human tragedy with wide-scale social and economic consequences from coronavirus-containment measures. The outbreak of COVID-19 prompted a number of measures to limit the spread, including travel and border restrictions, quarantines, and restrictions on large gatherings. In turn, these resulted in lower consumer activity, diminished demand for a wide range of products and services, disruption in manufacturing and supply chains, and – given the wide variability in outcomes regarding the outbreak – significant market uncertainty and volatility. Amid the turmoil, the U.S. government took unprecedented action – in concert with the U.S. Federal Reserve and central banks around the world – to help support consumers, businesses, and the broader economy, and to limit disruption to the financial system.
The situation continues to unfold, and the extent and duration of its impact on financial markets and the economy remain highly uncertain. Extreme events such as the coronavirus crisis are “exogenous shocks” that can have significant adverse effects on mutual funds and their investments. Although multiple asset classes may be affected by market disruption, the duration and impact may not be the same for all types of assets.
Fidelity is committed to helping you stay informed amid news about COVID-19 and during increased market volatility, and we’re taking extra steps to be responsive to customer needs. We encourage you to visit our websites, where we offer ongoing updates, commentary, and analysis on the markets and our funds.
Performance: The Bottom Line
Average annual total return reflects the change in the value of an investment, assuming reinvestment of distributions from dividend income and capital gains (the profits earned upon the sale of securities that have grown in value, if any) and assuming a constant rate of performance each year. The hypothetical investment and the average annual total returns do not reflect the deduction of taxes that a shareholder would pay on fund distributions or the redemption of fund shares. During periods of reimbursement by Fidelity, a fund’s total return will be greater than it would be had the reimbursement not occurred. How a fund did yesterday is no guarantee of how it will do tomorrow.
Average Annual Total Returns
| For the periods ended February 29, 2020 | Past 1 year | Past 5 years | Life of fundA |
| Strategic Advisers® Emerging Markets Fund | 1.80% | 3.05% | 1.94% |
A From September 30, 2010
$10,000 Over Life of Fund
Let's say hypothetically that $10,000 was invested in Strategic Advisers® Emerging Markets Fund on September 30, 2010, when the fund started.
The chart shows how the value of your investment would have changed, and also shows how the MSCI Emerging Markets Index performed over the same period.
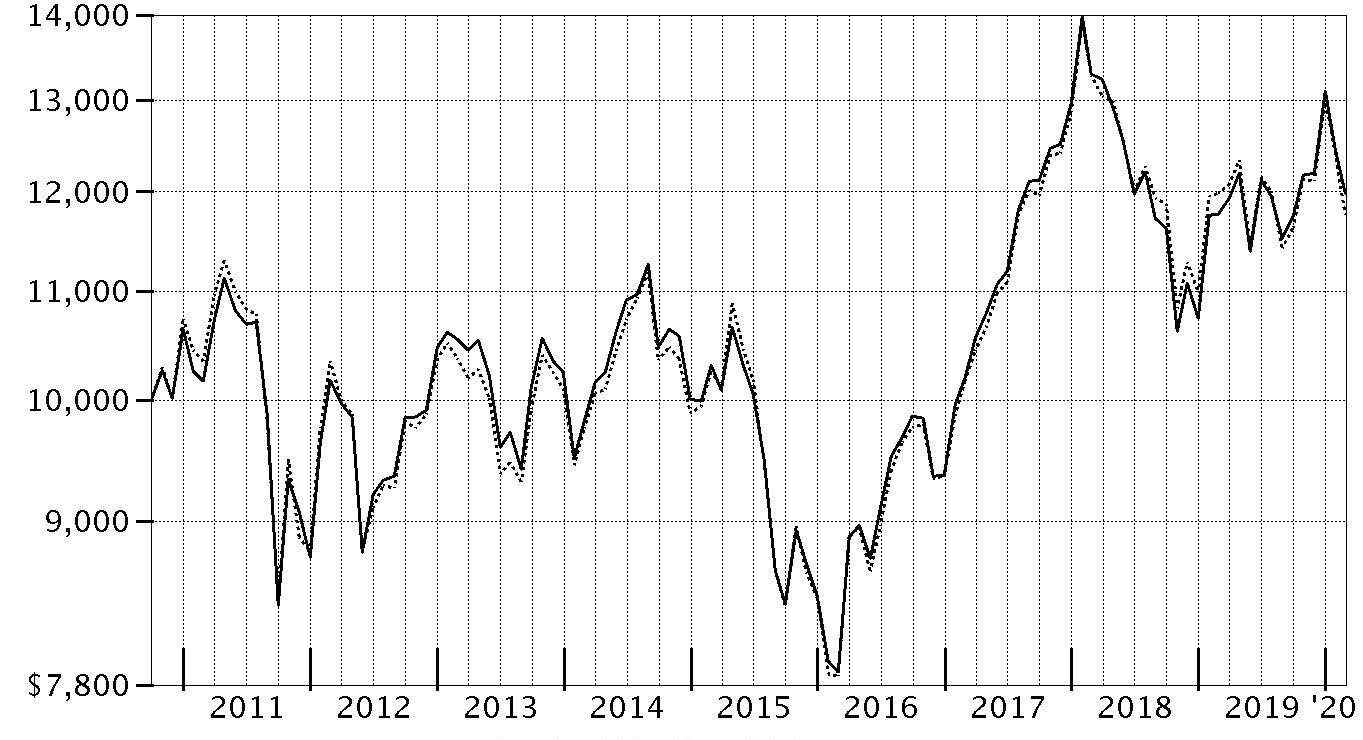
| Period Ending Values | ||
|
| $11,980 | Strategic Advisers® Emerging Markets Fund |
|
| $11,755 | MSCI Emerging Markets Index |
Management's Discussion of Fund Performance
Market Recap: The MSCI ACWI (All Country World Index) ex USA Index returned -0.51% for the 12 months ending February 29, 2020, as the negative impact of the new coronavirus in early 2020 reversed a strong uptrend. For the first 10 months of the past year, international stocks gained ground as they benefited from accommodative monetary policies from central banks around the world, favorable economic growth and de-escalation of the U.S.–China trade conflict. However, in January, the outbreak and spread of the novel coronavirus in China became a growing concern for many investors, threatening global economic growth and corporate earnings. The index had a return of -2.68% for the month. The outbreak escalated globally in February, when the index returned -7.90% amid a surge of cases outside China and causing investors to generally favor safer asset classes. For the full 12 months, the energy (-17%) sector was hit hardest, as concerns about global growth and lack of demand for crude oil and natural gas pressured stocks. Materials (-8%) fared poorly, followed by financials (-5%). Conversely, the defensive health care (+10%) and utilities (+7%) sectors held up well, while information technology (+17%) led the way. Regionally, the U.K. (-7%) suffered from uncertainty tied to Brexit for most of the period, though Parliament approved a deal in January. Asia Pacific ex Japan (-3%) and emerging markets (-2%) lagged, whereas Europe ex U.K. (+3%), Canada (+2%) and Japan (+1) slightly outperformed. Comments from Portfolio Manager Wilfred Chilangwa: For the fiscal year, the Fund gained 1.80%, handily outpacing the -1.86% return the benchmark MSCI Emerging Markets Index. During a period in which growth stocks and strategies outperformed their value-oriented counterparts, growth-oriented underlying managers emphasizing momentum and/or company quality delivered the best results. Fidelity® Emerging Markets Fund (+12%) outpaced the MSCI EM Index by an outsized margin and was the portfolio’s top relative contributor. Its strategy of combining a GARP (growth at a reasonable price) and earnings momentum focus led to broadly positive stock selection the past 12 months. The Select Emerging Markets strategy managed by sub-adviser FIAM® (+4%) – a risk-managed GARP approach – also added considerable value. On the downside, Fidelity® SAI® Emerging Markets Low Volatility Index Fund (-7%) was the primary relative detractor. Adverse security selection among consumer discretionary and information technology stocks, along with an underweighted allocation in China, resulted in a disappointing outcome for this new portfolio addition. During the period, we added three new sub-advised strategies, one from FIAM (Concentrated Emerging Markets) and two from FIL (Global Emerging Markets and Greater China). Given my efforts to reduce sources of portfolio volatility during the past two years, I believe the Fund is well positioned for bouts of market turbulence.The views expressed above reflect those of the portfolio manager(s) only through the end of the period as stated on the cover of this report and do not necessarily represent the views of Fidelity or any other person in the Fidelity organization. Any such views are subject to change at any time based upon market or other conditions and Fidelity disclaims any responsibility to update such views. These views may not be relied on as investment advice and, because investment decisions for a Fidelity fund are based on numerous factors, may not be relied on as an indication of trading intent on behalf of any Fidelity fund.
Investment Summary (Unaudited)
The information in the following tables is based on the direct investments of the Fund.Top Ten Holdings as of February 29, 2020
| (excluding cash equivalents) | % of fund's net assets |
| Fidelity Emerging Markets Fund | 8.3 |
| Fidelity SAI Emerging Markets Low Volatility Index Fund | 4.8 |
| Alibaba Group Holding Ltd. sponsored ADR | 3.7 |
| iShares MSCI China ETF | 3.7 |
| Tencent Holdings Ltd. | 3.6 |
| Samsung Electronics Co. Ltd. | 3.5 |
| Goldman Sachs Emerging Markets Equity Fund Institutional Shares | 3.3 |
| Taiwan Semiconductor Manufacturing Co. Ltd. | 3.3 |
| Invesco Oppenheimer Developing Markets Fund Class R6 | 2.6 |
| Aberdeen Emerging Markets Fund Institutional Service Class | 2.3 |
| 39.1 |
Top Five Market Sectors as of February 29, 2020
| (stocks only) | % of fund's net assets |
| Financials | 16.6 |
| Information Technology | 12.4 |
| Consumer Discretionary | 10.5 |
| Communication Services | 7.4 |
| Consumer Staples | 5.0 |
Geographic Diversification (% of fund's net assets)
| As of February 29, 2020 | ||
| United States of America* | 36.9% | |
| Cayman Islands | 13.0% | |
| China | 8.2% | |
| Korea (South) | 8.0% | |
| Taiwan | 6.4% | |
| India | 5.2% | |
| Brazil | 5.1% | |
| Russia | 3.0% | |
| Hong Kong | 2.5% | |
| Other | 11.7% | |

* Includes Short-Term investments and Net Other Assets (Liabilities).
Percentages are based on country or territory of incorporation and are adjusted for the effect of futures contracts, if applicable.
Asset Allocation (% of fund's net assets)
| As of February 29, 2020 | ||
| Common Stocks | 61.5% | |
| Preferred Stocks | 2.1% | |
| Diversifed Emerging Markets Funds | 27.4% | |
| Other | 3.9% | |
| Short-Term Investments and Net Other Assets (Liabilities) | 5.1% | |

Asset allocations of funds in the pie chart reflect the categorizations of assets as defined by Morningstar as of the reporting date.
Schedule of Investments February 29, 2020
Showing Percentage of Net Assets
| Common Stocks - 61.5% | |||
| Shares | Value | ||
| COMMUNICATION SERVICES - 7.3% | |||
| Diversified Telecommunication Services - 0.5% | |||
| China Telecom Corp. Ltd. (H Shares) | 13,872,000 | $5,214,235 | |
| China Tower Corp. Ltd. (H Shares) (a) | 11,608,000 | 2,814,512 | |
| China Unicom Ltd. | 3,906,000 | 3,138,734 | |
| Emirates Telecommunications Corp. | 35,503 | 152,728 | |
| HKBN Ltd. | 473,500 | 847,987 | |
| KT Corp. | 54,291 | 1,081,603 | |
| LG Telecom Ltd. | 400,125 | 4,398,223 | |
| Magyar Telekom PLC | 28,408 | 36,911 | |
| Ooredoo Qsc (b) | 62,110 | 107,871 | |
| PT Telekomunikasi Indonesia Tbk Series B | 11,122,900 | 2,712,040 | |
| Saudi Telecom Co. | 80,146 | 1,764,643 | |
| Telkom SA Ltd. | 405,832 | 690,387 | |
| Turk Telekomunikasyon A/S (b) | 1,007,763 | 1,217,904 | |
| 24,177,778 | |||
| Entertainment - 0.8% | |||
| Beijing Kunlun Tech Co. Ltd. (A Shares) (b) | 160,100 | 534,663 | |
| Bilibili, Inc. ADR (b)(c) | 34,498 | 885,909 | |
| CD Projekt RED SA | 59,735 | 4,286,035 | |
| Gravity Co. Ltd. ADR (b) | 498 | 13,695 | |
| HUYA, Inc. ADR (b) | 75,700 | 1,499,617 | |
| International Games Systems Co. Ltd. | 221,000 | 4,357,577 | |
| iQIYI, Inc. ADR (b) | 113,600 | 2,548,048 | |
| NetEase, Inc. ADR | 59,601 | 18,995,435 | |
| Nexon Co. Ltd. | 157,000 | 2,499,249 | |
| NHN Entertainment Corp. (b) | 2,843 | 165,013 | |
| Tencent Music Entertainment Group ADR (b) | 130,100 | 1,578,113 | |
| Wuhu Sanqi Interactive Entertainment Network Technology Group Co. Ltd. (A Shares) | 393,380 | 1,905,026 | |
| 39,268,380 | |||
| Interactive Media & Services - 4.9% | |||
| 58.com, Inc. ADR (b) | 30,362 | 1,675,072 | |
| Autohome, Inc. ADR Class A | 100,783 | 7,827,816 | |
| Baidu.com, Inc. sponsored ADR (b) | 122,721 | 14,724,066 | |
| Kakao Corp. | 19,564 | 2,802,165 | |
| Mail.Ru Group Ltd. GDR (Reg. S) (b) | 311,905 | 6,099,321 | |
| Momo, Inc. ADR | 130,100 | 3,658,412 | |
| NAVER Corp. | 52,858 | 7,658,921 | |
| Tencent Holdings Ltd. | 3,387,489 | 171,761,639 | |
| Weibo Corp. sponsored ADR (b) | 11,389 | 479,932 | |
| Yandex NV Series A (b)(c) | 477,740 | 19,401,021 | |
| 236,088,365 | |||
| Media - 0.0% | |||
| BlueFocus Intelligent Communications Group Co. Ltd. (A Shares) | 261,600 | 277,989 | |
| Cheil Worldwide, Inc. | 21,770 | 350,790 | |
| Hyundai HCN | 146,658 | 394,472 | |
| INNOCEAN Worldwide, Inc. | 3,518 | 198,332 | |
| 1,221,583 | |||
| Wireless Telecommunication Services - 1.1% | |||
| America Movil S.A.B. de CV Series L sponsored ADR | 159,370 | 2,530,796 | |
| Bharti Airtel Ltd. (b) | 1,139,936 | 8,226,699 | |
| China Mobile Ltd. | 2,312,000 | 18,400,317 | |
| China Mobile Ltd. sponsored ADR | 51,644 | 2,056,464 | |
| China United Network Communications Ltd. (A Shares) | 9,161,354 | 7,180,289 | |
| Etihad Etisalat Co. (b) | 96,454 | 589,805 | |
| Globe Telecom, Inc. | 1,795 | 62,577 | |
| Mobile Telecommunications Co. Saudi Arabia (b) | 1,131,224 | 3,051,576 | |
| Mobile TeleSystems OJSC sponsored ADR | 437,376 | 4,242,547 | |
| SK Telecom Co. Ltd. | 12,259 | 2,170,719 | |
| SK Telecom Co. Ltd. sponsored ADR | 19,876 | 381,818 | |
| Turkcell Iletisim Hizmet A/S | 584,447 | 1,298,198 | |
| VEON Ltd. sponsored ADR | 277,792 | 550,028 | |
| 50,741,833 | |||
| TOTAL COMMUNICATION SERVICES | 351,497,939 | ||
| CONSUMER DISCRETIONARY - 10.5% | |||
| Auto Components - 0.4% | |||
| Fuyao Glass Industries Group Co. Ltd. (A Shares) | 3,352,633 | 11,109,992 | |
| Huayu Automotive Systems Co. Ltd. (A Shares) | 584,831 | 2,354,564 | |
| Hyundai Mobis | 4,983 | 871,401 | |
| Motherson Sumi Systems Ltd. (b) | 1,258,401 | 1,798,112 | |
| Sailun Group Co. Ltd. A Shares | 642,920 | 417,460 | |
| Tianneng Power International Ltd. | 1,275,826 | 944,389 | |
| Yoo Sung Enterprise | 12,785 | 25,179 | |
| 17,521,097 | |||
| Automobiles - 0.8% | |||
| Bajaj Auto Ltd. | 225,034 | 8,965,498 | |
| Dongfeng Motor Group Co. Ltd. (H Shares) | 1,804,000 | 1,425,611 | |
| Guangzhou Automobile Group Co. Ltd. (H Shares) | 1,786,000 | 1,991,064 | |
| Hero Motocorp Ltd. | 241,697 | 6,836,348 | |
| Hyundai Motor Co. | 18,247 | 1,747,419 | |
| Kia Motors Corp. | 308,616 | 9,316,098 | |
| Mahindra & Mahindra Ltd. | 113,890 | 717,592 | |
| Maruti Suzuki India Ltd. | 22,078 | 1,912,327 | |
| PT Astra International Tbk | 10,474,100 | 4,033,414 | |
| 36,945,371 | |||
| Diversified Consumer Services - 0.5% | |||
| Estacio Participacoes SA | 738,009 | 8,563,538 | |
| New Oriental Education & Technology Group, Inc. sponsored ADR (b) | 93,574 | 11,967,179 | |
| TAL Education Group ADR (b) | 82,174 | 4,469,444 | |
| Visang Education, Inc. | 8,025 | 57,471 | |
| 25,057,632 | |||
| Hotels, Restaurants & Leisure - 0.5% | |||
| Huazhu Group Ltd. ADR | 7,837 | 264,499 | |
| Jubilant Foodworks Ltd. | 101,321 | 2,453,932 | |
| Sands China Ltd. | 2,547,922 | 11,848,900 | |
| Yum China Holdings, Inc. | 221,698 | 9,708,155 | |
| 24,275,486 | |||
| Household Durables - 1.4% | |||
| Cyrela Brazil Realty SA | 55,900 | 372,883 | |
| Direcional Engenharia SA | 11,200 | 37,593 | |
| Even Construtora e Incorporadora SA (b) | 28,253 | 90,599 | |
| Gree Electric Appliances, Inc. of Zhuhai (A Shares) | 437,800 | 3,706,800 | |
| Haier Electronics Group Co. Ltd. | 2,030,349 | 5,808,439 | |
| Haier Smart Home Co. Ltd. (A Shares) | 1,606,322 | 3,910,154 | |
| LG Electronics, Inc. | 165,448 | 8,321,586 | |
| Midea Group Co. Ltd. (A Shares) | 4,546,790 | 34,497,845 | |
| MRV Engenharia e Participacoes SA | 218,981 | 954,391 | |
| Whirlpool of India Ltd. | 1,156 | 34,726 | |
| Zhejiang Supor Cookware Co. Ltd. | 881,095 | 9,255,848 | |
| 66,990,864 | |||
| Internet & Direct Marketing Retail - 5.6% | |||
| Alibaba Group Holding Ltd. sponsored ADR (b) | 859,474 | 178,770,592 | |
| B2W Companhia Global do Varejo (b) | 115,700 | 1,607,987 | |
| Ctrip.com International Ltd. ADR (b) | 134,584 | 4,085,970 | |
| Danawa Co. Ltd. | 1,879 | 34,424 | |
| JD.com, Inc. sponsored ADR (b) | 806,347 | 31,052,423 | |
| MakeMyTrip Ltd. (b) | 21,761 | 500,721 | |
| Meituan Dianping Class B (b) | 686,700 | 8,712,589 | |
| MercadoLibre, Inc. (b) | 11,971 | 7,374,495 | |
| Naspers Ltd. Class N | 182,852 | 28,590,031 | |
| Prosus NV (b) | 22,243 | 1,555,450 | |
| Tongcheng-Elong Holdings Ltd. (b) | 1,582,000 | 2,411,053 | |
| Vipshop Holdings Ltd. ADR (b) | 599,377 | 7,690,007 | |
| 272,385,742 | |||
| Multiline Retail - 0.3% | |||
| Lojas Renner SA | 1,175,312 | 14,008,392 | |
| Magazine Luiza SA | 87,187 | 984,970 | |
| 14,993,362 | |||
| Specialty Retail - 0.4% | |||
| Chow Tai Fook Jewellery Group Ltd. | 82,000 | 71,007 | |
| Lewis Group Ltd. | 11,913 | 20,985 | |
| Mr Price Group Ltd. | 608,009 | 5,971,751 | |
| Petrobras Distribuidora SA | 506,581 | 2,956,632 | |
| SSI Group, Inc. | 417,000 | 16,262 | |
| Via Varejo SA (b) | 299,560 | 925,093 | |
| Zhongsheng Group Holdings Ltd. Class H | 2,752,000 | 10,467,838 | |
| 20,429,568 | |||
| Textiles, Apparel & Luxury Goods - 0.6% | |||
| adidas AG | 3,767 | 1,060,592 | |
| Anta Sports Products Ltd. | 791,000 | 6,357,428 | |
| CECEP COSTIN New Materials Group Ltd. (b)(d) | 741,000 | 28,518 | |
| Fila Holdings Corp. | 46,374 | 1,482,905 | |
| Jinli Group Holdings Ltd. | 46,782 | 14,902 | |
| LG Fashion Corp. | 7,144 | 74,661 | |
| Li Ning Co. Ltd. | 2,369,000 | 6,230,212 | |
| LPP SA | 18 | 31,859 | |
| Mavi Jeans Class B (a)(b) | 311,998 | 2,678,954 | |
| Pou Chen Corp. | 189,000 | 211,002 | |
| Regina Miracle International Holdings Ltd. (a) | 351,000 | 195,876 | |
| Shenzhou International Group Holdings Ltd. | 799,200 | 9,816,985 | |
| Titan Co. Ltd. | 19,698 | 340,660 | |
| Weiqiao Textile Co. Ltd. (H Shares) | 426,500 | 110,523 | |
| 28,635,077 | |||
| TOTAL CONSUMER DISCRETIONARY | 507,234,199 | ||
| CONSUMER STAPLES - 4.9% | |||
| Beverages - 1.3% | |||
| Anheuser-Busch InBev SA NV | 64,353 | 3,718,383 | |
| China Resources Beer Holdings Co. Ltd. | 1,784,000 | 8,262,014 | |
| Coca-Cola Icecek Sanayi A/S | 1,563 | 11,313 | |
| Fomento Economico Mexicano S.A.B. de CV: | |||
| unit | 564,551 | 4,566,487 | |
| sponsored ADR | 158,222 | 12,877,689 | |
| Heineken NV (Bearer) | 61,411 | 6,118,500 | |
| Kweichow Moutai Co. Ltd. (A Shares) | 105,621 | 15,967,133 | |
| Shanghai Bairun Investment Holding Group Co. Ltd. (A Shares) | 1,297,300 | 5,638,620 | |
| Thai Beverage PCL | 9,711,300 | 5,438,161 | |
| 62,598,300 | |||
| Food & Staples Retailing - 1.6% | |||
| Avenue Supermarts Ltd. (a)(b) | 21,122 | 676,691 | |
| Bidcorp Ltd. | 92,032 | 1,665,283 | |
| Bim Birlesik Magazalar A/S JSC | 1,198,264 | 9,238,792 | |
| C.P. ALL PCL (For. Reg.) | 5,745,900 | 11,974,419 | |
| Clicks Group Ltd. | 121,082 | 1,830,946 | |
| Dairy Farm International Holdings Ltd. | 36,100 | 173,280 | |
| Drogasil SA | 466,922 | 12,519,052 | |
| President Chain Store Corp. | 501,000 | 4,917,736 | |
| PUREGOLD Price Club, Inc. | 2,790,500 | 2,023,290 | |
| Shoprite Holdings Ltd. | 478,893 | 3,488,221 | |
| Sun Art Retail Group Ltd. | 697,000 | 890,586 | |
| Wal-Mart de Mexico SA de CV Series V | 3,773,300 | 10,582,033 | |
| X5 Retail Group NV GDR (Reg. S) | 402,707 | 12,613,461 | |
| Yifeng Pharmacy Chain Co. Ltd. | 180,000 | 2,103,276 | |
| 74,697,066 | |||
| Food Products - 1.3% | |||
| Angel Yeast Co. Ltd. (A Shares) | 99,400 | 412,274 | |
| AVI Ltd. | 158,412 | 741,913 | |
| Charoen Pokphand Foods PCL (For. Reg.) | 2,396,600 | 2,031,983 | |
| China Mengniu Dairy Co. Ltd. | 9,962,496 | 35,721,843 | |
| Gruma S.A.B. de CV Series B | 177,965 | 1,709,397 | |
| Inner Mongoli Yili Industries Co. Ltd. (A Shares) | 567,100 | 2,344,820 | |
| JBS SA | 2,007,047 | 10,188,056 | |
| Minerva SA (b) | 315,049 | 818,638 | |
| Tiger Brands Ltd. | 41,567 | 408,808 | |
| Unified-President Enterprises Corp. | 2,767,000 | 6,659,204 | |
| Universal Robina Corp. | 1,081,830 | 2,995,543 | |
| 64,032,479 | |||
| Household Products - 0.2% | |||
| C&S Paper Co. Ltd. (A Shares) | 1,873,500 | 3,925,482 | |
| Hindustan Unilever Ltd. | 195,203 | 5,852,269 | |
| Kimberly-Clark de Mexico SA de CV: | |||
| Series A | 452,900 | 857,572 | |
| Series A sponsored ADR | 2,476 | 23,324 | |
| 10,658,647 | |||
| Personal Products - 0.5% | |||
| Hengan International Group Co. Ltd. | 379,000 | 2,812,720 | |
| LG Household & Health Care Ltd. | 13,778 | 14,009,075 | |
| Natura & Co. Holding SA | 584,900 | 5,952,458 | |
| Organic Tea Cosmetics Holdings Co. Ltd. | 4,513 | 4,190 | |
| 22,778,443 | |||
| TOTAL CONSUMER STAPLES | 234,764,935 | ||
| ENERGY - 2.9% | |||
| Energy Equipment & Services - 0.2% | |||
| China Oilfield Services Ltd. (H Shares) | 2,642,000 | 3,389,352 | |
| Ezion Holdings Ltd. warrants 4/16/23 (b)(d) | 5,020,014 | 5,658 | |
| Tenaris SA sponsored ADR | 157,200 | 2,861,040 | |
| Yantai Jereh Oilfield Services (A Shares) | 1,054,500 | 5,218,244 | |
| 11,474,294 | |||
| Oil, Gas & Consumable Fuels - 2.7% | |||
| China Petroleum & Chemical Corp. (H Shares) | 17,134,000 | 8,867,822 | |
| China Shenhua Energy Co. Ltd. (H Shares) | 395,000 | 685,106 | |
| CNOOC Ltd. | 15,172,099 | 21,106,091 | |
| CNOOC Ltd. sponsored ADR | 9,900 | 1,369,467 | |
| Compania de Petroleos de Chile SA (COPEC) | 280,010 | 2,173,595 | |
| Cosan Ltd. Class A (b) | 23,052 | 420,930 | |
| Ecopetrol SA ADR | 240,399 | 4,243,042 | |
| Exxaro Resources Ltd. | 126,121 | 913,697 | |
| Gazprom OAO sponsored ADR (Reg. S) | 1,621,628 | 9,925,649 | |
| Grupa Lotos SA | 4,822 | 73,684 | |
| Lukoil PJSC | 33,201 | 2,873,410 | |
| Lukoil PJSC sponsored ADR (c) | 277,091 | 23,901,437 | |
| MOL Hungarian Oil and Gas PLC Series A (For. Reg.) | 159,190 | 1,228,561 | |
| NOVATEK OAO GDR (Reg. S) | 88,363 | 12,892,727 | |
| PetroChina Co. Ltd. (H Shares) | 3,564,000 | 1,392,252 | |
| Petroleo Brasileiro SA - Petrobras (ON) | 190,300 | 1,155,358 | |
| Polski Koncern Naftowy Orlen SA | 265,061 | 4,004,033 | |
| PT Adaro Energy Tbk | 20,554,500 | 1,654,675 | |
| PTT Exploration and Production PCL NVDR | 1,024,773 | 3,442,977 | |
| QGEP Participacoes SA | 30,900 | 91,831 | |
| Reliance Industries Ltd. | 1,034,417 | 18,946,748 | |
| Rosneft Oil Co. OJSC | 354,531 | 2,174,094 | |
| SK Energy Co. Ltd. | 26,610 | 2,503,980 | |
| Susco Public Co. Ltd. unit | 267,500 | 20,179 | |
| Tatneft PAO sponsored ADR | 34,126 | 2,052,063 | |
| Tupras Turkiye Petrol Rafinerileri A/S | 74,801 | 1,216,120 | |
| 129,329,528 | |||
| TOTAL ENERGY | 140,803,822 | ||
| FINANCIALS - 15.4% | |||
| Banks - 10.2% | |||
| Absa Group Ltd. | 725,731 | 6,245,374 | |
| Abu Dhabi Commercial Bank PJSC | 685,646 | 1,331,025 | |
| Abu Dhabi Islamic Bank (b) | 39,990 | 59,775 | |
| Agricultural Bank of China Ltd. (H Shares) | 1,597,000 | 639,210 | |
| Akbank TAS (b) | 3,171,440 | 3,440,827 | |
| Al Rajhi Bank | 278,872 | 4,601,407 | |
| Alpha Bank AE (b) | 4,318,497 | 6,304,732 | |
| AMMB Holdings Bhd | 69,200 | 60,767 | |
| Arab National Bank | 151,132 | 1,019,230 | |
| Axis Bank Ltd. | 457,920 | 4,401,875 | |
| Banco de Chile sponsored ADR | 1,046 | 18,901 | |
| Banco do Brasil SA | 766,791 | 8,035,025 | |
| Banco Santander Chile sponsored ADR | 299,918 | 5,419,518 | |
| Banco Santander Mexico SA | 1,677,122 | 2,146,355 | |
| Bancolombia SA sponsored ADR | 65,589 | 3,114,166 | |
| Bank Al-Jazira | 65,767 | 244,029 | |
| Bank of China Ltd. (H Shares) | 44,106,000 | 17,427,387 | |
| Bank Polska Kasa Opieki SA | 112,122 | 2,537,193 | |
| Capitec Bank Holdings Ltd. | 64,531 | 5,462,220 | |
| China Construction Bank Corp. (H Shares) | 53,329,000 | 43,848,778 | |
| China Merchants Bank Co. Ltd.: | |||
| (A Shares) | 784,081 | 3,835,206 | |
| (H Shares) | 1,122,000 | 5,289,737 | |
| Chinatrust Financial Holding Co. Ltd. | 14,175,058 | 10,578,390 | |
| Chongqing Rural Commercial Bank Co. Ltd. (H Shares) | 34,000 | 15,353 | |
| Commercial International Bank SAE sponsored GDR | 903,499 | 4,449,281 | |
| Credicorp Ltd. (United States) | 73,473 | 13,318,451 | |
| Dubai Islamic Bank Pakistan Ltd. (b) | 139,333 | 204,854 | |
| E.SUN Financial Holdings Co. Ltd. | 6,564,128 | 6,293,162 | |
| EFG Eurobank Ergasias SA (b) | 3,690,736 | 2,351,686 | |
| Emirates NBD Bank PJSC (b) | 399,276 | 1,364,312 | |
| Grupo Aval Acciones y Valores SA ADR | 190,142 | 1,545,854 | |
| Grupo Financiero Banorte S.A.B. de CV Series O | 3,268,218 | 17,706,791 | |
| Grupo Financiero Inbursa S.A.B. de CV Series O | 320,573 | 343,977 | |
| Guaranty Trust Bank PLC GDR (Reg. S) | 53,450 | 208,423 | |
| Habib Bank Ltd. | 309,900 | 314,381 | |
| Hana Financial Group, Inc. | 320,325 | 8,375,835 | |
| HDFC Bank Ltd. | 792,846 | 12,947,027 | |
| HDFC Bank Ltd. sponsored ADR | 222,926 | 12,227,491 | |
| ICICI Bank Ltd. | 893,695 | 6,173,334 | |
| ICICI Bank Ltd. sponsored ADR | 2,258,563 | 31,326,269 | |
| Industrial & Commercial Bank of China Ltd. (H Shares) | 47,054,000 | 32,174,191 | |
| JB Financial Group Co. Ltd. | 5,224 | 21,795 | |
| JSC Halyk Bank of Kazakhstan GDR unit | 199,312 | 2,827,309 | |
| Kasikornbank PCL (For. Reg.) | 830,800 | 3,146,770 | |
| KB Financial Group, Inc. | 304,379 | 9,731,710 | |
| Kiatnakin Bank PCL (For. Reg.) | 485,800 | 958,512 | |
| Komercni Banka A/S | 60,829 | 1,866,106 | |
| Kotak Mahindra Bank Ltd. | 79,595 | 1,777,964 | |
| Krung Thai Bank PCL NVDR | 3,037,100 | 1,347,683 | |
| Malayan Banking Bhd | 1,072,125 | 2,142,469 | |
| Mega Financial Holding Co. Ltd. | 1,084,000 | 1,154,190 | |
| National Bank of Abu Dhabi PJSC | 3,551,234 | 13,845,834 | |
| National Bank of Kuwait | 1,217,016 | 4,028,880 | |
| National Commercial Bank | 166,158 | 1,962,095 | |
| Nova Ljubljanska banka d.d. unit | 227,428 | 2,901,732 | |
| OTP Bank PLC | 649,242 | 28,168,585 | |
| Powszechna Kasa Oszczednosci Bank SA | 16,134 | 129,181 | |
| PT Bank Bukopin Tbk (b) | 4,000 | 46 | |
| PT Bank Central Asia Tbk | 6,772,700 | 14,845,891 | |
| PT Bank Mandiri (Persero) Tbk | 2,167,000 | 1,098,792 | |
| PT Bank Negara Indonesia (Persero) Tbk | 7,216,300 | 3,533,334 | |
| PT Bank Rakyat Indonesia Tbk | 8,717,100 | 2,545,715 | |
| Qatar National Bank SAQ | 574,059 | 2,970,208 | |
| Riyad Bank | 94,706 | 553,367 | |
| Sberbank of Russia | 4,484,193 | 15,871,179 | |
| Sberbank of Russia sponsored ADR (c) | 3,249,650 | 46,368,150 | |
| Shinhan Financial Group Co. Ltd. | 82,930 | 2,243,117 | |
| Sinopac Holdings Co. | 414,000 | 176,162 | |
| Standard Bank Group Ltd. | 562,715 | 5,408,957 | |
| State Bank of India (b) | 1,216,886 | 5,083,010 | |
| TCS Group Holding PLC GDR unit | 113,599 | 2,485,355 | |
| Thanachart Capital PCL: | |||
| (For. Reg.) | 1,420,500 | 2,375,004 | |
| NVDR | 626,962 | 1,048,249 | |
| TISCO Financial Group PCL | 682,700 | 2,131,409 | |
| Turkiye Garanti Bankasi A/S (b) | 4,071,609 | 6,207,966 | |
| Turkiye Halk Bankasi A/S (b) | 289,353 | 277,708 | |
| Turkiye Is Bankasi A/S Series C (b) | 5,487,232 | 5,028,623 | |
| Turkiye Vakiflar Bankasi TAO (b) | 3,823,822 | 3,252,619 | |
| United Bank Ltd. | 2,898,095 | 3,113,265 | |
| Woori Financial Group, Inc. (b) | 132,508 | 1,060,408 | |
| Yapi ve Kredi Bankasi A/S (b) | 1,580,932 | 581,043 | |
| 491,672,191 | |||
| Capital Markets - 0.3% | |||
| BM&F BOVESPA SA | 937,962 | 10,067,796 | |
| CITIC Securities Co. Ltd. (H Shares) | 487,000 | 1,040,849 | |
| Hong Kong Exchanges and Clearing Ltd. | 9,400 | 308,470 | |
| Huatai Securities Co. Ltd. (H Shares) (a) | 644,400 | 1,119,330 | |
| Korea Investment Holdings Co. Ltd. | 4,137 | 216,348 | |
| Meritz Securities Co. Ltd. | 66,766 | 193,205 | |
| Moscow Exchange MICEX-RTS OAO (b) | 879,379 | 1,323,995 | |
| Noah Holdings Ltd. sponsored ADR (b)(c) | 14,820 | 420,592 | |
| Samsung Securities Co. Ltd. | 3,829 | 105,541 | |
| XP, Inc. Class A (b) | 19,572 | 678,170 | |
| 15,474,296 | |||
| Consumer Finance - 0.3% | |||
| Compartamos S.A.B. de CV | 284,714 | 273,243 | |
| Qudian, Inc. ADR (b)(c) | 27,998 | 73,355 | |
| Shriram Transport Finance Co. Ltd. | 813,138 | 13,410,124 | |
| 13,756,722 | |||
| Diversified Financial Services - 0.4% | |||
| Alexander Forbes Group Holdings Ltd. | 888 | 272 | |
| Aseer Trading Tourism & Manufacturing Co. (b) | 14,265 | 42,131 | |
| Chailease Holding Co. Ltd. | 451,000 | 1,687,581 | |
| FirstRand Ltd. | 1,936,110 | 6,912,542 | |
| Haci Omer Sabanci Holding A/S | 879,341 | 1,201,010 | |
| Power Finance Corp. Ltd. | 281,909 | 425,357 | |
| Rec Ltd. | 844,074 | 1,370,737 | |
| Yuanta Financial Holding Co. Ltd. | 14,674,000 | 9,224,600 | |
| 20,864,230 | |||
| Insurance - 3.6% | |||
| AIA Group Ltd. | 4,451,784 | 44,617,763 | |
| BB Seguridade Participacoes SA | 1,347,923 | 9,600,248 | |
| Cathay Financial Holding Co. Ltd. | 551,738 | 726,916 | |
| China Life Insurance Co. Ltd. (b) | 299,000 | 235,984 | |
| China Life Insurance Co. Ltd. (H Shares) | 2,880,000 | 6,959,267 | |
| China Pacific Insurance (Group) Co. Ltd. (H Shares) | 2,199,000 | 7,235,965 | |
| FPC Par Corretora de Seguros | 17,800 | 56,124 | |
| Fubon Financial Holding Co. Ltd. | 2,413,000 | 3,512,196 | |
| Hyundai Fire & Marine Insurance Co. Ltd. | 262,911 | 4,947,944 | |
| IRB Brasil Resseguros SA | 1,043,525 | 7,758,941 | |
| Liberty Holdings Ltd. | 494,964 | 3,018,162 | |
| MMI Holdings Ltd. | 1,647,333 | 1,852,032 | |
| Old Mutual Ltd. | 760,307 | 773,467 | |
| PICC Property & Casualty Co. Ltd. (H Shares) | 2,648,000 | 2,741,419 | |
| Ping An Insurance Group Co. of China Ltd.: | |||
| (A Shares) | 483,398 | 5,373,278 | |
| (H Shares) | 4,007,500 | 45,655,028 | |
| Porto Seguro SA | 489,321 | 6,672,509 | |
| Powszechny Zaklad Ubezpieczen SA | 420,867 | 3,752,963 | |
| Qualitas Controladora S.A.B. de CV | 96,305 | 412,316 | |
| Samsung Fire & Marine Insurance Co. Ltd. | 16,957 | 2,795,901 | |
| Sanlam Ltd. | 3,134,202 | 13,165,239 | |
| Sul America SA unit | 245,202 | 2,964,203 | |
| 174,827,865 | |||
| Thrifts & Mortgage Finance - 0.6% | |||
| Housing Development Finance Corp. Ltd. | 741,545 | 22,242,056 | |
| LIC Housing Finance Ltd. | 1,330,842 | 5,875,490 | |
| 28,117,546 | |||
| TOTAL FINANCIALS | 744,712,850 | ||
| HEALTH CARE - 0.9% | |||
| Biotechnology - 0.1% | |||
| Hualan Biological Engineer, Inc. (A Shares) | 247,300 | 1,467,824 | |
| Innovent Biolgics, Inc. (a)(b) | 373,000 | 1,703,502 | |
| Medy-Tox, Inc. | 20 | 4,888 | |
| 3,176,214 | |||
| Health Care Equipment & Supplies - 0.0% | |||
| Shenzhen Mindray Bio-Medical Electronics Co. Ltd. (A Shares) | 33,000 | 1,128,012 | |
| Supermax Corp. Bhd | 64,476 | 24,331 | |
| 1,152,343 | |||
| Health Care Providers & Services - 0.2% | |||
| Aier Eye Hospital Group Co. Ltd. (A Shares) | 46,100 | 263,732 | |
| Hapvida Participacoes e Investimentos SA (a) | 62,200 | 767,781 | |
| Mediclinic International PLC (London) | 191,426 | 845,074 | |
| Qualicorp Consultoria E Corret | 229,832 | 1,760,269 | |
| Selcuk Ecza Deposu Tic A/S | 122,624 | 129,301 | |
| Shanghai Pharmaceuticals Holding Co. Ltd. (H Shares) | 705,300 | 1,290,260 | |
| Sinopharm Group Co. Ltd. (H Shares) | 779,700 | 2,405,617 | |
| 7,462,034 | |||
| Life Sciences Tools & Services - 0.1% | |||
| Hangzhou Tigermed Consulting Co. Ltd. (A Shares) | 13,796 | 150,944 | |
| Pharmaron Beijing Co. Ltd. (H Shares) (a)(b) | 86,500 | 588,133 | |
| WuXi AppTec Co. Ltd. | 21,637 | 328,023 | |
| WuXi AppTec Co. Ltd. (H Shares) (a) | 140,560 | 2,071,885 | |
| Wuxi Biologics (Cayman), Inc. (a)(b) | 264,500 | 3,868,249 | |
| 7,007,234 | |||
| Pharmaceuticals - 0.5% | |||
| Alembic Pharmaceuticals Ltd. (b) | 4,278 | 37,151 | |
| Aurobindo Pharma Ltd. | 171,185 | 1,192,931 | |
| CSPC Pharmaceutical Group Ltd. | 1,398,000 | 3,185,180 | |
| Dr. Reddy's Laboratories Ltd. | 54,473 | 2,203,225 | |
| Hansoh Pharmaceutical Group Co. Ltd. (a) | 1,200,000 | 4,164,208 | |
| J.B. Chemicals & Pharmaceuticals Ltd. | 5,061 | 37,585 | |
| Jiangsu Hengrui Medicine Co. Ltd. (A Shares) | 49,800 | 598,929 | |
| Lijun International Pharmaceutical Holding Ltd. | 814,000 | 681,901 | |
| Pfizer Ltd. | 2,143 | 123,905 | |
| PT Kalbe Farma Tbk | 35,808,056 | 3,044,839 | |
| Richter Gedeon PLC | 188,971 | 3,834,156 | |
| Sino Biopharmaceutical Ltd. | 359,000 | 519,502 | |
| Yunnan Baiyao Group Co. Ltd. (A Shares) | 253,500 | 2,852,983 | |
| 22,476,495 | |||
| TOTAL HEALTH CARE | 41,274,320 | ||
| INDUSTRIALS - 2.4% | |||
| Aerospace & Defense - 0.1% | |||
| Elbit Systems Ltd. (Israel) | 16,800 | 2,518,668 | |
| Garden Reach Shipbuilders & Engineers Ltd. (b) | 23,582 | 49,561 | |
| 2,568,229 | |||
| Air Freight & Logistics - 0.0% | |||
| Hyundai Glovis Co. Ltd. | 1,943 | 199,015 | |
| Airlines - 0.1% | |||
| Air Arabia PJSC (b) | 835,141 | 318,335 | |
| AirAsia Group BHD | 1,811,200 | 429,856 | |
| Azul SA sponsored ADR (b) | 32,566 | 960,697 | |
| Copa Holdings SA Class A | 24,058 | 2,000,182 | |
| Wizz Air Holdings PLC (a)(b) | 6,780 | 301,694 | |
| 4,010,764 | |||
| Commercial Services & Supplies - 0.0% | |||
| Country Garden Services Holdings Co. Ltd. | 319,502 | 1,246,037 | |
| Frontken Corp. BHD | 248,800 | 134,040 | |
| Indian Railway Catering & Tourism Corp. Ltd. | 14,408 | 346,361 | |
| 1,726,438 | |||
| Construction & Engineering - 0.4% | |||
| China Communications Construction Co. Ltd. (H Shares) | 2,213,000 | 1,649,459 | |
| China Communications Services Corp. Ltd. (H Shares) | 1,926,000 | 1,489,901 | |
| China National Chemical Engineering Co. Ltd. (A Shares) | 3,939,592 | 3,915,955 | |
| China Railway Construction Corp. Ltd. (H Shares) | 1,635,000 | 1,870,969 | |
| Daelim Industrial Co. | 23,895 | 1,442,622 | |
| Larsen & Toubro Ltd. | 346,238 | 5,668,329 | |
| Orascom Construction PLC | 1,460 | 8,219 | |
| Sinopec Engineering Group Co. Ltd. (H Shares) | 465,000 | 230,263 | |
| Tekfen Holding A/S | 773,855 | 1,844,360 | |
| 18,120,077 | |||
| Electrical Equipment - 0.1% | |||
| DONGYANG E&P, Inc. | 21,665 | 243,557 | |
| Polycab India Ltd. | 51,478 | 754,155 | |
| Weg SA | 252,529 | 2,436,688 | |
| Zhuzhou CRRC Times Electric Co. Ltd. (H Shares) | 486,700 | 1,701,421 | |
| 5,135,821 | |||
| Industrial Conglomerates - 0.3% | |||
| Astra Industrial Group (b) | 3,085 | 12,861 | |
| Fosun International Ltd. | 1,508,000 | 1,921,031 | |
| Hanwha Corp. | 50,367 | 840,946 | |
| Hong Leong Industries Bhd | 3,000 | 6,622 | |
| Industries Qatar QSC (b) | 243,150 | 600,321 | |
| Koc Holding A/S | 595,641 | 1,644,268 | |
| LG Corp. | 39,163 | 2,201,341 | |
| Mannai Corp. | 86,440 | 72,238 | |
| SK C&C Co. Ltd. | 4,071 | 650,894 | |
| SM Investments Corp. | 319,900 | 6,109,005 | |
| 14,059,527 | |||
| Machinery - 0.6% | |||
| Airtac International Group | 378,000 | 5,900,529 | |
| Estun Automation Co. Ltd. (A Shares) | 198,200 | 314,650 | |
| HIWIN Technologies Corp. | 524,270 | 5,116,752 | |
| Lonking Holdings Ltd. | 10,993,000 | 3,060,271 | |
| Sany Heavy Industry Co. Ltd. (A Shares) | 910,100 | 2,268,758 | |
| Shenzhen Inovance Technology Co. Ltd. (A Shares) | 1,032,300 | 4,179,723 | |
| Sinotruk Hong Kong Ltd. (c) | 1,614,983 | 3,087,010 | |
| Techtronic Industries Co. Ltd. | 136,000 | 1,100,038 | |
| Weichai Power Co. Ltd. (H Shares) | 1,951,000 | 3,839,428 | |
| XCMG Construction Machinery Co. Ltd. (A Shares) | 1,398,600 | 1,054,158 | |
| Zoomlion Heavy Industry Science and Technology Co. Ltd. (H Shares) | 327,800 | 271,660 | |
| 30,192,977 | |||
| Marine - 0.0% | |||
| Costamare, Inc. | 9,179 | 59,939 | |
| Qatar Navigation QPSC | 23,620 | 36,391 | |
| 96,330 | |||
| Professional Services - 0.1% | |||
| 51job, Inc. sponsored ADR (b) | 11,609 | 868,005 | |
| Centre Testing International Group Co. Ltd. (A Shares) | 1,458,652 | 3,396,314 | |
| Sporton International, Inc. | 169,000 | 1,169,154 | |
| 5,433,473 | |||
| Road & Rail - 0.2% | |||
| Globaltrans Investment PLC GDR (Reg. S) | 49,724 | 367,695 | |
| Localiza Rent A Car SA | 175,965 | 1,949,352 | |
| Rumo SA (b) | 1,060,178 | 5,007,035 | |
| United International Transportation Co. | 260,323 | 2,411,362 | |
| 9,735,444 | |||
| Trading Companies & Distributors - 0.0% | |||
| Al Hassan Ghazi Ibrahim Shaker Co. (b) | 13,536 | 43,875 | |
| CCS Supply Chain Management Co. Ltd. A Shares | 88,072 | 78,726 | |
| 122,601 | |||
| Transportation Infrastructure - 0.5% | |||
| Airports of Thailand PCL (For. Reg.) | 970,200 | 1,837,384 | |
| DP World Ltd. | 295,314 | 4,798,853 | |
| Grupo Aeroportuario del Pacifico S.A.B. de CV Series B | 200,019 | 2,171,217 | |
| Grupo Aeroportuario del Sureste S.A.B. de CV Series B sponsored ADR | 11,676 | 1,949,892 | |
| Grupo Aeroportuario Norte S.A.B. de CV | 510,888 | 3,355,306 | |
| Shanghai International Airport Co. Ltd. (A Shares) | 864,317 | 8,122,808 | |
| Zhejiang Expressway Co. Ltd. (H Shares) | 1,226,000 | 926,381 | |
| 23,161,841 | |||
| TOTAL INDUSTRIALS | 114,562,537 | ||
| INFORMATION TECHNOLOGY - 12.1% | |||
| Communications Equipment - 0.0% | |||
| Accton Technology Corp. | 380,000 | 2,015,806 | |
| Electronic Equipment & Components - 1.9% | |||
| AAC Technology Holdings, Inc. | 186,500 | 1,221,402 | |
| AVIC Jonhon OptronicTechnology Co. Ltd. | 217,329 | 1,221,241 | |
| Chaozhou Three-Circle Group Co. (A Shares) | 62,900 | 214,106 | |
| China Railway Signal & Communications Corp. (H Shares) (a) | 474,000 | 243,233 | |
| Coretronic Corp. | 87,400 | 105,919 | |
| Delta Electronics, Inc. | 671,000 | 3,058,847 | |
| FLEXium Interconnect, Inc. | 380,000 | 1,391,668 | |
| Foxconn Industrial Internet Co. Ltd. (A Shares) | 175,500 | 428,713 | |
| Foxconn Technology Co. Ltd. | 31,000 | 60,512 | |
| Hangzhou Hikvision Digital Technology Co. Ltd. (A Shares) | 679,203 | 3,399,925 | |
| Hollysys Automation Technologies Ltd. | 14,647 | 221,756 | |
| Hon Hai Precision Industry Co. Ltd. (Foxconn) | 9,336,626 | 24,498,255 | |
| INTOPS Co. Ltd. | 30,521 | 299,908 | |
| Largan Precision Co. Ltd. | 201,000 | 28,588,761 | |
| Lens Technology Co. Ltd. (A Shares) | 187,300 | 521,561 | |
| LG Display Co. Ltd. (b) | 111,198 | 1,278,745 | |
| LG Innotek Co. Ltd. | 31,609 | 3,421,856 | |
| Partron Co. Ltd. | 8,100 | 60,369 | |
| Pinnacle Technology Holdings Ltd. | 11,198 | 4,865 | |
| Redington India Ltd. | 26,941 | 40,835 | |
| Samsung SDI Co. Ltd. | 25,919 | 6,367,191 | |
| Sirtec International Co. Ltd. | 5,000 | 4,738 | |
| Sunny Optical Technology Group Co. Ltd. | 303,200 | 4,714,284 | |
| Synnex Technology International Corp. | 50,000 | 61,834 | |
| Unimicron Technology Corp. | 3,818,000 | 4,918,086 | |
| Yageo Corp. | 67,000 | 870,091 | |
| Zhen Ding Technology Holding Ltd. | 762,000 | 2,882,419 | |
| 90,101,120 | |||
| IT Services - 1.0% | |||
| HCL Technologies Ltd. | 648,892 | 4,779,986 | |
| Hexaware Technologies Ltd. | 465,190 | 2,305,461 | |
| Infosys Ltd. | 660,846 | 6,670,220 | |
| Infosys Ltd. sponsored ADR | 1,870,657 | 18,837,516 | |
| Mphasis BFL Ltd. | 69,476 | 834,748 | |
| Network International Holdings PLC (a) | 255,044 | 1,741,952 | |
| NIIT Ltd. (b) | 14,423 | 19,754 | |
| PagSeguro Digital Ltd. (b) | 100,561 | 3,154,599 | |
| QIWI PLC Class B sponsored ADR | 16,212 | 282,737 | |
| Samsung SDS Co. Ltd. | 1,984 | 275,083 | |
| Sonata Software Ltd. | 6,875 | 31,745 | |
| StoneCo Ltd. Class A (b) | 57,505 | 2,293,874 | |
| Tata Consultancy Services Ltd. | 238,669 | 6,580,926 | |
| Wipro Ltd. | 535,360 | 1,642,586 | |
| WNS Holdings Ltd. sponsored ADR (b) | 24,362 | 1,603,994 | |
| 51,055,181 | |||
| Semiconductors & Semiconductor Equipment - 5.3% | |||
| ASE Technology Holding Co. Ltd. | 1,937,000 | 4,516,557 | |
| Dongbu HiTek Co. Ltd. | 29,703 | 588,688 | |
| Everlight Electronics Co. Ltd. | 73,000 | 75,607 | |
| King Yuan Electronics Co. Ltd. | 1,125,000 | 1,196,019 | |
| Koh Young Technology, Inc. | 27,733 | 2,203,195 | |
| Malaysian Pacific Industries BHD | 12,286 | 31,841 | |
| MediaTek, Inc. | 805,000 | 9,410,144 | |
| Novatek Microelectronics Corp. | 12,000 | 75,938 | |
| Phison Electronics Corp. | 202,000 | 2,169,915 | |
| Powertech Technology, Inc. | 659,000 | 2,167,501 | |
| Radiant Opto-Electronics Corp. | 250,000 | 796,314 | |
| Realtek Semiconductor Corp. | 947,000 | 6,890,354 | |
| Semiconductor Manufacturing International Corp. (b)(c) | 231,500 | 457,528 | |
| Shenzhen Goodix Technology Co. Ltd. (A Shares) | 63,650 | 2,820,757 | |
| Sino-American Silicon Products, Inc. | 444,000 | 1,504,294 | |
| SK Hynix, Inc. | 763,070 | 55,854,848 | |
| Taiwan Semiconductor Manufacturing Co. Ltd. | 11,627,000 | 120,534,834 | |
| Taiwan Semiconductor Manufacturing Co. Ltd. sponsored ADR | 668,427 | 35,988,110 | |
| Topco Scientific Co. Ltd. | 106,000 | 361,139 | |
| Unisem (M) Bhd | 103,259 | 49,258 | |
| United Microelectronics Corp. | 7,406,000 | 3,715,572 | |
| United Microelectronics Corp. sponsored ADR | 353,437 | 876,524 | |
| Win Semiconductors Corp. | 201,000 | 1,764,089 | |
| 254,049,026 | |||
| Software - 0.1% | |||
| Asseco Poland SA | 19,723 | 307,992 | |
| Globant SA (b) | 10,254 | 1,158,805 | |
| Kingsoft Corp. Ltd. (b) | 158,000 | 510,789 | |
| Mix Telematics Ltd. sponsored ADR | 5,794 | 76,886 | |
| Nucleus Software Exports Ltd. (b) | 31,536 | 127,815 | |
| Totvs SA | 204,300 | 3,244,112 | |
| 5,426,399 | |||
| Technology Hardware, Storage & Peripherals - 3.8% | |||
| ASUSTeK Computer, Inc. | 23,000 | 154,717 | |
| Catcher Technology Co. Ltd. | 445,000 | 3,356,879 | |
| Chicony Electronics Co. Ltd. | 92,000 | 250,665 | |
| Compal Electronics, Inc. | 51,000 | 30,918 | |
| Lenovo Group Ltd. | 6,860,000 | 4,233,047 | |
| Lite-On Technology Corp. | 1,514,000 | 2,167,382 | |
| Pegatron Corp. | 2,364,000 | 4,836,617 | |
| Samsung Electronics Co. Ltd. | 3,679,429 | 166,068,527 | |
| Xiaomi Corp. Class B (a)(b) | 150,600 | 242,660 | |
| 181,341,412 | |||
| TOTAL INFORMATION TECHNOLOGY | 583,988,944 | ||
| MATERIALS - 2.8% | |||
| Chemicals - 0.5% | |||
| China Sanjiang Fine Chemicals Ltd. | 424,000 | 81,591 | |
| LG Chemical Ltd. | 51,808 | 15,876,409 | |
| Sinofert Holdings Ltd. | 2,042,000 | 204,331 | |
| Sociedad Quimica y Minera de Chile SA (PN-B) sponsored ADR | 108,600 | 2,973,468 | |
| Solar Industries India Ltd. (b) | 88,400 | 1,411,202 | |
| Taekwang Industrial Co. Ltd. | 168 | 112,759 | |
| 20,659,760 | |||
| Construction Materials - 0.6% | |||
| Anhui Conch Cement Co. Ltd.: | |||
| (A Shares) | 92,300 | 724,201 | |
| (H Shares) | 2,088,500 | 15,312,094 | |
| Asia Cement (China) Holdings Corp. | 259,584 | 342,338 | |
| CEMEX S.A.B. de CV sponsored ADR | 434,800 | 1,426,144 | |
| China National Building Materials Co. Ltd. (H Shares) | 2,686,442 | 3,105,175 | |
| China Resources Cement Holdings Ltd. | 792,165 | 996,939 | |
| City Cement Co. | 59,139 | 268,620 | |
| Eastern Province Cement Co. | 23,628 | 218,550 | |
| Gansu Qilianshan Cement Group Co. Ltd. (A Shares) | 960,100 | 1,701,334 | |
| JK Cement Ltd. | 135,600 | 2,593,802 | |
| Shree Cement Ltd. | 6,493 | 2,029,287 | |
| West China Cement Ltd. | 346,000 | 55,928 | |
| 28,774,412 | |||
| Containers & Packaging - 0.0% | |||
| Anadolu Cam Sanayii A/S | 134,325 | 81,275 | |
| Bio Pappel S.A.B. de CV (b) | 24,738 | 25,576 | |
| Klabin SA unit | 267,675 | 1,152,249 | |
| 1,259,100 | |||
| Metals & Mining - 1.5% | |||
| Alrosa Co. Ltd. | 2,838,260 | 3,045,636 | |
| Aluminum Corp. of China Ltd. (H Shares) (b) | 594,000 | 157,740 | |
| Anglo American Platinum Ltd. | 37,024 | 2,492,037 | |
| AngloGold Ashanti Ltd. | 330,935 | 5,893,376 | |
| AngloGold Ashanti Ltd. sponsored ADR | 39,500 | 689,275 | |
| Ann Joo Resources Bhd | 500 | 125 | |
| CAP SA | 85,501 | 484,007 | |
| China Molybdenum Co. Ltd. (H Shares) | 453,000 | 169,112 | |
| Compania de Minas Buenaventura SA sponsored ADR | 86,500 | 964,475 | |
| Daehan Steel Co. Ltd. | 2,905 | 12,192 | |
| Eregli Demir ve Celik Fabrikalari T.A.S. | 426,808 | 565,127 | |
| Grupo Mexico SA de CV Series B | 1,513,100 | 3,568,465 | |
| Hindalco Industries Ltd. | 880,082 | 1,891,462 | |
| Impala Platinum Holdings Ltd. | 691,379 | 5,619,649 | |
| KGHM Polska Miedz SA (Bearer) (b) | 45,216 | 829,222 | |
| KISCO Corp. | 6,262 | 19,815 | |
| Korea Zinc Co. Ltd. | 13,629 | 4,704,312 | |
| Kumba Iron Ore Ltd. | 93,581 | 1,724,550 | |
| Magnitogorsk Iron & Steel Works PJSC sponsored GDR (Reg. S) | 37,183 | 282,617 | |
| MMC Norilsk Nickel PJSC sponsored ADR | 368,349 | 11,137,716 | |
| Nanjing Iron & Steel Co. Ltd. | 400,200 | 176,291 | |
| Novolipetsk Steel OJSC GDR (Reg. S) | 12,307 | 236,307 | |
| Polyus PJSC | 8,916 | 1,127,908 | |
| Polyus PJSC unit | 11,923 | 741,296 | |
| POSCO | 49,449 | 8,032,764 | |
| POSCO sponsored ADR | 36,270 | 1,461,318 | |
| Severstal PAO GDR (Reg. S) | 7,512 | 92,093 | |
| Shanxi Taigang Stainless Steel Co. Ltd. (A Shares) | 784,304 | 394,847 | |
| Sheng Yu Steel Co. Ltd. | 35,418 | 22,695 | |
| Southern Copper Corp. | 105,931 | 3,564,578 | |
| Ternium SA sponsored ADR | 178,441 | 3,158,406 | |
| Vale SA sponsored ADR (b) | 839,001 | 8,238,990 | |
| Zijin Mining Group Co. Ltd. (H Shares) | 642,000 | 288,262 | |
| 71,786,665 | |||
| Paper & Forest Products - 0.2% | |||
| Duratex SA | 280,847 | 1,092,137 | |
| Suzano Papel e Celulose SA | 1,111,100 | 9,476,364 | |
| 10,568,501 | |||
| TOTAL MATERIALS | 133,048,438 | ||
| REAL ESTATE - 1.4% | |||
| Equity Real Estate Investment Trusts (REITs) - 0.0% | |||
| Concentradora Fibra Danhos SA de CV | 12,699 | 17,762 | |
| Fibra Uno Administracion SA de CV | 17,167 | 25,808 | |
| Link (REIT) | 107,500 | 995,702 | |
| Macquarie Mexican (REIT) (a) | 9,672 | 12,835 | |
| Musharaka Real Estate Income Fund | 13,897 | 34,006 | |
| Prologis Property Mexico SA | 60,798 | 128,435 | |
| Prologis Property Mexico SA rights (b) | 18,730 | 76 | |
| 1,214,624 | |||
| Real Estate Management & Development - 1.4% | |||
| Agile Property Holdings Ltd. | 3,329,238 | 4,672,465 | |
| Aldar Properties PJSC (b) | 1,478,311 | 853,294 | |
| Ayala Land, Inc. | 11,122,200 | 8,500,212 | |
| BR Malls Participacoes SA | 577,447 | 2,109,950 | |
| BR Properties SA (b) | 9,285 | 28,611 | |
| CapitaLand Ltd. | 587,800 | 1,489,650 | |
| Central China Real Estate Ltd. | 137,925 | 80,685 | |
| China Overseas Grand Oceans Group Ltd. | 656,000 | 448,554 | |
| China Overseas Land and Investment Ltd. | 1,792,000 | 6,011,648 | |
| China Resources Land Ltd. | 228,000 | 1,051,520 | |
| China South City Holdings Ltd. | 497,873 | 54,929 | |
| China Vanke Co. Ltd.: | |||
| (A Shares) | 228,097 | 965,309 | |
| (H Shares) | 135,300 | 520,718 | |
| Country Garden Holdings Co. Ltd. | 6,702,000 | 8,872,949 | |
| Dar Al Arkan Real Estate Development Co. (b) | 666,777 | 1,665,387 | |
| Emaar Properties PJSC | 3,967,374 | 3,780,663 | |
| Gemdale Corp. (A Shares) | 158,100 | 323,348 | |
| Gemdale Properties and Investment Corp. Ltd. | 628,000 | 111,179 | |
| Greenland Holdings Corp. Ltd. (A Shares) | 4,424,963 | 3,695,934 | |
| Greenland Hong Kong Holdings Ltd. | 133,366 | 51,841 | |
| Guangzhou R&F Properties Co. Ltd. (H Shares) | 551,200 | 854,201 | |
| Hang Lung Properties Ltd. | 579,000 | 1,264,218 | |
| Hopson Development Holdings Ltd. | 24,545 | 22,105 | |
| IOI Properties Group Bhd | 77,800 | 18,649 | |
| K Wah International Holdings Ltd. | 409,123 | 196,820 | |
| Kaisa Group Holdings Ltd. | 327,000 | 145,147 | |
| KSL Holdings Bhd (b) | 105,100 | 17,710 | |
| KWG Property Holding Ltd. | 980,500 | 1,436,473 | |
| Logan Property Holdings Co. Ltd. | 549,692 | 937,897 | |
| Longfor Properties Co. Ltd. (a) | 1,322,048 | 6,114,154 | |
| Poly Property Group Co. Ltd. | 1,135,686 | 426,884 | |
| Powerlong Real Estate Holding Ltd. | 378,417 | 235,934 | |
| PT Puradelta Lestari TBK | 5,453,700 | 89,707 | |
| Radium Life Tech Co. Ltd. | 330,676 | 109,773 | |
| Risesun Real Estate Development Co. Ltd. (A Shares) | 3,065,444 | 3,752,916 | |
| Road King Infrastructure Ltd. | 249,966 | 426,497 | |
| Sansiri PCL (For. Reg.) | 6,763,900 | 152,215 | |
| Shanghai Shimao Co. Ltd. (A Shares) | 1,476,815 | 846,978 | |
| Shimao Property Holdings Ltd. | 869,778 | 3,113,125 | |
| Shui On Land Ltd. | 360,500 | 71,684 | |
| Sun Hung Kai Properties Ltd. | 97,000 | 1,378,781 | |
| Sunac China Holdings Ltd. | 354,000 | 1,930,083 | |
| United Development Co. (b) | 229,244 | 76,116 | |
| 68,906,913 | |||
| TOTAL REAL ESTATE | 70,121,537 | ||
| UTILITIES - 0.9% | |||
| Electric Utilities - 0.5% | |||
| Cheung Kong Infrastructure Holdings Ltd. | 127,000 | 865,131 | |
| CPFL Energia SA | 183,800 | 1,460,322 | |
| EDP Energias do Brasil SA | 693,537 | 3,168,443 | |
| Enel Chile SA | 1,983,170 | 177,004 | |
| Enel Chile SA sponsored ADR | 176,677 | 775,612 | |
| Energa SA (b) | 19,990 | 35,989 | |
| Enersis SA | 14,466,654 | 2,423,196 | |
| Enersis SA sponsored ADR | 113,466 | 975,808 | |
| Equatorial Energia SA | 1,128,125 | 6,220,972 | |
| Korea Electric Power Corp. (b) | 140,742 | 2,490,744 | |
| Polska Grupa Energetyczna SA (b) | 195,906 | 225,222 | |
| Power Grid Corp. of India Ltd. | 660,912 | 1,653,669 | |
| Tenaga Nasional Bhd | 994,630 | 2,856,301 | |
| 23,328,413 | |||
| Gas Utilities - 0.4% | |||
| Beijing Enterprises Holdings Ltd. | 37,000 | 156,164 | |
| China Gas Holdings Ltd. | 1,894,200 | 6,925,555 | |
| China Resource Gas Group Ltd. | 150,000 | 748,557 | |
| Daesung Energy Co. Ltd. | 20,047 | 77,793 | |
| ENN Energy Holdings Ltd. | 101,300 | 1,122,162 | |
| Gujarat State Petronet Ltd. | 7,065 | 21,958 | |
| Indraprastha Gas Ltd. (b) | 1,130,824 | 6,896,656 | |
| Mahanagar Gas Ltd. | 34,288 | 475,189 | |
| PT Perusahaan Gas Negara Tbk Series B | 712,900 | 63,601 | |
| Samchully Co. Ltd. | 279 | 18,215 | |
| 16,505,850 | |||
| Independent Power and Renewable Electricity Producers - 0.0% | |||
| Benpres Holdings Corp. | 124,600 | 9,034 | |
| China Longyuan Power Grid Corp. Ltd. (H Shares) | 1,560,000 | 816,523 | |
| 825,557 | |||
| Water Utilities - 0.0% | |||
| Companhia de Saneamento Basico do Estado de Sao Paulo (SABESP) | 91,100 | 1,196,835 | |
| SIIC Environment Holdings Ltd. | 187,000 | 32,866 | |
| 1,229,701 | |||
| TOTAL UTILITIES | 41,889,521 | ||
| TOTAL COMMON STOCKS | |||
| (Cost $2,526,239,021) | 2,963,899,042 | ||
| Nonconvertible Preferred Stocks - 2.1% | |||
| COMMUNICATION SERVICES - 0.1% | |||
| Diversified Telecommunication Services - 0.1% | |||
| Telefonica Brasil SA | 47,240 | 563,893 | |
| Telefonica Brasil SA sponsored ADR | 190,100 | 2,267,893 | |
| 2,831,786 | |||
| CONSUMER STAPLES - 0.1% | |||
| Beverages - 0.0% | |||
| Ambev SA sponsored ADR | 455,222 | 1,461,263 | |
| Food & Staples Retailing - 0.1% | |||
| Companhia Brasileira de Distribuicao Grupo Pao de Acucar (PN) | 133,900 | 2,159,156 | |
| TOTAL CONSUMER STAPLES | 3,620,419 | ||
| ENERGY - 0.4% | |||
| Oil, Gas & Consumable Fuels - 0.4% | |||
| Petroleo Brasileiro SA - Petrobras: | |||
| (PN) sponsored ADR (non-vtg.) | 425,446 | 4,790,522 | |
| sponsored ADR | 1,088,563 | 13,171,612 | |
| 17,962,134 | |||
| FINANCIALS - 1.2% | |||
| Banks - 1.2% | |||
| Banco Bradesco SA (PN) | 1,628,984 | 11,121,197 | |
| Banco do Estado Rio Grande do Sul SA | 4,800 | 19,482 | |
| Itau Unibanco Holding SA | 4,098,536 | 29,328,284 | |
| Itau Unibanco Holding SA sponsored ADR | 837,485 | 5,921,019 | |
| Itausa-Investimentos Itau SA (PN) | 3,546,868 | 9,525,679 | |
| Sberbank of Russia | 109,335 | 358,504 | |
| 56,274,165 | |||
| INDUSTRIALS - 0.0% | |||
| Airlines - 0.0% | |||
| Azul SA (b) | 125,800 | 1,250,151 | |
| INFORMATION TECHNOLOGY - 0.3% | |||
| Technology Hardware, Storage & Peripherals - 0.3% | |||
| Samsung Electronics Co. Ltd. | 444,661 | 16,866,503 | |
| UTILITIES - 0.0% | |||
| Electric Utilities - 0.0% | |||
| Companhia Paranaense de Energia-Copel (PN-B) | 116,800 | 1,872,969 | |
| Water Utilities - 0.0% | |||
| Cia de Saneamento do Parana | 109,070 | 482,924 | |
| Companhia de Saneamento Basico do Estado de Sao Paulo (SABESP) sponsored ADR | 30,784 | 401,116 | |
| 884,040 | |||
| TOTAL UTILITIES | 2,757,009 | ||
| TOTAL NONCONVERTIBLE PREFERRED STOCKS | |||
| (Cost $95,024,783) | 101,562,167 | ||
| Equity Funds - 31.3% | |||
| Diversified Emerging Markets Funds - 31.3% | |||
| Aberdeen Emerging Markets Fund Institutional Service Class | 7,414,699 | 108,254,604 | |
| Brandes Emerging Markets Value Fund Class A | 10,256,732 | 82,771,827 | |
| Fidelity Emerging Markets Fund (e) | 12,174,383 | 398,711,045 | |
| Fidelity SAI Emerging Markets Low Volatility Index Fund (e) | 25,266,069 | 232,700,499 | |
| GMO Emerging Markets Fund - Class III | 1,632,303 | 50,340,230 | |
| Goldman Sachs Emerging Markets Equity Fund Institutional Shares | 7,309,524 | 159,128,342 | |
| Invesco Oppenheimer Developing Markets Fund Class R6 | 3,026,106 | 125,916,270 | |
| Invesco Oppenheimer Emerging Markets Innovators Fund Class R6 (b) | 4,679,444 | 48,900,194 | |
| iShares MSCI China ETF (c) | 2,832,430 | 175,978,876 | |
| iShares MSCI EM ESG Optimized ETF (c) | 70,286 | 2,293,432 | |
| iShares MSCI South Korea Index ETF | 373,835 | 20,545,972 | |
| Lazard Emerging Markets Equity Portfolio Open Shares | 2,147,890 | 35,740,896 | |
| Matthews Korea Fund Investor Class | 6,983,487 | 27,235,601 | |
| Matthews Pacific Tiger Fund Investor Class | 128 | 3,404 | |
| Morgan Stanley Institutional Fund, Inc. Frontier Markets Portfolio Class I | 1,987,350 | 31,420,010 | |
| Xtrackers Harvest CSI 300 China ETF Class A (c) | 414,269 | 11,835,665 | |
| TOTAL EQUITY FUNDS | |||
| (Cost $1,352,849,991) | 1,511,776,867 | ||
| U.S. Treasury Obligations - 0.2% | |||
| U.S. Treasury Bills, yield at date of purchase 1.38% to 1.55% 3/5/20 to 5/28/20 (f) | |||
| (Cost $7,298,701) | 7,310,000 | 7,299,977 | |
| Money Market Funds - 9.1% | |||
| Fidelity Cash Central Fund 1.60% (g) | 758,777 | 758,929 | |
| Fidelity Securities Lending Cash Central Fund 1.60% (g)(h) | 205,035,861 | 205,056,364 | |
| State Street Institutional U.S. Government Money Market Fund Premier Class 1.53% (i) | 231,056,124 | 231,056,124 | |
| TOTAL MONEY MARKET FUNDS | |||
| (Cost $436,871,417) | 436,871,417 | ||
| TOTAL INVESTMENT IN SECURITIES - 104.2% | |||
| (Cost $4,418,283,913) | 5,021,409,470 | ||
| NET OTHER ASSETS (LIABILITIES) - (4.2)% | (203,164,772) | ||
| NET ASSETS - 100% | $4,818,244,698 |
| Futures Contracts | |||||
| Number of contracts | Expiration Date | Notional Amount | Value | Unrealized Appreciation/(Depreciation) | |
| Purchased | |||||
| Equity Index Contracts | |||||
| ICE E-mini MSCI Emerging Markets Index Contracts (United States) | 2,638 | March 2020 | $133,060,720 | $(10,452,627) | $(10,452,627) |
The notional amount of futures purchased as a percentage of Net Assets is 2.8%
For the period, the average monthly notional amount at value for futures contracts in the aggregate was $211,913,599.
Security Type Abbreviations
ETF – Exchange-Traded Fund
Legend
(a) Security exempt from registration under Rule 144A of the Securities Act of 1933. These securities may be resold in transactions exempt from registration, normally to qualified institutional buyers. At the end of the period, the value of these securities amounted to $29,305,649 or 0.6% of net assets.
(b) Non-income producing
(c) Security or a portion of the security is on loan at period end.
(d) Level 3 security
(e) Affiliated Fund
(f) Security or a portion of the security was pledged to cover margin requirements for futures contracts. At period end, the value of securities pledged amounted to $7,256,892.
(g) Affiliated fund that is generally available only to investment companies and other accounts managed by Fidelity Investments. The rate quoted is the annualized seven-day yield of the fund at period end. A complete unaudited listing of the fund's holdings as of its most recent quarter end is available upon request. In addition, each Fidelity Central Fund's financial statements, which are not covered by the Fund's Report of Independent Registered Public Accounting Firm, are available on the SEC's website or upon request.
(h) Investment made with cash collateral received from securities on loan.
(i) The rate quoted is the annualized seven-day yield of the fund at period end.
Affiliated Central Funds
Information regarding fiscal year to date income earned by the Fund from investments in Fidelity Central Funds is as follows:
| Fund | Income earned |
| Fidelity Cash Central Fund | $34,749 |
| Fidelity Securities Lending Cash Central Fund | 479,665 |
| Total | $514,414 |
Amounts in the income column in the above table include any capital gain distributions from underlying funds, which are presented in the corresponding line-item in the Statement of Operations, if applicable. Amount for Fidelity Securities Lending Cash Central Fund represents the income earned on investing cash collateral, less rebates paid to borrowers and any lending agent fees associated with the loan, plus any premium payments received for lending certain types of securities.
Affiliated Underlying Funds
Fiscal year to date information regarding the Fund's investments in affiliated Underlying Funds, excluding any Money Market Central Funds, is presented below. Exchanges between classes of the same affiliated Underlying Funds may occur.
| Affiliate | Value, beginning of period | Purchases | Sales Proceeds | Dividend Income | Realized Gain (loss) | Change in Unrealized appreciation (depreciation) | Value, end of period |
| Fidelity Emerging Markets Fund | $355,884,838 | $7,163,136 | $-- | $7,163,139 | $-- | $35,663,071 | $398,711,045 |
| Fidelity SAI Emerging Markets Low Volatility Index Fund | -- | 256,782,547 | -- | 4,782,547 | -- | (24,082,048) | 232,700,499 |
| Total | $355,884,838 | $263,945,683 | $-- | $11,945,686 | $-- | $11,581,023 | $631,411,544 |
Amounts in the income column in the above table include any capital gain distributions from underlying funds, which are presented in the corresponding line-item in the Statement of Operations, if applicable.
Investment Valuation
The following is a summary of the inputs used, as of February 29, 2020, involving the Fund's assets and liabilities carried at fair value. The inputs or methodology used for valuing securities may not be an indication of the risk associated with investing in those securities. For more information on valuation inputs, and their aggregation into the levels used below, please refer to the Investment Valuation section in the accompanying Notes to Financial Statements.
| Valuation Inputs at Reporting Date: | ||||
| Description | Total | Level 1 | Level 2 | Level 3 |
| Investments in Securities: | ||||
| Equities: | ||||
| Communication Services | $354,329,725 | $139,631,353 | $214,698,372 | $-- |
| Consumer Discretionary | 507,234,199 | 469,749,109 | 37,456,572 | 28,518 |
| Consumer Staples | 238,385,354 | 196,222,899 | 42,162,455 | -- |
| Energy | 158,765,956 | 68,583,339 | 90,176,959 | 5,658 |
| Financials | 800,987,015 | 460,513,862 | 340,473,153 | -- |
| Health Care | 41,274,320 | 38,226,021 | 3,048,299 | -- |
| Industrials | 115,812,688 | 102,956,864 | 12,855,824 | -- |
| Information Technology | 600,855,447 | 354,319,168 | 246,536,279 | -- |
| Materials | 133,048,438 | 91,770,572 | 41,277,866 | -- |
| Real Estate | 70,121,537 | 70,011,688 | 109,849 | -- |
| Utilities | 44,646,530 | 41,894,575 | 2,751,955 | -- |
| Equity Funds | 1,511,776,867 | 1,511,776,867 | -- | -- |
| Other Short-Term Investments | 7,299,977 | -- | 7,299,977 | -- |
| Money Market Funds | 436,871,417 | 436,871,417 | -- | -- |
| Total Investments in Securities: | $5,021,409,470 | $3,982,527,734 | $1,038,847,560 | $34,176 |
| Derivative Instruments: | ||||
| Liabilities | ||||
| Futures Contracts | $(10,452,627) | $(10,452,627) | $-- | $-- |
| Total Liabilities | $(10,452,627) | $(10,452,627) | $-- | $-- |
| Total Derivative Instruments: | $(10,452,627) | $(10,452,627) | $-- | $-- |
Value of Derivative Instruments
The following table is a summary of the Fund's value of derivative instruments by primary risk exposure as of February 29, 2020. For additional information on derivative instruments, please refer to the Derivative Instruments section in the accompanying Notes to Financial Statements.
| Primary Risk Exposure / Derivative Type | Value | |
| Asset | Liability | |
| Equity Risk | ||
| Futures Contracts(a) | $0 | $(10,452,627) |
| Total Equity Risk | 0 | (10,452,627) |
| Total Value of Derivatives | $0 | $(10,452,627) |
(a) Reflects gross cumulative appreciation (depreciation) on futures contracts as presented in the Schedule of Investments. In the Statement of Assets and Liabilities, the period end daily variation margin is included in receivable or payable for daily variation margin on futures contracts, and the net cumulative appreciation (depreciation) is included in Total accumulated earnings (loss).
Other Information
Distribution of the direct investments by country of issue, as a percentage of Total Net Assets, is as follows (Unaudited):
| United States of America | 36.9% |
| Cayman Islands | 13.0% |
| China | 8.2% |
| Korea (South) | 8.0% |
| Taiwan | 6.4% |
| India | 5.2% |
| Brazil | 5.1% |
| Russia | 3.0% |
| Hong Kong | 2.5% |
| South Africa | 2.0% |
| Mexico | 1.4% |
| Others (Individually Less Than 1%) | 8.3% |
| 100.0% |
See accompanying notes which are an integral part of the financial statements.
Financial Statements
Statement of Assets and Liabilities
| February 29, 2020 | ||
| Assets | ||
| Investment in securities, at value (including securities loaned of $200,405,299) — See accompanying schedule: Unaffiliated issuers (cost $3,658,070,048) | $4,184,182,633 | |
| Fidelity Central Funds (cost $205,815,293) | 205,815,293 | |
| Other affiliated issuers (cost $554,398,572) | 631,411,544 | |
| Total Investment in Securities (cost $4,418,283,913) | $5,021,409,470 | |
| Cash | 6,299,116 | |
| Foreign currency held at value (cost $2,208,374) | 2,160,627 | |
| Receivable for investments sold | 10,001,835 | |
| Receivable for fund shares sold | 1,926,892 | |
| Dividends receivable | 7,599,069 | |
| Interest receivable | 287,978 | |
| Distributions receivable from Fidelity Central Funds | 80,768 | |
| Other receivables | 62,246 | |
| Total assets | 5,049,828,001 | |
| Liabilities | ||
| Payable for investments purchased | $18,053,742 | |
| Payable for fund shares redeemed | 5,871,701 | |
| Accrued management fee | 1,563,290 | |
| Payable for daily variation margin on futures contracts | 488,425 | |
| Other payables and accrued expenses | 580,774 | |
| Collateral on securities loaned | 205,025,371 | |
| Total liabilities | 231,583,303 | |
| Net Assets | $4,818,244,698 | |
| Net Assets consist of: | ||
| Paid in capital | $4,469,570,436 | |
| Total accumulated earnings (loss) | 348,674,262 | |
| Net Assets | $4,818,244,698 | |
| Net Asset Value, offering price and redemption price per share ($4,818,244,698 ÷ 472,299,126 shares) | $10.20 |
See accompanying notes which are an integral part of the financial statements.
Statement of Operations
| Year ended February 29, 2020 | ||
| Investment Income | ||
| Dividends: | ||
| Unaffiliated issuers | $101,902,773 | |
| Affiliated issuers | 11,945,686 | |
| Non-Cash dividends | 16,661,237 | |
| Interest | 5,916,161 | |
| Income from Fidelity Central Funds (including $479,665 from security lending) | 514,414 | |
| Income before foreign taxes withheld | 136,940,271 | |
| Less foreign taxes withheld | (9,508,908) | |
| Total income | 127,431,363 | |
| Expenses | ||
| Management fee | $29,751,832 | |
| Accounting and security lending fees | 521,164 | |
| Custodian fees and expenses | 851,461 | |
| Independent trustees' fees and expenses | 53,680 | |
| Registration fees | 57,251 | |
| Audit | 98,643 | |
| Legal | 17,549 | |
| Miscellaneous | 341,050 | |
| Total expenses before reductions | 31,692,630 | |
| Expense reductions | (12,387,865) | |
| Total expenses after reductions | 19,304,765 | |
| Net investment income (loss) | 108,126,598 | |
| Realized and Unrealized Gain (Loss) | ||
| Net realized gain (loss) on: | ||
| Investment securities: | ||
| Unaffiliated issuers | (30,107,368) | |
| Fidelity Central Funds | 9,267 | |
| Foreign currency transactions | (1,788,998) | |
| Futures contracts | 31,211,404 | |
| Capital gain distributions from underlying funds: | ||
| Unaffiliated issuers | 5,201,048 | |
| Total net realized gain (loss) | 4,525,353 | |
| Change in net unrealized appreciation (depreciation) on: | ||
| Investment securities: | ||
| Unaffiliated issuers (net of increase in deferred foreign taxes of $56,260) | 4,160,075 | |
| Affiliated issuers | 11,581,023 | |
| Assets and liabilities in foreign currencies | (286,860) | |
| Futures contracts | (22,927,293) | |
| Total change in net unrealized appreciation (depreciation) | (7,473,055) | |
| Net gain (loss) | (2,947,702) | |
| Net increase (decrease) in net assets resulting from operations | $105,178,896 |
See accompanying notes which are an integral part of the financial statements.
Statement of Changes in Net Assets
| Year ended February 29, 2020 | Year ended February 28, 2019 | |
| Increase (Decrease) in Net Assets | ||
| Operations | ||
| Net investment income (loss) | $108,126,598 | $77,358,567 |
| Net realized gain (loss) | 4,525,353 | (86,864,085) |
| Change in net unrealized appreciation (depreciation) | (7,473,055) | (640,462,210) |
| Net increase (decrease) in net assets resulting from operations | 105,178,896 | (649,967,728) |
| Distributions to shareholders | (108,590,118) | (69,748,423) |
| Share transactions | ||
| Proceeds from sales of shares | 778,953,889 | 1,059,692,349 |
| Reinvestment of distributions | 107,714,914 | 69,510,261 |
| Cost of shares redeemed | (725,778,234) | (819,100,492) |
| Net increase (decrease) in net assets resulting from share transactions | 160,890,569 | 310,102,118 |
| Total increase (decrease) in net assets | 157,479,347 | (409,614,033) |
| Net Assets | ||
| Beginning of period | 4,660,765,351 | 5,070,379,384 |
| End of period | $4,818,244,698 | $4,660,765,351 |
| Other Information | ||
| Shares | ||
| Sold | 75,927,054 | 96,882,174 |
| Issued in reinvestment of distributions | 9,678,318 | 7,458,183 |
| Redeemed | (69,026,725) | (80,109,848) |
| Net increase (decrease) | 16,578,647 | 24,230,509 |
See accompanying notes which are an integral part of the financial statements.
Financial Highlights
Strategic Advisers Emerging Markets Fund
| Years ended February 28, | 2020 A | 2019 | 2018 | 2017 | 2016 A |
| Selected Per–Share Data | |||||
| Net asset value, beginning of period | $10.23 | $11.75 | $9.14 | $7.15 | $9.47 |
| Income from Investment Operations | |||||
| Net investment income (loss)B | .23C | .17 | .14 | .10 | .10 |
| Net realized and unrealized gain (loss) | (.03) | (1.53) | 2.62 | 1.99 | (2.32) |
| Total from investment operations | .20 | (1.36) | 2.76 | 2.09 | (2.22) |
| Distributions from net investment income | (.23) | (.16) | (.15) | (.10) | (.10) |
| Distributions from net realized gain | – | – | –D | (.01) | – |
| Total distributions | (.23) | (.16) | (.15) | (.10)E | (.10) |
| Net asset value, end of period | $10.20 | $10.23 | $11.75 | $9.14 | $7.15 |
| Total ReturnF | 1.80% | (11.48)% | 30.23% | 29.40% | (23.49)% |
| Ratios to Average Net AssetsG,H,I | |||||
| Expenses before reductions | .64% | .66% | .70% | .60% | .50% |
| Expenses net of fee waivers, if any | .39% | .41% | .45% | .35% | .25% |
| Expenses net of all reductions | .39% | .40% | .45% | .35% | .24% |
| Net investment income (loss) | 2.20%C | 1.60% | 1.36% | 1.23% | 1.25% |
| Supplemental Data | |||||
| Net assets, end of period (000 omitted) | $4,818,245 | $4,660,765 | $5,070,379 | $4,599,443 | $4,265,092 |
| Portfolio turnover rateI | 39% | 57% | 31% | 23% | 41% |
A For the year ended February 29.
B Calculated based on average shares outstanding during the period.
C Net investment income per share reflects a large, non-recurring dividend which amounted to $.03 per share. Excluding this non-recurring dividend, the ratio of net investment income (loss) to average net assets would have been 1.87%.
D Amount represents less than $.005 per share.
E Total distributions of $.10 per share is comprised of distributions from net investment income of $.097 and distributions from net realized gain of $.005 per share.
F Total returns would have been lower if certain expenses had not been reduced during the applicable periods shown.
G Fees and expenses of any underlying Fidelity Central Funds are not included in the Fund's expense ratio. The Fund indirectly bears its proportionate share of the expenses of any underlying Fidelity Central Funds.
H Expense ratios reflect operating expenses of the Fund. Expenses before reductions do not reflect amounts reimbursed by the investment adviser or reductions from brokerage service arrangements or reductions from other expense offset arrangements and do not represent the amount paid by the Fund during periods when reimbursements or reductions occur. Expenses net of fee waivers reflect expenses after reimbursement by the investment adviser but prior to reductions from brokerage service arrangements or other expense offset arrangements. Expenses net of all reductions represent the net expenses paid by the Fund. Fees and expenses of the Underlying Funds are not included in the Fund's annualized ratios. The Fund indirectly bears its proportionate share of the expenses of the Underlying Funds.
I Amounts do not include the activity of Underlying Funds.
See accompanying notes which are an integral part of the financial statements.
Notes to Financial Statements
For the period ended February 29, 2020
1. Organization.
Strategic Advisers Emerging Markets Fund (the Fund) is a fund of Fidelity Rutland Square Trust II (the Trust), and is authorized to issue an unlimited number of shares. The Trust is registered under the Investment Company Act of 1940, as amended (the 1940 Act), as an open-end management investment company organized as a Delaware statutory trust. The Fund is offered exclusively to certain clients of Strategic Advisers LLC (Strategic Advisers), an affiliate of Fidelity Management & Research Company LLC (FMR). The Fund's investments in emerging markets can be subject to social, economic, regulatory, and political uncertainties and can be extremely volatile.
2. Significant Accounting Policies.
The Fund is an investment company and applies the accounting and reporting guidance of the Financial Accounting Standards Board (FASB) Accounting Standards Codification Topic 946 Financial Services – Investments Companies. The financial statements have been prepared in conformity with accounting principles generally accepted in the United States of America (GAAP), which require management to make certain estimates and assumptions at the date of the financial statements. Actual results could differ from those estimates. Subsequent events, if any, through the date that the financial statements were issued have been evaluated in the preparation of the financial statements. The following summarizes the significant accounting policies of the Fund:
Investment Valuation. Investments are valued as of 4:00 p.m. Eastern time on the last calendar day of the period. The Board of Trustees (the Board) has delegated the day to day responsibility for the valuation of the Fund's investments to the Fair Value Committee (the Committee) established by the Fund's investment adviser. In accordance with valuation policies and procedures approved by the Board, the Fund attempts to obtain prices from one or more third party pricing vendors or brokers to value its investments. When current market prices, quotations or currency exchange rates are not readily available or reliable, investments will be fair valued in good faith by the Committee, in accordance with procedures adopted by the Board. Factors used in determining fair value vary by investment type and may include market or investment specific events, changes in interest rates and credit quality. The frequency with which these procedures are used cannot be predicted and they may be utilized to a significant extent. The Committee oversees the Fund's valuation policies and procedures and reports to the Board on the Committee's activities and fair value determinations. The Board monitors the appropriateness of the procedures used in valuing the Fund's investments and ratifies the fair value determinations of the Committee.
The Fund categorizes the inputs to valuation techniques used to value its investments into a disclosure hierarchy consisting of three levels as shown below:
- Level 1 – quoted prices in active markets for identical investments
- Level 2 – other significant observable inputs (including quoted prices for similar investments, interest rates, prepayment speeds, etc.)
- Level 3 – unobservable inputs (including the Fund's own assumptions based on the best information available)
Valuation techniques used to value the Fund's investments by major category are as follows:
Equity securities, including restricted securities, for which market quotations are readily available, are valued at the last reported sale price or official closing price as reported by a third party pricing vendor on the primary market or exchange on which they are traded and are categorized as Level 1 in the hierarchy. In the event there were no sales during the day or closing prices are not available, securities are valued at the last quoted bid price or may be valued using the last available price and are generally categorized as Level 2 in the hierarchy. For foreign equity securities, when market or security specific events arise, comparisons to the valuation of American Depositary Receipts (ADRs), futures contracts, Exchange-Traded Funds (ETFs) and certain indexes as well as quoted prices for similar securities may be used and would be categorized as Level 2 in the hierarchy. For equity securities, including restricted securities, where observable inputs are limited, assumptions about market activity and risk are used and these securities may be categorized as Level 3 in the hierarchy.
Debt securities, including restricted securities, are valued based on evaluated prices received from third party pricing vendors or from brokers who make markets in such securities. U.S. government and government agency obligations are valued by pricing vendors who utilize matrix pricing which considers yield or price of bonds of comparable quality, coupon, maturity and type or by broker-supplied prices. When independent prices are unavailable or unreliable, debt securities may be valued utilizing pricing methodologies which consider similar factors that would be used by third party pricing vendors. Debt securities are generally categorized as Level 2 in the hierarchy but may be Level 3 depending on the circumstances. ETFs are valued at their last sale price or official closing price as reported by a third party pricing vendor on the primary market or exchange on which they are traded and are categorized as Level 1 in the hierarchy. In the event there were no sales during the day but the exchange reports a closing bid level, ETFs are valued at the closing bid and would be categorized as Level 1 in the hierarchy. In the event there was no closing bid, ETFs may be valued by another method that the Board believes reflects fair value in accordance with the Board's fair value pricing policies and may be categorized as Level 2 in the hierarchy.
Futures contracts are valued at the settlement price established each day by the board of trade or exchange on which they are traded and are categorized as Level 1 in the hierarchy. Investments in open-end mutual funds, including the Fidelity Central Funds, are valued at their closing net asset value (NAV) each business day and are categorized as Level 1 in the hierarchy. If an unaffiliated open-end mutual fund's NAV is unavailable, shares of that fund may be valued by another method that the Board believes reflects fair value in accordance with the Board's fair value pricing policies and is categorized as Level 2 in the hierarchy.
Changes in valuation techniques may result in transfers in or out of an assigned level within the disclosure hierarchy. The aggregate value of investments by input level as of February 29, 2020 is included at the end of the Fund's Schedule of Investments.
Foreign Currency. The Fund may use foreign currency contracts to facilitate transactions in foreign-denominated securities. Gains and losses from these transactions may arise from changes in the value of the foreign currency or if the counterparties do not perform under the contracts' terms.
Foreign-denominated assets, including investment securities, and liabilities are translated into U.S. dollars at the exchange rates at period end. Purchases and sales of investment securities, income and dividends received and expenses denominated in foreign currencies are translated into U.S. dollars at the exchange rate in effect on the transaction date.
The effects of exchange rate fluctuations on investments are included with the net realized and unrealized gain (loss) on investment securities. Other foreign currency transactions resulting in realized and unrealized gain (loss) are disclosed separately.
Investment Transactions and Income. For financial reporting purposes, the Fund's investment holdings and NAV include trades executed through the end of the last business day of the period. The NAV per share for processing shareholder transactions is calculated as of the close of business of the New York Stock Exchange (NYSE), normally 4:00 p.m. Eastern time and includes trades executed through the end of the prior business day. Gains and losses on securities sold are determined on the basis of identified cost. Dividend income is recorded on the ex-dividend date, except for certain dividends from foreign securities where the ex-dividend date may have passed, which are recorded as soon as the Fund is informed of the ex-dividend date. Non-cash dividends included in dividend income, if any, are recorded at the fair market value of the securities received. Income and capital gain distributions from Fidelity Central Funds, if any, are recorded on the ex-dividend date. Income and capital gain distributions from Underlying Funds and distributions from ETFs, if any, are recorded on the ex-dividend date. Certain distributions received by the Fund represent a return of capital or capital gain. The Fund determines the components of these distributions subsequent to the ex-dividend date, based upon receipt of tax filings or other correspondence relating to the underlying investment. These distributions are recorded as a reduction of cost of investments and/or as a realized gain. Large, non-recurring dividends recognized by the Fund are presented separately on the Statement of Operations in "Non-cash dividends" and the impact of these dividends is presented in the Financial Highlights. Interest income is accrued as earned and includes coupon interest and amortization of premium and accretion of discount on debt securities as applicable. Investment income is recorded net of foreign taxes withheld where recovery of such taxes is uncertain.
Expenses. Expenses directly attributable to a fund are charged to that fund. Expenses attributable to more than one fund are allocated among the respective funds on the basis of relative net assets or other appropriate methods. Expense estimates are accrued in the period to which they relate and adjustments are made when actual amounts are known.
Deferred Trustee Compensation. Under a Deferred Compensation Plan (the Plan), certain independent Trustees have elected to defer receipt of a portion of their annual compensation. Deferred amounts are invested in a cross-section of Strategic Advisers funds, are marked-to-market and remain in the Fund until distributed in accordance with the Plan. The investment of deferred amounts and the offsetting payable to the Trustees of $56,823 are included in the accompanying Statement of Assets and Liabilities in other receivables and other payables and accrued expenses, respectively.
Income Tax Information and Distributions to Shareholders. Each year, the Fund intends to qualify as a regulated investment company under Subchapter M of the Internal Revenue Code, including distributing substantially all of its taxable income and realized gains. As a result, no provision for U.S. Federal income taxes is required. As of February 29, 2020, the Fund did not have any unrecognized tax benefits in the financial statements; nor is the Fund aware of any tax positions for which it is reasonably possible that the total amounts of unrecognized tax benefits will significantly change in the next twelve months. The Fund files a U.S. federal tax return, in addition to state and local tax returns as required. The Fund's federal income tax returns are subject to examination by the Internal Revenue Service (IRS) for a period of three fiscal years after they are filed. State and local tax returns may be subject to examination for an additional fiscal year depending on the jurisdiction. Foreign taxes are provided for based on the Fund's understanding of the tax rules and rates that exist in the foreign markets in which it invests. The Fund is subject to a tax imposed on capital gains by certain countries in which it invests. An estimated deferred tax liability for net unrealized appreciation on the applicable securities is included in Other payables and accrued expenses on the Statement of Assets & Liabilities.
Distributions are declared and recorded on the ex-dividend date. Income and capital gain distributions are determined in accordance with income tax regulations, which may differ from GAAP.
Capital accounts within the financial statements are adjusted for permanent book-tax differences. These adjustments have no impact on net assets or the results of operations. Capital accounts are not adjusted for temporary book-tax differences which will reverse in a subsequent period.
Book-tax differences are primarily due to short-term gain distributions from the Underlying Funds, futures contracts, foreign currency transactions, passive foreign investment companies (PFIC), market discount, partnerships, deferred trustees compensation, capital loss carryforwards and losses due to wash sales and excise tax regulations.
As of period end, the cost and unrealized appreciation (depreciation) in securities, and derivatives if applicable, for federal income tax purposes were as follows:
| Gross unrealized appreciation | $830,042,088 |
| Gross unrealized depreciation | (245,420,918) |
| Net unrealized appreciation (depreciation) | $584,621,170 |
| Tax Cost | $4,436,788,300 |
The tax-based components of distributable earnings as of period end were as follows:
| Capital loss carryforward | $(234,855,303) |
| Net unrealized appreciation (depreciation) on securities and other investments | $584,279,483 |
Capital loss carryforwards are only available to offset future capital gains of the Fund to the extent provided by regulations and may be limited. The capital loss carryforward information presented below, including any applicable limitation, is estimated as of fiscal period end and is subject to adjustment.
| No expiration | |
| Short-term | $(234,855,303) |
The Fund intends to elect to defer to its next fiscal year $636,836 of ordinary losses recognized during the period January 1, 2020 to February 29, 2020.
The tax character of distributions paid was as follows:
| February 29, 2020 | February 28, 2019 | |
| Ordinary Income | $108,590,118 | $ 69,748,423 |
Restricted Securities. The Fund may invest in securities that are subject to legal or contractual restrictions on resale. These securities generally may be resold in transactions exempt from registration or to the public if the securities are registered. Disposal of these securities may involve time-consuming negotiations and expense, and prompt sale at an acceptable price may be difficult. Information regarding restricted securities is included at the end of the Fund's Schedule of Investments.
3. Derivative Instruments.
Risk Exposures and the Use of Derivative Instruments. The Fund's investment objective allows the Fund to enter into various types of derivative contracts, including futures contracts. Derivatives are investments whose value is primarily derived from underlying assets, indices or reference rates and may be transacted on an exchange or over-the-counter (OTC). Derivatives may involve a future commitment to buy or sell a specified asset based on specified terms, to exchange future cash flows at periodic intervals based on a notional principal amount, or for one party to make one or more payments upon the occurrence of specified events in exchange for periodic payments from the other party.
The Fund used derivatives to increase returns and to manage exposure to certain risks as defined below. The success of any strategy involving derivatives depends on analysis of numerous economic factors, and if the strategies for investment do not work as intended, the Fund may not achieve its objectives.
The Fund's use of derivatives increased or decreased its exposure to the following risk:
| Equity Risk | Equity risk relates to the fluctuations in the value of financial instruments as a result of changes in market prices (other than those arising from interest rate risk or foreign exchange risk), whether caused by factors specific to an individual investment, its issuer, or all factors affecting all instruments traded in a market or market segment. |
The Fund is also exposed to additional risks from investing in derivatives, such as liquidity risk and counterparty credit risk. Liquidity risk is the risk that the Fund will be unable to close out the derivative in the open market in a timely manner. Counterparty credit risk is the risk that the counterparty will not be able to fulfill its obligation to the Fund. Counterparty credit risk related to exchange-traded futures contracts may be mitigated by the protection provided by the exchange on which they trade.
Investing in derivatives may involve greater risks than investing in the underlying assets directly and, to varying degrees, may involve risk of loss in excess of any initial investment and collateral received and amounts recognized in the Statement of Assets and Liabilities. In addition, there may be the risk that the change in value of the derivative contract does not correspond to the change in value of the underlying instrument.
Futures Contracts. A futures contract is an agreement between two parties to buy or sell a specified underlying instrument for a fixed price at a specified future date. The Fund used futures contracts to manage its exposure to the stock market.
Upon entering into a futures contract, a fund is required to deposit either cash or securities (initial margin) with a clearing broker in an amount equal to a certain percentage of the face value of the contract. Futures contracts are marked-to-market daily and subsequent daily payments (variation margin) are made or received by a fund depending on the daily fluctuations in the value of the futures contracts and are recorded as unrealized appreciation or (depreciation). This receivable and/or payable, if any, is included in daily variation margin on futures contracts in the Statement of Assets and Liabilities. Realized gain or (loss) is recorded upon the expiration or closing of a futures contract. The net realized gain (loss) and change in net unrealized appreciation (depreciation) on futures contracts during the period is presented in the Statement of Operations.
Any open futures contracts at period end are presented in the Schedule of Investments under the caption "Futures Contracts". The notional amount at value reflects each contract's exposure to the underlying instrument or index at period end. Securities deposited to meet initial margin requirements are identified in the Schedule of Investments.
4. Purchases and Sales of Investments.
Purchases and sales of securities (including the Underlying Fund shares), other than short-term securities are noted in the table below.
| Purchases ($) | Sales ($) | |
| Strategic Advisers Emerging Markets Fund | 2,000,492,174 | 1,799,253,806 |
Prior Fiscal Year Unaffiliated Exchanges In-Kind. During the prior period, the Fund redeemed 30,747,979 shares of Causeway Emerging Markets Fund-Investor Class in exchange for investments and cash with a value of $409,716,815. The Fund had a net realized gain of $54,053,566 on the Fund's redemptions of Causeway Emerging Markets Fund-Investor Class. The Fund recognized gains on the exchanges for federal income tax purposes.
5. Fees and Other Transactions with Affiliates.
Management Fee. Strategic Advisers (the investment adviser) provides the Fund with investment management related services. For these services, the Fund pays a monthly management fee to the investment adviser. The management fee is calculated by adding the annual management fee rate of .25% of the Fund's average net assets throughout the month payable to the investment adviser to the aggregate of the fee rates, payable monthly, to the Fund's sub-advisers. The Fund's maximum aggregate management fee will not exceed 1.20% of the Fund's average net assets. For the reporting period, the total annual management fee rate was .60% of the Fund's average net assets.
During the period, the investment adviser waived a portion of its management fee as described in the Expense Reductions note.
Sub-Advisers. Acadian Asset Management LLC, Causeway Capital Management, LLC, FIAM LLC, FIL Investment Advisors (an affiliate of the investment adviser), Schroder Investment Management North America, Inc., Somerset Capital Management LLP and T. Rowe Price Associates, Inc. each served as a sub-adviser for the Fund during the period. Sub-advisers provide discretionary investment advisory services for their allocated portion of the Fund's assets and are paid by the investment adviser and not the Fund for providing these services.
Accounting and Security Lending Fees. Fidelity Service Company, Inc. (FSC), an affiliate of the investment adviser, maintains the Fund's accounting records. The accounting fee is based on the level of average net assets for each month. Prior to April 1, 2019, FSC had a separate agreement with the Fund for administration of the security lending program, based on the number and duration of lending transactions. Effective July 1, 2019 accounting fees are not paid by the Fund and are instead paid by the investment adviser or an affiliate. For the period, the total fees paid for accounting and administration of securities lending were equivalent to .01%.
Brokerage Commissions. A portion of portfolio transactions were placed with brokerage firms which are affiliates of the investment adviser. Brokerage commissions are included in net realized gain (loss) and change in net unrealized appreciation (depreciation) in the Statement of Operations. The commissions paid to these affiliated firms were as follows:
| Amount | |
| Strategic Advisers Emerging Markets Fund | $514 |
Interfund Trades. Funds may purchase from or sell securities to other funds affiliated with each sub-adviser under procedures adopted by the Board. The procedures have been designed to ensure these interfund trades are executed in accordance with Rule 17a-7 of the 1940 Act. Interfund trades are included within the respective purchases and sales amounts shown in the Purchases and Sales of Investments note.
6. Investments in Fidelity Central Funds.
The Fund invests in Fidelity Central Funds, which are open-end investment companies available only to other investment companies and accounts managed by the investment adviser and its affiliates. The Fund's Schedule of Investments lists each of the Fidelity Central Funds held as of period end, if any, as an investment of the Fund, but does not include the underlying holdings of each Fidelity Central Fund. As an Investing Fund, the Fund indirectly bears its proportionate share of the expenses of the underlying Fidelity Central Funds.
The Fidelity Money Market Central Funds are managed by FMR. Annualized expenses of the Money Market Central Funds as of their most recent shareholder report date ranged from less than .005% to .01%.
A complete unaudited list of holdings for each Fidelity Central Fund is available upon request or at the Securities and Exchange Commission (the SEC) website at www.sec.gov. In addition, the financial statements of the Fidelity Central Funds, which are not covered by the Fund's Report of Independent Registered Public Accounting Firm, are available on the SEC website or upon request.
7. Committed Line of Credit.
Certain Funds participate with other funds managed by the investment adviser or an affiliate in a $4.25 billion credit facility (the "line of credit") to be utilized for temporary or emergency purposes to fund shareholder redemptions or for other short-term liquidity purposes. The participating funds have agreed to pay commitment fees on their pro-rata portion of the line of credit, which are reflected in Miscellaneous expenses on the Statement of Operations, and are as follows:
| Amount | |
| Strategic Advisers Emerging Markets Fund | $12,243 |
During the period, there were no borrowings on this line of credit.
8. Security Lending.
The Fund lends portfolio securities through a lending agent from time to time in order to earn additional income. On the settlement date of the loan, the Fund receives collateral (in the form of U.S. Treasury obligations, letters of credit and/or cash) against the loaned securities and maintains collateral in an amount not less than 100% of the market value of the loaned securities during the period of the loan. The market value of the loaned securities is determined at the close of business of the Fund and any additional required collateral is delivered to the Fund on the next business day. The Fund or borrower may terminate the loan at any time, and if the borrower defaults on its obligation to return the securities loaned because of insolvency or other reasons, the Fund may apply collateral received from the borrower against the obligation. The Fund may experience delays and costs in recovering the securities loaned. Any cash collateral received is invested the Fidelity Securities Lending Cash Central Fund. The value of loaned securities and cash collateral at period end are disclosed on the Fund's Statement of Assets and Liabilities. Security lending income represents the income earned on investing cash collateral, less rebates paid to borrowers and any lending agent fees associated with the loan, plus any premium payments received for lending certain types of securities. Security lending income is presented in the Statement of Operations as a component of income from Fidelity Central Funds.
9. Expense Reductions.
The investment adviser has contractually agreed to waive the Fund's management fee in an amount equal to .25% of the Fund's average net assets until September 30, 2022. During the period, this waiver reduced the Fund's management fee by $12,326,402.
Commissions paid to certain brokers with whom the investment adviser, or its affiliates, places trades on behalf of the Fund include an amount in addition to trade execution, which may be rebated back to the Fund to offset certain expenses. This amount totaled $58,906 for the period.
In addition, through arrangements with the Fund's custodian and transfer agent, credits realized as a result of certain uninvested cash balances were used to reduce the Fund's expenses by $2,390 and $167, respectively.
10. Other.
The Fund's organizational documents provide former and current trustees and officers with a limited indemnification against liabilities arising in connection with the performance of their duties to the Fund. In the normal course of business, the Fund may also enter into contracts that provide general indemnifications. The Fund's maximum exposure under these arrangements is unknown as this would be dependent on future claims that may be made against the Fund. The risk of material loss from such claims is considered remote.
The Fund does not invest in the Underlying Funds for the purpose of exercising management or control; however, investments by the Fund within its principal investment strategies may represent a significant portion of an Underlying Fund's net assets.
At the end of the period, the Fund was the owner of record of 10% or more of the total outstanding shares of the following Underlying Funds:
| Fidelity Emerging Markets Fund | 12% |
| Fidelity SAI Emerging Markets Low Volatility Index Fund | 32% |
11. Coronavirus (Covid-19) Pandemic.
An outbreak of COVID-19 first detected in China during December 2019 has since spread globally and was declared a pandemic by the World Health Organization during March 2020. Developments that disrupt global economies and financial markets, such as the COVID-19 pandemic, may magnify factors that affect the Fund's performance.
Report of Independent Registered Public Accounting Firm
To the Board of Trustees of Fidelity Rutland Square Trust II and Shareholders of Strategic Advisers Emerging Markets Fund
Opinion on the Financial Statements
We have audited the accompanying statement of assets and liabilities, including the schedule of investments, of Strategic Advisers Emerging Markets Fund (one of the funds constituting Fidelity Rutland Square Trust II, referred to hereafter as the “Fund”) as of February 29, 2020, the related statement of operations for the year ended February 29, 2020, the statement of changes in net assets for each of the two years in the period ended February 29, 2020, including the related notes, and the financial highlights for each of the five years in the period ended February 29, 2020 (collectively referred to as the “financial statements”). In our opinion, the financial statements present fairly, in all material respects, the financial position of the Fund as of February 29, 2020, the results of its operations for the year then ended, the changes in its net assets for each of the two years in the period ended February 29, 2020 and the financial highlights for each of the five years in the period ended February 29, 2020 in conformity with accounting principles generally accepted in the United States of America.
Basis for Opinion
These financial statements are the responsibility of the Fund’s management. Our responsibility is to express an opinion on the Fund’s financial statements based on our audits. We are a public accounting firm registered with the Public Company Accounting Oversight Board (United States) (PCAOB) and are required to be independent with respect to the Fund in accordance with the U.S. federal securities laws and the applicable rules and regulations of the Securities and Exchange Commission and the PCAOB.
We conducted our audits of these financial statements in accordance with the standards of the PCAOB. Those standards require that we plan and perform the audit to obtain reasonable assurance about whether the financial statements are free of material misstatement, whether due to error or fraud.
Our audits included performing procedures to assess the risks of material misstatement of the financial statements, whether due to error or fraud, and performing procedures that respond to those risks. Such procedures included examining, on a test basis, evidence regarding the amounts and disclosures in the financial statements. Our audits also included evaluating the accounting principles used and significant estimates made by management, as well as evaluating the overall presentation of the financial statements. Our procedures included confirmation of securities owned as of February 29, 2020 by correspondence with the custodian and brokers; when replies were not received from brokers, we performed other auditing procedures. We believe that our audits provide a reasonable basis for our opinion.
PricewaterhouseCoopers LLP
Boston, Massachusetts
April 14, 2020
We have served as the auditor of one or more investment companies in the Fidelity group of funds since 1932.
Trustees and Officers
The Trustees, Members of the Advisory Board (if any), and officers of the trust and fund, as applicable, are listed below. The Board of Trustees governs the fund and is responsible for protecting the interests of shareholders. The Trustees are experienced executives who meet periodically throughout the year to oversee the fund's activities, review contractual arrangements with companies that provide services to the fund, oversee management of the risks associated with such activities and contractual arrangements, and review the fund's performance. If the interests of the fund and an underlying Fidelity® fund were to diverge, a conflict of interest could arise and affect how the Trustees and Members of the Advisory Board fulfill their fiduciary duties to the affected funds. Strategic Advisers has structured the fund to avoid these potential conflicts, although there may be situations where a conflict of interest is unavoidable. In such instances, Strategic Advisers, the Trustees, and Members of the Advisory Board would take reasonable steps to minimize and, if possible, eliminate the conflict. Each of the trustees oversees 14 funds.
The Trustees hold office without limit in time except that (a) any Trustee may resign; (b) any Trustee may be removed by written instrument, signed by at least two-thirds of the number of Trustees prior to such removal; (c) any Trustee who requests to be retired or who has become incapacitated by illness or injury may be retired by written instrument signed by a majority of the other Trustees; and (d) any Trustee may be removed at any special meeting of shareholders by a two-thirds vote of the outstanding voting securities of the trust. Officers and Advisory Board Members hold office without limit in time, except that any officer or Advisory Board Member may resign or may be removed by a vote of a majority of the Trustees at any regular meeting or any special meeting of the Trustees. Except as indicated, each individual has held the office shown or other offices in the same company for the past five years.
Each Trustee who is not an interested person (as defined in the 1940 Act) of the trust and the fund is referred to herein as an Independent Trustee.
The fund’s Statement of Additional Information (SAI) includes more information about the Trustees. To request a free copy, call Fidelity at 1-800-544-3455.
Experience, Skills, Attributes, and Qualifications of the Trustees. The Governance and Nominating Committee has adopted a statement of policy that describes the experience, qualifications, attributes, and skills that are necessary and desirable for potential Independent Trustee candidates (Statement of Policy). The Board believes that each Trustee satisfied at the time he or she was initially elected or appointed a Trustee, and continues to satisfy, the standards contemplated by the Statement of Policy. The Governance and Nominating Committee may also engage professional search firms to help identify potential Independent Trustee candidates with experience, qualifications, attributes, and skills consistent with the Statement of Policy. Additional criteria based on the composition and skills of the current Independent Trustees, as well as experience or skills that may be appropriate in light of future changes to board composition, business conditions, and regulatory or other developments, may be considered by the professional search firms and the Governance and Nominating Committee. In addition, the Board takes into account the Trustees' commitment and participation in Board and committee meetings, as well as their leadership of standing and ad hoc committees throughout their tenure.
In determining that a particular Trustee was and continues to be qualified to serve as a Trustee, the Board has considered a variety of criteria, none of which, in isolation, was controlling. The Board believes that, collectively, the Trustees have balanced and diverse experience, qualifications, attributes, and skills, which allow the Board to operate effectively in governing the fund and protecting the interests of shareholders. Information about the specific experience, skills, attributes, and qualifications of each Trustee, which in each case led to the Board's conclusion that the Trustee should serve (or continue to serve) as a trustee of the fund, is provided below.
Board Structure and Oversight Function. Robert A. Lawrence is an interested person and currently serves as Chairman. The Trustees have determined that an interested Chairman is appropriate and benefits shareholders because an interested Chairman has a personal and professional stake in the quality and continuity of services provided to the fund. Independent Trustees exercise their informed business judgment to appoint an individual of their choosing to serve as Chairman, regardless of whether the Trustee happens to be independent or a member of management. The Independent Trustees have determined that they can act independently and effectively without having an Independent Trustee serve as Chairman and that a key structural component for assuring that they are in a position to do so is for the Independent Trustees to constitute a substantial majority for the Board. The Independent Trustees also regularly meet in executive session. Mary C. Farrell serves as the lead Independent Trustee and as such (i) acts as a liaison between the Independent Trustees and management with respect to matters important to the Independent Trustees and (ii) with management prepares agendas for Board meetings.
Fidelity® funds are overseen by different Boards of Trustees. The fund's Board oversees asset allocation funds. Other Boards oversee Fidelity's investment-grade bond, money market, and asset allocation funds, and Fidelity's equity and high income funds. The fund may invest in Fidelity® funds overseen by such other Boards. The use of separate Boards, each with its own committee structure, allows the Trustees of each group of Fidelity® funds to focus on the unique issues of the funds they oversee, including common research, investment, and operational issues.
The Trustees primarily operate as a full Board, but also operate in committees, to facilitate the timely and efficient consideration of all matters of importance to the Trustees, the fund, and fund shareholders and to facilitate compliance with legal and regulatory requirements and oversight of the fund's activities and associated risks. The Board has charged Strategic Advisers and its affiliates with (i) identifying events or circumstances the occurrence of which could have demonstrably adverse effects on the fund's business and/or reputation; (ii) implementing processes and controls to lessen the possibility that such events or circumstances occur or to mitigate the effects of such events or circumstances if they do occur; and (iii) creating and maintaining a system designed to evaluate continuously business and market conditions in order to facilitate the identification and implementation processes described in (i) and (ii) above. Because the day-to-day operations and activities of the fund are carried out by or through Strategic Advisers, its affiliates and other service providers, the fund's exposure to risks is mitigated but not eliminated by the processes overseen by the Trustees. Board oversight of different aspects of the fund's activities is exercised primarily through the full Board, but also through the Audit and Compliance Committee. Appropriate personnel, including but not limited to the fund's Chief Compliance Officer (CCO), FMR's internal auditor, the independent accountants, the fund's Treasurer and portfolio management personnel, make periodic reports to the Board's committees, as appropriate. The responsibilities of each standing committee, including their oversight responsibilities, are described further under "Standing Committees of the Trustees."
Interested Trustees*:
Correspondence intended for a Trustee who is an interested person may be sent to Fidelity Investments, 245 Summer Street, Boston, Massachusetts 02210.
Name, Year of Birth; Principal Occupations and Other Relevant Experience+
Brian B. Hogan (1964)
Year of Election or Appointment: 2018
Trustee
Mr. Hogan also serves as Trustee of other funds. Mr. Hogan serves as Head of Fidelity Investments’ Investment Solutions and Innovation organization (2018-present), and a Director of Strategic Advisers LLC (2018-present). Previously, Mr. Hogan served as a Director of Fidelity SelectCo, LLC (investment adviser firm, 2014-2019), President of FMR Co., Inc. (2009-2018), a Vice President of Fidelity's Equity and High Income funds (2009-2018), a Director of FMR Investment Management (UK) Limited (investment adviser firm, 2015-2018), Trustee of certain Fidelity® funds (2014-2018), President of the Equity Division of Fidelity Management & Research Company (investment adviser firm, 2009-2018), Senior Vice President, Equity Research of Fidelity Management & Research Company (2006-2009), and as a portfolio manager. Mr. Brian B. Hogan is not related to Mr. Colm A. Hogan.
Robert A. Lawrence (1952)
Year of Election or Appointment: 2016
Trustee
Chairman of the Board of Trustees
Mr. Lawrence also serves as Trustee of other funds. Previously, Mr. Lawrence served as a Member of the Advisory Board of certain funds. Prior to his retirement in 2008, Mr. Lawrence served as Vice President of certain Fidelity® funds (2006-2008), Senior Vice President, Head of High Income Division of Fidelity Management & Research Company (investment adviser firm, 2006-2008), and President of Fidelity Strategic Investments (investment adviser firm, 2002-2005).
* Determined to be an "Interested Trustee" by virtue of, among other things, his or her affiliation with the trust or various entities under common control with Strategic Advisers.
+ The information includes the Trustee's principal occupation during the last five years and other information relating to the experience, attributes, and skills relevant to the Trustee's qualifications to serve as a Trustee, which led to the conclusion that the Trustee should serve as a Trustee for the fund.
Independent Trustees:
Correspondence intended for an Independent Trustee may be sent to Fidelity Investments, P.O. Box 55235, Boston, Massachusetts 02205-5235.
Name, Year of Birth; Principal Occupations and Other Relevant Experience+
Peter C. Aldrich (1944)
Year of Election or Appointment: 2006
Trustee
Mr. Aldrich also serves as Trustee of other funds. Mr. Aldrich is a Director of the National Bureau of Economic Research, a Director of the funds of BlackRock Realty Group (2006-present), and a Director of LivelyHood, Inc. (private corporation, 2013-present). Previously, Mr. Aldrich served as a Trustee for the Fidelity Rutland Square Trust (2005-2010), a Managing Member of Poseidon, LLC (foreign private investment, 1998-2004), and Chairman and Managing Member of AEGIS, LLC (foreign private investment, 1997-2004). Mr. Aldrich previously was a founder, Chief Executive Officer, and Chairman of AEW Capital Management, L.P. (then “Aldrich, Eastman and Waltch, L.P.”). Mr. Aldrich also served as a Director of Zipcar, Inc. (car sharing services, 2001-2009) and as Faculty Chairman of The Research Council on Global Investment of The Conference Board (business and professional education non-profit, 1999-2004). Mr. Aldrich is a Member Emeritus of the Board of Trustees of the Museum of Fine Arts Boston and an Overseer of the Massachusetts Eye and Ear Infirmary.
Ralph F. Cox (1932)
Year of Election or Appointment: 2006
Trustee
Mr. Cox also serves as Trustee of other funds. Mr. Cox is President of RABAR Enterprises (management consulting for the petroleum industry). Mr. Cox is a Director of Abraxas Petroleum (exploration and production, 1999-present). Mr. Cox is a member of the Advisory Boards of the Business and Engineering Schools of Texas A&M University and the Engineering School of University of Texas at Austin. Previously, Mr. Cox served as a Trustee for the Fidelity Rutland Square Trust (2005-2010) and as an Advisory Director of CH2M Hill Companies (engineering, 1981-2011). Mr. Ralph F. Cox and Mr. Howard E. Cox, Jr. are not related.
Mary C. Farrell (1949)
Year of Election or Appointment: 2013
Trustee
Ms. Farrell also serves as Trustee of other funds. Ms. Farrell is a Director of the W.R. Berkley Corporation (insurance provider) and President (2009-present) and Director (2006-present) of the Howard Gilman Foundation (charitable organization). Previously, Ms. Farrell was Managing Director and Chief Investment Strategist at UBS Wealth Management USA and Co-Head of UBS Wealth Management Investment Strategy & Research Group (2003-2005). Ms. Farrell also served as Investment Strategist at PaineWebber (1982-2000) and UBS PaineWebber (2000-2002). Ms. Farrell serves as Chairman of the Board of Trustees of Yale-New Haven Hospital and on the Yale New Haven Health System Board and previously served as Trustee on the Board of Overseers of the New York University Stern School of Business.
Karen Kaplan (1960)
Year of Election or Appointment: 2006
Trustee
Ms. Kaplan also serves as Trustee of other funds. Ms. Kaplan is Chairman (2014-present) and Chief Executive Officer (2013-present) of Hill Holliday (advertising and specialized marketing). Ms. Kaplan is a Director of The Michaels Companies, Inc. (specialty retailer, 2015-present), Member of the Board of Governors of the Chief Executives’ Club of Boston (2010-present), Member of the Executive Committee of the Greater Boston Chamber of Commerce (2006-present), Advisory Board Member of the National Association of Corporate Directors Chapter (2012-present), Member of the Board of Trustees of the Post Office Square Trust (2012-present), Trustee of the Brigham and Women’s Hospital (2016-present), Overseer of the Boston Symphony Orchestra (2014-present), Member of the Board of Directors of The Advertising Council, Inc. (2016-present), and Member of the Ron Burton Training Village Executive Board of Advisors (2018-present). Previously, Ms. Kaplan served as an Advisory Board Member of Fidelity Rutland Square Trust (2006-2010), a member of the Clinton Global Initiative (2010-2015), Director of DSM (dba Delta Dental and DentaQuest) (2004-2014), Formal Appointee of the 2015 Baker-Polito Economic Development Council, Director of Vera Bradley Inc. (designer of women’s accessories, 2012-2015), Member of the Board of Directors of the Massachusetts Conference for Women (2008-2015), Member of the Board of Directors of Jobs for Massachusetts (2012-2015), President of the Massachusetts Women’s Forum (2008-2010), Treasurer of the Massachusetts Women’s Forum (2002-2006), and Vice Chair of the Board of the Massachusetts Society for the Prevention of Cruelty to Children (2003-2010).
Heidi L. Steiger (1953)
Year of Election or Appointment: 2017
Trustee
Ms. Steiger also serves as Trustee of other funds. Ms. Steiger serves as a member of the Global Advisory Board and Of Counsel to Signum Global Advisors (international policy and strategy, 2018-present), a guest lecturer in the joint degree program in Global Luxury Management at North Carolina State University (Raleigh, NC) and Skema (Paris) (2018-present), Managing Partner of Topridge Associates, LLC (consulting, 2005-present), a Non-Executive Director of CrowdBureau Corporation (financial technology company and index provider, 2018-present), and a member of the Board of Directors (2013-present) and Chair of the Audit Committee and member of the Membership and Executive Committees (2017-present) of Business Executives for National Security (nonprofit). Previously, Ms. Steiger served as Eastern Region President of The Private Client Reserve of U.S. Bancorp (banking and financial services, 2010-2015), Advisory Director of Berkshire Capital Securities, LLC (financial services, 2009-2010), President and Senior Advisor of Lowenhaupt Global Advisors, LLC (financial services, 2005-2007), and President and Contributing Editor of Worth Magazine (2004-2005) and held a variety of positions at Neuberger Berman Group, LLC (financial services, 1986-2004), including Partner and Executive Vice President and Global Head of Private Asset Management at Neuberger Berman (1999-2004). Ms. Steiger also served as a member of the Board of Directors of Nuclear Electric Insurance Ltd (insurer of nuclear utilities, 2006-2017), a member of the Board of Trustees and Audit Committee of the Eaton Vance Funds (2007-2010), a member of the Board of Directors of Aviva USA (formerly AmerUs) (insurance, 2004-2014), and a member of the Board of Trustees and Audit Committee and Chair of the Investment Committee of CIFG (financial guaranty insurance, 2009-2012), and a member of the Board of Directors of Kin Group Plc (formerly, Fitbug Holdings) (health and technology, 2016-2017).
+ The information includes the Trustee's principal occupation during the last five years and other information relating to the experience, attributes, and skills relevant to the Trustee's qualifications to serve as a Trustee, which led to the conclusion that the Trustee should serve as a Trustee for the fund.
Advisory Board Members and Officers:
Correspondence intended for an officer or Howard E. Cox, Jr. may be sent to Fidelity Investments, 245 Summer Street, Boston, Massachusetts 02210. Officers appear below in alphabetical order.
Name, Year of Birth; Principal Occupation
Howard E. Cox, Jr. (1944)
Year of Election or Appointment: 2009
Member of the Advisory Board
Mr. Cox also serves as Member of the Advisory Board of other funds. Mr. Cox is a Partner of Greylock (venture capital, 1971-present) and a Director of Stryker Corporation (medical products and services, 1974-present). Previously, Mr. Cox served as an Advisory Board Member of Fidelity Rutland Square Trust (2006-2010). Mr. Cox also serves as a Member of the Secretary of Defense's Business Board of Directors (2008-present), a Director of Business Executives for National Security (1997-present), a Director of the Brookings Institution (2010-present), a Director of the World Economic Forum’s Young Global Leaders Foundation (2009-present), and is a Member of the Harvard Medical School Board of Fellows (2002-present). Mr. Howard E. Cox, Jr. and Mr. Ralph F. Cox are not related.
Christine Marcks (1955)
Year of Election or Appointment: 2019
Member of the Advisory Board
Ms. Marcks also serves as Member of the Advisory Board of other Funds. Prior to her retirement, Ms. Marcks served as Chief Executive Officer and President – Prudential Retirement (2007-2017) and Vice President for Rollover and Retirement Income Strategies (2005-2007), Prudential Financial, Inc. (financial services). Previously, Ms. Marcks was Senior Vice President and Head of Financial Horizons (2002-2004) and Vice President, Strategic Marketing (2000-2002) of Voya Financial (formerly ING U.S.) (financial services), held numerous positions at Aetna Financial Services (financial services, 1987-2000) and served as an International Economist for the United States Department of the Treasury (1980-1987). Ms. Marcks also serves as a member of the Board of Trustees, Audit Committee and Benefits & Operations Committee of the YMCA Retirement Fund (2018-present), a non-profit organization providing retirement plan benefits to YMCA staff members, and as a member of the Board of Trustees of Assumption College (2019-present).
Elizabeth Paige Baumann (1968)
Year of Election or Appointment: 2017
Anti-Money Laundering (AML) Officer
Ms. Baumann also serves as AML Officer of other funds. She is Chief AML Officer (2012-present) and Senior Vice President (2014-present) of FMR LLC (diversified financial services company) and is an employee of Fidelity Investments. Previously, Ms. Baumann served as AML Officer of certain funds (2017-2019), as AML Officer of the funds (2012-2016), and Vice President (2007-2014) and Deputy Anti-Money Laundering Officer (2007-2012) of FMR LLC.
Craig S. Brown (1977)
Year of Election or Appointment: 2019
Assistant Treasurer
Mr. Brown also serves as Assistant Treasurer of other funds. Mr. Brown is an employee of Fidelity Investments (2013-present).
John J. Burke III (1964)
Year of Election or Appointment: 2018
Chief Financial Officer
Mr. Burke also serves as Chief Financial Officer of other funds. Mr. Burke serves as Head of Investment Operations for Fidelity Fund and Investment Operations (2018-present) and is an employee of Fidelity Investments (1998-present). Previously Mr. Burke served as head of Asset Management Investment Operations (2012-2018).
Jonathan Davis (1968)
Year of Election or Appointment: 2010
Assistant Treasurer
Mr. Davis also serves as Assistant Treasurer of other funds. Mr. Davis serves as Assistant Treasurer of FMR Capital, Inc. (2017-present) and is an employee of Fidelity Investments. Previously, Mr. Davis served as Vice President and Associate General Counsel of FMR LLC (diversified financial services company, 2003-2010).
Laura M. Del Prato (1964)
Year of Election or Appointment: 2018
Assistant Treasurer
Ms. Del Prato also serves as an officer of other funds. Ms. Del Prato is an employee of Fidelity Investments (2017-present). Prior to joining Fidelity Investments, Ms. Del Prato served as a Managing Director and Treasurer of the JPMorgan Mutual Funds (2014-2017). Prior to JPMorgan, Ms. Del Prato served as a partner at Cohen Fund Audit Services (accounting firm, 2012-2013) and KPMG LLP (accounting firm, 2004-2012).
James D. Gryglewicz (1972)
Year of Election or Appointment: 2015
Chief Compliance Officer
Mr. Gryglewicz also serves as Chief Compliance Officer of other funds. Mr. Gryglewicz serves as Compliance Officer of Strategic Advisers LLC (investment adviser firm, 2015-present), Senior Vice President of Asset Management Compliance (2009-present), and is an employee of Fidelity Investments (2004-present). Previously, Mr. Gryglewicz served as Compliance Officer of Fidelity SelectCo, LLC (investment adviser firm, 2014-2019), and as Chief Compliance Officer of certain Fidelity® funds (2014-2018).
Colm A. Hogan (1973)
Year of Election or Appointment: 2016
Assistant Treasurer
Mr. Hogan also serves as an officer of other funds. Mr. Hogan serves as Assistant Treasurer of FMR Capital, Inc. (2017-present) and is an employee of Fidelity Investments (2005-present). Previously, Mr. Hogan served as Deputy Treasurer of certain Fidelity® funds (2016-2020) and Assistant Treasurer of certain Fidelity® funds (2016-2018). Mr. Colm A. Hogan is not related to Mr. Brian B. Hogan.
Christina H. Lee (1975)
Year of Election or Appointment: 2020
Secretary and Chief Legal Officer
Ms. Lee also serves as Secretary and CLO of other funds. Ms. Lee serves as Vice President, Associate General Counsel (2014-present) and is an employee of Fidelity Investments (2007-present). Previously, Ms. Lee served as Assistant Secretary of certain funds (2018-2019).
Cynthia Lo Bessette (1969)
Year of Election or Appointment: 2020
Assistant Secretary
Ms. Lo Bessette also serves as an officer of other funds. Ms. Lo Bessette serves as CLO, Secretary, and Senior Vice President of Fidelity Management & Research Company LLC (investment adviser firm, 2019-present); and CLO of Fidelity Management & Research (Hong Kong) Limited, FMR Investment Management (UK) Limited, and Fidelity Management & Research (Japan) Limited (investment adviser firms, 2019-present). She is a Senior Vice President and Deputy General Counsel of FMR LLC (diversified financial services company, 2019-present), and is an employee of Fidelity Investments. Previously, Ms. Lo Bessette served as CLO, Secretary, and Senior Vice President of FMR Co., Inc. (investment adviser firm, 2019); Secretary of Fidelity SelectCo, LLC and Fidelity Investments Money Management, Inc. (investment adviser firms, 2019). Prior to joining Fidelity Investments, Ms. Lo Bessette was Executive Vice President, General Counsel (2016-2019) and Senior Vice President, Deputy General Counsel (2015-2016) of OppenheimerFunds (investment management company) and Deputy Chief Legal Officer (2013-2015) of Jennison Associates LLC (investment adviser firm).
Chris Maher (1972)
Year of Election or Appointment: 2016
Assistant Treasurer
Mr. Maher also serves as an officer of other funds. Mr. Maher serves as Assistant Treasurer of FMR Capital, Inc. (2017-present), and is an employee of Fidelity Investments (2008-present). Previously, Mr. Maher served as Assistant Treasurer of certain funds (2013-2020); Vice President of Asset Management Compliance (2013), Vice President of the Program Management Group of FMR (investment adviser firm, 2010-2013), and Vice President of Valuation Oversight (2008-2010).
Stacie M. Smith (1974)
Year of Election or Appointment: 2020
President and Treasurer
Ms. Smith also serves as an officer of other funds. Ms. Smith serves as Assistant Treasurer of FMR Capital, Inc. (2017-present), is an employee of Fidelity Investments (2009-present), and has served in other fund officer roles. Prior to joining Fidelity Investments, Ms. Smith served as Senior Audit Manager of Ernst & Young LLP (accounting firm, 1996-2009). Previously, Ms. Smith served as Assistant Treasurer (2013-2019) and Deputy Treasurer (2013-2016) of certain Fidelity® funds.
Marc L. Spector (1972)
Year of Election or Appointment: 2016
Assistant Treasurer
Mr. Spector also serves as an officer of other funds. Mr. Spector serves as Assistant Treasurer of FMR Capital, Inc. (2017-present) and is an employee of Fidelity Investments (2016-present). Prior to joining Fidelity Investments, Mr. Spector served as Director at the Siegfried Group (accounting firm, 2013-2016), and prior to Siegfried Group as audit senior manager at Deloitte & Touche LLP (accounting firm, 2005-2013).
Jim Wegmann (1979)
Year of Election or Appointment: 2019
Assistant Treasurer
Mr. Wegmann also serves as Assistant Treasurer of other funds. Mr. Wegmann is an employee of Fidelity Investments (2011-present).
Shareholder Expense Example
As a shareholder of the Fund, you incur two types of costs: (1) transaction costs and (2) ongoing costs, including management fees and other Fund expenses. This Example is intended to help you understand your ongoing costs (in dollars) of investing in the Fund and to compare these costs with the ongoing costs of investing in other mutual funds.
The Example is based on an investment of $1,000 invested at the beginning of the period and held for the entire period (September 1, 2019 to February 29, 2020).
Actual Expenses
The first line of the accompanying table provides information about actual account values and actual expenses. You may use the information in this line, together with the amount you invested, to estimate the expenses that you paid over the period. Simply divide your account value by $1,000.00 (for example, an $8,600 account value divided by $1,000.00 = 8.6), then multiply the result by the number in the first line under the heading entitled "Expenses Paid During Period" to estimate the expenses you paid on your account during this period. In addition to the direct expenses incurred by the Fund presented in the table, as a shareholder of the underlying mutual funds and exchange-traded funds (ETFs) (the Underlying Funds), the Fund also indirectly bears its proportionate share of the expenses of the Underlying Funds. In addition, the Fund, as a shareholder in the underlying Fidelity Central Funds, will indirectly bear its pro-rata share of the fees and expenses incurred by the underlying Fidelity Central Funds. These fees and expenses are not included in the Fund's annualized expense ratio used to calculate the expense estimate in the table below.
Hypothetical Example for Comparison Purposes
The second line of the accompanying table provides information about hypothetical account values and hypothetical expenses based on the Fund's actual expense ratio and an assumed rate of return of 5% per year before expenses, which is not the Fund's actual return. The hypothetical account values and expenses may not be used to estimate the actual ending account balance or expenses you paid for the period. You may use this information to compare the ongoing costs of investing in the Fund and other funds. To do so, compare this 5% hypothetical example with the 5% hypothetical examples that appear in the shareholder reports of the other funds. In addition to the direct expenses incurred by the Fund presented in the table, as a shareholder of the Underlying Funds, the Fund also indirectly bears its proportionate share of the expenses of the Underlying Funds. In addition, the Fund, as a shareholder in the underlying Fidelity Central Funds, will indirectly bear its pro-rata share of the fees and expenses incurred by the underlying Fidelity Central Funds. These fees and expenses are not included in the Fund's annualized expense ratio used to calculate the expense estimate in the table below.
Please note that the expenses shown in the table are meant to highlight your ongoing costs only and do not reflect any transaction costs. Therefore, the second line of the table is useful in comparing ongoing costs only, and will not help you determine the relative total costs of owning different funds.
| Annualized Expense Ratio-A | Beginning Account Value September 1, 2019 | Ending Account Value February 29, 2020 | Expenses Paid During Period-B September 1, 2019 to February 29, 2020 |
|
| Actual | .38% | $1,000.00 | $1,039.80 | $1.93 |
| Hypothetical-C | $1,000.00 | $1,022.97 | $1.91 |
A Annualized expense ratio reflects expenses net of applicable fee waivers.
B Expenses are equal to the Fund's annualized expense ratio, multiplied by the average account value over the period, multiplied by 182/366 (to reflect the one-half year period). The fees and expenses of the Underlying Funds in which the Fund invests are not included in the Fund's annualized expense ratio.
C 5% return per year before expenses
Distributions (Unaudited)
The fund designates 6% and 1% of the dividends distributed in April and December, respectively during the fiscal year as qualifying for the dividends–received deduction for corporate shareholders.
The fund designates 86% and 64% of the dividends distributed in April and December, respectively during the fiscal year as amounts which may be taken into account as a dividend for the purposes of the maximum rate under section 1(h)(11) of the Internal Revenue Code.
The amounts per share which represent income derived from sources within, and taxes paid to, foreign countries or possessions of the United States are $0.0060 and $0.0010 for the dividend paid April 8, 2019, and $0.2544 and $0.0264 for the dividend paid December 31, 2019.
The fund will notify shareholders in January 2021 of amounts for use in preparing 2020 income tax returns.
Board Approval of Investment Advisory Contracts and Management Fees
Strategic Advisers Emerging Markets Fund
Each year, the Board of Trustees, including the Independent Trustees (together, the Board), votes at an in-person meeting on the renewal of the management contract with Strategic Advisers LLC (Strategic Advisers) and the sub-advisory agreements with Acadian Asset Management (Acadian), Causeway Capital Management, FIAM LLC (FIAM), FIL Investment Advisors (FIL), Schroder Investment Management North America, Inc. (SIMNA Inc.), Somerset Capital Management LLP (Somerset), and T. Rowe Price Associates, Inc. (T. Rowe Price) (collectively, the Sub-Advisory Agreements), and the sub-sub-advisory agreements with FIL Investment Advisors (UK) Limited, Schroder Investment Management North America Limited, and T. Rowe Price International Ltd. (collectively, the Sub-Sub-Advisory Agreements and, together with the management contract and the Sub-Advisory Agreements, the Advisory Contracts) for the fund. Strategic Advisers and the Sub-Advisers are referred to herein as the Investment Advisers. The Board, assisted by the advice of fund counsel and Independent Trustees' counsel, requests and considers a broad range of information relevant to the renewal of the Advisory Contracts throughout the year.The Board meets at least four times per year and, at each of its meetings, covers an extensive agenda of topics and materials and considers factors that are relevant to its annual consideration of the renewal of the fund's Advisory Contracts, including the services and support provided to the fund and its shareholders. The full Board or the Independent Trustees, as appropriate, act on all major matters; however, a portion of the activities of the Board (including certain of those described herein) may be conducted through standing committees that have been established by the Board. The Board, acting directly and through its committees, requests and receives information concerning the annual consideration of the renewal of the fund's Advisory Contracts.At its September 2019 meeting, the Board, including the Independent Trustees, unanimously determined to renew the fund's Advisory Contracts. In addition, the Board approved amendments to the fund's sub-advisory agreements with Acadian, FIL, SIMNA Inc., and Somerset to add certain exceptions to the most favored nation provision in each such sub-advisory agreement and, where applicable, to make other non-material amendments to the agreements. The Board noted that the other terms of each amended sub-advisory agreement are not materially different from those of the applicable existing sub-advisory agreement and that Acadian, FIL, SIMNA Inc., and Somerset each will continue to provide the same services to the fund.In reaching its determination to renew the fund's Advisory Contracts and approve the amendments to the sub-advisory agreements described above (Amendments), the Board considered all factors it believed relevant, including (i) the nature, extent, and quality of the services provided to the fund and its shareholders (including the investment performance of the fund); (ii) the competitiveness of the fund's management fee and total expenses relative to peer funds; (iii) the total costs of the services provided by and the profits, if any, realized by Strategic Advisers from its relationships with the fund; and (iv) the extent to which, if any, economies of scale exist and are realized as the fund grows and whether any economies of scale are appropriately shared with fund shareholders.In considering whether to renew the Advisory Contracts for the fund and approve the Amendments, the Board reached a determination, with the assistance of fund counsel and Independent Trustees' counsel and through the exercise of its business judgment, that the renewal of the Advisory Contracts and the approval of the Amendments is in the best interests of the fund and its shareholders. In addition, with respect to the Sub-Advisory Agreements, the Board also concluded that the renewal of such agreements and the approval of the Amendments do not involve a conflict of interest from which Strategic Advisers or its affiliates derive an inappropriate advantage. Also, the Board found that the advisory fees charged under the Advisory Contracts bear a reasonable relationship to the services rendered and are based on services provided that are in addition to, rather than duplicative of, services provided under the advisory contract of any underlying fund in which the fund may invest. The Board's decision to renew the Advisory Contracts and approve the Amendments was not based on any single factor, but rather was based on a comprehensive consideration of all the information provided to the Board throughout the year. Nature, Extent, and Quality of Services Provided. The Board considered the staffing within the Investment Advisers, including the backgrounds of the fund's investment personnel and also considered the fund's investment objective, strategies, and related investment philosophy. The Independent Trustees also had discussions with senior management of Strategic Advisers' investment operations and investment groups. The Board considered the structure of each Investment Adviser's investment personnel compensation program and whether such structures provide appropriate incentives to act in the best interests of the fund.The Trustees also discussed with representatives of Strategic Advisers, at meetings throughout the year, Strategic Advisers' role in, among other things, (i) setting, implementing and monitoring the investment strategies for the funds; (ii) identifying and recommending sub-advisers for the funds; (iii) overseeing compliance with federal securities laws by each sub-adviser with respect to the portion of fund assets allocated to the sub-adviser; (iv) monitoring and overseeing the performance and investment capabilities of each sub-adviser; and (v) recommending the replacement of a sub-adviser as appropriate. The Trustees considered that the Board had received from Strategic Advisers substantial information and periodic reports about Strategic Advisers' sub-adviser oversight and due diligence processes, as well as periodic reports regarding the performance of each sub-adviser.The Board also considered the nature, extent and quality of services provided by each Sub-Adviser. The Trustees noted that under the Sub-Advisory Agreements subject to oversight by Strategic Advisers, each Sub-Adviser is responsible for, among other things, identifying investments for the portion of fund assets allocated to the Sub-Adviser, if any, and executing portfolio transactions to implement its investment strategy. In addition, the Trustees noted that each Sub-Adviser is responsible for providing such reporting as may be requested from Strategic Advisers to fulfill its oversight responsibilities discussed above. Resources Dedicated to Investment Management and Support Services. The Board reviewed the general qualifications and capabilities of the Investment Advisers' investment staffs, their use of technology, and the Investment Advisers' approach to managing and compensating investment personnel. The Board noted that the Investment Advisers' analysts have extensive resources, tools, and capabilities that allow them to conduct sophisticated quantitative and/or fundamental analysis. Additionally, in its deliberations, the Board considered the Investment Advisers' trading capabilities and resources and global compliance infrastructure, which are integral parts of the investment management process. Shareholder and Administrative Services. The Board considered (i) the nature, extent, quality, and cost of administrative and shareholder services performed by Strategic Advisers and its affiliates under the management contract and under separate agreements covering transfer agency, pricing and bookkeeping, and securities lending services for the fund; (ii) the nature and extent of Strategic Advisers' supervision of third party service providers, including sub-advisers, custodians and subcustodians; and (iii) the resources devoted to, and the record of compliance with, the fund's compliance policies and procedures. Investment Performance. The Board considered whether the fund has operated in accordance with its investment objective, as well as its record of compliance with its investment restrictions and its performance history.In connection with the renewal of the Advisory Contracts, the Board considered annualized return information for the fund for different time periods, measured against an appropriate securities market index ("benchmark index") and a peer group of mutual funds with similar objectives ("peer group").The Board considered discussions that occur at Board meetings throughout the year with representatives of Strategic Advisers about fund investment performance and the performance of each Sub-Adviser as part of regularly scheduled fund reviews and other reports to the Board on fund performance, taking into account various factors including general market conditions. In its discussions with representatives of Strategic Advisers regarding fund performance, the Board gave particular attention to information indicating underperformance of certain funds for specific time periods and discussed with Strategic Advisers the reasons for any such underperformance.The following charts considered by the Board show, over the one-, three-, and five-year periods ended December 31, 2018, the cumulative total returns of the fund and the cumulative total returns of an appropriate benchmark index and peer group. The box within each chart shows the 25th percentile return (75% beaten, top of box) and the 75th percentile return (25% beaten, bottom of box) of the peer group. Returns shown above the box are in the first quartile and returns shown below the box are in the fourth quartile. The percentage beaten number noted below each chart corresponds to the percentile box and represents the percentage of funds in the peer group whose performance was equal to or lower than that of the fund.Strategic Advisers Emerging Markets Fund
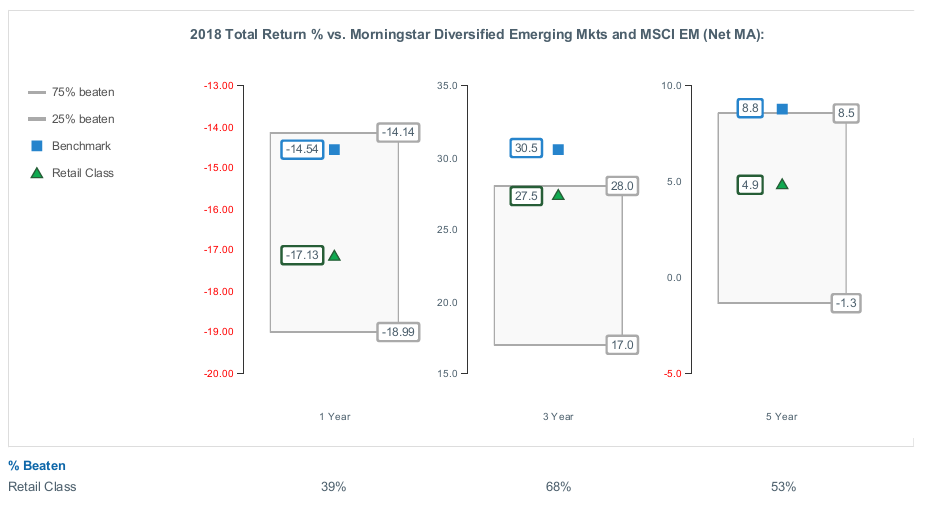
Strategic Advisers Emerging Markets Fund

Liquidity Risk Management Program
The Securities and Exchange Commission adopted Rule 22e-4 under the Investment Company Act of 1940 (the Liquidity Rule) to promote effective liquidity risk management throughout the open-end investment company industry, thereby reducing the risk that funds will be unable to meet their redemption obligations and mitigating dilution of the interests of fund shareholders.
The Fund has adopted and implemented a liquidity risk management program (the Program) reasonably designed to assess and manage the Fund’s liquidity risk and to comply with the requirements of the Liquidity Rule. The Fund’s Board of Trustees (the Board) has designated the Fund’s investment adviser as administrator of the Program. Strategic Advisers has established a Liquidity Risk Management Committee (the LRM Committee) to manage the Program for each of the Funds. The LRM Committee monitors the adequacy and effectiveness of implementation of the Program and on a periodic basis assesses each Fund’s liquidity risk based on a variety of factors including (1) the Fund’s investment strategy, (2) portfolio liquidity and cash flow projections during normal and reasonably foreseeable stressed conditions, (3) shareholder redemptions and (4) borrowings and other funding sources, as applicable.
In accordance with the Program, each of the Fund’s portfolio investments is classified into one of four liquidity categories described below based on a determination of a reasonable expectation for how long it would take to convert the investment to cash (or sell or dispose of the investment) without significantly changing its market value.
- Highly liquid investments – cash or convertible to cash within three business days or less
- Moderately liquid investments – convertible to cash in three to seven calendar days
- Less liquid investments – can be sold or disposed of, but not settled, within seven calendar days
- Illiquid investments – cannot not be sold or disposed of within seven calendar days
Liquidity classification determinations take into account a variety of factors including various market, trading and investment-specific considerations, as well as market depth, and generally utilize analysis from a third-party liquidity metrics service.
The Liquidity Rule places a 15% limit on a fund’s illiquid investments and requires funds that do not primarily hold assets that are highly liquid investments to determine and maintain a minimum percentage of the fund’s net assets to be invested in highly liquid investments (highly liquid investment minimum or HLIM). The Program includes provisions reasonably designed to comply with the 15% limit on illiquid investments and for determining, periodically reviewing and complying with the HLIM requirement as applicable.
At a recent meeting of the Fund’s Board of Trustees, the LRM Committee provided a written report to the Board pertaining to the operation, adequacy, and effectiveness of implementation of the Program for the annual period from December 1, 2018 through November 30, 2019. The report concluded that the Program has been implemented and is operating effectively and is reasonably designed to assess and manage the Fund’s liquidity risk.
![]()
SAE-ANN-0420
1.918359.109
Strategic Advisers® Fidelity® International Fund
Offered exclusively to certain clients of Strategic Advisers LLC - not available for sale to the general public
February 29, 2020
See the inside front cover for important information about access to your fund’s shareholder reports.
Beginning on January 1, 2021, as permitted by regulations adopted by the Securities and Exchange Commission, paper copies of a fund’s shareholder reports will no longer be sent by mail, unless you specifically request paper copies of the reports from the fund or from your financial intermediary, such as a financial advisor, broker-dealer or bank. Instead, the reports will be made available on a website, and you will be notified by mail each time a report is posted and provided with a website link to access the report.
If you already elected to receive shareholder reports electronically, you will not be affected by this change and you need not take any action. You may elect to receive shareholder reports and other communications from a fund electronically, by contacting your financial intermediary. For Fidelity customers, visit Fidelity's web site or call Fidelity using the contact information listed below.
You may elect to receive all future reports in paper free of charge. If you wish to continue receiving paper copies of your shareholder reports, you may contact your financial intermediary or, if you are a Fidelity customer, visit Fidelity’s website, or call Fidelity at the applicable toll-free number listed below. Your election to receive reports in paper will apply to all funds held with the fund complex/your financial intermediary.
| Account Type | Website | Phone Number |
| Brokerage, Mutual Fund, or Annuity Contracts: | fidelity.com/mailpreferences | 1-800-343-3548 |
| Employer Provided Retirement Accounts: | netbenefits.fidelity.com/preferences (choose 'no' under Required Disclosures to continue to print) | 1-800-343-0860 |
| Advisor Sold Accounts Serviced Through Your Financial Intermediary: | Contact Your Financial Intermediary | Your Financial Intermediary's phone number |
| Advisor Sold Accounts Serviced by Fidelity: | institutional.fidelity.com | 1-877-208-0098 |
Contents
|
Board Approval of Investment Advisory Contracts and Management Fees | |
To view a fund's proxy voting record for the 12-month period ended June 30, visit http://www.fidelity.com/proxyvotingresults or visit the Securities and Exchange Commission's (SEC) web site at http://www.sec.gov.
You may also call 1-800-544-3455 to request a free copy of the proxy voting guidelines.
Standard & Poor's, S&P and S&P 500 are registered service marks of The McGraw-Hill Companies, Inc. and have been licensed for use by Fidelity Distributors Corporation.
Other third-party marks appearing herein are the property of their respective owners.
All other marks appearing herein are registered or unregistered trademarks or service marks of FMR LLC or an affiliated company. © 2020 FMR LLC. All rights reserved.
This report and the financial statements contained herein are submitted for the general information of the shareholders of the Fund. This report is not authorized for distribution to prospective investors in the Fund unless preceded or accompanied by an effective prospectus.
A fund files its complete schedule of portfolio holdings with the SEC for the first and third quarters of each fiscal year on Form N-PORT. Forms N-PORT are available on the SEC’s web site at http://www.sec.gov. A fund's Forms N-PORT may be reviewed and copied at the SEC’s Public Reference Room in Washington, DC. Information regarding the operation of the SEC's Public Reference Room may be obtained by calling 1-800-SEC-0330.
For a complete list of a fund's portfolio holdings, view the most recent holdings listing, semiannual report, or annual report on Fidelity's web site at http://www.fidelity.com, http://www.institutional.fidelity.com, or http://www.401k.com, as applicable.
NOT FDIC INSURED •MAY LOSE VALUE •NO BANK GUARANTEE
Neither the Fund nor Fidelity Distributors Corporation is a bank.
Note to Shareholders:
Early in 2020, the outbreak and spread of a new coronavirus emerged as a public health emergency that had a major influence on financial markets, primarily based on its impact on the global economy and corporate earnings. The virus causes a respiratory disease known as COVID-19. On March 11, the World Health Organization declared the COVID-19 outbreak a pandemic, citing sustained risk of further global spread.
In the weeks following the end of this reporting period, as the crisis worsened, we witnessed an escalating human tragedy with wide-scale social and economic consequences from coronavirus-containment measures. The outbreak of COVID-19 prompted a number of measures to limit the spread, including travel and border restrictions, quarantines, and restrictions on large gatherings. In turn, these resulted in lower consumer activity, diminished demand for a wide range of products and services, disruption in manufacturing and supply chains, and – given the wide variability in outcomes regarding the outbreak – significant market uncertainty and volatility. Amid the turmoil, the U.S. government took unprecedented action – in concert with the U.S. Federal Reserve and central banks around the world – to help support consumers, businesses, and the broader economy, and to limit disruption to the financial system.
The situation continues to unfold, and the extent and duration of its impact on financial markets and the economy remain highly uncertain. Extreme events such as the coronavirus crisis are “exogenous shocks” that can have significant adverse effects on mutual funds and their investments. Although multiple asset classes may be affected by market disruption, the duration and impact may not be the same for all types of assets.
Fidelity is committed to helping you stay informed amid news about COVID-19 and during increased market volatility, and we’re taking extra steps to be responsive to customer needs. We encourage you to visit our websites, where we offer ongoing updates, commentary, and analysis on the markets and our funds.
Performance: The Bottom Line
Average annual total return reflects the change in the value of an investment, assuming reinvestment of distributions from dividend income and capital gains (the profits earned upon the sale of securities that have grown in value, if any) and assuming a constant rate of performance each year. The hypothetical investment and the average annual total returns do not reflect the deduction of taxes that a shareholder would pay on fund distributions or the redemption of fund shares. During periods of reimbursement by Fidelity, a fund’s total return will be greater than it would be had the reimbursement not occurred. How a fund did yesterday is no guarantee of how it will do tomorrow.
Average Annual Total Returns
| For the periods ended February 29, 2020 | Past 1 year | Past 5 years | Past 10 years |
| Strategic Advisers® Fidelity® International Fund | 5.10% | 3.32% | 5.93% |
$10,000 Over 10 Years
Let's say hypothetically that $10,000 was invested in Strategic Advisers® Fidelity® International Fund on February 28, 2010.
The chart shows how the value of your investment would have changed, and also shows how the MSCI EAFE Index performed over the same period.

| Period Ending Values | ||
|
| $17,784 | Strategic Advisers® Fidelity® International Fund |
|
| $16,291 | MSCI EAFE Index |
Management's Discussion of Fund Performance
Market Recap: The MSCI ACWI (All Country World Index) ex USA Index returned -0.51% for the 12 months ending February 29, 2020, as the negative impact of the new coronavirus in early 2020 reversed a strong uptrend. For the first 10 months of the past year, international stocks gained ground as they benefited from accommodative monetary policies from central banks around the world, favorable economic growth and de-escalation of the U.S.–China trade conflict. However, in January, the outbreak and spread of the novel coronavirus in China became a growing concern for many investors, threatening global economic growth and corporate earnings. The index had a return of -2.68% for the month. The outbreak escalated globally in February, when the index returned -7.90% amid a surge of cases outside China and causing investors to generally favor safer asset classes. For the full 12 months, the energy (-17%) sector was hit hardest, as concerns about global growth and lack of demand for crude oil and natural gas pressured stocks. Materials (-8%) fared poorly, followed by financials (-5%). Conversely, the defensive health care (+10%) and utilities (+7%) sectors held up well, while information technology (+17%) led the way. Regionally, the U.K. (-7%) suffered from uncertainty tied to Brexit for most of the period, though Parliament approved a deal in January. Asia Pacific ex Japan (-3%) and emerging markets (-2%) lagged, whereas Europe ex U.K. (+3%), Canada (+2%) and Japan (+1) slightly outperformed. Comments from Portfolio Manager Wilfred Chilangwa: For the fiscal year, the Fund gained 5.10%, handily outpacing the -0.34% return of the benchmark MSCI EAFE Index. During a period in which growth stocks and strategies outperformed their value-oriented counterparts, growth-oriented underlying managers emphasizing momentum and/or company quality delivered the best results. Fidelity® International Capital Appreciation Fund (+13%), which targets high-quality growth stocks, outperformed the benchmark by a large margin and was the top relative contributor. Fidelity® Diversified International Fund (+10%) – which follows a GARP (growth at a reasonable price) approach – also notably outperformed, led by stock picks in Europe ex U.K. and Japan, complemented by a sizable, out-of-benchmark allocation in emerging markets. Fidelity Overseas Fund (+8%) provided a further boost to the portfolio's relative result. This manager seeks to own high-quality companies purchased at attractive prices that he believes can outperform the market over the long term. On the downside, Fidelity® SAI® International Value Index Fund (-6%) was the largest relative detractor, as its style was out of favor the past 12 months. Despite this period's disappointing performance, I believe this fund helps balance the growth emphasis of the active managers in the portfolio. As of February 29, the portfolio was defensively positioned, reflecting heightened economic risk from the coronavirus pandemic.The views expressed above reflect those of the portfolio manager(s) only through the end of the period as stated on the cover of this report and do not necessarily represent the views of Fidelity or any other person in the Fidelity organization. Any such views are subject to change at any time based upon market or other conditions and Fidelity disclaims any responsibility to update such views. These views may not be relied on as investment advice and, because investment decisions for a Fidelity fund are based on numerous factors, may not be relied on as an indication of trading intent on behalf of any Fidelity fund.
Investment Summary (Unaudited)
The information in the following tables is based on the direct investments of the Fund.Top Ten Holdings as of February 29, 2020
(excluding cash equivalents)
| % of fund's net assets | |
| Fidelity Overseas Fund | 15.4 |
| Fidelity Diversified International Fund | 15.2 |
| Fidelity International Discovery Fund | 14.9 |
| Fidelity International Capital Appreciation Fund | 13.2 |
| Fidelity SAI International Value Index Fund | 11.9 |
| Fidelity SAI International Low Volatility Index Fund | 8.9 |
| Fidelity Advisor Japan Fund Class I | 3.0 |
| Fidelity International Value Fund | 2.1 |
| Fidelity Pacific Basin Fund | 1.8 |
| Fidelity Advisor International Real Estate Fund Class I | 1.0 |
| 87.4 |
Asset Allocation (% of fund's net assets)
| As of February 29, 2020 | ||
| Common Stocks | 7.1% | |
| Foreign Large Blend Funds | 10.7% | |
| Foreign Large Growth Funds | 59.5% | |
| Foreign Large Value Funds | 14.0% | |
| Foreign Small Mid Growth Funds | 0.9% | |
| Other | 3.4% | |
| Sector Funds | 1.0% | |
| Short-Term Investments and Net Other Assets (Liabilities) | 3.4% | |

Asset allocations of funds in the pie chart reflect the categorizations of assets as defined by Morningstar as of the reporting date.
Schedule of Investments February 29, 2020
Showing Percentage of Net Assets
| Common Stocks - 7.1% | |||
| Shares | Value | ||
| COMMUNICATION SERVICES - 0.4% | |||
| Diversified Telecommunication Services - 0.2% | |||
| Cellnex Telecom SA (a) | 79,472 | $3,874,597 | |
| HKT Trust/HKT Ltd. unit | 3,791,000 | 5,670,694 | |
| Nippon Telegraph & Telephone Corp. | 234,800 | 5,477,830 | |
| 15,023,121 | |||
| Interactive Media & Services - 0.0% | |||
| Adevinta ASA Class B | 148,360 | 1,562,570 | |
| Yahoo! Japan Corp. | 442,500 | 1,612,298 | |
| 3,174,868 | |||
| Media - 0.0% | |||
| Informa PLC | 222,675 | 1,970,771 | |
| Schibsted ASA (A Shares) | 76,356 | 1,946,016 | |
| 3,916,787 | |||
| Wireless Telecommunication Services - 0.2% | |||
| SoftBank Group Corp. | 222,100 | 10,318,393 | |
| Vodafone Group PLC | 1,647,096 | 2,878,709 | |
| 13,197,102 | |||
| TOTAL COMMUNICATION SERVICES | 35,311,878 | ||
| CONSUMER DISCRETIONARY - 0.8% | |||
| Auto Components - 0.1% | |||
| DENSO Corp. | 169,400 | 6,627,740 | |
| Automobiles - 0.2% | |||
| Bayerische Motoren Werke AG (BMW) | 34,271 | 2,261,294 | |
| Ferrari NV | 18,511 | 2,915,813 | |
| Isuzu Motors Ltd. | 264,700 | 2,493,373 | |
| Subaru Corp. | 128,800 | 3,128,051 | |
| Suzuki Motor Corp. | 55,600 | 2,235,650 | |
| Toyota Motor Corp. | 44,800 | 2,941,779 | |
| 15,975,960 | |||
| Hotels, Restaurants & Leisure - 0.1% | |||
| Aristocrat Leisure Ltd. | 135,584 | 2,924,480 | |
| Compass Group PLC | 82,389 | 1,815,231 | |
| Galaxy Entertainment Group Ltd. | 104,000 | 686,440 | |
| SJM Holdings Ltd. | 1,606,000 | 1,817,180 | |
| 7,243,331 | |||
| Household Durables - 0.1% | |||
| Sony Corp. | 111,600 | 6,879,904 | |
| Internet & Direct Marketing Retail - 0.1% | |||
| Delivery Hero AG (a)(b) | 80,084 | 6,126,276 | |
| Ocado Group PLC (b) | 115,140 | 1,595,061 | |
| Zozo, Inc. | 47,000 | 659,726 | |
| 8,381,063 | |||
| Leisure Products - 0.0% | |||
| Bandai Namco Holdings, Inc. | 49,800 | 2,479,381 | |
| Multiline Retail - 0.0% | |||
| B&M European Value Retail SA | 320,748 | 1,389,417 | |
| Specialty Retail - 0.0% | |||
| Nitori Holdings Co. Ltd. | 10,600 | 1,470,693 | |
| Textiles, Apparel & Luxury Goods - 0.2% | |||
| adidas AG | 11,645 | 3,278,629 | |
| Kering SA | 3,610 | 2,035,694 | |
| LVMH Moet Hennessy Louis Vuitton SE | 24,321 | 10,149,898 | |
| Moncler SpA | 54,876 | 2,159,426 | |
| 17,623,647 | |||
| TOTAL CONSUMER DISCRETIONARY | 68,071,136 | ||
| CONSUMER STAPLES - 0.7% | |||
| Beverages - 0.1% | |||
| Davide Campari-Milano SpA | 200,458 | 1,675,988 | |
| Diageo PLC | 190,805 | 6,807,842 | |
| Heineken NV (Bearer) | 30,637 | 3,052,425 | |
| 11,536,255 | |||
| Food & Staples Retailing - 0.1% | |||
| Koninklijke Ahold Delhaize NV | 203,512 | 4,754,503 | |
| Seven & i Holdings Co. Ltd. | 101,500 | 3,478,064 | |
| Tsuruha Holdings, Inc. | 25,000 | 2,904,228 | |
| 11,136,795 | |||
| Food Products - 0.2% | |||
| Danone SA | 65,432 | 4,618,093 | |
| Kerry Group PLC Class A | 24,345 | 3,106,155 | |
| Nestle SA (Reg. S) | 86,309 | 8,881,699 | |
| 16,605,947 | |||
| Personal Products - 0.2% | |||
| Kao Corp. | 55,200 | 4,026,642 | |
| Kose Corp. | 7,000 | 839,792 | |
| Shiseido Co. Ltd. | 38,800 | 2,308,719 | |
| Unilever NV | 124,452 | 6,570,727 | |
| Unilever PLC | 53,264 | 2,863,467 | |
| 16,609,347 | |||
| Tobacco - 0.1% | |||
| British American Tobacco PLC (United Kingdom) | 128,486 | 5,080,241 | |
| Imperial Brands PLC | 106,904 | 2,159,674 | |
| 7,239,915 | |||
| TOTAL CONSUMER STAPLES | 63,128,259 | ||
| ENERGY - 0.4% | |||
| Oil, Gas & Consumable Fuels - 0.4% | |||
| BP PLC | 2,334,305 | 12,128,134 | |
| Equinor ASA | 165,112 | 2,543,101 | |
| Idemitsu Kosan Co. Ltd. | 85,400 | 2,104,517 | |
| Lundin Petroleum AB | 111,599 | 3,185,962 | |
| Total SA | 237,389 | 10,260,515 | |
| Woodside Petroleum Ltd. | 81,353 | 1,479,688 | |
| 31,701,917 | |||
| FINANCIALS - 1.4% | |||
| Banks - 0.6% | |||
| Commonwealth Bank of Australia | 55,885 | 2,977,306 | |
| DBS Group Holdings Ltd. | 155,200 | 2,686,390 | |
| Intesa Sanpaolo SpA | 2,439,087 | 5,929,707 | |
| KBC Groep NV | 105,720 | 7,043,748 | |
| Lloyds Banking Group PLC | 6,291,436 | 4,083,753 | |
| Mitsubishi UFJ Financial Group, Inc. | 267,400 | 1,306,506 | |
| Mizrahi Tefahot Bank Ltd. | 87,456 | 2,269,292 | |
| National Australia Bank Ltd. | 381,959 | 6,285,552 | |
| Societe Generale Series A | 133,957 | 3,795,892 | |
| Standard Chartered PLC (United Kingdom) | 463,446 | 3,353,537 | |
| Sumitomo Mitsui Financial Group, Inc. | 215,700 | 6,844,120 | |
| Svenska Handelsbanken AB (A Shares) | 307,552 | 3,109,866 | |
| United Overseas Bank Ltd. | 90,403 | 1,588,819 | |
| 51,274,488 | |||
| Capital Markets - 0.2% | |||
| Amundi SA (a) | 41,786 | 3,002,597 | |
| EQT AB (b) | 198,560 | 2,903,804 | |
| Julius Baer Group Ltd. | 45,709 | 1,922,890 | |
| London Stock Exchange Group PLC | 26,794 | 2,631,815 | |
| Macquarie Group Ltd. | 65,734 | 5,773,746 | |
| Standard Life PLC | 1,291,999 | 4,630,982 | |
| 20,865,834 | |||
| Diversified Financial Services - 0.1% | |||
| Investor AB (B Shares) | 57,936 | 2,901,987 | |
| M&G PLC (b) | 768,353 | 2,006,404 | |
| ORIX Corp. | 177,400 | 2,865,110 | |
| 7,773,501 | |||
| Insurance - 0.5% | |||
| AIA Group Ltd. | 637,600 | 6,390,311 | |
| Allianz SE | 13,479 | 2,936,399 | |
| AXA SA | 286,291 | 6,654,645 | |
| NN Group NV | 80,975 | 2,767,579 | |
| Prudential PLC | 325,391 | 5,409,453 | |
| Swiss Re Ltd. | 29,922 | 2,846,496 | |
| Talanx AG | 39,158 | 1,749,144 | |
| Tokio Marine Holdings, Inc. | 92,700 | 4,985,655 | |
| Zurich Insurance Group Ltd. | 15,088 | 5,842,555 | |
| 39,582,237 | |||
| TOTAL FINANCIALS | 119,496,060 | ||
| HEALTH CARE - 1.0% | |||
| Biotechnology - 0.1% | |||
| CSL Ltd. | 25,959 | 5,232,937 | |
| Morphosys AG (b) | 4,480 | 482,890 | |
| Morphosys AG sponsored ADR (b) | 61,700 | 1,646,773 | |
| 7,362,600 | |||
| Health Care Equipment & Supplies - 0.1% | |||
| Hoya Corp. | 76,000 | 6,770,666 | |
| Olympus Corp. | 109,300 | 1,988,194 | |
| Terumo Corp. | 30,900 | 996,386 | |
| 9,755,246 | |||
| Life Sciences Tools & Services - 0.1% | |||
| Lonza Group AG | 12,822 | 5,116,462 | |
| Pharmaceuticals - 0.7% | |||
| Astellas Pharma, Inc. | 282,200 | 4,445,186 | |
| AstraZeneca PLC (United Kingdom) | 156,033 | 13,694,226 | |
| Bayer AG | 68,503 | 4,981,953 | |
| Daiichi Sankyo Kabushiki Kaisha | 38,300 | 2,340,043 | |
| Novartis AG | 41,835 | 3,519,296 | |
| Roche Holding AG (participation certificate) | 53,564 | 17,222,634 | |
| Sanofi SA | 94,499 | 8,813,527 | |
| Takeda Pharmaceutical Co. Ltd. | 84,900 | 2,931,901 | |
| Teva Pharmaceutical Industries Ltd. sponsored ADR (b) | 196,400 | 2,264,492 | |
| UCB SA | 42,160 | 3,903,424 | |
| 64,116,682 | |||
| TOTAL HEALTH CARE | 86,350,990 | ||
| INDUSTRIALS - 1.0% | |||
| Aerospace & Defense - 0.1% | |||
| Airbus Group NV | 20,167 | 2,434,129 | |
| MTU Aero Engines Holdings AG | 12,114 | 2,997,279 | |
| 5,431,408 | |||
| Air Freight & Logistics - 0.1% | |||
| Deutsche Post AG | 140,028 | 4,214,555 | |
| DSV A/S | 26,470 | 2,685,769 | |
| 6,900,324 | |||
| Building Products - 0.1% | |||
| Agc, Inc. | 105,000 | 3,017,801 | |
| Compagnie de St. Gobain | 80,968 | 2,858,935 | |
| Daikin Industries Ltd. | 11,900 | 1,624,583 | |
| 7,501,319 | |||
| Commercial Services & Supplies - 0.0% | |||
| Park24 Co. Ltd. | 74,100 | 1,444,765 | |
| Rentokil Initial PLC | 192,122 | 1,202,079 | |
| 2,646,844 | |||
| Construction & Engineering - 0.1% | |||
| Ferrovial SA | 118,701 | 3,409,554 | |
| VINCI SA | 71,881 | 7,263,412 | |
| 10,672,966 | |||
| Electrical Equipment - 0.0% | |||
| Akasol AG (a)(b)(c) | 19,900 | 742,158 | |
| Vestas Wind Systems A/S | 24,944 | 2,406,606 | |
| 3,148,764 | |||
| Industrial Conglomerates - 0.1% | |||
| Siemens AG | 56,349 | 5,796,698 | |
| Machinery - 0.2% | |||
| Fanuc Corp. | 24,400 | 4,006,820 | |
| Kawasaki Heavy Industries Ltd. | 76,600 | 1,391,953 | |
| Makita Corp. | 88,100 | 3,050,746 | |
| Minebea Mitsumi, Inc. | 137,900 | 2,434,281 | |
| Nabtesco Corp. | 40,400 | 1,090,718 | |
| Techtronic Industries Co. Ltd. | 227,500 | 1,840,138 | |
| THK Co. Ltd. | 123,900 | 2,840,763 | |
| 16,655,419 | |||
| Marine - 0.0% | |||
| A.P. Moller - Maersk A/S Series B | 1,076 | 1,085,803 | |
| Professional Services - 0.2% | |||
| Experian PLC | 94,848 | 3,156,912 | |
| Recruit Holdings Co. Ltd. | 123,000 | 4,285,500 | |
| RELX PLC (London Stock Exchange) | 143,776 | 3,478,637 | |
| SR Teleperformance SA | 17,425 | 4,250,852 | |
| 15,171,901 | |||
| Road & Rail - 0.0% | |||
| ComfortDelgro Corp. Ltd. | 1,554,900 | 2,176,793 | |
| Trading Companies & Distributors - 0.1% | |||
| Ashtead Group PLC | 58,155 | 1,823,248 | |
| Itochu Corp. | 207,800 | 4,742,256 | |
| MonotaRO Co. Ltd. | 84,400 | 1,877,990 | |
| Rexel SA | 269,957 | 3,337,020 | |
| 11,780,514 | |||
| TOTAL INDUSTRIALS | 88,968,753 | ||
| INFORMATION TECHNOLOGY - 0.5% | |||
| Communications Equipment - 0.0% | |||
| Ericsson (B Shares) | 490,741 | 3,936,102 | |
| Electronic Equipment & Components - 0.1% | |||
| Keyence Corp. | 14,000 | 4,466,345 | |
| TDK Corp. | 16,900 | 1,637,354 | |
| 6,103,699 | |||
| IT Services - 0.1% | |||
| Atos Origin SA | 38,660 | 2,908,679 | |
| Capgemini SA | 35,421 | 3,925,258 | |
| Edenred SA | 61,325 | 3,210,240 | |
| 10,044,177 | |||
| Semiconductors & Semiconductor Equipment - 0.2% | |||
| ASM Pacific Technology Ltd. | 122,900 | 1,456,038 | |
| ASML Holding NV (Netherlands) | 13,853 | 3,841,342 | |
| Disco Corp. | 3,500 | 709,994 | |
| Infineon Technologies AG | 102,351 | 2,184,542 | |
| NXP Semiconductors NV | 18,900 | 2,148,741 | |
| Renesas Electronics Corp. (b) | 167,900 | 1,013,378 | |
| Tokyo Electron Ltd. | 12,900 | 2,670,058 | |
| 14,024,093 | |||
| Software - 0.1% | |||
| Dassault Systemes SA | 11,271 | 1,788,296 | |
| Netcompany Group A/S (a)(b) | 41,175 | 1,954,515 | |
| Oracle Corp. Japan | 27,700 | 2,167,513 | |
| SAP SE | 47,308 | 5,906,049 | |
| Temenos Group AG | 11,422 | 1,633,086 | |
| 13,449,459 | |||
| TOTAL INFORMATION TECHNOLOGY | 47,557,530 | ||
| MATERIALS - 0.4% | |||
| Chemicals - 0.1% | |||
| NOF Corp. | 6,900 | 221,662 | |
| Shin-Etsu Chemical Co. Ltd. | 38,600 | 4,346,347 | |
| Sika AG | 17,435 | 3,120,928 | |
| 7,688,937 | |||
| Construction Materials - 0.0% | |||
| CRH PLC | 125,995 | 4,250,590 | |
| Metals & Mining - 0.2% | |||
| Anglo American PLC (United Kingdom) | 264,030 | 6,211,959 | |
| Antofagasta PLC | 195,726 | 1,934,613 | |
| BHP Billiton Ltd. | 136,979 | 2,977,297 | |
| Newcrest Mining Ltd. | 163,524 | 2,801,679 | |
| Rio Tinto PLC | 70,603 | 3,323,962 | |
| 17,249,510 | |||
| Paper & Forest Products - 0.1% | |||
| Stora Enso Oyj (R Shares) | 217,127 | 2,573,159 | |
| Svenska Cellulosa AB (SCA) (B Shares) | 302,838 | 2,905,852 | |
| UPM-Kymmene Corp. | 88,409 | 2,720,540 | |
| 8,199,551 | |||
| TOTAL MATERIALS | 37,388,588 | ||
| REAL ESTATE - 0.2% | |||
| Equity Real Estate Investment Trusts (REITs) - 0.0% | |||
| Land Securities Group PLC | 212,886 | 2,294,509 | |
| Real Estate Management & Development - 0.2% | |||
| Cheung Kong Property Holdings Ltd. | 284,500 | 1,777,441 | |
| LEG Immobilien AG | 36,190 | 4,345,862 | |
| Mitsubishi Estate Co. Ltd. | 157,400 | 2,690,948 | |
| Mitsui Fudosan Co. Ltd. | 80,500 | 1,849,052 | |
| Sino Land Ltd. | 1,229,959 | 1,672,555 | |
| UOL Group Ltd. | 391,600 | 2,072,002 | |
| Vonovia SE | 93,011 | 5,032,643 | |
| 19,440,503 | |||
| TOTAL REAL ESTATE | 21,735,012 | ||
| UTILITIES - 0.3% | |||
| Electric Utilities - 0.2% | |||
| CLP Holdings Ltd. | 286,500 | 3,006,504 | |
| Enel SpA | 685,784 | 5,755,914 | |
| Fortum Corp. | 197,361 | 4,214,820 | |
| Iberdrola SA | 271,496 | 3,108,140 | |
| SP AusNet | 3,243,334 | 3,581,315 | |
| 19,666,693 | |||
| Multi-Utilities - 0.1% | |||
| National Grid PLC | 249,855 | 3,149,607 | |
| RWE AG | 90,837 | 3,152,866 | |
| 6,302,473 | |||
| TOTAL UTILITIES | 25,969,166 | ||
| TOTAL COMMON STOCKS | |||
| (Cost $594,897,310) | 625,679,289 | ||
| Equity Funds - 89.5% | |||
| Foreign Large Blend Funds - 10.7% | |||
| Fidelity Pacific Basin Fund (d) | 4,884,671 | 156,211,773 | |
| Fidelity SAI International Low Volatility Index Fund (d) | 76,635,551 | 783,215,335 | |
| TOTAL FOREIGN LARGE BLEND FUNDS | 939,427,108 | ||
| Foreign Large Growth Funds - 59.5% | |||
| Fidelity Advisor Overseas Fund Class I (d) | 3,075,382 | 73,378,625 | |
| Fidelity Diversified International Fund (d) | 35,429,112 | 1,328,945,986 | |
| Fidelity International Capital Appreciation Fund (d) | 53,093,929 | 1,155,854,840 | |
| Fidelity International Discovery Fund (d) | 31,395,938 | 1,306,698,955 | |
| Fidelity Overseas Fund (d) | 28,325,907 | 1,352,562,045 | |
| TOTAL FOREIGN LARGE GROWTH FUNDS | 5,217,440,451 | ||
| Foreign Large Value Funds - 14.0% | |||
| Fidelity International Value Fund (d) | 25,377,058 | 186,775,146 | |
| Fidelity SAI International Value Index Fund (d) | 127,555,174 | 1,044,676,873 | |
| TOTAL FOREIGN LARGE VALUE FUNDS | 1,231,452,019 | ||
| Foreign Small Mid Growth Funds - 0.9% | |||
| Fidelity International Small Cap Opportunities Fund (d) | 4,034,933 | 74,242,760 | |
| Sector Funds - 1.0% | |||
| Fidelity Advisor International Real Estate Fund Class I (d) | 7,450,309 | 90,819,267 | |
| Other - 3.4% | |||
| Fidelity Advisor Japan Fund Class I (d) | 17,892,292 | 261,585,312 | |
| Fidelity Japan Smaller Companies Fund (d) | 2,607,622 | 38,462,431 | |
| TOTAL OTHER | 300,047,743 | ||
| TOTAL EQUITY FUNDS | |||
| (Cost $7,603,963,303) | 7,853,429,348 | ||
| Principal Amount | Value | ||
| U.S. Treasury Obligations - 0.2% | |||
| U.S. Treasury Bills, yield at date of purchase 1.38% to 1.56% 3/5/20 to 5/28/20 (e) | |||
| (Cost $13,072,383) | 13,101,000 | 13,077,116 | |
| Shares | Value | ||
| Money Market Funds - 3.2% | |||
| Fidelity Securities Lending Cash Central Fund 1.60% (f)(g) | 706,268 | 706,339 | |
| State Street Institutional U.S. Government Money Market Fund Premier Class 1.53% (h) | 280,541,615 | 280,541,615 | |
| TOTAL MONEY MARKET FUNDS | |||
| (Cost $281,247,954) | 281,247,954 | ||
| TOTAL INVESTMENT IN SECURITIES - 100.0% | |||
| (Cost $8,493,180,950) | 8,773,433,707 | ||
| NET OTHER ASSETS (LIABILITIES) - 0.0% | 2,570,919 | ||
| NET ASSETS - 100% | $8,776,004,626 |
| Futures Contracts | |||||
| Number of contracts | Expiration Date | Notional Amount | Value | Unrealized Appreciation/(Depreciation) | |
| Purchased | |||||
| Equity Index Contracts | |||||
| CME Nikkei 225 Index Contracts (United States) | 250 | March 2020 | $26,287,500 | $(3,111,386) | $(3,111,386) |
| ICE E-mini MSCI EAFE Index Contracts (United States) | 2,591 | March 2020 | 235,262,800 | (26,691,690) | (26,691,691) |
| TOTAL FUTURES CONTRACTS | $(29,803,077) |
The notional amount of futures purchased as a percentage of Net Assets is 3.0%
For the period, the average monthly notional amount at value for futures contracts in the aggregate was $348,916,261.
Legend
(a) Security exempt from registration under Rule 144A of the Securities Act of 1933. These securities may be resold in transactions exempt from registration, normally to qualified institutional buyers. At the end of the period, the value of these securities amounted to $15,700,143 or 0.2% of net assets.
(b) Non-income producing
(c) Security or a portion of the security is on loan at period end.
(d) Affiliated Fund
(e) Security or a portion of the security was pledged to cover margin requirements for futures contracts. At period end, the value of securities pledged amounted to $13,077,116.
(f) Affiliated fund that is generally available only to investment companies and other accounts managed by Fidelity Investments. The rate quoted is the annualized seven-day yield of the fund at period end. A complete unaudited listing of the fund's holdings as of its most recent quarter end is available upon request. In addition, each Fidelity Central Fund's financial statements, which are not covered by the Fund's Report of Independent Registered Public Accounting Firm, are available on the SEC's website or upon request.
(g) Investment made with cash collateral received from securities on loan.
(h) The rate quoted is the annualized seven-day yield of the fund at period end.
Affiliated Central Funds
Information regarding fiscal year to date income earned by the Fund from investments in Fidelity Central Funds is as follows:
| Fund | Income earned |
| Fidelity Securities Lending Cash Central Fund | $168,580 |
| Total | $168,580 |
Amounts in the income column in the above table include any capital gain distributions from underlying funds, which are presented in the corresponding line-item in the Statement of Operations, if applicable. Amount for Fidelity Securities Lending Cash Central Fund represents the income earned on investing cash collateral, less rebates paid to borrowers and any lending agent fees associated with the loan, plus any premium payments received for lending certain types of securities.
Affiliated Underlying Funds
Fiscal year to date information regarding the Fund's investments in affiliated Underlying Funds, excluding any Money Market Central Funds, is presented below. Exchanges between classes of the same affiliated Underlying Funds may occur.
| Affiliate | Value, beginning of period | Purchases | Sales Proceeds | Dividend Income | Realized Gain (loss) | Change in Unrealized appreciation (depreciation) | Value, end of period |
| Fidelity Advisor International Real Estate Fund Class I | $63,118,130 | $25,451,997 | $-- | $3,795,591 | $-- | $2,249,140 | $90,819,267 |
| Fidelity Advisor Japan Fund Class I | 163,992,431 | 96,084,391 | -- | 3,388,281 | -- | 1,508,490 | 261,585,312 |
| Fidelity Advisor Overseas Fund Class I | 69,718,920 | -- | -- | 1,076,384 | -- | 3,659,705 | 73,378,625 |
| Fidelity Diversified International Fund | 875,174,842 | 381,965,204 | -- | 17,429,767 | -- | 71,805,940 | 1,328,945,986 |
| Fidelity International Capital Appreciation Fund | 719,283,460 | 369,952,798 | -- | 36,687,689 | -- | 66,618,582 | 1,155,854,840 |
| Fidelity International Discovery Fund | 892,560,870 | 384,145,359 | -- | 30,439,046 | -- | 29,992,726 | 1,306,698,955 |
| Fidelity International Small Cap Opportunities Fund | 71,579,704 | -- | -- | 907,860 | -- | 2,663,056 | 74,242,760 |
| Fidelity International Value Fund | 200,478,758 | -- | -- | 7,486,232 | -- | (13,703,612) | 186,775,146 |
| Fidelity Japan Smaller Companies Fund | 39,715,912 | 2,988,428 | -- | 2,988,428 | -- | (4,241,909) | 38,462,431 |
| Fidelity Overseas Fund | 866,297,158 | 437,116,252 | -- | 18,416,309 | -- | 49,148,635 | 1,352,562,045 |
| Fidelity Pacific Basin Fund | 142,143,921 | -- | -- | 1,260,245 | -- | 14,067,852 | 156,211,773 |
| Fidelity SAI International Low Volatility Index Fund | 522,200,627 | 314,410,811 | -- | 44,925,053 | -- | (53,396,103) | 783,215,335 |
| Fidelity SAI International Value Index Fund | 597,997,103 | 552,816,152 | -- | 36,644,466 | -- | (106,136,382) | 1,044,676,873 |
| Total | $5,224,261,836 | $2,564,931,392 | $-- | $205,445,351 | $-- | $64,236,120 | $7,853,429,348 |
Amounts in the income column in the above table include any capital gain distributions from underlying funds, which are presented in the corresponding line-item in the Statement of Operations, if applicable.
Investment Valuation
The following is a summary of the inputs used, as of February 29, 2020, involving the Fund's assets and liabilities carried at fair value. The inputs or methodology used for valuing securities may not be an indication of the risk associated with investing in those securities. For more information on valuation inputs, and their aggregation into the levels used below, please refer to the Investment Valuation section in the accompanying Notes to Financial Statements.
| Valuation Inputs at Reporting Date: | ||||
| Description | Total | Level 1 | Level 2 | Level 3 |
| Investments in Securities: | ||||
| Equities: | ||||
| Communication Services | $35,311,878 | $7,282,992 | $28,028,886 | $-- |
| Consumer Discretionary | 68,071,136 | 24,522,714 | 43,548,422 | -- |
| Consumer Staples | 63,128,259 | 13,557,445 | 49,570,814 | -- |
| Energy | 31,701,917 | 3,584,205 | 28,117,712 | -- |
| Financials | 119,496,060 | 23,146,318 | 96,349,742 | -- |
| Health Care | 86,350,990 | 25,684,677 | 60,666,313 | -- |
| Industrials | 88,968,753 | 31,818,287 | 57,150,466 | -- |
| Information Technology | 47,557,530 | 16,269,421 | 31,288,109 | -- |
| Materials | 37,388,588 | 7,369,688 | 30,018,900 | -- |
| Real Estate | 21,735,012 | 10,061,998 | 11,673,014 | -- |
| Utilities | 25,969,166 | 6,587,819 | 19,381,347 | -- |
| Equity Funds | 7,853,429,348 | 7,853,429,348 | -- | -- |
| Other Short-Term Investments | 13,077,116 | -- | 13,077,116 | -- |
| Money Market Funds | 281,247,954 | 281,247,954 | -- | -- |
| Total Investments in Securities: | $8,773,433,707 | $8,304,562,866 | $468,870,841 | $-- |
| Derivative Instruments: | ||||
| Liabilities | ||||
| Futures Contracts | $(29,803,077) | $(29,803,077) | $-- | $-- |
| Total Liabilities | $(29,803,077) | $(29,803,077) | $-- | $-- |
| Total Derivative Instruments: | $(29,803,077) | $(29,803,077) | $-- | $-- |
Value of Derivative Instruments
The following table is a summary of the Fund's value of derivative instruments by primary risk exposure as of February 29, 2020. For additional information on derivative instruments, please refer to the Derivative Instruments section in the accompanying Notes to Financial Statements.
| Primary Risk Exposure / Derivative Type | Value | |
| Asset | Liability | |
| Equity Risk | ||
| Futures Contracts(a) | $0 | $(29,803,077) |
| Total Equity Risk | 0 | (29,803,077) |
| Total Value of Derivatives | $0 | $(29,803,077) |
(a) Reflects gross cumulative appreciation (depreciation) on futures contracts as presented in the Schedule of Investments. In the Statement of Assets and Liabilities, the period end daily variation margin is included in receivable or payable for daily variation margin on futures contracts, and the net cumulative appreciation (depreciation) is included in Total accumulated earnings (loss).
See accompanying notes which are an integral part of the financial statements.
Financial Statements
Statement of Assets and Liabilities
| February 29, 2020 | ||
| Assets | ||
| Investment in securities, at value (including securities loaned of $619,685) — See accompanying schedule: Unaffiliated issuers (cost $888,511,308) | $919,298,020 | |
| Fidelity Central Funds (cost $706,339) | 706,339 | |
| Other affiliated issuers (cost $7,603,963,303) | 7,853,429,348 | |
| Total Investment in Securities (cost $8,493,180,950) | $8,773,433,707 | |
| Foreign currency held at value (cost $153) | 113 | |
| Receivable for investments sold | 6,122,931 | |
| Receivable for fund shares sold | 25,658,588 | |
| Dividends receivable | 2,830,428 | |
| Interest receivable | 308,884 | |
| Distributions receivable from Fidelity Central Funds | 9,150 | |
| Other receivables | 41,960 | |
| Total assets | 8,808,405,761 | |
| Liabilities | ||
| Payable for investments purchased | $12,884,157 | |
| Payable for fund shares redeemed | 16,357,993 | |
| Accrued management fee | 139,860 | |
| Payable for daily variation margin on futures contracts | 1,998,925 | |
| Other payables and accrued expenses | 313,850 | |
| Collateral on securities loaned | 706,350 | |
| Total liabilities | 32,401,135 | |
| Net Assets | $8,776,004,626 | |
| Net Assets consist of: | ||
| Paid in capital | $8,455,370,143 | |
| Total accumulated earnings (loss) | 320,634,483 | |
| Net Assets | $8,776,004,626 | |
| Net Asset Value, offering price and redemption price per share ($8,776,004,626 ÷ 892,093,046 shares) | $9.84 |
See accompanying notes which are an integral part of the financial statements.
Statement of Operations
| Year ended February 29, 2020 | ||
| Investment Income | ||
| Dividends: | ||
| Unaffiliated issuers | $22,438,706 | |
| Affiliated issuers | 129,695,483 | |
| Interest | 8,120,500 | |
| Income from Fidelity Central Funds (including $168,580 from security lending) | 168,580 | |
| Income before foreign taxes withheld | 160,423,269 | |
| Less foreign taxes withheld | (1,664,586) | |
| Total income | 158,758,683 | |
| Expenses | ||
| Management fee | $21,434,054 | |
| Accounting and security lending fees | 547,705 | |
| Custodian fees and expenses | 63,045 | |
| Independent trustees' fees and expenses | 83,777 | |
| Registration fees | 575,876 | |
| Audit | 84,164 | |
| Legal | 23,112 | |
| Miscellaneous | 56,169 | |
| Total expenses before reductions | 22,867,902 | |
| Expense reductions | (19,883,458) | |
| Total expenses after reductions | 2,984,444 | |
| Net investment income (loss) | 155,774,239 | |
| Realized and Unrealized Gain (Loss) | ||
| Net realized gain (loss) on: | ||
| Investment securities: | ||
| Unaffiliated issuers | 5,150,006 | |
| Fidelity Central Funds | (4) | |
| Foreign currency transactions | (5,191) | |
| Futures contracts | 63,281,635 | |
| Capital gain distributions from underlying funds: | ||
| Affiliated issuers | 75,749,868 | |
| Total net realized gain (loss) | 144,176,314 | |
| Change in net unrealized appreciation (depreciation) on: | ||
| Investment securities: | ||
| Unaffiliated issuers | (7,113,364) | |
| Affiliated issuers | 64,236,120 | |
| Assets and liabilities in foreign currencies | (21,377) | |
| Futures contracts | (56,805,197) | |
| Total change in net unrealized appreciation (depreciation) | 296,182 | |
| Net gain (loss) | 144,472,496 | |
| Net increase (decrease) in net assets resulting from operations | $300,246,735 |
See accompanying notes which are an integral part of the financial statements.
Statement of Changes in Net Assets
| Year ended February 29, 2020 | Year ended February 28, 2019 | |
| Increase (Decrease) in Net Assets | ||
| Operations | ||
| Net investment income (loss) | $155,774,239 | $87,240,396 |
| Net realized gain (loss) | 144,176,314 | 43,857,518 |
| Change in net unrealized appreciation (depreciation) | 296,182 | (446,156,847) |
| Net increase (decrease) in net assets resulting from operations | 300,246,735 | (315,058,933) |
| Distributions to shareholders | (258,375,345) | (177,894,345) |
| Share transactions | ||
| Proceeds from sales of shares | 3,774,008,211 | 2,777,134,794 |
| Reinvestment of distributions | 247,402,033 | 177,319,906 |
| Cost of shares redeemed | (1,629,645,592) | (859,656,396) |
| Net increase (decrease) in net assets resulting from share transactions | 2,391,764,652 | 2,094,798,304 |
| Total increase (decrease) in net assets | 2,433,636,042 | 1,601,845,026 |
| Net Assets | ||
| Beginning of period | 6,342,368,584 | 4,740,523,558 |
| End of period | $8,776,004,626 | $6,342,368,584 |
| Other Information | ||
| Shares | ||
| Sold | 370,690,605 | 281,711,364 |
| Issued in reinvestment of distributions | 23,664,443 | 18,585,063 |
| Redeemed | (158,648,235) | (87,226,110) |
| Net increase (decrease) | 235,706,813 | 213,070,317 |
See accompanying notes which are an integral part of the financial statements.
Financial Highlights
Strategic Advisers Fidelity International Fund
| Years ended February 28, | 2020 A | 2019 | 2018 | 2017 | 2016 A |
| Selected Per–Share Data | |||||
| Net asset value, beginning of period | $9.66 | $10.69 | $8.94 | $8.19 | $9.41 |
| Income from Investment Operations | |||||
| Net investment income (loss)B | .20 | .16 | .12 | .14 | .10 |
| Net realized and unrealized gain (loss) | .31 | (.85) | 1.85 | .76 | (1.19) |
| Total from investment operations | .51 | (.69) | 1.97 | .90 | (1.09) |
| Distributions from net investment income | (.19) | (.15) | (.11) | (.13) | (.09) |
| Distributions from net realized gain | (.14) | (.20) | (.11) | (.02) | (.05) |
| Total distributions | (.33) | (.34)C | (.22) | (.15) | (.13)D |
| Net asset value, end of period | $9.84 | $9.66 | $10.69 | $8.94 | $8.19 |
| Total ReturnE | 5.10% | (6.41)% | 22.01% | 11.11% | (11.70)% |
| Ratios to Average Net AssetsF,G | |||||
| Expenses before reductions | .29% | .35% | .38% | .39% | .42% |
| Expenses net of fee waivers, if any | .04% | .10% | .13% | .14% | .17% |
| Expenses net of all reductions | .04% | .09% | .13% | .14% | .17% |
| Net investment income (loss) | 1.97% | 1.65% | 1.16% | 1.58% | 1.09% |
| Supplemental Data | |||||
| Net assets, end of period (000 omitted) | $8,776,005 | $6,342,369 | $4,740,524 | $3,593,237 | $2,736,052 |
| Portfolio turnover rateH | 6% | 9% | 13% | 14% | 16% |
A For the year ended February 29.
B Calculated based on average shares outstanding during the period.
C Total distributions of $.34 per share is comprised of distributions from net investment income of $.145 and distributions from net realized gain of $.197 per share.
D Total distributions of $.13 per share is comprised of distributions from net investment income of $.088 and distributions from net realized gain of $.046 per share.
E Total returns would have been lower if certain expenses had not been reduced during the applicable periods shown.
F Fees and expenses of any underlying Fidelity Central Funds are not included in the Fund's expense ratio. The Fund indirectly bears its proportionate share of the expenses of any underlying Fidelity Central Funds.
G Expense ratios reflect operating expenses of the Fund. Expenses before reductions do not reflect amounts reimbursed by the investment adviser or reductions from brokerage service arrangements or reductions from other expense offset arrangements and do not represent the amount paid by the Fund during periods when reimbursements or reductions occur. Expenses net of fee waivers reflect expenses after reimbursement by the investment adviser but prior to reductions from brokerage service arrangements or other expense offset arrangements. Expenses net of all reductions represent the net expenses paid by the Fund. Fees and expenses of the Underlying Funds are not included in the Fund's annualized ratios. The Fund indirectly bears its proportionate share of the expenses of the Underlying Funds.
H Amounts do not include the activity of Underlying Funds.
See accompanying notes which are an integral part of the financial statements.
Notes to Financial Statements
For the period ended February 29, 2020
1. Organization.
Strategic Advisers Fidelity International Fund (the Fund) is a fund of Fidelity Rutland Square Trust II (the Trust), and is authorized to issue an unlimited number of shares. The Trust is registered under the Investment Company Act of 1940, as amended (the 1940 Act), as an open-end management investment company organized as a Delaware statutory trust. The Fund is offered exclusively to certain clients of Strategic Advisers LLC (Strategic Advisers), an affiliate of Fidelity Management & Research Company LLC (FMR).
2. Significant Accounting Policies.
The Fund is an investment company and applies the accounting and reporting guidance of the Financial Accounting Standards Board (FASB) Accounting Standards Codification Topic 946 Financial Services – Investments Companies. The financial statements have been prepared in conformity with accounting principles generally accepted in the United States of America (GAAP), which require management to make certain estimates and assumptions at the date of the financial statements. Actual results could differ from those estimates. Subsequent events, if any, through the date that the financial statements were issued have been evaluated in the preparation of the financial statements. The following summarizes the significant accounting policies of the Fund:
Investment Valuation. Investments are valued as of 4:00 p.m. Eastern time on the last calendar day of the period. The Board of Trustees (the Board) has delegated the day to day responsibility for the valuation of the Fund's investments to the Fair Value Committee (the Committee) established by the Fund's investment adviser. In accordance with valuation policies and procedures approved by the Board, the Fund attempts to obtain prices from one or more third party pricing vendors or brokers to value its investments. When current market prices, quotations or currency exchange rates are not readily available or reliable, investments will be fair valued in good faith by the Committee, in accordance with procedures adopted by the Board. Factors used in determining fair value vary by investment type and may include market or investment specific events, changes in interest rates and credit quality. The frequency with which these procedures are used cannot be predicted and they may be utilized to a significant extent. The Committee oversees the Fund's valuation policies and procedures and reports to the Board on the Committee's activities and fair value determinations. The Board monitors the appropriateness of the procedures used in valuing the Fund's investments and ratifies the fair value determinations of the Committee.
The Fund categorizes the inputs to valuation techniques used to value its investments into a disclosure hierarchy consisting of three levels as shown below:
- Level 1 – quoted prices in active markets for identical investments
- Level 2 – other significant observable inputs (including quoted prices for similar investments, interest rates, prepayment speeds, etc.)
- Level 3 – unobservable inputs (including the Fund's own assumptions based on the best information available)
Valuation techniques used to value the Fund's investments by major category are as follows:
Equity securities, including restricted securities, for which market quotations are readily available, are valued at the last reported sale price or official closing price as reported by a third party pricing vendor on the primary market or exchange on which they are traded and are categorized as Level 1 in the hierarchy. In the event there were no sales during the day or closing prices are not available, securities are valued at the last quoted bid price or may be valued using the last available price and are generally categorized as Level 2 in the hierarchy. For foreign equity securities, when market or security specific events arise, comparisons to the valuation of American Depositary Receipts (ADRs), futures contracts, Exchange-Traded Funds (ETFs) and certain indexes as well as quoted prices for similar securities may be used and would be categorized as Level 2 in the hierarchy. For equity securities, including restricted securities, where observable inputs are limited, assumptions about market activity and risk are used and these securities may be categorized as Level 3 in the hierarchy.
Debt securities, including restricted securities, are valued based on evaluated prices received from third party pricing vendors or from brokers who make markets in such securities. U.S. government and government agency obligations are valued by pricing vendors who utilize matrix pricing which considers yield or price of bonds of comparable quality, coupon, maturity and type or by broker-supplied prices. When independent prices are unavailable or unreliable, debt securities may be valued utilizing pricing methodologies which consider similar factors that would be used by third party pricing vendors. Debt securities are generally categorized as Level 2 in the hierarchy but may be Level 3 depending on the circumstances.
Futures contracts are valued at the settlement price established each day by the board of trade or exchange on which they are traded and are categorized as Level 1 in the hierarchy. Investments in open-end mutual funds, including the Fidelity Central Funds, are valued at their closing net asset value (NAV) each business day and are categorized as Level 1 in the hierarchy. If an unaffiliated open-end mutual fund's NAV is unavailable, shares of that fund may be valued by another method that the Board believes reflects fair value in accordance with the Board's fair value pricing policies and is categorized as Level 2 in the hierarchy.
Changes in valuation techniques may result in transfers in or out of an assigned level within the disclosure hierarchy. The aggregate value of investments by input level as of February 29, 2020 is included at the end of the Fund's Schedule of Investments.
Foreign Currency. The Fund may use foreign currency contracts to facilitate transactions in foreign-denominated securities. Gains and losses from these transactions may arise from changes in the value of the foreign currency or if the counterparties do not perform under the contracts' terms.
Foreign-denominated assets, including investment securities, and liabilities are translated into U.S. dollars at the exchange rates at period end. Purchases and sales of investment securities, income and dividends received and expenses denominated in foreign currencies are translated into U.S. dollars at the exchange rate in effect on the transaction date.
The effects of exchange rate fluctuations on investments are included with the net realized and unrealized gain (loss) on investment securities. Other foreign currency transactions resulting in realized and unrealized gain (loss) are disclosed separately.
Investment Transactions and Income. For financial reporting purposes, the Fund's investment holdings and NAV include trades executed through the end of the last business day of the period. The NAV per share for processing shareholder transactions is calculated as of the close of business of the New York Stock Exchange (NYSE), normally 4:00 p.m. Eastern time and includes trades executed through the end of the prior business day. Gains and losses on securities sold are determined on the basis of identified cost and include proceeds received from litigation. Dividend income is recorded on the ex-dividend date, except for certain dividends from foreign securities where the ex-dividend date may have passed, which are recorded as soon as the Fund is informed of the ex-dividend date. Non-cash dividends included in dividend income, if any, are recorded at the fair market value of the securities received. Income and capital gain distributions from Fidelity Central Funds, if any, are recorded on the ex-dividend date. Income and capital gain distributions from Underlying Funds, if any, are recorded on the ex-dividend date. Interest income is accrued as earned and includes coupon interest and amortization of premium and accretion of discount on debt securities as applicable. Investment income is recorded net of foreign taxes withheld where recovery of such taxes is uncertain.
Expenses. Expenses directly attributable to a fund are charged to that fund. Expenses attributable to more than one fund are allocated among the respective funds on the basis of relative net assets or other appropriate methods. Expense estimates are accrued in the period to which they relate and adjustments are made when actual amounts are known.
Deferred Trustee Compensation. Under a Deferred Compensation Plan (the Plan), certain independent Trustees have elected to defer receipt of a portion of their annual compensation. Deferred amounts are invested in a cross-section of Strategic Advisers funds, are marked-to-market and remain in the Fund until distributed in accordance with the Plan. The investment of deferred amounts and the offsetting payable to the Trustees of $41,960 are included in the accompanying Statement of Assets and Liabilities in other receivables and other payables and accrued expenses, respectively.
Income Tax Information and Distributions to Shareholders. Each year, the Fund intends to qualify as a regulated investment company under Subchapter M of the Internal Revenue Code, including distributing substantially all of its taxable income and realized gains. As a result, no provision for U.S. Federal income taxes is required. As of February 29, 2020, the Fund did not have any unrecognized tax benefits in the financial statements; nor is the Fund aware of any tax positions for which it is reasonably possible that the total amounts of unrecognized tax benefits will significantly change in the next twelve months. The Fund files a U.S. federal tax return, in addition to state and local tax returns as required. The Fund's federal income tax returns are subject to examination by the Internal Revenue Service (IRS) for a period of three fiscal years after they are filed. State and local tax returns may be subject to examination for an additional fiscal year depending on the jurisdiction. Foreign taxes are provided for based on the Fund's understanding of the tax rules and rates that exist in the foreign markets in which it invests.
Distributions are declared and recorded on the ex-dividend date. Income and capital gain distributions are determined in accordance with income tax regulations, which may differ from GAAP. In addition, the Fund claimed a portion of the payment made to redeeming shareholders as a distribution for income tax purposes.
Capital accounts within the financial statements are adjusted for permanent book-tax differences. These adjustments have no impact on net assets or the results of operations. Capital accounts are not adjusted for temporary book-tax differences which will reverse in a subsequent period.
Book-tax differences are primarily due to the short-term gain distributions from the Underlying Funds, futures contracts, foreign currency transactions, passive foreign investment companies (PFIC), market discount, deferred trustees compensation and losses deferred due to wash sales.
As of period end, the cost and unrealized appreciation (depreciation) in securities, and derivatives if applicable, for federal income tax purposes were as follows:
| Gross unrealized appreciation | $591,116,135 |
| Gross unrealized depreciation | (324,683,764) |
| Net unrealized appreciation (depreciation) | $266,432,371 |
| Tax Cost | $8,507,001,336 |
The tax-based components of distributable earnings as of period end were as follows:
| Undistributed long-term capital gain | $54,260,986 |
| Net unrealized appreciation (depreciation) on securities and other investments | $266,415,457 |
The tax character of distributions paid was as follows:
| February 29, 2020 | February 28, 2019 | |
| Ordinary Income | $169,053,723 | $ 87,857,472 |
| Long-term Capital Gains | 89,321,622 | 90,036,873 |
| Total | $258,375,345 | $ 177,894,345 |
Restricted Securities. The Fund may invest in securities that are subject to legal or contractual restrictions on resale. These securities generally may be resold in transactions exempt from registration or to the public if the securities are registered. Disposal of these securities may involve time-consuming negotiations and expense, and prompt sale at an acceptable price may be difficult. Information regarding restricted securities is included at the end of the Fund's Schedule of Investments.
3. Derivative Instruments.
Risk Exposures and the Use of Derivative Instruments. The Fund's investment objective allows the Fund to enter into various types of derivative contracts, including futures contracts. Derivatives are investments whose value is primarily derived from underlying assets, indices or reference rates and may be transacted on an exchange or over-the-counter (OTC). Derivatives may involve a future commitment to buy or sell a specified asset based on specified terms, to exchange future cash flows at periodic intervals based on a notional principal amount, or for one party to make one or more payments upon the occurrence of specified events in exchange for periodic payments from the other party.
The Fund used derivatives to increase returns and to manage exposure to certain risks as defined below. The success of any strategy involving derivatives depends on analysis of numerous economic factors, and if the strategies for investment do not work as intended, the Fund may not achieve its objectives.
The Fund's use of derivatives increased or decreased its exposure to the following risk:
| Equity Risk | Equity risk relates to the fluctuations in the value of financial instruments as a result of changes in market prices (other than those arising from interest rate risk or foreign exchange risk), whether caused by factors specific to an individual investment, its issuer, or all factors affecting all instruments traded in a market or market segment. |
The Fund is also exposed to additional risks from investing in derivatives, such as liquidity risk and counterparty credit risk. Liquidity risk is the risk that the Fund will be unable to close out the derivative in the open market in a timely manner. Counterparty credit risk is the risk that the counterparty will not be able to fulfill its obligation to the Fund. Counterparty credit risk related to exchange-traded futures contracts may be mitigated by the protection provided by the exchange on which they trade.
Investing in derivatives may involve greater risks than investing in the underlying assets directly and, to varying degrees, may involve risk of loss in excess of any initial investment and collateral received and amounts recognized in the Statement of Assets and Liabilities. In addition, there may be the risk that the change in value of the derivative contract does not correspond to the change in value of the underlying instrument.
Futures Contracts. A futures contract is an agreement between two parties to buy or sell a specified underlying instrument for a fixed price at a specified future date. The Fund used futures contracts to manage its exposure to the stock market.
Upon entering into a futures contract, a fund is required to deposit either cash or securities (initial margin) with a clearing broker in an amount equal to a certain percentage of the face value of the contract. Futures contracts are marked-to-market daily and subsequent daily payments (variation margin) are made or received by a fund depending on the daily fluctuations in the value of the futures contracts and are recorded as unrealized appreciation or (depreciation). This receivable and/or payable, if any, is included in daily variation margin on futures contracts in the Statement of Assets and Liabilities. Realized gain or (loss) is recorded upon the expiration or closing of a futures contract. The net realized gain (loss) and change in net unrealized appreciation (depreciation) on futures contracts during the period is presented in the Statement of Operations.
Any open futures contracts at period end are presented in the Schedule of Investments under the caption "Futures Contracts". The notional amount at value reflects each contract's exposure to the underlying instrument or index at period end. Securities deposited to meet initial margin requirements are identified in the Schedule of Investments.
4. Purchases and Sales of Investments.
Purchases and sales of securities, other than short-term securities and U.S. government securities, are noted in the table below.
| Purchases ($) | Sales ($) | |
| Strategic Advisers Fidelity International Fund | 2,991,843,589 | 413,736,852 |
5. Fees and Other Transactions with Affiliates.
Management Fee. Strategic Advisers (the investment adviser) provides the Fund with investment management related services. For these services, the Fund pays a monthly management fee to the investment adviser. The management fee is calculated by adding the annual management fee rate of .25% of the Fund's average net assets throughout the month payable to the investment adviser to the aggregate of the fee rates, payable monthly, to the Fund's sub-advisers. The Fund's maximum aggregate management fee will not exceed 1.00% of the Fund's average net assets. For the reporting period, the total annual management fee rate was .27% of the Fund's average net assets.
During the period, the investment adviser waived a portion of its management fee as described in the Expense Reductions note.
Sub-Advisers. FIAM LLC (an affiliate of the investment adviser) served as a sub-adviser for the Fund during the period. Sub-advisers provide discretionary investment advisory services for their allocated portion of the Fund's assets and are paid by the investment adviser and not the Fund for providing these services.
FIL Investment Advisors and Geode Capital Management, LLC have been retained to serve as a sub-adviser for the Fund. As of the date of this report, however, these sub-advisers have not been allocated any portion of the Fund's assets. These sub-advisers in the future may provide discretionary investment advisory services for an allocated portion of the Fund's assets and will be paid by the investment adviser for providing these services.
Accounting and Security Lending Fees. Fidelity Service Company, Inc. (FSC), an affiliate of the investment adviser, maintains the Fund's accounting records. The accounting fee is based on the level of average net assets for each month. Prior to April 1, 2019, FSC had a separate agreement with the Fund for administration of the security lending program, based on the number and duration of lending transactions. Effective July 1, 2019 accounting fees are not paid by the Fund and are instead paid by the investment adviser or an affiliate. For the period, the total fees paid for accounting and administration of securities lending were equivalent to .01%.
Interfund Trades. Funds may purchase from or sell securities to other funds affiliated with each sub-adviser under procedures adopted by the Board. The procedures have been designed to ensure these interfund trades are executed in accordance with Rule 17a-7 of the 1940 Act. Interfund trades are included within the respective purchases and sales amounts shown in the Purchases and Sales of Investments note.
Other. During the period, the investment adviser reimbursed the Fund for certain losses in the amount of $23,093.
6. Investments in Fidelity Central Funds.
The Fund invests in Fidelity Central Funds, which are open-end investment companies available only to other investment companies and accounts managed by the investment adviser and its affiliates. The Fund's Schedule of Investments lists each of the Fidelity Central Funds held as of period end, if any, as an investment of the Fund, but does not include the underlying holdings of each Fidelity Central Fund. As an Investing Fund, the Fund indirectly bears its proportionate share of the expenses of the underlying Fidelity Central Funds.
The Fidelity Money Market Central Funds are managed by FMR. Annualized expenses of the Money Market Central Funds as of their most recent shareholder report date ranged from less than .005% to .01%.
A complete unaudited list of holdings for each Fidelity Central Fund is available upon request or at the Securities and Exchange Commission (the SEC) website at www.sec.gov. In addition, the financial statements of the Fidelity Central Funds, which are not covered by the Fund's Report of Independent Registered Public Accounting Firm, are available on the SEC website or upon request.
7. Committed Line of Credit.
Certain Funds participate with other funds managed by the investment adviser or an affiliate in a $4.25 billion credit facility (the "line of credit") to be utilized for temporary or emergency purposes to fund shareholder redemptions or for other short-term liquidity purposes. The participating funds have agreed to pay commitment fees on their pro-rata portion of the line of credit, which are reflected in Miscellaneous expenses on the Statement of Operations, and are as follows:
| Amount | |
| Strategic Advisers Fidelity International Fund | $18,573 |
During the period, there were no borrowings on this line of credit.
8. Security Lending.
The Fund lends portfolio securities through a lending agent from time to time in order to earn additional income. On the settlement date of the loan, the Fund receives collateral (in the form of U.S. Treasury obligations, letters of credit and/or cash) against the loaned securities and maintains collateral in an amount not less than 100% of the market value of the loaned securities during the period of the loan. The market value of the loaned securities is determined at the close of business of the Fund and any additional required collateral is delivered to the Fund on the next business day. The Fund or borrower may terminate the loan at any time, and if the borrower defaults on its obligation to return the securities loaned because of insolvency or other reasons, the Fund may apply collateral received from the borrower against the obligation. The Fund may experience delays and costs in recovering the securities loaned. Any cash collateral received is invested in the Fidelity Securities Lending Cash Central Fund. The value of loaned securities and cash collateral at period end are disclosed on the Fund's Statement of Assets and Liabilities. Security lending income represents the income earned on investing cash collateral, less rebates paid to borrowers and any lending agent fees associated with the loan, plus any premium payments received for lending certain types of securities. Security lending income is presented in the Statement of Operations as a component of income from Fidelity Central Funds.
9. Expense Reductions.
The investment adviser has contractually agreed to waive the Fund's management fee in an amount equal to .25% of the Fund's average net assets until September 30, 2022. During the period, this waiver reduced the Fund's management fee by $19,818,100.
Commissions paid to certain brokers with whom the investment adviser, or its affiliates, places trades on behalf of the Fund include an amount in addition to trade execution, which may be rebated back to the Fund to offset certain expenses. This amount totaled $65,324 for the period.
In addition, through arrangements with the Fund's transfer agent, credits realized as a result of certain uninvested cash balances were used to reduce the Fund's expenses by $34.
10. Other.
The Fund's organizational documents provide former and current trustees and officers with a limited indemnification against liabilities arising in connection with the performance of their duties to the Fund. In the normal course of business, the Fund may also enter into contracts that provide general indemnifications. The Fund's maximum exposure under these arrangements is unknown as this would be dependent on future claims that may be made against the Fund. The risk of material loss from such claims is considered remote.
The Fund does not invest in the Underlying Funds for the purpose of exercising management or control; however, investments by the Fund within its principal investment strategies may represent a significant portion of an Underlying Fund's net assets.
At the end of the period, the Fund was the owner of record of 10% or more of the total outstanding shares of the following Underlying Funds:
| Fidelity Advisor International Real Estate Fund | 53% |
| Fidelity Advisor Japan Fund | 81% |
| Fidelity Advisor Overseas Fund | 64% |
| Fidelity Diversified International Fund | 16% |
| Fidelity International Capital Appreciation Fund | 30% |
| Fidelity International Discovery Fund | 20% |
| Fidelity International Value Fund | 46% |
| Fidelity Overseas Fund | 22% |
| Fidelity Pacific Basin Fund | 18% |
| Fidelity SAI International Low Volatility Index Fund | 27% |
| Fidelity SAI International Value Index Fund | 98% |
11. Coronavirus (Covid-19) Pandemic.
An outbreak of COVID-19 first detected in China during December 2019 has since spread globally and was declared a pandemic by the World Health Organization during March 2020. Developments that disrupt global economies and financial markets, such as the COVID-19 pandemic, may magnify factors that affect the Fund's performance.
Report of Independent Registered Public Accounting Firm
To the Board of Trustees of Fidelity Rutland Square Trust II and Shareholders of Strategic Advisers Fidelity International Fund
Opinion on the Financial Statements
We have audited the accompanying statement of assets and liabilities, including the schedule of investments, of Strategic Advisers Fidelity International Fund (one of the funds constituting Fidelity Rutland Square Trust II, referred to hereafter as the “Fund”) as of February 29, 2020, the related statement of operations for the year ended February 29, 2020, the statement of changes in net assets for each of the two years in the period ended February 29, 2020, including the related notes, and the financial highlights for each of the five years in the period ended February 29, 2020 (collectively referred to as the “financial statements”). In our opinion, the financial statements present fairly, in all material respects, the financial position of the Fund as of February 29, 2020, the results of its operations for the year then ended, the changes in its net assets for each of the two years in the period ended February 29, 2020 and the financial highlights for each of the five years in the period ended February 29, 2020 in conformity with accounting principles generally accepted in the United States of America.
Basis for Opinion
These financial statements are the responsibility of the Fund’s management. Our responsibility is to express an opinion on the Fund’s financial statements based on our audits. We are a public accounting firm registered with the Public Company Accounting Oversight Board (United States) (PCAOB) and are required to be independent with respect to the Fund in accordance with the U.S. federal securities laws and the applicable rules and regulations of the Securities and Exchange Commission and the PCAOB.
We conducted our audits of these financial statements in accordance with the standards of the PCAOB. Those standards require that we plan and perform the audit to obtain reasonable assurance about whether the financial statements are free of material misstatement, whether due to error or fraud.
Our audits included performing procedures to assess the risks of material misstatement of the financial statements, whether due to error or fraud, and performing procedures that respond to those risks. Such procedures included examining, on a test basis, evidence regarding the amounts and disclosures in the financial statements. Our audits also included evaluating the accounting principles used and significant estimates made by management, as well as evaluating the overall presentation of the financial statements. Our procedures included confirmation of securities owned as of February 29, 2020 by correspondence with the custodian and brokers; when replies were not received from brokers, we performed other auditing procedures. We believe that our audits provide a reasonable basis for our opinion.
PricewaterhouseCoopers LLP
Boston, Massachusetts
April 13, 2020
We have served as the auditor of one or more investment companies in the Fidelity group of funds since 1932.
Trustees and Officers
The Trustees, Members of the Advisory Board (if any), and officers of the trust and fund, as applicable, are listed below. The Board of Trustees governs the fund and is responsible for protecting the interests of shareholders. The Trustees are experienced executives who meet periodically throughout the year to oversee the fund's activities, review contractual arrangements with companies that provide services to the fund, oversee management of the risks associated with such activities and contractual arrangements, and review the fund's performance. If the interests of the fund and an underlying Fidelity® fund were to diverge, a conflict of interest could arise and affect how the Trustees and Members of the Advisory Board fulfill their fiduciary duties to the affected funds. Strategic Advisers has structured the fund to avoid these potential conflicts, although there may be situations where a conflict of interest is unavoidable. In such instances, Strategic Advisers, the Trustees, and Members of the Advisory Board would take reasonable steps to minimize and, if possible, eliminate the conflict. Each of the Trustees oversees 14 funds.
The Trustees hold office without limit in time except that (a) any Trustee may resign; (b) any Trustee may be removed by written instrument, signed by at least two-thirds of the number of Trustees prior to such removal; (c) any Trustee who requests to be retired or who has become incapacitated by illness or injury may be retired by written instrument signed by a majority of the other Trustees; and (d) any Trustee may be removed at any special meeting of shareholders by a two-thirds vote of the outstanding voting securities of the trust. Officers and Advisory Board Members hold office without limit in time, except that any officer or Advisory Board Member may resign or may be removed by a vote of a majority of the Trustees at any regular meeting or any special meeting of the Trustees. Except as indicated, each individual has held the office shown or other offices in the same company for the past five years.
Each Trustee who is not an interested person (as defined in the 1940 Act) of the trust and the fund is referred to herein as an Independent Trustee.
The fund’s Statement of Additional Information (SAI) includes more information about the Trustees. To request a free copy, call Fidelity at 1-800-544-3455.
Experience, Skills, Attributes, and Qualifications of the Trustees. The Governance and Nominating Committee has adopted a statement of policy that describes the experience, qualifications, attributes, and skills that are necessary and desirable for potential Independent Trustee candidates (Statement of Policy). The Board believes that each Trustee satisfied at the time he or she was initially elected or appointed a Trustee, and continues to satisfy, the standards contemplated by the Statement of Policy. The Governance and Nominating Committee may also engage professional search firms to help identify potential Independent Trustee candidates with experience, qualifications, attributes, and skills consistent with the Statement of Policy. Additional criteria based on the composition and skills of the current Independent Trustees, as well as experience or skills that may be appropriate in light of future changes to board composition, business conditions, and regulatory or other developments, may be considered by the professional search firms and the Governance and Nominating Committee. In addition, the Board takes into account the Trustees' commitment and participation in Board and committee meetings, as well as their leadership of standing and ad hoc committees throughout their tenure.
In determining that a particular Trustee was and continues to be qualified to serve as a Trustee, the Board has considered a variety of criteria, none of which, in isolation, was controlling. The Board believes that, collectively, the Trustees have balanced and diverse experience, qualifications, attributes, and skills, which allow the Board to operate effectively in governing the fund and protecting the interests of shareholders. Information about the specific experience, skills, attributes, and qualifications of each Trustee, which in each case led to the Board's conclusion that the Trustee should serve (or continue to serve) as a trustee of the fund, is provided below.
Board Structure and Oversight Function. Robert A. Lawrence is an interested person and currently serves as Chairman. The Trustees have determined that an interested Chairman is appropriate and benefits shareholders because an interested Chairman has a personal and professional stake in the quality and continuity of services provided to the fund. Independent Trustees exercise their informed business judgment to appoint an individual of their choosing to serve as Chairman, regardless of whether the Trustee happens to be independent or a member of management. The Independent Trustees have determined that they can act independently and effectively without having an Independent Trustee serve as Chairman and that a key structural component for assuring that they are in a position to do so is for the Independent Trustees to constitute a substantial majority for the Board. The Independent Trustees also regularly meet in executive session. Mary C. Farrell serves as the lead Independent Trustee and as such (i) acts as a liaison between the Independent Trustees and management with respect to matters important to the Independent Trustees and (ii) with management prepares agendas for Board meetings.
Fidelity® funds are overseen by different Boards of Trustees. The fund's Board oversees asset allocation funds. Other Boards oversee Fidelity's investment-grade bond, money market, and asset allocation funds, and Fidelity's equity and high income funds. The fund may invest in Fidelity® funds overseen by such other Boards. The use of separate Boards, each with its own committee structure, allows the Trustees of each group of Fidelity® funds to focus on the unique issues of the funds they oversee, including common research, investment, and operational issues.
The Trustees primarily operate as a full Board, but also operate in committees, to facilitate the timely and efficient consideration of all matters of importance to the Trustees, the fund, and fund shareholders and to facilitate compliance with legal and regulatory requirements and oversight of the fund's activities and associated risks. The Board has charged Strategic Advisers and its affiliates with (i) identifying events or circumstances the occurrence of which could have demonstrably adverse effects on the fund's business and/or reputation; (ii) implementing processes and controls to lessen the possibility that such events or circumstances occur or to mitigate the effects of such events or circumstances if they do occur; and (iii) creating and maintaining a system designed to evaluate continuously business and market conditions in order to facilitate the identification and implementation processes described in (i) and (ii) above. Because the day-to-day operations and activities of the fund are carried out by or through Strategic Advisers, its affiliates and other service providers, the fund's exposure to risks is mitigated but not eliminated by the processes overseen by the Trustees. Board oversight of different aspects of the fund's activities is exercised primarily through the full Board, but also through the Audit and Compliance Committee. Appropriate personnel, including but not limited to the fund's Chief Compliance Officer (CCO), FMR's internal auditor, the independent accountants, the fund's Treasurer and portfolio management personnel, make periodic reports to the Board's committees, as appropriate. The responsibilities of each standing committee, including their oversight responsibilities, are described further under "Standing Committees of the Trustees."
Interested Trustees*:
Correspondence intended for a Trustee who is an interested person may be sent to Fidelity Investments, 245 Summer Street, Boston, Massachusetts 02210.
Name, Year of Birth; Principal Occupations and Other Relevant Experience+
Brian B. Hogan (1964)
Year of Election or Appointment: 2018
Trustee
Mr. Hogan also serves as Trustee of other funds. Mr. Hogan serves as Head of Fidelity Investments’ Investment Solutions and Innovation organization (2018-present), and a Director of Strategic Advisers LLC (2018-present). Previously, Mr. Hogan served as a Director of Fidelity SelectCo, LLC (investment adviser firm, 2014-2019), President of FMR Co., Inc. (2009-2018), a Vice President of Fidelity's Equity and High Income funds (2009-2018), a Director of FMR Investment Management (UK) Limited (investment adviser firm, 2015-2018), Trustee of certain Fidelity® funds (2014-2018), President of the Equity Division of Fidelity Management & Research Company (investment adviser firm, 2009-2018), Senior Vice President, Equity Research of Fidelity Management & Research Company (2006-2009), and as a portfolio manager. Mr. Brian B. Hogan is not related to Mr. Colm A. Hogan.
Robert A. Lawrence (1952)
Year of Election or Appointment: 2016
Trustee
Chairman of the Board of Trustees
Mr. Lawrence also serves as Trustee of other funds. Previously, Mr. Lawrence served as a Member of the Advisory Board of certain funds. Prior to his retirement in 2008, Mr. Lawrence served as Vice President of certain Fidelity® funds (2006-2008), Senior Vice President, Head of High Income Division of Fidelity Management & Research Company (investment adviser firm, 2006-2008), and President of Fidelity Strategic Investments (investment adviser firm, 2002-2005).
* Determined to be an "Interested Trustee" by virtue of, among other things, his or her affiliation with the trust or various entities under common control with Strategic Advisers.
+ The information includes the Trustee's principal occupation during the last five years and other information relating to the experience, attributes, and skills relevant to the Trustee's qualifications to serve as a Trustee, which led to the conclusion that the Trustee should serve as a Trustee for the fund.
Independent Trustees:
Correspondence intended for an Independent Trustee may be sent to Fidelity Investments, P.O. Box 55235, Boston, Massachusetts 02205-5235.
Name, Year of Birth; Principal Occupations and Other Relevant Experience+
Peter C. Aldrich (1944)
Year of Election or Appointment: 2006
Trustee
Mr. Aldrich also serves as Trustee of other funds. Mr. Aldrich is a Director of the National Bureau of Economic Research, a Director of the funds of BlackRock Realty Group (2006-present), and a Director of LivelyHood, Inc. (private corporation, 2013-present). Previously, Mr. Aldrich served as a Trustee for the Fidelity Rutland Square Trust (2005-2010), a Managing Member of Poseidon, LLC (foreign private investment, 1998-2004), and Chairman and Managing Member of AEGIS, LLC (foreign private investment, 1997-2004). Mr. Aldrich previously was a founder, Chief Executive Officer, and Chairman of AEW Capital Management, L.P. (then “Aldrich, Eastman and Waltch, L.P.”). Mr. Aldrich also served as a Director of Zipcar, Inc. (car sharing services, 2001-2009) and as Faculty Chairman of The Research Council on Global Investment of The Conference Board (business and professional education non-profit, 1999-2004). Mr. Aldrich is a Member Emeritus of the Board of Trustees of the Museum of Fine Arts Boston and an Overseer of the Massachusetts Eye and Ear Infirmary.
Ralph F. Cox (1932)
Year of Election or Appointment: 2006
Trustee
Mr. Cox also serves as Trustee of other funds. Mr. Cox is President of RABAR Enterprises (management consulting for the petroleum industry). Mr. Cox is a Director of Abraxas Petroleum (exploration and production, 1999-present). Mr. Cox is a member of the Advisory Boards of the Business and Engineering Schools of Texas A&M University and the Engineering School of University of Texas at Austin. Previously, Mr. Cox served as a Trustee for the Fidelity Rutland Square Trust (2005-2010) and as an Advisory Director of CH2M Hill Companies (engineering, 1981-2011). Mr. Ralph F. Cox and Mr. Howard E. Cox, Jr. are not related.
Mary C. Farrell (1949)
Year of Election or Appointment: 2013
Trustee
Ms. Farrell also serves as Trustee of other funds. Ms. Farrell is a Director of the W.R. Berkley Corporation (insurance provider) and President (2009-present) and Director (2006-present) of the Howard Gilman Foundation (charitable organization). Previously, Ms. Farrell was Managing Director and Chief Investment Strategist at UBS Wealth Management USA and Co-Head of UBS Wealth Management Investment Strategy & Research Group (2003-2005). Ms. Farrell also served as Investment Strategist at PaineWebber (1982-2000) and UBS PaineWebber (2000-2002). Ms. Farrell serves as Chairman of the Board of Trustees of Yale-New Haven Hospital and on the Yale New Haven Health System Board and previously served as Trustee on the Board of Overseers of the New York University Stern School of Business.
Karen Kaplan (1960)
Year of Election or Appointment: 2006
Trustee
Ms. Kaplan also serves as Trustee of other funds. Ms. Kaplan is Chairman (2014-present) and Chief Executive Officer (2013-present) of Hill Holliday (advertising and specialized marketing). Ms. Kaplan is a Director of The Michaels Companies, Inc. (specialty retailer, 2015-present), Member of the Board of Governors of the Chief Executives’ Club of Boston (2010-present), Member of the Executive Committee of the Greater Boston Chamber of Commerce (2006-present), Advisory Board Member of the National Association of Corporate Directors Chapter (2012-present), Member of the Board of Trustees of the Post Office Square Trust (2012-present), Trustee of the Brigham and Women’s Hospital (2016-present), Overseer of the Boston Symphony Orchestra (2014-present), Member of the Board of Directors of The Advertising Council, Inc. (2016-present), and Member of the Ron Burton Training Village Executive Board of Advisors (2018-present). Previously, Ms. Kaplan served as an Advisory Board Member of Fidelity Rutland Square Trust (2006-2010), a member of the Clinton Global Initiative (2010-2015), Director of DSM (dba Delta Dental and DentaQuest) (2004-2014), Formal Appointee of the 2015 Baker-Polito Economic Development Council, Director of Vera Bradley Inc. (designer of women’s accessories, 2012-2015), Member of the Board of Directors of the Massachusetts Conference for Women (2008-2015), Member of the Board of Directors of Jobs for Massachusetts (2012-2015), President of the Massachusetts Women’s Forum (2008-2010), Treasurer of the Massachusetts Women’s Forum (2002-2006), and Vice Chair of the Board of the Massachusetts Society for the Prevention of Cruelty to Children (2003-2010).
Heidi L. Steiger (1953)
Year of Election or Appointment: 2017
Trustee
Ms. Steiger also serves as Trustee of other funds. Ms. Steiger serves as a member of the Global Advisory Board and Of Counsel to Signum Global Advisors (international policy and strategy, 2018-present), a guest lecturer in the joint degree program in Global Luxury Management at North Carolina State University (Raleigh, NC) and Skema (Paris) (2018-present), Managing Partner of Topridge Associates, LLC (consulting, 2005-present), a Non-Executive Director of CrowdBureau Corporation (financial technology company and index provider, 2018-present), and a member of the Board of Directors (2013-present) and Chair of the Audit Committee and member of the Membership and Executive Committees (2017-present) of Business Executives for National Security (nonprofit). Previously, Ms. Steiger served as Eastern Region President of The Private Client Reserve of U.S. Bancorp (banking and financial services, 2010-2015), Advisory Director of Berkshire Capital Securities, LLC (financial services, 2009-2010), President and Senior Advisor of Lowenhaupt Global Advisors, LLC (financial services, 2005-2007), and President and Contributing Editor of Worth Magazine (2004-2005) and held a variety of positions at Neuberger Berman Group, LLC (financial services, 1986-2004), including Partner and Executive Vice President and Global Head of Private Asset Management at Neuberger Berman (1999-2004). Ms. Steiger also served as a member of the Board of Directors of Nuclear Electric Insurance Ltd (insurer of nuclear utilities, 2006-2017), a member of the Board of Trustees and Audit Committee of the Eaton Vance Funds (2007-2010), a member of the Board of Directors of Aviva USA (formerly AmerUs) (insurance, 2004-2014), and a member of the Board of Trustees and Audit Committee and Chair of the Investment Committee of CIFG (financial guaranty insurance, 2009-2012), and a member of the Board of Directors of Kin Group Plc (formerly, Fitbug Holdings) (health and technology, 2016-2017).
+ The information includes the Trustee's principal occupation during the last five years and other information relating to the experience, attributes, and skills relevant to the Trustee's qualifications to serve as a Trustee, which led to the conclusion that the Trustee should serve as a Trustee for the fund.
Advisory Board Members and Officers:
Correspondence intended for an officer or Howard E. Cox, Jr. may be sent to Fidelity Investments, 245 Summer Street, Boston, Massachusetts 02210. Officers appear below in alphabetical order.
Name, Year of Birth; Principal Occupation
Howard E. Cox, Jr. (1944)
Year of Election or Appointment: 2009
Member of the Advisory Board
Mr. Cox also serves as Member of the Advisory Board of other funds. Mr. Cox is a Partner of Greylock (venture capital, 1971-present) and a Director of Stryker Corporation (medical products and services, 1974-present). Previously, Mr. Cox served as an Advisory Board Member of Fidelity Rutland Square Trust (2006-2010). Mr. Cox also serves as a Member of the Secretary of Defense's Business Board of Directors (2008-present), a Director of Business Executives for National Security (1997-present), a Director of the Brookings Institution (2010-present), a Director of the World Economic Forum’s Young Global Leaders Foundation (2009-present), and is a Member of the Harvard Medical School Board of Fellows (2002-present). Mr. Howard E. Cox, Jr. and Mr. Ralph F. Cox are not related.
Christine Marcks (1955)
Year of Election or Appointment: 2019
Member of the Advisory Board
Ms. Marcks also serves as Member of the Advisory Board of other Funds. Prior to her retirement, Ms. Marcks served as Chief Executive Officer and President – Prudential Retirement (2007-2017) and Vice President for Rollover and Retirement Income Strategies (2005-2007), Prudential Financial, Inc. (financial services). Previously, Ms. Marcks was Senior Vice President and Head of Financial Horizons (2002-2004) and Vice President, Strategic Marketing (2000-2002) of Voya Financial (formerly ING U.S.) (financial services), held numerous positions at Aetna Financial Services (financial services, 1987-2000) and served as an International Economist for the United States Department of the Treasury (1980-1987). Ms. Marcks also serves as a member of the Board of Trustees, Audit Committee and Benefits & Operations Committee of the YMCA Retirement Fund (2018-present), a non-profit organization providing retirement plan benefits to YMCA staff members, and as a member of the Board of Trustees of Assumption College (2019-present).
Elizabeth Paige Baumann (1968)
Year of Election or Appointment: 2017
Anti-Money Laundering (AML) Officer
Ms. Baumann also serves as AML Officer of other funds. She is Chief AML Officer (2012-present) and Senior Vice President (2014-present) of FMR LLC (diversified financial services company) and is an employee of Fidelity Investments. Previously, Ms. Baumann served as AML Officer of certain funds (2017-2019), as AML Officer of the funds (2012-2016), and Vice President (2007-2014) and Deputy Anti-Money Laundering Officer (2007-2012) of FMR LLC.
Craig S. Brown (1977)
Year of Election or Appointment: 2019
Assistant Treasurer
Mr. Brown also serves as Assistant Treasurer of other funds. Mr. Brown is an employee of Fidelity Investments (2013-present).
John J. Burke III (1964)
Year of Election or Appointment: 2018
Chief Financial Officer
Mr. Burke also serves as Chief Financial Officer of other funds. Mr. Burke serves as Head of Investment Operations for Fidelity Fund and Investment Operations (2018-present) and is an employee of Fidelity Investments (1998-present). Previously Mr. Burke served as head of Asset Management Investment Operations (2012-2018).
Jonathan Davis (1968)
Year of Election or Appointment: 2010
Assistant Treasurer
Mr. Davis also serves as Assistant Treasurer of other funds. Mr. Davis serves as Assistant Treasurer of FMR Capital, Inc. (2017-present) and is an employee of Fidelity Investments. Previously, Mr. Davis served as Vice President and Associate General Counsel of FMR LLC (diversified financial services company, 2003-2010).
Laura M. Del Prato (1964)
Year of Election or Appointment: 2018
Assistant Treasurer
Ms. Del Prato also serves as an officer of other funds. Ms. Del Prato is an employee of Fidelity Investments (2017-present). Prior to joining Fidelity Investments, Ms. Del Prato served as a Managing Director and Treasurer of the JPMorgan Mutual Funds (2014-2017). Prior to JPMorgan, Ms. Del Prato served as a partner at Cohen Fund Audit Services (accounting firm, 2012-2013) and KPMG LLP (accounting firm, 2004-2012).
James D. Gryglewicz (1972)
Year of Election or Appointment: 2015
Chief Compliance Officer
Mr. Gryglewicz also serves as Chief Compliance Officer of other funds. Mr. Gryglewicz serves as Compliance Officer of Strategic Advisers LLC (investment adviser firm, 2015-present), Senior Vice President of Asset Management Compliance (2009-present), and is an employee of Fidelity Investments (2004-present). Previously, Mr. Gryglewicz served as Compliance Officer of Fidelity SelectCo, LLC (investment adviser firm, 2014-2019), and as Chief Compliance Officer of certain Fidelity® funds (2014-2018).
Colm A. Hogan (1973)
Year of Election or Appointment: 2016
Assistant Treasurer
Mr. Hogan also serves as an officer of other funds. Mr. Hogan serves as Assistant Treasurer of FMR Capital, Inc. (2017-present) and is an employee of Fidelity Investments (2005-present). Previously, Mr. Hogan served as Deputy Treasurer of certain Fidelity® funds (2016-2020) and Assistant Treasurer of certain Fidelity® funds (2016-2018). Mr. Colm A. Hogan is not related to Mr. Brian B. Hogan.
Christina H. Lee (1975)
Year of Election or Appointment: 2020
Secretary and Chief Legal Officer
Ms. Lee also serves as Secretary and CLO of other funds. Ms. Lee serves as Vice President, Associate General Counsel (2014-present) and is an employee of Fidelity Investments (2007-present). Previously, Ms. Lee served as Assistant Secretary of certain funds (2018-2019).
Cynthia Lo Bessette (1969)
Year of Election or Appointment: 2020
Assistant Secretary
Ms. Lo Bessette also serves as an officer of other funds. Ms. Lo Bessette serves as CLO, Secretary, and Senior Vice President of Fidelity Management & Research Company LLC (investment adviser firm, 2019-present); and CLO of Fidelity Management & Research (Hong Kong) Limited, FMR Investment Management (UK) Limited, and Fidelity Management & Research (Japan) Limited (investment adviser firms, 2019-present). She is a Senior Vice President and Deputy General Counsel of FMR LLC (diversified financial services company, 2019-present), and is an employee of Fidelity Investments. Previously, Ms. Lo Bessette served as CLO, Secretary, and Senior Vice President of FMR Co., Inc. (investment adviser firm, 2019); Secretary of Fidelity SelectCo, LLC and Fidelity Investments Money Management, Inc. (investment adviser firms, 2019). Prior to joining Fidelity Investments, Ms. Lo Bessette was Executive Vice President, General Counsel (2016-2019) and Senior Vice President, Deputy General Counsel (2015-2016) of OppenheimerFunds (investment management company) and Deputy Chief Legal Officer (2013-2015) of Jennison Associates LLC (investment adviser firm).
Chris Maher (1972)
Year of Election or Appointment: 2016
Assistant Treasurer
Mr. Maher also serves as an officer of other funds. Mr. Maher serves as Assistant Treasurer of FMR Capital, Inc. (2017-present), and is an employee of Fidelity Investments (2008-present). Previously, Mr. Maher served as Assistant Treasurer of certain funds (2013-2020); Vice President of Asset Management Compliance (2013), Vice President of the Program Management Group of FMR (investment adviser firm, 2010-2013), and Vice President of Valuation Oversight (2008-2010).
Stacie M. Smith (1974)
Year of Election or Appointment: 2020
President and Treasurer
Ms. Smith also serves as an officer of other funds. Ms. Smith serves as Assistant Treasurer of FMR Capital, Inc. (2017-present), is an employee of Fidelity Investments (2009-present), and has served in other fund officer roles. Prior to joining Fidelity Investments, Ms. Smith served as Senior Audit Manager of Ernst & Young LLP (accounting firm, 1996-2009). Previously, Ms. Smith served as Assistant Treasurer (2013-2019) and Deputy Treasurer (2013-2016) of certain Fidelity® funds.
Marc L. Spector (1972)
Year of Election or Appointment: 2016
Assistant Treasurer
Mr. Spector also serves as an officer of other funds. Mr. Spector serves as Assistant Treasurer of FMR Capital, Inc. (2017-present) and is an employee of Fidelity Investments (2016-present). Prior to joining Fidelity Investments, Mr. Spector served as Director at the Siegfried Group (accounting firm, 2013-2016), and prior to Siegfried Group as audit senior manager at Deloitte & Touche LLP (accounting firm, 2005-2013).
Jim Wegmann (1979)
Year of Election or Appointment: 2019
Assistant Treasurer
Mr. Wegmann also serves as Assistant Treasurer of other funds. Mr. Wegmann is an employee of Fidelity Investments (2011-present).
Shareholder Expense Example
As a shareholder of the Fund, you incur two types of costs: (1) transaction costs and (2) ongoing costs, including management fees and other Fund expenses. This Example is intended to help you understand your ongoing costs (in dollars) of investing in the Fund and to compare these costs with the ongoing costs of investing in other mutual funds.
The Example is based on an investment of $1,000 invested at the beginning of the period and held for the entire period (September 1, 2019 to February 29, 2020).
Actual Expenses
The first line of the accompanying table provides information about actual account values and actual expenses. You may use the information in this line, together with the amount you invested, to estimate the expenses that you paid over the period. Simply divide your account value by $1,000.00 (for example, an $8,600 account value divided by $1,000.00 = 8.6), then multiply the result by the number in the first line under the heading entitled "Expenses Paid During Period" to estimate the expenses you paid on your account during this period. In addition to the direct expenses incurred by the Fund presented in the table, as a shareholder of the underlying mutual funds (the Underlying Funds), the Fund also indirectly bears its proportionate share of the expenses of the Underlying Funds. In addition, the Fund, as a shareholder in the underlying Fidelity Central Funds, will indirectly bear its pro-rata share of the fees and expenses incurred by the underlying Fidelity Central Funds. These fees and expenses are not included in the Fund's annualized expense ratio used to calculate the expense estimate in the table below.
Hypothetical Example for Comparison Purposes
The second line of the accompanying table provides information about hypothetical account values and hypothetical expenses based on the Fund's actual expense ratio and an assumed rate of return of 5% per year before expenses, which is not the Fund's actual return. The hypothetical account values and expenses may not be used to estimate the actual ending account balance or expenses you paid for the period. You may use this information to compare the ongoing costs of investing in the Fund and other funds. To do so, compare this 5% hypothetical example with the 5% hypothetical examples that appear in the shareholder reports of the other funds. In addition to the direct expenses incurred by the Fund presented in the table, as a shareholder of the Underlying Funds, the Fund also indirectly bears its proportionate share of the expenses of the Underlying Funds. In addition, the Fund, as a shareholder in the underlying Fidelity Central Funds, will indirectly bear its pro-rata share of the fees and expenses incurred by the underlying Fidelity Central Funds. These fees and expenses are not included in the Fund's annualized expense ratio used to calculate the expense estimate in the table below.
Please note that the expenses shown in the table are meant to highlight your ongoing costs only and do not reflect any transaction costs. Therefore, the second line of the table is useful in comparing ongoing costs only, and will not help you determine the relative total costs of owning different funds.
| Annualized Expense Ratio-A | Beginning Account Value September 1, 2019 | Ending Account Value February 29, 2020 | Expenses Paid During Period-B September 1, 2019 to February 29, 2020 |
|
| Actual | .03% | $1,000.00 | $1,014.60 | $.15 |
| Hypothetical-C | $1,000.00 | $1,024.71 | $.15 |
A Annualized expense ratio reflects expenses net of applicable fee waivers.
B Expenses are equal to the Fund's annualized expense ratio, multiplied by the average account value over the period, multiplied by 182/366 (to reflect the one-half year period). The fees and expenses of the Underlying Funds in which the Fund invests are not included in the Fund's annualized expense ratio.
C 5% return per year before expenses
Distributions (Unaudited)
The Board of Trustees of Strategic Advisers Fidelity International Fund voted to pay on April 9, 2020, to shareholders of record at the opening of business on April 8, 2020, a distribution of $0.057 per share derived from capital gains realized from sales of portfolio securities.
The fund hereby designates as a capital gain dividend with respect to the taxable year ended February 29, 2020, $79,892,558, or, if subsequently determined to be different, the net capital gain of such year.
The fund designates 1% of the dividend distributed in December during the fiscal year as qualifying for the dividends–received deduction for corporate shareholders.
The fund designates 76% and 85% of the dividends distributed in April and December, respectively during the fiscal year as amounts which may be taken into account as a dividend for the purposes of the maximum rate under section 1(h)(11) of the Internal Revenue Code.
The fund designates 1% of the dividends distributed during the fiscal year as a section 199A dividend.
The amounts per share which represent income derived from sources within, and taxes paid to, foreign countries or possessions of the United States are $0.0024 and $0.0001 for the dividend paid April 8, 2019, and $0.1856 and $0.0162 for the dividend paid December 31, 2019.
The fund will notify shareholders in January 2021 of amounts for use in preparing 2020 income tax returns.
Board Approval of Investment Advisory Contracts and Management Fees
Strategic Advisers Fidelity International Fund
Each year, the Board of Trustees, including the Independent Trustees (together, the Board), votes at an in-person meeting on the renewal of the management contract with Strategic Advisers LLC (Strategic Advisers) and the sub-advisory agreements with FIAM LLC (FIAM), FIL Investment Advisors (FIL), and Geode Capital Management, LLC (Geode) (each a Sub-Adviser and collectively, the Sub-Advisers) (collectively, the Sub-Advisory Agreements), and the sub-sub-advisory agreement with FIL Investment Advisors (UK) Limited (the Sub-Sub-Advisory Agreement and, together with the management contract and the Sub-Advisory Agreements, the Advisory Contracts) for the fund. Strategic Advisers and the Sub-Advisers are referred to herein as the Investment Advisers. The Board, assisted by the advice of fund counsel and Independent Trustees' counsel, requests and considers a broad range of information relevant to the renewal of the Advisory Contracts throughout the year.The Board meets at least four times per year and, at each of its meetings, covers an extensive agenda of topics and materials and considers factors that are relevant to its annual consideration of the renewal of the fund's Advisory Contracts, including the services and support provided to the fund and its shareholders. The full Board or the Independent Trustees, as appropriate, act on all major matters; however, a portion of the activities of the Board (including certain of those described herein) may be conducted through standing committees that have been established by the Board. The Board, acting directly and through its committees, requests and receives information concerning the annual consideration of the renewal of the fund's Advisory Contracts.At its September 2019 meeting, the Board, including the Independent Trustees, unanimously determined to renew the fund's Advisory Contracts. In addition, the Board approved amendments to the fund's sub-advisory agreements with FIL and Geode to add certain exceptions to the most favored nation provision in each such sub-advisory agreement and, where applicable, to make other non-material amendments to the agreements. The Board noted that the other terms of each amended sub-advisory agreement are not materially different from those of the applicable existing sub-advisory agreement and that FIL and Geode each will continue to provide the same services to the fund.In reaching its determination to renew the fund's Advisory Contracts and approve the amendments to the sub-advisory agreements described above (Amendments), the Board considered all factors it believed relevant, including (i) the nature, extent, and quality of the services provided to the fund and its shareholders (including the investment performance of the fund); (ii) the competitiveness of the fund's management fee and total expenses relative to peer funds; (iii) the total costs of the services provided by and the profits, if any, realized by Strategic Advisers from its relationships with the fund; and (iv) the extent to which, if any, economies of scale exist and are realized as the fund grows and whether any economies of scale are appropriately shared with fund shareholders.In considering whether to renew the Advisory Contracts for the fund and approve the Amendments, the Board reached a determination, with the assistance of fund counsel and Independent Trustees' counsel and through the exercise of its business judgment, that the renewal of the Advisory Contracts and the approval of the Amendments is in the best interests of the fund and its shareholders. In addition, with respect to the Sub-Advisory Agreements, the Board also concluded that the renewal of such agreements and the approval of the Amendments do not involve a conflict of interest from which Strategic Advisers or its affiliates derive an inappropriate advantage. Also, the Board found that the advisory fees charged under the Advisory Contracts bear a reasonable relationship to the services rendered and are based on services provided that are in addition to, rather than duplicative of, services provided under the advisory contract of any underlying fund in which the fund may invest. The Board's decision to renew the Advisory Contracts and approve the Amendments was not based on any single factor, but rather was based on a comprehensive consideration of all the information provided to the Board throughout the year. Nature, Extent, and Quality of Services Provided. The Board considered the staffing within the Investment Advisers, including the backgrounds of the fund's investment personnel and also considered the fund's investment objective, strategies, and related investment philosophy. The Independent Trustees also had discussions with senior management of Strategic Advisers' investment operations and investment groups. The Board considered the structure of each Investment Adviser's investment personnel compensation program and whether such structures provide appropriate incentives to act in the best interests of the fund.The Trustees also discussed with representatives of Strategic Advisers, at meetings throughout the year, Strategic Advisers' role in, among other things, (i) setting, implementing and monitoring the investment strategies for the funds; (ii) identifying and recommending sub-advisers for the funds; (iii) overseeing compliance with federal securities laws by each sub-adviser with respect to the portion of fund assets allocated to the sub-adviser; (iv) monitoring and overseeing the performance and investment capabilities of each sub-adviser; and (v) recommending the replacement of a sub-adviser as appropriate. The Trustees considered that the Board had received from Strategic Advisers substantial information and periodic reports about Strategic Advisers' sub-adviser oversight and due diligence processes, as well as periodic reports regarding the performance of each sub-adviser.The Board also considered the nature, extent and quality of services provided by each Sub-Adviser. The Trustees noted that under the Sub-Advisory Agreements subject to oversight by Strategic Advisers, each Sub-Adviser is responsible for, among other things, identifying investments for the portion of fund assets allocated to the Sub-Adviser, if any, and executing portfolio transactions to implement its investment strategy. In addition, the Trustees noted that each Sub-Adviser is responsible for providing such reporting as may be requested from Strategic Advisers to fulfill its oversight responsibilities discussed above. Resources Dedicated to Investment Management and Support Services. The Board reviewed the general qualifications and capabilities of the Investment Advisers' investment staffs, their use of technology, and the Investment Advisers' approach to managing and compensating investment personnel. The Board noted that the Investment Advisers' analysts have extensive resources, tools, and capabilities that allow them to conduct sophisticated quantitative and/or fundamental analysis. Additionally, in its deliberations, the Board considered the Investment Advisers' trading capabilities and resources and global compliance infrastructure, which are integral parts of the investment management process. Shareholder and Administrative Services. The Board considered (i) the nature, extent, quality, and cost of administrative and shareholder services performed by Strategic Advisers and its affiliates under the management contract and under separate agreements covering transfer agency, pricing and bookkeeping, and securities lending services for the fund; (ii) the nature and extent of Strategic Advisers' supervision of third party service providers, including sub-advisers, custodians and subcustodians; and (iii) the resources devoted to, and the record of compliance with, the fund's compliance policies and procedures. Investment Performance. The Board considered whether the fund has operated in accordance with its investment objective, as well as its record of compliance with its investment restrictions and its performance history.In connection with the renewal of the Advisory Contracts, the Board considered annualized return information for the fund for different time periods, measured against an appropriate securities market index ("benchmark index") and a peer group of mutual funds with similar objectives ("peer group").The Board considered discussions that occur at Board meetings throughout the year with representatives of Strategic Advisers about fund investment performance and the performance of each Sub-Adviser as part of regularly scheduled fund reviews and other reports to the Board on fund performance, taking into account various factors including general market conditions. In its discussions with representatives of Strategic Advisers regarding fund performance, the Board gave particular attention to information indicating underperformance of certain funds for specific time periods and discussed with Strategic Advisers the reasons for any such underperformance.The following charts considered by the Board show, over the one-, three-, and five-year periods ended December 31, 2018, the cumulative total returns of the fund and the cumulative total returns of an appropriate benchmark index and peer group. The box within each chart shows the 25th percentile return (75% beaten, top of box) and the 75th percentile return (25% beaten, bottom of box) of the peer group. Returns shown above the box are in the first quartile and returns shown below the box are in the fourth quartile. The percentage beaten number noted below each chart corresponds to the percentile box and represents the percentage of funds in the peer group whose performance was equal to or lower than that of the fund.Strategic Advisers Fidelity International Fund
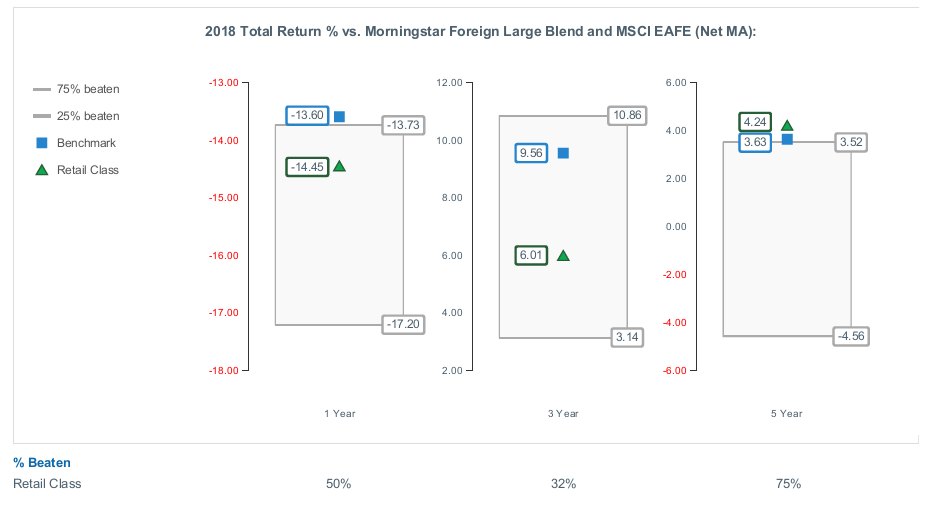
Strategic Advisers Fidelity International Fund
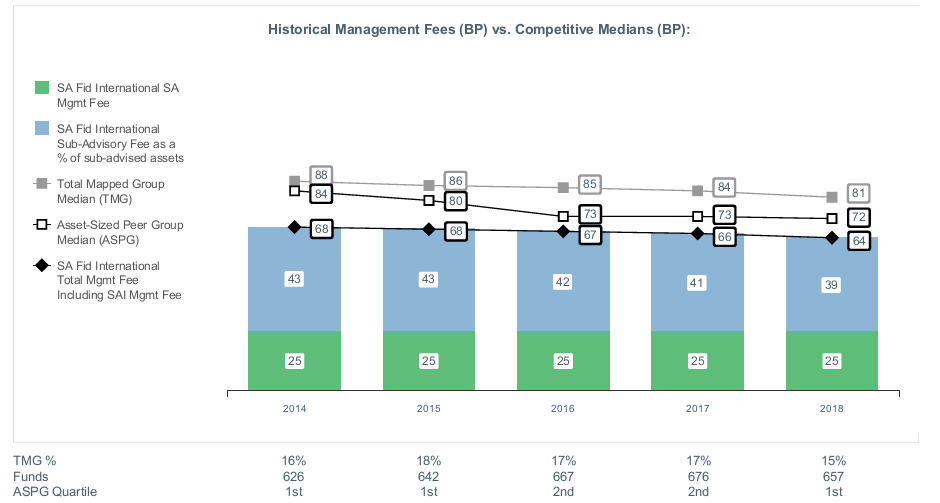
Liquidity Risk Management Program
The Securities and Exchange Commission adopted Rule 22e-4 under the Investment Company Act of 1940 (the Liquidity Rule) to promote effective liquidity risk management throughout the open-end investment company industry, thereby reducing the risk that funds will be unable to meet their redemption obligations and mitigating dilution of the interests of fund shareholders.
The Fund has adopted and implemented a liquidity risk management program (the Program) reasonably designed to assess and manage the Fund’s liquidity risk and to comply with the requirements of the Liquidity Rule. The Fund’s Board of Trustees (the Board) has designated the Fund’s investment adviser as administrator of the Program. Strategic Advisers has established a Liquidity Risk Management Committee (the LRM Committee) to manage the Program for each of the Funds. The LRM Committee monitors the adequacy and effectiveness of implementation of the Program and on a periodic basis assesses each Fund’s liquidity risk based on a variety of factors including (1) the Fund’s investment strategy, (2) portfolio liquidity and cash flow projections during normal and reasonably foreseeable stressed conditions, (3) shareholder redemptions and (4) borrowings and other funding sources, as applicable.
In accordance with the Program, each of the Fund’s portfolio investments is classified into one of four liquidity categories described below based on a determination of a reasonable expectation for how long it would take to convert the investment to cash (or sell or dispose of the investment) without significantly changing its market value.
- Highly liquid investments – cash or convertible to cash within three business days or less
- Moderately liquid investments – convertible to cash in three to seven calendar days
- Less liquid investments – can be sold or disposed of, but not settled, within seven calendar days
- Illiquid investments – cannot not be sold or disposed of within seven calendar days
Liquidity classification determinations take into account a variety of factors including various market, trading and investment-specific considerations, as well as market depth, and generally utilize analysis from a third-party liquidity metrics service.
The Liquidity Rule places a 15% limit on a fund’s illiquid investments and requires funds that do not primarily hold assets that are highly liquid investments to determine and maintain a minimum percentage of the fund’s net assets to be invested in highly liquid investments (highly liquid investment minimum or HLIM). The Program includes provisions reasonably designed to comply with the 15% limit on illiquid investments and for determining, periodically reviewing and complying with the HLIM requirement as applicable.
At a recent meeting of the Fund’s Board of Trustees, the LRM Committee provided a written report to the Board pertaining to the operation, adequacy, and effectiveness of implementation of the Program for the annual period from December 1, 2018 through November 30, 2019. The report concluded that the Program has been implemented and is operating effectively and is reasonably designed to assess and manage the Fund’s liquidity risk.
![]()
SIL-ANN-0420
1.912839.109
Strategic Advisers® International Fund
Offered exclusively to certain clients of Strategic Advisers LLC - not available for sale to the general public
February 29, 2020
See the inside front cover for important information about access to your fund’s shareholder reports.
Beginning on January 1, 2021, as permitted by regulations adopted by the Securities and Exchange Commission, paper copies of a fund’s shareholder reports will no longer be sent by mail, unless you specifically request paper copies of the reports from the fund or from your financial intermediary, such as a financial advisor, broker-dealer or bank. Instead, the reports will be made available on a website, and you will be notified by mail each time a report is posted and provided with a website link to access the report.
If you already elected to receive shareholder reports electronically, you will not be affected by this change and you need not take any action. You may elect to receive shareholder reports and other communications from a fund electronically, by contacting your financial intermediary. For Fidelity customers, visit Fidelity's web site or call Fidelity using the contact information listed below.
You may elect to receive all future reports in paper free of charge. If you wish to continue receiving paper copies of your shareholder reports, you may contact your financial intermediary or, if you are a Fidelity customer, visit Fidelity’s website, or call Fidelity at the applicable toll-free number listed below. Your election to receive reports in paper will apply to all funds held with the fund complex/your financial intermediary.
| Account Type | Website | Phone Number |
| Brokerage, Mutual Fund, or Annuity Contracts: | fidelity.com/mailpreferences | 1-800-343-3548 |
| Employer Provided Retirement Accounts: | netbenefits.fidelity.com/preferences (choose 'no' under Required Disclosures to continue to print) | 1-800-343-0860 |
| Advisor Sold Accounts Serviced Through Your Financial Intermediary: | Contact Your Financial Intermediary | Your Financial Intermediary's phone number |
| Advisor Sold Accounts Serviced by Fidelity: | institutional.fidelity.com | 1-877-208-0098 |
Contents
|
Board Approval of Investment Advisory Contracts and Management Fees | |
To view a fund's proxy voting record for the 12-month period ended June 30, visit http://www.fidelity.com/proxyvotingresults or visit the Securities and Exchange Commission's (SEC) web site at http://www.sec.gov.
You may also call 1-800-544-3455 to request a free copy of the proxy voting guidelines.
Standard & Poor's, S&P and S&P 500 are registered service marks of The McGraw-Hill Companies, Inc. and have been licensed for use by Fidelity Distributors Corporation.
Other third-party marks appearing herein are the property of their respective owners.
All other marks appearing herein are registered or unregistered trademarks or service marks of FMR LLC or an affiliated company. © 2020 FMR LLC. All rights reserved.
This report and the financial statements contained herein are submitted for the general information of the shareholders of the Fund. This report is not authorized for distribution to prospective investors in the Fund unless preceded or accompanied by an effective prospectus.
A fund files its complete schedule of portfolio holdings with the SEC for the first and third quarters of each fiscal year on Form N-PORT. Forms N-PORT are available on the SEC’s web site at http://www.sec.gov. A fund's Forms N-PORT may be reviewed and copied at the SEC’s Public Reference Room in Washington, DC. Information regarding the operation of the SEC's Public Reference Room may be obtained by calling 1-800-SEC-0330.
For a complete list of a fund's portfolio holdings, view the most recent holdings listing, semiannual report, or annual report on Fidelity's web site at http://www.fidelity.com, http://www.institutional.fidelity.com, or http://www.401k.com, as applicable.
NOT FDIC INSURED •MAY LOSE VALUE •NO BANK GUARANTEE
Neither the Fund nor Fidelity Distributors Corporation is a bank.
Note to Shareholders:
Early in 2020, the outbreak and spread of a new coronavirus emerged as a public health emergency that had a major influence on financial markets, primarily based on its impact on the global economy and corporate earnings. The virus causes a respiratory disease known as COVID-19. On March 11, the World Health Organization declared the COVID-19 outbreak a pandemic, citing sustained risk of further global spread.
In the weeks following the end of this reporting period, as the crisis worsened, we witnessed an escalating human tragedy with wide-scale social and economic consequences from coronavirus-containment measures. The outbreak of COVID-19 prompted a number of measures to limit the spread, including travel and border restrictions, quarantines, and restrictions on large gatherings. In turn, these resulted in lower consumer activity, diminished demand for a wide range of products and services, disruption in manufacturing and supply chains, and – given the wide variability in outcomes regarding the outbreak – significant market uncertainty and volatility. Amid the turmoil, the U.S. government took unprecedented action – in concert with the U.S. Federal Reserve and central banks around the world – to help support consumers, businesses, and the broader economy, and to limit disruption to the financial system.
The situation continues to unfold, and the extent and duration of its impact on financial markets and the economy remain highly uncertain. Extreme events such as the coronavirus crisis are “exogenous shocks” that can have significant adverse effects on mutual funds and their investments. Although multiple asset classes may be affected by market disruption, the duration and impact may not be the same for all types of assets.
Fidelity is committed to helping you stay informed amid news about COVID-19 and during increased market volatility, and we’re taking extra steps to be responsive to customer needs. We encourage you to visit our websites, where we offer ongoing updates, commentary, and analysis on the markets and our funds.
Performance: The Bottom Line
Average annual total return reflects the change in the value of an investment, assuming reinvestment of distributions from dividend income and capital gains (the profits earned upon the sale of securities that have grown in value, if any) and assuming a constant rate of performance each year. The hypothetical investment and the average annual total returns do not reflect the deduction of taxes that a shareholder would pay on fund distributions or the redemption of fund shares. During periods of reimbursement by Fidelity, a fund’s total return will be greater than it would be had the reimbursement not occurred. How a fund did yesterday is no guarantee of how it will do tomorrow.
Average Annual Total Returns
| For the periods ended February 29, 2020 | Past 1 year | Past 5 years | Past 10 years |
| Strategic Advisers® International Fund | 2.35% | 2.63% | 5.61% |
$10,000 Over 10 Years
Let's say hypothetically that $10,000 was invested in Strategic Advisers® International Fund on February 28, 2010.
The chart shows how the value of your investment would have changed, and also shows how the MSCI EAFE Index performed over the same period.
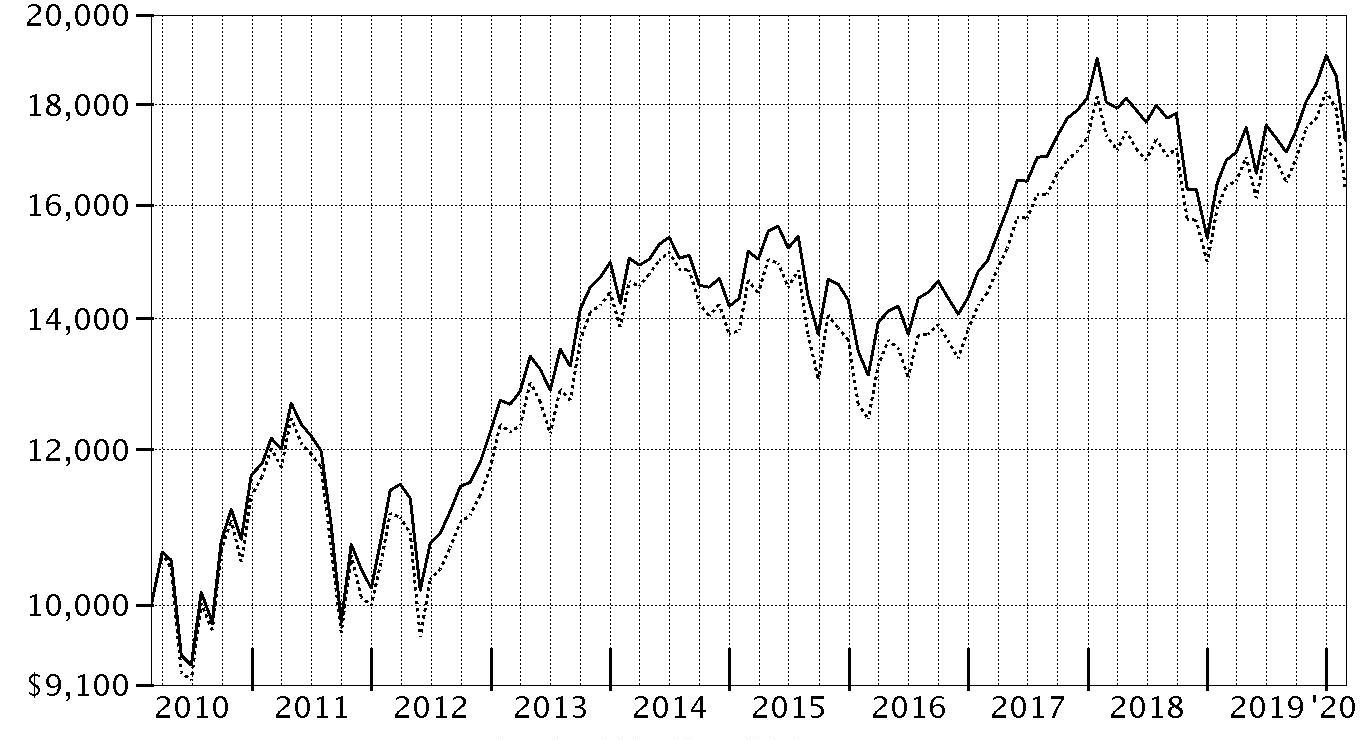
| Period Ending Values | ||
|
| $17,258 | Strategic Advisers® International Fund |
|
| $16,291 | MSCI EAFE Index |
Management's Discussion of Fund Performance
Market Recap: The MSCI ACWI (All Country World Index) ex USA Index returned -0.51% for the 12 months ending February 29, 2020, as the negative impact of the new coronavirus in early 2020 reversed a strong uptrend. For the first 10 months of the past year, international stocks gained ground as they benefited from accommodative monetary policies from central banks around the world, favorable economic growth and de-escalation of the U.S.–China trade conflict. However, in January, the outbreak and spread of the novel coronavirus in China became a growing concern for many investors, threatening global economic growth and corporate earnings. The index had a return of -2.68% for the month. The outbreak escalated globally in February, when the index returned -7.90% amid a surge of cases outside China and causing investors to generally favor safer asset classes. For the full 12 months, the energy (-17%) sector was hit hardest, as concerns about global growth and lack of demand for crude oil and natural gas pressured stocks. Materials (-8%) fared poorly, followed by financials (-5%). Conversely, the defensive health care (+10%) and utilities (+7%) sectors held up well, while information technology (+17%) led the way. Regionally, the U.K. (-7%) suffered from uncertainty tied to Brexit for most of the period, though Parliament approved a deal in January. Asia Pacific ex Japan (-3%) and emerging markets (-2%) lagged, whereas Europe ex U.K. (+3%), Canada (+2%) and Japan (+1) slightly outperformed. Comments from Portfolio Manager Wilfred Chilangwa: For the fiscal year, the Fund gained 2.35%, handily outpacing the -0.34% return of the benchmark MSCI EAFE Index. During a period in which growth stocks and strategies outperformed their value-oriented counterparts, growth-oriented underlying managers emphasizing momentum and/or company quality delivered the best results. The International Value strategy managed by sub-adviser MFS (+8%) – the Fund’s largest investment, on average – was the top relative contributor. This mandate has a quality bias resulting in a portfolio with a slight growth tilt that is typically less volatile than the broader market – two factors that worked well this period. William Blair Investment Management (+11%) also notably contributed versus the benchmark. This sub-adviser uses an opportunistic, quality growth strategy, with a bias toward emerging markets. On the downside, sub-adviser Causeway Capital Management (-6%) was the largest relative detractor the past 12 months. Its traditional value discipline, which seeks investment opportunities across the entire market-capitalization range, was out of favor this period. During the period, I increased the Fund's allocation to sub-advisers to about 54% of total assets, which included adding a new mandate from T. Rowe Price. As of February 29, the Fund was defensively positioned, reflecting heightened economic risk from the coronavirus pandemic.The views expressed above reflect those of the portfolio manager(s) only through the end of the period as stated on the cover of this report and do not necessarily represent the views of Fidelity or any other person in the Fidelity organization. Any such views are subject to change at any time based upon market or other conditions and Fidelity disclaims any responsibility to update such views. These views may not be relied on as investment advice and, because investment decisions for a Fidelity fund are based on numerous factors, may not be relied on as an indication of trading intent on behalf of any Fidelity fund.
Investment Summary (Unaudited)
The information in the following tables is based on the direct investments of the Fund.Top Ten Holdings as of February 29, 2020
| (excluding cash equivalents) | % of fund's net assets |
| Fidelity International Discovery Fund | 6.7 |
| iShares MSCI Japan ETF | 5.5 |
| Fidelity Diversified International Fund | 4.1 |
| Artisan International Value Fund Investor Class | 3.7 |
| Fidelity Overseas Fund | 3.4 |
| WCM Focused International Growth Fund Institutional Class | 3.3 |
| Oakmark International Fund Investor Class | 3.2 |
| JOHCM International Select Fund Class II Shares | 3.0 |
| Morgan Stanley Institutional Fund, Inc. International Equity Portfolio Class I | 2.7 |
| Pear Tree Polaris Foreign Value Fund Institutional Shares | 1.8 |
| 37.4 |
Asset Allocation (% of fund's net assets)
| As of February 29, 2020 | ||
| Common Stocks | 52.1% | |
| Preferred Stocks | 0.7% | |
| Europe Stock Funds | 0.8% | |
| Foreign Large Blend Funds | 10.7% | |
| Foreign Large Growth Funds | 21.2% | |
| Foreign Large Value Funds | 2.5% | |
| Foreign Small Mid Growth Funds | 0.7% | |
| Foreign Small Mid Blend Funds | 0.6% | |
| Foreign Small Mid Value Funds | 0.5% | |
| Other | 7.3% | |
| Sector Funds | 0.1% | |
| Short-Term Investments and Net Other Assets (Liabilities) | 2.8% | |

Asset allocations of funds in the pie chart reflect the categorizations of assets as defined by Morningstar as of the reporting date.
Top Five Market Sectors as of February 29, 2020
| (stocks only) | % of fund's net assets |
| Industrials | 8.7 |
| Financials | 8.2 |
| Information Technology | 7.7 |
| Consumer Staples | 6.9 |
| Health Care | 6.0 |
Geographic Diversification (% of fund's net assets)
| As of February 29, 2020 | ||
| United States of America | 48.8% | |
| Japan | 10.5% | |
| United Kingdom | 7.6% | |
| Germany | 5.9% | |
| Switzerland | 5.4% | |
| France | 5.1% | |
| Netherlands | 2.5% | |
| Australia | 1.2% | |
| Cayman Islands | 0.9% | |
| Other | 12.1% | |

Schedule of Investments February 29, 2020
Showing Percentage of Net Assets
| Common Stocks - 52.1% | |||
| Shares | Value | ||
| COMMUNICATION SERVICES - 2.7% | |||
| Diversified Telecommunication Services - 0.3% | |||
| BT Group PLC | 180,189 | $330,560 | |
| Hellenic Telecommunications Organization SA | 493,286 | 7,018,264 | |
| Koninklijke KPN NV | 1,117,066 | 2,709,295 | |
| KT Corp. | 127,161 | 2,533,342 | |
| Nippon Telegraph & Telephone Corp. | 1,175,200 | 27,417,147 | |
| Nippon Telegraph & Telephone Corp. sponsored ADR | 49,968 | 1,163,255 | |
| Telecom Italia SpA (a) | 1,301,248 | 723,717 | |
| Telefonica Deutschland Holding AG | 351,184 | 924,032 | |
| Telstra Corp. Ltd. | 656,047 | 1,465,920 | |
| 44,285,532 | |||
| Entertainment - 0.3% | |||
| NetEase, Inc. ADR | 28,710 | 9,150,164 | |
| Nintendo Co. Ltd. | 68,300 | 22,896,517 | |
| Square Enix Holdings Co. Ltd. | 149,100 | 6,013,212 | |
| TECMO KOEI HOLDINGS CO., LTD. | 17,100 | 425,043 | |
| Tencent Music Entertainment Group ADR (a) | 104,931 | 1,272,813 | |
| Vivendi SA | 228,100 | 5,827,788 | |
| 45,585,537 | |||
| Interactive Media & Services - 0.7% | |||
| Baidu.com, Inc. sponsored ADR (a) | 297,456 | 35,688,771 | |
| Carsales.com Ltd. | 180,526 | 1,905,179 | |
| Kakaku.com, Inc. | 10,000 | 214,167 | |
| Kakao Corp. | 18,965 | 2,716,370 | |
| Momo, Inc. ADR | 9,557 | 268,743 | |
| NAVER Corp. | 88,199 | 12,779,696 | |
| Scout24 AG (b) | 106,966 | 7,037,705 | |
| Tencent Holdings Ltd. | 602,700 | 30,559,727 | |
| Yahoo! Japan Corp. | 2,093,100 | 7,626,444 | |
| Yandex NV Series A (a) | 117,632 | 4,777,036 | |
| YY, Inc. ADR (a) | 84,355 | 4,552,639 | |
| 108,126,477 | |||
| Media - 0.2% | |||
| Altice Europe NV Class A (a) | 46,343 | 246,122 | |
| Chinese Universe Publishing and Media Group Co. Ltd. (A Shares) | 398,241 | 809,930 | |
| CyberAgent, Inc. | 142,000 | 5,391,155 | |
| Eutelsat Communications | 251,001 | 3,393,971 | |
| Hakuhodo DY Holdings, Inc. | 42,800 | 499,585 | |
| Informa PLC | 540,269 | 4,781,616 | |
| NOS SGPS | 156,796 | 619,303 | |
| Stroer Out-of-Home Media AG | 56,542 | 4,232,159 | |
| Telenet Group Holding NV | 1,900 | 73,081 | |
| Television Francaise 1 SA | 44,220 | 339,865 | |
| WPP PLC | 751,412 | 7,219,615 | |
| 27,606,402 | |||
| Wireless Telecommunication Services - 1.2% | |||
| Advanced Info Service PCL (For. Reg.) | 1,031,300 | 6,537,559 | |
| China Mobile Ltd. | 5,687,539 | 45,264,932 | |
| KDDI Corp. | 1,143,800 | 32,316,423 | |
| SK Telecom Co. Ltd. | 130,958 | 23,188,920 | |
| SoftBank Group Corp. | 501,500 | 23,298,847 | |
| Tele2 AB (B Shares) | 510,887 | 7,437,582 | |
| Vodafone Group PLC | 19,472,600 | 34,033,202 | |
| Vodafone Group PLC sponsored ADR | 577,911 | 10,113,443 | |
| 182,190,908 | |||
| TOTAL COMMUNICATION SERVICES | 407,794,856 | ||
| CONSUMER DISCRETIONARY - 4.0% | |||
| Auto Components - 0.4% | |||
| Aisin Seiki Co. Ltd. | 107,700 | 3,494,808 | |
| Autoliv, Inc. (depositary receipt) | 70,517 | 4,812,500 | |
| Continental AG | 17,252 | 1,972,902 | |
| Continental AG sponsored ADR | 26,891 | 303,330 | |
| Eagle Industry Co. Ltd. | 17,600 | 133,640 | |
| Koito Manufacturing Co. Ltd. | 221,400 | 8,744,335 | |
| Kyb Corp. (a) | 2,000 | 44,391 | |
| Magna International, Inc. Class A | 206,607 | 9,466,733 | |
| Michelin CGDE Series B | 61,163 | 6,554,639 | |
| Schaeffler AG | 11,564 | 105,419 | |
| Stanley Electric Co. Ltd. | 203,400 | 4,970,910 | |
| Sumitomo Electric Industries Ltd. | 104,100 | 1,245,513 | |
| Sumitomo Rubber Industries Ltd. | 274,500 | 2,857,996 | |
| Toyoda Gosei Co. Ltd. | 20,500 | 438,281 | |
| Toyota Industries Corp. | 227,300 | 12,033,034 | |
| TPR Co. Ltd. | 19,100 | 266,508 | |
| Unipres Corp. | 18,400 | 198,910 | |
| Valeo SA | 61,458 | 1,562,341 | |
| Yokohama Rubber Co. Ltd. | 78,000 | 1,270,592 | |
| Yorozu Corp. | 17,400 | 207,619 | |
| 60,684,401 | |||
| Automobiles - 0.4% | |||
| Bayerische Motoren Werke AG (BMW) | 43,357 | 2,860,813 | |
| Daimler AG: | |||
| ADR | 11,500 | 119,025 | |
| (Germany) | 44,044 | 1,853,138 | |
| Ferrari NV | 55,468 | 8,737,201 | |
| Fiat Chrysler Automobiles NV (Italy) | 543,576 | 6,849,398 | |
| Honda Motor Co. Ltd. | 130,500 | 3,347,906 | |
| Honda Motor Co. Ltd. sponsored ADR | 47,864 | 1,228,190 | |
| Kia Motors Corp. | 19,593 | 591,448 | |
| Maruti Suzuki India Ltd. | 32,671 | 2,829,859 | |
| Peugeot Citroen SA | 145,991 | 2,829,170 | |
| Renault SA | 15,566 | 462,690 | |
| Suzuki Motor Corp. | 142,800 | 5,741,921 | |
| Toyota Motor Corp. | 241,500 | 15,858,030 | |
| Volkswagen AG | 14,580 | 2,476,578 | |
| Yamaha Motor Co. Ltd. | 29,000 | 464,602 | |
| 56,249,969 | |||
| Distributors - 0.0% | |||
| Inchcape PLC | 970,863 | 7,257,137 | |
| Diversified Consumer Services - 0.1% | |||
| TAL Education Group ADR (a) | 162,509 | 8,838,865 | |
| Hotels, Restaurants & Leisure - 0.7% | |||
| Aristocrat Leisure Ltd. | 348,920 | 7,526,033 | |
| Autogrill SpA | 85,292 | 689,530 | |
| Basic-Fit NV (a)(b) | 43,623 | 1,449,654 | |
| Carnival PLC | 62,858 | 1,988,250 | |
| Collins Foods Ltd. | 95,921 | 549,892 | |
| Compass Group PLC | 2,280,616 | 50,247,552 | |
| CVC Brasil Operadora e Agencia de Viagens SA | 128,400 | 738,776 | |
| Evolution Gaming Group AB (b) | 112,576 | 4,102,498 | |
| Galaxy Entertainment Group Ltd. | 811,000 | 5,352,912 | |
| Gaming VC Holdings SA | 6,800 | 69,912 | |
| Greggs PLC | 197,638 | 5,325,832 | |
| Herfy Food Services Co. | 19,039 | 239,542 | |
| Huazhu Group Ltd. ADR | 61,622 | 2,079,743 | |
| InterContinental Hotel Group PLC | 51,813 | 2,870,838 | |
| Jumbo Interactive Ltd. | 11,271 | 81,135 | |
| Paddy Power Betfair PLC (c) | 47,440 | 5,103,877 | |
| SSP Group PLC | 246,337 | 1,629,067 | |
| Sushiro Global Holdings Ltd. | 23,400 | 1,670,499 | |
| TUI AG | 484,100 | 3,864,765 | |
| Wolverhampton & Dudley Breweries PLC | 420,484 | 487,908 | |
| Yum China Holdings, Inc. | 196,041 | 8,584,635 | |
| 104,652,850 | |||
| Household Durables - 0.4% | |||
| Barratt Developments PLC | 333,248 | 3,289,687 | |
| Bellway PLC | 10,512 | 508,744 | |
| Panasonic Corp. | 1,132,900 | 10,745,609 | |
| Persimmon PLC | 457,155 | 16,901,879 | |
| Redrow PLC | 71,328 | 692,980 | |
| Sekisui House Ltd. | 172,700 | 3,389,634 | |
| Sony Corp. | 430,400 | 26,533,248 | |
| Taylor Wimpey PLC | 1,088,460 | 2,874,163 | |
| Vistry Group PLC | 7,815 | 129,329 | |
| 65,065,273 | |||
| Internet & Direct Marketing Retail - 0.3% | |||
| Alibaba Group Holding Ltd. sponsored ADR (a) | 160,649 | 33,414,992 | |
| ASOS PLC (a) | 145,607 | 5,724,340 | |
| Rakuten, Inc. | 1,181,000 | 9,887,289 | |
| Zalando SE (a)(b) | 111,006 | 4,960,513 | |
| 53,987,134 | |||
| Leisure Products - 0.1% | |||
| Sega Sammy Holdings, Inc. | 568,900 | 7,505,514 | |
| Technogym SpA (b) | 186,086 | 1,965,149 | |
| 9,470,663 | |||
| Multiline Retail - 0.1% | |||
| Debenhams PLC (a)(d) | 913,233 | 12 | |
| Lojas Renner SA | 177,770 | 2,118,818 | |
| Magazine Luiza SA | 306,200 | 3,459,206 | |
| Wesfarmers Ltd. | 125,728 | 3,329,459 | |
| 8,907,495 | |||
| Specialty Retail - 0.2% | |||
| Adastria Co. Ltd. | 23,300 | 378,036 | |
| Dufry AG | 30,080 | 2,207,457 | |
| Dunelm Group PLC | 124,992 | 1,784,352 | |
| EDION Corp. | 21,900 | 183,955 | |
| Esprit Holdings Ltd. (a) | 2,061,800 | 343,854 | |
| Gulliver International Co. Ltd. | 58,900 | 279,592 | |
| H&M Hennes & Mauritz AB (B Shares) | 287,237 | 5,212,809 | |
| John David Group PLC | 75,479 | 722,047 | |
| Jumbo SA | 8,796 | 138,958 | |
| Kingfisher PLC | 2,861,440 | 7,020,262 | |
| Kingfisher PLC ADR | 61,868 | 298,977 | |
| Mekonomen AB | 72,028 | 569,605 | |
| Mr Price Group Ltd. | 104,681 | 1,028,157 | |
| Pets At Home Group PLC | 58,706 | 196,273 | |
| Premier Investments Ltd. | 20,331 | 223,304 | |
| Super Retail Group Ltd. | 116,970 | 617,983 | |
| USS Co. Ltd. | 711,400 | 11,252,071 | |
| WH Smith PLC | 90,300 | 2,262,402 | |
| 34,720,094 | |||
| Textiles, Apparel & Luxury Goods - 1.3% | |||
| adidas AG | 77,107 | 21,709,337 | |
| adidas AG sponsored ADR | 500 | 69,580 | |
| Burberry Group PLC | 250,521 | 5,398,678 | |
| Compagnie Financiere Richemont SA Series A | 558,528 | 38,287,737 | |
| ECLAT Textile Co. Ltd. | 130,000 | 1,523,139 | |
| Essilor International SA | 171,295 | 23,481,074 | |
| Gildan Activewear, Inc. | 41,204 | 997,983 | |
| Hermes International SCA | 5,789 | 4,083,542 | |
| Kering SA | 34,069 | 19,211,648 | |
| Li Ning Co. Ltd. | 1,875,500 | 4,932,360 | |
| lululemon athletica, Inc. (a) | 35,794 | 7,781,974 | |
| LVMH Moet Hennessy Louis Vuitton SE | 106,220 | 44,328,859 | |
| Moncler SpA | 237,059 | 9,328,509 | |
| Pandora A/S | 8,124 | 366,087 | |
| Puma AG | 94,657 | 7,338,975 | |
| Samsonite International SA (b) | 1,815,000 | 3,143,361 | |
| Seiko Holdings Corp. | 35,900 | 696,632 | |
| Shenzhou International Group Holdings Ltd. | 291,000 | 3,574,503 | |
| Swatch Group AG (Bearer) (Reg.) | 5,657 | 244,722 | |
| Titan Co. Ltd. | 144,171 | 2,493,314 | |
| 198,992,014 | |||
| TOTAL CONSUMER DISCRETIONARY | 608,825,895 | ||
| CONSUMER STAPLES - 6.6% | |||
| Beverages - 1.3% | |||
| Carlsberg A/S Series B | 18,803 | 2,486,843 | |
| Coca-Cola European Partners PLC | 54,937 | 2,799,590 | |
| Coca-Cola West Co. Ltd. | 154,900 | 3,568,760 | |
| Diageo PLC | 1,785,141 | 63,693,081 | |
| Fever-Tree Drinks PLC | 61,985 | 1,014,280 | |
| Heineken Holding NV | 126,096 | 11,197,023 | |
| Heineken NV (Bearer) | 283,089 | 28,204,721 | |
| ITO EN Ltd. | 446,200 | 19,691,378 | |
| Kirin Holdings Co. Ltd. | 478,000 | 9,195,717 | |
| Kweichow Moutai Co. Ltd. (A Shares) | 33,807 | 5,110,734 | |
| Pernod Ricard SA | 267,427 | 43,610,419 | |
| Royal Unibrew A/S | 27,863 | 2,410,585 | |
| 192,983,131 | |||
| Food & Staples Retailing - 0.5% | |||
| Alimentation Couche-Tard, Inc. Class B (sub. vtg.) | 263,611 | 8,005,054 | |
| Bidcorp Ltd. | 77,956 | 1,410,583 | |
| Carrefour SA | 1,045,423 | 18,055,514 | |
| Coles Group Ltd. | 322,243 | 2,983,037 | |
| Kato Sangyo | 7,800 | 217,671 | |
| Kobe Bussan Co. Ltd. | 8,200 | 299,156 | |
| Matsumotokiyoshi Holdings Co. Ltd. | 97,800 | 3,205,294 | |
| Qol Holdings Co. Ltd. | 16,800 | 193,451 | |
| Seven & i Holdings Co. Ltd. | 712,300 | 24,408,129 | |
| Seven & i Holdings Co. Ltd. ADR | 4,000 | 67,400 | |
| Tesco PLC | 4,688,800 | 13,970,444 | |
| Welcia Holdings Co. Ltd. | 60,200 | 3,627,851 | |
| Woolworths Group Ltd. | 135,277 | 3,419,297 | |
| Yokohama Reito Co. Ltd. | 10,300 | 81,457 | |
| 79,944,338 | |||
| Food Products - 2.3% | |||
| AarhusKarlshamn AB | 80,492 | 1,389,788 | |
| Aryzta AG (a) | 4,073,531 | 3,508,015 | |
| Associated British Foods PLC | 59,014 | 1,723,154 | |
| Ausnutria Dairy Hunan Co. Ltd. (H Shares) (c) | 88,000 | 142,019 | |
| Bakkafrost | 25,595 | 1,626,293 | |
| China Mengniu Dairy Co. Ltd. | 922,000 | 3,305,953 | |
| Danone SA | 850,821 | 60,049,683 | |
| Ezaki Glico Co. Ltd. | 216,700 | 8,930,387 | |
| JBS SA | 38,600 | 195,939 | |
| Kerry Group PLC Class A | 217,620 | 27,765,923 | |
| Kotobuki Spirits Co. Ltd. | 4,900 | 235,778 | |
| La Doria SpA | 17,325 | 157,402 | |
| Lindt & Spruengli AG (participation certificate) | 217 | 1,698,987 | |
| Marine Harvest ASA | 289,900 | 6,141,515 | |
| Nestle SA (Reg. S) | 1,924,498 | 198,042,047 | |
| New Hampshire Foods Ltd. | 45,000 | 1,698,034 | |
| Nissin Food Holdings Co. Ltd. | 84,100 | 6,627,573 | |
| Toyo Suisan Kaisha Ltd. | 492,900 | 19,535,949 | |
| Vitasoy International Holdings Ltd. | 296,000 | 1,061,347 | |
| WH Group Ltd. (b) | 2,001,000 | 2,033,088 | |
| WH Group Ltd. ADR | 4,700 | 95,645 | |
| Wilmar International Ltd. | 2,128,200 | 6,065,729 | |
| 352,030,248 | |||
| Household Products - 0.5% | |||
| Colgate-Palmolive Co. | 391,834 | 26,476,223 | |
| Reckitt Benckiser Group PLC | 679,436 | 50,205,459 | |
| Unicharm Corp. | 5,100 | 165,398 | |
| 76,847,080 | |||
| Personal Products - 1.5% | |||
| Kao Corp. | 645,100 | 47,057,730 | |
| Kobayashi Pharmaceutical Co. Ltd. | 268,700 | 19,555,859 | |
| Kose Corp. | 30,900 | 3,707,083 | |
| L'Oreal SA | 276,611 | 74,348,709 | |
| LG Household & Health Care Ltd. | 536 | 544,989 | |
| Pola Orbis Holdings, Inc. | 85,000 | 1,626,553 | |
| Rohto Pharmaceutical Co. Ltd. | 437,500 | 12,452,485 | |
| Shiseido Co. Ltd. | 143,300 | 8,526,788 | |
| Unilever NV | 149,716 | 7,904,598 | |
| Unilever PLC | 793,173 | 42,640,896 | |
| Unilever PLC sponsored ADR | 78,987 | 4,259,769 | |
| 222,625,459 | |||
| Tobacco - 0.5% | |||
| British American Tobacco PLC (United Kingdom) | 1,367,445 | 54,067,763 | |
| Imperial Brands PLC | 377,000 | 7,616,152 | |
| Japan Tobacco, Inc. | 412,900 | 8,207,469 | |
| 69,891,384 | |||
| TOTAL CONSUMER STAPLES | 994,321,640 | ||
| ENERGY - 1.7% | |||
| Energy Equipment & Services - 0.1% | |||
| BW Offshore Ltd. (a)(c) | 188,926 | 750,442 | |
| Core Laboratories NV | 115,795 | 3,107,938 | |
| The Drilling Co. of 1972 A/S (a) | 47,800 | 2,116,632 | |
| WorleyParsons Ltd. | 625,240 | 5,099,554 | |
| 11,074,566 | |||
| Oil, Gas & Consumable Fuels - 1.6% | |||
| BP PLC | 8,260,270 | 42,917,126 | |
| BW Energy Ltd. (c) | 1,681 | 3,058 | |
| BW LPG Ltd. (b) | 37,890 | 236,524 | |
| Cairn Energy PLC (a) | 2,762,006 | 5,021,296 | |
| Eni SpA | 1,415,139 | 17,631,419 | |
| EnQuest PLC (a) | 797,199 | 214,229 | |
| Equinor ASA | 508,043 | 7,825,019 | |
| Galp Energia SGPS SA Class B | 754,173 | 10,403,211 | |
| Gazprom OAO | 1,586,840 | 4,890,239 | |
| Gulf Keystone Petroleum Ltd. | 8,842 | 16,972 | |
| Hindustan Petroleum Corp. Ltd. | 151,255 | 411,922 | |
| Idemitsu Kosan Co. Ltd. | 270,000 | 6,653,625 | |
| Japan Petroleum Exploration Co. Ltd. | 26,600 | 569,930 | |
| JX Holdings, Inc. | 2,677,600 | 10,773,951 | |
| Lukoil PJSC | 17,307 | 1,497,850 | |
| Lundin Petroleum AB | 12,663 | 361,507 | |
| Neste Oyj | 252,996 | 10,111,273 | |
| Oil Search Ltd. ADR | 1,563,975 | 5,593,495 | |
| OMV AG | 30,038 | 1,258,051 | |
| Ovintiv, Inc. (c) | 1,101,978 | 12,733,603 | |
| Parkland Fuel Corp. (c) | 45,837 | 1,441,104 | |
| Premier Oil PLC (a) | 406,018 | 413,504 | |
| Reliance Industries Ltd. | 412,307 | 7,551,961 | |
| Royal Dutch Shell PLC: | |||
| Class B sponsored ADR (c) | 206,700 | 9,204,351 | |
| Class B (United Kingdom) | 1,111,199 | 24,085,505 | |
| Santos Ltd. | 1,366,625 | 6,080,666 | |
| TC Energy Corp. | 70,071 | 3,652,201 | |
| Total SA | 1,130,888 | 48,879,659 | |
| VERBIO Vereinigte BioEnergie AG | 52,208 | 555,260 | |
| Vopak NV | 8,332 | 396,642 | |
| 241,385,153 | |||
| TOTAL ENERGY | 252,459,719 | ||
| FINANCIALS - 8.2% | |||
| Banks - 3.5% | |||
| ABN AMRO Group NV GDR (b) | 381,648 | 5,234,432 | |
| AIB Group PLC | 5,239,150 | 12,225,045 | |
| Australia & New Zealand Banking Group Ltd. | 411,110 | 6,629,944 | |
| Banco Bilbao Vizcaya Argentaria SA | 2,689,637 | 12,881,445 | |
| Banco de Sabadell SA | 401,417 | 352,320 | |
| Banco Santander SA (Spain) | 1,299,044 | 4,801,733 | |
| Barclays PLC | 14,831,504 | 28,424,462 | |
| Barclays PLC sponsored ADR | 156,300 | 1,203,510 | |
| BNP Paribas SA | 1,060,966 | 51,499,618 | |
| BNP Paribas SA ADR | 5,700 | 137,883 | |
| CaixaBank SA | 4,557,320 | 11,713,374 | |
| Canadian Imperial Bank of Commerce | 114,559 | 8,719,201 | |
| Chiba Bank Ltd. | 704,900 | 3,483,327 | |
| China Merchants Bank Co. Ltd. (H Shares) | 2,357,500 | 11,114,577 | |
| Commerzbank AG | 230,585 | 1,332,606 | |
| Credicorp Ltd. (United States) | 30,380 | 5,506,983 | |
| Danske Bank A/S | 633,635 | 9,823,224 | |
| DBS Group Holdings Ltd. | 925,800 | 16,024,868 | |
| DNB ASA | 639,769 | 10,715,684 | |
| Erste Group Bank AG | 83,197 | 2,848,119 | |
| Fukuoka Financial Group, Inc. | 9,300 | 141,750 | |
| Grupo Financiero Banorte S.A.B. de CV Series O | 1,011,132 | 5,478,185 | |
| HDFC Bank Ltd. | 955,372 | 15,601,046 | |
| ING Groep NV: | |||
| (Certificaten Van Aandelen) | 2,773,798 | 26,561,445 | |
| sponsored ADR | 88,168 | 836,714 | |
| Intesa Sanpaolo SpA | 10,566,189 | 25,687,645 | |
| Jyske Bank A/S (Reg.) | 87,791 | 3,023,596 | |
| KB Financial Group, Inc. | 27,839 | 890,078 | |
| KBC Groep NV | 326,981 | 21,785,582 | |
| Lloyds Banking Group PLC | 12,104,902 | 7,857,257 | |
| Mebuki Financial Group, Inc. | 1,164,500 | 2,278,041 | |
| Mediobanca SpA | 1,101,014 | 10,011,991 | |
| Mitsubishi UFJ Financial Group, Inc. | 4,792,000 | 23,413,519 | |
| National Bank of Canada | 176,800 | 9,190,044 | |
| Nordea Bank ABP: | |||
| ADR | 14,300 | 111,540 | |
| (Stockholm Stock Exchange) | 120,082 | 947,727 | |
| North Pacific Bank Ltd. | 1,036,500 | 1,960,375 | |
| PT Bank Central Asia Tbk | 5,580,100 | 12,231,688 | |
| PT Bank Rakyat Indonesia Tbk | 21,536,900 | 6,289,570 | |
| Societe Generale Series A | 141,469 | 4,008,757 | |
| Standard Chartered PLC (United Kingdom) | 671,119 | 4,856,278 | |
| Sumitomo Mitsui Financial Group, Inc. | 937,100 | 29,734,006 | |
| Sumitomo Mitsui Trust Holdings, Inc. | 153,800 | 5,221,439 | |
| Svenska Handelsbanken AB (A Shares) | 1,945,863 | 19,675,933 | |
| Swedbank AB (A Shares) | 453,172 | 6,882,870 | |
| Sydbank A/S | 116,406 | 2,153,798 | |
| The Hachijuni Bank Ltd. | 691,500 | 2,365,692 | |
| The Toronto-Dominion Bank | 172,792 | 8,887,733 | |
| TISCO Financial Group PCL | 704,900 | 2,200,718 | |
| Turkiye Halk Bankasi A/S (a) | 484,110 | 464,628 | |
| Turkiye Is Bankasi A/S Series C (a) | 1,477,591 | 1,354,098 | |
| UniCredit SpA | 3,735,482 | 48,035,483 | |
| United Overseas Bank Ltd. | 448,600 | 7,884,075 | |
| Valiant Holding AG | 1,991 | 198,150 | |
| Yapi ve Kredi Bankasi A/S (a) | 272,103 | 100,007 | |
| 522,993,813 | |||
| Capital Markets - 1.5% | |||
| 3i Group PLC | 700,195 | 9,216,799 | |
| Anima Holding SpA (b) | 14,681 | 64,817 | |
| Ashmore Group PLC | 277,411 | 1,675,740 | |
| ASX Ltd. | 27,743 | 1,339,945 | |
| Azimut Holding SpA | 120,924 | 2,578,549 | |
| Banca Generali SpA | 118,904 | 3,696,138 | |
| BM&F BOVESPA SA | 557,300 | 5,981,887 | |
| Brewin Dolphin Holding PLC | 186,156 | 731,012 | |
| Brookfield Asset Management, Inc. (Canada) Class A | 269,298 | 16,104,713 | |
| BT Investment Management Ltd. | 105,054 | 506,437 | |
| Close Brothers Group PLC | 72,649 | 1,209,132 | |
| Daiwa Securities Group, Inc. | 1,678,000 | 7,143,868 | |
| Deutsche Borse AG | 66,778 | 10,507,768 | |
| Euronext NV (b) | 328,698 | 27,403,766 | |
| GAM Holding Ltd. (a) | 205,098 | 694,480 | |
| Hargreaves Lansdown PLC | 50,347 | 1,010,732 | |
| HFA Holdings Ltd. | 58,623 | 114,570 | |
| Hithink RoyalFlush Information Network Co. Ltd. (A Shares) | 103,658 | 1,830,781 | |
| Hong Kong Exchanges and Clearing Ltd. | 309,400 | 10,153,242 | |
| IG Group Holdings PLC | 620,955 | 5,417,156 | |
| Intermediate Capital Group PLC | 317,536 | 6,567,009 | |
| JAFCO Co. Ltd. | 18,300 | 696,472 | |
| Julius Baer Group Ltd. | 403,812 | 16,987,600 | |
| Jupiter Fund Management PLC | 142,203 | 556,157 | |
| London Stock Exchange Group PLC | 113,522 | 11,150,590 | |
| Macquarie Group Ltd. | 284,402 | 24,980,451 | |
| Partners Group Holding AG | 11,152 | 9,677,944 | |
| President Securities Corp. | 619,000 | 280,780 | |
| St. James's Place Capital PLC | 351,966 | 4,666,667 | |
| Standard Life PLC | 499,887 | 1,791,772 | |
| Tullett Prebon PLC | 85,526 | 403,525 | |
| UBS Group AG | 3,470,749 | 38,222,143 | |
| XP, Inc. Class A (a) | 37,216 | 1,289,534 | |
| 224,652,176 | |||
| Consumer Finance - 0.1% | |||
| AEON Financial Service Co. Ltd. | 712,200 | 10,353,510 | |
| Cembra Money Bank AG | 1,849 | 208,114 | |
| Flexigroup Ltd. | 163,343 | 163,339 | |
| JACCS Co. Ltd. | 5,400 | 108,441 | |
| Resurs Holding AB (b) | 23,123 | 125,165 | |
| 10,958,569 | |||
| Diversified Financial Services - 0.4% | |||
| Banca Farmafactoring SpA (b) | 64,610 | 397,395 | |
| Banca Mediolanum S.p.A. | 80,478 | 657,752 | |
| Challenger Ltd. | 1,773,287 | 10,500,839 | |
| Element Financial Corp. | 1,024,700 | 9,588,551 | |
| EXOR NV | 35,000 | 2,499,640 | |
| Fuyo General Lease Co. Ltd. | 4,500 | 254,079 | |
| Grenkeleasing AG (c) | 19,530 | 1,829,086 | |
| Groupe Bruxelles Lambert SA | 80,200 | 7,290,565 | |
| Investor AB (B Shares) | 133,500 | 6,686,953 | |
| Lundbergfoeretagen AB | 11,523 | 477,989 | |
| M&G PLC (a) | 805,040 | 2,102,205 | |
| Mitsubishi UFJ Lease & Finance Co. Ltd. | 725,400 | 4,149,562 | |
| ORIX Corp. | 907,700 | 14,659,868 | |
| Plus500 Ltd. | 16,664 | 204,980 | |
| Zenkoku Hosho Co. Ltd. | 46,100 | 1,728,857 | |
| 63,028,321 | |||
| Insurance - 2.7% | |||
| AEGON NV | 473,100 | 1,610,379 | |
| AEGON NV (NY Reg.) | 443,060 | 1,497,543 | |
| AIA Group Ltd. | 4,963,600 | 49,747,411 | |
| Allianz SE | 148,376 | 32,323,696 | |
| Aon PLC | 95,179 | 19,797,232 | |
| Assicurazioni Generali SpA | 194,091 | 3,503,603 | |
| Aviva PLC | 6,994,029 | 32,036,232 | |
| AXA SA | 972,900 | 22,614,416 | |
| BB Seguridade Participacoes SA | 156,600 | 1,115,345 | |
| Beazley PLC | 344,926 | 2,391,069 | |
| CNP Assurances | 97,156 | 1,526,931 | |
| Coface SA | 54,573 | 599,727 | |
| Dai-ichi Mutual Life Insurance Co. | 313,300 | 4,294,586 | |
| Direct Line Insurance Group PLC | 2,286,622 | 9,114,909 | |
| Fairfax Financial Holdings Ltd. (sub. vtg.) | 17,993 | 7,750,965 | |
| Helvetia Holding AG (Reg.) | 2,499 | 332,922 | |
| Hiscox Ltd. | 1,436,675 | 22,868,126 | |
| IRB Brasil Resseguros SA | 343,300 | 2,552,545 | |
| Legal & General Group PLC | 662,178 | 2,243,376 | |
| Manulife Financial Corp. | 533,436 | 8,965,778 | |
| MAPFRE SA (Reg.) | 341,254 | 767,588 | |
| Menora Mivtachim Holdings Ltd. | 9,590 | 113,194 | |
| MS&AD Insurance Group Holdings, Inc. | 303,600 | 9,803,809 | |
| MS&AD Insurance Group Holdings, Inc. ADR | 5,200 | 82,316 | |
| Muenchener Rueckversicherungs-Gesellschaft AG in Muenchen | 54,836 | 14,208,983 | |
| Muenchener Rueckversicherungs-Gesellschaft AG in Muenchen ADR | 7,100 | 181,263 | |
| NKSJ Holdings, Inc. | 352,200 | 13,113,621 | |
| NN Group NV | 76,892 | 2,628,029 | |
| PICC Property & Casualty Co. Ltd. (H Shares) | 8,006,000 | 8,288,444 | |
| Ping An Insurance Group Co. of China Ltd. (H Shares) | 1,966,500 | 22,403,147 | |
| Poste Italiane SpA (b) | 134,883 | 1,444,943 | |
| Prudential PLC | 1,409,299 | 23,428,848 | |
| RSA Insurance Group PLC | 671,045 | 4,488,340 | |
| Saga PLC | 297,511 | 123,866 | |
| Sampo Oyj (A Shares) | 134,216 | 5,484,329 | |
| Societa Cattolica Di Assicurazioni SCRL | 63,075 | 463,792 | |
| Storebrand ASA (A Shares) | 1,042,912 | 6,688,990 | |
| Sun Life Financial, Inc. | 275,376 | 11,897,228 | |
| Swiss Life Holding AG | 7,416 | 3,404,819 | |
| Swiss Re Ltd. | 81,552 | 7,758,085 | |
| T&D Holdings, Inc. | 32,100 | 316,953 | |
| Talanx AG | 84,700 | 3,783,454 | |
| Tokio Marine Holdings, Inc. | 310,800 | 16,715,657 | |
| Tokio Marine Holdings, Inc. ADR | 2,184 | 115,665 | |
| Tryg A/S | 52,862 | 1,483,229 | |
| Unipol Gruppo SpA | 156,166 | 778,106 | |
| Zurich Insurance Group Ltd. | 57,528 | 22,276,677 | |
| 409,130,166 | |||
| Thrifts & Mortgage Finance - 0.0% | |||
| Indiabulls Housing Finance Ltd. | 33,215 | 128,141 | |
| Paragon Banking Group PLC | 80,784 | 475,171 | |
| 603,312 | |||
| TOTAL FINANCIALS | 1,231,366,357 | ||
| HEALTH CARE - 6.0% | |||
| Biotechnology - 0.2% | |||
| Abcam PLC | 86,935 | 1,294,662 | |
| Ascendis Pharma A/S sponsored ADR (a) | 17,631 | 2,298,730 | |
| CSL Ltd. | 84,112 | 16,955,691 | |
| Genmab A/S (a) | 31,557 | 7,136,097 | |
| Genmab A/S ADR | 25,500 | 580,890 | |
| Seegene, Inc. (a) | 17,776 | 540,299 | |
| Vitrolife AB | 64,973 | 1,103,641 | |
| 29,910,010 | |||
| Health Care Equipment & Supplies - 1.3% | |||
| Alcon, Inc. (Switzerland) (a) | 55,544 | 3,396,594 | |
| ASAHI INTECC Co. Ltd. | 182,600 | 4,377,931 | |
| Carl Zeiss Meditec AG | 29,087 | 3,094,393 | |
| Coloplast A/S Series B | 79,089 | 10,617,339 | |
| Elekta AB (B Shares) (c) | 431,483 | 4,579,751 | |
| GN Store Nord A/S | 109,598 | 6,115,796 | |
| Hoya Corp. | 230,500 | 20,534,716 | |
| Koninklijke Philips Electronics NV | 1,090,021 | 46,679,270 | |
| Koninklijke Philips Electronics NV (depositary receipt) (NY Reg.) (c) | 28,240 | 1,211,496 | |
| Nihon Kohden Corp. | 490,300 | 14,591,721 | |
| Olympus Corp. | 1,307,000 | 23,774,652 | |
| Osstem Implant Co. Ltd. (a) | 12,166 | 329,260 | |
| Siemens Healthineers AG (b) | 165,824 | 6,780,194 | |
| Smith & Nephew PLC | 513,372 | 11,517,734 | |
| Terumo Corp. | 1,142,500 | 36,840,488 | |
| 194,441,335 | |||
| Health Care Providers & Services - 0.4% | |||
| Aier Eye Hospital Group Co. Ltd. (A Shares) | 496,000 | 2,837,549 | |
| Amplifon SpA | 90,241 | 2,588,879 | |
| Australian Pharmaceutical Industries Ltd. | 80,943 | 63,013 | |
| Estia Health Ltd. | 40,075 | 50,125 | |
| Fresenius SE & Co. KGaA | 462,867 | 21,951,512 | |
| Medipal Holdings Corp. | 140,000 | 2,559,614 | |
| Notre Dame Intermedica Participacoes SA | 234,000 | 3,308,621 | |
| Orpea | 25,063 | 3,252,019 | |
| Sigma Healthcare Ltd. | 368,393 | 133,194 | |
| Sinopharm Group Co. Ltd. (H Shares) | 1,896,021 | 5,849,815 | |
| Sonic Healthcare Ltd. | 389,490 | 7,307,518 | |
| Spire Healthcare Group PLC (b) | 91,336 | 136,052 | |
| Suzuken Co. Ltd. | 26,200 | 868,394 | |
| 50,906,305 | |||
| Life Sciences Tools & Services - 0.2% | |||
| Clinigen Group PLC | 36,651 | 339,090 | |
| Evotec OAI AG (a)(c) | 112,665 | 2,743,044 | |
| ICON PLC (a) | 40,196 | 6,272,988 | |
| Lonza Group AG | 47,898 | 19,113,111 | |
| Sartorius Stedim Biotech | 19,500 | 3,735,303 | |
| Tecan Group AG | 6,373 | 1,784,526 | |
| 33,988,062 | |||
| Pharmaceuticals - 3.9% | |||
| Astellas Pharma, Inc. | 2,434,400 | 38,346,427 | |
| AstraZeneca PLC: | |||
| (United Kingdom) | 250,254 | 21,963,526 | |
| sponsored ADR | 185,011 | 8,103,482 | |
| Bayer AG | 992,032 | 72,146,571 | |
| Bayer AG sponsored ADR | 88,631 | 1,597,131 | |
| Chugai Pharmaceutical Co. Ltd. | 43,500 | 4,724,666 | |
| Daiichi Sankyo Kabushiki Kaisha | 53,800 | 3,287,057 | |
| Dainippon Sumitomo Pharma Co. Ltd. | 10,400 | 150,514 | |
| Eisai Co. Ltd. | 35,600 | 2,634,189 | |
| GlaxoSmithKline PLC sponsored ADR | 347,326 | 14,077,123 | |
| H Lundbeck A/S | 7,691 | 268,132 | |
| Ipsen SA | 48,526 | 3,172,132 | |
| Kyowa Hakko Kirin Co., Ltd. | 312,000 | 7,434,081 | |
| Novartis AG | 1,116,834 | 93,951,706 | |
| Novartis AG sponsored ADR | 25,079 | 2,105,633 | |
| Novo Nordisk A/S: | |||
| Series B | 835,499 | 48,951,017 | |
| Series B sponsored ADR | 47,419 | 2,756,466 | |
| Ono Pharmaceutical Co. Ltd. | 65,800 | 1,348,211 | |
| Orion Oyj (B Shares) | 32,556 | 1,299,323 | |
| Otsuka Holdings Co. Ltd. | 284,000 | 10,742,815 | |
| Roche Holding AG: | |||
| (participation certificate) | 378,815 | 121,801,812 | |
| sponsored ADR | 133,321 | 5,318,175 | |
| Sanofi SA | 376,128 | 35,079,887 | |
| Santen Pharmaceutical Co. Ltd. | 2,332,900 | 37,461,365 | |
| Shionogi & Co. Ltd. | 100,400 | 5,404,535 | |
| Takeda Pharmaceutical Co. Ltd. | 1,272,900 | 43,957,795 | |
| Takeda Pharmaceutical Co. Ltd. ADR | 226,271 | 3,914,488 | |
| UCB SA | 11,909 | 1,102,606 | |
| 593,100,865 | |||
| TOTAL HEALTH CARE | 902,346,577 | ||
| INDUSTRIALS - 8.7% | |||
| Aerospace & Defense - 0.7% | |||
| Airbus Group NV | 168,412 | 20,327,096 | |
| Chemring Group PLC | 41,521 | 128,941 | |
| Dassault Aviation SA | 3,000 | 3,141,872 | |
| Leonardo SpA | 159,766 | 1,638,487 | |
| Meggitt PLC | 1,585,449 | 11,164,869 | |
| MTU Aero Engines Holdings AG | 45,793 | 11,330,227 | |
| QinetiQ Group PLC | 234,119 | 1,047,893 | |
| Rolls-Royce Holdings PLC | 4,206,780 | 33,854,398 | |
| Safran SA | 134,981 | 18,685,205 | |
| Senior Engineering Group PLC | 325,958 | 593,822 | |
| 101,912,810 | |||
| Air Freight & Logistics - 0.3% | |||
| Deutsche Post AG | 858,133 | 25,828,042 | |
| DSV A/S | 99,962 | 10,142,607 | |
| Kintetsu World Express, Inc. | 12,000 | 188,355 | |
| Yamato Holdings Co. Ltd. | 272,000 | 4,292,082 | |
| 40,451,086 | |||
| Airlines - 0.4% | |||
| Air France KLM (Reg.) (a) | 1,225,067 | 9,355,959 | |
| Deutsche Lufthansa AG | 228,439 | 3,021,084 | |
| Japan Airlines Co. Ltd. | 288,700 | 7,104,895 | |
| Qantas Airways Ltd. | 2,586,208 | 9,316,862 | |
| Ryanair Holdings PLC sponsored ADR (a) | 512,451 | 36,732,488 | |
| 65,531,288 | |||
| Building Products - 0.5% | |||
| Agc, Inc. | 49,700 | 1,428,426 | |
| Agc, Inc. ADR | 9,900 | 54,054 | |
| ASSA ABLOY AB (B Shares) | 71,132 | 1,599,698 | |
| Belimo Holding AG (Reg.) | 233 | 1,523,769 | |
| Central Glass Co. Ltd. | 10,400 | 197,856 | |
| Compagnie de St. Gobain | 146,589 | 5,175,977 | |
| Daikin Industries Ltd. | 231,100 | 31,549,671 | |
| Geberit AG (Reg.) | 21,394 | 10,675,631 | |
| GWA Group Ltd. | 38,814 | 82,683 | |
| Kingspan Group PLC (Ireland) | 108,116 | 6,808,132 | |
| Nibe Industrier AB (B Shares) | 122,992 | 2,002,513 | |
| Sanwa Holdings Corp. | 78,200 | 719,214 | |
| Toto Ltd. | 315,400 | 11,974,439 | |
| ZBOM Home Collection Co. Ltd. | 96,400 | 275,194 | |
| 74,067,257 | |||
| Commercial Services & Supplies - 0.5% | |||
| Aggreko PLC | 90,090 | 787,097 | |
| AMA Group Ltd. | 79,463 | 26,918 | |
| Babcock International Group PLC | 63,222 | 363,876 | |
| BIC SA | 12,406 | 754,143 | |
| Brambles Ltd. | 1,802,711 | 14,045,538 | |
| Country Garden Services Holdings Co. Ltd. | 825,000 | 3,217,447 | |
| Downer EDI Ltd. | 151,668 | 563,183 | |
| ISS Holdings A/S | 36,857 | 654,927 | |
| Nippon Parking Development Co. Ltd. | 264,300 | 296,498 | |
| Rentokil Initial PLC | 1,927,471 | 12,059,901 | |
| Ritchie Bros. Auctioneers, Inc. | 188,801 | 7,487,336 | |
| Secom Co. Ltd. | 248,300 | 19,740,149 | |
| SG Fleet Group Ltd. | 74,291 | 101,633 | |
| Shanks Group PLC | 362,138 | 168,911 | |
| Sohgo Security Services Co., Ltd. | 155,100 | 7,261,775 | |
| Tomra Systems ASA | 29,931 | 963,031 | |
| Toppan Printing Co. Ltd. | 73,900 | 1,288,762 | |
| 69,781,125 | |||
| Construction & Engineering - 0.1% | |||
| Balfour Beatty PLC | 4,484,136 | 14,261,813 | |
| JGC Corp. | 50,000 | 614,222 | |
| 14,876,035 | |||
| Electrical Equipment - 1.6% | |||
| ABB Ltd. (Reg.) | 2,765,634 | 59,929,129 | |
| Denyo Co. Ltd. | 12,000 | 206,490 | |
| Fuji Electric Co. Ltd. | 18,500 | 508,210 | |
| Huber+Suhner AG | 3,274 | 219,716 | |
| Legrand SA | 665,932 | 51,111,562 | |
| Mabuchi Motor Co. Ltd. | 27,700 | 961,770 | |
| Melrose Industries PLC | 7,177,970 | 19,851,549 | |
| Mitsubishi Electric Corp. | 960,700 | 12,211,382 | |
| Nexans SA | 14,913 | 687,452 | |
| Philips Lighting NV (b) | 35,373 | 1,053,991 | |
| Prysmian SpA | 492,162 | 11,757,432 | |
| Sanyo Denki Co. Ltd. | 3,600 | 146,690 | |
| Schneider Electric SA | 764,696 | 77,692,699 | |
| Siemens Gamesa Renewable Energy SA | 488,300 | 7,920,299 | |
| Tatsuta Electric Wire & Cable Co. Ltd. | 29,600 | 141,880 | |
| Vestas Wind Systems A/S | 22,212 | 2,143,021 | |
| 246,543,272 | |||
| Industrial Conglomerates - 0.8% | |||
| Bidvest Group Ltd. | 77,956 | 908,695 | |
| CJ Corp. | 3,761 | 252,120 | |
| CK Hutchison Holdings Ltd. | 2,510,000 | 21,847,787 | |
| DCC PLC (United Kingdom) | 219,085 | 15,691,539 | |
| Lifco AB | 39,638 | 2,086,069 | |
| Nolato AB (B Shares) | 35,056 | 1,859,180 | |
| Siemens AG | 685,528 | 70,521,190 | |
| Toshiba Corp. | 391,390 | 10,613,905 | |
| 123,780,485 | |||
| Machinery - 1.7% | |||
| Andritz AG | 12,954 | 458,412 | |
| Atlas Copco AB (A Shares) | 468,028 | 16,687,511 | |
| Bodycote PLC | 37,459 | 368,514 | |
| CNH Industrial NV | 181,133 | 1,687,431 | |
| Epiroc AB Class A | 320,634 | 3,703,686 | |
| Fanuc Corp. | 264,000 | 43,352,477 | |
| Fujitec Co. Ltd. | 13,600 | 189,260 | |
| Furukawa Co. Ltd. | 8,900 | 100,172 | |
| GEA Group AG | 802,612 | 21,477,022 | |
| Glory Ltd. | 31,400 | 836,673 | |
| Harmonic Drive Systems, Inc. (c) | 52,400 | 2,205,600 | |
| Hino Motors Ltd. | 149,800 | 1,238,843 | |
| IMI PLC | 1,102,510 | 14,272,069 | |
| Interpump Group SpA | 12,281 | 371,804 | |
| Interroll Holding AG | 323 | 577,121 | |
| Japan Steel Works Ltd. | 44,400 | 648,340 | |
| JTEKT Corp. | 73,600 | 718,531 | |
| Kawasaki Heavy Industries Ltd. | 54,900 | 997,627 | |
| KION Group AG | 28,898 | 1,562,902 | |
| Kitz Corp. | 37,200 | 222,110 | |
| Knorr-Bremse AG | 46,224 | 4,725,295 | |
| Komatsu Ltd. | 152,300 | 3,043,072 | |
| Komori Corp. | 73,200 | 558,535 | |
| Kone OYJ (B Shares) (c) | 40,787 | 2,310,270 | |
| Kubota Corp. | 960,300 | 13,559,586 | |
| Max Co. Ltd. | 12,800 | 211,593 | |
| Metso Corp. | 37,700 | 1,226,840 | |
| Misumi Group, Inc. | 179,700 | 3,793,593 | |
| Mitsubishi Heavy Industries Ltd. | 18,700 | 592,762 | |
| Mitsuboshi Belting Ltd. | 14,100 | 193,212 | |
| Morgan Advanced Materials PLC | 35,343 | 126,181 | |
| Nachi-Fujikoshi Corp. | 7,400 | 244,243 | |
| Nordson Corp. | 74,706 | 10,854,782 | |
| Noritake Co. Ltd. | 1,100 | 38,754 | |
| NSK Ltd. | 150,900 | 1,157,003 | |
| Rotork PLC | 691,289 | 2,527,729 | |
| Ryobi Ltd. | 14,000 | 182,236 | |
| Schindler Holding AG (participation certificate) | 85,990 | 19,282,691 | |
| Sintokogio Ltd. | 39,800 | 284,497 | |
| SMC Corp. | 76,900 | 30,707,241 | |
| Sodick Co. Ltd. | 27,600 | 185,518 | |
| Spirax-Sarco Engineering PLC | 259,301 | 28,409,941 | |
| Star Micronics Co. Ltd. | 24,900 | 280,027 | |
| Sumitomo Heavy Industries Ltd. | 17,200 | 375,064 | |
| Sunonwealth Electric Machine Industry Co. Ltd. | 441,000 | 567,354 | |
| Techtronic Industries Co. Ltd. | 1,913,000 | 15,473,335 | |
| THK Co. Ltd. | 244,800 | 5,612,742 | |
| Valmet Corp. | 10,419 | 248,768 | |
| VAT Group AG (b) | 16,822 | 2,286,678 | |
| Vesuvius PLC | 32,206 | 176,735 | |
| Volvo AB (A Shares) | 35,385 | 553,979 | |
| Wartsila Corp. | 262,129 | 2,740,564 | |
| 264,206,925 | |||
| Marine - 0.1% | |||
| A.P. Moller - Maersk A/S Series B | 7,639 | 7,708,593 | |
| Professional Services - 1.3% | |||
| 51job, Inc. sponsored ADR (a) | 75,780 | 5,666,071 | |
| Adecco SA (Reg.) | 40,159 | 2,150,792 | |
| Benefit One, Inc. | 123,500 | 1,884,675 | |
| Centre Testing International Group Co. Ltd. (A Shares) | 1,438,500 | 3,349,392 | |
| en-japan, Inc. | 34,300 | 946,382 | |
| Experian PLC | 1,014,216 | 33,757,069 | |
| Experian PLC ADR | 11,200 | 375,088 | |
| Hays PLC | 201,909 | 360,556 | |
| Intertek Group PLC | 295,429 | 20,163,236 | |
| IPH Ltd. | 68,770 | 377,666 | |
| IR Japan Holdings Ltd. | 3,800 | 228,648 | |
| McMillan Shakespeare Ltd. | 17,175 | 121,173 | |
| Meitec Corp. | 27,900 | 1,319,210 | |
| Nihon M&A Center, Inc. | 100,400 | 3,053,143 | |
| Persol Holdings Co., Ltd. | 436,900 | 5,788,338 | |
| Recruit Holdings Co. Ltd. | 254,500 | 8,867,152 | |
| RELX PLC: | |||
| (Euronext N.V.) | 317,042 | 7,627,617 | |
| (London Stock Exchange) | 1,080,406 | 26,140,245 | |
| SEEK Ltd. | 226,749 | 3,054,759 | |
| SGS SA (Reg.) | 10,107 | 25,243,206 | |
| SR Teleperformance SA | 24,756 | 6,039,259 | |
| TechnoPro Holdings, Inc. | 108,100 | 6,434,285 | |
| Thomson Reuters Corp. | 105,189 | 7,814,040 | |
| Tinexta SpA | 15,308 | 208,094 | |
| United Technology Holdings Co. Ltd. | 66,900 | 1,333,534 | |
| Wolters Kluwer NV | 250,972 | 18,466,528 | |
| 190,770,158 | |||
| Road & Rail - 0.3% | |||
| Aurizon Holdings Ltd. | 482,334 | 1,517,666 | |
| Canadian National Railway Co. | 135,806 | 11,513,030 | |
| Canadian Pacific Railway Ltd. | 37,671 | 9,336,570 | |
| Central Japan Railway Co. | 34,400 | 5,670,610 | |
| East Japan Railway Co. | 103,700 | 7,920,906 | |
| Hankyu Hanshin Holdings, Inc. | 57,900 | 1,905,665 | |
| Localiza Rent A Car SA | 227,115 | 2,515,995 | |
| Maruzen Showa Unyu Co. Ltd. | 3,800 | 84,484 | |
| Nikkon Holdings Co. Ltd. | 6,700 | 129,639 | |
| Seibu Holdings, Inc. | 114,400 | 1,618,528 | |
| The Go-Ahead Group PLC | 6,430 | 163,483 | |
| Tokyu Corp. | 54,600 | 838,287 | |
| West Japan Railway Co. | 39,200 | 2,768,641 | |
| 45,983,504 | |||
| Trading Companies & Distributors - 0.3% | |||
| AerCap Holdings NV (a) | 8,600 | 447,888 | |
| Ashtead Group PLC | 199,680 | 6,260,272 | |
| Brenntag AG | 134,228 | 6,090,331 | |
| Daiichi Jitsugyo Co. Ltd. | 2,000 | 61,839 | |
| Indutrade AB | 66,860 | 2,182,863 | |
| Mitsubishi Corp. | 328,900 | 8,202,679 | |
| MonotaRO Co. Ltd. | 84,700 | 1,884,665 | |
| Rexel SA | 465,588 | 5,755,274 | |
| Sumitomo Corp. | 971,400 | 13,909,951 | |
| Toromont Industries Ltd. | 32,324 | 1,598,078 | |
| Toyota Tsusho Corp. | 54,300 | 1,643,700 | |
| 48,037,540 | |||
| Transportation Infrastructure - 0.1% | |||
| Aena Sme SA (b) | 36,281 | 5,843,684 | |
| Airports of Thailand PCL (For. Reg.) | 905,800 | 1,715,422 | |
| Astm SpA | 9,663 | 240,360 | |
| Atlantia SpA | 61,759 | 1,335,772 | |
| Auckland International Airport Ltd. | 251,108 | 1,235,236 | |
| Beijing Capital International Airport Co. Ltd. (H Shares) | 2,992,000 | 2,333,722 | |
| CCR SA | 115,500 | 421,770 | |
| China Merchants Holdings International Co. Ltd. | 2,478,582 | 3,643,945 | |
| Grupo Aeroportuario del Sureste S.A.B. de CV Series B sponsored ADR | 12,201 | 2,037,567 | |
| Guangxi Wuzhou Communications Co. Ltd. (A Shares) | 345,800 | 198,322 | |
| Malaysia Airports Holdings Bhd | 1,226,300 | 1,917,958 | |
| The Sumitomo Warehouse Co. Ltd. | 60,500 | 708,432 | |
| 21,632,190 | |||
| TOTAL INDUSTRIALS | 1,315,282,268 | ||
| INFORMATION TECHNOLOGY - 7.7% | |||
| Communications Equipment - 0.1% | |||
| Ericsson (B Shares) | 1,981,408 | 15,892,344 | |
| Qingdao Eastsoft Communication Technology Co. Ltd. (A Shares) | 92,767 | 215,069 | |
| Raisecom Technology Co. Ltd. | 141,200 | 280,100 | |
| 16,387,513 | |||
| Electronic Equipment & Components - 1.6% | |||
| Alps Electric Co. Ltd. | 120,500 | 1,853,416 | |
| Comet Holding AG | 2,364 | 290,336 | |
| Daeduck Electronics Co. Ltd. | 53,459 | 417,127 | |
| Daiwabo Holdings Co. Ltd. | 27,400 | 1,389,561 | |
| Enplas Corp. | 6,600 | 156,892 | |
| ESPEC Corp. | 15,100 | 278,733 | |
| Halma PLC | 965,226 | 24,256,947 | |
| Hamamatsu Photonics K.K. | 134,000 | 5,199,240 | |
| Hexagon AB (B Shares) | 199,588 | 10,751,631 | |
| Hirose Electric Co. Ltd. | 161,090 | 17,115,626 | |
| Hitachi Ltd. | 1,023,980 | 34,528,233 | |
| Hitachi Ltd. sponsored ADR | 978 | 64,186 | |
| Hosiden Corp. | 13,800 | 119,243 | |
| Ibiden Co. Ltd. | 66,500 | 1,472,914 | |
| Ingenico SA | 10,093 | 1,438,549 | |
| Keyence Corp. | 53,500 | 17,067,819 | |
| Kyocera Corp. | 336,100 | 21,176,855 | |
| Landis+Gyr Group AG | 12,879 | 1,055,664 | |
| Largan Precision Co. Ltd. | 34,000 | 4,835,910 | |
| LG Innotek Co. Ltd. | 4,148 | 449,045 | |
| LianChuang Electronic Technology Co. Ltd. (A Shares) | 187,360 | 458,489 | |
| Murata Manufacturing Co. Ltd. | 353,200 | 18,503,124 | |
| Nippon Electric Glass Co. Ltd. | 32,800 | 554,370 | |
| Oki Electric Industry Co. Ltd. | 62,800 | 692,861 | |
| OMRON Corp. | 587,200 | 31,793,510 | |
| Optex Group Co. Ltd. | 4,600 | 52,414 | |
| Partron Co. Ltd. | 48,321 | 360,136 | |
| Renishaw PLC | 39,152 | 1,774,597 | |
| Ryoyo Electro Corp. (c) | 12,200 | 199,752 | |
| Samsung SDI Co. Ltd. | 19,153 | 4,705,074 | |
| Sanshin Electronic Co. Ltd. | 10,500 | 145,633 | |
| Shenzhen Aisidi Co. Ltd. (A Shares) | 197,800 | 194,633 | |
| Shimadzu Corp. | 628,900 | 15,323,097 | |
| Spectris PLC | 326,444 | 11,513,156 | |
| TDK Corp. | 35,300 | 3,420,035 | |
| Topcon Corp. | 18,500 | 184,726 | |
| Yokogawa Electric Corp. | 343,200 | 5,526,965 | |
| Zhejiang Dahua Technology Co. Ltd. (A Shares) | 502,496 | 1,392,798 | |
| 240,713,297 | |||
| IT Services - 1.4% | |||
| Adyen BV (a)(b) | 7,585 | 6,675,899 | |
| ALTEN | 16,474 | 1,844,983 | |
| Amadeus IT Holding SA Class A | 880,317 | 62,406,646 | |
| Argo Graphics, Inc. | 2,900 | 86,037 | |
| Capgemini SA | 89,388 | 9,905,732 | |
| Computershare Ltd. | 211,133 | 2,107,153 | |
| EPAM Systems, Inc. (a) | 28,408 | 6,340,666 | |
| Fujitsu Ltd. | 221,240 | 22,993,699 | |
| GMO Payment Gateway, Inc. | 31,600 | 1,939,477 | |
| Hexaware Technologies Ltd. | 265,640 | 1,316,500 | |
| Ines Corp. | 15,500 | 211,821 | |
| Infocom Corp. | 3,500 | 88,230 | |
| iomart Group PLC | 4,648 | 20,843 | |
| IT Holdings Corp. | 76,000 | 4,502,503 | |
| Link Administration Holdings Ltd. | 102,343 | 313,355 | |
| MasterCard, Inc. Class A | 31,312 | 9,088,308 | |
| NEC Corp. | 15,900 | 595,550 | |
| Nomura Research Institute Ltd. | 1,682,100 | 36,726,734 | |
| NS Solutions Corp. | 48,200 | 1,337,052 | |
| NTT Data Corp. | 241,500 | 2,890,566 | |
| OBIC Co. Ltd. | 144,900 | 17,853,894 | |
| Otsuka Corp. | 12,500 | 534,837 | |
| SCSK Corp. | 6,700 | 345,995 | |
| Softcat PLC | 133,644 | 1,828,796 | |
| Wirecard AG (c) | 3,893 | 501,463 | |
| Wix.com Ltd. (a) | 80,502 | 10,789,683 | |
| Worldline SA (a)(b) | 98,414 | 7,591,794 | |
| 210,838,216 | |||
| Semiconductors & Semiconductor Equipment - 2.2% | |||
| Advantest Corp. | 35,000 | 1,594,892 | |
| Analog Devices, Inc. | 237,758 | 25,927,510 | |
| ASML Holding NV | 28,686 | 7,937,703 | |
| ASML Holding NV (Netherlands) | 162,308 | 45,006,898 | |
| Broadcom, Inc. | 32,582 | 8,882,505 | |
| Dialog Semiconductor PLC (a) | 28,517 | 983,777 | |
| Disco Corp. | 58,300 | 11,826,479 | |
| Dongbu HiTek Co. Ltd. | 27,473 | 544,491 | |
| GlobalWafers Co. Ltd. | 166,000 | 2,159,981 | |
| Infineon Technologies AG | 1,722,134 | 36,756,585 | |
| Innox Advanced Materials Co. Ltd. (a) | 6,360 | 221,117 | |
| MediaTek, Inc. | 522,000 | 6,101,981 | |
| Melexis NV (c) | 24,612 | 1,702,118 | |
| Mellanox Technologies Ltd. (a) | 65,731 | 7,849,596 | |
| NXP Semiconductors NV | 206,394 | 23,464,934 | |
| Renesas Electronics Corp. (a) | 597,500 | 3,606,272 | |
| Risen Energy Co. Ltd. (A Shares) | 526,400 | 1,112,736 | |
| Silicon Motion Technology Corp. sponsored ADR | 135,401 | 5,039,625 | |
| Siltronic AG | 7,689 | 730,251 | |
| STMicroelectronics NV: | |||
| (France) | 105,968 | 2,924,692 | |
| (NY Shares) unit (c) | 51,339 | 1,406,689 | |
| Sumco Corp. | 298,700 | 4,544,472 | |
| Taiwan Semiconductor Manufacturing Co. Ltd. | 1,922,000 | 19,924,998 | |
| Taiwan Semiconductor Manufacturing Co. Ltd. sponsored ADR | 1,593,144 | 85,774,873 | |
| Texas Instruments, Inc. | 100,786 | 11,503,714 | |
| Tokyo Electron Ltd. | 61,100 | 12,646,556 | |
| Topco Scientific Co. Ltd. | 52,000 | 177,162 | |
| Visual Photonics Epitaxy Co. Ltd. | 89,000 | 283,021 | |
| 330,635,628 | |||
| Software - 1.7% | |||
| Altium Ltd. | 30,790 | 617,791 | |
| ANSYS, Inc. (a) | 118,104 | 28,603,608 | |
| Avast PLC (b) | 839,448 | 4,279,385 | |
| Aveva Group PLC | 103,124 | 5,866,378 | |
| Beijing SuperMap Software Co. Ltd. (A Shares) | 144,600 | 560,039 | |
| Cadence Design Systems, Inc. (a) | 700,243 | 46,314,072 | |
| Check Point Software Technologies Ltd. (a) | 213,656 | 22,177,493 | |
| Constellation Software, Inc. | 7,200 | 7,335,069 | |
| CyberArk Software Ltd. (a) | 24,945 | 2,611,742 | |
| Dassault Systemes SA | 196,465 | 31,171,813 | |
| Descartes Systems Group, Inc. (Canada) (a) | 90,296 | 3,749,075 | |
| Fukui Computer Holdings, Inc. | 15,100 | 376,590 | |
| Globant SA (a) | 20,008 | 2,261,104 | |
| Hundsun Technologies, Inc. (A Shares) | 25,600 | 352,186 | |
| Justsystems Corp. | 16,600 | 794,141 | |
| Micro Focus International PLC | 912,505 | 8,690,440 | |
| NICE Systems Ltd. sponsored ADR (a) | 16,994 | 2,784,127 | |
| Sage Group PLC | 275,091 | 2,437,082 | |
| SAP SE | 556,947 | 69,530,658 | |
| Shenzhen Ysstech Information-tech Co. Ltd. (A Shares) | 352,677 | 599,737 | |
| Software AG (Bearer) | 32,444 | 1,067,378 | |
| TeamViewer AG (a)(c) | 93,898 | 3,396,825 | |
| Temenos Group AG | 50,519 | 7,223,067 | |
| Trend Micro, Inc. | 9,200 | 458,038 | |
| Venustech Group, Inc. Class A | 137,634 | 818,684 | |
| WiseTech Global Ltd. (c) | 150,531 | 1,480,758 | |
| 255,557,280 | |||
| Technology Hardware, Storage & Peripherals - 0.7% | |||
| Brother Industries Ltd. | 38,300 | 682,838 | |
| Canon, Inc. | 154,700 | 3,893,380 | |
| Canon, Inc. sponsored ADR | 20,840 | 524,126 | |
| Fujifilm Holdings Corp. | 80,600 | 3,943,317 | |
| GRG Banking Equipment Co. Ltd. Class A | 627,800 | 847,608 | |
| Konica Minolta, Inc. | 112,800 | 612,839 | |
| Logitech International SA (Reg.) | 85,076 | 3,299,712 | |
| Ricoh Co. Ltd. | 68,200 | 635,463 | |
| Samsung Electronics Co. Ltd. | 2,161,986 | 97,579,769 | |
| Seiko Epson Corp. | 215,000 | 3,045,800 | |
| Zhuhai Wanlida Electric Co. Ltd. (A Shares) | 153,807 | 914,665 | |
| 115,979,517 | |||
| TOTAL INFORMATION TECHNOLOGY | 1,170,111,451 | ||
| MATERIALS - 4.0% | |||
| Chemicals - 3.0% | |||
| Air Liquide SA | 64,316 | 8,760,687 | |
| Air Water, Inc. | 69,600 | 922,106 | |
| Akzo Nobel NV | 447,193 | 35,780,105 | |
| Arkema SA | 75,800 | 7,170,648 | |
| Asahi Kasei Corp. | 784,800 | 6,553,582 | |
| BASF AG | 858,364 | 50,801,566 | |
| Christian Hansen Holding A/S | 48,159 | 3,471,959 | |
| Chugoku Marine Paints Ltd. | 34,300 | 293,518 | |
| Covestro AG (b) | 187,832 | 7,278,033 | |
| Croda International PLC | 389,545 | 23,025,778 | |
| Dainichiseika Color & Chemicals Manufacturing Co. Ltd. | 3,400 | 73,920 | |
| Denki Kagaku Kogyo KK | 176,360 | 4,460,505 | |
| Givaudan SA | 20,861 | 64,990,930 | |
| Johnson Matthey PLC | 614,441 | 20,139,509 | |
| JSR Corp. | 11,300 | 199,054 | |
| K&S AG (c) | 34,395 | 284,786 | |
| Kaneka Corp. | 14,200 | 382,976 | |
| Kansai Paint Co. Ltd. | 634,400 | 13,863,163 | |
| Koninklijke DSM NV | 22,827 | 2,574,711 | |
| Kuraray Co. Ltd. | 602,300 | 6,276,518 | |
| Linde PLC | 314,758 | 60,661,707 | |
| Mitsubishi Gas Chemical Co., Inc. | 73,600 | 1,116,351 | |
| Nitto Denko Corp. | 245,300 | 12,326,405 | |
| Novozymes A/S Series B | 330,206 | 16,928,196 | |
| Orica Ltd. | 58,545 | 755,155 | |
| Pidilite Industries Ltd. | 101,229 | 2,111,548 | |
| Shin-Etsu Chemical Co. Ltd. | 87,700 | 9,874,991 | |
| Sika AG | 210,628 | 37,703,170 | |
| Symrise AG | 380,525 | 37,288,382 | |
| Taiyo Nippon Sanso Corp. | 67,200 | 1,203,071 | |
| Teijin Ltd. | 30,500 | 501,924 | |
| Tokyo Ohka Kogyo Co. Ltd. | 10,200 | 367,393 | |
| Tosoh Corp. | 79,900 | 1,097,088 | |
| Umicore SA | 173,278 | 7,296,854 | |
| Umicore SA ADR | 5,300 | 55,544 | |
| Victrex PLC | 92,748 | 2,529,061 | |
| 449,120,894 | |||
| Construction Materials - 0.1% | |||
| CRH PLC sponsored ADR | 143,625 | 4,866,015 | |
| HeidelbergCement AG | 163,500 | 9,798,725 | |
| HeidelbergCement AG ADR | 9,700 | 115,527 | |
| Imerys SA | 18,616 | 732,103 | |
| Xinjiang Tianshan Cement Co. Ltd. (A Shares) | 521,000 | 843,501 | |
| 16,355,871 | |||
| Containers & Packaging - 0.1% | |||
| Amcor PLC unit | 498,652 | 4,684,292 | |
| Smurfit Kappa Group PLC | 292,708 | 9,861,305 | |
| Smurfit Kappa Group PLC | 8,523 | 283,903 | |
| Toyo Seikan Group Holdings Ltd. | 56,800 | 911,033 | |
| 15,740,533 | |||
| Metals & Mining - 0.8% | |||
| Agnico Eagle Mines Ltd. (Canada) | 122,117 | 5,794,473 | |
| Anglo American PLC (United Kingdom) | 64,041 | 1,506,723 | |
| Antofagasta PLC | 574,157 | 5,675,135 | |
| ArcelorMittal SA: | |||
| (Netherlands) | 388,500 | 5,532,213 | |
| Class A unit (c) | 8,907 | 127,370 | |
| Asahi Holdings, Inc. | 41,400 | 941,537 | |
| BHP Billiton Ltd. | 421,272 | 9,156,527 | |
| BHP Billiton Ltd. sponsored ADR (c) | 82,170 | 3,558,783 | |
| BHP Billiton PLC | 572,710 | 10,466,762 | |
| BHP Billiton PLC ADR | 249,326 | 9,050,534 | |
| Boliden AB | 24,212 | 508,482 | |
| Constellium NV (a) | 6,226 | 77,202 | |
| Ferrexpo PLC | 108,337 | 181,243 | |
| Fortescue Metals Group Ltd. | 654,593 | 4,298,461 | |
| Franco-Nevada Corp. | 114,524 | 12,294,959 | |
| Glencore Xstrata PLC | 3,271,641 | 8,258,119 | |
| Independence Group NL | 1,543,064 | 5,297,557 | |
| Kirkland Lake Gold Ltd. | 16,237 | 523,673 | |
| Kyoei Steel Ltd. | 4,600 | 69,729 | |
| MMC Norilsk Nickel PJSC | 8,339 | 2,556,711 | |
| Newcrest Mining Ltd. | 928 | 15,900 | |
| Rio Tinto Ltd. | 190,410 | 10,825,197 | |
| Rio Tinto PLC | 136,644 | 6,433,148 | |
| Rio Tinto PLC sponsored ADR | 234,102 | 10,986,407 | |
| South32 Ltd. | 2,275,741 | 3,291,220 | |
| Uacj Corp. | 17,000 | 298,832 | |
| 117,726,897 | |||
| Paper & Forest Products - 0.0% | |||
| Stora Enso Oyj (R Shares) | 608,609 | 7,212,590 | |
| UPM-Kymmene Corp. | 59,528 | 1,831,808 | |
| 9,044,398 | |||
| TOTAL MATERIALS | 607,988,593 | ||
| REAL ESTATE - 1.2% | |||
| Equity Real Estate Investment Trusts (REITs) - 0.3% | |||
| Big Yellow Group PLC | 168,129 | 2,334,123 | |
| British Land Co. PLC | 1,246,000 | 8,070,803 | |
| Goodman Group unit | 420,350 | 4,102,078 | |
| Great Portland Estates PLC | 510,411 | 5,509,585 | |
| Scentre Group unit | 2,007,501 | 4,524,941 | |
| Segro PLC | 668,729 | 7,089,542 | |
| Unibail-Rodamco SE & WFD Unibail-Rodamco NV unit | 28,455 | 3,414,843 | |
| Unite Group PLC | 108,507 | 1,578,526 | |
| Warehouses de Pauw | 85,638 | 2,294,886 | |
| 38,919,327 | |||
| Real Estate Management & Development - 0.9% | |||
| BR Malls Participacoes SA | 55,400 | 202,428 | |
| Cheung Kong Property Holdings Ltd. | 1,230,100 | 7,685,166 | |
| Deutsche Wohnen AG (Bearer) | 816,930 | 33,349,310 | |
| Fabege AB | 144,837 | 2,378,890 | |
| Grand City Properties SA | 742,815 | 17,524,842 | |
| Hang Lung Group Ltd. | 205,000 | 516,511 | |
| Hongkong Land Holdings Ltd. | 44,600 | 218,986 | |
| IWG PLC | 194,617 | 882,990 | |
| LEG Immobilien AG | 223,213 | 26,804,448 | |
| Lendlease Group unit | 403,100 | 4,629,629 | |
| Mitsui Fudosan Co. Ltd. | 439,700 | 10,099,729 | |
| Savills PLC | 148,254 | 2,074,332 | |
| Swire Pacific Ltd. (A Shares) | 44,500 | 405,740 | |
| TAG Immobilien AG | 320,538 | 7,876,638 | |
| Vonovia SE | 534,427 | 28,916,797 | |
| 143,566,436 | |||
| TOTAL REAL ESTATE | 182,485,763 | ||
| UTILITIES - 1.3% | |||
| Electric Utilities - 0.6% | |||
| Chubu Electric Power Co., Inc. | 201,900 | 2,634,658 | |
| CLP Holdings Ltd. | 1,016,000 | 10,661,809 | |
| Companhia Paranaense de Energia-Copel | 10,400 | 182,399 | |
| EDF SA | 130,122 | 1,826,452 | |
| Enel SpA | 1,947,000 | 16,341,537 | |
| Enel SpA ADR (c) | 27,500 | 231,550 | |
| Fortum Corp. | 150,609 | 3,216,390 | |
| Iberdrola SA | 1,772,519 | 20,292,146 | |
| Kansai Electric Power Co., Inc. | 188,600 | 2,036,202 | |
| Mosenergo PJSC | 1,381,000 | 48,642 | |
| ORSTED A/S (b) | 169,803 | 17,530,263 | |
| Scottish & Southern Energy PLC | 832,212 | 16,361,580 | |
| Shikoku Electric Power Co., Inc. | 29,100 | 221,771 | |
| Terna SpA | 166,465 | 1,100,456 | |
| Tokyo Electric Power Co., Inc. (a) | 415,900 | 1,580,929 | |
| 94,266,784 | |||
| Gas Utilities - 0.2% | |||
| APA Group unit | 986,402 | 6,901,434 | |
| Beijing Enterprises Holdings Ltd. | 837,000 | 3,532,688 | |
| China Resource Gas Group Ltd. | 1,016,000 | 5,070,225 | |
| Gas Natural SDG SA | 132,576 | 3,088,552 | |
| Rubis SCA | 34,587 | 1,875,639 | |
| Snam Rete Gas SpA | 378,118 | 1,874,852 | |
| 22,343,390 | |||
| Independent Power and Renewable Electricity Producers - 0.0% | |||
| Drax Group PLC | 70,014 | 243,587 | |
| Electric Power Development Co. Ltd. | 238,100 | 5,112,550 | |
| eRex Co. Ltd. | 24,600 | 296,039 | |
| Meridian Energy Ltd. | 188,178 | 543,407 | |
| 6,195,583 | |||
| Multi-Utilities - 0.5% | |||
| AGL Energy Ltd. | 28,033 | 349,537 | |
| Centrica PLC | 405,589 | 375,695 | |
| ENGIE | 2,277,841 | 38,037,714 | |
| Hera SpA | 165,247 | 709,271 | |
| Iren SpA | 117,314 | 363,139 | |
| National Grid PLC | 639,779 | 8,064,887 | |
| Veolia Environnement SA | 904,388 | 26,056,275 | |
| 73,956,518 | |||
| Water Utilities - 0.0% | |||
| Companhia de Saneamento de Minas Gerais | 1,600 | 21,578 | |
| TOTAL UTILITIES | 196,783,853 | ||
| TOTAL COMMON STOCKS | |||
| (Cost $6,739,337,159) | 7,869,766,972 | ||
| Nonconvertible Preferred Stocks - 0.7% | |||
| COMMUNICATION SERVICES - 0.0% | |||
| Diversified Telecommunication Services - 0.0% | |||
| Telecom Italia SpA (Risparmio Shares) | 6,476,914 | 3,623,694 | |
| CONSUMER DISCRETIONARY - 0.4% | |||
| Automobiles - 0.4% | |||
| Bayerische Motoren Werke AG (BMW) (non-vtg.) | 22,440 | 1,163,497 | |
| Porsche Automobil Holding SE (Germany) | 52,448 | 3,268,328 | |
| Volkswagen AG | 327,156 | 54,309,982 | |
| 58,741,807 | |||
| CONSUMER STAPLES - 0.3% | |||
| Beverages - 0.0% | |||
| Ambev SA sponsored ADR | 1,067,825 | 3,427,718 | |
| Household Products - 0.3% | |||
| Henkel AG & Co. KGaA | 417,479 | 38,895,287 | |
| TOTAL CONSUMER STAPLES | 42,323,005 | ||
| INDUSTRIALS - 0.0% | |||
| Aerospace & Defense - 0.0% | |||
| Embraer SA sponsored ADR (a) | 484,200 | 7,379,208 | |
| TOTAL NONCONVERTIBLE PREFERRED STOCKS | |||
| (Cost $104,373,099) | 112,067,714 | ||
| Equity Funds - 44.4% | |||
| Diversified Emerging Markets Funds - 0.0% | |||
| Matthews Pacific Tiger Fund Investor Class | 19,976 | 532,755 | |
| Europe Stock Funds - 0.8% | |||
| WisdomTree Europe Hedged Equity ETF (c) | 1,838,675 | 114,623,000 | |
| Foreign Large Blend Funds - 10.7% | |||
| Artisan International Value Fund Investor Class | 16,683,514 | 555,727,865 | |
| Fidelity SAI International Low Volatility Index Fund (e) | 15,157,339 | 154,908,004 | |
| Harbor International Fund Institutional Class | 9,619 | 344,082 | |
| Janus Henderson International Opportunities Fund Class T | 678,739 | 15,665,301 | |
| Morgan Stanley Institutional Fund, Inc. International Equity Portfolio Class I | 30,468,696 | 409,194,590 | |
| Oakmark International Fund Investor Class | 22,770,389 | 486,147,815 | |
| TOTAL FOREIGN LARGE BLEND FUNDS | 1,621,987,657 | ||
| Foreign Large Growth Funds - 21.2% | |||
| American Funds EuroPacific Growth Fund Class F2 | 959,673 | 48,415,492 | |
| Fidelity Diversified International Fund (e) | 16,548,086 | 620,718,700 | |
| Fidelity International Discovery Fund (e) | 24,179,257 | 1,006,340,643 | |
| Fidelity Overseas Fund (e) | 10,686,163 | 510,264,292 | |
| Invesco Oppenheimer International Growth Fund Class R6 | 1,640,635 | 67,052,763 | |
| JOHCM International Select Fund Class II Shares | 20,200,421 | 448,449,337 | |
| WCM Focused International Growth Fund Institutional Class | 27,724,947 | 497,662,793 | |
| TOTAL FOREIGN LARGE GROWTH FUNDS | 3,198,904,020 | ||
| Foreign Large Value Funds - 2.5% | |||
| iShares MSCI EAFE Value ETF (c) | 2,485,485 | 109,187,356 | |
| Pear Tree Polaris Foreign Value Fund Institutional Shares | 14,507,771 | 273,326,414 | |
| TOTAL FOREIGN LARGE VALUE FUNDS | 382,513,770 | ||
| Foreign Small Mid Blend Funds - 0.6% | |||
| Franklin International Small Cap Growth Fund | 574,030 | 8,208,634 | |
| iShares MSCI EAFE Small-Cap ETF | 580,453 | 31,669,516 | |
| Victory Trivalent International Small-Cap Fund Class I | 3,791,691 | 47,889,061 | |
| TOTAL FOREIGN SMALL MID BLEND FUNDS | 87,767,211 | ||
| Foreign Small Mid Growth Funds - 0.7% | |||
| Fidelity International Small Cap Opportunities Fund (e) | 2,892,180 | 53,216,114 | |
| Oberweis International Opportunities Fund | 580,965 | 10,242,414 | |
| T. Rowe Price International Discovery Fund | 557,152 | 35,908,448 | |
| Wasatch International Growth Fund Investor Class | 90 | 2,496 | |
| TOTAL FOREIGN SMALL MID GROWTH FUNDS | 99,369,472 | ||
| Foreign Small Mid Value Funds - 0.5% | |||
| Brandes International Small Cap Equity Fund Class A | 728,625 | 7,082,234 | |
| Segall Bryant & Hamill International Small Capital Fund Class A | 2,561,427 | 25,486,199 | |
| Transamerica International Small Cap Value Fund | 3,906,393 | 46,095,432 | |
| TOTAL FOREIGN SMALL MID VALUE FUNDS | 78,663,865 | ||
| Sector Funds - 0.1% | |||
| SPDR Dow Jones International Real Estate ETF | 201,575 | 7,214,369 | |
| Other - 7.3% | |||
| Fidelity Advisor Japan Fund Class I (e) | 3,419,044 | 49,986,426 | |
| Fidelity Japan Smaller Companies Fund (e) | 6,854,892 | 101,109,651 | |
| iShares MSCI Australia ETF (c) | 5,784,157 | 116,377,239 | |
| iShares MSCI Japan ETF (c) | 15,785,258 | 835,987,264 | |
| Matthews Japan Fund Investor Class | 179 | 3,369 | |
| TOTAL OTHER | 1,103,463,949 | ||
| TOTAL EQUITY FUNDS | |||
| (Cost $5,494,246,979) | 6,695,040,068 | ||
| Principal Amount | Value | ||
| U.S. Treasury Obligations - 0.1% | |||
| U.S. Treasury Bills, yield at date of purchase 1.53% to 1.56% 3/12/20 to 3/26/20 (f) | |||
| (Cost $14,719,101) | $14,730,000 | 14,720,343 | |
| Shares | Value | ||
| Money Market Funds - 4.4% | |||
| Fidelity Securities Lending Cash Central Fund 1.60% (g)(h) | 274,407,512 | 274,434,952 | |
| State Street Institutional U.S. Government Money Market Fund Premier Class 1.53% (i) | 387,035,691 | 387,035,691 | |
| TOTAL MONEY MARKET FUNDS | |||
| (Cost $661,470,643) | 661,470,643 | ||
| TOTAL INVESTMENT IN SECURITIES - 101.7% | |||
| (Cost $13,014,146,981) | 15,353,065,740 | ||
| NET OTHER ASSETS (LIABILITIES) - (1.7)% | (256,498,071) | ||
| NET ASSETS - 100% | $15,096,567,669 |
| Futures Contracts | |||||
| Number of contracts | Expiration Date | Notional Amount | Value | Unrealized Appreciation/(Depreciation) | |
| Purchased | |||||
| Equity Index Contracts | |||||
| CME Nikkei 225 Index Contracts (United States) | 1,086 | March 2020 | $114,192,900 | $(13,515,863) | $(13,515,863) |
| ICE E-mini MSCI EAFE Index Contracts (United States) | 1,105 | March 2020 | 100,334,000 | (10,565,146) | (10,565,146) |
| TOTAL FUTURES CONTRACTS | $(24,081,009) |
The notional amount of futures purchased as a percentage of Net Assets is 1.4%
For the period, the average monthly notional amount at value for futures contracts in the aggregate was $251,429,273
Security Type Abbreviations
ETF – Exchange-Traded Fund
Legend
(a) Non-income producing
(b) Security exempt from registration under Rule 144A of the Securities Act of 1933. These securities may be resold in transactions exempt from registration, normally to qualified institutional buyers. At the end of the period, the value of these securities amounted to $119,054,983 or 0.8% of net assets.
(c) Security or a portion of the security is on loan at period end.
(d) Level 3 security
(e) Affiliated Fund
(f) Security or a portion of the security was pledged to cover margin requirements for futures contracts. At period end, the value of securities pledged amounted to $11,284,364.
(g) Affiliated fund that is generally available only to investment companies and other accounts managed by Fidelity Investments. The rate quoted is the annualized seven-day yield of the fund at period end. A complete unaudited listing of the fund's holdings as of its most recent quarter end is available upon request. In addition, each Fidelity Central Fund's financial statements, which are not covered by the Fund's Report of Independent Registered Public Accounting Firm, are available on the SEC's website or upon request.
(h) Investment made with cash collateral received from securities on loan.
(i) The rate quoted is the annualized seven-day yield of the fund at period end.
Affiliated Central Funds
Information regarding fiscal year to date income earned by the Fund from investments in Fidelity Central Funds is as follows:
| Fund | Income earned |
| Fidelity Securities Lending Cash Central Fund | $1,757,431 |
| Total | $1,757,431 |
Amounts in the income column in the above table include any capital gain distributions from underlying funds, which are presented in the corresponding line-item in the Statement of Operations, if applicable. Amount for Fidelity Securities Lending Cash Central Fund represents the income earned on investing cash collateral, less rebates paid to borrowers and any lending agent fees associated with the loan, plus any premium payments received for lending certain types of securities.
Affiliated Underlying Funds
Fiscal year to date information regarding the Fund's investments in affiliated Underlying Funds, excluding any Money Market Central Funds, is presented below. Exchanges between classes of the same affiliated Underlying Funds may occur.
| Affiliate | Value, beginning of period | Purchases | Sales Proceeds | Dividend Income | Realized Gain (loss) | Change in Unrealized appreciation (depreciation) | Value, end of period |
| Fidelity Advisor Japan Fund Class I | $48,109,242 | $695,474 | $-- | $695,474 | $-- | $1,181,710 | $49,986,426 |
| Fidelity Diversified International Fund | 655,929,252 | 28,750,602 | 117,035,823 | 8,710,928 | 18,068,443 | 35,006,226 | 620,718,700 |
| Fidelity International Discovery Fund | 1,037,139,792 | 40,041,930 | 117,065,646 | 24,972,444 | 16,029,061 | 30,195,506 | 1,006,340,643 |
| Fidelity International Small Cap Opportunities Fund | 50,738,821 | 643,657 | -- | 643,657 | -- | 1,833,636 | 53,216,114 |
| Fidelity Japan Smaller Companies Fund | 104,404,790 | 7,855,949 | -- | 7,855,949 | -- | (11,151,088) | 101,109,651 |
| Fidelity Overseas Fund | 480,316,918 | 24,356,294 | 23,407,319 | 7,348,194 | 523,068 | 28,475,331 | 510,264,292 |
| Fidelity SAI International Low Volatility Index Fund | -- | 164,636,111 | -- | 9,636,110 | -- | (9,728,107) | 154,908,004 |
| Total | $2,376,638,815 | $266,980,017 | $257,508,788 | $59,862,756 | $34,620,572 | $75,813,214 | $2,496,543,830 |
Amounts in the income column in the above table include any capital gain distributions from underlying funds, which are presented in the corresponding line-item in the Statement of Operations, if applicable.
Investment Valuation
The following is a summary of the inputs used, as of February 29, 2020, involving the Fund's assets and liabilities carried at fair value. The inputs or methodology used for valuing securities may not be an indication of the risk associated with investing in those securities. For more information on valuation inputs, and their aggregation into the levels used below, please refer to the Investment Valuation section in the accompanying Notes to Financial Statements.
| Valuation Inputs at Reporting Date: | ||||
| Description | Total | Level 1 | Level 2 | Level 3 |
| Investments in Securities: | ||||
| Equities: | ||||
| Communication Services | $411,418,550 | $113,371,124 | $298,047,426 | $-- |
| Consumer Discretionary | 667,567,702 | 192,686,068 | 474,881,622 | 12 |
| Consumer Staples | 1,036,644,645 | 272,809,481 | 763,835,164 | -- |
| Energy | 252,459,719 | 72,874,301 | 179,585,418 | -- |
| Financials | 1,231,366,357 | 336,344,438 | 895,021,919 | -- |
| Health Care | 902,346,577 | 295,288,528 | 607,058,049 | -- |
| Industrials | 1,322,661,476 | 427,659,951 | 895,001,525 | -- |
| Information Technology | 1,170,111,451 | 731,415,455 | 438,695,996 | -- |
| Materials | 607,988,593 | 141,590,917 | 466,397,676 | -- |
| Real Estate | 182,485,763 | 31,979,468 | 150,506,295 | -- |
| Utilities | 196,783,853 | 39,376,776 | 157,407,077 | -- |
| Equity Funds | 6,695,040,068 | 6,695,040,068 | -- | -- |
| Other Short-Term Investments | 14,720,343 | -- | 14,720,343 | -- |
| Money Market Funds | 661,470,643 | 661,470,643 | -- | -- |
| Total Investments in Securities: | $15,353,065,740 | $10,011,907,218 | $5,341,158,510 | $12 |
| Derivative Instruments: | ||||
| Liabilities | ||||
| Futures Contracts | $(24,081,009) | $(24,081,009) | $-- | $-- |
| Total Liabilities | $(24,081,009) | $(24,081,009) | $-- | $-- |
| Total Derivative Instruments: | $(24,081,009) | $(24,081,009) | $-- | $-- |
Value of Derivative Instruments
The following table is a summary of the Fund's value of derivative instruments by primary risk exposure as of February 29, 2020. For additional information on derivative instruments, please refer to the Derivative Instruments section in the accompanying Notes to Financial Statements.
| Primary Risk Exposure / Derivative Type | Value | |
| Asset | Liability | |
| Equity Risk | ||
| Futures Contracts(a) | $0 | $(24,081,009) |
| Total Equity Risk | 0 | (24,081,009) |
| Total Value of Derivatives | $0 | $(24,081,009) |
(a) Reflects gross cumulative appreciation (depreciation) on futures contracts as presented in the Schedule of Investments. In the Statement of Assets and Liabilities, the period end daily variation margin is included in receivable or payable for daily variation margin on futures contracts, and the net cumulative appreciation (depreciation) is included in Total accumulated earnings (loss).
Other Information
Distribution of the direct investments by country of issue, as a percentage of Total Net Assets, is as follows (Unaudited):
| United States of America | 48.8% |
| Japan | 10.5% |
| United Kingdom | 7.6% |
| Germany | 5.9% |
| Switzerland | 5.4% |
| France | 5.1% |
| Netherlands | 2.5% |
| Canada | 1.6% |
| Australia | 1.2% |
| Italy | 1.0% |
| Denmark | 1.0% |
| Korea (South) | 1.0% |
| Hong Kong | 1.0% |
| Spain | 1.0% |
| Others (Individually Less Than 1%) | 6.4% |
| 100.0% |
See accompanying notes which are an integral part of the financial statements.
Financial Statements
Statement of Assets and Liabilities
| February 29, 2020 | ||
| Assets | ||
| Investment in securities, at value (including securities loaned of $265,743,177) — See accompanying schedule: Unaffiliated issuers (cost $10,866,662,447) | $12,582,086,958 | |
| Fidelity Central Funds (cost $274,434,952) | 274,434,952 | |
| Other affiliated issuers (cost $1,873,049,582) | 2,496,543,830 | |
| Total Investment in Securities (cost $13,014,146,981) | $15,353,065,740 | |
| Cash | 203,739 | |
| Foreign currency held at value (cost $16,330,061) | 16,315,178 | |
| Receivable for investments sold | 70,605,775 | |
| Receivable for fund shares sold | 5,834,671 | |
| Dividends receivable | 32,291,804 | |
| Interest receivable | 550,701 | |
| Distributions receivable from Fidelity Central Funds | 61,010 | |
| Other receivables | 527,072 | |
| Total assets | 15,479,455,690 | |
| Liabilities | ||
| Payable for investments purchased | $84,485,511 | |
| Payable for fund shares redeemed | 18,741,646 | |
| Accrued management fee | 2,548,397 | |
| Payable for daily variation margin on futures contracts | 1,929,411 | |
| Other payables and accrued expenses | 709,594 | |
| Collateral on securities loaned | 274,473,462 | |
| Total liabilities | 382,888,021 | |
| Net Assets | $15,096,567,669 | |
| Net Assets consist of: | ||
| Paid in capital | $12,686,601,549 | |
| Total accumulated earnings (loss) | 2,409,966,120 | |
| Net Assets | $15,096,567,669 | |
| Net Asset Value, offering price and redemption price per share ($15,096,567,669 ÷ 1,520,246,136 shares) | $9.93 |
See accompanying notes which are an integral part of the financial statements.
Statement of Operations
| Year ended February 29, 2020 | ||
| Investment Income | ||
| Dividends: | ||
| Unaffiliated issuers | $306,510,451 | |
| Affiliated issuers | 39,882,728 | |
| Interest | 8,287,339 | |
| Income from Fidelity Central Funds (including $1,757,431 from security lending) | 1,757,431 | |
| Income before foreign taxes withheld | 356,437,949 | |
| Less foreign taxes withheld | (19,295,045) | |
| Total income | 337,142,904 | |
| Expenses | ||
| Management fee | $68,193,446 | |
| Accounting and security lending fees | 680,342 | |
| Custodian fees and expenses | 557,538 | |
| Independent trustees' fees and expenses | 176,729 | |
| Registration fees | 108,180 | |
| Audit | 113,205 | |
| Legal | 39,526 | |
| Miscellaneous | 279,484 | |
| Total expenses before reductions | 70,148,450 | |
| Expense reductions | (40,307,688) | |
| Total expenses after reductions | 29,840,762 | |
| Net investment income (loss) | 307,302,142 | |
| Realized and Unrealized Gain (Loss) | ||
| Net realized gain (loss) on: | ||
| Investment securities: | ||
| Unaffiliated issuers | 99,853,997 | |
| Fidelity Central Funds | 951 | |
| Other affiliated issuers | 34,620,572 | |
| Foreign currency transactions | (658,977) | |
| Futures contracts | 36,791,840 | |
| Capital gain distributions from underlying funds: | ||
| Unaffiliated issuers | 48,160,306 | |
| Affiliated issuers | 19,980,028 | |
| Total net realized gain (loss) | 238,748,717 | |
| Change in net unrealized appreciation (depreciation) on: | ||
| Investment securities: | ||
| Unaffiliated issuers (net of increase in deferred foreign taxes of $96,449) | (174,335,480) | |
| Affiliated issuers | 75,813,214 | |
| Assets and liabilities in foreign currencies | 264,812 | |
| Futures contracts | (36,794,952) | |
| Total change in net unrealized appreciation (depreciation) | (135,052,406) | |
| Net gain (loss) | 103,696,311 | |
| Net increase (decrease) in net assets resulting from operations | $410,998,453 |
See accompanying notes which are an integral part of the financial statements.
Statement of Changes in Net Assets
| Year ended February 29, 2020 | Year ended February 28, 2019 | |
| Increase (Decrease) in Net Assets | ||
| Operations | ||
| Net investment income (loss) | $307,302,142 | $315,613,970 |
| Net realized gain (loss) | 238,748,717 | 460,628,213 |
| Change in net unrealized appreciation (depreciation) | (135,052,406) | (1,880,975,069) |
| Net increase (decrease) in net assets resulting from operations | 410,998,453 | (1,104,732,886) |
| Distributions to shareholders | (547,156,394) | (960,064,898) |
| Share transactions | ||
| Proceeds from sales of shares | 1,689,480,304 | 3,180,693,103 |
| Reinvestment of distributions | 542,299,321 | 956,581,738 |
| Cost of shares redeemed | (2,904,015,493) | (3,424,072,564) |
| Net increase (decrease) in net assets resulting from share transactions | (672,235,868) | 713,202,277 |
| Total increase (decrease) in net assets | (808,393,809) | (1,351,595,507) |
| Net Assets | ||
| Beginning of period | 15,904,961,478 | 17,256,556,985 |
| End of period | $15,096,567,669 | $15,904,961,478 |
| Other Information | ||
| Shares | ||
| Sold | 164,022,651 | 299,093,781 |
| Issued in reinvestment of distributions | 50,851,662 | 97,266,318 |
| Redeemed | (279,735,078) | (320,961,245) |
| Net increase (decrease) | (64,860,765) | 75,398,854 |
See accompanying notes which are an integral part of the financial statements.
Financial Highlights
Strategic Advisers International Fund
| Years ended February 28, | 2020 A | 2019 | 2018 | 2017 | 2016 A |
| Selected Per–Share Data | |||||
| Net asset value, beginning of period | $10.03 | $11.43 | $9.78 | $8.74 | $10.45 |
| Income from Investment Operations | |||||
| Net investment income (loss)B | .20 | .21 | .19 | .17 | .16 |
| Net realized and unrealized gain (loss) | .06 | (.98) | 1.82 | 1.07 | (1.54) |
| Total from investment operations | .26 | (.77) | 2.01 | 1.24 | (1.38) |
| Distributions from net investment income | (.22) | (.18) | (.18) | (.18) | (.16) |
| Distributions from net realized gain | (.14) | (.44) | (.18) | (.02) | (.17) |
| Total distributions | (.36) | (.63)C | (.36) | (.20) | (.33) |
| Net asset value, end of period | $9.93 | $10.03 | $11.43 | $9.78 | $8.74 |
| Total ReturnD | 2.35% | (6.57)% | 20.53% | 14.33% | (13.60)% |
| Ratios to Average Net AssetsE,F | |||||
| Expenses before reductions | .44% | .45% | .50% | .48% | .45% |
| Expenses net of fee waivers, if any | .19% | .20% | .25% | .23% | .20% |
| Expenses net of all reductions | .19% | .20% | .24% | .22% | .20% |
| Net investment income (loss) | 1.91% | 1.95% | 1.68% | 1.81% | 1.57% |
| Supplemental Data | |||||
| Net assets, end of period (000 omitted) | $15,096,568 | $15,904,961 | $17,256,557 | $16,141,374 | $18,533,655 |
| Portfolio turnover rateG | 33% | 39% | 33% | 28% | 28% |
A For the year ended February 29.
B Calculated based on average shares outstanding during the period.
C Total distributions of $.63 per share is comprised of distributions from net investment income of $.184 and distributions from net realized gain of $.444 per share.
D Total returns would have been lower if certain expenses had not been reduced during the applicable periods shown.
E Fees and expenses of any underlying Fidelity Central Funds are not included in the Fund's expense ratio. The Fund indirectly bears its proportionate share of the expenses of any underlying Fidelity Central Funds.
F Expense ratios reflect operating expenses of the Fund. Expenses before reductions do not reflect amounts reimbursed by the investment adviser or reductions from brokerage service arrangements or reductions from other expense offset arrangements and do not represent the amount paid by the Fund during periods when reimbursements or reductions occur. Expenses net of fee waivers reflect expenses after reimbursement by the investment adviser but prior to reductions from brokerage service arrangements or other expense offset arrangements. Expenses net of all reductions represent the net expenses paid by the Fund. Fees and expenses of the Underlying Funds are not included in the Fund's annualized ratios. The Fund indirectly bears its proportionate share of the expenses of the Underlying Funds.
G Amounts do not include the activity of Underlying Funds.
See accompanying notes which are an integral part of the financial statements.
Notes to Financial Statements
For the period ended February 29, 2020
1. Organization.
Strategic Advisers International Fund (the Fund) is a fund of Fidelity Rutland Square Trust II (the Trust), and is authorized to issue an unlimited number of shares. The Trust is registered under the Investment Company Act of 1940, as amended (the 1940 Act), as an open-end management investment company organized as a Delaware statutory trust. The Fund is offered exclusively to certain clients of Strategic Advisers LLC (Strategic Advisers), an affiliate of Fidelity Management & Research Company LLC (FMR).
2. Significant Accounting Policies.
The Fund is an investment company and applies the accounting and reporting guidance of the Financial Accounting Standards Board (FASB) Accounting Standards Codification Topic 946 Financial Services – Investments Companies. The financial statements have been prepared in conformity with accounting principles generally accepted in the United States of America (GAAP), which require management to make certain estimates and assumptions at the date of the financial statements. Actual results could differ from those estimates. Subsequent events, if any, through the date that the financial statements were issued have been evaluated in the preparation of the financial statements. The following summarizes the significant accounting policies of the Fund:
Investment Valuation. Investments are valued as of 4:00 p.m. Eastern time on the last calendar day of the period. The Board of Trustees (the Board) has delegated the day to day responsibility for the valuation of the Fund's investments to the Fair Value Committee (the Committee) established by the Fund's investment adviser. In accordance with valuation policies and procedures approved by the Board, the Fund attempts to obtain prices from one or more third party pricing vendors or brokers to value its investments. When current market prices, quotations or currency exchange rates are not readily available or reliable, investments will be fair valued in good faith by the Committee, in accordance with procedures adopted by the Board. Factors used in determining fair value vary by investment type and may include market or investment specific events, changes in interest rates and credit quality. The frequency with which these procedures are used cannot be predicted and they may be utilized to a significant extent. The Committee oversees the Fund's valuation policies and procedures and reports to the Board on the Committee's activities and fair value determinations. The Board monitors the appropriateness of the procedures used in valuing the Fund's investments and ratifies the fair value determinations of the Committee.
The Fund categorizes the inputs to valuation techniques used to value its investments into a disclosure hierarchy consisting of three levels as shown below:
- Level 1 – quoted prices in active markets for identical investments
- Level 2 – other significant observable inputs (including quoted prices for similar investments, interest rates, prepayment speeds, etc.)
- Level 3 – unobservable inputs (including the Fund's own assumptions based on the best information available)
Valuation techniques used to value the Fund's investments by major category are as follows:
Equity securities, including restricted securities, for which market quotations are readily available, are valued at the last reported sale price or official closing price as reported by a third party pricing vendor on the primary market or exchange on which they are traded and are categorized as Level 1 in the hierarchy. In the event there were no sales during the day or closing prices are not available, securities are valued at the last quoted bid price or may be valued using the last available price and are generally categorized as Level 2 in the hierarchy. For foreign equity securities, when market or security specific events arise, comparisons to the valuation of American Depositary Receipts (ADRs), futures contracts, Exchange-Traded Funds (ETFs) and certain indexes as well as quoted prices for similar securities may be used and would be categorized as Level 2 in the hierarchy. For equity securities, including restricted securities, where observable inputs are limited, assumptions about market activity and risk are used and these securities may be categorized as Level 3 in the hierarchy.
Debt securities, including restricted securities, are valued based on evaluated prices received from third party pricing vendors or from brokers who make markets in such securities. U.S. government and government agency obligations are valued by pricing vendors who utilize matrix pricing which considers yield or price of bonds of comparable quality, coupon, maturity and type or by broker-supplied prices. When independent prices are unavailable or unreliable, debt securities may be valued utilizing pricing methodologies which consider similar factors that would be used by third party pricing vendors. Debt securities are generally categorized as Level 2 in the hierarchy but may be Level 3 depending on the circumstances. ETFs are valued at their last sale price or official closing price as reported by a third party pricing vendor on the primary market or exchange on which they are traded and are categorized as Level 1 in the hierarchy. In the event there were no sales during the day but the exchange reports a closing bid level, ETFs are valued at the closing bid and would be categorized as Level 1 in the hierarchy. In the event there was no closing bid, ETFs may be valued by another method that the Board believes reflects fair value in accordance with the Board's fair value pricing policies and may be categorized as Level 2 in the hierarchy.
Futures contracts are valued at the settlement price established each day by the board of trade or exchange on which they are traded and are categorized as Level 1 in the hierarchy. Investments in open-end mutual funds, including the Fidelity Central Funds, are valued at their closing net asset value (NAV) each business day and are categorized as Level 1 in the hierarchy. If an unaffiliated open-end mutual fund's NAV is unavailable, shares of that fund may be valued by another method that the Board believes reflects fair value in accordance with the Board's fair value pricing policies and is categorized as Level 2 in the hierarchy.
Changes in valuation techniques may result in transfers in or out of an assigned level within the disclosure hierarchy. The aggregate value of investments by input level as of February 29, 2020 is included at the end of the Fund's Schedule of Investments.
Foreign Currency. The Fund may use foreign currency contracts to facilitate transactions in foreign-denominated securities. Gains and losses from these transactions may arise from changes in the value of the foreign currency or if the counterparties do not perform under the contracts' terms.
Foreign-denominated assets, including investment securities, and liabilities are translated into U.S. dollars at the exchange rates at period end. Purchases and sales of investment securities, income and dividends received and expenses denominated in foreign currencies are translated into U.S. dollars at the exchange rate in effect on the transaction date.
The effects of exchange rate fluctuations on investments are included with the net realized and unrealized gain (loss) on investment securities. Other foreign currency transactions resulting in realized and unrealized gain (loss) are disclosed separately.
Investment Transactions and Income. For financial reporting purposes, the Fund's investment holdings and NAV include trades executed through the end of the last business day of the period. The NAV per share for processing shareholder transactions is calculated as of the close of business of the New York Stock Exchange (NYSE), normally 4:00 p.m. Eastern time and includes trades executed through the end of the prior business day. Gains and losses on securities sold are determined on the basis of identified cost. Dividend income is recorded on the ex-dividend date, except for certain dividends from foreign securities where the ex-dividend date may have passed, which are recorded as soon as the Fund is informed of the ex-dividend date. Non-cash dividends included in dividend income, if any, are recorded at the fair market value of the securities received. Income and capital gain distributions from Fidelity Central Funds, if any, are recorded on the ex-dividend date. Income and capital gain distributions from Underlying Funds and distributions from ETFs, if any, are recorded on the ex-dividend date. Certain distributions received by the Fund represent a return of capital or capital gain. The Fund determines the components of these distributions subsequent to the ex-dividend date, based upon receipt of tax filings or other correspondence relating to the underlying investment. These distributions are recorded as a reduction of cost of investments and/or as a realized gain. Interest income is accrued as earned and includes coupon interest and amortization of premium and accretion of discount on debt securities as applicable. Investment income is recorded net of foreign taxes withheld where recovery of such taxes is uncertain.
Expenses. Expenses directly attributable to a fund are charged to that fund. Expenses attributable to more than one fund are allocated among the respective funds on the basis of relative net assets or other appropriate methods. Expense estimates are accrued in the period to which they relate and adjustments are made when actual amounts are known.
Deferred Trustee Compensation. Under a Deferred Compensation Plan (the Plan), certain independent Trustees have elected to defer receipt of a portion of their annual compensation. Deferred amounts are invested in a cross-section of Strategic Advisers funds, are marked-to-market and remain in the Fund until distributed in accordance with the Plan. The investment of deferred amounts and the offsetting payable to the Trustees of $282,406 are included in the accompanying Statement of Assets and Liabilities in other receivables and other payables and accrued expenses, respectively.
Income Tax Information and Distributions to Shareholders. Each year, the Fund intends to qualify as a regulated investment company under Subchapter M of the Internal Revenue Code, including distributing substantially all of its taxable income and realized gains. As a result, no provision for U.S. Federal income taxes is required. As of February 29, 2020, the Fund did not have any unrecognized tax benefits in the financial statements; nor is the Fund aware of any tax positions for which it is reasonably possible that the total amounts of unrecognized tax benefits will significantly change in the next twelve months. The Fund files a U.S. federal tax return, in addition to state and local tax returns as required. The Fund's federal income tax returns are subject to examination by the Internal Revenue Service (IRS) for a period of three fiscal years after they are filed. State and local tax returns may be subject to examination for an additional fiscal year depending on the jurisdiction. Foreign taxes are provided for based on the Fund's understanding of the tax rules and rates that exist in the foreign markets in which it invests. The Fund is subject to a tax imposed on capital gains by certain countries in which it invests. An estimated deferred tax liability for net unrealized appreciation on the applicable securities is included in Other payables and accrued expenses on the Statement of Assets & Liabilities.
Distributions are declared and recorded on the ex-dividend date. Income and capital gain distributions are determined in accordance with income tax regulations, which may differ from GAAP. In addition, the Fund claimed a portion of the payment made to redeeming shareholders as a distribution for income tax purposes.
Capital accounts within the financial statements are adjusted for permanent book-tax differences. These adjustments have no impact on net assets or the results of operations. Capital accounts are not adjusted for temporary book-tax differences which will reverse in a subsequent period.
Book-tax differences are primarily due to short-term gain distributions from the Underlying Funds, futures contracts, foreign currency transactions, certain foreign taxes, passive foreign investment companies (PFIC), market discount, deferred trustees compensation and losses deferred due to wash sales.
As of period end, the cost and unrealized appreciation (depreciation) in securities, and derivatives if applicable, for federal income tax purposes were as follows:
| Gross unrealized appreciation | $2,924,276,979 |
| Gross unrealized depreciation | (651,641,641) |
| Net unrealized appreciation (depreciation) | $2,272,635,338 |
| Tax Cost | $13,080,430,402 |
The tax-based components of distributable earnings as of period end were as follows:
| Undistributed ordinary income | $18,127,624 |
| Undistributed long-term capital gain | $119,463,435 |
| Net unrealized appreciation (depreciation) on securities and other investments | $2,272,753,914 |
The tax character of distributions paid was as follows:
| February 29, 2020 | February 28, 2019 | |
| Ordinary Income | $335,718,187 | $ 289,252,335 |
| Long-term Capital Gains | 211,438,207 | 670,812,563 |
| Total | $547,156,394 | $ 960,064,898 |
Restricted Securities. The Fund may invest in securities that are subject to legal or contractual restrictions on resale. These securities generally may be resold in transactions exempt from registration or to the public if the securities are registered. Disposal of these securities may involve time-consuming negotiations and expense, and prompt sale at an acceptable price may be difficult. Information regarding restricted securities is included at the end of the Fund's Schedule of Investments.
3. Derivative Instruments.
Risk Exposures and the Use of Derivative Instruments. The Fund's investment objective allows the Fund to enter into various types of derivative contracts, including futures contracts. Derivatives are investments whose value is primarily derived from underlying assets, indices or reference rates and may be transacted on an exchange or over-the-counter (OTC). Derivatives may involve a future commitment to buy or sell a specified asset based on specified terms, to exchange future cash flows at periodic intervals based on a notional principal amount, or for one party to make one or more payments upon the occurrence of specified events in exchange for periodic payments from the other party.
The Fund used derivatives to increase returns and to manage exposure to certain risks as defined below. The success of any strategy involving derivatives depends on analysis of numerous economic factors, and if the strategies for investment do not work as intended, the Fund may not achieve its objectives.
The Fund's use of derivatives increased or decreased its exposure to the following risk:
| Equity Risk | Equity risk relates to the fluctuations in the value of financial instruments as a result of changes in market prices (other than those arising from interest rate risk or foreign exchange risk), whether caused by factors specific to an individual investment, its issuer, or all factors affecting all instruments traded in a market or market segment. |
The Fund is also exposed to additional risks from investing in derivatives, such as liquidity risk and counterparty credit risk. Liquidity risk is the risk that the Fund will be unable to close out the derivative in the open market in a timely manner. Counterparty credit risk is the risk that the counterparty will not be able to fulfill its obligation to the Fund. Counterparty credit risk related to exchange-traded futures contracts may be mitigated by the protection provided by the exchange on which they trade.
Investing in derivatives may involve greater risks than investing in the underlying assets directly and, to varying degrees, may involve risk of loss in excess of any initial investment and collateral received and amounts recognized in the Statement of Assets and Liabilities. In addition, there may be the risk that the change in value of the derivative contract does not correspond to the change in value of the underlying instrument.
Futures Contracts. A futures contract is an agreement between two parties to buy or sell a specified underlying instrument for a fixed price at a specified future date. The Fund used futures contracts to manage its exposure to the stock market.
Upon entering into a futures contract, a fund is required to deposit either cash or securities (initial margin) with a clearing broker in an amount equal to a certain percentage of the face value of the contract. Futures contracts are marked-to-market daily and subsequent daily payments (variation margin) are made or received by a fund depending on the daily fluctuations in the value of the futures contracts and are recorded as unrealized appreciation or (depreciation). This receivable and/or payable, if any, is included in daily variation margin on futures contracts in the Statement of Assets and Liabilities. Realized gain or (loss) is recorded upon the expiration or closing of a futures contract. The net realized gain (loss) and change in net unrealized appreciation (depreciation) on futures contracts during the period is presented in the Statement of Operations.
Any open futures contracts at period end are presented in the Schedule of Investments under the caption "Futures Contracts". The notional amount at value reflects each contract's exposure to the underlying instrument or index at period end. Securities deposited to meet initial margin requirements are identified in the Schedule of Investments.
4. Purchases and Sales of Investments.
Purchases and sales of securities, other than short-term securities and U.S. government securities, are noted in the table below.
| Purchases ($) | Sales ($) | |
| Strategic Advisers International Fund | 5,168,530,614 | 5,900,264,268 |
Exchanges In-Kind. During the period, the Fund redeemed 122,639,719 shares of T. Rowe Price Overseas Stock Fund I Class in exchange for investments and cash with a value of $1,292,622,641. The net realized loss of $(31,647,358) on the Fund's redemptions of T. Rowe Price Overseas Stock Fund I Class shares are included in "Net realized gain (loss) on Investment securities: Unaffiliated issuers" in the accompanying Statement of Operations. The Fund recognized a net realized loss on the exchanges for federal income tax purposes.
5. Fees and Other Transactions with Affiliates.
Management Fee. Strategic Advisers (the investment adviser) provides the Fund with investment management related services. For these services, the Fund pays a monthly management fee to the investment adviser. The management fee is calculated by adding the annual management fee rate of .25% of the Fund's average net assets throughout the month payable to the investment adviser to the aggregate of the fee rates, payable monthly, to the Fund's sub-advisers. The Fund's maximum aggregate management fee will not exceed 1.00% of the Fund's average net assets. For the reporting period, the total annual management fee rate was .42% of the Fund's average net assets.
During the period, the investment adviser waived a portion of its management fee as described in the Expense Reductions note.
Sub-Advisers. Arrowstreet Capital, Limited Partnership, Causeway Capital Management, LLC, Massachusetts Financial Services Company (MFS), Thompson, Siegel & Walmsley LLC, T. Rowe Price Associates, Inc. and William Blair Investment Management, LLC each served as a sub-adviser for the Fund during the period. Sub-advisers provide discretionary investment advisory services for their allocated portion of the Fund's assets and are paid by the investment adviser and not the Fund for providing these services.
FIAM LLC (an affiliate of the investment adviser), FIL Investment Advisors and Geode Capital Management, LLC, have been retained to serve as a sub-adviser for the Fund. As of the date of this report, these sub-advisers have not been allocated any portion of the Fund's assets. These sub-advisers in the future may provide discretionary investment advisory services for an allocated portion of the Fund's assets and will be paid by the investment adviser for providing these services.
Accounting and Security Lending Fees. Fidelity Service Company, Inc. (FSC), an affiliate of the investment adviser, maintains the Fund's accounting records. The accounting fee is based on the level of average net assets for each month. Prior to April 1, 2019, FSC had a separate agreement with the Fund for administration of the security lending program, based on the number and duration of lending transactions. Effective July 1, 2019 accounting fees are not paid by the Fund and are instead paid by the investment adviser or an affiliate. For the period, the total fees paid for accounting and administration of securities lending were equivalent to less than .005%.
Brokerage Commissions. A portion of portfolio transactions were placed with brokerage firms which are affiliates of the investment adviser. Brokerage commissions are included in net realized gain (loss) and change in net unrealized appreciation (depreciation) in the Statement of Operations. The commissions paid to these affiliated firms were as follows:
| Amount | |
| Strategic Advisers International Fund | $1,394 |
Interfund Trades. Funds may purchase from or sell securities to other funds affiliated with each sub-adviser under procedures adopted by the Board. The procedures have been designed to ensure these interfund trades are executed in accordance with Rule 17a-7 of the 1940 Act. Interfund trades are included within the respective purchases and sales amounts shown in the Purchases and Sales of Investments note.
6. Investments in Fidelity Central Funds.
The Fund invests in Fidelity Central Funds, which are open-end investment companies available only to other investment companies and accounts managed by the investment adviser and its affiliates. The Fund's Schedule of Investments lists each of the Fidelity Central Funds held as of period end, if any, as an investment of the Fund, but does not include the underlying holdings of each Fidelity Central Fund. As an Investing Fund, the Fund indirectly bears its proportionate share of the expenses of the underlying Fidelity Central Funds.
The Fidelity Money Market Central Funds are managed by FMR. Annualized expenses of the Money Market Central Funds as of their most recent shareholder report date ranged from less than .005% to .01%.
A complete unaudited list of holdings for each Fidelity Central Fund is available upon request or at the Securities and Exchange Commission (the SEC) website at www.sec.gov. In addition, the financial statements of the Fidelity Central Funds, which are not covered by the Fund's Report of Independent Registered Public Accounting Firm, are available on the SEC website or upon request.
7. Committed Line of Credit.
Certain Funds participate with other funds managed by the investment adviser or an affiliate in a $4.25 billion credit facility (the "line of credit") to be utilized for temporary or emergency purposes to fund shareholder redemptions or for other short-term liquidity purposes. The participating funds have agreed to pay commitment fees on their pro-rata portion of the line of credit, which are reflected in Miscellaneous expenses on the Statement of Operations, and are as follows:
| Amount | |
| Strategic Advisers International Fund | $40,554 |
During the period, there were no borrowings on this line of credit.
8. Security Lending.
The Fund lends portfolio securities through a lending agent from time to time in order to earn additional income. On the settlement date of the loan, the Fund receives collateral (in the form of U.S. Treasury obligations, letters of credit and/or cash) against the loaned securities and maintains collateral in an amount not less than 100% of the market value of the loaned securities during the period of the loan. The market value of the loaned securities is determined at the close of business of the Fund and any additional required collateral is delivered to the Fund on the next business day. The Fund or borrower may terminate the loan at any time, and if the borrower defaults on its obligation to return the securities loaned because of insolvency or other reasons, the Fund may apply collateral received from the borrower against the obligation. The Fund may experience delays and costs in recovering the securities loaned. Any cash collateral received is invested in the Fidelity Securities Lending Cash Central Fund. The value of loaned securities and cash collateral at period end are disclosed on the Fund's Statement of Assets and Liabilities. Security lending income represents the income earned on investing cash collateral, less rebates paid to borrowers and any lending agent fees associated with the loan, plus any premium payments received for lending certain types of securities. Security lending income is presented in the Statement of Operations as a component of income from Fidelity Central Funds.
9. Expense Reductions.
The investment adviser has contractually agreed to waive the Fund's management fee in an amount equal to .25% of the Fund's average net assets until September 30, 2022. During the period, this waiver reduced the Fund's management fee by $40,275,872.
In addition, through arrangements with the Fund's custodian and transfer agent, credits realized as a result of certain uninvested cash balances were used to reduce the Fund's expenses by $31,663 and $153, respectively.
10. Other.
The Fund's organizational documents provide former and current trustees and officers with a limited indemnification against liabilities arising in connection with the performance of their duties to the Fund. In the normal course of business, the Fund may also enter into contracts that provide general indemnifications. The Fund's maximum exposure under these arrangements is unknown as this would be dependent on future claims that may be made against the Fund. The risk of material loss from such claims is considered remote.
The Fund does not invest in the Underlying Funds for the purpose of exercising management or control; however, investments by the Fund within its principal investment strategies may represent a significant portion of an Underlying Fund's net assets.
At the end of the period, the Fund was the owner of record of 10% or more of the total outstanding shares of the following Underlying Funds:
| Fidelity International Discovery Fund | 15% |
| Fidelity Japan Smaller Companies Fund | 17% |
| Fidelity Advisor Japan Fund | 15% |
11. Coronavirus (Covid-19) Pandemic.
An outbreak of COVID-19 first detected in China during December 2019 has since spread globally and was declared a pandemic by the World Health Organization during March 2020. Developments that disrupt global economies and financial markets, such as the COVID-19 pandemic, may magnify factors that affect the Fund's performance.
Report of Independent Registered Public Accounting Firm
To the Board of Trustees of Fidelity Rutland Square Trust II and Shareholders of Strategic Advisers International Fund
Opinion on the Financial Statements
We have audited the accompanying statement of assets and liabilities, including the schedule of investments, of Strategic Advisers International Fund (one of the funds constituting Fidelity Rutland Square Trust II, referred to hereafter as the “Fund”) as of February 29, 2020, the related statement of operations for the year ended February 29, 2020, the statement of changes in net assets for each of the two years in the period ended February 29, 2020, including the related notes, and the financial highlights for each of the five years in the period ended February 29, 2020 (collectively referred to as the “financial statements”). In our opinion, the financial statements present fairly, in all material respects, the financial position of the Fund as of February 29, 2020, the results of its operations for the year then ended, the changes in its net assets for each of the two years in the period ended February 29, 2020 and the financial highlights for each of the five years in the period ended February 29, 2020 in conformity with accounting principles generally accepted in the United States of America.
Basis for Opinion
These financial statements are the responsibility of the Fund’s management. Our responsibility is to express an opinion on the Fund’s financial statements based on our audits. We are a public accounting firm registered with the Public Company Accounting Oversight Board (United States) (PCAOB) and are required to be independent with respect to the Fund in accordance with the U.S. federal securities laws and the applicable rules and regulations of the Securities and Exchange Commission and the PCAOB.
We conducted our audits of these financial statements in accordance with the standards of the PCAOB. Those standards require that we plan and perform the audit to obtain reasonable assurance about whether the financial statements are free of material misstatement, whether due to error or fraud.
Our audits included performing procedures to assess the risks of material misstatement of the financial statements, whether due to error or fraud, and performing procedures that respond to those risks. Such procedures included examining, on a test basis, evidence regarding the amounts and disclosures in the financial statements. Our audits also included evaluating the accounting principles used and significant estimates made by management, as well as evaluating the overall presentation of the financial statements. Our procedures included confirmation of securities owned as of February 29, 2020 by correspondence with the custodian and brokers; when replies were not received from brokers, we performed other auditing procedures. We believe that our audits provide a reasonable basis for our opinion.
PricewaterhouseCoopers LLP
Boston, Massachusetts
April 14, 2020
We have served as the auditor of one or more investment companies in the Fidelity group of funds since 1932.
Trustees and Officers
The Trustees, Members of the Advisory Board (if any), and officers of the trust and fund, as applicable, are listed below. The Board of Trustees governs the fund and is responsible for protecting the interests of shareholders. The Trustees are experienced executives who meet periodically throughout the year to oversee the fund's activities, review contractual arrangements with companies that provide services to the fund, oversee management of the risks associated with such activities and contractual arrangements, and review the fund's performance. If the interests of the fund and an underlying Fidelity® fund were to diverge, a conflict of interest could arise and affect how the Trustees and Members of the Advisory Board fulfill their fiduciary duties to the affected funds. Strategic Advisers has structured the fund to avoid these potential conflicts, although there may be situations where a conflict of interest is unavoidable. In such instances, Strategic Advisers, the Trustees, and Members of the Advisory Board would take reasonable steps to minimize and, if possible, eliminate the conflict. Each of the Trustees oversees 14 funds.
The Trustees hold office without limit in time except that (a) any Trustee may resign; (b) any Trustee may be removed by written instrument, signed by at least two-thirds of the number of Trustees prior to such removal; (c) any Trustee who requests to be retired or who has become incapacitated by illness or injury may be retired by written instrument signed by a majority of the other Trustees; and (d) any Trustee may be removed at any special meeting of shareholders by a two-thirds vote of the outstanding voting securities of the trust. Officers and Advisory Board Members hold office without limit in time, except that any officer or Advisory Board Member may resign or may be removed by a vote of a majority of the Trustees at any regular meeting or any special meeting of the Trustees. Except as indicated, each individual has held the office shown or other offices in the same company for the past five years.
Each Trustee who is not an interested person (as defined in the 1940 Act) of the trust and the fund is referred to herein as an Independent Trustee.
The fund’s Statement of Additional Information (SAI) includes more information about the Trustees. To request a free copy, call Fidelity at 1-800-544-3455.
Experience, Skills, Attributes, and Qualifications of the Trustees. The Governance and Nominating Committee has adopted a statement of policy that describes the experience, qualifications, attributes, and skills that are necessary and desirable for potential Independent Trustee candidates (Statement of Policy). The Board believes that each Trustee satisfied at the time he or she was initially elected or appointed a Trustee, and continues to satisfy, the standards contemplated by the Statement of Policy. The Governance and Nominating Committee may also engage professional search firms to help identify potential Independent Trustee candidates with experience, qualifications, attributes, and skills consistent with the Statement of Policy. Additional criteria based on the composition and skills of the current Independent Trustees, as well as experience or skills that may be appropriate in light of future changes to board composition, business conditions, and regulatory or other developments, may be considered by the professional search firms and the Governance and Nominating Committee. In addition, the Board takes into account the Trustees' commitment and participation in Board and committee meetings, as well as their leadership of standing and ad hoc committees throughout their tenure.
In determining that a particular Trustee was and continues to be qualified to serve as a Trustee, the Board has considered a variety of criteria, none of which, in isolation, was controlling. The Board believes that, collectively, the Trustees have balanced and diverse experience, qualifications, attributes, and skills, which allow the Board to operate effectively in governing the fund and protecting the interests of shareholders. Information about the specific experience, skills, attributes, and qualifications of each Trustee, which in each case led to the Board's conclusion that the Trustee should serve (or continue to serve) as a trustee of the fund, is provided below.
Board Structure and Oversight Function. Robert A. Lawrence is an interested person and currently serves as Chairman. The Trustees have determined that an interested Chairman is appropriate and benefits shareholders because an interested Chairman has a personal and professional stake in the quality and continuity of services provided to the fund. Independent Trustees exercise their informed business judgment to appoint an individual of their choosing to serve as Chairman, regardless of whether the Trustee happens to be independent or a member of management. The Independent Trustees have determined that they can act independently and effectively without having an Independent Trustee serve as Chairman and that a key structural component for assuring that they are in a position to do so is for the Independent Trustees to constitute a substantial majority for the Board. The Independent Trustees also regularly meet in executive session. Mary C. Farrell serves as the lead Independent Trustee and as such (i) acts as a liaison between the Independent Trustees and management with respect to matters important to the Independent Trustees and (ii) with management prepares agendas for Board meetings.
Fidelity® funds are overseen by different Boards of Trustees. The fund's Board oversees asset allocation funds. Other Boards oversee Fidelity's investment-grade bond, money market, and asset allocation funds, and Fidelity's equity and high income funds. The fund may invest in Fidelity® funds overseen by such other Boards. The use of separate Boards, each with its own committee structure, allows the Trustees of each group of Fidelity® funds to focus on the unique issues of the funds they oversee, including common research, investment, and operational issues.
The Trustees primarily operate as a full Board, but also operate in committees, to facilitate the timely and efficient consideration of all matters of importance to the Trustees, the fund, and fund shareholders and to facilitate compliance with legal and regulatory requirements and oversight of the fund's activities and associated risks. The Board has charged Strategic Advisers and its affiliates with (i) identifying events or circumstances the occurrence of which could have demonstrably adverse effects on the fund's business and/or reputation; (ii) implementing processes and controls to lessen the possibility that such events or circumstances occur or to mitigate the effects of such events or circumstances if they do occur; and (iii) creating and maintaining a system designed to evaluate continuously business and market conditions in order to facilitate the identification and implementation processes described in (i) and (ii) above. Because the day-to-day operations and activities of the fund are carried out by or through Strategic Advisers, its affiliates and other service providers, the fund's exposure to risks is mitigated but not eliminated by the processes overseen by the Trustees. Board oversight of different aspects of the fund's activities is exercised primarily through the full Board, but also through the Audit and Compliance Committee. Appropriate personnel, including but not limited to the fund's Chief Compliance Officer (CCO), FMR's internal auditor, the independent accountants, the fund's Treasurer and portfolio management personnel, make periodic reports to the Board's committees, as appropriate. The responsibilities of each standing committee, including their oversight responsibilities, are described further under "Standing Committees of the Trustees."
Interested Trustees*:
Correspondence intended for a Trustee who is an interested person may be sent to Fidelity Investments, 245 Summer Street, Boston, Massachusetts 02210.
Name, Year of Birth; Principal Occupations and Other Relevant Experience+
Brian B. Hogan (1964)
Year of Election or Appointment: 2018
Trustee
Mr. Hogan also serves as Trustee of other funds. Mr. Hogan serves as Head of Fidelity Investments’ Investment Solutions and Innovation organization (2018-present), and a Director of Strategic Advisers LLC (2018-present). Previously, Mr. Hogan served as a Director of Fidelity SelectCo, LLC (investment adviser firm, 2014-2019), President of FMR Co., Inc. (2009-2018), a Vice President of Fidelity's Equity and High Income funds (2009-2018), a Director of FMR Investment Management (UK) Limited (investment adviser firm, 2015-2018), Trustee of certain Fidelity® funds (2014-2018), President of the Equity Division of Fidelity Management & Research Company (investment adviser firm, 2009-2018), Senior Vice President, Equity Research of Fidelity Management & Research Company (2006-2009), and as a portfolio manager. Mr. Brian B. Hogan is not related to Mr. Colm A. Hogan.
Robert A. Lawrence (1952)
Year of Election or Appointment: 2016
Trustee
Chairman of the Board of Trustees
Mr. Lawrence also serves as Trustee of other funds. Previously, Mr. Lawrence served as a Member of the Advisory Board of certain funds. Prior to his retirement in 2008, Mr. Lawrence served as Vice President of certain Fidelity® funds (2006-2008), Senior Vice President, Head of High Income Division of Fidelity Management & Research Company (investment adviser firm, 2006-2008), and President of Fidelity Strategic Investments (investment adviser firm, 2002-2005).
* Determined to be an "Interested Trustee" by virtue of, among other things, his or her affiliation with the trust or various entities under common control with Strategic Advisers.
+ The information includes the Trustee's principal occupation during the last five years and other information relating to the experience, attributes, and skills relevant to the Trustee's qualifications to serve as a Trustee, which led to the conclusion that the Trustee should serve as a Trustee for the fund.
Independent Trustees:
Correspondence intended for an Independent Trustee may be sent to Fidelity Investments, P.O. Box 55235, Boston, Massachusetts 02205-5235.
Name, Year of Birth; Principal Occupations and Other Relevant Experience+
Peter C. Aldrich (1944)
Year of Election or Appointment: 2006
Trustee
Mr. Aldrich also serves as Trustee of other funds. Mr. Aldrich is a Director of the National Bureau of Economic Research, a Director of the funds of BlackRock Realty Group (2006-present), and a Director of LivelyHood, Inc. (private corporation, 2013-present). Previously, Mr. Aldrich served as a Trustee for the Fidelity Rutland Square Trust (2005-2010), a Managing Member of Poseidon, LLC (foreign private investment, 1998-2004), and Chairman and Managing Member of AEGIS, LLC (foreign private investment, 1997-2004). Mr. Aldrich previously was a founder, Chief Executive Officer, and Chairman of AEW Capital Management, L.P. (then “Aldrich, Eastman and Waltch, L.P.”). Mr. Aldrich also served as a Director of Zipcar, Inc. (car sharing services, 2001-2009) and as Faculty Chairman of The Research Council on Global Investment of The Conference Board (business and professional education non-profit, 1999-2004). Mr. Aldrich is a Member Emeritus of the Board of Trustees of the Museum of Fine Arts Boston and an Overseer of the Massachusetts Eye and Ear Infirmary.
Ralph F. Cox (1932)
Year of Election or Appointment: 2006
Trustee
Mr. Cox also serves as Trustee of other funds. Mr. Cox is President of RABAR Enterprises (management consulting for the petroleum industry). Mr. Cox is a Director of Abraxas Petroleum (exploration and production, 1999-present). Mr. Cox is a member of the Advisory Boards of the Business and Engineering Schools of Texas A&M University and the Engineering School of University of Texas at Austin. Previously, Mr. Cox served as a Trustee for the Fidelity Rutland Square Trust (2005-2010) and as an Advisory Director of CH2M Hill Companies (engineering, 1981-2011). Mr. Ralph F. Cox and Mr. Howard E. Cox, Jr. are not related.
Mary C. Farrell (1949)
Year of Election or Appointment: 2013
Trustee
Ms. Farrell also serves as Trustee of other funds. Ms. Farrell is a Director of the W.R. Berkley Corporation (insurance provider) and President (2009-present) and Director (2006-present) of the Howard Gilman Foundation (charitable organization). Previously, Ms. Farrell was Managing Director and Chief Investment Strategist at UBS Wealth Management USA and Co-Head of UBS Wealth Management Investment Strategy & Research Group (2003-2005). Ms. Farrell also served as Investment Strategist at PaineWebber (1982-2000) and UBS PaineWebber (2000-2002). Ms. Farrell serves as Chairman of the Board of Trustees of Yale-New Haven Hospital and on the Yale New Haven Health System Board and previously served as Trustee on the Board of Overseers of the New York University Stern School of Business.
Karen Kaplan (1960)
Year of Election or Appointment: 2006
Trustee
Ms. Kaplan also serves as Trustee of other funds. Ms. Kaplan is Chairman (2014-present) and Chief Executive Officer (2013-present) of Hill Holliday (advertising and specialized marketing). Ms. Kaplan is a Director of The Michaels Companies, Inc. (specialty retailer, 2015-present), Member of the Board of Governors of the Chief Executives’ Club of Boston (2010-present), Member of the Executive Committee of the Greater Boston Chamber of Commerce (2006-present), Advisory Board Member of the National Association of Corporate Directors Chapter (2012-present), Member of the Board of Trustees of the Post Office Square Trust (2012-present), Trustee of the Brigham and Women’s Hospital (2016-present), Overseer of the Boston Symphony Orchestra (2014-present), Member of the Board of Directors of The Advertising Council, Inc. (2016-present), and Member of the Ron Burton Training Village Executive Board of Advisors (2018-present). Previously, Ms. Kaplan served as an Advisory Board Member of Fidelity Rutland Square Trust (2006-2010), a member of the Clinton Global Initiative (2010-2015), Director of DSM (dba Delta Dental and DentaQuest) (2004-2014), Formal Appointee of the 2015 Baker-Polito Economic Development Council, Director of Vera Bradley Inc. (designer of women’s accessories, 2012-2015), Member of the Board of Directors of the Massachusetts Conference for Women (2008-2015), Member of the Board of Directors of Jobs for Massachusetts (2012-2015), President of the Massachusetts Women’s Forum (2008-2010), Treasurer of the Massachusetts Women’s Forum (2002-2006), and Vice Chair of the Board of the Massachusetts Society for the Prevention of Cruelty to Children (2003-2010).
Heidi L. Steiger (1953)
Year of Election or Appointment: 2017
Trustee
Ms. Steiger also serves as Trustee of other funds. Ms. Steiger serves as a member of the Global Advisory Board and Of Counsel to Signum Global Advisors (international policy and strategy, 2018-present), a guest lecturer in the joint degree program in Global Luxury Management at North Carolina State University (Raleigh, NC) and Skema (Paris) (2018-present), Managing Partner of Topridge Associates, LLC (consulting, 2005-present), a Non-Executive Director of CrowdBureau Corporation (financial technology company and index provider, 2018-present), and a member of the Board of Directors (2013-present) and Chair of the Audit Committee and member of the Membership and Executive Committees (2017-present) of Business Executives for National Security (nonprofit). Previously, Ms. Steiger served as Eastern Region President of The Private Client Reserve of U.S. Bancorp (banking and financial services, 2010-2015), Advisory Director of Berkshire Capital Securities, LLC (financial services, 2009-2010), President and Senior Advisor of Lowenhaupt Global Advisors, LLC (financial services, 2005-2007), and President and Contributing Editor of Worth Magazine (2004-2005) and held a variety of positions at Neuberger Berman Group, LLC (financial services, 1986-2004), including Partner and Executive Vice President and Global Head of Private Asset Management at Neuberger Berman (1999-2004). Ms. Steiger also served as a member of the Board of Directors of Nuclear Electric Insurance Ltd (insurer of nuclear utilities, 2006-2017), a member of the Board of Trustees and Audit Committee of the Eaton Vance Funds (2007-2010), a member of the Board of Directors of Aviva USA (formerly AmerUs) (insurance, 2004-2014), and a member of the Board of Trustees and Audit Committee and Chair of the Investment Committee of CIFG (financial guaranty insurance, 2009-2012), and a member of the Board of Directors of Kin Group Plc (formerly, Fitbug Holdings) (health and technology, 2016-2017).
+ The information includes the Trustee's principal occupation during the last five years and other information relating to the experience, attributes, and skills relevant to the Trustee's qualifications to serve as a Trustee, which led to the conclusion that the Trustee should serve as a Trustee for the fund.
Advisory Board Members and Officers:
Correspondence intended for an officer or Howard E. Cox, Jr. may be sent to Fidelity Investments, 245 Summer Street, Boston, Massachusetts 02210. Officers appear below in alphabetical order.
Name, Year of Birth; Principal Occupation
Howard E. Cox, Jr. (1944)
Year of Election or Appointment: 2009
Member of the Advisory Board
Mr. Cox also serves as Member of the Advisory Board of other funds. Mr. Cox is a Partner of Greylock (venture capital, 1971-present) and a Director of Stryker Corporation (medical products and services, 1974-present). Previously, Mr. Cox served as an Advisory Board Member of Fidelity Rutland Square Trust (2006-2010). Mr. Cox also serves as a Member of the Secretary of Defense's Business Board of Directors (2008-present), a Director of Business Executives for National Security (1997-present), a Director of the Brookings Institution (2010-present), a Director of the World Economic Forum’s Young Global Leaders Foundation (2009-present), and is a Member of the Harvard Medical School Board of Fellows (2002-present). Mr. Howard E. Cox, Jr. and Mr. Ralph F. Cox are not related.
Christine Marcks (1955)
Year of Election or Appointment: 2019
Member of the Advisory Board
Ms. Marcks also serves as Member of the Advisory Board of other Funds. Prior to her retirement, Ms. Marcks served as Chief Executive Officer and President – Prudential Retirement (2007-2017) and Vice President for Rollover and Retirement Income Strategies (2005-2007), Prudential Financial, Inc. (financial services). Previously, Ms. Marcks was Senior Vice President and Head of Financial Horizons (2002-2004) and Vice President, Strategic Marketing (2000-2002) of Voya Financial (formerly ING U.S.) (financial services), held numerous positions at Aetna Financial Services (financial services, 1987-2000) and served as an International Economist for the United States Department of the Treasury (1980-1987). Ms. Marcks also serves as a member of the Board of Trustees, Audit Committee and Benefits & Operations Committee of the YMCA Retirement Fund (2018-present), a non-profit organization providing retirement plan benefits to YMCA staff members, and as a member of the Board of Trustees of Assumption College (2019-present).
Elizabeth Paige Baumann (1968)
Year of Election or Appointment: 2017
Anti-Money Laundering (AML) Officer
Ms. Baumann also serves as AML Officer of other funds. She is Chief AML Officer (2012-present) and Senior Vice President (2014-present) of FMR LLC (diversified financial services company) and is an employee of Fidelity Investments. Previously, Ms. Baumann served as AML Officer of certain funds (2017-2019), as AML Officer of the funds (2012-2016), and Vice President (2007-2014) and Deputy Anti-Money Laundering Officer (2007-2012) of FMR LLC.
Craig S. Brown (1977)
Year of Election or Appointment: 2019
Assistant Treasurer
Mr. Brown also serves as Assistant Treasurer of other funds. Mr. Brown is an employee of Fidelity Investments (2013-present).
John J. Burke III (1964)
Year of Election or Appointment: 2018
Chief Financial Officer
Mr. Burke also serves as Chief Financial Officer of other funds. Mr. Burke serves as Head of Investment Operations for Fidelity Fund and Investment Operations (2018-present) and is an employee of Fidelity Investments (1998-present). Previously Mr. Burke served as head of Asset Management Investment Operations (2012-2018).
Jonathan Davis (1968)
Year of Election or Appointment: 2010
Assistant Treasurer
Mr. Davis also serves as Assistant Treasurer of other funds. Mr. Davis serves as Assistant Treasurer of FMR Capital, Inc. (2017-present) and is an employee of Fidelity Investments. Previously, Mr. Davis served as Vice President and Associate General Counsel of FMR LLC (diversified financial services company, 2003-2010).
Laura M. Del Prato (1964)
Year of Election or Appointment: 2018
Assistant Treasurer
Ms. Del Prato also serves as an officer of other funds. Ms. Del Prato is an employee of Fidelity Investments (2017-present). Prior to joining Fidelity Investments, Ms. Del Prato served as a Managing Director and Treasurer of the JPMorgan Mutual Funds (2014-2017). Prior to JPMorgan, Ms. Del Prato served as a partner at Cohen Fund Audit Services (accounting firm, 2012-2013) and KPMG LLP (accounting firm, 2004-2012).
James D. Gryglewicz (1972)
Year of Election or Appointment: 2015
Chief Compliance Officer
Mr. Gryglewicz also serves as Chief Compliance Officer of other funds. Mr. Gryglewicz serves as Compliance Officer of Strategic Advisers LLC (investment adviser firm, 2015-present), Senior Vice President of Asset Management Compliance (2009-present), and is an employee of Fidelity Investments (2004-present). Previously, Mr. Gryglewicz served as Compliance Officer of Fidelity SelectCo, LLC (investment adviser firm, 2014-2019), and as Chief Compliance Officer of certain Fidelity® funds (2014-2018).
Colm A. Hogan (1973)
Year of Election or Appointment: 2016
Assistant Treasurer
Mr. Hogan also serves as an officer of other funds. Mr. Hogan serves as Assistant Treasurer of FMR Capital, Inc. (2017-present) and is an employee of Fidelity Investments (2005-present). Previously, Mr. Hogan served as Deputy Treasurer of certain Fidelity® funds (2016-2020) and Assistant Treasurer of certain Fidelity® funds (2016-2018). Mr. Colm A. Hogan is not related to Mr. Brian B. Hogan.
Christina H. Lee (1975)
Year of Election or Appointment: 2020
Secretary and Chief Legal Officer
Ms. Lee also serves as Secretary and CLO of other funds. Ms. Lee serves as Vice President, Associate General Counsel (2014-present) and is an employee of Fidelity Investments (2007-present). Previously, Ms. Lee served as Assistant Secretary of certain funds (2018-2019).
Cynthia Lo Bessette (1969)
Year of Election or Appointment: 2020
Assistant Secretary
Ms. Lo Bessette also serves as an officer of other funds. Ms. Lo Bessette serves as CLO, Secretary, and Senior Vice President of Fidelity Management & Research Company LLC (investment adviser firm, 2019-present); and CLO of Fidelity Management & Research (Hong Kong) Limited, FMR Investment Management (UK) Limited, and Fidelity Management & Research (Japan) Limited (investment adviser firms, 2019-present). She is a Senior Vice President and Deputy General Counsel of FMR LLC (diversified financial services company, 2019-present), and is an employee of Fidelity Investments. Previously, Ms. Lo Bessette served as CLO, Secretary, and Senior Vice President of FMR Co., Inc. (investment adviser firm, 2019); Secretary of Fidelity SelectCo, LLC and Fidelity Investments Money Management, Inc. (investment adviser firms, 2019). Prior to joining Fidelity Investments, Ms. Lo Bessette was Executive Vice President, General Counsel (2016-2019) and Senior Vice President, Deputy General Counsel (2015-2016) of OppenheimerFunds (investment management company) and Deputy Chief Legal Officer (2013-2015) of Jennison Associates LLC (investment adviser firm).
Chris Maher (1972)
Year of Election or Appointment: 2016
Assistant Treasurer
Mr. Maher also serves as an officer of other funds. Mr. Maher serves as Assistant Treasurer of FMR Capital, Inc. (2017-present), and is an employee of Fidelity Investments (2008-present). Previously, Mr. Maher served as Assistant Treasurer of certain funds (2013-2020); Vice President of Asset Management Compliance (2013), Vice President of the Program Management Group of FMR (investment adviser firm, 2010-2013), and Vice President of Valuation Oversight (2008-2010).
Stacie M. Smith (1974)
Year of Election or Appointment: 2020
President and Treasurer
Ms. Smith also serves as an officer of other funds. Ms. Smith serves as Assistant Treasurer of FMR Capital, Inc. (2017-present), is an employee of Fidelity Investments (2009-present), and has served in other fund officer roles. Prior to joining Fidelity Investments, Ms. Smith served as Senior Audit Manager of Ernst & Young LLP (accounting firm, 1996-2009). Previously, Ms. Smith served as Assistant Treasurer (2013-2019) and Deputy Treasurer (2013-2016) of certain Fidelity® funds.
Marc L. Spector (1972)
Year of Election or Appointment: 2016
Assistant Treasurer
Mr. Spector also serves as an officer of other funds. Mr. Spector serves as Assistant Treasurer of FMR Capital, Inc. (2017-present) and is an employee of Fidelity Investments (2016-present). Prior to joining Fidelity Investments, Mr. Spector served as Director at the Siegfried Group (accounting firm, 2013-2016), and prior to Siegfried Group as audit senior manager at Deloitte & Touche LLP (accounting firm, 2005-2013).
Jim Wegmann (1979)
Year of Election or Appointment: 2019
Assistant Treasurer
Mr. Wegmann also serves as Assistant Treasurer of other funds. Mr. Wegmann is an employee of Fidelity Investments (2011-present).
Shareholder Expense Example
As a shareholder of the Fund, you incur two types of costs: (1) transaction costs and (2) ongoing costs, including management fees and other Fund expenses. This Example is intended to help you understand your ongoing costs (in dollars) of investing in the Fund and to compare these costs with the ongoing costs of investing in other mutual funds.
The Example is based on an investment of $1,000 invested at the beginning of the period and held for the entire period (September 1, 2019 to February 29, 2020).
Actual Expenses
The first line of the accompanying table provides information about actual account values and actual expenses. You may use the information in this line, together with the amount you invested, to estimate the expenses that you paid over the period. Simply divide your account value by $1,000.00 (for example, an $8,600 account value divided by $1,000.00 = 8.6), then multiply the result by the number in the first line under the heading entitled "Expenses Paid During Period" to estimate the expenses you paid on your account during this period. In addition to the direct expenses incurred by the Fund presented in the table, as a shareholder of the underlying mutual funds and exchange-traded funds (ETFs) (the Underlying Funds), the Fund also indirectly bears its proportionate share of the expenses of the Underlying Funds. In addition, the Fund, as a shareholder in the underlying Fidelity Central Funds, will indirectly bear its pro-rata share of the fees and expenses incurred by the underlying Fidelity Central Funds. These fees and expenses are not included in the Fund's annualized expense ratio used to calculate the expense estimate in the table below.
Hypothetical Example for Comparison Purposes
The second line of the accompanying table provides information about hypothetical account values and hypothetical expenses based on the Fund's actual expense ratio and an assumed rate of return of 5% per year before expenses, which is not the Fund's actual return. The hypothetical account values and expenses may not be used to estimate the actual ending account balance or expenses you paid for the period. You may use this information to compare the ongoing costs of investing in the Fund and other funds. To do so, compare this 5% hypothetical example with the 5% hypothetical examples that appear in the shareholder reports of the other funds. In addition to the direct expenses incurred by the Fund presented in the table, as a shareholder of the Underlying Funds, the Fund also indirectly bears its proportionate share of the expenses of the Underlying Funds. In addition, the Fund, as a shareholder in the underlying Fidelity Central Funds, will indirectly bear its pro-rata share of the fees and expenses incurred by the underlying Fidelity Central Funds. These fees and expenses are not included in the Fund's annualized expense ratio used to calculate the expense estimate in the table below.
Please note that the expenses shown in the table are meant to highlight your ongoing costs only and do not reflect any transaction costs. Therefore, the second line of the table is useful in comparing ongoing costs only, and will not help you determine the relative total costs of owning different funds.
| Annualized Expense Ratio-A | Beginning Account Value September 1, 2019 | Ending Account Value February 29, 2020 | Expenses Paid During Period-B September 1, 2019 to February 29, 2020 |
|
| Actual | .19% | $1,000.00 | $1,013.90 | $.95 |
| Hypothetical-C | $1,000.00 | $1,023.92 | $.96 |
A Annualized expense ratio reflects expenses net of applicable fee waivers.
B Expenses are equal to the Fund's annualized expense ratio, multiplied by the average account value over the period, multiplied by 182/366 (to reflect the one-half year period). The fees and expenses of the Underlying Funds in which the Fund invests are not included in the Fund's annualized expense ratio.
C 5% return per year before expenses
Distributions (Unaudited)
The Board of Trustees of Strategic Advisers International Fund voted to pay on April 9, 2020, to shareholders of record at the opening of business on April 8, 2020, a distribution of $0.077 per share derived from capital gains realized from sales of portfolio securities and a dividend of $0.012 per share from net investment income.
The fund hereby designates as a capital gain dividend with respect to the taxable year ended February 29, 2020, $189,015,336, or, if subsequently determined to be different, the net capital gain of such year.
The fund designates 18% and 1% of the dividends distributed in April and December, respectively during the fiscal year as qualifying for the dividends–received deduction for corporate shareholders.
The fund designates 69% and 92% of the dividends distributed in April and December, respectively during the fiscal year as amounts which may be taken into account as a dividend for the purposes of the maximum rate under section 1(h)(11) of the Internal Revenue Code.
The amounts per share which represent income derived from sources within, and taxes paid to, foreign countries or possessions of the United States are as follows:
| Pay Date | Income | Taxes | |
| Strategic Advisers International Fund | |||
| 04/08/19 | $0.0163 | $0.0007 | |
| 12/31/19 | $0.2066 | $0.0178 | |
The fund will notify shareholders in January 2021 of amounts for use in preparing 2020 income tax returns.
Board Approval of Investment Advisory Contracts and Management Fees
Strategic Advisers International Fund
On September 4, 2019, the Board of Trustees, including the Independent Trustees (together, the Board) voted at an in-person meeting to approve an investment advisory agreement (the Sub-Advisory Agreement) with T. Rowe Price Associates, Inc. (New Sub-Adviser) for the fund.The Board, assisted by the advice of fund counsel and Independent Trustees' counsel, considered a broad range of information it believed relevant to the approval of the Sub-Advisory Agreement.In considering whether to approve the Sub-Advisory Agreement, the Board reached a determination, with the assistance of fund counsel and Independent Trustees' counsel and through the exercise of its business judgment, that the approval of the Sub-Advisory Agreement is in the best interests of the fund and its shareholders and that the approval of such agreement does not involve a conflict of interest from which Strategic Advisers LLC (Strategic Advisers) or its affiliates derive an inappropriate advantage. Also, the Board found that the sub-advisory fees to be charged under the Sub-Advisory Agreement bear a reasonable relationship to the services to be rendered and will be based upon services provided that will be in addition to, rather than duplicative of services provided under the advisory contract of any underlying fund in which the fund may invest. The Board's decision to approve the Sub-Advisory Agreement was not based on any single factor, but rather was based on a comprehensive consideration of all the information provided to the Board. In addition, individual Trustees did not necessarily attribute the same weight or importance to each factor Nature, Extent, and Quality of Services Provided. The Board considered the backgrounds of the investment personnel that will provide services to the fund, and also took into consideration the fund's investment objective, strategies and related investment philosophy and current sub-adviser line-up. The Board also considered the structure of the New Sub-Adviser's portfolio manager compensation program and whether this structure provides appropriate incentives to act in the best interests of the fund. The Board noted that it is familiar with the nature, extent and quality of services provided by the Sub-Adviser from its oversight of the Sub-Adviser on behalf of other funds overseen by the Board and that the same support staff, including compliance personnel, that currently provides services to other Strategic Advisers funds will also provide services to the fund. Resources Dedicated to Investment Management and Support Services. The Board reviewed the general qualifications and capabilities of the New Sub-Adviser's investment staff, its use of technology, and the New Sub-Adviser's approach to managing and compensating its investment personnel. The Board noted that the Sub-Adviser will utilize a different investment mandate to manage the fund than it currently uses in managing other Strategic Advisers funds and reviewed the general qualifications and capabilities of the investment staff that will provide services to the fund and its use of technology. The Board noted that the New Sub-Adviser's analysts have extensive resources, tools and capabilities which allow them to conduct sophisticated fundamental and/or quantitative analysis. Additionally, in its deliberations, the Board considered the New Sub-Adviser's trading capabilities and resources which are integral parts of the investment management process. Shareholder and Administrative Services. The Board considered (i) the nature, extent, quality, and cost of advisory services to be performed by the New Sub-Adviser under the Sub-Advisory Agreement and (ii) the resources to be devoted to the fund's compliance policies and procedures. Investment Performance. The Board also considered the historical investment performance of the New Sub-Adviser and the portfolio managers in managing accounts under a similar investment mandate.Based on its review, the Board concluded that the nature, extent, and quality of services that will be provided to the fund under each the Sub-Advisory Agreement should benefit the fund's shareholders. Competitiveness of Management Fee and Total Fund Expenses. In reviewing the Sub-Advisory Agreement, the Board considered the amount and nature of fees to be paid by the fund to the fund's investment adviser, Strategic Advisers, the amount and nature of fees to be paid by Strategic Advisers to the New Sub-Adviser and the projected change in the fund's management fee and total operating expenses, if any, as a result of hiring the New Sub-Adviser.The Board noted that the fund's maximum aggregate annual management fee rate may not exceed 1.00% of the fund's average daily net assets and that the Sub-Advisory Agreement will not result in a change to the maximum aggregate annual management fee payable by the fund or Strategic Advisers' portion of the management fee. The Board considered Strategic Advisers' contractual agreement to waive its 0.25% portion of the fund's management fee through September 30, 2021, and its proposal to extend the waiver through September 30, 2022. The Board also considered that after allocating assets to the New Sub-Adviser, the fund's management fee and total net expenses are expected to continue to rank below the competitive peer group medians presented to you in the June 2019 management contract renewal materials.Based on its review, the Board concluded that the fund's management fee structure and any changes to projected total expenses bear a reasonable relationship to the services that the fund and its shareholders will receive and the other factors considered.Because the Sub-Advisory Agreement was negotiated at arm's length and will have no impact on the maximum management fees payable by the fund or Strategic Advisers' portion of the management fee, the Board did not consider the costs of services and profitability to be significant factors in its decision to approve each Sub-Advisory Agreement. Potential Fall-Out Benefits. The Board considered that it reviews information regarding the potential of direct and indirect benefits to Strategic Advisers and its affiliates from their relationships with the fund, including non-advisory fee compensation paid to affiliates of Strategic Advisers, if any, as well as information regarding potential fall-out benefits accruing to each sub-adviser, if any, as a result of its relationship with the fund, during its annual renewal of the fund's advisory agreement with Strategic Advisers and the fund's sub-advisory agreements. With respect to the New Sub-Adviser, the Board considered management's representation that it does not anticipate that the hiring of the New Sub-Adviser will have a significant impact on the potential for fall-out benefits to Strategic Advisers or its affiliates. Possible Economies of Scale. The Board considered that it reviews whether there have been economies of scale in connection with the management of the fund during its annual renewal of the fund's advisory agreement with Strategic Advisers and the fund's sub-advisory agreements. The Board noted that the Sub-Advisory Agreement provides for breakpoints that have the potential to reduce sub-advisory fees paid to the New Sub-Adviser as assets allocated to the New Sub-Adviser grow. Conclusion. Based on its evaluation of all of the conclusions noted above, and after considering all factors it believed relevant, the Board ultimately concluded that the Sub-Advisory Agreement's fee structure bears a reasonable relationship to the services to be rendered and that the Sub-Advisory Agreement should be approved because the agreement is in the best interests of the fund and its shareholders. The Board also concluded that the sub-advisory fees to be charged thereunder will be based on services provided that will be in addition to, rather than duplicative of services provided under the advisory contract of any underlying fund in which the fund may invest. In addition, the Board concluded that the approval of the Sub-Advisory Agreement does not involve a conflict of interest from which Strategic Advisers or its affiliates derive an inappropriate advantage.Board Approval of Investment Advisory Contracts and Management Fees
Strategic Advisers International Fund
Each year, the Board of Trustees, including the Independent Trustees (together, the Board), votes at an in-person meeting on the renewal of the management contract with Strategic Advisers LLC (Strategic Advisers) and the sub-advisory agreements with Arrowstreet Capital, Limited Partnership (Arrowstreet), Causeway Capital Management LLC (Causeway), FIAM LLC, FIL Investment Advisors (FIL), Geode Capital Management, LLC (Geode), Massachusetts Financial Services Company (MFS), Thompson, Siegel & Walmsley, LLC (TSW), and William Blair Investment Management, LLC (William Blair) (each a Sub-Adviser and collectively, the Sub-Advisers) (collectively, the Sub-Advisory Agreements), and the sub-sub-advisory agreement with FIL Investment Advisors (UK) Limited (the Sub-Sub-Advisory Agreement and, together with the management contract and the Sub-Advisory Agreements, the Advisory Contracts) for the fund. Strategic Advisers and the Sub-Advisers are referred to herein as the Investment Advisers. The Board, assisted by the advice of fund counsel and Independent Trustees' counsel, requests and considers a broad range of information relevant to the renewal of the Advisory Contracts throughout the year.The Board meets at least four times per year and, at each of its meetings, covers an extensive agenda of topics and materials and considers factors that are relevant to its annual consideration of the renewal of the fund's Advisory Contracts, including the services and support provided to the fund and its shareholders. The full Board or the Independent Trustees, as appropriate, act on all major matters; however, a portion of the activities of the Board (including certain of those described herein) may be conducted through standing committees that have been established by the Board. The Board, acting directly and through its committees, requests and receives information concerning the annual consideration of the renewal of the fund's Advisory Contracts.At its September 2019 meeting, the Board, including the Independent Trustees, unanimously determined to renew the fund's Advisory Contracts. In addition, the Board approved amendments to the sub-advisory agreements with: (i) Arrowstreet, FIL, Geode, and William Blair to add certain exceptions to the most favored nation (MFN) provision in each such sub-advisory agreement; and (ii) Causeway, MFS, and TSW to both expand the scope of, and add certain exceptions to, the MFN provision in each such sub-advisory agreement. Where applicable, the Board also approved non-material amendments to these sub-advisory agreements. The Board noted that the other terms of each amended sub-advisory agreement are not materially different from those of the applicable existing sub-advisory agreement and that Arrowstreet, Causeway, FIL, Geode, MFS, TSW, and William Blair each will continue to provide the same services to the fund.In reaching its determination to renew the fund's Advisory Contracts and approve the amendments to the sub-advisory agreements described above (Amendments), the Board considered all factors it believed relevant, including (i) the nature, extent, and quality of the services provided to the fund and its shareholders (including the investment performance of the fund); (ii) the competitiveness of the fund's management fee and total expenses relative to peer funds; (iii) the total costs of the services provided by and the profits, if any, realized by Strategic Advisers from its relationships with the fund; and (iv) the extent to which, if any, economies of scale exist and are realized as the fund grows and whether any economies of scale are appropriately shared with fund shareholders.In considering whether to renew the Advisory Contracts for the fund and approve the Amendments, the Board reached a determination, with the assistance of fund counsel and Independent Trustees' counsel and through the exercise of its business judgment, that the renewal of the Advisory Contracts and the approval of the Amendments is in the best interests of the fund and its shareholders. In addition, with respect to the Sub-Advisory Agreements, the Board also concluded that the renewal of such agreements and the approval of the Amendments do not involve a conflict of interest from which Strategic Advisers or its affiliates derive an inappropriate advantage. Also, the Board found that the advisory fees charged under the Advisory Contracts bear a reasonable relationship to the services rendered and are based on services provided that are in addition to, rather than duplicative of, services provided under the advisory contract of any underlying fund in which the fund may invest. The Board's decision to renew the Advisory Contracts and approve the Amendments was not based on any single factor, but rather was based on a comprehensive consideration of all the information provided to the Board throughout the year. Nature, Extent, and Quality of Services Provided. The Board considered the staffing within the Investment Advisers, including the backgrounds of the fund's investment personnel and also considered the fund's investment objective, strategies, and related investment philosophy. The Independent Trustees also had discussions with senior management of Strategic Advisers' investment operations and investment groups. The Board considered the structure of each Investment Adviser's investment personnel compensation program and whether such structures provide appropriate incentives to act in the best interests of the fund.The Trustees also discussed with representatives of Strategic Advisers, at meetings throughout the year, Strategic Advisers' role in, among other things, (i) setting, implementing and monitoring the investment strategies for the funds; (ii) identifying and recommending sub-advisers for the funds; (iii) overseeing compliance with federal securities laws by each sub-adviser with respect to the portion of fund assets allocated to the sub-adviser; (iv) monitoring and overseeing the performance and investment capabilities of each sub-adviser; and (v) recommending the replacement of a sub-adviser as appropriate. The Trustees considered that the Board had received from Strategic Advisers substantial information and periodic reports about Strategic Advisers' sub-adviser oversight and due diligence processes, as well as periodic reports regarding the performance of each sub-adviser.The Board also considered the nature, extent and quality of services provided by each Sub-Adviser. The Trustees noted that under the Sub-Advisory Agreements subject to oversight by Strategic Advisers, each Sub-Adviser is responsible for, among other things, identifying investments for the portion of fund assets allocated to the Sub-Adviser, if any, and executing portfolio transactions to implement its investment strategy. In addition, the Trustees noted that each Sub-Adviser is responsible for providing such reporting as may be requested from Strategic Advisers to fulfill its oversight responsibilities discussed above. Resources Dedicated to Investment Management and Support Services. The Board reviewed the general qualifications and capabilities of the Investment Advisers’ investment staffs, their use of technology, and the Investment Advisers’ approach to managing and compensating investment personnel. The Board noted that the Investment Advisers’ analysts have extensive resources, tools, and capabilities that allow them to conduct sophisticated quantitative and/or fundamental analysis. Additionally, in its deliberations, the Board considered the Investment Advisers’ trading capabilities and resources and global compliance infrastructure, which are integral parts of the investment management process. Shareholder and Administrative Services. The Board considered (i) the nature, extent, quality, and cost of administrative and shareholder services performed by Strategic Advisers and its affiliates under the management contract and under separate agreements covering transfer agency, pricing and bookkeeping, and securities lending services for the fund; (ii) the nature and extent of Strategic Advisers' supervision of third party service providers, including sub-advisers, custodians and subcustodians; and (iii) the resources devoted to, and the record of compliance with, the fund's compliance policies and procedures. Investment Performance. The Board considered whether the fund has operated in accordance with its investment objective, as well as its record of compliance with its investment restrictions and its performance history.In connection with the renewal of the Advisory Contracts, the Board considered annualized return information for the fund for different time periods, measured against an appropriate securities market index ("benchmark index") and a peer group of mutual funds with similar objectives ("peer group").The Board considered discussions that occur at Board meetings throughout the year with representatives of Strategic Advisers about fund investment performance and the performance of each Sub-Adviser as part of regularly scheduled fund reviews and other reports to the Board on fund performance, taking into account various factors including general market conditions. In its discussions with representatives of Strategic Advisers regarding fund performance, the Board gave particular attention to information indicating underperformance of certain funds for specific time periods and discussed with Strategic Advisers the reasons for any such underperformance.The following charts considered by the Board show, over the one-, three-, and five-year periods ended December 31, 2018, the cumulative total returns of the fund and the cumulative total returns of an appropriate benchmark index and peer group. The box within each chart shows the 25th percentile return (75% beaten, top of box) and the 75th percentile return (25% beaten, bottom of box) of the peer group. Returns shown above the box are in the first quartile and returns shown below the box are in the fourth quartile. The percentage beaten number noted below each chart corresponds to the percentile box and represents the percentage of funds in the peer group whose performance was equal to or lower than that of the fund.Strategic Advisers International Fund

Strategic Advisers International Fund
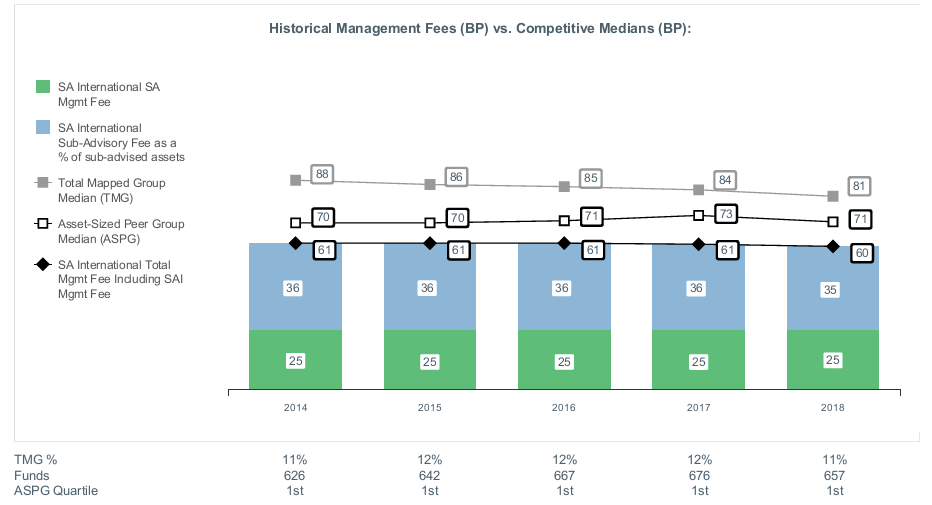
Liquidity Risk Management Program
The Securities and Exchange Commission adopted Rule 22e-4 under the Investment Company Act of 1940 (the Liquidity Rule) to promote effective liquidity risk management throughout the open-end investment company industry, thereby reducing the risk that funds will be unable to meet their redemption obligations and mitigating dilution of the interests of fund shareholders.
The Fund has adopted and implemented a liquidity risk management program (the Program) reasonably designed to assess and manage the Fund’s liquidity risk and to comply with the requirements of the Liquidity Rule. The Fund’s Board of Trustees (the Board) has designated the Fund’s investment adviser as administrator of the Program. Strategic Advisers has established a Liquidity Risk Management Committee (the LRM Committee) to manage the Program for each of the Funds. The LRM Committee monitors the adequacy and effectiveness of implementation of the Program and on a periodic basis assesses each Fund’s liquidity risk based on a variety of factors including (1) the Fund’s investment strategy, (2) portfolio liquidity and cash flow projections during normal and reasonably foreseeable stressed conditions, (3) shareholder redemptions and (4) borrowings and other funding sources, as applicable.
In accordance with the Program, each of the Fund’s portfolio investments is classified into one of four liquidity categories described below based on a determination of a reasonable expectation for how long it would take to convert the investment to cash (or sell or dispose of the investment) without significantly changing its market value.
- Highly liquid investments – cash or convertible to cash within three business days or less
- Moderately liquid investments – convertible to cash in three to seven calendar days
- Less liquid investments – can be sold or disposed of, but not settled, within seven calendar days
- Illiquid investments – cannot not be sold or disposed of within seven calendar days
Liquidity classification determinations take into account a variety of factors including various market, trading and investment-specific considerations, as well as market depth, and generally utilize analysis from a third-party liquidity metrics service.
The Liquidity Rule places a 15% limit on a fund’s illiquid investments and requires funds that do not primarily hold assets that are highly liquid investments to determine and maintain a minimum percentage of the fund’s net assets to be invested in highly liquid investments (highly liquid investment minimum or HLIM). The Program includes provisions reasonably designed to comply with the 15% limit on illiquid investments and for determining, periodically reviewing and complying with the HLIM requirement as applicable.
At a recent meeting of the Fund’s Board of Trustees, the LRM Committee provided a written report to the Board pertaining to the operation, adequacy, and effectiveness of implementation of the Program for the annual period from December 1, 2018 through November 30, 2019. The report concluded that the Program has been implemented and is operating effectively and is reasonably designed to assess and manage the Fund’s liquidity risk.
![]()
SIT-ANN-0420
1.912865.109
Strategic Advisers® Small-Mid Cap Fund
Offered exclusively to certain clients of Strategic Advisers LLC - not available for sale to the general public
February 29, 2020
See the inside front cover for important information about access to your fund’s shareholder reports.
Beginning on January 1, 2021, as permitted by regulations adopted by the Securities and Exchange Commission, paper copies of a fund’s shareholder reports will no longer be sent by mail, unless you specifically request paper copies of the reports from the fund or from your financial intermediary, such as a financial advisor, broker-dealer or bank. Instead, the reports will be made available on a website, and you will be notified by mail each time a report is posted and provided with a website link to access the report.
If you already elected to receive shareholder reports electronically, you will not be affected by this change and you need not take any action. You may elect to receive shareholder reports and other communications from a fund electronically, by contacting your financial intermediary. For Fidelity customers, visit Fidelity's web site or call Fidelity using the contact information listed below.
You may elect to receive all future reports in paper free of charge. If you wish to continue receiving paper copies of your shareholder reports, you may contact your financial intermediary or, if you are a Fidelity customer, visit Fidelity’s website, or call Fidelity at the applicable toll-free number listed below. Your election to receive reports in paper will apply to all funds held with the fund complex/your financial intermediary.
| Account Type | Website | Phone Number |
| Brokerage, Mutual Fund, or Annuity Contracts: | fidelity.com/mailpreferences | 1-800-343-3548 |
| Employer Provided Retirement Accounts: | netbenefits.fidelity.com/preferences (choose 'no' under Required Disclosures to continue to print) | 1-800-343-0860 |
| Advisor Sold Accounts Serviced Through Your Financial Intermediary: | Contact Your Financial Intermediary | Your Financial Intermediary's phone number |
| Advisor Sold Accounts Serviced by Fidelity: | institutional.fidelity.com | 1-877-208-0098 |
Contents
|
Board Approval of Investment Advisory Contracts and Management Fees | |
To view a fund's proxy voting record for the 12-month period ended June 30, visit http://www.fidelity.com/proxyvotingresults or visit the Securities and Exchange Commission's (SEC) web site at http://www.sec.gov.
You may also call 1-800-544-3455 to request a free copy of the proxy voting guidelines.
Standard & Poor's, S&P and S&P 500 are registered service marks of The McGraw-Hill Companies, Inc. and have been licensed for use by Fidelity Distributors Corporation.
Other third-party marks appearing herein are the property of their respective owners.
All other marks appearing herein are registered or unregistered trademarks or service marks of FMR LLC or an affiliated company. © 2020 FMR LLC. All rights reserved.
This report and the financial statements contained herein are submitted for the general information of the shareholders of the Fund. This report is not authorized for distribution to prospective investors in the Fund unless preceded or accompanied by an effective prospectus.
A fund files its complete schedule of portfolio holdings with the SEC for the first and third quarters of each fiscal year on Form N-PORT. Forms N-PORT are available on the SEC’s web site at http://www.sec.gov. A fund's Forms N-PORT may be reviewed and copied at the SEC’s Public Reference Room in Washington, DC. Information regarding the operation of the SEC's Public Reference Room may be obtained by calling 1-800-SEC-0330.
For a complete list of a fund's portfolio holdings, view the most recent holdings listing, semiannual report, or annual report on Fidelity's web site at http://www.fidelity.com, http://www.institutional.fidelity.com, or http://www.401k.com, as applicable.
NOT FDIC INSURED •MAY LOSE VALUE •NO BANK GUARANTEE
Neither the Fund nor Fidelity Distributors Corporation is a bank.
Note to Shareholders:
Early in 2020, the outbreak and spread of a new coronavirus emerged as a public health emergency that had a major influence on financial markets, primarily based on its impact on the global economy and corporate earnings. The virus causes a respiratory disease known as COVID-19. On March 11, the World Health Organization declared the COVID-19 outbreak a pandemic, citing sustained risk of further global spread.
In the weeks following the end of this reporting period, as the crisis worsened, we witnessed an escalating human tragedy with wide-scale social and economic consequences from coronavirus-containment measures. The outbreak of COVID-19 prompted a number of measures to limit the spread, including travel and border restrictions, quarantines, and restrictions on large gatherings. In turn, these resulted in lower consumer activity, diminished demand for a wide range of products and services, disruption in manufacturing and supply chains, and – given the wide variability in outcomes regarding the outbreak – significant market uncertainty and volatility. Amid the turmoil, the U.S. government took unprecedented action – in concert with the U.S. Federal Reserve and central banks around the world – to help support consumers, businesses, and the broader economy, and to limit disruption to the financial system.
The situation continues to unfold, and the extent and duration of its impact on financial markets and the economy remain highly uncertain. Extreme events such as the coronavirus crisis are “exogenous shocks” that can have significant adverse effects on mutual funds and their investments. Although multiple asset classes may be affected by market disruption, the duration and impact may not be the same for all types of assets.
Fidelity is committed to helping you stay informed amid news about COVID-19 and during increased market volatility, and we’re taking extra steps to be responsive to customer needs. We encourage you to visit our websites, where we offer ongoing updates, commentary, and analysis on the markets and our funds.
Performance: The Bottom Line
Average annual total return reflects the change in the value of an investment, assuming reinvestment of distributions from dividend income and capital gains (the profits earned upon the sale of securities that have grown in value, if any) and assuming a constant rate of performance each year. The hypothetical investment and the average annual total returns do not reflect the deduction of taxes that a shareholder would pay on fund distributions or the redemption of fund shares. During periods of reimbursement by Fidelity, a fund’s total return will be greater than it would be had the reimbursement not occurred. How a fund did yesterday is no guarantee of how it will do tomorrow.
Average Annual Total Returns
| For the periods ended February 29, 2020 | Past 1 year | Past 5 years | Past 10 years |
| Strategic Advisers® Small-Mid Cap Fund | (2.40)% | 5.17% | 9.84% |
Prior to May 1, 2010, the fund was named PAS® Small Cap Fund of Funds, and the fund operated under certain different investment policies and compared its performance to a different index. The fund's historical performance may not represent its current investment policies.
$10,000 Over 10 Years
Let's say hypothetically that $10,000 was invested in Strategic Advisers® Small-Mid Cap Fund on February 28, 2010.
The chart shows how the value of your investment would have changed, and also shows how the Russell 2500™ Index performed over the same period.

| Period Ending Values | ||
|
| $25,559 | Strategic Advisers® Small-Mid Cap Fund |
|
| $28,935 | Russell 2500™ Index |
Management's Discussion of Fund Performance
Market Recap: U.S. stocks stalled to begin the new year and declined in late February, as the outbreak and spread of the new coronavirus threatened to hamper global economic growth and corporate earnings. For the 12 months ending February 29, 2020, the U.S. equity bellwether S&P 500® index gained 8.19%. The period began with equities rising amid upbeat company earnings and signs the U.S. Federal Reserve may pause on rates. The uptrend extended until May, when the index dipped as trade talks between the U.S. and China broke down. The bull market roared back to record a series of highs in July, when the Fed cut interest rates for the first time since 2008. Volatility intensified in August, as the Treasury yield curve inverted, which some investors viewed as a sign the U.S. economy could be heading for recession. But the market proved resilient, hitting a new high on October 30, when the Fed lowered rates for the third time in 2019, and moving higher through December 31. Following a roughly flat January, stocks sank in late February, after a surge in coronavirus cases outside China created considerable uncertainty and pushed investors to safer asset classes. By sector, information technology (+27%) led the way by a wide margin, followed by utilities and communication services (+13% each). In contrast, energy (-25%) was by far the weakest category, struggling due to sluggish oil prices. Other notable laggards included materials and industrials (-2% each). Comments from Portfolio Manager Barry Golden: For the fiscal year, the Fund returned -2.40%, trailing the -1.80% result of its small-to-mid-cap benchmark, the Russell 2500® Index. During a period in which growth stocks and strategies outperformed their value-oriented counterparts, underlying managers with a value emphasis hampered the Fund’s relative performance. Versus the benchmark, sub-adviser LSV Asset Management (-10%) was the biggest detractor, as this manager’s deep-value strategy was out of favor this period. LSV was also hurt by security selection in the industrials, materials and health care sectors. The U.S. SMID-Cap Value strategy (-10%) managed by sub-adviser AB was another relative detractor, hampered by adverse stock selection across several groups, along with an overweighting in the poor-performing energy sector. On the plus side, sub-adviser JPMorgan Investment Management was the Fund's top relative contributor, as its quality-oriented SMID-cap strategy (+6%) focused on companies’ intrinsic value generated strong relative performance. Victory Capital Management’s sub-advised strategy (+10%) handily outperformed the Russell 2500 Index and was another key contributor, capitalizing on its quality-tilted growth strategy. In terms of positioning changes, we added the SMID Select strategy managed by ArrowMark Partners and hired FIAM to run its Small-Mid Cap Core Strategy. Additionally, we de-funded three sub-advisers: Mellon Investments, Fisher Investments and Voya Investment Management.The views expressed above reflect those of the portfolio manager(s) only through the end of the period as stated on the cover of this report and do not necessarily represent the views of Fidelity or any other person in the Fidelity organization. Any such views are subject to change at any time based upon market or other conditions and Fidelity disclaims any responsibility to update such views. These views may not be relied on as investment advice and, because investment decisions for a Fidelity fund are based on numerous factors, may not be relied on as an indication of trading intent on behalf of any Fidelity fund.
Investment Summary (Unaudited)
The information in the following tables is based on the direct investments of the Fund.Top Ten Holdings as of February 29, 2020
(excluding cash equivalents)
| % of fund's net assets | |
| Fidelity SAI Small-Mid Cap 500 Index Fund | 1.6 |
| Fidelity Small Cap Index Fund | 1.5 |
| Fidelity SAI Real Estate Index Fund | 1.4 |
| j2 Global, Inc. | 0.8 |
| LogMeIn, Inc. | 0.6 |
| SS&C Technologies Holdings, Inc. | 0.6 |
| Pool Corp. | 0.6 |
| Skechers U.S.A., Inc. Class A (sub. vtg.) | 0.6 |
| ON Semiconductor Corp. | 0.6 |
| Bright Horizons Family Solutions, Inc. | 0.6 |
| 8.9 |
Top Five Market Sectors as of February 29, 2020
(stocks only)
| % of fund's net assets | |
| Information Technology | 20.0 |
| Industrials | 17.5 |
| Financials | 13.3 |
| Consumer Discretionary | 12.5 |
| Health Care | 12.5 |
Asset Allocation (% of fund's net assets)
| As of February 29, 2020 | ||
| Common Stocks | 93.5% | |
| Mid-Cap Blend Funds | 1.6% | |
| Small Blend Funds | 1.5% | |
| Sector Funds | 1.4% | |
| Short-Term Investments and Net Other Assets (Liabilities) | 2.0% | |

Asset allocations of funds in the pie chart reflect the categorizations of assets as defined by Morningstar as of the reporting date.
Schedule of Investments February 29, 2020
Showing Percentage of Net Assets
| Common Stocks - 93.5% | |||
| Shares | Value | ||
| COMMUNICATION SERVICES - 2.7% | |||
| Diversified Telecommunication Services - 0.3% | |||
| Bandwidth, Inc. (a) | 159,312 | $10,019,132 | |
| CenturyLink, Inc. | 509,400 | 6,148,458 | |
| Cogent Communications Group, Inc. | 13,063 | 953,730 | |
| GCI Liberty, Inc. (a) | 32,500 | 2,246,075 | |
| Ooma, Inc. (a) | 82,036 | 1,052,522 | |
| Vonage Holdings Corp. (a) | 328,366 | 2,942,159 | |
| 23,362,076 | |||
| Entertainment - 0.9% | |||
| Cinemark Holdings, Inc. | 969,849 | 25,177,280 | |
| Electronic Arts, Inc. (a) | 51,398 | 5,210,215 | |
| Glu Mobile, Inc. (a) | 349,577 | 2,488,988 | |
| Live Nation Entertainment, Inc. (a) | 126,077 | 7,661,699 | |
| Nintendo Co. Ltd. ADR (b) | 28,657 | 1,203,021 | |
| Roku, Inc. Class A (a) | 21,280 | 2,418,898 | |
| Sciplay Corp. (A Shares) | 26,057 | 235,555 | |
| The Madison Square Garden Co. (a) | 29,247 | 7,832,932 | |
| World Wrestling Entertainment, Inc. Class A (b) | 270,763 | 12,663,586 | |
| 64,892,174 | |||
| Interactive Media & Services - 0.8% | |||
| Alphabet, Inc. Class C (a) | 8,553 | 11,455,289 | |
| ANGI Homeservices, Inc. Class A (a)(b) | 329,139 | 2,346,761 | |
| CarGurus, Inc. Class A (a) | 181,777 | 4,633,496 | |
| Cars.com, Inc. (a) | 198,000 | 1,797,840 | |
| Facebook, Inc. Class A (a) | 33,453 | 6,438,699 | |
| Match Group, Inc. (a)(b) | 77,200 | 5,018,000 | |
| Pinterest, Inc. Class A | 470,428 | 9,173,346 | |
| QuinStreet, Inc. (a) | 356,614 | 4,593,188 | |
| TripAdvisor, Inc. | 154,482 | 3,622,603 | |
| Yelp, Inc. (a) | 130,461 | 4,079,515 | |
| 53,158,737 | |||
| Media - 0.6% | |||
| AMC Networks, Inc. Class A (a) | 83,700 | 2,594,700 | |
| Boston Omaha Corp. (a)(b) | 157,459 | 3,064,152 | |
| Cable One, Inc. | 900 | 1,415,718 | |
| Criteo SA sponsored ADR (a) | 327,303 | 4,146,929 | |
| Entercom Communications Corp. Class A | 1,579,098 | 5,479,470 | |
| Liberty Media Corp. Liberty Formula One Group Series C (a) | 19,800 | 773,388 | |
| National CineMedia, Inc. | 1,135,576 | 8,732,579 | |
| Nexstar Broadcasting Group, Inc. Class A | 64,614 | 7,429,318 | |
| Ocean Outdoor Ltd. (a)(c) | 599,182 | 4,715,185 | |
| TechTarget, Inc. (a) | 107,467 | 2,485,712 | |
| 40,837,151 | |||
| Wireless Telecommunication Services - 0.1% | |||
| Boingo Wireless, Inc. (a) | 577,526 | 7,317,254 | |
| TOTAL COMMUNICATION SERVICES | 189,567,392 | ||
| CONSUMER DISCRETIONARY - 12.5% | |||
| Auto Components - 1.0% | |||
| Autoliv, Inc. | 75,961 | 5,068,878 | |
| BorgWarner, Inc. | 201,900 | 6,380,040 | |
| Cooper Tire & Rubber Co. | 78,500 | 2,000,965 | |
| Cooper-Standard Holding, Inc. (a) | 344,191 | 5,947,620 | |
| Dana, Inc. | 569,362 | 8,187,426 | |
| Dorman Products, Inc. (a) | 26,012 | 1,577,368 | |
| Fox Factory Holding Corp. (a) | 65,190 | 4,133,046 | |
| Gentex Corp. | 347,452 | 9,276,968 | |
| LCI Industries | 135,104 | 13,044,291 | |
| Lear Corp. | 98,818 | 10,988,562 | |
| Standard Motor Products, Inc. | 37,111 | 1,632,884 | |
| Stoneridge, Inc. (a) | 103,713 | 2,292,057 | |
| The Goodyear Tire & Rubber Co. | 208,800 | 2,022,228 | |
| 72,552,333 | |||
| Automobiles - 0.3% | |||
| Harley-Davidson, Inc. | 147,900 | 4,506,513 | |
| Thor Industries, Inc. | 245,060 | 18,479,975 | |
| 22,986,488 | |||
| Distributors - 1.0% | |||
| LKQ Corp. (a) | 853,417 | 25,244,075 | |
| Pool Corp. | 198,876 | 41,954,881 | |
| 67,198,956 | |||
| Diversified Consumer Services - 1.9% | |||
| American Public Education, Inc. (a) | 14,704 | 327,311 | |
| Bright Horizons Family Solutions, Inc. (a) | 246,618 | 38,756,019 | |
| Chegg, Inc. (a) | 189,119 | 7,415,356 | |
| Frontdoor, Inc. (a) | 779,684 | 33,058,602 | |
| Grand Canyon Education, Inc. (a) | 109,372 | 8,824,133 | |
| Houghton Mifflin Harcourt Co. (a) | 470,513 | 2,573,706 | |
| HyreCar, Inc. (a)(b) | 534,414 | 1,678,060 | |
| Park Lawn Corp. | 517,654 | 10,173,747 | |
| Service Corp. International | 80,300 | 3,837,537 | |
| ServiceMaster Global Holdings, Inc. (a) | 58,900 | 2,106,853 | |
| Strategic Education, Inc. | 132,633 | 19,547,452 | |
| Weight Watchers International, Inc. (a) | 33,210 | 996,300 | |
| 129,295,076 | |||
| Hotels, Restaurants & Leisure - 1.7% | |||
| Bloomin' Brands, Inc. | 577,241 | 10,384,566 | |
| Chipotle Mexican Grill, Inc. (a) | 6,280 | 4,858,082 | |
| Churchill Downs, Inc. | 34,430 | 4,325,785 | |
| Dave & Buster's Entertainment, Inc. | 133,725 | 4,414,262 | |
| Dominos Pizza Enterprises Ltd. (b) | 107,393 | 3,888,442 | |
| Eldorado Resorts, Inc. (a) | 3,800 | 190,684 | |
| Extended Stay America, Inc. unit | 477,356 | 5,241,369 | |
| Great Canadian Gaming Corp. (a) | 215,393 | 6,311,348 | |
| Jack in the Box, Inc. | 21,134 | 1,455,287 | |
| Lindblad Expeditions Holdings (a) | 348,104 | 4,142,438 | |
| Papa John's International, Inc. | 135,053 | 7,780,403 | |
| Penn National Gaming, Inc. (a) | 50,600 | 1,496,242 | |
| Planet Fitness, Inc. (a) | 378,411 | 25,538,958 | |
| Playa Hotels & Resorts NV (a) | 803,359 | 4,257,803 | |
| Six Flags Entertainment Corp. | 54,142 | 1,368,710 | |
| Vail Resorts, Inc. | 62,128 | 13,209,034 | |
| Wendy's Co. | 491,130 | 9,272,534 | |
| Wingstop, Inc. | 26,265 | 2,218,079 | |
| Wyndham Destinations, Inc. | 281,791 | 11,243,461 | |
| 121,597,487 | |||
| Household Durables - 1.1% | |||
| Cavco Industries, Inc. (a) | 7,668 | 1,546,789 | |
| Garmin Ltd. | 108,212 | 9,564,859 | |
| Helen of Troy Ltd. (a) | 23,644 | 3,891,802 | |
| La-Z-Boy, Inc. | 52,598 | 1,506,933 | |
| Lennar Corp. Class A | 137,878 | 8,319,559 | |
| M.D.C. Holdings, Inc. | 213,386 | 8,394,605 | |
| NVR, Inc. (a) | 1,778 | 6,520,246 | |
| PulteGroup, Inc. | 155,000 | 6,231,000 | |
| Purple Innovation, Inc. (a) | 118,941 | 1,615,219 | |
| Skyline Champion Corp. (a) | 142,015 | 3,618,542 | |
| Sonos, Inc. (a) | 291,873 | 3,368,214 | |
| Taylor Morrison Home Corp. (a) | 353,319 | 7,956,744 | |
| Tempur Sealy International, Inc. (a) | 73,630 | 5,503,843 | |
| Toll Brothers, Inc. | 111,375 | 4,124,216 | |
| Whirlpool Corp. | 39,900 | 5,101,614 | |
| 77,264,185 | |||
| Internet & Direct Marketing Retail - 0.7% | |||
| Chewy, Inc. (b) | 382,518 | 11,322,533 | |
| Etsy, Inc. (a) | 154,054 | 8,905,862 | |
| Expedia, Inc. | 23,252 | 2,293,112 | |
| GrubHub, Inc. (a) | 90,337 | 4,346,113 | |
| PetMed Express, Inc. | 18,444 | 486,922 | |
| Quotient Technology, Inc. (a) | 230,305 | 2,061,230 | |
| Shutterstock, Inc. | 368,461 | 14,200,487 | |
| The Rubicon Project, Inc. (a) | 208,122 | 2,362,185 | |
| 45,978,444 | |||
| Leisure Products - 0.8% | |||
| Brunswick Corp. | 541,619 | 28,814,131 | |
| Callaway Golf Co. | 305,854 | 5,193,401 | |
| Clarus Corp. | 308,236 | 3,563,208 | |
| Hasbro, Inc. | 26,400 | 2,039,400 | |
| Polaris, Inc. | 174,889 | 14,433,589 | |
| Sturm, Ruger & Co., Inc. | 14,892 | 715,412 | |
| 54,759,141 | |||
| Multiline Retail - 0.1% | |||
| Dillard's, Inc. Class A (b) | 46,400 | 2,611,856 | |
| Dollar Tree, Inc. (a) | 15,097 | 1,253,504 | |
| Kohl's Corp. | 112,400 | 4,400,460 | |
| 8,265,820 | |||
| Specialty Retail - 2.0% | |||
| Aaron's, Inc. Class A | 153,997 | 6,056,702 | |
| Advance Auto Parts, Inc. | 38,099 | 5,066,405 | |
| America's Car Mart, Inc. (a) | 44,297 | 4,552,403 | |
| American Eagle Outfitters, Inc. | 263,300 | 3,391,304 | |
| Burlington Stores, Inc. (a) | 80,980 | 17,512,735 | |
| CarMax, Inc. (a) | 26,011 | 2,271,020 | |
| Five Below, Inc. (a) | 72,199 | 6,999,693 | |
| Floor & Decor Holdings, Inc. Class A (a) | 38,910 | 1,986,356 | |
| Foot Locker, Inc. | 447,427 | 16,219,229 | |
| Group 1 Automotive, Inc. | 79,037 | 6,736,324 | |
| Haverty Furniture Companies, Inc. | 104,300 | 1,754,326 | |
| Lithia Motors, Inc. Class A (sub. vtg.) | 62,362 | 7,431,056 | |
| National Vision Holdings, Inc. (a) | 211,472 | 7,363,455 | |
| Office Depot, Inc. | 995,000 | 2,338,250 | |
| Penske Automotive Group, Inc. | 90,200 | 4,151,004 | |
| Sally Beauty Holdings, Inc. (a) | 2,272,409 | 28,268,768 | |
| Signet Jewelers Ltd. | 201,170 | 4,691,284 | |
| Sonic Automotive, Inc. Class A (sub. vtg.) | 111,800 | 3,130,400 | |
| Ulta Beauty, Inc. (a) | 14,057 | 3,613,914 | |
| Williams-Sonoma, Inc. | 120,194 | 7,498,904 | |
| 141,033,532 | |||
| Textiles, Apparel & Luxury Goods - 1.9% | |||
| Capri Holdings Ltd. (a) | 230,782 | 5,958,791 | |
| Carter's, Inc. | 236,606 | 21,642,351 | |
| Columbia Sportswear Co. | 34,000 | 2,764,200 | |
| Crocs, Inc. (a) | 197,736 | 5,174,751 | |
| Deckers Outdoor Corp. (a) | 15,839 | 2,752,818 | |
| Hanesbrands, Inc. | 2,124,494 | 28,128,301 | |
| Levi Strauss & Co. Class A | 178,890 | 3,039,341 | |
| PVH Corp. | 64,400 | 4,772,684 | |
| Skechers U.S.A., Inc. Class A (sub. vtg.) (a) | 1,233,429 | 40,801,831 | |
| Steven Madden Ltd. | 205,714 | 6,726,848 | |
| Under Armour, Inc. Class C (non-vtg.) (a) | 464,572 | 5,797,859 | |
| Unifi, Inc. (a) | 72,830 | 1,556,377 | |
| Wolverine World Wide, Inc. | 215,590 | 5,667,861 | |
| 134,784,013 | |||
| TOTAL CONSUMER DISCRETIONARY | 875,715,475 | ||
| CONSUMER STAPLES - 3.8% | |||
| Beverages - 0.4% | |||
| Boston Beer Co., Inc. Class A (a) | 10,411 | 3,860,295 | |
| Brown-Forman Corp. Class B (non-vtg.) | 148,909 | 9,144,502 | |
| Cott Corp. | 583,595 | 8,316,229 | |
| Cott Corp. | 318,674 | 4,518,060 | |
| National Beverage Corp. (b) | 10,836 | 458,254 | |
| 26,297,340 | |||
| Food & Staples Retailing - 1.1% | |||
| BJ's Wholesale Club Holdings, Inc. (a) | 563,150 | 10,846,269 | |
| Casey's General Stores, Inc. | 72,900 | 11,884,158 | |
| Grocery Outlet Holding Corp. | 178,607 | 5,652,912 | |
| Performance Food Group Co. (a) | 570,381 | 24,184,154 | |
| SpartanNash Co. | 65,200 | 810,436 | |
| U.S. Foods Holding Corp. (a) | 636,005 | 21,395,208 | |
| Weis Markets, Inc. | 47,626 | 1,774,069 | |
| 76,547,206 | |||
| Food Products - 1.6% | |||
| Flowers Foods, Inc. | 150,531 | 3,240,932 | |
| Fresh Del Monte Produce, Inc. | 88,779 | 2,434,320 | |
| Freshpet, Inc. (a) | 55,138 | 3,664,471 | |
| Hostess Brands, Inc. Class A (a) | 620,640 | 7,888,334 | |
| Ingredion, Inc. | 117,011 | 9,747,016 | |
| J&J Snack Foods Corp. | 13,454 | 2,163,672 | |
| John B. Sanfilippo & Son, Inc. | 7,799 | 547,412 | |
| Lamb Weston Holdings, Inc. | 235,266 | 20,442,263 | |
| Lancaster Colony Corp. | 17,489 | 2,526,286 | |
| Nomad Foods Ltd. (a) | 1,469,665 | 27,130,016 | |
| Pilgrim's Pride Corp. (a) | 199,300 | 4,217,188 | |
| Post Holdings, Inc. (a) | 79,982 | 8,098,977 | |
| Premium Brands Holdings Corp. | 57,531 | 4,034,564 | |
| The Hain Celestial Group, Inc. (a) | 370,711 | 8,796,972 | |
| The J.M. Smucker Co. | 70,800 | 7,291,692 | |
| Tootsie Roll Industries, Inc. (b) | 17,024 | 546,130 | |
| TreeHouse Foods, Inc. (a) | 40,600 | 1,547,266 | |
| 114,317,511 | |||
| Household Products - 0.2% | |||
| Central Garden & Pet Co. Class A (non-vtg.) (a) | 201,235 | 5,093,258 | |
| Energizer Holdings, Inc. (b) | 167,533 | 7,202,244 | |
| Spectrum Brands Holdings, Inc. | 37,202 | 2,004,816 | |
| WD-40 Co. | 12,394 | 2,137,841 | |
| 16,438,159 | |||
| Personal Products - 0.4% | |||
| elf Beauty, Inc. (a) | 964,314 | 15,390,451 | |
| Herbalife Nutrition Ltd. (a) | 117,069 | 3,788,353 | |
| MediFast, Inc. (b) | 50,750 | 4,217,833 | |
| Nu Skin Enterprises, Inc. Class A | 49,828 | 1,221,783 | |
| USANA Health Sciences, Inc. (a) | 12,299 | 812,964 | |
| 25,431,384 | |||
| Tobacco - 0.1% | |||
| Universal Corp. | 92,378 | 4,558,854 | |
| TOTAL CONSUMER STAPLES | 263,590,454 | ||
| ENERGY - 1.4% | |||
| Energy Equipment & Services - 0.3% | |||
| Apergy Corp. (a)(b) | 84,056 | 1,563,442 | |
| Cactus, Inc. | 80,918 | 2,209,871 | |
| Core Laboratories NV | 129,022 | 3,462,950 | |
| Dril-Quip, Inc. (a) | 114,093 | 4,063,993 | |
| Oil States International, Inc. (a) | 304,100 | 2,405,431 | |
| Patterson-UTI Energy, Inc. | 1,135,121 | 6,504,243 | |
| RPC, Inc. (b) | 403,838 | 1,389,203 | |
| 21,599,133 | |||
| Oil, Gas & Consumable Fuels - 1.1% | |||
| Abraxas Petroleum Corp. (a) | 2,060,821 | 391,556 | |
| Arch Coal, Inc. | 21,000 | 1,057,350 | |
| Brigham Minerals, Inc. Class A | 160,149 | 2,554,377 | |
| Canacol Energy Ltd. | 1,071,687 | 3,417,262 | |
| Canadian Natural Resources Ltd. | 68,060 | 1,751,889 | |
| Cenovus Energy, Inc. (Canada) | 240,308 | 1,767,063 | |
| Cimarex Energy Co. | 215,626 | 7,126,439 | |
| CONSOL Energy, Inc. (a) | 24,242 | 137,937 | |
| Delek U.S. Holdings, Inc. | 142,800 | 3,053,064 | |
| Devon Energy Corp. | 237,100 | 3,850,504 | |
| Diamondback Energy, Inc. | 76,571 | 4,747,402 | |
| Enerplus Corp. | 431,248 | 1,873,105 | |
| Gulfport Energy Corp. (a) | 350,800 | 287,516 | |
| HollyFrontier Corp. | 290,773 | 9,793,235 | |
| Kosmos Energy Ltd. | 1,104,505 | 3,368,740 | |
| Magnolia Oil & Gas Corp. Class A (a) | 214,100 | 1,607,891 | |
| Marathon Petroleum Corp. | 14,399 | 682,801 | |
| Noble Energy, Inc. | 115,062 | 1,821,431 | |
| Northern Oil & Gas, Inc. (a)(b) | 2,280,636 | 3,306,922 | |
| Ovintiv, Inc. (b) | 92,387 | 1,067,070 | |
| Parsley Energy, Inc. Class A | 122,183 | 1,637,252 | |
| PBF Energy, Inc. Class A | 187,700 | 4,202,603 | |
| PDC Energy, Inc. (a) | 155,539 | 2,959,907 | |
| QEP Resources, Inc. | 733,473 | 1,650,314 | |
| Rex American Resources Corp. (a) | 11,443 | 801,124 | |
| Southwestern Energy Co. (a)(b) | 800,000 | 1,136,000 | |
| W&T Offshore, Inc. (a) | 660,000 | 1,716,000 | |
| World Fuel Services Corp. | 285,530 | 8,074,788 | |
| 75,841,542 | |||
| TOTAL ENERGY | 97,440,675 | ||
| FINANCIALS - 13.3% | |||
| Banks - 4.6% | |||
| Associated Banc-Corp. | 461,939 | 7,820,627 | |
| Bank of Hawaii Corp. | 35,815 | 2,665,352 | |
| Bank OZK | 352,702 | 8,955,104 | |
| BankUnited, Inc. | 674,267 | 20,025,730 | |
| Berkshire Hills Bancorp, Inc. | 84,000 | 2,050,440 | |
| Boston Private Financial Holdings, Inc. | 252,961 | 2,467,635 | |
| Cadence Bancorp Class A | 481,471 | 6,798,371 | |
| Cathay General Bancorp | 102,900 | 3,167,262 | |
| Centerstate Banks of Florida, Inc. | 122,023 | 2,468,525 | |
| CIT Group, Inc. | 136,200 | 5,408,502 | |
| Citizens Financial Group, Inc. | 300,900 | 9,535,521 | |
| Columbia Banking Systems, Inc. | 59,159 | 1,964,079 | |
| Comerica, Inc. | 113,581 | 5,978,904 | |
| Commerce Bancshares, Inc. | 204,262 | 12,468,152 | |
| Cullen/Frost Bankers, Inc. | 126,355 | 9,904,968 | |
| East West Bancorp, Inc. | 69,867 | 2,706,648 | |
| First Citizens Bancshares, Inc. | 7,015 | 3,179,970 | |
| First Financial Bankshares, Inc. | 109,338 | 3,142,374 | |
| First Foundation, Inc. | 84,700 | 1,226,033 | |
| First Hawaiian, Inc. | 731,661 | 17,523,281 | |
| First Horizon National Corp. | 94,000 | 1,253,020 | |
| First Merchants Corp. | 79,896 | 2,794,762 | |
| First Midwest Bancorp, Inc., Delaware | 136,820 | 2,483,283 | |
| FNB Corp., Pennsylvania | 271,300 | 2,737,417 | |
| Fulton Financial Corp. | 239,600 | 3,462,220 | |
| Hancock Whitney Corp. | 82,900 | 2,777,150 | |
| Hanmi Financial Corp. | 204,657 | 3,192,649 | |
| Hope Bancorp, Inc. | 395,500 | 4,829,055 | |
| Huntington Bancshares, Inc. | 410,871 | 5,041,387 | |
| IBERIABANK Corp. | 242,907 | 14,620,572 | |
| KeyCorp | 420,100 | 6,868,635 | |
| PacWest Bancorp | 89,800 | 2,841,272 | |
| Peapack-Gladstone Financial Corp. | 57,910 | 1,589,630 | |
| Peoples Bancorp, Inc. | 40,051 | 1,143,456 | |
| Preferred Bank, Los Angeles | 49,509 | 2,531,395 | |
| Regions Financial Corp. | 579,341 | 7,832,690 | |
| ServisFirst Bancshares, Inc. | 196,674 | 6,795,087 | |
| Signature Bank | 94,428 | 11,812,943 | |
| Sterling Bancorp | 362,907 | 6,016,998 | |
| SVB Financial Group (a) | 32,707 | 6,808,289 | |
| Synovus Financial Corp. | 376,712 | 10,932,182 | |
| TCF Financial Corp. | 243,800 | 8,884,072 | |
| Texas Capital Bancshares, Inc. (a) | 135,649 | 6,386,355 | |
| Umpqua Holdings Corp. | 643,836 | 9,908,636 | |
| United Community Bank, Inc. | 209,600 | 5,191,792 | |
| Webster Financial Corp. | 165,857 | 6,297,590 | |
| Western Alliance Bancorp. | 468,639 | 21,576,140 | |
| Wintrust Financial Corp. | 175,596 | 9,378,582 | |
| Zions Bancorp NA | 468,078 | 18,699,716 | |
| 324,144,453 | |||
| Capital Markets - 3.1% | |||
| Alta Equipment Group, Inc. (a)(b) | 211,981 | 1,867,553 | |
| Ares Management Corp. | 150,150 | 5,193,689 | |
| Artisan Partners Asset Management, Inc. | 45,546 | 1,301,705 | |
| Cohen & Steers, Inc. | 19,203 | 1,203,068 | |
| Cowen Group, Inc. Class A | 40,800 | 610,776 | |
| Diamond Hill Investment Group, Inc. | 2,914 | 369,291 | |
| E*TRADE Financial Corp. | 292,750 | 13,402,095 | |
| Eaton Vance Corp. (non-vtg.) | 303,676 | 12,529,672 | |
| Evercore, Inc. Class A | 109,013 | 7,262,446 | |
| FactSet Research Systems, Inc. | 68,840 | 18,310,752 | |
| Federated Hermes, Inc. Class B (non-vtg.) | 85,496 | 2,466,560 | |
| Focus Financial Partners, Inc. Class A (a) | 221,115 | 6,012,117 | |
| FS KKR Capital Corp. | 431,000 | 2,284,300 | |
| Houlihan Lokey | 31,131 | 1,594,530 | |
| Interactive Brokers Group, Inc. | 116,821 | 5,969,553 | |
| Lazard Ltd. Class A | 629,243 | 22,539,484 | |
| Legg Mason, Inc. | 202,200 | 10,073,604 | |
| LPL Financial | 282,455 | 22,449,523 | |
| MarketAxess Holdings, Inc. | 33,663 | 10,917,921 | |
| Moelis & Co. Class A | 309,461 | 9,890,374 | |
| Morningstar, Inc. | 105,716 | 15,529,680 | |
| Newtek Business Services Corp. (b) | 142,900 | 2,709,384 | |
| Oaktree Specialty Lending Corp. | 547,600 | 2,683,240 | |
| PJT Partners, Inc. | 48,924 | 2,199,134 | |
| Prospect Capital Corp. | 398,500 | 2,195,735 | |
| SEI Investments Co. | 117,006 | 6,401,398 | |
| Stifel Financial Corp. | 70,134 | 3,818,095 | |
| Tradeweb Markets, Inc. Class A | 88,646 | 4,274,510 | |
| Victory Capital Holdings, Inc. | 521,474 | 10,309,541 | |
| Waddell & Reed Financial, Inc. Class A (b) | 66,804 | 919,223 | |
| WisdomTree Investments, Inc. | 1,775,783 | 7,209,679 | |
| 214,498,632 | |||
| Consumer Finance - 0.9% | |||
| Ally Financial, Inc. | 244,300 | 6,124,601 | |
| Credit Acceptance Corp. (a)(b) | 11,066 | 4,461,811 | |
| CURO Group Holdings Corp. | 10,880 | 100,422 | |
| First Cash Financial Services, Inc. | 107,450 | 8,265,054 | |
| LendingTree, Inc. (a)(b) | 35,168 | 9,700,038 | |
| Navient Corp. | 841,965 | 9,455,267 | |
| Nelnet, Inc. Class A | 24,756 | 1,314,544 | |
| OneMain Holdings, Inc. | 121,798 | 4,476,077 | |
| PRA Group, Inc. (a) | 84,854 | 3,294,032 | |
| Regional Management Corp. (a) | 68,700 | 1,762,155 | |
| SLM Corp. | 1,149,676 | 11,922,140 | |
| 60,876,141 | |||
| Diversified Financial Services - 0.3% | |||
| Banco Latinoamericano de Comercio Exterior SA Series E | 75,700 | 1,353,516 | |
| Jefferies Financial Group, Inc. | 166,298 | 3,277,734 | |
| Voya Financial, Inc. | 302,517 | 15,924,495 | |
| 20,555,745 | |||
| Insurance - 3.0% | |||
| Alleghany Corp. | 7,126 | 4,790,454 | |
| American Financial Group, Inc. | 81,708 | 7,551,453 | |
| Assurant, Inc. | 53,939 | 6,504,504 | |
| Assured Guaranty Ltd. | 223,425 | 9,117,974 | |
| Axis Capital Holdings Ltd. | 109,866 | 6,165,680 | |
| Brown & Brown, Inc. | 76,800 | 3,303,168 | |
| CNA Financial Corp. | 275,632 | 11,460,779 | |
| CNO Financial Group, Inc. | 339,200 | 5,433,984 | |
| Crawford & Co. Class B | 166,972 | 1,140,419 | |
| eHealth, Inc. (a) | 49,843 | 5,849,076 | |
| Erie Indemnity Co. Class A | 17,756 | 2,537,688 | |
| Everest Re Group Ltd. | 86,147 | 21,354,118 | |
| First American Financial Corp. | 231,072 | 13,194,211 | |
| Genworth Financial, Inc. Class A | 149,800 | 584,220 | |
| Goosehead Insurance | 8,039 | 436,035 | |
| Hanover Insurance Group, Inc. | 67,939 | 8,053,489 | |
| Heritage Insurance Holdings, Inc. | 127,900 | 1,427,364 | |
| Kemper Corp. | 102,052 | 7,025,260 | |
| Kinsale Capital Group, Inc. | 130,574 | 15,860,824 | |
| Lincoln National Corp. | 116,200 | 5,274,318 | |
| National General Holdings Corp. | 289,037 | 5,627,550 | |
| Old Republic International Corp. | 338,900 | 6,683,108 | |
| Palomar Holdings, Inc. | 11,289 | 573,594 | |
| Primerica, Inc. | 38,453 | 4,281,357 | |
| ProAssurance Corp. | 44,992 | 1,221,533 | |
| Reinsurance Group of America, Inc. | 179,939 | 21,957,956 | |
| RLI Corp. | 183,252 | 14,729,796 | |
| Selective Insurance Group, Inc. | 70,856 | 3,952,348 | |
| Universal Insurance Holdings, Inc. | 130,193 | 2,693,693 | |
| Unum Group | 241,300 | 5,624,703 | |
| White Mountains Insurance Group Ltd. | 5,565 | 5,509,907 | |
| 209,920,563 | |||
| Mortgage Real Estate Investment Trusts - 0.7% | |||
| AGNC Investment Corp. | 234,908 | 4,002,832 | |
| Annaly Capital Management, Inc. | 349,000 | 3,092,140 | |
| Ares Commercial Real Estate Corp. | 118,492 | 1,808,188 | |
| Blackstone Mortgage Trust, Inc. | 92,653 | 3,341,067 | |
| Chimera Investment Corp. | 176,100 | 3,460,365 | |
| MFA Financial, Inc. | 1,089,749 | 7,878,885 | |
| New York Mortgage Trust, Inc. | 403,200 | 2,298,240 | |
| Redwood Trust, Inc. | 477,142 | 8,149,585 | |
| Starwood Property Trust, Inc. | 217,772 | 4,830,183 | |
| Two Harbors Investment Corp. | 697,713 | 9,454,011 | |
| 48,315,496 | |||
| Thrifts & Mortgage Finance - 0.7% | |||
| Axos Financial, Inc. (a) | 154,346 | 3,844,759 | |
| Essent Group Ltd. | 430,461 | 18,785,318 | |
| Farmer Mac Class C (non-vtg.) | 27,685 | 2,078,036 | |
| Meta Financial Group, Inc. | 86,650 | 2,846,453 | |
| MGIC Investment Corp. | 490,900 | 5,905,527 | |
| NMI Holdings, Inc. (a) | 65,357 | 1,525,432 | |
| Radian Group, Inc. | 327,090 | 6,947,392 | |
| Walker & Dunlop, Inc. | 130,534 | 8,465,130 | |
| 50,398,047 | |||
| TOTAL FINANCIALS | 928,709,077 | ||
| HEALTH CARE - 12.5% | |||
| Biotechnology - 2.8% | |||
| AbbVie, Inc. | 19,221 | 1,647,432 | |
| ACADIA Pharmaceuticals, Inc. (a) | 69,818 | 2,984,021 | |
| Agios Pharmaceuticals, Inc. (a) | 157,148 | 7,461,387 | |
| Aimmune Therapeutics, Inc. (a)(b) | 160,686 | 3,825,934 | |
| Akebia Therapeutics, Inc. (a) | 198,769 | 1,763,081 | |
| Allogene Therapeutics, Inc. (a)(b) | 68,360 | 1,845,720 | |
| Anika Therapeutics, Inc. (a) | 12,670 | 529,099 | |
| Applied Genetic Technologies Corp. (a) | 232,909 | 1,101,660 | |
| Arena Pharmaceuticals, Inc. (a) | 41,230 | 1,838,858 | |
| Ascendis Pharma A/S sponsored ADR (a) | 19,161 | 2,498,211 | |
| Aurinia Pharmaceuticals, Inc. (a)(b) | 99,100 | 1,734,250 | |
| BeiGene Ltd. ADR (a) | 9,720 | 1,539,162 | |
| Biohaven Pharmaceutical Holding Co. Ltd. (a) | 51,486 | 2,273,622 | |
| BioMarin Pharmaceutical, Inc. (a) | 51,426 | 4,647,368 | |
| Biospecifics Technologies Corp. (a) | 4,729 | 260,994 | |
| Blueprint Medicines Corp. (a) | 75,575 | 4,090,875 | |
| Castle Biosciences, Inc. (b) | 111,369 | 3,334,388 | |
| Coherus BioSciences, Inc. (a) | 98,510 | 1,906,169 | |
| DBV Technologies SA sponsored ADR (a)(b) | 558,497 | 5,467,686 | |
| Deciphera Pharmaceuticals, Inc. (a) | 192,750 | 10,262,010 | |
| Emergent BioSolutions, Inc. (a) | 116,258 | 6,822,019 | |
| Exact Sciences Corp. (a) | 125,780 | 10,181,891 | |
| Exelixis, Inc. (a) | 107,112 | 1,991,212 | |
| Gilead Sciences, Inc. | 93,095 | 6,457,069 | |
| Global Blood Therapeutics, Inc. (a) | 88,955 | 5,689,562 | |
| Gossamer Bio, Inc. | 64,319 | 844,508 | |
| Halozyme Therapeutics, Inc. (a) | 59,566 | 1,165,707 | |
| Heron Therapeutics, Inc. (a)(b) | 376,917 | 7,029,502 | |
| Immunomedics, Inc. (a) | 780,519 | 12,488,304 | |
| Insmed, Inc. (a) | 69,818 | 1,738,468 | |
| Invitae Corp. (a)(b) | 61,977 | 1,263,091 | |
| Iovance Biotherapeutics, Inc. (a) | 87,956 | 2,894,632 | |
| Kodiak Sciences, Inc. (a) | 96,248 | 6,156,985 | |
| Lexicon Pharmaceuticals, Inc. (a)(b) | 18,697 | 51,884 | |
| Ligand Pharmaceuticals, Inc. Class B (a)(b) | 149,916 | 14,032,138 | |
| Madrigal Pharmaceuticals, Inc. (a)(b) | 14,200 | 1,223,614 | |
| Myriad Genetics, Inc. (a) | 32,517 | 572,950 | |
| Neurocrine Biosciences, Inc. (a) | 300,143 | 28,423,542 | |
| NextCure, Inc. | 42,780 | 1,786,493 | |
| Precision BioSciences, Inc. (a) | 114,053 | 913,565 | |
| PTC Therapeutics, Inc. (a) | 44,790 | 2,456,284 | |
| Puma Biotechnology, Inc. (a)(b) | 48,070 | 516,993 | |
| Repligen Corp. (a) | 10,922 | 934,923 | |
| Sarepta Therapeutics, Inc. (a) | 57,280 | 6,556,842 | |
| Seattle Genetics, Inc. (a) | 18,700 | 2,129,182 | |
| Syros Pharmaceuticals, Inc. (a) | 271,513 | 1,588,351 | |
| Ultragenyx Pharmaceutical, Inc. (a) | 47,788 | 2,679,951 | |
| United Therapeutics Corp. (a) | 44,270 | 4,558,039 | |
| Viking Therapeutics, Inc. (a)(b) | 852,840 | 5,048,813 | |
| 199,208,441 | |||
| Health Care Equipment & Supplies - 3.5% | |||
| Abiomed, Inc. (a) | 51,629 | 7,757,774 | |
| Atrion Corp. | 1,274 | 785,179 | |
| AxoGen, Inc. (a) | 985,328 | 12,198,361 | |
| Cantel Medical Corp. | 32,497 | 2,050,561 | |
| Dentsply Sirona, Inc. | 54,600 | 2,688,504 | |
| Endologix, Inc. (a)(b) | 452,524 | 565,655 | |
| Envista Holdings Corp. (a) | 193,286 | 4,905,599 | |
| Glaukos Corp. (a)(b) | 36,400 | 1,600,872 | |
| Hologic, Inc. (a) | 45,700 | 2,153,384 | |
| ICU Medical, Inc. (a) | 50,760 | 9,939,316 | |
| IDEXX Laboratories, Inc. (a) | 73,837 | 18,792,255 | |
| Insulet Corp. (a) | 77,985 | 14,814,810 | |
| Integra LifeSciences Holdings Corp. (a) | 162,333 | 8,457,549 | |
| iRhythm Technologies, Inc. (a) | 38,200 | 3,322,254 | |
| LeMaitre Vascular, Inc. | 10,802 | 307,857 | |
| Masimo Corp. (a) | 81,053 | 13,238,386 | |
| Meridian Bioscience, Inc. | 36,888 | 294,735 | |
| Merit Medical Systems, Inc. (a) | 650,941 | 23,440,385 | |
| Neogen Corp. (a) | 46,531 | 2,826,758 | |
| Nevro Corp. (a) | 42,636 | 5,549,075 | |
| Penumbra, Inc. (a) | 36,193 | 6,002,971 | |
| Quidel Corp. (a) | 120,286 | 9,290,891 | |
| Semler Scientific, Inc. (a) | 26,350 | 1,396,550 | |
| STERIS PLC | 160,570 | 25,469,613 | |
| Teleflex, Inc. | 29,531 | 9,893,476 | |
| The Cooper Companies, Inc. | 49,130 | 15,946,124 | |
| ViewRay, Inc. (a)(b) | 273,200 | 784,084 | |
| West Pharmaceutical Services, Inc. | 253,020 | 38,094,691 | |
| 242,567,669 | |||
| Health Care Providers & Services - 2.9% | |||
| Amedisys, Inc. (a) | 35,410 | 6,161,694 | |
| BioTelemetry, Inc. (a) | 361,195 | 15,430,250 | |
| Centene Corp. (a) | 301,987 | 16,011,351 | |
| Chemed Corp. | 14,341 | 5,989,088 | |
| Corvel Corp. (a) | 7,983 | 550,348 | |
| Encompass Health Corp. | 325,818 | 24,384,219 | |
| Five Star Sr Living, Inc. (a) | 40,440 | 191,686 | |
| Guardant Health, Inc. (a) | 77,893 | 6,773,575 | |
| HealthEquity, Inc. (a) | 272,924 | 19,374,875 | |
| Henry Schein, Inc. (a) | 129,169 | 7,871,559 | |
| LHC Group, Inc. (a) | 52,790 | 6,411,873 | |
| MEDNAX, Inc. (a) | 966,893 | 16,524,201 | |
| Molina Healthcare, Inc. (a) | 214,532 | 26,290,897 | |
| Owens & Minor, Inc. | 266,300 | 1,818,829 | |
| Patterson Companies, Inc. | 123,978 | 2,949,437 | |
| PetIQ, Inc. Class A (a)(b) | 118,003 | 3,669,893 | |
| Premier, Inc. (a) | 464,348 | 13,665,762 | |
| Quest Diagnostics, Inc. | 80,100 | 8,495,406 | |
| R1 RCM, Inc. (a) | 117,400 | 1,441,672 | |
| RadNet, Inc. (a) | 106,700 | 2,179,881 | |
| Select Medical Holdings Corp. (a) | 318,986 | 7,636,525 | |
| U.S. Physical Therapy, Inc. | 10,900 | 1,135,998 | |
| Universal Health Services, Inc. Class B | 59,264 | 7,333,327 | |
| 202,292,346 | |||
| Health Care Technology - 0.3% | |||
| Change Healthcare, Inc. (b) | 305,114 | 4,146,499 | |
| Teladoc Health, Inc. (a)(b) | 70,510 | 8,810,930 | |
| Veeva Systems, Inc. Class A (a) | 48,530 | 6,889,804 | |
| 19,847,233 | |||
| Life Sciences Tools & Services - 1.5% | |||
| 10X Genomics, Inc. (a)(b) | 53,556 | 4,268,413 | |
| Accelerate Diagnostics, Inc. (a)(b) | 86,900 | 1,113,189 | |
| Avantor, Inc. | 240,767 | 3,792,080 | |
| Bio-Rad Laboratories, Inc. Class A (a) | 45,088 | 15,871,878 | |
| Bio-Techne Corp. | 21,002 | 3,967,068 | |
| Bruker Corp. | 143,540 | 6,252,602 | |
| ICON PLC (a) | 121,660 | 18,986,260 | |
| Medpace Holdings, Inc. (a) | 23,276 | 2,093,443 | |
| PerkinElmer, Inc. | 61,055 | 5,277,594 | |
| PPD, Inc. | 111,792 | 3,116,761 | |
| Quanterix Corp. (a) | 156,403 | 3,567,552 | |
| Syneos Health, Inc. (a) | 534,084 | 33,834,221 | |
| 102,141,061 | |||
| Pharmaceuticals - 1.5% | |||
| Aerie Pharmaceuticals, Inc. (a)(b) | 154,804 | 2,709,070 | |
| Catalent, Inc. (a) | 370,738 | 19,104,129 | |
| Collegium Pharmaceutical, Inc. (a) | 98,541 | 2,340,349 | |
| GW Pharmaceuticals PLC ADR (a)(b) | 98,396 | 10,066,895 | |
| Horizon Pharma PLC (a) | 344,830 | 11,800,083 | |
| Innoviva, Inc. (a) | 216,035 | 2,909,991 | |
| Jazz Pharmaceuticals PLC (a) | 119,535 | 13,696,320 | |
| Lannett Co., Inc. (a)(b) | 177,600 | 1,545,120 | |
| Nektar Therapeutics (a)(b) | 114,161 | 2,375,690 | |
| OptiNose, Inc. (a) | 126,648 | 766,220 | |
| Pacira Biosciences, Inc. (a) | 77,821 | 3,375,875 | |
| Prestige Brands Holdings, Inc. (a) | 204,740 | 7,649,086 | |
| Reata Pharmaceuticals, Inc. (a) | 29,723 | 5,788,554 | |
| Revance Therapeutics, Inc. (a) | 585,966 | 13,547,534 | |
| Supernus Pharmaceuticals, Inc. (a) | 149,063 | 2,681,643 | |
| Zogenix, Inc. (a) | 61,185 | 1,534,520 | |
| Zynerba Pharmaceuticals, Inc. (a)(b) | 373,391 | 1,590,646 | |
| 103,481,725 | |||
| TOTAL HEALTH CARE | 869,538,475 | ||
| INDUSTRIALS - 17.5% | |||
| Aerospace & Defense - 1.3% | |||
| AAR Corp. | 168,059 | 5,806,438 | |
| Arconic, Inc. | 146,121 | 4,288,651 | |
| Axon Enterprise, Inc. (a) | 86,429 | 6,687,012 | |
| Curtiss-Wright Corp. | 28,451 | 3,412,413 | |
| HEICO Corp. | 36,961 | 3,986,244 | |
| HEICO Corp. Class A | 180,941 | 15,982,519 | |
| Hexcel Corp. | 89,720 | 5,798,604 | |
| Huntington Ingalls Industries, Inc. | 68,478 | 14,074,283 | |
| Mercury Systems, Inc. (a) | 104,530 | 7,678,774 | |
| National Presto Industries, Inc. | 4,291 | 337,187 | |
| Spirit AeroSystems Holdings, Inc. Class A | 111,400 | 5,886,376 | |
| Teledyne Technologies, Inc. (a) | 37,511 | 12,653,211 | |
| Textron, Inc. | 188,705 | 7,661,423 | |
| 94,253,135 | |||
| Air Freight & Logistics - 0.6% | |||
| Atlas Air Worldwide Holdings, Inc. (a) | 75,884 | 2,027,620 | |
| C.H. Robinson Worldwide, Inc. | 134,743 | 9,283,793 | |
| Forward Air Corp. | 223,314 | 13,177,759 | |
| Hub Group, Inc. Class A (a) | 119,342 | 5,517,181 | |
| XPO Logistics, Inc. (a) | 171,166 | 12,661,149 | |
| 42,667,502 | |||
| Airlines - 0.7% | |||
| Alaska Air Group, Inc. | 298,653 | 15,070,030 | |
| Azul SA sponsored ADR (a) | 220,600 | 6,507,700 | |
| Hawaiian Holdings, Inc. | 252,753 | 5,277,483 | |
| JetBlue Airways Corp. (a) | 520,555 | 8,214,358 | |
| SkyWest, Inc. | 254,979 | 11,576,047 | |
| Spirit Airlines, Inc. (a) | 60,966 | 1,734,483 | |
| 48,380,101 | |||
| Building Products - 1.5% | |||
| A.O. Smith Corp. | 128,828 | 5,095,147 | |
| AAON, Inc. | 36,405 | 2,002,639 | |
| Apogee Enterprises, Inc. | 76,492 | 2,309,293 | |
| Armstrong World Industries, Inc. | 197,567 | 19,786,335 | |
| CSW Industrials, Inc. | 13,615 | 896,412 | |
| Fortune Brands Home & Security, Inc. | 294,425 | 18,180,744 | |
| Lennox International, Inc. | 41,600 | 9,490,208 | |
| Masonite International Corp. (a) | 209,048 | 15,365,028 | |
| Owens Corning | 146,711 | 8,287,704 | |
| Patrick Industries, Inc. | 164,447 | 8,687,735 | |
| Simpson Manufacturing Co. Ltd. | 37,054 | 2,943,199 | |
| Trex Co., Inc. (a) | 120,523 | 11,528,025 | |
| 104,572,469 | |||
| Commercial Services & Supplies - 3.4% | |||
| ABM Industries, Inc. | 751,358 | 24,734,705 | |
| ACCO Brands Corp. | 471,306 | 3,775,161 | |
| Brady Corp. Class A | 261,542 | 12,381,398 | |
| Casella Waste Systems, Inc. Class A (a) | 110,339 | 5,345,925 | |
| Cimpress PLC (a)(b) | 191,684 | 22,313,934 | |
| Clean Harbors, Inc. (a) | 311,625 | 21,664,170 | |
| Copart, Inc. (a) | 53,381 | 4,509,627 | |
| Deluxe Corp. | 115,130 | 3,833,829 | |
| Harsco Corp. (a) | 247,886 | 2,972,153 | |
| Healthcare Services Group, Inc. (b) | 369,853 | 10,185,752 | |
| Herman Miller, Inc. | 235,447 | 8,061,705 | |
| IAA Spinco, Inc. (a) | 607,244 | 25,941,464 | |
| KAR Auction Services, Inc. | 494,153 | 9,512,445 | |
| MSA Safety, Inc. | 186,800 | 22,727,956 | |
| Pitney Bowes, Inc. | 367,000 | 1,255,140 | |
| Ritchie Bros. Auctioneers, Inc. | 388,714 | 15,431,946 | |
| Steelcase, Inc. Class A | 279,500 | 4,533,490 | |
| The Brink's Co. | 69,394 | 5,432,856 | |
| UniFirst Corp. | 13,822 | 2,568,266 | |
| Waste Connection, Inc. (United States) | 290,434 | 28,023,977 | |
| 235,205,899 | |||
| Construction & Engineering - 0.6% | |||
| AECOM (a) | 118,174 | 5,310,740 | |
| Aegion Corp. (a) | 219,922 | 3,960,795 | |
| Jacobs Engineering Group, Inc. | 60,020 | 5,542,247 | |
| Quanta Services, Inc. | 203,877 | 7,773,830 | |
| Tutor Perini Corp. (a) | 479,549 | 6,953,461 | |
| Williams Scotsman Corp. (a) | 670,703 | 11,764,131 | |
| 41,305,204 | |||
| Electrical Equipment - 1.2% | |||
| Acuity Brands, Inc. | 68,219 | 7,017,006 | |
| AMETEK, Inc. | 52,852 | 4,545,272 | |
| EnerSys | 209,097 | 12,876,193 | |
| Generac Holdings, Inc. (a) | 159,650 | 16,442,354 | |
| Hubbell, Inc. Class B | 48,988 | 6,527,161 | |
| nVent Electric PLC | 146,194 | 3,510,118 | |
| Regal Beloit Corp. | 151,860 | 11,790,410 | |
| Sensata Technologies, Inc. PLC (a) | 470,001 | 19,176,041 | |
| Vicor Corp. (a) | 31,111 | 1,345,240 | |
| 83,229,795 | |||
| Industrial Conglomerates - 0.2% | |||
| Carlisle Companies, Inc. | 83,775 | 12,171,670 | |
| Raven Industries, Inc. | 32,056 | 920,328 | |
| 13,091,998 | |||
| Machinery - 4.4% | |||
| Alamo Group, Inc. | 35,530 | 3,935,658 | |
| Allison Transmission Holdings, Inc. | 298,359 | 12,113,375 | |
| Donaldson Co., Inc. | 114,494 | 5,161,390 | |
| Douglas Dynamics, Inc. | 168,685 | 7,342,858 | |
| Flowserve Corp. | 66,800 | 2,684,692 | |
| Gardner Denver Holdings, Inc. | 225,982 | 7,409,950 | |
| Gates Industrial Corp. PLC (a) | 625,986 | 6,547,814 | |
| Gorman-Rupp Co. | 16,997 | 543,734 | |
| Graco, Inc. | 149,026 | 7,349,962 | |
| Hillenbrand, Inc. | 66,020 | 1,544,868 | |
| IDEX Corp. | 191,721 | 28,374,708 | |
| ITT, Inc. | 78,434 | 4,717,805 | |
| John Bean Technologies Corp. | 176,938 | 17,138,215 | |
| Kennametal, Inc. | 425,465 | 11,827,927 | |
| Lincoln Electric Holdings, Inc. | 265,852 | 21,770,620 | |
| Meritor, Inc. (a) | 219,680 | 4,984,539 | |
| Middleby Corp. (a) | 141,821 | 15,857,006 | |
| Nordson Corp. | 91,419 | 13,283,181 | |
| Oshkosh Corp. | 87,500 | 6,313,125 | |
| Proto Labs, Inc. (a) | 24,279 | 2,127,812 | |
| RBC Bearings, Inc. (a) | 89,808 | 15,374,232 | |
| Rexnord Corp. | 107,932 | 3,147,297 | |
| Snap-On, Inc. | 98,941 | 14,321,710 | |
| Tennant Co. | 211,094 | 15,101,665 | |
| Terex Corp. | 169,652 | 3,734,041 | |
| Timken Co. | 98,800 | 4,430,192 | |
| Toro Co. | 411,044 | 29,360,873 | |
| Trinity Industries, Inc. | 206,600 | 4,204,310 | |
| WABCO Holdings, Inc. (a) | 46,727 | 6,312,818 | |
| Welbilt, Inc. (a) | 467,340 | 6,178,235 | |
| Woodward, Inc. | 235,916 | 24,346,531 | |
| 307,541,143 | |||
| Marine - 0.4% | |||
| Kirby Corp. (a) | 183,710 | 11,711,513 | |
| Matson, Inc. | 466,246 | 15,484,030 | |
| 27,195,543 | |||
| Professional Services - 1.2% | |||
| ASGN, Inc. (a) | 118,436 | 6,005,890 | |
| Barrett Business Services, Inc. | 6,581 | 394,202 | |
| CoStar Group, Inc. (a) | 15,491 | 10,341,637 | |
| Exponent, Inc. | 46,585 | 3,430,985 | |
| FTI Consulting, Inc. (a) | 128,095 | 14,422,216 | |
| Huron Consulting Group, Inc. (a) | 38,401 | 2,278,715 | |
| InnerWorkings, Inc. (a) | 1,070,483 | 3,361,317 | |
| Kforce, Inc. | 19,612 | 597,382 | |
| Manpower, Inc. | 147,468 | 11,198,720 | |
| Robert Half International, Inc. | 108,772 | 5,483,197 | |
| TriNet Group, Inc. (a) | 473,812 | 25,045,702 | |
| 82,559,963 | |||
| Road & Rail - 1.0% | |||
| Heartland Express, Inc. | 574,107 | 10,282,256 | |
| Kansas City Southern | 33,100 | 4,987,508 | |
| Knight-Swift Transportation Holdings, Inc. Class A | 705,493 | 22,533,446 | |
| Landstar System, Inc. | 200,432 | 20,237,619 | |
| Lyft, Inc. | 156,842 | 5,978,817 | |
| Old Dominion Freight Lines, Inc. | 20,000 | 3,876,000 | |
| Ryder System, Inc. | 6,760 | 257,150 | |
| Schneider National, Inc. Class B | 81,500 | 1,459,665 | |
| Uber Technologies, Inc. | 103,295 | 3,498,602 | |
| 73,111,063 | |||
| Trading Companies & Distributors - 1.0% | |||
| Air Lease Corp. Class A | 160,244 | 6,146,960 | |
| Applied Industrial Technologies, Inc. | 145,548 | 8,585,877 | |
| BMC Stock Holdings, Inc. (a) | 78,412 | 1,923,446 | |
| EVI Industries, Inc. (a)(b) | 85,959 | 1,897,115 | |
| HD Supply Holdings, Inc. (a) | 89,697 | 3,410,280 | |
| Kaman Corp. | 25,080 | 1,390,937 | |
| MRC Global, Inc. (a) | 421,332 | 3,665,588 | |
| MSC Industrial Direct Co., Inc. Class A | 63,263 | 3,910,919 | |
| SiteOne Landscape Supply, Inc. (a) | 130,831 | 12,984,977 | |
| Transcat, Inc. (a) | 143,838 | 4,155,480 | |
| Triton International Ltd. | 186,565 | 6,412,239 | |
| United Rentals, Inc. (a) | 57,400 | 7,604,352 | |
| Watsco, Inc. | 21,442 | 3,365,965 | |
| WESCO International, Inc. (a) | 93,641 | 3,799,015 | |
| 69,253,150 | |||
| TOTAL INDUSTRIALS | 1,222,366,965 | ||
| INFORMATION TECHNOLOGY - 20.0% | |||
| Communications Equipment - 0.6% | |||
| CalAmp Corp. (a) | 89,464 | 860,644 | |
| Ciena Corp. (a) | 450,520 | 17,322,494 | |
| CommScope Holding Co., Inc. (a) | 175,568 | 1,933,004 | |
| F5 Networks, Inc. (a) | 31,787 | 3,812,851 | |
| Juniper Networks, Inc. | 304,600 | 6,463,612 | |
| KVH Industries, Inc. (a) | 277,851 | 2,895,207 | |
| NetScout Systems, Inc. (a) | 256,995 | 6,604,772 | |
| Viavi Solutions, Inc. (a) | 242,110 | 3,193,431 | |
| 43,086,015 | |||
| Electronic Equipment & Components - 2.6% | |||
| Arrow Electronics, Inc. (a) | 118,632 | 7,955,462 | |
| Avnet, Inc. | 139,243 | 4,271,975 | |
| Badger Meter, Inc. | 26,102 | 1,571,601 | |
| Belden, Inc. | 783,415 | 31,281,761 | |
| Cognex Corp. | 419,347 | 18,677,715 | |
| Coherent, Inc. (a) | 21,944 | 2,824,412 | |
| Dolby Laboratories, Inc. Class A | 57,316 | 3,765,661 | |
| Flextronics International Ltd. (a) | 240,795 | 2,675,232 | |
| FLIR Systems, Inc. | 118,527 | 5,033,842 | |
| Insight Enterprises, Inc. (a) | 96,663 | 5,325,165 | |
| IPG Photonics Corp. (a) | 57,090 | 7,286,968 | |
| Jabil, Inc. | 250,281 | 8,021,506 | |
| Littelfuse, Inc. | 46,520 | 7,428,314 | |
| National Instruments Corp. | 100,790 | 4,059,821 | |
| Novanta, Inc. (a) | 64,366 | 5,742,091 | |
| Par Technology Corp. (a)(b) | 105,957 | 2,806,801 | |
| Powerfleet, Inc. (a) | 431,273 | 3,040,475 | |
| Rogers Corp. (a) | 43,927 | 5,095,532 | |
| Sanmina Corp. (a) | 129,900 | 3,415,071 | |
| ScanSource, Inc. (a) | 71,700 | 2,038,431 | |
| SYNNEX Corp. | 126,479 | 15,813,669 | |
| Trimble, Inc. (a) | 425,558 | 16,801,030 | |
| TTM Technologies, Inc. (a) | 774,721 | 10,063,626 | |
| Vishay Intertechnology, Inc. | 296,159 | 5,538,173 | |
| 180,534,334 | |||
| IT Services - 3.7% | |||
| Akamai Technologies, Inc. (a) | 46,921 | 4,059,136 | |
| Alliance Data Systems Corp. | 28,502 | 2,447,752 | |
| Amdocs Ltd. | 454,656 | 28,984,320 | |
| Black Knight, Inc. (a) | 148,121 | 9,881,152 | |
| Booz Allen Hamilton Holding Corp. Class A | 156,022 | 11,124,369 | |
| Broadridge Financial Solutions, Inc. | 38,480 | 4,015,773 | |
| CACI International, Inc. Class A (a) | 7,277 | 1,783,011 | |
| Cass Information Systems, Inc. | 10,781 | 506,168 | |
| CoreLogic, Inc. | 218,805 | 9,927,183 | |
| EPAM Systems, Inc. (a) | 15,268 | 3,407,818 | |
| Equiniti Group PLC (c) | 3,578,288 | 9,284,839 | |
| Euronet Worldwide, Inc. (a) | 262,670 | 32,581,587 | |
| EVERTEC, Inc. | 165,417 | 4,909,577 | |
| Gartner, Inc. (a) | 79,251 | 10,254,287 | |
| Genpact Ltd. | 149,980 | 5,768,231 | |
| GoDaddy, Inc. (a) | 258,445 | 18,085,981 | |
| Hackett Group, Inc. | 23,709 | 365,119 | |
| International Money Express, Inc. (a) | 63,193 | 595,278 | |
| Jack Henry & Associates, Inc. | 52,357 | 7,944,651 | |
| Maximus, Inc. | 158,800 | 10,007,576 | |
| NIC, Inc. | 59,688 | 1,091,694 | |
| Science Applications International Corp. | 56,236 | 4,506,191 | |
| Switch, Inc. Class A | 803,839 | 11,527,051 | |
| Sykes Enterprises, Inc. (a) | 65,190 | 2,065,219 | |
| The Western Union Co. | 154,700 | 3,463,733 | |
| Ttec Holdings, Inc. | 127,396 | 4,768,432 | |
| Twilio, Inc. Class A (a) | 43,862 | 4,940,616 | |
| Unisys Corp. (a) | 634,237 | 9,849,701 | |
| Virtusa Corp. (a) | 117,556 | 5,185,395 | |
| WEX, Inc. (a) | 83,250 | 15,587,730 | |
| Wix.com Ltd. (a) | 77,678 | 10,411,182 | |
| WNS Holdings Ltd. sponsored ADR (a) | 99,101 | 6,524,810 | |
| 255,855,562 | |||
| Semiconductors & Semiconductor Equipment - 2.7% | |||
| Ambarella, Inc. (a) | 21,196 | 1,260,102 | |
| AXT, Inc. (a) | 344,076 | 1,197,384 | |
| Cabot Microelectronics Corp. | 105,999 | 14,763,541 | |
| Cirrus Logic, Inc. (a) | 50,300 | 3,452,592 | |
| Cree, Inc. (a) | 44,922 | 2,009,361 | |
| Cypress Semiconductor Corp. | 444,520 | 10,263,967 | |
| Diodes, Inc. (a) | 156,600 | 6,891,966 | |
| Entegris, Inc. | 186,232 | 9,929,890 | |
| Impinj, Inc. (a)(b) | 123,765 | 3,805,774 | |
| Inphi Corp. (a) | 62,710 | 4,681,929 | |
| Kulicke & Soffa Industries, Inc. | 327,565 | 7,478,309 | |
| Lattice Semiconductor Corp. (a) | 290,281 | 5,210,544 | |
| Maxim Integrated Products, Inc. | 228,780 | 12,724,744 | |
| MaxLinear, Inc. Class A (a) | 322,594 | 4,987,303 | |
| MKS Instruments, Inc. | 57,590 | 5,769,942 | |
| Monolithic Power Systems, Inc. | 74,028 | 11,743,802 | |
| NVE Corp. | 4,312 | 272,820 | |
| ON Semiconductor Corp. (a) | 2,109,388 | 39,361,180 | |
| Power Integrations, Inc. | 25,082 | 2,183,388 | |
| Qorvo, Inc. (a) | 60,515 | 6,086,599 | |
| Semtech Corp. (a) | 252,103 | 9,955,547 | |
| Silicon Laboratories, Inc. (a) | 87,232 | 7,735,734 | |
| Skyworks Solutions, Inc. | 15,600 | 1,562,808 | |
| Teradyne, Inc. | 123,884 | 7,279,424 | |
| Universal Display Corp. | 56,899 | 9,034,992 | |
| 189,643,642 | |||
| Software - 10.0% | |||
| 2U, Inc. (a) | 739,773 | 17,392,063 | |
| 8x8, Inc. (a) | 29,251 | 541,144 | |
| ACI Worldwide, Inc. (a) | 599,204 | 16,699,815 | |
| Alarm.com Holdings, Inc. (a) | 48,266 | 2,328,835 | |
| American Software, Inc. Class A | 24,402 | 401,413 | |
| Anaplan, Inc. (a) | 117,424 | 5,277,035 | |
| ANSYS, Inc. (a) | 16,914 | 4,096,402 | |
| Aspen Technology, Inc. (a) | 187,970 | 20,020,685 | |
| Avalara, Inc. (a) | 69,483 | 5,888,684 | |
| Blackbaud, Inc. | 32,300 | 2,189,940 | |
| Box, Inc. Class A (a) | 134,100 | 2,246,175 | |
| CDK Global, Inc. | 432,809 | 19,917,870 | |
| Cerence, Inc. (a) | 149,984 | 3,256,153 | |
| ChannelAdvisor Corp. (a) | 329,440 | 3,136,269 | |
| Citrix Systems, Inc. | 17,000 | 1,757,630 | |
| CommVault Systems, Inc. (a) | 192,315 | 8,019,536 | |
| Cornerstone OnDemand, Inc. (a) | 370,455 | 15,199,769 | |
| Coupa Software, Inc. (a) | 101,410 | 15,186,148 | |
| DocuSign, Inc. (a) | 113,610 | 9,805,679 | |
| Domo, Inc. Class B (a) | 81,613 | 1,721,218 | |
| Dynatrace, Inc. | 161,473 | 5,215,578 | |
| Ebix, Inc. (b) | 35,369 | 935,156 | |
| Elastic NV (a) | 60,250 | 4,450,065 | |
| Enghouse Systems Ltd. | 199,711 | 7,573,321 | |
| Everbridge, Inc. (a) | 82,085 | 8,673,101 | |
| Fair Isaac Corp. (a) | 64,450 | 24,235,134 | |
| FireEye, Inc. (a) | 698,773 | 9,248,261 | |
| Guidewire Software, Inc. (a) | 113,188 | 12,406,537 | |
| HubSpot, Inc. (a) | 48,497 | 8,702,787 | |
| Instructure, Inc. (a) | 32,100 | 1,565,196 | |
| j2 Global, Inc. | 647,084 | 56,509,846 | |
| LivePerson, Inc. (a) | 471,152 | 12,466,682 | |
| LogMeIn, Inc. | 511,330 | 43,583,213 | |
| Manhattan Associates, Inc. (a) | 150,397 | 10,130,742 | |
| Mimecast Ltd. (a) | 190,403 | 7,538,055 | |
| Model N, Inc. (a) | 41,292 | 1,197,468 | |
| New Relic, Inc. (a) | 133,525 | 7,512,117 | |
| Nortonlifelock, Inc. | 79,400 | 1,510,982 | |
| Nuance Communications, Inc. (a) | 1,217,578 | 26,324,036 | |
| Palo Alto Networks, Inc. (a) | 9,358 | 1,727,674 | |
| Parametric Technology Corp. (a) | 31,800 | 2,402,490 | |
| Paycom Software, Inc. (a) | 72,852 | 20,591,618 | |
| Paylocity Holding Corp. (a) | 28,373 | 3,674,871 | |
| Pluralsight, Inc. (a) | 647,215 | 11,539,843 | |
| Proofpoint, Inc. (a) | 125,330 | 13,366,445 | |
| Q2 Holdings, Inc. (a) | 164,532 | 12,400,777 | |
| Qualys, Inc. (a) | 92,934 | 7,451,448 | |
| Rapid7, Inc. (a) | 124,649 | 5,771,249 | |
| RealPage, Inc. (a) | 273,754 | 17,547,631 | |
| RingCentral, Inc. (a) | 126,710 | 29,871,883 | |
| SharpSpring, Inc. (a)(b) | 90,437 | 1,030,982 | |
| Slack Technologies, Inc. Class A (a)(b) | 92,190 | 2,490,974 | |
| Smartsheet, Inc. (a) | 120,694 | 5,588,132 | |
| SolarWinds, Inc. (a) | 993,749 | 18,106,107 | |
| Splunk, Inc. (a) | 115,448 | 17,008,954 | |
| Sprout Social, Inc. (a)(b) | 128,905 | 2,532,983 | |
| SS&C Technologies Holdings, Inc. | 771,475 | 42,816,863 | |
| The Trade Desk, Inc. (a) | 50,959 | 14,637,973 | |
| Tyler Technologies, Inc. (a) | 54,860 | 17,190,381 | |
| Upland Software, Inc. (a) | 482,926 | 18,790,651 | |
| Verint Systems, Inc. (a) | 137,979 | 7,572,288 | |
| Yext, Inc. (a)(b) | 93,640 | 1,419,582 | |
| Zendesk, Inc. (a) | 65,020 | 5,156,736 | |
| Zix Corp. (a) | 903,344 | 7,118,351 | |
| Zoom Video Communications, Inc. Class A (b) | 18,764 | 1,970,220 | |
| 694,637,846 | |||
| Technology Hardware, Storage & Peripherals - 0.4% | |||
| NCR Corp. (a) | 462,063 | 11,643,988 | |
| Quantum Corp. (a) | 359,896 | 1,875,058 | |
| Seagate Technology LLC | 127,000 | 6,089,650 | |
| Western Digital Corp. | 86,260 | 4,792,606 | |
| Xerox Holdings Corp. | 164,200 | 5,287,240 | |
| 29,688,542 | |||
| TOTAL INFORMATION TECHNOLOGY | 1,393,445,941 | ||
| MATERIALS - 3.7% | |||
| Chemicals - 1.5% | |||
| Axalta Coating Systems Ltd. (a) | 402,436 | 10,028,705 | |
| Cabot Corp. | 76,213 | 2,848,842 | |
| Celanese Corp. Class A | 57,600 | 5,399,424 | |
| CF Industries Holdings, Inc. | 54,000 | 1,990,440 | |
| Chase Corp. | 6,466 | 574,116 | |
| Eastman Chemical Co. | 114,700 | 7,055,197 | |
| FMC Corp. | 77,292 | 7,195,885 | |
| Huntsman Corp. | 539,093 | 10,210,421 | |
| Ingevity Corp. (a) | 108,110 | 4,869,274 | |
| Innospec, Inc. | 43,475 | 3,762,327 | |
| Minerals Technologies, Inc. | 80,014 | 3,590,228 | |
| NewMarket Corp. | 7,964 | 3,094,731 | |
| Olin Corp. | 112,470 | 1,820,889 | |
| Orion Engineered Carbons SA | 300,226 | 4,266,211 | |
| PQ Group Holdings, Inc. (a) | 246,755 | 3,274,439 | |
| Quaker Chemical Corp. (b) | 58,841 | 9,271,576 | |
| Sensient Technologies Corp. | 37,853 | 1,861,611 | |
| Stepan Co. | 18,163 | 1,595,256 | |
| The Chemours Co. LLC | 183,400 | 2,725,324 | |
| The Mosaic Co. | 136,573 | 2,325,838 | |
| Trinseo SA | 336,467 | 7,361,898 | |
| Valvoline, Inc. | 391,390 | 7,632,105 | |
| Venator Materials PLC (a) | 242,645 | 647,862 | |
| Westlake Chemical Corp. | 72,748 | 4,064,431 | |
| 107,467,030 | |||
| Construction Materials - 0.1% | |||
| Eagle Materials, Inc. | 40,925 | 3,230,210 | |
| Summit Materials, Inc. (a) | 86,100 | 1,682,394 | |
| 4,912,604 | |||
| Containers & Packaging - 1.5% | |||
| Aptargroup, Inc. | 299,641 | 30,284,716 | |
| CCL Industries, Inc. Class B | 143,078 | 4,723,253 | |
| Crown Holdings, Inc. (a) | 218,045 | 15,372,173 | |
| Graphic Packaging Holding Co. | 1,560,396 | 21,096,554 | |
| Greif, Inc. Class A | 111,900 | 3,954,546 | |
| O-I Glass, Inc. | 379,289 | 4,096,321 | |
| Packaging Corp. of America | 85,700 | 7,766,134 | |
| Sealed Air Corp. | 330,111 | 10,005,664 | |
| WestRock Co. | 155,117 | 5,157,640 | |
| 102,457,001 | |||
| Metals & Mining - 0.5% | |||
| Carpenter Technology Corp. | 158,397 | 5,821,090 | |
| Cleveland-Cliffs, Inc. (b) | 474,100 | 2,754,521 | |
| Ferroglobe Representation & Warranty Insurance (a)(d) | 495,885 | 5 | |
| Kaiser Aluminum Corp. | 23,694 | 2,240,268 | |
| Reliance Steel & Aluminum Co. | 122,024 | 12,481,835 | |
| Royal Gold, Inc. | 24,400 | 2,353,868 | |
| Steel Dynamics, Inc. | 80,000 | 2,130,400 | |
| SunCoke Energy, Inc. | 562,840 | 2,594,692 | |
| Worthington Industries, Inc. | 36,044 | 1,146,199 | |
| 31,522,878 | |||
| Paper & Forest Products - 0.1% | |||
| Domtar Corp. | 79,600 | 2,290,092 | |
| Neenah, Inc. | 15,061 | 870,074 | |
| Schweitzer-Mauduit International, Inc. | 161,978 | 5,461,898 | |
| 8,622,064 | |||
| TOTAL MATERIALS | 254,981,577 | ||
| REAL ESTATE - 4.9% | |||
| Equity Real Estate Investment Trusts (REITs) - 4.6% | |||
| American Campus Communities, Inc. | 188,726 | 8,198,257 | |
| Americold Realty Trust | 206,508 | 6,333,600 | |
| Apartment Investment & Management Co. Class A | 64,100 | 3,066,544 | |
| Brandywine Realty Trust (SBI) | 338,200 | 4,592,756 | |
| Brixmor Property Group, Inc. | 313,300 | 5,705,193 | |
| Camden Property Trust (SBI) | 87,051 | 9,225,665 | |
| CBL & Associates Properties, Inc. | 226,300 | 120,120 | |
| Chatham Lodging Trust | 2,914 | 40,621 | |
| City Office REIT, Inc. | 182,900 | 2,121,640 | |
| Colony Capital, Inc. | 475,708 | 1,883,804 | |
| CoreCivic, Inc. | 159,700 | 2,365,157 | |
| CorEnergy Infrastructure Trust, Inc. | 84,100 | 2,935,090 | |
| CoreSite Realty Corp. | 34,700 | 3,599,431 | |
| Cousins Properties, Inc. | 254,825 | 9,094,704 | |
| CubeSmart | 589,883 | 17,855,758 | |
| CyrusOne, Inc. | 42,350 | 2,565,563 | |
| DiamondRock Hospitality Co. | 461,700 | 4,210,704 | |
| Easterly Government Properties, Inc. | 263,159 | 6,255,289 | |
| EastGroup Properties, Inc. | 125,981 | 15,839,591 | |
| Empire State Realty Trust, Inc. | 514,554 | 6,020,282 | |
| Equity Commonwealth | 267,182 | 8,405,546 | |
| Franklin Street Properties Corp. | 275,093 | 1,961,413 | |
| Gaming & Leisure Properties | 126,866 | 5,667,104 | |
| Global Net Lease, Inc. | 190,184 | 3,508,895 | |
| Government Properties Income Trust | 132,285 | 3,853,462 | |
| Healthcare Trust of America, Inc. | 113,800 | 3,543,732 | |
| Hospitality Properties Trust (SBI) | 254,722 | 4,605,374 | |
| Industrial Logistics Properties Trust | 136,179 | 2,813,458 | |
| Lamar Advertising Co. Class A | 76,198 | 6,380,821 | |
| Medical Properties Trust, Inc. | 169,200 | 3,575,196 | |
| MGM Growth Properties LLC | 273,915 | 7,861,361 | |
| Mid-America Apartment Communities, Inc. | 113,657 | 14,691,304 | |
| National Retail Properties, Inc. | 342,779 | 17,430,312 | |
| Omega Healthcare Investors, Inc. | 140,200 | 5,551,920 | |
| Outfront Media, Inc. | 804,115 | 21,180,389 | |
| Park Hotels & Resorts, Inc. | 279,576 | 5,105,058 | |
| Physicians Realty Trust | 297,910 | 5,618,583 | |
| Piedmont Office Realty Trust, Inc. Class A | 469,700 | 10,140,823 | |
| Preferred Apartment Communities, Inc. Class A | 234,200 | 2,234,268 | |
| Retail Value, Inc. | 38,179 | 1,060,994 | |
| RLJ Lodging Trust | 556,959 | 7,357,428 | |
| Ryman Hospitality Properties, Inc. | 45,966 | 3,195,097 | |
| Sabra Health Care REIT, Inc. | 406,300 | 7,943,165 | |
| Senior Housing Properties Trust (SBI) | 596,834 | 3,754,086 | |
| SITE Centers Corp. | 357,750 | 4,117,703 | |
| SL Green Realty Corp. | 23,011 | 1,804,983 | |
| Spirit Realty Capital, Inc. | 45,405 | 2,065,928 | |
| Stag Industrial, Inc. | 310,349 | 8,683,565 | |
| Summit Hotel Properties, Inc. | 198,800 | 1,842,876 | |
| Sun Communities, Inc. | 54,144 | 8,277,535 | |
| Tanger Factory Outlet Centers, Inc. | 210,900 | 2,526,582 | |
| The GEO Group, Inc. | 154,500 | 2,261,880 | |
| VEREIT, Inc. | 1,265,900 | 10,962,694 | |
| Washington Prime Group, Inc. (b) | 365,000 | 1,003,750 | |
| Weingarten Realty Investors (SBI) | 94,200 | 2,536,806 | |
| Xenia Hotels & Resorts, Inc. | 257,700 | 3,855,192 | |
| 319,409,052 | |||
| Real Estate Management & Development - 0.3% | |||
| Cushman & Wakefield PLC (a) | 716,856 | 13,039,611 | |
| FirstService Corp. | 25,265 | 2,506,830 | |
| Howard Hughes Corp. (a) | 18,300 | 1,974,204 | |
| Jones Lang LaSalle, Inc. | 27,403 | 4,049,341 | |
| Marcus & Millichap, Inc. (a) | 12,785 | 408,609 | |
| The RMR Group, Inc. | 6,213 | 231,496 | |
| 22,210,091 | |||
| TOTAL REAL ESTATE | 341,619,143 | ||
| UTILITIES - 1.2% | |||
| Electric Utilities - 0.5% | |||
| Alliant Energy Corp. | 195,783 | 10,204,210 | |
| Evergy, Inc. | 12,600 | 823,410 | |
| PNM Resources, Inc. | 165,634 | 7,798,049 | |
| Portland General Electric Co. | 277,466 | 15,096,925 | |
| 33,922,594 | |||
| Gas Utilities - 0.2% | |||
| National Fuel Gas Co. | 107,300 | 3,928,253 | |
| South Jersey Industries, Inc. | 80,400 | 2,174,820 | |
| Southwest Gas Holdings, Inc. | 53,948 | 3,489,357 | |
| 9,592,430 | |||
| Independent Power and Renewable Electricity Producers - 0.2% | |||
| NRG Energy, Inc. | 43,100 | 1,431,351 | |
| The AES Corp. | 324,952 | 5,436,447 | |
| Vistra Energy Corp. | 497,030 | 9,557,887 | |
| 16,425,685 | |||
| Multi-Utilities - 0.3% | |||
| Black Hills Corp. | 78,386 | 5,659,469 | |
| MDU Resources Group, Inc. | 103,800 | 2,878,374 | |
| NorthWestern Energy Corp. | 192,317 | 13,527,578 | |
| 22,065,421 | |||
| TOTAL UTILITIES | 82,006,130 | ||
| TOTAL COMMON STOCKS | |||
| (Cost $5,977,633,740) | 6,518,981,304 | ||
| Convertible Preferred Stocks - 0.0% | |||
| CONSUMER DISCRETIONARY - 0.0% | |||
| Internet & Direct Marketing Retail - 0.0% | |||
| The Honest Co., Inc. Series D (a)(d)(e) | |||
| (Cost $257,662) | 6,381 | 291,995 | |
| Equity Funds - 4.5% | |||
| Mid-Cap Blend Funds - 1.6% | |||
| Fidelity SAI Small-Mid Cap 500 Index Fund (f) | 9,390,840 | 109,403,255 | |
| Sector Funds - 1.4% | |||
| Fidelity SAI Real Estate Index Fund (f) | 9,065,287 | 99,990,120 | |
| Small Blend Funds - 1.5% | |||
| Fidelity Small Cap Index Fund (f) | 5,763,672 | 107,434,853 | |
| TOTAL EQUITY FUNDS | |||
| (Cost $333,092,296) | 316,828,228 | ||
| Principal Amount | Value | ||
| U.S. Treasury Obligations - 0.0% | |||
| U.S. Treasury Bills, yield at date of purchase 1.82% 3/19/20 (g) | |||
| (Cost $79,928) | 80,000 | 79,946 | |
| Shares | Value | ||
| Money Market Funds - 4.9% | |||
| Fidelity Cash Central Fund 1.60% (h) | 5,407,315 | 5,408,397 | |
| Fidelity Securities Lending Cash Central Fund 1.60% (h)(i) | 191,485,777 | 191,504,925 | |
| State Street Institutional U.S. Government Money Market Fund Premier Class 1.53% (j) | 146,566,857 | 146,566,857 | |
| TOTAL MONEY MARKET FUNDS | |||
| (Cost $343,480,179) | 343,480,179 | ||
| TOTAL INVESTMENT IN SECURITIES - 102.9% | |||
| (Cost $6,654,543,805) | 7,179,661,652 | ||
| NET OTHER ASSETS (LIABILITIES) - (2.9)% | (204,315,321) | ||
| NET ASSETS - 100% | $6,975,346,331 |
| Futures Contracts | |||||
| Number of contracts | Expiration Date | Notional Amount | Value | Unrealized Appreciation/(Depreciation) | |
| Purchased | |||||
| Equity Index Contracts | |||||
| CME E-mini Russell 2000 Index Contracts (United States) | 8 | March 2020 | $589,960 | $(60,368) | $(60,368) |
| CME E-mini S&P MidCap 400 Index Contracts (United States) | 5 | March 2020 | 906,100 | (93,997) | (93,997) |
| TOTAL FUTURES CONTRACTS | $(154,365) |
The notional amount of futures purchased as a percentage of Net Assets is 0.0%
Legend
(a) Non-income producing
(b) Security or a portion of the security is on loan at period end.
(c) Security exempt from registration under Rule 144A of the Securities Act of 1933. These securities may be resold in transactions exempt from registration, normally to qualified institutional buyers. At the end of the period, the value of these securities amounted to $14,000,024 or 0.2% of net assets.
(d) Level 3 security
(e) Restricted securities (including private placements) - Investment in securities not registered under the Securities Act of 1933 (excluding 144A issues). At the end of the period, the value of restricted securities (excluding 144A issues) amounted to $291,995 or 0.0% of net assets.
(f) Affiliated Fund
(g) Security or a portion of the security was pledged to cover margin requirements for futures contracts. At period end, the value of securities pledged amounted to $79,946.
(h) Affiliated fund that is generally available only to investment companies and other accounts managed by Fidelity Investments. The rate quoted is the annualized seven-day yield of the fund at period end. A complete unaudited listing of the fund's holdings as of its most recent quarter end is available upon request. In addition, each Fidelity Central Fund's financial statements, which are not covered by the Fund's Report of Independent Registered Public Accounting Firm, are available on the SEC's website or upon request.
(i) Investment made with cash collateral received from securities on loan.
(j) The rate quoted is the annualized seven-day yield of the fund at period end.
Additional information on each restricted holding is as follows:
| Security | Acquisition Date | Acquisition Cost |
| The Honest Co., Inc. Series D | 9/25/15 | $257,662 |
Affiliated Central Funds
Information regarding fiscal year to date income earned by the Fund from investments in Fidelity Central Funds is as follows:
| Fund | Income earned |
| Fidelity Cash Central Fund | $57,440 |
| Fidelity Securities Lending Cash Central Fund | 1,804,422 |
| Total | $1,861,862 |
Amounts in the income column in the above table include any capital gain distributions from underlying funds, which are presented in the corresponding line-item in the Statement of Operations, if applicable. Amount for Fidelity Securities Lending Cash Central Fund represents the income earned on investing cash collateral, less rebates paid to borrowers and any lending agent fees associated with the loan, plus any premium payments received for lending certain types of securities.
Affiliated Underlying Funds
Fiscal year to date information regarding the Fund's investments in affiliated Underlying Funds, excluding any Money Market Central Funds, is presented below. Exchanges between classes of the same affiliated Underlying Funds may occur. Certain Underlying Funds incurred name changes since their most recent shareholder report. The names of the Underlying Funds are those in effect at period end.
| Affiliate | Value, beginning of period | Purchases | Sales Proceeds | Dividend Income | Realized Gain (loss) | Change in Unrealized appreciation (depreciation) | Value, end of period |
| Fidelity SAI Real Estate Index Fund | $99,325,713 | $4,003,420 | $-- | $4,003,423 | $-- | $(3,339,013) | $99,990,120 |
| Fidelity SAI Small-Mid Cap 500 Index Fund | 166,666,203 | 581,440,363 | 642,513,981 | 8,154,696 | 40,183,107 | (36,372,437) | 109,403,255 |
| Fidelity Small Cap Index Fund | 166,544,687 | 582,308,796 | 638,419,698 | 6,267,414 | 25,069,200 | (28,068,132) | 107,434,853 |
| Total | $432,536,603 | $1,167,752,579 | $1,280,933,679 | $18,425,533 | $65,252,307 | $(67,779,582) | $316,828,228 |
Amounts in the income column in the above table include any capital gain distributions from underlying funds, which are presented in the corresponding line-item in the Statement of Operations, if applicable.
Investment Valuation
The following is a summary of the inputs used, as of February 29, 2020, involving the Fund's assets and liabilities carried at fair value. The inputs or methodology used for valuing securities may not be an indication of the risk associated with investing in those securities. For more information on valuation inputs, and their aggregation into the levels used below, please refer to the Investment Valuation section in the accompanying Notes to Financial Statements.
| Valuation Inputs at Reporting Date: | ||||
| Description | Total | Level 1 | Level 2 | Level 3 |
| Investments in Securities: | ||||
| Equities: | ||||
| Communication Services | $189,567,392 | $184,852,207 | $4,715,185 | $-- |
| Consumer Discretionary | 876,007,470 | 875,715,475 | -- | 291,995 |
| Consumer Staples | 263,590,454 | 263,590,454 | -- | -- |
| Energy | 97,440,675 | 97,440,675 | -- | -- |
| Financials | 928,709,077 | 928,709,077 | -- | -- |
| Health Care | 869,538,475 | 869,538,475 | -- | -- |
| Industrials | 1,222,366,965 | 1,222,366,965 | -- | -- |
| Information Technology | 1,393,445,941 | 1,384,161,102 | 9,284,839 | -- |
| Materials | 254,981,577 | 254,981,572 | -- | 5 |
| Real Estate | 341,619,143 | 341,619,143 | -- | -- |
| Utilities | 82,006,130 | 82,006,130 | -- | -- |
| Equity Funds | 316,828,228 | 316,828,228 | -- | -- |
| Other Short-Term Investments | 79,946 | -- | 79,946 | -- |
| Money Market Funds | 343,480,179 | 343,480,179 | -- | -- |
| Total Investments in Securities: | $7,179,661,652 | $7,165,289,682 | $14,079,970 | $292,000 |
| Derivative Instruments: | ||||
| Liabilities | ||||
| Futures Contracts | $(154,365) | $(154,365) | $-- | $-- |
| Total Liabilities | $(154,365) | $(154,365) | $-- | $-- |
| Total Derivative Instruments: | $(154,365) | $(154,365) | $-- | $-- |
Value of Derivative Instruments
The following table is a summary of the Fund's value of derivative instruments by primary risk exposure as of February 29, 2020. For additional information on derivative instruments, please refer to the Derivative Instruments section in the accompanying Notes to Financial Statements.
| Primary Risk Exposure / Derivative Type | Value | |
| Asset | Liability | |
| Equity Risk | ||
| Futures Contracts(a) | $0 | $(154,365) |
| Total Equity Risk | 0 | (154,365) |
| Total Value of Derivatives | $0 | $(154,365) |
(a) Reflects gross cumulative appreciation (depreciation) on futures contracts as presented in the Schedule of Investments. In the Statement of Assets and Liabilities, the period end daily variation margin is included in receivable or payable for daily variation margin on futures contracts, and the net cumulative appreciation (depreciation) is included in Total accumulated earnings (loss).
See accompanying notes which are an integral part of the financial statements.
Financial Statements
Statement of Assets and Liabilities
| February 29, 2020 | ||
| Assets | ||
| Investment in securities, at value (including securities loaned of $182,828,238) — See accompanying schedule: Unaffiliated issuers (cost $6,124,538,187) | $6,665,920,102 | |
| Fidelity Central Funds (cost $196,913,322) | 196,913,322 | |
| Other affiliated issuers (cost $333,092,296) | 316,828,228 | |
| Total Investment in Securities (cost $6,654,543,805) | $7,179,661,652 | |
| Receivable for investments sold | 70,806,126 | |
| Receivable for fund shares sold | 2,678,239 | |
| Dividends receivable | 6,368,053 | |
| Interest receivable | 207,094 | |
| Distributions receivable from Fidelity Central Funds | 208,728 | |
| Other receivables | 258,172 | |
| Total assets | 7,260,188,064 | |
| Liabilities | ||
| Payable to custodian bank | $5,334,730 | |
| Payable for investments purchased | 76,267,918 | |
| Payable for fund shares redeemed | 8,956,217 | |
| Accrued management fee | 2,507,582 | |
| Payable for daily variation margin on futures contracts | 23,276 | |
| Other payables and accrued expenses | 245,019 | |
| Collateral on securities loaned | 191,506,991 | |
| Total liabilities | 284,841,733 | |
| Net Assets | $6,975,346,331 | |
| Net Assets consist of: | ||
| Paid in capital | $6,366,926,968 | |
| Total accumulated earnings (loss) | 608,419,363 | |
| Net Assets | $6,975,346,331 | |
| Net Asset Value, offering price and redemption price per share ($6,975,346,331 ÷ 541,845,490 shares) | $12.87 |
See accompanying notes which are an integral part of the financial statements.
Statement of Operations
| Year ended February 29, 2020 | ||
| Investment Income | ||
| Dividends: | ||
| Unaffiliated issuers | $93,305,652 | |
| Affiliated issuers | 9,348,621 | |
| Interest | 3,720,904 | |
| Income from Fidelity Central Funds (including $1,804,422 from security lending) | 1,861,862 | |
| Total income | 108,237,039 | |
| Expenses | ||
| Management fee | $50,962,284 | |
| Accounting and security lending fees | 410,860 | |
| Custodian fees and expenses | 193,929 | |
| Independent trustees' fees and expenses | 87,708 | |
| Registration fees | 72,856 | |
| Audit | 92,102 | |
| Legal | 41,042 | |
| Miscellaneous | 71,309 | |
| Total expenses before reductions | 51,932,090 | |
| Expense reductions | (19,841,094) | |
| Total expenses after reductions | 32,090,996 | |
| Net investment income (loss) | 76,146,043 | |
| Realized and Unrealized Gain (Loss) | ||
| Net realized gain (loss) on: | ||
| Investment securities: | ||
| Unaffiliated issuers | 332,179,424 | |
| Fidelity Central Funds | (2,628) | |
| Other affiliated issuers | 65,252,307 | |
| Foreign currency transactions | 19,945 | |
| Futures contracts | 257,622 | |
| Capital gain distributions from underlying funds: | ||
| Affiliated issuers | 9,076,912 | |
| Total net realized gain (loss) | 406,783,582 | |
| Change in net unrealized appreciation (depreciation) on: | ||
| Investment securities: | ||
| Unaffiliated issuers | (535,398,102) | |
| Affiliated issuers | (67,779,582) | |
| Assets and liabilities in foreign currencies | (1,890) | |
| Futures contracts | (273,419) | |
| Total change in net unrealized appreciation (depreciation) | (603,452,993) | |
| Net gain (loss) | (196,669,411) | |
| Net increase (decrease) in net assets resulting from operations | $(120,523,368) |
See accompanying notes which are an integral part of the financial statements.
Statement of Changes in Net Assets
| Year ended February 29, 2020 | Year ended February 28, 2019 | |
| Increase (Decrease) in Net Assets | ||
| Operations | ||
| Net investment income (loss) | $76,146,043 | $61,869,587 |
| Net realized gain (loss) | 406,783,582 | 378,717,385 |
| Change in net unrealized appreciation (depreciation) | (603,452,993) | (203,573,605) |
| Net increase (decrease) in net assets resulting from operations | (120,523,368) | 237,013,367 |
| Distributions to shareholders | (261,863,893) | (805,620,345) |
| Share transactions | ||
| Proceeds from sales of shares | 659,416,886 | 2,475,758,767 |
| Reinvestment of distributions | 260,179,078 | 803,532,856 |
| Cost of shares redeemed | (1,643,423,965) | (2,132,255,365) |
| Net increase (decrease) in net assets resulting from share transactions | (723,828,001) | 1,147,036,258 |
| Total increase (decrease) in net assets | (1,106,215,262) | 578,429,280 |
| Net Assets | ||
| Beginning of period | 8,081,561,593 | 7,503,132,313 |
| End of period | $6,975,346,331 | $8,081,561,593 |
| Other Information | ||
| Shares | ||
| Sold | 47,201,679 | 175,003,000 |
| Issued in reinvestment of distributions | 18,055,453 | 64,550,159 |
| Redeemed | (116,757,002) | (150,975,250) |
| Net increase (decrease) | (51,499,870) | 88,577,909 |
See accompanying notes which are an integral part of the financial statements.
Financial Highlights
Strategic Advisers Small-Mid Cap Fund
| Years ended February 28, | 2020 A | 2019 | 2018 | 2017 | 2016 A |
| Selected Per–Share Data | |||||
| Net asset value, beginning of period | $13.62 | $14.86 | $14.19 | $11.12 | $13.66 |
| Income from Investment Operations | |||||
| Net investment income (loss)B | .13 | .11 | .08 | .05 | .04 |
| Net realized and unrealized gain (loss) | (.41) | .11 | 1.88 | 3.29 | (1.78) |
| Total from investment operations | (.28) | .22 | 1.96 | 3.34 | (1.74) |
| Distributions from net investment income | (.13) | (.11) | (.07) | (.04) | (.03) |
| Distributions from net realized gain | (.34) | (1.35) | (1.22) | (.22) | (.77) |
| Total distributions | (.47) | (1.46) | (1.29) | (.27)C | (.80) |
| Net asset value, end of period | $12.87 | $13.62 | $14.86 | $14.19 | $11.12 |
| Total ReturnD | (2.40)% | 2.64% | 14.04% | 30.11% | (13.45)% |
| Ratios to Average Net AssetsE,F | |||||
| Expenses before reductions | .65% | .73% | .85% | .87% | .72% |
| Expenses net of fee waivers, if any | .40% | .48% | .60% | .62% | .46% |
| Expenses net of all reductions | .40% | .48% | .60% | .62% | .46% |
| Net investment income (loss) | .96% | .77% | .53% | .37% | .28% |
| Supplemental Data | |||||
| Net assets, end of period (000 omitted) | $6,975,346 | $8,081,562 | $7,503,132 | $7,048,707 | $6,718,287 |
| Portfolio turnover rateG | 67% | 82% | 75% | 82% | 71% |
A For the year ended February 29.
B Calculated based on average shares outstanding during the period.
C Total distributions of $.27 per share is comprised of distributions from net investment income of $.044 and distributions from net realized gain of $.224 per share.
D Total returns would have been lower if certain expenses had not been reduced during the applicable periods shown.
E Fees and expenses of any underlying Fidelity Central Funds are not included in the Fund's expense ratio. The Fund indirectly bears its proportionate share of the expenses of any underlying Fidelity Central Funds.
F Expense ratios reflect operating expenses of the Fund. Expenses before reductions do not reflect amounts reimbursed by the investment adviser or reductions from brokerage service arrangements or reductions from other expense offset arrangements and do not represent the amount paid by the Fund during periods when reimbursements or reductions occur. Expenses net of fee waivers reflect expenses after reimbursement by the investment adviser but prior to reductions from brokerage service arrangements or other expense offset arrangements. Expenses net of all reductions represent the net expenses paid by the Fund. Fees and expenses of the Underlying Funds are not included in the Fund's annualized ratios. The Fund indirectly bears its proportionate share of the expenses of the Underlying Funds.
G Amounts do not include the activity of Underlying Funds.
See accompanying notes which are an integral part of the financial statements.
Notes to Financial Statements
For the period ended February 29, 2020
1. Organization.
Strategic Advisers Small-Mid Cap Fund (the Fund) is a fund of Fidelity Rutland Square Trust II (the Trust), and is authorized to issue an unlimited number of shares. The Trust is registered under the Investment Company Act of 1940, as amended (the 1940 Act), as an open-end management investment company organized as a Delaware statutory trust. The Fund is offered exclusively to certain clients of Strategic Advisers LLC (Strategic Advisers), an affiliate of Fidelity Management & Research Company LLC (FMR).
2. Significant Accounting Policies.
The Fund is an investment company and applies the accounting and reporting guidance of the Financial Accounting Standards Board (FASB) Accounting Standards Codification Topic 946 Financial Services – Investments Companies. The financial statements have been prepared in conformity with accounting principles generally accepted in the United States of America (GAAP), which require management to make certain estimates and assumptions at the date of the financial statements. Actual results could differ from those estimates. Subsequent events, if any, through the date that the financial statements were issued have been evaluated in the preparation of the financial statements. The following summarizes the significant accounting policies of the Fund:
Investment Valuation. Investments are valued as of 4:00 p.m. Eastern time on the last calendar day of the period. The Board of Trustees (the Board) has delegated the day to day responsibility for the valuation of the Fund's investments to the Fair Value Committee (the Committee) established by the Fund's investment adviser. In accordance with valuation policies and procedures approved by the Board, the Fund attempts to obtain prices from one or more third party pricing vendors or brokers to value its investments. When current market prices, quotations or currency exchange rates are not readily available or reliable, investments will be fair valued in good faith by the Committee, in accordance with procedures adopted by the Board. Factors used in determining fair value vary by investment type and may include market or investment specific events, changes in interest rates and credit quality. The frequency with which these procedures are used cannot be predicted and they may be utilized to a significant extent. The Committee oversees the Fund's valuation policies and procedures and reports to the Board on the Committee's activities and fair value determinations. The Board monitors the appropriateness of the procedures used in valuing the Fund's investments and ratifies the fair value determinations of the Committee.
The Fund categorizes the inputs to valuation techniques used to value its investments into a disclosure hierarchy consisting of three levels as shown below:
- Level 1 – quoted prices in active markets for identical investments
- Level 2 – other significant observable inputs (including quoted prices for similar investments, interest rates, prepayment speeds, etc.)
- Level 3 – unobservable inputs (including the Fund's own assumptions based on the best information available)
Valuation techniques used to value the Fund's investments by major category are as follows:
Equity securities, including restricted securities, for which market quotations are readily available, are valued at the last reported sale price or official closing price as reported by a third party pricing vendor on the primary market or exchange on which they are traded and are categorized as Level 1 in the hierarchy. In the event there were no sales during the day or closing prices are not available, securities are valued at the last quoted bid price or may be valued using the last available price and are generally categorized as Level 2 in the hierarchy. For foreign equity securities, when market or security specific events arise, comparisons to the valuation of American Depositary Receipts (ADRs), futures contracts, Exchange-Traded Funds (ETFs) and certain indexes as well as quoted prices for similar securities may be used and would be categorized as Level 2 in the hierarchy. For equity securities, including restricted securities, where observable inputs are limited, assumptions about market activity and risk are used and these securities may be categorized as Level 3 in the hierarchy.
Debt securities, including restricted securities, are valued based on evaluated prices received from third party pricing vendors or from brokers who make markets in such securities. U.S. government and government agency obligations are valued by pricing vendors who utilize matrix pricing which considers yield or price of bonds of comparable quality, coupon, maturity and type or by broker-supplied prices. When independent prices are unavailable or unreliable, debt securities may be valued utilizing pricing methodologies which consider similar factors that would be used by third party pricing vendors. Debt securities are generally categorized as Level 2 in the hierarchy but may be Level 3 depending on the circumstances.
Futures contracts are valued at the settlement price established each day by the board of trade or exchange on which they are traded and are categorized as Level 1 in the hierarchy. Investments in open-end mutual funds, including the Fidelity Central Funds, are valued at their closing net asset value (NAV) each business day and are categorized as Level 1 in the hierarchy. If an unaffiliated open-end mutual fund's NAV is unavailable, shares of that fund may be valued by another method that the Board believes reflects fair value in accordance with the Board's fair value pricing policies and is categorized as Level 2 in the hierarchy.
Changes in valuation techniques may result in transfers in or out of an assigned level within the disclosure hierarchy. The aggregate value of investments by input level as of February 29, 2020 is included at the end of the Fund's Schedule of Investments.
Foreign Currency. The Fund may use foreign currency contracts to facilitate transactions in foreign-denominated securities. Gains and losses from these transactions may arise from changes in the value of the foreign currency or if the counterparties do not perform under the contracts' terms.
Foreign-denominated assets, including investment securities, and liabilities are translated into U.S. dollars at the exchange rates at period end. Purchases and sales of investment securities, income and dividends received and expenses denominated in foreign currencies are translated into U.S. dollars at the exchange rate in effect on the transaction date.
The effects of exchange rate fluctuations on investments are included with the net realized and unrealized gain (loss) on investment securities. Other foreign currency transactions resulting in realized and unrealized gain (loss) are disclosed separately.
Investment Transactions and Income. For financial reporting purposes, the Fund's investment holdings and NAV include trades executed through the end of the last business day of the period. The NAV per share for processing shareholder transactions is calculated as of the close of business of the New York Stock Exchange (NYSE), normally 4:00 p.m. Eastern time and includes trades executed through the end of the prior business day. Gains and losses on securities sold are determined on the basis of identified cost and include proceeds received from litigation. Dividend income is recorded on the ex-dividend date, except for certain dividends from foreign securities where the ex-dividend date may have passed, which are recorded as soon as the Fund is informed of the ex-dividend date. Non-cash dividends included in dividend income, if any, are recorded at the fair market value of the securities received. Income and capital gain distributions from Fidelity Central Funds, if any, are recorded on the ex-dividend date. Income and capital gain distributions from Underlying Funds, if any, are recorded on the ex-dividend date. Certain distributions received by the Fund represent a return of capital or capital gain. The Fund determines the components of these distributions subsequent to the ex-dividend date, based upon receipt of tax filings or other correspondence relating to the underlying investment. These distributions are recorded as a reduction of cost of investments and/or as a realized gain. Interest income is accrued as earned and includes coupon interest and amortization of premium and accretion of discount on debt securities as applicable. Investment income is recorded net of foreign taxes withheld where recovery of such taxes is uncertain.
Expenses. Expenses directly attributable to a fund are charged to that fund. Expenses attributable to more than one fund are allocated among the respective funds on the basis of relative net assets or other appropriate methods. Expense estimates are accrued in the period to which they relate and adjustments are made when actual amounts are known.
Deferred Trustee Compensation. Under a Deferred Compensation Plan (the Plan), certain independent Trustees have elected to defer receipt of a portion of their annual compensation. Deferred amounts are invested in a cross-section of Strategic Advisers funds, are marked-to-market and remain in the Fund until distributed in accordance with the Plan. The investment of deferred amounts and the offsetting payable to the Trustees of $99,719 are included in the accompanying Statement of Assets and Liabilities in other receivables and other payables and accrued expenses, respectively.
Income Tax Information and Distributions to Shareholders. Each year, the Fund intends to qualify as a regulated investment company under Subchapter M of the Internal Revenue Code, including distributing substantially all of its taxable income and realized gains. As a result, no provision for U.S. Federal income taxes is required. As of February 29, 2020, the Fund did not have any unrecognized tax benefits in the financial statements; nor is the Fund aware of any tax positions for which it is reasonably possible that the total amounts of unrecognized tax benefits will significantly change in the next twelve months. The Fund files a U.S. federal tax return, in addition to state and local tax returns as required. The Fund's federal income tax returns are subject to examination by the Internal Revenue Service (IRS) for a period of three fiscal years after they are filed. State and local tax returns may be subject to examination for an additional fiscal year depending on the jurisdiction. Foreign taxes are provided for based on the Fund's understanding of the tax rules and rates that exist in the foreign markets in which it invests.
Distributions are declared and recorded on the ex-dividend date. Income and capital gain distributions are determined in accordance with income tax regulations, which may differ from GAAP. In addition, the Fund claimed a portion of the payment made to redeeming shareholders as a distribution for income tax purposes.
Capital accounts within the financial statements are adjusted for permanent book-tax differences. These adjustments have no impact on net assets or the results of operations. Capital accounts are not adjusted for temporary book-tax differences which will reverse in a subsequent period.
Book-tax differences are primarily due to the short-term gain distributions from the Underlying Funds, futures contracts, foreign currency transactions, passive foreign investment companies (PFIC), market discount, partnerships, deferred trustees compensation and losses deferred due to wash sales and excise tax regulations.
As of period end, the cost and unrealized appreciation (depreciation) in securities, and derivatives if applicable, for federal income tax purposes were as follows:
| Gross unrealized appreciation | $1,235,870,531 |
| Gross unrealized depreciation | (754,729,018) |
| Net unrealized appreciation (depreciation) | $481,141,513 |
| Tax Cost | $6,698,520,139 |
The tax-based components of distributable earnings as of period end were as follows:
| Undistributed ordinary income | $1,778,638 |
| Undistributed long-term capital gain | $125,600,014 |
| Net unrealized appreciation (depreciation) on securities and other investments | $481,140,425 |
The tax character of distributions paid was as follows:
| February 29, 2020 | February 28, 2019 | |
| Ordinary Income | $73,476,579 | $ 154,708,847 |
| Long-term Capital Gains | 188,387,314 | 650,911,498 |
| Total | $261,863,893 | $ 805,620,345 |
Restricted Securities. The Fund may invest in securities that are subject to legal or contractual restrictions on resale. These securities generally may be resold in transactions exempt from registration or to the public if the securities are registered. Disposal of these securities may involve time-consuming negotiations and expense, and prompt sale at an acceptable price may be difficult. Information regarding restricted securities is included at the end of the Fund's Schedule of Investments.
3. Derivative Instruments.
Risk Exposures and the Use of Derivative Instruments. The Fund's investment objective allows the Fund to enter into various types of derivative contracts, including futures contracts. Derivatives are investments whose value is primarily derived from underlying assets, indices or reference rates and may be transacted on an exchange or over-the-counter (OTC). Derivatives may involve a future commitment to buy or sell a specified asset based on specified terms, to exchange future cash flows at periodic intervals based on a notional principal amount, or for one party to make one or more payments upon the occurrence of specified events in exchange for periodic payments from the other party.
The Fund used derivatives to increase returns and to manage exposure to certain risks as defined below. The success of any strategy involving derivatives depends on analysis of numerous economic factors, and if the strategies for investment do not work as intended, the Fund may not achieve its objectives.
The Fund's use of derivatives increased or decreased its exposure to the following risk:
| Equity Risk | Equity risk relates to the fluctuations in the value of financial instruments as a result of changes in market prices (other than those arising from interest rate risk or foreign exchange risk), whether caused by factors specific to an individual investment, its issuer, or all factors affecting all instruments traded in a market or market segment. |
The Fund is also exposed to additional risks from investing in derivatives, such as liquidity risk and counterparty credit risk. Liquidity risk is the risk that the Fund will be unable to close out the derivative in the open market in a timely manner. Counterparty credit risk is the risk that the counterparty will not be able to fulfill its obligation to the Fund. Counterparty credit risk related to exchange-traded futures contracts may be mitigated by the protection provided by the exchange on which they trade.
Investing in derivatives may involve greater risks than investing in the underlying assets directly and, to varying degrees, may involve risk of loss in excess of any initial investment and collateral received and amounts recognized in the Statement of Assets and Liabilities. In addition, there may be the risk that the change in value of the derivative contract does not correspond to the change in value of the underlying instrument.
Futures Contracts. A futures contract is an agreement between two parties to buy or sell a specified underlying instrument for a fixed price at a specified future date. The Fund used futures contracts to manage its exposure to the stock market.
Upon entering into a futures contract, a fund is required to deposit either cash or securities (initial margin) with a clearing broker in an amount equal to a certain percentage of the face value of the contract. Futures contracts are marked-to-market daily and subsequent daily payments (variation margin) are made or received by a fund depending on the daily fluctuations in the value of the futures contracts and are recorded as unrealized appreciation or (depreciation). This receivable and/or payable, if any, is included in daily variation margin on futures contracts in the Statement of Assets and Liabilities. Realized gain or (loss) is recorded upon the expiration or closing of a futures contract. The net realized gain (loss) and change in net unrealized appreciation (depreciation) on futures contracts during the period is presented in the Statement of Operations.
Any open futures contracts at period end are presented in the Schedule of Investments under the caption "Futures Contracts". The notional amount at value reflects each contract's exposure to the underlying instrument or index at period end and is representative of volume of activity during the period. Securities deposited to meet initial margin requirements are identified in the Schedule of Investments.
4. Purchases and Sales of Investments.
Purchases and sales of securities, other than short-term securities and U.S. government securities, are noted in the table below.
| Purchases ($) | Sales ($) | |
| Strategic Advisers Small-Mid Cap Fund | 5,151,522,410 | 5,906,953,750 |
Prior Fiscal Year Unaffiliated Exchanges In-Kind. During the prior period, the Fund redeemed 13,396,695 shares of AB Discovery Value Fund Advisor Class in exchange for investments and cash with a value of $324,601,918. The Fund had a net realized gain of $5,799,071 on the Fund's redemptions of AB Discovery Value Fund Class shares. The Fund recognized gains on the exchanges for federal income tax purposes.
5. Fees and Other Transactions with Affiliates.
Management Fee. Strategic Advisers (the investment adviser) provides the Fund with investment management related services. For these services, the Fund pays a monthly management fee to the investment adviser. The management fee is calculated by adding the annual management fee rate of .25% of the Fund's average net assets throughout the month payable to the investment adviser to the aggregate of the fee rates, payable monthly, to the Fund's sub-advisers. The Fund's maximum aggregate management fee will not exceed 1.10% of the Fund's average net assets. For the reporting period, the total annual management fee rate was .64% of the Fund's average net assets.
During the period, the investment adviser waived a portion of its management fee as described in the Expense Reductions note.
Sub-Advisers. AllianceBernstein, L.P. (AB), ArrowMark Colorado Holdings, LLC (d/b/a ArrowMark Partners), LLC, Boston Partners Global Investors, Inc., FIAM LLC (an affiliate of the investment adviser), Fisher Investments (through October 15, 2019), Geode Capital Management, LLC, J.P. Morgan Investment Management, Inc., LSV Asset Management, Portolan Capital Management, LLC, Rice Hall James & Associates, LLC, Victory Capital Management, Inc., Mellon Investments Corporation (through May 2, 2019) and Voya Investment Management Co., LLC (through November 22, 2019) each served as a sub-adviser for the Fund during the period. Sub-advisers provide discretionary investment advisory services for their allocated portion of the Fund's assets and are paid by the investment adviser and not the Fund for providing these services.
Accounting and Security Lending Fees. Fidelity Service Company, Inc. (FSC), an affiliate of the investment adviser, maintains the Fund's accounting records. The accounting fee is based on the level of average net assets for each month. Prior to April 1, 2019, FSC had a separate agreement with the Fund for administration of the security lending program, based on the number and duration of lending transactions. Effective July 1, 2019 accounting fees are not paid by the Fund and are instead paid by the investment adviser or an affiliate. For the period, the total fees paid for accounting and administration of securities lending were equivalent to .01%.
Brokerage Commissions. A portion of portfolio transactions were placed with brokerage firms which are affiliates of the investment adviser. Brokerage commissions are included in net realized gain (loss) and change in net unrealized appreciation (depreciation) in the Statement of Operations. The commissions paid to these affiliated firms were as follows:
| Amount | |
| Strategic Advisers Small-Mid Cap Fund | $21,175 |
Interfund Trades. Funds may purchase from or sell securities to other funds affiliated with each sub-adviser under procedures adopted by the Board. The procedures have been designed to ensure these interfund trades are executed in accordance with Rule 17a-7 of the 1940 Act. Interfund trades are included within the respective purchases and sales amounts shown in the Purchases and Sales of Investments note.
Other. During the period, the investment adviser reimbursed the Fund for certain losses in the amount of $116,019.
6. Investments in Fidelity Central Funds.
The Fund invest in Fidelity Central Funds, which are open-end investment companies available only to other investment companies and accounts managed by the investment adviser and its affiliates. The Fund's Schedule of Investments lists each of the Fidelity Central Funds held as of period end, if any, as an investment of the Fund, but does not include the underlying holdings of each Fidelity Central Fund. As an Investing Fund, the Fund indirectly bears its proportionate share of the expenses of the underlying Fidelity Central Funds.
The Fidelity Money Market Central Funds are managed by FMR. Annualized expenses of the Money Market Central Funds as of their most recent shareholder report date ranged from less than .005% to .01%.
A complete unaudited list of holdings for each Fidelity Central Fund is available upon request or at the Securities and Exchange Commission (the SEC) website at www.sec.gov. In addition, the financial statements of the Fidelity Central Funds, which are not covered by the Fund's Report of Independent Registered Public Accounting Firm, are available on the SEC website or upon request.
7. Committed Line of Credit.
Certain Funds participate with other funds managed by the investment adviser or an affiliate in a $4.25 billion credit facility (the "line of credit") to be utilized for temporary or emergency purposes to fund shareholder redemptions or for other short-term liquidity purposes. The participating funds have agreed to pay commitment fees on their pro-rata portion of the line of credit, which are reflected in Miscellaneous expenses on the Statement of Operations, and are as follows:
| Amount | |
| Strategic Advisers Small-Mid Cap Fund | $20,232 |
During the period, there were no borrowings on this line of credit.
8. Security Lending.
The Fund lends portfolio securities through a lending agent from time to time in order to earn additional income. On the settlement date of the loan, the Fund receives collateral (in the form of U.S. Treasury obligations, letters of credit and/or cash) against the loaned securities and maintains collateral in an amount not less than 100% of the market value of the loaned securities during the period of the loan. The market value of the loaned securities is determined at the close of business of the Fund and any additional required collateral is delivered to the Fund on the next business day. The Fund or borrower may terminate the loan at any time, and if the borrower defaults on its obligation to return the securities loaned because of insolvency or other reasons, the Fund may apply collateral received from the borrower against the obligation. The Fund may experience delays and costs in recovering the securities loaned. Any cash collateral received is invested in the Fidelity Securities Lending Cash Central Fund. The value of loaned securities and cash collateral at period end are disclosed on the Fund's Statement of Assets and Liabilities. Security lending income represents the income earned on investing cash collateral, less rebates paid to borrowers and any lending agent fees associated with the loan, plus any premium payments received for lending certain types of securities. Security lending income is presented in the Statement of Operations as a component of income from Fidelity Central Funds.
9. Expense Reductions.
The investment adviser has contractually agreed to waive the Fund's management fee in an amount equal to .25% of the Fund's average net assets until September 30, 2022. During the period, this waiver reduced the Fund's management fee by $19,839,523.
Commissions paid to certain brokers with whom the investment adviser, or its affiliates, places trades on behalf of the Fund include an amount in addition to trade execution, which may be rebated back to the Fund to offset certain expenses. This amount totaled $1,405 for the period.
In addition, through arrangements with the Fund's transfer agent, credits realized as a result of certain uninvested cash balances were used to reduce the Fund's expenses by $166.
10. Other.
The Fund's organizational documents provide former and current trustees and officers with a limited indemnification against liabilities arising in connection with the performance of their duties to the Fund. In the normal course of business, the Fund may also enter into contracts that provide general indemnifications. The Fund's maximum exposure under these arrangements is unknown as this would be dependent on future claims that may be made against the Fund. The risk of material loss from such claims is considered remote.
The Fund does not invest in the Underlying Funds for the purpose of exercising management or control; however, investments by the Fund within its principal investment strategies may represent a significant portion of an Underlying Fund's net assets.
At the end of the period, the Fund was the owner of record of 10% or more of the total outstanding shares of the following Underlying Fund:
| Fidelity SAI Real Estate Index Fund | 100% |
11. Coronavirus (Covid-19) Pandemic.
An outbreak of COVID-19 first detected in China during December 2019 has since spread globally and was declared a pandemic by the World Health Organization during March 2020. Developments that disrupt global economies and financial markets, such as the COVID-19 pandemic, may magnify factors that affect the Fund's performance.
Report of Independent Registered Public Accounting Firm
To the Board of Trustees of Fidelity Rutland Square Trust II and Shareholders of Strategic Advisers Small-Mid Cap Fund
Opinion on the Financial Statements
We have audited the accompanying statement of assets and liabilities, including the schedule of investments, of Strategic Advisers Small-Mid Cap Fund (one of the funds constituting Fidelity Rutland Square Trust II, referred to hereafter as the “Fund”) as of February 29, 2020, the related statement of operations for the year ended February 29, 2020, the statement of changes in net assets for each of the two years in the period ended February 29, 2020, including the related notes, and the financial highlights for each of the five years in the period ended February 29, 2020 (collectively referred to as the “financial statements”). In our opinion, the financial statements present fairly, in all material respects, the financial position of the Fund as of February 29, 2020, the results of its operations for the year then ended, the changes in its net assets for each of the two years in the period ended February 29, 2020 and the financial highlights for each of the five years in the period ended February 29, 2020 in conformity with accounting principles generally accepted in the United States of America.
Basis for Opinion
These financial statements are the responsibility of the Fund’s management. Our responsibility is to express an opinion on the Fund’s financial statements based on our audits. We are a public accounting firm registered with the Public Company Accounting Oversight Board (United States) (PCAOB) and are required to be independent with respect to the Fund in accordance with the U.S. federal securities laws and the applicable rules and regulations of the Securities and Exchange Commission and the PCAOB.
We conducted our audits of these financial statements in accordance with the standards of the PCAOB. Those standards require that we plan and perform the audit to obtain reasonable assurance about whether the financial statements are free of material misstatement, whether due to error or fraud.
Our audits included performing procedures to assess the risks of material misstatement of the financial statements, whether due to error or fraud, and performing procedures that respond to those risks. Such procedures included examining, on a test basis, evidence regarding the amounts and disclosures in the financial statements. Our audits also included evaluating the accounting principles used and significant estimates made by management, as well as evaluating the overall presentation of the financial statements. Our procedures included confirmation of securities owned as of February 29, 2020 by correspondence with the custodian, issuers of privately offered securities and brokers; when replies were not received from brokers, we performed other auditing procedures. We believe that our audits provide a reasonable basis for our opinion.
PricewaterhouseCoopers LLP
Boston, Massachusetts
April 13, 2020
We have served as the auditor of one or more investment companies in the Fidelity group of funds since 1932.
Trustees and Officers
The Trustees, Members of the Advisory Board (if any), and officers of the trust and fund, as applicable, are listed below. The Board of Trustees governs the fund and is responsible for protecting the interests of shareholders. The Trustees are experienced executives who meet periodically throughout the year to oversee the fund's activities, review contractual arrangements with companies that provide services to the fund, oversee management of the risks associated with such activities and contractual arrangements, and review the fund's performance. If the interests of the fund and an underlying Fidelity® fund were to diverge, a conflict of interest could arise and affect how the Trustees and Members of the Advisory Board fulfill their fiduciary duties to the affected funds. Strategic Advisers has structured the fund to avoid these potential conflicts, although there may be situations where a conflict of interest is unavoidable. In such instances, Strategic Advisers, the Trustees, and Members of the Advisory Board would take reasonable steps to minimize and, if possible, eliminate the conflict. Each of the Trustees oversees 14 funds.
The Trustees hold office without limit in time except that (a) any Trustee may resign; (b) any Trustee may be removed by written instrument, signed by at least two-thirds of the number of Trustees prior to such removal; (c) any Trustee who requests to be retired or who has become incapacitated by illness or injury may be retired by written instrument signed by a majority of the other Trustees; and (d) any Trustee may be removed at any special meeting of shareholders by a two-thirds vote of the outstanding voting securities of the trust. Officers and Advisory Board Members hold office without limit in time, except that any officer or Advisory Board Member may resign or may be removed by a vote of a majority of the Trustees at any regular meeting or any special meeting of the Trustees. Except as indicated, each individual has held the office shown or other offices in the same company for the past five years.
Each Trustee who is not an interested person (as defined in the 1940 Act) of the trust and the fund is referred to herein as an Independent Trustee.
The fund’s Statement of Additional Information (SAI) includes more information about the Trustees. To request a free copy, call Fidelity at 1-800-544-3455.
Experience, Skills, Attributes, and Qualifications of the Trustees. The Governance and Nominating Committee has adopted a statement of policy that describes the experience, qualifications, attributes, and skills that are necessary and desirable for potential Independent Trustee candidates (Statement of Policy). The Board believes that each Trustee satisfied at the time he or she was initially elected or appointed a Trustee, and continues to satisfy, the standards contemplated by the Statement of Policy. The Governance and Nominating Committee may also engage professional search firms to help identify potential Independent Trustee candidates with experience, qualifications, attributes, and skills consistent with the Statement of Policy. Additional criteria based on the composition and skills of the current Independent Trustees, as well as experience or skills that may be appropriate in light of future changes to board composition, business conditions, and regulatory or other developments, may be considered by the professional search firms and the Governance and Nominating Committee. In addition, the Board takes into account the Trustees' commitment and participation in Board and committee meetings, as well as their leadership of standing and ad hoc committees throughout their tenure.
In determining that a particular Trustee was and continues to be qualified to serve as a Trustee, the Board has considered a variety of criteria, none of which, in isolation, was controlling. The Board believes that, collectively, the Trustees have balanced and diverse experience, qualifications, attributes, and skills, which allow the Board to operate effectively in governing the fund and protecting the interests of shareholders. Information about the specific experience, skills, attributes, and qualifications of each Trustee, which in each case led to the Board's conclusion that the Trustee should serve (or continue to serve) as a trustee of the fund, is provided below.
Board Structure and Oversight Function. Robert A. Lawrence is an interested person and currently serves as Chairman. The Trustees have determined that an interested Chairman is appropriate and benefits shareholders because an interested Chairman has a personal and professional stake in the quality and continuity of services provided to the fund. Independent Trustees exercise their informed business judgment to appoint an individual of their choosing to serve as Chairman, regardless of whether the Trustee happens to be independent or a member of management. The Independent Trustees have determined that they can act independently and effectively without having an Independent Trustee serve as Chairman and that a key structural component for assuring that they are in a position to do so is for the Independent Trustees to constitute a substantial majority for the Board. The Independent Trustees also regularly meet in executive session. Mary C. Farrell serves as the lead Independent Trustee and as such (i) acts as a liaison between the Independent Trustees and management with respect to matters important to the Independent Trustees and (ii) with management prepares agendas for Board meetings.
Fidelity® funds are overseen by different Boards of Trustees. The fund's Board oversees asset allocation funds. Other Boards oversee Fidelity's investment-grade bond, money market, and asset allocation funds, and Fidelity's equity and high income funds. The fund may invest in Fidelity® funds overseen by such other Boards. The use of separate Boards, each with its own committee structure, allows the Trustees of each group of Fidelity® funds to focus on the unique issues of the funds they oversee, including common research, investment, and operational issues.
The Trustees primarily operate as a full Board, but also operate in committees, to facilitate the timely and efficient consideration of all matters of importance to the Trustees, the fund, and fund shareholders and to facilitate compliance with legal and regulatory requirements and oversight of the fund's activities and associated risks. The Board has charged Strategic Advisers and its affiliates with (i) identifying events or circumstances the occurrence of which could have demonstrably adverse effects on the fund's business and/or reputation; (ii) implementing processes and controls to lessen the possibility that such events or circumstances occur or to mitigate the effects of such events or circumstances if they do occur; and (iii) creating and maintaining a system designed to evaluate continuously business and market conditions in order to facilitate the identification and implementation processes described in (i) and (ii) above. Because the day-to-day operations and activities of the fund are carried out by or through Strategic Advisers, its affiliates and other service providers, the fund's exposure to risks is mitigated but not eliminated by the processes overseen by the Trustees. Board oversight of different aspects of the fund's activities is exercised primarily through the full Board, but also through the Audit and Compliance Committee. Appropriate personnel, including but not limited to the fund's Chief Compliance Officer (CCO), FMR's internal auditor, the independent accountants, the fund's Treasurer and portfolio management personnel, make periodic reports to the Board's committees, as appropriate. The responsibilities of each standing committee, including their oversight responsibilities, are described further under "Standing Committees of the Trustees."
Interested Trustees*:
Correspondence intended for a Trustee who is an interested person may be sent to Fidelity Investments, 245 Summer Street, Boston, Massachusetts 02210.
Name, Year of Birth; Principal Occupations and Other Relevant Experience+
Brian B. Hogan (1964)
Year of Election or Appointment: 2018
Trustee
Mr. Hogan also serves as Trustee of other funds. Mr. Hogan serves as Head of Fidelity Investments’ Investment Solutions and Innovation organization (2018-present), and a Director of Strategic Advisers LLC (2018-present). Previously, Mr. Hogan served as a Director of Fidelity SelectCo, LLC (investment adviser firm, 2014-2019), President of FMR Co., Inc. (2009-2018), a Vice President of Fidelity's Equity and High Income funds (2009-2018), a Director of FMR Investment Management (UK) Limited (investment adviser firm, 2015-2018), Trustee of certain Fidelity® funds (2014-2018), President of the Equity Division of Fidelity Management & Research Company (investment adviser firm, 2009-2018), Senior Vice President, Equity Research of Fidelity Management & Research Company (2006-2009), and as a portfolio manager. Mr. Brian B. Hogan is not related to Mr. Colm A. Hogan.
Robert A. Lawrence (1952)
Year of Election or Appointment: 2016
Trustee
Chairman of the Board of Trustees
Mr. Lawrence also serves as Trustee of other funds. Previously, Mr. Lawrence served as a Member of the Advisory Board of certain funds. Prior to his retirement in 2008, Mr. Lawrence served as Vice President of certain Fidelity® funds (2006-2008), Senior Vice President, Head of High Income Division of Fidelity Management & Research Company (investment adviser firm, 2006-2008), and President of Fidelity Strategic Investments (investment adviser firm, 2002-2005).
* Determined to be an "Interested Trustee" by virtue of, among other things, his or her affiliation with the trust or various entities under common control with Strategic Advisers.
+ The information includes the Trustee's principal occupation during the last five years and other information relating to the experience, attributes, and skills relevant to the Trustee's qualifications to serve as a Trustee, which led to the conclusion that the Trustee should serve as a Trustee for the fund.
Independent Trustees:
Correspondence intended for an Independent Trustee may be sent to Fidelity Investments, P.O. Box 55235, Boston, Massachusetts 02205-5235.
Name, Year of Birth; Principal Occupations and Other Relevant Experience+
Peter C. Aldrich (1944)
Year of Election or Appointment: 2006
Trustee
Mr. Aldrich also serves as Trustee of other funds. Mr. Aldrich is a Director of the National Bureau of Economic Research, a Director of the funds of BlackRock Realty Group (2006-present), and a Director of LivelyHood, Inc. (private corporation, 2013-present). Previously, Mr. Aldrich served as a Trustee for the Fidelity Rutland Square Trust (2005-2010), a Managing Member of Poseidon, LLC (foreign private investment, 1998-2004), and Chairman and Managing Member of AEGIS, LLC (foreign private investment, 1997-2004). Mr. Aldrich previously was a founder, Chief Executive Officer, and Chairman of AEW Capital Management, L.P. (then “Aldrich, Eastman and Waltch, L.P.”). Mr. Aldrich also served as a Director of Zipcar, Inc. (car sharing services, 2001-2009) and as Faculty Chairman of The Research Council on Global Investment of The Conference Board (business and professional education non-profit, 1999-2004). Mr. Aldrich is a Member Emeritus of the Board of Trustees of the Museum of Fine Arts Boston and an Overseer of the Massachusetts Eye and Ear Infirmary.
Ralph F. Cox (1932)
Year of Election or Appointment: 2006
Trustee
Mr. Cox also serves as Trustee of other funds. Mr. Cox is President of RABAR Enterprises (management consulting for the petroleum industry). Mr. Cox is a Director of Abraxas Petroleum (exploration and production, 1999-present). Mr. Cox is a member of the Advisory Boards of the Business and Engineering Schools of Texas A&M University and the Engineering School of University of Texas at Austin. Previously, Mr. Cox served as a Trustee for the Fidelity Rutland Square Trust (2005-2010) and as an Advisory Director of CH2M Hill Companies (engineering, 1981-2011). Mr. Ralph F. Cox and Mr. Howard E. Cox, Jr. are not related.
Mary C. Farrell (1949)
Year of Election or Appointment: 2013
Trustee
Ms. Farrell also serves as Trustee of other funds. Ms. Farrell is a Director of the W.R. Berkley Corporation (insurance provider) and President (2009-present) and Director (2006-present) of the Howard Gilman Foundation (charitable organization). Previously, Ms. Farrell was Managing Director and Chief Investment Strategist at UBS Wealth Management USA and Co-Head of UBS Wealth Management Investment Strategy & Research Group (2003-2005). Ms. Farrell also served as Investment Strategist at PaineWebber (1982-2000) and UBS PaineWebber (2000-2002). Ms. Farrell serves as Chairman of the Board of Trustees of Yale-New Haven Hospital and on the Yale New Haven Health System Board and previously served as Trustee on the Board of Overseers of the New York University Stern School of Business.
Karen Kaplan (1960)
Year of Election or Appointment: 2006
Trustee
Ms. Kaplan also serves as Trustee of other funds. Ms. Kaplan is Chairman (2014-present) and Chief Executive Officer (2013-present) of Hill Holliday (advertising and specialized marketing). Ms. Kaplan is a Director of The Michaels Companies, Inc. (specialty retailer, 2015-present), Member of the Board of Governors of the Chief Executives’ Club of Boston (2010-present), Member of the Executive Committee of the Greater Boston Chamber of Commerce (2006-present), Advisory Board Member of the National Association of Corporate Directors Chapter (2012-present), Member of the Board of Trustees of the Post Office Square Trust (2012-present), Trustee of the Brigham and Women’s Hospital (2016-present), Overseer of the Boston Symphony Orchestra (2014-present), Member of the Board of Directors of The Advertising Council, Inc. (2016-present), and Member of the Ron Burton Training Village Executive Board of Advisors (2018-present). Previously, Ms. Kaplan served as an Advisory Board Member of Fidelity Rutland Square Trust (2006-2010), a member of the Clinton Global Initiative (2010-2015), Director of DSM (dba Delta Dental and DentaQuest) (2004-2014), Formal Appointee of the 2015 Baker-Polito Economic Development Council, Director of Vera Bradley Inc. (designer of women’s accessories, 2012-2015), Member of the Board of Directors of the Massachusetts Conference for Women (2008-2015), Member of the Board of Directors of Jobs for Massachusetts (2012-2015), President of the Massachusetts Women’s Forum (2008-2010), Treasurer of the Massachusetts Women’s Forum (2002-2006), and Vice Chair of the Board of the Massachusetts Society for the Prevention of Cruelty to Children (2003-2010).
Heidi L. Steiger (1953)
Year of Election or Appointment: 2017
Trustee
Ms. Steiger also serves as Trustee of other funds. Ms. Steiger serves as a member of the Global Advisory Board and Of Counsel to Signum Global Advisors (international policy and strategy, 2018-present), a guest lecturer in the joint degree program in Global Luxury Management at North Carolina State University (Raleigh, NC) and Skema (Paris) (2018-present), Managing Partner of Topridge Associates, LLC (consulting, 2005-present), a Non-Executive Director of CrowdBureau Corporation (financial technology company and index provider, 2018-present), and a member of the Board of Directors (2013-present) and Chair of the Audit Committee and member of the Membership and Executive Committees (2017-present) of Business Executives for National Security (nonprofit). Previously, Ms. Steiger served as Eastern Region President of The Private Client Reserve of U.S. Bancorp (banking and financial services, 2010-2015), Advisory Director of Berkshire Capital Securities, LLC (financial services, 2009-2010), President and Senior Advisor of Lowenhaupt Global Advisors, LLC (financial services, 2005-2007), and President and Contributing Editor of Worth Magazine (2004-2005) and held a variety of positions at Neuberger Berman Group, LLC (financial services, 1986-2004), including Partner and Executive Vice President and Global Head of Private Asset Management at Neuberger Berman (1999-2004). Ms. Steiger also served as a member of the Board of Directors of Nuclear Electric Insurance Ltd (insurer of nuclear utilities, 2006-2017), a member of the Board of Trustees and Audit Committee of the Eaton Vance Funds (2007-2010), a member of the Board of Directors of Aviva USA (formerly AmerUs) (insurance, 2004-2014), and a member of the Board of Trustees and Audit Committee and Chair of the Investment Committee of CIFG (financial guaranty insurance, 2009-2012), and a member of the Board of Directors of Kin Group Plc (formerly, Fitbug Holdings) (health and technology, 2016-2017).
+ The information includes the Trustee's principal occupation during the last five years and other information relating to the experience, attributes, and skills relevant to the Trustee's qualifications to serve as a Trustee, which led to the conclusion that the Trustee should serve as a Trustee for the fund.
Advisory Board Members and Officers:
Correspondence intended for an officer or Howard E. Cox, Jr. may be sent to Fidelity Investments, 245 Summer Street, Boston, Massachusetts 02210. Officers appear below in alphabetical order.
Name, Year of Birth; Principal Occupation
Howard E. Cox, Jr. (1944)
Year of Election or Appointment: 2009
Member of the Advisory Board
Mr. Cox also serves as Member of the Advisory Board of other funds. Mr. Cox is a Partner of Greylock (venture capital, 1971-present) and a Director of Stryker Corporation (medical products and services, 1974-present). Previously, Mr. Cox served as an Advisory Board Member of Fidelity Rutland Square Trust (2006-2010). Mr. Cox also serves as a Member of the Secretary of Defense's Business Board of Directors (2008-present), a Director of Business Executives for National Security (1997-present), a Director of the Brookings Institution (2010-present), a Director of the World Economic Forum’s Young Global Leaders Foundation (2009-present), and is a Member of the Harvard Medical School Board of Fellows (2002-present). Mr. Howard E. Cox, Jr. and Mr. Ralph F. Cox are not related.
Christine Marcks (1955)
Year of Election or Appointment: 2019
Member of the Advisory Board
Ms. Marcks also serves as Member of the Advisory Board of other Funds. Prior to her retirement, Ms. Marcks served as Chief Executive Officer and President – Prudential Retirement (2007-2017) and Vice President for Rollover and Retirement Income Strategies (2005-2007), Prudential Financial, Inc. (financial services). Previously, Ms. Marcks was Senior Vice President and Head of Financial Horizons (2002-2004) and Vice President, Strategic Marketing (2000-2002) of Voya Financial (formerly ING U.S.) (financial services), held numerous positions at Aetna Financial Services (financial services, 1987-2000) and served as an International Economist for the United States Department of the Treasury (1980-1987). Ms. Marcks also serves as a member of the Board of Trustees, Audit Committee and Benefits & Operations Committee of the YMCA Retirement Fund (2018-present), a non-profit organization providing retirement plan benefits to YMCA staff members, and as a member of the Board of Trustees of Assumption College (2019-present).
Elizabeth Paige Baumann (1968)
Year of Election or Appointment: 2017
Anti-Money Laundering (AML) Officer
Ms. Baumann also serves as AML Officer of other funds. She is Chief AML Officer (2012-present) and Senior Vice President (2014-present) of FMR LLC (diversified financial services company) and is an employee of Fidelity Investments. Previously, Ms. Baumann served as AML Officer of certain funds (2017-2019), as AML Officer of the funds (2012-2016), and Vice President (2007-2014) and Deputy Anti-Money Laundering Officer (2007-2012) of FMR LLC.
Craig S. Brown (1977)
Year of Election or Appointment: 2019
Assistant Treasurer
Mr. Brown also serves as Assistant Treasurer of other funds. Mr. Brown is an employee of Fidelity Investments (2013-present).
John J. Burke III (1964)
Year of Election or Appointment: 2018
Chief Financial Officer
Mr. Burke also serves as Chief Financial Officer of other funds. Mr. Burke serves as Head of Investment Operations for Fidelity Fund and Investment Operations (2018-present) and is an employee of Fidelity Investments (1998-present). Previously Mr. Burke served as head of Asset Management Investment Operations (2012-2018).
Jonathan Davis (1968)
Year of Election or Appointment: 2010
Assistant Treasurer
Mr. Davis also serves as Assistant Treasurer of other funds. Mr. Davis serves as Assistant Treasurer of FMR Capital, Inc. (2017-present) and is an employee of Fidelity Investments. Previously, Mr. Davis served as Vice President and Associate General Counsel of FMR LLC (diversified financial services company, 2003-2010).
Laura M. Del Prato (1964)
Year of Election or Appointment: 2018
Assistant Treasurer
Ms. Del Prato also serves as an officer of other funds. Ms. Del Prato is an employee of Fidelity Investments (2017-present). Prior to joining Fidelity Investments, Ms. Del Prato served as a Managing Director and Treasurer of the JPMorgan Mutual Funds (2014-2017). Prior to JPMorgan, Ms. Del Prato served as a partner at Cohen Fund Audit Services (accounting firm, 2012-2013) and KPMG LLP (accounting firm, 2004-2012).
James D. Gryglewicz (1972)
Year of Election or Appointment: 2015
Chief Compliance Officer
Mr. Gryglewicz also serves as Chief Compliance Officer of other funds. Mr. Gryglewicz serves as Compliance Officer of Strategic Advisers LLC (investment adviser firm, 2015-present), Senior Vice President of Asset Management Compliance (2009-present), and is an employee of Fidelity Investments (2004-present). Previously, Mr. Gryglewicz served as Compliance Officer of Fidelity SelectCo, LLC (investment adviser firm, 2014-2019), and as Chief Compliance Officer of certain Fidelity® funds (2014-2018).
Colm A. Hogan (1973)
Year of Election or Appointment: 2016
Assistant Treasurer
Mr. Hogan also serves as an officer of other funds. Mr. Hogan serves as Assistant Treasurer of FMR Capital, Inc. (2017-present) and is an employee of Fidelity Investments (2005-present). Previously, Mr. Hogan served as Deputy Treasurer of certain Fidelity® funds (2016-2020) and Assistant Treasurer of certain Fidelity® funds (2016-2018). Mr. Colm A. Hogan is not related to Mr. Brian B. Hogan.
Christina H. Lee (1975)
Year of Election or Appointment: 2020
Secretary and Chief Legal Officer
Ms. Lee also serves as Secretary and CLO of other funds. Ms. Lee serves as Vice President, Associate General Counsel (2014-present) and is an employee of Fidelity Investments (2007-present). Previously, Ms. Lee served as Assistant Secretary of certain funds (2018-2019).
Cynthia Lo Bessette (1969)
Year of Election or Appointment: 2020
Assistant Secretary
Ms. Lo Bessette also serves as an officer of other funds. Ms. Lo Bessette serves as CLO, Secretary, and Senior Vice President of Fidelity Management & Research Company LLC (investment adviser firm, 2019-present); and CLO of Fidelity Management & Research (Hong Kong) Limited, FMR Investment Management (UK) Limited, and Fidelity Management & Research (Japan) Limited (investment adviser firms, 2019-present). She is a Senior Vice President and Deputy General Counsel of FMR LLC (diversified financial services company, 2019-present), and is an employee of Fidelity Investments. Previously, Ms. Lo Bessette served as CLO, Secretary, and Senior Vice President of FMR Co., Inc. (investment adviser firm, 2019); Secretary of Fidelity SelectCo, LLC and Fidelity Investments Money Management, Inc. (investment adviser firms, 2019). Prior to joining Fidelity Investments, Ms. Lo Bessette was Executive Vice President, General Counsel (2016-2019) and Senior Vice President, Deputy General Counsel (2015-2016) of OppenheimerFunds (investment management company) and Deputy Chief Legal Officer (2013-2015) of Jennison Associates LLC (investment adviser firm).
Chris Maher (1972)
Year of Election or Appointment: 2016
Assistant Treasurer
Mr. Maher also serves as an officer of other funds. Mr. Maher serves as Assistant Treasurer of FMR Capital, Inc. (2017-present), and is an employee of Fidelity Investments (2008-present). Previously, Mr. Maher served as Assistant Treasurer of certain funds (2013-2020); Vice President of Asset Management Compliance (2013), Vice President of the Program Management Group of FMR (investment adviser firm, 2010-2013), and Vice President of Valuation Oversight (2008-2010).
Stacie M. Smith (1974)
Year of Election or Appointment: 2020
President and Treasurer
Ms. Smith also serves as an officer of other funds. Ms. Smith serves as Assistant Treasurer of FMR Capital, Inc. (2017-present), is an employee of Fidelity Investments (2009-present), and has served in other fund officer roles. Prior to joining Fidelity Investments, Ms. Smith served as Senior Audit Manager of Ernst & Young LLP (accounting firm, 1996-2009). Previously, Ms. Smith served as Assistant Treasurer (2013-2019) and Deputy Treasurer (2013-2016) of certain Fidelity® funds.
Marc L. Spector (1972)
Year of Election or Appointment: 2016
Assistant Treasurer
Mr. Spector also serves as an officer of other funds. Mr. Spector serves as Assistant Treasurer of FMR Capital, Inc. (2017-present) and is an employee of Fidelity Investments (2016-present). Prior to joining Fidelity Investments, Mr. Spector served as Director at the Siegfried Group (accounting firm, 2013-2016), and prior to Siegfried Group as audit senior manager at Deloitte & Touche LLP (accounting firm, 2005-2013).
Jim Wegmann (1979)
Year of Election or Appointment: 2019
Assistant Treasurer
Mr. Wegmann also serves as Assistant Treasurer of other funds. Mr. Wegmann is an employee of Fidelity Investments (2011-present).
Shareholder Expense Example
As a shareholder of the Fund, you incur two types of costs: (1) transaction costs and (2) ongoing costs, including management fees and other Fund expenses. This Example is intended to help you understand your ongoing costs (in dollars) of investing in the Fund and to compare these costs with the ongoing costs of investing in other mutual funds.
The Example is based on an investment of $1,000 invested at the beginning of the period and held for the entire period (September 1, 2019 to February 29, 2020).
Actual Expenses
The first line of the accompanying table provides information about actual account values and actual expenses. You may use the information in this line, together with the amount you invested, to estimate the expenses that you paid over the period. Simply divide your account value by $1,000.00 (for example, an $8,600 account value divided by $1,000.00 = 8.6), then multiply the result by the number in the first line under the heading entitled "Expenses Paid During Period" to estimate the expenses you paid on your account during this period. In addition to the direct expenses incurred by the Fund presented in the table, as a shareholder of the underlying mutual funds (the Underlying Funds), the Fund also indirectly bears its proportionate share of the expenses of the Underlying Funds. In addition, the Fund, as a shareholder in the underlying Fidelity Central Funds, will indirectly bear its pro-rata share of the fees and expenses incurred by the underlying Fidelity Central Funds. These fees and expenses are not included in the Fund's annualized expense ratio used to calculate the expense estimate in the table below.
Hypothetical Example for Comparison Purposes
The second line of the accompanying table provides information about hypothetical account values and hypothetical expenses based on the Fund's actual expense ratio and an assumed rate of return of 5% per year before expenses, which is not the Fund's actual return. The hypothetical account values and expenses may not be used to estimate the actual ending account balance or expenses you paid for the period. You may use this information to compare the ongoing costs of investing in the Fund and other funds. To do so, compare this 5% hypothetical example with the 5% hypothetical examples that appear in the shareholder reports of the other funds. In addition to the direct expenses incurred by the Fund presented in the table, as a shareholder of the Underlying Funds, the Fund also indirectly bears its proportionate share of the expenses of the Underlying Funds. In addition, the Fund, as a shareholder in the underlying Fidelity Central Funds, will indirectly bear its pro-rata share of the fees and expenses incurred by the underlying Fidelity Central Funds. These fees and expenses are not included in the Fund's annualized expense ratio used to calculate the expense estimate in the table below.
Please note that the expenses shown in the table are meant to highlight your ongoing costs only and do not reflect any transaction costs. Therefore, the second line of the table is useful in comparing ongoing costs only, and will not help you determine the relative total costs of owning different funds.
| Annualized Expense Ratio-A | Beginning Account Value September 1, 2019 | Ending Account Value February 29, 2020 | Expenses Paid During Period-B September 1, 2019 to February 29, 2020 |
|
| Actual | .39% | $1,000.00 | $979.60 | $1.92 |
| Hypothetical-C | $1,000.00 | $1,022.92 | $1.96 |
A Annualized expense ratio reflects expenses net of applicable fee waivers.
B Expenses are equal to the Fund's annualized expense ratio, multiplied by the average account value over the period, multiplied by 182/366 (to reflect the one-half year period). The fees and expenses of the Underlying Funds in which the Fund invests are not included in the Fund's annualized expense ratio.
C 5% return per year before expenses
Distributions (Unaudited)
The Board of Trustees of Strategic Advisers Small-Mid Cap Fund voted to pay on April 9, 2020, to shareholders of record at the opening of business on April 8, 2020, a distribution of $0.199 per share derived from capital gains realized from sales of portfolio securities and a dividend of $0.003 per share from net investment income.
The fund hereby designates as a capital gain dividend with respect to the taxable year ended February 29, 2020, $326,862,804, or, if subsequently determined to be different, the net capital gain of such year.
The fund designates 80% of the dividends distributed in December, during the fiscal year as qualifying for the dividends–received deduction for corporate shareholders.
The fund designates 88% of the dividends distributed in December, during the fiscal year as amounts which may be taken into account as a dividend for the purposes of the maximum rate under section 1(h)(11) of the Internal Revenue Code.
The fund designates 13% of the dividends distributed during the fiscal year as a section 199A dividend.
The fund will notify shareholders in January 2021 of amounts for use in preparing 2020 income tax returns.
Board Approval of Investment Advisory Contracts and Management Fees
Strategic Advisers Small-Mid Cap Fund
Each year, the Board of Trustees, including the Independent Trustees (together, the Board), votes at an in-person meeting on the renewal of the management contract with Strategic Advisers LLC (Strategic Advisers) and the sub-advisory agreements with AllianceBernstein L.P. (AB), ArrowMark Colorado Holdings, LLC, doing business as ArrowMark Partners (ArrowMark), Boston Partners Global Investors, Inc. (Boston Partners), FIAM LLC, Fisher Investments, Inc. (Fisher), Geode Capital Management, LLC (Geode), J.P. Morgan Investment Management Inc., LSV Asset Management (LSV), Portolan Capital Management, LLC (Portolan), Rice Hall James & Associates, LLC (Rice Hall), Victory Capital Management, Inc. (Victory), and Voya Investment Management Co. LLC (Voya) (each a Sub-Adviser and collectively, the Sub-Advisers) (collectively, the Sub-Advisory Agreements and, together with the management contract, the Advisory Contracts) for the fund. Strategic Advisers and the Sub-Advisers are referred to herein as the Investment Advisers. The Board, assisted by the advice of fund counsel and Independent Trustees' counsel, requests and considers a broad range of information relevant to the renewal of the Advisory Contracts throughout the year.The Board meets at least four times per year and, at each of its meetings, covers an extensive agenda of topics and materials and considers factors that are relevant to its annual consideration of the renewal of the fund's Advisory Contracts, including the services and support provided to the fund and its shareholders. The full Board or the Independent Trustees, as appropriate, act on all major matters; however, a portion of the activities of the Board (including certain of those described herein) may be conducted through standing committees that have been established by the Board. The Board, acting directly and through its committees, requests and receives information concerning the annual consideration of the renewal of the fund's Advisory Contracts.At its September 2019 meeting, the Board, including the Independent Trustees, unanimously determined to renew the fund's Advisory Contracts. In addition, the Board approved amendments to the fund's sub-advisory agreements with: (i) AB, Boston Partners, Fisher, Geode, and Rice Hall to add certain exceptions to the most favored nation (MFN) provision in each such sub-advisory agreement; and (ii) ArrowMark, LSV, Portolan, Victory, and Voya to both expand the scope of, and add certain exceptions to, the MFN provision in each such sub-advisory agreement. Where applicable, the Board also approved non-material amendments to these sub-advisory agreements. The Board noted that the other terms of each amended sub-advisory agreement are not materially different from those of the applicable existing sub-advisory agreement and that AB, Boston Partners, Fisher, Geode, Rice Hall, ArrowMark, LSV, Portolan, Victory, and Voya each will continue to provide the same services to the fund. The Board also approved amendments to the sub-advisory agreement with ArrowMark to add a new mandate. The Board noted that the new mandate (once funded) is expected to decrease each of the fund's total management fee rate and total net expenses by less than 0.5 basis points. The Board also noted that the amended sub-advisory agreement would not result in changes to the nature, extent, and quality of the services that ArrowMark provides to the fund. The Board also noted that it had approved a new sub-advisory agreement with AB for the fund at its December 2018 meeting that would take effect in the event of certain changes to the indirect ownership of AB, and that such new sub-advisory agreement will be updated to reflect the amendments described above at the first annual contract approval after the agreement becomes effective.In reaching its determination to renew the fund's Advisory Contracts and approve the amendments to the sub-advisory agreements described above (Amendments), the Board considered all factors it believed relevant, including (i) the nature, extent, and quality of the services provided to the fund and its shareholders (including the investment performance of the fund); (ii) the competitiveness of the fund's management fee and total expenses relative to peer funds; (iii) the total costs of the services provided by and the profits, if any, realized by Strategic Advisers from its relationships with the fund; and (iv) the extent to which, if any, economies of scale exist and are realized as the fund grows and whether any economies of scale are appropriately shared with fund shareholders.In considering whether to renew the Advisory Contracts for the fund and approve the Amendments, the Board reached a determination, with the assistance of fund counsel and Independent Trustees' counsel and through the exercise of its business judgment, that the renewal of the Advisory Contracts and the approval of the Amendments is in the best interests of the fund and its shareholders. In addition, with respect to the Sub-Advisory Agreements, the Board also concluded that the renewal of such agreements and the approval of the Amendments do not involve a conflict of interest from which Strategic Advisers or its affiliates derive an inappropriate advantage. Also, the Board found that the advisory fees charged under the Advisory Contracts bear a reasonable relationship to the services rendered and are based on services provided that are in addition to, rather than duplicative of, services provided under the advisory contract of any underlying fund in which the fund may invest. The Board's decision to renew the Advisory Contracts and approve the Amendments was not based on any single factor, but rather was based on a comprehensive consideration of all the information provided to the Board throughout the year. Nature, Extent, and Quality of Services Provided. The Board considered the staffing within the Investment Advisers, including the backgrounds of the fund's investment personnel and also considered the fund's investment objective, strategies, and related investment philosophy. The Independent Trustees also had discussions with senior management of Strategic Advisers' investment operations and investment groups. The Board considered the structure of each Investment Adviser's investment personnel compensation program and whether such structures provide appropriate incentives to act in the best interests of the fund.The Trustees also discussed with representatives of Strategic Advisers, at meetings throughout the year, Strategic Advisers' role in, among other things, (i) setting, implementing and monitoring the investment strategies for the funds; (ii) identifying and recommending sub-advisers for the funds; (iii) overseeing compliance with federal securities laws by each sub-adviser with respect to the portion of fund assets allocated to the sub-adviser; (iv) monitoring and overseeing the performance and investment capabilities of each sub-adviser; and (v) recommending the replacement of a sub-adviser as appropriate. The Trustees considered that the Board had received from Strategic Advisers substantial information and periodic reports about Strategic Advisers' sub-adviser oversight and due diligence processes, as well as periodic reports regarding the performance of each sub-adviser.The Board also considered the nature, extent and quality of services provided by each Sub-Adviser. The Trustees noted that under the Sub-Advisory Agreements subject to oversight by Strategic Advisers, each Sub-Adviser is responsible for, among other things, identifying investments for the portion of fund assets allocated to the Sub-Adviser, if any, and executing portfolio transactions to implement its investment strategy. In addition, the Trustees noted that each Sub-Adviser is responsible for providing such reporting as may be requested from Strategic Advisers to fulfill its oversight responsibilities discussed above. Resources Dedicated to Investment Management and Support Services. The Board reviewed the general qualifications and capabilities of the Investment Advisers' investment staffs, their use of technology, and the Investment Advisers' approach to managing and compensating investment personnel. The Board noted that the Investment Advisers' analysts have extensive resources, tools, and capabilities that allow them to conduct sophisticated quantitative and/or fundamental analysis. Additionally, in its deliberations, the Board considered the Investment Advisers' trading capabilities and resources and global compliance infrastructure, which are integral parts of the investment management process. Shareholder and Administrative Services. The Board considered (i) the nature, extent, quality, and cost of administrative and shareholder services performed by Strategic Advisers and itsaffiliates under the management contract and under separate agreements covering transfer agency, pricing and bookkeeping, and securities lending services for the fund; (ii) the nature and extent of Strategic Advisers' supervision of third party service providers, including sub-advisers, custodians and subcustodians; and (iii) the resources devoted to, and the record of compliance with, the fund's compliance policies and procedures. Investment Performance. The Board considered whether the fund has operated in accordance with its investment objective, as well as its record of compliance with its investment restrictions and its performance history.In connection with the renewal of the Advisory Contracts, the Board considered annualized return information for the fund for different time periods, measured against an appropriate securities market index ("benchmark index") and a peer group of mutual funds with similar objectives ("peer group").The Board considered discussions that occur at Board meetings throughout the year with representatives of Strategic Advisers about fund investment performance and the performance of each Sub-Adviser as part of regularly scheduled fund reviews and other reports to the Board on fund performance, taking into account various factors including general market conditions. In its discussions with representatives of Strategic Advisers regarding fund performance, the Board gave particular attention to information indicating underperformance of certain funds for specific time periods and discussed with Strategic Advisers the reasons for any such underperformance.The following charts considered by the Board show, over the one-, three-, and five-year periods ended December 31, 2018, the cumulative total returns of the fund and the cumulative total returns of an appropriate benchmark index and peer group. The box within each chart shows the 25th percentile return (75% beaten, top of box) and the 75th percentile return (25% beaten, bottom of box) of the peer group. Returns shown above the box are in the first quartile and returns shown below the box are in the fourth quartile. The percentage beaten number noted below each chart corresponds to the percentile box and represents the percentage of funds in the peer group whose performance was equal to or lower than that of the fund.Strategic Advisers Small-Mid Cap Fund

Strategic Advisers Small-Mid Cap Fund

Liquidity Risk Management Program
The Securities and Exchange Commission adopted Rule 22e-4 under the Investment Company Act of 1940 (the Liquidity Rule) to promote effective liquidity risk management throughout the open-end investment company industry, thereby reducing the risk that funds will be unable to meet their redemption obligations and mitigating dilution of the interests of fund shareholders.
The Fund has adopted and implemented a liquidity risk management program (the Program) reasonably designed to assess and manage the Fund’s liquidity risk and to comply with the requirements of the Liquidity Rule. The Fund’s Board of Trustees (the Board) has designated the Fund’s investment adviser as administrator of the Program. Strategic Advisers has established a Liquidity Risk Management Committee (the LRM Committee) to manage the Program for each of the Funds. The LRM Committee monitors the adequacy and effectiveness of implementation of the Program and on a periodic basis assesses each Fund’s liquidity risk based on a variety of factors including (1) the Fund’s investment strategy, (2) portfolio liquidity and cash flow projections during normal and reasonably foreseeable stressed conditions, (3) shareholder redemptions and (4) borrowings and other funding sources, as applicable.
In accordance with the Program, each of the Fund’s portfolio investments is classified into one of four liquidity categories described below based on a determination of a reasonable expectation for how long it would take to convert the investment to cash (or sell or dispose of the investment) without significantly changing its market value.
- Highly liquid investments – cash or convertible to cash within three business days or less
- Moderately liquid investments – convertible to cash in three to seven calendar days
- Less liquid investments – can be sold or disposed of, but not settled, within seven calendar days
- Illiquid investments – cannot not be sold or disposed of within seven calendar days
Liquidity classification determinations take into account a variety of factors including various market, trading and investment-specific considerations, as well as market depth, and generally utilize analysis from a third-party liquidity metrics service.
The Liquidity Rule places a 15% limit on a fund’s illiquid investments and requires funds that do not primarily hold assets that are highly liquid investments to determine and maintain a minimum percentage of the fund’s net assets to be invested in highly liquid investments (highly liquid investment minimum or HLIM). The Program includes provisions reasonably designed to comply with the 15% limit on illiquid investments and for determining, periodically reviewing and complying with the HLIM requirement as applicable.
At a recent meeting of the Fund’s Board of Trustees, the LRM Committee provided a written report to the Board pertaining to the operation, adequacy, and effectiveness of implementation of the Program for the annual period from December 1, 2018 through November 30, 2019. The report concluded that the Program has been implemented and is operating effectively and is reasonably designed to assess and manage the Fund’s liquidity risk.
![]()
SMC-ANN-0420
1.912857.109
Strategic Advisers® Income Opportunities Fund
Offered exclusively to certain clients of Strategic Advisers LLC - not available for sale to the general public
February 29, 2020
See the inside front cover for important information about access to your fund’s shareholder reports.
Beginning on January 1, 2021, as permitted by regulations adopted by the Securities and Exchange Commission, paper copies of a fund’s shareholder reports will no longer be sent by mail, unless you specifically request paper copies of the reports from the fund or from your financial intermediary, such as a financial advisor, broker-dealer or bank. Instead, the reports will be made available on a website, and you will be notified by mail each time a report is posted and provided with a website link to access the report.
If you already elected to receive shareholder reports electronically, you will not be affected by this change and you need not take any action. You may elect to receive shareholder reports and other communications from a fund electronically, by contacting your financial intermediary. For Fidelity customers, visit Fidelity's web site or call Fidelity using the contact information listed below.
You may elect to receive all future reports in paper free of charge. If you wish to continue receiving paper copies of your shareholder reports, you may contact your financial intermediary or, if you are a Fidelity customer, visit Fidelity’s website, or call Fidelity at the applicable toll-free number listed below. Your election to receive reports in paper will apply to all funds held with the fund complex/your financial intermediary.
| Account Type | Website | Phone Number |
| Brokerage, Mutual Fund, or Annuity Contracts: | fidelity.com/mailpreferences | 1-800-343-3548 |
| Employer Provided Retirement Accounts: | netbenefits.fidelity.com/preferences (choose 'no' under Required Disclosures to continue to print) | 1-800-343-0860 |
| Advisor Sold Accounts Serviced Through Your Financial Intermediary: | Contact Your Financial Intermediary | Your Financial Intermediary's phone number |
| Advisor Sold Accounts Serviced by Fidelity: | institutional.fidelity.com | 1-877-208-0098 |
Contents
|
Board Approval of Investment Advisory Contracts and Management Fees | |
To view a fund's proxy voting record for the 12-month period ended June 30, visit http://www.fidelity.com/proxyvotingresults or visit the Securities and Exchange Commission's (SEC) web site at http://www.sec.gov.
You may also call 1-800-544-3455 to request a free copy of the proxy voting guidelines.
Standard & Poor's, S&P and S&P 500 are registered service marks of The McGraw-Hill Companies, Inc. and have been licensed for use by Fidelity Distributors Corporation.
Other third-party marks appearing herein are the property of their respective owners.
All other marks appearing herein are registered or unregistered trademarks or service marks of FMR LLC or an affiliated company. © 2020 FMR LLC. All rights reserved.
This report and the financial statements contained herein are submitted for the general information of the shareholders of the Fund. This report is not authorized for distribution to prospective investors in the Fund unless preceded or accompanied by an effective prospectus.
A fund files its complete schedule of portfolio holdings with the SEC for the first and third quarters of each fiscal year on Form N-PORT. Forms N-PORT are available on the SEC’s web site at http://www.sec.gov. A fund's Forms N-PORT may be reviewed and copied at the SEC’s Public Reference Room in Washington, DC. Information regarding the operation of the SEC's Public Reference Room may be obtained by calling 1-800-SEC-0330.
For a complete list of a fund's portfolio holdings, view the most recent holdings listing, semiannual report, or annual report on Fidelity's web site at http://www.fidelity.com, http://www.institutional.fidelity.com, or http://www.401k.com, as applicable.
NOT FDIC INSURED •MAY LOSE VALUE •NO BANK GUARANTEE
Neither the Fund nor Fidelity Distributors Corporation is a bank.
Note to Shareholders:
Early in 2020, the outbreak and spread of a new coronavirus emerged as a public health emergency that had a major influence on financial markets, primarily based on its impact on the global economy and corporate earnings. The virus causes a respiratory disease known as COVID-19. On March 11, the World Health Organization declared the COVID-19 outbreak a pandemic, citing sustained risk of further global spread.
In the weeks following the end of this reporting period, as the crisis worsened, we witnessed an escalating human tragedy with wide-scale social and economic consequences from coronavirus-containment measures. The outbreak of COVID-19 prompted a number of measures to limit the spread, including travel and border restrictions, quarantines, and restrictions on large gatherings. In turn, these resulted in lower consumer activity, diminished demand for a wide range of products and services, disruption in manufacturing and supply chains, and – given the wide variability in outcomes regarding the outbreak – significant market uncertainty and volatility. Amid the turmoil, the U.S. government took unprecedented action – in concert with the U.S. Federal Reserve and central banks around the world – to help support consumers, businesses, and the broader economy, and to limit disruption to the financial system.
The situation continues to unfold, and the extent and duration of its impact on financial markets and the economy remain highly uncertain. Extreme events such as the coronavirus crisis are “exogenous shocks” that can have significant adverse effects on mutual funds and their investments. Although multiple asset classes may be affected by market disruption, the duration and impact may not be the same for all types of assets.
Fidelity is committed to helping you stay informed amid news about COVID-19 and during increased market volatility, and we’re taking extra steps to be responsive to customer needs. We encourage you to visit our websites, where we offer ongoing updates, commentary, and analysis on the markets and our funds.
Performance: The Bottom Line
Average annual total return reflects the change in the value of an investment, assuming reinvestment of distributions from dividend income and capital gains (the profits earned upon the sale of securities that have grown in value, if any) and assuming a constant rate of performance each year. The hypothetical investment and the average annual total returns do not reflect the deduction of taxes that a shareholder would pay on fund distributions or the redemption of fund shares. During periods of reimbursement by Fidelity, a fund’s total return will be greater than it would be had the reimbursement not occurred. How a fund did yesterday is no guarantee of how it will do tomorrow.
Average Annual Total Returns
| For the periods ended February 29, 2020 | Past 1 year | Past 5 years | Past 10 years |
| Strategic Advisers® Income Opportunities Fund | 5.57% | 4.49% | 6.52% |
$10,000 Over 10 Years
Let's say hypothetically that $10,000 was invested in Strategic Advisers® Income Opportunities Fund on February 28, 2010.
The chart shows how the value of your investment would have changed, and also shows how the ICE® BofAML® US High Yield Constrained Index performed over the same period.

| Period Ending Values | ||
|
| $18,812 | Strategic Advisers® Income Opportunities Fund |
|
| $19,928 | ICE® BofAML® US High Yield Constrained Index |
Management's Discussion of Fund Performance
Market Recap: The ICE BofA® US High Yield Constrained Index gained 5.91% for the year ending February 29, 2019, a choppy period in which high-yield bonds were influenced by persistent, nagging concerns about global economic growth and trade, as well as the early-2020 outbreak and spread of the new coronavirus. High yield began the period on an uptrend, driven by upbeat company earnings and signs the U.S. Federal Reserve may pause on rates. But May brought a sharp reversal, as volatility spiked and the index lost ground as trade negotiations between the U.S. and China broke down. Declining oil prices also were a headwind at this time. The bull market roared back in June and July, when the Fed cut interest rates for the first time since 2008. Volatility intensified in August, but high yield proved resilient and trended up through October 30, when the Fed lowered rates for the third time in 2019, and moved even higher through year-end. Following a flat January, high yield sank in late February, after a surge in coronavirus cases outside China created considerable uncertainty and pushed investors into safer asset classes. For the full 12 months, higher-quality bonds prevailed, with the core BB and B tiers rising 8.05% and 5.74%, respectively, well ahead of the lower-quality CCC-C category (-0.12%). By industry, returns were resoundingly positive, led by banks & thrifts (+16%) and insurance (+15%). In contrast, index major energy (-11%) was the lone negative for the period, hampered by depressed oil prices Comments from Portfolio Manager Charles Sterling: For the fiscal year, the Fund gained 5.57%, trailing its benchmark, the ICE BofAML℠ US High Yield Constrained Index. Hotchkis & Wiley High Yield Fund (+2.1%) was the primary relative detractor the past 12 months, primarily due to adverse security selection in the energy sector. Fidelity Advisor® High Income Advantage Fund (+4.5%) and Fidelity® Capital & Income Fund (+4.9%) also dampened relative performance, as both were hampered by sizable allocations to stocks. On the plus side, PGIM High Yield Fund was among the broader portfolio's top relative contributors. This manager’s overweighted exposure to bonds rated BB gave the fund greater interest rate sensitivity than the benchmark, which proved beneficial this period. Vanguard High Yield Corporate Bond Fund (+4.6%) – a new addition during the fiscal year – was another key contributor versus the benchmark, as its defensively oriented strategy worked well in an environment of declining interest rates. Recognizing that both the U.S. economy and the high-yield credit cycle are in their later phases, we reduced risk in the portfolio. Specifically, we sold the Fund's position in Fidelity Advisor® High Income Advantage Fund and substantially reduced our exposure to Hotchkis & Wiley High Yield Fund and Fidelity® Capital & Income Fund.The views expressed above reflect those of the portfolio manager(s) only through the end of the period as stated on the cover of this report and do not necessarily represent the views of Fidelity or any other person in the Fidelity organization. Any such views are subject to change at any time based upon market or other conditions and Fidelity disclaims any responsibility to update such views. These views may not be relied on as investment advice and, because investment decisions for a Fidelity fund are based on numerous factors, may not be relied on as an indication of trading intent on behalf of any Fidelity fund.
Note to shareholders: On April 1, 2019, Jonathan Duggan assumed co-management responsibilities for the fund, joining Lead Manager Chip Sterling.Investment Summary (Unaudited)
The information in the following tables is based on the direct investments of the Fund.Top Ten Holdings as of February 29, 2020
| (excluding cash equivalents) | % of fund's net assets |
| Artisan High Income Fund Investor Shares | 12.0 |
| Vanguard High-Yield Corporate Fund Admiral Shares | 11.8 |
| MainStay HIgh Yield Corporate Bond Fund Class A | 10.2 |
| T. Rowe Price High Yield Advisor Class | 8.7 |
| Fidelity Capital & Income Fund | 7.2 |
| Eaton Vance Income Fund of Boston Class A | 4.9 |
| Blackrock High Yield Bond Portfolio Insitutional Class | 4.0 |
| Hotchkis & Wiley High Yield Fund Class A | 1.2 |
| C&W Senior Financing Designated Activity Co. 6.875% 9/15/27 | 0.3 |
| JBS U.S.A. LLC/JBS U.S.A. Finance, Inc. 5.875% 7/15/24 | 0.3 |
Asset Allocation (% of fund's net assets)
| As of February 29, 2020 | ||
| Corporate Bonds | 34.4% | |
| Asset-Backed Securities | 1.3% | |
| High Yield Fixed-Income Funds | 60.0% | |
| Other Investments | 2.1% | |
| Short-Term Investments and Net Other Assets (Liabilities) | 2.2% | |

Asset allocations of funds in the pie chart reflect the categorizations of assets as defined by Morningstar as of the reporting date.
Schedule of Investments February 29, 2020
Showing Percentage of Net Assets
| Corporate Bonds - 34.5% | |||
| Principal Amount | Value | ||
| Convertible Bonds - 0.1% | |||
| COMMUNICATION SERVICES - 0.1% | |||
| Media - 0.1% | |||
| DISH Network Corp.: | |||
| 2.375% 3/15/24 | $1,500,000 | $1,394,505 | |
| 3.375% 8/15/26 | 1,350,000 | 1,303,435 | |
| 2,697,940 | |||
| Nonconvertible Bonds - 34.4% | |||
| COMMUNICATION SERVICES - 7.5% | |||
| Diversified Telecommunication Services - 2.1% | |||
| C&W Senior Financing Designated Activity Co.: | |||
| 6.875% 9/15/27 (a) | 6,185,000 | 6,525,175 | |
| 7.5% 10/15/26 (a) | 2,835,000 | 2,976,750 | |
| Century Telephone Enterprises, Inc. 6.875% 1/15/28 | 80,000 | 88,800 | |
| CenturyLink, Inc.: | |||
| 5.125% 12/15/26 (a) | 2,450,000 | 2,468,375 | |
| 5.625% 4/1/25 | 860,000 | 896,550 | |
| 5.8% 3/15/22 | 1,875,000 | 1,966,406 | |
| 6.45% 6/15/21 | 900,000 | 933,480 | |
| 7.6% 9/15/39 | 1,325,000 | 1,429,609 | |
| 7.65% 3/15/42 | 752,000 | 812,160 | |
| Embarq Corp. 7.995% 6/1/36 | 528,000 | 562,320 | |
| Front Range BidCo, Inc.: | |||
| 4% 3/1/27 (a)(b) | 805,000 | 781,856 | |
| 6.125% 3/1/28 (a)(b) | 775,000 | 764,344 | |
| Frontier Communications Corp. 8% 4/1/27 (a) | 1,260,000 | 1,307,250 | |
| Intelsat Connect Finance SA 9.5% 2/15/23 (a) | 790,000 | 466,100 | |
| Level 3 Financing, Inc.: | |||
| 5.125% 5/1/23 | 1,600,000 | 1,604,000 | |
| 5.25% 3/15/26 | 590,000 | 609,175 | |
| 5.375% 1/15/24 | 675,000 | 673,326 | |
| 5.375% 5/1/25 | 715,000 | 729,893 | |
| Sable International Finance Ltd. 5.75% 9/7/27 (a) | 255,000 | 265,838 | |
| SFR Group SA: | |||
| 7.375% 5/1/26 (a) | 2,420,000 | 2,537,854 | |
| 8.125% 2/1/27 (a) | 3,410,000 | 3,716,150 | |
| Sprint Capital Corp.: | |||
| 6.875% 11/15/28 | 1,610,000 | 1,917,413 | |
| 8.75% 3/15/32 | 1,500,000 | 2,083,200 | |
| Telecom Italia Capital SA: | |||
| 6% 9/30/34 | 560,000 | 630,000 | |
| 6.375% 11/15/33 | 315,000 | 365,142 | |
| Telecom Italia SpA 5.303% 5/30/24 (a) | 2,895,000 | 3,090,413 | |
| Telenet Finance Luxembourg Notes SARL 5.5% 3/1/28 (a) | 2,600,000 | 2,743,000 | |
| 42,944,579 | |||
| Entertainment - 0.3% | |||
| AMC Entertainment Holdings, Inc.: | |||
| 5.875% 11/15/26 | 50,000 | 40,000 | |
| 6.125% 5/15/27 | 2,325,000 | 1,860,000 | |
| AMC Entertainment, Inc. 5.75% 6/15/25 | 125,000 | 100,416 | |
| National CineMedia LLC: | |||
| 5.75% 8/15/26 | 625,000 | 618,750 | |
| 5.875% 4/15/28 (a) | 500,000 | 510,898 | |
| Netflix, Inc.: | |||
| 4.875% 4/15/28 | 715,000 | 752,688 | |
| 4.875% 6/15/30 (a) | 360,000 | 379,368 | |
| 5.375% 11/15/29 (a) | 600,000 | 652,320 | |
| 5.875% 11/15/28 | 925,000 | 1,039,978 | |
| 6.375% 5/15/29 | 285,000 | 326,354 | |
| 6,280,772 | |||
| Interactive Media & Services - 0.0% | |||
| Match Group, Inc. 4.125% 8/1/30 (a) | 350,000 | 342,895 | |
| Media - 3.7% | |||
| Altice Financing SA: | |||
| 5% 1/15/28 (a) | 470,000 | 455,853 | |
| 7.5% 5/15/26 (a) | 5,535,000 | 5,839,425 | |
| Altice Finco SA 7.625% 2/15/25 (a) | 1,595,000 | 1,660,794 | |
| CCO Holdings LLC/CCO Holdings Capital Corp.: | |||
| 4% 3/1/23 (a) | 3,215,000 | 3,247,150 | |
| 4.5% 8/15/30 (a) | 895,000 | 905,069 | |
| 4.75% 3/1/30 (a) | 2,024,000 | 2,084,720 | |
| 5% 2/1/28 (a) | 2,398,000 | 2,493,920 | |
| 5.125% 5/1/23 (a) | 2,195,000 | 2,220,682 | |
| 5.125% 5/1/27 (a) | 2,805,000 | 2,916,359 | |
| 5.5% 5/1/26 (a) | 5,360,000 | 5,561,536 | |
| Clear Channel Outdoor Holdings, Inc. 5.125% 8/15/27 (a) | 700,000 | 701,750 | |
| Clear Channel Worldwide Holdings, Inc. 9.25% 2/15/24 (a) | 4,525,000 | 4,807,813 | |
| CSC Holdings LLC: | |||
| 5.375% 7/15/23 (a) | 3,000,000 | 3,073,200 | |
| 5.5% 5/15/26 (a) | 1,380,000 | 1,428,790 | |
| 5.5% 4/15/27 (a) | 2,650,000 | 2,789,125 | |
| 7.5% 4/1/28 (a) | 1,885,000 | 2,125,338 | |
| 7.75% 7/15/25 (a) | 1,555,000 | 1,636,638 | |
| Cumulus Media New Holdings, Inc. 6.75% 7/1/26 (a) | 1,250,000 | 1,298,063 | |
| Diamond Sports Group LLC/Diamond Sports Finance Co.: | |||
| 5.375% 8/15/26 (a) | 750,000 | 691,515 | |
| 6.625% 8/15/27 (a) | 2,685,000 | 2,174,850 | |
| DISH DBS Corp.: | |||
| 5.875% 7/15/22 | 1,975,000 | 2,060,814 | |
| 5.875% 11/15/24 | 2,840,000 | 2,913,073 | |
| 7.75% 7/1/26 | 1,060,000 | 1,139,034 | |
| Entercom Media Corp. 6.5% 5/1/27 (a) | 700,000 | 731,500 | |
| Gray Escrow, Inc. 7% 5/15/27 (a) | 675,000 | 732,206 | |
| iHeartCommunications, Inc. 8.375% 5/1/27 | 700,000 | 760,165 | |
| Quebecor Media, Inc. 5.75% 1/15/23 | 550,000 | 583,275 | |
| Radiate Holdco LLC/Radiate Financial Service Ltd.: | |||
| 6.625% 2/15/25 (a) | 2,440,000 | 2,446,100 | |
| 6.875% 2/15/23 (a) | 1,115,000 | 1,120,575 | |
| Scripps Escrow, Inc. 5.875% 7/15/27 (a) | 200,000 | 207,500 | |
| Sinclair Television Group, Inc. 5.875% 3/15/26 (a) | 425,000 | 437,750 | |
| Sirius XM Radio, Inc.: | |||
| 4.625% 7/15/24 (a) | 750,000 | 773,213 | |
| 5% 8/1/27 (a) | 1,060,000 | 1,109,025 | |
| 5.375% 4/15/25 (a) | 2,165,000 | 2,220,922 | |
| Univision Communications, Inc. 5.125% 2/15/25 (a) | 1,175,000 | 1,108,636 | |
| Virgin Media Secured Finance PLC 5.5% 8/15/26 (a) | 2,970,000 | 3,056,330 | |
| Ziggo Bond Co. BV: | |||
| 5.125% 2/28/30 (a) | 1,110,000 | 1,123,653 | |
| 6% 1/15/27 (a) | 2,000,000 | 2,107,500 | |
| Ziggo BV 5.5% 1/15/27 (a) | 2,612,000 | 2,690,464 | |
| 75,434,325 | |||
| Wireless Telecommunication Services - 1.4% | |||
| Citizens Utilities Co. 7.05% 10/1/46 | 2,508,000 | 1,153,680 | |
| Intelsat Jackson Holdings SA: | |||
| 5.5% 8/1/23 | 4,335,000 | 3,728,100 | |
| 8.5% 10/15/24 (a) | 1,860,000 | 1,605,794 | |
| 9.75% 7/15/25 (a) | 1,700,000 | 1,499,188 | |
| Millicom International Cellular SA: | |||
| 6% 3/15/25 (a) | 705,000 | 722,405 | |
| 6.625% 10/15/26 (a) | 2,740,000 | 2,931,800 | |
| Neptune Finco Corp. 6.625% 10/15/25 (a) | 750,000 | 783,765 | |
| Sprint Communications, Inc. 6% 11/15/22 | 4,800,000 | 5,148,480 | |
| Sprint Corp.: | |||
| 7.125% 6/15/24 | 2,220,000 | 2,521,543 | |
| 7.625% 2/15/25 | 500,000 | 580,000 | |
| 7.875% 9/15/23 | 4,805,000 | 5,493,701 | |
| T-Mobile U.S.A., Inc. 4.5% 2/1/26 | 1,060,000 | 1,074,257 | |
| Ypso Finance BIS SA 6% 2/15/28 (a) | 1,550,000 | 1,488,465 | |
| 28,731,178 | |||
| TOTAL COMMUNICATION SERVICES | 153,733,749 | ||
| CONSUMER DISCRETIONARY - 4.4% | |||
| Auto Components - 0.3% | |||
| Adient Global Holdings Ltd. 4.875% 8/15/26 (a) | 1,325,000 | 1,142,813 | |
| Allison Transmission, Inc. 5.875% 6/1/29 (a) | 266,000 | 288,278 | |
| American Axle & Manufacturing, Inc.: | |||
| 6.25% 4/1/25 | 850,000 | 822,970 | |
| 6.5% 4/1/27 | 1,700,000 | 1,631,150 | |
| Cooper Standard Auto, Inc. 5.625% 11/15/26 (a) | 800,000 | 714,800 | |
| Dana Financing Luxembourg SARL 5.75% 4/15/25 (a) | 200,000 | 206,000 | |
| Dana, Inc. 5.375% 11/15/27 | 1,445,000 | 1,459,450 | |
| 6,265,461 | |||
| Automobiles - 0.2% | |||
| Ford Motor Co. 5.291% 12/8/46 | 2,900,000 | 2,658,927 | |
| General Motors Co. 5% 10/1/28 | 475,000 | 519,504 | |
| 3,178,431 | |||
| Diversified Consumer Services - 0.5% | |||
| Frontdoor, Inc. 6.75% 8/15/26 (a) | 860,000 | 941,102 | |
| GEMS MENASA Cayman Ltd. 7.125% 7/31/26 (a) | 2,370,000 | 2,436,656 | |
| Laureate Education, Inc. 8.25% 5/1/25 (a) | 4,940,000 | 5,237,042 | |
| Service Corp. International 5.125% 6/1/29 | 735,000 | 794,719 | |
| 9,409,519 | |||
| Hotels, Restaurants & Leisure - 2.2% | |||
| 1011778 BC Unlimited Liability Co./New Red Finance, Inc.: | |||
| 4.25% 5/15/24 (a) | 780,000 | 780,741 | |
| 5% 10/15/25 (a) | 1,410,000 | 1,416,458 | |
| Aramark Services, Inc. 4.75% 6/1/26 | 2,480,000 | 2,566,800 | |
| Brinker International, Inc. 5% 10/1/24 (a) | 1,515,000 | 1,580,145 | |
| Caesars Resort Collection LLC 5.25% 10/15/25 (a) | 4,900,000 | 4,811,898 | |
| CEC Entertainment, Inc. 8% 2/15/22 | 850,000 | 824,500 | |
| Eldorado Resorts, Inc.: | |||
| 6% 4/1/25 | 765,000 | 799,425 | |
| 6% 9/15/26 | 250,000 | 271,250 | |
| Golden Entertainment, Inc. 7.625% 4/15/26 (a) | 3,621,000 | 3,865,418 | |
| Golden Nugget, Inc.: | |||
| 6.75% 10/15/24 (a) | 2,695,000 | 2,647,029 | |
| 8.75% 10/1/25 (a) | 2,350,000 | 2,359,894 | |
| Hilton Domestic Operating Co., Inc. 4.25% 9/1/24 | 670,000 | 672,231 | |
| Hilton Worldwide Finance LLC/Hilton Worldwide Finance Corp.: | |||
| 4.625% 4/1/25 | 655,000 | 657,456 | |
| 4.875% 4/1/27 | 390,000 | 398,775 | |
| International Game Technology PLC 6.25% 1/15/27 (a) | 1,450,000 | 1,532,679 | |
| Jacobs Entertainment, Inc. 7.875% 2/1/24 (a) | 800,000 | 840,000 | |
| MCE Finance Ltd. 4.875% 6/6/25 (a) | 215,000 | 216,072 | |
| MGM Mirage, Inc. 5.5% 4/15/27 | 750,000 | 809,775 | |
| Penn National Gaming, Inc. 5.625% 1/15/27 (a) | 2,000,000 | 2,070,000 | |
| Scientific Games Corp.: | |||
| 5% 10/15/25 (a) | 2,720,000 | 2,728,500 | |
| 7% 5/15/28 (a) | 845,000 | 823,347 | |
| 7.25% 11/15/29 (a) | 900,000 | 876,420 | |
| 8.25% 3/15/26 (a) | 500,000 | 516,250 | |
| Stars Group Holdings BV 7% 7/15/26 (a) | 3,255,000 | 3,499,125 | |
| Station Casinos LLC: | |||
| 4.5% 2/15/28 (a) | 325,000 | 309,563 | |
| 5% 10/1/25 (a) | 1,145,000 | 1,150,725 | |
| Twin River Worldwide Holdings, Inc. 6.75% 6/1/27 (a) | 1,930,000 | 2,010,684 | |
| Wyndham Destinations, Inc. 4.625% 3/1/30 (a) | 250,000 | 250,050 | |
| Wyndham Hotels & Resorts, Inc. 5.375% 4/15/26 (a) | 1,340,000 | 1,389,051 | |
| Wynn Macau Ltd.: | |||
| 4.875% 10/1/24 (a) | 1,950,000 | 1,946,178 | |
| 5.125% 12/15/29 (a) | 575,000 | 563,500 | |
| Wynn Resorts Ltd. 5.125% 10/1/29 (a) | 500,000 | 483,125 | |
| 45,667,064 | |||
| Household Durables - 0.8% | |||
| Ashton Woods U.S.A. LLC/Ashton Woods Finance Co. 6.75% 8/1/25 (a) | 1,500,000 | 1,548,750 | |
| Beazer Homes U.S.A., Inc.: | |||
| 5.875% 10/15/27 | 450,000 | 455,625 | |
| 7.25% 10/15/29 (a) | 1,500,000 | 1,590,000 | |
| Brookfield Residential Properties, Inc./Brookfield Residential U.S. Corp.: | |||
| 4.875% 2/15/30 (a) | 375,000 | 371,213 | |
| 6.25% 9/15/27 (a) | 1,395,000 | 1,433,363 | |
| KB Home 6.875% 6/15/27 | 1,550,000 | 1,829,000 | |
| Lennar Corp. 4.75% 5/30/25 | 800,000 | 864,504 | |
| M/I Homes, Inc. 4.95% 2/1/28 (a) | 1,075,000 | 1,093,813 | |
| Meritage Homes Corp. 6% 6/1/25 | 1,000,000 | 1,124,170 | |
| PulteGroup, Inc. 5% 1/15/27 | 650,000 | 713,622 | |
| Reynolds Group Issuer, Inc./Reynolds Group Issuer LLC/Reynolds Group Issuer (Luxembourg) SA: | |||
| 5.125% 7/15/23 (a) | 1,000,000 | 1,010,000 | |
| 7% 7/15/24 (a) | 2,825,000 | 2,851,499 | |
| TopBuild Corp. 5.625% 5/1/26 (a) | 975,000 | 1,014,000 | |
| 15,899,559 | |||
| Internet & Direct Marketing Retail - 0.1% | |||
| Terrier Media Buyer, Inc. 8.875% 12/15/27 (a) | 1,125,000 | 1,116,563 | |
| Leisure Products - 0.0% | |||
| Mattel, Inc. 6.75% 12/31/25 (a) | 730,000 | 767,194 | |
| Specialty Retail - 0.3% | |||
| L Brands, Inc. 5.625% 10/15/23 | 1,975,000 | 2,128,063 | |
| Michaels Stores, Inc. 8% 7/15/27 (a) | 1,492,000 | 1,243,731 | |
| PetSmart, Inc. 5.875% 6/1/25 (a) | 920,000 | 925,796 | |
| Sally Holdings LLC 5.625% 12/1/25 | 2,000,000 | 2,027,000 | |
| 6,324,590 | |||
| Textiles, Apparel & Luxury Goods - 0.0% | |||
| The William Carter Co. 5.625% 3/15/27 (a) | 880,000 | 936,254 | |
| TOTAL CONSUMER DISCRETIONARY | 89,564,635 | ||
| CONSUMER STAPLES - 1.7% | |||
| Food & Staples Retailing - 0.2% | |||
| Albertsons Companies LLC/Safeway, Inc./New Albertson's, Inc./Albertson's LLC 4.875% 2/15/30 (a) | 675,000 | 675,000 | |
| C&S Group Enterprises LLC 5.375% 7/15/22 (a) | 1,950,000 | 1,979,445 | |
| 2,654,445 | |||
| Food Products - 1.4% | |||
| B&G Foods, Inc.: | |||
| 5.25% 4/1/25 | 1,000,000 | 987,490 | |
| 5.25% 9/15/27 | 600,000 | 594,000 | |
| Chobani LLC/Finance Corp., Inc. 7.5% 4/15/25 (a) | 230,000 | 228,850 | |
| JBS U.S.A. LLC/JBS U.S.A. Finance, Inc.: | |||
| 5.75% 6/15/25 (a) | 4,505,000 | 4,611,994 | |
| 5.875% 7/15/24 (a) | 5,915,000 | 6,018,631 | |
| 6.75% 2/15/28 (a) | 525,000 | 569,258 | |
| JBS U.S.A. Lux SA / JBS Food Co.: | |||
| 5.5% 1/15/30 (a) | 2,400,000 | 2,532,744 | |
| 6.5% 4/15/29 (a) | 4,850,000 | 5,260,795 | |
| Lamb Weston Holdings, Inc.: | |||
| 4.625% 11/1/24 (a) | 330,000 | 343,474 | |
| 4.875% 11/1/26 (a) | 2,000,000 | 2,075,100 | |
| Pilgrim's Pride Corp. 5.875% 9/30/27 (a) | 1,275,000 | 1,321,283 | |
| Post Holdings, Inc.: | |||
| 4.625% 4/15/30 (a) | 180,000 | 177,406 | |
| 5% 8/15/26 (a) | 1,045,000 | 1,065,900 | |
| 5.5% 12/15/29 (a) | 1,250,000 | 1,296,875 | |
| 5.625% 1/15/28 (a) | 540,000 | 564,413 | |
| 5.75% 3/1/27 (a) | 720,000 | 749,264 | |
| 28,397,477 | |||
| Household Products - 0.0% | |||
| Spectrum Brands Holdings, Inc. 5% 10/1/29 (a) | 500,000 | 516,315 | |
| Personal Products - 0.0% | |||
| Prestige Brands, Inc. 6.375% 3/1/24 (a) | 500,000 | 515,415 | |
| Tobacco - 0.1% | |||
| Vector Group Ltd. 6.125% 2/1/25 (a) | 1,500,000 | 1,440,000 | |
| TOTAL CONSUMER STAPLES | 33,523,652 | ||
| ENERGY - 4.0% | |||
| Energy Equipment & Services - 0.6% | |||
| Diamond Offshore Drilling, Inc. 7.875% 8/15/25 | 675,000 | 473,344 | |
| Jonah Energy LLC 7.25% 10/15/25 (a) | 1,840,000 | 441,600 | |
| Nabors Industries Ltd.: | |||
| 7.25% 1/15/26 (a) | 175,000 | 159,688 | |
| 7.5% 1/15/28 (a) | 1,600,000 | 1,476,160 | |
| Noble Holding International Ltd.: | |||
| 6.2% 8/1/40 | 1,000,000 | 280,000 | |
| 7.875% 2/1/26 (a) | 515,000 | 317,369 | |
| Precision Drilling Corp.: | |||
| 5.25% 11/15/24 | 500,000 | 442,190 | |
| 7.125% 1/15/26 (a) | 1,000,000 | 923,000 | |
| Summit Midstream Holdings LLC 5.75% 4/15/25 | 1,550,000 | 1,147,000 | |
| Transocean, Inc.: | |||
| 7.5% 1/15/26 (a) | 1,676,000 | 1,332,420 | |
| 8% 2/1/27 (a) | 700,000 | 581,000 | |
| U.S.A. Compression Partners LP: | |||
| 6.875% 4/1/26 | 1,500,000 | 1,451,400 | |
| 6.875% 9/1/27 | 435,000 | 421,428 | |
| Valaris PLC: | |||
| 5.2% 3/15/25 | 2,500,000 | 962,500 | |
| 7.75% 2/1/26 | 1,500,000 | 592,425 | |
| Weatherford International Ltd. 11% 12/1/24 (a) | 893,000 | 854,065 | |
| 11,855,589 | |||
| Oil, Gas & Consumable Fuels - 3.4% | |||
| Antero Midstream Partners LP/Antero Midstream Finance Corp. 5.75% 1/15/28 (a) | 1,160,000 | 796,282 | |
| Antero Resources Corp.: | |||
| 5.125% 12/1/22 | 525,000 | 326,813 | |
| 5.625% 6/1/23 (Reg. S) | 1,258,000 | 679,320 | |
| Antero Resources Finance Corp. 5.375% 11/1/21 | 1,466,000 | 1,222,278 | |
| Ascent Resources - Utica LLC/ARU Finance Corp.: | |||
| 7% 11/1/26 (a) | 930,000 | 558,000 | |
| 10% 4/1/22 (a) | 1,334,000 | 1,136,861 | |
| California Resources Corp. 8% 12/15/22 (a) | 3,615,000 | 831,450 | |
| Cheniere Energy Partners LP: | |||
| 5.25% 10/1/25 | 2,735,000 | 2,741,892 | |
| 5.625% 10/1/26 | 615,000 | 618,075 | |
| Chesapeake Energy Corp.: | |||
| 4.875% 4/15/22 | 500,000 | 255,000 | |
| 7% 10/1/24 | 835,000 | 292,250 | |
| 8% 1/15/25 | 2,760,000 | 828,000 | |
| 8% 6/15/27 | 2,265,000 | 679,500 | |
| 11.5% 1/1/25 (a) | 1,675,000 | 1,000,813 | |
| Citgo Holding, Inc. 9.25% 8/1/24 (a) | 3,010,000 | 3,130,400 | |
| Citgo Petroleum Corp. 6.25% 8/15/22 (a) | 1,797,000 | 1,797,000 | |
| CNX Midstream Partners LP 6.5% 3/15/26 (a) | 700,000 | 574,000 | |
| CNX Resources Corp. 5.875% 4/15/22 | 1,825,000 | 1,669,875 | |
| Comstock Escrow Corp. 9.75% 8/15/26 | 2,595,000 | 2,173,313 | |
| Crestwood Midstream Partners LP/Crestwood Midstream Finance Corp.: | |||
| 5.625% 5/1/27 (a) | 1,255,000 | 1,160,812 | |
| 5.75% 4/1/25 | 900,000 | 879,750 | |
| 6.25% 4/1/23 | 2,580,000 | 2,451,516 | |
| CVR Energy, Inc. 5.25% 2/15/25 (a) | 1,360,000 | 1,268,200 | |
| DCP Midstream Operating LP: | |||
| 5.125% 5/15/29 | 1,700,000 | 1,670,250 | |
| 5.375% 7/15/25 | 1,785,000 | 1,869,823 | |
| Denbury Resources, Inc.: | |||
| 7.75% 2/15/24 (a) | 1,690,000 | 947,245 | |
| 9.25% 3/31/22 (a) | 4,230,000 | 3,384,000 | |
| EG Global Finance PLC: | |||
| 6.75% 2/7/25 (a) | 1,100,000 | 1,075,250 | |
| 8.5% 10/30/25 (a) | 2,733,000 | 2,814,170 | |
| Endeavor Energy Resources LP/EER Finance, Inc. 5.75% 1/30/28 (a) | 700,000 | 684,040 | |
| EP Energy LLC/Everest Acquisition Finance, Inc. 7.75% 5/15/26 (a)(c) | 850,000 | 501,500 | |
| EQT Corp.: | |||
| 3.9% 10/1/27 | 713,000 | 465,233 | |
| 6.125% 2/1/25 | 660,000 | 501,864 | |
| Extraction Oil & Gas, Inc. 5.625% 2/1/26 (a) | 1,875,000 | 656,250 | |
| Global Partners LP/GLP Finance Corp.: | |||
| 7% 6/15/23 | 800,000 | 821,000 | |
| 7% 8/1/27 | 1,200,000 | 1,241,166 | |
| Hess Infrastructure Partners LP 5.625% 2/15/26 (a) | 2,655,000 | 2,648,416 | |
| Hess Midstream Partners LP 5.125% 6/15/28 (a) | 575,000 | 560,625 | |
| Hilcorp Energy I LP/Hilcorp Finance Co.: | |||
| 5% 12/1/24 (a) | 265,000 | 209,350 | |
| 5.75% 10/1/25 (a) | 850,000 | 680,000 | |
| 6.25% 11/1/28 (a) | 375,000 | 272,820 | |
| Holly Energy Partners LP/Holly Finance Corp. 5% 2/1/28 (a) | 1,450,000 | 1,459,063 | |
| MEG Energy Corp.: | |||
| 7% 3/31/24 (a) | 624,000 | 591,240 | |
| 7.125% 2/1/27 (a) | 2,625,000 | 2,476,084 | |
| NGPL PipeCo LLC 4.875% 8/15/27 (a) | 425,000 | 460,577 | |
| Parsley Energy LLC/Parsley: | |||
| 5.25% 8/15/25 (a) | 170,000 | 168,300 | |
| 5.375% 1/15/25 (a) | 1,760,000 | 1,760,035 | |
| PBF Logistics LP/PBF Logistics Finance, Inc. 6.875% 5/15/23 | 1,945,000 | 1,992,264 | |
| Range Resources Corp.: | |||
| 5% 3/15/23 | 1,525,000 | 1,105,168 | |
| 9.25% 2/1/26 (a) | 625,000 | 423,938 | |
| Sanchez Energy Corp. 7.25% 2/15/23 (a)(c) | 3,242,000 | 1,783,100 | |
| Sunoco LP/Sunoco Finance Corp.: | |||
| 4.875% 1/15/23 | 815,000 | 812,571 | |
| 5.5% 2/15/26 | 1,310,000 | 1,329,781 | |
| Tallgrass Energy Partners LP / Tallgrass Energy Finance Corp. 5.5% 9/15/24 (a) | 1,600,000 | 1,484,160 | |
| Targa Resources Partners LP/Targa Resources Partners Finance Corp.: | |||
| 4.25% 11/15/23 | 750,000 | 742,875 | |
| 5.375% 2/1/27 | 3,000,000 | 3,075,000 | |
| Viper Energy Partners LP 5.375% 11/1/27 (a) | 1,300,000 | 1,321,190 | |
| WPX Energy, Inc.: | |||
| 5.25% 9/15/24 | 550,000 | 552,750 | |
| 5.75% 6/1/26 | 892,000 | 885,042 | |
| 70,497,540 | |||
| TOTAL ENERGY | 82,353,129 | ||
| FINANCIALS - 2.6% | |||
| Banks - 0.0% | |||
| CIT Group, Inc. 6.125% 3/9/28 | 625,000 | 750,000 | |
| Capital Markets - 0.2% | |||
| Balboa Merger Sub, Inc. 11.375% 12/1/21 (a) | 1,600,000 | 1,646,240 | |
| LPL Holdings, Inc. 5.75% 9/15/25 (a) | 500,000 | 518,750 | |
| MSCI, Inc. 4.75% 8/1/26 (a) | 1,775,000 | 1,843,267 | |
| 4,008,257 | |||
| Consumer Finance - 1.1% | |||
| Ally Financial, Inc.: | |||
| 3.875% 5/21/24 | 840,000 | 880,631 | |
| 5.75% 11/20/25 | 4,685,000 | 5,287,725 | |
| 8% 11/1/31 | 770,000 | 1,065,942 | |
| Navient Corp.: | |||
| 5.5% 1/25/23 | 1,620,000 | 1,656,450 | |
| 5.875% 10/25/24 | 195,000 | 199,879 | |
| 6.125% 3/25/24 | 505,000 | 521,413 | |
| 6.5% 6/15/22 | 2,610,000 | 2,720,925 | |
| 7.25% 1/25/22 | 1,015,000 | 1,068,288 | |
| 7.25% 9/25/23 | 1,825,000 | 1,961,875 | |
| Springleaf Finance Corp.: | |||
| 6.875% 3/15/25 | 2,516,000 | 2,767,600 | |
| 7.125% 3/15/26 | 3,020,000 | 3,352,200 | |
| 21,482,928 | |||
| Diversified Financial Services - 0.7% | |||
| Enviva Partners LP / Enviva Partners Finance Corp. 6.5% 1/15/26 (a) | 350,000 | 364,007 | |
| Fairstone Financial, Inc. 7.875% 7/15/24 (a) | 550,000 | 596,750 | |
| Financial & Risk U.S. Holdings, Inc. 8.25% 11/15/26 (a) | 4,000,000 | 4,404,000 | |
| Five Point Operation Co. LP 7.875% 11/15/25 (a) | 452,000 | 453,980 | |
| Icahn Enterprises LP/Icahn Enterprises Finance Corp.: | |||
| 4.75% 9/15/24 (a) | 1,530,000 | 1,560,600 | |
| 6.25% 5/15/26 | 1,210,000 | 1,240,383 | |
| 6.375% 12/15/25 | 1,080,000 | 1,115,100 | |
| MPH Acquisition Holdings LLC 7.125% 6/1/24 (a) | 1,915,000 | 1,781,371 | |
| Venator Finance SARL/Venator Capital Management Ltd. 5.75% 7/15/25 (a) | 900,000 | 805,500 | |
| Verscend Escrow Corp. 9.75% 8/15/26 (a) | 1,000,000 | 1,087,450 | |
| 13,409,141 | |||
| Insurance - 0.4% | |||
| Alliant Holdings Intermediate LLC 6.75% 10/15/27 (a) | 1,875,000 | 1,870,350 | |
| AmWINS Group, Inc. 7.75% 7/1/26 (a) | 2,140,000 | 2,221,598 | |
| USIS Merger Sub, Inc. 6.875% 5/1/25 (a) | 2,205,000 | 2,194,813 | |
| Wand Merger Corp. 9.125% 7/15/26 (a) | 2,600,000 | 2,815,852 | |
| 9,102,613 | |||
| Mortgage Real Estate Investment Trusts - 0.0% | |||
| Starwood Property Trust, Inc. 4.75% 3/15/25 | 515,000 | 525,300 | |
| Thrifts & Mortgage Finance - 0.2% | |||
| Nationstar Mortgage Holdings, Inc. 6% 1/15/27 (a) | 1,862,000 | 1,891,569 | |
| Quicken Loans, Inc. 5.25% 1/15/28 (a) | 1,965,000 | 2,033,186 | |
| 3,924,755 | |||
| TOTAL FINANCIALS | 53,202,994 | ||
| HEALTH CARE - 2.6% | |||
| Health Care Equipment & Supplies - 0.1% | |||
| Hologic, Inc.: | |||
| 4.375% 10/15/25 (a) | 980,000 | 998,081 | |
| 4.625% 2/1/28 (a) | 185,000 | 191,884 | |
| Teleflex, Inc. 4.875% 6/1/26 | 1,750,000 | 1,824,375 | |
| 3,014,340 | |||
| Health Care Providers & Services - 1.8% | |||
| Centene Corp.: | |||
| 4.25% 12/15/27 (a) | 485,000 | 498,968 | |
| 5.25% 4/1/25 (a) | 1,095,000 | 1,126,481 | |
| Community Health Systems, Inc.: | |||
| 6.25% 3/31/23 | 1,775,000 | 1,778,337 | |
| 8% 3/15/26 (a) | 2,080,000 | 2,148,016 | |
| 8.625% 1/15/24 (a) | 1,445,000 | 1,509,707 | |
| HCA Holdings, Inc.: | |||
| 5% 3/15/24 | 3,000,000 | 3,334,604 | |
| 5.875% 2/1/29 | 2,300,000 | 2,653,119 | |
| MEDNAX, Inc. 5.25% 12/1/23 (a) | 1,250,000 | 1,223,438 | |
| Polaris Intermediate Corp. 8.5% 12/1/22 pay-in-kind (a)(d) | 1,590,000 | 1,351,659 | |
| RegionalCare Hospital Partners Holdings, Inc. 9.75% 12/1/26 (a) | 1,555,000 | 1,667,738 | |
| Surgery Center Holdings, Inc. 10% 4/15/27 (a) | 875,000 | 955,938 | |
| Tenet Healthcare Corp.: | |||
| 4.875% 1/1/26 (a) | 795,000 | 809,906 | |
| 5.125% 5/1/25 | 915,000 | 921,863 | |
| 6.25% 2/1/27 (a) | 5,140,000 | 5,384,150 | |
| 6.75% 6/15/23 | 2,620,000 | 2,803,400 | |
| 6.875% 11/15/31 | 500,000 | 520,000 | |
| 7% 8/1/25 | 2,160,000 | 2,219,400 | |
| 8.125% 4/1/22 | 4,645,000 | 5,032,625 | |
| Vizient, Inc. 6.25% 5/15/27 (a) | 125,000 | 133,438 | |
| 36,072,787 | |||
| Health Care Technology - 0.1% | |||
| IMS Health, Inc. 5% 5/15/27 (a) | 1,425,000 | 1,473,094 | |
| Life Sciences Tools & Services - 0.1% | |||
| Avantor, Inc. 6% 10/1/24 (a) | 780,000 | 818,672 | |
| Charles River Laboratories International, Inc.: | |||
| 4.25% 5/1/28 (a) | 145,000 | 145,914 | |
| 5.5% 4/1/26 (a) | 735,000 | 772,797 | |
| 1,737,383 | |||
| Pharmaceuticals - 0.5% | |||
| Catalent Pharma Solutions 4.875% 1/15/26 (a) | 1,355,000 | 1,388,875 | |
| Valeant Pharmaceuticals International, Inc.: | |||
| 5.5% 11/1/25 (a) | 780,000 | 803,072 | |
| 5.875% 5/15/23 (a) | 21,000 | 21,079 | |
| 6.125% 4/15/25 (a) | 785,000 | 800,700 | |
| 7% 3/15/24 (a) | 2,500,000 | 2,573,950 | |
| 8.5% 1/31/27 (a) | 2,000,000 | 2,194,560 | |
| 9.25% 4/1/26 (a) | 1,940,000 | 2,167,601 | |
| 9,949,837 | |||
| TOTAL HEALTH CARE | 52,247,441 | ||
| INDUSTRIALS - 3.0% | |||
| Aerospace & Defense - 1.1% | |||
| BBA U.S. Holdings, Inc. 5.375% 5/1/26 (a) | 2,530,000 | 2,581,498 | |
| Bombardier, Inc.: | |||
| 7.5% 12/1/24 (a) | 2,040,000 | 2,064,684 | |
| 7.5% 3/15/25 (a) | 4,430,000 | 4,374,625 | |
| 7.875% 4/15/27 (a) | 2,800,000 | 2,779,000 | |
| 8.75% 12/1/21 (a) | 850,000 | 899,742 | |
| BWX Technologies, Inc. 5.375% 7/15/26 (a) | 1,925,000 | 2,015,100 | |
| Moog, Inc. 4.25% 12/15/27 (a) | 145,000 | 147,538 | |
| TransDigm UK Holdings PLC 6.875% 5/15/26 | 495,000 | 519,750 | |
| TransDigm, Inc.: | |||
| 5.5% 11/15/27 (a) | 1,640,000 | 1,638,032 | |
| 6.25% 3/15/26 (a) | 2,455,000 | 2,599,236 | |
| 6.5% 7/15/24 | 725,000 | 741,313 | |
| 6.5% 5/15/25 | 1,805,000 | 1,863,121 | |
| 7.5% 3/15/27 | 195,000 | 205,491 | |
| 22,429,130 | |||
| Air Freight & Logistics - 0.2% | |||
| Aercap Global Aviation Trust 6.5% 6/15/45 (a)(d) | 2,950,000 | 3,171,250 | |
| XPO Logistics, Inc. 6.75% 8/15/24 (a) | 1,410,000 | 1,487,550 | |
| 4,658,800 | |||
| Building Products - 0.3% | |||
| Advanced Drain Systems, Inc. 5% 9/30/27 (a) | 1,950,000 | 2,015,813 | |
| Building Materials Corp. of America 4.75% 1/15/28 (a) | 1,846,000 | 1,899,728 | |
| Griffon Corp. 5.75% 3/1/28 (a) | 500,000 | 503,750 | |
| Masonite International Corp. 5.375% 2/1/28 (a) | 800,000 | 840,000 | |
| 5,259,291 | |||
| Commercial Services & Supplies - 0.4% | |||
| Allied Universal Holdco LLC / Allied Universal Finance Corp.: | |||
| 6.625% 7/15/26 (a) | 600,000 | 629,250 | |
| 9.75% 7/15/27 (a) | 665,000 | 709,888 | |
| Brand Energy & Infrastructure Services, Inc. 8.5% 7/15/25 (a) | 1,030,000 | 1,001,675 | |
| LBC Tank Terminals Holding Netherlands BV 6.875% 5/15/23 (a) | 1,800,000 | 1,818,036 | |
| Nielsen Co. SARL (Luxembourg) 5% 2/1/25 (a) | 2,580,000 | 2,547,750 | |
| Nielsen Finance LLC/Nielsen Finance Co. 5% 4/15/22 (a) | 2,135,000 | 2,124,325 | |
| Star Merger Sub, Inc. 6.875% 8/15/26 (a) | 400,000 | 427,100 | |
| 9,258,024 | |||
| Construction & Engineering - 0.4% | |||
| AECOM: | |||
| 5.125% 3/15/27 | 3,156,000 | 3,261,000 | |
| 5.875% 10/15/24 | 905,000 | 993,238 | |
| Amsted Industries, Inc. 5.625% 7/1/27 (a) | 805,000 | 853,300 | |
| Cloud Crane LLC 10.125% 8/1/24 (a) | 1,250,000 | 1,281,250 | |
| Pisces Midco, Inc. 8% 4/15/26 (a) | 1,000,000 | 989,700 | |
| 7,378,488 | |||
| Electrical Equipment - 0.0% | |||
| Sensata Technologies BV 5% 10/1/25 (a) | 715,000 | 752,609 | |
| Machinery - 0.1% | |||
| Navistar International Corp. New 6.625% 11/1/25 (a) | 1,225,000 | 1,268,892 | |
| Titan International, Inc. 6.5% 11/30/23 | 675,000 | 506,250 | |
| 1,775,142 | |||
| Trading Companies & Distributors - 0.5% | |||
| Beacon Roofing Supply, Inc. 4.875% 11/1/25 (a) | 500,000 | 482,350 | |
| FLY Leasing Ltd.: | |||
| 5.25% 10/15/24 | 2,075,000 | 2,126,875 | |
| 6.375% 10/15/21 | 1,500,000 | 1,518,750 | |
| H&E Equipment Services, Inc. 5.625% 9/1/25 | 575,000 | 599,196 | |
| United Rentals North America, Inc.: | |||
| 4% 7/15/30 | 300,000 | 291,720 | |
| 4.875% 1/15/28 | 3,000,000 | 3,078,900 | |
| 5.25% 1/15/30 | 1,400,000 | 1,472,800 | |
| 9,570,591 | |||
| TOTAL INDUSTRIALS | 61,082,075 | ||
| INFORMATION TECHNOLOGY - 2.4% | |||
| Communications Equipment - 0.1% | |||
| CommScope Finance LLC: | |||
| 6% 3/1/26 (a) | 1,050,000 | 1,077,752 | |
| 8.25% 3/1/27 (a) | 995,000 | 1,003,706 | |
| SSL Robotics LLC 9.75% 12/31/23 (a) | 800,000 | 850,240 | |
| 2,931,698 | |||
| Electronic Equipment & Components - 0.3% | |||
| Infor U.S., Inc. 6.5% 5/15/22 | 3,125,000 | 3,134,344 | |
| TTM Technologies, Inc. 5.625% 10/1/25 (a) | 2,835,000 | 2,891,700 | |
| 6,026,044 | |||
| IT Services - 0.8% | |||
| Alliance Data Systems Corp. 4.75% 12/15/24 (a) | 575,000 | 564,219 | |
| Banff Merger Sub, Inc. 9.75% 9/1/26 (a) | 4,408,000 | 4,429,820 | |
| Camelot Finance SA 4.5% 11/1/26 (a) | 1,250,000 | 1,256,125 | |
| Gartner, Inc. 5.125% 4/1/25 (a) | 350,000 | 361,410 | |
| Olympus Merger Sub, Inc. 8.5% 10/15/25 (a) | 2,500,000 | 1,681,250 | |
| Rackspace Hosting, Inc. 8.625% 11/15/24 (a) | 2,150,000 | 2,058,625 | |
| Tempo Acquisition LLC 6.75% 6/1/25 (a) | 2,275,000 | 2,264,353 | |
| Zayo Group LLC/Zayo Capital, Inc.: | |||
| 5.75% 1/15/27 (a) | 1,565,000 | 1,600,213 | |
| 6.375% 5/15/25 | 1,000,000 | 1,022,500 | |
| 15,238,515 | |||
| Semiconductors & Semiconductor Equipment - 0.1% | |||
| Qorvo, Inc. 5.5% 7/15/26 | 1,795,000 | 1,854,235 | |
| Software - 1.1% | |||
| Ascend Learning LLC: | |||
| 6.875% 8/1/25(a) | 185,000 | 191,321 | |
| 6.875% 8/1/25 (a) | 1,355,000 | 1,395,650 | |
| CDK Global, Inc.: | |||
| 4.875% 6/1/27 | 485,000 | 499,550 | |
| 5.25% 5/15/29 (a) | 240,000 | 255,900 | |
| 5.875% 6/15/26 | 985,000 | 1,030,606 | |
| Ensemble S Merger Sub, Inc. 9% 9/30/23 (a) | 2,258,000 | 2,317,273 | |
| Fair Isaac Corp. 5.25% 5/15/26 (a) | 2,365,000 | 2,619,238 | |
| Nortonlifelock, Inc. 5% 4/15/25 (a) | 3,260,000 | 3,309,428 | |
| Nuance Communications, Inc. 5.625% 12/15/26 | 1,085,000 | 1,144,675 | |
| Open Text Corp.: | |||
| 3.875% 2/15/28 (a) | 875,000 | 870,800 | |
| 5.875% 6/1/26 (a) | 2,330,000 | 2,467,004 | |
| Solera LLC/Solera Finance, Inc. 10.5% 3/1/24 (a) | 4,910,000 | 5,186,237 | |
| SS&C Technologies, Inc. 5.5% 9/30/27 (a) | 1,850,000 | 1,947,125 | |
| 23,234,807 | |||
| TOTAL INFORMATION TECHNOLOGY | 49,285,299 | ||
| MATERIALS - 2.7% | |||
| Chemicals - 1.1% | |||
| Alpha 2 BV 8.75% 6/1/23 pay-in-kind (a)(d) | 975,000 | 977,438 | |
| Alpha 3 BV / Alpha U.S. BidCo I 6.25% 2/1/25 (a) | 425,000 | 436,131 | |
| CF Industries Holdings, Inc. 5.15% 3/15/34 | 75,000 | 84,225 | |
| Consolidated Energy Finance SA 3 month U.S. LIBOR + 3.750% 5.6436% 6/15/22 (a)(d)(e) | 1,640,000 | 1,623,652 | |
| Cornerstone Chemical Co. 6.75% 8/15/24 (a) | 750,000 | 670,628 | |
| Element Solutions, Inc. 5.875% 12/1/25 (a) | 2,365,000 | 2,376,872 | |
| Hexion, Inc. 7.875% 7/15/27 (a) | 950,000 | 942,875 | |
| Nufarm Australia Ltd. 5.75% 4/30/26 (a) | 1,795,000 | 1,768,075 | |
| OCI NV 6.625% 4/15/23 (a) | 1,620,000 | 1,678,320 | |
| Olin Corp. 5.125% 9/15/27 | 1,495,000 | 1,506,512 | |
| Rain CII Carbon LLC/CII Carbon Corp. 7.25% 4/1/25 (a) | 800,000 | 768,000 | |
| The Chemours Co. LLC: | |||
| 5.375% 5/15/27 | 1,380,000 | 1,183,626 | |
| 6.625% 5/15/23 | 1,600,000 | 1,541,328 | |
| 7% 5/15/25 | 1,315,000 | 1,226,238 | |
| The Scotts Miracle-Gro Co. 4.5% 10/15/29 (a) | 1,500,000 | 1,552,500 | |
| Tronox, Inc. 6.5% 4/15/26 (a) | 1,750,000 | 1,679,913 | |
| Valvoline, Inc.: | |||
| 4.25% 2/15/30 (a) | 525,000 | 517,781 | |
| 4.375% 8/15/25 | 1,025,000 | 1,055,750 | |
| 21,589,864 | |||
| Construction Materials - 0.1% | |||
| Summit Materials LLC/Summit Materials Finance Corp. 6.5% 3/15/27 (a) | 600,000 | 639,000 | |
| U.S. Concrete, Inc. 6.375% 6/1/24 | 1,420,000 | 1,444,992 | |
| 2,083,992 | |||
| Containers & Packaging - 0.8% | |||
| ARD Finance SA 6.5% 6/30/27 pay-in-kind (a)(d) | 750,000 | 754,725 | |
| Ardagh Packaging Finance PLC/Ardagh MP Holdings U.S.A., Inc. 6% 2/15/25 (a) | 2,260,000 | 2,356,050 | |
| Crown Americas LLC/Crown Americas Capital Corp. IV 4.75% 2/1/26 | 980,000 | 1,010,625 | |
| Crown Americas LLC/Crown Americas Capital Corp. V 4.25% 9/30/26 | 2,120,000 | 2,182,127 | |
| Flex Acquisition Co., Inc.: | |||
| 6.875% 1/15/25 (a) | 1,985,000 | 1,930,452 | |
| 7.875% 7/15/26 (a) | 895,000 | 908,425 | |
| OI European Group BV 4% 3/15/23 (a) | 1,445,000 | 1,461,256 | |
| Owens-Brockway Glass Container, Inc.: | |||
| 5.375% 1/15/25 (a) | 2,000,000 | 2,098,560 | |
| 6.375% 8/15/25 (a) | 650,000 | 716,625 | |
| Silgan Holdings, Inc. 4.75% 3/15/25 | 695,000 | 703,111 | |
| Trivium Packaging Finance BV: | |||
| 5.5% 8/15/26 (a) | 1,785,000 | 1,849,710 | |
| 8.5% 8/15/27 (a) | 315,000 | 333,245 | |
| 16,304,911 | |||
| Metals & Mining - 0.7% | |||
| Allegheny Technologies, Inc. 5.875% 12/1/27 | 1,150,000 | 1,152,875 | |
| Cleveland-Cliffs, Inc.: | |||
| 5.75% 3/1/25 | 500,000 | 455,000 | |
| 5.875% 6/1/27 (a) | 1,175,000 | 989,938 | |
| Constellium NV: | |||
| 5.875% 2/15/26 (a) | 500,000 | 508,125 | |
| 6.625% 3/1/25 (a) | 825,000 | 840,551 | |
| Eldorado Gold Corp. 9.5% 6/1/24 (a) | 975,000 | 1,057,066 | |
| First Quantum Minerals Ltd.: | |||
| 6.875% 3/1/26 (a) | 1,650,000 | 1,565,438 | |
| 7.25% 5/15/22 (a) | 565,000 | 554,689 | |
| 7.25% 4/1/23 (a) | 2,395,000 | 2,299,200 | |
| Freeport-McMoRan, Inc.: | |||
| 3.55% 3/1/22 | 475,000 | 479,228 | |
| 3.875% 3/15/23 | 1,645,000 | 1,653,719 | |
| Hecla Mining Co. 7.25% 2/15/28 | 350,000 | 343,910 | |
| IAMGOLD Corp. 7% 4/15/25 (a) | 750,000 | 768,525 | |
| Novelis Corp. 5.875% 9/30/26 (a) | 1,399,000 | 1,444,964 | |
| 14,113,228 | |||
| Paper & Forest Products - 0.0% | |||
| Berry Global Escrow Corp. 4.875% 7/15/26 (a) | 1,105,000 | 1,124,006 | |
| TOTAL MATERIALS | 55,216,001 | ||
| REAL ESTATE - 1.5% | |||
| Equity Real Estate Investment Trusts (REITs) - 0.9% | |||
| CoreCivic, Inc.: | |||
| 4.625% 5/1/23 | 275,000 | 275,605 | |
| 5% 10/15/22 | 802,000 | 818,441 | |
| CTR Partnership LP/CareTrust Capital Corp. 5.25% 6/1/25 | 1,170,000 | 1,216,800 | |
| GLP Capital LP/GLP Financing II, Inc. 5.25% 6/1/25 | 1,325,000 | 1,482,874 | |
| MGM Growth Properties Operating Partnership LP: | |||
| 4.5% 9/1/26 | 3,050,000 | 3,156,750 | |
| 4.5% 1/15/28 | 925,000 | 948,125 | |
| MPT Operating Partnership LP/MPT Finance Corp.: | |||
| 5% 10/15/27 | 1,650,000 | 1,721,792 | |
| 5.25% 8/1/26 | 1,035,000 | 1,076,767 | |
| 5.5% 5/1/24 | 1,500,000 | 1,526,250 | |
| The GEO Group, Inc.: | |||
| 5.875% 10/15/24 | 350,000 | 327,250 | |
| 6% 4/15/26 | 1,290,000 | 1,167,450 | |
| VICI Properties, Inc.: | |||
| 3.5% 2/15/25 (a) | 630,000 | 630,977 | |
| 4.25% 12/1/26 (a) | 1,480,000 | 1,494,948 | |
| 4.625% 12/1/29 (a) | 1,660,000 | 1,713,950 | |
| 17,557,979 | |||
| Real Estate Management & Development - 0.6% | |||
| Forestar Group, Inc.: | |||
| 5% 3/1/28 (a) | 300,000 | 294,750 | |
| 8% 4/15/24 (a) | 650,000 | 704,438 | |
| Greystar Real Estate Partners 5.75% 12/1/25 (a) | 1,500,000 | 1,550,625 | |
| Howard Hughes Corp. 5.375% 3/15/25 (a) | 3,045,000 | 3,082,149 | |
| Hunt Companies, Inc. 6.25% 2/15/26 (a) | 1,300,000 | 1,261,000 | |
| Mattamy Group Corp.: | |||
| 4.625% 3/1/30 (a)(b) | 500,000 | 485,085 | |
| 5.25% 12/15/27 (a) | 725,000 | 750,375 | |
| Taylor Morrison Communities, Inc./Monarch Communities, Inc.: | |||
| 5.625% 3/1/24 (a) | 250,000 | 270,000 | |
| 5.75% 1/15/28 (a) | 3,000,000 | 3,314,640 | |
| 5.875% 6/15/27 (a) | 800,000 | 896,000 | |
| 12,609,062 | |||
| TOTAL REAL ESTATE | 30,167,041 | ||
| UTILITIES - 2.0% | |||
| Electric Utilities - 0.9% | |||
| Clearway Energy Operating LLC: | |||
| 4.75% 3/15/28 (a) | 290,000 | 295,075 | |
| 5.75% 10/15/25 | 900,000 | 929,997 | |
| InterGen NV 7% 6/30/23 (a) | 3,045,000 | 2,984,100 | |
| NextEra Energy Partners LP: | |||
| 4.25% 9/15/24 (a) | 1,365,000 | 1,374,146 | |
| 4.5% 9/15/27 (a) | 250,000 | 260,754 | |
| NRG Yield Operating LLC 5% 9/15/26 | 885,000 | 906,510 | |
| NSG Holdings II LLC/NSG Holdings, Inc. 7.75% 12/15/25 (a) | 1,499,953 | 1,664,947 | |
| Vistra Operations Co. LLC: | |||
| 5% 7/31/27 (a) | 2,990,000 | 3,020,349 | |
| 5.5% 9/1/26 (a) | 3,566,000 | 3,607,383 | |
| 5.625% 2/15/27 (a) | 3,120,000 | 3,198,000 | |
| 18,241,261 | |||
| Gas Utilities - 0.3% | |||
| AmeriGas Partners LP/AmeriGas Finance Corp. 5.875% 8/20/26 | 2,375,000 | 2,464,110 | |
| Ferrellgas LP/Ferrellgas Finance Corp. 6.75% 6/15/23 (d) | 1,125,000 | 939,848 | |
| Ferrellgas Partners LP / Ferrellgas Partners Finance Corp.: | |||
| 8.625% 6/15/20 | 300,000 | 117,750 | |
| 8.625% 6/15/20 | 2,650,000 | 1,040,125 | |
| Suburban Propane Partners LP/Suburban Energy Finance Corp. 5.875% 3/1/27 | 1,375,000 | 1,416,250 | |
| Superior Plus LP / Superior General Partner, Inc. 7% 7/15/26 (a) | 975,000 | 1,043,250 | |
| 7,021,333 | |||
| Independent Power and Renewable Electricity Producers - 0.8% | |||
| Calpine Corp.: | |||
| 5.125% 3/15/28 (a) | 4,500,000 | 4,230,000 | |
| 5.75% 1/15/25 | 2,000,000 | 2,006,000 | |
| NRG Energy, Inc.: | |||
| 5.25% 6/15/29 (a) | 3,495,000 | 3,632,668 | |
| 6.625% 1/15/27 | 1,910,000 | 1,991,404 | |
| Talen Energy Supply LLC 10.5% 1/15/26 (a) | 565,000 | 502,850 | |
| TerraForm Power Operating LLC: | |||
| 4.25% 1/31/23 (a) | 500,000 | 508,135 | |
| 5% 1/31/28 (a) | 560,000 | 602,728 | |
| The AES Corp.: | |||
| 4.5% 3/15/23 | 755,000 | 751,240 | |
| 6% 5/15/26 | 2,000,000 | 2,057,900 | |
| 16,282,925 | |||
| TOTAL UTILITIES | 41,545,519 | ||
| TOTAL NONCONVERTIBLE BONDS | 701,921,535 | ||
| TOTAL CORPORATE BONDS | |||
| (Cost $714,955,686) | 704,619,475 | ||
| Asset-Backed Securities - 1.3% | |||
| Allegro CLO VII Ltd./LLC Series 2018-1A Class A, 3 month U.S. LIBOR + 1.100% 2.9312% 6/13/31 (a)(d)(e) | 6,000,000 | 5,969,400 | |
| Carlyle Global Market Strategies CLO Series 2018-3RA Class A1A, 3 month U.S. LIBOR + 1.050% 2.8441% 7/27/31 (a)(d)(e) | 3,000,000 | 2,978,100 | |
| Carlyle Global Market Strategies CLO, Ltd. Series 2020-3A Class A1R, 3 month U.S. LIBOR + 1.020% 2.7146% 10/20/29 (a)(d)(e) | 2,500,000 | 2,500,000 | |
| CIFC Funding Ltd./CIFC Funding LLC Series 2020-2A Class AR2, 3 month U.S. LIBOR + 1.010% 0% 4/15/30 (a)(d)(e) | 1,500,000 | 1,500,000 | |
| Greenwood Park CLO, Ltd. Series 2018-1A Class A2, 3 month U.S. LIBOR + 1.010% 2.8412% 4/15/31 (a)(d)(e) | 1,852,000 | 1,839,777 | |
| Greywolf CLO VI, Ltd. Series 2018-1A Class A1, 3 month U.S. LIBOR + 1.030% 2.8241% 4/26/31 (a)(d)(e) | 1,500,000 | 1,488,150 | |
| Jackson Mill CLO LTD. / Jackson Mill CLO LLC Series 2018-1A Class AR, 3 month U.S. LIBOR + 0.830% 2.6613% 4/15/27 (a)(d)(e) | 2,479,697 | 2,474,241 | |
| Madison Park Funding 2015 Series 2020-19A Class A1R2, 3 month U.S. LIBOR + 0.920% 0% 1/22/28 (a)(d)(e) | 1,500,000 | 1,500,000 | |
| OZLM XI, Ltd. Series 2017-11A Class A1R, 3 month U.S. LIBOR + 1.250% 3.0195% 10/30/30 (a)(d)(e) | 2,000,000 | 2,001,400 | |
| Race Point VIII CLO, Ltd. Series 2020-8A Class AR2, 3 month U.S. LIBOR + 1.040% 0% 2/20/30 (a)(d)(e) | 3,000,000 | 3,000,000 | |
| Sound Point CLO XVII, Ltd. Series 2017-3A Class A1B, 3 month U.S. LIBOR + 1.220% 3.0391% 10/20/30 (a)(d)(e) | 1,500,000 | 1,499,400 | |
| TOTAL ASSET-BACKED SECURITIES | |||
| (Cost $26,812,504) | 26,750,468 | ||
| Shares | Value | ||
| Common Stocks - 0.0% | |||
| ENERGY - 0.0% | |||
| Energy Equipment & Services - 0.0% | |||
| Weatherford International PLC (f) | |||
| (Cost $152,055) | 6,540 | 136,686 | |
| Principal Amount | Value | ||
| Bank Loan Obligations - 1.2% | |||
| COMMUNICATION SERVICES - 0.1% | |||
| Media - 0.1% | |||
| iHeartCommunications, Inc. 1LN, term loan 3 month U.S. LIBOR + 3.000% 4.655% 5/1/26 (d)(e)(g) | 750,000 | 735,000 | |
| WideOpenWest Finance LLC Tranche B, term loan 3 month U.S. LIBOR + 3.250% 4.8894% 8/19/23 (d)(e)(g) | 1,456,475 | 1,405,498 | |
| 2,140,498 | |||
| CONSUMER DISCRETIONARY - 0.1% | |||
| Hotels, Restaurants & Leisure - 0.1% | |||
| Golden Entertainment, Inc. Tranche B, term loan 3 month U.S. LIBOR + 3.000% 4.62% 10/20/24 (d)(e)(g) | 1,312,400 | 1,282,871 | |
| Playtika Holding Corp. Tranche B 1LN, term loan 3 month U.S. LIBOR + 6.000% 7.6034% 12/10/24 (d)(e)(g) | 750,000 | 750,000 | |
| 2,032,871 | |||
| Specialty Retail - 0.0% | |||
| Sally Holdings LLC Tranche B 2LN, term loan 4.5% 7/5/24 (d)(g) | 500,000 | 488,750 | |
| TOTAL CONSUMER DISCRETIONARY | 2,521,621 | ||
| ENERGY - 0.4% | |||
| Oil, Gas & Consumable Fuels - 0.4% | |||
| California Resources Corp. Tranche B, term loan 3 month U.S. LIBOR + 4.750% 6.3633% 12/31/22 (d)(e)(g) | 2,295,000 | 1,948,845 | |
| Chesapeake Energy Corp. term loan 3 month U.S. LIBOR + 8.000% 9.9278% 6/9/24 (d)(e)(g) | 3,735,000 | 3,383,275 | |
| Citgo Holding, Inc. Tranche B 1LN, term loan 3 month U.S. LIBOR + 7.000% 8.6034% 8/1/23 (d)(e)(g) | 375,000 | 375,000 | |
| Citgo Petroleum Corp. Tranche B 1LN, term loan 3 month U.S. LIBOR + 5.000% 6.9446% 3/28/24 (d)(e)(g) | 750,000 | 746,250 | |
| Gavilan Resources LLC Tranche 2LN, term loan 3 month U.S. LIBOR + 6.000% 7.6034% 3/1/24 (d)(e)(g) | 2,475,000 | 824,992 | |
| Sanchez Energy Corp.: | |||
| 1LN, term loan 3 month U.S. LIBOR + 8.000% 6.7821% 5/11/20 (e)(g)(h)(i) | 1,274,833 | 1,274,833 | |
| term loan 7.25% 5/11/20 (d)(g)(i) | 373,000 | 373,000 | |
| 8,926,195 | |||
| FINANCIALS - 0.0% | |||
| Diversified Financial Services - 0.0% | |||
| MPH Acquisition Holdings LLC Tranche B, term loan 3 month U.S. LIBOR + 2.750% 4.6946% 6/7/23 (d)(e)(g) | 300,000 | 285,249 | |
| HEALTH CARE - 0.1% | |||
| Health Care Providers & Services - 0.0% | |||
| RegionalCare Hospital Partners Holdings, Inc. Tranche B, term loan 3 month U.S. LIBOR + 3.750% 5.3952% 11/16/25 (d)(e)(g) | 335,000 | 331,650 | |
| Pharmaceuticals - 0.1% | |||
| Mallinckrodt International Finance S.A. Tranche B, term loan 3 month U.S. LIBOR + 2.750% 9/24/24 (e)(g)(j) | 500,000 | 444,165 | |
| TOTAL HEALTH CARE | 775,815 | ||
| INDUSTRIALS - 0.1% | |||
| Commercial Services & Supplies - 0.1% | |||
| Brand Energy & Infrastructure Services, Inc. Tranche B, term loan 3 month U.S. LIBOR + 4.250% 6.088% 6/21/24 (d)(e)(g) | 1,452,750 | 1,419,337 | |
| West Corp. Tranche B 1LN, term loan 3 month U.S. LIBOR + 4.000% 5.5678% 10/10/24 (d)(e)(g) | 1,150,000 | 911,375 | |
| 2,330,712 | |||
| INFORMATION TECHNOLOGY - 0.2% | |||
| Communications Equipment - 0.0% | |||
| Radiate Holdco LLC Tranche B, term loan 3 month U.S. LIBOR + 3.000% 4.6034% 2/1/24 (d)(e)(g) | 403,588 | 394,761 | |
| Software - 0.2% | |||
| Almonde, Inc.: | |||
| Tranche 2LN, term loan 3 month U.S. LIBOR + 7.250% 9.0271% 6/13/25 (d)(e)(g) | 805,000 | 765,257 | |
| Tranche B 1LN, term loan 3 month U.S. LIBOR + 3.500% 5.2771% 6/13/24 (d)(e)(g) | 240,772 | 229,136 | |
| Boxer Parent Co., Inc. Tranche B, term loan 3 month U.S. LIBOR + 4.250% 5.8534% 10/2/25 (d)(e)(g) | 450,000 | 431,519 | |
| Informatica Corp. Tranche B 1LN, term loan 3 month U.S. LIBOR + 3.250% 2/14/27 (e)(g)(j) | 825,000 | 806,438 | |
| TIBCO Software, Inc. 2LN, term loan 3 month U.S. LIBOR + 7.750% 2/13/28 (e)(g)(j) | 1,000,000 | 1,000,000 | |
| 3,232,350 | |||
| TOTAL INFORMATION TECHNOLOGY | 3,627,111 | ||
| MATERIALS - 0.1% | |||
| Chemicals - 0.1% | |||
| Solenis International LP Tranche 1LN, term loan 3 month U.S. LIBOR + 4.000% 12/18/23 (e)(g)(j) | 1,000,000 | 973,750 | |
| Starfruit U.S. Holdco LLC Tranche B, term loan 3 month U.S. LIBOR + 3.000% 4.6709% 10/1/25 (d)(e)(g) | 1,000,000 | 965,000 | |
| 1,938,750 | |||
| Metals & Mining - 0.0% | |||
| Aleris International, Inc. Tranche B 1LN, term loan 3 month U.S. LIBOR + 4.750% 2/27/23 (e)(g)(j) | 750,000 | 747,893 | |
| TOTAL MATERIALS | 2,686,643 | ||
| REAL ESTATE - 0.1% | |||
| Real Estate Management & Development - 0.1% | |||
| Brookfield Retail Holdings VII Sub 3 LLC Tranche B, term loan 3 month U.S. LIBOR + 2.500% 8/24/25 (e)(g)(j) | 1,000,000 | 977,500 | |
| TOTAL BANK LOAN OBLIGATIONS | |||
| (Cost $25,393,359) | 24,271,344 | ||
| Shares | Value | ||
| Fixed-Income Funds - 60.0% | |||
| High Yield Fixed-Income Funds - 60.0% | |||
| Artisan High Income Fund Investor Shares | 25,486,061 | 245,940,451 | |
| BlackRock High Yield Bond Portfolio Institutional Class | 10,729,857 | 81,332,317 | |
| Eaton Vance Income Fund of Boston Class A | 18,137,743 | 99,757,584 | |
| Fidelity Capital & Income Fund (k) | 15,039,162 | 147,684,574 | |
| Hotchkis & Wiley High Yield Fund Class A | 2,228,463 | 24,758,219 | |
| MainStay High Yield Corporate Bond Fund Class A | 37,604,342 | 207,952,012 | |
| T. Rowe Price High Yield Fund Advisor Class | 27,290,683 | 176,843,629 | |
| Vanguard High-Yield Corporate Fund Admiral Shares | 40,862,480 | 239,862,760 | |
| TOTAL FIXED-INCOME FUNDS | |||
| (Cost $1,171,077,887) | 1,224,131,546 | ||
| Principal Amount | Value | ||
| Preferred Securities - 0.9% | |||
| ENERGY - 0.1% | |||
| Oil, Gas & Consumable Fuels - 0.1% | |||
| MPLX LP 6.875% (d)(l) | 2,055,000 | 1,988,898 | |
| FINANCIALS - 0.7% | |||
| Banks - 0.7% | |||
| Bank of America Corp.: | |||
| 5.2% (d)(l) | 1,200,000 | 1,248,515 | |
| 6.25% (d)(l) | 4,000,000 | 4,516,559 | |
| Barclays PLC 7.875% (Reg. S) (d)(l) | 1,535,000 | 1,645,438 | |
| Citigroup, Inc. 4.7% (d)(l) | 1,075,000 | 1,065,496 | |
| JPMorgan Chase & Co. 4.6% (d)(l) | 2,440,000 | 2,463,861 | |
| Royal Bank of Scotland Group PLC 7.5% (d)(l) | 1,060,000 | 1,083,414 | |
| Wells Fargo & Co. 5.9% (d)(l) | 2,250,000 | 2,440,738 | |
| 14,464,021 | |||
| INDUSTRIALS - 0.1% | |||
| Trading Companies & Distributors - 0.1% | |||
| AerCap Holdings NV 5.875% 10/10/79 (d) | 2,530,000 | 2,626,024 | |
| TOTAL PREFERRED SECURITIES | |||
| (Cost $18,403,669) | 19,078,943 | ||
| Shares | Value | ||
| Money Market Funds - 2.2% | |||
| Fidelity Cash Central Fund 1.60% (m) | 23,055,934 | 23,060,546 | |
| State Street Institutional U.S. Government Money Market Fund Premier Class 1.53% (n) | 21,664,893 | 21,664,893 | |
| TOTAL MONEY MARKET FUNDS | |||
| (Cost $44,725,294) | 44,725,439 | ||
| TOTAL INVESTMENT IN SECURITIES - 100.1% | |||
| (Cost $2,001,520,454) | 2,043,713,901 | ||
| NET OTHER ASSETS (LIABILITIES) - (0.1)% | ( 1,660,368 ) | ||
| NET ASSETS - 100% | $2,042,053,533 |
Swaps
| Underlying Reference | Maturity Date | Clearinghouse / Counterparty(1) | Fixed Payment Received/(Paid) | Payment Frequency | Notional Amount | Value | Upfront Premium Received/(Paid)(2) | Unrealized Appreciation/(Depreciation) |
| Credit Default Swaps | ||||||||
| Buy Protection | ||||||||
| CDX N.A. HY Series 33 5YR V3 | Dec. 2024 | ICE | (5%) | Quarterly | $20,975,000 | $648,756 | $0 | $648,756 |
(1) Swaps with Intercontinental Exchange (ICE) are centrally cleared over-the-counter (OTC) swaps.
(2) Any premiums for centrally cleared over-the-counter (OTC) swaps are recorded periodically throughout the term of the swap to variation margin and included in unrealized appreciation (depreciation).
Legend
(a) Security exempt from registration under Rule 144A of the Securities Act of 1933. These securities may be resold in transactions exempt from registration, normally to qualified institutional buyers. At the end of the period, the value of these securities amounted to $501,784,907 or 24.6% of net assets.
(b) Security or a portion of the security purchased on a delayed delivery or when-issued basis.
(c) Non-income producing - Security is in default.
(d) Coupon rates for floating and adjustable rate securities reflect the rates in effect at period end.
(e) Coupon is indexed to a floating interest rate which may be multiplied by a specified factor and/or subject to caps or floors.
(f) Non-income producing
(g) Remaining maturities of bank loan obligations may be less than the stated maturities shown as a result of contractual or optional prepayments by the borrower. Such prepayments cannot be predicted with certainty.
(h) Position represents an unfunded loan commitment. At period end, the total principal amount and market value of unfunded commitments totaled $410,231 and $410,231, respectively.
(i) Level 3 security
(j) The coupon rate will be determined upon settlement of the loan after period end.
(k) Affiliated Fund
(l) Security is perpetual in nature with no stated maturity date.
(m) Affiliated fund that is generally available only to investment companies and other accounts managed by Fidelity Investments. The rate quoted is the annualized seven-day yield of the fund at period end. A complete unaudited listing of the fund's holdings as of its most recent quarter end is available upon request. In addition, each Fidelity Central Fund's financial statements, which are not covered by the Fund's Report of Independent Registered Public Accounting Firm, are available on the SEC's website or upon request.
(n) The rate quoted is the annualized seven-day yield of the fund at period end.
Affiliated Central Funds
Information regarding fiscal year to date income earned by the Fund from investments in Fidelity Central Funds is as follows:
| Fund | Income earned |
| Fidelity Cash Central Fund | $288,492 |
| Total | $288,492 |
Amounts in the income column in the above table include any capital gain distributions from underlying funds, which are presented in the corresponding line-item in the Statement of Operations, if applicable.
Affiliated Underlying Funds
Fiscal year to date information regarding the Fund's investments in affiliated Underlying Funds, excluding any Money Market Central Funds, is presented below. Exchanges between classes of the same affiliated Underlying Funds may occur.
| Affiliate | Value, beginning of period | Purchases | Sales Proceeds | Dividend Income | Realized Gain (loss) | Change in Unrealized appreciation (depreciation) | Value, end of period |
| Fidelity Advisor High Income Advantage Fund Class I | $160,296,900 | $3,864,008 | $165,171,810 | $3,864,116 | $17,346,425 | $(16,335,523) | $-- |
| Fidelity Capital & Income Fund | 360,272,960 | 9,037,793 | 222,034,748 | 8,388,988 | 24,056,694 | (23,648,125) | 147,684,574 |
| Total | $520,569,860 | $12,901,801 | $387,206,558 | $12,253,104 | $41,403,119 | $(39,983,648) | $147,684,574 |
Amounts in the income column in the above table include any capital gain distributions from underlying funds, which are presented in the corresponding line-item in the Statement of Operations, if applicable.
Investment Valuation
The following is a summary of the inputs used, as of February 29, 2020, involving the Fund's assets and liabilities carried at fair value. The inputs or methodology used for valuing securities may not be an indication of the risk associated with investing in those securities. For more information on valuation inputs, and their aggregation into the levels used below, please refer to the Investment Valuation section in the accompanying Notes to Financial Statements.
| Valuation Inputs at Reporting Date: | ||||
| Description | Total | Level 1 | Level 2 | Level 3 |
| Investments in Securities: | ||||
| Equities: | ||||
| Energy | $136,686 | $136,686 | $-- | $-- |
| Corporate Bonds | 704,619,475 | -- | 704,619,475 | -- |
| Asset-Backed Securities | 26,750,468 | -- | 26,750,468 | -- |
| Bank Loan Obligations | 24,271,344 | -- | 22,623,511 | 1,647,833 |
| Fixed-Income Funds | 1,224,131,546 | 1,224,131,546 | -- | -- |
| Preferred Securities | 19,078,943 | -- | 19,078,943 | -- |
| Money Market Funds | 44,725,439 | 44,725,439 | -- | -- |
| Total Investments in Securities: | $2,043,713,901 | $1,268,993,671 | $773,072,397 | $1,647,833 |
| Derivative Instruments: | ||||
| Assets | ||||
| Swaps | $648,756 | $-- | $648,756 | $-- |
| Total Assets | $648,756 | $-- | $648,756 | $-- |
| Total Derivative Instruments: | $648,756 | $-- | $648,756 | $-- |
Value of Derivative Instruments
The following table is a summary of the Fund's value of derivative instruments by primary risk exposure as of February 29, 2020. For additional information on derivative instruments, please refer to the Derivative Instruments section in the accompanying Notes to Financial Statements.
| Primary Risk Exposure / Derivative Type | Value | |
| Asset | Liability | |
| Credit Risk | ||
| Swaps(a) | $648,756 | $0 |
| Total Credit Risk | 648,756 | 0 |
| Total Value of Derivatives | $648,756 | $0 |
(a) For centrally cleared over-the-counter (OTC) swaps, reflects gross cumulative appreciation (depreciation) as presented in the Schedule of Investments. In the Statement of Assets and Liabilities, the period end daily variation margin for centrally cleared OTC swaps is included in receivable or payable for daily variation margin on centrally cleared OTC swaps, and the net cumulative appreciation (depreciation) for centrally cleared OTC swaps is included in Total accumulated earnings (loss).
See accompanying notes which are an integral part of the financial statements.
Financial Statements
Statement of Assets and Liabilities
| February 29, 2020 | ||
| Assets | ||
| Investment in securities, at value — See accompanying schedule: Unaffiliated issuers (cost $1,867,696,696) | $1,872,968,781 | |
| Fidelity Central Funds (cost $23,060,402) | 23,060,546 | |
| Other affiliated issuers (cost $110,763,356) | 147,684,574 | |
| Total Investment in Securities (cost $2,001,520,454) | $2,043,713,901 | |
| Cash | 907,792 | |
| Receivable for investments sold | 4,456,116 | |
| Receivable for fund shares sold | 563,710 | |
| Interest receivable | 12,193,687 | |
| Distributions receivable from Fidelity Central Funds | 32,151 | |
| Receivable for daily variation margin on centrally cleared OTC swaps | 13,416 | |
| Other receivables | 1,476,005 | |
| Total assets | 2,063,356,778 | |
| Liabilities | ||
| Payable for investments purchased | ||
| Regular delivery | $16,432,578 | |
| Delayed delivery | 2,080,000 | |
| Payable for fund shares redeemed | 2,421,202 | |
| Distributions payable | 73,486 | |
| Accrued management fee | 203,475 | |
| Other payables and accrued expenses | 92,504 | |
| Total liabilities | 21,303,245 | |
| Net Assets | $2,042,053,533 | |
| Net Assets consist of: | ||
| Paid in capital | $2,132,059,986 | |
| Total accumulated earnings (loss) | (90,006,453) | |
| Net Assets | $2,042,053,533 | |
| Net Asset Value, offering price and redemption price per share ($2,042,053,533 ÷ 219,053,688 shares) | $9.32 |
See accompanying notes which are an integral part of the financial statements.
Statement of Operations
| Year ended February 29, 2020 | ||
| Investment Income | ||
| Dividends: | ||
| Unaffiliated issuers | $83,013,204 | |
| Affiliated issuers | 10,967,951 | |
| Interest | 32,356,126 | |
| Income from Fidelity Central Funds | 288,492 | |
| Total income | 126,625,773 | |
| Expenses | ||
| Management fee | $7,414,496 | |
| Accounting fees and expenses | 266,939 | |
| Custodian fees and expenses | 11,478 | |
| Independent trustees' fees and expenses | 25,898 | |
| Registration fees | 45,508 | |
| Audit | 49,034 | |
| Legal | 8,158 | |
| Miscellaneous | 23,627 | |
| Total expenses before reductions | 7,845,138 | |
| Expense reductions | (5,719,402) | |
| Total expenses after reductions | 2,125,736 | |
| Net investment income (loss) | 124,500,037 | |
| Realized and Unrealized Gain (Loss) | ||
| Net realized gain (loss) on: | ||
| Investment securities: | ||
| Unaffiliated issuers | (27,534,350) | |
| Affiliated issuers | 41,403,119 | |
| Swaps | 158,171 | |
| Capital gain distributions from underlying funds: | ||
| Unaffiliated issuers | 91,452 | |
| Affiliated issuers | 1,285,153 | |
| Total net realized gain (loss) | 15,403,545 | |
| Change in net unrealized appreciation (depreciation) on: | ||
| Investment securities: | ||
| Unaffiliated issuers | 28,136,234 | |
| Affiliated issuers | (39,983,648) | |
| Swaps | 648,756 | |
| Total change in net unrealized appreciation (depreciation) | (11,198,658) | |
| Net gain (loss) | 4,204,887 | |
| Net increase (decrease) in net assets resulting from operations | $128,704,924 |
See accompanying notes which are an integral part of the financial statements.
Statement of Changes in Net Assets
| Year ended February 29, 2020 | Year ended February 28, 2019 | |
| Increase (Decrease) in Net Assets | ||
| Operations | ||
| Net investment income (loss) | $124,500,037 | $163,409,710 |
| Net realized gain (loss) | 15,403,545 | (34,529,191) |
| Change in net unrealized appreciation (depreciation) | (11,198,658) | (47,729,454) |
| Net increase (decrease) in net assets resulting from operations | 128,704,924 | 81,151,065 |
| Distributions to shareholders | (128,212,511) | (152,578,108) |
| Share transactions | ||
| Proceeds from sales of shares | 264,458,141 | 518,968,318 |
| Reinvestment of distributions | 92,688,234 | 99,413,790 |
| Cost of shares redeemed | (958,070,158) | (951,905,541) |
| Net increase (decrease) in net assets resulting from share transactions | (600,923,783) | (333,523,433) |
| Total increase (decrease) in net assets | (600,431,370) | (404,950,476) |
| Net Assets | ||
| Beginning of period | 2,642,484,903 | 3,047,435,379 |
| End of period | $2,042,053,533 | $2,642,484,903 |
| Other Information | ||
| Shares | ||
| Sold | 27,921,160 | 55,268,271 |
| Issued in reinvestment of distributions | 9,796,252 | 10,691,042 |
| Redeemed | (101,436,177) | (102,827,858) |
| Net increase (decrease) | (63,718,765) | (36,868,545) |
See accompanying notes which are an integral part of the financial statements.
Financial Highlights
Strategic Advisers Income Opportunities Fund
| Years ended February 28, | 2020 A | 2019 | 2018 | 2017 | 2016 A |
| Selected Per–Share Data | |||||
| Net asset value, beginning of period | $9.34 | $9.53 | $9.57 | $8.48 | $9.94 |
| Income from Investment Operations | |||||
| Net investment income (loss)B | .515 | .513 | .489 | .493 | .518 |
| Net realized and unrealized gain (loss) | (.001) | (.222) | (.050) | 1.091 | (1.300) |
| Total from investment operations | .514 | .291 | .439 | 1.584 | (.782) |
| Distributions from net investment income | (.530) | (.469) | (.479) | (.494) | (.537)C |
| Distributions from net realized gain | (.004) | (.012) | – | – | (.118)C |
| Tax return of capital | – | – | – | – | (.023) |
| Total distributions | (.534) | (.481) | (.479) | (.494) | (.678) |
| Net asset value, end of period | $9.32 | $9.34 | $9.53 | $9.57 | $8.48 |
| Total ReturnD | 5.57% | 3.21% | 4.66% | 19.08% | (8.26)% |
| Ratios to Average Net AssetsE,F | |||||
| Expenses before reductions | .34% | .36% | .38% | .29% | .26% |
| Expenses net of fee waivers, if any | .09% | .11% | .13% | .04% | .01% |
| Expenses net of all reductions | .09% | .11% | .13% | .04% | .01% |
| Net investment income (loss) | 5.44% | 5.49% | 5.09% | 5.40% | 5.56% |
| Supplemental Data | |||||
| Net assets, end of period (000 omitted) | $2,042,054 | $2,642,485 | $3,047,435 | $3,318,071 | $3,813,523 |
| Portfolio turnover rateG | 40% | 22% | 33% | 38% | 10% |
A For the year ended February 29.
B Calculated based on average shares outstanding during the period.
C The amounts shown reflect certain reclassifications related to book to tax differences that were made in the year shown.
D Total returns would have been lower if certain expenses had not been reduced during the applicable periods shown.
E Fees and expenses of any underlying Fidelity Central Funds are not included in the Fund's expense ratio. The Fund indirectly bears its proportionate share of the expenses of any underlying Fidelity Central Funds.
F Expense ratios reflect operating expenses of the Fund. Expenses before reductions do not reflect amounts reimbursed by the investment adviser or reductions from expense offset arrangements and do not represent the amount paid by the Fund during periods when reimbursements or reductions occur. Expenses net of fee waivers reflect expenses after reimbursement by the investment adviser but prior to reductions from expense offset arrangements. Expenses net of all reductions represent the net expenses paid by the Fund. Fees and expenses of the Underlying Funds are not included in the Fund's annualized ratios. The Fund indirectly bears its proportionate share of the expenses of the Underlying Funds.
G Amounts do not include the activity of Underlying Funds.
See accompanying notes which are an integral part of the financial statements.
Notes to Financial Statements
For the period ended February 29, 2020
1. Organization.
Strategic Advisers Income Opportunities Fund (the Fund) is a fund of Fidelity Rutland Square Trust II (the Trust), and is authorized to issue an unlimited number of shares. The Trust is registered under the Investment Company Act of 1940, as amended (the 1940 Act), as an open-end management investment company organized as a Delaware statutory trust. The Fund is offered exclusively to certain clients of Strategic Advisers LLC (Strategic Advisers), an affiliate of Fidelity Management & Research Company LLC (FMR).
2. Significant Accounting Policies.
The Fund is an investment company and applies the accounting and reporting guidance of the Financial Accounting Standards Board (FASB) Accounting Standards Codification Topic 946 Financial Services – Investments Companies. The financial statements have been prepared in conformity with accounting principles generally accepted in the United States of America (GAAP), which require management to make certain estimates and assumptions at the date of the financial statements. Actual results could differ from those estimates. Subsequent events, if any, through the date that the financial statements were issued have been evaluated in the preparation of the financial statements. The Fund's Schedule of Investments lists each of the Underlying Funds as an investment of the Fund but does not include the underlying holdings of each Underlying Fund. The following summarizes the significant accounting policies of the Fund:
Investment Valuation. Investments are valued as of 4:00 p.m. Eastern time on the last calendar day of the period. The Board of Trustees (the Board) has delegated the day to day responsibility for the valuation of the Fund's investments to the Fair Value Committee (the Committee) established by the Fund's investment adviser. In accordance with valuation policies and procedures approved by the Board, the Fund attempts to obtain prices from one or more third party pricing vendors or brokers to value its investments. When current market prices, quotations or currency exchange rates are not readily available or reliable, investments will be fair valued in good faith by the Committee, in accordance with procedures adopted by the Board. Factors used in determining fair value vary by investment type and may include market or investment specific events, changes in interest rates and credit quality. The frequency with which these procedures are used cannot be predicted and they may be utilized to a significant extent. The Committee oversees the Fund's valuation policies and procedures and reports to the Board on the Committee's activities and fair value determinations. The Board monitors the appropriateness of the procedures used in valuing the Fund's investments and ratifies the fair value determinations of the Committee.
The Fund categorizes the inputs to valuation techniques used to value its investments into a disclosure hierarchy consisting of three levels as shown below:
- Level 1 – quoted prices in active markets for identical investments
- Level 2 – other significant observable inputs (including quoted prices for similar investments, interest rates, prepayment speeds, etc.)
- Level 3 – unobservable inputs (including the Fund's own assumptions based on the best information available)
Valuation techniques used to value the Fund's investments by major category are as follows:
Debt securities, including restricted securities, are valued based on evaluated prices received from third party pricing vendors or from brokers who make markets in such securities. Corporate bonds, bank loan obligations and preferred securities are valued by pricing vendors who utilize matrix pricing which considers yield or price of bonds of comparable quality, coupon, maturity and type or by broker-supplied prices. Asset backed securities are valued by pricing vendors who utilize matrix pricing which considers prepayment speed assumptions, attributes of the collateral, yield or price of bonds of comparable quality, coupon, maturity and type or by broker-supplied prices. Swaps are marked-to-market daily based on valuations from third party pricing vendors, registered derivatives clearing organizations (clearinghouses) or broker-supplied valuations. These pricing sources may utilize inputs such as interest rate curves, credit spread curves, default possibilities and recovery rates. When independent prices are unavailable or unreliable, debt securities and swaps may be valued utilizing pricing methodologies which consider similar factors that would be used by third party pricing vendors. Debt securities and swaps are generally categorized as Level 2 in the hierarchy but may be Level 3 depending on the circumstances. The Fund invests a significant portion of its assets in below investment grade securities. The value of these securities can be more volatile due to changes in the credit quality of the issuer and is sensitive to changes in economic, market and regulatory conditions.
Equity securities, including restricted securities, for which market quotations are readily available, are valued at the last reported sale price or official closing price as reported by a third party pricing vendor on the primary market or exchange on which they are traded and are categorized as Level 1 in the hierarchy. In the event there were no sales during the day or closing prices are not available, securities are valued at the last quoted bid price or may be valued using the last available price and are generally categorized as Level 2 in the hierarchy. For equity securities, including restricted securities, where observable inputs are limited, assumptions about market activity and risk are used and these securities may be categorized as Level 3 in the hierarchy.
Investments in open-end mutual funds, including the Fidelity Central Funds, are valued at their closing net asset value (NAV) each business day and are categorized as Level 1 in the hierarchy. If an unaffiliated open-end mutual fund's NAV is unavailable, shares of that fund may be valued by another method that the Board believes reflects fair value in accordance with the Board's fair value pricing policies and is categorized as Level 2 in the hierarchy.
Changes in valuation techniques may result in transfers in or out of an assigned level within the disclosure hierarchy. The aggregate value of investments by input level as of February 29, 2020 is included at the end of the Fund's Schedule of Investments.
Investment Transactions and Income. For financial reporting purposes, the Fund's investment holdings and NAV include trades executed through the end of the last business day of the period. The NAV per share for processing shareholder transactions is calculated as of the close of business of the New York Stock Exchange (NYSE), normally 4:00 p.m. Eastern time and includes trades executed through the end of the prior business day. Gains and losses on securities sold are determined on the basis of identified cost and include proceeds received from litigation. Dividend income is recorded on the ex-dividend date, except for certain dividends from foreign securities where the ex-dividend date may have passed, which are recorded as soon as the Fund is informed of the ex-dividend date. Non-cash dividends included in dividend income, if any, are recorded at the fair market value of the securities received. Income and capital gain distributions from Fidelity Central Funds, if any, are recorded on the ex-dividend date. Income and capital gain distributions from Underlying Funds, if any, are recorded on the ex-dividend date. Certain distributions received by the Fund represent a return of capital or capital gain. The Fund determines the components of these distributions subsequent to the ex-dividend date, based upon receipt of tax filings or other correspondence relating to the underlying investment. These distributions are recorded as a reduction of cost of investments and/or as a realized gain. Interest income is accrued as earned and includes coupon interest and amortization of premium and accretion of discount on debt securities as applicable. Paid in Kind (PIK) income is recorded at the fair market value of the securities received. Debt obligations may be placed on non-accrual status and related interest income may be reduced by ceasing current accruals and writing off interest receivables when the collection of all or a portion of interest has become doubtful based on consistently applied procedures. A debt obligation is removed from non-accrual status when the issuer resumes interest payments or when collectability of interest is reasonably assured.
Expenses. Expenses directly attributable to a fund are charged to that fund. Expenses attributable to more than one fund are allocated among the respective funds on the basis of relative net assets or other appropriate methods. Expenses included in the accompanying financial statements reflect the expenses of the Fund and do not include any expenses associated with the Underlying Funds. Although not included in the Fund's expenses, the Fund indirectly bears its proportionate share of the Underlying Funds' expenses through the impact of these expenses on each Underlying Fund's NAV. Expense estimates are accrued in the period to which they relate and adjustments are made when actual amounts are known.
Deferred Trustee Compensation. Under a Deferred Compensation Plan (the Plan), certain independent Trustees have elected to defer receipt of a portion of their annual compensation. Deferred amounts are invested in a cross-section of Strategic Advisers funds, are marked-to-market and remain in the Fund until distributed in accordance with the Plan. The investment of deferred amounts and the offsetting payable to the Trustees of $56,005 are included in the accompanying Statement of Assets and Liabilities in other receivables and other payables and accrued expenses, respectively.
Income Tax Information and Distributions to Shareholders. Each year, the Fund intends to qualify as a regulated investment company under Subchapter M of the Internal Revenue Code, including distributing substantially all of its taxable income and realized gains. As a result, no provision for U.S. Federal income taxes is required. As of February 29, 2020, the Fund did not have any unrecognized tax benefits in the financial statements; nor is the Fund aware of any tax positions for which it is reasonably possible that the total amounts of unrecognized tax benefits will significantly change in the next twelve months. The Fund files a U.S. federal tax return, in addition to state and local tax returns as required. The Fund's federal income tax returns are subject to examination by the Internal Revenue Service (IRS) for a period of three fiscal years after they are filed. State and local tax returns may be subject to examination for an additional fiscal year depending on the jurisdiction.
Distributions are declared and recorded daily and paid monthly from net investment income. Distributions from realized gains, if any, are declared and recorded on the ex-dividend date. Income and capital gain distributions are determined in accordance with income tax regulations, which may differ from GAAP.
Capital accounts within the financial statements are adjusted for permanent book-tax differences. These adjustments have no impact on net assets or the results of operations. Capital accounts are not adjusted for temporary book-tax differences which will reverse in a subsequent period.
Book-tax differences are primarily due to the short-term gain distributions from the Underlying Funds, swaps, market discount, partnerships, deferred trustees compensation, capital loss carryforwards and losses deferred due to wash sales.
As of period end, the cost and unrealized appreciation (depreciation) in securities, and derivatives if applicable, for federal income tax purposes were as follows:
| Gross unrealized appreciation | $82,584,928 |
| Gross unrealized depreciation | (39,203,097) |
| Net unrealized appreciation (depreciation) | $43,381,831 |
| Tax Cost | $2,001,057,624 |
The tax-based components of distributable earnings as of period end were as follows:
| Capital loss carryforward | $(132,937,521) |
| Net unrealized appreciation (depreciation) on securities and other investments | $43,381,831 |
Capital loss carryforwards are only available to offset future capital gains of the Fund to the extent provided by regulations and may be limited. The capital loss carryforward information presented below, including any applicable limitation, is estimated as of fiscal period end and is subject to adjustment.
| No expiration | |
| Short-term | $(11,096,177) |
| Long-term | (121,841,344) |
| Total capital loss carryforward | $(132,937,521) |
The tax character of distributions paid was as follows:
| February 29, 2020 | February 28, 2019 | |
| Ordinary Income | $128,212,511 | $ 152,578,108 |
Delayed Delivery Transactions and When-Issued Securities. During the period, the Fund transacted in securities on a delayed delivery or when-issued basis. Payment and delivery may take place after the customary settlement period for that security. The price of the underlying securities and the date when the securities will be delivered and paid for are fixed at the time the transaction is negotiated. The securities purchased on a delayed delivery or when-issued basis are identified as such in the Fund's Schedule of Investments. The Fund may receive compensation for interest forgone in the purchase of a delayed delivery or when-issued security. With respect to purchase commitments, the Fund identifies securities as segregated in its records with a value at least equal to the amount of the commitment. Losses may arise due to changes in the value of the underlying securities or if the counterparty does not perform under the contract's terms, or if the issuer does not issue the securities due to political, economic, or other factors.
Restricted Securities. The Fund may invest in securities that are subject to legal or contractual restrictions on resale. These securities generally may be resold in transactions exempt from registration or to the public if the securities are registered. Disposal of these securities may involve time-consuming negotiations and expense, and prompt sale at an acceptable price may be difficult. Information regarding restricted securities is included at the end of the Fund's Schedule of Investments.
Loans and Other Direct Debt Instruments. The Fund invests in direct debt instruments which are interests in amounts owed to lenders by corporate or other borrowers. These instruments may be in the form of loans, trade claims or other receivables and may include standby financing commitments such as revolving credit facilities that obligate the Fund to supply additional cash to the borrower on demand. Loans may be acquired through assignment or participation. The Fund also invests in unfunded loan commitments, which are contractual obligations for future funding. Information regarding unfunded commitments is included at the end of the Fund's Schedule of Investments.
3. Derivative Instruments.
Risk Exposures and the Use of Derivative Instruments. The Fund's investment objective allows the Fund to enter into various types of derivative contracts, including swaps. Derivatives are investments whose value is primarily derived from underlying assets, indices or reference rates and may be transacted on an exchange or over-the-counter (OTC). Derivatives may involve a future commitment to buy or sell a specified asset based on specified terms, to exchange future cash flows at periodic intervals based on a notional principal amount, or for one party to make one or more payments upon the occurrence of specified events in exchange for periodic payments from the other party.
The Fund used derivatives to increase returns, to gain exposure to certain types of assets and to manage exposure to certain risks as defined below. The success of any strategy involving derivatives depends on analysis of numerous economic factors, and if the strategies for investment do not work as intended, the Fund may not achieve its objectives.
The Fund's use of derivatives increased or decreased its exposure to the following risk:
| Credit Risk | Credit risk relates to the ability of the issuer of a financial instrument to make further principal or interest payments on an obligation or commitment that it has to the Fund. |
The Fund is also exposed to additional risks from investing in derivatives, such as liquidity risk and counterparty credit risk. Liquidity risk is the risk that the Fund will be unable to close out the derivative in the open market in a timely manner. Counterparty credit risk is the risk that the counterparty will not be able to fulfill its obligation to the Fund. Counterparty credit risk related to centrally cleared OTC swaps may be mitigated by the protection provided by the clearinghouse.
Investing in derivatives may involve greater risks than investing in the underlying assets directly and, to varying degrees, may involve risk of loss in excess of any initial investment and collateral received and amounts recognized in the Statement of Assets and Liabilities. In addition, there may be the risk that the change in value of the derivative contract does not correspond to the change in value of the underlying instrument.
Swaps. A swap is a contract between two parties to exchange future cash flows at periodic intervals based on a notional principal amount. A centrally cleared OTC swap is a transaction executed between a fund and a dealer counterparty, then cleared by a futures commission merchant (FCM) through a clearinghouse. Once cleared, the clearinghouse serves as a central counterparty, with whom a fund exchanges cash flows for the life of the transaction, similar to transactions in futures contracts.
Centrally cleared OTC swaps require a fund to deposit either cash or securities (initial margin) with the FCM, at the instruction of and for the benefit of the clearinghouse. Centrally cleared OTC swaps are marked-to-market daily and subsequent payments (variation margin) are made or received depending on the daily fluctuations in the value of the swaps and are recorded as unrealized appreciation or (depreciation). These daily payments, if any, are included in receivable or payable for daily variation margin on centrally cleared OTC swaps in the Statement of Assets and Liabilities. Any premiums for centrally cleared OTC swaps are recorded periodically throughout the term of the swap to variation margin and included in unrealized appreciation (depreciation) in the Statement of Assets and Liabilities. Any premiums are recognized as realized gain (loss) upon termination or maturity of the swap.
Payments are exchanged at specified intervals, accrued daily commencing with the effective date of the contract and recorded as realized gain or (loss). Some swaps may be terminated prior to the effective date and realize a gain or loss upon termination. The net realized gain (loss) and change in net unrealized appreciation (depreciation) on swaps during the period is presented in the Statement of Operations.
Any open swaps at period end are included in the Schedule of Investments under the caption "Swaps" and are representative of volume of activity during the period.
Credit Default Swaps. Credit default swaps enable the Fund to buy or sell protection against specified credit events on a single-name issuer or a traded credit index. Under the terms of a credit default swap the buyer of protection (buyer) receives credit protection in exchange for making periodic payments to the seller of protection (seller) based on a fixed percentage applied to a notional principal amount. In return for these payments, the seller will be required to make a payment upon the occurrence of one or more specified credit events. The Fund enters into credit default swaps as a seller to gain credit exposure to an issuer and/or as a buyer to obtain a measure of protection against defaults of an issuer. Periodic payments are made over the life of the contract by the buyer provided that no credit event occurs.
For credit default swaps on most corporate and sovereign issuers, credit events include bankruptcy, failure to pay or repudiation/moratorium. For credit default swaps on corporate or sovereign issuers, the obligation that may be put to the seller is not limited to the specific reference obligation described in the Schedule of Investments. For credit default swaps on asset-backed securities, a credit event may be triggered by events such as failure to pay principal, maturity extension, rating downgrade or write-down. For credit default swaps on asset-backed securities, the reference obligation described represents the security that may be put to the seller. For credit default swaps on a traded credit index, a specified credit event may affect all or individual underlying securities included in the index.
As a seller, if an underlying credit event occurs, the Fund will pay a net settlement amount of cash equal to the notional amount of the swap less the recovery value of the reference obligation or underlying securities comprising an index. Only in the event of the industry's inability to value the underlying asset will the Fund be required to take delivery of the reference obligation or underlying securities comprising an index and pay an amount equal to the notional amount of the swap.
As a buyer, if an underlying credit event occurs, the Fund will receive a net settlement amount of cash equal to the notional amount of the swap less the recovery value of the reference obligation or underlying securities comprising an index. Only in the event of the industry's inability to value the underlying asset will the Fund be required to deliver the reference obligation or underlying securities comprising an index in exchange for payment of an amount equal to the notional amount of the swap.
Typically, the value of each credit default swap and credit rating disclosed for each reference obligation in the Schedule of Investments, where the Fund is the seller, can be used as measures of the current payment/performance risk of the swap. As the value of the swap changes as a positive or negative percentage of the total notional amount, the payment/performance risk may decrease or increase, respectively. In addition to these measures, the investment adviser monitors a variety of factors including cash flow assumptions, market activity and market sentiment as part of its ongoing process of assessing payment/performance risk.
4. Purchases and Sales of Investments.
Purchases and sales of securities, other than short-term securities, are noted in the table below.
| Purchases ($) | Sales ($) | |
| Strategic Advisers Income Opportunities Fund | 897,914,971 | 1,520,368,050 |
5. Fees and Other Transactions with Affiliates.
Management Fee. Strategic Advisers (the investment adviser) provides the Fund with investment management related services. For these services, the Fund pays a monthly management fee to the investment adviser. The management fee is calculated by adding the annual management fee rate of .25% of the Fund's average net assets throughout the month payable to the investment adviser to the aggregate of the fee rates, payable monthly, to the Fund's sub-advisers. The Fund's maximum aggregate management fee will not exceed .75% of the Fund's average net assets. For the reporting period, the total annual management fee rate was .32% of the Fund's average net assets.
During the period, the investment adviser waived a portion of its management fee as described in the Expense Reductions note.
Sub-Adviser. FIAM LLC (an affiliate of the investment adviser) and PGIM, Inc. each served as a sub-adviser for the Fund during the period. Sub-advisers provide discretionary investment advisory services for their allocated portion of the Fund's assets and are paid by the investment adviser and not the Fund for providing these services.
Accounting Fees. Fidelity Service Company, Inc. (FSC), an affiliate of the investment adviser, maintains the Fund's accounting records. The accounting fee is based on the level of average net assets for each month. Effective July 1, 2019 accounting fees are not paid by the Fund and are instead paid by the investment adviser or an affiliate. For the period, the fees were equivalent to .01%.
Interfund Trades. Funds may purchase from or sell securities to other Fidelity Funds under procedures adopted by the Board. The procedures have been designed to ensure these interfund trades are executed in accordance with Rule 17a-7 of the 1940 Act. Interfund trades are included within the respective purchases and sales amounts shown in the Purchases and Sales of Investments note.
6. Investments in Fidelity Central Funds.
The Fund invests in Fidelity Central Funds, which are open-end investment companies available only to other investment companies and accounts managed by the investment adviser and its affiliates. The Fund's Schedule of Investments lists each of the Fidelity Central Funds held as of period end, if any, as an investment of the Fund, but does not include the underlying holdings of each Fidelity Central Fund. As an Investing Fund, the Fund indirectly bears its proportionate share of the expenses of the underlying Fidelity Central Funds.
The Fidelity Money Market Central Funds are managed by FMR. Annualized expenses of the Money Market Central Funds as of their most recent shareholder report date ranged from less than .005% to .01%.
A complete unaudited list of holdings for each Fidelity Central Fund is available upon request or at the Securities and Exchange Commission (the SEC) website at www.sec.gov. In addition, the financial statements of the Fidelity Central Funds, which are not covered by the Fund's Report of Independent Registered Public Accounting Firm, are available on the SEC website or upon request.
7. Committed Line of Credit.
Certain Funds participate with other funds managed by the investment adviser or an affiliate in a $4.25 billion credit facility (the "line of credit") to be utilized for temporary or emergency purposes to fund shareholder redemptions or for other short-term liquidity purposes. The participating funds have agreed to pay commitment fees on their pro-rata portion of the line of credit, which are reflected in Miscellaneous expenses on the Statement of Operations, and are as follows:
| Amount | |
| Strategic Advisers Income Opportunities Fund | $6,102 |
During the period, there were no borrowings on this line of credit.
8. Expense Reductions.
The investment adviser has contractually agreed to waive the Fund's management fee in an amount equal to .25% of the Fund's average net assets until September 30, 2022. During the period, this waiver reduced the Fund's management fee by $5,717,643.
In addition, through arrangements with the Fund's custodian and transfer agent, credits realized as a result of certain uninvested cash balances were used to reduce the Fund's expenses by $1,616 and $143, respectively.
9. Other.
The Fund's organizational documents provide former and current trustees and officers with a limited indemnification against liabilities arising in connection with the performance of their duties to the Fund. In the normal course of business, the Fund may also enter into contracts that provide general indemnifications. The Fund's maximum exposure under these arrangements is unknown as this would be dependent on future claims that may be made against the Fund. The risk of material loss from such claims is considered remote.
10. Coronavirus (Covid-19) Pandemic.
An outbreak of COVID-19 first detected in China during December 2019 has since spread globally and was declared a pandemic by the World Health Organization during March 2020. Developments that disrupt global economies and financial markets, such as the COVID-19 pandemic, may magnify factors that affect the Fund's performance.
Report of Independent Registered Public Accounting Firm
To the Board of Trustees of Fidelity Rutland Square Trust II and Shareholders of Strategic Advisers Income Opportunities Fund
Opinion on the Financial Statements
We have audited the accompanying statement of assets and liabilities, including the schedule of investments, of Strategic Advisers Income Opportunities Fund (one of the funds constituting Fidelity Rutland Square Trust II, referred to hereafter as the “Fund”) as of February 29, 2020, the related statement of operations for the year ended February 29, 2020, the statement of changes in net assets for each of the two years in the period ended February 29, 2020, including the related notes, and the financial highlights for each of the five years in the period ended February 29, 2020 (collectively referred to as the “financial statements”). In our opinion, the financial statements present fairly, in all material respects, the financial position of the Fund as of February 29, 2020, the results of its operations for the year then ended, the changes in its net assets for each of the two years in the period ended February 29, 2020 and the financial highlights for each of the five years in the period ended February 29, 2020 in conformity with accounting principles generally accepted in the United States of America.
Basis for Opinion
These financial statements are the responsibility of the Fund’s management. Our responsibility is to express an opinion on the Fund’s financial statements based on our audits. We are a public accounting firm registered with the Public Company Accounting Oversight Board (United States) (PCAOB) and are required to be independent with respect to the Fund in accordance with the U.S. federal securities laws and the applicable rules and regulations of the Securities and Exchange Commission and the PCAOB.
We conducted our audits of these financial statements in accordance with the standards of the PCAOB. Those standards require that we plan and perform the audit to obtain reasonable assurance about whether the financial statements are free of material misstatement, whether due to error or fraud.
Our audits included performing procedures to assess the risks of material misstatement of the financial statements, whether due to error or fraud, and performing procedures that respond to those risks. Such procedures included examining, on a test basis, evidence regarding the amounts and disclosures in the financial statements. Our audits also included evaluating the accounting principles used and significant estimates made by management, as well as evaluating the overall presentation of the financial statements. Our procedures included confirmation of securities owned as of February 29, 2020 by correspondence with the custodian, agent banks and brokers; when replies were not received from brokers, we performed other auditing procedures. We believe that our audits provide a reasonable basis for our opinion.
PricewaterhouseCoopers LLP
Boston, Massachusetts
April 15, 2020
We have served as the auditor of one or more investment companies in the Fidelity group of funds since 1932.
Trustees and Officers
The Trustees, Members of the Advisory Board (if any), and officers of the trust and fund, as applicable, are listed below. The Board of Trustees governs the fund and is responsible for protecting the interests of shareholders. The Trustees are experienced executives who meet periodically throughout the year to oversee the fund's activities, review contractual arrangements with companies that provide services to the fund, oversee management of the risks associated with such activities and contractual arrangements, and review the fund's performance. If the interests of the fund and an underlying Fidelity® fund were to diverge, a conflict of interest could arise and affect how the Trustees and Members of the Advisory Board fulfill their fiduciary duties to the affected funds. Strategic Advisers has structured the fund to avoid these potential conflicts, although there may be situations where a conflict of interest is unavoidable. In such instances, Strategic Advisers, the Trustees, and Members of the Advisory Board would take reasonable steps to minimize and, if possible, eliminate the conflict. Each of the Trustees oversees 14 funds.
The Trustees hold office without limit in time except that (a) any Trustee may resign; (b) any Trustee may be removed by written instrument, signed by at least two-thirds of the number of Trustees prior to such removal; (c) any Trustee who requests to be retired or who has become incapacitated by illness or injury may be retired by written instrument signed by a majority of the other Trustees; and (d) any Trustee may be removed at any special meeting of shareholders by a two-thirds vote of the outstanding voting securities of the trust. Officers and Advisory Board Members hold office without limit in time, except that any officer or Advisory Board Member may resign or may be removed by a vote of a majority of the Trustees at any regular meeting or any special meeting of the Trustees. Except as indicated, each individual has held the office shown or other offices in the same company for the past five years.
Each Trustee who is not an interested person (as defined in the 1940 Act) of the trust and the fund is referred to herein as an Independent Trustee.
The fund’s Statement of Additional Information (SAI) includes more information about the Trustees. To request a free copy, call Fidelity at 1-800-544-3455.
Experience, Skills, Attributes, and Qualifications of the Trustees. The Governance and Nominating Committee has adopted a statement of policy that describes the experience, qualifications, attributes, and skills that are necessary and desirable for potential Independent Trustee candidates (Statement of Policy). The Board believes that each Trustee satisfied at the time he or she was initially elected or appointed a Trustee, and continues to satisfy, the standards contemplated by the Statement of Policy. The Governance and Nominating Committee may also engage professional search firms to help identify potential Independent Trustee candidates with experience, qualifications, attributes, and skills consistent with the Statement of Policy. Additional criteria based on the composition and skills of the current Independent Trustees, as well as experience or skills that may be appropriate in light of future changes to board composition, business conditions, and regulatory or other developments, may be considered by the professional search firms and the Governance and Nominating Committee. In addition, the Board takes into account the Trustees' commitment and participation in Board and committee meetings, as well as their leadership of standing and ad hoc committees throughout their tenure.
In determining that a particular Trustee was and continues to be qualified to serve as a Trustee, the Board has considered a variety of criteria, none of which, in isolation, was controlling. The Board believes that, collectively, the Trustees have balanced and diverse experience, qualifications, attributes, and skills, which allow the Board to operate effectively in governing the fund and protecting the interests of shareholders. Information about the specific experience, skills, attributes, and qualifications of each Trustee, which in each case led to the Board's conclusion that the Trustee should serve (or continue to serve) as a trustee of the fund, is provided below.
Board Structure and Oversight Function. Robert A. Lawrence is an interested person and currently serves as Chairman. The Trustees have determined that an interested Chairman is appropriate and benefits shareholders because an interested Chairman has a personal and professional stake in the quality and continuity of services provided to the fund. Independent Trustees exercise their informed business judgment to appoint an individual of their choosing to serve as Chairman, regardless of whether the Trustee happens to be independent or a member of management. The Independent Trustees have determined that they can act independently and effectively without having an Independent Trustee serve as Chairman and that a key structural component for assuring that they are in a position to do so is for the Independent Trustees to constitute a substantial majority for the Board. The Independent Trustees also regularly meet in executive session. Mary C. Farrell serves as the lead Independent Trustee and as such (i) acts as a liaison between the Independent Trustees and management with respect to matters important to the Independent Trustees and (ii) with management prepares agendas for Board meetings.
Fidelity® funds are overseen by different Boards of Trustees. The fund's Board oversees asset allocation funds. Other Boards oversee Fidelity's investment-grade bond, money market, and asset allocation funds, and Fidelity's equity and high income funds. The fund may invest in Fidelity® funds overseen by such other Boards. The use of separate Boards, each with its own committee structure, allows the Trustees of each group of Fidelity® funds to focus on the unique issues of the funds they oversee, including common research, investment, and operational issues.
The Trustees primarily operate as a full Board, but also operate in committees, to facilitate the timely and efficient consideration of all matters of importance to the Trustees, the fund, and fund shareholders and to facilitate compliance with legal and regulatory requirements and oversight of the fund's activities and associated risks. The Board has charged Strategic Advisers and its affiliates with (i) identifying events or circumstances the occurrence of which could have demonstrably adverse effects on the fund's business and/or reputation; (ii) implementing processes and controls to lessen the possibility that such events or circumstances occur or to mitigate the effects of such events or circumstances if they do occur; and (iii) creating and maintaining a system designed to evaluate continuously business and market conditions in order to facilitate the identification and implementation processes described in (i) and (ii) above. Because the day-to-day operations and activities of the fund are carried out by or through Strategic Advisers, its affiliates and other service providers, the fund's exposure to risks is mitigated but not eliminated by the processes overseen by the Trustees. Board oversight of different aspects of the fund's activities is exercised primarily through the full Board, but also through the Audit and Compliance Committee. Appropriate personnel, including but not limited to the fund's Chief Compliance Officer (CCO), FMR's internal auditor, the independent accountants, the fund's Treasurer and portfolio management personnel, make periodic reports to the Board's committees, as appropriate. The responsibilities of each standing committee, including their oversight responsibilities, are described further under "Standing Committees of the Trustees."
Interested Trustees*:
Correspondence intended for a Trustee who is an interested person may be sent to Fidelity Investments, 245 Summer Street, Boston, Massachusetts 02210.
Name, Year of Birth; Principal Occupations and Other Relevant Experience+
Brian B. Hogan (1964)
Year of Election or Appointment: 2018
Trustee
Mr. Hogan also serves as Trustee of other funds. Mr. Hogan serves as Head of Fidelity Investments’ Investment Solutions and Innovation organization (2018-present), and a Director of Strategic Advisers LLC (2018-present). Previously, Mr. Hogan served as a Director of Fidelity SelectCo, LLC (investment adviser firm, 2014-2019), President of FMR Co., Inc. (2009-2018), a Vice President of Fidelity's Equity and High Income funds (2009-2018), a Director of FMR Investment Management (UK) Limited (investment adviser firm, 2015-2018), Trustee of certain Fidelity® funds (2014-2018), President of the Equity Division of Fidelity Management & Research Company (investment adviser firm, 2009-2018), Senior Vice President, Equity Research of Fidelity Management & Research Company (2006-2009), and as a portfolio manager. Mr. Brian B. Hogan is not related to Mr. Colm A. Hogan.
Robert A. Lawrence (1952)
Year of Election or Appointment: 2016
Trustee
Chairman of the Board of Trustees
Mr. Lawrence also serves as Trustee of other funds. Previously, Mr. Lawrence served as a Member of the Advisory Board of certain funds. Prior to his retirement in 2008, Mr. Lawrence served as Vice President of certain Fidelity® funds (2006-2008), Senior Vice President, Head of High Income Division of Fidelity Management & Research Company (investment adviser firm, 2006-2008), and President of Fidelity Strategic Investments (investment adviser firm, 2002-2005).
* Determined to be an "Interested Trustee" by virtue of, among other things, his or her affiliation with the trust or various entities under common control with Strategic Advisers.
+ The information includes the Trustee's principal occupation during the last five years and other information relating to the experience, attributes, and skills relevant to the Trustee's qualifications to serve as a Trustee, which led to the conclusion that the Trustee should serve as a Trustee for the fund.
Independent Trustees:
Correspondence intended for an Independent Trustee may be sent to Fidelity Investments, P.O. Box 55235, Boston, Massachusetts 02205-5235.
Name, Year of Birth; Principal Occupations and Other Relevant Experience+
Peter C. Aldrich (1944)
Year of Election or Appointment: 2006
Trustee
Mr. Aldrich also serves as Trustee of other funds. Mr. Aldrich is a Director of the National Bureau of Economic Research, a Director of the funds of BlackRock Realty Group (2006-present), and a Director of LivelyHood, Inc. (private corporation, 2013-present). Previously, Mr. Aldrich served as a Trustee for the Fidelity Rutland Square Trust (2005-2010), a Managing Member of Poseidon, LLC (foreign private investment, 1998-2004), and Chairman and Managing Member of AEGIS, LLC (foreign private investment, 1997-2004). Mr. Aldrich previously was a founder, Chief Executive Officer, and Chairman of AEW Capital Management, L.P. (then “Aldrich, Eastman and Waltch, L.P.”). Mr. Aldrich also served as a Director of Zipcar, Inc. (car sharing services, 2001-2009) and as Faculty Chairman of The Research Council on Global Investment of The Conference Board (business and professional education non-profit, 1999-2004). Mr. Aldrich is a Member Emeritus of the Board of Trustees of the Museum of Fine Arts Boston and an Overseer of the Massachusetts Eye and Ear Infirmary.
Ralph F. Cox (1932)
Year of Election or Appointment: 2006
Trustee
Mr. Cox also serves as Trustee of other funds. Mr. Cox is President of RABAR Enterprises (management consulting for the petroleum industry). Mr. Cox is a Director of Abraxas Petroleum (exploration and production, 1999-present). Mr. Cox is a member of the Advisory Boards of the Business and Engineering Schools of Texas A&M University and the Engineering School of University of Texas at Austin. Previously, Mr. Cox served as a Trustee for the Fidelity Rutland Square Trust (2005-2010) and as an Advisory Director of CH2M Hill Companies (engineering, 1981-2011). Mr. Ralph F. Cox and Mr. Howard E. Cox, Jr. are not related.
Mary C. Farrell (1949)
Year of Election or Appointment: 2013
Trustee
Ms. Farrell also serves as Trustee of other funds. Ms. Farrell is a Director of the W.R. Berkley Corporation (insurance provider) and President (2009-present) and Director (2006-present) of the Howard Gilman Foundation (charitable organization). Previously, Ms. Farrell was Managing Director and Chief Investment Strategist at UBS Wealth Management USA and Co-Head of UBS Wealth Management Investment Strategy & Research Group (2003-2005). Ms. Farrell also served as Investment Strategist at PaineWebber (1982-2000) and UBS PaineWebber (2000-2002). Ms. Farrell serves as Chairman of the Board of Trustees of Yale-New Haven Hospital and on the Yale New Haven Health System Board and previously served as Trustee on the Board of Overseers of the New York University Stern School of Business.
Karen Kaplan (1960)
Year of Election or Appointment: 2006
Trustee
Ms. Kaplan also serves as Trustee of other funds. Ms. Kaplan is Chairman (2014-present) and Chief Executive Officer (2013-present) of Hill Holliday (advertising and specialized marketing). Ms. Kaplan is a Director of The Michaels Companies, Inc. (specialty retailer, 2015-present), Member of the Board of Governors of the Chief Executives’ Club of Boston (2010-present), Member of the Executive Committee of the Greater Boston Chamber of Commerce (2006-present), Advisory Board Member of the National Association of Corporate Directors Chapter (2012-present), Member of the Board of Trustees of the Post Office Square Trust (2012-present), Trustee of the Brigham and Women’s Hospital (2016-present), Overseer of the Boston Symphony Orchestra (2014-present), Member of the Board of Directors of The Advertising Council, Inc. (2016-present), and Member of the Ron Burton Training Village Executive Board of Advisors (2018-present). Previously, Ms. Kaplan served as an Advisory Board Member of Fidelity Rutland Square Trust (2006-2010), a member of the Clinton Global Initiative (2010-2015), Director of DSM (dba Delta Dental and DentaQuest) (2004-2014), Formal Appointee of the 2015 Baker-Polito Economic Development Council, Director of Vera Bradley Inc. (designer of women’s accessories, 2012-2015), Member of the Board of Directors of the Massachusetts Conference for Women (2008-2015), Member of the Board of Directors of Jobs for Massachusetts (2012-2015), President of the Massachusetts Women’s Forum (2008-2010), Treasurer of the Massachusetts Women’s Forum (2002-2006), and Vice Chair of the Board of the Massachusetts Society for the Prevention of Cruelty to Children (2003-2010).
Heidi L. Steiger (1953)
Year of Election or Appointment: 2017
Trustee
Ms. Steiger also serves as Trustee of other funds. Ms. Steiger serves as a member of the Global Advisory Board and Of Counsel to Signum Global Advisors (international policy and strategy, 2018-present), a guest lecturer in the joint degree program in Global Luxury Management at North Carolina State University (Raleigh, NC) and Skema (Paris) (2018-present), Managing Partner of Topridge Associates, LLC (consulting, 2005-present), a Non-Executive Director of CrowdBureau Corporation (financial technology company and index provider, 2018-present), and a member of the Board of Directors (2013-present) and Chair of the Audit Committee and member of the Membership and Executive Committees (2017-present) of Business Executives for National Security (nonprofit). Previously, Ms. Steiger served as Eastern Region President of The Private Client Reserve of U.S. Bancorp (banking and financial services, 2010-2015), Advisory Director of Berkshire Capital Securities, LLC (financial services, 2009-2010), President and Senior Advisor of Lowenhaupt Global Advisors, LLC (financial services, 2005-2007), and President and Contributing Editor of Worth Magazine (2004-2005) and held a variety of positions at Neuberger Berman Group, LLC (financial services, 1986-2004), including Partner and Executive Vice President and Global Head of Private Asset Management at Neuberger Berman (1999-2004). Ms. Steiger also served as a member of the Board of Directors of Nuclear Electric Insurance Ltd (insurer of nuclear utilities, 2006-2017), a member of the Board of Trustees and Audit Committee of the Eaton Vance Funds (2007-2010), a member of the Board of Directors of Aviva USA (formerly AmerUs) (insurance, 2004-2014), and a member of the Board of Trustees and Audit Committee and Chair of the Investment Committee of CIFG (financial guaranty insurance, 2009-2012), and a member of the Board of Directors of Kin Group Plc (formerly, Fitbug Holdings) (health and technology, 2016-2017).
+ The information includes the Trustee's principal occupation during the last five years and other information relating to the experience, attributes, and skills relevant to the Trustee's qualifications to serve as a Trustee, which led to the conclusion that the Trustee should serve as a Trustee for the fund.
Advisory Board Members and Officers:
Correspondence intended for an officer or Howard E. Cox, Jr. may be sent to Fidelity Investments, 245 Summer Street, Boston, Massachusetts 02210. Officers appear below in alphabetical order.
Name, Year of Birth; Principal Occupation
Howard E. Cox, Jr. (1944)
Year of Election or Appointment: 2009
Member of the Advisory Board
Mr. Cox also serves as Member of the Advisory Board of other funds. Mr. Cox is a Partner of Greylock (venture capital, 1971-present) and a Director of Stryker Corporation (medical products and services, 1974-present). Previously, Mr. Cox served as an Advisory Board Member of Fidelity Rutland Square Trust (2006-2010). Mr. Cox also serves as a Member of the Secretary of Defense's Business Board of Directors (2008-present), a Director of Business Executives for National Security (1997-present), a Director of the Brookings Institution (2010-present), a Director of the World Economic Forum’s Young Global Leaders Foundation (2009-present), and is a Member of the Harvard Medical School Board of Fellows (2002-present). Mr. Howard E. Cox, Jr. and Mr. Ralph F. Cox are not related.
Christine Marcks (1955)
Year of Election or Appointment: 2019
Member of the Advisory Board
Ms. Marcks also serves as Member of the Advisory Board of other Funds. Prior to her retirement, Ms. Marcks served as Chief Executive Officer and President – Prudential Retirement (2007-2017) and Vice President for Rollover and Retirement Income Strategies (2005-2007), Prudential Financial, Inc. (financial services). Previously, Ms. Marcks was Senior Vice President and Head of Financial Horizons (2002-2004) and Vice President, Strategic Marketing (2000-2002) of Voya Financial (formerly ING U.S.) (financial services), held numerous positions at Aetna Financial Services (financial services, 1987-2000) and served as an International Economist for the United States Department of the Treasury (1980-1987). Ms. Marcks also serves as a member of the Board of Trustees, Audit Committee and Benefits & Operations Committee of the YMCA Retirement Fund (2018-present), a non-profit organization providing retirement plan benefits to YMCA staff members, and as a member of the Board of Trustees of Assumption College (2019-present).
Elizabeth Paige Baumann (1968)
Year of Election or Appointment: 2017
Anti-Money Laundering (AML) Officer
Ms. Baumann also serves as AML Officer of other funds. She is Chief AML Officer (2012-present) and Senior Vice President (2014-present) of FMR LLC (diversified financial services company) and is an employee of Fidelity Investments. Previously, Ms. Baumann served as AML Officer of certain funds (2017-2019), as AML Officer of the funds (2012-2016), and Vice President (2007-2014) and Deputy Anti-Money Laundering Officer (2007-2012) of FMR LLC.
Craig S. Brown (1977)
Year of Election or Appointment: 2019
Assistant Treasurer
Mr. Brown also serves as Assistant Treasurer of other funds. Mr. Brown is an employee of Fidelity Investments (2013-present).
John J. Burke III (1964)
Year of Election or Appointment: 2018
Chief Financial Officer
Mr. Burke also serves as Chief Financial Officer of other funds. Mr. Burke serves as Head of Investment Operations for Fidelity Fund and Investment Operations (2018-present) and is an employee of Fidelity Investments (1998-present). Previously Mr. Burke served as head of Asset Management Investment Operations (2012-2018).
Jonathan Davis (1968)
Year of Election or Appointment: 2010
Assistant Treasurer
Mr. Davis also serves as Assistant Treasurer of other funds. Mr. Davis serves as Assistant Treasurer of FMR Capital, Inc. (2017-present) and is an employee of Fidelity Investments. Previously, Mr. Davis served as Vice President and Associate General Counsel of FMR LLC (diversified financial services company, 2003-2010).
Laura M. Del Prato (1964)
Year of Election or Appointment: 2018
Assistant Treasurer
Ms. Del Prato also serves as an officer of other funds. Ms. Del Prato is an employee of Fidelity Investments (2017-present). Prior to joining Fidelity Investments, Ms. Del Prato served as a Managing Director and Treasurer of the JPMorgan Mutual Funds (2014-2017). Prior to JPMorgan, Ms. Del Prato served as a partner at Cohen Fund Audit Services (accounting firm, 2012-2013) and KPMG LLP (accounting firm, 2004-2012).
James D. Gryglewicz (1972)
Year of Election or Appointment: 2015
Chief Compliance Officer
Mr. Gryglewicz also serves as Chief Compliance Officer of other funds. Mr. Gryglewicz serves as Compliance Officer of Strategic Advisers LLC (investment adviser firm, 2015-present), Senior Vice President of Asset Management Compliance (2009-present), and is an employee of Fidelity Investments (2004-present). Previously, Mr. Gryglewicz served as Compliance Officer of Fidelity SelectCo, LLC (investment adviser firm, 2014-2019), and as Chief Compliance Officer of certain Fidelity® funds (2014-2018).
Colm A. Hogan (1973)
Year of Election or Appointment: 2016
Assistant Treasurer
Mr. Hogan also serves as an officer of other funds. Mr. Hogan serves as Assistant Treasurer of FMR Capital, Inc. (2017-present) and is an employee of Fidelity Investments (2005-present). Previously, Mr. Hogan served as Deputy Treasurer of certain Fidelity® funds (2016-2020) and Assistant Treasurer of certain Fidelity® funds (2016-2018). Mr. Colm A. Hogan is not related to Mr. Brian B. Hogan.
Christina H. Lee (1975)
Year of Election or Appointment: 2020
Secretary and Chief Legal Officer
Ms. Lee also serves as Secretary and CLO of other funds. Ms. Lee serves as Vice President, Associate General Counsel (2014-present) and is an employee of Fidelity Investments (2007-present). Previously, Ms. Lee served as Assistant Secretary of certain funds (2018-2019).
Cynthia Lo Bessette (1969)
Year of Election or Appointment: 2020
Assistant Secretary
Ms. Lo Bessette also serves as an officer of other funds. Ms. Lo Bessette serves as CLO, Secretary, and Senior Vice President of Fidelity Management & Research Company LLC (investment adviser firm, 2019-present); and CLO of Fidelity Management & Research (Hong Kong) Limited, FMR Investment Management (UK) Limited, and Fidelity Management & Research (Japan) Limited (investment adviser firms, 2019-present). She is a Senior Vice President and Deputy General Counsel of FMR LLC (diversified financial services company, 2019-present), and is an employee of Fidelity Investments. Previously, Ms. Lo Bessette served as CLO, Secretary, and Senior Vice President of FMR Co., Inc. (investment adviser firm, 2019); Secretary of Fidelity SelectCo, LLC and Fidelity Investments Money Management, Inc. (investment adviser firms, 2019). Prior to joining Fidelity Investments, Ms. Lo Bessette was Executive Vice President, General Counsel (2016-2019) and Senior Vice President, Deputy General Counsel (2015-2016) of OppenheimerFunds (investment management company) and Deputy Chief Legal Officer (2013-2015) of Jennison Associates LLC (investment adviser firm).
Chris Maher (1972)
Year of Election or Appointment: 2016
Assistant Treasurer
Mr. Maher also serves as an officer of other funds. Mr. Maher serves as Assistant Treasurer of FMR Capital, Inc. (2017-present), and is an employee of Fidelity Investments (2008-present). Previously, Mr. Maher served as Assistant Treasurer of certain funds (2013-2020); Vice President of Asset Management Compliance (2013), Vice President of the Program Management Group of FMR (investment adviser firm, 2010-2013), and Vice President of Valuation Oversight (2008-2010).
Stacie M. Smith (1974)
Year of Election or Appointment: 2020
President and Treasurer
Ms. Smith also serves as an officer of other funds. Ms. Smith serves as Assistant Treasurer of FMR Capital, Inc. (2017-present), is an employee of Fidelity Investments (2009-present), and has served in other fund officer roles. Prior to joining Fidelity Investments, Ms. Smith served as Senior Audit Manager of Ernst & Young LLP (accounting firm, 1996-2009). Previously, Ms. Smith served as Assistant Treasurer (2013-2019) and Deputy Treasurer (2013-2016) of certain Fidelity® funds.
Marc L. Spector (1972)
Year of Election or Appointment: 2016
Assistant Treasurer
Mr. Spector also serves as an officer of other funds. Mr. Spector serves as Assistant Treasurer of FMR Capital, Inc. (2017-present) and is an employee of Fidelity Investments (2016-present). Prior to joining Fidelity Investments, Mr. Spector served as Director at the Siegfried Group (accounting firm, 2013-2016), and prior to Siegfried Group as audit senior manager at Deloitte & Touche LLP (accounting firm, 2005-2013).
Jim Wegmann (1979)
Year of Election or Appointment: 2019
Assistant Treasurer
Mr. Wegmann also serves as Assistant Treasurer of other funds. Mr. Wegmann is an employee of Fidelity Investments (2011-present).
Shareholder Expense Example
As a shareholder of the Fund, you incur two types of costs: (1) transaction costs and (2) ongoing costs, including management fees and other Fund expenses. This Example is intended to help you understand your ongoing costs (in dollars) of investing in the Fund and to compare these costs with the ongoing costs of investing in other mutual funds.
The Example is based on an investment of $1,000 invested at the beginning of the period and held for the entire period (September 1, 2019 to February 29, 2020).
Actual Expenses
The first line of the accompanying table provides information about actual account values and actual expenses. You may use the information in this line, together with the amount you invested, to estimate the expenses that you paid over the period. Simply divide your account value by $1,000.00 (for example, an $8,600 account value divided by $1,000.00 = 8.6), then multiply the result by the number in the first line under the heading entitled "Expenses Paid During Period" to estimate the expenses you paid on your account during this period. In addition to the direct expenses incurred by the Fund presented in the table, as a shareholder of the underlying mutual funds (the Underlying Funds), the Fund also indirectly bears its proportionate share of the expenses of the Underlying Funds. In addition, the Fund, as a shareholder in the underlying Fidelity Central Funds, will indirectly bear its pro-rata share of the fees and expenses incurred by the underlying Fidelity Central Funds. These fees and expenses are not included in the Fund's annualized expense ratio used to calculate the expense estimate in the table below.
Hypothetical Example for Comparison Purposes
The second line of the accompanying table provides information about hypothetical account values and hypothetical expenses based on the Fund's actual expense ratio and an assumed rate of return of 5% per year before expenses, which is not the Fund's actual return. The hypothetical account values and expenses may not be used to estimate the actual ending account balance or expenses you paid for the period. You may use this information to compare the ongoing costs of investing in the Fund and other funds. To do so, compare this 5% hypothetical example with the 5% hypothetical examples that appear in the shareholder reports of the other funds. In addition to the direct expenses incurred by the Fund presented in the table, as a shareholder of the Underlying Funds, the Fund also indirectly bears its proportionate share of the expenses of the Underlying Funds. In addition, the Fund, as a shareholder in the underlying Fidelity Central Funds, will indirectly bear its pro-rata share of the fees and expenses incurred by the underlying Fidelity Central Funds. These fees and expenses are not included in the Fund's annualized expense ratio used to calculate the expense estimate in the table below.
Please note that the expenses shown in the table are meant to highlight your ongoing costs only and do not reflect any transaction costs. Therefore, the second line of the table is useful in comparing ongoing costs only, and will not help you determine the relative total costs of owning different funds.
| Annualized Expense Ratio-A | Beginning Account Value September 1, 2019 | Ending Account Value February 29, 2020 | Expenses Paid During Period-B September 1, 2019 to February 29, 2020 |
|
| Actual | .09% | $1,000.00 | $1,013.80 | $.45 |
| Hypothetical-C | $1,000.00 | $1,024.42 | $.45 |
A Annualized expense ratio reflects expenses net of applicable fee waivers.
B Expenses are equal to the Fund's annualized expense ratio, multiplied by the average account value over the period, multiplied by 182/366 (to reflect the one-half year period). The fees and expenses of the Underlying Funds in which the Fund invests are not included in the Fund's annualized expense ratio.
C 5% return per year before expenses
Distributions (Unaudited)
A total of 0.37% of the dividends distributed during the fiscal year was derived from interest on U.S. Government securities which is generally exempt from state income tax.
The fund will notify shareholders in January 2021 of amounts for use in preparing 2020 income tax returns.
Board Approval of Investment Advisory Contracts and Management Fees
Strategic Advisers Income Opportunities Fund
Each year, the Board of Trustees, including the Independent Trustees (together, the Board), votes at an in-person meeting on the renewal of the management contract with Strategic Advisers LLC (Strategic Advisers) and the sub-advisory agreement with FIAM LLC (the Sub-Adviser) (the Sub-Advisory Agreement and, together with the management contract, the Advisory Contracts) for the fund. Strategic Advisers and the Sub-Adviser are referred to herein as the Investment Advisers. The Board, assisted by the advice of fund counsel and Independent Trustees' counsel, requests and considers a broad range of information relevant to the renewal of the Advisory Contracts throughout the year.The Board meets at least four times per year and, at each of its meetings, covers an extensive agenda of topics and materials and considers factors that are relevant to its annual consideration of the renewal of the fund's Advisory Contracts, including the services and support provided to the fund and its shareholders. The full Board or the Independent Trustees, as appropriate, act on all major matters; however, a portion of the activities of the Board (including certain of those described herein) may be conducted through standing committees that have been established by the Board. The Board, acting directly and through its committees, requests and receives information concerning the annual consideration of the renewal of the fund's Advisory Contracts.At its September 2019 meeting, the Board, including the Independent Trustees, unanimously determined to renew the fund's Advisory Contracts. In reaching its determination to renew the fund's Advisory Contracts, the Board considered all factors it believed relevant, including (i) the nature, extent, and quality of the services provided to the fund and its shareholders (including the investment performance of the fund); (ii) the competitiveness of the fund's management fee and total expenses relative to peer funds; (iii) the total costs of the services provided by and the profits, if any, realized by Strategic Advisers from its relationships with the fund; and (iv) the extent to which, if any, economies of scale exist and are realized as the fund grows and whether any economies of scale are appropriately shared with fund shareholders.In considering whether to renew the Advisory Contracts for the fund, the Board reached a determination, with the assistance of fund counsel and Independent Trustees' counsel and through the exercise of its business judgment, that the renewal of the Advisory Contracts is in the best interests of the fund and its shareholders. In addition, with respect to the Sub-Advisory Agreement, the Board also concluded that the renewal of the agreement does not involve a conflict of interest from which Strategic Advisers or its affiliates derive an inappropriate advantage. Also, the Board found that the advisory fees charged under the Advisory Contracts bear a reasonable relationship to the services rendered and are based on services provided that are in addition to, rather than duplicative of, services provided under the advisory contract of any underlying fund in which the fund may invest. The Board's decision to renew the Advisory Contracts was not based on any single factor, but rather was based on a comprehensive consideration of all the information provided to the Board throughout the year. Nature, Extent, and Quality of Services Provided. The Board considered the staffing within the Investment Advisers, including the backgrounds of the fund's investment personnel and also considered the fund's investment objective, strategies, and related investment philosophy. The Independent Trustees also had discussions with senior management of Strategic Advisers' investment operations and investment groups. The Board considered the structure of each Investment Adviser's investment personnel compensation program and whether such structures provide appropriate incentives to act in the best interests of the fund.The Trustees also discussed with representatives of Strategic Advisers, at meetings throughout the year, Strategic Advisers' role in, among other things, (i) setting, implementing and monitoring the investment strategies for the funds; (ii) identifying and recommending sub-advisers for the funds; (iii) overseeing compliance with federal securities laws by each sub-adviser with respect to the portion of fund assets allocated to the sub-adviser; (iv) monitoring and overseeing the performance and investment capabilities of each sub-adviser; and (v) recommending the replacement of a sub-adviser as appropriate. The Trustees considered that the Board had received from Strategic Advisers substantial information and periodic reports about Strategic Advisers' sub-adviser oversight and due diligence processes, as well as periodic reports regarding the performance of each sub-adviser.The Board also considered the nature, extent and quality of services provided by the Sub-Adviser. The Trustees noted that under the Sub-Advisory Agreement subject to oversight by Strategic Advisers, the Sub-Adviser is responsible for, among other things, identifying investments for the portion of fund assets allocated to the Sub-Adviser, if any, and executing portfolio transactions to implement its investment strategy. In addition, the Trustees noted that the Sub-Adviser is responsible for providing such reporting as may be requested from Strategic Advisers to fulfill its oversight responsibilities discussed above. Resources Dedicated to Investment Management and Support Services. The Board reviewed the general qualifications and capabilities of the Investment Advisers' investment staffs, their use of technology, and the Investment Advisers' approach to managing and compensating investment personnel. The Board noted that the Investment Advisers' analysts have extensive resources, tools, and capabilities that allow them to conduct sophisticated quantitative and/or fundamental analysis. Additionally, in its deliberations, the Board considered the Investment Advisers' trading capabilities and resources and global compliance infrastructure, which are integral parts of the investment management process. Shareholder and Administrative Services. The Board considered (i) the nature, extent, quality, and cost of administrative and shareholder services performed by Strategic Advisers and its affiliates under the management contract and under separate agreements covering transfer agency and pricing and bookkeeping services for the fund; (ii) the nature and extent of Strategic Advisers' supervision of third party service providers, including sub-advisers, custodians and subcustodians; and (iii) the resources devoted to, and the record of compliance with, the fund's compliance policies and procedures. Investment Performance. The Board considered whether the fund has operated in accordance with its investment objective, as well as its record of compliance with its investment restrictions and its performance history.In connection with the renewal of the Advisory Contracts, the Board considered annualized return information for the fund for different time periods, measured against an appropriate securities market index ("benchmark index") and a peer group of mutual funds with similar objectives ("peer group").The Board considered discussions that occur at Board meetings throughout the year with representatives of Strategic Advisers about fund investment performance and the performance of the Sub-Adviser as part of regularly scheduled fund reviews and other reports to the Board on fund performance, taking into account various factors including general market conditions. In its discussions with representatives of Strategic Advisers regarding fund performance, the Board gave particular attention to information indicating underperformance of certain funds for specific time periods and discussed with Strategic Advisers the reasons for any such underperformance.The following charts considered by the Board show, over the one-, three-, and five-year periods ended December 31, 2018, the cumulative total returns of the fund and the cumulative total returns of an appropriate benchmark index and peer group. The box within each chart shows the 25th percentile return (75% beaten, top of box) and the 75th percentile return (25% beaten, bottom of box) of the peer group. Returns shown above the box are in the first quartile and returns shown below the box are in the fourth quartile. The percentage beaten number noted below each chart corresponds to the percentile box and represents the percentage of funds in the peer group whose performance was equal to or lower than that of the fund.Strategic Advisers Income Opportunities Fund
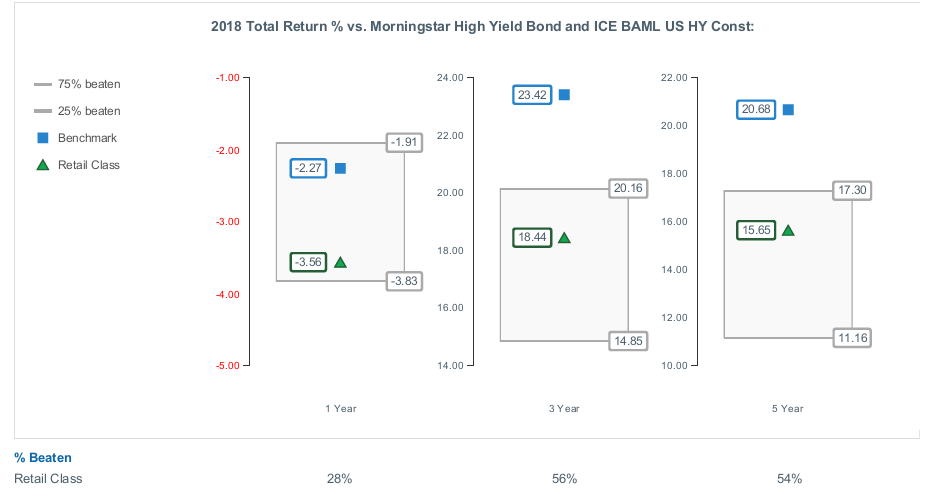
Strategic Advisers Income Opportunities Fund
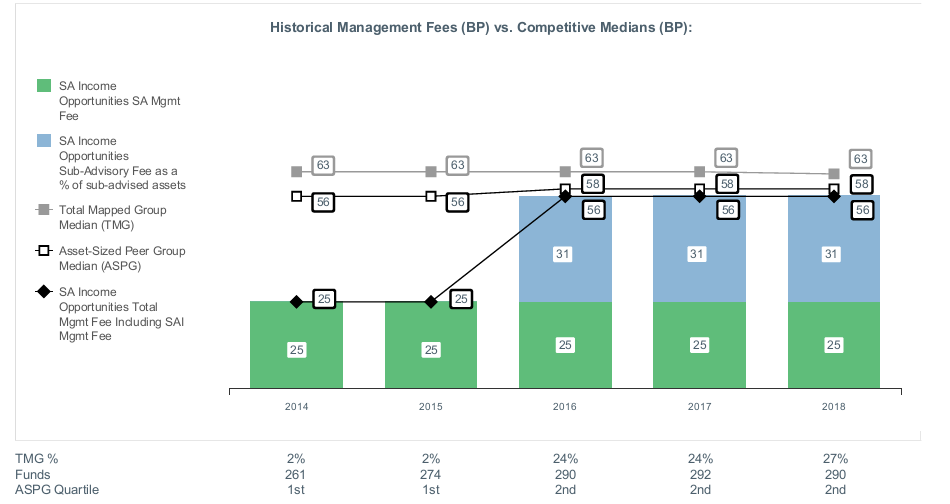
Board Approval of Investment Advisory Contracts and Management Fees
Strategic Advisers Income Opportunities Fund
On December 4, 2019, the Board of Trustees, including the Independent Trustees (together, the Board) voted at an in-person meeting to approve a sub-advisory agreement (the Sub-Advisory Agreement) with PGIM, Inc. (New Sub-Adviser) for the fund.The Board, assisted by the advice of fund counsel and Independent Trustees' counsel, considered a broad range of information it believed relevant to the approval of the Sub-Advisory Agreement.In considering whether to approve the Sub-Advisory Agreement, the Board reached a determination, with the assistance of fund counsel and Independent Trustees' counsel and through the exercise of its business judgment, that the approval of the Sub-Advisory Agreement is in the best interests of the fund and its shareholders and that the approval of such agreement does not involve a conflict of interest from which Strategic Advisers LLC (Strategic Advisers) or its affiliates derive an inappropriate advantage. Also, the Board found that the sub-advisory fees to be charged under the Sub-Advisory Agreement bear a reasonable relationship to the services to be rendered and will be based upon services provided that will be in addition to, rather than duplicative of services provided under the advisory contract of any underlying fund in which the fund may invest. The Board's decision to approve the Sub-Advisory Agreement was not based on any single factor, but rather was based on a comprehensive consideration of all the information provided to the Board. In addition, individual Trustees did not necessarily attribute the same weight or importance to each factor. Nature, Extent, and Quality of Services Provided. The Board considered the backgrounds of the investment personnel that will provide services to the fund, and also took into consideration the fund's investment objective, strategies and related investment philosophy and current sub-adviser line-up. The Board also considered the structure of the New Sub-Adviser's portfolio manager compensation program and whether this structure provides appropriate incentives to act in the best interests of the fund. The Board noted that it is familiar with the nature, extent and quality of services provided by the New Sub-Adviser from its oversight of the New Sub-Adviser on behalf of other funds overseen by the Board and that the same support staff, including compliance personnel, that currently provides services to other Strategic Advisers funds will also provide services to the fund. Resources Dedicated to Investment Management and Support Services. The Board reviewed the general qualifications and capabilities of the New Sub-Adviser's investment staff, its use of technology, and the New Sub-Adviser's approach to managing and compensating its investment personnel. The Board noted that the New Sub-Adviser will utilize a different investment mandate to manage the fund than it currently uses in managing other Strategic Advisers funds and reviewed the general qualifications and capabilities of the investment staff that will provide services to the fund. The Board noted that the New Sub-Adviser's analysts have extensive resources, tools and capabilities which allow them to conduct sophisticated fundamental and/or quantitative analysis. Additionally, in its deliberations, the Board considered the New Sub-Adviser's trading capabilities and resources which are integral parts of the investment management process. Shareholder and Administrative Services. The Board considered (i) the nature, extent, quality, and cost of advisory services to be performed by the New Sub-Adviser under the Sub-Advisory Agreement and (ii) the resources to be devoted to the fund's compliance policies and procedures. Investment Performance. The Board also considered the historical investment performance of the New Sub-Adviser and the portfolio managers in managing accounts under a similar investment mandate.Based on its review, the Board concluded that the nature, extent, and quality of services that will be provided to the fund under the Sub-Advisory Agreement should benefit the fund's shareholders. Competitiveness of Management Fee and Total Fund Expenses. In reviewing the Sub-Advisory Agreement, the Board considered the amount and nature of fees to be paid by the fund to the fund's investment adviser, Strategic Advisers, the amount and nature of fees to be paid by Strategic Advisers to the New Sub-Adviser and the projected change in the fund's management fee and total operating expenses, if any, as a result of hiring the New Sub-Adviser.The Board noted that the fund's maximum aggregate annual management fee rate may not exceed 0.75% of the fund's average daily net assets and that the Sub-Advisory Agreement will not result in a change to the maximum aggregate annual management fee payable by the fund or Strategic Advisers' portion of the management fee. The Board considered Strategic Advisers' contractual agreement to waive its 0.25% portion of the fund's management fee through September 30, 2022. The Board also considered that after allocating assets to the New Sub-Adviser, the fund's management fee is expected to continue to rank below the competitive peer group median, and the fund's total net expenses are expected to continue to rank above the competitive peer group median, presented to the Board in the June 2019 management contract renewal materials.Based on its review, the Board concluded that the fund's management fee structure and any changes to projected total expenses bear a reasonable relationship to the services that the fund and its shareholders will receive and the other factors considered.Because the Sub-Advisory Agreement was negotiated at arm's length and will have no impact on the maximum management fees payable by the fund or Strategic Advisers portion of the management fee, the Board did not consider the costs of services and profitability to be significant factors in its decision to approve the Sub-Advisory Agreement. Potential Fall-Out Benefits. The Board considered that it reviews information regarding the potential of direct and indirect benefits to Strategic Advisers and its affiliates from their relationships with the fund, including non-advisory fee compensation paid to affiliates of Strategic Advisers, if any, as well as information regarding potential fall-out benefits accruing to the fund's sub-advisers, if any, as a result of their respective relationships with the fund, during its annual renewal of the fund's advisory agreement with Strategic Advisers and the fund's sub-advisory agreements. With respect to the New Sub-Adviser, the Board considered management's representation that it does not anticipate that the hiring of the New Sub-Adviser will have a significant impact on the potential for fall-out benefits to Strategic Advisers or its affiliates. Possible Economies of Scale. The Board considered that it reviews whether there have been economies of scale in connection with the management of the fund during its annual renewal of the fund's advisory agreement with Strategic Advisers and the fund's sub-advisory agreements. The Board noted that the Sub-Advisory Agreement provides for breakpoints that have the potential to reduce sub-advisory fees paid to the New Sub-Adviser as assets allocated to the New Sub-Adviser grow. Conclusion. Based on its evaluation of all of the conclusions noted above, and after considering all factors it believed relevant, the Board ultimately concluded that the Sub-Advisory Agreement's fee structure bears a reasonable relationship to the services to be rendered and that the Sub-Advisory Agreement should be approved because the Sub-Advisory Agreement is in the best interests of the fund and its shareholders. The Board also concluded that the sub-advisory fees to be charged thereunder will be based on services provided that will be in addition to, rather than duplicative of services provided under the advisory contract of any underlying fund in which the fund may invest. In addition, the Board concluded that the approval of the Sub-Advisory Agreement does not involve a conflict of interest from which Strategic Advisers or its affiliates derive an inappropriate advantage.Liquidity Risk Management Program
The Securities and Exchange Commission adopted Rule 22e-4 under the Investment Company Act of 1940 (the Liquidity Rule) to promote effective liquidity risk management throughout the open-end investment company industry, thereby reducing the risk that funds will be unable to meet their redemption obligations and mitigating dilution of the interests of fund shareholders.
The Fund has adopted and implemented a liquidity risk management program (the Program) reasonably designed to assess and manage the Fund’s liquidity risk and to comply with the requirements of the Liquidity Rule. The Fund’s Board of Trustees (the Board) has designated the Fund’s investment adviser as administrator of the Program. Strategic Advisers has established a Liquidity Risk Management Committee (the LRM Committee) to manage the Program for each of the Funds. The LRM Committee monitors the adequacy and effectiveness of implementation of the Program and on a periodic basis assesses each Fund’s liquidity risk based on a variety of factors including (1) the Fund’s investment strategy, (2) portfolio liquidity and cash flow projections during normal and reasonably foreseeable stressed conditions, (3) shareholder redemptions and (4) borrowings and other funding sources, as applicable.
In accordance with the Program, each of the Fund’s portfolio investments is classified into one of four liquidity categories described below based on a determination of a reasonable expectation for how long it would take to convert the investment to cash (or sell or dispose of the investment) without significantly changing its market value.
- Highly liquid investments – cash or convertible to cash within three business days or less
- Moderately liquid investments – convertible to cash in three to seven calendar days
- Less liquid investments – can be sold or disposed of, but not settled, within seven calendar days
- Illiquid investments – cannot not be sold or disposed of within seven calendar days
Liquidity classification determinations take into account a variety of factors including various market, trading and investment-specific considerations, as well as market depth, and generally utilize analysis from a third-party liquidity metrics service.
The Liquidity Rule places a 15% limit on a fund’s illiquid investments and requires funds that do not primarily hold assets that are highly liquid investments to determine and maintain a minimum percentage of the fund’s net assets to be invested in highly liquid investments (highly liquid investment minimum or HLIM). The Program includes provisions reasonably designed to comply with the 15% limit on illiquid investments and for determining, periodically reviewing and complying with the HLIM requirement as applicable.
At a recent meeting of the Fund’s Board of Trustees, the LRM Committee provided a written report to the Board pertaining to the operation, adequacy, and effectiveness of implementation of the Program for the annual period from December 1, 2018 through November 30, 2019. The report concluded that the Program has been implemented and is operating effectively and is reasonably designed to assess and manage the Fund’s liquidity risk.
![]()
SRQ-ANN-0420
1.912881.109
Strategic Advisers® Core Income Fund
Offered exclusively to certain clients of Strategic Advisers LLC - not available for sale to the general public
February 29, 2020
See the inside front cover for important information about access to your fund’s shareholder reports.
Beginning on January 1, 2021, as permitted by regulations adopted by the Securities and Exchange Commission, paper copies of a fund’s shareholder reports will no longer be sent by mail, unless you specifically request paper copies of the reports from the fund or from your financial intermediary, such as a financial advisor, broker-dealer or bank. Instead, the reports will be made available on a website, and you will be notified by mail each time a report is posted and provided with a website link to access the report.
If you already elected to receive shareholder reports electronically, you will not be affected by this change and you need not take any action. You may elect to receive shareholder reports and other communications from a fund electronically, by contacting your financial intermediary. For Fidelity customers, visit Fidelity's web site or call Fidelity using the contact information listed below.
You may elect to receive all future reports in paper free of charge. If you wish to continue receiving paper copies of your shareholder reports, you may contact your financial intermediary or, if you are a Fidelity customer, visit Fidelity’s website, or call Fidelity at the applicable toll-free number listed below. Your election to receive reports in paper will apply to all funds held with the fund complex/your financial intermediary.
| Account Type | Website | Phone Number |
| Brokerage, Mutual Fund, or Annuity Contracts: | fidelity.com/mailpreferences | 1-800-343-3548 |
| Employer Provided Retirement Accounts: | netbenefits.fidelity.com/preferences (choose 'no' under Required Disclosures to continue to print) | 1-800-343-0860 |
| Advisor Sold Accounts Serviced Through Your Financial Intermediary: | Contact Your Financial Intermediary | Your Financial Intermediary's phone number |
| Advisor Sold Accounts Serviced by Fidelity: | institutional.fidelity.com | 1-877-208-0098 |
Contents
|
Board Approval of Investment Advisory Contracts and Management Fees | |
To view a fund's proxy voting record for the 12-month period ended June 30, visit http://www.fidelity.com/proxyvotingresults or visit the Securities and Exchange Commission's (SEC) web site at http://www.sec.gov.
You may also call 1-800-544-3455 to request a free copy of the proxy voting guidelines.
Standard & Poor's, S&P and S&P 500 are registered service marks of The McGraw-Hill Companies, Inc. and have been licensed for use by Fidelity Distributors Corporation.
Other third-party marks appearing herein are the property of their respective owners.
All other marks appearing herein are registered or unregistered trademarks or service marks of FMR LLC or an affiliated company. © 2020 FMR LLC. All rights reserved.
This report and the financial statements contained herein are submitted for the general information of the shareholders of the Fund. This report is not authorized for distribution to prospective investors in the Fund unless preceded or accompanied by an effective prospectus.
A fund files its complete schedule of portfolio holdings with the SEC for the first and third quarters of each fiscal year on Form N-PORT. Forms N-PORT are available on the SEC’s web site at http://www.sec.gov. A fund's Forms N-PORT may be reviewed and copied at the SEC’s Public Reference Room in Washington, DC. Information regarding the operation of the SEC's Public Reference Room may be obtained by calling 1-800-SEC-0330.
For a complete list of a fund's portfolio holdings, view the most recent holdings listing, semiannual report, or annual report on Fidelity's web site at http://www.fidelity.com, http://www.institutional.fidelity.com, or http://www.401k.com, as applicable.
NOT FDIC INSURED •MAY LOSE VALUE •NO BANK GUARANTEE
Neither the Fund nor Fidelity Distributors Corporation is a bank.
Note to Shareholders:
Early in 2020, the outbreak and spread of a new coronavirus emerged as a public health emergency that had a major influence on financial markets, primarily based on its impact on the global economy and corporate earnings. The virus causes a respiratory disease known as COVID-19. On March 11, the World Health Organization declared the COVID-19 outbreak a pandemic, citing sustained risk of further global spread.
In the weeks following the end of this reporting period, as the crisis worsened, we witnessed an escalating human tragedy with wide-scale social and economic consequences from coronavirus-containment measures. The outbreak of COVID-19 prompted a number of measures to limit the spread, including travel and border restrictions, quarantines, and restrictions on large gatherings. In turn, these resulted in lower consumer activity, diminished demand for a wide range of products and services, disruption in manufacturing and supply chains, and – given the wide variability in outcomes regarding the outbreak – significant market uncertainty and volatility. Amid the turmoil, the U.S. government took unprecedented action – in concert with the U.S. Federal Reserve and central banks around the world – to help support consumers, businesses, and the broader economy, and to limit disruption to the financial system.
The situation continues to unfold, and the extent and duration of its impact on financial markets and the economy remain highly uncertain. Extreme events such as the coronavirus crisis are “exogenous shocks” that can have significant adverse effects on mutual funds and their investments. Although multiple asset classes may be affected by market disruption, the duration and impact may not be the same for all types of assets.
Fidelity is committed to helping you stay informed amid news about COVID-19 and during increased market volatility, and we’re taking extra steps to be responsive to customer needs. We encourage you to visit our websites, where we offer ongoing updates, commentary, and analysis on the markets and our funds.
Performance: The Bottom Line
Average annual total return reflects the change in the value of an investment, assuming reinvestment of distributions from dividend income and capital gains (the profits earned upon the sale of securities that have grown in value, if any) and assuming a constant rate of performance each year. The hypothetical investment and the average annual total returns do not reflect the deduction of taxes that a shareholder would pay on fund distributions or the redemption of fund shares. During periods of reimbursement by Fidelity, a fund’s total return will be greater than it would be had the reimbursement not occurred. How a fund did yesterday is no guarantee of how it will do tomorrow.
Average Annual Total Returns
| For the periods ended February 29, 2020 | Past 1 year | Past 5 years | Past 10 years |
| Strategic Advisers® Core Income Fund | 11.25% | 3.93% | 4.49% |
$10,000 Over 10 Years
Let's say hypothetically that $10,000 was invested in Strategic Advisers® Core Income Fund on February 28, 2010.
The chart shows how the value of your investment would have changed, and also shows how the Bloomberg Barclays U.S. Aggregate Bond Index performed over the same period.
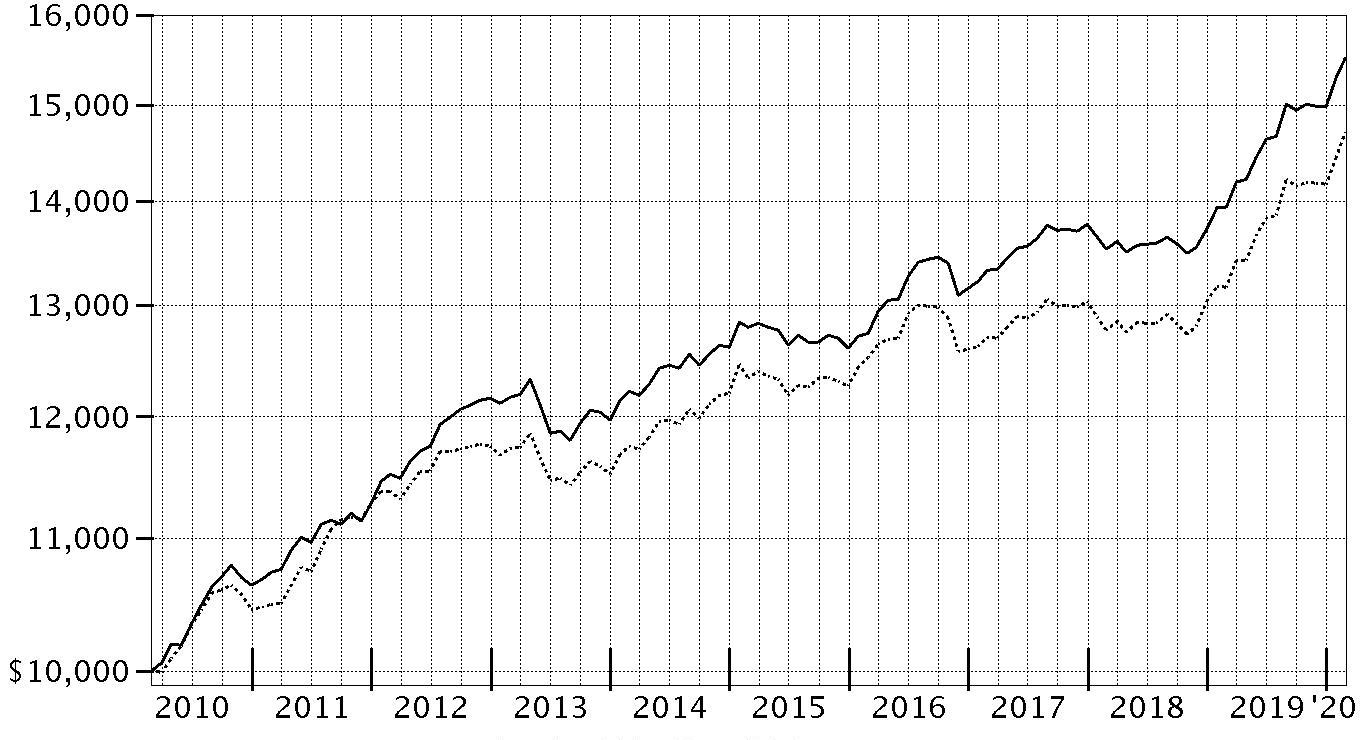
| Period Ending Values | ||
|
| $15,515 | Strategic Advisers® Core Income Fund |
|
| $14,707 | Bloomberg Barclays U.S. Aggregate Bond Index |
Management's Discussion of Fund Performance
Market Recap: U.S. taxable investment-grade bonds rose strongly for the 12 months ending February 29, 2020, driven by a maturing business cycle, trade uncertainty and the U.S. Federal Reserve’s dovish shift. The Bloomberg Barclays U.S. Aggregate Bond Index gained 11.68% for the period. Longer-term market yields declined in August, shortly after the Fed reduced interest rates for the first time since 2008, citing signs of weakness in some segments of the U.S. economy. The Fed followed with rate cuts of 25 basis points each in September and October. Yields rebounded slightly through the end of 2019, partly due to better-than-expected U.S. economic reports and comments from the Fed in October that seemingly set a high bar for additional accommodation. Yields then declined in January and plunged in February, amid robust investor demand for most fixed-income assets – especially U.S. Treasury bonds – as the outbreak and spread of the new coronavirus threatened to hamper global economic growth and corporate earnings. Within the Bloomberg Barclays index, corporate bonds gained 15.81%, topping the 12.15% advance of U.S. Treasuries. Agency mortgage-backed securities (+7.45%) and asset-backed securities (+5.71%) lagged. Outside the index, U.S. corporate high-yield bonds gained 5.91%, while Treasury Inflation-Protected Securities (TIPS) rose 10.76%. Comments from Portfolio Manager Jonathan Duggan: For the fiscal year, the Fund gained 11.25%, modestly trailing the benchmark Bloomberg Barclays U.S. Aggregate Bond Index. At the total Fund level, increased exposure to mortgage-backed securities (MBS) dampened relative performance the past 12 months. Despite posting a solid absolute return, MBS could not keep pace with sectors that directly benefited from declining interest rates. These factors weighed on the performance of PIMCO Income Fund (+6.2%), the Fixed Income Securitized strategy managed by sub-adviser FIAM® (+8.1%), DoubleLine Total Return Fund (+8.4%) and PIMCO Mortgage Opportunities & Bond Fund (+5.5%), making them the primary relative detractors. On the positive side, PGIM Total Return Bond Fund (+16.9%) and Western Asset Core Plus Fund (+13.9%) added considerable value versus the benchmark. Both of these funds were well positioned for declining interest rates and also benefited from overweighted allocations in corporate credit. The Core Investment Grade strategy managed by FIAM® (+12.3%) also contributed, aided by an overweighting in corporate credit and an underweighting in MBS. During the period, I continued to reduce risk in the portfolio by adjusting the allocations to underlying managers and increasing the Fund’s exposure to intermediate- and long-term U.S. Treasuries. Given the uncertain economic impact of the coronavirus pandemic, I plan to maintain this emphasis on risk- and liquidity management in the months ahead.The views expressed above reflect those of the portfolio manager(s) only through the end of the period as stated on the cover of this report and do not necessarily represent the views of Fidelity or any other person in the Fidelity organization. Any such views are subject to change at any time based upon market or other conditions and Fidelity disclaims any responsibility to update such views. These views may not be relied on as investment advice and, because investment decisions for a Fidelity fund are based on numerous factors, may not be relied on as an indication of trading intent on behalf of any Fidelity fund.
Investment Summary (Unaudited)
The information in the following tables is based on the direct investments of the Fund.Top Ten Holdings as of February 29, 2020
| (excluding cash equivalents) | % of fund's net assets |
| PIMCO Total Return Fund Institutional Class | 15.5 |
| Fidelity SAI Total Bond Fund | 14.5 |
| Fidelity SAI U.S. Treasury Bond Index Fund | 8.4 |
| Western Asset Core Plus Bond Fund Class I | 7.1 |
| U.S. Treasury Obligations | 6.4 |
| Metropolitan West Total Return Bond Fund Class M | 5.0 |
| Western Asset Core Bond Fund Class I | 4.7 |
| Prudential Total Return Bond Fund Class A | 4.6 |
| Ginnie Mae | 4.0 |
| DoubleLine Total Return Bond Fund Class N | 3.0 |
Asset Allocation (% of fund's net assets)
| As of February 29, 2020 | ||
| Corporate Bonds | 7.6% | |
| U.S. Government and U.S. Government Agency Obligations | 15.9% | |
| Asset-Backed Securities | 0.9% | |
| CMOs and Other Mortgage Related Securities | 0.9% | |
| Municipal Securities | 0.2% | |
| Bank Loan Funds | 0.4% | |
| High Yield Fixed-Income Funds | 0.4% | |
| Intermediate-Term Bond Funds | 66.2% | |
| Long Government Bond Funds | 1.5% | |
| Other Investments | 0.3% | |
| Short-Term Investments and Net Other Assets (Liabilities)* | (2.7)% | |
| Intermediate Government Funds | 8.4% | |

* Short-Term Investments and Net Other Assets (Liabilities) are not included in the pie chart
Asset allocations of funds in the pie chart reflect the categorizations of assets as defined by Morningstar as of the reporting date.
Percentages in the above tables are adjusted for the effect of TBA Sale Commitments.
Schedule of Investments February 29, 2020
Showing Percentage of Net Assets
| Nonconvertible Bonds - 7.6% | |||
| Principal Amount | Value | ||
| COMMUNICATION SERVICES - 0.7% | |||
| Diversified Telecommunication Services - 0.3% | |||
| AT&T, Inc.: | |||
| 3.55% 6/1/24 | $3,131,000 | $3,335,889 | |
| 3.6% 2/17/23 | 6,860,000 | 7,224,696 | |
| 3.8% 2/15/27 | 3,375,000 | 3,693,651 | |
| 4.1% 2/15/28 | 1,580,000 | 1,768,619 | |
| 4.3% 2/15/30 | 3,709,000 | 4,248,846 | |
| 4.45% 4/1/24 | 1,147,000 | 1,261,783 | |
| 4.5% 5/15/35 | 1,980,000 | 2,278,024 | |
| 4.5% 3/9/48 | 22,490,000 | 25,640,295 | |
| 4.55% 3/9/49 | 2,211,000 | 2,563,301 | |
| 4.75% 5/15/46 | 41,715,000 | 49,183,921 | |
| 4.8% 6/15/44 | 515,000 | 604,518 | |
| 4.9% 6/15/42 | 7,000,000 | 8,255,653 | |
| 5.15% 11/15/46 | 10,160,000 | 12,604,985 | |
| 5.35% 9/1/40 | 59,000 | 74,117 | |
| 6.2% 3/15/40 | 2,433,000 | 3,284,097 | |
| 6.3% 1/15/38 | 2,523,000 | 3,483,557 | |
| British Telecommunications PLC 9.625% 12/15/30 (a) | 575,000 | 910,572 | |
| C&W Senior Financing Designated Activity Co.: | |||
| 6.875% 9/15/27 (b) | 425,000 | 448,375 | |
| 7.5% 10/15/26 (b) | 1,140,000 | 1,197,000 | |
| Century Telephone Enterprises, Inc. 6.875% 1/15/28 | 15,000 | 16,650 | |
| CenturyLink, Inc.: | |||
| 5.125% 12/15/26 (b) | 495,000 | 498,713 | |
| 5.625% 4/1/25 | 175,000 | 182,438 | |
| Level 3 Financing, Inc.: | |||
| 5.125% 5/1/23 | 900,000 | 902,250 | |
| 5.375% 1/15/24 | 900,000 | 897,768 | |
| Sable International Finance Ltd. 5.75% 9/7/27 (b) | 585,000 | 609,863 | |
| SFR Group SA: | |||
| 7.375% 5/1/26 (b) | 510,000 | 534,837 | |
| 8.125% 2/1/27 (b) | 135,000 | 147,120 | |
| Telecom Italia SpA 5.303% 5/30/24 (b) | 1,100,000 | 1,174,250 | |
| Telenet Finance Luxembourg Notes SARL 5.5% 3/1/28 (b) | 400,000 | 422,000 | |
| Verizon Communications, Inc.: | |||
| 4.016% 12/3/29 | 1,146,000 | 1,332,136 | |
| 4.5% 8/10/33 | 1,310,000 | 1,605,645 | |
| 4.522% 9/15/48 | 2,361,000 | 3,043,461 | |
| 4.862% 8/21/46 | 4,163,000 | 5,539,540 | |
| 5.012% 4/15/49 | 1,594,000 | 2,202,299 | |
| 151,170,869 | |||
| Entertainment - 0.0% | |||
| NBCUniversal, Inc.: | |||
| 4.45% 1/15/43 | 2,406,000 | 2,965,382 | |
| 5.95% 4/1/41 | 1,495,000 | 2,177,562 | |
| Netflix, Inc.: | |||
| 4.375% 11/15/26 | 165,000 | 172,788 | |
| 4.875% 4/15/28 | 145,000 | 152,643 | |
| 4.875% 6/15/30 (b) | 70,000 | 73,766 | |
| 5.375% 11/15/29 (b) | 120,000 | 130,464 | |
| 5.875% 11/15/28 | 190,000 | 213,617 | |
| 6.375% 5/15/29 | 55,000 | 62,981 | |
| The Walt Disney Co.: | |||
| 4.75% 9/15/44 | 2,230,000 | 2,953,582 | |
| 4.95% 10/15/45 | 50,000 | 68,708 | |
| Viacom, Inc.: | |||
| 3.875% 4/1/24 | 1,380,000 | 1,483,972 | |
| 5.85% 9/1/43 | 220,000 | 277,336 | |
| 10,732,801 | |||
| Interactive Media & Services - 0.0% | |||
| Match Group, Inc. 4.125% 8/1/30 (b) | 70,000 | 68,579 | |
| Media - 0.4% | |||
| Altice Financing SA: | |||
| 5% 1/15/28 (b) | 200,000 | 193,980 | |
| 7.5% 5/15/26 (b) | 300,000 | 316,500 | |
| Cablevision Systems Corp. 5.875% 9/15/22 | 1,600,000 | 1,680,240 | |
| CCO Holdings LLC/CCO Holdings Capital Corp.: | |||
| 4% 3/1/23 (b) | 1,200,000 | 1,212,000 | |
| 4.5% 8/15/30 (b) | 180,000 | 182,025 | |
| 5.75% 2/15/26 (b) | 2,400,000 | 2,495,280 | |
| Charter Communications Operating LLC/Charter Communications Operating Capital Corp.: | |||
| 4.464% 7/23/22 | 11,002,000 | 11,675,265 | |
| 4.8% 3/1/50 | 750,000 | 807,713 | |
| 4.908% 7/23/25 | 7,565,000 | 8,476,249 | |
| 5.375% 4/1/38 | 450,000 | 516,950 | |
| 5.375% 5/1/47 | 31,249,000 | 35,956,402 | |
| 5.75% 4/1/48 | 14,203,000 | 16,937,337 | |
| 6.384% 10/23/35 | 2,985,000 | 3,933,197 | |
| 6.484% 10/23/45 | 1,295,000 | 1,665,474 | |
| Comcast Corp.: | |||
| 3.45% 2/1/50 | 755,000 | 833,237 | |
| 3.6% 3/1/24 | 1,495,000 | 1,615,438 | |
| 3.9% 3/1/38 | 1,317,000 | 1,536,649 | |
| 4.6% 8/15/45 | 5,366,000 | 6,836,094 | |
| 4.65% 7/15/42 | 3,871,000 | 4,867,177 | |
| 4.7% 10/15/48 | 1,230,000 | 1,613,963 | |
| CSC Holdings LLC 5.25% 6/1/24 | 1,600,000 | 1,728,000 | |
| Discovery Communications LLC: | |||
| 3.5% 6/15/22 | 1,105,000 | 1,145,125 | |
| 3.95% 6/15/25 | 710,000 | 773,103 | |
| 5% 9/20/37 | 380,000 | 436,347 | |
| 5.3% 5/15/49 | 925,000 | 1,120,686 | |
| DISH DBS Corp. 5.875% 11/15/24 | 200,000 | 205,146 | |
| Fox Corp.: | |||
| 3.666% 1/25/22 (b) | 986,000 | 1,026,703 | |
| 4.03% 1/25/24 (b) | 1,733,000 | 1,874,150 | |
| 4.709% 1/25/29 (b) | 2,509,000 | 2,942,074 | |
| 5.476% 1/25/39 (b) | 2,474,000 | 3,172,487 | |
| 5.576% 1/25/49 (b) | 1,641,000 | 2,205,799 | |
| Radiate Holdco LLC/Radiate Financial Service Ltd. 6.625% 2/15/25 (b) | 150,000 | 150,375 | |
| Sirius XM Radio, Inc.: | |||
| 3.875% 8/1/22 (b) | 1,500,000 | 1,496,445 | |
| 4.625% 5/15/23 (b) | 1,500,000 | 1,511,250 | |
| Time Warner Cable, Inc.: | |||
| 4% 9/1/21 | 16,424,000 | 16,879,405 | |
| 5.5% 9/1/41 | 2,591,000 | 3,030,440 | |
| 5.875% 11/15/40 | 5,543,000 | 6,628,746 | |
| 6.55% 5/1/37 | 8,522,000 | 11,101,836 | |
| 7.3% 7/1/38 | 6,393,000 | 8,679,082 | |
| TWDC Enterprises 18 Corp.: | |||
| 1.85% 7/30/26 | 2,030,000 | 2,072,096 | |
| 2.55% 2/15/22 | 335,000 | 343,598 | |
| 2.75% 8/16/21 | 200,000 | 203,920 | |
| Virgin Media Secured Finance PLC 5.5% 8/15/26 (b) | 300,000 | 308,720 | |
| Ziggo Bond Co. BV 5.125% 2/28/30 (b) | 215,000 | 217,645 | |
| Ziggo BV 5.5% 1/15/27 (b) | 1,529,000 | 1,574,931 | |
| 174,179,279 | |||
| Wireless Telecommunication Services - 0.0% | |||
| Millicom International Cellular SA: | |||
| 5.125% 1/15/28 (b) | 995,000 | 1,024,850 | |
| 6% 3/15/25 (b) | 100,000 | 102,469 | |
| 6.625% 10/15/26 (b) | 600,000 | 642,000 | |
| Rogers Communications, Inc. 3% 3/15/23 | 150,000 | 156,661 | |
| SoftBank Corp. 5.375% 7/30/22 (Reg. S) | 200,000 | 208,700 | |
| Sprint Communications, Inc. 6% 11/15/22 | 800,000 | 858,080 | |
| Ypso Finance BIS SA 6% 2/15/28 (b) | 105,000 | 100,832 | |
| 3,093,592 | |||
| TOTAL COMMUNICATION SERVICES | 339,245,120 | ||
| CONSUMER DISCRETIONARY - 0.3% | |||
| Automobiles - 0.1% | |||
| Ford Motor Co. 6.375% 2/1/29 | 1,255,000 | 1,312,216 | |
| General Motors Co. 6.25% 10/2/43 | 465,000 | 528,363 | |
| General Motors Financial Co., Inc.: | |||
| 3.7% 5/9/23 | 11,800,000 | 12,257,073 | |
| 4% 1/15/25 | 2,175,000 | 2,301,324 | |
| 4.25% 5/15/23 | 1,875,000 | 1,978,552 | |
| 4.375% 9/25/21 | 7,321,000 | 7,567,239 | |
| 25,944,767 | |||
| Diversified Consumer Services - 0.0% | |||
| California Institute of Technology 3.65% 9/1/19 | 635,000 | 758,683 | |
| GEMS MENASA Cayman Ltd. 7.125% 7/31/26 (b) | 320,000 | 329,000 | |
| Ingersoll-Rand Global Holding Co. Ltd. 4.25% 6/15/23 | 425,000 | 465,108 | |
| President and Fellows of Harvard College: | |||
| 3.15% 7/15/46 | 190,000 | 218,890 | |
| 3.3% 7/15/56 | 190,000 | 228,404 | |
| Service Corp. International 5.125% 6/1/29 | 270,000 | 291,938 | |
| Trustees of Boston University 4.061% 10/1/48 | 450,000 | 589,433 | |
| University of Pennsylvania Trustees 3.61% 2/15/2119 | 285,000 | 352,585 | |
| University of Southern California 3.841% 10/1/47 | 705,000 | 907,902 | |
| 4,141,943 | |||
| Hotels, Restaurants & Leisure - 0.0% | |||
| 1011778 BC Unlimited Liability Co./New Red Finance, Inc.: | |||
| 4.25% 5/15/24 (b) | 300,000 | 300,285 | |
| 4.375% 1/15/28 (b) | 280,000 | 278,600 | |
| Aramark Services, Inc.: | |||
| 4.75% 6/1/26 | 100,000 | 103,500 | |
| 5% 4/1/25 (b) | 300,000 | 309,750 | |
| 5% 2/1/28 (b) | 960,000 | 1,002,000 | |
| Caesars Resort Collection LLC 5.25% 10/15/25 (b) | 300,000 | 294,606 | |
| Hilton Worldwide Finance LLC/Hilton Worldwide Finance Corp. 4.625% 4/1/25 | 400,000 | 401,500 | |
| KFC Holding Co./Pizza Hut Holding LLC 5% 6/1/24 (b) | 300,000 | 302,364 | |
| Marriott International, Inc.: | |||
| 3.125% 6/15/26 | 1,090,000 | 1,143,810 | |
| 3.6% 4/15/24 | 660,000 | 706,718 | |
| McDonald's Corp.: | |||
| 3.7% 1/30/26 | 185,000 | 202,864 | |
| 4.7% 12/9/35 | 1,535,000 | 1,930,958 | |
| MCE Finance Ltd. 4.875% 6/6/25 (b) | 300,000 | 301,496 | |
| Twin River Worldwide Holdings, Inc. 6.75% 6/1/27 (b) | 300,000 | 312,542 | |
| Wyndham Hotels & Resorts, Inc. 5.375% 4/15/26 (b) | 200,000 | 207,321 | |
| Wynn Las Vegas LLC/Wynn Las Vegas Capital Corp.: | |||
| 5.25% 5/15/27 (b) | 300,000 | 288,750 | |
| 5.5% 3/1/25 (b) | 300,000 | 294,375 | |
| Wynn Macau Ltd.: | |||
| 4.875% 10/1/24 (b) | 300,000 | 299,412 | |
| 5.5% 10/1/27 (b) | 190,000 | 191,781 | |
| 8,872,632 | |||
| Household Durables - 0.2% | |||
| Lennar Corp.: | |||
| 4.75% 11/29/27 | 9,350,000 | 10,308,375 | |
| 5% 6/15/27 | 12,100,000 | 13,524,049 | |
| 5.25% 6/1/26 | 2,920,000 | 3,217,840 | |
| Toll Brothers Finance Corp.: | |||
| 4.35% 2/15/28 | 29,675,000 | 31,318,402 | |
| 4.375% 4/15/23 | 5,000,000 | 5,200,000 | |
| 4.875% 11/15/25 | 35,000 | 38,238 | |
| 4.875% 3/15/27 | 7,917,000 | 8,636,972 | |
| 5.625% 1/15/24 | 885,000 | 971,288 | |
| 5.875% 2/15/22 | 12,000,000 | 12,570,000 | |
| 85,785,164 | |||
| Internet & Direct Marketing Retail - 0.0% | |||
| Amazon.com, Inc. 2.8% 8/22/24 | 1,045,000 | 1,101,840 | |
| Leisure Products - 0.0% | |||
| Hasbro, Inc.: | |||
| 2.6% 11/19/22 | 2,485,000 | 2,556,876 | |
| 3% 11/19/24 | 5,655,000 | 5,931,301 | |
| Mattel, Inc. 6.75% 12/31/25 (b) | 145,000 | 152,388 | |
| 8,640,565 | |||
| Multiline Retail - 0.0% | |||
| Dollar Tree, Inc. 4.2% 5/15/28 | 1,395,000 | 1,560,304 | |
| Specialty Retail - 0.0% | |||
| AutoZone, Inc. 3.75% 4/18/29 | 1,200,000 | 1,357,774 | |
| Lowe's Companies, Inc. 4.25% 9/15/44 | 305,000 | 347,685 | |
| The Home Depot, Inc.: | |||
| 2.625% 6/1/22 | 260,000 | 267,420 | |
| 3.75% 2/15/24 | 4,226,000 | 4,609,333 | |
| 4.875% 2/15/44 | 1,000,000 | 1,333,888 | |
| 5.875% 12/16/36 | 300,000 | 433,517 | |
| 8,349,617 | |||
| TOTAL CONSUMER DISCRETIONARY | 144,396,832 | ||
| CONSUMER STAPLES - 0.3% | |||
| Beverages - 0.2% | |||
| Anheuser-Busch Companies LLC / Anheuser-Busch InBev Worldwide, Inc.: | |||
| 3.65% 2/1/26 | 5,100,000 | 5,558,836 | |
| 4.7% 2/1/36 | 2,765,000 | 3,293,484 | |
| 4.9% 2/1/46 | 945,000 | 1,167,681 | |
| Anheuser-Busch InBev Finance, Inc.: | |||
| 3.65% 2/1/26 | 12,330,000 | 13,481,090 | |
| 4.7% 2/1/36 | 9,871,000 | 11,597,316 | |
| 4.9% 2/1/46 | 12,306,000 | 15,081,486 | |
| Anheuser-Busch InBev Worldwide, Inc.: | |||
| 4.75% 4/15/58 | 6,987,000 | 8,446,172 | |
| 5.45% 1/23/39 | 5,390,000 | 7,020,583 | |
| 5.55% 1/23/49 | 14,627,000 | 19,814,300 | |
| 5.8% 1/23/59 (Reg. S) | 15,062,000 | 21,278,626 | |
| Constellation Brands, Inc.: | |||
| 3.7% 12/6/26 | 925,000 | 1,014,388 | |
| 4.4% 11/15/25 | 480,000 | 542,835 | |
| 4.75% 11/15/24 | 5,595,000 | 6,336,216 | |
| PepsiCo, Inc.: | |||
| 2.75% 3/5/22 | 900,000 | 922,933 | |
| 3.1% 7/17/22 | 260,000 | 270,026 | |
| 3.6% 3/1/24 | 1,952,000 | 2,115,816 | |
| 117,941,788 | |||
| Food & Staples Retailing - 0.0% | |||
| C&S Group Enterprises LLC 5.375% 7/15/22 (b) | 400,000 | 406,040 | |
| Kroger Co. 2.65% 10/15/26 | 530,000 | 548,592 | |
| Walgreens Boots Alliance, Inc. 3.3% 11/18/21 | 2,632,000 | 2,700,163 | |
| 3,654,795 | |||
| Food Products - 0.1% | |||
| Conagra Brands, Inc. 3.8% 10/22/21 | 1,514,000 | 1,573,786 | |
| H.J. Heinz Co.: | |||
| 3% 6/1/26 | 2,365,000 | 2,354,844 | |
| 4.375% 6/1/46 | 7,290,000 | 6,733,082 | |
| 5.2% 7/15/45 | 4,912,000 | 4,969,739 | |
| H.J. Heinz Finance Co. 7.125% 8/1/39 (b) | 9,093,000 | 11,038,407 | |
| JBS U.S.A. LLC/JBS U.S.A. Finance, Inc.: | |||
| 5.75% 6/15/25 (b) | 1,300,000 | 1,330,875 | |
| 5.875% 7/15/24 (b) | 1,300,000 | 1,322,776 | |
| JBS U.S.A. Lux SA / JBS Food Co.: | |||
| 5.5% 1/15/30 (b) | 470,000 | 495,996 | |
| 6.5% 4/15/29 (b) | 295,000 | 319,987 | |
| Lamb Weston Holdings, Inc. 4.625% 11/1/24 (b) | 400,000 | 416,332 | |
| Post Holdings, Inc.: | |||
| 4.625% 4/15/30 (b) | 40,000 | 39,424 | |
| 5% 8/15/26 (b) | 35,000 | 35,700 | |
| 5.625% 1/15/28 (b) | 105,000 | 109,747 | |
| The J.M. Smucker Co. 3.5% 3/15/25 | 310,000 | 336,475 | |
| Tyson Foods, Inc. 4% 3/1/26 | 2,520,000 | 2,813,308 | |
| 33,890,478 | |||
| Tobacco - 0.0% | |||
| Altria Group, Inc.: | |||
| 2.85% 8/9/22 | 1,570,000 | 1,612,979 | |
| 4% 1/31/24 | 1,380,000 | 1,492,418 | |
| BAT Capital Corp.: | |||
| 3.215% 9/6/26 | 1,530,000 | 1,595,835 | |
| 3.222% 8/15/24 | 1,095,000 | 1,149,822 | |
| 3.557% 8/15/27 | 1,170,000 | 1,235,139 | |
| Philip Morris International, Inc. 3.875% 8/21/42 | 530,000 | 578,927 | |
| 7,665,120 | |||
| TOTAL CONSUMER STAPLES | 163,152,181 | ||
| ENERGY - 1.2% | |||
| Energy Equipment & Services - 0.0% | |||
| Baker Hughes Co. 4.08% 12/15/47 | 145,000 | 153,510 | |
| El Paso Pipeline Partners Operating Co. LLC 5% 10/1/21 | 1,212,000 | 1,262,934 | |
| Halliburton Co.: | |||
| 4.75% 8/1/43 | 445,000 | 480,225 | |
| 6.7% 9/15/38 | 170,000 | 225,238 | |
| Summit Midstream Holdings LLC 5.75% 4/15/25 | 1,035,000 | 765,900 | |
| 2,887,807 | |||
| Oil, Gas & Consumable Fuels - 1.2% | |||
| Alberta Energy Co. Ltd. 8.125% 9/15/30 | 6,179,000 | 7,781,633 | |
| Amerada Hess Corp.: | |||
| 7.125% 3/15/33 | 1,335,000 | 1,692,396 | |
| 7.3% 8/15/31 | 1,849,000 | 2,365,592 | |
| 7.875% 10/1/29 | 5,583,000 | 7,284,396 | |
| Apache Corp. 3.25% 4/15/22 | 110,000 | 112,192 | |
| Canadian Natural Resources Ltd. 5.85% 2/1/35 | 2,743,000 | 3,531,855 | |
| Cenovus Energy, Inc.: | |||
| 4.25% 4/15/27 | 7,813,000 | 8,375,239 | |
| 5.25% 6/15/37 | 605,000 | 640,423 | |
| Chesapeake Energy Corp.: | |||
| 7% 10/1/24 | 165,000 | 57,750 | |
| 8% 6/15/27 | 455,000 | 136,500 | |
| Chevron Corp.: | |||
| 2.355% 12/5/22 | 840,000 | 860,828 | |
| 2.566% 5/16/23 | 4,322,000 | 4,473,908 | |
| Citgo Holding, Inc. 9.25% 8/1/24 (b) | 260,000 | 270,400 | |
| CNOOC Finance (2013) Ltd. 2.875% 9/30/29 | 2,225,000 | 2,333,469 | |
| Columbia Pipeline Group, Inc.: | |||
| 3.3% 6/1/20 | 4,641,000 | 4,652,836 | |
| 4.5% 6/1/25 | 1,418,000 | 1,580,605 | |
| Concho Resources, Inc.: | |||
| 3.75% 10/1/27 | 1,890,000 | 1,963,648 | |
| 4.3% 8/15/28 | 2,415,000 | 2,625,663 | |
| 4.875% 10/1/47 | 185,000 | 206,012 | |
| Conoco, Inc. 6.95% 4/15/29 | 425,000 | 579,585 | |
| Crestwood Midstream Partners LP/Crestwood Midstream Finance Corp.: | |||
| 5.625% 5/1/27 (b) | 240,000 | 221,988 | |
| 5.75% 4/1/25 | 1,500,000 | 1,466,250 | |
| CVR Energy, Inc. 5.25% 2/15/25 (b) | 275,000 | 256,438 | |
| DCP Midstream LLC: | |||
| 4.75% 9/30/21 (b) | 2,017,000 | 2,005,301 | |
| 5.35% 3/15/20 (b) | 2,258,000 | 2,260,826 | |
| 5.85% 5/21/43 (a)(b) | 7,892,000 | 7,102,800 | |
| DCP Midstream Operating LP: | |||
| 3.875% 3/15/23 | 17,626,000 | 17,546,683 | |
| 5.375% 7/15/25 | 800,000 | 838,016 | |
| 5.6% 4/1/44 | 3,773,000 | 3,508,890 | |
| Denbury Resources, Inc.: | |||
| 7.75% 2/15/24 (b) | 320,000 | 179,360 | |
| 9.25% 3/31/22 (b) | 30,000 | 24,000 | |
| Devon Energy Corp.: | |||
| 5% 6/15/45 | 915,000 | 984,240 | |
| 5.6% 7/15/41 | 175,000 | 199,141 | |
| Ecopetrol SA: | |||
| 4.125% 1/16/25 | 1,320,000 | 1,376,925 | |
| 5.375% 6/26/26 | 1,490,000 | 1,671,594 | |
| 5.875% 9/18/23 | 460,000 | 508,645 | |
| EG Global Finance PLC: | |||
| 6.75% 2/7/25 (b) | 220,000 | 215,050 | |
| 8.5% 10/30/25 (b) | 380,000 | 391,286 | |
| El Paso Corp. 6.5% 9/15/20 | 12,030,000 | 12,333,423 | |
| Enable Midstream Partners LP 3.9% 5/15/24 (a) | 1,210,000 | 1,238,216 | |
| Enbridge Energy Partners LP 4.2% 9/15/21 | 2,044,000 | 2,104,151 | |
| Enbridge, Inc.: | |||
| 4% 10/1/23 | 3,799,000 | 4,063,317 | |
| 4.25% 12/1/26 | 1,943,000 | 2,167,107 | |
| Encana Corp.: | |||
| 5.15% 11/15/41 | 3,000,000 | 2,920,858 | |
| 6.5% 8/15/34 | 1,165,000 | 1,249,215 | |
| Energy Transfer Partners LP: | |||
| 3.75% 5/15/30 | 2,964,000 | 3,003,852 | |
| 4.2% 9/15/23 | 1,452,000 | 1,555,314 | |
| 4.25% 3/15/23 | 1,373,000 | 1,454,086 | |
| 4.5% 4/15/24 | 1,723,000 | 1,866,662 | |
| 4.75% 1/15/26 | 1,935,000 | 2,132,000 | |
| 4.95% 6/15/28 | 4,954,000 | 5,459,204 | |
| 5% 5/15/50 | 6,600,000 | 6,690,201 | |
| 5.25% 4/15/29 | 2,803,000 | 3,147,963 | |
| 5.3% 4/15/47 | 560,000 | 580,811 | |
| 5.8% 6/15/38 | 2,762,000 | 3,084,922 | |
| 6% 6/15/48 | 1,799,000 | 2,020,493 | |
| 6.25% 4/15/49 | 2,605,000 | 3,002,394 | |
| 6.625% 10/15/36 | 900,000 | 1,063,505 | |
| Enterprise Products Operating LP: | |||
| 3.125% 7/31/29 | 515,000 | 538,487 | |
| 3.7% 1/31/51 | 215,000 | 214,294 | |
| 3.95% 1/31/60 | 50,000 | 48,951 | |
| 4.85% 3/15/44 | 2,850,000 | 3,351,923 | |
| EOG Resources, Inc. 3.9% 4/1/35 | 205,000 | 240,262 | |
| EQT Corp.: | |||
| 3.9% 10/1/27 | 89,000 | 58,073 | |
| 6.125% 2/1/25 | 277,000 | 210,631 | |
| Exxon Mobil Corp.: | |||
| 2.397% 3/6/22 | 1,575,000 | 1,607,680 | |
| 4.114% 3/1/46 | 705,000 | 859,473 | |
| Global Partners LP/GLP Finance Corp. 7% 8/1/27 | 500,000 | 517,153 | |
| Hess Corp.: | |||
| 4.3% 4/1/27 | 1,117,000 | 1,177,742 | |
| 5.6% 2/15/41 | 1,896,000 | 2,049,428 | |
| 5.8% 4/1/47 | 4,517,000 | 5,002,633 | |
| Hess Infrastructure Partners LP 5.625% 2/15/26 (b) | 600,000 | 598,512 | |
| Hess Midstream Partners LP 5.125% 6/15/28 (b) | 115,000 | 112,125 | |
| Hilcorp Energy I LP/Hilcorp Finance Co. 5% 12/1/24 (b) | 225,000 | 177,750 | |
| Holly Energy Partners LP/Holly Finance Corp. 5% 2/1/28 (b) | 285,000 | 286,781 | |
| Kinder Morgan Energy Partners LP: | |||
| 3.45% 2/15/23 | 1,900,000 | 1,984,005 | |
| 4.15% 3/1/22 | 885,000 | 930,791 | |
| 4.15% 2/1/24 | 300,000 | 323,329 | |
| Kinder Morgan, Inc. 5.55% 6/1/45 | 3,329,000 | 3,961,061 | |
| Magellan Midstream Partners LP: | |||
| 3.95% 3/1/50 | 1,035,000 | 1,085,175 | |
| 4.2% 10/3/47 | 695,000 | 782,249 | |
| 4.25% 9/15/46 | 65,000 | 70,651 | |
| Marathon Petroleum Corp. 5.125% 3/1/21 | 2,870,000 | 2,951,592 | |
| MPLX LP: | |||
| 3 month U.S. LIBOR + 0.900% 2.785% 9/9/21 (a)(c) | 2,069,000 | 2,074,943 | |
| 3 month U.S. LIBOR + 1.100% 2.985% 9/9/22 (a)(c) | 3,115,000 | 3,126,416 | |
| 4.125% 3/1/27 | 505,000 | 541,468 | |
| 4.5% 7/15/23 | 1,235,000 | 1,333,571 | |
| 4.5% 4/15/38 | 900,000 | 909,581 | |
| 4.7% 4/15/48 | 1,945,000 | 2,027,359 | |
| 4.8% 2/15/29 | 2,855,000 | 3,198,886 | |
| 4.875% 12/1/24 | 2,489,000 | 2,760,819 | |
| 5.5% 2/15/49 | 4,516,000 | 5,072,515 | |
| Noble Energy, Inc.: | |||
| 5.25% 11/15/43 | 295,000 | 312,143 | |
| 6% 3/1/41 | 360,000 | 411,058 | |
| Occidental Petroleum Corp.: | |||
| 2.6% 8/13/21 | 2,048,000 | 2,074,098 | |
| 2.6% 4/15/22 | 2,105,000 | 2,142,920 | |
| 2.7% 8/15/22 | 1,810,000 | 1,844,411 | |
| 2.9% 8/15/24 | 5,981,000 | 6,061,843 | |
| 3.125% 2/15/22 | 4,427,000 | 4,530,846 | |
| 3.2% 8/15/26 | 805,000 | 819,604 | |
| 3.5% 8/15/29 | 2,534,000 | 2,556,792 | |
| 4.3% 8/15/39 | 369,000 | 354,291 | |
| 4.4% 8/15/49 | 1,569,000 | 1,492,759 | |
| 4.85% 3/15/21 | 1,762,000 | 1,808,134 | |
| 5.55% 3/15/26 | 7,413,000 | 8,374,928 | |
| 6.45% 9/15/36 | 4,200,000 | 4,961,575 | |
| 6.6% 3/15/46 | 6,475,000 | 7,860,624 | |
| 6.95% 7/1/24 | 975,000 | 1,145,009 | |
| 7.5% 5/1/31 | 8,126,000 | 10,324,812 | |
| ONEOK Partners LP: | |||
| 3.375% 10/1/22 | 1,065,000 | 1,101,711 | |
| 6.65% 10/1/36 | 400,000 | 518,220 | |
| ONEOK, Inc.: | |||
| 4.45% 9/1/49 | 1,335,000 | 1,369,789 | |
| 4.95% 7/13/47 | 365,000 | 400,102 | |
| Parsley Energy LLC/Parsley 5.25% 8/15/25 (b) | 700,000 | 693,000 | |
| Pemex Project Funding Master Trust 6.625% 6/15/35 | 800,000 | 800,400 | |
| Petro-Canada 6.8% 5/15/38 | 350,000 | 510,919 | |
| Petrobras Global Finance BV 7.25% 3/17/44 | 34,097,000 | 42,049,488 | |
| Petroleos Mexicanos: | |||
| 6.375% 1/23/45 | 160,000 | 150,080 | |
| 6.5% 3/13/27 | 30,470,000 | 31,879,238 | |
| 6.75% 9/21/47 | 26,150,000 | 25,040,913 | |
| 6.84% 1/23/30 (b) | 11,864,000 | 12,397,880 | |
| 7.69% 1/23/50 (b) | 80,620,000 | 84,167,280 | |
| Phillips 66 Co. 4.875% 11/15/44 | 305,000 | 367,056 | |
| Phillips 66 Partners LP 3.75% 3/1/28 | 295,000 | 316,290 | |
| Plains All American Pipeline LP/PAA Finance Corp.: | |||
| 3.55% 12/15/29 | 2,689,000 | 2,645,374 | |
| 3.6% 11/1/24 | 1,877,000 | 1,945,072 | |
| 3.65% 6/1/22 | 10,550,000 | 10,845,627 | |
| QEP Resources, Inc. 5.25% 5/1/23 | 300,000 | 265,560 | |
| Regency Energy Partners LP/Regency Energy Finance Corp. 5.875% 3/1/22 | 2,310,000 | 2,466,224 | |
| Schlumberger Investment SA 3.65% 12/1/23 | 210,000 | 223,873 | |
| Shell International Finance BV 3.25% 5/11/25 | 1,465,000 | 1,578,712 | |
| Spectra Energy Partners LP 4.75% 3/15/24 | 6,000,000 | 6,600,699 | |
| Sunoco Logistics Partner Operations LP: | |||
| 5.35% 5/15/45 | 850,000 | 877,552 | |
| 5.4% 10/1/47 | 1,861,000 | 1,972,894 | |
| Sunoco LP/Sunoco Finance Corp. 5.5% 2/15/26 | 500,000 | 507,550 | |
| Targa Resources Partners LP/Targa Resources Partners Finance Corp.: | |||
| 4.25% 11/15/23 | 600,000 | 594,300 | |
| 5.125% 2/1/25 | 900,000 | 903,393 | |
| 5.875% 4/15/26 | 400,000 | 412,040 | |
| The Williams Companies, Inc.: | |||
| 3.7% 1/15/23 | 2,512,000 | 2,622,014 | |
| 4.55% 6/24/24 | 12,246,000 | 13,416,927 | |
| Total Capital International SA: | |||
| 2.7% 1/25/23 | 1,375,000 | 1,421,848 | |
| 2.829% 1/10/30 | 800,000 | 845,192 | |
| Valero Energy Corp. 4% 4/1/29 | 820,000 | 891,421 | |
| Viper Energy Partners LP 5.375% 11/1/27 (b) | 300,000 | 304,890 | |
| Western Gas Partners LP: | |||
| 3.95% 6/1/25 | 1,126,000 | 1,142,702 | |
| 4.65% 7/1/26 | 1,931,000 | 2,026,878 | |
| 4.75% 8/15/28 | 1,465,000 | 1,500,665 | |
| 5.3% 3/1/48 | 645,000 | 585,913 | |
| 5.375% 6/1/21 | 4,846,000 | 4,993,579 | |
| Williams Partners LP: | |||
| 3.6% 3/15/22 | 660,000 | 681,096 | |
| 3.75% 6/15/27 | 1,635,000 | 1,714,963 | |
| 4% 11/15/21 | 1,643,000 | 1,701,267 | |
| 4.125% 11/15/20 | 394,000 | 398,021 | |
| 4.3% 3/4/24 | 2,607,000 | 2,822,528 | |
| 4.85% 3/1/48 | 100,000 | 105,424 | |
| 4.9% 1/15/45 | 470,000 | 503,454 | |
| 531,962,231 | |||
| TOTAL ENERGY | 534,850,038 | ||
| FINANCIALS - 3.1% | |||
| Banks - 1.7% | |||
| Banco Santander SA 3.848% 4/12/23 | 800,000 | 847,441 | |
| Bank of America Corp.: | |||
| 2.496% 2/13/31 (a) | 1,800,000 | 1,827,728 | |
| 3.004% 12/20/23 (a) | 10,921,000 | 11,317,016 | |
| 3.3% 1/11/23 | 3,572,000 | 3,734,534 | |
| 3.419% 12/20/28 (a) | 14,538,000 | 15,708,665 | |
| 3.5% 4/19/26 | 5,358,000 | 5,852,671 | |
| 3.95% 4/21/25 | 14,568,000 | 15,900,465 | |
| 3.97% 3/5/29 (a) | 7,295,000 | 8,207,871 | |
| 4% 1/22/25 | 45,375,000 | 49,435,241 | |
| 4.1% 7/24/23 | 13,989,000 | 15,148,796 | |
| 4.2% 8/26/24 | 2,028,000 | 2,226,267 | |
| 4.25% 10/22/26 | 10,727,000 | 11,975,936 | |
| 4.45% 3/3/26 | 2,065,000 | 2,330,881 | |
| Banque Federative du Credit Mutuel SA 3 month U.S. LIBOR + 0.730% 2.5491% 7/20/22 (a)(b)(c) | 8,041,000 | 8,128,387 | |
| Barclays PLC: | |||
| 3.65% 3/16/25 | 1,400,000 | 1,485,286 | |
| 3.932% 5/7/25 (a) | 200,000 | 212,708 | |
| 4.375% 1/12/26 | 1,440,000 | 1,588,968 | |
| 4.836% 5/9/28 | 6,667,000 | 7,375,788 | |
| 4.95% 1/10/47 | 1,405,000 | 1,708,483 | |
| 4.972% 5/16/29 (a) | 15,000,000 | 17,353,328 | |
| 5.088% 6/20/30 (a) | 13,438,000 | 15,257,951 | |
| 5.2% 5/12/26 | 1,701,000 | 1,897,074 | |
| Capital One Bank NA 3.375% 2/15/23 | 1,035,000 | 1,082,849 | |
| Capital One NA 2.15% 9/6/22 | 5,084,000 | 5,134,994 | |
| CIT Group, Inc.: | |||
| 4.75% 2/16/24 | 2,480,000 | 2,635,000 | |
| 5% 8/1/23 | 7,000,000 | 7,472,500 | |
| 6.125% 3/9/28 | 4,840,000 | 5,808,000 | |
| Citigroup, Inc.: | |||
| 2.666% 1/29/31 (a) | 4,890,000 | 5,014,319 | |
| 2.7% 10/27/22 | 50,590,000 | 52,069,009 | |
| 3.2% 10/21/26 | 3,500,000 | 3,726,193 | |
| 3.352% 4/24/25 (a) | 6,698,000 | 7,091,608 | |
| 3.4% 5/1/26 | 1,045,000 | 1,129,904 | |
| 3.668% 7/24/28 (a) | 1,275,000 | 1,396,541 | |
| 3.7% 1/12/26 | 4,465,000 | 4,884,865 | |
| 4.05% 7/30/22 | 1,159,000 | 1,223,062 | |
| 4.3% 11/20/26 | 2,129,000 | 2,357,007 | |
| 4.4% 6/10/25 | 17,376,000 | 19,336,359 | |
| 4.45% 9/29/27 | 6,075,000 | 6,865,834 | |
| 4.5% 1/14/22 | 2,773,000 | 2,915,280 | |
| 4.6% 3/9/26 | 5,735,000 | 6,490,226 | |
| 4.75% 5/18/46 | 10,000,000 | 12,615,431 | |
| 5.5% 9/13/25 | 8,267,000 | 9,679,642 | |
| Citizens Financial Group, Inc.: | |||
| 4.15% 9/28/22 (b) | 3,115,000 | 3,302,158 | |
| 4.3% 12/3/25 | 9,918,000 | 11,071,044 | |
| Commonwealth Bank of Australia 3.61% 9/12/34 (a)(b) | 3,419,000 | 3,634,904 | |
| Credit Suisse Group Funding Guernsey Ltd.: | |||
| 3.75% 3/26/25 | 16,672,000 | 18,023,853 | |
| 3.8% 9/15/22 | 10,230,000 | 10,766,062 | |
| 3.8% 6/9/23 | 9,457,000 | 10,048,704 | |
| 4.55% 4/17/26 | 5,384,000 | 6,073,019 | |
| Discover Bank 7% 4/15/20 | 3,143,000 | 3,162,665 | |
| Export-Import Bank of Korea 5.125% 6/29/20 | 800,000 | 809,016 | |
| Fifth Third Bancorp 8.25% 3/1/38 | 603,000 | 1,005,815 | |
| HSBC Holdings PLC: | |||
| 3.973% 5/22/30 (a) | 1,000,000 | 1,096,276 | |
| 4.041% 3/13/28 (a) | 2,880,000 | 3,155,222 | |
| 4.25% 3/14/24 | 1,872,000 | 2,012,404 | |
| 4.583% 6/19/29 (a) | 1,300,000 | 1,479,073 | |
| 4.875% 1/14/22 | 4,645,000 | 4,918,098 | |
| Huntington Bancshares, Inc. 7% 12/15/20 | 404,000 | 420,265 | |
| Intesa Sanpaolo SpA: | |||
| 5.017% 6/26/24 (b) | 31,005,000 | 32,644,744 | |
| 5.71% 1/15/26 (b) | 7,646,000 | 8,316,591 | |
| Japan Bank International Cooperation 3.25% 7/20/23 | 400,000 | 427,011 | |
| JPMorgan Chase & Co.: | |||
| 2.95% 10/1/26 | 4,205,000 | 4,457,849 | |
| 3.3% 4/1/26 | 1,125,000 | 1,216,433 | |
| 3.509% 1/23/29 (a) | 7,005,000 | 7,646,029 | |
| 3.625% 5/13/24 | 2,860,000 | 3,092,888 | |
| 3.797% 7/23/24 (a) | 10,889,000 | 11,639,516 | |
| 3.875% 9/10/24 | 10,030,000 | 10,863,018 | |
| 3.882% 7/24/38 (a) | 6,115,000 | 7,008,631 | |
| 3.964% 11/15/48 (a) | 1,945,000 | 2,314,911 | |
| 4.125% 12/15/26 | 7,374,000 | 8,296,975 | |
| 4.35% 8/15/21 | 4,947,000 | 5,140,725 | |
| 4.625% 5/10/21 | 1,718,000 | 1,781,341 | |
| Lloyds Banking Group PLC: | |||
| 2.438% 2/5/26 (a) | 1,010,000 | 1,028,663 | |
| 3.9% 3/12/24 | 300,000 | 322,385 | |
| 4.375% 3/22/28 | 1,365,000 | 1,528,497 | |
| Peoples United Bank 4% 7/15/24 | 40,000 | 42,569 | |
| PNC Bank NA 3.25% 6/1/25 | 1,710,000 | 1,836,660 | |
| PNC Financial Services Group, Inc.: | |||
| 2.854% 11/9/22 | 275,000 | 283,440 | |
| 3.9% 4/29/24 | 375,000 | 405,295 | |
| Rabobank Nederland 4.375% 8/4/25 | 7,713,000 | 8,564,270 | |
| Royal Bank of Scotland Group PLC: | |||
| 4.269% 3/22/25 (a) | 1,735,000 | 1,870,509 | |
| 4.8% 4/5/26 | 15,438,000 | 17,648,574 | |
| 5.125% 5/28/24 | 25,198,000 | 27,585,320 | |
| 6% 12/19/23 | 40,605,000 | 45,526,170 | |
| 6.1% 6/10/23 | 35,526,000 | 39,306,706 | |
| 6.125% 12/15/22 | 5,889,000 | 6,424,433 | |
| Societe Generale 4.25% 4/14/25 (b) | 21,901,000 | 23,498,792 | |
| Sumitomo Mitsui Banking Corp. 3.95% 7/19/23 | 250,000 | 269,419 | |
| SunTrust Banks, Inc. 2.7% 1/27/22 | 540,000 | 551,857 | |
| Synchrony Bank 3% 6/15/22 | 5,477,000 | 5,631,792 | |
| UniCredit SpA 6.572% 1/14/22 (b) | 7,600,000 | 8,162,675 | |
| Wells Fargo & Co.: | |||
| 2.1% 7/26/21 | 1,530,000 | 1,543,945 | |
| 2.572% 2/11/31 (a) | 1,965,000 | 2,002,744 | |
| 2.879% 10/30/30 (a) | 3,110,000 | 3,248,278 | |
| 3% 2/19/25 | 7,625,000 | 8,048,644 | |
| 4.125% 8/15/23 | 280,000 | 301,871 | |
| 4.3% 7/22/27 | 21,880,000 | 24,620,802 | |
| 4.65% 11/4/44 | 1,385,000 | 1,685,238 | |
| Westpac Banking Corp. 4.11% 7/24/34 (a) | 4,937,000 | 5,404,006 | |
| 781,618,902 | |||
| Capital Markets - 0.8% | |||
| Affiliated Managers Group, Inc. 4.25% 2/15/24 | 1,847,000 | 2,006,797 | |
| Ares Capital Corp. 4.2% 6/10/24 | 12,032,000 | 12,777,672 | |
| Bank of New York Mellon Corp. 3.4% 5/15/24 | 750,000 | 803,514 | |
| Credit Suisse Group AG 2.593% 9/11/25 (a)(b) | 13,060,000 | 13,333,383 | |
| Deutsche Bank AG 4.5% 4/1/25 | 13,996,000 | 13,945,956 | |
| Deutsche Bank AG New York Branch: | |||
| 3.3% 11/16/22 | 10,180,000 | 10,448,637 | |
| 5% 2/14/22 | 14,609,000 | 15,374,097 | |
| Goldman Sachs Group, Inc.: | |||
| 2.876% 10/31/22 (a) | 12,744,000 | 12,996,323 | |
| 3.2% 2/23/23 | 5,700,000 | 5,960,556 | |
| 3.691% 6/5/28 (a) | 5,415,000 | 5,919,879 | |
| 3.75% 2/25/26 | 1,650,000 | 1,803,547 | |
| 6.75% 10/1/37 | 50,999,000 | 73,075,732 | |
| Intercontinental Exchange, Inc.: | |||
| 2.75% 12/1/20 | 1,768,000 | 1,783,619 | |
| 3.75% 12/1/25 | 3,162,000 | 3,485,737 | |
| Moody's Corp.: | |||
| 3.25% 1/15/28 | 2,897,000 | 3,154,413 | |
| 4.875% 2/15/24 | 2,720,000 | 3,027,396 | |
| Morgan Stanley: | |||
| 3 month U.S. LIBOR + 0.930% 2.7321% 7/22/22 (a)(c) | 3,691,000 | 3,715,899 | |
| 3.125% 1/23/23 | 7,600,000 | 7,930,025 | |
| 3.125% 7/27/26 | 37,616,000 | 40,088,891 | |
| 3.591% 7/22/28 (a) | 2,610,000 | 2,856,750 | |
| 3.7% 10/23/24 | 21,259,000 | 23,116,857 | |
| 3.75% 2/25/23 | 3,725,000 | 3,964,469 | |
| 3.875% 4/29/24 | 4,200,000 | 4,565,589 | |
| 3.875% 1/27/26 | 1,125,000 | 1,244,136 | |
| 4% 7/23/25 | 2,450,000 | 2,720,355 | |
| 4.1% 5/22/23 | 4,350,000 | 4,650,368 | |
| 4.35% 9/8/26 | 2,340,000 | 2,619,497 | |
| 4.431% 1/23/30 (a) | 6,039,000 | 7,013,357 | |
| 5% 11/24/25 | 40,891,000 | 47,185,087 | |
| 5.75% 1/25/21 | 4,996,000 | 5,174,299 | |
| Nomura Holdings, Inc. 2.648% 1/16/25 | 1,525,000 | 1,566,378 | |
| 338,309,215 | |||
| Consumer Finance - 0.3% | |||
| AerCap Ireland Capital Ltd./AerCap Global Aviation Trust: | |||
| 2.875% 8/14/24 | 7,954,000 | 8,102,526 | |
| 3.5% 5/26/22 | 1,949,000 | 2,003,806 | |
| 4.125% 7/3/23 | 5,132,000 | 5,456,220 | |
| 4.45% 12/16/21 | 4,011,000 | 4,179,175 | |
| 4.45% 4/3/26 | 4,282,000 | 4,679,925 | |
| 4.5% 5/15/21 | 1,455,000 | 1,503,038 | |
| 4.875% 1/16/24 | 6,861,000 | 7,465,960 | |
| 5% 10/1/21 | 2,185,000 | 2,289,116 | |
| Ally Financial, Inc.: | |||
| 4.125% 2/13/22 | 1,700,000 | 1,765,467 | |
| 5.125% 9/30/24 | 1,700,000 | 1,883,294 | |
| Capital One Financial Corp. 3.8% 1/31/28 | 7,795,000 | 8,505,995 | |
| Discover Financial Services: | |||
| 3.85% 11/21/22 | 2,293,000 | 2,424,968 | |
| 3.95% 11/6/24 | 2,567,000 | 2,781,570 | |
| 4.1% 2/9/27 | 645,000 | 704,473 | |
| 4.5% 1/30/26 | 6,463,000 | 7,196,595 | |
| 5.2% 4/27/22 | 1,093,000 | 1,177,177 | |
| Ford Motor Credit Co. LLC: | |||
| 3.35% 11/1/22 | 3,970,000 | 4,007,243 | |
| 3.664% 9/8/24 | 1,275,000 | 1,271,197 | |
| 4.063% 11/1/24 | 22,139,000 | 22,559,616 | |
| 5.085% 1/7/21 | 4,004,000 | 4,108,045 | |
| 5.584% 3/18/24 | 8,575,000 | 9,174,834 | |
| 5.596% 1/7/22 | 8,285,000 | 8,741,683 | |
| GE Capital International Funding Co. 4.418% 11/15/35 | 1,370,000 | 1,564,401 | |
| John Deere Capital Corp.: | |||
| 2.65% 6/24/24 | 615,000 | 647,246 | |
| 2.8% 1/27/23 | 990,000 | 1,033,288 | |
| 2.8% 3/6/23 | 1,045,000 | 1,089,987 | |
| Navient Corp.: | |||
| 6.625% 7/26/21 | 1,300,000 | 1,338,376 | |
| 7.25% 1/25/22 | 1,300,000 | 1,368,250 | |
| Springleaf Finance Corp. 6.875% 3/15/25 | 500,000 | 550,000 | |
| Synchrony Financial: | |||
| 2.85% 7/25/22 | 2,029,000 | 2,074,882 | |
| 3.75% 8/15/21 | 2,016,000 | 2,068,337 | |
| 3.95% 12/1/27 | 8,719,000 | 9,356,535 | |
| 4.25% 8/15/24 | 2,029,000 | 2,181,337 | |
| 4.375% 3/19/24 | 3,130,000 | 3,373,100 | |
| 5.15% 3/19/29 | 11,000,000 | 12,825,679 | |
| 151,453,341 | |||
| Diversified Financial Services - 0.1% | |||
| AXA Equitable Holdings, Inc. 3.9% 4/20/23 | 1,273,000 | 1,353,624 | |
| Berkshire Hathaway, Inc.: | |||
| 2.75% 3/15/23 | 2,695,000 | 2,799,359 | |
| 3.125% 3/15/26 | 1,615,000 | 1,750,547 | |
| BP Capital Markets America, Inc. 3.245% 5/6/22 | 2,610,000 | 2,709,542 | |
| Brixmor Operating Partnership LP: | |||
| 4.125% 6/15/26 | 5,706,000 | 6,326,435 | |
| 4.125% 5/15/29 | 6,724,000 | 7,507,961 | |
| General Electric Capital Corp.: | |||
| 3.15% 9/7/22 | 1,386,000 | 1,431,487 | |
| 3.45% 5/15/24 | 920,000 | 971,757 | |
| Icahn Enterprises LP/Icahn Enterprises Finance Corp.: | |||
| 4.75% 9/15/24 (b) | 305,000 | 311,100 | |
| 6.25% 5/15/26 | 1,100,000 | 1,127,621 | |
| 6.375% 12/15/25 | 1,100,000 | 1,135,750 | |
| MPH Acquisition Holdings LLC 7.125% 6/1/24 (b) | 385,000 | 358,135 | |
| Park Aerospace Holdings Ltd. 5.5% 2/15/24 (b) | 7,000,000 | 7,697,426 | |
| Pine Street Trust I: | |||
| 4.572% 2/15/29 (b) | 7,798,000 | 8,834,894 | |
| 5.568% 2/15/49 (b) | 7,800,000 | 9,735,022 | |
| Voya Financial, Inc. 3.125% 7/15/24 | 3,436,000 | 3,634,461 | |
| 57,685,121 | |||
| Insurance - 0.2% | |||
| ACE INA Holdings, Inc.: | |||
| 2.7% 3/13/23 | 1,105,000 | 1,148,390 | |
| 3.15% 3/15/25 | 1,615,000 | 1,744,440 | |
| American International Group, Inc.: | |||
| 3.75% 7/10/25 | 2,360,000 | 2,574,736 | |
| 4.125% 2/15/24 | 360,000 | 393,104 | |
| 4.5% 7/16/44 | 2,530,000 | 3,102,931 | |
| 4.875% 6/1/22 | 3,898,000 | 4,153,626 | |
| Aon Corp. 5% 9/30/20 | 540,000 | 550,232 | |
| Arch Capital Finance LLC 4.011% 12/15/26 | 1,970,000 | 2,251,208 | |
| CNA Financial Corp. 3.95% 5/15/24 | 1,400,000 | 1,518,800 | |
| Liberty Mutual Group, Inc. 4.569% 2/1/29 (b) | 1,847,000 | 2,173,536 | |
| Lincoln National Corp.: | |||
| 3.05% 1/15/30 | 130,000 | 137,036 | |
| 4.35% 3/1/48 | 165,000 | 188,485 | |
| 6.3% 10/9/37 | 110,000 | 155,653 | |
| Markel Corp.: | |||
| 4.15% 9/17/50 | 1,040,000 | 1,191,065 | |
| 4.3% 11/1/47 | 525,000 | 587,677 | |
| Marsh & McLennan Companies, Inc.: | |||
| 3.5% 6/3/24 | 1,140,000 | 1,218,721 | |
| 4.375% 3/15/29 | 5,432,000 | 6,330,393 | |
| 4.75% 3/15/39 | 2,493,000 | 3,225,363 | |
| 4.8% 7/15/21 | 1,026,000 | 1,065,096 | |
| 4.9% 3/15/49 | 4,960,000 | 6,650,254 | |
| MetLife, Inc. 4.368% 9/15/23 (a) | 910,000 | 1,005,835 | |
| Metropolitan Life Global Funding I U.S. SOFR SEC OVRN FIN RATE INDX + 0.500% 2.08% 5/28/21 (a)(b)(c) | 31,400,000 | 31,462,133 | |
| Pricoa Global Funding I 5.375% 5/15/45 (a) | 5,278,000 | 5,762,943 | |
| Prudential Financial, Inc. 4.5% 11/16/21 | 1,118,000 | 1,173,545 | |
| Swiss Re Finance Luxembourg SA 5% 4/2/49 (a)(b) | 3,200,000 | 3,620,800 | |
| The Chubb Corp. 6% 5/11/37 | 300,000 | 453,811 | |
| Unum Group: | |||
| 4% 6/15/29 | 5,961,000 | 6,595,605 | |
| 5.625% 9/15/20 | 3,216,000 | 3,283,689 | |
| 5.75% 8/15/42 | 2,238,000 | 2,723,638 | |
| 96,442,745 | |||
| Thrifts & Mortgage Finance - 0.0% | |||
| Quicken Loans, Inc. 5.25% 1/15/28 (b) | 600,000 | 620,820 | |
| TOTAL FINANCIALS | 1,426,130,144 | ||
| HEALTH CARE - 0.7% | |||
| Biotechnology - 0.1% | |||
| AbbVie, Inc.: | |||
| 3.6% 5/14/25 | 2,980,000 | 3,214,604 | |
| 4.25% 11/21/49 (b) | 3,195,000 | 3,601,904 | |
| 4.7% 5/14/45 | 2,925,000 | 3,449,456 | |
| 4.875% 11/14/48 | 585,000 | 719,915 | |
| Amgen, Inc. 2.6% 8/19/26 | 4,225,000 | 4,469,219 | |
| Baxalta, Inc. 4% 6/23/25 | 579,000 | 638,875 | |
| Gilead Sciences, Inc.: | |||
| 3.25% 9/1/22 | 195,000 | 203,834 | |
| 3.65% 3/1/26 | 685,000 | 753,993 | |
| 4.4% 12/1/21 | 1,120,000 | 1,171,033 | |
| 4.5% 2/1/45 | 665,000 | 814,088 | |
| 19,036,921 | |||
| Health Care Equipment & Supplies - 0.0% | |||
| Abbott Laboratories: | |||
| 2.55% 3/15/22 | 500,000 | 512,703 | |
| 3.75% 11/30/26 | 937,000 | 1,056,865 | |
| 4.9% 11/30/46 | 1,460,000 | 2,026,304 | |
| Becton, Dickinson & Co.: | |||
| 2.404% 6/5/20 | 4,246,000 | 4,254,271 | |
| 3.125% 11/8/21 | 1,050,000 | 1,077,026 | |
| 3.7% 6/6/27 | 118,000 | 130,328 | |
| 3.734% 12/15/24 | 855,000 | 926,133 | |
| Hologic, Inc. 4.375% 10/15/25 (b) | 200,000 | 203,690 | |
| Stryker Corp.: | |||
| 3.375% 5/15/24 | 335,000 | 356,193 | |
| 3.375% 11/1/25 | 305,000 | 331,263 | |
| 3.5% 3/15/26 | 675,000 | 737,757 | |
| Teleflex, Inc. 4.875% 6/1/26 | 1,000,000 | 1,042,500 | |
| 12,655,033 | |||
| Health Care Providers & Services - 0.4% | |||
| Anthem, Inc.: | |||
| 3.3% 1/15/23 | 3,395,000 | 3,548,556 | |
| 3.65% 12/1/27 | 3,535,000 | 3,865,359 | |
| Ascension Health: | |||
| 3.106% 11/15/39 | 610,000 | 672,204 | |
| 3.945% 11/15/46 | 465,000 | 577,388 | |
| 4.847% 11/15/53 | 250,000 | 358,178 | |
| Cardinal Health, Inc. 3.2% 6/15/22 | 405,000 | 419,280 | |
| Centene Corp.: | |||
| 3.375% 2/15/30 (b) | 4,420,000 | 4,420,000 | |
| 4.25% 12/15/27 (b) | 5,580,000 | 5,740,704 | |
| 4.625% 12/15/29 (b) | 7,750,000 | 8,292,500 | |
| 4.75% 1/15/25 (b) | 3,965,000 | 4,065,513 | |
| 5.25% 4/1/25 (b) | 1,300,000 | 1,337,375 | |
| 5.375% 8/15/26 (b) | 200,000 | 210,000 | |
| Childrens Hospital Corp. 4.115% 1/1/47 | 580,000 | 736,827 | |
| Cigna Corp.: | |||
| 3.25% 4/15/25 (b) | 1,080,000 | 1,145,511 | |
| 3.75% 7/15/23 | 6,229,000 | 6,631,301 | |
| 4% 2/15/22 (b) | 1,910,000 | 1,981,377 | |
| 4.125% 9/15/20 (b) | 1,049,000 | 1,063,263 | |
| 4.125% 11/15/25 | 4,646,000 | 5,169,012 | |
| 4.375% 10/15/28 | 7,774,000 | 8,842,098 | |
| 4.5% 2/25/26 (b) | 4,925,000 | 5,566,091 | |
| 4.8% 8/15/38 | 4,840,000 | 5,820,190 | |
| 4.9% 12/15/48 | 4,836,000 | 6,000,062 | |
| CommonSpirit Health 2.76% 10/1/24 | 950,000 | 989,949 | |
| CVS Health Corp.: | |||
| 3% 8/15/26 | 828,000 | 867,830 | |
| 3.25% 8/15/29 | 1,903,000 | 1,996,117 | |
| 4.1% 3/25/25 | 30,084,000 | 32,970,880 | |
| 4.3% 3/25/28 | 20,029,000 | 22,413,516 | |
| 4.78% 3/25/38 | 7,778,000 | 9,173,043 | |
| 5.05% 3/25/48 | 12,863,000 | 15,830,848 | |
| 5.125% 7/20/45 | 125,000 | 152,319 | |
| 5.3% 12/5/43 | 305,000 | 377,444 | |
| Hackensack Meridian Health 4.5% 7/1/57 | 385,000 | 521,258 | |
| HCA Holdings, Inc.: | |||
| 4.75% 5/1/23 | 205,000 | 222,851 | |
| 5% 3/15/24 | 300,000 | 333,460 | |
| 5.25% 6/15/26 | 900,000 | 1,029,448 | |
| 5.375% 2/1/25 | 500,000 | 552,750 | |
| Kaiser Foundation Hospitals 4.15% 5/1/47 | 1,310,000 | 1,654,316 | |
| Laboratory Corp. of America Holdings: | |||
| 3.25% 9/1/24 | 795,000 | 844,944 | |
| 4.7% 2/1/45 | 830,000 | 996,744 | |
| Memorial Sloan-Kettring Cancer Center: | |||
| 4.2% 7/1/55 | 140,000 | 181,001 | |
| 5% 7/1/42 | 225,000 | 311,647 | |
| Mount Sinai Hospital 3.737% 7/1/49 | 460,000 | 516,907 | |
| New York & Presbyterian Hospital: | |||
| 4.024% 8/1/45 | 550,000 | 688,604 | |
| 4.063% 8/1/56 | 540,000 | 674,479 | |
| NYU Hospitals Center 4.368% 7/1/47 | 810,000 | 1,003,988 | |
| Providence St. Joseph Health Obligated Group: | |||
| 2.532% 10/1/29 | 790,000 | 817,084 | |
| 2.746% 10/1/26 | 780,000 | 837,202 | |
| Quest Diagnostics, Inc.: | |||
| 4.7% 3/30/45 | 100,000 | 121,550 | |
| 5.75% 1/30/40 | 68,000 | 82,621 | |
| Sutter Health 4.091% 8/15/48 | 2,640,000 | 3,329,229 | |
| Tenet Healthcare Corp.: | |||
| 4.875% 1/1/26 (b) | 160,000 | 163,000 | |
| 6.25% 2/1/27 (b) | 120,000 | 125,700 | |
| 8.125% 4/1/22 | 900,000 | 975,105 | |
| Toledo Hospital: | |||
| 5.325% 11/15/28 | 2,792,000 | 3,252,377 | |
| 6.015% 11/15/48 | 5,710,000 | 7,396,574 | |
| UnitedHealth Group, Inc.: | |||
| 4.25% 4/15/47 | 645,000 | 780,569 | |
| 4.25% 6/15/48 | 1,350,000 | 1,637,911 | |
| 4.7% 2/15/21 | 240,000 | 245,172 | |
| 6.875% 2/15/38 | 700,000 | 1,068,029 | |
| 191,599,255 | |||
| Health Care Technology - 0.0% | |||
| IMS Health, Inc. 5% 10/15/26 (b) | 900,000 | 928,445 | |
| Life Sciences Tools & Services - 0.0% | |||
| Charles River Laboratories International, Inc.: | |||
| 4.25% 5/1/28 (b) | 30,000 | 30,189 | |
| 5.5% 4/1/26 (b) | 100,000 | 105,143 | |
| Thermo Fisher Scientific, Inc. 4.15% 2/1/24 | 570,000 | 621,622 | |
| 756,954 | |||
| Pharmaceuticals - 0.2% | |||
| Actavis Funding SCS: | |||
| 3.85% 6/15/24 | 560,000 | 607,020 | |
| 4.55% 3/15/35 | 400,000 | 477,531 | |
| Bayer U.S. Finance II LLC 4.25% 12/15/25 (b) | 51,454,000 | 57,275,593 | |
| Bristol-Myers Squibb Co.: | |||
| 3.625% 5/15/24 (b) | 910,000 | 981,841 | |
| 4.25% 10/26/49 (b) | 1,770,000 | 2,276,870 | |
| 5% 8/15/45 (b) | 510,000 | 695,404 | |
| Elanco Animal Health, Inc.: | |||
| 4.662% 8/27/21 (a) | 1,274,000 | 1,335,770 | |
| 5.022% 8/28/23 (a) | 4,020,000 | 4,305,769 | |
| 5.65% 8/28/28 (a) | 1,693,000 | 1,939,261 | |
| GlaxoSmithKline Capital PLC 2.85% 5/8/22 | 710,000 | 731,588 | |
| GlaxoSmithKline Capital, Inc. 2.8% 3/18/23 | 1,425,000 | 1,480,900 | |
| Johnson & Johnson: | |||
| 2.45% 3/1/26 | 45,000 | 47,329 | |
| 3.625% 3/3/37 | 1,585,000 | 1,826,307 | |
| Merck & Co., Inc.: | |||
| 2.4% 9/15/22 | 2,875,000 | 2,940,160 | |
| 3.4% 3/7/29 | 1,525,000 | 1,708,197 | |
| Mylan NV: | |||
| 3.15% 6/15/21 | 5,494,000 | 5,581,504 | |
| 3.95% 6/15/26 | 2,804,000 | 3,048,625 | |
| 5.2% 4/15/48 | 1,680,000 | 1,990,188 | |
| Novartis Capital Corp.: | |||
| 2.4% 9/21/22 | 4,195,000 | 4,317,234 | |
| 4% 11/20/45 | 1,340,000 | 1,684,152 | |
| Perrigo Finance PLC 3.5% 12/15/21 | 400,000 | 409,626 | |
| Shire Acquisitions Investments Ireland DAC 3.2% 9/23/26 | 2,490,000 | 2,670,755 | |
| Teva Pharmaceutical Finance Netherlands III BV 2.2% 7/21/21 | 1,013,000 | 982,711 | |
| Valeant Pharmaceuticals International, Inc. 7% 3/15/24 (b) | 1,300,000 | 1,338,454 | |
| Wyeth LLC 6.45% 2/1/24 | 3,255,000 | 3,864,805 | |
| Zoetis, Inc. 3.25% 2/1/23 | 5,975,000 | 6,270,895 | |
| 110,788,489 | |||
| TOTAL HEALTH CARE | 335,765,097 | ||
| INDUSTRIALS - 0.2% | |||
| Aerospace & Defense - 0.0% | |||
| BBA U.S. Holdings, Inc. 5.375% 5/1/26 (b) | 700,000 | 714,249 | |
| BWX Technologies, Inc. 5.375% 7/15/26 (b) | 700,000 | 732,764 | |
| Embraer Netherlands Finance BV 5.4% 2/1/27 | 75,000 | 85,031 | |
| General Dynamics Corp.: | |||
| 2.25% 11/15/22 | 1,000,000 | 1,022,906 | |
| 3.5% 5/15/25 | 1,905,000 | 2,089,059 | |
| Lockheed Martin Corp.: | |||
| 2.9% 3/1/25 | 3,640,000 | 3,871,593 | |
| 3.8% 3/1/45 | 485,000 | 572,000 | |
| Moog, Inc. 4.25% 12/15/27 (b) | 30,000 | 30,525 | |
| Northrop Grumman Corp. 4.75% 6/1/43 | 820,000 | 1,064,432 | |
| Rockwell Collins, Inc. 3.5% 3/15/27 | 2,225,000 | 2,474,965 | |
| The Boeing Co.: | |||
| 2.25% 6/15/26 | 1,335,000 | 1,340,010 | |
| 3.1% 5/1/26 | 360,000 | 381,442 | |
| 3.6% 5/1/34 | 1,750,000 | 1,931,177 | |
| TransDigm, Inc.: | |||
| 6.25% 3/15/26 (b) | 850,000 | 899,939 | |
| 7.5% 3/15/27 | 40,000 | 42,152 | |
| United Technologies Corp. 4.125% 11/16/28 | 490,000 | 573,514 | |
| 17,825,758 | |||
| Air Freight & Logistics - 0.0% | |||
| Aercap Global Aviation Trust 6.5% 6/15/45 (a)(b) | 180,000 | 193,500 | |
| FedEx Corp. 3.3% 3/15/27 | 280,000 | 296,853 | |
| United Parcel Service, Inc. 2.05% 4/1/21 | 150,000 | 150,980 | |
| 641,333 | |||
| Airlines - 0.0% | |||
| American Airelines 2014-1 Class A Pass-Through Trust Equipment Trust Certificate 3.7% 4/1/28 | 239,755 | 260,110 | |
| American Airlines, Inc. equipment trust certificate 3.2% 12/15/29 | 461,430 | 495,793 | |
| Continental Airlines, Inc. 4.15% 10/11/25 | 748,086 | 806,337 | |
| Delta Air Lines, Inc. 3.625% 3/15/22 | 480,000 | 494,372 | |
| Delta Air Lines, Inc. pass-thru trust certificates 6.821% 2/10/24 | 111,008 | 121,632 | |
| Southwest Airlines Co. 2.625% 2/10/30 | 735,000 | 738,358 | |
| United Airlines pass-thru Trust Series 2013-1A Class O, 4.3% 2/15/27 | 149,184 | 163,452 | |
| 3,080,054 | |||
| Building Products - 0.0% | |||
| Advanced Drain Systems, Inc. 5% 9/30/27 (b) | 400,000 | 413,500 | |
| Johnson Controls International PLC 4.95% 7/2/64 | 197,000 | 237,348 | |
| Masco Corp. 4.45% 4/1/25 | 1,610,000 | 1,793,607 | |
| 2,444,455 | |||
| Commercial Services & Supplies - 0.0% | |||
| Advocate Health & Hospitals Corp. 3.387% 10/15/49 | 510,000 | 582,704 | |
| Cintas Corp. No. 2 3.7% 4/1/27 | 1,135,000 | 1,279,420 | |
| LBC Tank Terminals Holding Netherlands BV 6.875% 5/15/23 (b) | 300,000 | 303,006 | |
| Nielsen Co. SARL (Luxembourg) 5% 2/1/25 (b) | 520,000 | 513,500 | |
| Nielsen Finance LLC/Nielsen Finance Co. 5% 4/15/22 (b) | 1,200,000 | 1,194,000 | |
| Waste Management, Inc. 2.9% 9/15/22 | 375,000 | 387,956 | |
| WMX Technologies, Inc. 4.6% 3/1/21 | 345,000 | 352,226 | |
| 4,612,812 | |||
| Construction & Engineering - 0.0% | |||
| AECOM: | |||
| 5.125% 3/15/27 | 600,000 | 619,962 | |
| 5.875% 10/15/24 | 1,100,000 | 1,207,250 | |
| 1,827,212 | |||
| Electrical Equipment - 0.0% | |||
| ABB Finance (U.S.A.), Inc. 2.875% 5/8/22 | 115,000 | 118,716 | |
| Sensata Technologies BV 4.875% 10/15/23 (b) | 800,000 | 844,000 | |
| 962,716 | |||
| Industrial Conglomerates - 0.0% | |||
| Covidien International Finance SA 3.2% 6/15/22 | 865,000 | 895,056 | |
| General Electric Co. 2.7% 10/9/22 | 1,170,000 | 1,195,561 | |
| 2,090,617 | |||
| Machinery - 0.0% | |||
| Fortive Corp. 3.15% 6/15/26 | 275,000 | 290,469 | |
| Pentair Finance SA 4.5% 7/1/29 | 670,000 | 752,975 | |
| Westinghouse Air Brake Co. 4.95% 9/15/28 | 430,000 | 488,997 | |
| Xylem, Inc.: | |||
| 3.25% 11/1/26 | 225,000 | 244,619 | |
| 4.875% 10/1/21 | 525,000 | 552,885 | |
| 2,329,945 | |||
| Professional Services - 0.0% | |||
| Equifax, Inc. 2.6% 12/1/24 | 1,245,000 | 1,288,526 | |
| IHS Markit Ltd. 4.125% 8/1/23 | 365,000 | 390,813 | |
| 1,679,339 | |||
| Road & Rail - 0.1% | |||
| Avolon Holdings Funding Ltd.: | |||
| 3.625% 5/1/22 (b) | 2,155,000 | 2,205,989 | |
| 3.95% 7/1/24 (b) | 2,862,000 | 2,977,379 | |
| 4.375% 5/1/26 (b) | 3,477,000 | 3,702,117 | |
| 5.25% 5/15/24 (b) | 4,140,000 | 4,520,224 | |
| Burlington Northern Santa Fe LLC 4.1% 6/1/21 | 950,000 | 976,089 | |
| Canadian National Railway Co. 2.85% 12/15/21 | 600,000 | 614,068 | |
| CSX Corp.: | |||
| 3.4% 8/1/24 | 1,700,000 | 1,818,798 | |
| 6.15% 5/1/37 | 1,500,000 | 2,090,154 | |
| Union Pacific Corp.: | |||
| 3.6% 9/15/37 | 640,000 | 709,926 | |
| 3.75% 2/5/70 | 315,000 | 329,314 | |
| 4.3% 6/15/42 | 325,000 | 385,529 | |
| 20,329,587 | |||
| Trading Companies & Distributors - 0.1% | |||
| Air Lease Corp.: | |||
| 2.25% 1/15/23 | 1,711,000 | 1,723,809 | |
| 3% 9/15/23 | 800,000 | 824,142 | |
| 3.375% 6/1/21 | 2,750,000 | 2,807,916 | |
| 3.75% 2/1/22 | 4,752,000 | 4,891,921 | |
| 3.875% 4/1/21 | 2,900,000 | 2,970,417 | |
| 4.25% 2/1/24 | 7,846,000 | 8,457,712 | |
| 4.25% 9/15/24 | 3,212,000 | 3,450,921 | |
| 4.75% 3/1/20 | 3,227,000 | 3,227,000 | |
| FLY Leasing Ltd. 5.25% 10/15/24 | 160,000 | 164,000 | |
| 28,517,838 | |||
| Transportation Infrastructure - 0.0% | |||
| BNSF Funding Trust I 6.613% 12/15/55 (a) | 755,000 | 834,275 | |
| TOTAL INDUSTRIALS | 87,175,941 | ||
| INFORMATION TECHNOLOGY - 0.1% | |||
| Communications Equipment - 0.0% | |||
| Cisco Systems, Inc.: | |||
| 1.85% 9/20/21 | 725,000 | 730,065 | |
| 2.9% 3/4/21 | 150,000 | 152,020 | |
| 3% 6/15/22 | 310,000 | 323,106 | |
| 1,205,191 | |||
| Electronic Equipment & Components - 0.0% | |||
| Diamond 1 Finance Corp./Diamond 2 Finance Corp.: | |||
| 5.45% 6/15/23 (b) | 6,100,000 | 6,713,871 | |
| 6.02% 6/15/26 (b) | 2,112,000 | 2,473,423 | |
| TTM Technologies, Inc. 5.625% 10/1/25 (b) | 700,000 | 714,000 | |
| 9,901,294 | |||
| IT Services - 0.0% | |||
| Fiserv, Inc.: | |||
| 2.75% 7/1/24 | 205,000 | 212,741 | |
| 3.85% 6/1/25 | 1,490,000 | 1,629,103 | |
| Global Payments, Inc. 2.65% 2/15/25 | 495,000 | 512,469 | |
| IBM Corp. 3.625% 2/12/24 | 3,865,000 | 4,170,236 | |
| MasterCard, Inc. 3.375% 4/1/24 | 870,000 | 942,425 | |
| Zayo Group LLC/Zayo Capital, Inc. 6.375% 5/15/25 | 400,000 | 409,000 | |
| 7,875,974 | |||
| Semiconductors & Semiconductor Equipment - 0.0% | |||
| Broadcom Corp./Broadcom Cayman LP 3.125% 1/15/25 | 1,260,000 | 1,298,939 | |
| Entegris, Inc. 4.625% 2/10/26 (b) | 400,000 | 412,500 | |
| Qorvo, Inc. 5.5% 7/15/26 | 600,000 | 619,800 | |
| 2,331,239 | |||
| Software - 0.1% | |||
| CDK Global, Inc.: | |||
| 4.875% 6/1/27 | 500,000 | 515,000 | |
| 5.875% 6/15/26 | 200,000 | 209,260 | |
| Microsoft Corp.: | |||
| 2.4% 8/8/26 | 1,815,000 | 1,908,744 | |
| 2.875% 2/6/24 | 1,700,000 | 1,795,825 | |
| 3.7% 8/8/46 | 2,050,000 | 2,479,170 | |
| 4.1% 2/6/37 | 1,930,000 | 2,393,775 | |
| Nortonlifelock, Inc. 5% 4/15/25 (b) | 1,100,000 | 1,116,678 | |
| Nuance Communications, Inc. 5.625% 12/15/26 | 600,000 | 633,000 | |
| Open Text Corp.: | |||
| 3.875% 2/15/28 (b) | 175,000 | 174,160 | |
| 5.875% 6/1/26 (b) | 500,000 | 529,400 | |
| Open Text Holdings, Inc. 4.125% 2/15/30 (b) | 270,000 | 268,650 | |
| Oracle Corp.: | |||
| 2.65% 7/15/26 | 2,795,000 | 2,950,854 | |
| 2.95% 5/15/25 | 2,085,000 | 2,213,030 | |
| 4.125% 5/15/45 | 1,695,000 | 2,064,117 | |
| SS&C Technologies, Inc. 5.5% 9/30/27 (b) | 775,000 | 815,688 | |
| 20,067,351 | |||
| Technology Hardware, Storage & Peripherals - 0.0% | |||
| Apple, Inc.: | |||
| 2.85% 5/11/24 | 2,545,000 | 2,685,661 | |
| 3.25% 2/23/26 | 9,525,000 | 10,392,156 | |
| Hewlett Packard Enterprise Co. 4.4% 10/15/22 (a) | 5,700,000 | 6,075,657 | |
| 19,153,474 | |||
| TOTAL INFORMATION TECHNOLOGY | 60,534,523 | ||
| MATERIALS - 0.1% | |||
| Chemicals - 0.1% | |||
| CF Industries Holdings, Inc. 5.15% 3/15/34 | 300,000 | 336,900 | |
| Consolidated Energy Finance SA 3 month U.S. LIBOR + 3.750% 5.6436% 6/15/22 (a)(b)(c) | 500,000 | 495,016 | |
| DuPont de Nemours, Inc. 4.493% 11/15/25 | 2,875,000 | 3,240,945 | |
| Eastman Chemical Co. 4.65% 10/15/44 | 485,000 | 544,954 | |
| Ecolab, Inc. 4.35% 12/8/21 | 245,000 | 257,863 | |
| FMC Corp. 4.5% 10/1/49 | 800,000 | 972,880 | |
| LYB International Finance II BV 3.5% 3/2/27 | 1,170,000 | 1,269,505 | |
| LyondellBasell Industries NV: | |||
| 5.75% 4/15/24 | 1,730,000 | 1,979,538 | |
| 6% 11/15/21 | 1,919,000 | 2,040,641 | |
| Nufarm Australia Ltd. 5.75% 4/30/26 (b) | 400,000 | 394,000 | |
| Nutrien Ltd.: | |||
| 4.9% 6/1/43 | 825,000 | 956,911 | |
| 5.25% 1/15/45 | 180,000 | 225,900 | |
| OCI NV 6.625% 4/15/23 (b) | 400,000 | 414,400 | |
| Olin Corp. 5.125% 9/15/27 | 700,000 | 705,390 | |
| Sherwin-Williams Co. 4.5% 6/1/47 | 210,000 | 252,065 | |
| The Chemours Co. LLC 7% 5/15/25 | 600,000 | 559,500 | |
| The Dow Chemical Co. 3.625% 5/15/26 | 3,370,000 | 3,668,631 | |
| Valvoline, Inc.: | |||
| 4.25% 2/15/30 (b) | 70,000 | 69,038 | |
| 4.375% 8/15/25 | 400,000 | 412,000 | |
| W. R. Grace & Co.-Conn. 5.625% 10/1/24 (b) | 400,000 | 442,000 | |
| 19,238,077 | |||
| Construction Materials - 0.0% | |||
| Vulcan Materials Co. 4.5% 6/15/47 | 795,000 | 937,208 | |
| Containers & Packaging - 0.0% | |||
| Ardagh Packaging Finance PLC/Ardagh MP Holdings U.S.A., Inc. 6% 2/15/25 (b) | 145,000 | 151,163 | |
| Crown Americas LLC/Crown Americas Capital Corp. V 4.25% 9/30/26 | 600,000 | 617,583 | |
| International Paper Co.: | |||
| 5% 9/15/35 | 405,000 | 514,448 | |
| 5.15% 5/15/46 | 116,000 | 143,746 | |
| OI European Group BV 4% 3/15/23 (b) | 500,000 | 505,625 | |
| Rock-Tenn Co. 4.9% 3/1/22 | 185,000 | 196,836 | |
| Trivium Packaging Finance BV: | |||
| 5.5% 8/15/26 (b) | 205,000 | 212,432 | |
| 8.5% 8/15/27 (b) | 60,000 | 63,475 | |
| 2,405,308 | |||
| Metals & Mining - 0.0% | |||
| Anglo American Capital PLC: | |||
| 4.125% 4/15/21 (b) | 6,803,000 | 6,980,436 | |
| 4.125% 9/27/22 (b) | 1,333,000 | 1,403,177 | |
| Barrick North America Finance LLC 5.75% 5/1/43 | 330,000 | 465,827 | |
| BHP Billiton Financial (U.S.A.) Ltd. 6.25% 10/19/75 (a)(b) | 1,979,000 | 2,018,580 | |
| Corporacion Nacional del Cobre de Chile (Codelco): | |||
| 3.625% 8/1/27 (b) | 2,033,000 | 2,174,039 | |
| 4.5% 8/1/47 (b) | 1,715,000 | 1,965,819 | |
| Newmont Corp. 2.8% 10/1/29 | 425,000 | 441,913 | |
| Southern Copper Corp. 5.875% 4/23/45 | 455,000 | 579,414 | |
| 16,029,205 | |||
| Paper & Forest Products - 0.0% | |||
| Berry Global Escrow Corp. 4.875% 7/15/26 (b) | 200,000 | 203,440 | |
| TOTAL MATERIALS | 38,813,238 | ||
| REAL ESTATE - 0.5% | |||
| Equity Real Estate Investment Trusts (REITs) - 0.3% | |||
| American Campus Communities Operating Partnership LP 3.75% 4/15/23 | 813,000 | 865,280 | |
| Boston Properties, Inc.: | |||
| 3.85% 2/1/23 | 1,175,000 | 1,248,344 | |
| 4.5% 12/1/28 | 5,210,000 | 6,151,229 | |
| Camden Property Trust: | |||
| 2.95% 12/15/22 | 954,000 | 982,544 | |
| 4.25% 1/15/24 | 2,838,000 | 3,090,581 | |
| CoreCivic, Inc. 4.625% 5/1/23 | 800,000 | 801,760 | |
| Corporate Office Properties LP 5% 7/1/25 | 3,453,000 | 3,858,568 | |
| CTR Partnership LP/CareTrust Capital Corp. 5.25% 6/1/25 | 300,000 | 312,000 | |
| Duke Realty LP: | |||
| 3.25% 6/30/26 | 805,000 | 869,675 | |
| 3.625% 4/15/23 | 1,382,000 | 1,464,355 | |
| 3.875% 10/15/22 | 2,108,000 | 2,223,652 | |
| 4.375% 6/15/22 | 1,237,000 | 1,308,462 | |
| Equity One, Inc. 3.75% 11/15/22 | 3,200,000 | 3,372,118 | |
| GLP Capital LP/GLP Financing II, Inc. 5.25% 6/1/25 | 200,000 | 223,830 | |
| HCP, Inc.: | |||
| 3% 1/15/30 | 925,000 | 972,408 | |
| 3.25% 7/15/26 | 776,000 | 837,167 | |
| 3.5% 7/15/29 | 887,000 | 975,834 | |
| Healthcare Trust of America Holdings LP: | |||
| 3.1% 2/15/30 | 1,715,000 | 1,793,011 | |
| 3.5% 8/1/26 | 1,786,000 | 1,935,282 | |
| Highwoods/Forsyth LP 3.2% 6/15/21 | 2,263,000 | 2,302,994 | |
| Hudson Pacific Properties LP 4.65% 4/1/29 | 10,503,000 | 12,248,364 | |
| Lexington Corporate Properties Trust 4.4% 6/15/24 | 1,319,000 | 1,395,289 | |
| MGM Growth Properties Operating Partnership LP 5.625% 5/1/24 | 2,300,000 | 2,489,750 | |
| MPT Operating Partnership LP/MPT Finance Corp. 6.375% 3/1/24 | 1,600,000 | 1,650,000 | |
| Omega Healthcare Investors, Inc.: | |||
| 3.625% 10/1/29 | 7,647,000 | 8,041,838 | |
| 4.375% 8/1/23 | 6,644,000 | 7,174,064 | |
| 4.5% 1/15/25 | 2,793,000 | 3,044,499 | |
| 4.5% 4/1/27 | 1,500,000 | 1,670,620 | |
| 4.75% 1/15/28 | 7,569,000 | 8,506,572 | |
| 4.95% 4/1/24 | 1,152,000 | 1,279,488 | |
| 5.25% 1/15/26 | 5,841,000 | 6,703,881 | |
| Prologis LP 3.25% 10/1/26 | 2,158,000 | 2,347,095 | |
| Realty Income Corp. 3% 1/15/27 | 585,000 | 627,202 | |
| Retail Opportunity Investments Partnership LP: | |||
| 4% 12/15/24 | 877,000 | 937,477 | |
| 5% 12/15/23 | 626,000 | 675,449 | |
| SBA Communications Corp. 4.875% 9/1/24 | 200,000 | 205,376 | |
| Simon Property Group LP: | |||
| 2.45% 9/13/29 | 885,000 | 902,556 | |
| 3.25% 11/30/26 | 1,070,000 | 1,167,236 | |
| 3.375% 10/1/24 | 2,620,000 | 2,791,901 | |
| 3.5% 9/1/25 | 55,000 | 59,724 | |
| 3.75% 2/1/24 | 275,000 | 295,840 | |
| SITE Centers Corp.: | |||
| 3.625% 2/1/25 | 2,396,000 | 2,543,960 | |
| 4.25% 2/1/26 | 5,582,000 | 6,119,093 | |
| 4.625% 7/15/22 | 1,600,000 | 1,703,973 | |
| Store Capital Corp. 4.625% 3/15/29 | 2,475,000 | 2,863,656 | |
| The GEO Group, Inc.: | |||
| 5.875% 10/15/24 | 65,000 | 60,775 | |
| 6% 4/15/26 | 265,000 | 239,825 | |
| Ventas Realty LP: | |||
| 3% 1/15/30 | 10,008,000 | 10,407,672 | |
| 3.125% 6/15/23 | 1,414,000 | 1,480,866 | |
| 3.85% 4/1/27 | 1,050,000 | 1,154,845 | |
| 4% 3/1/28 | 2,712,000 | 3,020,315 | |
| 4.125% 1/15/26 | 1,628,000 | 1,806,926 | |
| VICI Properties, Inc.: | |||
| 3.5% 2/15/25 (b) | 125,000 | 125,194 | |
| 4.25% 12/1/26 (b) | 670,000 | 676,767 | |
| 4.625% 12/1/29 (b) | 250,000 | 258,125 | |
| Weingarten Realty Investors 3.375% 10/15/22 | 472,000 | 488,019 | |
| Welltower, Inc. 2.7% 2/15/27 | 340,000 | 353,103 | |
| WP Carey, Inc.: | |||
| 3.85% 7/15/29 | 1,725,000 | 1,927,647 | |
| 4% 2/1/25 | 5,544,000 | 5,970,586 | |
| 4.6% 4/1/24 | 7,436,000 | 8,130,516 | |
| 149,135,178 | |||
| Real Estate Management & Development - 0.2% | |||
| Brandywine Operating Partnership LP: | |||
| 3.95% 2/15/23 | 4,006,000 | 4,253,575 | |
| 3.95% 11/15/27 | 5,608,000 | 6,158,733 | |
| 4.1% 10/1/24 | 4,892,000 | 5,339,946 | |
| 4.55% 10/1/29 | 1,707,000 | 1,978,666 | |
| CBRE Group, Inc. 4.875% 3/1/26 | 12,670,000 | 14,533,109 | |
| Digital Realty Trust LP 3.95% 7/1/22 | 3,488,000 | 3,658,909 | |
| Essex Portfolio LP 3.875% 5/1/24 | 2,685,000 | 2,923,604 | |
| Howard Hughes Corp. 5.375% 3/15/25 (b) | 400,000 | 404,880 | |
| Liberty Property LP: | |||
| 3.375% 6/15/23 | 4,307,000 | 4,585,169 | |
| 4.125% 6/15/22 | 1,061,000 | 1,121,178 | |
| Mack-Cali Realty LP: | |||
| 3.15% 5/15/23 | 3,436,000 | 3,462,455 | |
| 4.5% 4/18/22 | 644,000 | 663,661 | |
| Mid-America Apartments LP 4% 11/15/25 | 1,296,000 | 1,451,880 | |
| Post Apartment Homes LP 3.375% 12/1/22 | 1,800,000 | 1,879,771 | |
| Tanger Properties LP: | |||
| 3.125% 9/1/26 | 3,497,000 | 3,597,959 | |
| 3.75% 12/1/24 | 3,352,000 | 3,538,789 | |
| 3.875% 12/1/23 | 1,492,000 | 1,574,363 | |
| 3.875% 7/15/27 | 13,369,000 | 14,284,160 | |
| 75,410,807 | |||
| TOTAL REAL ESTATE | 224,545,985 | ||
| UTILITIES - 0.4% | |||
| Electric Utilities - 0.2% | |||
| AEP Transmission Co. LLC 4% 12/1/46 | 375,000 | 459,876 | |
| Alabama Power Co.: | |||
| 3.75% 3/1/45 | 1,000,000 | 1,121,339 | |
| 3.85% 12/1/42 | 250,000 | 287,702 | |
| 4.1% 1/15/42 | 225,000 | 259,017 | |
| Appalachian Power Co. 3.3% 6/1/27 | 605,000 | 653,355 | |
| Baltimore Gas & Electric Co. 3.35% 7/1/23 | 470,000 | 495,401 | |
| CenterPoint Energy Houston Electric LLC: | |||
| 2.25% 8/1/22 | 530,000 | 541,261 | |
| 3.95% 3/1/48 | 1,235,000 | 1,474,502 | |
| Clearway Energy Operating LLC 4.75% 3/15/28 (b) | 60,000 | 61,050 | |
| Cleco Corporate Holdings LLC 3.375% 9/15/29 (b) | 4,448,000 | 4,570,756 | |
| Commonwealth Edison Co.: | |||
| 3.2% 11/15/49 | 940,000 | 997,197 | |
| 3.7% 3/1/45 | 315,000 | 359,264 | |
| 3.75% 8/15/47 | 250,000 | 289,691 | |
| 4.35% 11/15/45 | 555,000 | 691,336 | |
| 4.6% 8/15/43 | 1,045,000 | 1,318,370 | |
| Dominion Energy South Carolina: | |||
| 5.1% 6/1/65 | 470,000 | 677,314 | |
| 5.45% 2/1/41 | 35,000 | 48,056 | |
| Duke Energy Carolinas LLC: | |||
| 2.95% 12/1/26 | 1,270,000 | 1,360,895 | |
| 4.25% 12/15/41 | 1,450,000 | 1,773,803 | |
| 6.1% 6/1/37 | 775,000 | 1,128,234 | |
| Duke Energy Industries, Inc. 3.25% 10/1/49 | 1,665,000 | 1,780,691 | |
| Duquesne Light Holdings, Inc.: | |||
| 5.9% 12/1/21 (b) | 8,875,000 | 9,468,082 | |
| 6.4% 9/15/20 (b) | 4,858,000 | 4,971,480 | |
| Entergy Louisiana LLC: | |||
| 2.4% 10/1/26 | 1,070,000 | 1,118,669 | |
| 4.05% 9/1/23 | 880,000 | 958,608 | |
| Evergy Kansas Central 4.125% 3/1/42 | 655,000 | 808,645 | |
| Exelon Corp. 5.625% 6/15/35 | 150,000 | 197,173 | |
| FirstEnergy Corp.: | |||
| 4.25% 3/15/23 | 12,580,000 | 13,463,835 | |
| 4.85% 7/15/47 | 335,000 | 420,378 | |
| 7.375% 11/15/31 | 9,948,000 | 14,524,374 | |
| Florida Power & Light Co.: | |||
| 2.75% 6/1/23 | 1,200,000 | 1,251,554 | |
| 3.95% 3/1/48 | 2,080,000 | 2,557,841 | |
| Fortis, Inc. 3.055% 10/4/26 | 301,000 | 319,385 | |
| Georgia Power Co. 2.65% 9/15/29 | 150,000 | 155,003 | |
| Hydro-Quebec 8.05% 7/7/24 | 1,455,000 | 1,872,149 | |
| Indiana Michigan Power Co. 4.55% 3/15/46 | 620,000 | 795,027 | |
| IPALCO Enterprises, Inc.: | |||
| 3.45% 7/15/20 | 8,163,000 | 8,200,835 | |
| 3.7% 9/1/24 | 2,644,000 | 2,785,109 | |
| LG&E and KU Energy LLC 3.75% 11/15/20 | 211,000 | 213,028 | |
| Louisville Gas & Electric Co. 5.125% 11/15/40 | 345,000 | 452,545 | |
| MidAmerican Energy Co. 3.95% 8/1/47 | 1,675,000 | 2,046,015 | |
| NextEra Energy Capital Holdings, Inc. 3.15% 4/1/24 | 2,655,000 | 2,813,561 | |
| NextEra Energy Partners LP 4.25% 9/15/24 (b) | 300,000 | 302,010 | |
| Northern States Power Co. 6.25% 6/1/36 | 370,000 | 547,954 | |
| NRG Yield Operating LLC 5% 9/15/26 | 480,000 | 491,666 | |
| NSG Holdings II LLC/NSG Holdings, Inc. 7.75% 12/15/25 (b) | 23,648 | 26,249 | |
| Ohio Power Co. 4% 6/1/49 | 680,000 | 832,831 | |
| PacifiCorp: | |||
| 5.25% 6/15/35 | 1,375,000 | 1,840,746 | |
| 5.75% 4/1/37 | 900,000 | 1,274,809 | |
| PPL Capital Funding, Inc. 4.7% 6/1/43 | 1,315,000 | 1,584,360 | |
| PPL Electric Utilities Corp.: | |||
| 4.15% 10/1/45 | 730,000 | 890,345 | |
| 6.25% 5/15/39 | 250,000 | 369,828 | |
| Public Service Co. of Colorado 2.5% 3/15/23 | 645,000 | 662,547 | |
| Public Service Electric & Gas Co.: | |||
| 2.25% 9/15/26 | 595,000 | 615,467 | |
| 3.6% 12/1/47 | 260,000 | 306,378 | |
| 3.65% 9/1/28 | 860,000 | 977,799 | |
| 3.65% 9/1/42 | 125,000 | 145,570 | |
| 3.95% 5/1/42 | 405,000 | 488,405 | |
| Puget Sound Energy, Inc. 5.764% 7/15/40 | 285,000 | 394,823 | |
| Southern California Edison Co.: | |||
| 3.6% 2/1/45 | 1,935,000 | 2,027,248 | |
| 4% 4/1/47 | 715,000 | 805,756 | |
| Southwestern Electric Power Co. 3.85% 2/1/48 | 660,000 | 727,796 | |
| Virginia Electric & Power Co.: | |||
| 3.15% 1/15/26 | 15,000 | 16,143 | |
| 6% 1/15/36 | 470,000 | 668,280 | |
| 6% 5/15/37 | 1,375,000 | 1,985,864 | |
| Vistra Operations Co. LLC: | |||
| 5% 7/31/27 (b) | 195,000 | 196,979 | |
| 5.5% 9/1/26 (b) | 1,700,000 | 1,719,729 | |
| 5.625% 2/15/27 (b) | 225,000 | 230,625 | |
| Wisconsin Power & Light Co. 4.1% 10/15/44 | 240,000 | 276,635 | |
| Xcel Energy, Inc. 3.5% 12/1/49 | 1,175,000 | 1,291,597 | |
| 111,440,845 | |||
| Gas Utilities - 0.0% | |||
| AGL Capital Corp.: | |||
| 3.5% 9/15/21 | 1,030,000 | 1,054,284 | |
| 4.4% 6/1/43 | 440,000 | 516,018 | |
| Atmos Energy Corp. 3.375% 9/15/49 | 1,595,000 | 1,747,408 | |
| Nakilat, Inc. 6.067% 12/31/33 (b) | 666,000 | 808,149 | |
| Southern Natural Gas Co./Southern Natural Issuing Corp. 4.4% 6/15/21 | 527,000 | 542,016 | |
| 4,667,875 | |||
| Independent Power and Renewable Electricity Producers - 0.1% | |||
| Dolphin Subsidiary II, Inc. 7.25% 10/15/21 | 11,495,000 | 11,897,325 | |
| Emera U.S. Finance LP: | |||
| 2.7% 6/15/21 | 1,304,000 | 1,324,401 | |
| 3.55% 6/15/26 | 2,020,000 | 2,193,308 | |
| 4.75% 6/15/46 | 760,000 | 892,712 | |
| Exelon Generation Co. LLC 5.6% 6/15/42 | 375,000 | 447,378 | |
| NRG Energy, Inc. 6.625% 1/15/27 | 400,000 | 417,048 | |
| PSEG Power LLC 3% 6/15/21 | 1,075,000 | 1,095,060 | |
| TerraForm Power Operating LLC 5% 1/31/28 (b) | 400,000 | 430,520 | |
| The AES Corp. 4.875% 5/15/23 | 602,000 | 596,444 | |
| 19,294,196 | |||
| Multi-Utilities - 0.1% | |||
| Ameren Illinois Co.: | |||
| 3.25% 3/15/50 | 710,000 | 792,485 | |
| 4.5% 3/15/49 | 600,000 | 797,180 | |
| CenterPoint Energy, Inc. 2.95% 3/1/30 | 400,000 | 416,111 | |
| Consolidated Edison Co. of New York, Inc. 4.3% 12/1/56 | 300,000 | 363,587 | |
| Dominion Energy, Inc. 7% 6/15/38 | 150,000 | 219,301 | |
| DTE Energy Co. 3.8% 3/15/27 | 1,635,000 | 1,781,906 | |
| NiSource Finance Corp.: | |||
| 4.8% 2/15/44 | 305,000 | 370,479 | |
| 5.95% 6/15/41 | 640,000 | 883,027 | |
| NiSource, Inc. 2.95% 9/1/29 | 11,346,000 | 11,892,372 | |
| NorthWestern Energy Corp. 4.176% 11/15/44 | 260,000 | 304,456 | |
| Puget Energy, Inc.: | |||
| 3.65% 5/15/25 | 624,000 | 670,124 | |
| 5.625% 7/15/22 | 4,555,000 | 4,911,811 | |
| 6% 9/1/21 | 4,353,000 | 4,646,345 | |
| 6.5% 12/15/20 | 1,405,000 | 1,458,055 | |
| San Diego Gas & Electric Co.: | |||
| 3.6% 9/1/23 | 1,025,000 | 1,087,316 | |
| 3.75% 6/1/47 | 585,000 | 679,791 | |
| Sempra Energy 4% 2/1/48 | 590,000 | 653,011 | |
| WEC Energy Group, Inc. 3 month U.S. LIBOR + 2.110% 3.8043% 5/15/67 (a)(c) | 1,012,000 | 972,459 | |
| 32,899,816 | |||
| TOTAL UTILITIES | 168,302,732 | ||
| TOTAL NONCONVERTIBLE BONDS | |||
| (Cost $3,248,362,096) | 3,522,911,831 | ||
| U.S. Government and Government Agency Obligations - 6.4% | |||
| U.S. Government Agency Obligations - 0.0% | |||
| Fannie Mae: | |||
| 1.625% 10/15/24 | $3,505,000 | $3,604,216 | |
| 1.625% 1/7/25 | 2,480,000 | 2,550,260 | |
| 1.875% 9/24/26 | 495,000 | 517,502 | |
| 2% 10/5/22 | 635,000 | 651,528 | |
| 2.25% 4/12/22 | 955,000 | 980,978 | |
| 2.375% 1/19/23 | 455,000 | 473,649 | |
| 2.5% 2/5/24 | 665,000 | 703,796 | |
| 2.875% 10/30/20 | 765,000 | 773,916 | |
| 2.875% 9/12/23 | 670,000 | 714,859 | |
| 6.25% 5/15/29 | 255,000 | 361,487 | |
| 6.625% 11/15/30 | 670,000 | 1,011,652 | |
| Federal Home Loan Bank: | |||
| 2.625% 10/1/20 | 165,000 | 166,391 | |
| 3% 10/12/21 | 1,165,000 | 1,202,934 | |
| 3.25% 11/16/28 | 1,815,000 | 2,094,362 | |
| Freddie Mac: | |||
| 2.375% 2/16/21 | 2,785,000 | 2,817,609 | |
| 6.25% 7/15/32 | 40,000 | 61,398 | |
| 6.75% 9/15/29 | 255,000 | 376,840 | |
| Tennessee Valley Authority: | |||
| 2.25% 3/15/20 | 3,130,000 | 3,130,901 | |
| 2.875% 2/1/27 | 1,320,000 | 1,464,660 | |
| 5.25% 9/15/39 | 150,000 | 226,080 | |
| 7.125% 5/1/30 | 460,000 | 700,204 | |
| TOTAL U.S. GOVERNMENT AGENCY OBLIGATIONS | 24,585,222 | ||
| U.S. Treasury Obligations - 6.4% | |||
| U.S. Treasury Bonds: | |||
| 2.375% 11/15/49 | 1,913,000 | 2,233,054 | |
| 2.875% 8/15/45 | 18,855,000 | 23,545,181 | |
| 2.875% 11/15/46 | 7,015,000 | 8,838,352 | |
| 3% 11/15/44 | 3,705,000 | 4,706,218 | |
| 3% 5/15/45 | 15,826,000 | 20,156,513 | |
| 3% 2/15/47 | 4,045,000 | 5,219,314 | |
| 3% 2/15/49 | 117,700,000 | 153,984,703 | |
| 3.125% 2/15/43 | 32,100,000 | 41,342,543 | |
| 3.625% 8/15/43 | 43,790,000 | 60,871,521 | |
| 3.75% 11/15/43 | 9,925,000 | 14,065,586 | |
| 6.25% 8/15/23 | 11,080,000 | 13,090,847 | |
| 7.25% 8/15/22 | 7,335,000 | 8,462,470 | |
| stripped coupon: | |||
| 0% 2/15/29 | 2,800,000 | 2,510,860 | |
| 0% 11/15/36 | 1,975,000 | 1,521,125 | |
| 0% 2/15/37 | 3,725,000 | 2,860,482 | |
| 0% 5/15/39 | 6,850,000 | 4,989,239 | |
| 0% 8/15/39 | 14,380,000 | 10,477,618 | |
| U.S. Treasury Notes: | |||
| 1.125% 2/28/25 | 5,100,000 | 5,151,797 | |
| 1.125% 2/28/27 | 953,000 | 957,988 | |
| 1.375% 4/30/21 | 14,560,000 | 14,610,050 | |
| 1.375% 5/31/21 | 60,865,000 | 61,136,039 | |
| 1.375% 2/15/23 | 15,120,000 | 15,340,303 | |
| 1.375% 1/31/25 | 2,125,000 | 2,171,235 | |
| 1.5% 1/31/22 | 1,450,000 | 1,465,803 | |
| 1.5% 1/31/27 | 17,561,000 | 18,091,946 | |
| 1.5% 2/15/30 | 11,970,000 | 12,377,728 | |
| 1.625% 11/15/22 | 64,320,000 | 65,581,275 | |
| 1.625% 4/30/23 | 29,145,000 | 29,812,147 | |
| 1.625% 8/15/29 | 188,233,000 | 196,519,664 | |
| 1.75% 9/30/22 | 16,995,000 | 17,370,085 | |
| 1.75% 11/15/29 | 548,700,000 | 579,350,042 | |
| 1.875% 4/30/22 | 57,915,000 | 59,114,021 | |
| 1.875% 9/30/22 | 1,213,000 | 1,243,704 | |
| 2% 10/31/22 | 32,840,000 | 33,800,826 | |
| 2% 2/15/25 | 23,205,000 | 24,400,601 | |
| 2% 11/15/26 | 192,301,000 | 204,252,207 | |
| 2.125% 9/30/21 | 60,710,000 | 61,807,997 | |
| 2.125% 6/30/22 | 25,130,000 | 25,841,689 | |
| 2.125% 7/31/24 | 46,305,000 | 48,714,307 | |
| 2.125% 5/15/25 | 35,440,000 | 37,552,556 | |
| 2.25% 11/15/27 | 46,660,000 | 50,740,927 | |
| 2.375% 5/15/27 | 87,359,000 | 95,381,696 | |
| 2.625% 2/15/29 | 276,154,000 | 311,611,743 | |
| 2.875% 11/15/21 | 17,335,000 | 17,896,356 | |
| 2.875% 11/30/25 | 391,344,000 | 432,633,848 | |
| 2.875% 5/15/28 | 34,740,000 | 39,614,456 | |
| 3.125% 11/15/28 | 94,900,000 | 110,792,043 | |
| TOTAL U.S. TREASURY OBLIGATIONS | 2,954,210,705 | ||
| Other Government Related - 0.0% | |||
| Private Export Funding Corp. Secured: | |||
| 1.75% 11/15/24 | 1,225,000 | 1,259,058 | |
| 3.55% 1/15/24 | 755,000 | 825,698 | |
| TOTAL OTHER GOVERNMENT RELATED | 2,084,756 | ||
| TOTAL U.S. GOVERNMENT AND GOVERNMENT AGENCY OBLIGATIONS | |||
| (Cost $2,787,181,879) | 2,980,880,683 | ||
| U.S. Government Agency - Mortgage Securities - 9.1% | |||
| Fannie Mae - 2.5% | |||
| 12 month U.S. LIBOR + 1.550% 4.345% 6/1/36 (a)(c) | 6,428 | 6,703 | |
| 12 month U.S. LIBOR + 1.820% 4.387% 2/1/35 (a)(c) | 142,647 | 150,478 | |
| 12 month U.S. LIBOR + 1.900% 4.783% 7/1/37 (a)(c) | 8,745 | 9,175 | |
| 2% 8/1/31 to 10/1/34 | 7,314,749 | 7,427,957 | |
| 2.5% 9/1/27 to 12/1/49 | 96,359,160 | 99,250,151 | |
| 3% 2/1/27 to 2/1/50 | 270,089,708 | 282,386,982 | |
| 3.5% 9/1/26 to 12/1/49(d)(e)(f) | 314,452,243 | 333,531,150 | |
| 4% 5/1/29 to 11/1/49 | 242,318,829 | 260,561,070 | |
| 4.5% 6/1/24 to 9/1/49 | 84,775,226 | 92,618,793 | |
| 5% 10/1/21 to 2/1/49 | 48,444,627 | 53,984,084 | |
| 5.245% 8/1/41 (a) | 378,492 | 418,242 | |
| 5.5% 11/1/36 to 1/1/40 | 2,552,239 | 2,934,429 | |
| 6% to 6% 3/1/22 to 1/1/42 | 15,384,818 | 18,091,128 | |
| 6.5% 2/1/36 | 1,792 | 2,118 | |
| 6.542% 2/1/39 (a) | 354,578 | 387,081 | |
| TOTAL FANNIE MAE | 1,151,759,541 | ||
| Freddie Mac - 1.6% | |||
| 6 month U.S. LIBOR + 2.680% 4.873% 10/1/35 (a)(c) | 4,417 | 4,633 | |
| 2% 1/1/32 | 2,121,579 | 2,159,654 | |
| 2.5% 3/1/28 to 2/1/43 | 35,542,108 | 36,721,141 | |
| 3% 10/1/28 to 1/1/50 (g) | 155,316,555 | 161,960,692 | |
| 3.5% 8/1/26 to 9/1/49 | 306,545,582 | 325,206,216 | |
| 3.5% 8/1/47 | 11,729,251 | 12,475,875 | |
| 4% 6/1/33 to 7/1/48 | 143,876,963 | 155,059,753 | |
| 4.5% 7/1/25 to 4/1/49 | 54,155,752 | 58,948,282 | |
| 5% 10/1/33 to 12/1/47 | 7,578,867 | 8,484,385 | |
| 6% 7/1/37 to 9/1/38 | 184,363 | 218,835 | |
| 6.5% 9/1/39 | 549,715 | 658,001 | |
| TOTAL FREDDIE MAC | 761,897,467 | ||
| Ginnie Mae - 4.0% | |||
| 3.5% 9/20/40 to 12/20/49 | 274,903,847 | 291,182,069 | |
| 4.5% 5/15/39 to 3/20/49 | 81,227,970 | 87,363,351 | |
| 5.5% 6/15/36 to 3/20/41 | 225,178 | 256,317 | |
| 2.5% 12/20/46 | 1,066,985 | 1,101,677 | |
| 2.5% 3/1/50 (g) | 33,200,000 | 34,079,322 | |
| 2.5% 3/1/50 (g) | 18,800,000 | 19,297,929 | |
| 2.5% 3/1/50 (g) | 12,100,000 | 12,420,476 | |
| 2.5% 3/1/50 (g) | 3,000,000 | 3,079,457 | |
| 2.5% 3/1/50 (g) | 3,100,000 | 3,182,105 | |
| 2.5% 3/1/50 (g) | 7,100,000 | 7,288,048 | |
| 2.5% 3/1/50 (g) | 7,300,000 | 7,493,345 | |
| 2.5% 4/1/50 (g) | 19,550,000 | 20,049,463 | |
| 2.5% 4/1/50 (g) | 20,750,000 | 21,280,121 | |
| 3% 8/20/42 to 4/20/50 (g) | 98,905,960 | 103,304,483 | |
| 3% 3/1/50 (g) | 9,850,000 | 10,177,349 | |
| 3% 3/1/50 (g) | 25,100,000 | 25,934,158 | |
| 3% 3/1/50 (g) | 23,350,000 | 24,126,000 | |
| 3% 3/1/50 (g) | 9,900,000 | 10,229,011 | |
| 3% 3/1/50 (g) | 5,350,000 | 5,527,799 | |
| 3% 3/1/50 (g) | 31,400,000 | 32,443,529 | |
| 3% 3/1/50 (g) | 33,575,000 | 34,690,811 | |
| 3% 3/1/50 (g) | 5,750,000 | 5,941,092 | |
| 3% 3/1/50 (g) | 32,300,000 | 33,373,439 | |
| 3% 3/1/50 (g) | 29,300,000 | 30,273,739 | |
| 3% 3/1/50 (g) | 200,000 | 206,647 | |
| 3% 3/1/50 (g) | 3,000,000 | 3,099,700 | |
| 3% 3/1/50 (g) | 11,100,000 | 11,468,891 | |
| 3% 3/1/50 (g) | 30,200,000 | 31,203,649 | |
| 3% 3/1/50 (g) | 18,900,000 | 19,528,111 | |
| 3% 3/1/50 (g) | 9,900,000 | 10,229,011 | |
| 3% 3/1/50 (g) | 11,300,000 | 11,675,537 | |
| 3% 3/1/50 (g) | 3,350,000 | 3,461,332 | |
| 3% 3/1/50 (g) | 3,300,000 | 3,409,670 | |
| 3% 3/1/50 (g) | 7,600,000 | 7,852,574 | |
| 3% 3/1/50 (g) | 400,000 | 413,293 | |
| 3% 3/1/50 (g) | 1,100,000 | 1,136,557 | |
| 3% 4/1/50 (g) | 15,500,000 | 15,998,770 | |
| 3% 4/1/50 (g) | 30,750,000 | 31,739,495 | |
| 3% 4/1/50 (g) | 3,000,000 | 3,096,536 | |
| 3% 4/1/50 (g) | 6,700,000 | 6,915,597 | |
| 3% 4/1/50 (g) | 9,500,000 | 9,805,698 | |
| 3% 4/1/50 (g) | 19,200,000 | 19,817,831 | |
| 3% 4/1/50 (g) | 9,900,000 | 10,218,569 | |
| 3% 4/1/50 (g) | 4,900,000 | 5,057,676 | |
| 3% 4/1/50 (g) | 26,300,000 | 27,146,300 | |
| 3% 4/1/50 (g) | 13,000,000 | 13,418,323 | |
| 3.5% 3/1/50 (g) | 9,200,000 | 9,531,217 | |
| 3.5% 3/1/50 (g) | 14,450,000 | 14,970,226 | |
| 3.5% 3/1/50 (g) | 10,600,000 | 10,981,619 | |
| 3.5% 3/1/50 (g) | 16,500,000 | 17,094,030 | |
| 3.5% 3/1/50 (g) | 8,600,000 | 8,909,615 | |
| 3.5% 3/1/50 (g) | 13,400,000 | 13,882,424 | |
| 3.5% 3/1/50 (g) | 4,600,000 | 4,765,608 | |
| 3.5% 3/1/50 (g) | 11,600,000 | 12,017,621 | |
| 3.5% 3/1/50 (g) | 8,575,000 | 8,883,715 | |
| 3.5% 3/1/50 (g) | 9,700,000 | 10,049,217 | |
| 3.5% 3/1/50 (g) | 4,800,000 | 4,972,809 | |
| 3.5% 3/1/50 (g) | 1,350,000 | 1,398,602 | |
| 3.5% 3/1/50 (g) | 1,350,000 | 1,398,602 | |
| 3.5% 3/1/50 (g) | 4,700,000 | 4,869,208 | |
| 3.5% 3/1/50 (g) | 25,400,000 | 26,314,446 | |
| 3.5% 3/1/50 (g) | 17,000,000 | 17,612,031 | |
| 3.5% 3/1/50 (g) | 41,900,000 | 43,408,475 | |
| 3.5% 3/1/50 (g) | 5,000,000 | 5,180,009 | |
| 3.5% 3/1/50 (g) | 2,200,000 | 2,279,204 | |
| 3.5% 3/1/50 (g) | 9,100,000 | 9,427,616 | |
| 3.5% 3/1/50 (g) | 4,900,000 | 5,076,409 | |
| 3.5% 3/1/50 (g) | 2,150,000 | 2,227,404 | |
| 3.5% 3/1/50 (g) | 3,400,000 | 3,522,406 | |
| 3.5% 3/1/50 (g) | 11,700,000 | 12,121,221 | |
| 3.5% 3/1/50 (g) | 11,900,000 | 12,328,421 | |
| 3.5% 4/1/50 (g) | 27,675,000 | 28,647,566 | |
| 3.5% 4/1/50 (g) | 21,800,000 | 22,566,104 | |
| 3.5% 4/1/50 (g) | 17,600,000 | 18,218,506 | |
| 3.5% 4/1/50 (g) | 15,700,000 | 16,251,736 | |
| 3.5% 4/1/50 (g) | 11,900,000 | 12,318,195 | |
| 3.5% 4/1/50 (g) | 17,800,000 | 18,425,535 | |
| 3.5% 4/1/50 (g) | 13,375,000 | 13,845,030 | |
| 4% 5/20/40 to 5/20/49 | 331,803,523 | 351,870,897 | |
| 4% 3/1/50 (g) | 7,900,000 | 8,224,872 | |
| 4% 3/1/50 (g) | 9,200,000 | 9,578,332 | |
| 5% 6/20/34 to 6/20/48 | 31,753,738 | 34,558,549 | |
| TOTAL GINNIE MAE | 1,868,722,334 | ||
| Uniform Mortgage Backed Securities - 1.0% | |||
| 2.5% 3/1/35 (g) | 13,750,000 | 14,113,194 | |
| 2.5% 3/1/35 (g) | 13,100,000 | 13,446,025 | |
| 2.5% 3/1/35 (g) | 6,700,000 | 6,876,974 | |
| 2.5% 3/1/35 (g) | 3,800,000 | 3,900,374 | |
| 2.5% 3/1/35 (g) | 10,000,000 | 10,264,141 | |
| 2.5% 3/1/35 (g) | 2,750,000 | 2,822,639 | |
| 2.5% 3/1/35 (g) | 2,000,000 | 2,052,828 | |
| 2.5% 3/1/35 (g) | 2,650,000 | 2,719,997 | |
| 2.5% 3/1/35 (g) | 2,650,000 | 2,719,997 | |
| 2.5% 3/1/35 (g) | 1,900,000 | 1,950,187 | |
| 2.5% 3/1/35 (g) | 2,550,000 | 2,617,356 | |
| 2.5% 3/1/35 (g) | 11,250,000 | 11,547,159 | |
| 2.5% 3/1/35 (g) | 7,350,000 | 7,544,144 | |
| 2.5% 3/1/35 (g) | 11,200,000 | 11,495,838 | |
| 2.5% 3/1/35 (g)(h) | 5,500,000 | 5,645,278 | |
| 2.5% 3/1/50 (g) | 5,100,000 | 5,200,749 | |
| 2.5% 3/1/50 (g) | 8,500,000 | 8,667,915 | |
| 3% 3/1/50 (g) | 17,000,000 | 17,506,415 | |
| 3% 3/1/50 (g)(h) | 22,400,000 | 23,067,276 | |
| 3% 3/1/50 (g) | 4,400,000 | 4,531,072 | |
| 3% 3/1/50 (g) | 4,400,000 | 4,531,072 | |
| 3% 3/1/50 (g) | 39,500,000 | 40,676,669 | |
| 3% 3/1/50 (g) | 2,000,000 | 2,059,578 | |
| 3% 3/1/50 (g) | 5,400,000 | 5,560,861 | |
| 3% 3/1/50 (g) | 5,700,000 | 5,869,798 | |
| 3% 3/1/50 (g) | 9,300,000 | 9,577,039 | |
| 3% 3/1/50 (g) | 5,950,000 | 6,127,245 | |
| 3% 3/1/50 (g) | 5,950,000 | 6,127,245 | |
| 3% 3/1/50 (g) | 5,600,000 | 5,766,819 | |
| 3% 3/1/50 (g) | 3,350,000 | 3,449,793 | |
| 3% 3/1/50 (g) | 3,300,000 | 3,398,304 | |
| 3% 3/1/50 (g) | 5,650,000 | 5,818,308 | |
| 3% 3/1/50 (g) | 5,800,000 | 5,972,777 | |
| 3% 3/1/50 (g) | 3,900,000 | 4,016,177 | |
| 3% 3/1/50 (g) | 4,000,000 | 4,119,156 | |
| 3.5% 3/1/50 (g) | 10,000,000 | 10,384,160 | |
| 3.5% 3/1/50 (g) | 9,500,000 | 9,864,952 | |
| 3.5% 3/1/50 (g) | 2,700,000 | 2,803,723 | |
| 3.5% 3/1/50 (g) | 6,400,000 | 6,645,862 | |
| 3.5% 3/1/50 (g) | 3,100,000 | 3,219,090 | |
| 3.5% 3/1/50 (g) | 6,300,000 | 6,542,021 | |
| 3.5% 3/1/50 (g) | 3,000,000 | 3,115,248 | |
| 3.5% 3/1/50 (g) | 11,000,000 | 11,422,576 | |
| 3.5% 3/1/50 (g) | 14,600,000 | 15,160,874 | |
| 3.5% 3/1/50 (g) | 2,700,000 | 2,803,723 | |
| 3.5% 3/1/50 (g) | 8,300,000 | 8,618,853 | |
| 3.5% 3/1/50 (g) | 1,500,000 | 1,557,624 | |
| 3.5% 3/1/50 (g) | 17,800,000 | 18,483,805 | |
| 3.5% 3/1/50 (g) | 16,000,000 | 16,614,656 | |
| 3.5% 3/1/50 (g) | 17,000,000 | 17,653,072 | |
| 3.5% 3/1/50 (g) | 2,200,000 | 2,284,515 | |
| 3.5% 3/1/50 (g) | 2,150,000 | 2,232,594 | |
| 3.5% 3/1/50 (g) | 8,500,000 | 8,826,536 | |
| 3.5% 3/1/50 (g) | 4,700,000 | 4,880,555 | |
| 3.5% 3/1/50 (g) | 4,700,000 | 4,880,555 | |
| 3.5% 3/1/50 (g) | 3,000,000 | 3,115,248 | |
| 4% 3/1/50 (g) | 1,500,000 | 1,579,972 | |
| 4% 3/1/50 (g) | 1,500,000 | 1,579,972 | |
| 4% 3/1/50 (g) | 1,500,000 | 1,579,972 | |
| 4% 3/1/50 (g) | 3,000,000 | 3,159,943 | |
| 4% 3/1/50 (g) | 2,500,000 | 2,633,286 | |
| TOTAL UNIFORM MORTGAGE BACKED SECURITIES | 443,403,786 | ||
| TOTAL U.S. GOVERNMENT AGENCY - MORTGAGE SECURITIES | |||
| (Cost $4,142,926,878) | 4,225,783,128 | ||
| Asset-Backed Securities - 0.9% | |||
| AASET Trust: | |||
| Series 2018-1A Class A, 3.844% 1/16/38 (b) | $4,382,223 | $4,435,651 | |
| Series 2019-1 Class A, 3.844% 5/15/39 (b) | 5,235,175 | 5,352,274 | |
| Series 2019-2: | |||
| Class A, 3.376% 10/16/39 (b) | 8,353,669 | 8,425,642 | |
| Class B, 4.458% 10/16/39 (b) | 1,469,492 | 1,487,095 | |
| Aimco Series 2019-10A Class A, 3 month U.S. LIBOR + 1.320% 3.1221% 7/22/32 (a)(b)(c) | 8,486,000 | 8,491,092 | |
| Allegany Park CLO, Ltd. / Allegany Series 2020-1A Class A, 3 month U.S. LIBOR + 1.330% 3.1491% 1/20/33 (a)(b)(c) | 3,880,000 | 3,873,404 | |
| Apollo Aviation Securitization Equity Trust Series 2020-1A: | |||
| Class A, 3.351% 1/16/40 (b) | 3,903,000 | 3,902,922 | |
| Class B, 4.335% 1/16/40 (b) | 622,000 | 621,981 | |
| Ares CLO Series 2019-54A Class A, 3 month U.S. LIBOR + 1.320% 3.1658% 10/15/32 (a)(b)(c) | 7,102,000 | 7,104,131 | |
| Ares Xli Clo Ltd. / Ares Xli Cl Series 2016-41A Class AR, 3 month U.S. LIBOR + 1.200% 3.0313% 1/15/29 (a)(b)(c) | 9,133,000 | 9,125,694 | |
| Ares XXXIV CLO Ltd. Series 2020-2A Class AR2, 3 month U.S. LIBOR + 1.250% 1.25% 4/17/33 (a)(b)(c)(g) | 2,769,000 | 2,769,000 | |
| Argent Securities, Inc. pass-thru certificates Series 2005-W2 Class A2C, 1 month U.S. LIBOR + 0.360% 1.9868% 10/25/35 (a)(c) | 1,791,176 | 1,787,113 | |
| Beechwood Park CLO Ltd. Series 2019-1A Class A1, 3 month U.S. LIBOR + 1.330% 3.2332% 1/17/33 (a)(b)(c) | 2,900,000 | 2,900,870 | |
| Blackbird Capital Aircraft Series 2016-1A: | |||
| Class A, 4.213% 12/16/41 (b) | 8,846,302 | 9,058,623 | |
| Class AA, 2.487% 12/16/41 (b) | 1,698,094 | 1,690,364 | |
| Bristol Park CLO, Ltd. Series 2020-1A Class AR, 3 month U.S. LIBOR + 0.990% 2.6167% 4/15/29 (a)(b)(c) | 8,338,000 | 8,338,000 | |
| CarMax Auto Owner Trust Series 2019-4 Class A2A, 2.01% 3/15/23 | 4,300,000 | 4,324,076 | |
| Carvana Auto Receivables Trust Series 2019-4A: | |||
| Class A2, 2.2% 7/15/22 (b) | 1,610,000 | 1,615,422 | |
| Class A3, 2.3% 9/15/23 (b) | 2,936,000 | 2,961,578 | |
| Castlelake Aircraft Securitization Trust Series 2019-1A: | |||
| Class A, 3.967% 4/15/39 (b) | 7,790,442 | 8,013,470 | |
| Class B, 5.095% 4/15/39 (b) | 3,435,596 | 3,575,645 | |
| Castlelake Aircraft Structured Trust Series 2018-1 Class A, 4.125% 6/15/43 (b) | 7,545,790 | 7,760,837 | |
| Cedar Funding Ltd.: | |||
| Series 2019-10A Class A, 3 month U.S. LIBOR + 1.340% 3.4705% 10/20/32 (a)(b)(c) | 5,957,000 | 5,957,596 | |
| Series 2019-11A Class A1A, 3 month U.S. LIBOR + 1.350% 3.2638% 5/29/32 (a)(b)(c) | 4,370,000 | 4,370,437 | |
| Chase Issuance Trust Series 2012-A7 Class A7, 2.16% 9/15/24 | 800,000 | 819,464 | |
| Citi Mortgage Loan Trust Series 2007-1 Class 1A, 1 month U.S. LIBOR + 1.350% 2.9768% 10/25/37 (a)(b)(c) | 2,608,671 | 2,630,995 | |
| Citibank Credit Card Issuance Trust: | |||
| Series 2018-A3 Class A3, 3.29% 5/23/25 | 700,000 | 747,082 | |
| Series 2018-A6 Class A6, 3.21% 12/7/24 | 2,400,000 | 2,532,185 | |
| Series 2018-A7 Class A7, 3.96% 10/13/30 | 2,100,000 | 2,453,691 | |
| CNH Equipment Trust Series 2019-C Class A2, 1.99% 3/15/23 | 4,300,000 | 4,321,163 | |
| Consumer Lending Receivables Trust Series 2019-A Class A, 3.52% 4/15/26 (b) | 958,423 | 967,916 | |
| Consumer Loan Underlying Bond Credit Trust: | |||
| Series 2018-P3 Class A, 3.82% 1/15/26 (b) | 6,174,900 | 6,240,601 | |
| Series 2019-HP1 Class A, 2.59% 12/15/26 (b) | 7,241,760 | 7,303,759 | |
| Series 2019-P1 Class A, 2.94% 7/15/26 (b) | 2,834,504 | 2,857,957 | |
| CPS Auto Receivables Trust Series 2019-D Class A, 2.17% 12/15/22 (b) | 1,529,728 | 1,533,919 | |
| DB Master Finance LLC Series 2017-1A: | |||
| Class A2I, 3.629% 11/20/47 (b) | 4,228,665 | 4,342,670 | |
| Class A2II, 4.03% 11/20/47 (b) | 7,147,480 | 7,595,055 | |
| Dell Equipment Finance Trust Series 2019-2 Class A3, 1.91% 10/22/24 (b) | 6,242,000 | 6,321,994 | |
| DLL Securitization Trust Series 2019-MT3 Class A3, 2.08% 2/21/23 (b) | 2,600,000 | 2,632,530 | |
| Dryden CLO, Ltd. Series 2019-76A Class A1, 3 month U.S. LIBOR + 1.330% 3.264% 10/20/32 (a)(b)(c) | 2,651,000 | 2,651,795 | |
| Dryden Senior Loan Fund: | |||
| Series 2014-36A Class AR2, 3 month U.S. LIBOR + 1.280% 3.1113% 4/15/29 (a)(b)(c) | 10,300,000 | 10,296,910 | |
| Series 2019-72A Class A, 3 month U.S. LIBOR + 1.330% 3.0218% 5/15/32 (a)(b)(c) | 7,149,000 | 7,146,140 | |
| Series 2020-78A Class A, 3 month U.S. LIBOR + 1.180% 0% 4/17/33 (a)(b)(c)(g) | 5,400,000 | 5,400,000 | |
| Enterprise Fleet Financing LLC Series 2019-3 Class A2, 2.06% 5/20/25 (b) | 9,335,000 | 9,437,215 | |
| Exeter Automobile Receivables Trust Series 2019-4A Class A, 2.18% 1/17/23 (b) | 4,816,962 | 4,830,418 | |
| First Franklin Mortgage Loan Trust Series 2004-FF2 Class M3, 1 month U.S. LIBOR + 0.820% 2.4518% 3/25/34 (a)(c) | 100 | 99 | |
| Flagship Credit Auto Trust Series 2019-4 Class A, 2.17% 6/17/24 (b) | 2,174,737 | 2,190,256 | |
| Flatiron CLO Ltd. Series 2019-1A Class A, 3 month U.S. LIBOR + 1.320% 3.2149% 11/16/32 (a)(b)(c) | 7,901,000 | 7,903,370 | |
| Ford Credit Floorplan Master Owner Trust Series 2018-4 Class A, 4.06% 11/15/30 | 5,435,000 | 6,239,513 | |
| Hertz Fleet Lease Funding LP Series 2017-1 Class A1, 1 month U.S. LIBOR + 0.650% 2.3209% 4/10/31 (a)(b)(c) | 1,096,825 | 1,096,911 | |
| Horizon Aircraft Finance I Ltd. Series 2018-1 Class A, 4.458% 12/15/38 (b) | 3,654,031 | 3,782,430 | |
| Horizon Aircraft Finance Ltd. Series 2019-1 Class A, 3.721% 7/15/39 (b) | 3,764,160 | 3,853,928 | |
| JPMorgan Mtg Acquisition Corp. Series 2005-FRE1 Class A2V3, 1 month U.S. LIBOR + 0.330% 1.9568% 10/25/35 (a)(c) | 2,549,594 | 2,529,725 | |
| Lanark Master Issuer PLC Series 2020-1A Class 1A, 2.277% 12/22/69 (a)(b) | 6,383,000 | 6,442,821 | |
| Madison Park Funding Ltd.: | |||
| Series 2012-10A Class AR2, 3 month U.S. LIBOR + 1.220% 3.0391% 1/20/29 (a)(b)(c) | 3,469,000 | 3,467,266 | |
| Series 2019-37A Class A1, 3 month U.S. LIBOR + 1.300% 3.1313% 7/15/32 (a)(b)(c) | 8,529,000 | 8,530,706 | |
| Madison Park Funding XXXIII Ltd. Series 2019-33A Class A, 3 month U.S. LIBOR + 1.330% 3.1741% 10/15/32 (a)(b)(c) | 3,846,000 | 3,847,538 | |
| Magnetite CLO Ltd.: | |||
| Series 2019-21A Class A, 3 month U.S. LIBOR + 1.280% 3.0991% 4/20/30 (a)(b)(c) | 7,784,000 | 7,794,119 | |
| Series 2019-24A Class A, 3 month U.S. LIBOR + 1.330% 3.2371% 1/15/33 (a)(b)(c) | 5,176,000 | 5,181,694 | |
| Marlette Funding Trust: | |||
| Series 2019-4A Class A, 2.39% 12/17/29 (b) | 4,142,429 | 4,171,106 | |
| Series 2020-1A Class A, 2.24% 3/15/30 (b) | 3,000,000 | 3,013,550 | |
| Metlife Securitization Trust Series 2019-1A Class A1A, 3.75% 4/25/58 (b) | 3,681,193 | 3,881,147 | |
| Milos CLO, Ltd. Series 2020-1A Class AR, 3 month U.S. LIBOR + 1.070% 2.7571% 10/20/30 (a)(b)(c) | 8,191,000 | 8,191,000 | |
| Nationstar HECM Loan Trust: | |||
| Series 2018-2A Class A, 3.1877% 7/25/28 (b) | 960,454 | 960,802 | |
| Series 2018-3A Class A 3.5545% 11/25/28 (b) | 3,392,625 | 3,387,981 | |
| Series 2019-1A Class A, 2.6513% 6/25/29 (b) | 2,982,109 | 2,992,909 | |
| Navistar Financial Dealer Note Master Trust Series 2018-1 Class A, 1 month U.S. LIBOR + 0.630% 2.2568% 9/25/23 (a)(b)(c) | 11,000,000 | 11,021,148 | |
| New Century Home Equity Loan Trust Series 2005-4 Class M2, 1 month U.S. LIBOR + 0.510% 2.1368% 9/25/35 (a)(c) | 76,951 | 76,957 | |
| Niagara Park CLO, Ltd. Series 2019-1A Class A, 3 month U.S. LIBOR + 1.300% 3.1361% 7/17/32 (a)(b)(c) | 8,530,000 | 8,531,706 | |
| Planet Fitness Master Issuer LLC Series 2019-1A Class A2, 3.858% 12/5/49 (b) | 6,154,000 | 6,429,945 | |
| Prosper Marketplace Issuance Trust: | |||
| Series 2018-2A Class A, 3.35% 10/15/24 (b) | 556,399 | 557,500 | |
| Series 2019-4A Class A, 2.48% 2/17/26 (b) | 2,019,847 | 2,029,827 | |
| RMF Buyout Issuance Trust Series 2020-1 Class A, 2.1582% 2/25/30 (b) | 277,207 | 279,679 | |
| Sapphire Aviation Finance Series 2020-1A: | |||
| Class A, 3.228% 3/15/40 (b) | 7,806,000 | 7,805,881 | |
| Class B, 4.335% 3/15/40 (b) | 712,000 | 707,662 | |
| SBA Tower Trust Series 2019, 2.836% 1/15/50 (b) | 8,004,000 | 8,391,151 | |
| SoFi Consumer Loan Program Trust Series 2019-4 Class A, 2.45% 8/25/28 (b) | 8,115,234 | 8,191,665 | |
| Taconic Park CLO, Ltd. Series 2020-1A Class A1R, 3 month U.S. LIBOR + 1.000% 1% 1/20/29 (a)(b)(c) | 5,538,000 | 5,538,000 | |
| Terwin Mortgage Trust Series 2003-4HE Class A1, 1 month U.S. LIBOR + 0.860% 2.4868% 9/25/34 (a)(c) | 3,983 | 3,908 | |
| Thunderbolt Aircraft Lease Ltd. Series 2018-A Class A, 4.147% 9/15/38 (a)(b) | 8,014,685 | 8,316,192 | |
| Thunderbolt III Aircraft Lease Ltd. Series 2019-1 Class A, 3.671% 11/15/39 (b) | 10,047,322 | 10,159,530 | |
| Towd Point Mortgage Trust: | |||
| Series 2018-3 Class A1, 3.75% 5/25/58 (b) | 6,476,876 | 6,841,868 | |
| Series 2018-6 Class A1A, 3.75% 3/25/58 (b) | 5,637,552 | 5,906,824 | |
| Series 2019-1 Class A1, 3.75% 3/25/58 (b) | 2,725,328 | 2,908,398 | |
| Series 2019-MH1 Class A1, 3% 11/25/58 (b) | 2,159,746 | 2,191,897 | |
| Upgrade Receivables Trust: | |||
| Series 2019-1A Class A, 3.48% 3/15/25 (b) | 1,046,566 | 1,050,169 | |
| Series 2019-2A Class A, 2.77% 10/15/25 (b) | 4,503,629 | 4,525,356 | |
| Verde CLO Ltd. Series 2019-1A Class A, 3 month U.S. LIBOR + 1.350% 3.1813% 4/15/32 (a)(b)(c) | 8,662,000 | 8,662,000 | |
| Voya CLO Ltd. Series 2019-2A Class A, 3 month U.S. LIBOR + 1.270% 3.0891% 7/20/32 (a)(b)(c) | 8,868,000 | 8,872,434 | |
| TOTAL ASSET-BACKED SECURITIES | |||
| (Cost $413,495,550) | 419,464,944 | ||
| Collateralized Mortgage Obligations - 0.3% | |||
| Private Sponsor - 0.1% | |||
| Banc of America Funding Corp. Series 2015-R3 Class 10A1, 1 month U.S. LIBOR + 0.140% 1.8009% 6/27/36 (a)(b)(c) | 612,484 | 606,628 | |
| BCAP LLC Trust sequential payer: | |||
| Series 2010-RR2 Class 5A2, 5% 12/26/36 (b) | 517,869 | 522,863 | |
| Series 2012-RR5 Class 8A5, 1.8578% 7/26/36 (a)(b) | 102,135 | 101,258 | |
| Citigroup Mortgage Loan Trust sequential payer Series 2009-5 Class 5A1, 4.3541% 1/25/37 (a)(b) | 91,524 | 92,531 | |
| CSMC floater Series 2015-1R Class 6A1, 1 month U.S. LIBOR + 0.280% 2.0073% 5/27/37 (a)(b)(c) | 579,018 | 561,577 | |
| FirstKey Mortgage Trust sequential payer Series 2015-1 Class A9, 3% 3/25/45 (a)(b) | 1,097,056 | 1,109,275 | |
| Gosforth Funding PLC floater Series 2018-1A Class A1, 3 month U.S. LIBOR + 0.450% 2.1293% 8/25/60 (a)(b)(c) | 5,119,518 | 5,116,994 | |
| Holmes Master Issuer PLC floater Series 2018-2A Class A2, 3 month U.S. LIBOR + 0.420% 2.2513% 10/15/54 (a)(b)(c) | 6,626,443 | 6,622,639 | |
| JPMorgan Resecuritization Trust floater Series 2012-2 Class 6A1, 1 month U.S. LIBOR + 0.210% 1.8638% 6/21/36 (a)(b)(c) | 198,407 | 197,790 | |
| Lanark Master Issuer PLC: | |||
| floater Series 2019-1A Class 1A1, 3 month U.S. LIBOR + 0.770% 2.4528% 12/22/69 (a)(b)(c) | 4,172,980 | 4,177,412 | |
| Series 2019-2A Class 1A, 2.71% 12/22/69 (b) | 5,800,000 | 5,897,539 | |
| Merrill Lynch Alternative Note Asset Trust floater Series 2007-OAR1 Class A1, 1 month U.S. LIBOR + 0.170% 1.8309% 2/25/37 (a)(c) | 2,803 | 2,853 | |
| Nationstar HECM Loan Trust sequential payer Series 2019-2A Class A, 2.2722% 11/25/29 (b) | 3,594,663 | 3,584,875 | |
| New Residential Mortgage Loan Trust Series 2019-5A Class A1B, 3.5% 8/25/59 (b) | 2,616,798 | 2,720,732 | |
| New Residential Mtg Ln Trust 2020 3.5% 10/25/59 (b) | 4,127,241 | 4,323,964 | |
| Opteum Mortgage Acceptance Corp. floater Series 2005-3 Class APT, 1 month U.S. LIBOR + 0.290% 1.9168% 7/25/35 (a)(c) | 1,575 | 1,576 | |
| Permanent Master Issuer PLC floater: | |||
| Series 2018-1A Class 1A1, 3 month U.S. LIBOR + 0.380% 2.2113% 7/15/58 (a)(b)(c) | 11,487,000 | 11,487,425 | |
| Series-1A Class 1A1, 3 month U.S. LIBOR + 0.550% 2.3813% 7/15/58 (a)(b)(c) | 5,256,000 | 5,263,626 | |
| Provident Funding Mortgage Trust sequential payer Series 2019-1 Class A3, 3% 12/25/49 (b) | 3,840,208 | 3,930,213 | |
| Sequoia Mortgage Trust floater Series 2004-6 Class A3B, 6 month U.S. LIBOR + 0.880% 2.7849% 7/20/34 (a)(c) | 1,466 | 1,438 | |
| Silverstone Master Issuer PLC floater: | |||
| Series 2015-1A Class 2A2, 3 month U.S. LIBOR + 0.550% 2.3691% 1/21/70 (a)(b)(c) | 1,485,000 | 1,485,322 | |
| Series 2019-1A Class 1A, 3 month U.S. LIBOR + 0.570% 2.3891% 1/21/70 (a)(b)(c) | 4,161,540 | 4,165,057 | |
| Thornburg Mortgage Securities Trust floater Series 2003-4 Class A1, 1 month U.S. LIBOR + 0.640% 2.2668% 9/25/43 (a)(c) | 2,397,415 | 2,400,990 | |
| Winwater Mortgage Loan Trust sequential payer Series 2015-1 Class A9, 2.5% 1/20/45 (b) | 151,203 | 151,148 | |
| TOTAL PRIVATE SPONSOR | 64,525,725 | ||
| U.S. Government Agency - 0.2% | |||
| Fannie Mae: | |||
| planned amortization class Series 2012-149: | |||
| Class DA, 1.75% 1/25/43 | 1,269,793 | 1,278,359 | |
| Class GA, 1.75% 6/25/42 | 1,334,373 | 1,343,291 | |
| Series 2005-79 Class ZC, 5.9% 9/25/35 | 294,005 | 339,842 | |
| Series 2007-75 Class JI, 6.540% - 1 month U.S. LIBOR 4.9183% 8/25/37 (a)(i)(j) | 1,100,707 | 241,249 | |
| Series 2010-135 Class ZA, 4.5% 12/25/40 | 965,416 | 1,076,088 | |
| Series 2010-150 Class ZC, 4.75% 1/25/41 | 992,645 | 1,128,283 | |
| Series 2010-95 Class ZC, 5% 9/25/40 | 2,130,730 | 2,440,458 | |
| Series 2011-4 Class PZ, 5% 2/25/41 | 451,842 | 520,448 | |
| Series 2012-100 Class WI, 3% 9/25/27 (i) | 675,659 | 50,007 | |
| Series 2012-14 Class JS, 6.650% - 1 month U.S. LIBOR 5.0233% 12/25/30 (a)(i)(j) | 243,539 | 20,401 | |
| Series 2012-9 Class SH, 6.550% - 1 month U.S. LIBOR 4.9233% 6/25/41 (a)(i)(j) | 304,993 | 32,779 | |
| Series 2013-133 Class IB, 3% 4/25/32 (i) | 481,446 | 25,553 | |
| Series 2013-134 Class SA, 6.050% - 1 month U.S. LIBOR 4.4233% 1/25/44 (a)(i)(j) | 254,085 | 42,496 | |
| Series 2013-44 Class DJ, 1.85% 5/25/33 | 12,908,814 | 12,967,223 | |
| Series 2013-51 Class GI, 3% 10/25/32 (i) | 872,691 | 69,796 | |
| Series 2015-42 Class IL, 6% 6/25/45 (i) | 1,131,682 | 234,010 | |
| Series 2015-70 Class JC, 3% 10/25/45 | 904,530 | 954,846 | |
| Series 2017-30 Class AI, 5.5% 5/25/47 (i) | 610,470 | 122,047 | |
| Freddie Mac: | |||
| planned amortization class Series 4135 Class AB, 1.75% 6/15/42 | 1,004,214 | 1,011,656 | |
| sequential payer Series 3871 Class KB, 5.5% 6/15/41 | 755,852 | 896,084 | |
| Series 2017-4683 Class LM, 3% 5/15/47 | 1,252,741 | 1,303,642 | |
| Series 2933 Class ZM, 5.75% 2/15/35 | 565,335 | 671,867 | |
| Series 2996 Class ZD, 5.5% 6/15/35 | 386,157 | 456,157 | |
| Series 3237 Class C, 5.5% 11/15/36 | 562,160 | 650,136 | |
| Series 3955 Class YI, 3% 11/15/21 (i) | 68,475 | 1,216 | |
| Series 3980 Class EP, 5% 1/15/42 | 3,424,193 | 3,844,403 | |
| Series 4055 Class BI, 3.5% 5/15/31 (i) | 428,662 | 25,072 | |
| Series 4149 Class IO, 3% 1/15/33 (i) | 420,121 | 44,510 | |
| Series 4314 Class AI, 5% 3/15/34 (i) | 137,295 | 10,660 | |
| Series 4427 Class LI, 3.5% 2/15/34 (i) | 788,902 | 59,011 | |
| Series 4471 Class PA 4% 12/15/40 | 662,431 | 696,158 | |
| Freddie Mac Multi-family Structured pass-thru certificates Series 4386 Class AZ, 4.5% 11/15/40 | 950,556 | 1,040,915 | |
| Freddie Mac Seasoned Credit Risk Transfer Trust Series 2018-3 Class M55D, 4% 8/25/57 | 3,211,316 | 3,468,159 | |
| Ginnie Mae guaranteed REMIC pass-thru certificates: | |||
| floater: | |||
| Series 2010-H27 Series FA, 1 month U.S. LIBOR + 0.380% 2.1144% 12/20/60 (a)(c)(k) | 1,052,219 | 1,049,846 | |
| Series 2011-H20 Class FA, 1 month U.S. LIBOR + 0.550% 2.2844% 9/20/61 (a)(c)(k) | 4,733,196 | 4,743,236 | |
| Series 2012-H18 Class NA, 1 month U.S. LIBOR + 0.520% 2.2544% 8/20/62 (a)(c)(k) | 968,425 | 969,217 | |
| Series 2012-H21 Class DF, 1 month U.S. LIBOR + 0.650% 2.3844% 5/20/61 (a)(c)(k) | 22,795 | 22,860 | |
| Series 2013-H19 Class FC, 1 month U.S. LIBOR + 0.600% 2.3344% 8/20/63 (a)(c)(k) | 3,130,992 | 3,138,184 | |
| planned amortization class: | |||
| Series 2010-158 Class MS, 10.000% - 1 month U.S. LIBOR 6.706% 12/20/40 (a)(j) | 1,187,000 | 1,446,332 | |
| Series 2016-69 Class WA, 3% 2/20/46 | 818,997 | 856,017 | |
| Series 2017-134 Class BA, 2.5% 11/20/46 | 1,401,103 | 1,445,362 | |
| sequential payer: | |||
| Series 2010-160 Class DY, 4% 12/20/40 | 2,508,816 | 2,811,657 | |
| Series 2010-170 Class B, 4% 12/20/40 | 559,259 | 626,697 | |
| Series 2017-139 Class BA, 3% 9/20/47 | 7,804,913 | 8,275,769 | |
| Series 2010-116 Class QB, 4% 9/16/40 | 3,947,281 | 4,193,353 | |
| Series 2010-14 Class SN, 5.950% - 1 month U.S. LIBOR 4.2915% 2/16/40 (a)(i)(j) | 584,607 | 101,867 | |
| Series 2011-94 Class SA, 6.100% - 1 month U.S. LIBOR 4.453% 7/20/41 (a)(i)(j) | 183,022 | 33,349 | |
| Series 2013-149 Class MA, 2.5% 5/20/40 | 2,897,799 | 3,005,132 | |
| Series 2015-H13 Class HA, 2.5% 8/20/64 (k) | 543,983 | 545,456 | |
| Series 2015-H17 Class HA, 2.5% 5/20/65 (k) | 590,376 | 591,138 | |
| Series 2017-H06 Class FA, U.S. TREASURY 1 YEAR INDEX + 0.350% 1.88% 8/20/66 (a)(c)(k) | 3,499,856 | 3,501,205 | |
| TOTAL U.S. GOVERNMENT AGENCY | 74,423,499 | ||
| TOTAL COLLATERALIZED MORTGAGE OBLIGATIONS | |||
| (Cost $136,827,082) | 138,949,224 | ||
| Commercial Mortgage Securities - 1.1% | |||
| BAMLL Commercial Mortgage Securities Trust: | |||
| sequential payer Series 2019-BPR: | |||
| Class AMP, 3.287% 11/5/32 (b) | 6,500,000 | 6,859,361 | |
| Class ANM, 3.112% 11/5/32 (b) | 4,963,000 | 5,253,089 | |
| Series 2019-BPR: | |||
| Class BNM, 3.465% 11/5/32 (b) | 1,113,000 | 1,179,800 | |
| Class CNM, 3.8425% 11/5/32 (a)(b) | 461,000 | 487,698 | |
| BANK sequential payer: | |||
| Series 2019-BN21 Class A4, 2.6% 10/17/52 | 4,400,000 | 4,653,192 | |
| Series 2019-BN24 Class A3, 2.96% 11/15/62 | 2,500,000 | 2,719,429 | |
| Barclays Commercial Mortgage Securities LLC Series 2015-STP Class A, 3.3228% 9/10/28 (b) | 3,445,145 | 3,461,156 | |
| Bayview Commercial Asset Trust floater: | |||
| Series 2005-3A Class A2, 1 month U.S. LIBOR + 0.400% 2.0268% 11/25/35 (a)(b)(c) | 24,478 | 23,636 | |
| Series 2005-4A: | |||
| Class A2, 1 month U.S. LIBOR + 0.390% 2.0168% 1/25/36 (a)(b)(c) | 60,757 | 58,701 | |
| Class M1, 1 month U.S. LIBOR + 0.450% 2.0768% 1/25/36 (a)(b)(c) | 19,611 | 18,951 | |
| Series 2006-4A Class A2, 1 month U.S. LIBOR + 0.270% 1.8968% 12/25/36 (a)(b)(c) | 152,627 | 146,620 | |
| Series 2007-1 Class A2, 1 month U.S. LIBOR + 0.270% 1.8968% 3/25/37 (a)(b)(c) | 37,333 | 35,238 | |
| Series 2007-2A: | |||
| Class A1, 1 month U.S. LIBOR + 0.270% 1.8968% 7/25/37 (a)(b)(c) | 110,608 | 105,147 | |
| Class A2, 1 month U.S. LIBOR + 0.320% 1.9468% 7/25/37 (a)(b)(c) | 103,558 | 97,180 | |
| Class M1, 1 month U.S. LIBOR + 0.370% 1.9968% 7/25/37 (a)(b)(c) | 35,249 | 32,761 | |
| Series 2007-3: | |||
| Class A2, 1 month U.S. LIBOR + 0.290% 1.9168% 7/25/37 (a)(b)(c) | 38,330 | 36,228 | |
| Class M1, 1 month U.S. LIBOR + 0.310% 1.9368% 7/25/37 (a)(b)(c) | 20,313 | 19,311 | |
| Class M2, 1 month U.S. LIBOR + 0.340% 1.9668% 7/25/37 (a)(b)(c) | 21,726 | 20,487 | |
| Class M3, 1 month U.S. LIBOR + 0.370% 1.9968% 7/25/37 (a)(b)(c) | 34,797 | 32,092 | |
| Class M4, 1 month U.S. LIBOR + 0.500% 2.1268% 7/25/37 (a)(b)(c) | 54,933 | 51,468 | |
| Class M5, 1 month U.S. LIBOR + 0.600% 2.2268% 7/25/37 (a)(b)(c) | 22,423 | 27,196 | |
| BBCMS Mortgage Trust sequential payer Series 2019-C4 Class A4, 2.661% 8/15/52 | 4,000,000 | 4,211,545 | |
| Benchmark Commercial Mortgage Trust Series 2018-B3 Class A3, 3.746% 4/10/51 | 1,700,000 | 1,847,516 | |
| Benchmark Mortgage Trust: | |||
| Series 2019-B12 Class XA, 1.0683% 8/15/52 (a)(i) | 40,145,393 | 3,028,155 | |
| Series 2019-B14 Class XA, 0.7912% 12/15/62 (a)(i) | 22,980,081 | 1,307,479 | |
| BX Commercial Mortgage Trust: | |||
| floater Series 2020-BXLP: | |||
| Class B, 1 month U.S. LIBOR + 1.000% 2.6585% 12/15/29 (a)(b)(c) | 4,451,000 | 4,449,662 | |
| Class C, 1 month U.S. LIBOR + 1.120% 2.7785% 12/15/29 (a)(b)(c) | 3,689,000 | 3,692,472 | |
| Class D, 1 month U.S. LIBOR + 1.250% 2.9085% 12/15/29 (a)(b)(c) | 5,099,000 | 5,113,402 | |
| floater sequential payer: | |||
| Series 2019-CALM Class A, 1 month U.S. LIBOR + 0.870% 2.5345% 11/15/32 (a)(b)(c) | 1,900,000 | 1,900,594 | |
| Series 2020-BXLP Class A, 1 month U.S. LIBOR + 0.800% 2.4585% 12/15/29 (a)(b)(c) | 8,812,000 | 8,816,073 | |
| BX Trust: | |||
| floater: | |||
| Series 2018-EXCL: | |||
| Class A, 1 month U.S. LIBOR + 1.088% 2.7461% 9/15/37 (a)(b)(c) | 3,889,969 | 3,885,292 | |
| Class B, 1 month U.S. LIBOR + 1.320% 2.9835% 9/15/37 (a)(b)(c) | 4,446,198 | 4,439,064 | |
| Class D, 1 month U.S. LIBOR + 2.620% 4.2835% 9/15/37 (a)(b)(c) | 2,530,703 | 2,531,679 | |
| Series 2018-IND Class F, 1 month U.S. LIBOR + 1.800% 3.4585% 11/15/35 (a)(b)(c) | 2,713,900 | 2,718,257 | |
| Series 2019-IMC: | |||
| Class B, 1 month U.S. LIBOR + 1.300% 2.9585% 4/15/34 (a)(b)(c) | 4,464,000 | 4,462,647 | |
| Class C, 1 month U.S. LIBOR + 1.600% 3.2585% 4/15/34 (a)(b)(c) | 2,952,000 | 2,951,995 | |
| Class D, 1 month U.S. LIBOR + 1.900% 3.5585% 4/15/34 (a)(b)(c) | 3,099,000 | 3,100,950 | |
| Series 2019-XL: | |||
| Class B, 1 month U.S. LIBOR + 1.080% 2.7385% 10/15/36 (a)(b)(c) | 3,832,112 | 3,838,264 | |
| Class C, 1 month U.S. LIBOR + 1.250% 2.9085% 10/15/36 (a)(b)(c) | 4,818,085 | 4,830,174 | |
| Class D, 1 month U.S. LIBOR + 1.450% 3.1085% 10/15/36 (a)(b)(c) | 6,823,471 | 6,849,505 | |
| Class E, 1 month U.S. LIBOR + 1.800% 3.4585% 10/15/36 (a)(b)(c) | 9,588,400 | 9,630,788 | |
| Series 2020-BXLP Class E, 1 month U.S. LIBOR + 1.600% 3.2585% 12/15/29 (a)(b)(c) | 4,677,000 | 4,699,075 | |
| floater, sequential payer: | |||
| Series 2019-IMC Class A, 1 month U.S. LIBOR + 1.000% 2.6585% 4/15/34 (a)(b)(c) | 8,070,000 | 8,065,125 | |
| Series 2019-XL Class A, 1 month U.S. LIBOR + 0.920% 2.5785% 10/15/36 (a)(b)(c) | 18,439,230 | 18,521,716 | |
| CD Commercial Mortgage Trust Series 2017-CD6 Class A3, 3.104% 11/13/50 | 2,500,000 | 2,656,715 | |
| CGDB Commercial Mortgage Trust floater Series 2019-MOB: | |||
| Class A, 1 month U.S. LIBOR + 0.950% 2.6085% 11/15/36 (a)(b)(c) | 3,687,000 | 3,684,688 | |
| Class B, 1 month U.S. LIBOR + 1.250% 2.9085% 11/15/36 (a)(b)(c) | 1,400,000 | 1,397,364 | |
| CHC Commercial Mortgage Trust floater Series 2019-CHC: | |||
| Class A, 1 month U.S. LIBOR + 1.120% 2.7785% 6/15/34 (a)(b)(c) | 14,057,000 | 14,050,411 | |
| Class B, 1 month U.S. LIBOR + 1.500% 3.1585% 6/15/34 (a)(b)(c) | 2,119,000 | 2,115,678 | |
| Class C, 1 month U.S. LIBOR + 1.750% 3.4085% 6/15/34 (a)(b)(c) | 2,394,000 | 2,390,247 | |
| Citigroup Commercial Mortgage Trust: | |||
| sequential payer Series 2016-GC37 Class A3, 3.05% 4/10/49 | 4,000,000 | 4,281,484 | |
| Series 2015-GC29 Class XA, 1.0774% 4/10/48 (a)(i) | 31,995,730 | 1,449,701 | |
| Series 2015-GC33 Class XA, 0.8942% 9/10/58 (a)(i) | 18,937,622 | 806,551 | |
| Series 2016-C2 Class A3, 2.575% 8/10/49 | 2,800,000 | 2,934,248 | |
| Series 2016-GC36 Class A4, 3.349% 2/10/49 | 2,500,000 | 2,717,370 | |
| Series 2016-P6 Class XA, 0.7931% 12/10/49 (a)(i) | 17,410,027 | 584,061 | |
| COMM Mortgage Trust: | |||
| sequential payer: | |||
| Series 2013-CR7 Class AM, 3.314% 3/10/46 (b) | 1,700,000 | 1,776,497 | |
| Series 2015-DC1 Class A5, 3.35% 2/10/48 | 3,800,000 | 4,093,398 | |
| Series 2014-CR17 Class XA, 0.9735% 5/10/47 (a)(i) | 18,926,886 | 660,927 | |
| Series 2014-CR20 Class XA, 1.0272% 11/10/47 (a)(i) | 18,188,941 | 744,619 | |
| Series 2014-LC17 Class XA, 0.7681% 10/10/47 (a)(i) | 42,222,920 | 1,192,325 | |
| Series 2014-UBS6: | |||
| Class A5, 3.644% 12/10/47 | 3,900,000 | 4,223,641 | |
| Class XA, 0.892% 12/10/47 (a)(i) | 11,077,262 | 380,085 | |
| Series 2015-CR23 Class A3, 3.23% 5/10/48 | 2,500,000 | 2,686,272 | |
| Series 2015-CR24 Class A4, 3.432% 8/10/48 | 1,500,000 | 1,622,073 | |
| Series 2015-PC1 Class A4, 3.62% 7/10/50 | 1,900,000 | 2,073,799 | |
| Core Industrial Trust floater Series 2019-CORE Class A, 1 month U.S. LIBOR + 0.880% 2.5385% 12/15/31 (a)(b)(c) | 2,583,000 | 2,582,225 | |
| Credit Suisse Mortgage Trust: | |||
| floater Series 2019-ICE4 Class A, 1 month U.S. LIBOR + 0.980% 2.6385% 5/15/36 (a)(b)(c) | 15,700,000 | 15,699,983 | |
| Series 2018-SITE: | |||
| Class A, 4.284% 4/15/36 (b) | 5,008,000 | 5,383,233 | |
| Class B, 4.5349% 4/15/36 (b) | 1,543,000 | 1,658,688 | |
| Class C, 4.782% 4/15/36 (a)(b) | 1,033,000 | 1,107,420 | |
| Class D, 4.782% 4/15/36 (a)(b) | 2,066,000 | 2,182,178 | |
| CSAIL Commercial Mortgage Trust Series 2016-C7 Class A4, 3.21% 11/15/49 | 2,800,000 | 2,997,825 | |
| Fannie Mae Series 2017-M1 Class A2, 2.4167% 10/25/26 (a) | 2,300,000 | 2,435,088 | |
| Freddie Mac: | |||
| sequential payer: | |||
| Series 2017-K069 Class AM, 3.248% 9/25/27 | 1,750,000 | 1,924,160 | |
| Series 2018-K082 Class A2, 3.92% 9/25/28 | 10,200,000 | 11,956,032 | |
| Series 2018-K083 Class AM, 4.03% 10/25/28 | 1,150,000 | 1,354,031 | |
| Series 2019-K103 Class A2, 2.651% 11/25/29 | 13,700,000 | 14,889,660 | |
| Series K076: | |||
| Class A2, 3.9% 4/25/28 | 4,800,000 | 5,585,251 | |
| Class AM, 3.9% 4/25/28 | 2,125,000 | 2,460,431 | |
| Series K077 Class AM, 3.85% 5/25/28 | 660,000 | 763,621 | |
| Series K090 Class A2, 3.422% 2/25/29 | 7,200,000 | 8,194,623 | |
| Freddie Mac Multi-family Structured pass-thru certificates Series K078 Class A2, 3.854% 6/25/28 | 17,300,000 | 20,105,008 | |
| GS Mortgage Securities Trust: | |||
| floater: | |||
| Series 2018-3PCK Class A, 1 month U.S. LIBOR + 1.450% 3.1085% 9/15/31 (a)(b)(c) | 17,575,000 | 17,530,699 | |
| Series 2018-HART Class A, 1 month U.S. LIBOR + 1.090% 2.7485% 10/15/31 (a)(b)(c) | 4,013,000 | 4,016,078 | |
| Series 2013-GC12 Class XA, 1.4176% 6/10/46 (a)(i) | 5,403,705 | 204,678 | |
| Series 2015-GC30 Class A3, 3.119% 5/10/50 | 2,000,000 | 2,135,133 | |
| Series 2015-GC34 Class XA, 1.2682% 10/10/48 (a)(i) | 5,885,017 | 336,293 | |
| Series 2019-GC40 Class A3, 2.904% 7/10/52 | 2,000,000 | 2,152,239 | |
| JPMBB Commercial Mortgage Securities Trust: | |||
| Series 2014-C19 Class XA, 0.7505% 4/15/47 (a)(i) | 3,492,438 | 71,710 | |
| Series 2015-C30 Class A4, 3.5508% 7/15/48 | 1,900,000 | 2,064,482 | |
| JPMorgan Chase Commercial Mortgage Securities Trust: | |||
| floater Series 2019-BKWD Class A, 1 month U.S. LIBOR + 1.000% 2.6585% 9/15/29 (a)(b)(c) | 6,300,000 | 6,301,950 | |
| Series 2007-CB19 Class B, 5.9407% 2/12/49 (a)(l) | 15,599 | 780 | |
| Series 2018-WPT: | |||
| Class AFX, 4.2475% 7/5/33 (b) | 2,700,000 | 2,925,670 | |
| Class CFX, 4.9498% 7/5/33 (b) | 919,000 | 997,527 | |
| Class DFX, 5.3503% 7/5/33 (b) | 1,414,000 | 1,537,439 | |
| Class EFX, 5.5422% 7/5/33 (b) | 1,934,000 | 2,085,995 | |
| Class XAFX, 1.116% 7/5/33 (a)(b)(i) | 10,000,000 | 358,383 | |
| Series 2019-COR4 Class A3, 3.7629% 3/10/52 | 5,400,000 | 6,041,620 | |
| Morgan Stanley BAML Trust: | |||
| sequential payer: | |||
| Series 2014-C16 Class A3, 3.592% 6/15/47 | 1,637,170 | 1,660,594 | |
| Series 2015-C21 Class A3, 3.077% 3/15/48 | 3,732,073 | 3,960,526 | |
| Series 2015-C25: | |||
| Class A4, 3.372% 10/15/48 | 2,800,000 | 3,033,639 | |
| Class XA, 1.0925% 10/15/48 (a)(i) | 10,889,144 | 504,504 | |
| Series 2015-C26 Class A4, 3.252% 10/15/48 | 3,200,000 | 3,434,684 | |
| Series 2016-C32 Class A3, 3.459% 12/15/49 | 5,100,000 | 5,612,712 | |
| Morgan Stanley Capital I Trust: | |||
| floater: | |||
| Series 2018-BOP Class A, 1 month U.S. LIBOR + 0.850% 2.5085% 8/15/33 (a)(b)(c) | 7,150,000 | 7,141,394 | |
| Series 2019-AGLN Class A, 1 month U.S. LIBOR + 0.950% 2.6085% 3/15/34 (a)(b)(c) | 3,470,000 | 3,461,289 | |
| floater sequential payer Series 2019-NUGS Class A, 1 month U.S. LIBOR + 0.950% 2.6085% 12/15/36 (a)(b)(c) | 5,200,000 | 5,194,282 | |
| sequential payer Series 2019-MEAD Class A, 3.17% 11/10/36 (b) | 10,782,000 | 11,357,829 | |
| Series 2011-C3 Class AJ, 5.2445% 7/15/49 (a)(b) | 4,200,000 | 4,374,987 | |
| Series 2015-UBS8 Class A3, 3.54% 12/15/48 | 3,000,000 | 3,270,196 | |
| Series 2016-UB12 Class A3, 3.337% 12/15/49 | 2,000,000 | 2,183,563 | |
| Series 2018-H4 Class A4, 4.31% 12/15/51 | 3,237,000 | 3,819,667 | |
| Series 2019-MEAD: | |||
| Class B, 3.1771% 11/10/36 (b) | 1,558,000 | 1,617,536 | |
| Class C, 3.1771% 11/10/36 (b) | 1,495,000 | 1,532,128 | |
| MSCG Trust Series 2016-SNR: | |||
| Class A, 3.348% 11/15/34 (a)(b) | 511,909 | 517,475 | |
| Class B, 4.181% 11/15/34 (b) | 1,796,900 | 1,830,497 | |
| Class C, 5.205% 11/15/34 (b) | 1,260,550 | 1,293,916 | |
| RETL floater Series 2019-RVP: | |||
| Class A, 1 month U.S. LIBOR + 1.150% 2.8085% 3/15/36 (a)(b)(c) | 3,686,673 | 3,687,814 | |
| Class B, 1 month U.S. LIBOR + 1.550% 3.2085% 3/15/36 (a)(b)(c) | 3,800,000 | 3,803,553 | |
| Class C, 1 month U.S. LIBOR + 2.100% 3.7585% 3/15/36 (a)(b)(c) | 8,731,000 | 8,750,241 | |
| UBS Commercial Mortgage Trust: | |||
| Series 2017-C1 Class A3, 3.283% 11/15/50 | 5,500,000 | 6,025,274 | |
| Series 2017-C7 Class XA, 1.0558% 12/15/50 (a)(i) | 17,574,634 | 1,127,423 | |
| Series 2018-C11 Class A3, 4.3124% 6/15/51 | 4,100,000 | 4,603,358 | |
| Series 2018-C13 Class A3, 4.0694% 10/15/51 | 6,000,000 | 6,903,848 | |
| Series 2018-C9 Class ASB, 4.09% 3/15/51 | 3,300,000 | 3,694,801 | |
| UBS-Barclays Commercial Mortgage Trust floater Series 2013-C6 Class A3, 1 month U.S. LIBOR + 0.790% 2.4479% 4/10/46 (a)(b)(c) | 5,423,000 | 5,480,306 | |
| Wells Fargo Commercial Mortgage Trust: | |||
| sequential payer Series 2020-C55 Class A4, 2.474% 2/15/53 | 5,800,000 | 6,043,098 | |
| Series 2015-C31 Class XA, 1.0142% 11/15/48 (a)(i) | 7,250,725 | 349,814 | |
| Series 2017-C42 Class XA, 0.89% 12/15/50 (a)(i) | 35,668,825 | 2,112,358 | |
| Series 2018-C46 Class XA, 0.9441% 8/15/51 (a)(i) | 13,100,886 | 748,488 | |
| Series 2018-C48 Class A5, 4.302% 1/15/52 | 3,181,000 | 3,740,153 | |
| WF-RBS Commercial Mortgage Trust: | |||
| floater Series 2013-C14 Class A3, 1 month U.S. LIBOR + 0.720% 2.3783% 6/15/46 (a)(b)(c) | 5,434,295 | 5,438,262 | |
| Series 2014-C24 Class XA, 0.8369% 11/15/47 (a)(i) | 6,442,369 | 199,115 | |
| Series 2014-LC14 Class XA, 1.2075% 3/15/47 (a)(i) | 10,032,945 | 379,264 | |
| TOTAL COMMERCIAL MORTGAGE SECURITIES | |||
| (Cost $463,275,242) | 477,661,045 | ||
| Municipal Securities - 0.2% | |||
| Bay Area Toll Auth. San Francisco Bay Toll Bridge Rev.: | |||
| Series 2009 F2, 6.263% 4/1/49 | $3,470,000 | $5,968,504 | |
| Series 2019 F1, 2.574% 4/1/31 | 1,050,000 | 1,111,110 | |
| California Gen. Oblig. Series 2009, 7.5% 4/1/34 | 630,000 | 1,044,282 | |
| Chicago O'Hare Int'l. Arpt. Rev. Series 2018 C, 4.472% 1/1/49 | 910,000 | 1,230,875 | |
| Colorado Reg'l. Trans. District Sales Tax Rev. (Fastracks Proj.) Series 2010 B, 5.844% 11/1/50 | 45,000 | 74,715 | |
| District of Columbia Income Tax Rev. Series 2010 F, 5.582% 12/1/35 | 75,000 | 100,942 | |
| Illinois Gen. Oblig.: | |||
| Series 2003: | |||
| 4.95% 6/1/23 | 6,685,091 | 7,072,492 | |
| 5.1% 6/1/33 | 24,560,000 | 28,735,200 | |
| Series 2010-1, 6.63% 2/1/35 | 3,845,000 | 4,834,818 | |
| Series 2010-3: | |||
| 6.725% 4/1/35 | 2,510,000 | 3,146,109 | |
| 7.35% 7/1/35 | 4,655,000 | 6,015,843 | |
| Series 2010-5, 6.2% 7/1/21 | 958,000 | 991,281 | |
| Jobsohio Beverage Sys. Statewide Series 2020 A, 2.833% 1/1/38 | 325,000 | 350,126 | |
| Los Angeles Dept. of Wtr. & Pwr. Rev. Series 2010 A, 5.716% 7/1/39 | 190,000 | 280,052 | |
| Maryland Trans. Auth. Trans. Facility Projs. Rev. Series 2009 B, 5.888% 7/1/43 | 50,000 | 74,377 | |
| Massachusetts Commonwealth Trans. Fund Rev. (Accelerated Bridge Prog.) Series 2010 A, 5.731% 6/1/40 | 150,000 | 213,149 | |
| Michigan Fin. Auth. Rev. Series 2019 T, 3.384% 12/1/40 | 545,000 | 614,024 | |
| New Jersey Econ. Dev. Auth. State Pension Fdg. Rev. Series 1997, 7.425% 2/15/29 (Nat'l. Pub. Fin. Guarantee Corp. Insured) | 9,315,000 | 12,162,782 | |
| New Jersey Tpk. Auth. Tpk. Rev.: | |||
| Series 2009 E, 7.414% 1/1/40 | 1,740,000 | 3,020,692 | |
| Series 2010 A, 7.102% 1/1/41 | 1,675,000 | 2,829,092 | |
| New York City Muni. Wtr. Fin. Auth. Wtr. & Swr. Sys. Rev. Series 2010 DD, 5.952% 6/15/42 | 25,000 | 40,722 | |
| New York City Transitional Fin. Auth. Rev. Series 2010 C2, 5.767% 8/1/36 | 900,000 | 1,192,959 | |
| Ohio State Univ. Gen. Receipts: | |||
| Series 2010 C, 4.91% 6/1/40 | 365,000 | 513,139 | |
| Series 2011 A, 4.8% 6/1/11 | 1,678,000 | 2,588,164 | |
| Port Auth. of New York & New Jersey 174th Series, 4.458% 10/1/62 | 390,000 | 532,974 | |
| Salt River Proj. Agricultural Impt. & Pwr. District Elec. Sys. Rev. Series 2010 A, 4.839% 1/1/41 | 750,000 | 1,054,800 | |
| Texas Private Activity Bond Surface Trans. Corp. (NTE Mobility Partners LLC North Tarrant Express Managed Lanes Proj.) Series 2019 B, 3.922% 12/31/49 | 555,000 | 641,369 | |
| Univ. of California Revs. Series 2009 R, 5.77% 5/15/43 | 60,000 | 88,468 | |
| TOTAL MUNICIPAL SECURITIES | |||
| (Cost $75,319,065) | 86,523,060 | ||
| Foreign Government and Government Agency Obligations - 0.1% | |||
| Colombian Republic: | |||
| 3.875% 4/25/27 | $600,000 | $646,875 | |
| 5% 6/15/45 | 1,895,000 | 2,297,095 | |
| Hungarian Republic 7.625% 3/29/41 | 600,000 | 1,026,000 | |
| Indonesian Republic: | |||
| 3.4% 9/18/29 | 1,170,000 | 1,233,619 | |
| 3.5% 1/11/28 | 2,955,000 | 3,123,066 | |
| Israeli State: | |||
| (guaranteed by U.S. Government through Agency for International Development) 5.5% 12/4/23 | 180,000 | 209,589 | |
| 4% 6/30/22 | 1,700,000 | 1,784,694 | |
| Italian Republic 2.375% 10/17/24 | 3,800,000 | 3,816,041 | |
| Panamanian Republic: | |||
| 3.16% 1/23/30 | 1,725,000 | 1,827,422 | |
| 4.3% 4/29/53 | 615,000 | 757,603 | |
| 4.5% 4/16/50 | 400,000 | 498,625 | |
| Province of Quebec yankee 7.125% 2/9/24 | 810,000 | 996,430 | |
| United Mexican States: | |||
| 4.15% 3/28/27 | 750,000 | 824,531 | |
| 4.75% 3/8/44 | 2,960,000 | 3,430,825 | |
| Uruguay Republic: | |||
| 4.975% 4/20/55 | 740,000 | 920,838 | |
| 5.1% 6/18/50 | 1,375,000 | 1,735,508 | |
| TOTAL FOREIGN GOVERNMENT AND GOVERNMENT AGENCY OBLIGATIONS | |||
| (Cost $23,742,838) | 25,128,761 | ||
| Bank Notes - 0.1% | |||
| Capital One NA 2.95% 7/23/21 | 5,551,000 | 5,654,423 | |
| Discover Bank: | |||
| 3.1% 6/4/20 | $6,744,000 | $6,758,325 | |
| 3.2% 8/9/21 | 6,369,000 | 6,504,919 | |
| 3.45% 7/27/26 | 435,000 | 463,395 | |
| 4.682% 8/9/28 (a) | 3,503,000 | 3,722,638 | |
| KeyBank NA 3.9% 4/13/29 | 2,005,000 | 2,243,893 | |
| RBS Citizens NA 2.55% 5/13/21 | 1,705,000 | 1,727,726 | |
| Regions Bank 6.45% 6/26/37 | 2,533,000 | 3,574,977 | |
| SunTrust Banks, Inc.: | |||
| 2.75% 5/1/23 | 645,000 | 669,894 | |
| 3.3% 5/15/26 | 965,000 | 1,042,817 | |
| Synchrony Bank 3.65% 5/24/21 | 5,843,000 | 5,986,917 | |
| U.S. Bank NA, Cincinnati 2.65% 5/23/22 | 1,500,000 | 1,541,437 | |
| TOTAL BANK NOTES | |||
| (Cost $37,607,555) | 39,891,361 | ||
| Shares | Value | ||
| Fixed-Income Funds - 77.1% | |||
| Bank Loan Funds - 0.4% | |||
| Eaton Vance Floating-Rate Fund - Advisers Class | 22,545,645 | $196,598,029 | |
| High Yield Fixed-Income Funds - 0.4% | |||
| Stone Harbor Emerging Markets Debt Fund | 16,123,396 | 159,944,092 | |
| Inflation-Protected Bond Funds - 0.2% | |||
| Fidelity Inflation-Protected Bond Index Fund (m) | 10,148,210 | 105,541,389 | |
| Intermediate Government Funds - 8.4% | |||
| Fidelity SAI U.S. Treasury Bond Index Fund (m) | 368,196,069 | 3,902,878,329 | |
| iShares 3-7 Year Treasury Bond ETF (n) | 5,100 | 664,428 | |
| TOTAL INTERMEDIATE GOVERNMENT FUNDS | 3,903,542,757 | ||
| Intermediate-Term Bond Funds - 66.2% | |||
| Baird Short-Term Bond Fund - Institutional Class | 60,696,066 | 722,890,145 | |
| BlackRock Total Return Fund Institutional Shares | 29,465,133 | 362,126,484 | |
| DoubleLine Total Return Bond Fund Class N | 126,519,307 | 1,380,325,645 | |
| Fidelity SAI Total Bond Fund (m) | 624,510,129 | 6,719,728,989 | |
| Fidelity Sustainability Bond Index Fund (m) | 2,356,525 | 25,615,432 | |
| Fidelity U.S. Bond Index Fund (m) | 12,676,015 | 156,168,500 | |
| iShares Core U.S. Aggregate Bond ETF | 4,531 | 526,593 | |
| John Hancock Bond Fund Class A | 15,015,255 | 248,352,311 | |
| JPMorgan Core Plus Bond Fund Class A | 34,011,217 | 296,237,701 | |
| Metropolitan West Total Return Bond Fund Class M | 207,246,005 | 2,341,879,852 | |
| PIMCO Income Fund Institutional Class | 104,030,310 | 1,245,242,811 | |
| PIMCO Mortgage Opportunities Fund Institutional Class | 80,360,573 | 877,537,456 | |
| PIMCO Total Return Fund Institutional Class | 672,409,185 | 7,194,778,271 | |
| Prudential Total Return Bond Fund Class A | 141,848,164 | 2,119,211,569 | |
| TCW Total Return Bond Fund Class I | 30,586,453 | 315,958,058 | |
| Voya Intermediate Bond Fund Class I | 112,787,632 | 1,202,316,154 | |
| Western Asset Core Bond Fund Class I | 165,000,909 | 2,189,562,062 | |
| Western Asset Core Plus Bond Fund Class I | 269,088,133 | 3,282,875,220 | |
| TOTAL INTERMEDIATE-TERM BOND FUNDS | 30,681,333,253 | ||
| Long Government Bond Funds - 1.5% | |||
| iShares 20+ Year Treasury Bond ETF (n) | 4,433,020 | 688,492,336 | |
| TOTAL FIXED-INCOME FUNDS | |||
| (Cost $34,068,375,007) | 35,735,451,856 | ||
| Principal Amount | Value | ||
| Preferred Securities - 0.1% | |||
| ENERGY - 0.0% | |||
| Oil, Gas & Consumable Fuels - 0.0% | |||
| MPLX LP 6.875% (a)(o) | 300,000 | 290,350 | |
| FINANCIALS - 0.1% | |||
| Banks - 0.1% | |||
| Bank of Nova Scotia 4.65% (a)(o) | 12,927,000 | 12,948,531 | |
| Barclays Bank PLC 7.625% 11/21/22 | 27,412,000 | 31,127,348 | |
| Barclays PLC 7.875% (Reg. S) (a)(o) | 290,000 | 310,864 | |
| Citigroup, Inc. 4.7% (a)(o) | 215,000 | 213,099 | |
| JPMorgan Chase & Co. 4.6% (a)(o) | 490,000 | 494,792 | |
| Royal Bank of Scotland Group PLC 7.5% (a)(o) | 200,000 | 204,418 | |
| Wells Fargo & Co. 5.9% (a)(o) | 700,000 | 759,341 | |
| 46,058,393 | |||
| INDUSTRIALS - 0.0% | |||
| Trading Companies & Distributors - 0.0% | |||
| AerCap Holdings NV 5.875% 10/10/79 (a) | 710,000 | 736,948 | |
| TOTAL PREFERRED SECURITIES | |||
| (Cost $47,463,809) | 47,085,691 | ||
| Shares | Value | ||
| Money Market Funds - 1.2% | |||
| Fidelity Cash Central Fund 1.60% (p) | 68,499,185 | 68,512,885 | |
| Fidelity Securities Lending Cash Central Fund 1.60% (p)(q) | 419,758,124 | 419,800,100 | |
| State Street Institutional U.S. Government Money Market Fund Premier Class 1.53% (r) | 67,053,641 | 67,053,641 | |
| TOTAL MONEY MARKET FUNDS | |||
| (Cost $555,362,981) | 555,366,626 |
| Purchased Swaptions - 0.0% | ||||
| Expiration Date | Notional Amount | Value | ||
| Put Options - 0.0% | ||||
| Option on an interest rate swap with Bank of America N.A. to pay semi-annually a fixed rate of 1.67% and receive quarterly a floating rate based on 3-month LIBOR, expiring February 2030 | 2/7/25 | 20,100,000 | $388,479 | |
| Option on an interest rate swap with Bank of America N.A. to pay semi-annually a fixed rate of 1.785% and receive quarterly a floating rate based on 3-month LIBOR, expiring October 2029 | 10/24/24 | 28,800,000 | 472,237 | |
| Option on an interest rate swap with Bank of America N.A. to pay semi-annually a fixed rate of 2.215% and receive quarterly a floating rate based on 3-month LIBOR, expiring July 2029 | 7/10/24 | 5,000,000 | 49,424 | |
| Option on an interest rate swap with Bank of America, N.A. to pay semi-annually a fixed rate of 2.605% and receive quarterly a floating rate based on 3-month LIBOR, expiring May 2029 | 4/29/22 | 5,300,000 | 13,983 | |
| Option on an interest rate swap with Citibank, N.A. to pay semi-annually a fixed rate of 2.54% and receive quarterly a floating rate based on 3-month LIBOR, expiring April 2029 | 4/5/22 | 4,500,000 | 12,328 | |
| Option on an interest rate swap with Goldman Sachs Bank U.S.A. to pay semi-annually a fixed rate of 1.4% and receive quarterly a floating rate based on 3-month LIBOR, expiring February 2030 | 2/26/25 | 11,700,000 | 288,982 | |
| Option on an interest rate swap with Goldman Sachs Bank U.S.A. to pay semi-annually a fixed rate of 1.4025% and receive quarterly a floating rate based on 3-month LIBOR, expiring February 2030 | 2/26/25 | 14,200,000 | 349,997 | |
| Option on an interest rate swap with Goldman Sachs Bank U.S.A. to pay semi-annually a fixed rate of 1.905% and receive quarterly a floating rate based on 3-month LIBOR, expiring October 2029 | 10/28/24 | 15,700,000 | 229,660 | |
| Option on an interest rate swap with Goldman Sachs Bank U.S.A. to pay semi-annually a fixed rate of 2.2% and receive quarterly a floating rate based on 3-month LIBOR, expiring July 2029 | 7/18/24 | 79,000,000 | 800,037 | |
| Option on an interest rate swap with Goldman Sachs Bank U.S.A. to pay semi-annually a fixed rate of 2.5675% and receive quarterly a floating rate based on 3-month LIBOR, expiring April 2029 | 4/4/22 | 3,000,000 | 7,846 | |
| Option on an interest rate swap with Goldman Sachs Bank U.S.A. to pay semi-annually a fixed rate of 2.645% and receive quarterly a floating rate based on 3-month LIBOR, expiring April 2029 | 4/14/22 | 9,000,000 | 21,255 | |
| TOTAL PUT OPTIONS | 2,634,228 | |||
| Call Options - 0.0% | ||||
| Option on an interest rate swap with Bank of America N.A. to receive semi-annually a fixed rate of 1.67% and pay quarterly a floating rate based on 3-month LIBOR, expiring February 2030 | 2/7/25 | 20,100,000 | 790,276 | |
| Option on an interest rate swap with Bank of America N.A. to receive semi-annually a fixed rate of 1.785% and pay quarterly a floating rate based on 3-month LIBOR, expiring October 2029 | 10/24/24 | 28,800,000 | 1,228,584 | |
| Option on an interest rate swap with Bank of America N.A. to receive semi-annually a fixed rate of 2.215% and pay quarterly a floating rate based on 3-month LIBOR, expiring July 2029 | 7/10/24 | 5,000,000 | 286,704 | |
| Option on an interest rate swap with Bank of America, N.A. to receive semi-annually a fixed rate of 2.605% and pay quarterly a floating rate based on 3-month LIBOR, expiring May 2029 | 4/29/22 | 5,300,000 | 538,044 | |
| Option on an interest rate swap with Citibank, N.A. to receive semi-annually a fixed rate of 2.54% and pay quarterly a floating rate based on 3-month LIBOR, expiring April 2029 | 4/5/22 | 4,500,000 | 439,974 | |
| Option on an interest rate swap with Goldman Sachs Bank U.S.A. to receive semi-annually a fixed rate of 1.4% and pay quarterly a floating rate based on 3-month LIBOR, expiring February 2030 | 2/26/25 | 11,700,000 | 373,066 | |
| Option on an interest rate swap with Goldman Sachs Bank U.S.A. to receive semi-annually a fixed rate of 1.4025% and pay quarterly a floating rate based on 3-month LIBOR, expiring February 2030 | 2/26/25 | 14,200,000 | 453,713 | |
| Option on an interest rate swap with Goldman Sachs Bank U.S.A. to receive semi-annually a fixed rate of 1.905% and pay quarterly a floating rate based on 3-month LIBOR, expiring October 2029 | 10/28/24 | 15,700,000 | 730,211 | |
| Option on an interest rate swap with Goldman Sachs Bank U.S.A. to receive semi-annually a fixed rate of 2.2% and pay quarterly a floating rate based on 3-month LIBOR, expiring July 2029 | 7/18/24 | 79,000,000 | 4,487,698 | |
| Option on an interest rate swap with Goldman Sachs Bank U.S.A. to receive semi-annually a fixed rate of 2.5675% and pay quarterly a floating rate based on 3-month LIBOR, expiring April 2029 | 4/4/22 | 3,000,000 | 298,327 | |
| Option on an interest rate swap with Goldman Sachs Bank U.S.A. to receive semi-annually a fixed rate of 2.645% and pay quarterly a floating rate based on 3-month LIBOR, expiring April 2029 | 4/14/22 | 9,000,000 | 937,298 | |
| TOTAL CALL OPTIONS | 10,563,895 | |||
| TOTAL PURCHASED SWAPTIONS | ||||
| (Cost $10,741,172) | 13,198,123 | |||
| TOTAL INVESTMENT IN SECURITIES - 104.2% | ||||
| (Cost $46,010,681,154) | 48,268,296,333 | |||
| NET OTHER ASSETS (LIABILITIES) - (4.2)% | (1,927,216,068) | |||
| NET ASSETS - 100% | $46,341,080,265 |
| TBA Sale Commitments | ||
| Principal Amount | Value | |
| Ginnie Mae | ||
| 2.5% 3/1/50 | $(5,000,000) | $(5,132,428) |
| 2.5% 3/1/50 | (19,550,000) | (20,067,793) |
| 2.5% 3/1/50 | (20,750,000) | (21,299,576) |
| 3% 3/1/50 | (2,300,000) | (2,376,437) |
| 3% 3/1/50 | (11,400,000) | (11,778,861) |
| 3% 3/1/50 | (30,750,000) | (31,771,928) |
| 3% 3/1/50 | (15,500,000) | (16,015,118) |
| 3% 3/1/50 | (1,350,000) | (1,394,865) |
| 3% 3/1/50 | (3,300,000) | (3,409,670) |
| 3% 3/1/50 | (450,000) | (464,955) |
| 3% 3/1/50 | (1,100,000) | (1,136,557) |
| 3% 3/1/50 | (9,500,000) | (9,815,717) |
| 3% 3/1/50 | (19,200,000) | (19,838,081) |
| 3% 3/1/50 | (9,900,000) | (10,229,011) |
| 3% 3/1/50 | (4,900,000) | (5,062,844) |
| 3% 3/1/50 | (26,300,000) | (27,174,038) |
| 3% 3/1/50 | (13,000,000) | (13,432,034) |
| 3% 3/1/50 | (8,400,000) | (8,679,161) |
| 3% 3/1/50 | (5,350,000) | (5,527,799) |
| 3% 3/1/50 | (5,450,000) | (5,631,122) |
| 3% 3/1/50 | (5,300,000) | (5,476,137) |
| 3% 3/1/50 | (5,400,000) | (5,579,460) |
| 3% 4/1/50 | (6,700,000) | (6,915,597) |
| 3% 4/1/50 | (3,000,000) | (3,096,536) |
| 3% 4/1/50 | (6,700,000) | (6,915,597) |
| 3% 4/1/50 | (3,000,000) | (3,096,536) |
| 3.5% 3/1/50 | (7,825,000) | (8,106,714) |
| 3.5% 3/1/50 | (6,200,000) | (6,423,211) |
| 3.5% 3/1/50 | (8,300,000) | (8,598,815) |
| 3.5% 3/1/50 | (6,500,000) | (6,734,012) |
| 3.5% 3/1/50 | (9,100,000) | (9,427,616) |
| 3.5% 3/1/50 | (11,100,000) | (11,499,620) |
| 3.5% 3/1/50 | (9,300,000) | (9,634,817) |
| 3.5% 3/1/50 | (6,400,000) | (6,630,412) |
| 3.5% 3/1/50 | (3,100,000) | (3,211,606) |
| 3.5% 3/1/50 | (9,500,000) | (9,842,017) |
| 3.5% 3/1/50 | (6,300,000) | (6,526,811) |
| 3.5% 3/1/50 | (3,000,000) | (3,108,005) |
| 3.5% 3/1/50 | (11,000,000) | (11,396,020) |
| 3.5% 3/1/50 | (14,600,000) | (15,125,626) |
| 3.5% 3/1/50 | (16,000,000) | (16,576,029) |
| 3.5% 3/1/50 | (27,675,000) | (28,671,350) |
| 3.5% 3/1/50 | (17,600,000) | (18,233,632) |
| 3.5% 3/1/50 | (21,800,000) | (22,584,839) |
| 3.5% 3/1/50 | (15,700,000) | (16,265,228) |
| 3.5% 3/1/50 | (11,900,000) | (12,328,421) |
| 3.5% 3/1/50 | (17,800,000) | (18,440,832) |
| 3.5% 3/1/50 | (13,375,000) | (13,856,524) |
| 4% 3/1/50 | (7,600,000) | (7,912,535) |
| 4% 3/1/50 | (6,600,000) | (6,871,412) |
| TOTAL GINNIE MAE | (529,323,962) | |
| Uniform Mortgage Backed Securities | ||
| 2.5% 3/1/35 | (1,600,000) | (1,642,263) |
| 2.5% 3/1/35 | (2,200,000) | (2,258,111) |
| 2.5% 3/1/35 | (1,300,000) | (1,334,338) |
| 2.5% 3/1/35 | (1,800,000) | (1,847,545) |
| 2.5% 3/1/35 | (1,700,000) | (1,744,904) |
| 2.5% 3/1/35 | (900,000) | (923,773) |
| 2.5% 3/1/50 | (8,500,000) | (8,667,915) |
| 3% 3/1/50 | (200,000) | (205,958) |
| 3% 3/1/50 | (2,500,000) | (2,574,473) |
| 3% 3/1/50 | (11,100,000) | (11,430,659) |
| 3% 3/1/50 | (9,900,000) | (10,194,912) |
| 3% 3/1/50 | (11,300,000) | (11,636,617) |
| 3% 3/1/50 | (12,000,000) | (12,357,469) |
| 3% 3/1/50 | (11,000,000) | (11,327,680) |
| 3% 3/1/50 | (3,350,000) | (3,449,793) |
| 3% 3/1/50 | (3,300,000) | (3,398,304) |
| 3% 3/1/50 | (1,850,000) | (1,905,110) |
| 3% 3/1/50 | (1,800,000) | (1,853,620) |
| 3.5% 3/1/50 | (8,500,000) | (8,826,536) |
| 3.5% 3/1/50 | (4,800,000) | (4,984,397) |
| 3.5% 3/1/50 | (1,350,000) | (1,401,862) |
| 3.5% 3/1/50 | (4,700,000) | (4,880,555) |
| 3.5% 3/1/50 | (1,350,000) | (1,401,862) |
| 3.5% 3/1/50 | (6,600,000) | (6,853,546) |
| 3.5% 3/1/50 | (4,400,000) | (4,569,030) |
| 3.5% 3/1/50 | (14,600,000) | (15,160,874) |
| 3.5% 3/1/50 | (2,700,000) | (2,803,723) |
| 3.5% 3/1/50 | (8,300,000) | (8,618,853) |
| 3.5% 3/1/50 | (1,500,000) | (1,557,624) |
| 3.5% 3/1/50 | (17,800,000) | (18,483,803) |
| 3.5% 3/1/50 | (7,000,000) | (7,268,912) |
| 3.5% 3/1/50 | (9,000,000) | (9,345,744) |
| 3.5% 3/1/50 | (17,000,000) | (17,653,072) |
| 3.5% 3/1/50 | (2,200,000) | (2,284,515) |
| 3.5% 3/1/50 | (2,150,000) | (2,232,594) |
| 3.5% 3/1/50 | (11,900,000) | (12,357,150) |
| 3.5% 4/1/50 | (8,500,000) | (8,821,888) |
| 4% 3/1/50 | (3,500,000) | (3,686,600) |
| 4% 3/1/50 | (3,000,000) | (3,159,943) |
| 4% 3/1/50 | (1,500,000) | (1,579,972) |
| 4% 3/1/50 | (1,500,000) | (1,579,972) |
| 4% 3/1/50 | (2,500,000) | (2,633,286) |
| 4% 3/1/50 | (1,500,000) | (1,579,972) |
| 4% 4/1/50 | (1,500,000) | (1,579,034) |
| 4% 4/1/50 | (1,500,000) | (1,579,034) |
| 4% 4/1/50 | (1,500,000) | (1,579,034) |
| 4% 4/1/50 | (3,000,000) | (3,158,068) |
| 4% 4/1/50 | (2,500,000) | (2,631,724) |
| TOTAL UNIFORM MORTGAGE BACKED SECURITIES | (253,006,623) | |
| TOTAL TBA SALE COMMITMENTS | ||
| (Proceeds $777,869,967) | $(782,330,585) |
| Written Swaptions | |||
| Expiration Date | Notional Amount | Value | |
| Put Swaptions | |||
| Option on an interest rate swap with Bank of America N.A. to pay semi-annually a fixed rate of 1.395% and receive quarterly a floating rate based on 3-month LIBOR, expiring February 2030 | 2/24/25 | 9,100,000 | $(225,939) |
| Option on an interest rate swap with Bank of America N.A. to pay semi-annually a fixed rate of 1.45% and receive quarterly a floating rate based on 3-month LIBOR, expiring September 2029 | 9/4/24 | 10,500,000 | (229,534) |
| Option on an interest rate swap with Bank of America N.A. to pay semi-annually a fixed rate of 1.775% and receive quarterly a floating rate based on 3-month LIBOR, expiring December 2029 | 12/3/24 | 8,200,000 | (139,047) |
| Option on an interest rate swap with Bank of America N.A. to pay semi-annually a fixed rate of 1.795% and receive quarterly a floating rate based on 3-month LIBOR, expiring November 2029 | 11/25/24 | 10,600,000 | (175,552) |
| Option on an interest rate swap with Bank of America N.A. to pay semi-annually a fixed rate of 1.89% and receive quarterly a floating rate based on 3-month LIBOR, expiring December 2029 | 12/9/24 | 20,200,000 | (308,431) |
| Option on an interest rate swap with Bank of America N.A. to pay semi-annually a fixed rate of 1.9% and receive quarterly a floating rate based on 3-month LIBOR, expiring December 2029 | 12/10/24 | 20,200,000 | (305,545) |
| Option on an interest rate swap with Bank of America N.A. to pay semi-annually a fixed rate of 1.92% and receive quarterly a floating rate based on 3-month LIBOR, expiring January 2030 | 1/8/25 | 18,000,000 | (271,693) |
| Option on an interest rate swap with Bank of America N.A. to pay semi-annually a fixed rate of 1.97% and receive quarterly a floating rate based on 3-month LIBOR, expiring August 2029 | 8/1/24 | 17,000,000 | (220,365) |
| Option on an interest rate swap with JPMorgan Chase Bank N.A. to pay semi-annually a fixed rate of 1.684% and receive quarterly a floating rate based on 3-month LIBOR, expiring January 2030 | 1/27/25 | 8,000,000 | (151,924) |
| TOTAL PUT SWAPTIONS | (2,028,030) | ||
| Call Swaptions | |||
| Option on an interest rate swap with Bank of America N.A. to receive semi-annually a fixed rate of 1.395% and pay quarterly a floating rate based on 3-month LIBOR, expiring February 2030 | 2/24/25 | 9,100,000 | (289,336) |
| Option on an interest rate swap with Bank of America N.A. to receive semi-annually a fixed rate of 1.45% and pay quarterly a floating rate based on 3-month LIBOR, expiring September 2029 | 9/4/24 | 10,500,000 | (343,854) |
| Option on an interest rate swap with Bank of America N.A. to receive semi-annually a fixed rate of 1.775% and pay quarterly a floating rate based on 3-month LIBOR, expiring December 2029 | 12/3/24 | 8,200,000 | (347,892) |
| Option on an interest rate swap with Bank of America N.A. to receive semi-annually a fixed rate of 1.795% and pay quarterly a floating rate based on 3-month LIBOR, expiring November 2029 | 11/25/24 | 10,600,000 | (456,180) |
| Option on an interest rate swap with Bank of America N.A. to receive semi-annually a fixed rate of 1.89% and pay quarterly a floating rate based on 3-month LIBOR, expiring December 2029 | 12/9/24 | 20,200,000 | (931,153) |
| Option on an interest rate swap with Bank of America N.A. to receive semi-annually a fixed rate of 1.9% and pay quarterly a floating rate based on 3-month LIBOR, expiring December 2029 | 12/10/24 | 20,200,000 | (937,585) |
| Option on an interest rate swap with Bank of America N.A. to receive semi-annually a fixed rate of 1.92% and pay quarterly a floating rate based on 3-month LIBOR, expiring January 2030 | 1/8/25 | 18,000,000 | (847,505) |
| Option on an interest rate swap with Bank of America N.A. to receive semi-annually a fixed rate of 1.97% and pay quarterly a floating rate based on 3-month LIBOR, expiring August 2029 | 8/1/24 | 17,000,000 | (827,133) |
| Option on an interest rate swap with JPMorgan Chase Bank N.A. to receive semi-annually a fixed rate of 1.684% and pay quarterly a floating rate based on 3-month LIBOR, expiring January 2030 | 1/27/25 | 8,000,000 | (318,283) |
| TOTAL CALL SWAPTIONS | (5,298,921) | ||
| TOTAL WRITTEN SWAPTIONS | $(7,326,951) |
| Futures Contracts | |||||
| Number of contracts | Expiration Date | Notional Amount | Value | Unrealized Appreciation/(Depreciation) | |
| Purchased | |||||
| Treasury Contracts | |||||
| CBOT 5-Year U.S. Treasury Note Contracts (United States) | 148 | June 2020 | $18,167,000 | $300,575 | $300,575 |
| Sold | |||||
| Treasury Contracts | |||||
| CBOT 10-Year U.S. Treasury Note Contracts (United States) | 1,025 | June 2020 | 138,118,750 | (3,393,981) | (3,393,981) |
| CBOT 2-Year U.S. Treasury Note Contracts (United States) | 1,259 | June 2020 | 274,875,109 | (2,176,944) | (2,176,944) |
| CBOT 5-Year U.S. Treasury Note Contracts (United States) | 149 | June 2020 | 18,289,750 | (203,730) | (203,730) |
| CBOT Long Term U.S. Treasury Bond Contracts (United States) | 105 | June 2020 | 17,876,250 | (739,466) | (739,466) |
| TOTAL SOLD | (6,514,121) | ||||
| TOTAL FUTURES CONTRACTS | $(6,213,546) |
The notional amount of futures purchased as a percentage of Net Assets is 0%
The notional amount of futures sold as a percentage of Net Assets is 0.9%
Swaps
| Underlying Reference | Maturity Date | Clearinghouse / Counterparty | Fixed Payment Received/(Paid) | Payment Frequency | Notional Amount | Value | Upfront Premium Received/(Paid) | Unrealized Appreciation/(Depreciation) |
| Credit Default Swaps | ||||||||
| Buy Protection | ||||||||
| CMBX N.A. AAA Index Series 12 | Aug. 2061 | Citigroup Global Markets Ltd. | (0.5%) | Monthly | $7,200,000 | $58,265 | $2,807 | $61,072 |
| CMBX N.A. AAA Index Series 12 | Aug. 2061 | Citigroup Global Markets Ltd. | (0.5%) | Monthly | 16,770,000 | 135,708 | (234) | 135,474 |
| CMBX N.A. AAA Index Series 12 | Aug. 2061 | Citigroup Global Markets Ltd. | (0.5%) | Monthly | 2,600,000 | 21,040 | 534 | 21,574 |
| CMBX N.A. AAA Index Series 12 | Aug. 2061 | Citigroup Global Markets Ltd. | (0.5%) | Monthly | 330,000 | 2,670 | (60) | 2,610 |
| CMBX N.A. AAA Index Series 12 | Aug. 2061 | J.P. Morgan Securities LLC | (0.5%) | Monthly | 8,700,000 | 70,403 | 4,188 | 74,591 |
| CMBX N.A. AAA Index Series 12 | Aug. 2061 | Morgan Stanley Capital Services LLC | (0.5%) | Monthly | 710,000 | 5,746 | 348 | 6,094 |
| TOTAL CREDIT DEFAULT SWAPS | $293,832 | $7,583 | $301,415 | |||||
Swaps
| Payment Received | Payment Frequency | Payment Paid | Payment Frequency | Clearinghouse / Counterparty(1) | Maturity Date | Notional Amount | Value | Upfront Premium Received/(Paid)(2) | Unrealized Appreciation/(Depreciation) |
| Interest Rate Swaps | |||||||||
| 1.75% | Semi - annual | 3-month LIBOR(3) | Quarterly | LCH | Mar. 2022 | $116,599,000 | $1,634,233 | $0 | $1,634,233 |
| 1.75% | Semi - annual | 3-month LIBOR(3) | Quarterly | LCH | Mar. 2025 | 15,250,000 | 415,007 | 0 | 415,007 |
| 3-month LIBOR(3) | Quarterly | 1.75% | Semi - annual | LCH | Mar. 2025 | 1,580,000 | (34,681) | 0 | (34,681) |
| 2% | Semi - annual | 3-month LIBOR(3) | Quarterly | LCH | Mar. 2027 | 12,810,000 | 577,821 | 0 | 577,821 |
| 3-month LIBOR(3) | Quarterly | 2% | Semi - annual | LCH | Mar. 2030 | 32,510,000 | (1,727,906) | 0 | (1,727,906) |
| TOTAL INTEREST RATE SWAPS | $864,474 | $0 | $864,474 | ||||||
(1) Swaps with LCH Clearnet Group (LCH) are centrally cleared over-the-counter (OTC) swaps.
(2) Any premiums for centrally cleared over-the-counter (OTC) swaps are recorded periodically throughout the term of the swap to variation margin and included in unrealized appreciation (depreciation).
(3) Represents floating rate.
Security Type Abbreviations
ETF – Exchange-Traded Fund
Legend
(a) Coupon rates for floating and adjustable rate securities reflect the rates in effect at period end.
(b) Security exempt from registration under Rule 144A of the Securities Act of 1933. These securities may be resold in transactions exempt from registration, normally to qualified institutional buyers. At the end of the period, the value of these securities amounted to $1,235,147,019 or 2.7% of net assets.
(c) Coupon is indexed to a floating interest rate which may be multiplied by a specified factor and/or subject to caps or floors.
(d) Security or a portion of the security was pledged to cover margin requirements for futures contracts. At period end, the value of securities pledged amounted to $2,755,586.
(e) Security or a portion of the security has been segregated as collateral for open options. At period end, the value of securities pledged amounted to $163,456.
(f) Security or a portion of the security was pledged to cover margin requirements for centrally cleared OTC swaps. At period end, the value of securities pledged amounted to $1,369,631.
(g) Security or a portion of the security purchased on a delayed delivery or when-issued basis.
(h) A portion of the security sold on a delayed delivery basis.
(i) Security represents right to receive monthly interest payments on an underlying pool of mortgages or assets. Principal shown is the outstanding par amount of the pool as of the end of the period.
(j) Coupon is inversely indexed to a floating interest rate multiplied by a specified factor. The price may be considerably more volatile than the price of a comparable fixed rate security.
(k) Represents an investment in an underlying pool of reverse mortgages which typically do not require regular principal and interest payments as repayment is deferred until a maturity event.
(l) Level 3 security
(m) Affiliated Fund
(n) Security or a portion of the security is on loan at period end.
(o) Security is perpetual in nature with no stated maturity date.
(p) Affiliated fund that is generally available only to investment companies and other accounts managed by Fidelity Investments. The rate quoted is the annualized seven-day yield of the fund at period end. A complete unaudited listing of the fund's holdings as of its most recent quarter end is available upon request. In addition, each Fidelity Central Fund's financial statements, which are not covered by the Fund's Report of Independent Registered Public Accounting Firm, are available on the SEC's website or upon request.
(q) Investment made with cash collateral received from securities on loan.
(r) The rate quoted is the annualized seven-day yield of the fund at period end.
Affiliated Central Funds
Information regarding fiscal year to date income earned by the Fund from investments in Fidelity Central Funds is as follows:
| Fund | Income earned |
| Fidelity Cash Central Fund | $2,587,709 |
| Fidelity Securities Lending Cash Central Fund | 112,566 |
| Total | $2,700,275 |
Amounts in the income column in the above table include any capital gain distributions from underlying funds, which are presented in the corresponding line-item in the Statement of Operations, if applicable. Amount for Fidelity Securities Lending Cash Central Fund represents the income earned on investing cash collateral, less rebates paid to borrowers and any lending agent fees associated with the loan, plus any premium payments received for lending certain types of securities.
Affiliated Underlying Funds
Fiscal year to date information regarding the Fund's investments in affiliated Underlying Funds, excluding any Money Market Central Funds, is presented below. Exchanges between classes of the same affiliated Underlying Funds may occur.
| Affiliate | Value, beginning of period | Purchases | Sales Proceeds | Dividend Income | Realized Gain (loss) | Change in Unrealized appreciation (depreciation) | Value, end of period |
| Fidelity Inflation-Protected Bond Index Fund | $225,416,281 | $115,955,934 | $242,625,956 | $264,130 | $1,062,439 | $5,732,691 | $105,541,389 |
| Fidelity SAI Total Bond Fund | 6,465,621,313 | 424,835,503 | 537,395,211 | 214,917,863 | 5,691,970 | 360,975,414 | 6,719,728,989 |
| Fidelity SAI U.S. Treasury Bond Index Fund | 1,277,017,459 | 2,949,823,860 | 614,395,663 | 64,583,022 | 5,380,112 | 285,052,561 | 3,902,878,329 |
| Fidelity Sustainability Bond Index Fund | 23,027,435 | 758,447 | -- | 646,713 | -- | 1,829,550 | 25,615,432 |
| Fidelity U.S. Bond Index Fund | 193,744,006 | 338,652,029 | 393,553,883 | 4,708,685 | 13,631,354 | 3,694,994 | 156,168,500 |
| Total | $8,184,826,494 | $3,830,025,773 | $1,787,970,713 | $285,120,413 | $25,765,875 | $657,285,210 | $10,909,932,639 |
Amounts in the income column in the above table include any capital gain distributions from underlying funds, which are presented in the corresponding line-item in the Statement of Operations, if applicable.
Investment Valuation
The following is a summary of the inputs used, as of February 29, 2020, involving the Fund's assets and liabilities carried at fair value. The inputs or methodology used for valuing securities may not be an indication of the risk associated with investing in those securities. For more information on valuation inputs, and their aggregation into the levels used below, please refer to the Investment Valuation section in the accompanying Notes to Financial Statements.
| Valuation Inputs at Reporting Date: | ||||
| Description | Total | Level 1 | Level 2 | Level 3 |
| Investments in Securities: | ||||
| Corporate Bonds | $3,522,911,831 | $-- | $3,522,911,831 | $-- |
| U.S. Government and Government Agency Obligations | 2,980,880,683 | -- | 2,980,880,683 | -- |
| U.S. Government Agency - Mortgage Securities | 4,225,783,128 | -- | 4,225,783,128 | -- |
| Asset-Backed Securities | 419,464,944 | -- | 419,464,944 | -- |
| Collateralized Mortgage Obligations | 138,949,224 | -- | 138,949,224 | -- |
| Commercial Mortgage Securities | 477,661,045 | -- | 477,660,265 | 780 |
| Municipal Securities | 86,523,060 | -- | 86,523,060 | -- |
| Foreign Government and Government Agency Obligations | 25,128,761 | -- | 25,128,761 | -- |
| Bank Notes | 39,891,361 | -- | 39,891,361 | -- |
| Fixed-Income Funds | 35,735,451,856 | 35,735,451,856 | -- | -- |
| Preferred Securities | 47,085,691 | -- | 47,085,691 | -- |
| Money Market Funds | 555,366,626 | 555,366,626 | -- | -- |
| Purchased Swaptions | 13,198,123 | -- | 13,198,123 | -- |
| Total Investments in Securities: | $48,268,296,333 | $36,290,818,482 | $11,977,477,071 | $780 |
| Derivative Instruments: | ||||
| Assets | ||||
| Futures Contracts | $300,575 | $300,575 | $-- | $-- |
| Swaps | 2,920,893 | -- | 2,920,893 | -- |
| Total Assets | $3,221,468 | $300,575 | $2,920,893 | $-- |
| Liabilities | ||||
| Futures Contracts | $(6,514,121) | $(6,514,121) | $-- | $-- |
| Swaps | (1,762,587) | -- | (1,762,587) | -- |
| Written Swaptions | (7,326,951) | -- | (7,326,951) | -- |
| Total Liabilities | $(15,603,659) | $(6,514,121) | $(9,089,538) | $-- |
| Total Derivative Instruments: | $(12,382,191) | $(6,213,546) | $(6,168,645) | $-- |
| Other Financial Instruments: | ||||
| TBA Sale Commitments | $(782,330,585) | $-- | $(782,330,585) | $-- |
| Total Other Financial Instruments: | $(782,330,585) | $-- | $(782,330,585) | $-- |
Value of Derivative Instruments
The following table is a summary of the Fund's value of derivative instruments by primary risk exposure as of February 29, 2020. For additional information on derivative instruments, please refer to the Derivative Instruments section in the accompanying Notes to Financial Statements.
| Primary Risk Exposure / Derivative Type | Value | |
| Asset | Liability | |
| Credit Risk | ||
| Swaps(a) | $293,832 | $0 |
| Total Credit Risk | 293,832 | 0 |
| Interest Rate Risk | ||
| Futures Contracts(b) | 300,575 | (6,514,121) |
| Purchased Swaptions(c) | 13,198,123 | 0 |
| Swaps(d) | 2,627,061 | (1,762,587) |
| Written Swaptions(e) | 0 | (7,326,951) |
| Total Interest Rate Risk | 16,125,759 | (15,603,659) |
| Total Value of Derivatives | $16,419,591 | $(15,603,659) |
(a) For bi-lateral over-the-counter (OTC) swaps, reflects gross value which is presented in the Statement of Assets and Liabilities in the bi-lateral OTC swaps, at value line-items.
(b) Reflects gross cumulative appreciation (depreciation) on futures contracts as presented in the Schedule of Investments. In the Statement of Assets and Liabilities, the period end daily variation margin is included in receivable or payable for daily variation margin on futures contracts, and the net cumulative appreciation (depreciation) is included in Total accumulated earnings (loss).
(c) Gross value is included in the Statement of Assets and Liabilities in the investments, at value line-item.
(d) For centrally cleared over-the-counter (OTC) swaps, reflects gross cumulative appreciation (depreciation) as presented in the Schedule of Investments. In the Statement of Assets and Liabilities, the period end daily variation margin for centrally cleared OTC swaps is included in receivable or payable for daily variation margin on centrally cleared OTC swaps, and the net cumulative appreciation (depreciation) for centrally cleared OTC swaps is included in Total accumulated earnings (loss).
(e) Gross value is presented in the Statement of Assets and Liabilities in the written options, at value line-item.
See accompanying notes which are an integral part of the financial statements.
Financial Statements
Statement of Assets and Liabilities
| February 29, 2020 | ||
| Assets | ||
| Investment in securities, at value (including securities loaned of $420,630,177) — See accompanying schedule: Unaffiliated issuers (cost $35,387,384,014) | $36,870,050,709 | |
| Fidelity Central Funds (cost $488,309,340) | 488,312,985 | |
| Other affiliated issuers (cost $10,134,987,800) | 10,909,932,639 | |
| Total Investment in Securities (cost $46,010,681,154) | $48,268,296,333 | |
| Cash | 683,473 | |
| Receivable for investments sold | ||
| Regular delivery | 166,963,242 | |
| Delayed delivery | 12,782,832 | |
| Receivable for premium on written options | 6,924,982 | |
| Receivable for TBA sale commitments | 777,869,967 | |
| Receivable for fund shares sold | 19,605,624 | |
| Dividends receivable | 3,741,649 | |
| Interest receivable | 63,649,228 | |
| Distributions receivable from Fidelity Central Funds | 208,638 | |
| Receivable for daily variation margin on centrally cleared OTC swaps | 453,849 | |
| Bi-lateral OTC swaps, at value | 293,832 | |
| Other receivables | 397,628 | |
| Total assets | 49,321,871,277 | |
| Liabilities | ||
| Payable for investments purchased | ||
| Regular delivery | $225,380,174 | |
| Delayed delivery | 1,486,783,440 | |
| TBA sale commitments, at value | 782,330,585 | |
| Payable for fund shares redeemed | 53,328,104 | |
| Distributions payable | 868,365 | |
| Accrued management fee | 943,955 | |
| Payable for daily variation margin on futures contracts | 2,921,818 | |
| Written options, at value (premium receivable $6,924,982) | 7,326,951 | |
| Other payables and accrued expenses | 1,107,520 | |
| Collateral on securities loaned | 419,800,100 | |
| Total liabilities | 2,980,791,012 | |
| Net Assets | $46,341,080,265 | |
| Net Assets consist of: | ||
| Paid in capital | $44,322,256,752 | |
| Total accumulated earnings (loss) | 2,018,823,513 | |
| Net Assets | $46,341,080,265 | |
| Net Asset Value, offering price and redemption price per share ($46,341,080,265 ÷ 4,163,045,614 shares) | $11.13 |
See accompanying notes which are an integral part of the financial statements.
Statement of Operations
| Year ended February 29, 2020 | ||
| Investment Income | ||
| Dividends: | ||
| Unaffiliated issuers | $799,107,057 | |
| Affiliated issuers | 174,528,908 | |
| Interest | 414,650,319 | |
| Income from Fidelity Central Funds (including $112,566 from security lending) | 2,700,275 | |
| Total income | 1,390,986,559 | |
| Expenses | ||
| Management fee | $115,717,890 | |
| Accounting and security lending fees | 762,473 | |
| Custodian fees and expenses | 163,000 | |
| Independent trustees' fees and expenses | 456,045 | |
| Registration fees | 785,798 | |
| Audit | 83,761 | |
| Legal | 135,758 | |
| Miscellaneous | 365,914 | |
| Total expenses before reductions | 118,470,639 | |
| Expense reductions | (105,151,558) | |
| Total expenses after reductions | 13,319,081 | |
| Net investment income (loss) | 1,377,667,478 | |
| Realized and Unrealized Gain (Loss) | ||
| Net realized gain (loss) on: | ||
| Investment securities: | ||
| Unaffiliated issuers | 186,204,489 | |
| Fidelity Central Funds | (7,426) | |
| Other affiliated issuers | 25,765,875 | |
| Futures contracts | (9,694,470) | |
| Swaps | 143,464 | |
| Written options | (397,667) | |
| Capital gain distributions from underlying funds: | ||
| Unaffiliated issuers | 147,292,064 | |
| Affiliated issuers | 110,591,505 | |
| Total net realized gain (loss) | 459,897,834 | |
| Change in net unrealized appreciation (depreciation) on: | ||
| Investment securities: | ||
| Unaffiliated issuers | 2,023,254,202 | |
| Fidelity Central Funds | (605) | |
| Other affiliated issuers | 657,285,210 | |
| Futures contracts | (6,277,753) | |
| Swaps | 1,485,053 | |
| Written options | (401,969) | |
| Delayed delivery commitments | (5,303,114) | |
| Total change in net unrealized appreciation (depreciation) | 2,670,041,024 | |
| Net gain (loss) | 3,129,938,858 | |
| Net increase (decrease) in net assets resulting from operations | $4,507,606,336 |
See accompanying notes which are an integral part of the financial statements.
Statement of Changes in Net Assets
| Year ended February 29, 2020 | Year ended February 28, 2019 | |
| Increase (Decrease) in Net Assets | ||
| Operations | ||
| Net investment income (loss) | $1,377,667,478 | $1,179,353,603 |
| Net realized gain (loss) | 459,897,834 | (443,383,172) |
| Change in net unrealized appreciation (depreciation) | 2,670,041,024 | 395,454,319 |
| Net increase (decrease) in net assets resulting from operations | 4,507,606,336 | 1,131,424,750 |
| Distributions to shareholders | (1,560,742,405) | (1,143,156,839) |
| Share transactions | ||
| Proceeds from sales of shares | 10,531,970,234 | 9,961,531,357 |
| Reinvestment of distributions | 1,541,427,164 | 1,141,595,515 |
| Cost of shares redeemed | (6,711,834,609) | (8,764,885,562) |
| Net increase (decrease) in net assets resulting from share transactions | 5,361,562,789 | 2,338,241,310 |
| Total increase (decrease) in net assets | 8,308,426,720 | 2,326,509,221 |
| Net Assets | ||
| Beginning of period | 38,032,653,545 | 35,706,144,324 |
| End of period | $46,341,080,265 | $38,032,653,545 |
| Other Information | ||
| Shares | ||
| Sold | 980,939,776 | 965,172,695 |
| Issued in reinvestment of distributions | 142,378,833 | 110,799,972 |
| Redeemed | (623,427,707) | (852,168,708) |
| Net increase (decrease) | 499,890,902 | 223,803,959 |
See accompanying notes which are an integral part of the financial statements.
Financial Highlights
Strategic Advisers Core Income Fund
| Years ended February 28, | 2020 A | 2019 | 2018 | 2017 | 2016 A |
| Selected Per–Share Data | |||||
| Net asset value, beginning of period | $10.38 | $10.38 | $10.50 | $10.40 | $10.78 |
| Income from Investment Operations | |||||
| Net investment income (loss)B | .354 | .324 | .270 | .300 | .316 |
| Net realized and unrealized gain (loss) | .796 | (.009) | (.106) | .174 | (.366) |
| Total from investment operations | 1.150 | .315 | .164 | .474 | (.050) |
| Distributions from net investment income | (.350) | (.309) | (.270) | (.297) | (.322) |
| Distributions from net realized gain | (.050) | (.006) | (.014) | (.077) | (.008) |
| Total distributions | (.400) | (.315) | (.284) | (.374) | (.330) |
| Net asset value, end of period | $11.13 | $10.38 | $10.38 | $10.50 | $10.40 |
| Total ReturnC | 11.25% | 3.10% | 1.54% | 4.60% | (.45)% |
| Ratios to Average Net AssetsD,E | |||||
| Expenses before reductions | .28% | .30% | .31% | .31% | .31% |
| Expenses net of fee waivers, if any | .03% | .05% | .06% | .06% | .06% |
| Expenses net of all reductions | .03% | .05% | .06% | .06% | .06% |
| Net investment income (loss) | 3.28% | 3.15% | 2.55% | 2.84% | 3.00% |
| Supplemental Data | |||||
| Net assets, end of period (000 omitted) | $46,341,080 | $38,032,654 | $35,706,144 | $30,150,207 | $26,817,412 |
| Portfolio turnover rateF | 65% | 78% | 45% | 52% | 69% |
A For the year ended February 29.
B Calculated based on average shares outstanding during the period.
C Total returns would have been lower if certain expenses had not been reduced during the applicable periods shown.
D Fees and expenses of any underlying Fidelity Central Funds are not included in the Fund's expense ratio. The Fund indirectly bears its proportionate share of the expenses of any underlying Fidelity Central Funds.
E Expense ratios reflect operating expenses of the Fund. Expenses before reductions do not reflect amounts reimbursed by the investment adviser or reductions from brokerage service arrangements or reductions from other expense offset arrangements and do not represent the amount paid by the Fund during periods when reimbursements or reductions occur. Expenses net of fee waivers reflect expenses after reimbursement by the investment adviser but prior to reductions from brokerage service arrangements or other expense offset arrangements. Expenses net of all reductions represent the net expenses paid by the Fund. Fees and expenses of the Underlying Funds are not included in the Fund's annualized ratios. The Fund indirectly bears its proportionate share of the expenses of the Underlying Funds.
F Amounts do not include the activity of Underlying Funds.
See accompanying notes which are an integral part of the financial statements.
Notes to Financial Statements
For the period ended February 29, 2020
1. Organization.
Strategic Advisers Core Income Fund (the Fund) is a fund of Fidelity Rutland Square Trust II (the Trust), and is authorized to issue an unlimited number of shares. The Trust is registered under the Investment Company Act of 1940, as amended (the 1940 Act), as an open-end management investment company organized as a Delaware statutory trust. The Fund is offered exclusively to certain clients of Strategic Advisers LLC (Strategic Advisers), an affiliate of Fidelity Management & Research Company LLC (FMR).
2. Significant Accounting Policies.
The Fund is an investment company and applies the accounting and reporting guidance of the Financial Accounting Standards Board (FASB) Accounting Standards Codification Topic 946 Financial Services – Investments Companies. The financial statements have been prepared in conformity with accounting principles generally accepted in the United States of America (GAAP), which require management to make certain estimates and assumptions at the date of the financial statements. Actual results could differ from those estimates. Subsequent events, if any, through the date that the financial statements were issued have been evaluated in the preparation of the financial statements. The following summarizes the significant accounting policies of the Fund:
Investment Valuation. Investments are valued as of 4:00 p.m. Eastern time on the last calendar day of the period. The Board of Trustees (the Board) has delegated the day to day responsibility for the valuation of the Fund's investments to the Fair Value Committee (the Committee) established by the Fund's investment adviser. In accordance with valuation policies and procedures approved by the Board, the Fund attempts to obtain prices from one or more third party pricing vendors or brokers to value its investments. When current market prices, quotations or currency exchange rates are not readily available or reliable, investments will be fair valued in good faith by the Committee, in accordance with procedures adopted by the Board. Factors used in determining fair value vary by investment type and may include market or investment specific events, changes in interest rates and credit quality. The frequency with which these procedures are used cannot be predicted and they may be utilized to a significant extent. The Committee oversees the Fund's valuation policies and procedures and reports to the Board on the Committee's activities and fair value determinations. The Board monitors the appropriateness of the procedures used in valuing the Fund's investments and ratifies the fair value determinations of the Committee.
The Fund categorizes the inputs to valuation techniques used to value its investments into a disclosure hierarchy consisting of three levels as shown below:
- Level 1 – quoted prices in active markets for identical investments
- Level 2 – other significant observable inputs (including quoted prices for similar investments, interest rates, prepayment speeds, etc.)
- Level 3 – unobservable inputs (including the Fund's own assumptions based on the best information available)
Valuation techniques used to value the Fund's investments by major category are as follows:
Debt securities, including restricted securities, are valued based on evaluated prices received from third party pricing vendors or from brokers who make markets in such securities. Corporate bonds, bank notes, foreign government and government agency obligations, municipal securities, preferred securities and U.S. government and government agency obligations are valued by pricing vendors who utilize matrix pricing which considers yield or price of bonds of comparable quality, coupon, maturity and type or by broker-supplied prices. Asset backed securities, collateralized mortgage obligations, commercial mortgage securities and U.S. government agency mortgage securities are valued by pricing vendors who utilize matrix pricing which considers prepayment speed assumptions, attributes of the collateral, yield or price of bonds of comparable quality, coupon, maturity and type or by broker-supplied prices. Swaps are marked-to-market daily based on valuations from third party pricing vendors, registered derivatives clearing organizations (clearinghouses) or broker-supplied valuations. These pricing sources may utilize inputs such as interest rate curves, credit spread curves, default possibilities and recovery rates. When independent prices are unavailable or unreliable, debt securities and swaps may be valued utilizing pricing methodologies which consider similar factors that would be used by third party pricing vendors. For foreign debt securities, when significant market or security specific events arise, valuations may be determined in good faith in accordance with procedures adopted by the Board. Debt securities and swaps are generally categorized as Level 2 in the hierarchy but may be Level 3 depending on the circumstances.
Exchange-Traded Funds (ETFs) are valued at their last sale price or official closing price as reported by a third party pricing vendor on the primary market or exchange on which they are traded and are categorized as Level 1 in the hierarchy. In the event there were no sales during the day but the exchange reports a closing bid level, ETFs are valued at the closing bid and would be categorized as Level 1 in the hierarchy. In the event there was no closing bid, ETFs may be valued by another method that the Board believes reflects fair value in accordance with the Board's fair value pricing policies and may be categorized as Level 2 in the hierarchy.
Futures contracts are valued at the settlement price established each day by the board of trade or exchange on which they are traded and are categorized as Level 1 in the hierarchy. Options traded over-the-counter are valued using vendor or broker-supplied valuations and are categorized as Level 2 in the hierarchy. Investments in open-end mutual funds, including the Fidelity Central Funds, are valued at their closing net asset value (NAV) each business day and are categorized as Level 1 in the hierarchy. If an unaffiliated open-end mutual fund's NAV is unavailable, shares of that fund may be valued by another method that the Board believes reflects fair value in accordance with the Board's fair value pricing policies and is categorized as Level 2 in the hierarchy.
Changes in valuation techniques may result in transfers in or out of an assigned level within the disclosure hierarchy. The aggregate value of investments by input level as of February 29, 2020 is included at the end of the Fund's Schedule of Investments.
Investment Transactions and Income. For financial reporting purposes, the Fund's investment holdings and NAV include trades executed through the end of the last business day of the period. The NAV per share for processing shareholder transactions is calculated as of the close of business of the New York Stock Exchange (NYSE), normally 4:00 p.m. Eastern time and includes trades executed through the end of the prior business day. Gains and losses on securities sold are determined on the basis of identified cost and include proceeds received from litigation. Dividend income is recorded on the ex-dividend date, except for certain dividends from foreign securities where the ex-dividend date may have passed, which are recorded as soon as the Fund is informed of the ex-dividend date. Non-cash dividends included in dividend income, if any, are recorded at the fair market value of the securities received. Income and capital gain distributions from Fidelity Central Funds, if any, are recorded on the ex-dividend date. Income and capital gain distributions from Underlying Funds and distributions from ETFs, if any, are recorded on the ex-dividend date. Certain distributions received by the Fund represent a return of capital or capital gain. The Fund determines the components of these distributions subsequent to the ex-dividend date, based upon receipt of tax filings or other correspondence relating to the underlying investment. These distributions are recorded as a reduction of cost of investments and/or as a realized gain. Interest income is accrued as earned and includes coupon interest and amortization of premium and accretion of discount on debt securities as applicable. Debt obligations may be placed on non-accrual status and related interest income may be reduced by ceasing current accruals and writing off interest receivables when the collection of all or a portion of interest has become doubtful based on consistently applied procedures. A debt obligation is removed from non-accrual status when the issuer resumes interest payments or when collectability of interest is reasonably assured.
Expenses. Expenses directly attributable to a fund are charged to that fund. Expenses attributable to more than one fund are allocated among the respective funds on the basis of relative net assets or other appropriate methods. Expense estimates are accrued in the period to which they relate and adjustments are made when actual amounts are known.
Deferred Trustee Compensation. Under a Deferred Compensation Plan (the Plan), certain independent Trustees have elected to defer receipt of a portion of their annual compensation. Deferred amounts are invested in a cross-section of Strategic Advisers funds, are marked-to-market and remain in the Fund until distributed in accordance with the Plan. The investment of deferred amounts and the offsetting payable to the Trustees of $397,628 are included in the accompanying Statement of Assets and Liabilities in other receivables and other payables and accrued expenses, respectively.
Income Tax Information and Distributions to Shareholders. Each year, the Fund intends to qualify as a regulated investment company under Subchapter M of the Internal Revenue Code, including distributing substantially all of its taxable income and realized gains. As a result, no provision for U.S. Federal income taxes is required. As of February 29, 2020, the Fund did not have any unrecognized tax benefits in the financial statements; nor is the Fund aware of any tax positions for which it is reasonably possible that the total amounts of unrecognized tax benefits will significantly change in the next twelve months. The Fund files a U.S. federal tax return, in addition to state and local tax returns as required. The Fund's federal income tax returns are subject to examination by the Internal Revenue Service (IRS) for a period of three fiscal years after they are filed. State and local tax returns may be subject to examination for an additional fiscal year depending on the jurisdiction.
Distributions are declared and recorded daily and paid monthly from net investment income. Distributions from realized gains, if any, are declared and recorded on the ex-dividend date. Income and capital gain distributions are determined in accordance with income tax regulations, which may differ from GAAP. In addition, the Funds claimed a portion of the payment made to redeeming shareholders as a distribution for income tax purposes.
Capital accounts within the financial statements are adjusted for permanent book-tax differences. These adjustments have no impact on net assets or the results of operations. Capital accounts are not adjusted for temporary book-tax differences which will reverse in a subsequent period.
Book-tax differences are primarily due to the short-term gain distributions from the Underlying Funds, futures contracts, swaps, market discount, partnerships, deferred trustees compensation, capital loss carryforwards and losses deferred due to wash sales and futures contracts.
As of period end, the cost and unrealized appreciation (depreciation) in securities, and derivatives if applicable, for federal income tax purposes were as follows:
| Gross unrealized appreciation | $2,434,456,238 |
| Gross unrealized depreciation | (185,609,233) |
| Net unrealized appreciation (depreciation) | $2,248,847,005 |
| Tax Cost | $46,007,762,184 |
The tax-based components of distributable earnings as of period end were as follows:
| Undistributed ordinary income | $23,756,333 |
| Capital loss carryforward | $(234,565,508) |
| Net unrealized appreciation (depreciation) on securities and other investments | $2,230,030,315 |
Capital loss carryforwards are only available to offset future capital gains of the Fund to the extent provided by regulations and may be limited. The capital loss carryforward information presented below, including any applicable limitation, is estimated as of fiscal period end and is subject to adjustment.
| No expiration | |
| Long-term | $(234,565,508) |
| Total capital loss carryforward | $(234,565,508) |
The tax character of distributions paid was as follows:
| February 29, 2020 | February 28, 2019 | |
| Ordinary Income | $1,560,742,405 | $ 1,143,156,839 |
Delayed Delivery Transactions and When-Issued Securities. During the period, the Fund transacted in securities on a delayed delivery or when-issued basis. Payment and delivery may take place after the customary settlement period for that security. The price of the underlying securities and the date when the securities will be delivered and paid for are fixed at the time the transaction is negotiated. The securities purchased on a delayed delivery or when-issued basis are identified as such in the Fund's Schedule of Investments. The Fund may receive compensation for interest forgone in the purchase of a delayed delivery or when-issued security. With respect to purchase commitments, the Fund identifies securities as segregated in its records with a value at least equal to the amount of the commitment. Losses may arise due to changes in the value of the underlying securities or if the counterparty does not perform under the contract's terms, or if the issuer does not issue the securities due to political, economic, or other factors.
To-Be-Announced (TBA) Securities and Mortgage Dollar Rolls. During the period, the Fund transacted in TBA securities that involved buying or selling mortgage-backed securities (MBS) on a forward commitment basis. A TBA transaction typically does not designate the actual security to be delivered and only includes an approximate principal amount; however delivered securities must meet specified terms defined by industry guidelines, including issuer, rate and current principal amount outstanding on underlying mortgage pools. The Fund may enter into a TBA transaction with the intent to take possession of or deliver the underlying MBS, or the Fund may elect to extend the settlement by entering into either a mortgage or reverse mortgage dollar roll. Mortgage dollar rolls are transactions where a fund sells TBA securities and simultaneously agrees to repurchase MBS on a later date at a lower price and with the same counterparty. Reverse mortgage dollar rolls involve the purchase and simultaneous agreement to sell TBA securities on a later date at a lower price. Transactions in mortgage dollar rolls and reverse mortgage dollar rolls are accounted for as purchases and sales and may result in an increase to the Fund's portfolio turnover rate.
Purchases and sales of TBA securities involve risks similar to those discussed above for delayed delivery and when-issued securities. Also, if the counterparty in a mortgage dollar roll or a reverse mortgage dollar roll transaction files for bankruptcy or becomes insolvent, the Fund's right to repurchase or sell securities may be limited. Additionally, when a fund sells TBA securities without already owning or having the right to obtain the deliverable securities (an uncovered forward commitment to sell), it incurs a risk of loss because it could have to purchase the securities at a price that is higher than the price at which it sold them. A fund may be unable to purchase the deliverable securities if the corresponding market is illiquid.
TBA securities subject to a forward commitment to sell at period end are included at the end of the Fund's Schedule of Investments under the caption "TBA Sale Commitments." The proceeds and value of these commitments are reflected in the Fund's Statement of Assets and Liabilities as Receivable for TBA sale commitments and TBA sale commitments, at value, respectively.
Restricted Securities. The Fund may invest in securities that are subject to legal or contractual restrictions on resale. These securities generally may be resold in transactions exempt from registration or to the public if the securities are registered. Disposal of these securities may involve time-consuming negotiations and expense, and prompt sale at an acceptable price may be difficult. Information regarding restricted securities is included at the end of the Fund's Schedule of Investments.
3. Derivative Instruments.
Risk Exposures and the Use of Derivative Instruments. The Fund's investment objective allows the Fund to enter into various types of derivative contracts, including futures contracts, options and swaps. Derivatives are investments whose value is primarily derived from underlying assets, indices or reference rates and may be transacted on an exchange or over-the-counter (OTC). Derivatives may involve a future commitment to buy or sell a specified asset based on specified terms, to exchange future cash flows at periodic intervals based on a notional principal amount, or for one party to make one or more payments upon the occurrence of specified events in exchange for periodic payments from the other party.
The Fund used derivatives to increase returns, to gain exposure to certain types of assets, and to manage exposure to certain risks as defined below. The success of any strategy involving derivatives depends on analysis of numerous economic factors, and if the strategies for investment do not work as intended, the Fund may not achieve its objectives.
The Fund's use of derivatives increased or decreased its exposure to the following risks:
| Credit Risk | Credit risk relates to the ability of the issuer of a financial instrument to make further principal or interest payments on an obligation or commitment that it has to the Fund. |
| Interest Rate Risk | Interest rate risk relates to the fluctuations in the value of interest-bearing securities due to changes in the prevailing levels of market interest rates. |
The Fund is also exposed to additional risks from investing in derivatives, such as liquidity risk and counterparty credit risk. Liquidity risk is the risk that the Fund will be unable to close out the derivative in the open market in a timely manner. Counterparty credit risk is the risk that the counterparty will not be able to fulfill its obligation to the Fund. Derivative counterparty credit risk is managed through formal evaluation of the creditworthiness of all potential counterparties. On certain OTC derivatives such as options and bi-lateral swaps, the Fund attempts to reduce its exposure to counterparty credit risk by entering into an International Swaps and Derivatives Association, Inc. (ISDA) Master Agreement with each of its counterparties. The ISDA Master Agreement gives the Fund the right to terminate all transactions traded under such agreement upon the deterioration in the credit quality of the counterparty beyond specified levels. The ISDA Master Agreement gives each party the right, upon an event of default by the other party or a termination of the agreement, to close out all transactions traded under such agreement and to net amounts owed under each transaction to one net payable by one party to the other. To mitigate counterparty credit risk on bi-lateral OTC derivatives, the Fund receives collateral in the form of cash or securities once the Fund's net unrealized appreciation on outstanding derivative contracts under an ISDA Master Agreement exceeds certain applicable thresholds, subject to certain minimum transfer provisions. The collateral received is held in segregated accounts with the Fund's custodian bank in accordance with the collateral agreements entered into between the Fund, the counterparty and the Fund's custodian bank. The Fund could experience delays and costs in gaining access to the collateral even though it is held by the Fund's custodian bank. The Fund's maximum risk of loss from counterparty credit risk related to bi-lateral OTC derivatives is generally the aggregate unrealized appreciation and unpaid counterparty payments in excess of any collateral pledged by the counterparty to the Fund. For OTC written options with upfront premiums received, the Fund is obligated to perform and therefore does not have counterparty risk. For OTC written options with premiums to be received at a future date, the maximum risk of loss from counterparty credit risk is the amount of the premium in excess of any collateral pledged by the counterparty. The Fund may be required to pledge collateral for the benefit of the counterparties on bi-lateral OTC derivatives in an amount not less than each counterparty's unrealized appreciation on outstanding derivative contracts, subject to certain minimum transfer provisions, and any such pledged collateral is identified in the Schedule of Investments. Exchange-traded futures contracts are not covered by the ISDA Master Agreement; however counterparty credit risk related to exchange-traded futures contracts may be mitigated by the protection provided by the exchange on which they trade. Counterparty credit risk related to centrally cleared OTC swaps may be mitigated by the protection provided by the clearinghouse.
Investing in derivatives may involve greater risks than investing in the underlying assets directly and, to varying degrees, may involve risk of loss in excess of any initial investment and collateral received and amounts recognized in the Statement of Assets and Liabilities. In addition, there may be the risk that the change in value of the derivative contract does not correspond to the change in value of the underlying instrument.
Net Realized Gain (Loss) and Change in Net Unrealized Appreciation (Depreciation) on Derivatives. The table below, which reflects the impacts of derivatives on the financial performance of the Fund, summarizes the net realized gain (loss) and change in net unrealized appreciation (depreciation) for derivatives during the period as presented in the Statement of Operations.
| Primary Risk Exposure / Derivative Type | Net Realized Gain (Loss) | Change in Net Unrealized Appreciation (Depreciation) |
| Credit Risk | ||
| Swaps | $143,464 | $620,581 |
| Interest Rate Risk | ||
| Futures Contracts | (9,694,470) | (6,277,753) |
| Purchased Options | 1,827,732 | 2,456,953 |
| Written Options | (397,667) | (401,969) |
| Swaps | – | 864,472 |
| Total Interest Rate Risk | (8,264,405) | (3,358,297) |
| Totals | $(8,120,941) | $(2,737,716) |
A summary of the value of derivatives by primary risk exposure as of period end is included at the end of the Schedule of Investments.
Futures Contracts. A futures contract is an agreement between two parties to buy or sell a specified underlying instrument for a fixed price at a specified future date. The Fund used futures contracts to manage its exposure to the bond market and fluctuations in interest rates.
Upon entering into a futures contract, a fund is required to deposit either cash or securities (initial margin) with a clearing broker in an amount equal to a certain percentage of the face value of the contract. Futures contracts are marked-to-market daily and subsequent daily payments (variation margin) are made or received by a fund depending on the daily fluctuations in the value of the futures contracts and are recorded as unrealized appreciation or (depreciation). This receivable and/or payable, if any, is included in daily variation margin on futures contracts in the Statement of Assets and Liabilities. Realized gain or (loss) is recorded upon the expiration or closing of a futures contract. The net realized gain (loss) and change in net unrealized appreciation (depreciation) on futures contracts during the period is presented in the Statement of Operations.
Any open futures contracts at period end are presented in the Schedule of Investments under the caption "Futures Contracts". The notional amount at value reflects each contract's exposure to the underlying instrument or index at period end and is representative of volume of activity during the period. Securities deposited to meet initial margin requirements are identified in the Schedule of Investments.
Options. Options give the purchaser the right, but not the obligation, to buy (call) or sell (put) an underlying security or financial instrument at an agreed exercise or strike price between or on certain dates. Options obligate the seller (writer) to buy (put) or sell (call) an underlying instrument at the exercise or strike price or cash settle an underlying derivative instrument if the holder exercises the option on or before the expiration date. The Fund uses OTC options, such as swaptions, which are options where the underlying instrument is a swap, to manage its exposure to fluctuations in interest rates.
Upon entering into an options contract, a fund will pay or receive a premium. Premiums paid on purchased options are reflected as cost of investments and premiums received on written options are reflected as a liability on the Statement of Assets and Liabilities. Certain options may be purchased or written with premiums to be paid or received on a future date. Options are valued daily and any unrealized appreciation (depreciation) is reflected on the Statement of Assets and Liabilities. When an option is exercised, the cost or proceeds of the underlying instrument purchased or sold is adjusted by the amount of the premium. When an option is closed the Fund will realize a gain or loss depending on whether the proceeds or amount paid for the closing sale transaction is greater or less than the premium received or paid. When an option expires, gains and losses are realized to the extent of premiums received and paid, respectively. The net realized and unrealized gains (losses) on purchased options are included in the Statement of Operations in net realized gain (loss) and change in net unrealized appreciation (depreciation) on investment securities. The net realized gain (loss) and change in net unrealized appreciation (depreciation) on written options are presented in the Statement of Operations.
Any open options at period end are presented in the Schedule of Investments under the captions "Purchased Options," "Purchased Swaptions," "Written Options" and "Written Swaptions," as applicable, and are representative of volume of activity during the period.
Writing puts and buying calls tend to increase exposure to the underlying instrument while buying puts and writing calls tend to decrease exposure to the underlying instrument. For purchased options, risk of loss is limited to the premium paid, and for written options, risk of loss is the change in value in excess of the premium received.
Swaps. A swap is a contract between two parties to exchange future cash flows at periodic intervals based on a notional principal amount. A bi-lateral OTC swap is a transaction between a fund and a dealer counterparty where cash flows are exchanged between the two parties for the life of the swap. A centrally cleared OTC swap is a transaction executed between a fund and a dealer counterparty, then cleared by a futures commission merchant (FCM) through a clearinghouse. Once cleared, the clearinghouse serves as a central counterparty, with whom a fund exchanges cash flows for the life of the transaction, similar to transactions in futures contracts.
Bi-lateral OTC swaps are marked-to-market daily and changes in value are reflected in the Statement of Assets and Liabilities in the bi-lateral OTC swaps at value line items. Any upfront premiums paid or received upon entering a bi-lateral OTC swap to compensate for differences between stated terms of the swap and prevailing market conditions (e.g. credit spreads, interest rates or other factors) are recorded in net unrealized appreciation (depreciation) in the Statement of Assets and Liabilities and amortized to realized gain or (loss) ratably over the term of the swap. Any unamortized upfront premiums are presented in the Schedule of Investments.
Centrally cleared OTC swaps require a fund to deposit either cash or securities (initial margin) with the FCM, at the instruction of and for the benefit of the clearinghouse. Securities deposited to meet initial margin requirements are identified in the Schedule of Investments. Centrally cleared OTC swaps are marked-to-market daily and subsequent payments (variation margin) are made or received depending on the daily fluctuations in the value of the swaps and are recorded as unrealized appreciation or (depreciation). These daily payments, if any, are included in receivable or payable for daily variation margin on centrally cleared OTC swaps in the Statement of Assets and Liabilities. Any premiums for centrally cleared OTC swaps are recorded periodically throughout the term of the swap to variation margin and included in unrealized appreciation (depreciation) in the Statement of Assets and Liabilities. Any premiums are recognized as realized gain (loss) upon termination or maturity of the swap.
For both bi-lateral and centrally cleared OTC swaps, payments are exchanged at specified intervals, accrued daily commencing with the effective date of the contract and recorded as realized gain or (loss). Some swaps may be terminated prior to the effective date and realize a gain or loss upon termination. The net realized gain (loss) and change in net unrealized appreciation (depreciation) on swaps during the period is presented in the Statement of Operations.
Any open swaps at period end are included in the Schedule of Investments under the caption "Swaps" and are representative of volume of activity during the period.
Credit Default Swaps. Credit default swaps enable the Fund to buy or sell protection against specified credit events on a single-name issuer or a traded credit index. Under the terms of a credit default swap the buyer of protection (buyer) receives credit protection in exchange for making periodic payments to the seller of protection (seller) based on a fixed percentage applied to a notional principal amount. In return for these payments, the seller will be required to make a payment upon the occurrence of one or more specified credit events. The Fund enters into credit default swaps as a seller to gain credit exposure to an issuer and/or as a buyer to obtain a measure of protection against defaults of an issuer. Periodic payments are made over the life of the contract by the buyer provided that no credit event occurs.
For credit default swaps on most corporate and sovereign issuers, credit events include bankruptcy, failure to pay or repudiation/moratorium. For credit default swaps on corporate or sovereign issuers, the obligation that may be put to the seller is not limited to the specific reference obligation described in the Schedule of Investments. For credit default swaps on asset-backed securities, a credit event may be triggered by events such as failure to pay principal, maturity extension, rating downgrade or write-down. For credit default swaps on asset-backed securities, the reference obligation described represents the security that may be put to the seller. For credit default swaps on a traded credit index, a specified credit event may affect all or individual underlying securities included in the index.
As a seller, if an underlying credit event occurs, the Fund will pay a net settlement amount of cash equal to the notional amount of the swap less the recovery value of the reference obligation or underlying securities comprising an index. Only in the event of the industry's inability to value the underlying asset will the Fund be required to take delivery of the reference obligation or underlying securities comprising an index and pay an amount equal to the notional amount of the swap.
As a buyer, if an underlying credit event occurs, the Fund will receive a net settlement amount of cash equal to the notional amount of the swap less the recovery value of the reference obligation or underlying securities comprising an index. Only in the event of the industry's inability to value the underlying asset will the Fund be required to deliver the reference obligation or underlying securities comprising an index in exchange for payment of an amount equal to the notional amount of the swap.
Typically, the value of each credit default swap and credit rating disclosed for each reference obligation in the Schedule of Investments, where the Fund is the seller, can be used as measures of the current payment/performance risk of the swap. As the value of the swap changes as a positive or negative percentage of the total notional amount, the payment/performance risk may decrease or increase, respectively. In addition to these measures, the investment adviser monitors a variety of factors including cash flow assumptions, market activity and market sentiment as part of its ongoing process of assessing payment/performance risk.
Interest Rate Swaps. Interest rate swaps are agreements between counterparties to exchange cash flows, one based on a fixed rate, and the other on a floating rate. The Fund entered into interest rate swaps to manage its exposure to interest rate changes. Changes in interest rates can have an effect on both the value of bond holdings as well as the amount of interest income earned. In general, the value of bonds can fall when interest rates rise and can rise when interest rates fall.
4. Purchases and Sales of Investments.
Purchases and sales of securities, other than short-term securities and U.S. government securities, are noted in the table below.
| Purchases ($) | Sales ($) | |
| Strategic Advisers Core Income Fund | 14,102,547,343 | 8,354,114,540 |
5. Fees and Other Transactions with Affiliates.
Management Fee. Strategic Advisers (the investment adviser) provides the Fund with investment management related services. For these services, the Fund pays a monthly management fee to the investment adviser. The management fee is calculated by adding the annual management fee rate of .25% of the Fund's average net assets throughout the month payable to the investment adviser to the aggregate of the fee rates, payable monthly, to the Fund's sub-advisers. The Fund's maximum aggregate management fee will not exceed .60% of the Fund's average net assets. For the reporting period, the total annual management fee rate was .28% of the Fund's average net assets.
During the period, the investment adviser waived a portion of its management fee as described in the Expense Reductions note.
Sub-Advisers. FIAM LLC (an affiliate of the investment adviser) and PGIM, Inc. each served as a sub-adviser for the Fund during the period. Sub-advisers provide discretionary investment advisory services for their allocated portion of the Fund's assets and are paid by the investment adviser and not the Fund for providing these services.
Accounting and Security Lending Fees. Fidelity Service Company, Inc. (FSC), an affiliate of the investment adviser, maintains the Fund's accounting records. The accounting fee is based on the level of average net assets for each month. Prior to April 1, 2019, FSC had a separate agreement with the Fund for administration of the security lending program, based on the number and duration of lending transactions. Effective July 1, 2019 accounting fees are not paid by the Fund and are instead paid by the investment adviser or an affiliate. For the period, the total fees paid for accounting and administration of securities lending were equivalent to less than .005%.
Interfund Trades. Funds may purchase from or sell securities to other funds affiliated with each sub-adviser under procedures adopted by the Board. The procedures have been designed to ensure these interfund trades are executed in accordance with Rule 17a-7 of the 1940 Act. Interfund trades are included within the respective purchases and sales amounts shown in the Purchases and Sales of Investments note.
Prior Fiscal Year Reallocation of Underlying Fund Investments. During the prior period, the investment adviser allocated investments of the Fund. This involved taxable redemptions of the Fund's interest in Fidelity Total Bond Fund in exchange for investments and cash, valued at $6,386,899,397, and non-taxable exchanges of those investments for shares of Fidelity SAI Total Bond fund. The Fund had a net realized loss of $(291,139,992) on the redemption of Fidelity Total Bond Fund shares.
Other. During the period, the investment adviser reimbursed the Fund for certain losses in the amount of $6,184.
6. Investments in Fidelity Central Funds.
The Fund invests in Fidelity Central Funds, which are open-end investment companies available only to other investment companies and accounts managed by the investment adviser and its affiliates. The Fund's Schedule of Investments lists each of the Fidelity Central Funds held as of period end, if any, as an investment of the Fund, but does not include the underlying holdings of each Fidelity Central Fund. As an Investing Fund, the Fund indirectly bears its proportionate share of the expenses of the underlying Fidelity Central Funds.
The Fidelity Money Market Central Funds are managed by FMR. Annualized expenses of the Money Market Central Funds as of their most recent shareholder report date ranged from less than .005% to .01%.
A complete unaudited list of holdings for each Fidelity Central Fund is available upon request or at the Securities and Exchange Commission (the SEC) website at www.sec.gov. In addition, the financial statements of the Fidelity Central Funds, which are not covered by the Fund's Report of Independent Registered Public Accounting Firm, are available on the SEC website or upon request.
7. Committed Line of Credit.
Certain Funds participate with other funds managed by the investment adviser or an affiliate in a $4.25 billion credit facility (the "line of credit") to be utilized for temporary or emergency purposes to fund shareholder redemptions or for other short-term liquidity purposes. The participating funds have agreed to pay commitment fees on their pro-rata portion of the line of credit, which are reflected in Miscellaneous expenses on the Statement of Operations, and are as follows:
| Amount | |
| Strategic Advisers Core Income Fund | $103,556 |
During the period, there were no borrowings on this line of credit.
8. Security Lending.
The Fund lends portfolio securities through a lending agent from time to time in order to earn additional income. On the settlement date of the loan, the Fund receives collateral (in the form of U.S. Treasury obligations, letters of credit and/or cash) against the loaned securities and maintains collateral in an amount not less than 100% of the market value of the loaned securities during the period of the loan. The market value of the loaned securities is determined at the close of business of the Fund and any additional required collateral is delivered to the Fund on the next business day. The Fund or borrower may terminate the loan at any time, and if the borrower defaults on its obligation to return the securities loaned because of insolvency or other reasons, the Fund may apply collateral received from the borrower against the obligation. The Fund may experience delays and costs in recovering the securities loaned. Any cash collateral received is invested in the Fidelity Securities Lending Cash Central Fund. The value of loaned securities and cash collateral at period end are disclosed on the Fund's Statement of Assets and Liabilities. Security lending income represents the income earned on investing cash collateral, less rebates paid to borrowers and any lending agent fees associated with the loan, plus any premium payments received for lending certain types of securities. Security lending income is presented in the Statement of Operations as a component of income from Fidelity Central Funds.
9. Expense Reductions.
The investment adviser has contractually agreed to waive the Fund's management fee in an amount equal to .25% of the Fund's average net assets until September 30, 2022. During the period, this waiver reduced the Fund's management fee by $105,124,976.
Commissions paid to certain brokers with whom the investment adviser, or its affiliates, places trades on behalf of the Fund include an amount in addition to trade execution, which may be rebated back to the Fund to offset certain expenses. This amount totaled $6,125 for the period.
In addition, through arrangements with the Fund's custodian and transfer agent, credits realized as a result of certain uninvested cash balances were used to reduce the Fund's expenses by $20,315 and $142, respectively.
10. Other.
The Fund's organizational documents provide former and current trustees and officers with a limited indemnification against liabilities arising in connection with the performance of their duties to the Fund. In the normal course of business, the Fund may also enter into contracts that provide general indemnifications. The Fund's maximum exposure under these arrangements is unknown as this would be dependent on future claims that may be made against the Fund. The risk of material loss from such claims is considered remote.
The Fund does not invest in the Underlying Funds for the purpose of exercising management or control; however, investments by the Fund within its principal investment strategies may represent a significant portion of an Underlying Fund's net assets.
At the end of the period, the Fund was the owner of record of 10% or more of the total outstanding shares of the following Underlying Funds:
| Fidelity SAI U.S. Treasury Bond Index Fund | 42% |
| Fidelity Sustainability Bond Index Fund | 25% |
| Fidelity SAI Total Bond Fund | 44% |
11. Coronavirus (COVID-19) Pandemic.
An outbreak of COVID-19 first detected in China during December 2019 has since spread globally and was declared a pandemic by the World Health Organization during March 2020. Developments that disrupt global economies and financial markets, such as the COVID-19 pandemic, may magnify factors that affect the Fund's performance.
Report of Independent Registered Public Accounting Firm
To the Board of Trustees of Fidelity Rutland Square Trust II and Shareholders of Strategic Advisers Core Income Fund
Opinion on the Financial Statements
We have audited the accompanying statement of assets and liabilities, including the schedule of investments, of Strategic Advisers Core Income Fund (one of the funds constituting Fidelity Rutland Square Trust II, referred to hereafter as the “Fund”) as of February 29, 2020, the related statement of operations for the year ended February 29, 2020, the statement of changes in net assets for each of the two years in the period ended February 29, 2020, including the related notes, and the financial highlights for each of the five years in the period ended February 29, 2020 (collectively referred to as the “financial statements”). In our opinion, the financial statements present fairly, in all material respects, the financial position of the Fund as of February 29, 2020, the results of its operations for the year then ended, the changes in its net assets for each of the two years in the period ended February 29, 2020 and the financial highlights for each of the five years in the period ended February 29, 2020 in conformity with accounting principles generally accepted in the United States of America.
Basis for Opinion
These financial statements are the responsibility of the Fund’s management. Our responsibility is to express an opinion on the Fund’s financial statements based on our audits. We are a public accounting firm registered with the Public Company Accounting Oversight Board (United States) (PCAOB) and are required to be independent with respect to the Fund in accordance with the U.S. federal securities laws and the applicable rules and regulations of the Securities and Exchange Commission and the PCAOB.
We conducted our audits of these financial statements in accordance with the standards of the PCAOB. Those standards require that we plan and perform the audit to obtain reasonable assurance about whether the financial statements are free of material misstatement, whether due to error or fraud.
Our audits included performing procedures to assess the risks of material misstatement of the financial statements, whether due to error or fraud, and performing procedures that respond to those risks. Such procedures included examining, on a test basis, evidence regarding the amounts and disclosures in the financial statements. Our audits also included evaluating the accounting principles used and significant estimates made by management, as well as evaluating the overall presentation of the financial statements. Our procedures included confirmation of securities owned as of February 29, 2020 by correspondence with the custodian and brokers; when replies were not received from brokers, we performed other auditing procedures. We believe that our audits provide a reasonable basis for our opinion.
PricewaterhouseCoopers LLP
Boston, Massachusetts
April 14, 2020
We have served as the auditor of one or more investment companies in the Fidelity group of funds since 1932.
Trustees and Officers
The Trustees, Members of the Advisory Board (if any), and officers of the trust and fund, as applicable, are listed below. The Board of Trustees governs the fund and is responsible for protecting the interests of shareholders. The Trustees are experienced executives who meet periodically throughout the year to oversee the fund's activities, review contractual arrangements with companies that provide services to the fund, oversee management of the risks associated with such activities and contractual arrangements, and review the fund's performance. If the interests of the fund and an underlying Fidelity® fund were to diverge, a conflict of interest could arise and affect how the Trustees and Members of the Advisory Board fulfill their fiduciary duties to the affected funds. Strategic Advisers has structured the fund to avoid these potential conflicts, although there may be situations where a conflict of interest is unavoidable. In such instances, Strategic Advisers, the Trustees, and Members of the Advisory Board would take reasonable steps to minimize and, if possible, eliminate the conflict. Each of the Trustees oversees 14 funds.
The Trustees hold office without limit in time except that (a) any Trustee may resign; (b) any Trustee may be removed by written instrument, signed by at least two-thirds of the number of Trustees prior to such removal; (c) any Trustee who requests to be retired or who has become incapacitated by illness or injury may be retired by written instrument signed by a majority of the other Trustees; and (d) any Trustee may be removed at any special meeting of shareholders by a two-thirds vote of the outstanding voting securities of the trust. Officers and Advisory Board Members hold office without limit in time, except that any officer or Advisory Board Member may resign or may be removed by a vote of a majority of the Trustees at any regular meeting or any special meeting of the Trustees. Except as indicated, each individual has held the office shown or other offices in the same company for the past five years.
Each Trustee who is not an interested person (as defined in the 1940 Act) of the trust and the fund is referred to herein as an Independent Trustee.
The fund’s Statement of Additional Information (SAI) includes more information about the Trustees. To request a free copy, call Fidelity at 1-800-544-3455.
Experience, Skills, Attributes, and Qualifications of the Trustees. The Governance and Nominating Committee has adopted a statement of policy that describes the experience, qualifications, attributes, and skills that are necessary and desirable for potential Independent Trustee candidates (Statement of Policy). The Board believes that each Trustee satisfied at the time he or she was initially elected or appointed a Trustee, and continues to satisfy, the standards contemplated by the Statement of Policy. The Governance and Nominating Committee may also engage professional search firms to help identify potential Independent Trustee candidates with experience, qualifications, attributes, and skills consistent with the Statement of Policy. Additional criteria based on the composition and skills of the current Independent Trustees, as well as experience or skills that may be appropriate in light of future changes to board composition, business conditions, and regulatory or other developments, may be considered by the professional search firms and the Governance and Nominating Committee. In addition, the Board takes into account the Trustees' commitment and participation in Board and committee meetings, as well as their leadership of standing and ad hoc committees throughout their tenure.
In determining that a particular Trustee was and continues to be qualified to serve as a Trustee, the Board has considered a variety of criteria, none of which, in isolation, was controlling. The Board believes that, collectively, the Trustees have balanced and diverse experience, qualifications, attributes, and skills, which allow the Board to operate effectively in governing the fund and protecting the interests of shareholders. Information about the specific experience, skills, attributes, and qualifications of each Trustee, which in each case led to the Board's conclusion that the Trustee should serve (or continue to serve) as a trustee of the fund, is provided below.
Board Structure and Oversight Function. Robert A. Lawrence is an interested person and currently serves as Chairman. The Trustees have determined that an interested Chairman is appropriate and benefits shareholders because an interested Chairman has a personal and professional stake in the quality and continuity of services provided to the fund. Independent Trustees exercise their informed business judgment to appoint an individual of their choosing to serve as Chairman, regardless of whether the Trustee happens to be independent or a member of management. The Independent Trustees have determined that they can act independently and effectively without having an Independent Trustee serve as Chairman and that a key structural component for assuring that they are in a position to do so is for the Independent Trustees to constitute a substantial majority for the Board. The Independent Trustees also regularly meet in executive session. Mary C. Farrell serves as the lead Independent Trustee and as such (i) acts as a liaison between the Independent Trustees and management with respect to matters important to the Independent Trustees and (ii) with management prepares agendas for Board meetings.
Fidelity® funds are overseen by different Boards of Trustees. The fund's Board oversees asset allocation funds. Other Boards oversee Fidelity's investment-grade bond, money market, and asset allocation funds, and Fidelity's equity and high income funds. The fund may invest in Fidelity® funds overseen by such other Boards. The use of separate Boards, each with its own committee structure, allows the Trustees of each group of Fidelity® funds to focus on the unique issues of the funds they oversee, including common research, investment, and operational issues.
The Trustees primarily operate as a full Board, but also operate in committees, to facilitate the timely and efficient consideration of all matters of importance to the Trustees, the fund, and fund shareholders and to facilitate compliance with legal and regulatory requirements and oversight of the fund's activities and associated risks. The Board has charged Strategic Advisers and its affiliates with (i) identifying events or circumstances the occurrence of which could have demonstrably adverse effects on the fund's business and/or reputation; (ii) implementing processes and controls to lessen the possibility that such events or circumstances occur or to mitigate the effects of such events or circumstances if they do occur; and (iii) creating and maintaining a system designed to evaluate continuously business and market conditions in order to facilitate the identification and implementation processes described in (i) and (ii) above. Because the day-to-day operations and activities of the fund are carried out by or through Strategic Advisers, its affiliates and other service providers, the fund's exposure to risks is mitigated but not eliminated by the processes overseen by the Trustees. Board oversight of different aspects of the fund's activities is exercised primarily through the full Board, but also through the Audit and Compliance Committee. Appropriate personnel, including but not limited to the fund's Chief Compliance Officer (CCO), FMR's internal auditor, the independent accountants, the fund's Treasurer and portfolio management personnel, make periodic reports to the Board's committees, as appropriate. The responsibilities of each standing committee, including their oversight responsibilities, are described further under "Standing Committees of the Trustees."
Interested Trustees*:
Correspondence intended for a Trustee who is an interested person may be sent to Fidelity Investments, 245 Summer Street, Boston, Massachusetts 02210.
Name, Year of Birth; Principal Occupations and Other Relevant Experience+
Brian B. Hogan (1964)
Year of Election or Appointment: 2018
Trustee
Mr. Hogan also serves as Trustee of other funds. Mr. Hogan serves as Head of Fidelity Investments’ Investment Solutions and Innovation organization (2018-present), and a Director of Strategic Advisers LLC (2018-present). Previously, Mr. Hogan served as a Director of Fidelity SelectCo, LLC (investment adviser firm, 2014-2019), President of FMR Co., Inc. (2009-2018), a Vice President of Fidelity's Equity and High Income funds (2009-2018), a Director of FMR Investment Management (UK) Limited (investment adviser firm, 2015-2018), Trustee of certain Fidelity® funds (2014-2018), President of the Equity Division of Fidelity Management & Research Company (investment adviser firm, 2009-2018), Senior Vice President, Equity Research of Fidelity Management & Research Company (2006-2009), and as a portfolio manager. Mr. Brian B. Hogan is not related to Mr. Colm A. Hogan.
Robert A. Lawrence (1952)
Year of Election or Appointment: 2016
Trustee
Chairman of the Board of Trustees
Mr. Lawrence also serves as Trustee of other funds. Previously, Mr. Lawrence served as a Member of the Advisory Board of certain funds. Prior to his retirement in 2008, Mr. Lawrence served as Vice President of certain Fidelity® funds (2006-2008), Senior Vice President, Head of High Income Division of Fidelity Management & Research Company (investment adviser firm, 2006-2008), and President of Fidelity Strategic Investments (investment adviser firm, 2002-2005).
* Determined to be an "Interested Trustee" by virtue of, among other things, his or her affiliation with the trust or various entities under common control with Strategic Advisers.
+ The information includes the Trustee's principal occupation during the last five years and other information relating to the experience, attributes, and skills relevant to the Trustee's qualifications to serve as a Trustee, which led to the conclusion that the Trustee should serve as a Trustee for the fund.
Independent Trustees:
Correspondence intended for an Independent Trustee may be sent to Fidelity Investments, P.O. Box 55235, Boston, Massachusetts 02205-5235.
Name, Year of Birth; Principal Occupations and Other Relevant Experience+
Peter C. Aldrich (1944)
Year of Election or Appointment: 2006
Trustee
Mr. Aldrich also serves as Trustee of other funds. Mr. Aldrich is a Director of the National Bureau of Economic Research, a Director of the funds of BlackRock Realty Group (2006-present), and a Director of LivelyHood, Inc. (private corporation, 2013-present). Previously, Mr. Aldrich served as a Trustee for the Fidelity Rutland Square Trust (2005-2010), a Managing Member of Poseidon, LLC (foreign private investment, 1998-2004), and Chairman and Managing Member of AEGIS, LLC (foreign private investment, 1997-2004). Mr. Aldrich previously was a founder, Chief Executive Officer, and Chairman of AEW Capital Management, L.P. (then “Aldrich, Eastman and Waltch, L.P.”). Mr. Aldrich also served as a Director of Zipcar, Inc. (car sharing services, 2001-2009) and as Faculty Chairman of The Research Council on Global Investment of The Conference Board (business and professional education non-profit, 1999-2004). Mr. Aldrich is a Member Emeritus of the Board of Trustees of the Museum of Fine Arts Boston and an Overseer of the Massachusetts Eye and Ear Infirmary.
Ralph F. Cox (1932)
Year of Election or Appointment: 2006
Trustee
Mr. Cox also serves as Trustee of other funds. Mr. Cox is President of RABAR Enterprises (management consulting for the petroleum industry). Mr. Cox is a Director of Abraxas Petroleum (exploration and production, 1999-present). Mr. Cox is a member of the Advisory Boards of the Business and Engineering Schools of Texas A&M University and the Engineering School of University of Texas at Austin. Previously, Mr. Cox served as a Trustee for the Fidelity Rutland Square Trust (2005-2010) and as an Advisory Director of CH2M Hill Companies (engineering, 1981-2011). Mr. Ralph F. Cox and Mr. Howard E. Cox, Jr. are not related.
Mary C. Farrell (1949)
Year of Election or Appointment: 2013
Trustee
Ms. Farrell also serves as Trustee of other funds. Ms. Farrell is a Director of the W.R. Berkley Corporation (insurance provider) and President (2009-present) and Director (2006-present) of the Howard Gilman Foundation (charitable organization). Previously, Ms. Farrell was Managing Director and Chief Investment Strategist at UBS Wealth Management USA and Co-Head of UBS Wealth Management Investment Strategy & Research Group (2003-2005). Ms. Farrell also served as Investment Strategist at PaineWebber (1982-2000) and UBS PaineWebber (2000-2002). Ms. Farrell serves as Chairman of the Board of Trustees of Yale-New Haven Hospital and on the Yale New Haven Health System Board and previously served as Trustee on the Board of Overseers of the New York University Stern School of Business.
Karen Kaplan (1960)
Year of Election or Appointment: 2006
Trustee
Ms. Kaplan also serves as Trustee of other funds. Ms. Kaplan is Chairman (2014-present) and Chief Executive Officer (2013-present) of Hill Holliday (advertising and specialized marketing). Ms. Kaplan is a Director of The Michaels Companies, Inc. (specialty retailer, 2015-present), Member of the Board of Governors of the Chief Executives’ Club of Boston (2010-present), Member of the Executive Committee of the Greater Boston Chamber of Commerce (2006-present), Advisory Board Member of the National Association of Corporate Directors Chapter (2012-present), Member of the Board of Trustees of the Post Office Square Trust (2012-present), Trustee of the Brigham and Women’s Hospital (2016-present), Overseer of the Boston Symphony Orchestra (2014-present), Member of the Board of Directors of The Advertising Council, Inc. (2016-present), and Member of the Ron Burton Training Village Executive Board of Advisors (2018-present). Previously, Ms. Kaplan served as an Advisory Board Member of Fidelity Rutland Square Trust (2006-2010), a member of the Clinton Global Initiative (2010-2015), Director of DSM (dba Delta Dental and DentaQuest) (2004-2014), Formal Appointee of the 2015 Baker-Polito Economic Development Council, Director of Vera Bradley Inc. (designer of women’s accessories, 2012-2015), Member of the Board of Directors of the Massachusetts Conference for Women (2008-2015), Member of the Board of Directors of Jobs for Massachusetts (2012-2015), President of the Massachusetts Women’s Forum (2008-2010), Treasurer of the Massachusetts Women’s Forum (2002-2006), and Vice Chair of the Board of the Massachusetts Society for the Prevention of Cruelty to Children (2003-2010).
Heidi L. Steiger (1953)
Year of Election or Appointment: 2017
Trustee
Ms. Steiger also serves as Trustee of other funds. Ms. Steiger serves as a member of the Global Advisory Board and Of Counsel to Signum Global Advisors (international policy and strategy, 2018-present), a guest lecturer in the joint degree program in Global Luxury Management at North Carolina State University (Raleigh, NC) and Skema (Paris) (2018-present), Managing Partner of Topridge Associates, LLC (consulting, 2005-present), a Non-Executive Director of CrowdBureau Corporation (financial technology company and index provider, 2018-present), and a member of the Board of Directors (2013-present) and Chair of the Audit Committee and member of the Membership and Executive Committees (2017-present) of Business Executives for National Security (nonprofit). Previously, Ms. Steiger served as Eastern Region President of The Private Client Reserve of U.S. Bancorp (banking and financial services, 2010-2015), Advisory Director of Berkshire Capital Securities, LLC (financial services, 2009-2010), President and Senior Advisor of Lowenhaupt Global Advisors, LLC (financial services, 2005-2007), and President and Contributing Editor of Worth Magazine (2004-2005) and held a variety of positions at Neuberger Berman Group, LLC (financial services, 1986-2004), including Partner and Executive Vice President and Global Head of Private Asset Management at Neuberger Berman (1999-2004). Ms. Steiger also served as a member of the Board of Directors of Nuclear Electric Insurance Ltd (insurer of nuclear utilities, 2006-2017), a member of the Board of Trustees and Audit Committee of the Eaton Vance Funds (2007-2010), a member of the Board of Directors of Aviva USA (formerly AmerUs) (insurance, 2004-2014), and a member of the Board of Trustees and Audit Committee and Chair of the Investment Committee of CIFG (financial guaranty insurance, 2009-2012), and a member of the Board of Directors of Kin Group Plc (formerly, Fitbug Holdings) (health and technology, 2016-2017).
+ The information includes the Trustee's principal occupation during the last five years and other information relating to the experience, attributes, and skills relevant to the Trustee's qualifications to serve as a Trustee, which led to the conclusion that the Trustee should serve as a Trustee for the fund.
Advisory Board Members and Officers:
Correspondence intended for an officer or Howard E. Cox, Jr. may be sent to Fidelity Investments, 245 Summer Street, Boston, Massachusetts 02210. Officers appear below in alphabetical order.
Name, Year of Birth; Principal Occupation
Howard E. Cox, Jr. (1944)
Year of Election or Appointment: 2009
Member of the Advisory Board
Mr. Cox also serves as Member of the Advisory Board of other funds. Mr. Cox is a Partner of Greylock (venture capital, 1971-present) and a Director of Stryker Corporation (medical products and services, 1974-present). Previously, Mr. Cox served as an Advisory Board Member of Fidelity Rutland Square Trust (2006-2010). Mr. Cox also serves as a Member of the Secretary of Defense's Business Board of Directors (2008-present), a Director of Business Executives for National Security (1997-present), a Director of the Brookings Institution (2010-present), a Director of the World Economic Forum’s Young Global Leaders Foundation (2009-present), and is a Member of the Harvard Medical School Board of Fellows (2002-present). Mr. Howard E. Cox, Jr. and Mr. Ralph F. Cox are not related.
Christine Marcks (1955)
Year of Election or Appointment: 2019
Member of the Advisory Board
Ms. Marcks also serves as Member of the Advisory Board of other Funds. Prior to her retirement, Ms. Marcks served as Chief Executive Officer and President – Prudential Retirement (2007-2017) and Vice President for Rollover and Retirement Income Strategies (2005-2007), Prudential Financial, Inc. (financial services). Previously, Ms. Marcks was Senior Vice President and Head of Financial Horizons (2002-2004) and Vice President, Strategic Marketing (2000-2002) of Voya Financial (formerly ING U.S.) (financial services), held numerous positions at Aetna Financial Services (financial services, 1987-2000) and served as an International Economist for the United States Department of the Treasury (1980-1987). Ms. Marcks also serves as a member of the Board of Trustees, Audit Committee and Benefits & Operations Committee of the YMCA Retirement Fund (2018-present), a non-profit organization providing retirement plan benefits to YMCA staff members, and as a member of the Board of Trustees of Assumption College (2019-present).
Elizabeth Paige Baumann (1968)
Year of Election or Appointment: 2017
Anti-Money Laundering (AML) Officer
Ms. Baumann also serves as AML Officer of other funds. She is Chief AML Officer (2012-present) and Senior Vice President (2014-present) of FMR LLC (diversified financial services company) and is an employee of Fidelity Investments. Previously, Ms. Baumann served as AML Officer of certain funds (2017-2019), as AML Officer of the funds (2012-2016), and Vice President (2007-2014) and Deputy Anti-Money Laundering Officer (2007-2012) of FMR LLC.
Craig S. Brown (1977)
Year of Election or Appointment: 2019
Assistant Treasurer
Mr. Brown also serves as Assistant Treasurer of other funds. Mr. Brown is an employee of Fidelity Investments (2013-present).
John J. Burke III (1964)
Year of Election or Appointment: 2018
Chief Financial Officer
Mr. Burke also serves as Chief Financial Officer of other funds. Mr. Burke serves as Head of Investment Operations for Fidelity Fund and Investment Operations (2018-present) and is an employee of Fidelity Investments (1998-present). Previously Mr. Burke served as head of Asset Management Investment Operations (2012-2018).
Jonathan Davis (1968)
Year of Election or Appointment: 2010
Assistant Treasurer
Mr. Davis also serves as Assistant Treasurer of other funds. Mr. Davis serves as Assistant Treasurer of FMR Capital, Inc. (2017-present) and is an employee of Fidelity Investments. Previously, Mr. Davis served as Vice President and Associate General Counsel of FMR LLC (diversified financial services company, 2003-2010).
Laura M. Del Prato (1964)
Year of Election or Appointment: 2018
Assistant Treasurer
Ms. Del Prato also serves as an officer of other funds. Ms. Del Prato is an employee of Fidelity Investments (2017-present). Prior to joining Fidelity Investments, Ms. Del Prato served as a Managing Director and Treasurer of the JPMorgan Mutual Funds (2014-2017). Prior to JPMorgan, Ms. Del Prato served as a partner at Cohen Fund Audit Services (accounting firm, 2012-2013) and KPMG LLP (accounting firm, 2004-2012).
James D. Gryglewicz (1972)
Year of Election or Appointment: 2015
Chief Compliance Officer
Mr. Gryglewicz also serves as Chief Compliance Officer of other funds. Mr. Gryglewicz serves as Compliance Officer of Strategic Advisers LLC (investment adviser firm, 2015-present), Senior Vice President of Asset Management Compliance (2009-present), and is an employee of Fidelity Investments (2004-present). Previously, Mr. Gryglewicz served as Compliance Officer of Fidelity SelectCo, LLC (investment adviser firm, 2014-2019), and as Chief Compliance Officer of certain Fidelity® funds (2014-2018).
Colm A. Hogan (1973)
Year of Election or Appointment: 2016
Assistant Treasurer
Mr. Hogan also serves as an officer of other funds. Mr. Hogan serves as Assistant Treasurer of FMR Capital, Inc. (2017-present) and is an employee of Fidelity Investments (2005-present). Previously, Mr. Hogan served as Deputy Treasurer of certain Fidelity® funds (2016-2020) and Assistant Treasurer of certain Fidelity® funds (2016-2018). Mr. Colm A. Hogan is not related to Mr. Brian B. Hogan.
Christina H. Lee (1975)
Year of Election or Appointment: 2020
Secretary and Chief Legal Officer
Ms. Lee also serves as Secretary and CLO of other funds. Ms. Lee serves as Vice President, Associate General Counsel (2014-present) and is an employee of Fidelity Investments (2007-present). Previously, Ms. Lee served as Assistant Secretary of certain funds (2018-2019).
Cynthia Lo Bessette (1969)
Year of Election or Appointment: 2020
Assistant Secretary
Ms. Lo Bessette also serves as an officer of other funds. Ms. Lo Bessette serves as CLO, Secretary, and Senior Vice President of Fidelity Management & Research Company LLC (investment adviser firm, 2019-present); and CLO of Fidelity Management & Research (Hong Kong) Limited, FMR Investment Management (UK) Limited, and Fidelity Management & Research (Japan) Limited (investment adviser firms, 2019-present). She is a Senior Vice President and Deputy General Counsel of FMR LLC (diversified financial services company, 2019-present), and is an employee of Fidelity Investments. Previously, Ms. Lo Bessette served as CLO, Secretary, and Senior Vice President of FMR Co., Inc. (investment adviser firm, 2019); Secretary of Fidelity SelectCo, LLC and Fidelity Investments Money Management, Inc. (investment adviser firms, 2019). Prior to joining Fidelity Investments, Ms. Lo Bessette was Executive Vice President, General Counsel (2016-2019) and Senior Vice President, Deputy General Counsel (2015-2016) of OppenheimerFunds (investment management company) and Deputy Chief Legal Officer (2013-2015) of Jennison Associates LLC (investment adviser firm).
Chris Maher (1972)
Year of Election or Appointment: 2016
Assistant Treasurer
Mr. Maher also serves as an officer of other funds. Mr. Maher serves as Assistant Treasurer of FMR Capital, Inc. (2017-present), and is an employee of Fidelity Investments (2008-present). Previously, Mr. Maher served as Assistant Treasurer of certain funds (2013-2020); Vice President of Asset Management Compliance (2013), Vice President of the Program Management Group of FMR (investment adviser firm, 2010-2013), and Vice President of Valuation Oversight (2008-2010).
Stacie M. Smith (1974)
Year of Election or Appointment: 2020
President and Treasurer
Ms. Smith also serves as an officer of other funds. Ms. Smith serves as Assistant Treasurer of FMR Capital, Inc. (2017-present), is an employee of Fidelity Investments (2009-present), and has served in other fund officer roles. Prior to joining Fidelity Investments, Ms. Smith served as Senior Audit Manager of Ernst & Young LLP (accounting firm, 1996-2009). Previously, Ms. Smith served as Assistant Treasurer (2013-2019) and Deputy Treasurer (2013-2016) of certain Fidelity® funds.
Marc L. Spector (1972)
Year of Election or Appointment: 2016
Assistant Treasurer
Mr. Spector also serves as an officer of other funds. Mr. Spector serves as Assistant Treasurer of FMR Capital, Inc. (2017-present) and is an employee of Fidelity Investments (2016-present). Prior to joining Fidelity Investments, Mr. Spector served as Director at the Siegfried Group (accounting firm, 2013-2016), and prior to Siegfried Group as audit senior manager at Deloitte & Touche LLP (accounting firm, 2005-2013).
Jim Wegmann (1979)
Year of Election or Appointment: 2019
Assistant Treasurer
Mr. Wegmann also serves as Assistant Treasurer of other funds. Mr. Wegmann is an employee of Fidelity Investments (2011-present).
Shareholder Expense Example
As a shareholder of the Fund, you incur two types of costs: (1) transaction costs and (2) ongoing costs, including management fees and other Fund expenses. This Example is intended to help you understand your ongoing costs (in dollars) of investing in the Fund and to compare these costs with the ongoing costs of investing in other mutual funds.
The Example is based on an investment of $1,000 invested at the beginning of the period and held for the entire period (September 1, 2019 to February 29, 2020).
Actual Expenses
The first line of the accompanying table provides information about actual account values and actual expenses. You may use the information in this line, together with the amount you invested, to estimate the expenses that you paid over the period. Simply divide your account value by $1,000.00 (for example, an $8,600 account value divided by $1,000.00 = 8.6), then multiply the result by the number in the first line under the heading entitled "Expenses Paid During Period" to estimate the expenses you paid on your account during this period. In addition to the direct expenses incurred by the Fund presented in the table, as a shareholder of the underlying mutual funds and exchange-traded funds (ETFs) (the Underlying Funds), the Fund also indirectly bears its proportionate share of the expenses of the Underlying Funds. In addition, the Fund, as a shareholder in the underlying Fidelity Central Funds, will indirectly bear its pro-rata share of the fees and expenses incurred by the underlying Fidelity Central Funds.
Hypothetical Example for Comparison Purposes
The second line of the accompanying table provides information about hypothetical account values and hypothetical expenses based on the Fund's actual expense ratio and an assumed rate of return of 5% per year before expenses, which is not the Fund's actual return. The hypothetical account values and expenses may not be used to estimate the actual ending account balance or expenses you paid for the period. You may use this information to compare the ongoing costs of investing in the Fund and other funds. To do so, compare this 5% hypothetical example with the 5% hypothetical examples that appear in the shareholder reports of the other funds. In addition to the direct expenses incurred by the Fund presented in the table, as a shareholder of the Underlying Funds, the Fund also indirectly bears its proportionate share of the expenses of the Underlying Funds. In addition, the Fund, as a shareholder in the underlying Fidelity Central Funds, will indirectly bear its pro-rata share of the fees and expenses incurred by the underlying Fidelity Central Funds.
Please note that the expenses shown in the table are meant to highlight your ongoing costs only and do not reflect any transaction costs. Therefore, the second line of the table is useful in comparing ongoing costs only, and will not help you determine the relative total costs of owning different funds.
| Annualized Expense Ratio-A | Beginning Account Value September 1, 2019 | Ending Account Value February 29, 2020 | Expenses Paid During Period-B September 1, 2019 to February 29, 2020 |
|
| Actual | .03% | $1,000.00 | $1,034.00 | $.15 |
| Hypothetical-C | $1,000.00 | $1,024.71 | $.15 |
A Annualized expense ratio reflects expenses net of applicable fee waivers.
B Expenses are equal to the Fund's annualized expense ratio, multiplied by the average account value over the period, multiplied by 182/366 (to reflect the one-half year period). The fees and expenses of the Underlying Funds in which the Fund invests are not included in the Fund's annualized expense ratio.
C 5% return per year before expenses
Distributions (Unaudited)
A total of 14.85% of the dividends distributed during the fiscal year was derived from interest on U.S. Government securities which is generally exempt from state income tax.
The fund will notify shareholders in January 2021 of amounts for use in preparing 2020 income tax returns.
Board Approval of Investment Advisory Contracts and Management Fees
Strategic Advisers Core Income Fund
Each year, the Board of Trustees, including the Independent Trustees (together, the Board), votes at an in-person meeting on the renewal of the management contract with Strategic Advisers LLC (Strategic Advisers) and the sub-advisory agreements with FIAM LLC and PGIM, Inc. (PGIM) (each a Sub-Adviser and collectively, the Sub-Advisers) (collectively, the Sub-Advisory Agreements and, together with the management contract, the Advisory Contracts) for the fund. Strategic Advisers and the Sub-Advisers are referred to herein as the Investment Advisers. The Board, assisted by the advice of fund counsel and Independent Trustees' counsel, requests and considers a broad range of information relevant to the renewal of the Advisory Contracts throughout the year.The Board meets at least four times per year and, at each of its meetings, covers an extensive agenda of topics and materials and considers factors that are relevant to its annual consideration of the renewal of the fund's Advisory Contracts, including the services and support provided to the fund and its shareholders. The full Board or the Independent Trustees, as appropriate, act on all major matters; however, a portion of the activities of the Board (including certain of those described herein) may be conducted through standing committees that have been established by the Board. The Board, acting directly and through its committees, requests and receives information concerning the annual consideration of the renewal of the fund's Advisory Contracts.At its September 2019 meeting, the Board, including the Independent Trustees, unanimously determined to renew the fund's Advisory Contracts. In addition, the Board approved amendments to the fund's sub-advisory agreement with PGIM to add certain exceptions to the most favored nation provision, implement a new fee schedule, effective April 1, 2019, and make other non-material amendments to the agreement. The Board noted that the new fee schedule is expected to result in a decrease of less than 0.5 basis points in the total management fee rate of the fund. The Board noted that the other terms of the amended sub-advisory agreement are not materially different from those of the existing sub-advisory agreement with PGIM. The Board also noted that the amended sub-advisory agreement with PGIM would not result in changes to the nature, extent, and quality of the services that PGIM provides to the fund.In reaching its determination to renew the fund's Advisory Contracts and approve the amendments to the sub-advisory agreement described above (Amendments), the Board considered all factors it believed relevant, including (i) the nature, extent, and quality of the services provided to the fund and its shareholders (including the investment performance of the fund); (ii) the competitiveness of the fund's management fee and total expenses relative to peer funds; (iii) the total costs of the services provided by and the profits, if any, realized by Strategic Advisers from its relationships with the fund; and (iv) the extent to which, if any, economies of scale exist and are realized as the fund grows and whether any economies of scale are appropriately shared with fund shareholders.In considering whether to renew the Advisory Contracts for the fund and approve the Amendments, the Board reached a determination, with the assistance of fund counsel and Independent Trustees' counsel and through the exercise of its business judgment, that the renewal of the Advisory Contracts and the approval of the Amendments is in the best interests of the fund and its shareholders. In addition, with respect to the Sub-Advisory Agreements, the Board also concluded that the renewal of such agreements and the approval of the Amendments do not involve a conflict of interest from which Strategic Advisers or its affiliates derive an inappropriate advantage. Also, the Board found that the advisory fees charged under the Advisory Contracts bear a reasonable relationship to the services rendered and are based on services provided that are in addition to, rather than duplicative of, services provided under the advisory contract of any underlying fund in which the fund may invest. The Board's decision to renew the Advisory Contracts and approve the Amendments was not based on any single factor, but rather was based on a comprehensive consideration of all the information provided to the Board throughout the year. Nature, Extent, and Quality of Services Provided. The Board considered the staffing within the Investment Advisers, including the backgrounds of the fund's investment personnel and also considered the fund's investment objective, strategies, and related investment philosophy. The Independent Trustees also had discussions with senior management of Strategic Advisers' investment operations and investment groups. The Board considered the structure of each Investment Adviser's investment personnel compensation program and whether such structures provide appropriate incentives to act in the best interests of the fund.The Trustees also discussed with representatives of Strategic Advisers, at meetings throughout the year, Strategic Advisers' role in, among other things, (i) setting, implementing and monitoring the investment strategies for the funds; (ii) identifying and recommending sub-advisers for the funds; (iii) overseeing compliance with federal securities laws by each sub-adviser with respect to the portion of fund assets allocated to the sub-adviser; (iv) monitoring and overseeing the performance and investment capabilities of each sub-adviser; and (v) recommending the replacement of a sub-adviser as appropriate. The Trustees considered that the Board had received from Strategic Advisers substantial information and periodic reports about Strategic Advisers' sub-adviser oversight and due diligence processes, as well as periodic reports regarding the performance of each sub-adviser.The Board also considered the nature, extent and quality of services provided by each Sub-Adviser. The Trustees noted that under the Sub-Advisory Agreements subject to oversight by Strategic Advisers, each Sub-Adviser is responsible for, among other things, identifying investments for the portion of fund assets allocated to the Sub-Adviser, if any, and executing portfolio transactions to implement its investment strategy. In addition, the Trustees noted that each Sub-Adviser is responsible for providing such reporting as may be requested from Strategic Advisers to fulfill its oversight responsibilities discussed above. Resources Dedicated to Investment Management and Support Services. The Board reviewed the general qualifications and capabilities of the Investment Advisers' investment staffs, their use of technology, and the Investment Advisers' approach to managing and compensating investment personnel. The Board noted that the Investment Advisers' analysts have extensive resources, tools, and capabilities that allow them to conduct sophisticated quantitative and/or fundamental analysis. Additionally, in its deliberations, the Board considered the Investment Advisers' trading capabilities and resources and global compliance infrastructure, which are integral parts of the investment management process. Shareholder and Administrative Services. The Board considered (i) the nature, extent, quality, and cost of administrative and shareholder services performed by Strategic Advisers and its affiliates under the management contract and under separate agreements covering transfer agency, pricing and bookkeeping, and securities lending services for the fund; (ii) the nature and extent of Strategic Advisers' supervision of third party service providers, including sub-advisers, custodians and subcustodians; and (iii) the resources devoted to, and the record of compliance with, the fund's compliance policies and procedures. Investment Performance. The Board considered whether the fund has operated in accordance with its investment objective, as well as its record of compliance with its investment restrictions and its performance history.In connection with the renewal of the Advisory Contracts, the Board considered annualized return information for the fund for different time periods, measured against an appropriate securities market index ("benchmark index") and a peer group of mutual funds with similar objectives ("peer group").The Board considered discussions that occur at Board meetings throughout the year with representatives of Strategic Advisers about fund investment performance and the performance of each Sub-Adviser as part of regularly scheduled fund reviews and other reports to the Board on fund performance, taking into account various factors including general market conditions. In its discussions with representatives of Strategic Advisers regarding fund performance, the Board gave particular attention to information indicating underperformance of certain funds for specific time periods and discussed with Strategic Advisers the reasons for any such underperformance.The following charts considered by the Board show, over the one-, three-, and five-year periods ended December 31, 2018, the cumulative total returns of the fund and the cumulative total returns of an appropriate benchmark index and peer group. The box within each chart shows the 25th percentile return (75% beaten, top of box) and the 75th percentile return (25% beaten, bottom of box) of the peer group. Returns shown above the box are in the first quartile and returns shown below the box are in the fourth quartile. The percentage beaten number noted below each chart corresponds to the percentile box and represents the percentage of funds in the peer group whose performance was equal to or lower than that of the fund.Strategic Advisers Core Income Fund

Strategic Advisers Core Income Fund

Liquidity Risk Management Program
The Securities and Exchange Commission adopted Rule 22e-4 under the Investment Company Act of 1940 (the Liquidity Rule) to promote effective liquidity risk management throughout the open-end investment company industry, thereby reducing the risk that funds will be unable to meet their redemption obligations and mitigating dilution of the interests of fund shareholders.
The Fund has adopted and implemented a liquidity risk management program (the Program) reasonably designed to assess and manage the Fund’s liquidity risk and to comply with the requirements of the Liquidity Rule. The Fund’s Board of Trustees (the Board) has designated the Fund’s investment adviser as administrator of the Program. Strategic Advisers has established a Liquidity Risk Management Committee (the LRM Committee) to manage the Program for each of the Funds. The LRM Committee monitors the adequacy and effectiveness of implementation of the Program and on a periodic basis assesses each Fund’s liquidity risk based on a variety of factors including (1) the Fund’s investment strategy, (2) portfolio liquidity and cash flow projections during normal and reasonably foreseeable stressed conditions, (3) shareholder redemptions and (4) borrowings and other funding sources, as applicable.
In accordance with the Program, each of the Fund’s portfolio investments is classified into one of four liquidity categories described below based on a determination of a reasonable expectation for how long it would take to convert the investment to cash (or sell or dispose of the investment) without significantly changing its market value.
- Highly liquid investments – cash or convertible to cash within three business days or less
- Moderately liquid investments – convertible to cash in three to seven calendar days
- Less liquid investments – can be sold or disposed of, but not settled, within seven calendar days
- Illiquid investments – cannot not be sold or disposed of within seven calendar days
Liquidity classification determinations take into account a variety of factors including various market, trading and investment-specific considerations, as well as market depth, and generally utilize analysis from a third-party liquidity metrics service.
The Liquidity Rule places a 15% limit on a fund’s illiquid investments and requires funds that do not primarily hold assets that are highly liquid investments to determine and maintain a minimum percentage of the fund’s net assets to be invested in highly liquid investments (highly liquid investment minimum or HLIM). The Program includes provisions reasonably designed to comply with the 15% limit on illiquid investments and for determining, periodically reviewing and complying with the HLIM requirement as applicable.
At a recent meeting of the Fund’s Board of Trustees, the LRM Committee provided a written report to the Board pertaining to the operation, adequacy, and effectiveness of implementation of the Program for the annual period from December 1, 2018 through November 30, 2019. The report concluded that the Program has been implemented and is operating effectively and is reasonably designed to assess and manage the Fund’s liquidity risk.
![]()
SSC-ANN-0420
1.912891.109
Item 2.
Code of Ethics
As of the end of the period, February 29, 2020, Fidelity Rutland Square Trust II (the trust) has adopted a code of ethics, as defined in Item 2 of Form N-CSR, that applies to its President and Treasurer and its Chief Financial Officer. A copy of the code of ethics is filed as an exhibit to this Form N-CSR.
Item 3.
Audit Committee Financial Expert
The Board of Trustees of the trust has determined that Heidi L. Steiger is an audit committee financial expert, as defined in Item 3 of Form N-CSR. Ms. Steiger is independent for purposes of Item 3 of Form N-CSR.
Item 4.
Principal Accountant Fees and Services
Fees and Services
The following table presents fees billed by PricewaterhouseCoopers LLP (“PwC”) in each of the last two fiscal years for services rendered to Strategic Advisers Core Income Fund, Strategic Advisers Emerging Markets Fund, Strategic Advisers Fidelity International Fund, Strategic Advisers Income Opportunities Fund, Strategic Advisers International Fund and Strategic Advisers Small-Mid Cap Fund (the “Funds”):
Services Billed by PwC
February 29, 2020 FeesA
| | Audit Fees | Audit-Related Fees | Tax Fees | All Other Fees |
| | | | | |
| Strategic Advisers Core Income Fund | $49,800 | $4,100 | $4,000 | $9,600 |
| Strategic Advisers Emerging Markets Fund | $36,600 | $2,300 | $2,900 | $5,500 |
| Strategic Advisers Fidelity International Fund | $44,200 | $3,800 | $4,200 | $9,000 |
| Strategic Advisers Income Opportunities Fund | $29,000 | $2,300 | $2,900 | $5,400 |
| Strategic Advisers International Fund | $44,700 | $3,900 | $4,200 | $9,100 |
| Strategic Advisers Small-Mid Cap Fund | $47,000 | $3,900 | $4,000 | $9,000 |
February 28, 2019 FeesA
| | Audit Fees | Audit-Related Fees | Tax Fees | All Other Fees |
| | | | | |
| Strategic Advisers Core Income Fund | $50,000 | $3,900 | $4,000 | $7,700 |
| Strategic Advisers Emerging Markets Fund | $27,000 | $2,200 | $3,600 | $4,300 |
| Strategic Advisers Fidelity International Fund | $47,000 | $3,700 | $4,200 | $7,300 |
| Strategic Advisers Income Opportunities Fund | $27,000 | $2,200 | $3,000 | $4,300 |
| Strategic Advisers International Fund | $47,000 | $3,800 | $4,200 | $7,300 |
| Strategic Advisers Small-Mid Cap Fund | $47,000 | $3,700 | $4,000 | $7,300 |
A Amounts may reflect rounding.
The following table(s) present(s) fees billed by PwC that were required to be approved by the Audit Committee for services that relate directly to the operations and financial reporting of the Fund(s) and that are rendered on behalf of Strategic Advisers, LLC (“Strategic Advisers”) and entities controlling, controlled by, or under common control with Strategic Advisers (not including any sub-adviser whose role is primarily portfolio management and is subcontracted with or overseen by another investment adviser) that provide ongoing services to the Fund(s) (“Fund Service Providers”):
Services Billed by PwC
| | February 29, 2020A | February 28, 2019A |
| Audit-Related Fees | $7,927,700 | $7,930,000 |
| Tax Fees | $28,000 | $15,000 |
| All Other Fees | $- | $- |
A Amounts may reflect rounding.
“Audit-Related Fees” represent fees billed for assurance and related services that are reasonably related to the performance of the fund audit or the review of the fund's financial statements and that are not reported under Audit Fees.
“Tax Fees” represent fees billed for tax compliance, tax advice or tax planning that relate directly to the operations and financial reporting of the fund.
“All Other Fees” represent fees billed for services provided to the fund or Fund Service Provider, a significant portion of which are assurance related, that relate directly to the
operations and financial reporting of the fund, excluding those services that are reported under Audit Fees, Audit-Related Fees or Tax Fees.
Assurance services must be performed by an independent public accountant.
* * *
The aggregate non-audit fees billed by PwC for services rendered to the Fund(s), Strategic Advisers (not including any sub-adviser whose role is primarily portfolio management and is subcontracted with or overseen by another investment adviser), and any Fund Service Provider for each of the last two fiscal years of the Fund(s) are as follows:
| Billed By | February 29, 2020A | February 28, 2019A |
| PwC | $12,683,500 | $11,200,000 |
A Amounts may reflect rounding.
The trust's Audit Committee has considered non-audit services that were not pre-approved that were provided by PwC to Fund Service Providers to be compatible with maintaining the independence of PwC in its(their) audit of the Fund(s), taking into account representations from PwC, in accordance with Public Company Accounting Oversight Board rules, regarding its independence from the Fund(s) and its(their) related entities and Strategic Advisers’s review of the appropriateness and permissibility under applicable law of such non-audit services prior to their provision to the Fund(s) Service Providers.
Audit Committee Pre-Approval Policies and Procedures
The trust’s Audit Committee must pre-approve all audit and non-audit services provided by a fund’s independent registered public accounting firm relating to the operations or financial reporting of the fund. Prior to the commencement of any audit or non-audit services to a fund, the Audit Committee reviews the services to determine whether they are appropriate and permissible under applicable law.
The Audit Committee has adopted policies and procedures to, among other purposes, provide a framework for the Committee’s consideration of non-audit services by the audit firms that audit the Fidelity funds. The policies and procedures require that any non-audit service provided by a fund audit firm to a Fidelity fund and any non-audit service provided by a fund auditor to a Fund Service Provider that relates directly to the operations and financial reporting of a Fidelity fund (“Covered Service”) are subject to approval by the Audit Committee before such service is provided.
All Covered Services must be approved in advance of provision of the service either: (i) by formal resolution of the Audit Committee, or (ii) by oral or written approval of the service by the Chair of the Audit Committee (or if the Chair is unavailable, such other
member of the Audit Committee as may be designated by the Chair to act in the Chair’s absence). The approval contemplated by (ii) above is permitted where the Treasurer determines that action on such an engagement is necessary before the next meeting of the Audit Committee.
Non-audit services provided by a fund audit firm to a Fund Service Provider that do not relate directly to the operations and financial reporting of a Fidelity fund are reported to the Audit Committee periodically.
Non-Audit Services Approved Pursuant to Rule 2-01(c)(7)(i)(C) and (ii) of Regulation S-X (“De Minimis Exception”)
There were no non-audit services approved or required to be approved by the Audit Committee pursuant to the De Minimis Exception during the Fund’s(s’) last two fiscal years relating to services provided to (i) the Fund(s) or (ii) any Fund Service Provider that relate directly to the operations and financial reporting of the Fund(s).
Item 5.
Audit Committee of Listed Registrants
Not applicable.
Item 6.
Investments
(a)
Not applicable.
(b)
Not applicable.
Item 7.
Disclosure of Proxy Voting Policies and Procedures for Closed-End Management Investment Companies
Not applicable.
Item 8.
Portfolio Managers of Closed-End Management Investment Companies
Not applicable.
Item 9.
Purchase of Equity Securities by Closed-End Management Investment Company and Affiliated Purchasers
Not applicable.
Item 10.
Submission of Matters to a Vote of Security Holders
There were no material changes to the procedures by which shareholders may recommend nominees to the trust’s Board of Trustees.
Item 11.
Controls and Procedures
(a)(i) The President and Treasurer and the Chief Financial Officer have concluded that the trust’s disclosure controls and procedures (as defined in Rule 30a-3(c) under the Investment Company Act) provide reasonable assurances that material information relating to the trust is made known to them by the appropriate persons, based on their evaluation of these controls and procedures as of a date within 90 days of the filing date of this report.
(a)(ii) There was no change in the trust’s internal control over financial reporting (as defined in Rule 30a-3(d) under the Investment Company Act) that occurred during the period covered by this report that has materially affected, or is reasonably likely to materially affect, the trust’s internal control over financial reporting.
Item 12.
Disclosure of Securities Lending Activities for Closed-End Management
Investment Companies
Not applicable.
Item 13.
Exhibits
| (a) | (1) | Code of Ethics pursuant to Item 2 of Form N-CSR is filed and attached hereto as EX-99.CODE ETH. |
| (a) | (2) | |
| (a) | (3) | Not applicable. |
| (b) | |
SIGNATURES
Pursuant to the requirements of the Securities Exchange Act of 1934 and the Investment Company Act of 1940, the registrant has duly caused this report to be signed on its behalf by the undersigned, thereunto duly authorized.
Fidelity Rutland Square Trust II
| By: | /s/Stacie M. Smith |
| | Stacie M. Smith |
| | President and Treasurer |
| | |
| Date: | April 21, 2020 |
Pursuant to the requirements of the Securities Exchange Act of 1934 and the Investment Company Act of 1940, this report has been signed below by the following persons on behalf of the registrant and in the capacities and on the dates indicated.
| By: | /s/Stacie M. Smith |
| | Stacie M. Smith |
| | President and Treasurer |
| | |
| Date: | April 21, 2020 |
| By: | /s/John J. Burke III |
| | John J. Burke III |
| | Chief Financial Officer |
| | |
| Date: | April 21, 2020 |
Exhibit EX-99.CERT
I, Stacie M. Smith, certify that:
1.
I have reviewed this report on Form N-CSR of Fidelity Rutland Square Trust II;
2.
Based on my knowledge, this report does not contain any untrue statement of a material fact or omit to state a material fact necessary to make the statements made, in light of the circumstances under which such statements were made, not misleading with respect to the period covered by this report;
3.
Based on my knowledge, the financial statements, and other financial information included in this report, fairly present in all material respects the financial condition, results of operations, changes in net assets, and cash flows (if the financial statements are required to include a statement of cash flows) of the registrant as of, and for, the periods presented in this report;
4.
The registrant's other certifying officer(s) and I are responsible for establishing and maintaining disclosure controls and procedures (as defined in Rule 30a-3(c) under the Investment Company Act of 1940) and internal control over financial reporting (as defined in Rule 30a-3(d) under the Investment Company Act of 1940) for the registrant and have:
a.
Designed such disclosure controls and procedures, or caused such disclosure controls and procedures to be designed under our supervision, to ensure that material information relating to the registrant, including its consolidated subsidiaries, is made known to us by others within those entities, particularly during the period in which this report is being prepared;
b.
Designed such internal control over financial reporting, or caused such internal control over financial reporting to be designed under our supervision, to provide reasonable assurance regarding the reliability of financial reporting and the preparation of financial statements for external purposes in accordance with generally accepted accounting principles;
c.
Evaluated the effectiveness of the registrant's disclosure controls and procedures and presented in this report our conclusions about the effectiveness of the disclosure controls and procedures, as of a date within 90 days prior to the filing date of this report based upon such evaluation; and
d.
Disclosed in this report any change in the registrant’s internal control over financial reporting that occurred during the period covered by this report that has materially affected, or is reasonably likely to materially affect, the registrant’s internal control over financial reporting; and
5.
The registrant's other certifying officer(s) and I have disclosed to the registrant's auditors and the audit committee of the registrant's board of directors (or persons performing the equivalent functions):
a.
All significant deficiencies and material weaknesses in the design or operation of internal control over financial reporting which are reasonably likely to adversely affect the registrant's ability to record, process, summarize, and report financial information; and
b.
Any fraud, whether or not material, that involves management or other employees who have a significant role in the registrant's internal control over financial reporting.
Date:
April 21, 2020
/s/Stacie M. Smith |
Stacie M. Smith |
President and Treasurer |
I, John J. Burke III, certify that:
1.
I have reviewed this report on Form N-CSR of Fidelity Rutland Square Trust II;
2.
Based on my knowledge, this report does not contain any untrue statement of a material fact or omit to state a material fact necessary to make the statements made, in light of the circumstances under which such statements were made, not misleading with respect to the period covered by this report;
3.
Based on my knowledge, the financial statements, and other financial information included in this report, fairly present in all material respects the financial condition, results of operations, changes in net assets, and cash flows (if the financial statements are required to include a statement of cash flows) of the registrant as of, and for, the periods presented in this report;
4.
The registrant's other certifying officer(s) and I are responsible for establishing and maintaining disclosure controls and procedures (as defined in Rule 30a-3(c) under the Investment Company Act of 1940) and internal control over financial reporting (as defined in Rule 30a-3(d) under the Investment Company Act of 1940) for the registrant and have:
a.
Designed such disclosure controls and procedures, or caused such disclosure controls and procedures to be designed under our supervision, to ensure that material information relating to the registrant, including its consolidated subsidiaries, is made known to us by others within those entities, particularly during the period in which this report is being prepared;
b.
Designed such internal control over financial reporting, or caused such internal control over financial reporting to be designed under our supervision, to provide reasonable assurance regarding the reliability of financial reporting and the preparation of financial statements for external purposes in accordance with generally accepted accounting principles;
c.
Evaluated the effectiveness of the registrant's disclosure controls and procedures and presented in this report our conclusions about the effectiveness of the disclosure controls and procedures, as of a date within 90 days prior to the filing date of this report based upon such evaluation; and
d.
Disclosed in this report any change in the registrant’s internal control over financial reporting that occurred during the period covered by this report that has materially affected, or is reasonably likely to materially affect, the registrant’s internal control over financial reporting; and
5.
The registrant's other certifying officer(s) and I have disclosed to the registrant's auditors and the audit committee of the registrant's board of directors (or persons performing the equivalent functions):
a.
All significant deficiencies and material weaknesses in the design or operation of internal control over financial reporting which are reasonably likely to adversely affect the registrant's ability to record, process, summarize, and report financial information; and
b.
Any fraud, whether or not material, that involves management or other employees who have a significant role in the registrant's internal control over financial reporting.
Date:
April 21, 2020
/s/John J. Burke III |
John J. Burke III |
Chief Financial Officer |
Exhibit EX-99.906CERT
Certification Pursuant to Section 906 of the Sarbanes-Oxley Act of 2002 (subsections (a) and (b) of section 1350, chapter 63 of title 18, United States Code)
In connection with the attached Report of Fidelity Rutland Square Trust II (the “Trust”) on Form N-CSR to be filed with the Securities and Exchange Commission (the “Report”), each of the undersigned officers of the Trust does hereby certify that, to the best of such officer’s knowledge:
1.
The Report fully complies with the requirements of 13(a) or 15(d) of the Securities Exchange Act of 1934; and
2.
The information contained in the Report fairly presents, in all material respects, the financial condition and results of operations of the Trust as of, and for, the periods presented in the Report.
Dated: April 21, 2020
/s/Stacie M. Smith |
Stacie M. Smith |
President and Treasurer |
Dated: April 21, 2020
/s/John J. Burke III |
John J. Burke III |
Chief Financial Officer |
A signed original of this written statement required by Section 906, or other document authenticating, acknowledging, or otherwise adopting the signature that appears in typed form within the electronic version of this written statement required by Section 906, has been provided to the Trust and will be retained by the Trust and furnished to the Securities and Exchange Commission or its staff upon request.
EXHIBIT EX-99.CODE ETH
FIDELITY RUTLAND SQUARE TRUST II
CODE OF ETHICS FOR PRESIDENT, TREASURER
AND CHIEF FINANCIAL OFFICER
I. Purpose of the Code/Covered Officers
This document constitutes the Code of Ethics (the “Code”) adopted by Fidelity Rutland Square Trust II (the “Trust”) pursuant to the provisions of Rule 30b2-1(a) under the Investment Company Act of 1940, which Rule implements Sections 406 of the Sarbanes-Oxley Act of 2002 with respect to registered investment companies. The Code applies to the Trust’s President and Treasurer, and Chief Financial Officer (the “Covered Officers”). Fidelity’s Ethics Office (the “Ethics Office”), a part of Fidelity Corporate Compliance Group within Core Compliance, administers the Code.
The purposes of the Code are to deter wrongdoing and to promote, on the part of the Covered Officers:
·
honest and ethical conduct, including the ethical handling of actual or apparent conflicts of interest between personal and professional relationships;
·
full, fair, accurate, timely and understandable disclosure in reports and documents that the funds of the Trust submit to the Securities and Exchange Commission (“SEC”), and in other public communications by the funds of the Trust;
·
compliance with applicable laws and governmental rules and regulations;
·
the prompt internal reporting to an appropriate person or persons identified in the Code of violations of the Code; and
·
accountability for adherence to the Code.
Each Covered Officer should adhere to a high standard of business ethics and should be sensitive to situations that may give rise to actual as well as apparent conflicts of interest.
II. Covered Officers Should Handle Ethically Actual and Apparent Conflicts of Interest
Overview. A “conflict of interest” occurs when a Covered Officer’s private interest interferes with the interests of, or his service to, the Trust. For example, a conflict of interest would arise if a Covered Officer, or a member of his family, receives improper personal benefits as a result of his position with the Trust.
Certain conflicts of interest arise out of the relationships between Covered Officers and the Trust and already are subject to conflict of interest provisions in the Investment Company Act of 1940 (the “Investment Company Act”) and the Investment Advisers Act of 1940 (the “Investment Advisers Act”). For example, Covered Officers may not individually engage in certain transactions (such as the purchase or sale of securities or other property) with a fund of the Trust because of their status as “affiliated persons” of the Trust. Separate compliance programs and procedures of the Trust, Strategic Advisers, Inc. (“Strategic”) and the other Fidelity companies are designed to prevent, or identify and correct, violations of these provisions. This Code does not, and is not intended to, repeat or replace these programs and procedures, and such conflicts fall outside of the parameters of this Code.
Although typically not presenting an opportunity for improper personal benefit, conflicts arise from, or as a result of, the contractual relationship between the Trust and Strategic (or another Fidelity company) of which the Covered Officers are also officers or employees. As a result, this Code recognizes that the Covered Officers will, in the normal course of their duties (whether formally for the Trust, Strategic or another Fidelity company), be involved in establishing policies and implementing decisions that have different effects on the Trust, Strategic and other Fidelity companies. The participation of the Covered Officers in such activities is inherent in the contractual relationship between the Trust and Strategic (or another Fidelity company), and is consistent with the performance by the Covered Officers of their duties as officers of the Trust. Thus, if performed in conformity with the provisions of the Investment Company Act and the Investment Advisers Act, such activities will be deemed to have been handled ethically. In addition, it is recognized by the Trust’s Board of Trustees (“Board”) that the Covered Officers also may be officers or employees of one or more other Trusts covered by this Code.
Other conflicts of interest are covered by the Code, even if such conflicts of interest are not subject to provisions in the Investment Company Act and the Investment Advisers Act. The following list provides examples of conflicts of interest under the Code, but Covered Officers should keep in mind that these examples are not exhaustive. The overarching principle is that the personal interest of a Covered Officer should not be placed improperly before the interest of the Trust.
* * *
Each Covered Officer must:
·
not use his or her personal influence or personal relationships improperly to influence investment decisions or financial reporting by any fund of the Trust whereby the Covered Officer would benefit personally to the detriment of the Trust;
·
not cause a fund of the Trust to take action, or fail to take action, for the individual personal benefit of the Covered Officer rather than the benefit of the Trust;
·
not engage in any outside business activity, including serving as a director or trustee, that prevents the Covered Officer from devoting appropriate time and attention to the Covered Officer’s responsibilities with the Trust;
·
not have a consulting or employment relationship with any of the Trust’s service providers that are not affiliated with Fidelity; and
·
not retaliate against any employee or Covered Officer for reports of actual or potential misconduct, which are made in good faith.
With respect to other fact patterns, if a Covered Officer is in doubt, other potential conflict of interest situations should be described immediately to the Ethics Office for resolution. Similarly, any questions a Covered Officer has generally regarding the application or interpretation of the Code should be directed to the Ethics Office immediately.
III. Disclosure and Compliance
·
Each Covered Officer should familiarize himself with the disclosure requirements generally applicable to the Trust.
·
Each Covered Officer should not knowingly misrepresent, or cause others to misrepresent, facts about any fund of the Trust to others, whether within or outside Fidelity, including to the Trust’s Board of Trustees (the “Board”) and auditors, and to governmental regulators and self-regulatory organizations;
·
Each Covered Officer should, to the extent appropriate within his area of responsibility, consult with other officers and employees of the Trust, Strategic and the Fidelity service providers, and with the Board’s Audit Committee, with the goal of promoting full, fair, accurate, timely and understandable disclosure in the reports and documents the funds of the Trust file with, or submit to, the SEC and in other public communications made by the funds of the Trust; and
·
It is the responsibility of each Covered Officer to promote compliance with the standards and restrictions imposed by applicable laws, rules and regulations.
IV. Reporting and Accountability
Each Covered Officer must:
·
upon receipt of the Code, and annually thereafter, submit to the Ethics Office an acknowledgement stating that he or she has received, read, and understands the Code; and
·
notify the Ethics Office promptly if he or she knows of any violation of the Code. Failure to do so is itself a violation of this Code.
The Ethics Office shall take all action it considers appropriate to investigate any actual or potential violations reported to it. Upon completion of the investigation, if necessary, the matter will be reviewed with senior management or other appropriate parties, and a determination will be made as to whether any action should be taken as detailed below. The Covered Officer will be informed of any action determined to be appropriate. The Ethics Office will inform the Personal Trading Committee of all Code violations and actions taken in response. Without implied limitation, appropriate remedial, disciplinary or preventive action may include a written warning, a letter of censure, suspension, dismissal or, in the event of criminal or other serious violations of law, notification of the SEC or other appropriate law enforcement authorities. Additionally, other legal remedies may be pursued.
The policies and procedures described in the Code do not create any obligations to any person or entity other than the Trust. The Code is intended solely for the internal use by the Trust and does not constitute a promise, contract or an admission by, or on behalf of, the Trust as to any fact, circumstance, or legal conclusion. The Trust, the Fidelity companies and the Fidelity Chief Ethics Officer retain the discretion to decide whether the Code applies to a specific situation, and how it should be interpreted.
V. Oversight
Material violations of this Code will be reported promptly by Strategic to the Board’s Audit Committee. In addition, at least once each year, Strategic will provide a written report to the Board, which describes any issues arising under the Code since the last report to the Board, including, but not limited to, information about material violations of the Code and action taken in response to the material violations.
VI. Other Policies and Procedures
This Code shall be the sole code of ethics adopted by the Trust for purposes of Section 406 of the Sarbanes-Oxley Act and the rules and forms applicable to registered investment companies thereunder. Other Fidelity policies or procedures that cover the behavior or activities of Covered Officers are separate requirements applying to the Covered Officers (and others), and are not part of this Code.
VII. Amendments
Any material amendments or changes to this Code must be approved or ratified by a majority vote of the Board, including a majority of the Trustees who are not interested persons of the Trust.
VIII. Records and Confidentiality
Records of any violation of the Code and of the actions taken as a result of such violations will be kept by the Ethics Office. All reports and records prepared or maintained pursuant to this Code will be considered confidential and shall be maintained and protected accordingly. Except as otherwise required by law or this Code, such matters shall not be disclosed to anyone other than the Ethics Office, the Personal Trading Committee, the Board, appropriate personnel at the relevant Fidelity company or companies and the legal counsel of any or all of the foregoing.
Serious News for Serious Traders! Try StreetInsider.com Premium Free!
You May Also Be Interested In
- NV Gold Announces Secured Loan Terms
- Almonty Closes Additional Tranches of Private Placement
- Tocvan Provides Corporate Update
Create E-mail Alert Related Categories
SEC FilingsSign up for StreetInsider Free!
Receive full access to all new and archived articles, unlimited portfolio tracking, e-mail alerts, custom newswires and RSS feeds - and more!
