

Form N-CSR ETF Series Solutions For: Oct 31
 Tweet
Tweet Share
ShareUNITED STATES
SECURITIES AND EXCHANGE COMMISSION
Washington, D.C. 20549
SECURITIES AND EXCHANGE COMMISSION
Washington, D.C. 20549
FORM N-CSR
CERTIFIED SHAREHOLDER REPORT OF REGISTERED
MANAGEMENT INVESTMENT COMPANIES
Investment Company Act file number 811-22668
ETF Series Solutions
(Exact name of registrant as specified in charter)
(Exact name of registrant as specified in charter)
615 East Michigan Street
Milwaukee, WI 53202
(Address of principal executive offices) (Zip code)
(Address of principal executive offices) (Zip code)
Paul R. Fearday
ETF Series Solutions
615 East Michigan Street
Milwaukee, WI 53202
(Name and address of agent for service)
(Name and address of agent for service)
(414) 765-5346
Registrant's telephone number, including area code
Date of fiscal year end: October 31
Date of reporting period: October 31, 2018
Item 1. Reports to Stockholders.
Annual Report
October 31, 2018
AAM S&P 500 High Dividend Value ETF
Ticker: SPDV
AAM S&P Emerging Markets
High Dividend Value ETF
Ticker: EEMD
AAM ETFs
TABLE OF CONTENTS
|
Page
|
||
|
Management of Discussion of Fund Performance
|
1
|
|
|
Performance Summaries
|
3
|
|
|
Portfolio Allocations
|
5
|
|
|
Schedules of Investments
|
6
|
|
|
Statements of Assets and Liabilities
|
12
|
|
|
Statements of Operations
|
13
|
|
|
Statements of Changes in Net Assets
|
14
|
|
|
Financial Highlights
|
16
|
|
|
Notes to Financial Statements
|
18
|
|
|
Report of Independent Registered Public Accounting Firm
|
27
|
|
|
Trustees and Officers
|
28
|
|
|
Expense Examples
|
30
|
|
|
Federal Tax Information
|
32
|
|
|
Federal Tax Credit Pass Through
|
32
|
|
|
Information About Portfolio Holdings
|
33
|
|
|
Information About Proxy Voting
|
33
|
|
|
Frequency Distribution of Premiums and Discounts
|
33
|
AAM ETFs
MANAGEMENT’S DISCUSSION OF FUND PERFORMANCE
(Unaudited)
The AAM S&P 500 High Dividend Value ETF
The AAM S&P 500 High Dividend Value ETF (“SPDV” or the “Fund”) seeks to track the total return performance, before fees and expenses, of its underlying index, the S&P 500 Dividend and Free Cash Flow Yield Index (the “Index”). Through the Index, SPDV, is passively managed using a rules-based, equal-weighted strategy that is designed to provide exposure to constituents of the S&P 500® Index that exhibit both high dividend yield and sustainable dividend distribution characteristics, while maintaining a diversified sector exposure.
For the period November 28, 2017 to October 31, 2018 (the annual “Period”), the U.S. equity market, represented by the S&P 500 index, gained 5.02%. Concerns of trade war with China, and the U.S. Federal Reserve (“Fed”) raising interest rates, created a challenging environment for equity markets for the Period. That said, SPDV generated a total return (NAV) of 5.98% and 6.15% (market price) over the same Period, while the underlying Index for SPDV generated a total return of 6.29%.
The top performing sectors contributing to SPDV’s return during the period were consumer discretionary, industrials and utilities. Worst performing sectors were financials, materials and health care.
Individual leaders contributing to SPDV’s return over the Period were Kohl’s (115 bps), WW Grainger (112 bps) and Macy’s (98 bps). The individual performance laggards over the Period were Western Digital (-109 bps), Principal Financial Group (-70 bps) and Cummins (-55 bps).
The AAM S&P Emerging Markets High Dividend Value ETF
The AAM S&P Emerging Markets High Dividend Value ETF (“EEMD” or the “Fund”) seeks to track the total return performance, before fees and expenses, of its underlying index, the S&P Emerging Markets Dividend and Free Cash Flow Yield Index (the “Index”). Through the Index, EEMD, is passively managed using a rules-based, equal-weighted strategy that is designed to provide exposure to constituents of the S&P Emerging Plus LargeMidCap® Index that exhibit both high dividend yield and sustainable dividend distribution characteristics, while maintaining a diversified sector exposure.
During the Period, emerging market equities continued their downward trend for the year. Historically, U.S. Federal Reserve (“Fed”) interest rate hikes often indicate a short-term decline in foreign currencies relative to the US dollar ($), all else being equal. Steady interest rate hikes throughout the Period helped contribute to international equites being out of favor relative to US equities.
EEMD generated a total return of -9.65% (NAV) and -9.19% (market price) over the Period. This compares to the -8.68% total return of the Index, and -14.34% total return of the benchmark index, the S&P Emerging Plus LargeMidCap® Index, for the same Period.
1
AAM ETFs
MANAGEMENT’S DISCUSSION OF FUND PERFORMANCE
(Unaudited) (Continued)
Top performing sectors contributing to EEMD’s return over the Period were materials, real estate and utilities. Worst performing sectors included consumer discretionary, information technology and health care.
Individual leaders contributing to EEMD’s return were CIA Energetica Minas (67 bps), China Vanke (54 bps) and Alrosa PJSC (47 bps). The individual performance laggards over the Period were Cheng UEI Precision Industry (-127 bps), Astro Malaysia (-104 bps) and BAIC Motor Corp (-89 bps).
Must be preceded or accompanied by a prospectus.
The AAM S&P 500 High Dividend Value ETF and AAM S&P Emerging Markets High Dividend Value ETF are distributed by Quasar Distributors, LLC.
Investing involves risk, including the possible loss of principal. Shares of any ETF are bought and sold at market price (not NAV) and may trade at a discount or premium to NAV. Shares are not individually redeemable from the Funds and may be only be acquired or redeemed from the Funds in creation units. Brokerage commissions will reduce returns. Companies with high yield or payout ratio may underperform other securities in certain market conditions and reduce or discontinue paying dividends entirely while included in the index. The Funds return may not match or achieve a high degree of correlation with the return of the underlying Index. To the extent the Funds utilize a sampling approach, they may experience tracking error to a greater extent than if the Funds had sought to replicate the Index. Investments in foreign securities involve political, economic and currency risks, greater volatility and differences in accounting methods. These risks are greater for emerging markets investments. Investments in mid-cap companies may involve less liquidity and greater volatility than larger companies. Diversification does not assure a profit or protect against a loss in a declining market.
S&P 500 Dividend and Free Cash Flow Yield index is a rules-based, equal-weighted index that is designed to provide exposure to the constituents of the S&P 500® Index that exhibit both high dividend yield and sustainable dividend distribution characteristics, while maintaining diversified sector exposure.
S&P 500® Index is a widely recognized capitalization-weighted index of 500 common stock prices in U.S. companies.
S&P Emerging Markets Dividend and Free Cash Flow Yield Index is rules-based, equal-weighted index that is designed to provide exposure to the constituents of the S&P Emerging Plus LargeMidCap® Index that exhibit both high dividend yield and sustainable dividend distribution characteristics, while maintaining diversified sector exposure.
S&P Emerging Plus LargeMidCap® Index is designed to measure the performance of large- and mid-capitalization securities in emerging markets.
Basis Point (bps) refers to a unit of measurement for interest rates and other percentages. One basis point is equal to 1/100th of 1%, or 0.01%.
It is not possible to invest directly in an index.
For a complete list of Fund holdings please see the schedule of investments on page 7 of the report. Fund holdings and sector allocations are subject to change and should not be considered a recommendation to buy or sell any security.
2
AAM S&P 500 High Dividend Value ETF
PERFORMANCE SUMMARY
(Unaudited)
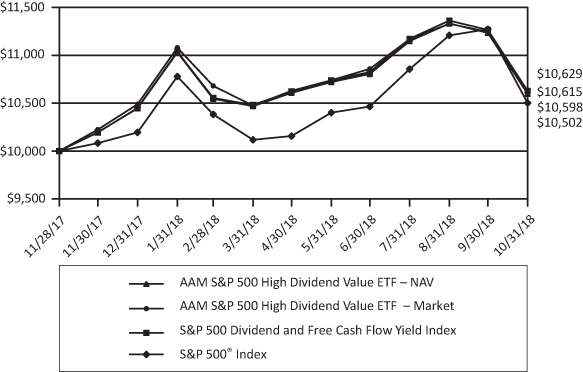
Growth of $10,000
|
Total Returns
|
Since Inception
|
|
Period Ending October 31, 2018
|
(11/28/2017)
|
|
AAM S&P 500 High Dividend Value ETF – NAV
|
5.98%
|
|
AAM S&P 500 High Dividend Value ETF – Market
|
6.15%
|
|
S&P 500 Dividend and Free Cash Flow Yield Index
|
6.29%
|
|
S&P 500® Index
|
5.02%
|
This chart illustrates the performance of a hypothetical $10,000 investment made on November 28, 2017 and is not intended to imply any future performance. The returns shown do not reflect the deduction of taxes that a shareholder would pay on Fund distributions or the redemption of Fund shares. The chart assumes reinvestment of capital gains and dividends.
3
AAM S&P Emerging Markets High Dividend Value ETF
PERFORMANCE SUMMARY
(Unaudited)
Growth of $10,000

|
Total Returns
|
Since Inception
|
|
Period Ending October 31, 2018
|
(11/28/2017)
|
|
AAM S&P Emerging Markets High Dividend Value ETF – NAV
|
-9.65%
|
|
AAM S&P Emerging Markets High Dividend Value ETF – Market
|
-9.19%
|
|
S&P Emerging Markets Dividend and Free Cash Flow Yield Index
|
-8.68%
|
|
S&P Emerging Plus LargeMidCap® Index
|
-14.34%
|
This chart illustrates the performance of a hypothetical $10,000 investment made on November 28, 2017 and is not intended to imply any future performance. The returns shown do not reflect the deduction of taxes that a shareholder would pay on Fund distributions or the redemption of Fund shares. The chart assumes reinvestment of capital gains and dividends.
4
AAM ETFs
PORTFOLIO ALLOCATIONS
As of October 31, 2018 (Unaudited)
|
AAM S&P 500 High Dividend Value ETF
|
|
|
Percentage of
|
|
|
Sector
|
Net Assets
|
|
Utilities
|
10.2%
|
|
Consumer Staples
|
10.1
|
|
Real Estate
|
9.9
|
|
Consumer Discretionary
|
9.7
|
|
Industrials
|
9.7
|
|
Health Care
|
9.6
|
|
Energy
|
9.1
|
|
Financials
|
8.9
|
|
Materials
|
8.3
|
|
Information Technology
|
7.9
|
|
Communication Services
|
6.3
|
|
Other Assets in Excess of Liabilities
|
0.3
|
|
Short-Term Investments
|
0.0+
|
|
Total
|
100.0%
|
|
AAM S&P Emerging Markets High Dividend Value ETF
|
|
|
Percentage of
|
|
|
Sector
|
Net Assets
|
|
Communication Services
|
11.0%
|
|
Consumer Staples
|
10.4
|
|
Energy
|
9.7
|
|
Utilities
|
9.7
|
|
Information Technology
|
9.3
|
|
Materials
|
9.3
|
|
Real Estate
|
8.8
|
|
Financials
|
8.8
|
|
Industrials
|
8.7
|
|
Health Care
|
6.8
|
|
Consumer Discretionary
|
6.5
|
|
Other Assets in Excess of Liabilities
|
0.8
|
|
Short-Term Investments
|
0.2
|
|
Total
|
100.0%
|
|
+ Represents less than 0.05% of net assets.
|
The Global Industry Classification Standard (GICS®) was developed by and/or is exclusive property of MSCI, Inc. and Standard & Poor’s Financial Services LLC (“S&P”). GICS® is a service mark of MSCI, Inc. and S&P and has been licensed for use by the Fund’s Administrator, U.S. Bank Global Fund Services, LLC.
5
AAM S&P 500 High Dividend Value ETF
SCHEDULE OF INVESTMENTS
October 31, 2018
|
Shares
|
Security Description
|
Value
|
|||||
|
COMMON STOCKS – 99.7%
|
|||||||
|
Communication Services – 6.3%
|
|||||||
|
11,996
|
AT&T, Inc.
|
$
|
368,037
|
||||
|
20,476
|
CenturyLink, Inc.
|
422,625
|
|||||
|
7,377
|
Verizon Communications, Inc.
|
421,153
|
|||||
|
1,211,815
|
|||||||
|
Consumer Discretionary – 9.7%
|
|||||||
|
35,925
|
Ford Motor Company
|
343,084
|
|||||
|
15,179
|
H&R Block, Inc.
|
402,851
|
|||||
|
5,218
|
Kohl’s Corporation
|
395,159
|
|||||
|
9,655
|
Macy’s, Inc.
|
331,070
|
|||||
|
4,788
|
Target Corporation
|
400,420
|
|||||
|
1,872,584
|
|||||||
|
Consumer Staples – 10.1%
|
|||||||
|
9,481
|
Campbell Soup Company
|
354,684
|
|||||
|
8,819
|
General Mills, Inc.
|
386,272
|
|||||
|
3,529
|
J.M. Smucker Company
|
382,262
|
|||||
|
5,897
|
Molson Coors Brewing Company – Class B
|
377,408
|
|||||
|
5,805
|
Walgreens Boots Alliance, Inc.
|
463,065
|
|||||
|
1,963,691
|
|||||||
|
Energy – 9.1%
|
|||||||
|
4,577
|
Exxon Mobil Corporation
|
364,695
|
|||||
|
5,357
|
HollyFrontier Corporation
|
361,276
|
|||||
|
5,156
|
Marathon Petroleum Corporation
|
363,240
|
|||||
|
3,446
|
Phillips 66
|
354,318
|
|||||
|
3,542
|
Valero Energy Corporation
|
322,641
|
|||||
|
1,766,170
|
|||||||
|
Financials – 8.9%
|
|||||||
|
24,850
|
Huntington Bancshares, Inc.
|
356,100
|
|||||
|
8,461
|
MetLife, Inc.
|
348,509
|
|||||
|
20,613
|
People’s United Financial, Inc.
|
322,800
|
|||||
|
6,991
|
Principal Financial Group, Inc.
|
329,066
|
|||||
|
3,872
|
Prudential Financial, Inc.
|
363,116
|
|||||
|
1,719,591
|
|||||||
The accompanying notes are an integral part of these financial statements.
6
AAM S&P 500 High Dividend Value ETF
SCHEDULE OF INVESTMENTS
October 31, 2018 (Continued)
|
Shares
|
Security Description
|
Value
|
|||||
|
COMMON STOCKS (Continued)
|
|||||||
|
Health Care – 9.6%
|
|||||||
|
4,153
|
AbbVie, Inc.
|
$
|
323,311
|
||||
|
2,002
|
Amgen, Inc.
|
385,965
|
|||||
|
7,726
|
Cardinal Health, Inc.
|
390,936
|
|||||
|
4,893
|
Gilead Sciences, Inc.
|
333,605
|
|||||
|
10,084
|
Pfizer, Inc.
|
434,217
|
|||||
|
1,868,034
|
|||||||
|
Industrials – 9.7%
|
|||||||
|
2,824
|
Cummins, Inc.
|
386,012
|
|||||
|
7,354
|
Delta Air Lines, Inc.
|
402,484
|
|||||
|
4,906
|
Eaton Corporation plc
|
351,613
|
|||||
|
4,204
|
Ingersoll-Rand plc
|
403,332
|
|||||
|
12,867
|
Nielsen Holdings plc
|
334,285
|
|||||
|
1,877,726
|
|||||||
|
Information Technology – 7.9%
|
|||||||
|
16,526
|
HP, Inc.
|
398,938
|
|||||
|
2,596
|
International Business Machines Corporation
|
299,656
|
|||||
|
6,821
|
Seagate Technology plc
|
274,409
|
|||||
|
5,111
|
Western Digital Corporation
|
220,131
|
|||||
|
18,790
|
Western Union Company
|
338,971
|
|||||
|
1,532,105
|
|||||||
|
Materials – 8.3%
|
|||||||
|
8,733
|
CF Industries Holdings, Inc.
|
419,446
|
|||||
|
3,793
|
Eastman Chemical Company
|
297,181
|
|||||
|
3,508
|
LyondellBasell Industries NV – Class A
|
313,159
|
|||||
|
3,265
|
Packaging Corporation of America
|
299,760
|
|||||
|
6,614
|
WestRock Company
|
284,204
|
|||||
|
1,613,750
|
|||||||
|
Real Estate – 9.9%
|
|||||||
|
14,686
|
HCP, Inc.#
|
404,599
|
|||||
|
17,982
|
Host Hotels & Resorts, Inc.#
|
343,636
|
|||||
|
22,794
|
Kimco Realty Corporation#
|
366,756
|
|||||
|
2,239
|
Simon Property Group, Inc.#
|
410,901
|
|||||
|
6,585
|
Ventas, Inc.#
|
382,193
|
|||||
|
1,908,085
|
|||||||
The accompanying notes are an integral part of these financial statements.
7
AAM S&P 500 High Dividend Value ETF
SCHEDULE OF INVESTMENTS
October 31, 2018 (Continued)
|
Shares
|
Security Description
|
Value
|
|||||
|
COMMON STOCKS (Continued)
|
|||||||
|
Utilities – 10.2%
|
|||||||
|
29,224
|
AES Corporation
|
$
|
426,086
|
||||
|
13,603
|
CenterPoint Energy, Inc.
|
367,417
|
|||||
|
6,910
|
Evergy, Inc.
|
386,891
|
|||||
|
2,234
|
NextEra Energy, Inc.
|
385,365
|
|||||
|
5,897
|
WEC Energy Group, Inc.
|
403,355
|
|||||
|
1,969,114
|
|||||||
|
TOTAL COMMON STOCKS (Cost $20,136,748)
|
19,302,665
|
||||||
|
SHORT-TERM INVESTMENTS – 0.0%+
|
|||||||
|
9,626
|
Invesco Government & Agency Portfolio Short-Term
|
||||||
|
Investments Trust, Institutional Class – 2.08%*
|
9,626
|
||||||
|
TOTAL SHORT-TERM INVESTMENTS (Cost $9,626)
|
9,626
|
||||||
|
TOTAL INVESTMENTS – 99.7% (Cost $20,146,374)
|
19,312,291
|
||||||
|
Other Assets in Excess of Liabilities – 0.3%
|
57,261
|
||||||
|
NET ASSETS – 100.0%
|
$
|
19,369,552
|
|||||
Percentages are stated as a percent of net assets.
|
#
|
Real Estate Investment Trust (“REIT”)
|
|
|
*
|
Rate shown is the annualized seven-day yield as of October 31, 2018.
|
|
|
+
|
Represents less than 0.05% of net assets.
|
The Global Industry Classification Standard (GICS®) was developed by and/or is exclusive property of MSCI, Inc. and Standard & Poor’s Financial Services LLC (“S&P”). GICS® is a service mark of MSCI, Inc. and S&P and has been licensed for use by the Fund’s Administrator, U.S. Bank Global Fund Services, LLC.
The accompanying notes are an integral part of these financial statements.
8
AAM S&P Emerging Markets High Dividend Value ETF
SCHEDULE OF INVESTMENTS
October 31, 2018
|
Shares
|
Security Description
|
Value
|
|||||
|
COMMON STOCKS – 96.4%
|
|||||||
|
Brazil – 8.6%
|
|||||||
|
4,700
|
Banco Santander Brasil SA
|
$
|
53,434
|
||||
|
14,200
|
CCR SA
|
41,554
|
|||||
|
6,200
|
Cia de Saneamento Basico do Estado de Sao Paulo
|
46,235
|
|||||
|
5,679
|
Hypermarcas SA
|
45,209
|
|||||
|
186,432
|
|||||||
|
China – 21.7%
|
|||||||
|
88,000
|
Agricultural Bank of China, Ltd. – H Shares
|
38,615
|
|||||
|
49,500
|
BAIC Motor Corporation, Ltd. – H Shares
|
27,783
|
|||||
|
154,000
|
China Cinda Asset Management
|
||||||
|
Company, Ltd. – H Shares
|
37,717
|
||||||
|
173,000
|
China Huarong Asset Management
|
||||||
|
Compay, Ltd. – H Shares
|
31,337
|
||||||
|
46,000
|
China Petroleum & Chemical Corporation – H Shares
|
37,319
|
|||||
|
19,000
|
China Shenhua Energy Company, Ltd. – H Shares
|
43,044
|
|||||
|
13,000
|
China Vanke Company, Ltd. – H Shares
|
40,048
|
|||||
|
49,000
|
Chongqing Changan Automobile
|
||||||
|
Company, Ltd. – Class B
|
33,002
|
||||||
|
44,000
|
Dongfeng Motor Group
|
||||||
|
Company, Ltd. – H Shares
|
43,330
|
||||||
|
15,500
|
Longfor Group Holdings, Ltd.
|
37,646
|
|||||
|
15,000
|
Shimao Property Holdings, Ltd.
|
29,352
|
|||||
|
70,000
|
Sinopec Shanghai Petrochemical
|
||||||
|
Company, Ltd. – H Shares
|
30,717
|
||||||
|
50,000
|
Zhejiang Expressway Company, Ltd. – H Shares
|
41,904
|
|||||
|
471,814
|
|||||||
|
Malaysia – 7.9%
|
|||||||
|
95,000
|
Astro Malaysia Holdings, Bhd.
|
30,649
|
|||||
|
5,100
|
British American Tobacco Malaysia, Bhd.
|
37,904
|
|||||
|
107,300
|
FGV Holdings, Bhd.
|
35,899
|
|||||
|
70,600
|
Sime Darby, Bhd.
|
37,118
|
|||||
|
136,900
|
YTL Power International, Bhd.
|
31,080
|
|||||
|
172,650
|
|||||||
|
Marshall Islands – 1.5%
|
|||||||
|
5,992
|
Costamare, Inc.
|
31,758
|
|||||
The accompanying notes are an integral part of these financial statements.
9
AAM S&P Emerging Markets High Dividend Value ETF
SCHEDULE OF INVESTMENTS
October 31, 2018 (Continued)
|
Shares
|
Security Description
|
Value
|
|||||
|
COMMON STOCKS (Continued)
|
|||||||
|
Mexico – 1.8%
|
|||||||
|
52,595
|
Nemak SAB de CV
|
$
|
38,100
|
||||
|
Pakistan – 2.0%
|
|||||||
|
10,320
|
Pakistan Oilfields, Ltd.
|
42,447
|
|||||
|
Qatar – 6.0%
|
|||||||
|
4,297
|
Barwa Real Estate Company
|
44,120
|
|||||
|
2,123
|
Ooredoo Q.P.S.C.
|
40,156
|
|||||
|
9,765
|
Qatar Gas Transport Company, Ltd.
|
46,793
|
|||||
|
131,069
|
|||||||
|
Republic of Korea – 3.8%
|
|||||||
|
3,176
|
KT Corporation – ADR
|
43,956
|
|||||
|
444
|
KT&G Corporation
|
39,547
|
|||||
|
83,503
|
|||||||
|
Russian Federation – 11.4%
|
|||||||
|
28,100
|
Alrosa PJSC
|
42,701
|
|||||
|
643,000
|
Inter RAO UES PJSC
|
38,948
|
|||||
|
60,100
|
Magnitogorsk Iron & Steel Works PJSC
|
43,832
|
|||||
|
4,905
|
Mobile TeleSystems PJSC – ADR
|
39,289
|
|||||
|
2,740
|
Severstal PJSC
|
42,930
|
|||||
|
14,026
|
VEON, Ltd. – ADR
|
39,413
|
|||||
|
247,113
|
|||||||
|
South Africa – 6.5%
|
|||||||
|
23,620
|
Life Healthcare Group Holdings, Ltd.
|
39,190
|
|||||
|
21,281
|
Netcare, Ltd.
|
35,784
|
|||||
|
3,085
|
SPAR Group, Ltd.
|
36,735
|
|||||
|
1,716
|
Tiger Brands, Ltd.
|
30,631
|
|||||
|
142,340
|
|||||||
|
Taiwan, Province of China – 14.3%
|
|||||||
|
107,000
|
AU Optronics Corporation
|
42,187
|
|||||
|
40,000
|
Cheng Uei Precision Industry Company, Ltd.
|
27,535
|
|||||
|
26,000
|
CTCI Corporation
|
36,677
|
|||||
|
152,000
|
HannStar Display Corporation
|
33,403
|
|||||
|
55,000
|
Inventec Corporation
|
44,348
|
|||||
|
21,000
|
Radiant Opto-Electronics Corporation
|
54,904
|
|||||
The accompanying notes are an integral part of these financial statements.
10
AAM S&P Emerging Markets High Dividend Value ETF
SCHEDULE OF INVESTMENTS
October 31, 2018 (Continued)
|
Shares
|
Security Description
|
Value
|
|||||
|
COMMON STOCKS (Continued)
|
|||||||
|
Taiwan, Province of China (Continued)
|
|||||||
|
2,000
|
St. Shine Optical Company, Ltd.
|
$
|
35,549
|
||||
|
14,000
|
TTY Biopharm Company, Ltd.
|
36,558
|
|||||
|
311,161
|
|||||||
|
Thailand – 7.5%
|
|||||||
|
15,400
|
Glow Energy pcl
|
38,906
|
|||||
|
17,700
|
PTT Global Chemical pcl
|
41,247
|
|||||
|
430,800
|
Quality Houses pcl
|
40,806
|
|||||
|
97,200
|
Star Petroleum Refining pcl
|
41,343
|
|||||
|
162,302
|
|||||||
|
Turkey – 1.4%
|
|||||||
|
43,903
|
Turkiye Is Bankasi AS – Class C
|
31,262
|
|||||
|
United Arab Emirates – 2.0%
|
|||||||
|
9,217
|
Emirates Telecommunications Group Company PJSC
|
43,662
|
|||||
|
TOTAL COMMON STOCKS (Cost $2,544,558)
|
2,095,613
|
||||||
|
PREFERRED STOCKS – 2.6%
|
|||||||
|
Brazil – 2.6%
|
|||||||
|
19,162
|
Cia Energetica de Minas Gerais
|
57,004
|
|||||
|
TOTAL PREFERRED STOCKS (Cost $43,453)
|
57,004
|
||||||
|
SHORT-TERM INVESTMENTS – 0.2%
|
|||||||
|
4,876
|
Invesco Government & Agency Portfolio Short-Term
|
||||||
|
Investments Trust, Institutional Class – 2.08%*
|
4,876
|
||||||
|
TOTAL SHORT-TERM INVESTMENTS (Cost $4,876)
|
4,876
|
||||||
|
TOTAL INVESTMENTS – 99.2% (Cost $2,592,887)
|
2,157,493
|
||||||
|
Other Assets in Excess of Liabilities – 0.8%
|
17,149
|
||||||
|
NET ASSETS – 100.0%
|
$
|
2,174,642
|
|||||
Percentages are stated as a percent of net assets.
|
ADR
|
American Depositary Receipt
|
|
|
*
|
Rate shown is the annualized seven-day yield as of October 31, 2018.
|
The accompanying notes are an integral part of these financial statements.
11
AAM ETFs
STATEMENTS OF ASSETS & LIABILITIES
October 31, 2018
|
AAM
|
AAM
|
|||||||
|
S&P 500
|
S&P Emerging
|
|||||||
|
High
|
Markets High
|
|||||||
|
Dividend
|
Dividend
|
|||||||
|
Value ETF
|
Value ETF
|
|||||||
|
ASSETS
|
||||||||
|
Investments in securities, at value*
|
$
|
19,312,291
|
$
|
2,157,493
|
||||
|
Foreign currency, at value*
|
—
|
1
|
||||||
|
Cash
|
—
|
1,021
|
||||||
|
Receivable for securities sold
|
34,071
|
4,887
|
||||||
|
Dividends and interest receivable
|
27,448
|
12,150
|
||||||
|
Total assets
|
19,373,810
|
2,175,552
|
||||||
|
LIABILITIES
|
||||||||
|
Management fees payable
|
4,258
|
910
|
||||||
|
Total liabilities
|
4,258
|
910
|
||||||
|
NET ASSETS
|
$
|
19,369,552
|
$
|
2,174,642
|
||||
|
Net assets consist of:
|
||||||||
|
Paid-in capital
|
$
|
20,266,444
|
$
|
2,704,897
|
||||
|
Total distributable earnings/(accumulated deficit)
|
(896,892
|
)
|
(530,255
|
)
|
||||
|
Net assets
|
$
|
19,369,552
|
$
|
2,174,642
|
||||
|
Net asset value:
|
||||||||
|
Net assets
|
$
|
19,369,552
|
$
|
2,174,642
|
||||
|
Shares outstanding^
|
750,000
|
100,000
|
||||||
|
Net asset value, offering and
|
||||||||
|
redemption price per share
|
$
|
25.83
|
$
|
21.75
|
||||
|
* Identified Cost:
|
||||||||
|
Investments in securities
|
$
|
20,146,374
|
$
|
2,592,887
|
||||
|
Foreign currency
|
$
|
—
|
$
|
3
|
||||
|
^ No par value, unlimited number of shares authorized.
|
||||||||
The accompanying notes are an integral part of these financial statements.
12
AAM ETFs
STATEMENTS OF OPERATIONS
For the Period Ended October 31, 2018
|
AAM
|
AAM
|
|||||||
|
S&P 500
|
S&P Emerging
|
|||||||
|
High
|
Markets High
|
|||||||
|
Dividend
|
Dividend
|
|||||||
|
Value ETF*
|
Value ETF*
|
|||||||
|
INCOME
|
||||||||
|
Dividends^
|
$
|
227,647
|
$
|
123,901
|
||||
|
Interest
|
171
|
204
|
||||||
|
Total investment income
|
227,818
|
124,105
|
||||||
|
EXPENSES
|
||||||||
|
Management fees
|
19,810
|
11,175
|
||||||
|
Total expenses
|
19,810
|
11,175
|
||||||
|
Net investment income (loss)
|
208,008
|
112,930
|
||||||
|
REALIZED AND UNREALIZED
|
||||||||
|
GAIN (LOSS) ON INVESTMENTS
|
||||||||
|
Net realized gain (loss) on:
|
||||||||
|
Investments
|
365,806
|
90,026
|
||||||
|
Foreign currency
|
—
|
(8,548
|
)**
|
|||||
|
Change in unrealized appreciation (depreciation) on:
|
||||||||
|
Investments
|
(834,083
|
)
|
(435,394
|
)
|
||||
|
Foreign currency
|
—
|
(319
|
)
|
|||||
|
Net realized and unrealized
|
||||||||
|
gain (loss) on investments
|
(468,277
|
)
|
(354,235
|
)
|
||||
|
Net increase (decrease) in net assets
|
||||||||
|
resulting from operations
|
$
|
(260,269
|
)
|
$
|
(241,305
|
)
|
||
|
^
|
Net of foreign taxes withheld of $0 and $17,002 respectively.
|
|
|
*
|
Fund inception date of November 28, 2017. The information presented is for the period from November 28, 2017 to October 31, 2018.
|
|
|
**
|
Net of $1,058 in foreign capital gain taxes.
|
The accompanying notes are an integral part of these financial statements.
13
AAM S&P 500 High Dividend Value ETF
STATEMENT OF CHANGES IN NET ASSETS
|
Period Ended
|
||||
|
October 31, 2018*
|
||||
|
OPERATIONS
|
||||
|
Net investment income (loss)
|
$
|
208,008
|
||
|
Net realized gain (loss) on investments
|
365,806
|
|||
|
Change in unrealized appreciation
|
||||
|
(depreciation) of investments
|
(834,083
|
)
|
||
|
Net increase (decrease) in net assets
|
||||
|
resulting from operations
|
(260,269
|
)
|
||
|
DISTRIBUTIONS TO SHAREHOLDERS
|
||||
|
Distributions to shareholders
|
(180,619
|
)
|
||
|
Total distributions to shareholders
|
(180,619
|
)
|
||
|
CAPITAL SHARE TRANSACTIONS
|
||||
|
Proceeds from subscriptions
|
23,923,010
|
|||
|
Transaction fees (Note 6)
|
10
|
|||
|
Payments for shares redeemed
|
(4,112,580
|
)
|
||
|
Net increase (decrease) in net assets derived
|
||||
|
from capital share transactions (a)
|
19,810,440
|
|||
|
Net increase (decrease) in net assets
|
19,369,552
|
|||
|
NET ASSETS
|
||||
|
Beginning of period
|
$
|
—
|
||
|
End of period
|
$
|
19,369,552
|
||
|
(a)
|
A summary of capital share transactions is as follows:
|
|
Period Ended
|
|||||
|
October 31, 2018*
|
|||||
|
Shares
|
|||||
|
Subscriptions
|
900,000
|
||||
|
Redemptions
|
(150,000
|
)
|
|||
|
Net income (decrease)
|
750,000
|
||||
|
*
|
Fund inception date of November 28, 2017. The information presented is for the period from November 28, 2017 to October 31, 2018.
|
The accompanying notes are an integral part of these financial statements.
14
AAM S&P Emerging Markets High Dividend Value ETF
STATEMENT OF CHANGES IN NET ASSETS
|
Period Ended
|
||||
|
October 31, 2018*
|
||||
|
OPERATIONS
|
||||
|
Net investment income (loss)
|
$
|
112,930
|
||
|
Net realized gain (loss) on investments
|
||||
|
and foreign currency
|
81,478
|
|||
|
Change in unrealized appreciation
|
||||
|
(depreciation) on investments and foreign currency
|
(435,713
|
)
|
||
|
Net increase (decrease) in net assets
|
||||
|
resulting from operations
|
(241,305
|
)
|
||
|
DISTRIBUTIONS TO SHAREHOLDERS
|
||||
|
Distributions to shareholders
|
(92,758
|
)
|
||
|
Total distributions to shareholders
|
(92,758
|
)
|
||
|
CAPITAL SHARE TRANSACTIONS
|
||||
|
Proceeds from subscriptions
|
3,890,905
|
|||
|
Transaction fees (Note 6)
|
9,785
|
|||
|
Payments for shares redeemed
|
(1,391,985
|
)
|
||
|
Net increase (decrease) in net assets derived
|
||||
|
from capital share transactions (a)
|
2,508,705
|
|||
|
Net increase (decrease) in net assets
|
2,174,642
|
|||
|
NET ASSETS
|
||||
|
Beginning of period
|
$
|
—
|
||
|
End of period
|
$
|
2,174,642
|
||
|
(a)
|
A summary of capital share transactions is as follows:
|
|
Period Ended
|
|||||
|
October 31, 2018*
|
|||||
|
Shares
|
|||||
|
Subscriptions
|
150,000
|
||||
|
Redemptions
|
(50,000
|
)
|
|||
|
Net increase (decrease)
|
100,000
|
||||
|
*
|
Fund inception date of November 28, 2017. The information presented is for the period from November 28, 2017 to October 31, 2018.
|
The accompanying notes are an integral part of these financial statements.
15
AAM S&P 500 High Dividend Value ETF
FINANCIAL HIGHLIGHTS
For a capital share outstanding throughout the period
|
Period Ended
|
||||
|
October 31, 2018(1)
|
||||
|
Net asset value, beginning of period
|
$
|
25.00
|
||
|
INCOME (LOSS) FROM INVESTMENT OPERATIONS:
|
||||
|
Net investment income (loss)(2)
|
0.75
|
|||
|
Net realized and unrealized gain (loss) on investments(3)
|
0.76
|
|||
|
Total from investment operations
|
1.51
|
|||
|
DISTRIBUTIONS TO SHAREHOLDERS:
|
||||
|
Distributions from:
|
||||
|
Net investment income
|
(0.68
|
)
|
||
|
Total distributions
|
(0.68
|
)
|
||
|
CAPITAL SHARE TRANSACTIONS:
|
||||
|
Transaction fees (Note 6)
|
0.00
|
(4)
|
||
|
Net asset value, end of period
|
$
|
25.83
|
||
|
Total return
|
5.98
|
%(5)
|
||
|
SUPPLEMENTAL DATA:
|
||||
|
Net assets at end of period (000’s)
|
$
|
19,370
|
||
|
RATIOS TO AVERAGE NET ASSETS:
|
||||
|
Expenses to average net assets
|
0.29
|
%(6)
|
||
|
Net investment income (loss) to average net assets
|
3.05
|
%(6)
|
||
|
Portfolio turnover rate(7)
|
38
|
%(5)
|
||
|
(1)
|
Inception date of November 28, 2017.
|
|
(2)
|
Calculated based on average shares outstanding during the period.
|
|
(3)
|
Realized and unrealized gains and losses per share in this caption are balancing amounts necessary to reconcile the change in net asset value per share for the period, and may not reconcile with the aggregate gains and losses in the Statement of Operations due to share transactions for the period.
|
|
(4)
|
Less than $0.005.
|
|
(5)
|
Not annualized.
|
|
(6)
|
Annualized.
|
|
(7)
|
Excludes the impact of in-kind transactions.
|
The accompanying notes are an integral part of these financial statements.
16
AAM S&P Emerging Markets High Dividend Value ETF
FINANCIAL HIGHLIGHTS
For a capital share outstanding throughout the period
|
Period Ended
|
||||
|
October 31, 2018(1)
|
||||
|
Net asset value, beginning of period
|
$
|
25.00
|
||
|
INCOME (LOSS) FROM INVESTMENT OPERATIONS:
|
||||
|
Net investment income (loss)(2)
|
1.13
|
|||
|
Net realized and unrealized gain (loss) on investments
|
||||
|
and foreign currency
|
(3.55
|
)
|
||
|
Total from investment operations
|
(2.42
|
)
|
||
|
DISTRIBUTIONS TO SHAREHOLDERS:
|
||||
|
Distribution from:
|
||||
|
Net investment income
|
(0.93
|
)
|
||
|
Total distributions
|
(0.93
|
)
|
||
|
CAPITAL SHARE TRANSACTIONS:
|
||||
|
Transaction fees (Note 6)
|
0.10
|
|||
|
Net asset value, end of period
|
$
|
21.75
|
||
|
Total return
|
-9.65
|
%(3)
|
||
|
SUPPLEMENTAL DATA:
|
||||
|
Net assets at end of period (000’s)
|
$
|
2,175
|
||
|
RATIOS TO AVERAGE NET ASSETS:
|
||||
|
Expenses to average net assets
|
0.49
|
%(4)
|
||
|
Net investment income (loss) to average net assets
|
4.95
|
%(4)
|
||
|
Portfolio turnover rate(5)
|
104
|
%(3)
|
||
|
(1)
|
Inception date of November 28, 2017.
|
|
(2)
|
Calculated based on average shares outstanding during the period.
|
|
(3)
|
Not annualized.
|
|
(4)
|
Annualized.
|
|
(5)
|
Excludes the impact of in-kind transactions.
|
The accompanying notes are an integral part of these financial statements.
17
AAM ETFs
NOTES TO FINANCIAL STATEMENTS
October 31, 2018
NOTE 1 – ORGANIZATION
AAM S&P 500 High Dividend Value ETF and AAM S&P Emerging Markets High Dividend Value ETF (individually each a “Fund” or collectively the “Funds”) are diversified series of ETF Series Solutions (“ESS” or the “Trust”), an open-end management investment company consisting of multiple investment series, organized as a Delaware statutory trust on February 9, 2012. The Trust is registered with the Securities and Exchange Commission (“SEC”) under the Investment Company Act of 1940, as amended (the “1940 Act”), as an open-end management investment company and the offering of the Funds’ shares is registered under the Securities Act of 1933, as amended (the “Securities Act”). The investment objective of the AAM S&P 500 High Dividend Value ETF is to track the performance, before fees and expenses, of the S&P 500 Dividend and Free Cash Flow Yield Index. The investments objective of the AAM S&P Emerging Markets High Dividend Value ETF is to track the performance, before fees and expenses, of the S&P Emerging Markets Dividend Free Cash Flow Yield Index. AAM S&P 500 High Dividend Value ETF and AAM S&P Emerging Markets High Dividend Value ETF commenced operations on November 28, 2017.
NOTE 2 – SIGNIFICANT ACCOUNTING POLICIES
The Funds are investment companies and accordingly follow the investment company accounting and reporting guidance of the Financial Accounting Standards Board (“FASB”) Accounting Standards Codification (“ASC”) Topic 946 Financial Services – Investment Companies.
The following is a summary of significant accounting policies consistently followed by the Funds. These policies are in conformity with the United States of America generally accepted accounting principles (“U.S. GAAP”).
|
A.
|
Security Valuation. All equity securities, including domestic and foreign common stocks, preferred stocks, and exchange traded funds that are traded on a national securities exchange, except those listed on The Nasdaq Stock Market®, Nasdaq Global Select Markets® and Nasdaq Capital Market Exchange® (collectively, “Nasdaq”), are valued at the last reported sale price on the exchange on which the security is principally traded. Securities traded on Nasdaq will be valued at the Nasdaq Official Closing Price (“NOCP”) If, on a particular day, an exchange-traded or Nasdaq security does not trade, then the mean between the most recent quoted bid and asked prices will be used. All equity securities that are not traded on a listed exchange are valued at the last sale price in the over-the-counter market. If a non-exchange traded security does not trade on a particular day, then the mean between the last quoted closing bid and asked price will be used. Prices denominated in foreign currencies are
|
18
AAM ETFs
NOTES TO FINANCIAL STATEMENTS
October 31, 2018 (Continued)
|
converted to U.S. dollar equivalents at the current exchange rate, which approximates fair value. Investments in mutual funds, including money market funds, are valued at their net asset value (“NAV”) per share. Short-term securities that have maturities of less than 60 days at the time of purchase are valued at amortized cost, which, when combined with accrued interest, approximates fair value.
|
|
|
Securities for which quotations are not readily available are valued at their respective fair values in accordance with pricing procedures adopted by the Funds’ Board of Trustees (the “Board”). When a security is “fair valued,” consideration is given to the facts and circumstances relevant to the particular situation, including a review of various factors set forth in the pricing procedures adopted by the Board. The use of fair value pricing by the Funds may cause the NAV of their shares to differ significantly from the NAV that would be calculated without regard to such considerations.
|
|
|
As described above, the Funds utilize various methods to measure the fair value of their investments on a recurring basis. U.S. GAAP establishes a hierarchy that prioritizes inputs to valuations methods. The three levels of inputs are:
|
|
Level 1 –
|
Unadjusted quoted prices in active markets for identical assets or liabilities that the Funds have the ability to access.
|
|
|
Level 2 –
|
Observable inputs other than quoted prices included in Level 1 that are observable for the asset or liability, either directly or indirectly. These inputs may include quoted prices for the identical instrument on an inactive market, prices for similar instruments, interest rates, prepayment speeds, credit risk, yield curves, default rates and similar data.
|
|
|
Level 3 –
|
Unobservable inputs for the asset or liability, to the extent relevant observable inputs are not available; representing the Funds’ own assumptions about the assumptions a market participant would use in valuing the asset or liability, and would be based on the best information available.
|
|
The availability of observable inputs can vary from security to security and is affected by a wide variety of factors, including, for example, the type of security, whether the security is new and not yet established in the marketplace, the liquidity of markets, and other characteristics particular to the security. To the extent that valuation is based on models or inputs that are less observable or unobservable in the market, the determination of fair value requires more judgment. Accordingly, the degree of judgment exercised in determining fair value is greatest for instruments categorized in Level 3.
|
19
AAM ETFs
NOTES TO FINANCIAL STATEMENTS
October 31, 2018 (Continued)
|
The inputs used to measure fair value may fall into different levels of the fair value hierarchy. In such cases, for disclosure purposes, the level in the fair value hierarchy within which the fair value measurement falls in its entirety, is determined based on the lowest level input that is significant to the fair value measurement in its entirety.
|
|
|
The following is a summary of the inputs used to value the Funds’ investments as of October 31, 2018:
|
|
AAM S&P 500 High Dividend Value ETF
|
|||||||||||||||||
|
Assets^
|
Level 1
|
Level 2
|
Level 3
|
Total
|
|||||||||||||
|
Common Stocks
|
$
|
19,302,665
|
$
|
—
|
$
|
—
|
$
|
19,302,665
|
|||||||||
|
Short-Term Investments
|
9,626
|
—
|
—
|
9,626
|
|||||||||||||
|
Total Investments
|
|||||||||||||||||
|
in Securities
|
$
|
19,312,291
|
$
|
—
|
$
|
—
|
$
|
19,312,291
|
|||||||||
|
^ See Schedule of Investments for breakout of investments by sector classification.
|
|||||||||||||||||
|
AAM S&P Emerging Markets High Dividend Value ETF
|
|||||||||||||||||
|
Assets^
|
Level 1
|
Level 2
|
Level 3
|
Total
|
|||||||||||||
|
Common Stocks
|
$
|
2,095,613
|
$
|
—
|
$
|
—
|
$
|
2,095,613
|
|||||||||
|
Preferred Stocks
|
57,004
|
—
|
—
|
57,004
|
|||||||||||||
|
Short-Term Investments
|
4,876
|
—
|
—
|
4,876
|
|||||||||||||
|
Total Investments
|
|||||||||||||||||
|
in Securities
|
$
|
2,157,493
|
$
|
—
|
$
|
—
|
$
|
2,175,493
|
|||||||||
|
^ See Schedule of Investments for breakout of investments by country.
|
|||||||||||||||||
|
For the period ended October 31, 2018, the Funds did not recognize any transfers to or from Level 3.
|
||
|
B.
|
Federal Income Taxes. The Funds’ policy is to comply with the provisions of Subchapter M of the Internal Revenue Code of 1986, as amended, applicable to regulated investment companies and to distribute substantially all of their net investment income and net capital gains to shareholders. Therefore, no federal income tax provision is required. Each Fund plans to file U.S. Federal and various state and local tax returns.
|
|
|
Each Fund recognizes the tax benefits of uncertain tax positions only when the position is more likely than not to be sustained. Management has analyzed each Fund’s uncertain tax positions and concluded that no liability for unrecognized tax benefits should be recorded related to uncertain tax positions. Management is not aware of any tax positions for which it is reasonably possible that the total amounts of unrecognized tax benefits will change materially in the next 12 months. Income and capital gain
|
20
AAM ETFs
NOTES TO FINANCIAL STATEMENTS
October 31, 2018 (Continued)
|
distributions are determined in accordance with federal income tax regulations, which may differ from U.S. GAAP. The Funds recognize interest and penalties, if any, related to unrecognized tax benefits on uncertain tax positions as income tax expenses in the Statements of Operations. During the most recently completed fiscal period end, the Funds did not occur any interest or penalties.
|
||
|
C.
|
Security Transactions and Investment Income. Investment securities transactions are accounted for on the trade date. Gains and losses realized on sales of securities are determined on a specific identification basis. Dividend income is recorded on the ex-dividend date. Interest income is recorded on an accrual basis. Withholding taxes on foreign dividends and foreign taxes on capital gains have been provided for in accordance with the Funds’ understanding of the applicable tax rules and regulations.
|
|
|
Distributions received from investments in real estate investment trusts (“REITs”) may be characterized as ordinary income, net capital gain, or a return of capital. The proper characterization of REIT distributions is generally not known until after the end of each calendar year. As such, the Funds must use estimates in reporting the character of income and distributions for financial statement purposes. The actual character of distribution to a Fund’s shareholders will be reflected on the Form 1099 received by shareholders after the end of the calendar year. Due to the nature of REIT investments, a portion of the distributions received by a Fund’s shareholders may represent a return of capital.
|
||
|
D.
|
Foreign Currency. Investment securities and other assets and liabilities denominated in foreign currencies are translated into U.S. dollar amounts at the date of valuation. Purchases and sales of investment securities and income and expense items denominated in foreign currencies are translated into U.S. dollar amounts on the respective dates of such transactions. The Funds do not isolate that portion of the results of operations resulting from changes in foreign exchange rates on investments and currency gains or losses realized between the trade and settlement dates on securities transactions from the fluctuations arising from changes in market prices of securities held. Such fluctuations are included with the net realized and unrealized gain or loss from investments. The Funds report net realized foreign exchange gains or losses that arise from sales of foreign currencies, currency gains or losses realized between the trade and settlement dates on foreign currency transactions, and the difference between the amounts of dividends, interest, and foreign withholding taxes recorded on the Funds’ books and the U.S. dollar equivalent of the amounts actually received or paid. Net unrealized foreign exchange gains and losses arise from changes in the fair values of assets
|
21
AAM ETFs
NOTES TO FINANCIAL STATEMENTS
October 31, 2018 (Continued)
|
and liabilities, other than investments in securities at fiscal period end, resulting from changes in exchange rates.
|
||
|
E.
|
Distributions to Shareholders. Distributions to shareholders from net investment income on securities are declared and paid by the Funds on a monthly basis. Net realized gains on securities are declared and paid by the Funds on an annual basis. Distributions are recorded on the ex-dividend date.
|
|
|
F.
|
Use of Estimates. The preparation of financial statements in conformity with U.S. GAAP requires management to make estimates and assumptions that affect the reported amounts of assets and liabilities and disclosure of contingent assets and liabilities at the date of the financial statements, as well as the reported amounts of revenues and expenses during the reporting period. Actual results could differ from those estimates.
|
|
|
G.
|
Share Valuation. The NAV per share of each Fund is calculated by dividing the sum of the value of the securities held by each Fund, plus cash and other assets, minus all liabilities (including estimated accrued expenses) by the total number of outstanding shares for each Fund, rounded to the nearest cent. The Funds’ shares will not be priced on the days on which the New York Stock Exchange (“NYSE”) is closed for trading. The offering and redemption price per share for creation units of each Fund is equal to each Fund’s NAV per share.
|
|
|
H.
|
Reclassification of Capital Accounts. U.S. GAAP requires that certain components of net assets relating to permanent differences be reclassified between financial and tax reporting. These reclassifications have no effect on net assets or NAV per share.
|
|
|
The permanent differences primarily relate to redemptions in-kind. For the period ended October 31, 2018, the following table shows the reclassifications made:
|
|
Distributable
|
|||
|
Earnings/
|
|||
|
(Accumulated
|
Paid-In
|
||
|
Deficit)
|
Capital
|
||
|
AAM S&P 500 High Dividend Value ETF
|
$(456,004)
|
$456,004
|
|
|
AAM S&P Emerging Markets
|
|||
|
High Dividend Value ETF
|
$(196,192)
|
$196,192
|
|
During the period ended October 31, 2018, the Funds realized the following net capital gains resulting from in-kind redemptions, in which shareholders exchanged Fund shares for securities held by the Funds rather than for cash. Because such gains are not taxable to the Funds, and are not distributed to shareholders, they have been reclassified from distributable earnings/(accumulated deficit) to paid in capital.
|
22
AAM ETFs
NOTES TO FINANCIAL STATEMENTS
October 31, 2018 (Continued)
|
AAM S&P 500 High Dividend Value ETF
|
$456,004
|
|
|
AAM S&P Emerging Markets High Dividend Value ETF
|
$196,192
|
|
I.
|
Guarantees and Indemnifications. In the normal course of business, the Funds enter into contracts with service providers that contain general indemnification clauses. The Funds’ maximum exposure under these arrangements is unknown as this would involve future claims that may be against the Funds that have not yet occurred. However, based on experience, the Funds expect the risk of loss to be remote.
|
|
|
J.
|
Subsequent Events. In preparing these financial statements, management has evaluated events and transactions for potential recognition or disclosure through the date the financial statements were issued. There were no events or transactions that occurred during the period subsequent to October 31, 2018, that materially impacted the amounts or disclosures in the Funds’ financial statements.
|
|
|
K.
|
New Accounting Pronouncements and Other Matters. In August 2018, FASB issued Accounting Standards Update 2018-13, Fair Value Measurement (Topic 820): Disclosure Framework—Changes to the Disclosure Requirements for Fair Value Measurement (“ASU 2018-13”). The primary focus of ASU 2018-13 is to improve the effectiveness of the disclosure requirements for fair value measurements. The changes affect all companies that are required to include fair value measurement disclosures. In general, the amendments in ASU 2018-13 are effective for all entities for fiscal years and interim periods within those fiscal years, beginning after December 15, 2019. An entity is permitted to early adopt the removed or modified disclosures upon the issuance of ASU 2018-13 and may delay adoption of the additional disclosures, which are required for public companies only, until their effective date. Management has evaluated the ASU 2018-13 and has adopted the framework.
|
NOTE 3 – COMMITMENTS AND OTHER RELATED PARTY TRANSACTIONS
Advisors Asset Management, Inc. (the “Adviser”), serves as the investment adviser to the Funds. Pursuant to an Investment Advisory Agreement (“Advisory Agreement”) between the Trust, on behalf of the Funds, and the Adviser, the Adviser provides investment advice to the Funds and oversees the day-to-day operations of the Funds, subject to the direction and control of the Board and the officers of the Trust. Under the Advisory Agreement, the Adviser also is responsible for arranging, in consulting with Vident Investment Advisory, LLC (“VIA” or the “Sub-Adviser”), transfer agency, custody, fund administration and accounting, and other related services necessary for the Funds to operate. Under the Advisory Agreement, the Adviser has agreed to pay all expenses of each Fund, except for: the fee paid to the Adviser pursuant to the Advisory Agreement, interest charges on any
23
AAM ETFs
NOTES TO FINANCIAL STATEMENTS
October 31, 2018 (Continued)
borrowings, taxes, brokerage commissions and other expenses incurred in placing orders for the purchase and sale of securities and other investment instruments, acquired fund fees and expenses, accrued deferred tax liability, extraordinary expenses, and distribution (12b-1) fees and expenses. For services provided to the Funds, AAM S&P 500 High Dividend Value ETF pays the Adviser 0.29% and AAM S&P Emerging Markets High Dividend Value ETF pays the Adviser 0.49% at an annual rate based on each Funds’ average daily net assets.
U.S. Bancorp Fund Services, LLC, doing business as U.S. Bank Global Fund Services, LLC (“Fund Services” or “Administrator”), acts as the Funds’ Administrator and, in that capacity, performs various administrative and accounting services for the Funds. The Administrator prepares various federal and state regulatory filings, reports and returns for the Funds, including regulatory compliance monitoring and financial reporting; prepares reports and materials to be supplied to the Board; monitors the activities of the Funds’ Custodian, transfer agent and accountants. Fund Services also serves as the transfer agent and fund accountant to the Funds. U.S. Bank N.A. (the “Custodian”), an affiliate of Fund Services, serves as the Funds’ Custodian.
Quasar Distributors, LLC, (the “Distributor”) acts as the Funds’ principal underwriter in a continuous public offering of the Funds’ shares. The Distributor is an affiliate of the Administrator.
A Trustee and all officers of the Trust are affiliated with the Administrator, Distributor, and Custodian.
NOTE 4 – PURCHASES AND SALES OF SECURITIES
During the period ended October 31, 2018, purchases and sales of securities by the Funds, excluding short-term securities and in-kind transactions, were as follows:
|
Purchases
|
Sales
|
||
|
AAM S&P 500 High Dividend Value ETF
|
$3,039,601
|
$2,981,765
|
|
|
AAM S&P Emerging Markets
|
|||
|
High Dividend Value ETF
|
$4,726,253
|
$2,564,213
|
During the period ended October 31, 2018, there were no purchases or sales of U.S. Government securities by the Funds.
During the period ended October 31, 2018, in-kind transactions associated with creations and redemptions for the Funds were as follows:
|
Purchases
|
Sales
|
||
|
AAM S&P 500 High Dividend Value ETF
|
$23,830,658
|
$4,105,545
|
|
|
AAM S&P Emerging Markets
|
|||
|
High Dividend Value ETF
|
$ 1,738,515
|
$1,399,284
|
24
AAM ETFs
NOTES TO FINANCIAL STATEMENTS
October 31, 2018 (Continued)
NOTE 5 – INCOME TAX INFORMATION
The components of distributable earnings/(accumulated deficit) and cost basis of investments for federal income tax purposes at October 31, 2018 were as follows:
|
AAM S&P
|
|||||||||
|
AAM S&P 500
|
Emerging Markets
|
||||||||
|
High Dividend
|
High Dividend
|
||||||||
|
Value ETF
|
Value ETF
|
||||||||
|
Tax cost of investments
|
$
|
20,250,802
|
$
|
2,599,011
|
|||||
|
Gross tax unrealized appreciation
|
562,227
|
41,436
|
|||||||
|
Gross tax unrealized depreciation
|
(1,500,738
|
)
|
(483,273
|
)
|
|||||
|
Total unrealized appreciation/(depreciation)
|
$
|
(938,511
|
)
|
$
|
(441,837
|
)
|
|||
|
Undistributed ordinary income
|
41,619
|
13,026
|
|||||||
|
Undistributed long term capital gains
|
—
|
—
|
|||||||
|
Total accumulated gain/(loss)
|
41,619
|
13,026
|
|||||||
|
Other accumulated gain/(loss)
|
—
|
(101,444
|
)
|
||||||
|
Distributable earnings/(accumulated deficit)
|
$
|
(896,892
|
)
|
$
|
(530,255
|
)
|
|||
The differences between the cost basis for financial statement and federal income tax purposes are primarily due to timing differences in recognizing wash sales.
As of October 31, 2018, the Funds deferred, on a tax basis, no late-year losses and no post-October capital losses.
As of October 31, 2018, the Funds had the following capital loss carryforwards:
|
Short-Term
|
Long-Term
|
||
|
AAM S&P 500 High Dividend Value ETF
|
$ —
|
$ —
|
|
|
AAM S&P Emerging Markets
|
|||
|
High Dividend Value ETF
|
$101,444
|
$ —
|
These amounts do not have an expiration date.
The tax character of distributions paid by the Funds during the fiscal period ended October 31, 2018 were as follows:
|
Ordinary Income
|
Capital Gains
|
||
|
AAM S&P 500 High Dividend Value ETF
|
$180,619
|
$ —
|
|
|
AAM S&P Emerging Markets
|
|||
|
High Dividend Value ETF
|
$ 92,758
|
$ —
|
NOTE 6 – SHARE TRANSACTIONS
Shares of each Fund are listed and trade on the New York Stock Exchange Arca, Inc. (“NYSE Arca”). Market prices for the shares may be different from their NAV. The Funds issue and redeem shares on a continuous basis at NAV generallly in blocks of 50,000 shares called “Creation Units.” Creation Units are issued and
25
AAM ETFs
NOTES TO FINANCIAL STATEMENTS
October 31, 2018 (Continued)
redeemed principally in-kind for securities included in a specified universe. Once created, shares generally trade in the secondary market at market prices that change throughout the day. Except when aggregated in Creation Units, shares are not redeemable securities of the Funds. Creation Units may only be purchased or redeemed by certain financial institutions (“Authorized Participants”). An Authorized Participant is either (i) a broker-dealer or other participant in the clearing process through the Continuous Net Settlement System of the National Securities Clearing Corporation or (ii) a Depository Trust Company participant and, in each case, must have executed a Participant Agreement with the Distributor. Most retail investors do not qualify as Authorized Participants nor have the resources to buy and sell whole Creation Units. Therefore, they are unable to purchase or redeem shares directly from the Funds. Rather, most retail investors may purchase shares in the secondary market with the assistance of a broker and are subject to customary brokerage commissions or fees.
The Funds each currently offer one class of shares, which has no front end sales load, no deferred sales charge, and no redemption fee. A fixed transaction fee is imposed for the transfer and other transaction costs associated with the purchase or sale of Creation Units. The standard fixed transaction of $250 for AAM S&P 500 High Dividend Value ETF and $1,000 for AAM S&P Emerging Markets High Dividend ETF, payable to the Custodian. In addition, a variable fee may be charged on all cash transactions or substitutes for Creation Units of up to a maximum of 2% as a percentage of the value of the Creation Units subject to the transaction. Variable fees are imposed to compensate the Funds for the transaction costs associated with the cash transactions. Variable fees received by the Funds, if any, are displayed in the capital shares transactions section of the Statements of Changes in Net Assets. The Funds may issue an unlimited number of shares of beneficial interest, with no par value. All shares of the Funds have equal rights and privileges.
26
AAM ETFs
REPORT OF INDEPENDENT REGISTERED PUBLIC ACCOUNTING FIRM
To the Shareholders of AAM S&P 500 High Dividend Value ETF and AAM S&P Emerging Markets High Dividend Value ETF and Board of Trustees of ETF Series Solutions
Opinion on the Financial Statements
We have audited the accompanying statements of assets and liabilities, including the schedules of investments, of AAM S&P 500 High Dividend Value ETF and AAM S&P Emerging Markets High Dividend Value ETF (the “Funds”), each a series of ETF Series Solutions, as of October 31, 2018, and the related statements of operations and changes in net assets and the financial highlights for the period November 28, 2017 (commencement of operations) to October 31, 2018, including the related notes (collectively referred to as the “financial statements”). In our opinion, the financial statements present fairly, in all material respects, the financial position of each of the Funds as of October 31, 2018, and the results of their operations, the changes in their net assets and the financial highlights for the period indicated above, in conformity with accounting principles generally accepted in the United States of America.
Basis for Opinion
These financial statements are the responsibility of the Funds’ management. Our responsibility is to express an opinion on the Funds’ financial statements based on our audit. We are a public accounting firm registered with the Public Company Accounting Oversight Board (United States) (“PCAOB”) and are required to be independent with respect to the Funds in accordance with the U.S. federal securities laws and the applicable rules and regulations of the Securities and Exchange Commission and the PCAOB.
We conducted our audit in accordance with the standards of the PCAOB. Those standards require that we plan and perform the audit to obtain reasonable assurance about whether the financial statements are free of material misstatement, whether due to error or fraud.
Our audit included performing procedures to assess the risks of material misstatement of the financial statements, whether due to error or fraud, and performing procedures that respond to those risks. Such procedures included examining, on a test basis, evidence regarding the amounts and disclosures in the financial statements. Our procedures included confirmation of securities owned as of October 31, 2018, by correspondence with the custodian and brokers. Our audit also included evaluating the accounting principles used and significant estimates made by management, as well as evaluating the overall presentation of the financial statements. We believe that our audit provides a reasonable basis for our opinion.
We have served as the Funds’ auditor since 2017.

COHEN & COMPANY, LTD.
Milwaukee, Wisconsin
December 28, 2018
27
AAM ETFs
TRUSTEES AND OFFICERS
(Unaudited) (Continued)
Additional information about each Trustee of the Trust is set forth below. The address of each Trustee of the Trust is c/o U.S. Bank Global Fund Services, 615 E. Michigan Street, Milwaukee, WI 53202.
|
Number of
|
Other
|
||||
|
Term of
|
Portfolios
|
Directorships
|
|||
|
Office and
|
in Fund
|
Held by
|
|||
|
Name
|
Position
|
Length of
|
Complex
|
Trustee
|
|
|
and Year
|
Held with
|
Time
|
Principal Occupation(s)
|
Overseen
|
During Past
|
|
of Birth
|
the Trust
|
Served
|
During Past 5 Years
|
by Trustee
|
5 Years
|
|
Independent Trustees
|
|||||
|
Leonard M. Rush, CPA
|
Lead
|
Indefinite
|
Retired; formerly Chief
|
45
|
Independent
|
|
Born: 1946
|
Indepen-
|
term;
|
Financial Officer,
|
Trustee,
|
|
|
dent
|
since
|
Robert W. Baird & Co.
|
Managed
|
||
|
Trustee
|
2012
|
Incorporated (wealth
|
Portfolio
|
||
|
and
|
management firm)
|
Series (38
|
|||
|
Audit
|
(2000–2011).
|
portfolios).
|
|||
|
Committee
|
|||||
|
Chairman
|
|||||
|
David A. Massart
|
Trustee
|
Indefinite
|
Co-Founder, President,
|
45
|
Independent
|
|
Born: 1967
|
term;
|
and Chief Investment
|
Trustee,
|
||
|
since
|
Strategist, Next Generation
|
Managed
|
|||
|
2012
|
Wealth Management, Inc.
|
Portfolio
|
|||
|
(since 2005).
|
Series (38
|
||||
|
portfolios).
|
|||||
|
Janet D. Olsen
|
Trustee
|
Indefinite
|
Retired; formerly Managing
|
45
|
Independent
|
|
Born: 1956
|
term;
|
Director and General
|
Trustee, PPM
|
||
|
since
|
Counsel, Artisan Partners
|
Funds
|
|||
|
2018
|
Limited Partnership
|
(9 portfolios)
|
|||
|
(investment adviser) (2000–
|
(since 2018).
|
||||
|
2013); Executive Vice
|
|||||
|
President and General
|
|||||
|
Counsel, Artisan Partners
|
|||||
|
Asset Management Inc.
|
|||||
|
(2012–2013); Vice President
|
|||||
|
and General Counsel, Artisan
|
|||||
|
Funds, Inc. (investment
|
|||||
|
company) (2001–2012).
|
|||||
|
Interested Trustee
|
|||||
|
Michael A. Castino
|
Trustee
|
Indefinite
|
Senior Vice President,
|
45
|
None
|
|
Born: 1967
|
and
|
term;
|
U.S. Bancorp Fund
|
||
|
Chairman
|
Trustee
|
Services, LLC (since 2013);
|
|||
|
since
|
Managing Director of
|
||||
|
2014;
|
Index Services, Zacks
|
||||
|
Chairman
|
Investment Management
|
||||
|
since
|
(2011–2013).
|
||||
|
2013
|
28
AAM ETFs
TRUSTEES AND OFFICERS
(Unaudited) (Continued)
The officers of the Trust conduct and supervise its daily business. The address of each officer of the Trust is c/o U.S. Bank Global Fund Services, 615 E. Michigan Street, Milwaukee, WI 53202. Additional information about the Trust’s officers is as follows:
|
Term of
|
|||
|
Office and
|
|||
|
Name
|
Position(s)
|
Length of
|
|
|
and Year
|
Held with
|
Time
|
|
|
of Birth
|
the Fund
|
Served
|
Principal Occupation(s) During Past Five Years
|
|
Paul R. Fearday, CPA
|
President
|
Indefinite
|
Senior Vice President, U.S. Bancorp Fund Services, LLC
|
|
Born: 1979
|
and
|
term;
|
(since 2008); Manager, PricewaterhouseCoopers LLP
|
|
Assistant
|
President
|
(accounting firm) (2002–2008).
|
|
|
Treasurer
|
and
|
||
|
Assistant
|
|||
|
Treasurer
|
|||
|
since 2014
|
|||
|
(other roles
|
|||
|
since 2013)
|
|||
|
Michael D. Barolsky, Esq.
|
Vice
|
Indefinite
|
Vice President, U.S. Bancorp Fund Services, LLC
|
|
Born: 1981
|
President
|
term;
|
(since 2012); Associate, Thompson Hine LLP
|
|
and
|
since 2014
|
(law firm) (2008–2012).
|
|
|
Secretary
|
(other roles
|
||
|
since 2013)
|
|||
|
James R. Butz
|
Chief
|
Indefinite
|
Senior Vice President, U.S. Bancorp Fund Services, LLC
|
|
Born: 1982
|
Compliance
|
term;
|
(since 2015); Vice President, U.S. Bancorp Fund
|
|
Officer
|
since
|
Services, LLC (2014–2015); Assistant Vice President,
|
|
|
2015
|
U.S. Bancorp Fund Services, LLC (2011–2014).
|
||
|
Kristen M. Weitzel, CPA
|
Treasurer
|
Indefinite
|
Vice President, U.S. Bancorp Fund Services, LLC
|
|
Born: 1977
|
term;
|
(since 2015); Assistant Vice President, U.S. Bancorp
|
|
|
since 2014
|
Fund Services, LLC (2011–2015); Manager,
|
||
|
(other roles
|
PricewaterhouseCoopers LLP (accounting firm)
|
||
|
since 2013)
|
(2005–2011).
|
||
|
Brett M. Wickmann
|
Assistant
|
Indefinite
|
Vice President, U.S. Bancorp Fund Services, LLC
|
|
Born: 1982
|
Treasurer
|
term;
|
(since 2017); Assistant Vice President, U.S. Bancorp
|
|
since 2017
|
Fund Services, LLC (2012–2017).
|
||
|
Elizabeth A. Winske
|
Assistant
|
Indefinite
|
Assistant Vice President, U.S. Bancorp Fund Services,
|
|
Born: 1983
|
Treasurer
|
term;
|
LLC (since 2016); Officer, U.S. Bancorp Fund Services,
|
|
since 2017
|
LLC (2012–2016).
|
The Statement of Additional Information (“SAI”) includes additional information about the Trustees and is available without charge, upon request, by calling toll free (800) 617-0004, by accessing the Securities and Exchange Commission’s (“SEC”) website at www.sec.gov, or by accessing the Fund’s website at www.aamlive.com.
29
AAM ETFs
EXPENSE EXAMPLES
For the Period Ended October 31, 2018 (Unaudited)
As a shareholder of the Funds you incur two types of costs: (1) transaction costs, including brokerage commissions on purchases and sales of Fund shares, and (2) ongoing costs, including management fees and other Fund expenses. This example is intended to help you understand your ongoing costs (in dollars) of investing in the Fund and to compare these costs with the ongoing costs of investing in other funds. The example is based on an investment of $1,000 invested at the beginning of the period and held for the current period (May 1, 2018 – October 31, 2018).
Actual Expenses
The first line of the table provides information about actual account values based on actual returns and actual expenses. You may use the information in this line, together with the amount you invested, to estimate the expenses that you paid over the period. Simply divide your account value by $1,000 (for example, an $8,600 account value divided by $1,000 = 8.6), then, multiply the result by the number in the first line under the heading entitled “Expenses Paid During Period’’ to estimate the expenses you paid on your account during this period.
Hypothetical Example for Comparison Purposes
The second line of the table provides information about hypothetical account values based on a hypothetical return and hypothetical expenses based on the Fund’s actual expense ratio and an assumed rate of return of 5% per year before expenses, which is not the Fund’s actual return. The hypothetical account values and expenses may not be used to estimate the actual ending account balance or expenses you paid for the period. You may use this information to compare the ongoing costs of investing in the Fund and other funds. To do so, compare this 5% hypothetical example with the 5% hypothetical examples that appear in the shareholder reports of the other funds. Please note that the expenses shown in the table are meant to highlight your ongoing costs only and do not reflect any transactional costs, such as brokerage commissions paid on purchases and sales of Fund shares. Therefore, the second line of the table is useful in comparing ongoing costs only and will not help you determine the relative total costs of owning different funds. If these transactional costs were included, your costs would have been higher.
30
AAM ETFs
EXPENSE EXAMPLES
For the Period Ended October 31, 2018 (Unaudited) (Continued)
AAM S&P 500 High Dividend Value ETF
|
Beginning
|
Ending
|
||
|
Account Value
|
Account Value
|
Expenses Paid
|
|
|
May 1, 2018
|
October 31, 2018
|
During the Period(1)
|
|
|
Actual
|
$1,000.00
|
$ 999.00
|
$1.46
|
|
Hypothetical (5% annual
|
$1,000.00
|
$1,023.74
|
$1.48
|
|
return before expenses)
|
|
(1)
|
The dollar amounts shown as expenses paid during the period are equal to the annualized six-month period expense ratio, 0.29%, multiplied by the average account value during the period, multiplied by the number of days in the most recent six-month period, 184 days, and divided by the number of days in the most recent twelve-month period, 365 days.
|
AAM S&P Emerging Markets High Dividend Value ETF
|
Beginning
|
Ending
|
||
|
Account Value
|
Account Value
|
Expenses Paid
|
|
|
May 1, 2018
|
October 31, 2018
|
During the Period(2)
|
|
|
Actual
|
$1,000.00
|
$ 874.00
|
$2.31
|
|
Hypothetical (5% annual
|
$1,000.00
|
$1,022.74
|
$2.50
|
|
return before expenses)
|
|
(2)
|
The dollar amounts shown as expenses paid during the period are equal to the annualized expense ratio, 0.49%, multiplied by the average account value during the period, multiplied by the number of days in the most recent period, 184 days, and divided by the number of days in the most recent twelve-month period, 365 days.
|
31
AAM ETFs
FEDERAL TAX INFORMATION
(Unaudited)
For the fiscal period ended October 31, 2018, certain dividends paid by the Funds may be subject to the maximum rate of 23.8%, as provided for by the Jobs and Growth Tax relief Reconciliation Act of 2003.
The percentage of dividends declared from ordinary income designated as qualified dividend income was as follows:
|
AAM S&P 500 High Dividend Value ETF
|
21.78%
|
|
|
AAM S&P Emerging Markets High Dividend Value ETF
|
0.00%
|
For corporate shareholders, the percentage of ordinary income distributions qualified for the corporate dividend received deduction for the fiscal period ended October 31, 2018 was as follows:
|
AAM S&P 500 High Dividend Value ETF
|
0.00%
|
|
|
AAM S&P Emerging Markets High Dividend Value ETF
|
0.00%
|
The percentage of taxable ordinary income distributions that are designated as short-term capital gain distributions under Internal Revenue Section 871(k)(2)(C) for each Fund were as follows:
|
AAM S&P 500 High Dividend Value ETF
|
0.00%
|
|
|
AAM S&P Emerging Markets High Dividend Value ETF
|
0.00%
|
FEDERAL TAX CREDIT PASS THROUGH
(Unaudited)
Pursuant to Section 853 of the Internal Revenue code, The Funds designate the following amounts as foreign taxes paid for the period ended October 31, 2018. Foreign taxes paid for purposes of Section 853 may be less than actual foreign taxes paid for financial statement purposes.
|
Portion of
|
|||
|
Creditable
|
Ordinary Income
|
||
|
Foreign
|
Per
|
Distribution Derived
|
|
|
Tax Credit
|
Share
|
from Foreign
|
|
|
Paid
|
Amount
|
Sourced Income
|
|
|
AAM S&P 500 High Dividend Value ETF
|
$ —
|
$ —
|
—
|
|
AAM S&P Emerging Markets
|
|||
|
High Dividend Value ETF
|
$18,060
|
$0.1806
|
99.82%
|
Foreign taxes paid or withheld should be included in taxable income with an offsetting deduction from gross income or as a credit for taxes paid to foreign governments.
Above figures may differ from those cited elsewhere in this report due to differences in the calculation of income and gains under U.S. GAAP purposes and Internal Revenue Service purposes.
Shareholders are strongly advised to consult their own tax advisers with respect to the tax consequences of their investments in the Funds.
32
AAM ETFs
INFORMATION ABOUT PORTFOLIO HOLDINGS
(Unaudited)
Each Fund files its complete schedules of portfolio holdings for its first and third fiscal quarters with the SEC on Form N-Q. The Funds’ Form N-Q is available without charge, upon request, by calling toll-free at (800) 617-0004. Furthermore, you may obtain the Form N-Q on the SEC’s website at www.sec.gov. The Funds’ portfolio holdings are posted on their website at www.aamlive.com daily.
INFORMATION ABOUT PROXY VOTING
(Unaudited)
A description of the policies and procedures the Funds use to determine how to vote proxies relating to portfolio securities is provided in the SAI. The SAI is available without charge, upon request, by calling toll-free at (800) 617-0004, by accessing the SEC’s website at www.sec.gov, or by accessing the Fund’s website at www.aamlive.com.
Information regarding how the Funds voted proxies relating to portfolio securities during the period ending June 30 is available by calling toll-free at (800) 617-0004 or by accessing the SEC’s website at www.sec.gov.
FREQUENCY DISTRIBUTION OF PREMIUMS AND DISCOUNTS
(Unaudited)
Information regarding how often shares of the Funds trade on the exchange at a price about (i.e. at a premium) or below (i.e. at a discount) the NAV of the Funds are available, without charge on the Fund’s website at www.aamlive.com.
33
Adviser
Advisors Asset Management, Inc.
18925 Base Camp Road, Suite 203
Monument, Colorado 80132
Sub-Adviser
Vident Investment Advisory, LLC
300 Colonial Center Parkway, Suite 330
Roswell, Georgia 30076
Index Provider
S&P Opco, LLC c/o S&P Dow Jones Indices LLC
55 Water Street
New York, New York 10041
Distributor
Quasar Distributors, LLC
777 East Wisconsin Avenue, 6th Floor
Milwaukee, Wisconsin 53202
Custodian
U.S. Bank National Association
1555 North Rivercenter Drive, Suite 302
Milwaukee, Wisconsin 53212
Transfer Agent
U.S. Bancorp Fund Services, LLC
615 East Michigan Street
Milwaukee, Wisconsin 53202
Independent Registered Public Accounting Firm
Cohen & Company, Ltd.
342 North Water Street, Suite 830
Milwaukee, Wisconsin 53202
Legal Counsel
Morgan, Lewis, & Bockius, LLP
1111 Pennsylvania Avenue, NW
Washington, DC 20004
AAM S&P 500 High Dividend Value ETF
Symbol – SPDV
CUSIP – 26922A594
AAM S&P Emerging Markets High Dividend Value ETF
Symbol – EEMD
CUSIP – 26922A586
Item 2. Code of Ethics.
The registrant has adopted a code of ethics that applies to the registrant’s principal executive officer and principal financial officer. The registrant has not made any amendments to its code of ethics during the period covered by this report. The registrant has not granted any waivers from any provisions of the code of ethics during the period covered by this report.
A copy of the registrant’s Code of Ethics is filed herewith.
Item 3. Audit Committee Financial Expert.
The registrant’s board of trustees has determined that there is at least one audit committee financial expert serving on its audit committee. Mr. Leonard Rush is the “audit committee financial expert” and is considered to be “independent” as each term is defined in Item 3 of Form N‑CSR.
Item 4. Principal Accountant Fees and Services.
The registrant has engaged its principal accountant to perform audit services, audit-related services, tax services and other services during the fiscal year. “Audit services” refer to performing an audit of the registrant's annual financial statements or services that are normally provided by the accountant in connection with statutory and regulatory filings or engagements for those fiscal years. “Audit-related services” refer to the assurance and related services by the principal accountant that are reasonably related to the performance of the audit. “Tax services” refer to professional services rendered by the principal accountant for tax compliance, tax advice, and tax planning. There were no “Other services” provided by the principal accountant. The following table details the aggregate fees billed or expected to be billed for each of the last two fiscal years for audit fees, audit-related fees, tax fees and other fees by the principal accountant.
AAM S&P 500 High Dividend Value ETF
|
FYE 10/31/2018
|
|
|
Audit Fees
|
$14,000
|
|
Audit-Related Fees
|
N/A
|
|
Tax Fees
|
$3,000
|
|
All Other Fees
|
N/A
|
AAM S&P Emerging Markets High Dividend Value ETF
|
FYE 10/31/2018
|
|
|
Audit Fees
|
$15,000
|
|
Audit-Related Fees
|
N/A
|
|
Tax Fees
|
$3,000
|
|
All Other Fees
|
N/A
|
The audit committee has adopted pre-approval policies and procedures that require the audit committee to pre‑approve all audit and non‑audit services of the registrant, including services provided to any entity affiliated with the registrant.
The percentage of fees billed by Cohen & Company, Ltd. applicable to non-audit services pursuant to waiver of pre-approval requirement were as follows:
AAM S&P 500 High Dividend Value ETF
|
FYE 10/31/2018
|
|
|
Audit-Related Fees
|
0%
|
|
Tax Fees
|
0%
|
|
All Other Fees
|
0%
|
AAM S&P Emerging Markets High Dividend Value ETF
|
FYE 10/31/2018
|
|
|
Audit-Related Fees
|
0%
|
|
Tax Fees
|
0%
|
|
All Other Fees
|
0%
|
All of the principal accountant’s hours spent on auditing the registrant’s financial statements were attributed to work performed by full‑time permanent employees of the principal accountant.
The following table indicates the non-audit fees billed or expected to be billed by the registrant’s accountant for services to the registrant and to the registrant’s investment adviser (and any other controlling entity, etc.—not sub-adviser) for the year. The audit committee of the board of trustees/directors has considered whether the provision of non-audit services that were rendered to the registrant's investment adviser is compatible with maintaining the principal accountant's independence and has concluded that the provision of such non-audit services by the accountant has not compromised the accountant’s independence.
AAM S&P 500 High Dividend Value ETF
|
Non-Audit Related Fees
|
FYE 10/31/2018
|
|
Registrant
|
N/A
|
|
Registrant’s Investment Adviser
|
N/A
|
AAM S&P Emerging Markets High Dividend Value ETF
|
Non-Audit Related Fees
|
FYE 10/31/2018
|
|
Registrant
|
N/A
|
|
Registrant’s Investment Adviser
|
N/A
|
Item 5. Audit Committee of Listed Registrants.
The registrant is an issuer as defined in Rule 10A-3 under the Securities Exchange Act of 1934, (the “Act”) and has a separately-designated standing audit committee established in accordance with Section 3(a)(58)(A) of the Act. The independent members of the committee are as follows: Leonard M. Rush, David A. Massart, and Janet D. Olsen.
Item 6. Investments.
Schedule of Investments is included as part of the report to shareholders filed under Item 1 of this Form.
Item 7. Disclosure of Proxy Voting Policies and Procedures for Closed-End Management Investment Companies.
Not applicable to open-end investment companies.
Item 8. Portfolio Managers of Closed-End Management Investment Companies.
Not applicable to open-end investment companies.
Item 9. Purchases of Equity Securities by Closed‑End Management Investment Company and Affiliated Purchasers.
Not applicable to open-end investment companies.
Item 10. Submission of Matters to a Vote of Security Holders.
There have been no material changes to the procedures by which shareholders may recommend nominees to the registrant’s board of Trustees.
Item 11. Controls and Procedures.
|
(a)
|
The Registrant’s President (principal executive officer) and Treasurer (principal financial officer) have reviewed the Registrant's disclosure controls and procedures (as defined in Rule 30a-3(c) under the Investment Company Act of 1940 (the “Act”)) as of a date within 90 days of the filing of this report, as required by Rule 30a-3(b) under the Act and Rules 13a-15(b) or 15d‑15(b) under the Securities Exchange Act of 1934. Based on their review, such officers have concluded that the disclosure controls and procedures are effective in ensuring that information required to be disclosed in this report is appropriately recorded, processed, summarized and reported and made known to them by others within the Registrant and by the Registrant’s service provider.
|
|
(b)
|
There were no changes in the Registrant's internal control over financial reporting (as defined in Rule 30a-3(d) under the Act) that occurred during the second fiscal quarter of the period covered by this report that has materially affected, or is reasonably likely to materially affect, the Registrant's internal control over financial reporting.
|
Item 12. Disclosure of Securities Lending Activities for Closed-End Management Investment Companies.
Not applicable to open-end investment companies.
Item 13. Exhibits.
|
(a)
|
(1) Any code of ethics or amendment thereto, that is the subject of the disclosure required by Item 2, to the extent that the registrant intends to satisfy Item 2 requirements through filing an exhibit. Filed herewith.
|
(2) A separate certification for each principal executive officer and principal financial officer pursuant to Section 302 of the Sarbanes-Oxley Act of 2002. Filed herewith.
(3) Any written solicitation to purchase securities under Rule 23c‑1 under the Act sent or given during the period covered by the report by or on behalf of the registrant to 10 or more persons. Not applicable to open-end investment companies.
(4) Change in the registrant’s independent public accountant. There was no change in the registrant’s independent public accountant for the period covered by this report.
|
(b)
|
Certifications pursuant to Section 906 of the Sarbanes‑Oxley Act of 2002. Furnished herewith.
|
|
SIGNATURES
|
Pursuant to the requirements of the Securities Exchange Act of 1934 and the Investment Company Act of 1940, the registrant has duly caused this report to be signed on its behalf by the undersigned, thereunto duly authorized.
(Registrant) ETF Series Solutions
By (Signature and Title)* /s/ Paul R. Fearday
Paul R. Fearday, President (principal executive officer)
Date January 4, 2019
Pursuant to the requirements of the Securities Exchange Act of 1934 and the Investment Company Act of 1940, this report has been signed below by the following persons on behalf of the registrant and in the capacities and on the dates indicated.
By (Signature and Title)* /s/ Paul R. Fearday
Paul Fearday, President (principal executive officer)
Date January 4, 2019
By (Signature and Title)* s/ Kristen M. Weitzel
Kristen M. Weitzel, Treasurer (principal financial officer)
Date January 4, 2019
ETF Series Solutions
Code of Ethics
For Principal Executive Officer & Principal Financial Officer
This Code of Ethics is designed to comply with Section 406 of the Sarbanes-Oxley Act of 2002 and the rules promulgated by the Securities and Exchange Commission (the “SEC”) thereunder. This Code of Ethics is in addition to, not in replacement of, the ETF Series Solutions (the “Trust”) Code of Ethics for access persons (the “Investment Company Code of Ethics”), adopted pursuant to Rule 17j-1 under the Investment Company Act of 1940, as amended (the “Investment Company Act”). The persons covered by this Code of Ethics may also be subject to the Investment Company Code of Ethics.
The Trust requires its Principal Executive Officer, Principal Financial Officer, or other Trust officers performing similar functions (the “Principal Officers”), to maintain the highest ethical and legal standards while performing their duties and responsibilities to the Trust and each of its series (each a “Fund,” collectively the “Funds”), with particular emphasis on those duties that relate to the preparation and reporting of the financial information of the Funds. The following principles and responsibilities shall govern the professional conduct of the Principal Officers:
1. HONEST AND ETHICAL CONDUCT.
The Principal Officers shall act with honesty and integrity, avoiding actual or apparent conflicts of interest in personal and professional relationships, and shall report any material transaction or relationship that reasonably could be expected to give rise to such conflict between their interests and those of a Fund to the Audit Committee, the full Board of Trustees of the Trust, and, in addition, to any other appropriate person or entity that may reasonably be expected to deal with any conflict of interest in timely and expeditious manner.
The Principal Officers shall act in good faith, responsibly, with due care, competence and diligence, without misrepresenting material facts or allowing their independent judgment to be subordinated or compromised.
2. FINANCIAL RECORDS AND REPORTING
The Principal Officers shall provide full, fair, accurate, timely and understandable disclosure in the reports and/or other documents to be filed with or submitted to the Securities and Exchange Commission or other applicable body by a Fund, or that is otherwise publicly disclosed or communicated. The Principal Officers shall comply with applicable rules and regulations of federal, state, and local governments, and other appropriate private and public regulatory agencies.
The Principal Officers shall respect the confidentiality of information acquired in the course of their work and shall not disclose such information except when authorized or legally obligated to disclose. The Principal Officers will not use confidential information acquired in the course of their duties as Principal Officers.
The Principal Officers shall share knowledge and maintain skills important and relevant to the Trust’s needs; shall proactively promote ethical behavior of the Trust’s employees and with industry peers and associates; and shall maintain control over and responsibly manage assets and resources employed or entrusted to them by the Trust.
3. COMPLIANCE WITH LAWS, RULES AND REGULATIONS
The Principal Officers shall establish and maintain mechanisms to oversee the compliance of the Funds with applicable federal, state or local law, regulation or administrative rule, and to identify, report and correct in a swift and certain manner, any detected deviations from applicable federal, state or local law regulation or rule.
4. COMPLIANCE WITH THIS CODE OF ETHICS
The Principal Officers shall promptly report any violations of this Code of Ethics to the Audit Committee as well as the full Board of Trustees of the Trust and shall be held accountable for strict adherence to this Code of Ethics. A proven failure to uphold the standards stated herein shall be grounds for such sanctions as shall be reasonably imposed by the Board of Trustees of the Trust.
5. AMENDMENT AND WAIVER
This Code of Ethics may only be amended or modified by approval of the Board of Trustees. Any substantive amendment that is not technical or administrative in nature or any material waiver, implicit or otherwise, of any provision of this Code of Ethics, shall be communicated publicly in accordance with Item 2 of Form N-CSR under the Investment Company Act of 1940.
Adopted: March 27, 2012
CERTIFICATIONS
I, Paul R. Fearday, certify that:
|
1.
|
I have reviewed this report on Form N-CSR of the ETF Series Solutions;
|
|
2.
|
Based on my knowledge, this report does not contain any untrue statement of a material fact or omit to state a material fact necessary to make the statements made, in light of the circumstances under which such statements were made, not misleading with respect to the period covered by this report;
|
|
3.
|
Based on my knowledge, the financial statements, and other financial information included in this report, fairly present in all material respects the financial condition, results of operations, changes in net assets, and cash flows (if the financial statements are required to include a statement of cash flows) of the registrant as of, and for, the periods presented in this report;
|
|
4.
|
The registrant’s other certifying officer(s) and I are responsible for establishing and maintaining disclosure controls and procedures (as defined in Rule 30a-3(c) under the Investment Company Act of 1940) and internal control over financial reporting (as defined in Rule 30a-3(d) under the Investment Company Act of 1940) for the registrant and have:
|
|
(a)
|
Designed such disclosure controls and procedures, or caused such disclosure controls and procedures to be designed under our supervision, to ensure that material information relating to the registrant, including its consolidated subsidiaries, is made known to us by others within those entities, particularly during the period in which this report is being prepared;
|
|
(b)
|
Designed such internal control over financial reporting, or caused such internal control over financial reporting to be designed under our supervision, to provide reasonable assurance regarding the reliability of financial reporting and the preparation of financial statements for external purposes in accordance with generally accepted accounting principles;
|
|
(c)
|
Evaluated the effectiveness of the registrant's disclosure controls and procedures and presented in this report our conclusions about the effectiveness of the disclosure controls and procedures, as of a date within 90 days prior to the filing date of this report based on such evaluation; and
|
|
(d)
|
Disclosed in this report any change in the registrant’s internal control over financial reporting that occurred during the second fiscal quarter of the period covered by this report that has materially affected, or is reasonably likely to materially affect, the registrant’s internal control over financial reporting; and
|
|
5.
|
The registrant’s other certifying officer(s) and I have disclosed to the registrant’s auditors and the audit committee of the registrant’s board of directors (or persons performing the equivalent functions):
|
|
(a)
|
All significant deficiencies and material weaknesses in the design or operation of internal control over financial reporting which are reasonably likely to adversely affect the registrant’s ability to record, process, summarize, and report financial information; and
|
|
(b)
|
Any fraud, whether or not material, that involves management or other employees who have a significant role in the registrant’s internal control over financial reporting.
|
|
Date: January 4, 2019
|
/s/ Paul R. Fearday
Paul R. Fearday
President (principal executive officer) ETF Series Solutions
|
CERTIFICATIONS
I, Kristen M. Weitzel, certify that:
|
1.
|
I have reviewed this report on Form N-CSR of the ETF Series Solutions;
|
|
2.
|
Based on my knowledge, this report does not contain any untrue statement of a material fact or omit to state a material fact necessary to make the statements made, in light of the circumstances under which such statements were made, not misleading with respect to the period covered by this report;
|
|
3.
|
Based on my knowledge, the financial statements, and other financial information included in this report, fairly present in all material respects the financial condition, results of operations, changes in net assets, and cash flows (if the financial statements are required to include a statement of cash flows) of the registrant as of, and for, the periods presented in this report;
|
|
4.
|
The registrant’s other certifying officer(s) and I are responsible for establishing and maintaining disclosure controls and procedures (as defined in Rule 30a-3(c) under the Investment Company Act of 1940) and internal control over financial reporting (as defined in Rule 30a-3(d) under the Investment Company Act of 1940) for the registrant and have:
|
|
(a)
|
Designed such disclosure controls and procedures, or caused such disclosure controls and procedures to be designed under our supervision, to ensure that material information relating to the registrant, including its consolidated subsidiaries, is made known to us by others within those entities, particularly during the period in which this report is being prepared;
|
|
(b)
|
Designed such internal control over financial reporting, or caused such internal control over financial reporting to be designed under our supervision, to provide reasonable assurance regarding the reliability of financial reporting and the preparation of financial statements for external purposes in accordance with generally accepted accounting principles;
|
|
(c)
|
Evaluated the effectiveness of the registrant’s disclosure controls and procedures and presented in this report our conclusions about the effectiveness of the disclosure controls and procedures, as of a date within 90 days prior to the filing date of this report based on such evaluation; and
|
|
(d)
|
Disclosed in this report any change in the registrant’s internal control over financial reporting that occurred during the second fiscal quarter of the period covered by this report that has materially affected, or is reasonably likely to materially affect, the registrant’s internal control over financial reporting; and
|
|
5.
|
The registrant’s other certifying officer(s) and I have disclosed to the registrant’s auditors and the audit committee of the registrant’s board of directors (or persons performing the equivalent functions):
|
|
(a)
|
All significant deficiencies and material weaknesses in the design or operation of internal control over financial reporting which are reasonably likely to adversely affect the registrant’s ability to record, process, summarize, and report financial information; and
|
|
(b)
|
Any fraud, whether or not material, that involves management or other employees who have a significant role in the registrant’s internal control over financial reporting.
|
|
Date: January 4, 2019
|
/s/ Kristen M. Weitzel
Kristen M. Weitzel Treasurer (principal financial officer) ETF Series Solutions
|
Certification Pursuant to Section 906 of the Sarbanes-Oxley Act
Pursuant to Section 906 of the Sarbanes-Oxley Act of 2002, each of the undersigned officers of the ETF Series Solutions, does hereby certify, to such officer’s knowledge, that the report on Form N-CSR of the ETF Series Solutions for the period ended October 31, 2018 fully complies with the requirements of Section 13(a) or 15(d) of the Securities Exchange Act of 1934, as applicable, and that the information contained in the Form N-CSR fairly presents, in all material respects, the financial condition and results of operations of the ETF Series Solutions for the stated period.
|
/s/ Paul R. Fearday
Paul R. Fearday
President (principal executive officer)
ETF Series Solutions
|
/s/ Kristen M. Weitzel
Kristen M. Weitzel
Treasurer (principal financial officer)
ETF Series Solutions
|
|
Dated: January 4, 2019
|
Dated: January 4, 2019
|
This statement accompanies this report on Form N-CSR pursuant to Section 906 of the Sarbanes-Oxley Act of 2002 and shall not be deemed as filed by the ETF Series Solutions for purposes of Section 18 of the Securities Exchange Act of 1934.
Serious News for Serious Traders! Try StreetInsider.com Premium Free!
You May Also Be Interested In
- REI Path Ahead Ventures celebrates 16 emerging companies bringing new innovations and perspectives to the outdoor industry
- PPX Continues To Deliver Solid Exploration Results At Callanquitas With Up To 18.93 Au g/t
- Al Capone's "Sweetheart" Colt .45 Pistol Announced for Auction by Richmond Auctions
Create E-mail Alert Related Categories
SEC FilingsSign up for StreetInsider Free!
Receive full access to all new and archived articles, unlimited portfolio tracking, e-mail alerts, custom newswires and RSS feeds - and more!
