

Form N-CSR EATON VANCE TAX ADVANTAG For: Oct 31
 Tweet
Tweet Share
Share
UNITED STATES
SECURITIES AND EXCHANGE COMMISSION
Washington, D.C. 20549
Form N-CSR
CERTIFIED SHAREHOLDER REPORT OF REGISTERED
MANAGEMENT INVESTMENT COMPANIES
Investment Company Act File Number: 811-21470
Eaton Vance Tax-Advantaged Global Dividend Income Fund
(Exact Name of Registrant as Specified in Charter)
Two International Place, Boston, Massachusetts 02110
(Address of Principal Executive Offices)
Deidre E. Walsh
Two International Place, Boston, Massachusetts 02110
(Name and Address of Agent for Services)
(617) 482-8260
(Registrant’s Telephone Number)
October 31
Date of Fiscal Year End
October 31, 2021
Date of Reporting Period
Item 1. Reports to Stockholders

Eaton Vance
Tax-Advantaged Global Dividend Income Fund (ETG)
Annual Report
October 31, 2021

Commodity Futures Trading Commission Registration. The Commodity Futures Trading Commission (“CFTC”) has adopted regulations that subject registered investment companies and advisers to regulation by the CFTC if a fund invests more than a prescribed level of its assets in certain CFTC-regulated instruments (including futures, certain options and swap agreements) or markets itself as providing investment exposure to such instruments. The investment adviser has claimed an exclusion from the definition of “commodity pool operator” under the Commodity Exchange Act with respect to its management of the Fund. Accordingly, neither the Fund nor the adviser with respect to the operation of the Fund is subject to CFTC regulation. Because of its management of other strategies, the Fund’s adviser is registered with the CFTC as a commodity pool operator. The adviser is also registered as a commodity trading advisor.
Managed Distribution Plan. Pursuant to an exemptive order issued by the Securities and Exchange Commission (Order), the Fund is authorized to distribute long-term capital gains to shareholders more frequently than once per year. Pursuant to the Order, the Fund’s Board of Trustees approved a Managed Distribution Plan (MDP) pursuant to which the Fund makes monthly cash distributions to common shareholders, stated in terms of a fixed amount per common share.
The Fund currently distributes monthly cash distributions equal to $0.1300 per share in accordance with the MDP. You should not draw any conclusions about the Fund’s investment performance from the amount of these distributions or from the terms of the MDP. The MDP will be subject to regular periodic review by the Fund’s Board of Trustees and the Board may amend or terminate the MDP at any time without prior notice to Fund shareholders. However, at this time there are no reasonably foreseeable circumstances that might cause the termination of the MDP.
The Fund may distribute more than its net investment income and net realized capital gains and, therefore, a distribution may include a return of capital. A return of capital distribution does not necessarily reflect the Fund’s investment performance and should not be confused with “yield” or “income.” With each distribution, the Fund will issue a notice to shareholders and a press release containing information about the amount and sources of the distribution and other related information. The amounts and sources of distributions contained in the notice and press release are only estimates and are not provided for tax purposes. The amounts and sources of the Fund’s distributions for tax purposes will be reported to shareholders on Form 1099-DIV for each calendar year.
Fund shares are not insured by the FDIC and are not deposits or other obligations of, or guaranteed by, any depository institution. Shares are subject to investment risks, including possible loss of principal invested.
Annual Report October 31, 2021
Eaton Vance
Tax-Advantaged Global Dividend Income Fund
| 2 | ||||
| 4 | ||||
| 5 | ||||
| The Fund’s Investment Objectives, Principal Strategies and Principal Risks |
6 | |||
| 9 | ||||
| 10 | ||||
| 30 | ||||
| 31 | ||||
| 32 | ||||
| 33 | ||||
| 35 | ||||
| 38 | ||||
| 40 | ||||
| 46 |
Eaton Vance
Tax-Advantaged Global Dividend Income Fund
October 31, 2021
Management’s Discussion of Fund Performance1
Economic and Market Conditions
The 12-month period starting November 1, 2020 was notable for a global equity rally that began in the opening month of the period and continued through period-end — except for a pause in January 2021 and a temporary retreat the following September. For the period as a whole, broad-market stock indexes generally posted strong double-digit returns as investors cheered the reopening of businesses that had been affected by the COVID-19 pandemic and the rollout of several highly effective vaccines.
The COVID-19 virus, however, continued to have a firm grip on the global economy. Disease rates advanced and declined with second and third waves of COVID-19 infections. Worker shortages led to global supply chain disruptions. From computer chips to shipping containers, scarcities of key items led to temporary factory shutdowns and empty store shelves. In the U.S., those shortages — combined with high demand from consumers eager to spend money they had saved earlier in the pandemic — led to higher year-over-year inflation than the economy had seen in years.
Still, investor optimism about a recovering economy drove stock prices up during most of the period. The only significant pullback occurred in September 2021, when stock indexes around the world reported negative returns. In the U.S., unexpectedly weak job creation in August and the U.S. Federal Reserve’s announcement that it might soon begin reducing its monthly bond purchases — which had stimulated the economy earlier — combined to drive U.S. stocks into negative territory. Across the globe, rising COVID-19 infections weighed on equity performance.
In the final month of the period, however, stock prices came roaring back. In the U.S., earnings season brought news that a large majority of companies had beaten analysts’ expectations. For October 2021, both the broad-market S&P 500® Index and the technology-laden Nasdaq Composite Index reported their best monthly performances since November 2020.
In China, the world’s second-largest economy, the Communist Party’s efforts to dial back capitalism and take more control of China’s surging technology sector were not applauded by global investors. The MSCI Golden Dragon Index, a measure of Chinese large-cap and mid-cap stocks, was one of the worst-performing major stock indexes for the one-year period, returning 3.84%.
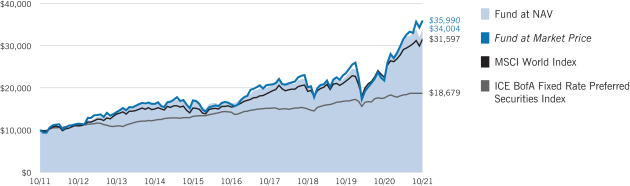
Most other indexes fared significantly better. The MSCI World Index, a broad measure of global equities, returned 40.42% for the 12 months ended October 31, 2021; while the S&P 500® Index returned 42.91%; and the Nasdaq Composite Index rose 42.99%. The MSCI EAFE Index of developed-market international equities returned 34.18%, while the MSCI Emerging Markets Index returned 16.96% during the period.
Fund Performance
For the 12-month period ended October 31, 2021, Eaton Vance Tax-Advantaged Global Dividend Income Fund (the Fund) returned 49.37% at net asset value of its common shares (NAV), outperforming its benchmark, the MSCI World Index (the Index), which returned 40.42%.
The Fund’s common stock allocation outperformed the Index and, thus, contributed to Fund performance versus the Index during the period. Within the Fund’s common stock allocation, contributors to performance relative to the Index included stock selections in the health care sector; stock selections and an overweight position relative to the Index in the financials sector; and stock selections and an underweight position in the information technology (IT) sector.
In the health care sector, the Fund’s overweight position in Eli Lilly & Co., a global drug maker specializing in diabetes, oncology, and immunology therapies, rose in price in light of positive test data for its next-generation diabetes drug.
In the IT sector, the Fund’s overweight position relative to the Index in ASML Holding NV (ASML), a Netherlands-headquartered manufacturer of semiconductor manufacturing equipment, more than doubled in price as demand for semiconductors increased. ASML was well positioned to benefit from a worldwide semiconductor shortage during the period, as it had a near monopoly on the machines used to make increasingly powerful semiconductor chips.
The Fund’s use of leverage also contributed to performance versus the Index, which does not employ leverage. Leverage had the effect of magnifying the Fund’s overall positive absolute performance during the period.
In contrast, stock selections in the consumer discretionary sector detracted from Fund performance versus the Index. Within the sector, not owning electric vehicle maker and Index component Tesla, Inc. (Tesla) — due in part to concerns about inconsistency of earnings and the company’s high valuation — hurt performance relative to the Index when Tesla’s stock performed strongly as vehicle deliveries and profits rose during the period. Tesla’s stock received an additional boost in the final week of the period when car rental firm The Hertz Corp. announced it was purchasing 100,000 Tesla cars for its rental fleet.
See Endnotes and Additional Disclosures in this report.
Past performance is no guarantee of future results. Returns are historical and are calculated net of management fees and other expenses by determining the percentage change in net asset value (NAV) or market price (as applicable) with all distributions reinvested in accordance with the Fund’s Dividend Reinvestment Plan. Performance at market price will differ from performance at NAV due to variations in the Fund’s market price versus NAV, which may reflect factors such as fluctuations in supply and demand for Fund shares, changes in Fund distributions, shifting market expectations for the Fund’s future returns and distribution rates, and other considerations affecting the trading prices of closed-end funds. Investment return and principal value will fluctuate so that shares, when sold, may be worth more or less than their original cost. Performance for periods less than or equal to one year is cumulative. Performance is for the stated time period only; due to market volatility, current Fund performance may be lower or higher than the quoted return. For performance as of the most recent month-end, please refer to eatonvance.com.
| 2 |
Eaton Vance
Tax-Advantaged Global Dividend Income Fund
October 31, 2021
Management’s Discussion of Fund Performance1 — continued
The Fund’s allocation to preferred securities, however, was the largest detractor from performance versus the Index. The Fund’s preferred securities allocation — preferred stocks, exchange-traded funds investing primarily in preferred stocks, and corporate bonds and other debt securities with preferred characteristics — underperformed the strong performance of the Index, but outperformed the overall preferred securities market, as measured by the ICE BofA Fixed Rate Preferred Securities Index (the Preferred Index).
An overweight exposure, relative to the Preferred Index, to energy company securities was the largest contributor to the Fund’s performance versus the Preferred Index, as those securities benefited from a significant rise in oil and gas prices. In addition, some of the Fund’s preferred holdings in other industries that had been heavily impacted by COVID-19 — including real estate, agriculture, and aircraft leasing — experienced strong recoveries in price during the period.
Fund Distributions
Pursuant to an exemptive order issued by the Securities and Exchange Commission (the Order), the Fund is authorized to distribute long-term capital gains to shareholders more frequently than once per year. Pursuant to the Order, the Fund’s Board of Trustees approved a Managed Distribution Plan (MDP) pursuant to which the Fund makes monthly cash distributions to common shareholders. The Fund’s MDP had no effect on the Fund’s investment strategy during the most recent fiscal year and is not expected to have an effect in future periods, but distributions in excess of Fund returns will cause its per share NAV to erode. Investors should not draw any conclusions about the Fund’s investment performance from the amount of its distribution or from the terms of its MDP.
For the period from November 1, 2020 to July 31, 2021, the Fund made monthly distributions of $0.1025 per share and, for the period from August 1, 2021 to October 31, 2021, the Fund made monthly distributions of $0.1300 per share. The Fund’s distributions may be comprised of amounts characterized for federal income tax purposes as qualified and non-qualified ordinary dividends, capital gains and non-dividend distributions, also known as return of capital distributions. The federal income tax character of distributions is determined after the end of the calendar year and reported to shareholders on the Internal Revenue Service’s form 1099-DIV. For additional information, see Note 2 in the Notes to Financial Statements herein.
See Endnotes and Additional Disclosures in this report.
Past performance is no guarantee of future results. Returns are historical and are calculated net of management fees and other expenses by determining the percentage change in net asset value (NAV) or market price (as applicable) with all distributions reinvested in accordance with the Fund’s Dividend Reinvestment Plan. Performance at market price will differ from performance at NAV due to variations in the Fund’s market price versus NAV, which may reflect factors such as fluctuations in supply and demand for Fund shares, changes in Fund distributions, shifting market expectations for the Fund’s future returns and distribution rates, and other considerations affecting the trading prices of closed-end funds. Investment return and principal value will fluctuate so that shares, when sold, may be worth more or less than their original cost. Performance for periods less than or equal to one year is cumulative. Performance is for the stated time period only; due to market volatility, current Fund performance may be lower or higher than the quoted return. For performance as of the most recent month-end, please refer to eatonvance.com.
| 3 |
Eaton Vance
Tax-Advantaged Global Dividend Income Fund
October 31, 2021
Portfolio Managers John H. Croft, CFA and Derek J.V. DiGregorio of Eaton Vance Management; Christopher M. Dyer, CFA of Eaton Vance Advisers International Ltd.
| % Average Annual Total Returns | Inception Date | One Year | Five Years | Ten Years | ||||||||||||
| Fund at NAV |
01/30/2004 | 49.37 | % | 15.71 | % | 13.01 | % | |||||||||
| Fund at Market Price |
— | 65.85 | 17.55 | 13.65 | ||||||||||||
|
| ||||||||||||||||
| MSCI World Index |
— | 40.42 | % | 15.44 | % | 12.18 | % | |||||||||
| ICE BofA Fixed Rate Preferred Securities Index |
— | 6.28 | 5.58 | 6.44 | ||||||||||||
| Blended Index |
— | 33.01 | 13.53 | 11.13 | ||||||||||||
| % Premium/Discount to NAV4 | ||||||||||||||||
| –1.81 | % | |||||||||||||||
| Distributions5 | ||||||||||||||||
| Total Distributions per share for the period |
$ | 1.313 | ||||||||||||||
| Distribution Rate at NAV |
6.90 | % | ||||||||||||||
| Distribution Rate at Market Price |
7.03 | |||||||||||||||
| % Total Leverage6 | ||||||||||||||||
| Borrowings |
17.66 | % | ||||||||||||||
Growth of $10,000
This graph shows the change in value of a hypothetical investment of $10,000 in the Fund for the period indicated. For comparison, the same investment is shown in the indicated index.
See Endnotes and Additional Disclosures in this report.
Past performance is no guarantee of future results. Returns are historical and are calculated net of management fees and other expenses by determining the percentage change in net asset value (NAV) or market price (as applicable) with all distributions reinvested in accordance with the Fund’s Dividend Reinvestment Plan. Performance at market price will differ from performance at NAV due to variations in the Fund’s market price versus NAV, which may reflect factors such as fluctuations in supply and demand for Fund shares, changes in Fund distributions, shifting market expectations for the Fund’s future returns and distribution rates, and other considerations affecting the trading prices of closed-end funds. Investment return and principal value will fluctuate so that shares, when sold, may be worth more or less than their original cost. Performance for periods less than or equal to one year is cumulative. Performance is for the stated time period only; due to market volatility, current Fund performance may be lower or higher than the quoted return. For performance as of the most recent month-end, please refer to eatonvance.com.
| 4 |
Eaton Vance
Tax-Advantaged Global Dividend Income Fund
October 31, 2021
Sector Allocation (% of total investments)7

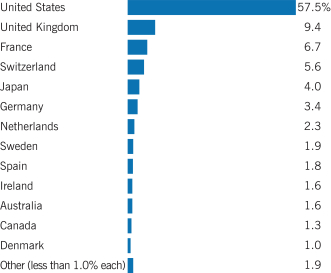
Country Allocation (% of total investments)
Top 10 Holdings (% of total investments)7
| Alphabet, Inc., Class C |
4.2 | % | ||
| Microsoft Corp. |
4.1 | |||
| Amazon.com, Inc. |
2.7 | |||
| Apple, Inc. |
2.1 | |||
| Nestle S.A. |
1.7 | |||
| ASML Holding NV |
1.6 | |||
| Walt Disney Co. (The) |
1.5 | |||
| Meta Platforms, Inc., Class A |
1.4 | |||
| Coca-Cola Co. (The) |
1.4 | |||
| adidas AG |
1.4 | |||
| Total |
22.1 | % | ||
See Endnotes and Additional Disclosures in this report.
| 5 |
Eaton Vance
Tax-Advantaged Global Dividend Income Fund
October 31, 2021
The Fund’s Investment Objective, Principal Strategies and Principal Risks8
Investment Objective. The Fund’s investment objective is to provide a high level of after-tax total return. Such return is expected to consist primarily of tax-advantaged dividend income and capital appreciation.
Principal Strategies. Under normal market conditions, the Fund invests at least 80% of its total managed assets in dividend-paying common and preferred stocks of U.S. and foreign issuers that the Fund’s investment adviser believes at the time of investment are eligible to pay dividends that qualify for federal income taxation at rates applicable to long-term capital gains. The Fund may invest in preferred stocks that are rated below investment grade. The Fund may also invest a portion of its assets in stocks and other securities that generate fully taxable ordinary income, including up to 30% of its total assets in securities rated below investment grade.
Under normal market conditions, the Fund will invest (i) at least 25% of its total managed assets in the securities of U.S. issuers; (ii) at least 30% of its total managed assets in securities of non-U.S. issuers, including issuers located in emerging market countries; and (iii) in issuers located in at least five different countries (including the U.S.).
In seeking its objective, the Fund may engage in dividend capture trading. The Fund may use derivatives principally to seek to manage exposure to certain sectors and/or markets in connection with its use of dividend capture trading. The Fund expects to buy and sell equity index futures contracts for this purpose, but may also engage in other types of derivatives to manage such exposures. Additionally, the Fund may also use derivatives for other purposes, such as hedging, to enhance return or as a substitute for the purchase or sale of securities or currencies. Other permitted derivatives include futures contracts on securities and non-equity indices, options on futures contracts, the purchase of put options and the sale of call options on securities held, equity swaps, interest rate swaps, covered short sales, forward sales of stocks, forward currency exchange contracts and currency futures contracts. The Fund may invest in the foregoing derivatives without limitation and use of derivatives may be extensive. The Fund may also invest in credit derivatives (credit default swaps, total return swaps, credit options and other derivative transactions with substantially similar characteristics and risks), provided that the notional value of such derivative instruments entered into for non-hedging purposes does not exceed 5% of the value of preferred stocks held by the Fund.
The Fund may also invest up to 10% of its net assets in exchange-traded funds (“ETFs”) that invest primarily in common and/or preferred stocks.
The Fund employs leverage through borrowings to seek opportunities for additional income. Leverage may amplify the Fund’s net asset value of any increase or decrease in the value of investments held. There can be no assurance that the use of borrowings will be successful.
Principal Risks
Market Discount Risk. As with any security, the market value of the common shares may increase or decrease from the amount initially paid for the common shares. The Fund’s common shares have traded both at a premium and at a discount relative to NAV. The shares of closed-end management investment companies frequently trade at a discount from their NAV. This is a risk separate and distinct from the risk that the Fund’s NAV may decrease.
Market Risk. The value of investments held by the Fund may increase or decrease in response to economic, political, financial, public health crises (such as epidemics or pandemics) or other disruptive events (whether real,
expected or perceived) in the U.S. and global markets. These events may negatively impact broad segments of businesses and populations and may exacerbate pre-existing risks to the Fund. The frequency and magnitude of resulting changes in the value of the Fund’s investments cannot be predicted. Certain securities and other investments held by the Fund may experience increased volatility, illiquidity, or other potentially adverse effects in reaction to changing market conditions. Monetary and/or fiscal actions taken by U.S. or foreign governments to stimulate or stabilize the global economy may not be effective and could lead to high market volatility. No active trading market may exist for certain investments held by the Fund, which may impair the ability of the Fund to sell or to realize the current valuation of such investments in the event of the need to liquidate such assets.
Equity Securities Risk. The value of equity securities and related instruments may decline in response to adverse changes in investor sentiment; interest rate, currency, and commodity price fluctuations; adverse geopolitical, social or environmental developments; issuer and sector-specific considerations; unexpected trading activity among retail investors; or other factors. Market conditions may affect certain types of stocks to a greater extent than other types of stocks. If the stock market declines in value, the value of the Fund’s equity securities will also likely decline. Although prices can rebound, there is no assurance that values will return to previous levels.
Tax-Sensitive Investing Risk. The Fund may hold a security in order to achieve more favorable tax-treatment or to sell a security in order to create tax losses. The Fund’s utilization of various tax-management techniques may be curtailed or eliminated by tax legislation, regulation or interpretations. The Fund may not be able to minimize taxable distributions to shareholders and a portion of the Fund’s distributions may be taxable.
Foreign Investment Risk. Foreign investments can be adversely affected by political, economic and market developments abroad, including the imposition of economic and other sanctions by the United States or another country. There may be less publicly available information about foreign issuers because they may not be subject to reporting practices, requirements or regulations comparable to those to which United States companies are subject. Foreign markets may be smaller, less liquid and more volatile than the major markets in the United States, and as a result, Fund share values may be more volatile. Trading in foreign markets typically involves higher expense than trading in the United States. The Fund may have difficulties enforcing its legal or contractual rights in a foreign country.
Emerging Markets Investment Risk. Investment markets within emerging market countries are typically smaller, less liquid, less developed and more volatile than those in more developed markets like the United States, and may be focused in certain sectors. Emerging market securities often involve greater risks than developed market securities. The information available about an emerging market issuer may be less reliable than for comparable issuers in more developed capital markets.
Currency Risk. Exchange rates for currencies fluctuate daily. The value of foreign investments may be affected favorably or unfavorably by changes in currency exchange rates in relation to the U.S. dollar. Currency markets generally are not as regulated as securities markets and currency transactions are subject to settlement, custodial and other operational risks.
See Endnotes and Additional Disclosures in this report.
| 6 |
Eaton Vance
Tax-Advantaged Global Dividend Income Fund
October 31, 2021
The Fund’s Investment Objective, Principal Strategies and Principal Risks8 — continued
Sector Risk. Because the Fund may, under certain market conditions, invest a significant portion of its assets in the utilities and/or financial services sectors, the value of Fund shares may be affected by events that adversely affect those sectors and may fluctuate more than that of a more broadly diversified fund.
Preferred Stock Risk. Although preferred stocks represent an ownership interest in an issuer, preferred stocks generally do not have voting rights or have limited voting rights and have economic characteristics similar to fixed-income securities. Preferred stocks are subject to issuer-specific risks generally applicable to equity securities and credit and interest rate risks generally applicable to fixed-income securities. The value of preferred stock generally declines when interest rates rise and may react more significantly than bonds and other debt instruments to actual or perceived changes in the company’s financial condition or prospects.
Income Risk. The Fund’s ability to distribute income to shareholders will depend on the yield available on the common and preferred stocks and other hybrid securities and fixed-income securities held by the Fund. Changes in the dividend policies of companies held by the Fund could make it difficult for the Fund to provide a predictable level of income.
Dividend Capture Trading Risk. The use of dividend capture strategies will expose the Fund to higher portfolio turnover, increased trading costs and potential for capital loss or gain, particularly in the event of significant short-term price movements of stocks subject to dividend capture trading.
Credit Risk. Investments in fixed income and other debt obligations, including loans, (referred to below as “debt instruments”) are subject to the risk of non-payment of scheduled principal and interest. Changes in economic conditions or other circumstances may reduce the capacity of the party obligated to make principal and interest payments on such instruments and may lead to defaults. Such non-payments and defaults may reduce the value of Fund shares and income distributions. The value of debt instruments also may decline because of concerns about the issuer’s ability to make principal and interest payments. In addition, the credit ratings of debt instruments may be lowered if the financial condition of the party obligated to make payments with respect to such instruments deteriorates. In the event of bankruptcy of the issuer of a debt instrument, the Fund could experience delays or limitations with respect to its ability to realize the benefits of any collateral securing the instrument. In order to enforce its rights in the event of a default, bankruptcy or similar situation, the Fund may be required to retain legal or similar counsel, which may increase the Fund’s operating expenses and adversely affect net asset value.
Interest Rate Risk. In general, the value of income securities will fluctuate based on changes in interest rates. The value of these securities is likely to increase when interest rates fall and decline when interest rates rise. Duration measures the time-weighted expected cash flows of a fixed-income security, while maturity refers to the amount of time until a fixed-income security matures. Generally, securities with longer durations or maturities are more sensitive to changes in interest rates than securities with shorter durations or maturities, causing them to be more volatile. Conversely, fixed-income securities with shorter durations or maturities will be less volatile but may provide lower returns than fixed-income securities with longer durations or maturities. The impact of interest rate changes is significantly less for floating-rate instruments that have relatively short periodic rate resets (e.g., ninety days or less). In a rising interest rate environment, the durations or maturities of income securities that have the
ability to be prepaid or called by the issuer may be extended. In a declining interest rate environment, the proceeds from prepaid or maturing instruments may have to be reinvested at a lower interest rate. Certain instruments held by the Fund may pay an interest rate based on the London Interbank Offered Rate (“LIBOR”), which is the average offered rate for various maturities of short-term loans between certain major international banks. LIBOR is used throughout global banking and financial industries to determine interest rates for a variety of financial instruments (such as debt instruments and derivatives) and borrowing arrangements. The ICE Benchmark Administration Limited, the administrator of LIBOR, is expected to cease publishing certain LIBOR settings on December 31, 2021, and the remaining LIBOR settings on June 30, 2023. Although the transition process away from LIBOR has become increasingly well defined in advance of the anticipated discontinuation, the impact on certain debt securities, derivatives and other financial instruments that utilize LIBOR remains uncertain. The phase-out of LIBOR may result in, among other things, increased volatility or illiquidity in markets for instruments based on LIBOR and changes in the value of such instruments.
Lower Rated Investments Risk. Investments rated below investment grade and comparable unrated investments (sometimes referred to as “junk”) have speculative characteristics because of the credit risk associated with their issuers. Changes in economic conditions or other circumstances typically have a greater effect on the ability of issuers of lower rated investments to make principal and interest payments than they do on issuers of higher rated investments. An economic downturn generally leads to a higher non-payment rate, and a lower rated investment may lose significant value before a default occurs. Lower rated investments typically are subject to greater price volatility and illiquidity than higher rated investments.
Derivatives Risk. The Fund’s exposure to derivatives involves risks different from, or possibly greater than, the risks associated with investing directly in securities and other investments. The use of derivatives can lead to losses because of adverse movements in the price or value of the security, instrument, index, currency, commodity, economic indicator or event underlying a derivative (“reference instrument”), due to failure of a counterparty or due to tax or regulatory constraints. Derivatives may create leverage in the Fund, which represents a non-cash exposure to the underlying reference instrument. Leverage can increase both the risk and return potential of the Fund. Derivatives risk may be more significant when derivatives are used to enhance return or as a substitute for a cash investment position, rather than solely to hedge the risk of a position held by the Fund. Use of derivatives involves the exercise of specialized skill and judgment, and a transaction may be unsuccessful in whole or in part because of market behavior or unexpected events. Changes in the value of a derivative (including one used for hedging) may not correlate perfectly with the underlying reference instrument. Derivative instruments traded in over-the-counter markets may be difficult to value, may be illiquid, and may be subject to wide swings in valuation caused by changes in the value of the underlying reference instrument. If a derivative’s counterparty is unable to honor its commitments, the value of Fund shares may decline and the Fund could experience delays in the return of collateral or other assets held by the counterparty. The loss on derivative transactions may substantially exceed the initial investment, particularly when there is no stated limit on the Fund’s use of derivatives. A derivative investment also involves the risks relating to the reference instrument underlying the investment.
See Endnotes and Additional Disclosures in this report.
| 7 |
Eaton Vance
Tax-Advantaged Global Dividend Income Fund
October 31, 2021
The Fund’s Investment Objective, Principal Strategies and Principal Risks8 — continued
ETF Risk. ETFs are subject to the risks of investing in the underlying securities or other investments. ETF shares may trade at a premium or discount to net asset value and are subject to secondary market trading risks. In addition, the Fund will bear a pro rata portion of the operating expenses of an ETF in which it invests. Other pooled investment vehicles generally are subject to risks similar to those of ETFs.
Liquidity Risk. The Fund is exposed to liquidity risk when trading volume, lack of a market maker or trading partner, large position size, market conditions, or legal restrictions impair its ability to sell particular investments or to sell them at advantageous market prices. Consequently, the Fund may have to accept a lower price to sell an investment or continue to hold it or keep the position open, sell other investments to raise cash or abandon an investment opportunity, any of which could have a negative effect on the Fund’s performance. These effects may be exacerbated during times of financial or political stress.
Leverage Risk. Certain Fund transactions may give rise to leverage. Leverage can result from a non-cash exposure to the underlying reference instrument. Leverage can increase both the risk and return potential of the Fund. The Fund is required to segregate liquid assets or otherwise cover the Fund’s obligation created by a transaction that may give rise to leverage. The use of leverage may cause the Fund to liquidate portfolio positions when it may not be advantageous to do so to satisfy its obligations or to meet segregation requirements. Leverage may cause the Fund’s share price to be more volatile than if it had not been leveraged, as certain types of leverage may exaggerate the effect of any increase or decrease in the Fund’s portfolio securities. The loss on leveraged investments may substantially exceed the initial investment.
Risks Associated with Active Management. The success of the Fund’s investment strategy depends on portfolio management’s successful application of analytical skills and investment judgment. Active management involves subjective decisions.
Recent Market Conditions. An outbreak of respiratory disease caused by a novel coronavirus was first detected in China in late 2019 and subsequently spread internationally. This coronavirus has resulted in closing borders, enhanced health screenings, changes to healthcare service preparation and delivery, quarantines, cancellations, disruptions to supply chains and customer activity, as well as general concern and uncertainty. The impact of this coronavirus has resulted in a substantial economic downturn. Health crises caused by outbreaks of disease, such as the coronavirus outbreak, may exacerbate other pre-existing political, social and economic risks and disrupt normal market conditions and operations. The impact of this outbreak has negatively affected the worldwide economy, as well as the economies of individual countries and industries, and could continue to affect the market in significant and unforeseen ways. Other epidemics and pandemics that may arise in the future may have similar effects. For example, a global pandemic or other widespread health crisis could cause substantial market volatility and exchange trading suspensions and closures. In addition, the increasing interconnectedness of markets around the world may result in many markets being affected by events or conditions in a single country or region or events affecting a single or small number of issuers. The coronavirus outbreak and public and private sector responses thereto have led to large portions of the populations of many countries working from home for indefinite periods of time, temporary or permanent layoffs, disruptions in supply chains, and lack of availability of certain goods. The impact of such responses could adversely affect the
information technology and operational systems upon which the Fund and the Fund’s service providers rely, and could otherwise disrupt the ability of the employees of the Fund’s service providers to perform critical tasks relating to the Fund. Any such impact could adversely affect the Fund’s performance, or the performance of the securities in which the Fund invests and may lead to losses on your investment in the Fund.
Cybersecurity Risk. With the increased use of technologies by Fund service providers to conduct business, such as the Internet, the Fund is susceptible to operational, information security and related risks. In general, cyber incidents can result from deliberate attacks or unintentional events. Cybersecurity failures by or breaches of the Fund’s investment adviser or administrator and other service providers (including, but not limited to, the custodian or transfer agent), and the issuers of securities in which the Fund invests, have the ability to cause disruptions and impact business operations potentially resulting in financial losses, interference with the Fund’s ability to calculate its net asset value, impediments to trading, the inability of Fund shareholders to transact business, violations of applicable privacy and other laws, regulatory fines, penalties, reputational damage, reimbursement or other compensation costs, or additional compliance costs.
General Fund Investing Risks. The Fund is not a complete investment program and there is no guarantee that the Fund will achieve its investment objective. It is possible to lose money by investing in the Fund. An investment in the Fund is not a deposit in a bank and is not insured or guaranteed by the Federal Deposit Insurance Corporation or any other government agency.
Important Notice to Shareholders
The following information is a summary of certain changes since October 31, 2020. This information may not reflect all of the changes that have occurred since you purchased the Fund.
Effective July 1, 2021, Derek J.V. DiGregorio has joined the Fund’s portfolio management team. Mr. DiGregorio manages other Eaton Vance portfolios, has been employed by Eaton Vance Management (“EVM”) for more than five years and is a Vice President of EVM.
See Endnotes and Additional Disclosures in this report.
| 8 |
Eaton Vance
Tax-Advantaged Global Dividend Income Fund
October 31, 2021
Endnotes and Additional Disclosures
| 1 | The views expressed in this report are those of the portfolio manager(s) and are current only through the date stated at the top of this page. These views are subject to change at any time based upon market or other conditions, and Eaton Vance and the Fund(s) disclaim any responsibility to update such views. These views may not be relied upon as investment advice and, because investment decisions are based on many factors, may not be relied upon as an indication of trading intent on behalf of any Eaton Vance fund. This commentary may contain statements that are not historical facts, referred to as “forward-looking statements.” The Fund’s actual future results may differ significantly from those stated in any forward-looking statement, depending on factors such as changes in securities or financial markets or general economic conditions, the volume of sales and purchases of Fund shares, the continuation of investment advisory, administrative and service contracts, and other risks discussed from time to time in the Fund’s filings with the Securities and Exchange Commission. |
| 2 | MSCI World Index is an unmanaged index of equity securities in the developed markets. MSCI indexes are net of foreign withholding taxes. Source: MSCI. MSCI data may not be reproduced or used for any other purpose. MSCI provides no warranties, has not prepared or approved this report, and has no liability hereunder. ICE BofA Fixed Rate Preferred Securities Index is an unmanaged index of fixed-rate, preferred securities issued in the U.S. ICE® BofA® indices are not for redistribution or other uses; provided “as is”, without warranties, and with no liability. Eaton Vance has prepared this report and ICE Data Indices, LLC does not endorse it, or guarantee, review, or endorse Eaton Vance’s products. BofA® is a licensed registered trademark of Bank of America Corporation in the United States and other countries. The Blended Index consists of 80% MSCI World Index and 20% ICE BofA Fixed Rate Preferred Securities Index, rebalanced monthly. Unless otherwise stated, index returns do not reflect the effect of any applicable sales charges, commissions, expenses, taxes or leverage, as applicable. It is not possible to invest directly in an index. |
| 3 | Performance results reflect the effects of leverage. |
| 4 | The shares of the Fund often trade at a discount or premium to their net asset value. The discount or premium may vary over time and may be higher or lower than what is quoted in this report. For up-to-date premium/discount information, please refer to https://funds.eatonvance.com/closed-end-fund-prices.php. |
| 5 | The Distribution Rate is based on the Fund’s last regular distribution per share in the period (annualized) divided by the Fund’s NAV or market price at the end of the period. The Fund’s distributions may be comprised of amounts characterized for federal income tax purposes as qualified and non-qualified ordinary dividends, capital gains and nondividend distributions, also known as return of capital. For additional information about nondividend distributions, please refer to Eaton Vance Closed-End Fund Distribution Notices (19a) posted on our website, eatonvance.com. The Fund will determine the federal income tax character of distributions paid to a shareholder after the end of the calendar year. This is reported on the IRS form 1099-DIV and provided to the shareholder shortly after each year-end. For information about the tax character of distributions made in prior calendar years, please refer to Performance-Tax Character of Distributions on the Fund’s webpage available at eatonvance.com. The Fund’s distributions are determined by the investment adviser based |
| on its current assessment of the Fund’s long-term return potential. Fund distributions may be affected by numerous factors including changes in Fund performance, the cost of financing for leverage, portfolio holdings, realized and projected returns, and other factors. As portfolio and market conditions change, the rate of distributions paid by the Fund could change. |
| 6 | Total leverage is shown as a percentage of the Fund’s aggregate net assets plus borrowings outstanding. The Fund employs leverage through borrowings. Use of leverage creates an opportunity for income, but creates risks including greater price volatility. The cost of borrowings rises and falls with changes in short-term interest rates. The Fund may be required to maintain prescribed asset coverage for its leverage and may be required to reduce its leverage at an inopportune time. |
| 7 | Excludes cash and cash equivalents. |
| 8 | The information contained herein is provided for informational purposes only and does not constitute a solicitation of an offer to buy or sell Fund shares. Common shares of the Fund are available for purchase and sale only at current market prices in secondary market trading. |
Fund profile subject to change due to active management.
Additional Information
S&P 500® Index is an unmanaged index of large-cap stocks commonly used as a measure of U.S. stock market performance. S&P Dow Jones Indices are a product of S&P Dow Jones Indices LLC (“S&P DJI”) and have been licensed for use. S&P® and S&P 500® are registered trademarks of S&P DJI; Dow Jones® is a registered trademark of Dow Jones Trademark Holdings LLC (“Dow Jones”); S&P DJI, Dow Jones and their respective affiliates do not sponsor, endorse, sell or promote the Fund, will not have any liability with respect thereto and do not have any liability for any errors, omissions, or interruptions of the S&P Dow Jones Indices. Nasdaq Composite Index is a market capitalization-weighted index of all domestic and international securities listed on Nasdaq. Source: Nasdaq, Inc. The information is provided by Nasdaq (with its affiliates, are referred to as the “Corporations”) and Nasdaq’s third party licensors on an “as is” basis and the Corporations make no guarantees and bear no liability of any kind with respect to the information or the Fund. MSCI Golden Dragon Index is an unmanaged index of common stocks traded in China, Hong Kong and Taiwan. MSCI EAFE Index is an unmanaged index of equities in the developed markets, excluding the U.S. and Canada. MSCI Emerging Markets Index is an unmanaged index of emerging markets common stocks.
| 9 |
Eaton Vance
Tax-Advantaged Global Dividend Income Fund
October 31, 2021
| Common Stocks — 103.6% |
| |||||||||
| Security | Shares | Value | ||||||||
| Aerospace & Defense — 1.0% | ||||||||||
| Safran S.A. |
127,485 | $ | 17,158,171 | |||||||
| $ | 17,158,171 | |||||||||
| Air Freight & Logistics — 1.1% | ||||||||||
| GXO Logistics, Inc.(1) |
217,577 | $ | 19,320,838 | |||||||
| $ | 19,320,838 | |||||||||
| Automobiles — 1.1% | ||||||||||
| Stellantis NV |
932,883 | $ | 18,624,494 | |||||||
| $ | 18,624,494 | |||||||||
| Banks — 8.5% | ||||||||||
| Citigroup, Inc. |
218,140 | $ | 15,086,563 | |||||||
| Credit Agricole S.A. |
814,940 | 12,294,967 | ||||||||
| HDFC Bank, Ltd. |
380,394 | 8,083,913 | ||||||||
| HSBC Holdings PLC |
3,504,110 | 21,112,865 | ||||||||
| ING Groep NV |
835,980 | 12,680,899 | ||||||||
| M&T Bank Corp. |
77,407 | 11,388,118 | ||||||||
| Mitsubishi UFJ Financial Group, Inc.(2) |
1,765,177 | 9,679,338 | ||||||||
| Svenska Handelsbanken AB, Class A |
1,202,697 | 13,785,716 | ||||||||
| Swedbank AB, Class A |
499,730 | 10,838,493 | ||||||||
| Toronto-Dominion Bank (The) |
240,729 | 17,475,027 | ||||||||
| Wells Fargo & Co. |
282,071 | 14,430,752 | ||||||||
| $ | 146,856,651 | |||||||||
| Beverages — 3.2% | ||||||||||
| Coca-Cola Co. (The) |
515,345 | $ | 29,049,997 | |||||||
| Diageo PLC |
542,691 | 26,999,794 | ||||||||
| $ | 56,049,791 | |||||||||
| Biotechnology — 1.2% | ||||||||||
| CSL, Ltd. |
88,268 | $ | 20,084,526 | |||||||
| $ | 20,084,526 | |||||||||
| Building Products — 1.5% | ||||||||||
| Assa Abloy AB, Class B |
416,748 | $ | 12,228,492 | |||||||
| Kingspan Group PLC |
113,079 | 13,018,216 | ||||||||
| $ | 25,246,708 | |||||||||
| Capital Markets — 1.9% | ||||||||||
| Bank of New York Mellon Corp. (The) |
392,646 | $ | 23,244,643 | |||||||
| London Stock Exchange Group PLC |
104,622 | 10,184,298 | ||||||||
| $ | 33,428,941 | |||||||||
| Security | Shares | Value | ||||||||
| Construction Materials — 1.0% | ||||||||||
| CRH PLC |
355,260 | $ | 17,000,549 | |||||||
| $ | 17,000,549 | |||||||||
| Diversified Financial Services — 0.8% | ||||||||||
| Berkshire Hathaway, Inc., Class B(1) |
44,439 | $ | 12,754,437 | |||||||
| Industrivarden AB, Class A |
18,503 | 610,381 | ||||||||
| $ | 13,364,818 | |||||||||
| Electric Utilities — 1.8% | ||||||||||
| Iberdrola S.A. |
1,287,398 | $ | 15,215,985 | |||||||
| NextEra Energy, Inc. |
183,697 | 15,674,865 | ||||||||
| $ | 30,890,850 | |||||||||
| Electrical Equipment — 2.8% | ||||||||||
| AMETEK, Inc.(3) |
196,446 | $ | 26,009,450 | |||||||
| Schneider Electric SE |
133,617 | 23,037,986 | ||||||||
| $ | 49,047,436 | |||||||||
| Electronic Equipment, Instruments & Components — 4.0% | ||||||||||
| CDW Corp. |
119,441 | $ | 22,293,663 | |||||||
| Halma PLC |
309,074 | 12,533,969 | ||||||||
| Keyence Corp. |
19,105 | 11,532,059 | ||||||||
| Murata Manufacturing Co., Ltd. |
9,838 | 729,768 | ||||||||
| TE Connectivity, Ltd. |
147,861 | 21,587,706 | ||||||||
| $ | 68,677,165 | |||||||||
| Entertainment — 2.2% | ||||||||||
| Nintendo Co., Ltd. |
17,909 | $ | 7,909,634 | |||||||
| Walt Disney Co. (The)(1)(3) |
179,369 | 30,325,917 | ||||||||
| $ | 38,235,551 | |||||||||
| Equity Real Estate Investment Trusts (REITs) — 1.0% | ||||||||||
| American Tower Corp. |
45,592 | $ | 12,855,576 | |||||||
| Equity Residential |
54,310 | 4,692,384 | ||||||||
| $ | 17,547,960 | |||||||||
| Food Products — 3.6% | ||||||||||
| Mondelez International, Inc., Class A |
443,076 | $ | 26,912,436 | |||||||
| Nestle S.A. |
261,640 | 34,512,193 | ||||||||
| $ | 61,424,629 | |||||||||
| Health Care Equipment & Supplies — 4.2% | ||||||||||
| Alcon, Inc. |
130,271 | $ | 10,801,878 | |||||||
| 10 | See Notes to Financial Statements. |
Eaton Vance
Tax-Advantaged Global Dividend Income Fund
October 31, 2021
Portfolio of Investments — continued
| Security | Shares | Value | ||||||||
| Health Care Equipment & Supplies (continued) | ||||||||||
| Boston Scientific Corp.(1)(3) |
542,726 | $ | 23,407,773 | |||||||
| Intuitive Surgical, Inc.(1) |
63,855 | 23,059,956 | ||||||||
| Straumann Holding AG |
7,093 | 14,765,477 | ||||||||
| $ | 72,035,084 | |||||||||
| Health Care Providers & Services — 1.0% | ||||||||||
| Anthem, Inc. |
41,547 | $ | 18,078,346 | |||||||
| $ | 18,078,346 | |||||||||
| Hotels, Restaurants & Leisure — 1.7% | ||||||||||
| Compass Group PLC(1) |
934,174 | $ | 19,823,770 | |||||||
| InterContinental Hotels Group PLC(1) |
132,673 | 9,293,361 | ||||||||
| $ | 29,117,131 | |||||||||
| Industrial Conglomerates — 1.1% | ||||||||||
| DCC PLC |
41,613 | $ | 3,472,204 | |||||||
| Siemens AG |
98,365 | 15,992,367 | ||||||||
| $ | 19,464,571 | |||||||||
| Insurance — 2.9% | ||||||||||
| Allstate Corp. (The) |
89,111 | $ | 11,020,358 | |||||||
| Arch Capital Group, Ltd.(1) |
382,777 | 16,007,734 | ||||||||
| Aviva PLC |
1,503,172 | 8,110,990 | ||||||||
| AXA S.A. |
535,149 | 15,569,081 | ||||||||
| $ | 50,708,163 | |||||||||
| Interactive Media & Services — 6.8% | ||||||||||
| Alphabet, Inc., Class C(1)(3) |
29,410 | $ | 87,212,708 | |||||||
| Meta Platforms, Inc., Class A(1)(3) |
91,757 | 29,689,813 | ||||||||
| $ | 116,902,521 | |||||||||
| Internet & Direct Marketing Retail — 3.3% | ||||||||||
| Amazon.com, Inc.(1)(3) |
16,691 | $ | 56,289,229 | |||||||
| $ | 56,289,229 | |||||||||
| IT Services — 4.0% | ||||||||||
| Amadeus IT Group S.A.(1) |
259,207 | $ | 17,340,395 | |||||||
| Fidelity National Information Services, Inc. |
150,401 | 16,655,407 | ||||||||
| Global Payments, Inc. |
83,825 | 11,986,137 | ||||||||
| Visa, Inc., Class A |
105,502 | 22,342,159 | ||||||||
| $ | 68,324,098 | |||||||||
| Security | Shares | Value | ||||||||
| Leisure Products — 0.9% | ||||||||||
| Yamaha Corp. |
235,850 | $ | 14,900,550 | |||||||
| $ | 14,900,550 | |||||||||
| Life Sciences Tools & Services — 1.0% | ||||||||||
| Lonza Group AG |
21,350 | $ | 17,545,439 | |||||||
| $ | 17,545,439 | |||||||||
| Machinery — 3.0% | ||||||||||
| Graco, Inc. |
113,899 | $ | 8,562,927 | |||||||
| Ingersoll Rand, Inc.(1) |
214,762 | 11,545,605 | ||||||||
| Sandvik AB |
39,486 | 1,001,314 | ||||||||
| SMC Corp. |
21,968 | 13,109,735 | ||||||||
| Stanley Black & Decker, Inc. |
101,869 | 18,308,915 | ||||||||
| $ | 52,528,496 | |||||||||
| Metals & Mining — 1.2% | ||||||||||
| Anglo American PLC |
334,915 | $ | 12,741,179 | |||||||
| Rio Tinto, Ltd. |
129,188 | 8,851,023 | ||||||||
| $ | 21,592,202 | |||||||||
| Multi-Utilities — 0.4% | ||||||||||
| CMS Energy Corp. |
113,754 | $ | 6,865,054 | |||||||
| $ | 6,865,054 | |||||||||
| Oil, Gas & Consumable Fuels — 2.8% | ||||||||||
| Chevron Corp. |
57,687 | $ | 6,604,585 | |||||||
| ConocoPhillips |
120,384 | 8,967,404 | ||||||||
| EOG Resources, Inc. |
238,727 | 22,072,698 | ||||||||
| Phillips 66 |
79,290 | 5,929,306 | ||||||||
| Pioneer Natural Resources Co. |
27,960 | 5,227,961 | ||||||||
| $ | 48,801,954 | |||||||||
| Personal Products — 0.4% | ||||||||||
| Kose Corp. |
59,996 | $ | 6,967,084 | |||||||
| $ | 6,967,084 | |||||||||
| Pharmaceuticals — 8.0% | ||||||||||
| AstraZeneca PLC |
177,263 | $ | 22,175,832 | |||||||
| Eli Lilly & Co. |
86,576 | 22,056,102 | ||||||||
| Novo Nordisk A/S, Class B |
197,361 | 21,641,592 | ||||||||
| Roche Holding AG PC |
61,746 | 23,920,028 | ||||||||
| Sanofi |
245,848 | 24,693,983 | ||||||||
| Zoetis, Inc. |
106,604 | 23,047,785 | ||||||||
| $ | 137,535,322 | |||||||||
| 11 | See Notes to Financial Statements. |
Eaton Vance
Tax-Advantaged Global Dividend Income Fund
October 31, 2021
Portfolio of Investments — continued
| Security | Shares | Value | ||||||||
| Professional Services — 4.0% | ||||||||||
| Recruit Holdings Co., Ltd. |
298,491 | $ | 19,855,322 | |||||||
| RELX PLC |
807,721 | 25,045,313 | ||||||||
| Verisk Analytics, Inc. |
111,781 | 23,504,191 | ||||||||
| $ | 68,404,826 | |||||||||
| Semiconductors & Semiconductor Equipment — 5.2% | ||||||||||
| ASML Holding NV |
40,076 | $ | 32,577,765 | |||||||
| Infineon Technologies AG |
421,048 | 19,718,239 | ||||||||
| Micron Technology, Inc. |
250,910 | 17,337,881 | ||||||||
| Taiwan Semiconductor Manufacturing Co., Ltd. ADR(3) |
171,591 | 19,509,897 | ||||||||
| $ | 89,143,782 | |||||||||
| Software — 7.7% | ||||||||||
| Adobe, Inc.(1) |
21,843 | $ | 14,205,814 | |||||||
| Dassault Systemes SE |
299,340 | 17,480,675 | ||||||||
| Intuit, Inc. |
25,575 | 16,009,694 | ||||||||
| Microsoft Corp.(3) |
256,634 | 85,104,967 | ||||||||
| $ | 132,801,150 | |||||||||
| Specialty Retail — 2.1% | ||||||||||
| Lowe’s Cos., Inc. |
67,682 | $ | 15,825,405 | |||||||
| TJX Cos., Inc. (The)(3) |
316,673 | 20,738,915 | ||||||||
| $ | 36,564,320 | |||||||||
| Technology Hardware, Storage & Peripherals — 2.5% | ||||||||||
| Apple, Inc.(3) |
290,108 | $ | 43,458,178 | |||||||
| $ | 43,458,178 | |||||||||
| Textiles, Apparel & Luxury Goods — 2.7% | ||||||||||
| adidas AG |
87,583 | $ | 28,666,022 | |||||||
| LVMH Moet Hennessy Louis Vuitton SE |
22,748 | 17,837,196 | ||||||||
| $ | 46,503,218 | |||||||||
| Total Common Stocks
|
|
$ | 1,787,489,796 | |||||||
| Corporate Bonds — 10.4% |
| |||||||||
| Security | Principal Amount* (000’s omitted) |
Value | ||||||||
| Automobiles — 0.1% | ||||||||||
| General Motors Financial Co., Inc., Series C, 5.70% to 9/30/30(4)(5) |
2,048 | $ | 2,368,000 | |||||||
| $ | 2,368,000 | |||||||||
| Security | Principal Amount* (000’s omitted) |
Value | ||||||||
| Banks — 5.4% | ||||||||||
| Banco Bilbao Vizcaya Argentaria S.A., 6.125% to 11/16/27(4)(5) |
3,800 | $ | 4,095,488 | |||||||
| Banco Davivienda S.A., 6.65% to 4/22/31(4)(5)(6) |
1,000 | 1,044,190 | ||||||||
| Banco Mercantil del Norte S.A./Grand Cayman: | ||||||||||
| 7.50% to 6/27/29(4)(5)(6) |
2,470 | 2,714,728 | ||||||||
| 7.625% to 1/10/28(4)(5)(6) |
1,160 | 1,274,852 | ||||||||
| 8.375% to 10/14/30(4)(5)(6) |
1,105 | 1,293,248 | ||||||||
| Barclays PLC, 6.125% to 12/15/25(4)(5) |
2,500 | 2,749,225 | ||||||||
| BNP Paribas S.A., 4.625% to 2/25/31(4)(5)(6) |
4,110 | 4,140,825 | ||||||||
| Citigroup, Inc., Series M, 6.30% to 5/15/24(4)(5) |
6,675 | 7,124,227 | ||||||||
| Comerica, Inc., 5.625% to 7/1/25(4)(5) |
2,922 | 3,232,831 | ||||||||
| Credit Suisse Group AG: | ||||||||||
| 4.50% to 9/3/30(4)(5)(6) |
2,963 | 2,888,036 | ||||||||
| 7.50% to 7/17/23(4)(5)(6) |
5,917 | 6,304,563 | ||||||||
| Deutsche Bank AG, 7.125% to 4/30/26(4)(5)(7) |
GBP | 3,700 | 5,494,072 | |||||||
| Farm Credit Bank of Texas, Series 3, 6.20% to 6/15/28(4)(5)(6) |
3,200 | 3,520,000 | ||||||||
| HSBC Holdings PLC: | ||||||||||
| 4.60% to 12/17/30(4)(5) |
2,022 | 2,014,175 | ||||||||
| 6.375% to 9/17/24(4)(5) |
1,515 | 1,634,306 | ||||||||
| Huntington Bancshares, Inc., Series F, 5.625% to 7/15/30(4)(5) |
2,926 | 3,405,133 | ||||||||
| ING Groep NV, 6.50% to 4/16/25(4)(5) |
3,100 | 3,406,140 | ||||||||
| JPMorgan Chase & Co., Series KK, 3.65% to 6/1/26(4)(5) |
9,303 | 9,279,742 | ||||||||
| Lloyds Banking Group PLC, 7.50% to 6/27/24(4)(5) |
6,125 | 6,783,437 | ||||||||
| Natwest Group PLC: |
|
|||||||||
| 4.60% to 6/28/31(4)(5) |
752 | 742,600 | ||||||||
| 6.00% to 12/29/25(4)(5) |
1,642 | 1,819,221 | ||||||||
| 8.00% to 8/10/25(4)(5) |
5,035 | 5,909,907 | ||||||||
| Societe Generale S.A.: | ||||||||||
| 4.75% to 5/26/26(4)(5)(6) |
721 | 740,359 | ||||||||
| 5.375% to 11/18/30(4)(5)(6) |
6,249 | 6,655,185 | ||||||||
| Standard Chartered PLC, 4.75% to 1/14/31(4)(5)(6) |
2,349 | 2,309,361 | ||||||||
| SVB Financial Group., Series C, 4.00% to 5/15/26(4)(5) |
1,461 | 1,466,479 | ||||||||
| Zions Bancorp NA, 5.80% to 6/15/23(4)(5) |
1,501 | 1,547,219 | ||||||||
| $ | 93,589,549 | |||||||||
| Capital Markets — 0.7% | ||||||||||
| AerCap Holdings NV, 5.875% to 10/10/24, 10/10/79(4) |
3,510 | $ | 3,667,037 | |||||||
| Charles Schwab Corp. (The), Series I, 4.00% to 6/1/26(4)(5) |
3,551 | 3,658,950 | ||||||||
| 12 | See Notes to Financial Statements. |
Eaton Vance
Tax-Advantaged Global Dividend Income Fund
October 31, 2021
Portfolio of Investments — continued
| Security | Principal Amount* (000’s omitted) |
Value | ||||||||||
| Capital Markets (continued) | ||||||||||||
| UBS Group AG: | ||||||||||||
| 4.375% to 2/10/31(4)(5)(6) |
2,750 | $ | 2,738,313 | |||||||||
| 6.875% to 8/7/25(4)(5)(7) |
2,364 | 2,672,798 | ||||||||||
| $ | 12,737,098 | |||||||||||
| Diversified Financial Services — 0.5% | ||||||||||||
| Alpha Holding S.A. de CV: | ||||||||||||
| 9.00%, 2/10/25(6)(8) |
3,235 | $ | 459,758 | |||||||||
| 10.00%, 12/19/22(6)(8) |
470 | 66,796 | ||||||||||
| American AgCredit Corp., Series QIB, 5.25% to 6/15/26(4)(5)(6) |
3,764 | 3,848,690 | ||||||||||
| Goldman Sachs Group, Inc. (The), Series V, 4.125% to 11/10/26(4)(5) |
1,046 | 1,050,132 | ||||||||||
| Textron Financial Corp., 1.86%, (3 mo. USD LIBOR + 1.735%), 2/15/67(6)(9) |
1,719 | 1,517,017 | ||||||||||
| Unifin Financiera SAB de CV, 7.375%, 2/12/26(6) |
1,325 | 1,188,499 | ||||||||||
| $ | 8,130,892 | |||||||||||
| Electric Utilities — 0.9% | ||||||||||||
| Emera, Inc., Series 16-A, 6.75% to 6/15/26, 6/15/76(4) |
3,025 | $ | 3,562,331 | |||||||||
| NextEra Energy Capital Holdings, Inc., 5.65% to 5/1/29, 5/1/79(4) |
3,502 | 4,070,177 | ||||||||||
| Southern California Edison Co., Series E, 6.25% to 2/1/22(4)(5) |
1,705 | 1,716,097 | ||||||||||
| Southern Co. (The): | ||||||||||||
| Series 21-A, 3.75% to 6/15/26, 9/15/51(4) |
2,980 | 3,030,064 | ||||||||||
| Series B, 5.50% to 3/15/22, 3/15/57(4) |
2,469 | 2,499,016 | ||||||||||
| $ | 14,877,685 | |||||||||||
| Food Products — 0.5% | ||||||||||||
| Land O’ Lakes, Inc., 8.00%(5)(6) |
8,391 | $ | 9,105,242 | |||||||||
| $ | 9,105,242 | |||||||||||
| Gas Utilities — 0.3% | ||||||||||||
| NiSource, Inc., 5.65% to 6/15/23(4)(5) |
4,965 | $ | 5,262,900 | |||||||||
| $ | 5,262,900 | |||||||||||
| Insurance — 0.3% | ||||||||||||
| Liberty Mutual Group, Inc., 4.125% to 12/15/26, 12/15/51(4)(6) |
1,499 | $ | 1,538,409 | |||||||||
| QBE Insurance Group, Ltd., 5.875% to 5/12/25(4)(5)(6) |
3,702 | 4,053,690 | ||||||||||
| $ | 5,592,099 | |||||||||||
| Security | Principal Amount* (000’s omitted) |
Value | ||||||||||
| Multi-Utilities — 0.5% | ||||||||||||
| Centerpoint Energy, Inc., Series A, 6.125% to 9/1/23(4)(5) |
6,450 | $ | 6,818,779 | |||||||||
| Dominion Resources, Inc., 5.75% to 10/1/24, 10/1/54(4) |
873 | 953,299 | ||||||||||
| $ | 7,772,078 | |||||||||||
| Oil, Gas & Consumable Fuels — 1.0% | ||||||||||||
| DCP Midstream, L.P., Series A, 7.375% to 12/15/22(4)(5) |
6,375 | $ | 6,406,875 | |||||||||
| EnLink Midstream Partners, L.P., Series C, 6.00% to 12/15/22(4)(5) |
4,900 | 3,928,477 | ||||||||||
| Odebrecht Oil & Gas Finance, Ltd., 0.00%(5)(6) |
6,981 | 95,985 | ||||||||||
| Plains All American Pipeline, L.P., Series B, 6.125% to 11/15/22(4)(5) |
8,080 | 7,332,600 | ||||||||||
| $ | 17,763,937 | |||||||||||
| Pipelines — 0.2% | ||||||||||||
| Energy Transfer, L.P., Series B, 6.625% to 2/15/28(4)(5) |
2,514 | $ | 2,444,865 | |||||||||
| $ | 2,444,865 | |||||||||||
| Total Corporate Bonds
|
|
$ | 179,644,345 | |||||||||
| Exchange-Traded Funds — 0.3% |
|
|||||||||||
| Security | Shares | Value | ||||||||||
| Equity Funds — 0.3% | ||||||||||||
| Global X U.S. Preferred ETF |
94,690 | $ | 2,459,099 | |||||||||
| iShares Preferred & Income Securities ETF |
60,532 | 2,383,145 | ||||||||||
| Total Exchange-Traded Funds
|
|
$ | 4,842,244 | |||||||||
| Preferred Stocks — 6.1% | ||||||||||||
| Security | Shares | Value | ||||||||||
| Banks — 1.6% | ||||||||||||
| AgriBank FCB, 6.875% to 1/1/24(4) |
50,890 | $ | 5,534,287 | |||||||||
| CoBank ACB, Series F, 6.25% to 10/1/22(4) |
37,717 | 3,931,997 | ||||||||||
| Farm Credit Bank of Texas, 6.75% to 9/15/23(4)(6) |
7,600 | 824,600 | ||||||||||
| First Republic Bank, Series M, 4.00% |
115,200 | 2,808,576 | ||||||||||
| JPMorgan Chase & Co., Series LL, 4.625% |
88,050 | 2,301,627 | ||||||||||
| Signature Bank, Series A, 5.00% |
117,000 | 3,030,300 | ||||||||||
| 13 | See Notes to Financial Statements. |
Eaton Vance
Tax-Advantaged Global Dividend Income Fund
October 31, 2021
Portfolio of Investments — continued
| Security | Shares | Value | ||||||||
| Banks (continued) | ||||||||||
| Wells Fargo & Co.: | ||||||||||
| Series DD, 4.25% |
60,204 | $ | 1,502,692 | |||||||
| Series L, 7.50% (Convertible) |
3,647 | 5,543,331 | ||||||||
| Series Z, 4.75% |
90,021 | 2,331,544 | ||||||||
| $ | 27,808,954 | |||||||||
| Capital Markets — 0.5% | ||||||||||
| Affiliated Managers Group, Inc., 4.75% |
54,225 | $ | 1,404,970 | |||||||
| KKR Group Finance Co. IX, LLC, 4.625% |
177,000 | 4,650,675 | ||||||||
| Stifel Financial Corp., Series D, 4.50% |
115,200 | 2,937,600 | ||||||||
| $ | 8,993,245 | |||||||||
| Electric Utilities — 0.8% | ||||||||||
| Brookfield BRP Holdings Canada, Inc., 4.625% |
178,000 | $ | 4,446,440 | |||||||
| SCE Trust III, Series H, 5.75% to 3/15/24(4) |
76,426 | 1,969,498 | ||||||||
| SCE Trust IV, Series J, 5.375% to 9/15/25(4) |
37,216 | 932,633 | ||||||||
| SCE Trust V, Series K, 5.45% to 3/15/26(4) |
68,884 | 1,782,718 | ||||||||
| Southern Co. (The), 4.95% |
142,000 | 3,775,780 | ||||||||
| $ | 12,907,069 | |||||||||
| Equity Real Estate Investment Trusts (REITs) — 0.1% | ||||||||||
| SITE Centers Corp., Series A, 6.375% |
88,127 | $ | 2,315,977 | |||||||
| $ | 2,315,977 | |||||||||
| Food Products — 0.5% | ||||||||||
| Dairy Farmers of America, Inc., 7.875%(6) |
64,930 | $ | 6,525,465 | |||||||
| Ocean Spray Cranberries, Inc., Series A, 6.25%(6) |
18,430 | 1,723,205 | ||||||||
| $ | 8,248,670 | |||||||||
| Independent Power and Renewable Electricity Producers — 0.1% | ||||||||||
| Algonquin Power & Utilities Corp., Series 19-A, 6.20% to 7/1/24(4) |
59,970 | $ | 1,682,908 | |||||||
| $ | 1,682,908 | |||||||||
| Insurance — 0.7% | ||||||||||
| American Equity Investment Life Holding Co., Series B, 6.625% to 9/1/25(4) |
185,406 | $ | 5,308,174 | |||||||
| Athene Holding, Ltd., Series C, 6.375% to 6/30/25(4) |
105,760 | 3,054,349 | ||||||||
| RenaissanceRe Holdings, Ltd., Series G, 4.20% |
150,000 | 3,777,000 | ||||||||
| $ | 12,139,523 | |||||||||
| Oil, Gas & Consumable Fuels — 0.5% | ||||||||||
| NuStar Energy, L.P., Series B, 7.625% to 6/15/22(4) |
359,474 | $ | 8,142,086 | |||||||
| $ | 8,142,086 | |||||||||
| Security | Shares | Value | ||||||||||
| Pipelines — 0.3% | ||||||||||||
| Energy Transfer L.P.: | ||||||||||||
| Series C, 7.375% to 5/15/23(4) |
116,000 | $ | 2,927,840 | |||||||||
| Series E, 7.60% to 5/15/24(4) |
100,950 | 2,576,244 | ||||||||||
| $ | 5,504,084 | |||||||||||
| Real Estate Management & Development — 0.5% | ||||||||||||
| Brookfield Property Partners, L.P.: | ||||||||||||
| Series A, 5.75% |
117,848 | $ | 2,876,670 | |||||||||
| Series A-1, 6.50% |
102,075 | 2,623,327 | ||||||||||
| Series A2, 6.375% |
134,005 | 3,476,090 | ||||||||||
| $ | 8,976,087 | |||||||||||
| Wireless Telecommunication Services — 0.5% | ||||||||||||
| United States Cellular Corp., 5.50% |
285,000 | $ | 7,583,850 | |||||||||
| $ | 7,583,850 | |||||||||||
| Total Preferred Stocks
|
|
$ | 104,302,453 | |||||||||
| Total Investments — 120.4%(10) |
|
$ | 2,076,278,838 | |||||||||
| Other Assets, Less Liabilities — (20.4)% |
|
$ | (351,203,868 | ) | ||||||||
| Net Assets — 100.0% |
|
$ | 1,725,074,970 | |||||||||
The percentage shown for each investment category in the Portfolio of Investments is based on net assets.
| * | In U.S. dollars unless otherwise indicated. |
| (1) | Non-income producing security. |
| (2) | Represents an investment in an issuer that may be deemed to be an affiliate effective March 1, 2021 (see Note 9). |
| (3) | All or a portion of this security was on loan at October 31, 2021 pursuant to the Liquidity Agreement (see Note 7). The aggregate market value of securities on loan at October 31, 2021 was $185,645,647. |
| (4) | Security converts to variable rate after the indicated fixed-rate coupon period. |
| (5) | Perpetual security with no stated maturity date but may be subject to calls by the issuer. |
| (6) | Security exempt from registration under Rule 144A of the Securities Act of 1933, as amended. These securities may be sold in certain transactions in reliance on an exemption from registration (normally to qualified institutional buyers). At October 31, 2021, the aggregate value of these securities is $66,571,016 or 3.9% of the Fund’s net assets. |
| (7) | Security exempt from registration under Regulation S of the Securities Act of 1933, as amended, which exempts from registration securities offered and sold outside the United States. Security may not be offered or sold in the United States except pursuant to an exemption from, or in a transaction not subject to, the registration requirements of the Securities |
| 14 | See Notes to Financial Statements. |
Eaton Vance
Tax-Advantaged Global Dividend Income Fund
October 31, 2021
Portfolio of Investments — continued
| Act of 1933, as amended. At October 31, 2021, the aggregate value of these securities is $8,166,870 or 0.5% of the Fund’s net assets. |
| (8) | Issuer is in default with respect to interest and/or principal payments. |
| (9) | Variable rate security. The stated interest rate represents the rate in effect at October 31, 2021. |
| (10) | The Fund has granted a security interest in all the Fund’s investments, unless otherwise pledged, in connection with the Liquidity Agreement (see Note 7). |
| Country Concentration of Portfolio |
| |||||||
| Country | Percentage of Total Investments |
Value | ||||||
| United States |
57.2 | % | $ | 1,186,896,171 | ||||
| United Kingdom |
9.4 | 195,455,807 | ||||||
| France |
6.7 | 139,608,428 | ||||||
| Switzerland |
5.6 | 116,148,725 | ||||||
| Japan |
4.0 | 84,683,490 | ||||||
| Germany |
3.4 | 69,870,700 | ||||||
| Netherlands |
2.3 | 48,664,804 | ||||||
| Sweden |
1.9 | 38,464,396 | ||||||
| Spain |
1.8 | 36,651,868 | ||||||
| Ireland |
1.6 | 33,685,802 | ||||||
| Australia |
1.6 | 32,989,239 | ||||||
| Canada |
1.3 | 27,166,706 | ||||||
| Denmark |
1.0 | 21,641,592 | ||||||
| Taiwan |
0.9 | 19,509,897 | ||||||
| India |
0.4 | 8,083,913 | ||||||
| Mexico |
0.3 | 6,997,881 | ||||||
| Bermuda |
0.2 | 3,777,000 | ||||||
| Colombia |
0.1 | 1,044,190 | ||||||
| Brazil |
0.0 | (1) | 95,985 | |||||
| Exchange-Traded Funds |
0.3 | 4,842,244 | ||||||
| Total Investments |
100.0 | % | $ | 2,076,278,838 | ||||
| (1) | Amount is less than 0.05%. |
| Forward Foreign Currency Exchange Contracts | ||||||||||||||||||||||||
| Currency Purchased | Currency Sold | Counterparty | Settlement Date |
Unrealized Appreciation |
Unrealized (Depreciation) |
|||||||||||||||||||
| USD | 5,558,648 | GBP | 4,037,334 | State Street Bank and Trust Company | 11/30/21 | $ | 33,256 | $ | — | |||||||||||||||
| $ | 33,256 | $ | — | |||||||||||||||||||||
Abbreviations:
| ADR | – | American Depositary Receipt | ||
| LIBOR | – | London Interbank Offered Rate | ||
| PC | – | Participation Certificate | ||
Currency Abbreviations:
| GBP | – | British Pound Sterling | ||
| USD | – | United States Dollar | ||
| 15 | See Notes to Financial Statements. |
Eaton Vance
Tax-Advantaged Global Dividend Income Fund
October 31, 2021
Statement of Assets and Liabilities
| Assets | October 31, 2021 | |||
| Unaffiliated investments, at value including $185,645,647 of securities on loan (identified cost, $1,637,022,744) |
$ | 2,066,599,500 | ||
| Affiliated investments, at value (identified cost, $8,584,485) |
9,679,338 | |||
| Dividends and interest receivable |
3,933,491 | |||
| Dividends receivable from affiliated investments |
191,991 | |||
| Receivable for investments sold |
7,228,553 | |||
| Receivable for open forward foreign currency exchange contracts |
33,256 | |||
| Tax reclaims receivable |
10,135,483 | |||
| Total assets |
$ | 2,097,801,612 | ||
| Liabilities |
| |||
| Liquidity Agreement borrowings |
$ | 370,000,000 | ||
| Due to custodian |
450,985 | |||
| Due to custodian — foreign currency, at value (identified cost, $3,303) |
3,285 | |||
| Payable to affiliates: |
||||
| Investment adviser fee |
1,469,533 | |||
| Trustees’ fees |
8,082 | |||
| Accrued expenses |
794,757 | |||
| Total liabilities |
$ | 372,726,642 | ||
| Net Assets |
$ | 1,725,074,970 | ||
| Sources of Net Assets |
| |||
| Common shares, $0.01 par value, unlimited number of shares authorized, 76,300,214 shares issued and outstanding |
$ | 763,002 | ||
| Additional paid-in capital |
1,302,306,325 | |||
| Distributable earnings |
422,005,643 | |||
| Net Assets |
$ | 1,725,074,970 | ||
| Net Asset Value | ||||
| ($1,725,074,970 ÷ 76,300,214 common shares issued and outstanding) |
$ | 22.61 | ||
| 16 | See Notes to Financial Statements. |
Eaton Vance
Tax-Advantaged Global Dividend Income Fund
October 31, 2021
Statement of Operations
| Investment Income | Year Ended October 31, 2021 |
|||
| Dividends (net of foreign taxes, $6,046,299) |
$ | 72,238,464 | ||
| Interest (net of foreign taxes $44,408) |
10,798,380 | |||
| Dividends from affiliated investments (net of foreign taxes, $37,546) |
346,494 | |||
| Total investment income |
$ | 83,383,338 | ||
| Expenses | ||||
| Investment adviser fee |
$ | 16,662,699 | ||
| Trustees’ fees and expenses |
96,482 | |||
| Custodian fee |
539,071 | |||
| Transfer and dividend disbursing agent fees |
18,661 | |||
| Legal and accounting services |
137,675 | |||
| Printing and postage |
442,681 | |||
| Interest expense and fees |
2,325,415 | |||
| Miscellaneous |
151,887 | |||
| Total expenses |
$ | 20,374,571 | ||
| Net investment income |
$ | 63,008,767 | ||
| Realized and Unrealized Gain (Loss) | ||||
| Net realized gain (loss) — |
||||
| Investment transactions (net of foreign capital gains taxes of $152,218) |
$ | 191,462,918 | ||
| Investment transactions — affiliated investments |
807,345 | |||
| Proceeds from securities litigation settlements |
37,230 | |||
| Financial futures contracts |
(5,607,153 | ) | ||
| Foreign currency transactions |
(46,000 | ) | ||
| Forward foreign currency exchange contracts |
194,817 | |||
| Net realized gain |
$ | 186,849,157 | ||
| Change in unrealized appreciation (depreciation) — |
||||
| Investments |
$ | 341,961,593 | ||
| Investments — affiliated investments |
(31,572 | ) | ||
| Financial futures contracts |
320,378 | |||
| Foreign currency |
(16,384 | ) | ||
| Forward foreign currency exchange contracts |
(28,727 | ) | ||
| Net change in unrealized appreciation (depreciation) |
$ | 342,205,288 | ||
| Net realized and unrealized gain |
$ | 529,054,445 | ||
| Net increase in net assets from operations |
$ | 592,063,212 | ||
| 17 | See Notes to Financial Statements. |
Eaton Vance
Tax-Advantaged Global Dividend Income Fund
October 31, 2021
Statements of Changes in Net Assets
| Year Ended October 31, | ||||||||
| Increase (Decrease) in Net Assets | 2021 | 2020 | ||||||
| From operations — |
||||||||
| Net investment income |
$ | 63,008,767 | $ | 79,483,583 | ||||
| Net realized gain (loss) |
186,849,157 | (36,304,686 | ) | |||||
| Net change in unrealized appreciation (depreciation) |
342,205,288 | (50,378,610 | ) | |||||
| Net increase (decrease) in net assets from operations |
$ | 592,063,212 | $ | (7,199,713 | ) | |||
| Distributions to shareholders |
$ | (100,144,031 | ) | $ | (93,849,263 | ) | ||
| Net increase (decrease) in net assets |
$ | 491,919,181 | $ | (101,048,976 | ) | |||
| Net Assets | ||||||||
| At beginning of year |
$ | 1,233,155,789 | $ | 1,334,204,765 | ||||
| At end of year |
$ | 1,725,074,970 | $ | 1,233,155,789 | ||||
| 18 | See Notes to Financial Statements. |
Eaton Vance
Tax-Advantaged Global Dividend Income Fund
October 31, 2021
Statement of Cash Flows
| Cash Flows From Operating Activities | Year Ended October 31, 2021 |
|||
| Net increase in net assets from operations |
$ | 592,063,212 | ||
| Adjustments to reconcile net increase in net assets from operations to net cash provided by operating activities: |
||||
| Investments purchased |
(2,131,988,533 | ) | ||
| Investments sold |
2,159,842,620 | |||
| Decrease in short-term investments, net |
10,971,365 | |||
| Net amortization/accretion of premium (discount) |
266,261 | |||
| Decrease in dividends and interest receivable |
2,456,217 | |||
| Increase in dividends receivable from affiliated investments |
(190,128 | ) | ||
| Decrease in receivable for open forward foreign currency exchange contracts |
28,727 | |||
| Increase in tax reclaims receivable |
(643,088 | ) | ||
| Decrease in payable for variation margin on open financial futures contracts |
(18,227 | ) | ||
| Increase in payable to affiliate for investment adviser fee |
262,678 | |||
| Increase in payable to affiliate for Trustees’ fees |
974 | |||
| Increase in accrued expenses |
173,457 | |||
| Net change in unrealized (appreciation) depreciation from investments |
(341,930,021 | ) | ||
| Net realized gain from investments |
(192,270,263 | ) | ||
| Net cash provided by operating activities |
$ | 99,025,251 | ||
| Cash Flows From Financing Activities | ||||
| Cash distributions paid |
$ | (100,144,031 | ) | |
| Increase in due to custodian |
450,985 | |||
| Decrease in due to custodian — foreign currency |
(1,246,590 | ) | ||
| Net cash used in financing activities |
$ | (100,939,636 | ) | |
| Net decrease in cash |
$ | (1,914,385 | ) | |
| Cash at beginning of year |
$ | 1,914,385 | ||
| Cash at end of year |
$ | — | ||
| Supplemental disclosure of cash flow information: | ||||
| Cash paid for interest and fees on borrowings |
$ | 2,342,221 | ||
| 19 | See Notes to Financial Statements. |
Eaton Vance
Tax-Advantaged Global Dividend Income Fund
October 31, 2021
Financial Highlights
| Year Ended October 31, | ||||||||||||||||||||
| 2021 | 2020 | 2019 | 2018 | 2017 | ||||||||||||||||
| Net asset value — Beginning of year |
$ | 16.160 | $ | 17.490 | $ | 16.730 | $ | 18.230 | $ | 15.800 | ||||||||||
| Income (Loss) From Operations | ||||||||||||||||||||
| Net investment income(1) |
$ | 0.826 | $ | 1.042 | $ | 1.218 | $ | 0.546 | $ | 1.259 | ||||||||||
| Net realized and unrealized gain (loss) |
6.937 | (1.142 | ) | 0.772 | (0.816 | ) | 2.401 | |||||||||||||
| Total income (loss) from operations |
$ | 7.763 | $ | (0.100 | ) | $ | 1.990 | $ | (0.270 | ) | $ | 3.660 | ||||||||
| Less Distributions | ||||||||||||||||||||
| From net investment income |
$ | (0.894 | ) | $ | (1.230 | ) | $ | (1.166 | ) | $ | (0.560 | ) | $ | (1.230 | ) | |||||
| From net realized gain |
(0.419 | ) | — | (0.064 | ) | (0.670 | ) | — | ||||||||||||
| Total distributions |
$ | (1.313 | ) | $ | (1.230 | ) | $ | (1.230 | ) | $ | (1.230 | ) | $ | (1.230 | ) | |||||
| Net asset value — End of year |
$ | 22.610 | $ | 16.160 | $ | 17.490 | $ | 16.730 | $ | 18.230 | ||||||||||
| Market value — End of year |
$ | 22.200 | $ | 14.290 | $ | 16.770 | $ | 15.540 | $ | 17.190 | ||||||||||
| Total Investment Return on Net Asset Value(2) |
49.37 | % | 0.16 | % | 13.06 | % | (1.38 | )% | 24.42 | % | ||||||||||
| Total Investment Return on Market Value(2) |
65.85 | % | (7.63 | )% | 16.70 | % | (2.91 | )% | 29.34 | % | ||||||||||
| Ratios/Supplemental Data | ||||||||||||||||||||
| Net assets, end of year (000’s omitted) |
$ | 1,725,075 | $ | 1,233,156 | $ | 1,334,205 | $ | 1,276,190 | $ | 1,390,617 | ||||||||||
| Ratios (as a percentage of average daily net assets): |
||||||||||||||||||||
| Expenses excluding interest and fees |
1.12 | % | 1.21 | % | 1.22 | % | 1.18 | % | 1.21 | % | ||||||||||
| Interest and fee expense |
0.15 | % | 0.50 | % | 1.01 | % | 0.76 | % | 0.57 | % | ||||||||||
| Total expenses |
1.27 | % | 1.71 | % | 2.23 | % | 1.94 | % | 1.78 | % | ||||||||||
| Net investment income |
3.93 | % | 6.26 | % | 7.25 | % | 2.98 | % | 7.35 | % | ||||||||||
| Portfolio Turnover |
111 | % | 224 | % | 175 | % | 110 | % | 197 | % | ||||||||||
| Senior Securities: |
||||||||||||||||||||
| Total amount outstanding (in 000’s) |
$ | 370,000 | $ | 370,000 | $ | 425,000 | $ | 425,000 | $ | 425,000 | ||||||||||
| Asset coverage per $1,000(3) |
$ | 5,662 | $ | 4,333 | $ | 4,139 | $ | 4,003 | $ | 4,272 | ||||||||||
| (1) | Computed using average shares outstanding. |
| (2) | Returns are historical and are calculated by determining the percentage change in net asset value or market value with all distributions reinvested. Distributions are assumed to be reinvested at prices obtained under the Fund’s dividend reinvestment plan. |
| (3) | Calculated by subtracting the Fund’s total liabilities (not including the borrowings payable/notes payable) from the Fund’s total assets, and dividing the result by the borrowings payable/notes payable balance in thousands. |
| 20 | See Notes to Financial Statements. |
Eaton Vance
Tax-Advantaged Global Dividend Income Fund
October 31, 2021
Notes to Financial Statements
1 Significant Accounting Policies
Eaton Vance Tax-Advantaged Global Dividend Income Fund (the Fund) is a Massachusetts business trust registered under the Investment Company Act of 1940, as amended (the 1940 Act), as a diversified, closed-end management investment company. The Fund’s investment objective is to provide a high level of after-tax total return consisting primarily of tax-advantaged dividend income and capital appreciation. The Fund pursues its objective by investing primarily in dividend-paying common and preferred stocks.
The following is a summary of significant accounting policies of the Fund. The policies are in conformity with accounting principles generally accepted in the United States of America (U.S. GAAP). The Fund is an investment company and follows accounting and reporting guidance in the Financial Accounting Standards Board (FASB) Accounting Standards Codification Topic 946.
A Investment Valuation — The following methodologies are used to determine the market value or fair value of investments.
Equity Securities. Equity securities listed on a U.S. securities exchange generally are valued at the last sale or closing price on the day of valuation or, if no sales took place on such date, at the mean between the closing bid and ask prices on the exchange where such securities are principally traded. Equity securities listed on the NASDAQ National Market System are valued at the NASDAQ official closing price. Unlisted or listed securities for which closing sales prices or closing quotations are not available are valued at the mean between the latest available bid and ask prices or, in the case of preferred equity securities that are not listed or traded in the over-the-counter market, by a third party pricing service that uses various techniques that consider factors including, but not limited to, prices or yields of securities with similar characteristics, benchmark yields, broker/dealer quotes, quotes of underlying common stock, issuer spreads, as well as industry and economic events.
Debt Obligations. Debt obligations are generally valued on the basis of valuations provided by third party pricing services, as derived from such services’ pricing models. Inputs to the models may include, but are not limited to, reported trades, executable bid and ask prices, broker/dealer quotations, prices or yields of securities with similar characteristics, interest rates, anticipated prepayments, benchmark curves or information pertaining to the issuer, as well as industry and economic events. The pricing services may use a matrix approach, which considers information regarding securities with similar characteristics to determine the valuation for a security. Short-term debt obligations purchased with a remaining maturity of sixty days or less for which a valuation from a third party pricing service is not readily available may be valued at amortized cost, which approximates fair value.
Derivatives. Financial futures contracts are valued at the closing settlement price established by the board of trade or exchange on which they are traded, with adjustments for fair valuation for certain foreign financial futures contracts as described below. Forward foreign currency exchange contracts are generally valued at the mean of the average bid and average ask prices that are reported by currency dealers to a third party pricing service at the valuation time. Such third party pricing service valuations are supplied for specific settlement periods and the Fund’s forward foreign currency exchange contracts are valued at an interpolated rate between the closest preceding and subsequent settlement period reported by the third party pricing service.
Foreign Securities, Financial Futures Contracts and Currencies. Foreign securities, financial futures contracts and currencies are valued in U.S. dollars, based on foreign currency exchange rate quotations supplied by a third party pricing service. The pricing service uses a proprietary model to determine the exchange rate. Inputs to the model include reported trades and implied bid/ask spreads. The daily valuation of exchange-traded foreign securities and certain exchange-traded foreign financial futures contracts generally is determined as of the close of trading on the principal exchange on which such securities and contracts trade. Events occurring after the close of trading on foreign exchanges may result in adjustments to the valuation of foreign securities and certain foreign financial futures contracts to more accurately reflect their fair value as of the close of regular trading on the New York Stock Exchange. When valuing foreign equity securities and foreign financial futures contracts that meet certain criteria, the Fund’s Trustees have approved the use of a fair value service that values such securities and foreign financial futures contracts to reflect market trading that occurs after the close of the applicable foreign markets of comparable securities or other instruments that have a strong correlation to the fair-valued securities and foreign financial futures contracts.
Affiliated Fund. The Fund may invest in Eaton Vance Cash Reserves Fund, LLC (Cash Reserves Fund), an affiliated investment company managed by Eaton Vance Management (EVM). While Cash Reserves Fund is not a registered money market mutual fund, it conducts all of its investment activities in accordance with the requirements of Rule 2a-7 under the 1940 Act. Investments in Cash Reserves Fund are valued at the closing net asset value per unit on the valuation day. Cash Reserves Fund generally values its investment securities based on available market quotations provided by a third party pricing service.
Fair Valuation. Investments for which valuations or market quotations are not readily available or are deemed unreliable are valued at fair value using methods determined in good faith by or at the direction of the Trustees of the Fund in a manner that most fairly reflects the security’s “fair value”, which is the amount that the Fund might reasonably expect to receive for the security upon its current sale in the ordinary course. Each such determination is based on a consideration of relevant factors, which are likely to vary from one pricing context to another. These factors may include, but are not limited to, the type of security, the existence of any contractual restrictions on the security’s disposition, the price and extent of public trading in similar securities of the issuer or of comparable companies or entities, quotations or relevant information obtained from broker/dealers or other market participants, information obtained from the issuer, analysts, and/or the appropriate stock exchange (for exchange-traded securities), an analysis of the company’s or entity’s financial statements, and an evaluation of the forces that influence the issuer and the market(s) in which the security is purchased and sold.
B Investment Transactions — Investment transactions for financial statement purposes are accounted for on a trade date basis. Realized gains and losses on investments sold are determined on the basis of identified cost.
| 21 |
Eaton Vance
Tax-Advantaged Global Dividend Income Fund
October 31, 2021
Notes to Financial Statements — continued
C Income — Dividend income is recorded on the ex-dividend date for dividends received in cash and/or securities. However, if the ex-dividend date has passed, certain dividends from foreign securities are recorded as the Fund is informed of the ex-dividend date. Withholding taxes on foreign dividends, interest and capital gains have been provided for in accordance with the Fund’s understanding of the applicable countries’ tax rules and rates. In consideration of recent decisions rendered by European courts, the Fund has filed additional tax reclaims for previously withheld taxes on dividends earned in certain European Union countries. These filings are subject to various administrative and judicial proceedings within these countries. Due to the uncertainty as to the ultimate resolution of these proceedings, the likelihood of receipt of these reclaims, and the potential timing of payment, no amounts are reflected in the financial statements for such outstanding reclaims. Interest income is recorded on the basis of interest accrued, adjusted for amortization of premium or accretion of discount. Distributions from investment companies are recorded as dividend income, capital gains or return of capital based on the nature of the distribution.
D Federal Taxes — The Fund’s policy is to comply with the provisions of the Internal Revenue Code applicable to regulated investment companies and to distribute to shareholders each year substantially all of its net investment income, and all or substantially all of its net realized capital gains. Accordingly, no provision for federal income or excise tax is necessary.
As of October 31, 2021, the Fund had no uncertain tax positions that would require financial statement recognition, de-recognition, or disclosure. The Fund files a U.S. federal income tax return annually after its fiscal year-end, which is subject to examination by the Internal Revenue Service for a period of three years from the date of filing.
E Foreign Currency Translation — Investment valuations, other assets, and liabilities initially expressed in foreign currencies are translated each business day into U.S. dollars based upon current exchange rates. Purchases and sales of foreign investment securities and income and expenses denominated in foreign currencies are translated into U.S. dollars based upon currency exchange rates in effect on the respective dates of such transactions. Recognized gains or losses on investment transactions attributable to changes in foreign currency exchange rates are recorded for financial statement purposes as net realized gains and losses on investments. That portion of unrealized gains and losses on investments that results from fluctuations in foreign currency exchange rates is not separately disclosed.
F Use of Estimates — The preparation of the financial statements in conformity with U.S. GAAP requires management to make estimates and assumptions that affect the reported amounts of assets and liabilities at the date of the financial statements and the reported amounts of income and expense during the reporting period. Actual results could differ from those estimates.
G Indemnifications — Under the Fund’s organizational documents, its officers and Trustees may be indemnified against certain liabilities and expenses arising out of the performance of their duties to the Fund. Under Massachusetts law, if certain conditions prevail, shareholders of a Massachusetts business trust (such as the Fund) could be deemed to have personal liability for the obligations of the Fund. However, the Fund’s Declaration of Trust contains an express disclaimer of liability on the part of Fund shareholders and the By-laws provide that the Fund shall assume, upon request by the shareholder, the defense on behalf of any Fund shareholders. Moreover, the By-laws also provide for indemnification out of Fund property of any shareholder held personally liable solely by reason of being or having been a shareholder for all loss or expense arising from such liability. Additionally, in the normal course of business, the Fund enters into agreements with service providers that may contain indemnification clauses. The Fund’s maximum exposure under these arrangements is unknown as this would involve future claims that may be made against the Fund that have not yet occurred.
H Financial Futures Contracts — Upon entering into a financial futures contract, the Fund is required to deposit with the broker, either in cash or securities, an amount equal to a certain percentage of the contract amount (initial margin). Subsequent payments, known as variation margin, are made or received by the Fund each business day, depending on the daily fluctuations in the value of the underlying security or index, and are recorded as unrealized gains or losses by the Fund. Gains (losses) are realized upon the expiration or closing of the financial futures contracts. Should market conditions change unexpectedly, the Fund may not achieve the anticipated benefits of the financial futures contracts and may realize a loss. Futures contracts have minimal counterparty risk as they are exchange traded and the clearinghouse for the exchange is substituted as the counterparty, guaranteeing counterparty performance.
I Forward Foreign Currency Exchange Contracts — The Fund may enter into forward foreign currency exchange contracts for the purchase or sale of a specific foreign currency at a fixed price on a future date. The forward foreign currency exchange contracts are adjusted by the daily exchange rate of the underlying currency and any gains or losses are recorded as unrealized until such time as the contracts have been closed. Risks may arise upon entering these contracts from the potential inability of counterparties to meet the terms of their contracts and from movements in the value of a foreign currency relative to the U.S. dollar.
2 Distributions to Shareholders and Income Tax Information
Subject to its Managed Distribution Plan, the Fund intends to make monthly distributions from its net investment income, net capital gain (which is the excess of net long-term capital gain over net short-term capital loss) and other sources. The Fund intends to distribute all or substantially all of its net realized capital gains. Distributions are recorded on the ex-dividend date. Distributions to shareholders are determined in accordance with income tax regulations, which may differ from U.S. GAAP. As required by U.S. GAAP, only distributions in excess of tax basis earnings and profits are reported in the
| 22 |
Eaton Vance
Tax-Advantaged Global Dividend Income Fund
October 31, 2021
Notes to Financial Statements — continued
financial statements as a return of capital. Permanent differences between book and tax accounting relating to distributions are reclassified to paid-in capital. For tax purposes, distributions from short-term capital gains are considered to be from ordinary income. Distributions in any year may include a return of capital component.
The tax character of distributions declared for the years ended October 31, 2021 and October 31, 2020 was as follows:
| Year Ended October 31, | ||||||||
| 2021 | 2020 | |||||||
| Ordinary income |
$ | 68,223,722 | $ | 93,849,263 | ||||
| Long-term capital gains |
$ | 31,920,309 | $ | — | ||||
As of October 31, 2021, the components of distributable earnings (accumulated loss) on a tax basis were as follows:
| Undistributed long-term capital gains |
$ | 7,327,378 | ||
| Net unrealized appreciation |
413,357,725 | |||
| Other temporary differences |
1,320,540 | |||
| Distributable earnings |
$ | 422,005,643 | ||
The cost and unrealized appreciation (depreciation) of investments, including open derivative contracts, of the Fund at October 31, 2021, as determined on a federal income tax basis, were as follows:
| Aggregate cost |
$ | 1,663,227,388 | ||
| Gross unrealized appreciation |
$ | 439,899,191 | ||
| Gross unrealized depreciation |
(26,847,741 | ) | ||
| Net unrealized appreciation |
$ | 413,051,450 | ||
3 Investment Adviser Fee and Other Transactions with Affiliates
The investment adviser fee is earned by EVM as compensation for investment advisory services rendered to the Fund. On March 1, 2021, Morgan Stanley acquired Eaton Vance Corp. (the “Transaction”) and EVM became an indirect, wholly-owned subsidiary of Morgan Stanley. In connection with the Transaction, the Fund entered into a new investment advisory agreement (the “New Agreement”) with EVM, which took effect on March 1, 2021. The Fund’s prior fee reduction agreement was incorporated into the New Agreement. Pursuant to the New Agreement (and the Fund’s investment advisory agreement and related fee reduction agreement with EVM in effect prior to March 1, 2021), the fee is computed at an annual rate as a percentage of average daily gross assets as follows and is payable monthly:
| Average Daily Gross Assets | Annual Fee Rate |
|||
| Up to and including $1.5 billion |
0.850 | % | ||
| Over $1.5 billion up to and including $3 billion |
0.830 | % | ||
| Over $3 billion up to and including $5 billion |
0.810 | % | ||
| Over $5 billion |
0.790 | % | ||
Gross assets, as defined in the New Agreement (and the Fund’s investment advisory agreement with EVM in effect prior to March 1, 2021), means total assets of the Fund, including any form of investment leverage, minus all accrued expenses incurred in the normal course of operations, but not excluding any liabilities or obligations attributable to investment leverage obtained through (i) indebtedness of any type (including, without limitation, borrowing through a credit facility or the issuance of debt securities), (ii) the issuance of preferred stock or other similar preference securities, (iii) the reinvestment of collateral received for securities loaned in accordance with the Fund’s investment objectives and policies, and/or (iv) any other means. Accrued expenses
| 23 |
Eaton Vance
Tax-Advantaged Global Dividend Income Fund
October 31, 2021
Notes to Financial Statements — continued
includes other liabilities other than indebtedness attributable to leverage. For the year ended October 31, 2021, the Fund’s investment adviser fee amounted to $16,662,699 or 0.84% of the Fund’s average daily gross assets.
Pursuant to an investment sub-advisory agreement, EVM has delegated the investment management of the Fund to Eaton Vance Advisers International Ltd. (EVAIL), an affiliate of EVM and, effective March 1, 2021, an indirect, wholly-owned subsidiary of Morgan Stanley. In connection with the Transaction, EVM entered into a new sub-advisory agreement with EVAIL, which took effect on March 1, 2021. EVM pays EVAIL a portion of its investment adviser fee for sub-advisory services provided to the Fund. The Fund may invest its cash in Cash Reserves Fund. EVM does not currently receive a fee for advisory services provided to Cash Reserves Fund. EVM also serves as administrator of the Fund, but receives no compensation.
Trustees and officers of the Fund who are members of EVM’s organization receive remuneration for their services to the Fund out of the investment adviser fee. Trustees of the Fund who are not affiliated with EVM may elect to defer receipt of all or a percentage of their annual fees in accordance with the terms of the Trustees Deferred Compensation Plan. For the year ended October 31, 2021, no significant amounts have been deferred. Certain officers and Trustees of the Fund are officers of EVM.
4 Purchases and Sales of Investments
Purchases and sales of investments, other than short-term obligations, aggregated $2,127,387,168 and $2,157,161,889, respectively, for the year ended October 31, 2021.
5 Common Shares of Beneficial Interest
The Fund may issue common shares pursuant to its dividend reinvestment plan. There were no common shares issued by the Fund for the years ended October 31, 2021 and October 31, 2020.
In November 2013, the Board of Trustees initially approved a share repurchase program for the Fund. Pursuant to the reauthorization of the share repurchase program by the Board of Trustees in March 2019, the Fund is authorized to repurchase up to 10% of its common shares outstanding as of the last day of the prior calendar year at market prices when shares are trading at a discount to net asset value. The share repurchase program does not obligate the Fund to purchase a specific amount of shares. There were no repurchases of common shares by the Fund for the years ended October 31, 2021 and October 31, 2020.
6 Financial Instruments
The Fund may trade in financial instruments with off-balance sheet risk in the normal course of its investing activities. These financial instruments may include futures contracts and forward foreign currency exchange contracts and may involve, to a varying degree, elements of risk in excess of the amounts recognized for financial statement purposes. The notional or contractual amounts of these instruments represent the investment the Fund has in particular classes of financial instruments and do not necessarily represent the amounts potentially subject to risk. The measurement of the risks associated with these instruments is meaningful only when all related and offsetting transactions are considered. A summary of obligations under these financial instruments at October 31, 2021 is included in the Portfolio of Investments. At October 31, 2021, the Fund had sufficient cash and/or securities to cover commitments under these contracts.
In the normal course of pursuing its investment objective, the Fund is subject to the following risks:
Equity Price Risk: The Fund enters into equity futures contracts on securities indices to gain or limit exposure to certain markets, particularly in connection with engaging in the dividend capture trading strategy.
Foreign Exchange Risk: The Fund engages in forward foreign currency exchange contracts to seek to hedge against fluctuations in currency exchange rates.
The Fund enters into forward foreign currency exchange contracts that may contain provisions whereby the counterparty may terminate the contract under certain conditions, including but not limited to a decline in the Fund’s net assets below a certain level over a certain period of time, which would trigger a payment by the Fund for those derivatives in a liability position. At October 31, 2021, the Fund had no open derivatives with credit-related contingent features in a net liability position.
The over-the-counter (OTC) derivatives in which the Fund invests are subject to the risk that the counterparty to the contract fails to perform its obligations under the contract. To mitigate this risk, the Fund has entered into an International Swaps and Derivatives Association, Inc. Master Agreement (“ISDA Master Agreement”) or similar agreement with substantially all its derivative counterparties. An ISDA Master Agreement is a bilateral agreement between the Fund and a counterparty that governs certain OTC derivatives and typically contains, among other things, set-off provisions in the event of a default and/or termination event as defined under the relevant ISDA Master Agreement. Under an ISDA Master Agreement, the Fund may, under certain circumstances, offset with the counterparty certain derivative financial instruments’ payables and/or receivables with collateral held and/or posted and create one single net payment. The provisions of the ISDA Master Agreement typically permit a single net payment in the event of default including the bankruptcy or insolvency of the counterparty. However, bankruptcy or insolvency laws of a particular jurisdiction may impose restrictions on or prohibitions
| 24 |
Eaton Vance
Tax-Advantaged Global Dividend Income Fund
October 31, 2021
Notes to Financial Statements — continued
against the right of offset in bankruptcy or insolvency. Certain ISDA Master Agreements allow counterparties to OTC derivatives to terminate derivative contracts prior to maturity in the event the Fund’s net assets decline by a stated percentage or the Fund fails to meet the terms of its ISDA Master Agreements, which would cause the counterparty to accelerate payment by the Fund of any net liability owed to it.
The collateral requirements for derivatives traded under an ISDA Master Agreement are governed by a Credit Support Annex to the ISDA Master Agreement. Collateral requirements are determined at the close of business each day and are typically based on changes in market values for each transaction under an ISDA Master Agreement and netted into one amount for such agreement. Generally, the amount of collateral due from or to a counterparty is subject to a minimum transfer threshold amount before a transfer is required, which may vary by counterparty. Collateral pledged for the benefit of the Fund and/or counterparty is held in segregated accounts by the Fund’s custodian and cannot be sold, re-pledged, assigned or otherwise used while pledged. The portion of such collateral representing cash, if any, is reflected as deposits for derivatives collateral and, in the case of cash pledged by a counterparty for the benefit of the Fund, a corresponding liability on the Statement of Assets and Liabilities. Securities pledged by the Fund as collateral, if any, are identified as such in the Portfolio of Investments.
The fair value of open derivative instruments (not considered to be hedging instruments for accounting disclosure purposes) and whose primary underlying risk exposure is foreign exchange risk at October 31, 2021 was as follows:
| Fair Value | ||||||||
| Derivative | Asset Derivative | Liability Derivative | ||||||
| Forward foreign currency exchange contracts |
$ | 33,256 | (1) | $ | — | |||
| (1) | Statement of Assets and Liabilities location: Receivable for open forward foreign currency exchange contracts. |
The Fund’s derivative assets and liabilities at fair value by risk, which are reported gross in the Statement of Assets and Liabilities, are presented in the table above. The following table presents the Fund’s derivative assets by counterparty, net of amounts available for offset under a master netting agreement and net of the related collateral received by the Fund for such assets as of October 31, 2021.
| Counterparty | Derivative Assets Subject to Master Netting Agreement |
Derivatives Available for Offset |
Non-cash Collateral Received(a) |
Cash Collateral Received(a) |
Net Amount of Derivative Assets(b) |
|||||||||||||||
| State Street Bank and Trust Company |
$ | 33,256 | $ | — | $ | — | $ | — | $ | 33,256 | ||||||||||
| (a) | In some instances, the total collateral received and/or pledged may be more than the amount shown due to overcollateralization. |
| (b) | Net amount represents the net amount due from the counterparty in the event of default. |
The effect of derivative instruments (not considered to be hedging instruments for accounting disclosure purposes) on the Statement of Operations by risk exposure for the year ended October 31, 2021 was as follows:
| Risk | Derivative | Realized Gain (Loss) on Derivatives Recognized in Income(1) |
Change in Unrealized Appreciation (Depreciation) on Derivatives Recognized in Income(2) |
|||||||
| Equity Price |
Futures contracts |
$ | (5,607,153 | ) | $ | 320,378 | ||||
| Foreign Exchange |
Forward foreign currency exchange contracts | 194,817 | (28,727 | ) | ||||||
| Total |
$ | (5,412,336 | ) | $ | 291,651 | |||||
| (1) | Statement of Operations location: Net realized gain (loss) – Financial futures contracts and Forward foreign currency exchange contracts, respectively. |
| (2) | Statement of Operations location: Change in unrealized appreciation (depreciation) – Financial futures contracts and Forward foreign currency exchange contracts, respectively. |
| 25 |
Eaton Vance
Tax-Advantaged Global Dividend Income Fund
October 31, 2021
Notes to Financial Statements — continued
The average notional cost of futures contracts and average notional amounts of other derivative contracts outstanding during the year ended October 31, 2021, which are indicative of the volume of these derivative types, were approximately as follows:
| Futures Contracts — Long |
Futures Contracts — Short |
Forward Exchange Contracts* |
||||||||
| $96,598,000 | $ | 99,313,000 | $ | 5,641,000 | ||||||
| * | The average notional amount for forward foreign currency exchange contracts is based on the absolute value of notional amounts of currency purchased and currency sold. |
7 Liquidity Agreement
Effective August 28, 2020, the Fund entered into a Liquidity Agreement (the Agreement) with State Street Bank and Trust Company (SSBT) that allows the Fund to borrow or otherwise access up to $435 million through securities lending transactions, direct loans from SSBT or a combination of both. The Fund has granted to SSBT a security interest in all its cash, securities and other financial assets, unless otherwise pledged, to secure the payment and performance of its obligations under the Agreement. Pursuant to the terms of the Agreement, the Fund has made its securities available for securities lending transactions by SSBT acting as securities lending agent for the Fund. Securities lending transactions are required to be secured with cash collateral received from the securities borrowers equal at all times to at least 100%, 102% or 105% of the market value of the securities loaned, depending on the type of security. The market value of securities loaned is determined daily and any additional required collateral is delivered to SSBT on the next business day. The Fund is subject to the possible delay in the recovery of loaned securities. Pursuant to the Agreement, SSBT has provided indemnification to the Fund in the event of default by a securities borrower with respect to security loans. However, the Fund retains all risk of loss and gains associated with securities purchased using cash received as collateral for security loans. The Fund is entitled to receive from securities borrowers all substitute interest, dividends and other distributions paid with respect to the securities on loan. The Fund may instruct SSBT to recall a security on loan at any time. At October 31, 2021, the value of the securities loaned and the value of the cash collateral received by SSBT, which exceeded the value of the securities loaned, amounted to $185,645,647 and $188,339,139, respectively.
Interest on borrowings outstanding under the Agreement is charged at a rate equal to 1-month LIBOR plus 0.50%, payable monthly. SSBT retains all net fees that may arise in connection with securities lending transactions. If the value of securities available to lend falls below a prescribed level, the interest rate may be increased. If the Fund utilizes less than 50% of the commitment amount, it will be charged a monthly non-usage fee of 0.25% per annum on the unused portion of the commitment. The Agreement may be terminated by either SSBT or the Fund upon 360 days’ prior written notice to the other party and after the second anniversary of the Agreement, by the Fund upon 90 days’ prior written notice to SSBT. If certain asset coverage and collateral requirements or other covenants are not met, the Agreement could be deemed in default and result in termination. At October 31, 2021, the Fund had borrowings outstanding under the Agreement of $370 million at an annual interest rate of 0.58%, which are shown as Liquidity Agreement borrowings on the Statement of Assets and Liabilities. The carrying amount of the borrowings at October 31, 2021 approximated its fair value. If measured at fair value, borrowings under the Agreement would have been considered as Level 2 in the fair value hierarchy (see Note 10) at October 31, 2021. For the year ended October 31, 2021, the aggregate average borrowings under the Agreement and the average annual interest rate (excluding fees) were $370,000,000 and 0.63%, respectively.
8 Overdraft Advances
Pursuant to the custodian agreement, SSBT may, in its discretion, advance funds to the Fund to make properly authorized payments. When such payments result in an overdraft, the Fund is obligated to repay SSBT at the current rate of interest charged by SSBT for secured loans (currently, the Federal Funds rate plus 2%). This obligation is payable on demand to SSBT. SSBT has a lien on the Fund’s assets to the extent of any overdraft. At October 31, 2021, the Fund had a payment due to SSBT pursuant to the foregoing arrangement of $450,985. Based on the short-term nature of these payments and the variable interest rate, the carrying value of the overdraft advances approximated its fair value at October 31, 2021. If measured at fair value, overdraft advances would have been considered as Level 2 in the fair value hierarchy (see Note 10) at October 31, 2021. The Fund’s average overdraft advances during the year ended October 31, 2021 were not significant.
| 26 |
Eaton Vance
Tax-Advantaged Global Dividend Income Fund
October 31, 2021
Notes to Financial Statements — continued
9 Investments in Affiliated Issuers and Funds
The Fund invested in issuers that may be deemed to be affiliated with Morgan Stanley. At October 31, 2021, the value of the Fund’s investment in affiliated issuers and funds was $9,679,338, which represents 0.6% of the Fund’s net assets. Transactions in affiliated issuers and funds by the Fund for the year ended October 31, 2021 were as follows:
| Name | Value, beginning of period |
Purchases | Sales proceeds |
Net realized gain (loss) |
Change in unrealized appreciation (depreciation) |
Value, end of period |
Dividend income |
Shares/ Units, end of period |
||||||||||||||||||||||||
| Common Stocks |
| |||||||||||||||||||||||||||||||
| Mitsubishi UFJ Financial Group, Inc.(1) |
$ | — | $ | 1,781,137 | $ | (4,329,522 | ) | $ | 806,951 | $ | (31,572 | ) | $ | 9,679,338 | $ | 337,918 | 1,765,177 | |||||||||||||||
| Short-Term Investments |
| |||||||||||||||||||||||||||||||
| Eaton Vance Cash Reserves Fund, LLC |
10,970,971 | 581,891,164 | (592,862,529 | ) | 394 | — | — | 8,576 | — | |||||||||||||||||||||||
| $ | 807,345 | $ | (31,572 | ) | $ | 9,679,338 | $ | 346,494 | ||||||||||||||||||||||||
| (1) | May be deemed to be an affiliated issuer as of March 1, 2021 (see Note 3). |
10 Fair Value Measurements
Under generally accepted accounting principles for fair value measurements, a three-tier hierarchy to prioritize the assumptions, referred to as inputs, is used in valuation techniques to measure fair value. The three-tier hierarchy of inputs is summarized in the three broad levels listed below.
| • | Level 1 – quoted prices in active markets for identical investments |
| • | Level 2 – other significant observable inputs (including quoted prices for similar investments, interest rates, prepayment speeds, credit risk, etc.) |
| • | Level 3 – significant unobservable inputs (including a fund’s own assumptions in determining the fair value of investments) |
In cases where the inputs used to measure fair value fall in different levels of the fair value hierarchy, the level disclosed is determined based on the lowest level input that is significant to the fair value measurement in its entirety. The inputs or methodology used for valuing securities are not necessarily an indication of the risk associated with investing in those securities.
| 27 |
Eaton Vance
Tax-Advantaged Global Dividend Income Fund
October 31, 2021
Notes to Financial Statements — continued
At October 31, 2021, the hierarchy of inputs used in valuing the Fund’s investments and open derivative instruments, which are carried at value, were as follows:
| Asset Description | Level 1 | Level 2 | Level 3 | Total | ||||||||||||
| Common Stocks |
| |||||||||||||||
| Communication Services |
$ | 147,228,438 | $ | 7,909,634 | $ | — | $ | 155,138,072 | ||||||||
| Consumer Discretionary |
92,853,549 | 109,145,393 | — | 201,998,942 | ||||||||||||
| Consumer Staples |
55,962,433 | 68,479,071 | — | 124,441,504 | ||||||||||||
| Energy |
48,801,954 | — | — | 48,801,954 | ||||||||||||
| Financials |
121,407,632 | 122,950,941 | — | 244,358,573 | ||||||||||||
| Health Care |
109,649,962 | 155,628,755 | — | 265,278,717 | ||||||||||||
| Industrials |
107,251,926 | 143,919,120 | — | 251,171,046 | ||||||||||||
| Information Technology |
290,491,503 | 111,912,870 | — | 402,404,373 | ||||||||||||
| Materials |
— | 38,592,751 | — | 38,592,751 | ||||||||||||
| Real Estate |
17,547,960 | — | — | 17,547,960 | ||||||||||||
| Utilities |
22,539,919 | 15,215,985 | — | 37,755,904 | ||||||||||||
| Total Common Stocks |
$ | 1,013,735,276 | $ | 773,754,520 | * | $ | — | $ | 1,787,489,796 | |||||||
| Corporate Bonds |
$ | — | $ | 179,644,345 | $ | — | $ | 179,644,345 | ||||||||
| Exchange-Traded Funds |
4,842,244 | — | — | 4,842,244 | ||||||||||||
| Preferred Stocks |
| |||||||||||||||
| Communication Services |
7,583,850 | — | — | 7,583,850 | ||||||||||||
| Consumer Staples |
— | 8,248,670 | — | 8,248,670 | ||||||||||||
| Energy |
13,646,170 | — | — | 13,646,170 | ||||||||||||
| Financials |
34,000,163 | 14,941,559 | — | 48,941,722 | ||||||||||||
| Real Estate |
11,292,064 | — | — | 11,292,064 | ||||||||||||
| Utilities |
12,907,069 | 1,682,908 | — | 14,589,977 | ||||||||||||
| Total Preferred Stocks |
$ | 79,429,316 | $ | 24,873,137 | $ | — | $ | 104,302,453 | ||||||||
| Total Investments |
$ | 1,098,006,836 | $ | 978,272,002 | $ | — | $ | 2,076,278,838 | ||||||||
| Forward Foreign Currency Exchange Contracts |
$ | — | $ | 33,256 | $ | — | $ | 33,256 | ||||||||
| Total |
$ | 1,098,006,836 | $ | 978,305,258 | $ | — | $ | 2,076,312,094 | ||||||||
| * | Includes foreign equity securities whose values were adjusted to reflect market trading of comparable securities or other correlated instruments that occurred after the close of trading in their applicable foreign markets. |
Level 3 investments at the beginning and/or end of the period in relation to net assets were not significant and accordingly, a reconciliation of Level 3 assets for the year ended October 31, 2021 is not presented.
11 Risks and Uncertainties
Risks Associated with Foreign Investments
Foreign investments can be adversely affected by political, economic and market developments abroad, including the imposition of economic and other sanctions by the United States or another country. There may be less publicly available information about foreign issuers because they may not be subject to reporting practices, requirements or regulations comparable to those to which United States companies are subject. Foreign markets may be smaller, less liquid and more volatile than the major markets in the United States. Trading in foreign markets typically involves higher expense than trading in the United States. The Fund may have difficulties enforcing its legal or contractual rights in a foreign country. Securities that trade or are denominated in currencies other than the U.S. dollar may be adversely affected by fluctuations in currency exchange rates.
| 28 |
Eaton Vance
Tax-Advantaged Global Dividend Income Fund
October 31, 2021
Notes to Financial Statements — continued
Pandemic Risk
An outbreak of respiratory disease caused by a novel coronavirus was first detected in China in late 2019 and subsequently spread internationally. This coronavirus has resulted in closing borders, enhanced health screenings, changes to healthcare service preparation and delivery, quarantines, cancellations, disruptions to supply chains and customer activity, as well as general concern and uncertainty. Health crises caused by outbreaks, such as the coronavirus outbreak, may exacerbate other pre-existing political, social and economic risks and disrupt normal market conditions and operations. The impact of this outbreak has negatively affected the worldwide economy, the economies of individual countries, individual companies, and the market in general, and may continue to do so in significant and unforeseen ways, as may other epidemics and pandemics that may arise in the future. Any such impact could adversely affect the Fund’s performance, or the performance of the securities in which the Fund invests.
| 29 |
Eaton Vance
Tax-Advantaged Global Dividend Income Fund
October 31, 2021
Report of Independent Registered Public Accounting Firm
To the Trustees and Shareholders of Eaton Vance Tax-Advantaged Global Dividend Income Fund:
Opinion on the Financial Statements and Financial Highlights
We have audited the accompanying statement of assets and liabilities of Eaton Vance Tax-Advantaged Global Dividend Income Fund (the “Fund”), including the portfolio of investments, as of October 31, 2021, the related statements of operations and cash flows for the year then ended, the statements of changes in net assets for each of the two years in the period then ended, the financial highlights for each of the five years in the period then ended, and the related notes. In our opinion, the financial statements and financial highlights present fairly, in all material respects, the financial position of the Fund as of October 31, 2021, and the results of its operations and its cash flows for the year then ended, the changes in its net assets for each of the two years in the period then ended, and the financial highlights for each of the five years in the period then ended, in conformity with accounting principles generally accepted in the United States of America.
Basis for Opinion
These financial statements and financial highlights are the responsibility of the Fund’s management. Our responsibility is to express an opinion on the Fund’s financial statements and financial highlights based on our audits. We are a public accounting firm registered with the Public Company Accounting Oversight Board (United States) (PCAOB) and are required to be independent with respect to the Fund in accordance with the U.S. federal securities laws and the applicable rules and regulations of the Securities and Exchange Commission and the PCAOB.
We conducted our audits in accordance with the standards of the PCAOB. Those standards require that we plan and perform the audit to obtain reasonable assurance about whether the financial statements and financial highlights are free of material misstatement, whether due to error or fraud. The Fund is not required to have, nor were we engaged to perform, an audit of its internal control over financial reporting. As part of our audits we are required to obtain an understanding of internal control over financial reporting but not for the purpose of expressing an opinion on the effectiveness of the Fund’s internal control over financial reporting. Accordingly, we express no such opinion.
Our audits included performing procedures to assess the risks of material misstatement of the financial statements and financial highlights, whether due to error or fraud, and performing procedures that respond to those risks. Such procedures included examining, on a test basis, evidence regarding the amounts and disclosures in the financial statements and financial highlights. Our audits also included evaluating the accounting principles used and significant estimates made by management, as well as evaluating the overall presentation of the financial statements and financial highlights. Our procedures included confirmation of securities owned as of October 31, 2021, by correspondence with the custodian and brokers; when replies were not received from brokers, we performed other auditing procedures. We believe that our audits provide a reasonable basis for our opinion.
/s/ Deloitte & Touche LLP
Boston, Massachusetts
December 16, 2021
We have served as the auditor of one or more Eaton Vance investment companies since 1959.
| 30 |
Eaton Vance
Tax-Advantaged Global Dividend Income Fund
October 31, 2021
Federal Tax Information (Unaudited)
The Form 1099-DIV you receive in February 2022 will show the tax status of all distributions paid to your account in calendar year 2021. Shareholders are advised to consult their own tax adviser with respect to the tax consequences of their investment in the Fund. As required by the Internal Revenue Code and/or regulations, shareholders must be notified regarding the status of qualified dividend income for individuals, the dividends received deduction for corporations, 163(j) interest dividends and capital gains dividends.
Qualified Dividend Income. For the fiscal year ended October 31, 2021, the Fund designates approximately $81,300,261, or up to the maximum amount of such dividends allowable pursuant to the Internal Revenue Code, as qualified dividend income eligible for the reduced tax rate of 15%.
Dividends Received Deduction. Corporate shareholders are generally entitled to take the dividends received deduction on the portion of the Fund’s dividend distribution that qualifies under tax law. For the Fund’s fiscal 2021 ordinary income dividends, 19.79% qualifies for the corporate dividends received deduction.
163(j) Interest Dividends. For the fiscal year ended October 31, 2021, the Fund designates 8.04% of distributions from net investment income as a 163(j) interest dividend.
Capital Gains Dividends. The Fund hereby designates as a capital gain dividend with respect to the taxable year ended October 31, 2021, $39,247,687 or, if subsequently determined to be different, the net capital gain of such year.
| 31 |
Eaton Vance
Tax-Advantaged Global Dividend Income Fund
October 31, 2021
Annual Meeting of Shareholders (Unaudited)
The Fund held its Annual Meeting of Shareholders on August 12, 2021. The following action was taken by the shareholders:
Proposal 1: The election of George J. Gorman, Helen Frame Peters, Marcus L. Smith and Susan J. Sutherland as Class III Trustees of the Fund, each for a three-year term ending in 2024.
| Number of Shares | ||||||||
| Nominee for Trustee | For | Withheld | ||||||
| George J. Gorman |
37,574,019 | 24,430,825 | ||||||
| Helen Frame Peters |
37,340,319 | 24,664,525 | ||||||
| Marcus L. Smith |
37,505,412 | 24,499,432 | ||||||
| Susan J. Sutherland |
37,329,914 | 24,674,930 | ||||||
| 32 |
Eaton Vance
Tax-Advantaged Global Dividend Income Fund
October 31, 2021
The Fund offers a dividend reinvestment plan (Plan) pursuant to which shareholders may elect to have distributions automatically reinvested in common shares (Shares) of the Fund. You may elect to participate in the Plan by completing the Dividend Reinvestment Plan Application Form. If you do not participate, you will receive all distributions in cash paid by check mailed directly to you by American Stock Transfer & Trust Company, LLC (AST) as dividend paying agent. On the distribution payment date, if the NAV per Share is equal to or less than the market price per Share plus estimated brokerage commissions, then new Shares will be issued. The number of Shares shall be determined by the greater of the NAV per Share or 95% of the market price. Otherwise, Shares generally will be purchased on the open market by AST, the Plan agent (Agent). Distributions subject to income tax (if any) are taxable whether or not Shares are reinvested.
If your Shares are in the name of a brokerage firm, bank, or other nominee, you can ask the firm or nominee to participate in the Plan on your behalf. If the nominee does not offer the Plan, you will need to request that the Fund’s transfer agent re-register your Shares in your name or you will not be able to participate.
The Agent’s service fee for handling distributions will be paid by the Fund. Plan participants will be charged their pro rata share of brokerage commissions on all open-market purchases.
Plan participants may withdraw from the Plan at any time by writing to the Agent at the address noted on the following page. If you withdraw, you will receive Shares in your name for all Shares credited to your account under the Plan. If a participant elects by written notice to the Agent to sell part or all of his or her Shares and remit the proceeds, the Agent is authorized to deduct a $5.00 fee plus brokerage commissions from the proceeds.
If you wish to participate in the Plan and your Shares are held in your own name, you may complete the form on the following page and deliver it to the Agent. Any inquiries regarding the Plan can be directed to the Agent at 1-866-439-6787.
| 33 |
Eaton Vance
Tax-Advantaged Global Dividend Income Fund
October 31, 2021
Application for Participation in Dividend Reinvestment Plan
This form is for shareholders who hold their common shares in their own names. If your common shares are held in the name of a brokerage firm, bank, or other nominee, you should contact your nominee to see if it will participate in the Plan on your behalf. If you wish to participate in the Plan, but your brokerage firm, bank, or nominee is unable to participate on your behalf, you should request that your common shares be re-registered in your own name which will enable your participation in the Plan.
The following authorization and appointment is given with the understanding that I may terminate it at any time by terminating my participation in the Plan as provided in the terms and conditions of the Plan.
Please print exact name on account
Shareholder signature Date
Shareholder signature Date
Please sign exactly as your common shares are registered. All persons whose names appear on the share certificate must sign.
YOU SHOULD NOT RETURN THIS FORM IF YOU WISH TO RECEIVE YOUR DISTRIBUTIONS IN CASH. THIS IS NOT A PROXY.
This authorization form, when signed, should be mailed to the following address:
Eaton Vance Tax-Advantaged Global Dividend Income Fund
c/o American Stock Transfer & Trust Company, LLC
P.O. Box 922
Wall Street Station
New York, NY 10269-0560
| 34 |
Eaton Vance
Tax-Advantaged Global Dividend Income Fund
October 31, 2021
Fund Management. The Trustees of Eaton Vance Tax-Advantaged Global Dividend Income Fund (the Fund) are responsible for the overall management and supervision of the Fund’s affairs. The Trustees and officers of the Fund are listed below. Except as indicated, each individual has held the office shown or other offices in the same company for the last five years. The “Noninterested Trustees” consist of those Trustees who are not “interested persons” of the Fund, as that term is defined under the 1940 Act. The business address of each Trustee and officer is Two International Place, Boston, Massachusetts 02110. As used below, “EVC” refers to Eaton Vance Corp., “EV” refers to EV LLC, “EVM” refers to Eaton Vance Management, “BMR” refers to Boston Management and Research and “EVD” refers to Eaton Vance Distributors, Inc. EV is the trustee of each of EVM and BMR. Effective March 1, 2021, each of EVM, BMR, EVD and EV are indirect, wholly owned subsidiaries of Morgan Stanley. Each officer affiliated with EVM may hold a position with other EVM affiliates that is comparable to his or her position with EVM listed below. Each Trustee oversees 138 portfolios (with the exception of Messrs. Faust and Wennerholm and Ms. Frost who oversee 137 portfolios) in the Eaton Vance Complex (including all master and feeder funds in a master feeder structure). Each officer serves as an officer of certain other Eaton Vance funds.
| Name and Year of Birth | Fund Position(s) |
Term Expiring. Trustee |
Principal Occupation(s) and Other Directorships During Past Five Years and Other Relevant Experience | |||
| Interested Trustee | ||||||
| Thomas E. Faust Jr. 1958 |
Class II Trustee |
Until 2023. Trustee |
Chairman of Morgan Stanley Investment Management, Inc. (MSIM), member of the Board of Managers and President of EV, Chief Executive Officer of EVM and BMR, and Director of EVD. Formerly, Chairman, Chief Executive Officer and President of EVC. Trustee and/or officer of 137 registered investment companies. Mr. Faust is an interested person because of his positions with MSIM, BMR, EVM, EVD, and EV, which are affiliates of the Fund, and his former position with EVC, which was an affiliate of the Fund prior to March 1, 2021. Other Directorships in the Last Five Years. Formerly, Director of EVC (2007-2021) and Hexavest Inc. (investment management firm) (2012-2021). | |||
| Noninterested Trustees | ||||||
| Mark R. Fetting 1954 |
Class II Trustee |
Until 2023. Trustee |
Private investor. Formerly held various positions at Legg Mason, Inc. (investment management firm) (2000-2012), including President, Chief Executive Officer, Director and Chairman (2008-2012), Senior Executive Vice President (2004-2008) and Executive Vice President (2001-2004). Formerly, President of Legg Mason family of funds (2001-2008). Formerly, Division President and Senior Officer of Prudential Financial Group, Inc. and related companies (investment management firm) (1991-2000). Other Directorships in the Last Five Years. None. | |||
| Cynthia E. Frost 1961 |
Class I Trustee |
Until 2022. Trustee |
Private investor. Formerly, Chief Investment Officer of Brown University (university endowment) (2000-2012). Formerly, Portfolio Strategist for Duke Management Company (university endowment manager) (1995-2000). Formerly, Managing Director, Cambridge Associates (investment consulting company) (1989-1995). Formerly, Consultant, Bain and Company (management consulting firm) (1987-1989). Formerly, Senior Equity Analyst, BA Investment Management Company (1983-1985). Other Directorships in the Last Five Years. None. | |||
| George J. Gorman 1952 |
Chairperson of the Board and Class III Trustee |
Until 2024. Chairperson of the Board since 2021 and Trustee since 2014. |
Principal at George J. Gorman LLC (consulting firm). Formerly, Senior Partner at Ernst & Young LLP (a registered public accounting firm) (1974-2009). Other Directorships in the Last Five Years. None. | |||
| Valerie A. Mosley 1960 |
Class I Trustee |
Until 2022. Trustee |
Chairwoman and Chief Executive Officer of Valmo Ventures (a consulting and investment firm). Founder of Upward Wealth, Inc., dba BrightUP, a fintech platform. Formerly, Partner and Senior Vice President, Portfolio Manager and Investment Strategist at Wellington Management Company, LLP (investment management firm) (1992-2012). Formerly, Chief Investment Officer, PG Corbin Asset Management (1990-1992). Formerly worked in institutional corporate bond sales at Kidder Peabody (1986-1990). Other Directorships in the Last Five Years. Director of DraftKings, Inc. (digital sports entertainment and gaming company) (since September 2020). Director of Groupon, Inc. (e-commerce provider) (since April 2020). Director of Envestnet, Inc. (provider of intelligent systems for wealth management and financial wellness) (since 2018). Formerly, Director of Dynex Capital, Inc. (mortgage REIT) (2013-2020). | |||
| 35 |
Eaton Vance
Tax-Advantaged Global Dividend Income Fund
October 31, 2021
Management and Organization — continued
| Name and Year of Birth | Fund Position(s) |
Term Expiring. Trustee |
Principal Occupation(s) and Other Directorships During Past Five Years and Other Relevant Experience | |||
| Noninterested Trustees (continued) | ||||||
| William H. Park 1947 |
Class II Trustee |
Until 2023. Trustee |
Private investor. Formerly, Consultant (management and transactional) (2012-2014). Formerly, Chief Financial Officer, Aveon Group L.P. (investment management firm) (2010-2011). Formerly, Vice Chairman, Commercial Industrial Finance Corp. (specialty finance company) (2006-2010). Formerly, President and Chief Executive Officer, Prizm Capital Management, LLC (investment management firm) (2002-2005). Formerly, Executive Vice President and Chief Financial Officer, United Asset Management Corporation (investment management firm) (1982-2001). Formerly, Senior Manager, Price Waterhouse (now PricewaterhouseCoopers) (a registered public accounting firm) (1972-1981). Other Directorships in the Last Five Years. None. | |||
| Helen Frame Peters 1948 |
Class III Trustee |
Until 2024. Trustee |
Professor of Finance, Carroll School of Management, Boston College. Formerly, Dean, Carroll School of Management, Boston College (2000-2002). Formerly, Chief Investment Officer, Fixed Income, Scudder Kemper Investments (investment management firm) (1998-1999). Formerly, Chief Investment Officer, Equity and Fixed Income, Colonial Management Associates (investment management firm) (1991-1998). Other Directorships in the Last Five Years. None. | |||
| Keith Quinton 1958 |
Class II Trustee |
Until 2023. Trustee |
Private investor, researcher and lecturer. Formerly, Independent Investment Committee Member at New Hampshire Retirement System (2017-2021). Formerly, Portfolio Manager and Senior Quantitative Analyst at Fidelity Investments (investment management firm) (2001-2014). Other Directorships in the Last Five Years. Formerly, Director (2016-2021) and Chairman (2019-2021) of New Hampshire Municipal Bond Bank. | |||
| Marcus L. Smith 1966 |
Class III Trustee |
Until 2024. Trustee |
Private investor. Formerly, Portfolio Manager at MFS Investment Management (investment management firm) (1994-2017). Other Directorships in the Last Five Years. Director of First Industrial Realty Trust, Inc. (an industrial REIT) (since 2021). Director of MSCI Inc. (global provider of investment decision support tools) (since 2017). Formerly, Director of DCT Industrial Trust Inc. (logistics real estate company) (2017-2018). | |||
| Susan J. Sutherland 1957 |
Class III Trustee |
Until 2024. Trustee |
Private investor. Director of Ascot Group Limited and certain of its subsidiaries (insurance and reinsurance) (since 2017). Formerly, Director of Hagerty Holding Corp. (insurance) (2015-2018) and Montpelier Re Holdings Ltd. (insurance and reinsurance) (2013-2015). Formerly, Associate, Counsel and Partner at Skadden, Arps, Slate, Meagher & Flom LLP (law firm) (1982-2013). Other Directorships in the Last Five Years. Director of Kairos Acquisition Corp. (insurance/InsurTech acquisition company) (since 2021). | |||
| Scott E. Wennerholm 1959 |
Class I Trustee |
Until 2022. Trustee |
Private investor. Formerly, Trustee at Wheelock College (postsecondary institution) (2012-2018). Formerly, Consultant at GF Parish Group (executive recruiting firm) (2016-2017). Formerly, Chief Operating Officer and Executive Vice President at BNY Mellon Asset Management (investment management firm) (2005-2011). Formerly, Chief Operating Officer and Chief Financial Officer at Natixis Global Asset Management (investment management firm) (1997-2004). Formerly, Vice President at Fidelity Investments Institutional Services (investment management firm) (1994-1997). Other Directorships in the Last Five Years. None. | |||
| Name and Year of Birth | Fund Position(s) |
Officer Since(2) |
Principal Occupation(s) During Past Five Years | |||
| Principal Officers who are not Trustees | ||||||
| Edward J. Perkin 1972 |
President | 2014 | Vice President and Chief Equity Investment Officer of EVM and BMR. Also Vice President of Calvert Research and Management (“CRM”). | |||
| Deidre E. Walsh 1971 |
Vice President and Chief Legal Officer | 2009 | Vice President of EVM and BMR. Also Vice President of CRM. | |||
| 36 |
Eaton Vance
Tax-Advantaged Global Dividend Income Fund
October 31, 2021
Management and Organization — continued
| Name and Year of Birth | Fund Position(s) |
Officer Since(2) |
Principal Occupation(s) During Past Five Years | |||
| Principal Officers who are not Trustees (continued) | ||||||
| James F. Kirchner 1967 |
Treasurer | 2007 | Vice President of EVM and BMR. Also Vice President of CRM. | |||
| Kimberly M. Roessiger 1985 |
Secretary | 2021 | Vice President of EVM and BMR. | |||
| Richard F. Froio 1968 |
Chief Compliance Officer |
2017 | Vice President of EVM and BMR since 2017. Formerly, Deputy Chief Compliance Officer (Adviser/Funds) and Chief Compliance Officer (Distribution) at PIMCO (2012-2017) and Managing Director at BlackRock/Barclays Global Investors (2009-2012). | |||
| (1) | Year first appointed to serve as Trustee for a fund in the Eaton Vance family of funds. Each Trustee has served continuously since appointment unless indicated otherwise. |
| (2) | Year first elected to serve as officer of a fund in the Eaton Vance family of funds when the officer has served continuously. Otherwise, year of most recent election as an officer of a fund in the Eaton Vance family of funds. Titles may have changed since initial election. Each officer serves until his or her successor is elected. |
| 37 |
Eaton Vance Funds
| Privacy Notice | April 2021 |
| FACTS | WHAT DOES EATON VANCE DO WITH YOUR PERSONAL INFORMATION? | |
| Why? | Financial companies choose how they share your personal information. Federal law gives consumers the right to limit some but not all sharing. Federal law also requires us to tell you how we collect, share, and protect your personal information. Please read this notice carefully to understand what we do. | |
| What? | The types of personal information we collect and share depend on the product or service you have with us. This information can include:
∎ Social Security number and income ∎ investment experience and risk tolerance ∎ checking account number and wire transfer instructions | |
| How? | All financial companies need to share customers’ personal information to run their everyday business. In the section below, we list the reasons financial companies can share their customers’ personal information; the reasons Eaton Vance chooses to share; and whether you can limit this sharing. | |
| Reasons we can share your personal information |
Does Eaton Vance share? | Can you limit this sharing? | ||
| For our everyday business purposes — such as to process your transactions, maintain your account(s), respond to court orders and legal investigations, or report to credit bureaus | Yes | No | ||
| For our marketing purposes — to offer our products and services to you | Yes | No | ||
| For joint marketing with other financial companies | No | We don’t share | ||
| For our investment management affiliates’ everyday business purposes — information about your transactions, experiences, and creditworthiness | Yes | Yes | ||
| For our affiliates’ everyday business purposes — information about your transactions and experiences | Yes | No | ||
| For our affiliates’ everyday business purposes — information about your creditworthiness | No | We don’t share | ||
| For our investment management affiliates to market to you | Yes | Yes | ||
| For our affiliates to market to you | No | We don’t share | ||
| For nonaffiliates to market to you | No | We don’t share |
| To limit our sharing | Call toll-free 1-800-262-1122 or email: [email protected]
Please note:
If you are a new customer, we can begin sharing your information 30 days from the date we sent this notice. When you are no longer our customer, we continue to share your information as described in this notice. However, you can contact us at any time to limit our sharing. | |
| Questions? | Call toll-free 1-800-262-1122 or email: [email protected] | |
| 38 |
Eaton Vance Funds
| Privacy Notice — continued | April 2021 |
| Page 2 |
| Who we are | ||
| Who is providing this notice? | Eaton Vance Management, Eaton Vance Distributors, Inc., Eaton Vance Trust Company, Eaton Vance Management (International) Limited, Eaton Vance Advisers International Ltd., Eaton Vance Global Advisors Limited, Eaton Vance Management’s Real Estate Investment Group, Boston Management and Research, Calvert Research and Management, Eaton Vance and Calvert Fund Families and our investment advisory affiliates (“Eaton Vance”) (see Investment Management Affiliates definition below) | |
| What we do | ||
| How does Eaton Vance protect my personal information? | To protect your personal information from unauthorized access and use, we use security measures that comply with federal law. These measures include computer safeguards and secured files and buildings. We have policies governing the proper handling of customer information by personnel and requiring third parties that provide support to adhere to appropriate security standards with respect to such information. | |
| How does Eaton Vance collect my personal information? | We collect your personal information, for example, when you
∎ open an account or make deposits or withdrawals from your account ∎ buy securities from us or make a wire transfer ∎ give us your contact information
We also collect your personal information from others, such as credit bureaus, affiliates, or other companies. | |
| Why can’t I limit all sharing? | Federal law gives you the right to limit only
∎ sharing for affiliates’ everyday business purposes — information about your creditworthiness ∎ affiliates from using your information to market to you ∎ sharing for nonaffiliates to market to you
State laws and individual companies may give you additional rights to limit sharing. See below for more on your rights under state law. | |
| Definitions | ||
| Investment Management Affiliates | Eaton Vance Investment Management Affiliates include registered investment advisers, registered broker-dealers, and registered and unregistered funds. Investment Management Affiliates does not include entities associated with Morgan Stanley Wealth Management, such as Morgan Stanley Smith Barney LLC and Morgan Stanley & Co. | |
| Affiliates | Companies related by common ownership or control. They can be financial and nonfinancial companies.
∎ Our affiliates include companies with a Morgan Stanley name and financial companies such as Morgan Stanley Smith Barney LLC and Morgan Stanley & Co. | |
| Nonaffiliates | Companies not related by common ownership or control. They can be financial and nonfinancial companies.
∎ Eaton Vance does not share with nonaffiliates so they can market to you. | |
| Joint marketing | A formal agreement between nonaffiliated financial companies that together market financial products or services to you.
∎ Eaton Vance doesn’t jointly market. | |
| Other important information | ||
|
Vermont: Except as permitted by law, we will not share personal information we collect about Vermont residents with Nonaffiliates unless you provide us with your written consent to share such information.
California: Except as permitted by law, we will not share personal information we collect about California residents with Nonaffiliates and we will limit sharing such personal information with our Affiliates to comply with California privacy laws that apply to us. | ||
| 39 |
Eaton Vance
Tax-Advantaged Global Dividend Income Fund
October 31, 2021
Potential Conflicts of Interest
As a diversified global financial services firm, Morgan Stanley engages in a broad spectrum of activities, including financial advisory services, investment management activities, lending, commercial banking, sponsoring and managing private investment funds, engaging in broker-dealer transactions and principal securities, commodities and foreign exchange transactions, research publication and other activities. In the ordinary course of its business, Morgan Stanley is a full-service investment banking and financial services firm and therefore engages in activities where Morgan Stanley’s interests or the interests of its clients may conflict with the interests of a Fund or Portfolio, if applicable, (collectively for the purposes of this section, “Fund” or “Funds”). Morgan Stanley advises clients and sponsors, manages or advises other investment funds and investment programs, accounts and businesses (collectively, together with the Morgan Stanley funds, any new or successor funds, programs, accounts or businesses (other than funds, programs, accounts or businesses sponsored, managed, or advised by former direct or indirect subsidiaries of Eaton Vance Corp. (“Eaton Vance Investment Accounts”)), the ‘‘MS Investment Accounts, and, together with the Eaton Vance Investment Accounts, the “Affiliated Investment Accounts’’) with a wide variety of investment objectives that in some instances may overlap or conflict with a Fund’s investment objectives and present conflicts of interest. In addition, Morgan Stanley or the investment adviser may also from time to time create new or successor Affiliated Investment Accounts that may compete with a Fund and present similar conflicts of interest. The discussion below enumerates certain actual, apparent and potential conflicts of interest. There is no assurance that conflicts of interest will be resolved in favor of Fund shareholders and, in fact, they may not be. Conflicts of interest not described below may also exist.
The discussions below with respect to actual, apparent and potential conflicts of interest also may be applicable to or arise from the MS Investment Accounts whether or not specifically identified.
Material Non-public and Other Information. It is expected that confidential or material non-public information regarding an investment or potential investment opportunity may become available to the investment adviser. If such information becomes available, the investment adviser may be precluded (including by applicable law or internal policies or procedures) from pursuing an investment or disposition opportunity with respect to such investment or investment opportunity. The investment adviser may also from time to time be subject to contractual ‘‘stand-still’’ obligations and/or confidentiality obligations that may restrict its ability to trade in certain investments on a Fund’s behalf. In addition, the investment adviser may be precluded from disclosing such information to an investment team, even in circumstances in which the information would be beneficial if disclosed. Therefore, the investment team may not be provided access to material non-public information in the possession of Morgan Stanley that might be relevant to an investment decision to be made on behalf of a Fund, and the investment team may initiate a transaction or sell an investment that, if such information had been known to it, may not have been undertaken. In addition, certain members of the investment team may be recused from certain investment-related discussions so that such members do not receive information that would limit their ability to perform functions of their employment with the investment adviser or its affiliates unrelated to that of a Fund. Furthermore, access to certain parts of Morgan Stanley may be subject to third party confidentiality obligations and to information barriers established by Morgan Stanley in order to manage potential conflicts of interest and regulatory restrictions, including without limitation joint transaction restrictions pursuant to the 1940 Act. Accordingly, the investment adviser’s ability to source investments from other business units within Morgan Stanley may be limited and there can be no assurance that the investment adviser will be able to source any investments from any one or more parts of the Morgan Stanley network.
The investment adviser may restrict its investment decisions and activities on behalf of the Funds in various circumstances, including because of applicable regulatory requirements or information held by the investment adviser or Morgan Stanley. The investment adviser might not engage in transactions or other activities for, or enforce certain rights in favor of, a Fund due to Morgan Stanley’s activities outside the Funds. In instances where trading of an investment is restricted, the investment adviser may not be able to purchase or sell such investment on behalf of a Fund, resulting in the Fund’s inability to participate in certain desirable transactions. This inability to buy or sell an investment could have an adverse effect on a Fund’s portfolio due to, among other things, changes in an investment’s value during the period its trading is restricted. Also, in situations where the investment adviser is required to aggregate its positions with those of other Morgan Stanley business units for position limit calculations, the investment adviser may have to refrain from making investments due to the positions held by other Morgan Stanley business units or their clients. There may be other situations where the investment adviser refrains from making an investment due to additional disclosure obligations, regulatory requirements, policies, and reputational risk, or the investment adviser may limit purchases or sales of securities in respect of which Morgan Stanley is engaged in an underwriting or other distribution capacity.
Morgan Stanley has established certain information barriers and other policies to address the sharing of information between different businesses within Morgan Stanley. As a result of information barriers, the investment adviser generally will not have access, or will have limited access, to certain information and personnel in other areas of Morgan Stanley and generally will not manage the Funds with the benefit of the information held by such other areas. Morgan Stanley, due to its access to and knowledge of funds, markets and securities based on its prime brokerage and other businesses, may make decisions based on information or take (or refrain from taking) actions with respect to interests in investments of the kind held (directly or indirectly) by the Funds in a manner that may be adverse to the Funds, and will not have any obligation or other duty to share information with the investment adviser.
In limited circumstances, however, including for purposes of managing business and reputational risk, and subject to policies and procedures and any applicable regulations, Morgan Stanley personnel, including personnel of the investment adviser, on one side of an information barrier may have access to information and personnel on the other side of the information barrier through “wall crossings.” The investment adviser faces conflicts of interest in determining whether to engage in such wall crossings. Information obtained in connection with such wall crossings may limit or restrict the ability of the investment adviser to engage in or otherwise effect transactions on behalf of the Funds (including purchasing or selling securities that the investment adviser may otherwise have purchased or sold for a Fund in the absence of a wall crossing). In managing conflicts of interest that arise because of the foregoing, the investment adviser generally will be subject to fiduciary requirements. The investment adviser may also implement internal information barriers or ethical walls, and the conflicts described herein with respect to information barriers and otherwise with respect to Morgan Stanley and the investment adviser will also apply internally within the investment adviser. As a result, a Fund may not be permitted to transact in (e.g., dispose of a
| 40 |
Eaton Vance
Tax-Advantaged Global Dividend Income Fund
October 31, 2021
Potential Conflicts of Interest — continued
security in whole or in part) during periods when it otherwise would have been able to do so, which could adversely affect a Fund. Other investors in the security that are not subject to such restrictions may be able to transact in the security during such periods. There may also be circumstances in which, as a result of information held by certain portfolio management teams in the investment adviser, the investment adviser limits an activity or transaction for a Fund, including if the Fund is managed by a portfolio management team other than the team holding such information.
Investments by Morgan Stanley and its Affiliated Investment Accounts. In serving in multiple capacities to Affiliated Investment Accounts, Morgan Stanley, including the investment adviser and its investment teams, may have obligations to other clients or investors in Affiliated Investment Accounts, the fulfillment of which may not be in the best interests of a Fund or its shareholders. A Fund’s investment objectives may overlap with the investment objectives of certain Affiliated Investment Accounts. As a result, the members of an investment team may face conflicts in the allocation of investment opportunities among a Fund and other investment funds, programs, accounts and businesses advised by or affiliated with the investment adviser. Certain Affiliated Investment Accounts may provide for higher management or incentive fees or greater expense reimbursements or overhead allocations, all of which may contribute to this conflict of interest and create an incentive for the investment adviser to favor such other accounts.
Morgan Stanley currently invests and plans to continue to invest on its own behalf and on behalf of its Affiliated Investment Accounts in a wide variety of investment opportunities globally. Morgan Stanley and its Affiliated Investment Accounts, to the extent consistent with applicable law and policies and procedures, will be permitted to invest in investment opportunities without making such opportunities available to a Fund beforehand. Subject to the foregoing, Morgan Stanley may offer investments that fall into the investment objectives of an Affiliated Investment Account to such account or make such investment on its own behalf, even though such investment also falls within a Fund’s investment objectives. A Fund may invest in opportunities that Morgan Stanley and/or one or more Affiliated Investment Accounts has declined, and vice versa. All of the foregoing may reduce the number of investment opportunities available to a Fund and may create conflicts of interest in allocating investment opportunities. Investors should note that the conflicts inherent in making such allocation decisions may not always be resolved to a Fund’s advantage. There can be no assurance that a Fund will have an opportunity to participate in certain opportunities that fall within their investment objectives.
To seek to reduce potential conflicts of interest and to attempt to allocate such investment opportunities in a fair and equitable manner, the investment adviser has implemented allocation policies and procedures. These policies and procedures are intended to give all clients of the investment adviser, including the Funds, fair access to investment opportunities consistent with the requirements of organizational documents, investment strategies, applicable laws and regulations, and the fiduciary duties of the investment adviser. Each client of the investment adviser that is subject to the allocation policies and procedures, including each Fund, is assigned an investment team and portfolio manager(s) by the investment adviser. The investment team and portfolio managers review investment opportunities and will decide with respect to the allocation of each opportunity considering various factors and in accordance with the allocation policies and procedures. The allocation policies and procedures are subject to change. Investors should note that the conflicts inherent in making such allocation decisions may not always be resolved to the advantage of a Fund.
It is possible that Morgan Stanley or an Affiliated Investment Account, including another Eaton Vance fund, will invest in or advise a company that is or becomes a competitor of a company of which a Fund holds an investment. Such investment could create a conflict between the Fund, on the one hand, and Morgan Stanley or the Affiliated Investment Account, on the other hand. In such a situation, Morgan Stanley may also have a conflict in the allocation of its own resources to the portfolio investment. Furthermore, certain Affiliated Investment Accounts will be focused primarily on investing in other funds which may have strategies that overlap and/or directly conflict and compete with a Fund.
In addition, certain investment professionals who are involved in a Fund’s activities remain responsible for the investment activities of other Affiliated Investment Accounts managed by the investment adviser and its affiliates, and they will devote time to the management of such investments and other newly created Affiliated Investment Accounts (whether in the form of funds, separate accounts or other vehicles), as well as their own investments. In addition, in connection with the management of investments for other Affiliated Investment Accounts, members of Morgan Stanley and its affiliates may serve on the boards of directors of or advise companies which may compete with a Fund’s portfolio investments. Moreover, these Affiliated Investment Accounts managed by Morgan Stanley and its affiliates may pursue investment opportunities that may also be suitable for a Fund.
It should be noted that Morgan Stanley may, directly or indirectly, make large investments in certain of its Affiliated Investment Accounts, and accordingly Morgan Stanley’s investment in a Fund may not be a determining factor in the outcome of any of the foregoing conflicts. Nothing herein restricts or in any way limits the activities of Morgan Stanley, including its ability to buy or sell interests in, or provide financing to, equity and/or debt instruments, funds or portfolio companies, for its own accounts or for the accounts of Affiliated Investment Accounts or other investment funds or clients in accordance with applicable law.
Different clients of the investment adviser, including a Fund, may invest in different classes of securities of the same issuer, depending on the respective clients’ investment objectives and policies. As a result, the investment adviser and its affiliates, at times, will seek to satisfy fiduciary obligations to certain clients owning one class of securities of a particular issuer by pursuing or enforcing rights on behalf of those clients with respect to such class of securities, and those activities may have an adverse effect on another client which owns a different class of securities of such issuer. For example, if one client holds debt securities of an issuer and another client holds equity securities of the same issuer, if the issuer experiences financial or operational challenges, the investment adviser and its affiliates may seek a liquidation of the issuer on behalf of the client that holds the debt securities, whereas the client holding the equity securities may benefit from a reorganization of the issuer. Thus, in such situations, the actions taken by the investment adviser or its affiliates on behalf of one client can negatively impact securities held by another client. These conflicts also exist as between the investment adviser’s clients, including the Funds, and the Affiliated Investment Accounts managed by Morgan Stanley.
| 41 |
Eaton Vance
Tax-Advantaged Global Dividend Income Fund
October 31, 2021
Potential Conflicts of Interest — continued
The investment adviser and its affiliates may give advice and recommend securities to other clients which may differ from advice given to, or securities recommended or bought for, a Fund even though such other clients’ investment objectives may be similar to those of the Fund.
The investment adviser and its affiliates manage long and short portfolios. The simultaneous management of long and short portfolios creates conflicts of interest in portfolio management and trading in that opposite directional positions may be taken in client accounts, including client accounts managed by the same investment team, and creates risks such as: (i) the risk that short sale activity could adversely affect the market value of long positions in one or more portfolios (and vice versa) and (ii) the risks associated with the trading desk receiving opposing orders in the same security simultaneously. The investment adviser and its affiliates have adopted policies and procedures that are reasonably designed to mitigate these conflicts. In certain circumstances, the investment adviser invests on behalf of itself in securities and other instruments that would be appropriate for, held by, or may fall within the investment guidelines of its clients, including a Fund. At times, the investment adviser may give advice or take action for its own accounts that differs from, conflicts with, or is adverse to advice given or action taken for any client.
From time to time, conflicts also arise due to the fact that certain securities or instruments may be held in some client accounts, including a Fund, but not in others, or that client accounts may have different levels of holdings in certain securities or instruments. . In addition, due to differences in the investment strategies or restrictions among client accounts, the investment adviser may take action with respect to one account that differs from the action taken with respect to another account. In some cases, a client account may compensate the investment adviser based on the performance of the securities held by that account. The existence of such a performance based fee may create additional conflicts of interest for the investment adviser in the allocation of management time, resources and investment opportunities. The investment adviser has adopted several policies and procedures designed to address these potential conflicts including a code of ethics and policies that govern the investment adviser’s trading practices, including, among other things, the aggregation and allocation of trades among clients, brokerage allocations, cross trades and best execution.
In addition, at times an investment adviser investment team will give advice or take action with respect to the investments of one or more clients that is not given or taken with respect to other clients with similar investment programs, objectives, and strategies. Accordingly, clients with similar strategies will not always hold the same securities or instruments or achieve the same performance. The investment adviser’s investment teams also advise clients with conflicting programs, objectives or strategies. These conflicts also exist as between the investment adviser’s clients, including the Funds, and the Affiliated Investment Accounts managed by Morgan Stanley.
The investment adviser maintains separate trading desks by investment team and generally based on asset class, including two trading desks trading equity securities. These trading desks operate independently of one another. The two equity trading desks do not share information. The separate equity trading desks may result in one desk competing against the other desk when implementing buy and sell transactions, possibly causing certain accounts to pay more or receive less for a security than other accounts. In addition, Morgan Stanley and its affiliates maintain separate trading desks that operate independently of each other and do not share trading information with the investment adviser. These trading desks may compete against the investment adviser trading desks when implementing buy and sell transactions, possibly causing certain Affiliated Investment Accounts to pay more or receive less for a security than other Affiliated Investment Accounts.
Investments by Separate Investment Departments. The entities and individuals that provide investment-related services for the Fund and certain other Eaton Vance Investment Accounts (the “Eaton Vance Investment Department”) may be different from the entities and individuals that provide investment-related services to MS Investment Accounts (the “MS Investment Department and, together with the Eaton Vance Investment Department, the “Investment Departments”). Although Morgan Stanley has implemented information barriers between the Investment Departments in accordance with internal policies and procedures, each Investment Department may engage in discussions and share information and resources with the other Investment Department on certain investment-related matters. The sharing of information and resources between the Investment Departments is designed to further increase the knowledge and effectiveness of each Investment Department. Because each Investment Department generally makes investment decisions and executes trades independently of the other, the quality and price of execution, and the performance of investments and accounts, can be expected to vary. In addition, each Investment Department may use different trading systems and technology and may employ differing investment and trading strategies. As a result, a MS Investment Account could trade in advance of the Fund (and vice versa), might complete trades more quickly and efficiently than the Fund, and/or achieve different execution than the Fund on the same or similar investments made contemporaneously, even when the Investment Departments shared research and viewpoints that led to that investment decision. Any sharing of information or resources between the Investment Department servicing the Fund and the MS Investment Department may result, from time to time, in the Fund simultaneously or contemporaneously seeking to engage in the same or similar transactions as an account serviced by the other Investment Department and for which there are limited buyers or sellers on specific securities, which could result in less favorable execution for the Fund than such account. The Eaton Vance Investment Department will not knowingly or intentionally cause the Fund to engage in a cross trade with an account serviced by the MS Investment Department, however, subject to applicable law and internal policies and procedures, the Fund may conduct cross trades with other accounts serviced by the Eaton Vance Investment Department. Although the Eaton Vance Investment Department may aggregate the Fund’s trades with trades of other accounts serviced by the Eaton Vance Investment Department, subject to applicable law and internal policies and procedures, there will be no aggregation or coordination of trades with accounts serviced by the MS Investment Department, even when both Investment Departments are seeking to acquire or dispose of the same investments contemporaneously.
Payments to Broker-Dealers and Other Financial Intermediaries. The investment adviser and/or EVD may pay compensation, out of their own funds and not as an expense of the Funds, to certain financial intermediaries (which may include affiliates of the investment adviser and EVD), including recordkeepers and administrators of various deferred compensation plans, in connection with the sale, distribution, marketing and retention of shares of the
| 42 |
Eaton Vance
Tax-Advantaged Global Dividend Income Fund
October 31, 2021
Potential Conflicts of Interest — continued
Funds and/or shareholder servicing. For example, the investment adviser or EVD may pay additional compensation to a financial intermediary for, among other things, promoting the sale and distribution of Fund shares, providing access to various programs, mutual fund platforms or preferred or recommended mutual fund lists that may be offered by a financial intermediary, granting EVD access to a financial intermediary’s financial advisors and consultants, providing assistance in the ongoing education and training of a financial intermediary’s financial personnel, furnishing marketing support, maintaining share balances and/or for sub-accounting, recordkeeping, administrative, shareholder or transaction processing services. Such payments are in addition to any distribution fees, shareholder servicing fees and/or transfer agency fees that may be payable by the Funds. The additional payments may be based on various factors, including level of sales (based on gross or net sales or some specified minimum sales or some other similar criteria related to sales of the Funds and/or some or all other Eaton Vance funds), amount of assets invested by the financial intermediary’s customers (which could include current or aged assets of the Funds and/or some or all other Eaton Vance funds), a Fund’s advisory fee, some other agreed upon amount or other measures as determined from time to time by the investment adviser and/or EVD. The amount of these payments may be different for different financial intermediaries.
The prospect of receiving, or the receipt of, additional compensation, as described above, by financial intermediaries may provide such financial intermediaries and their financial advisors and other salespersons with an incentive to favor sales of shares of the Funds over other investment options with respect to which these financial intermediaries do not receive additional compensation (or receive lower levels of additional compensation). These payment arrangements, however, will not change the price that an investor pays for shares of the Funds or the amount that the Funds receive to invest on behalf of an investor. Investors may wish to take such payment arrangements into account when considering and evaluating any recommendations relating to Fund shares and should review carefully any disclosures provided by financial intermediaries as to their compensation. In addition, in certain circumstances, the investment adviser may restrict, limit or reduce the amount of a Fund’s investment, or restrict the type of governance or voting rights it acquires or exercises, where the Fund (potentially together with Morgan Stanley) exceeds a certain ownership interest, or possesses certain degrees of voting or control or has other interests.
Morgan Stanley Trading and Principal Investing Activities. Notwithstanding anything to the contrary herein, Morgan Stanley will generally conduct its sales and trading businesses, publish research and analysis, and render investment advice without regard for a Fund’s holdings, although these activities could have an adverse impact on the value of one or more of the Fund’s investments, or could cause Morgan Stanley to have an interest in one or more portfolio investments that is different from, and potentially adverse to that of a Fund. Furthermore, from time to time, the investment adviser or its affiliates may invest “seed” capital in a Fund, typically to enable the Fund to commence investment operations and/or achieve sufficient scale. The investment adviser and its affiliates may hedge such seed capital exposure by investing in derivatives or other instruments expected to produce offsetting exposure. Such hedging transactions, if any, would occur outside of a Fund.
Morgan Stanley’s sales and trading, financing and principal investing businesses (whether or not specifically identified as such, and including Morgan Stanley’s trading and principal investing businesses) will not be required to offer any investment opportunities to a Fund. These businesses may encompass, among other things, principal trading activities as well as principal investing.
Morgan Stanley’s sales and trading, financing and principal investing businesses have acquired or invested in, and in the future may acquire or invest in, minority and/or majority control positions in equity or debt instruments of diverse public and/or private companies. Such activities may put Morgan Stanley in a position to exercise contractual, voting or creditor rights, or management or other control with respect to securities or loans of portfolio investments or other issuers, and in these instances Morgan Stanley may, in its discretion and subject to applicable law, act to protect its own interests or interests of clients, and not a Fund’s interests.
Subject to the limitations of applicable law, a Fund may purchase from or sell assets to, or make investments in, companies in which Morgan Stanley has or may acquire an interest, including as an owner, creditor or counterparty.
Morgan Stanley’s Investment Banking and Other Commercial Activities. Morgan Stanley advises clients on a variety of mergers, acquisitions, restructuring, bankruptcy and financing transactions. Morgan Stanley may act as an advisor to clients, including other investment funds that may compete with a Fund and with respect to investments that a Fund may hold. Morgan Stanley may give advice and take action with respect to any of its clients or proprietary accounts that may differ from the advice given, or may involve an action of a different timing or nature than the action taken, by a Fund. Morgan Stanley may give advice and provide recommendations to persons competing with a Fund and/or any of a Fund’s investments that are contrary to the Fund’s best interests and/or the best interests of any of its investments.
Morgan Stanley could be engaged in financial advising, whether on the buy-side or sell-side, or in financing or lending assignments that could result in Morgan Stanley’s determining in its discretion or being required to act exclusively on behalf of one or more third parties, which could limit a Fund’s ability to transact with respect to one or more existing or potential investments. Morgan Stanley may have relationships with third-party funds, companies or investors who may have invested in or may look to invest in portfolio companies, and there could be conflicts between a Fund’s best interests, on the one hand, and the interests of a Morgan Stanley client or counterparty, on the other hand.
To the extent that Morgan Stanley advises creditor or debtor companies in the financial restructuring of companies either prior to or after filing for protection under Chapter 11 of the U.S. Bankruptcy Code or similar laws in other jurisdictions, the investment adviser’s flexibility in making investments in such restructurings on a Fund’s behalf may be limited.
| 43 |
Eaton Vance
Tax-Advantaged Global Dividend Income Fund
October 31, 2021
Potential Conflicts of Interest — continued
Morgan Stanley could provide investment banking services to competitors of portfolio companies, as well as to private equity and/or private credit funds; such activities may present Morgan Stanley with a conflict of interest vis-a-vis a Fund’s investment and may also result in a conflict in respect of the allocation of investment banking resources to portfolio companies.
To the extent permitted by applicable law, Morgan Stanley may provide a broad range of financial services to companies in which a Fund invests, including strategic and financial advisory services, interim acquisition financing and other lending and underwriting or placement of securities, and Morgan Stanley generally will be paid fees (that may include warrants or other securities) for such services. Morgan Stanley will not share any of the foregoing interest, fees and other compensation received by it (including, for the avoidance of doubt, amounts received by the investment adviser) with a Fund, and any advisory fees payable will not be reduced thereby.
Morgan Stanley may be engaged to act as a financial advisor to a company in connection with the sale of such company, or subsidiaries or divisions thereof, may represent potential buyers of businesses through its mergers and acquisition activities and may provide lending and other related financing services in connection with such transactions. Morgan Stanley’s compensation for such activities is usually based upon realized consideration and is usually contingent, in substantial part, upon the closing of the transaction. Under these circumstances, a Fund may be precluded from participating in a transaction with or relating to the company being sold or participating in any financing activity related to merger or acquisition.
The involvement or presence of Morgan Stanley in the investment banking and other commercial activities described above (or the financial markets more broadly) may restrict or otherwise limit investment opportunities that may otherwise be available to the Funds. For example, issuers may hire and compensate Morgan Stanley to provide underwriting, financial advisory, placement agency, brokerage services or other services and, because of limitations imposed by applicable law and regulation, a Fund may be prohibited from buying or selling securities issued by those issuers or participating in related transactions or otherwise limited in its ability to engage in such investments.
Morgan Stanley’s Marketing Activities. Morgan Stanley is engaged in the business of underwriting, syndicating, brokering, administering, servicing, arranging and advising on the distribution of a wide variety of securities and other investments in which a Fund may invest. Subject to the restrictions of the 1940 Act, including Sections 10(f) and 17(e) thereof, a Fund may invest in transactions in which Morgan Stanley acts as underwriter, placement agent, syndicator, broker, administrative agent, servicer, advisor, arranger or structuring agent and receives fees or other compensation from the sponsors of such products or securities. Any fees earned by Morgan Stanley in such capacity will not be shared with the investment adviser or the Funds. Certain conflicts of interest, in addition to the receipt of fees or other compensation, would be inherent in these transactions. Moreover, the interests of one of Morgan Stanley’s clients with respect to an issuer of securities in which a Fund has an investment may be adverse to the investment adviser’s or a Fund’s best interests. In conducting the foregoing activities, Morgan Stanley will be acting for its other clients and will have no obligation to act in the investment adviser’s or a Fund’s best interests.
Client Relationships. Morgan Stanley has existing and potential relationships with a significant number of corporations, institutions and individuals. In providing services to its clients, Morgan Stanley may face conflicts of interest with respect to activities recommended to or performed for such clients, on the one hand, and a Fund, its shareholders or the entities in which the Fund invests, on the other hand. In addition, these client relationships may present conflicts of interest in determining whether to offer certain investment opportunities to a Fund.
In acting as principal or in providing advisory and other services to its other clients, Morgan Stanley may engage in or recommend activities with respect to a particular matter that conflict with or are different from activities engaged in or recommended by the investment adviser on a Fund’s behalf.
Principal Investments. To the extent permitted by applicable law, there may be situations in which a Fund’s interests may conflict with the interests of one or more general accounts of Morgan Stanley and its affiliates or accounts managed by Morgan Stanley or its affiliates. This may occur because these accounts hold public and private debt and equity securities of many issuers which may be or become portfolio companies, or from whom portfolio companies may be acquired.
Transactions with Portfolio Companies of Affiliated Investment Accounts. The companies in which a Fund may invest may be counterparties to or participants in agreements, transactions or other arrangements with portfolio companies or other entities of portfolio investments of Affiliated Investment Accounts (for example, a company in which a Fund invests may retain a company in which an Affiliated Investment Account invests to provide services or may acquire an asset from such company or vice versa). Certain of these agreements, transactions and arrangements involve fees, servicing payments, rebates and/or other benefits to Morgan Stanley or its affiliates. For example, portfolio entities may, including at the encouragement of Morgan Stanley, enter into agreements regarding group procurement and/or vendor discounts. Morgan Stanley and its affiliates may also participate in these agreements and may realize better pricing or discounts as a result of the participation of portfolio entities. To the extent permitted by applicable law, certain of these agreements may provide for commissions or similar payments and/or discounts or rebates to be paid to a portfolio entity of an Affiliated Investment Account, and such payments or discounts or rebates may also be made directly to Morgan Stanley or its affiliates. Under these arrangements, a particular portfolio company or other entity may benefit to a greater degree than the other participants, and the funds, investment vehicles and accounts (which may or may not include a Fund) that own an interest in such entity will receive a greater relative benefit from the arrangements than the Eaton Vance funds, investment vehicles or accounts that do not own an interest therein. Fees and compensation received by portfolio companies of Affiliated Investment Accounts in relation to the foregoing will not be shared with a Fund or offset advisory fees payable.
| 44 |
Eaton Vance
Tax-Advantaged Global Dividend Income Fund
October 31, 2021
Potential Conflicts of Interest — continued
Investments in Portfolio Investments of Other Funds. To the extent permitted by applicable law, when a Fund invests in certain companies or other entities, other funds affiliated with the investment adviser may have made or may be making an investment in such companies or other entities. Other funds that have been or may be managed by the investment adviser may invest in the companies or other entities in which a Fund has made an investment. Under such circumstances, a Fund and such other funds may have conflicts of interest (e.g., over the terms, exit strategies and related matters, including the exercise of remedies of their respective investments). If the interests held by a Fund are different from (or take priority over) those held by such other funds, the investment adviser may be required to make a selection at the time of conflicts between the interests held by such other funds and the interests held by a Fund.
Allocation of Expenses. Expenses may be incurred that are attributable to a Fund and one or more other Affiliated Investment Accounts (including in connection with issuers in which a Fund and such other Affiliated Investment Accounts have overlapping investments). The allocation of such expenses among such entities raises potential conflicts of interest. The investment adviser and its affiliates intend to allocate such common expenses among a Fund and any such other Affiliated Investment Accounts on a pro rata basis or in such other manner as the investment adviser deems to be fair and equitable or in such other manner as may be required by applicable law.
Temporary Investments. To more efficiently invest short-term cash balances held by a Fund, the investment adviser may invest such balances on an overnight “sweep” basis in shares of one or more money market funds or other short-term vehicles. It is anticipated that the investment adviser to these money market funds or other short-term vehicles may be the investment adviser (or an affiliate) to the extent permitted by applicable law, including Rule 12d1-1 under the 1940 Act. The Fund may invest in Eaton Vance Cash Reserves Fund, LLC (Cash Reserves Fund), an affiliated investment company managed by Eaton Vance, for this purpose. Eaton Vance does not currently receive a fee for advisory services provided to Cash Reserves Fund.
Transactions with Affiliates. The investment adviser and any investment sub-adviser might purchase securities from underwriters or placement agents in which a Morgan Stanley affiliate is a member of a syndicate or selling group, as a result of which an affiliate might benefit from the purchase through receipt of a fee or otherwise. Neither the investment adviser nor any investment sub-adviser will purchase securities on behalf of a Fund from an affiliate that is acting as a manager of a syndicate or selling group. Purchases by the investment adviser on behalf of a Fund from an affiliate acting as a placement agent must meet the requirements of applicable law. Furthermore, Morgan Stanley may face conflicts of interest when the Funds use service providers affiliated with Morgan Stanley because Morgan Stanley receives greater overall fees when they are used.
General Process for Potential Conflicts. All of the transactions described above involve the potential for conflicts of interest between the investment adviser, related persons of the investment adviser and/or their clients. The Advisers Act, the 1940 Act and ERISA impose certain requirements designed to decrease the possibility of conflicts of interest between an investment adviser and its clients. In some cases, transactions may be permitted subject to fulfillment of certain conditions. Certain other transactions may be prohibited. In addition, the investment adviser has instituted policies and procedures designed to prevent conflicts of interest from arising and, when they do arise, to ensure that it effects transactions for clients in a manner that is consistent with its fiduciary duty to its clients and in accordance with applicable law. The investment adviser seeks to ensure that potential or actual conflicts of interest are appropriately resolved taking into consideration the overriding best interests of the client.
| 45 |
Eaton Vance Funds
Delivery of Shareholder Documents. The Securities and Exchange Commission (SEC) permits funds to deliver only one copy of shareholder documents, including prospectuses, proxy statements and shareholder reports, to fund investors with multiple accounts at the same residential or post office box address. This practice is often called “householding” and it helps eliminate duplicate mailings to shareholders. American Stock Transfer & Trust Company, LLC (“AST”), the closed-end funds transfer agent, or your financial intermediary, may household the mailing of your documents indefinitely unless you instruct AST, or your financial intermediary, otherwise. If you would prefer that your Eaton Vance documents not be householded, please contact AST or your financial intermediary. Your instructions that householding not apply to delivery of your Eaton Vance documents will typically be effective within 30 days of receipt by AST or your financial intermediary.
Portfolio Holdings. Each Eaton Vance Fund and its underlying Portfolio(s) (if applicable) files a schedule of portfolio holdings on Part F to Form N-PORT with the SEC. Certain information filed on Form N-PORT may be viewed on the Eaton Vance website at www.eatonvance.com, by calling Eaton Vance at 1-800-262-1122 or in the EDGAR database on the SEC’s website at www.sec.gov.
Proxy Voting. From time to time, funds are required to vote proxies related to the securities held by the funds. The Eaton Vance Funds or their underlying Portfolios (if applicable) vote proxies according to a set of policies and procedures approved by the Funds’ and Portfolios’ Boards. You may obtain a description of these policies and procedures and information on how the Funds or Portfolios voted proxies relating to portfolio securities during the most recent 12-month period ended June 30, without charge, upon request, by calling 1-800-262-1122 and by accessing the SEC’s website at www.sec.gov.
Share Repurchase Program. The Fund’s Board of Trustees has approved a share repurchase program authorizing the Fund to repurchase up to 10% of its common shares outstanding as of the last day of the prior calendar year in open-market transactions at a discount to net asset value. The repurchase program does not obligate the Fund to purchase a specific amount of shares. The Fund’s repurchase activity, including the number of shares purchased, average price and average discount to net asset value, is disclosed in the Fund’s annual and semi-annual reports to shareholders.
Additional Notice to Shareholders. If applicable, a Fund may also redeem or purchase its outstanding preferred shares in order to maintain compliance with regulatory requirements, borrowing or rating agency requirements or for other purposes as it deems appropriate or necessary.
Closed-End Fund Information. Eaton Vance closed-end funds make fund performance data and certain information about portfolio characteristics available on the Eaton Vance website shortly after the end of each month. Other information about the funds is available on the website. The funds’ net asset value per share is readily accessible on the Eaton Vance website. Portfolio holdings for the most recent month-end are also posted to the website approximately 30 days following the end of the month. This information is available at www.eatonvance.com on the fund information pages under “Individual Investors — Closed-End Funds”.
| 46 |
This Page Intentionally Left Blank
This Page Intentionally Left Blank
Investment Adviser and Administrator
Eaton Vance Management
Two International Place
Boston, MA 02110
Investment Sub-Adviser
Eaton Vance Advisers International Ltd.
125 Old Broad Street
London, EC2N 1AR
United Kingdom
Custodian
State Street Bank and Trust Company
State Street Financial Center, One Lincoln Street
Boston, MA 02111
Transfer Agent
American Stock Transfer & Trust Company, LLC
6201 15th Avenue
Brooklyn, NY 11219
Independent Registered Public Accounting Firm
Deloitte & Touche LLP
200 Berkeley Street
Boston, MA 02116-5022
Fund Offices
Two International Place
Boston, MA 02110

2051 10.31.21
Item 2. Code of Ethics
The registrant (sometimes referred to as the “Fund”) has adopted a code of ethics applicable to its Principal Executive Officer, Principal Financial Officer and Principal Accounting Officer. The registrant undertakes to provide a copy of such code of ethics to any person upon request, without charge, by calling 1-800-262-1122. The registrant has not amended the code of ethics as described in Form N-CSR during the period covered by this report. The registrant has not granted any waiver, including an implicit waiver, from a provision of the code of ethics as described in Form N-CSR during the period covered by this report.
Item 3. Audit Committee Financial Expert
The registrant’s Board of Trustees (the “Board”) has designated George J. Gorman, William H. Park and Scott E. Wennerholm, each an independent trustee, as audit committee financial experts. Mr. Gorman is a certified public accountant who is the Principal at George J. Gorman LLC (a consulting firm). Previously, Mr. Gorman served in various capacities at Ernst & Young LLP (a registered public accounting firm), including as Senior Partner. Mr. Gorman also has experience serving as an independent trustee and audit committee financial
expert of other mutual fund complexes. Mr. Park is a certified public accountant who is a private investor. Previously, he served as a consultant, as the Chief Financial Officer of Aveon Group, L.P. (an investment management firm), as the Vice Chairman of Commercial Industrial Finance Corp. (specialty finance company), as President and Chief Executive Officer of Prizm Capital Management, LLC (investment management firm), as Executive Vice President and Chief Financial Officer of United Asset Management Corporation (an institutional investment management firm) and as a Senior Manager at Price Waterhouse (now PricewaterhouseCoopers) (a registered public accounting firm). Mr. Wennerholm is a private investor. Previously, Mr. Wennerholm served as a Trustee at Wheelock College (postsecondary institution), as a Consultant at GF Parish Group (executive recruiting firm), Chief Operating Officer and Executive Vice President at BNY Mellon Asset Management (investment management firm), Chief Operating Officer and Chief Financial Officer at Natixis Global Asset Management (investment management firm), and Vice President at Fidelity Investments Institutional Services (investment management firm).
Item 4. Principal Accountant Fees and Services
(a) –(d)
The following table presents the aggregate fees billed to the registrant for the registrant’s fiscal years ended October 31, 2020 and October 31, 2021 by the registrant’s principal accountant, Deloitte & Touche LLP (“D&T”), for professional services rendered for the audit of the registrant’s annual financial statements and fees billed for other services rendered by D&T during such periods.
| Fiscal Years Ended |
10/31/20 | 10/31/21 | ||||||
| Audit Fees |
$ | 56,250 | $ | 57,950 | ||||
| Audit-Related Fees(1) |
$ | 0 | $ | 0 | ||||
| Tax Fees(2) |
$ | 10,812 | $ | 11,162 | ||||
| All Other Fees(3) |
$ | 0 | $ | 0 | ||||
|
|
|
|
|
|||||
| Total |
$ | 67,062 | $ | 69,112 | ||||
|
|
|
|
|
|||||
| (1) | Audit-related fees consist of the aggregate fees billed for assurance and related services that are reasonably related to the performance of the audit of the registrant’s financial statements and are not reported under the category of audit fees. |
| (2) | Tax fees consist of the aggregate fees billed for professional services rendered by the principal accountant relating to tax compliance, tax advice, and tax planning and specifically include fees for tax return preparation and other related tax compliance/planning matters. |
| (3) | All other fees consist of the aggregate fees billed for products and services provided by the registrant’s principal accountant other than audit, audit-related, and tax services. |
(e)(1) The registrant’s audit committee has adopted policies and procedures relating to the pre-approval of services provided by the registrant’s principal accountant (the “Pre-Approval Policies”). The Pre-Approval Policies establish a framework intended to assist the audit committee in the proper discharge of its pre-approval responsibilities. As a general matter, the Pre-Approval Policies (i) specify certain types of audit, audit-related, tax, and other services determined to be pre-approved by the audit committee; and (ii) delineate specific procedures governing the mechanics of the pre-approval process, including the approval and monitoring of audit and non-audit service fees. Unless a service is specifically pre-approved under the Pre-Approval Policies, it must be separately pre-approved by the audit committee.
The Pre-Approval Policies and the types of audit and non-audit services pre-approved therein must be reviewed and ratified by the registrant’s audit committee at least annually. The registrant’s audit committee maintains full responsibility for the appointment, compensation, and oversight of the work of the registrant’s principal accountant.
(e)(2) No services described in paragraphs (b)-(d) above were approved by the registrant’s audit committee pursuant to the “de minimis exception” set forth in Rule 2-01 (c)(7)(i)(C) of Regulation S-X.
(f) Not applicable.
(g) The following table presents (i) the aggregate non-audit fees (i.e., fees for audit-related, tax, and other services) billed to the registrant by D&T for the registrant’s fiscal years ended October 31, 2020 and October 31, 2021; and (ii) the aggregate non-audit fees (i.e., fees for audit-related, tax, and other services) billed to the Eaton Vance organization by D&T for the same time periods.
| Fiscal Years Ended |
10/31/20 | 10/31/21 | ||||||
| Registrant |
$ | 10,812 | $ | 11,162 | ||||
| Eaton Vance(1) |
$ | 51,800 | $ | 51,800 | ||||
| (1) | The investment adviser to the registrant, as well as any of its affiliates that provide ongoing services to the registrant, are subsidiaries of Morgan Stanley. |
(h) The registrant’s audit committee has considered whether the provision by the registrant’s principal accountant of non-audit services to the registrant’s investment adviser and any entity controlling, controlled by, or under common control with the adviser that provides ongoing services to the registrant that were not pre-approved pursuant to Rule 2-01(c)(7)(ii) of Regulation S-X is compatible with maintaining the principal accountant’s independence.
Item 5. Audit Committee of Listed Registrants
The registrant has a separately-designated standing audit committee established in accordance with Section 3(a)(58)(A) of the Securities and Exchange Act of 1934, as amended. George J. Gorman, William H. Park, Helen Frame Peters and Scott E. Wennerholm (Chair) are the members of the registrant’s audit committee.
Item 6. Schedule of Investments
Please see schedule of investments contained in the Report to Stockholders included under Item 1 of this Form N-CSR.
Item 7. Disclosure of Proxy Voting Policies and Procedures for Closed-End Management Investment Companies
The Board of the Fund has adopted a proxy voting policy and procedure (the “Fund Policy”), pursuant to which the trustees have delegated proxy voting responsibility to the Fund’s investment adviser and adopted the investment adviser’s proxy voting policies and procedures (the “Policies”) which are described below. The trustees will review the Policies annually. In the event that a conflict of interest arises between the Fund’s shareholders and the investment adviser, the administrator, or any of their affiliates or any affiliate of the Fund, the investment adviser will generally refrain from voting the proxies related to the companies giving rise to such conflict until it consults with the Board, or any committee, sub-committee or group of independent trustees identified by the Board, which will instruct the investment adviser on the appropriate course of action. If the Board Members are unable to meet and the failure to vote a proxy would have a material adverse impact on the Fund, the investment adviser may vote such proxy, provided that it discloses the existence of the material conflict to the Chairperson of the Fund’s Board as soon as practicable and to the Board at its next meeting.
The Policies are designed to promote accountability of a company’s management to its shareholders and to align the interests of management with those shareholders. An independent proxy voting service (“Agent”), currently Institutional Shareholder Services, Inc., has been retained to assist in the voting of proxies through the provision of vote analysis, implementation and recordkeeping and disclosure services. The investment adviser will generally vote proxies through the Agent. The Agent is required to vote all proxies in accordance with customized proxy voting guidelines (the “Guidelines”) and/or refer them back to the investment adviser pursuant to the Policies.
The Agent is required to establish and maintain adequate internal controls and policies in connection with the provision of proxy voting services, including methods to reasonably ensure that its analysis and recommendations are not influenced by a conflict of interest. The Guidelines include voting guidelines for matters relating to, among other things, the election of directors, approval of independent auditors, executive compensation, corporate structure and anti-takeover defenses. The investment adviser may cause the Fund to abstain from voting from time to time where it determines that the costs associated with voting a proxy outweigh the benefits derived from exercising the right to vote or it is unable to access or access timely ballots or other proxy information, among other stated reasons. The Agent will refer Fund proxies to the investment adviser for instructions under circumstances where, among others: (1) the application of the Guidelines is unclear; (2) a particular proxy question is not covered by the Guidelines; or (3) the Guidelines require input from the investment adviser. When a proxy voting issue has been referred to the investment adviser, the analyst (or portfolio manager if applicable) covering the company subject to the proxy proposal determines the final vote (or decision not to vote) and the investment adviser’s Proxy Administrator (described below) instructs the Agent to vote accordingly for securities held by the Fund. Where more than one analyst covers a particular company and the recommendations of such analysts voting a proposal conflict, the investment adviser’s Global Proxy Group (described below) will review such recommendations and any other available information related to the proposal and determine the manner in which it should be voted, which may result in different recommendations for the Fund that may differ from other clients of the investment adviser.
The investment adviser has appointed a Proxy Administrator to assist in the coordination of the voting of client proxies (including the Fund’s) in accordance with the Guidelines and the Policies. The investment adviser and its affiliates have also established a Global Proxy Group. The Global Proxy Group develops the investment adviser’s positions on all major corporate issues, creates the Guidelines and oversees the proxy voting process. The Proxy Administrator maintains a record of all proxy questions that have been referred by the Agent, all applicable recommendations, analysis and research received and any resolution of the matter. Before instructing the Agent to vote contrary to the Guidelines or the recommendation of the Agent, the Proxy Administrator will provide the Global Proxy Group with the Agent’s recommendation for the proposal along with any other relevant materials, including the basis for the analyst’s recommendation. The Proxy Administrator will then instruct the Agent to vote the proxy in the manner determined by the Global Proxy Group. A similar process will be followed if the Agent has a conflict of interest with respect to a proxy. The investment adviser will report to the Fund’s Board any votes cast contrary to the Guidelines or Agent recommendations, as applicable, no less than annually.
The investment adviser’s Global Proxy Group is responsible for monitoring and resolving possible material conflicts with respect to proxy voting. Because the Guidelines are predetermined and designed to be in the best interests of shareholders, application of the Guidelines to vote client proxies should, in most cases, adequately address any possible conflict of interest. The investment adviser will monitor situations that may result in a conflict of interest between any of its clients and the investment adviser or any of its affiliates by maintaining a list of significant existing and prospective corporate clients. The Proxy Administrator will compare such list with the names of companies of which he or she has been referred a proxy statement (the “Proxy Companies”). If a company on the list is also a Proxy Company, the Proxy Administrator will report that fact to the Global
Proxy Group. If the Proxy Administrator intends to instruct the Agent to vote in a manner inconsistent with the Guidelines, the Global Proxy Group will first determine, in consultation with legal counsel if necessary, whether a material conflict exists. If it is determined that a material conflict exists, the investment adviser will seek instruction on how the proxy should be voted from the Fund’s Board, or any committee or subcommittee identified by the Board. If a matter is referred to the Global Proxy Group, the decision made and basis for the decision will be documented by the Proxy Administrator and/or Global Proxy Group.
Information on how the Fund voted proxies relating to portfolio securities during the most recent 12 month period ended June 30 is available (1) without charge, upon request, by calling 1-800-262-1122, and (2) on the Securities and Exchange Commission’s website at http://www.sec.gov.
| Item 8. Portfolio | Managers of Closed-End Management Investment Companies |
Eaton Vance Management (“EVM” or “Eaton Vance”) is the investment adviser of the Fund and Eaton Vance Advisers International Ltd. (“EVAIL”) is the sub-adviser of the Fund. John H. Croft, Derek J.V. DiGregorio and Christopher M. Dyer comprise the investment team responsible for the overall and day-to-day management of the Fund’s investments.
Mr. Croft is a Vice President of EVM, has been a portfolio manager of the Fund since March 2010 and has managed other Eaton Vance portfolios for more than five years. Mr. DiGregorio is a Vice President of EVM, has been a portfolio manager of the Fund since July 2021 and has been employed by EVM for more than five years. Mr. Dyer is a Vice President and Director of EVAIL, is the Director of Global Equity for the Eaton Vance organization and has been a portfolio manager of the Fund since September 2015. Prior to joining EVAIL in November 2017, Mr. Dyer was a Vice President of Eaton Vance Management (International) Limited (“EVMI”). Prior to joining EVMI in June 2015, Mr. Dyer was Head of European Equity for Goldman Sachs Asset Management in London, where he also served in various portfolio management roles during his fourteen-year tenure (2001-2015). This information is provided as of the date of filing this report.
The following table shows, as of the Fund’s most recent fiscal year end, the number of accounts each portfolio manager managed in each of the listed categories and the total assets (in millions of dollars) in the accounts managed within each category. The table also shows the number of accounts with respect to which the advisory fee is based on the performance of the account, if any, and the total assets (in millions of dollars) in those accounts.
| Number of All Accounts |
Total Assets of All Accounts |
Number of Accounts Paying a Performance Fee |
Total Assets of Accounts Paying a Performance Fee |
|||||||||||||
| John H. Croft(1) |
||||||||||||||||
| Registered Investment Companies |
9 | $ | 8,665.0 | 0 | $ | 0 | ||||||||||
| Other Pooled Investment Vehicles |
0 | $ | 0 | 0 | $ | 0 | ||||||||||
| Other Accounts |
0 | $ | 0 | 0 | $ | 0 | ||||||||||
| Derek J.V. DiGregorio(1) |
||||||||||||||||
| Registered Investment Companies |
9 | $ | 7,199.2 | 0 | $ | 0 | ||||||||||
| Other Pooled Investment Vehicles |
0 | $ | 0 | 0 | $ | 0 | ||||||||||
| Other Accounts |
0 | $ | 0 | 0 | $ | 0 | ||||||||||
| Christopher M. Dyer(1) |
||||||||||||||||
| Registered Investment Companies |
9 | $ | 8,430.7 | 0 | $ | 0 | ||||||||||
| Other Pooled Investment Vehicles |
0 | $ | 0 | 0 | $ | 0 | ||||||||||
| Other Accounts |
1 | $ | 4.5 | 0 | $ | 0 | ||||||||||
(1) This portfolio manager serves as portfolio manager of one or more registered investment companies that invests or may invest in one or more underlying registered investment companies in the Eaton Vance family of funds or other pooled investment vehicles sponsored by Eaton Vance. The underlying investment companies may be managed by this portfolio manager or another portfolio manager.
The following table shows the dollar range of Fund shares beneficially owned by each portfolio manager as of the Fund’s most recent fiscal year end.
| Portfolio Manager |
Dollar Range of Equity Securities Beneficially Owned in the Fund | |
| John H. Croft |
None | |
| Derek J.V. DiGregorio |
None | |
| Christopher M. Dyer |
None |
Potential for Conflicts of Interest. It is possible that conflicts of interest may arise in connection with a portfolio manager’s management of the Fund’s investments on the one hand and the investments of other accounts for which a portfolio manager is responsible on the other. For example, a portfolio manager may have conflicts of interest in allocating management time, resources and investment opportunities among the Fund and other accounts he advises. In addition, due to differences in the investment strategies or restrictions between the Fund and the other accounts, the portfolio manager may take action with respect to another account that differs from the action taken with respect to the Fund. In some cases, another account managed by a portfolio manager may compensate EVM or EVAIL based on the performance of the securities held by that account. The existence of such a performance based fee may create additional conflicts of interest for the portfolio manager in the allocation of management time, resources and investment opportunities. Whenever conflicts of interest arise, the portfolio manager will endeavor to exercise his discretion in a manner that he believes is equitable to all interested persons. EVM and EVAIL have adopted several policies and procedures designed to address these potential conflicts including a code of ethics and policies that govern EVM’s and EVAIL’s trading practices, including among other things the aggregation and allocation of trades among clients, brokerage allocations, cross trades and best execution.
Compensation Structure for EVM and EVAIL
Compensation of EVM’s and EVAIL’s portfolio managers and other investment professionals has the following primary components: (1) a base salary and (2) discretionary variable compensation that is comprised of cash bonus and depending on eligibility, may also include deferred compensation consisting of restricted shares of Morgan Stanley stock and deferred cash that are subject to a fixed vesting and distribution schedule. EVM’s and EVAIL’s investment professionals also receive certain retirement, insurance and other benefits that are broadly available to EVM’s and EVAIL’s employees. Compensation of EVM’s and EVAIL’s investment professionals is reviewed primarily on an annual basis. Cash bonuses and deferred compensation awards, and adjustments in base salary are typically paid or put into effect shortly after the December 31st fiscal year end of Morgan Stanley.
Method to Determine Compensation. EVM and EVAIL compensate its portfolio managers based on company and team business results, and individual performance, including the scale and complexity of their portfolio responsibilities and the total return performance of managed funds and accounts versus the benchmark(s) stated in the prospectus, as well as an appropriate peer group (as described below). In addition to rankings within peer groups of funds on the basis of absolute performance, consideration may also be given to relative risk-adjusted performance. Risk-adjusted performance measures include, but are not limited to the Sharpe ratio, which uses standard deviation and excess return to determine reward per unit of risk. Fund performance is normally evaluated primarily versus peer groups of funds as determined by Lipper Inc. and/or Morningstar, Inc. When a
fund’s peer group as determined by Lipper or Morningstar is deemed by EVM’s and EVAIL’s management not to provide a fair comparison, performance may instead be evaluated primarily against a custom peer group or market index. In evaluating the performance of a fund and its manager, primary emphasis is normally placed on three-year performance, with secondary consideration of performance over longer and shorter periods. For funds that are tax-managed or otherwise have an objective of after-tax returns, performance is measured net of taxes. For other funds, performance is evaluated on a pre-tax basis. For funds with an investment objective other than total return (such as current income), consideration will also be given to the fund’s success in achieving its objective. For managers responsible for multiple funds and accounts, investment performance is evaluated on an aggregate basis, based on averages or weighted averages among managed funds and accounts. Funds and accounts that have performance-based advisory fees are not accorded disproportionate weightings in measuring aggregate portfolio manager performance.
The compensation of portfolio managers with other job responsibilities (such as heading an investment group or providing analytical support to other portfolios) will include consideration of the scope of such responsibilities and the managers’ performance in meeting them.
EVM and EVAIL seek to compensate portfolio managers commensurate with their responsibilities and performance, and competitive with other firms within the investment management industry. EVM and EVAIL participate in investment-industry compensation surveys and utilizes survey data as a factor in determining salary and variable compensation levels for portfolio managers and other investment professionals. Salaries and variable compensation are also influenced by the operating performance of EVM and EVAIL and Morgan Stanley. While the salaries of EVM’s and EVAIL’s portfolio managers are comparatively fixed, variable compensation may fluctuate significantly from year to year, based on changes in company and team performance, manager performance and other factors as described herein. For a high performing portfolio manager, variable compensation may represent a substantial portion of total compensation.
Item 9. Purchases of Equity Securities by Closed-End Management Investment Company and Affiliated Purchasers
No such purchases this period.
Item 10. Submission of Matters to a Vote of Security Holders
No material changes.
Item 11. Controls and Procedures
(a) It is the conclusion of the registrant’s principal executive officer and principal financial officer that the effectiveness of the registrant’s current disclosure controls and procedures (such disclosure controls and procedures having been evaluated within 90 days of the date of this filing) provide reasonable assurance that the information required to be disclosed by the registrant has been recorded, processed, summarized and reported within the time period specified in the Commission’s rules and forms and that the information required to be disclosed by the registrant has been accumulated and communicated to the registrant’s principal executive officer and principal financial officer in order to allow timely decisions regarding required disclosure.
(b) There have been no changes in the registrant’s internal controls over financial reporting during the period covered by this report that has materially affected, or is reasonably likely to materially affect, the registrant’s internal control over financial reporting.
Item 12. Disclosure of Securities Lending Activities for Closed-End Management Investment Companies
The registrant did not accrue any income or fees/compensation related to its securities lending activities during its most recent fiscal year. See Liquidity Agreement note in the financial statements for further information.
Item 13. Exhibits
| (a)(1) |
Registrant’s Code of Ethics – Not applicable (please see Item 2). | |
| (a)(2)(i) |
Treasurer’s Section 302 certification. | |
| (a)(2)(ii) |
President’s Section 302 certification. | |
| (b) |
Combined Section 906 certification. | |
| (c) |
Registrant’s notices to shareholders pursuant to Registrant’s exemptive order granting an exemption from Section 19(b) of the 1940 Act and Rule 19b-1 thereunder regarding distributions paid pursuant to the Registrant’s Managed Distribution Plan. | |
Signatures
Pursuant to the requirements of the Securities Exchange Act of 1934 and the Investment Company Act of 1940, the registrant has duly caused this report to be signed on its behalf by the undersigned, thereunto duly authorized.
Eaton Vance Tax-Advantaged Global Dividend Income Fund
| By: | /s/ Edward J. Perkin | |
| Edward J. Perkin | ||
| President | ||
| Date: | December 17, 2021 | |
Pursuant to the requirements of the Securities Exchange Act of 1934 and the Investment Company Act of 1940, this report has been signed below by the following persons on behalf of the registrant and in the capacities and on the dates indicated.
| By: | /s/ James F. Kirchner | |
| James F. Kirchner | ||
| Treasurer | ||
| Date: | December 17, 2021 | |
| By: | /s/ Edward J. Perkin | |
| Edward J. Perkin | ||
| President | ||
| Date: | December 17, 2021 | |
Eaton Vance Tax-Advantaged Global Dividend Income Fund
FORM N-CSR
Exhibit 13(a)(2)(i)
CERTIFICATION
I, James F. Kirchner, certify that:
1. I have reviewed this report on Form N-CSR of Eaton Vance Tax-Advantaged Global Dividend Income Fund;
2. Based on my knowledge, this report does not contain any untrue statement of a material fact or omit to state a material fact necessary to make the statements made, in light of the circumstances under which such statements were made, not misleading with respect to the period covered by this report;
3. Based on my knowledge, the financial statements, and other financial information included in this report, fairly present in all material respects the financial condition, results of operations, changes in net assets, and cash flows (if the financial statements are required to include a statement of cash flows) of the registrant as of, and for, the periods presented in this report;
4. The registrant’s other certifying officer(s) and I are responsible for establishing and maintaining disclosure controls and procedures (as defined in Rule 30a-3(c) under the Investment Company Act of 1940) and internal control over financial reporting (as defined in Rule 30a-3(d) under the Investment Company Act of 1940) for the registrant and have:
(a) Designed such disclosure controls and procedures, or caused such disclosure controls and procedures to be designed under our supervision, to ensure that material information relating to the registrant, including its consolidated subsidiaries, is made known to us by others within those entities, particularly during the period in which this report is being prepared;
(b) Designed such internal control over financial reporting, or caused such internal control over financial reporting to be designed under our supervision, to provide reasonable assurance regarding the reliability of financial reporting and the preparation of financial statements for external purposes in accordance with generally accepted accounting principles;
(c) Evaluated the effectiveness of the registrant’s disclosure controls and procedures and presented in this report our conclusions about the effectiveness of the disclosure controls and procedures, as of a date within 90 days prior to the filing date of this report based on such evaluation; and
(d) Disclosed in this report any change in the registrant’s internal control over financial reporting that occurred during the period covered by this report that has materially affected, or is reasonably likely to materially affect, the registrant’s internal control over financial reporting; and
5. The registrant’s other certifying officer(s) and I have disclosed to the registrant’s auditors and the audit committee of the registrant’s board of directors (or persons performing the equivalent functions):
(a) All significant deficiencies and material weaknesses in the design or operation of internal control over financial reporting which are reasonably likely to adversely affect the registrant’s ability to record, process, summarize, and report financial information; and
(b) Any fraud, whether or not material, that involves management or other employees who have a significant role in the registrant’s internal control over financial reporting.
| Date: | December 17, 2021 | /s/ James F. Kirchner | ||||
| James F. Kirchner | ||||||
| Treasurer |
Eaton Vance Tax-Advantaged Global Dividend Income Fund
FORM N-CSR
Exhibit 13(a)(2)(ii)
CERTIFICATION
I, Edward J. Perkin, certify that:
1. I have reviewed this report on Form N-CSR of Eaton Vance Tax-Advantaged Global Dividend Income Fund;
2. Based on my knowledge, this report does not contain any untrue statement of a material fact or omit to state a material fact necessary to make the statements made, in light of the circumstances under which such statements were made, not misleading with respect to the period covered by this report;
3. Based on my knowledge, the financial statements, and other financial information included in this report, fairly present in all material respects the financial condition, results of operations, changes in net assets, and cash flows (if the financial statements are required to include a statement of cash flows) of the registrant as of, and for, the periods presented in this report;
4. The registrant’s other certifying officer(s) and I are responsible for establishing and maintaining disclosure controls and procedures (as defined in Rule 30a-3(c) under the Investment Company Act of 1940) and internal control over financial reporting (as defined in Rule 30a-3(d) under the Investment Company Act of 1940) for the registrant and have:
(a) Designed such disclosure controls and procedures, or caused such disclosure controls and procedures to be designed under our supervision, to ensure that material information relating to the registrant, including its consolidated subsidiaries, is made known to us by others within those entities, particularly during the period in which this report is being prepared;
(b) Designed such internal control over financial reporting, or caused such internal control over financial reporting to be designed under our supervision, to provide reasonable assurance regarding the reliability of financial reporting and the preparation of financial statements for external purposes in accordance with generally accepted accounting principles;
(c) Evaluated the effectiveness of the registrant’s disclosure controls and procedures and presented in this report our conclusions about the effectiveness of the disclosure controls and procedures, as of a date within 90 days prior to the filing date of this report based on such evaluation; and
(d) Disclosed in this report any change in the registrant’s internal control over financial reporting that occurred during the period covered by this report that has materially affected, or is reasonably likely to materially affect, the registrant’s internal control over financial reporting; and
5. The registrant’s other certifying officer(s) and I have disclosed to the registrant’s auditors and the audit committee of the registrant’s board of directors (or persons performing the equivalent functions):
(a) All significant deficiencies and material weaknesses in the design or operation of internal control over financial reporting which are reasonably likely to adversely affect the registrant’s ability to record, process, summarize, and report financial information; and
(b) Any fraud, whether or not material, that involves management or other employees who have a significant role in the registrant’s internal control over financial reporting.
| Date: | December 17, 2021 | /s/ Edward J. Perkin | ||||
| Edward J. Perkin | ||||||
| President |
Form N-CSR Item 13(b) Exhibit
CERTIFICATION PURSUANT TO
18 U.S.C. SECTION 1350,
AS ADOPTED PURSUANT TO
SECTION 906 OF THE SARBANES-OXLEY ACT OF 2002
The undersigned hereby certify in their capacity as Treasurer and President, respectively, of Eaton Vance Tax-Advantaged Global Dividend Income Fund (the “Fund”), that:
| (a) | The Annual Report of the Fund on Form N-CSR for the period ended October 31, 2021 (the “Report”) fully complies with the requirements of Section 13(a) or 15(d) of the Securities Exchange Act of 1934, as amended; and |
| (b) | The information contained in the Report fairly presents, in all material respects, the financial condition and the results of operations of the Fund for such period. |
A signed original of this written statement required by section 906 has been provided to the Fund and will be retained by the Fund and furnished to the Securities and Exchange Commission or its staff upon request.
Eaton Vance Tax-Advantaged Global Dividend Income Fund
| Date: December 17, 2021 |
| /s/ James F. Kirchner |
| James F. Kirchner |
| Treasurer |
| Date: December 17, 2021 |
| /s/ Edward J. Perkin |
| Edward J. Perkin |
| President |
Form N-CSR Item 13(c) Exhibit

Dear Eaton Vance Fund Shareholder:
This notice provides shareholders of the Eaton Vance Tax-Advantaged Global Dividend Income Fund (NYSE: ETG) with important information concerning the distribution declared in May 2021. You are receiving this notice as a requirement of the Fund’s managed distribution plan (Plan). The Board of Trustees approved the implementation of the Plan to make monthly cash distributions to common shareholders, stated in terms of a fixed amount per common share. This information is sent to you for informational purposes only and is an estimate of the sources of the May distribution. It is not determinative of the tax character of the Fund’s distributions for the 2021 calendar year.
The amounts and sources of distributions reported in this notice are estimates, are not being provided for tax reporting purposes and the distribution may later be determined to be from other sources including realized short-term gains, long-term gains, to the extent permitted by law, and return of capital. The actual amounts and sources for tax reporting purposes will depend upon the Fund’s investment experience during the remainder of its fiscal year and may be subject to changes based on tax regulations. The Fund will send you a Form 1099-DIV for the calendar year that will tell you how to report these distributions for federal income tax purposes.
Distribution Period: May 2021
Distribution Amount per Common Share: $0.1025
The following table sets forth an estimate of the sources of the Fund’s May distribution and its cumulative distributions paid this fiscal year to date. Amounts are expressed on a per common share basis and as a percentage of the distribution amount.
| Eaton Vance Tax-Advantaged Global Dividend Income Fund | ||||||||||||||||
| Source |
Current Distribution |
% of Current Distribution |
Cumulative Distributions for the Fiscal Year-to-Date1 |
% of the Cumulative Distributions for the Fiscal Year-to-Date1 |
||||||||||||
| Net Investment Income |
$ | 0.0916 | 89.4 | % | $ | 0.3286 | 45.8 | % | ||||||||
| Net Realized Short-Term Capital Gains |
$ | 0.0000 | 0.0 | % | $ | 0.0000 | 0.0 | % | ||||||||
| Net Realized Long-Term Capital Gains |
$ | 0.0109 | 10.6 | % | $ | 0.3243 | 45.2 | % | ||||||||
| Return of Capital or Other Capital Source(s) |
$ | 0.0000 | 0.0 | % | $ | 0.0646 | 9.0 | % | ||||||||
| Total per common share |
$ | 0.1025 | 100.0 | % | $ | 0.7175 | 100.0 | % | ||||||||
| 1 | The Fund’s fiscal year is November 1, 2020 to October 31, 2021 |
IMPORTANT DISCLOSURE: You should not draw any conclusions about the Fund’s investment performance from the amount of this distribution or from the terms of the Fund’s Plan. The Fund estimates that it has distributed more than its income and net realized capital gains; therefore, a portion of your distribution may be a return of capital. A return of capital may occur for example, when some or all of the money that you invested in the Fund is paid back to you. A return of capital distribution does not necessarily reflect the Fund’s investment performance and should not be confused with ‘yield’ or ‘income.’ The amounts and sources of distributions reported in this Notice are only estimates and are not being provided for tax reporting purposes. The actual amounts and sources of the amounts for accounting and/or tax reporting purposes will depend upon the Fund’s investment experience during the remainder of its fiscal year and may be subject to changes based on tax regulations. The Fund will send you a Form 1099-DIV for the calendar year that will tell you how to report these distributions for federal income tax purposes.
Set forth in the table below is information relating to the Fund’s performance based on its net asset value (NAV) for certain periods.
| Average annual total return at NAV for the 5-year period ended on April 30, 20211 |
13.82 | % | ||
| Annualized current distribution rate expressed as a percentage of NAV as of April 30, 20212 |
5.72 | % | ||
| Cumulative total return at NAV for the fiscal year through April 30, 20213 |
37.52 | % | ||
| Cumulative fiscal year to date distribution rate as a percentage of NAV as of April 30, 20214 |
2.86 | % | ||
| 1 | Average annual total return at NAV represents the change in NAV of the Fund, with all distributions reinvested, for the 5-year period ended on April 30, 2021. |
| 2 | The annualized current distribution rate is the cumulative distribution rate annualized as a percentage of the Fund’s NAV as of April 30, 2021. |
| 3 | Cumulative total return at NAV is the percentage change in the Fund’s NAV for the period from the beginning of its fiscal year to April 30, 2021 including distributions paid and assuming reinvestment of those distributions. |
| 4 | Cumulative fiscal year distribution rate for the period from the beginning of its fiscal year to April 30, 2021 measured on the dollar value of distributions in the year-to-date period as a percentage of the Fund’s NAV as of April 30, 2021. |
If you have any questions regarding this information, please contact your investment advisor or an Eaton Vance Investor Services associate at 1-866-328-6681. Our associates are available to assist you Monday-Friday 8:30 a.m. to 5:30 p.m., Eastern Time.
NOTE: This correspondence is for informational purposes only and should not be relied upon to project the tax character of actual Fund distributions for the 2021 calendar year.
NO ACTION IS REQUIRED ON YOUR PART.
Eaton Vance Tax-Advantaged Global Dividend Income Fund
May 28, 2021
Dear Eaton Vance Fund Shareholder:
This notice provides shareholders of the Eaton Vance Tax-Advantaged Global Dividend Income Fund (NYSE: ETG) with important information concerning the distribution declared in June 2021. You are receiving this notice as a requirement of the Fund’s managed distribution plan (Plan). The Board of Trustees approved the implementation of the Plan to make monthly cash distributions to common shareholders, stated in terms of a fixed amount per common share. This information is sent to you for informational purposes only and is an estimate of the sources of the June distribution. It is not determinative of the tax character of the Fund’s distributions for the 2021 calendar year.
The amounts and sources of distributions reported in this notice are estimates, are not being provided for tax reporting purposes and the distribution may later be determined to be from other sources including realized short-term gains, long-term gains, to the extent permitted by law, and return of capital. The actual amounts and sources for tax reporting purposes will depend upon the Fund’s investment experience during the remainder of its fiscal year and may be subject to changes based on tax regulations. The Fund will send you a Form 1099-DIV for the calendar year that will tell you how to report these distributions for federal income tax purposes.
Distribution Period: June 2021
Distribution Amount per Common Share: $0.1025
The following table sets forth an estimate of the sources of the Fund’s June distribution and its cumulative distributions paid this fiscal year to date. Amounts are expressed on a per common share basis and as a percentage of the distribution amount.
| Eaton Vance Tax-Advantaged Global Dividend Income Fund |
||||||||||||||||
| Source |
Current Distribution |
% of Current Distribution |
Cumulative Distributions for the Fiscal Year-to-Date1 |
% of the Cumulative Distributions for the Fiscal Year-to-Date1 |
||||||||||||
| Net Investment Income |
$ | 0.0929 | 90.6 | % | $ | 0.4215 | 51.4 | % | ||||||||
| Net Realized Short-Term Capital Gains |
$ | 0.0000 | 0.0 | % | $ | 0.0000 | 0.0 | % | ||||||||
| Net Realized Long-Term Capital Gains |
$ | 0.0096 | 9.4 | % | $ | 0.3985 | 48.6 | % | ||||||||
| Return of Capital or Other Capital Source(s) |
$ | 0.0000 | 0.0 | % | $ | 0.0000 | 0.0 | % | ||||||||
| Total per common share |
$ | 0.1025 | 100.0 | % | $ | 0.8200 | 100.0 | % | ||||||||
| 1 | The Fund’s fiscal year is November 1, 2020 to October 31, 2021 |
IMPORTANT DISCLOSURE: You should not draw any conclusions about the Fund’s investment performance from the amount of this distribution or from the terms of the Fund’s Plan. The Fund estimates that it has distributed more than its income and net realized capital gains; therefore, a portion of your distribution may be a return of capital. A return of capital may occur for example, when some or all of the money that you invested in the Fund is paid back to you. A return of capital distribution does not necessarily reflect the Fund’s investment performance and should not be confused with ‘yield’ or ‘income.’ The amounts and sources of distributions reported in this Notice are only estimates and are not being provided for tax reporting purposes. The actual amounts and sources of the amounts for accounting and/or tax reporting purposes will depend upon the Fund’s investment experience during the remainder of its fiscal year and may be subject to changes based on tax regulations. The Fund will send you a Form 1099-DIV for the calendar year that will tell you how to report these distributions for federal income tax purposes.
Set forth in the table below is information relating to the Fund’s performance based on its net asset value (NAV) for certain periods.
| Average annual total return at NAV for the 5-year period ended on May 31, 20211 |
14.43 | % | ||
| Annualized current distribution rate expressed as a percentage of NAV as of May 31, 20212 |
5.59 | % | ||
| Cumulative total return at NAV for the fiscal year through May 31, 20213 |
41.35 | % | ||
| Cumulative fiscal year to date distribution rate as a percentage of NAV as of May 31, 20214 |
3.26 | % | ||
| 1 | Average annual total return at NAV represents the change in NAV of the Fund, with all distributions reinvested, for the 5-year period ended on May 31, 2021. |
| 2 | The annualized current distribution rate is the cumulative distribution rate annualized as a percentage of the Fund’s NAV as of May 31, 2021. |
| 3 | Cumulative total return at NAV is the percentage change in the Fund’s NAV for the period from the beginning of its fiscal year to May 31, 2021 including distributions paid and assuming reinvestment of those distributions. |
| 4 | Cumulative fiscal year distribution rate for the period from the beginning of its fiscal year to May 31, 2021 measured on the dollar value of distributions in the year-to-date period as a percentage of the Fund’s NAV as of May 31, 2021. |
If you have any questions regarding this information, please contact your investment advisor or an Eaton Vance Investor Services associate at 1-866-328-6681. Our associates are available to assist you Monday-Friday 8:30 a.m. to 5:30 p.m., Eastern Time.
NOTE: This correspondence is for informational purposes only and should not be relied upon to project the tax character of actual Fund distributions for the 2021 calendar year.
NO ACTION IS REQUIRED ON YOUR PART.
Eaton Vance Tax-Advantaged Global Dividend Income Fund
June 30, 2021
Dear Eaton Vance Fund Shareholder:
This notice provides shareholders of the Eaton Vance Tax-Advantaged Global Dividend Income Fund (NYSE: ETG) with important information concerning the distribution declared in July 2021. You are receiving this notice as a requirement of the Fund’s managed distribution plan (Plan). The Board of Trustees approved the implementation of the Plan to make monthly cash distributions to common shareholders, stated in terms of a fixed amount per common share. This information is sent to you for informational purposes only and is an estimate of the sources of the July distribution. It is not determinative of the tax character of the Fund’s distributions for the 2021 calendar year.
The amounts and sources of distributions reported in this notice are estimates, are not being provided for tax reporting purposes and the distribution may later be determined to be from other sources including realized short-term gains, long-term gains, to the extent permitted by law, and return of capital. The actual amounts and sources for tax reporting purposes will depend upon the Fund’s investment experience during the remainder of its fiscal year and may be subject to changes based on tax regulations. The Fund will send you a Form 1099-DIV for the calendar year that will tell you how to report these distributions for federal income tax purposes.
Distribution Period: July 2021
Distribution Amount per Common Share: $0.1025
The following table sets forth an estimate of the sources of the Fund’s July distribution and its cumulative distributions paid this fiscal year to date. Amounts are expressed on a per common share basis and as a percentage of the distribution amount.
| Eaton Vance Tax-Advantaged Global Dividend Income Fund |
||||||||||||||||
| Source |
Current Distribution |
% of Current Distribution |
Cumulative Distributions for the Fiscal Year-to-Date1 |
% of the Cumulative Distributions for the Fiscal Year-to-Date1 |
||||||||||||
| Net Investment Income |
$ | 0.0925 | 90.2 | % | $ | 0.5138 | 55.7 | % | ||||||||
| Net Realized Short-Term Capital Gains |
$ | 0.0000 | 0.0 | % | $ | 0.0000 | 0.0 | % | ||||||||
| Net Realized Long-Term Capital Gains |
$ | 0.0000 | 0.0 | % | $ | 0.3708 | 40.2 | % | ||||||||
| Return of Capital or Other Capital Source(s) |
$ | 0.0100 | 9.8 | % | $ | 0.0379 | 4.1 | % | ||||||||
| Total per common share |
$ | 0.1025 | 100.0 | % | $ | 0.9225 | 100.0 | % | ||||||||
| 1 | The Fund’s fiscal year is November 1, 2020 to October 31, 2021 |
IMPORTANT DISCLOSURE: You should not draw any conclusions about the Fund’s investment performance from the amount of this distribution or from the terms of the Fund’s Plan. The Fund estimates that it has distributed more than its income and net realized capital gains; therefore, a portion of your distribution may be a return of capital. A return of capital may occur for example, when some or all of the money that you invested in the Fund is paid back to you. A return of capital distribution does not necessarily reflect the Fund’s investment performance and should not be confused with ‘yield’ or ‘income.’ The amounts and sources of distributions reported in this Notice are only estimates and are not being provided for tax reporting purposes. The actual amounts and sources of the amounts for accounting and/or tax reporting purposes will depend upon the Fund’s investment experience during the remainder of its fiscal year and may be subject to changes based on tax regulations. The Fund will send you a Form 1099-DIV for the calendar year that will tell you how to report these distributions for federal income tax purposes.
Set forth in the table below is information relating to the Fund’s performance based on its net asset value (NAV) for certain periods.
| Average annual total return at NAV for the 5-year period ended on June 30, 20211 |
14.95 | % | ||
| Annualized current distribution rate expressed as a percentage of NAV as of June 30, 20212 |
5.61 | % | ||
| Cumulative total return at NAV for the fiscal year through June 30, 20213 |
41.52 | % | ||
| Cumulative fiscal year to date distribution rate as a percentage of NAV as of June 30, 20214 |
3.74 | % | ||
| 1 | Average annual total return at NAV represents the change in NAV of the Fund, with all distributions reinvested, for the 5-year period ended on June 30, 2021. |
| 2 | The annualized current distribution rate is the cumulative distribution rate annualized as a percentage of the Fund’s NAV as of June 30, 2021. |
| 3 | Cumulative total return at NAV is the percentage change in the Fund’s NAV for the period from the beginning of its fiscal year to June 30, 2021 including distributions paid and assuming reinvestment of those distributions. |
| 4 | Cumulative fiscal year distribution rate for the period from the beginning of its fiscal year to June 30, 2021 measured on the dollar value of distributions in the year-to-date period as a percentage of the Fund’s NAV as of June 30, 2021. |
If you have any questions regarding this information, please contact your investment advisor or an Eaton Vance Investor Services associate at 1-866-328-6681. Our associates are available to assist you Monday-Friday 8:30 a.m. to 5:30 p.m., Eastern Time.
NOTE: This correspondence is for informational purposes only and should not be relied upon to project the tax character of actual Fund distributions for the 2021 calendar year.
NO ACTION IS REQUIRED ON YOUR PART.
Eaton Vance Tax-Advantaged Global Dividend Income Fund
July 30, 2021
Dear Eaton Vance Fund Shareholder:
This notice provides shareholders of the Eaton Vance Tax-Advantaged Global Dividend Income Fund (NYSE: ETG) with important information concerning the distribution declared in August 2021. You are receiving this notice as a requirement of the Fund’s managed distribution plan (Plan). The Board of Trustees approved the implementation of the Plan to make monthly cash distributions to common shareholders, stated in terms of a fixed amount per common share. This information is sent to you for informational purposes only and is an estimate of the sources of the August distribution. It is not determinative of the tax character of the Fund’s distributions for the 2021 calendar year.
The amounts and sources of distributions reported in this notice are estimates, are not being provided for tax reporting purposes and the distribution may later be determined to be from other sources including realized short-term gains, long-term gains, to the extent permitted by law, and return of capital. The actual amounts and sources for tax reporting purposes will depend upon the Fund’s investment experience during the remainder of its fiscal year and may be subject to changes based on tax regulations. The Fund will send you a Form 1099-DIV for the calendar year that will tell you how to report these distributions for federal income tax purposes.
Distribution Period: August 2021
Distribution Amount per Common Share: $0.1300
The following table sets forth an estimate of the sources of the Fund’s August distribution and its cumulative distributions paid this fiscal year to date. Amounts are expressed on a per common share basis and as a percentage of the distribution amount.
| Eaton Vance Tax-Advantaged Global Dividend Income Fund |
||||||||||||||||
| Source |
Current Distribution |
% of Current Distribution |
Cumulative Distributions for the Fiscal Year-to-Date1 |
% of the Cumulative Distributions for the Fiscal Year-to-Date1 |
||||||||||||
| Net Investment Income |
$ | 0.0975 | 75.0 | % | $ | 0.6115 | 58.1 | % | ||||||||
| Net Realized Short-Term Capital Gains |
$ | 0.0000 | 0.0 | % | $ | 0.0000 | 0.0 | % | ||||||||
| Net Realized Long-Term Capital Gains |
$ | 0.0060 | 4.6 | % | $ | 0.3768 | 35.8 | % | ||||||||
| Return of Capital or Other Capital Source(s) |
$ | 0.0265 | 20.4 | % | $ | 0.0642 | 6.1 | % | ||||||||
| Total per common share |
$ | 0.1300 | 100.0 | % | $ | 1.0525 | 100.0 | % | ||||||||
| 1 | The Fund’s fiscal year is November 1, 2020 to October 31, 2021 |
IMPORTANT DISCLOSURE: You should not draw any conclusions about the Fund’s investment performance from the amount of this distribution or from the terms of the Fund’s Plan. The Fund estimates that it has distributed more than its income and net realized capital gains; therefore, a portion of your distribution may be a return of capital. A return of capital may occur for example, when some or all of the money that you invested in the Fund is paid back to you. A return of capital distribution does not necessarily reflect the Fund’s investment performance and should not be confused with ‘yield’ or ‘income.’ The amounts and sources of distributions reported in this Notice are only estimates and are not being provided for tax reporting purposes. The actual amounts and sources of the amounts for accounting and/or tax reporting purposes will depend upon the Fund’s investment experience during the remainder of its fiscal year and may be subject to changes based on tax regulations. The Fund will send you a Form 1099-DIV for the calendar year that will tell you how to report these distributions for federal income tax purposes.
Set forth in the table below is information relating to the Fund’s performance based on its net asset value (NAV) for certain periods.
| Average annual total return at NAV for the 5-year period ended on July 31, 20211 |
14.46 | % | ||
| Annualized current distribution rate expressed as a percentage of NAV as of July 31, 20212 |
5.52 | % | ||
| Cumulative total return at NAV for the fiscal year through July 31, 20213 |
44.68 | % | ||
| Cumulative fiscal year to date distribution rate as a percentage of NAV as of July 31, 20214 |
4.14 | % | ||
| 1 | Average annual total return at NAV represents the change in NAV of the Fund, with all distributions reinvested, for the 5-year period ended on July 31, 2021. |
| 2 | The annualized current distribution rate is the cumulative distribution rate annualized as a percentage of the Fund’s NAV as of July 31, 2021. |
| 3 | Cumulative total return at NAV is the percentage change in the Fund’s NAV for the period from the beginning of its fiscal year to July 31, 2021 including distributions paid and assuming reinvestment of those distributions. |
| 4 | Cumulative fiscal year distribution rate for the period from the beginning of its fiscal year to July 31, 2021 measured on the dollar value of distributions in the year-to-date period as a percentage of the Fund’s NAV as of July 31, 2021. |
If you have any questions regarding this information, please contact your investment advisor or an Eaton Vance Investor Services associate at 1-866-328-6681. Our associates are available to assist you Monday-Friday 8:30 a.m. to 5:30 p.m., Eastern Time.
NOTE: This correspondence is for informational purposes only and should not be relied upon to project the tax character of actual Fund distributions for the 2021 calendar year.
NO ACTION IS REQUIRED ON YOUR PART.
Eaton Vance Tax-Advantaged Global Dividend Income Fund
August 31, 2021
Dear Eaton Vance Fund Shareholder:
This notice provides shareholders of the Eaton Vance Tax-Advantaged Global Dividend Income Fund (NYSE: ETG) with important information concerning the distribution declared in September 2021. You are receiving this notice as a requirement of the Fund’s managed distribution plan (Plan). The Board of Trustees approved the implementation of the Plan to make monthly cash distributions to common shareholders, stated in terms of a fixed amount per common share. This information is sent to you for informational purposes only and is an estimate of the sources of the September distribution. It is not determinative of the tax character of the Fund’s distributions for the 2021 calendar year.
The amounts and sources of distributions reported in this notice are estimates, are not being provided for tax reporting purposes and the distribution may later be determined to be from other sources including realized short-term gains, long-term gains, to the extent permitted by law, and return of capital. The actual amounts and sources for tax reporting purposes will depend upon the Fund’s investment experience during the remainder of its fiscal year and may be subject to changes based on tax regulations. The Fund will send you a Form 1099-DIV for the calendar year that will tell you how to report these distributions for federal income tax purposes.
Distribution Period: September 2021
Distribution Amount per Common Share: $0.1300
The following table sets forth an estimate of the sources of the Fund’s September distribution and its cumulative distributions paid this fiscal year to date. Amounts are expressed on a per common share basis and as a percentage of the distribution amount.
| Eaton Vance Tax-Advantaged Global Dividend Income Fund |
||||||||||||||||
| Source |
Current Distribution |
% of Current Distribution |
Cumulative Distributions for the Fiscal Year-to-Date1 |
% of the Cumulative Distributions for the Fiscal Year-to-Date1 |
||||||||||||
| Net Investment Income |
$ | 0.1300 | 100.0 | % | $ | 0.8195 | 69.3 | % | ||||||||
| Net Realized Short-Term Capital Gains |
$ | 0.0000 | 0.0 | % | $ | 0.0000 | 0.0 | % | ||||||||
| Net Realized Long-Term Capital Gains |
$ | 0.0000 | 0.0 | % | $ | 0.3630 | 30.7 | % | ||||||||
| Return of Capital or Other Capital Source(s) |
$ | 0.0000 | 0.0 | % | $ | 0.0000 | 0.0 | % | ||||||||
| Total per common share |
$ | 0.1300 | 100.0 | % | $ | 1.1825 | 100.0 | % | ||||||||
| 1 | The Fund’s fiscal year is November 1, 2020 to October 31, 2021 |
IMPORTANT DISCLOSURE: You should not draw any conclusions about the Fund’s investment performance from the amount of this distribution or from the terms of the Fund’s Plan. The Fund estimates that it has distributed more than its income and net realized capital gains; therefore, a portion of your distribution may be a return of capital. A return of capital may occur for example, when some or all of the money that you invested in the Fund is paid back to you. A return of capital distribution does not necessarily reflect the Fund’s investment performance and should not be confused with ‘yield’ or ‘income.’ The amounts and sources of distributions reported in this Notice are only estimates and are not being provided for tax reporting purposes. The actual amounts and sources of the amounts for accounting and/or tax reporting purposes will depend upon the Fund’s investment experience during the remainder of its fiscal year and may be subject to changes based on tax regulations. The Fund will send you a Form 1099-DIV for the calendar year that will tell you how to report these distributions for federal income tax purposes.
Set forth in the table below is information relating to the Fund’s performance based on its net asset value (NAV) for certain periods.
| Average annual total return at NAV for the 5-year period ended on August 31, 20211 |
15.17 | % | ||
| Annualized current distribution rate expressed as a percentage of NAV as of August 31, 20212 |
6.86 | % | ||
| Cumulative total return at NAV for the fiscal year through August 31, 20213 |
48.51 | % | ||
| Cumulative fiscal year to date distribution rate as a percentage of NAV as of August 31, 20214 |
4.63 | % | ||
| 1 | Average annual total return at NAV represents the change in NAV of the Fund, with all distributions reinvested, for the 5-year period ended on August 31, 2021. |
| 2 | The annualized current distribution rate is the cumulative distribution rate annualized as a percentage of the Fund’s NAV as of August 31, 2021. |
| 3 | Cumulative total return at NAV is the percentage change in the Fund’s NAV for the period from the beginning of its fiscal year to August 31, 2021 including distributions paid and assuming reinvestment of those distributions. |
| 4 | Cumulative fiscal year distribution rate for the period from the beginning of its fiscal year to August 31, 2021 measured on the dollar value of distributions in the year-to-date period as a percentage of the Fund’s NAV as of August 31, 2021. |
If you have any questions regarding this information, please contact your investment advisor or an Eaton Vance Investor Services associate at 1-866-328-6681. Our associates are available to assist you Monday-Friday 8:30 a.m. to 5:30 p.m., Eastern Time.
NOTE: This correspondence is for informational purposes only and should not be relied upon to project the tax character of actual Fund distributions for the 2021 calendar year.
NO ACTION IS REQUIRED ON YOUR PART.
Eaton Vance Tax-Advantaged Global Dividend Income Fund
September 30, 2021
Dear Eaton Vance Fund Shareholder:
This notice provides shareholders of the Eaton Vance Tax-Advantaged Global Dividend Income Fund (NYSE: ETG) with important information concerning the distribution declared in October 2021. You are receiving this notice as a requirement of the Fund’s managed distribution plan (Plan). The Board of Trustees approved the implementation of the Plan to make monthly cash distributions to common shareholders, stated in terms of a fixed amount per common share. This information is sent to you for informational purposes only and is an estimate of the sources of the October distribution. It is not determinative of the tax character of the Fund’s distributions for the 2021 calendar year.
The amounts and sources of distributions reported in this notice are estimates, are not being provided for tax reporting purposes and the distribution may later be determined to be from other sources including realized short-term gains, long-term gains, to the extent permitted by law, and return of capital. The actual amounts and sources for tax reporting purposes will depend upon the Fund’s investment experience during the remainder of its fiscal year and may be subject to changes based on tax regulations. The Fund will send you a Form 1099-DIV for the calendar year that will tell you how to report these distributions for federal income tax purposes.
Distribution Period: October 2021
Distribution Amount per Common Share: $0.1300
The following table sets forth an estimate of the sources of the Fund’s October distribution and its cumulative distributions paid this fiscal year to date. Amounts are expressed on a per common share basis and as a percentage of the distribution amount.
| Eaton Vance Tax-Advantaged Global Dividend Income Fund |
||||||||||||||||
| Source |
Current Distribution |
% of Current Distribution |
Cumulative Distributions for the Fiscal Year-to-Date1 |
% of the Cumulative Distributions for the Fiscal Year-to-Date1 |
||||||||||||
| Net Investment Income |
$ | 0.0647 | 49.8 | % | $ | 0.8846 | 67.4 | % | ||||||||
| Net Realized Short-Term Capital Gains |
$ | 0.0000 | 0.0 | % | $ | 0.0000 | 0.0 | % | ||||||||
| Net Realized Long-Term Capital Gains |
$ | 0.0653 | 50.2 | % | $ | 0.4279 | 32.6 | % | ||||||||
| Return of Capital or Other Capital Source(s) |
$ | 0.0000 | 0.0 | % | $ | 0.0000 | 0.0 | % | ||||||||
| Total per common share |
$ | 0.1300 | 100.0 | % | $ | 1.3125 | 100.0 | % | ||||||||
| 1 | The Fund’s fiscal year is November 1, 2020 to October 31, 2021 |
IMPORTANT DISCLOSURE: You should not draw any conclusions about the Fund’s investment performance from the amount of this distribution or from the terms of the Fund’s Plan. The Fund estimates that it has distributed more than its income and net realized capital gains; therefore, a portion of your distribution may be a return of capital. A return of capital may occur for example, when some or all of the money that you invested in the Fund is paid back to you. A return of capital distribution does not necessarily reflect the Fund’s investment performance and should not be confused with ‘yield’ or ‘income.’ The amounts and sources of distributions reported in this Notice are only estimates and are not being provided for tax reporting purposes. The actual amounts and sources of the amounts for accounting and/or tax reporting purposes will depend upon the Fund’s investment experience during the remainder of its fiscal year and may be subject to changes based on tax regulations. The Fund will send you a Form 1099-DIV for the calendar year that will tell you how to report these distributions for federal income tax purposes.
Set forth in the table below is information relating to the Fund’s performance based on its net asset value (NAV) for certain periods.
| Average annual total return at NAV for the 5-year period ended on September 30, 20211 |
13.83 | % | ||
| Annualized current distribution rate expressed as a percentage of NAV as of September 30, 20212 |
7.30 | % | ||
| Cumulative total return at NAV for the fiscal year through September 30, 20213 |
40.43 | % | ||
| Cumulative fiscal year to date distribution rate as a percentage of NAV as of September 30, 20214 |
5.53 | % | ||
| 1 | Average annual total return at NAV represents the change in NAV of the Fund, with all distributions reinvested, for the 5-year period ended on September 30, 2021. |
| 2 | The annualized current distribution rate is the cumulative distribution rate annualized as a percentage of the Fund’s NAV as of September 30, 2021. |
| 3 | Cumulative total return at NAV is the percentage change in the Fund’s NAV for the period from the beginning of its fiscal year to September 30, 2021 including distributions paid and assuming reinvestment of those distributions. |
| 4 | Cumulative fiscal year distribution rate for the period from the beginning of its fiscal year to September 30, 2021 measured on the dollar value of distributions in the year-to-date period as a percentage of the Fund’s NAV as of September 30, 2021. |
If you have any questions regarding this information, please contact your investment advisor or an Eaton Vance Investor Services associate at 1-866-328-6681. Our associates are available to assist you Monday-Friday 8:30 a.m. to 5:30 p.m., Eastern Time.
NOTE: This correspondence is for informational purposes only and should not be relied upon to project the tax character of actual Fund distributions for the 2021 calendar year.
NO ACTION IS REQUIRED ON YOUR PART.
Eaton Vance Tax-Advantaged Global Dividend Income Fund
October 29, 2021
Serious News for Serious Traders! Try StreetInsider.com Premium Free!
You May Also Be Interested In
- ROSEN, A RANKED AND LEADING FIRM, Encourages Innoviz Technologies Ltd. Investors to Secure Counsel Before Important Deadline in Securities Class Action – INVZ, INVZW
- Actions Technology's Smartwatch Chip Powers HONOR Band 9 to Achieve 14-Day Long Battery Life
- Quorum Announces Q4 and Year End 2023 Results
Create E-mail Alert Related Categories
SEC FilingsSign up for StreetInsider Free!
Receive full access to all new and archived articles, unlimited portfolio tracking, e-mail alerts, custom newswires and RSS feeds - and more!
