

Form N-CSR EATON VANCE GROWTH TRUST For: Feb 28
 Tweet
Tweet Share
Share
UNITED STATES
SECURITIES AND EXCHANGE COMMISSION
Washington, D.C. 20549
Form N-CSR
CERTIFIED SHAREHOLDER REPORT OF REGISTERED
MANAGEMENT INVESTMENT COMPANIES
Investment Company Act File Number: 811-01241
Eaton Vance Growth Trust
(Exact Name of Registrant as Specified in Charter)
Two International Place, Boston, Massachusetts 02110
(Address of Principal Executive Offices)
Maureen A. Gemma
Two International Place, Boston, Massachusetts 02110
(Name and Address of Agent for Services)
(617) 482-8260
(Registrant’s Telephone Number)
February 28
Date of Fiscal Year End
February 28, 2018
Date of Reporting Period
Item 1. Reports to Stockholders

Eaton Vance
Focused Growth Opportunities Fund
Annual Report
February 28, 2018

Commodity Futures Trading Commission Registration. Effective December 31, 2012, the Commodity Futures Trading Commission (“CFTC”) adopted certain regulatory changes that subject registered investment companies and advisers to regulation by the CFTC if a fund invests more than a prescribed level of its assets in certain CFTC-regulated instruments (including futures, certain options and swap agreements) or markets itself as providing investment exposure to such instruments. The Fund has claimed an exclusion from the definition of the term “commodity pool operator” under the Commodity Exchange Act. Accordingly, neither the Fund nor the adviser with respect to the operation of the Fund is subject to CFTC regulation. Because of its management of other strategies, the Fund’s adviser is registered with the CFTC as a commodity pool operator and a commodity trading advisor.
Fund shares are not insured by the FDIC and are not deposits or other obligations of, or guaranteed by, any depository institution. Shares are subject to investment risks, including possible loss of principal invested.
This report must be preceded or accompanied by a current summary prospectus or prospectus. Before investing, investors should consider carefully the investment objective, risks, and charges and expenses of a mutual fund. This and other important information is contained in the summary prospectus and prospectus, which can be obtained from a financial advisor. Prospective investors should read the prospectus carefully before investing. For further information, please call 1-800-262-1122.
Annual Report February 28, 2018
Eaton Vance
Focused Growth Opportunities Fund
Table of Contents
| Management’s Discussion of Fund Performance |
2 | |||
| Performance |
3 | |||
| Fund Profile |
4 | |||
| Endnotes and Additional Disclosures |
5 | |||
| Fund Expenses |
6 | |||
| Financial Statements |
7 | |||
| Report of Independent Registered Public Accounting Firm |
20 | |||
| Federal Tax Information |
21 | |||
| Management and Organization |
22 | |||
| Important Notices |
25 | |||
Eaton Vance
Focused Growth Opportunities Fund
February 28, 2018
Management’s Discussion of Fund Performance1
See Endnotes and Additional Disclosures in this report.
Past performance is no guarantee of future results. Returns are historical and are calculated by determining the percentage change in net asset value (NAV) or offering price (as applicable) with all distributions reinvested. Investment return and principal value will fluctuate so that shares, when redeemed, may be worth more or less than their original cost. Performance less than or equal to one year is cumulative. Performance is for the stated time period only; due to market volatility, the Fund’s current performance may be lower or higher than quoted. Returns are before taxes unless otherwise noted. For performance as of the most recent month-end, please refer to eatonvance.com.
| 2 |
Eaton Vance
Focused Growth Opportunities Fund
February 28, 2018
Performance2,3
Portfolio Managers Lewis R. Piantedosi and Yana S. Barton, CFA
| % Average Annual Total Returns | Class Inception Date |
Performance Inception Date |
One Year | Five Years | Since Inception |
|||||||||||||||
| Class A at NAV |
03/07/2011 | 03/07/2011 | 23.00 | % | 16.36 | % | 12.83 | % | ||||||||||||
| Class A with 5.75% Maximum Sales Charge |
— | — | 15.95 | 15.00 | 11.88 | |||||||||||||||
| Class C at NAV |
03/07/2011 | 03/07/2011 | 22.06 | 15.46 | 11.97 | |||||||||||||||
| Class C with 1% Maximum Sales Charge |
— | — | 21.06 | 15.46 | 11.97 | |||||||||||||||
| Class I at NAV |
03/07/2011 | 03/07/2011 | 23.28 | 16.63 | 13.11 | |||||||||||||||
| Russell 1000® Growth Index |
— | — | 26.11 | % | 17.02 | % | 14.79 | % | ||||||||||||
| % Total Annual Operating Expense Ratios4 | Class A | Class C | Class I | |||||||||||||||||
| Gross |
1.09 | % | 1.84 | % | 0.84 | % | ||||||||||||||
| Net |
1.05 | 1.80 | 0.80 | |||||||||||||||||
Growth of $10,000
This graph shows the change in value of a hypothetical investment of $10,000 in Class A of the Fund for the period indicated. For comparison, the same investment is shown in the indicated index.
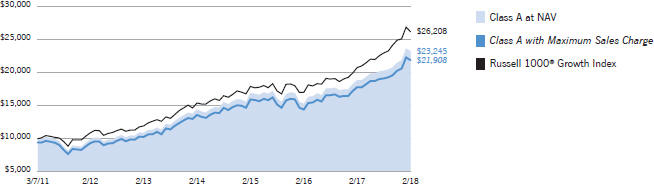
| Growth of Investment | Amount Invested | Period Beginning | At NAV | With Maximum Sales Charge | ||||||||||||
| Class C |
$ | 10,000 | 03/07/2011 | $ | 22,029 | N.A. | ||||||||||
| Class I |
$ | 250,000 | 03/07/2011 | $ | 591,254 | N.A. | ||||||||||
See Endnotes and Additional Disclosures in this report.
Past performance is no guarantee of future results. Returns are historical and are calculated by distributions reinvested. Investment return and principal value will fluctuate so that shares, when redeemed, may be worth more or less than their original cost. Performance less than or equal to one year is cumulative. Performance is for the stated time period only; due to market volatility, the Fund’s current performance may be lower or higher than quoted. Returns are before taxes unless otherwise noted. For performance as of the most recent month-end, please refer to eatonvance.com.
| 3 |
Eaton Vance
Focused Growth Opportunities Fund
February 28, 2018
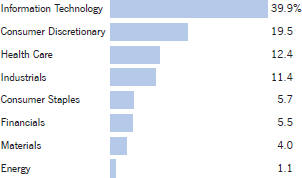
Fund Profile
See Endnotes and Additional Disclosures in this report.
| 4 |
Eaton Vance
Focused Growth Opportunities Fund
February 28, 2018
Endnotes and Additional Disclosures
| 5 |
Eaton Vance
Focused Growth Opportunities Fund
February 28, 2018
Fund Expenses
Example: As a Fund shareholder, you incur two types of costs: (1) transaction costs, including sales charges (loads) on purchases and redemption fees (if applicable); and (2) ongoing costs, including management fees; distribution and/or service fees; and other Fund expenses. This Example is intended to help you understand your ongoing costs (in dollars) of Fund investing and to compare these costs with the ongoing costs of investing in other mutual funds. The Example is based on an investment of $1,000 invested at the beginning of the period and held for the entire period (September 1, 2017 – February 28, 2018).
Actual Expenses: The first section of the table below provides information about actual account values and actual expenses. You may use the information in this section, together with the amount you invested, to estimate the expenses that you paid over the period. Simply divide your account value by $1,000 (for example, an $8,600 account value divided by $1,000 = 8.6), then multiply the result by the number in the first section under the heading entitled “Expenses Paid During Period” to estimate the expenses you paid on your account during this period.
Hypothetical Example for Comparison Purposes: The second section of the table below provides information about hypothetical account values and hypothetical expenses based on the actual Fund expense ratio and an assumed rate of return of 5% per year (before expenses), which is not the actual Fund return. The hypothetical account values and expenses may not be used to estimate the actual ending account balance or expenses you paid for the period. You may use this information to compare the ongoing costs of investing in your Fund and other funds. To do so, compare this 5% hypothetical example with the 5% hypothetical examples that appear in the shareholder reports of the other funds.
Please note that the expenses shown in the table are meant to highlight your ongoing costs only and do not reflect any transactional costs, such as sales charges (loads) or redemption fees (if applicable). Therefore, the second section of the table is useful in comparing ongoing costs only, and will not help you determine the relative total costs of owning different funds. In addition, if these transactional costs were included, your costs would be higher.
| Beginning Account Value (9/1/17) |
Ending Account Value (2/28/18) |
Expenses Paid During Period* (9/1/17 – 2/28/18) |
Annualized Expense Ratio |
|||||||||||||
| Actual |
||||||||||||||||
| Class A |
$ | 1,000.00 | $ | 1,145.00 | $ | 5.58 | ** | 1.05 | % | |||||||
| Class C |
$ | 1,000.00 | $ | 1,140.80 | $ | 9.55 | ** | 1.80 | % | |||||||
| Class I |
$ | 1,000.00 | $ | 1,146.10 | $ | 4.26 | ** | 0.80 | % | |||||||
| Hypothetical |
||||||||||||||||
| (5% return per year before expenses) |
||||||||||||||||
| Class A |
$ | 1,000.00 | $ | 1,019.60 | $ | 5.26 | ** | 1.05 | % | |||||||
| Class C |
$ | 1,000.00 | $ | 1,015.90 | $ | 9.00 | ** | 1.80 | % | |||||||
| Class I |
$ | 1,000.00 | $ | 1,020.80 | $ | 4.01 | ** | 0.80 | % | |||||||
| * | Expenses are equal to the Fund’s annualized expense ratio for the indicated Class, multiplied by the average account value over the period, multiplied by 181/365 (to reflect the one-half year period). The Example assumes that the $1,000 was invested at the net asset value per share determined at the close of business on August 31, 2017. |
| ** | Absent an allocation of certain expenses to an affiliate, expenses would be higher. |
| 6 |
Eaton Vance
Focused Growth Opportunities Fund
February 28, 2018
Portfolio of Investments
| 7 | See Notes to Financial Statements. |
Eaton Vance
Focused Growth Opportunities Fund
February 28, 2018
Portfolio of Investments — continued
| 8 | See Notes to Financial Statements. |
Eaton Vance
Focused Growth Opportunities Fund
February 28, 2018
Statement of Assets and Liabilities
| Assets | February 28, 2018 | |||
| Unaffiliated investments, at value (identified cost, $154,741,953) |
$ | 218,472,336 | ||
| Affiliated investment, at value (identified cost, $1,992,480) |
1,992,491 | |||
| Dividends receivable |
181,220 | |||
| Dividends receivable from affiliated investment |
3,459 | |||
| Receivable for Fund shares sold |
354,709 | |||
| Total assets |
$ | 221,004,215 | ||
| Liabilities | ||||
| Payable for Fund shares redeemed |
$ | 1,074,984 | ||
| Payable to affiliates: |
||||
| Investment adviser and administration fee |
108,727 | |||
| Distribution and service fees |
19,841 | |||
| Other |
5,250 | |||
| Accrued expenses |
105,432 | |||
| Total liabilities |
$ | 1,314,234 | ||
| Net Assets |
$ | 219,689,981 | ||
| Sources of Net Assets | ||||
| Paid-in capital |
$ | 150,201,424 | ||
| Accumulated net investment loss |
(67,281 | ) | ||
| Accumulated net realized gain |
5,825,444 | |||
| Net unrealized appreciation |
63,730,394 | |||
| Total |
$ | 219,689,981 | ||
| Class A Shares | ||||
| Net Assets |
$ | 32,847,126 | ||
| Shares Outstanding |
1,518,229 | |||
| Net Asset Value and Redemption Price Per Share |
||||
| (net assets ÷ shares of beneficial interest outstanding) |
$ | 21.64 | ||
| Maximum Offering Price Per Share |
||||
| (100 ÷ 94.25 of net asset value per share) |
$ | 22.96 | ||
| Class C Shares | ||||
| Net Assets |
$ | 17,813,487 | ||
| Shares Outstanding |
865,563 | |||
| Net Asset Value and Offering Price Per Share* |
||||
| (net assets ÷ shares of beneficial interest outstanding) |
$ | 20.58 | ||
| Class I Shares | ||||
| Net Assets |
$ | 169,029,368 | ||
| Shares Outstanding |
7,722,014 | |||
| Net Asset Value, Offering Price and Redemption Price Per Share |
||||
| (net assets ÷ shares of beneficial interest outstanding) |
$ | 21.89 | ||
On sales of $50,000 or more, the offering price of Class A shares is reduced.
| * | Redemption price per share is equal to the net asset value less any applicable contingent deferred sales charge. |
| 9 | See Notes to Financial Statements. |
Eaton Vance
Focused Growth Opportunities Fund
February 28, 2018
Statement of Operations
| Investment Income | Year Ended February 28, 2018 |
|||
| Dividends |
$ | 1,681,606 | ||
| Dividends from affiliated investment |
31,029 | |||
| Total investment income |
$ | 1,712,635 | ||
| Expenses | ||||
| Investment adviser and administration fee |
$ | 1,376,057 | ||
| Distribution and service fees |
||||
| Class A |
80,090 | |||
| Class C |
161,916 | |||
| Trustees’ fees and expenses |
10,254 | |||
| Custodian fee |
65,264 | |||
| Transfer and dividend disbursing agent fees |
79,905 | |||
| Legal and accounting services |
41,323 | |||
| Printing and postage |
25,423 | |||
| Registration fees |
54,338 | |||
| Miscellaneous |
20,184 | |||
| Total expenses |
$ | 1,914,754 | ||
| Deduct — |
||||
| Allocation of expenses to affiliate |
$ | 60,140 | ||
| Total expense reductions |
$ | 60,140 | ||
| Net expenses |
$ | 1,854,614 | ||
| Net investment loss |
$ | (141,979 | ) | |
| Realized and Unrealized Gain (Loss) | ||||
| Net realized gain (loss) — |
||||
| Investment transactions |
$ | 16,408,070 | ||
| Investment transactions — affiliated investment |
(569 | ) | ||
| Foreign currency transactions |
(3,512 | ) | ||
| Net realized gain |
$ | 16,403,989 | ||
| Change in unrealized appreciation (depreciation) — |
||||
| Investments |
$ | 26,119,231 | ||
| Investments — affiliated investment |
(419 | ) | ||
| Net change in unrealized appreciation (depreciation) |
$ | 26,118,812 | ||
| Net realized and unrealized gain |
$ | 42,522,801 | ||
| Net increase in net assets from operations |
$ | 42,380,822 | ||
| 10 | See Notes to Financial Statements. |
Eaton Vance
Focused Growth Opportunities Fund
February 28, 2018
Statements of Changes in Net Assets
| Year Ended February 28, | ||||||||
| Increase (Decrease) in Net Assets | 2018 | 2017 | ||||||
| From operations — |
||||||||
| Net investment income (loss) |
$ | (141,979 | ) | $ | 534,227 | |||
| Net realized gain |
16,403,989 | 2,355,252 | ||||||
| Net change in unrealized appreciation (depreciation) |
26,118,812 | 36,093,185 | ||||||
| Net increase in net assets from operations |
$ | 42,380,822 | $ | 38,982,664 | ||||
| Distributions to shareholders — |
||||||||
| From net investment income |
||||||||
| Class A |
$ | (12,579 | ) | $ | — | |||
| Class I |
(474,731 | ) | — | |||||
| Total distributions to shareholders |
$ | (487,310 | ) | $ | — | |||
| Transactions in shares of beneficial interest — |
||||||||
| Proceeds from sale of shares |
||||||||
| Class A |
$ | 13,771,461 | $ | 13,369,408 | ||||
| Class C |
3,410,784 | 4,669,703 | ||||||
| Class I |
45,199,901 | 45,805,357 | ||||||
| Net asset value of shares issued to shareholders in payment of distributions declared |
||||||||
| Class A |
11,688 | — | ||||||
| Class I |
319,015 | — | ||||||
| Cost of shares redeemed |
||||||||
| Class A |
(26,149,508 | ) | (15,385,445 | ) | ||||
| Class C |
(3,755,882 | ) | (3,596,046 | ) | ||||
| Class I |
(53,182,257 | ) | (61,098,963 | ) | ||||
| Net decrease in net assets from Fund share transactions |
$ | (20,374,798 | ) | $ | (16,235,986 | ) | ||
| Net increase in net assets |
$ | 21,518,714 | $ | 22,746,678 | ||||
| Net Assets | ||||||||
| At beginning of year |
$ | 198,171,267 | $ | 175,424,589 | ||||
| At end of year |
$ | 219,689,981 | $ | 198,171,267 | ||||
| Accumulated undistributed net investment income (loss) included in net assets |
||||||||
| At end of year |
$ | (67,281 | ) | $ | 494,506 | |||
| 11 | See Notes to Financial Statements. |
Eaton Vance
Focused Growth Opportunities Fund
February 28, 2018
Financial Highlights
| Class A | ||||||||||||||||||||
| Year Ended February 28, | Year Ended February 29, 2016 |
Year Ended February 28, | ||||||||||||||||||
| 2018 | 2017 | 2015 | 2014 | |||||||||||||||||
| Net asset value — Beginning of year |
$ | 17.600 | $ | 14.240 | $ | 15.950 | $ | 14.100 | $ | 10.890 | ||||||||||
| Income (Loss) From Operations | ||||||||||||||||||||
| Net investment income (loss)(1) |
$ | (0.041 | ) | $ | 0.027 | $ | (0.026 | ) | $ | (0.037 | ) | $ | (0.014 | ) | ||||||
| Net realized and unrealized gain (loss) |
4.088 | 3.333 | (1.485 | ) | 2.420 | 3.529 | ||||||||||||||
| Total income (loss) from operations |
$ | 4.047 | $ | 3.360 | $ | (1.511 | ) | $ | 2.383 | $ | 3.515 | |||||||||
| Less Distributions | ||||||||||||||||||||
| From net investment income |
$ | (0.007 | ) | $ | — | $ | — | $ | — | $ | — | |||||||||
| From net realized gain |
— | — | (0.199 | ) | (0.533 | ) | (0.305 | ) | ||||||||||||
| Total distributions |
$ | (0.007 | ) | $ | — | $ | (0.199 | ) | $ | (0.533 | ) | $ | (0.305 | ) | ||||||
| Net asset value — End of year |
$ | 21.640 | $ | 17.600 | $ | 14.240 | $ | 15.950 | $ | 14.100 | ||||||||||
| Total Return(2)(3) |
23.00 | % | 23.60 | % | (9.61 | )% | 17.21 | % | 32.49 | % | ||||||||||
| Ratios/Supplemental Data | ||||||||||||||||||||
| Net assets, end of year (000’s omitted) |
$ | 32,847 | $ | 38,469 | $ | 32,921 | $ | 7,052 | $ | 1,240 | ||||||||||
| Ratios (as a percentage of average daily net assets): |
||||||||||||||||||||
| Expenses(3) |
1.05 | % | 1.05 | % | 1.05 | % | 1.09 | % | 1.25 | % | ||||||||||
| Net investment income (loss) |
(0.21 | )% | 0.17 | % | (0.17 | )% | (0.25 | )% | (0.11 | )% | ||||||||||
| Portfolio Turnover |
80 | % | 71 | % | 87 | % | 69 | % | 66 | % | ||||||||||
| (1) | Computed using average shares outstanding. |
| (2) | Returns are historical and are calculated by determining the percentage change in net asset value with all distributions reinvested and do not reflect the effect of sales charges. |
| (3) | The investment adviser and administrator reimbursed certain operating expenses (equal to 0.03%, 0.14%, 0.15%, 0.30% and 0.47% of average daily net assets for the years ended February 28, 2018, 2017, the year ended February 29, 2016, and the years ended February 28, 2015 and 2014, respectively). Absent this reimbursement, total return would be lower. |
| 12 | See Notes to Financial Statements. |
Eaton Vance
Focused Growth Opportunities Fund
February 28, 2018
Financial Highlights — continued
| Class C | ||||||||||||||||||||
| Year Ended February 28, | Year Ended February 29, 2016 |
Year Ended February 28, | ||||||||||||||||||
| 2018 | 2017 | 2015 | 2014 | |||||||||||||||||
| Net asset value — Beginning of year |
$ | 16.860 | $ | 13.750 | $ | 15.520 | $ | 13.840 | $ | 10.730 | ||||||||||
| Income (Loss) From Operations | ||||||||||||||||||||
| Net investment loss(1) |
$ | (0.173 | ) | $ | (0.090 | ) | $ | (0.134 | ) | $ | (0.143 | ) | $ | (0.111 | ) | |||||
| Net realized and unrealized gain (loss) |
3.893 | 3.200 | (1.437 | ) | 2.356 | 3.467 | ||||||||||||||
| Total income (loss) from operations |
$ | 3.720 | $ | 3.110 | $ | (1.571 | ) | $ | 2.213 | $ | 3.356 | |||||||||
| Less Distributions | ||||||||||||||||||||
| From net realized gain |
$ | — | $ | — | $ | (0.199 | ) | $ | (0.533 | ) | $ | (0.246 | ) | |||||||
| Total distributions |
$ | — | $ | — | $ | (0.199 | ) | $ | (0.533 | ) | $ | (0.246 | ) | |||||||
| Net asset value — End of year |
$ | 20.580 | $ | 16.860 | $ | 13.750 | $ | 15.520 | $ | 13.840 | ||||||||||
| Total Return(2)(3) |
22.06 | % | 22.62 | % | (10.27 | )% | 16.30 | % | 31.45 | % | ||||||||||
| Ratios/Supplemental Data | ||||||||||||||||||||
| Net assets, end of year (000’s omitted) |
$ | 17,813 | $ | 14,909 | $ | 11,207 | $ | 2,073 | $ | 304 | ||||||||||
| Ratios (as a percentage of average daily net assets): |
||||||||||||||||||||
| Expenses(3) |
1.80 | % | 1.80 | % | 1.80 | % | 1.82 | % | 2.00 | % | ||||||||||
| Net investment loss |
(0.94 | )% | (0.58 | )% | (0.91 | )% | (0.98 | )% | (0.89 | )% | ||||||||||
| Portfolio Turnover |
80 | % | 71 | % | 87 | % | 69 | % | 66 | % | ||||||||||
| (1) | Computed using average shares outstanding. |
| (2) | Returns are historical and are calculated by determining the percentage change in net asset value with all distributions reinvested and do not reflect the effect of sales charges. |
| (3) | The investment adviser and administrator reimbursed certain operating expenses (equal to 0.03%, 0.14%, 0.15%, 0.30% and 0.47% of average daily net assets for the years ended February 28, 2018, 2017, the year ended February 29, 2016, and the years ended February 28, 2015 and 2014, respectively). Absent this reimbursement, total return would be lower. |
| 13 | See Notes to Financial Statements. |
Eaton Vance
Focused Growth Opportunities Fund
February 28, 2018
Financial Highlights — continued
| Class I | ||||||||||||||||||||
| Year Ended February 28, | Year Ended February 29, 2016 |
Year Ended February 28, | ||||||||||||||||||
| 2018 | 2017 | 2015 | 2014 | |||||||||||||||||
| Net asset value — Beginning of year |
$ | 17.810 | $ | 14.370 | $ | 16.060 | $ | 14.160 | $ | 10.930 | ||||||||||
| Income (Loss) From Operations | ||||||||||||||||||||
| Net investment income(1) |
$ | 0.010 | $ | 0.067 | $ | 0.011 | $ | 0.002 | $ | 0.019 | ||||||||||
| Net realized and unrealized gain (loss) |
4.129 | 3.373 | (1.502 | ) | 2.431 | 3.538 | ||||||||||||||
| Total income (loss) from operations |
$ | 4.139 | $ | 3.440 | $ | (1.491 | ) | $ | 2.433 | $ | 3.557 | |||||||||
| Less Distributions | ||||||||||||||||||||
| From net investment income |
$ | (0.059 | ) | $ | — | $ | — | $ | — | $ | (0.022 | ) | ||||||||
| From net realized gain |
— | — | (0.199 | ) | (0.533 | ) | (0.305 | ) | ||||||||||||
| Total distributions |
$ | (0.059 | ) | $ | — | $ | (0.199 | ) | $ | (0.533 | ) | $ | (0.327 | ) | ||||||
| Net asset value — End of year |
$ | 21.890 | $ | 17.810 | $ | 14.370 | $ | 16.060 | $ | 14.160 | ||||||||||
| Total Return(2)(3) |
23.28 | % | 23.94 | % | (9.42 | )% | 17.50 | % | 32.77 | % | ||||||||||
| Ratios/Supplemental Data | ||||||||||||||||||||
| Net assets, end of year (000’s omitted) |
$ | 169,029 | $ | 144,793 | $ | 131,297 | $ | 57,551 | $ | 20,603 | ||||||||||
| Ratios (as a percentage of average daily net assets): |
||||||||||||||||||||
| Expenses(3) |
0.80 | % | 0.80 | % | 0.80 | % | 0.84 | % | 1.00 | % | ||||||||||
| Net investment income |
0.05 | % | 0.41 | % | 0.07 | % | 0.01 | % | 0.15 | % | ||||||||||
| Portfolio Turnover |
80 | % | 71 | % | 87 | % | 69 | % | 66 | % | ||||||||||
| (1) | Computed using average shares outstanding. |
| (2) | Returns are historical and are calculated by determining the percentage change in net asset value with all distributions reinvested. |
| (3) | The investment adviser and administrator reimbursed certain operating expenses (equal to 0.03%, 0.14%, 0.15%, 0.30% and 0.47% of average daily net assets for the years ended February 28, 2018, 2017, the year ended February 29, 2016, and the years ended February 28, 2015 and 2014, respectively). Absent this reimbursement, total return would be lower. |
| 14 | See Notes to Financial Statements. |
Eaton Vance
Focused Growth Opportunities Fund
February 28, 2018
Notes to Financial Statements
1 Significant Accounting Policies
Eaton Vance Focused Growth Opportunities Fund (the Fund) is a diversified series of Eaton Vance Growth Trust (the Trust). The Trust is a Massachusetts business trust registered under the Investment Company Act of 1940, as amended (the 1940 Act), as an open-end management investment company. The Fund’s investment objective is to seek long-term capital growth. The Fund offers three classes of shares. Class A shares are generally sold subject to a sales charge imposed at time of purchase. Class C shares are sold at net asset value and are generally subject to a contingent deferred sales charge (see Note 5). Class I shares are sold at net asset value and are not subject to a sales charge. Each class represents a pro-rata interest in the Fund, but votes separately on class-specific matters and (as noted below) is subject to different expenses. Realized and unrealized gains and losses and net investment income and losses, other than class-specific expenses, are allocated daily to each class of shares based on the relative net assets of each class to the total net assets of the Fund. Each class of shares differs in its distribution plan and certain other class-specific expenses.
The following is a summary of significant accounting policies of the Fund. The policies are in conformity with accounting principles generally accepted in the United States of America (U.S. GAAP). The Fund is an investment company and follows accounting and reporting guidance in the Financial Accounting Standards Board (FASB) Accounting Standards Codification Topic 946.
A Investment Valuation — The following methodologies are used to determine the market value or fair value of investments.
Equity Securities. Equity securities listed on a U.S. securities exchange generally are valued at the last sale or closing price on the day of valuation or, if no sales took place on such date, at the mean between the closing bid and asked prices therefore on the exchange where such securities are principally traded. Equity securities listed on the NASDAQ Global or Global Select Market generally are valued at the NASDAQ official closing price. Unlisted or listed securities for which closing sales prices or closing quotations are not available are valued at the mean between the latest available bid and asked prices.
Foreign Securities and Currencies. Foreign securities and currencies are valued in U.S. dollars, based on foreign currency exchange rate quotations supplied by a third party pricing service. The pricing service uses a proprietary model to determine the exchange rate. Inputs to the model include reported trades and implied bid/ask spreads. The daily valuation of exchange-traded foreign securities generally is determined as of the close of trading on the principal exchange on which such securities trade. Events occurring after the close of trading on foreign exchanges may result in adjustments to the valuation of foreign securities to more accurately reflect their fair value as of the close of regular trading on the New York Stock Exchange. When valuing foreign equity securities that meet certain criteria, the Fund’s Trustees have approved the use of a fair value service that values such securities to reflect market trading that occurs after the close of the applicable foreign markets of comparable securities or other instruments that have a strong correlation to the fair-valued securities.
Affiliated Fund. The Fund may invest in Eaton Vance Cash Reserves Fund, LLC (Cash Reserves Fund), an affiliated investment company managed by Eaton Vance Management (EVM). While Cash Reserves Fund is not a registered money market mutual fund, it conducts all of its investment activities in accordance with the requirements of Rule 2a-7 under the 1940 Act. Investments in Cash Reserves Fund are valued at the closing net asset value per unit on the valuation day. Cash Reserves Fund generally values its investment securities based on available market quotations provided by a third party pricing service.
Fair Valuation. Investments for which valuations or market quotations are not readily available or are deemed unreliable are valued at fair value using methods determined in good faith by or at the direction of the Trustees of the Fund in a manner that fairly reflects the security’s value, or the amount that the Fund might reasonably expect to receive for the security upon its current sale in the ordinary course. Each such determination is based on a consideration of relevant factors, which are likely to vary from one pricing context to another. These factors may include, but are not limited to, the type of security, the existence of any contractual restrictions on the security’s disposition, the price and extent of public trading in similar securities of the issuer or of comparable companies or entities, quotations or relevant information obtained from broker/dealers or other market participants, information obtained from the issuer, analysts, and/or the appropriate stock exchange (for exchange-traded securities), an analysis of the company’s or entity’s financial condition, and an evaluation of the forces that influence the issuer and the market(s) in which the security is purchased and sold.
B Investment Transactions — Investment transactions for financial statement purposes are accounted for on a trade date basis. Realized gains and losses on investments sold are determined on the basis of identified cost.
C Income — Dividend income is recorded on the ex-dividend date for dividends received in cash and/or securities. However, if the ex-dividend date has passed, certain dividends from foreign securities are recorded as the Fund is informed of the ex-dividend date. Interest income is recorded on the basis of interest accrued, adjusted for amortization of premium or accretion of discount.
D Federal Taxes — The Fund’s policy is to comply with the provisions of the Internal Revenue Code applicable to regulated investment companies and to distribute to shareholders each year substantially all of its net investment income, and all or substantially all of its net realized capital gains. Accordingly, no provision for federal income or excise tax is necessary.
As of February 28, 2018, the Fund had no uncertain tax positions that would require financial statement recognition, de-recognition, or disclosure. The Fund files a U.S. federal income tax return annually after its fiscal year-end, which is subject to examination by the Internal Revenue Service for a period of three years from the date of filing.
E Expenses — The majority of expenses of the Trust are directly identifiable to an individual fund. Expenses which are not readily identifiable to a specific fund are allocated taking into consideration, among other things, the nature and type of expense and the relative size of the funds.
| 15 |
Eaton Vance
Focused Growth Opportunities Fund
February 28, 2018
Notes to Financial Statements — continued
F Foreign Currency Translation — Investment valuations, other assets, and liabilities initially expressed in foreign currencies are translated each business day into U.S. dollars based upon current exchange rates. Purchases and sales of foreign investment securities and income and expenses denominated in foreign currencies are translated into U.S. dollars based upon currency exchange rates in effect on the respective dates of such transactions. Recognized gains or losses on investment transactions attributable to changes in foreign currency exchange rates are recorded for financial statement purposes as net realized gains and losses on investments. That portion of unrealized gains and losses on investments that results from fluctuations in foreign currency exchange rates is not separately disclosed.
G Use of Estimates — The preparation of the financial statements in conformity with U.S. GAAP requires management to make estimates and assumptions that affect the reported amounts of assets and liabilities at the date of the financial statements and the reported amounts of income and expense during the reporting period. Actual results could differ from those estimates.
H Indemnifications — Under the Trust’s organizational documents, its officers and Trustees may be indemnified against certain liabilities and expenses arising out of the performance of their duties to the Fund. Under Massachusetts law, if certain conditions prevail, shareholders of a Massachusetts business trust (such as the Trust) could be deemed to have personal liability for the obligations of the Trust. However, the Trust’s Declaration of Trust contains an express disclaimer of liability on the part of Fund shareholders and the By-laws provide that the Trust shall assume the defense on behalf of any Fund shareholders. Moreover, the By-laws also provide for indemnification out of Fund property of any shareholder held personally liable solely by reason of being or having been a shareholder for all loss or expense arising from such liability. Additionally, in the normal course of business, the Fund enters into agreements with service providers that may contain indemnification clauses. The Fund’s maximum exposure under these arrangements is unknown as this would involve future claims that may be made against the Fund that have not yet occurred.
2 Distributions to Shareholders and Income Tax Information
It is the present policy of the Fund to make at least one distribution annually (normally in December) of all or substantially all of its net investment income and to distribute annually all or substantially all of its net realized capital gains. Distributions to shareholders are recorded on the ex-dividend date. Distributions are declared separately for each class of shares. Shareholders may reinvest income and capital gain distributions in additional shares of the same class of the Fund at the net asset value as of the ex-dividend date or, at the election of the shareholder, receive distributions in cash. Distributions to shareholders are determined in accordance with income tax regulations, which may differ from U.S. GAAP. As required by U.S. GAAP, only distributions in excess of tax basis earnings and profits are reported in the financial statements as a return of capital. Permanent differences between book and tax accounting relating to distributions are reclassified to paid-in capital. For tax purposes, distributions from short-term capital gains are considered to be from ordinary income.
The tax character of distributions declared for the years ended February 28, 2018 and February 28, 2017 was as follows:
| Year Ended February 28, | ||||||||
| 2018 | 2017 | |||||||
| Distributions declared from: |
||||||||
| Ordinary income |
$ | 459,752 | $ | — | ||||
| Long-term capital gains |
$ | 27,558 | $ | — | ||||
During the year ended February 28, 2018, accumulated net realized gain was decreased by $915,131, accumulated net investment loss was decreased by $67,502 and paid-in capital was increased by $847,629 due to the Fund’s use of equalization accounting and differences between book and tax accounting, primarily for foreign currency gain (loss), net operating losses, return of capital distributions from securities, dividend redesignations and investments in partnerships. Tax equalization accounting allows the Fund to treat as a distribution that portion of redemption proceeds representing a redeeming shareholder’s portion of undistributed taxable income and net capital gains. These reclassifications had no effect on the net assets or net asset value per share of the Fund.
As of February 28, 2018, the components of distributable earnings (accumulated losses) on a tax basis were as follows:
| Undistributed long-term capital gains |
$ | 6,153,517 | ||
| Late year ordinary losses |
$ | (67,281 | ) | |
| Net unrealized appreciation |
$ | 63,402,321 |
The differences between components of distributable earnings (accumulated losses) on a tax basis and the amounts reflected in the Statement of Assets and Liabilities are primarily due to wash sales and investments in partnerships.
| 16 |
Eaton Vance
Focused Growth Opportunities Fund
February 28, 2018
Notes to Financial Statements — continued
At February 28, 2018, the Fund had a late year ordinary loss of $67,281 which it has elected to defer to the following taxable year pursuant to income tax regulations. Late year ordinary losses represent certain specified losses realized in that portion of a taxable year after October 31 that are treated as ordinary for tax purposes plus ordinary losses attributable to that portion of a taxable year after December 31.
The cost and unrealized appreciation (depreciation) of investments of the Fund at February 28, 2018, as determined on a federal income tax basis, were as follows:
| Aggregate cost |
$ | 157,062,506 | ||
| Gross unrealized appreciation |
$ | 64,716,488 | ||
| Gross unrealized depreciation |
(1,314,167 | ) | ||
| Net unrealized appreciation |
$ | 63,402,321 | ||
3 Investment Adviser and Administration Fee and Other Transactions with Affiliates
The investment adviser and administration fee is earned by EVM as compensation for investment advisory and administrative services rendered to the Fund. Pursuant to the investment advisory and administration agreement and subsequent fee reduction agreement between the Fund and EVM effective July 1, 2017, the fee is computed at an annual rate of 0.65% of the Fund’s average daily net assets up to $500 million and is payable monthly. On net assets of $500 million and over, the annual fee is reduced. The fee reduction cannot be terminated or reduced without the approval of a majority vote of the Trustees of the Fund who are not interested persons of EVM or the Fund and by the vote of a majority of shareholders. Prior to July 1, 2017, the fee was computed at an annual rate of 0.75% of the Fund’s average daily net assets up to $500 million and at reduced rates on net assets of $500 million and over. For the year ended February 28, 2018, the investment adviser and administration fee amounted to $1,376,057 or 0.68% of the Fund’s average daily net assets. The Fund invests its cash in Cash Reserves Fund. EVM does not currently receive a fee for advisory services provided to Cash Reserves Fund.
EVM has agreed to reimburse the Fund’s expenses to the extent that total annual operating expenses (relating to ordinary operating expenses only) exceed 1.05%, 1.80% and 0.80% of the Fund’s average daily net assets for Class A, Class C and Class I, respectively, through June 30, 2018. Thereafter, the reimbursement may be changed or terminated at any time. Pursuant to this agreement, EVM was allocated $60,140 of the Fund’s operating expenses for the year ended February 28, 2018.
EVM provides sub-transfer agency and related services to the Fund pursuant to a Sub-Transfer Agency Support Services Agreement. For the year ended February 28, 2018, EVM earned $6,323 from the Fund pursuant to such agreement, which is included in transfer and dividend disbursing agent fees on the Statement of Operations. The Fund was informed that Eaton Vance Distributors, Inc. (EVD), an affiliate of EVM and the Fund’s principal underwriter, received $15,767 as its portion of the sales charge on sales of Class A shares for the year ended February 28, 2018. EVD also received distribution and service fees from Class A and Class C shares (see Note 4) and contingent deferred sales charges (see Note 5).
Trustees and officers of the Fund who are members of EVM’s organization receive remuneration for their services to the Fund out of the investment adviser and administration fee. Trustees of the Fund who are not affiliated with EVM may elect to defer receipt of all or a percentage of their annual fees in accordance with the terms of the Trustees Deferred Compensation Plan. For the year ended February 28, 2018, no significant amounts have been deferred. Certain officers and Trustees of the Fund are officers of EVM.
4 Distribution Plans
The Fund has in effect a distribution plan for Class A shares (Class A Plan) pursuant to Rule 12b-1 under the 1940 Act. Pursuant to the Class A Plan, the Fund pays EVD a distribution and service fee of 0.25% per annum of its average daily net assets attributable to Class A shares for distribution services and facilities provided to the Fund by EVD, as well as for personal services and/or the maintenance of shareholder accounts. Distribution and service fees paid or accrued to EVD for the year ended February 28, 2018 amounted to $80,090 for Class A shares.
The Fund also has in effect a distribution plan for Class C shares (Class C Plan) pursuant to Rule 12b-1 under the 1940 Act. Pursuant to the Class C Plan, the Fund pays EVD amounts equal to 0.75% per annum of its average daily net assets attributable to Class C shares for providing ongoing distribution services and facilities to the Fund. For the year ended February 28, 2018, the Fund paid or accrued to EVD $121,437 for Class C shares.
Pursuant to the Class C Plan, the Fund also makes payments of service fees to EVD, financial intermediaries and other persons in amounts equal to 0.25% per annum of its average daily net assets attributable to that class. Service fees paid or accrued are for personal services and/or the maintenance of shareholder accounts. They are separate and distinct from the sales commissions and distribution fees payable to EVD. Service fees paid or accrued for the year ended February 28, 2018 amounted to $40,479 for Class C shares.
Distribution and service fees are subject to the limitations contained in the Financial Industry Regulatory Authority Rule 2341(d).
| 17 |
Eaton Vance
Focused Growth Opportunities Fund
February 28, 2018
Notes to Financial Statements — continued
5 Contingent Deferred Sales Charges
A contingent deferred sales charge (CDSC) of 1% generally is imposed on redemptions of Class C shares made within one year of purchase. Class A shares may be subject to a 1% CDSC if redeemed within 18 months of purchase (depending on the circumstances of purchase). Generally, the CDSC is based upon the lower of the net asset value at date of redemption or date of purchase. No charge is levied on shares acquired by reinvestment of dividends or capital gain distributions. For the year ended February 28, 2018, the Fund was informed that EVD received approximately $2,000 of CDSCs paid by Class C shareholders and no CDSCs paid by Class A shareholders.
6 Purchases and Sales of Investments
Purchases and sales of investments, other than short-term obligations, aggregated $160,267,474 and $180,243,929, respectively, for the year ended February 28, 2018.
7 Shares of Beneficial Interest
The Fund’s Declaration of Trust permits the Trustees to issue an unlimited number of full and fractional shares of beneficial interest (without par value). Such shares may be issued in a number of different series (such as the Fund) and classes. Transactions in Fund shares were as follows:
| Year Ended February 28, | ||||||||
| Class A | 2018 | 2017 | ||||||
| Sales |
726,951 | 830,405 | ||||||
| Issued to shareholders electing to receive payments of distributions in Fund shares |
612 | — | ||||||
| Redemptions |
(1,395,177 | ) | (956,322 | ) | ||||
| Net decrease |
(667,614 | ) | (125,917 | ) | ||||
| Year Ended February 28, | ||||||||
| Class C | 2018 | 2017 | ||||||
| Sales |
185,195 | 301,086 | ||||||
| Issued to shareholders electing to receive payments of distributions in Fund shares |
— | — | ||||||
| Redemptions |
(203,936 | ) | (232,079 | ) | ||||
| Net increase (decrease) |
(18,741 | ) | 69,007 | |||||
| Year Ended February 28, | ||||||||
| Class I | 2018 | 2017 | ||||||
| Sales |
2,375,788 | 2,796,147 | ||||||
| Issued to shareholders electing to receive payments of distributions in Fund shares |
16,538 | — | ||||||
| Redemptions |
(2,800,585 | ) | (3,799,753 | ) | ||||
| Net decrease |
(408,259 | ) | (1,003,606 | ) | ||||
At February 28, 2018, an Eaton Vance collective investment trust and donor advised and pooled income funds (established and maintained by a public charity) managed by EVM owned in the aggregate 24.1% of the value of the outstanding shares of the Fund.
8 Line of Credit
The Fund participates with other portfolios and funds managed by EVM and its affiliates in a $625 million unsecured line of credit agreement with a group of banks, which is in effect through October 30, 2018. Borrowings are made by the Fund solely to facilitate the handling of unusual and/or unanticipated short-term cash requirements. Interest is charged to the Fund based on its borrowings at an amount above either the Eurodollar rate or Federal Funds rate. In addition, a fee computed at an annual rate of 0.15% on the daily unused portion of the line of credit is allocated among the participating portfolios and
| 18 |
Eaton Vance
Focused Growth Opportunities Fund
February 28, 2018
Notes to Financial Statements — continued
funds at the end of each quarter. Because the line of credit is not available exclusively to the Fund, it may be unable to borrow some or all of its requested amounts at any particular time. The Fund did not have any significant borrowings or allocated fees during the year ended February 28, 2018.
9 Fair Value Measurements
Under generally accepted accounting principles for fair value measurements, a three-tier hierarchy to prioritize the assumptions, referred to as inputs, is used in valuation techniques to measure fair value. The three-tier hierarchy of inputs is summarized in the three broad levels listed below.
| • | Level 1 – quoted prices in active markets for identical investments |
| • | Level 2 – other significant observable inputs (including quoted prices for similar investments, interest rates, prepayment speeds, credit risk, etc.) |
| • | Level 3 – significant unobservable inputs (including a fund’s own assumptions in determining the fair value of investments) |
In cases where the inputs used to measure fair value fall in different levels of the fair value hierarchy, the level disclosed is determined based on the lowest level input that is significant to the fair value measurement in its entirety. The inputs or methodology used for valuing securities are not necessarily an indication of the risk associated with investing in those securities.
At February 28, 2018, the hierarchy of inputs used in valuing the Fund’s investments, which are carried at value, were as follows:
| Asset Description | Level 1 | Level 2 | Level 3 | Total | ||||||||||||
| Common Stocks |
$ | 218,472,336 | * | $ | — | $ | — | $ | 218,472,336 | |||||||
| Short-Term Investments |
— | 1,992,491 | — | 1,992,491 | ||||||||||||
| Total Investments |
$ | 218,472,336 | $ | 1,992,491 | $ | — | $ | 220,464,827 | ||||||||
| * | The level classification by major category of investments is the same as the category presentation in the Portfolio of Investments. |
The Fund held no investments or other financial instruments as of February 28, 2017 whose fair value was determined using Level 3 inputs. At February 28, 2018, there were no investments transferred between Level 1 and Level 2 during the year then ended.
| 19 |
Eaton Vance
Focused Growth Opportunities Fund
February 28, 2018
Report of Independent Registered Public Accounting Firm
To the Trustees of Eaton Vance Growth Trust and Shareholders of Eaton Vance Focused Growth Opportunities Fund:
Opinion on the Financial Statements and Financial Highlights
We have audited the accompanying statement of assets and liabilities of Eaton Vance Focused Growth Opportunities Fund (the “Fund”) (one of the funds constituting Eaton Vance Growth Trust), including the portfolio of investments, as of February 28, 2018, the related statement of operations for the year then ended, the statements of changes in net assets for each of the two years in the period then ended, the financial highlights for each of the five years in the period then ended, and the related notes. In our opinion, the financial statements and financial highlights present fairly, in all material respects, the financial position of the Fund as of February 28, 2018, and the results of its operations for the year then ended, the changes in its net assets for each of the two years in the period then ended, and the financial highlights for each of the five years in the period then ended, in conformity with accounting principles generally accepted in the United States of America.
Basis for Opinion
These financial statements and financial highlights are the responsibility of the Fund’s management. Our responsibility is to express an opinion on the Fund’s financial statements and financial highlights based on our audits. We are a public accounting firm registered with the Public Company Accounting Oversight Board (United States) (PCAOB) and are required to be independent with respect to the Fund in accordance with the U.S. federal securities laws and the applicable rules and regulations of the Securities and Exchange Commission and the PCAOB.
We conducted our audits in accordance with the standards of the PCAOB. Those standards require that we plan and perform the audit to obtain reasonable assurance about whether the financial statements and financial highlights are free of material misstatement, whether due to error or fraud. The Fund is not required to have, nor were we engaged to perform, an audit of its internal control over financial reporting. As part of our audits we are required to obtain an understanding of internal control over financial reporting but not for the purpose of expressing an opinion on the effectiveness of the Fund’s internal control over financial reporting. Accordingly, we express no such opinion.
Our audits included performing procedures to assess the risks of material misstatement of the financial statements and financial highlights, whether due to error or fraud, and performing procedures that respond to those risks. Such procedures included examining, on a test basis, evidence regarding the amounts and disclosures in the financial statements and financial highlights. Our audits also included evaluating the accounting principles used and significant estimates made by management, as well as evaluating the overall presentation of the financial statements and financial highlights. Our procedures included confirmation of securities owned as of February 28, 2018, by correspondence with the custodian and brokers; when replies were not received from brokers, we performed other auditing procedures. We believe that our audits provide a reasonable basis for our opinion.
/s/ Deloitte & Touche LLP
Boston, Massachusetts
April 20, 2018
We have served as the auditor of one or more Eaton Vance investment companies since 1959.
| 20 |
Eaton Vance
Focused Growth Opportunities Fund
February 28, 2018
Federal Tax Information (Unaudited)
The Form 1099-DIV you receive in February 2019 will show the tax status of all distributions paid to your account in calendar year 2018. Shareholders are advised to consult their own tax adviser with respect to the tax consequences of their investment in the Fund. As required by the Internal Revenue Code and/or regulations, shareholders must be notified regarding the status of qualified dividend income for individuals, the dividends received deduction for corporations and capital gains dividends.
Qualified Dividend Income. For the fiscal year ended February 28, 2018, the Fund designates approximately $1,450,846, or up to the maximum amount of such dividends allowable pursuant to the Internal Revenue Code, as qualified dividend income eligible for the reduced tax rate of 15%.
Dividends Received Deduction. Corporate shareholders are generally entitled to take the dividends received deduction on the portion of the Fund’s dividend distribution that qualifies under tax law. For the Fund’s fiscal 2018 ordinary income dividends, 100% qualifies for the corporate dividends received deduction.
Capital Gains Dividends. The Fund hereby designates as a capital gain dividend with respect to the taxable year ended February 28, 2018, $7,106,914 or, if subsequently determined to be different, the net capital gain of such year.
| 21 |
Eaton Vance
Focused Growth Opportunities Fund
February 28, 2018
Management and Organization
Fund Management. The Trustees of Eaton Vance Growth Trust (the Trust) are responsible for the overall management and supervision of the Trust’s affairs. The Trustees and officers of the Trust are listed below. Except as indicated, each individual has held the office shown or other offices in the same company for the last five years. Trustees and officers of the Trust hold indefinite terms of office. The “noninterested Trustees” consist of those Trustees who are not “interested persons” of the Trust, as that term is defined under the 1940 Act. The business address of each Trustee and officer is Two International Place, Boston, Massachusetts 02110. As used below, “EVC” refers to Eaton Vance Corp., “EV” refers to Eaton Vance, Inc., “EVM” refers to Eaton Vance Management, “BMR” refers to Boston Management and Research and “EVD” refers to Eaton Vance Distributors, Inc. EVC and EV are the corporate parent and trustee, respectively, of EVM and BMR. EVD is the Fund’s principal underwriter and a wholly-owned subsidiary of EVC. Each officer affiliated with Eaton Vance may hold a position with other Eaton Vance affiliates that is comparable to his or her position with EVM listed below. Each Trustee oversees 174 portfolios in the Eaton Vance Complex (including all master and feeder funds in a master feeder structure). Each officer serves as an officer of certain other Eaton Vance funds. Each Trustee and officer serves until his or her successor is elected.
| Name and Year of Birth | Position(s) with the |
Trustee Since(1) |
Principal Occupation(s) and Directorships During Past Five Years and Other Relevant Experience | |||
| Interested Trustee | ||||||
| Thomas E. Faust Jr. 1958 |
Trustee | 2007 | Chairman, Chief Executive Officer and President of EVC, Director and President of EV, Chief Executive Officer and President of EVM and BMR, and Director of EVD. Trustee and/or officer of 174 registered investment companies. Mr. Faust is an interested person because of his positions with EVM, BMR, EVD, EVC and EV, which are affiliates of the Trust. Directorships in the Last Five Years.(2) Director of EVC and Hexavest Inc. (investment management firm). | |||
| Noninterested Trustees | ||||||
| Mark R. Fetting 1954 |
Trustee | 2016 | Private investor. Formerly held various positions at Legg Mason, Inc. (investment management firm) (2000-2012), including President, Chief Executive Officer, Director and Chairman (2008-2012), Senior Executive Vice President (2004-2008) and Executive Vice President (2001-2004). Formerly, President of Legg Mason family of funds (2001-2008). Formerly, Division President and Senior Officer of Prudential Financial Group, Inc. and related companies (investment management firm) (1991-2000). Directorships in the Last Five Years. None. | |||
| Cynthia E. Frost 1961 |
Trustee | 2014 | Private investor. Formerly, Chief Investment Officer of Brown University (university endowment) (2000-2012); Formerly, Portfolio Strategist for Duke Management Company (university endowment manager) (1995-2000); Formerly, Managing Director, Cambridge Associates (investment consulting company) (1989-1995); Formerly, Consultant, Bain and Company (management consulting firm) (1987-1989); Formerly, Senior Equity Analyst, BA Investment Management Company (1983-1985). Directorships in the Last Five Years. None. | |||
| George J. Gorman 1952 |
Trustee | 2014 | Principal at George J. Gorman LLC (consulting firm). Formerly, Senior Partner at Ernst & Young LLP (a registered public accounting firm) (1974-2009). Directorships in the Last Five Years. Formerly, Trustee of the BofA Funds Series Trust (11 funds) (2011-2014) and of the Ashmore Funds (9 funds) (2010-2014). | |||
| Valerie A. Mosley 1960 |
Trustee | 2014 | Chairwoman and Chief Executive Officer of Valmo Ventures (a consulting and investment firm). Former Partner and Senior Vice President, Portfolio Manager and Investment Strategist at Wellington Management Company, LLP (investment management firm) (1992-2012). Former Chief Investment Officer, PG Corbin Asset Management (1990-1992). Formerly worked in institutional corporate bond sales at Kidder Peabody (1986-1990). Directorships in the Last Five Years.(2) Director of Dynex Capital, Inc. (mortgage REIT) (since 2013). | |||
| 22 |
Eaton Vance
Focused Growth Opportunities Fund
February 28, 2018
Management and Organization — continued
| Name and Year of Birth | Position(s) with the |
Trustee Since(1) |
Principal Occupation(s) and Directorships During Past Five Years and Other Relevant Experience | |||
| Noninterested Trustees (continued) | ||||||
| William H. Park 1947 |
Chairperson of the Board and Trustee |
2016 (Chairperson) 2003 (Trustee) |
Private investor. Formerly, Consultant (management and transactional) (2012-2014). Formerly, Chief Financial Officer, Aveon Group L.P. (investment management firm) (2010-2011). Formerly, Vice Chairman, Commercial Industrial Finance Corp. (specialty finance company) (2006-2010). Formerly, President and Chief Executive Officer, Prizm Capital Management, LLC (investment management firm) (2002-2005). Formerly, Executive Vice President and Chief Financial Officer, United Asset Management Corporation (investment management firm) (1982-2001). Formerly, Senior Manager, Price Waterhouse (now PricewaterhouseCoopers) (a registered public accounting firm) (1972-1981). Directorships in the Last Five Years.(2) None. | |||
| Helen Frame Peters 1948 |
Trustee | 2008 | Professor of Finance, Carroll School of Management, Boston College. Formerly, Dean, Carroll School of Management, Boston College (2000-2002). Formerly, Chief Investment Officer, Fixed Income, Scudder Kemper Investments (investment management firm) (1998-1999). Formerly, Chief Investment Officer, Equity and Fixed Income, Colonial Management Associates (investment management firm) (1991-1998). Directorships in the Last Five Years.(2) None. | |||
| Susan J. Sutherland 1957 |
Trustee | 2015 | Private investor. Formerly, Associate, Counsel and Partner at Skadden, Arps, Slate, Meagher & Flom LLP (law firm) (1982-2013). Directorships in the Last Five Years. Formerly, Director of Montpelier Re Holdings Ltd. (global provider of customized insurance and reinsurance products) (2013-2015). | |||
| Harriett Tee Taggart 1948 |
Trustee | 2011 | Managing Director, Taggart Associates (a professional practice firm). Formerly, Partner and Senior Vice President, Wellington Management Company, LLP (investment management firm) (1983-2006). Ms. Taggart has apprised the Board of Trustees that she intends to retire as a Trustee of all Eaton Vance Funds in 2018. Directorships in the Last Five Years.(2) Director of Albemarle Corporation (chemicals manufacturer) (since 2007) and The Hanover Group (specialty property and casualty insurance company) (since 2009). | |||
| Scott E. Wennerholm 1959 |
Trustee | 2016 | Trustee at Wheelock College (postsecondary institution) (since 2012). Formerly, Consultant at GF Parish Group (executive recruiting firm) (2016-2017). Formerly, Chief Operating Officer and Executive Vice President at BNY Mellon Asset Management (investment management firm) (2005-2011). Formerly, Chief Operating Officer and Chief Financial Officer at Natixis Global Asset Management (investment management firm) (1997-2004). Formerly, Vice President at Fidelity Investments Institutional Services (investment management firm) (1994-1997). Directorships in the Last Five Years. None | |||
| Name and Year of Birth | Position(s) with the Trust |
Officer Since(3) |
Principal Occupation(s) During Past Five Years | |||
| Principal Officers who are not Trustees | ||||||
| Payson F. Swaffield 1956 |
President | 2003 | Vice President and Chief Income Investment Officer of EVM and BMR. Also Vice President of Calvert Research and Management (“CRM”). | |||
| Maureen A. Gemma 1960 |
Vice President, Secretary and Chief Legal Officer |
2005 | Vice President of EVM and BMR. Also Vice President of CRM. | |||
| James F. Kirchner 1967 |
Treasurer | 2007 | Vice President of EVM and BMR. Also Vice President of CRM. | |||
| 23 |
Eaton Vance
Focused Growth Opportunities Fund
February 28, 2018
Management and Organization — continued
| Name and Year of Birth | Position(s) with the Trust |
Officer Since(3) |
Principal Occupation(s) During Past Five Years | |||
| Principal Officers who are not Trustees (continued) | ||||||
| Richard F. Froio 1968 |
Chief Compliance Officer |
2017 | Vice President of EVM and BMR since 2017. Formerly Deputy Chief Compliance Officer (Adviser/Funds) and Chief Compliance Officer (Distribution) at PIMCO (2012-2017) and Managing Director at BlackRock/Barclays Global Investors (2009-2012). | |||
| (1) | Year first appointed to serve as Trustee for a fund in the Eaton Vance family of funds. Each Trustee has served continuously since appointment unless indicated otherwise. |
| (2) | During their respective tenures, the Trustees (except for Mmes. Frost and Sutherland and Messrs. Fetting, Gorman and Wennerholm) also served as Board members of one or more of the following funds (which operated in the years noted): eUnitsTM 2 Year U.S. Market Participation Trust: Upside to Cap / Buffered Downside (launched in 2012 and terminated in 2014); and eUnitsTM 2 Year U.S. Market Participation Trust II: Upside to Cap / Buffered Downside (launched in 2012 and terminated in 2014). However, Ms. Mosley did not serve as a Board member of eUnitsTM 2 Year U.S. Market Participation Trust: Upside to Cap / Buffered Downside (launched in 2012 and terminated in 2014). |
| (3) | Year first elected to serve as officer of a fund in the Eaton Vance family of funds when the officer has served continuously. Otherwise, year of most recent election as an officer of a fund in the Eaton Vance family of funds. Titles may have changed since initial election. |
The SAI for the Fund includes additional information about the Trustees and officers of the Fund and can be obtained without charge on Eaton Vance’s website at www.eatonvance.com or by calling 1-800-262-1122.
| 24 |
Eaton Vance Funds
IMPORTANT NOTICES
Privacy. The Eaton Vance organization is committed to ensuring your financial privacy. Each of the financial institutions identified below has in effect the following policy (“Privacy Policy”) with respect to nonpublic personal information about its customers:
| • | Only such information received from you, through application forms or otherwise, and information about your Eaton Vance fund transactions will be collected. This may include information such as name, address, social security number, tax status, account balances and transactions. |
| • | None of such information about you (or former customers) will be disclosed to anyone, except as permitted by law (which includes disclosure to employees necessary to service your account). In the normal course of servicing a customer’s account, Eaton Vance may share information with unaffiliated third parties that perform various required services such as transfer agents, custodians and broker-dealers. |
| • | Policies and procedures (including physical, electronic and procedural safeguards) are in place that are designed to protect the confidentiality of such information. |
| • | We reserve the right to change our Privacy Policy at any time upon proper notification to you. Customers may want to review our Privacy Policy periodically for changes by accessing the link on our homepage: www.eatonvance.com. |
Our pledge of privacy applies to the following entities within the Eaton Vance organization: the Eaton Vance Family of Funds, Eaton Vance Management, Eaton Vance Investment Counsel, Eaton Vance Distributors, Inc., Eaton Vance Trust Company, Eaton Vance Management (International) Limited, Eaton Vance Advisers International Ltd., Eaton Vance Management’s Real Estate Investment Group and Boston Management and Research. In addition, our Privacy Policy applies only to those Eaton Vance customers who are individuals and who have a direct relationship with us. If a customer’s account (i.e., fund shares) is held in the name of a third-party financial advisor/broker-dealer, it is likely that only such advisor’s privacy policies apply to the customer. This notice supersedes all previously issued privacy disclosures. For more information about Eaton Vance’s Privacy Policy, please call 1-800-262-1122.
Delivery of Shareholder Documents. The Securities and Exchange Commission (SEC) permits funds to deliver only one copy of shareholder documents, including prospectuses, proxy statements and shareholder reports, to fund investors with multiple accounts at the same residential or post office box address. This practice is often called “householding” and it helps eliminate duplicate mailings to shareholders. Eaton Vance, or your financial advisor, may household the mailing of your documents indefinitely unless you instruct Eaton Vance, or your financial advisor, otherwise. If you would prefer that your Eaton Vance documents not be householded, please contact Eaton Vance at 1-800-262-1122, or contact your financial advisor. Your instructions that householding not apply to delivery of your Eaton Vance documents will typically be effective within 30 days of receipt by Eaton Vance or your financial advisor.
Portfolio Holdings. Each Eaton Vance Fund and its underlying Portfolio(s) (if applicable) will file a schedule of portfolio holdings on Form N-Q with the SEC for the first and third quarters of each fiscal year. The Form N-Q will be available on the Eaton Vance website at www.eatonvance.com, by calling Eaton Vance at 1-800-262-1122 or in the EDGAR database on the SEC’s website at www.sec.gov. Form N-Q may also be reviewed and copied at the SEC’s public reference room in Washington, D.C. (call 1-800-732-0330 for information on the operation of the public reference room).
Proxy Voting. From time to time, funds are required to vote proxies related to the securities held by the funds. The Eaton Vance Funds or their underlying Portfolios (if applicable) vote proxies according to a set of policies and procedures approved by the Funds’ and Portfolios’ Boards. You may obtain a description of these policies and procedures and information on how the Funds or Portfolios voted proxies relating to portfolio securities during the most recent 12-month period ended June 30, without charge, upon request, by calling 1-800-262-1122 and by accessing the SEC’s website at www.sec.gov.
| 25 |
This Page Intentionally Left Blank
This Page Intentionally Left Blank
This Page Intentionally Left Blank
| * | FINRA BrokerCheck. Investors may check the background of their Investment Professional by contacting the Financial Industry Regulatory Authority (FINRA). FINRA BrokerCheck is a free tool to help investors check the professional background of current and former FINRA-registered securities firms and brokers. FINRA BrokerCheck is available by calling 1-800-289-9999 and at www.FINRA.org. The FINRA BrokerCheck brochure describing this program is available to investors at www.FINRA.org. |
5300 2.28.18

Eaton Vance
Focused Value Opportunities Fund
Annual Report
February 28, 2018

Commodity Futures Trading Commission Registration. Effective December 31, 2012, the Commodity Futures Trading Commission (“CFTC”) adopted certain regulatory changes that subject registered investment companies and advisers to regulation by the CFTC if a fund invests more than a prescribed level of its assets in certain CFTC-regulated instruments (including futures, certain options and swap agreements) or markets itself as providing investment exposure to such instruments. The Fund has claimed an exclusion from the definition of the term “commodity pool operator” under the Commodity Exchange Act. Accordingly, neither the Fund nor the adviser with respect to the operation of the Fund is subject to CFTC regulation. Because of its management of other strategies, the Fund’s adviser is registered with the CFTC as a commodity pool operator and a commodity trading advisor.
Fund shares are not insured by the FDIC and are not deposits or other obligations of, or guaranteed by, any depository institution. Shares are subject to investment risks, including possible loss of principal invested.
This report must be preceded or accompanied by a current summary prospectus or prospectus. Before investing, investors should consider carefully the investment objective, risks, and charges and expenses of a mutual fund. This and other important information is contained in the summary prospectus and prospectus, which can be obtained from a financial advisor. Prospective investors should read the prospectus carefully before investing. For further information, please call 1-800-262-1122.
Annual Report February 28, 2018
Eaton Vance
Focused Value Opportunities Fund
Table of Contents
| Management’s Discussion of Fund Performance |
2 | |||
| Performance |
3 | |||
| Fund Profile |
4 | |||
| Endnotes and Additional Disclosures |
5 | |||
| Fund Expenses |
6 | |||
| Financial Statements |
7 | |||
| Report of Independent Registered Public Accounting Firm |
20 | |||
| Federal Tax Information |
21 | |||
| Management and Organization |
22 | |||
| Important Notices |
24 | |||
Eaton Vance
Focused Value Opportunities Fund
February 28, 2018
Management’s Discussion of Fund Performance1
See Endnotes and Additional Disclosures in this report.
Past performance is no guarantee of future results. Returns are historical and are calculated by determining the percentage change in net asset value (NAV) or offering price (as applicable) with all distributions reinvested. Investment return and principal value will fluctuate so that shares, when redeemed, may be worth more or less than their original cost. Performance less than or equal to one year is cumulative. Performance is for the stated time period only; due to market volatility, the Fund’s current performance may be lower or higher than quoted. Returns are before taxes unless otherwise noted. For performance as of the most recent month-end, please refer to eatonvance.com.
| 2 |
Eaton Vance
Focused Value Opportunities Fund
February 28, 2018
Performance2,3
Portfolio Managers Edward J. Perkin, CFA and Aaron S. Dunn, CFA
| % Average Annual Total Returns | Class Inception Date |
Performance Inception Date |
One Year | Five Years | Since Inception |
|||||||||||||||
| Class A at NAV |
03/07/2011 | 03/07/2011 | 14.71 | % | 12.04 | % | 10.65 | % | ||||||||||||
| Class A with 5.75% Maximum Sales Charge |
— | — | 8.14 | 10.72 | 9.72 | |||||||||||||||
| Class C at NAV |
03/07/2011 | 03/07/2011 | 13.86 | 11.20 | 9.82 | |||||||||||||||
| Class C with 1% Maximum Sales Charge |
— | — | 12.86 | 11.20 | 9.82 | |||||||||||||||
| Class I at NAV |
03/07/2011 | 03/07/2011 | 14.99 | 12.32 | 10.93 | |||||||||||||||
| Russell 1000® Value Index |
— | — | 7.75 | % | 12.04 | % | 11.58 | % | ||||||||||||
| % Total Annual Operating Expense Ratios4 | Class A | Class C | Class I | |||||||||||||||||
| Gross |
1.26 | % | 2.01 | % | 1.01 | % | ||||||||||||||
| Net |
1.05 | 1.80 | 0.80 | |||||||||||||||||
Growth of $10,000
This graph shows the change in value of a hypothetical investment of $10,000 in Class A of the Fund for the period indicated. For comparison, the same investment is shown in the indicated index.
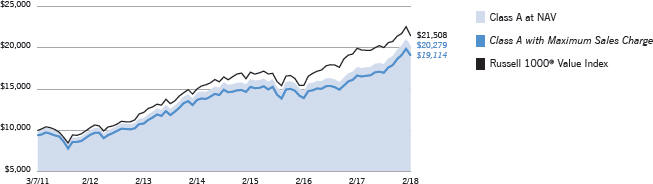
| Growth of Investment | Amount Invested | Period Beginning | At NAV | With Maximum Sales Charge | ||||||||||||
| Class C |
$ | 10,000 | 03/07/2011 | $ | 19,239 | N.A. | ||||||||||
| Class I |
$ | 250,000 | 03/07/2011 | $ | 515,875 | N.A. | ||||||||||
See Endnotes and Additional Disclosures in this report.
Past performance is no guarantee of future results. Returns are historical and are calculated by determining the percentage change in net asset value (NAV) or offering price (as applicable) with all distributions reinvested. Investment return and principal value will fluctuate so that shares, when redeemed, may be worth more or less than their original cost. Performance less than or equal to one year is cumulative. Performance is for the stated time period only; due to market volatility, the Fund’s current performance may be lower or higher than quoted. Returns are before taxes unless otherwise noted. For performance as of the most recent month-end, please refer to eatonvance.com.
| 3 |
Eaton Vance
Focused Value Opportunities Fund
February 28, 2018
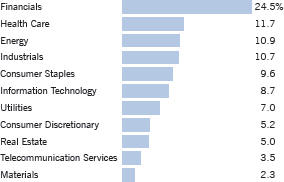
Fund Profile
See Endnotes and Additional Disclosures in this report.
| 4 |
Eaton Vance
Focused Value Opportunities Fund
February 28, 2018
Endnotes and Additional Disclosures
| 5 |
Eaton Vance
Focused Value Opportunities Fund
February 28, 2018
Fund Expenses
Example: As a Fund shareholder, you incur two types of costs: (1) transaction costs, including sales charges (loads) on purchases and redemption fees (if applicable); and (2) ongoing costs, including management fees; distribution and/or service fees; and other Fund expenses. This Example is intended to help you understand your ongoing costs (in dollars) of Fund investing and to compare these costs with the ongoing costs of investing in other mutual funds. The Example is based on an investment of $1,000 invested at the beginning of the period and held for the entire period (September 1, 2017 – February 28, 2018).
Actual Expenses: The first section of the table below provides information about actual account values and actual expenses. You may use the information in this section, together with the amount you invested, to estimate the expenses that you paid over the period. Simply divide your account value by $1,000 (for example, an $8,600 account value divided by $1,000 = 8.6), then multiply the result by the number in the first section under the heading entitled “Expenses Paid During Period” to estimate the expenses you paid on your account during this period.
Hypothetical Example for Comparison Purposes: The second section of the table below provides information about hypothetical account values and hypothetical expenses based on the actual Fund expense ratio and an assumed rate of return of 5% per year (before expenses), which is not the actual Fund return. The hypothetical account values and expenses may not be used to estimate the actual ending account balance or expenses you paid for the period. You may use this information to compare the ongoing costs of investing in your Fund and other funds. To do so, compare this 5% hypothetical example with the 5% hypothetical examples that appear in the shareholder reports of the other funds.
Please note that the expenses shown in the table are meant to highlight your ongoing costs only and do not reflect any transactional costs, such as sales charges (loads) or redemption fees (if applicable). Therefore, the second section of the table is useful in comparing ongoing costs only, and will not help you determine the relative total costs of owning different funds. In addition, if these transactional costs were included, your costs would be higher.
| Beginning Account Value (9/1/17) |
Ending Account Value (2/28/18) |
Expenses Paid During Period* (9/1/17 – 2/28/18) |
Annualized Expense Ratio |
|||||||||||||
| Actual |
||||||||||||||||
| Class A |
$ | 1,000.00 | $ | 1,124.30 | $ | 5.53 | ** | 1.05 | % | |||||||
| Class C |
$ | 1,000.00 | $ | 1,119.70 | $ | 9.46 | ** | 1.80 | % | |||||||
| Class I |
$ | 1,000.00 | $ | 1,125.50 | $ | 4.22 | ** | 0.80 | % | |||||||
| Hypothetical |
||||||||||||||||
| (5% return per year before expenses) |
||||||||||||||||
| Class A |
$ | 1,000.00 | $ | 1,019.60 | $ | 5.26 | ** | 1.05 | % | |||||||
| Class C |
$ | 1,000.00 | $ | 1,015.90 | $ | 9.00 | ** | 1.80 | % | |||||||
| Class I |
$ | 1,000.00 | $ | 1,020.80 | $ | 4.01 | ** | 0.80 | % | |||||||
| * | Expenses are equal to the Fund’s annualized expense ratio for the indicated Class, multiplied by the average account value over the period, multiplied by 181/365 (to reflect the one-half year period). The Example assumes that the $1,000 was invested at the net asset value per share determined at the close of business on August 31, 2017. |
| ** | Absent an allocation of certain expenses to an affiliate, expenses would be higher. |
| 6 |
Eaton Vance
Focused Value Opportunities Fund
February 28, 2018
Portfolio of Investments
| 7 | See Notes to Financial Statements. |
Eaton Vance
Focused Value Opportunities Fund
February 28, 2018
Portfolio of Investments — continued
| 8 | See Notes to Financial Statements. |
Eaton Vance
Focused Value Opportunities Fund
February 28, 2018
Statement of Assets and Liabilities
| Assets | February 28, 2018 | |||
| Unaffiliated investments, at value (identified cost, $62,420,488) |
$ | 69,885,021 | ||
| Affiliated investment, at value (identified cost, $539,908) |
539,908 | |||
| Dividends receivable |
148,016 | |||
| Dividends receivable from affiliated investment |
257 | |||
| Receivable for investments sold |
385,846 | |||
| Receivable for Fund shares sold |
49,801 | |||
| Tax reclaims receivable |
9,173 | |||
| Receivable from affiliate |
4,956 | |||
| Total assets |
$ | 71,022,978 | ||
| Liabilities | ||||
| Payable for investments purchased |
$ | 360,432 | ||
| Payable for Fund shares redeemed |
22,020 | |||
| Payable to affiliates: |
||||
| Investment adviser and administration fee |
40,706 | |||
| Distribution and service fees |
1,732 | |||
| Accrued expenses |
66,065 | |||
| Total liabilities |
$ | 490,955 | ||
| Net Assets |
$ | 70,532,023 | ||
| Sources of Net Assets | ||||
| Paid-in capital |
$ | 57,352,442 | ||
| Accumulated undistributed net investment income |
211,484 | |||
| Accumulated net realized gain |
5,503,654 | |||
| Net unrealized appreciation |
7,464,443 | |||
| Total |
$ | 70,532,023 | ||
| Class A Shares | ||||
| Net Assets |
$ | 3,750,897 | ||
| Shares Outstanding |
225,674 | |||
| Net Asset Value and Redemption Price Per Share |
||||
| (net assets ÷ shares of beneficial interest outstanding) |
$ | 16.62 | ||
| Maximum Offering Price Per Share |
||||
| (100 ÷ 94.25 of net asset value per share) |
$ | 17.63 | ||
| Class C Shares | ||||
| Net Assets |
$ | 1,166,284 | ||
| Shares Outstanding |
71,237 | |||
| Net Asset Value and Offering Price Per Share* |
||||
| (net assets ÷ shares of beneficial interest outstanding) |
$ | 16.37 | ||
| Class I Shares | ||||
| Net Assets |
$ | 65,614,842 | ||
| Shares Outstanding |
3,941,381 | |||
| Net Asset Value, Offering Price and Redemption Price Per Share |
||||
| (net assets ÷ shares of beneficial interest outstanding) |
$ | 16.65 | ||
On sales of $50,000 or more, the offering price of Class A shares is reduced.
| * | Redemption price per share is equal to the net asset value less any applicable contingent deferred sales charge. |
| 9 | See Notes to Financial Statements. |
Eaton Vance
Focused Value Opportunities Fund
February 28, 2018
Statement of Operations
| Investment Income | Year Ended February 28, 2018 |
|||
| Dividends |
$ | 1,394,871 | ||
| Dividends from affiliated investment |
13,521 | |||
| Total investment income |
$ | 1,408,392 | ||
| Expenses | ||||
| Investment adviser and administration fee |
$ | 473,170 | ||
| Distribution and service fees |
||||
| Class A |
9,380 | |||
| Class C |
12,186 | |||
| Trustees’ fees and expenses |
3,505 | |||
| Custodian fee |
35,771 | |||
| Transfer and dividend disbursing agent fees |
13,076 | |||
| Legal and accounting services |
38,565 | |||
| Printing and postage |
10,791 | |||
| Registration fees |
45,115 | |||
| Miscellaneous |
15,002 | |||
| Total expenses |
$ | 656,561 | ||
| Deduct — |
||||
| Allocation of expenses to affiliate |
$ | 130,286 | ||
| Total expense reductions |
$ | 130,286 | ||
| Net expenses |
$ | 526,275 | ||
| Net investment income |
$ | 882,117 | ||
| Realized and Unrealized Gain (Loss) | ||||
| Net realized gain (loss) — |
||||
| Investment transactions |
$ | 8,378,955 | ||
| Investment transactions — affiliated investment |
241 | |||
| Foreign currency transactions |
2,430 | |||
| Net realized gain |
$ | 8,381,626 | ||
| Change in unrealized appreciation (depreciation) — |
||||
| Investments |
$ | (537,465 | ) | |
| Investments — affiliated investment |
(300 | ) | ||
| Foreign currency |
547 | |||
| Net change in unrealized appreciation (depreciation) |
$ | (537,218 | ) | |
| Net realized and unrealized gain |
$ | 7,844,408 | ||
| Net increase in net assets from operations |
$ | 8,726,525 | ||
| 10 | See Notes to Financial Statements. |
Eaton Vance
Focused Value Opportunities Fund
February 28, 2018
Statements of Changes in Net Assets
| Year Ended February 28, | ||||||||
| Increase (Decrease) in Net Assets | 2018 | 2017 | ||||||
| From operations — |
||||||||
| Net investment income |
$ | 882,117 | $ | 1,406,909 | ||||
| Net realized gain |
8,381,626 | 3,199,849 | ||||||
| Net change in unrealized appreciation (depreciation) |
(537,218 | ) | 6,826,446 | |||||
| Net increase in net assets from operations |
$ | 8,726,525 | $ | 11,433,204 | ||||
| Distributions to shareholders — |
||||||||
| From net investment income |
||||||||
| Class A |
$ | (33,723 | ) | $ | (53,942 | ) | ||
| Class C |
(4,320 | ) | (8,194 | ) | ||||
| Class I |
(727,946 | ) | (835,494 | ) | ||||
| From net realized gain |
||||||||
| Class A |
(84,018 | ) | — | |||||
| Class C |
(30,137 | ) | — | |||||
| Class I |
(1,441,603 | ) | — | |||||
| Total distributions to shareholders |
$ | (2,321,747 | ) | $ | (897,630 | ) | ||
| Transactions in shares of beneficial interest — |
||||||||
| Proceeds from sale of shares |
||||||||
| Class A |
$ | 600,440 | $ | 1,658,157 | ||||
| Class C |
339,959 | 658,589 | ||||||
| Class I |
17,220,873 | 15,078,617 | ||||||
| Net asset value of shares issued to shareholders in payment of distributions declared |
||||||||
| Class A |
117,741 | 53,942 | ||||||
| Class C |
34,457 | 8,121 | ||||||
| Class I |
1,800,727 | 82,205 | ||||||
| Cost of shares redeemed |
||||||||
| Class A |
(1,790,801 | ) | (2,520,633 | ) | ||||
| Class C |
(519,948 | ) | (268,235 | ) | ||||
| Class I |
(21,064,044 | ) | (19,689,015 | ) | ||||
| Net decrease in net assets from Fund share transactions |
$ | (3,260,596 | ) | $ | (4,938,252 | ) | ||
| Net increase in net assets |
$ | 3,144,182 | $ | 5,597,322 | ||||
| Net Assets | ||||||||
| At beginning of year |
$ | 67,387,841 | $ | 61,790,519 | ||||
| At end of year |
$ | 70,532,023 | $ | 67,387,841 | ||||
| Accumulated undistributed net investment income included in net assets |
||||||||
| At end of year |
$ | 211,484 | $ | 92,504 | ||||
| 11 | See Notes to Financial Statements. |
Eaton Vance
Focused Value Opportunities Fund
February 28, 2018
Financial Highlights
| Class A | ||||||||||||||||||||
| Year Ended February 28, | Year Ended February 29, 2016 |
Year Ended February 28, | ||||||||||||||||||
| 2018 | 2017 | 2015 | 2014 | |||||||||||||||||
| Net asset value — Beginning of year |
$ | 14.980 | $ | 12.670 | $ | 14.450 | $ | 13.820 | $ | 11.210 | ||||||||||
| Income (Loss) From Operations | ||||||||||||||||||||
| Net investment income(1) |
$ | 0.185 | $ | 0.277 | (2) | $ | 0.209 | $ | 0.149 | $ | 0.114 | |||||||||
| Net realized and unrealized gain (loss) |
2.005 | 2.207 | (1.446 | ) | 1.407 | 2.849 | ||||||||||||||
| Total income (loss) from operations |
$ | 2.190 | $ | 2.484 | $ | (1.237 | ) | $ | 1.556 | $ | 2.963 | |||||||||
| Less Distributions | ||||||||||||||||||||
| From net investment income |
$ | (0.156 | ) | $ | (0.174 | ) | $ | (0.187 | ) | $ | (0.068 | ) | $ | (0.083 | ) | |||||
| From net realized gain |
(0.394 | ) | — | (0.356 | ) | (0.858 | ) | (0.270 | ) | |||||||||||
| Total distributions |
$ | (0.550 | ) | $ | (0.174 | ) | $ | (0.543 | ) | $ | (0.926 | ) | $ | (0.353 | ) | |||||
| Net asset value — End of year |
$ | 16.620 | $ | 14.980 | $ | 12.670 | $ | 14.450 | $ | 13.820 | ||||||||||
| Total Return(3)(4) |
14.71 | % | 19.67 | % | (8.89 | )% | 11.53 | % | 26.59 | % | ||||||||||
| Ratios/Supplemental Data | ||||||||||||||||||||
| Net assets, end of year (000’s omitted) |
$ | 3,751 | $ | 4,436 | $ | 4,477 | $ | 1,711 | $ | 1,827 | ||||||||||
| Ratios (as a percentage of average daily net assets): |
||||||||||||||||||||
| Expenses(4) |
1.05 | % | 1.05 | % | 1.05 | % | 1.13 | % | 1.25 | % | ||||||||||
| Net investment income |
1.18 | % | 1.99 | %(2) | 1.54 | % | 1.04 | % | 0.89 | % | ||||||||||
| Portfolio Turnover |
99 | % | 87 | % | 90 | % | 119 | % | 44 | % | ||||||||||
| (1) | Computed using average shares outstanding. |
| (2) | Net investment income per share includes special dividends which amounted to $0.071 per share for the year ended February 28, 2017. Excluding special dividends, the ratio of net investment income to average daily net assets would have been 1.48% for the year ended February 28, 2017. |
| (3) | Returns are historical and are calculated by determining the percentage change in net asset value with all distributions reinvested and do not reflect the effect of sales charges. |
| (4) | The investment adviser and administrator reimbursed certain operating expenses (equal to 0.21%, 0.21%, 0.25%, 0.31% and 0.45% of average daily net assets for the years ended February 28, 2018, 2017, the year ended February 29, 2016, and the years ended February 28, 2015 and 2014, respectively). Absent this reimbursement, total return would be lower. |
| 12 | See Notes to Financial Statements. |
Eaton Vance
Focused Value Opportunities Fund
February 28, 2018
Financial Highlights — continued
| Class C | ||||||||||||||||||||
| Year Ended February 28, | Year Ended February 29, 2016 |
Year Ended February 28, | ||||||||||||||||||
| 2018 | 2017 | 2015 | 2014 | |||||||||||||||||
| Net asset value — Beginning of year |
$ | 14.790 | $ | 12.560 | $ | 14.310 | $ | 13.720 | $ | 11.190 | ||||||||||
| Income (Loss) From Operations | ||||||||||||||||||||
| Net investment income(1) |
$ | 0.069 | $ | 0.166 | (2) | $ | 0.097 | $ | 0.044 | $ | 0.025 | |||||||||
| Net realized and unrealized gain (loss) |
1.962 | 2.186 | (1.414 | ) | 1.403 | 2.813 | ||||||||||||||
| Total income (loss) from operations |
$ | 2.031 | $ | 2.352 | $ | (1.317 | ) | $ | 1.447 | $ | 2.838 | |||||||||
| Less Distributions | ||||||||||||||||||||
| From net investment income |
$ | (0.057 | ) | $ | (0.122 | ) | $ | (0.085 | ) | $ | (0.029 | ) | $ | (0.038 | ) | |||||
| From net realized gain |
(0.394 | ) | — | (0.348 | ) | (0.828 | ) | (0.270 | ) | |||||||||||
| Total distributions |
$ | (0.451 | ) | $ | (0.122 | ) | $ | (0.433 | ) | $ | (0.857 | ) | $ | (0.308 | ) | |||||
| Net asset value — End of year |
$ | 16.370 | $ | 14.790 | $ | 12.560 | $ | 14.310 | $ | 13.720 | ||||||||||
| Total Return(3)(4) |
13.86 | % | 18.69 | % | (9.49 | )% | 10.78 | % | 25.49 | % | ||||||||||
| Ratios/Supplemental Data | ||||||||||||||||||||
| Net assets, end of year (000’s omitted) |
$ | 1,166 | $ | 1,182 | $ | 646 | $ | 539 | $ | 372 | ||||||||||
| Ratios (as a percentage of average daily net assets): |
||||||||||||||||||||
| Expenses(4) |
1.80 | % | 1.80 | % | 1.80 | % | 1.86 | % | 2.00 | % | ||||||||||
| Net investment income |
0.44 | % | 1.20 | %(2) | 0.73 | % | 0.31 | % | 0.19 | % | ||||||||||
| Portfolio Turnover |
99 | % | 87 | % | 90 | % | 119 | % | 44 | % | ||||||||||
| (1) | Computed using average shares outstanding. |
| (2) | Net investment income per share includes special dividends which amounted to $0.065 per share for the year ended February 28, 2017. Excluding special dividends, the ratio of net investment income to average daily net assets would have been 0.73% for the year ended February 28, 2017. |
| (3) | Returns are historical and are calculated by determining the percentage change in net asset value with all distributions reinvested and do not reflect the effect of sales charges. |
| (4) | The investment adviser and administrator reimbursed certain operating expenses (equal to 0.21%, 0.21%, 0.25%, 0.31% and 0.45% of average daily net assets for the years ended February 28, 2018, 2017, the year ended February 29, 2016, and the years ended February 28, 2015 and 2014, respectively). Absent this reimbursement, total return would be lower. |
| 13 | See Notes to Financial Statements. |
Eaton Vance
Focused Value Opportunities Fund
February 28, 2018
Financial Highlights — continued
| Class I | ||||||||||||||||||||
| Year Ended February 28, | Year Ended February 29, 2016 |
Year Ended February 28, | ||||||||||||||||||
| 2018 | 2017 | 2015 | 2014 | |||||||||||||||||
| Net asset value — Beginning of year |
$ | 15.010 | $ | 12.700 | $ | 14.460 | $ | 13.830 | $ | 11.220 | ||||||||||
| Income (Loss) From Operations | ||||||||||||||||||||
| Net investment income(1) |
$ | 0.226 | $ | 0.313 | (2) | $ | 0.247 | $ | 0.194 | $ | 0.149 | |||||||||
| Net realized and unrealized gain (loss) |
2.009 | 2.208 | (1.443 | ) | 1.406 | 2.844 | ||||||||||||||
| Total income (loss) from operations |
$ | 2.235 | $ | 2.521 | $ | (1.196 | ) | $ | 1.600 | $ | 2.993 | |||||||||
| Less Distributions | ||||||||||||||||||||
| From net investment income |
$ | (0.201 | ) | $ | (0.211 | ) | $ | (0.208 | ) | $ | (0.112 | ) | $ | (0.113 | ) | |||||
| From net realized gain |
(0.394 | ) | — | (0.356 | ) | (0.858 | ) | (0.270 | ) | |||||||||||
| Total distributions |
$ | (0.595 | ) | $ | (0.211 | ) | $ | (0.564 | ) | $ | (0.970 | ) | $ | (0.383 | ) | |||||
| Net asset value — End of year |
$ | 16.650 | $ | 15.010 | $ | 12.700 | $ | 14.460 | $ | 13.830 | ||||||||||
| Total Return(3)(4) |
14.99 | % | 19.93 | % | (8.60 | )% | 11.86 | % | 26.85 | % | ||||||||||
| Ratios/Supplemental Data | ||||||||||||||||||||
| Net assets, end of year (000’s omitted) |
$ | 65,615 | $ | 61,770 | $ | 56,668 | $ | 49,511 | $ | 19,756 | ||||||||||
| Ratios (as a percentage of average daily net assets): |
||||||||||||||||||||
| Expenses(4) |
0.80 | % | 0.80 | % | 0.80 | % | 0.85 | % | 1.00 | % | ||||||||||
| Net investment income |
1.43 | % | 2.25 | %(2) | 1.81 | % | 1.35 | % | 1.17 | % | ||||||||||
| Portfolio Turnover |
99 | % | 87 | % | 90 | % | 119 | % | 44 | % | ||||||||||
| (1) | Computed using average shares outstanding. |
| (2) | Net investment income per share includes special dividends which amounted to $0.071 per share for the year ended February 28, 2017. Excluding special dividends, the ratio of net investment income to average daily net assets would have been 1.74% for the year ended February 28, 2017. |
| (3) | Returns are historical and are calculated by determining the percentage change in net asset value with all distributions reinvested. |
| (4) | The investment adviser and administrator reimbursed certain operating expenses (equal to 0.21%, 0.21%, 0.25%, 0.31% and 0.45% of average daily net assets for the years ended February 28, 2018, 2017, the year ended February 29, 2016, and the years ended February 28, 2015 and 2014, respectively). Absent this reimbursement, total return would be lower. |
| 14 | See Notes to Financial Statements. |
Eaton Vance
Focused Value Opportunities Fund
February 28, 2018
Notes to Financial Statements
1 Significant Accounting Policies
Eaton Vance Focused Value Opportunities Fund (the Fund) is a diversified series of Eaton Vance Growth Trust (the Trust). The Trust is a Massachusetts business trust registered under the Investment Company Act of 1940, as amended (the 1940 Act), as an open-end management investment company. The Fund’s investment objective is total return. The Fund offers three classes of shares. Class A shares are generally sold subject to a sales charge imposed at time of purchase. Class C shares are sold at net asset value and are generally subject to a contingent deferred sales charge (see Note 5). Class I shares are sold at net asset value and are not subject to a sales charge. Each class represents a pro-rata interest in the Fund, but votes separately on class-specific matters and (as noted below) is subject to different expenses. Realized and unrealized gains and losses and net investment income and losses, other than class-specific expenses, are allocated daily to each class of shares based on the relative net assets of each class to the total net assets of the Fund. Each class of shares differs in its distribution plan and certain other class-specific expenses.
The following is a summary of significant accounting policies of the Fund. The policies are in conformity with accounting principles generally accepted in the United States of America (U.S. GAAP). The Fund is an investment company and follows accounting and reporting guidance in the Financial Accounting Standards Board (FASB) Accounting Standards Codification Topic 946.
A Investment Valuation — The following methodologies are used to determine the market value or fair value of investments.
Equity Securities. Equity securities listed on a U.S. securities exchange generally are valued at the last sale or closing price on the day of valuation or, if no sales took place on such date, at the mean between the closing bid and asked prices therefore on the exchange where such securities are principally traded. Equity securities listed on the NASDAQ Global or Global Select Market generally are valued at the NASDAQ official closing price. Unlisted or listed securities for which closing sales prices or closing quotations are not available are valued at the mean between the latest available bid and asked prices.
Foreign Securities and Currencies. Foreign securities and currencies are valued in U.S. dollars, based on foreign currency exchange rate quotations supplied by a third party pricing service. The pricing service uses a proprietary model to determine the exchange rate. Inputs to the model include reported trades and implied bid/ask spreads. The daily valuation of exchange-traded foreign securities generally is determined as of the close of trading on the principal exchange on which such securities trade. Events occurring after the close of trading on foreign exchanges may result in adjustments to the valuation of foreign securities to more accurately reflect their fair value as of the close of regular trading on the New York Stock Exchange. When valuing foreign equity securities that meet certain criteria, the Fund’s Trustees have approved the use of a fair value service that values such securities to reflect market trading that occurs after the close of the applicable foreign markets of comparable securities or other instruments that have a strong correlation to the fair-valued securities.
Affiliated Fund. The Fund may invest in Eaton Vance Cash Reserves Fund, LLC (Cash Reserves Fund), an affiliated investment company managed by Eaton Vance Management (EVM). While Cash Reserves Fund is not a registered money market mutual fund, it conducts all of its investment activities in accordance with the requirements of Rule 2a-7 under the 1940 Act. Investments in Cash Reserves Fund are valued at the closing net asset value per unit on the valuation day. Cash Reserves Fund generally values its investment securities based on available market quotations provided by a third party pricing service.
Fair Valuation. Investments for which valuations or market quotations are not readily available or are deemed unreliable are valued at fair value using methods determined in good faith by or at the direction of the Trustees of the Fund in a manner that fairly reflects the security’s value, or the amount that the Fund might reasonably expect to receive for the security upon its current sale in the ordinary course. Each such determination is based on a consideration of relevant factors, which are likely to vary from one pricing context to another. These factors may include, but are not limited to, the type of security, the existence of any contractual restrictions on the security’s disposition, the price and extent of public trading in similar securities of the issuer or of comparable companies or entities, quotations or relevant information obtained from broker/dealers or other market participants, information obtained from the issuer, analysts, and/or the appropriate stock exchange (for exchange-traded securities), an analysis of the company’s or entity’s financial condition, and an evaluation of the forces that influence the issuer and the market(s) in which the security is purchased and sold.
B Investment Transactions — Investment transactions for financial statement purposes are accounted for on a trade date basis. Realized gains and losses on investments sold are determined on the basis of identified cost.
C Income — Dividend income is recorded on the ex-dividend date for dividends received in cash and/or securities. However, if the ex-dividend date has passed, certain dividends from foreign securities are recorded as the Fund is informed of the ex-dividend date. Withholding taxes on foreign dividends and capital gains have been provided for in accordance with the Fund’s understanding of the applicable countries’ tax rules and rates. Interest income is recorded on the basis of interest accrued, adjusted for amortization of premium or accretion of discount.
D Federal Taxes — The Fund’s policy is to comply with the provisions of the Internal Revenue Code applicable to regulated investment companies and to distribute to shareholders each year substantially all of its net investment income, and all or substantially all of its net realized capital gains. Accordingly, no provision for federal income or excise tax is necessary.
As of February 28, 2018, the Fund had no uncertain tax positions that would require financial statement recognition, de-recognition, or disclosure. The Fund files a U.S. federal income tax return annually after its fiscal year-end, which is subject to examination by the Internal Revenue Service for a period of three years from the date of filing.
E Expenses — The majority of expenses of the Trust are directly identifiable to an individual fund. Expenses which are not readily identifiable to a specific fund are allocated taking into consideration, among other things, the nature and type of expense and the relative size of the funds.
| 15 |
Eaton Vance
Focused Value Opportunities Fund
February 28, 2018
Notes to Financial Statements — continued
F Foreign Currency Translation — Investment valuations, other assets, and liabilities initially expressed in foreign currencies are translated each business day into U.S. dollars based upon current exchange rates. Purchases and sales of foreign investment securities and income and expenses denominated in foreign currencies are translated into U.S. dollars based upon currency exchange rates in effect on the respective dates of such transactions. Recognized gains or losses on investment transactions attributable to changes in foreign currency exchange rates are recorded for financial statement purposes as net realized gains and losses on investments. That portion of unrealized gains and losses on investments that results from fluctuations in foreign currency exchange rates is not separately disclosed.
G Use of Estimates — The preparation of the financial statements in conformity with U.S. GAAP requires management to make estimates and assumptions that affect the reported amounts of assets and liabilities at the date of the financial statements and the reported amounts of income and expense during the reporting period. Actual results could differ from those estimates.
H Indemnifications — Under the Trust’s organizational documents, its officers and Trustees may be indemnified against certain liabilities and expenses arising out of the performance of their duties to the Fund. Under Massachusetts law, if certain conditions prevail, shareholders of a Massachusetts business trust (such as the Trust) could be deemed to have personal liability for the obligations of the Trust. However, the Trust’s Declaration of Trust contains an express disclaimer of liability on the part of Fund shareholders and the By-laws provide that the Trust shall assume the defense on behalf of any Fund shareholders. Moreover, the By-laws also provide for indemnification out of Fund property of any shareholder held personally liable solely by reason of being or having been a shareholder for all loss or expense arising from such liability. Additionally, in the normal course of business, the Fund enters into agreements with service providers that may contain indemnification clauses. The Fund’s maximum exposure under these arrangements is unknown as this would involve future claims that may be made against the Fund that have not yet occurred.
2 Distributions to Shareholders and Income Tax Information
It is the present policy of the Fund to make at least one distribution annually (normally in December) of all or substantially all of its net investment income and to distribute annually all or substantially all of its net realized capital gains. Distributions to shareholders are recorded on the ex-dividend date. Distributions are declared separately for each class of shares. Shareholders may reinvest income and capital gain distributions in additional shares of the same class of the Fund at the net asset value as of the ex-dividend date or, at the election of the shareholder, receive distributions in cash. Distributions to shareholders are determined in accordance with income tax regulations, which may differ from U.S. GAAP. As required by U.S. GAAP, only distributions in excess of tax basis earnings and profits are reported in the financial statements as a return of capital. Permanent differences between book and tax accounting relating to distributions are reclassified to paid-in capital. For tax purposes, distributions from short-term capital gains are considered to be from ordinary income.
The tax character of distributions declared for the years ended February 28, 2018 and February 28, 2017 was as follows:
| Year Ended February 28, | ||||||||
| 2018 | 2017 | |||||||
| Distributions declared from: |
||||||||
| Ordinary income |
$ | 983,842 | $ | 897,630 | ||||
| Long-term capital gains |
$ | 1,337,905 | $ | — | ||||
During the year ended February 28, 2018, accumulated net realized gain was decreased by $738,922, accumulated undistributed net investment income was increased by $2,852 and paid-in capital was increased by $736,070 due to the Fund’s use of equalization accounting and differences between book and tax accounting, primarily for foreign currency gain (loss), distributions from real estate investment trusts and investments in partnerships. Tax equalization accounting allows the Fund to treat as a distribution that portion of redemption proceeds representing a redeeming shareholder’s portion of undistributed taxable income and net capital gains. These reclassifications had no effect on the net assets or net asset value per share of the Fund.
As of February 28, 2018, the components of distributable earnings (accumulated losses) on a tax basis were as follows:
| Undistributed ordinary income |
$ | 966,710 | ||
| Undistributed long-term capital gains |
$ | 4,814,760 | ||
| Net unrealized appreciation |
$ | 7,398,111 |
The differences between components of distributable earnings (accumulated losses) on a tax basis and the amounts reflected in the Statement of Assets and Liabilities are primarily due to wash sales and investments in partnerships.
| 16 |
Eaton Vance
Focused Value Opportunities Fund
February 28, 2018
Notes to Financial Statements — continued
The cost and unrealized appreciation (depreciation) of investments of the Fund at February 28, 2018, as determined on a federal income tax basis, were as follows:
| Aggregate cost |
$ | 63,026,728 | ||
| Gross unrealized appreciation |
$ | 9,132,413 | ||
| Gross unrealized depreciation |
(1,734,212 | ) | ||
| Net unrealized appreciation |
$ | 7,398,201 | ||
3 Investment Adviser and Administration Fee and Other Transactions with Affiliates
The investment adviser and administration fee is earned by EVM as compensation for investment advisory and administrative services rendered to the Fund. The fee is computed at an annual rate of 0.75% of the Fund’s average daily net assets up to $500 million and is payable monthly. On net assets of $500 million and over, the annual fee is reduced. For the year ended February 28, 2018, the investment adviser and administration fee amounted to $473,170 or 0.75% of the Fund’s average daily net assets. The Fund invests its cash in Cash Reserves Fund. EVM does not currently receive a fee for advisory services provided to Cash Reserves Fund.
EVM has agreed to reimburse the Fund’s expenses to the extent that total annual operating expenses (relating to ordinary operating expenses only) exceed 1.05%, 1.80% and 0.80% of the Fund’s average daily net assets for Class A, Class C and Class I, respectively, through June 30, 2018. Thereafter, the reimbursement may be changed or terminated at any time. Pursuant to this agreement, EVM was allocated $130,286 of the Fund’s operating expenses for the year ended February 28, 2018.
EVM provides sub-transfer agency and related services to the Fund pursuant to a Sub-Transfer Agency Support Services Agreement. For the year ended February 28, 2018, EVM earned $1,646 from the Fund pursuant to such agreement, which is included in transfer and dividend disbursing agent fees on the Statement of Operations. The Fund was informed that Eaton Vance Distributors, Inc. (EVD), an affiliate of EVM and the Fund’s principal underwriter, received $1,778 as its portion of the sales charge on sales of Class A shares for the year ended February 28, 2018. EVD also received distribution and service fees from Class A and Class C shares (see Note 4) and contingent deferred sales charges (see Note 5).
Trustees and officers of the Fund who are members of EVM’s organization receive remuneration for their services to the Fund out of the investment adviser and administration fee. Trustees of the Fund who are not affiliated with EVM may elect to defer receipt of all or a percentage of their annual fees in accordance with the terms of the Trustees Deferred Compensation Plan. For the year ended February 28, 2018, no significant amounts have been deferred. Certain officers and Trustees of the Fund are officers of EVM.
4 Distribution Plans
The Fund has in effect a distribution plan for Class A shares (Class A Plan) pursuant to Rule 12b-1 under the 1940 Act. Pursuant to the Class A Plan, the Fund pays EVD a distribution and service fee of 0.25% per annum of its average daily net assets attributable to Class A shares for distribution services and facilities provided to the Fund by EVD, as well as for personal services and/or the maintenance of shareholder accounts. Distribution and service fees paid or accrued to EVD for the year ended February 28, 2018 amounted to $9,380 for Class A shares.
The Fund also has in effect a distribution plan for Class C shares (Class C Plan) pursuant to Rule 12b-1 under the 1940 Act. Pursuant to the Class C Plan, the Fund pays EVD amounts equal to 0.75% per annum of its average daily net assets attributable to Class C shares for providing ongoing distribution services and facilities to the Fund. For the year ended February 28, 2018, the Fund paid or accrued to EVD $9,139 for Class C shares.
Pursuant to the Class C Plan, the Fund also makes payments of service fees to EVD, financial intermediaries and other persons in amounts equal to 0.25% per annum of its average daily net assets attributable to that class. Service fees paid or accrued are for personal services and/or the maintenance of shareholder accounts. They are separate and distinct from the sales commissions and distribution fees payable to EVD. Service fees paid or accrued for the year ended February 28, 2018 amounted to $3,047 for Class C shares.
Distribution and service fees are subject to the limitations contained in the Financial Industry Regulatory Authority Rule 2341(d).
5 Contingent Deferred Sales Charges
A contingent deferred sales charge (CDSC) of 1% generally is imposed on redemptions of Class C shares made within one year of purchase. Class A shares may be subject to a 1% CDSC if redeemed within 18 months of purchase (depending on the circumstances of purchase). Generally, the CDSC is based upon the lower of the net asset value at date of redemption or date of purchase. No charge is levied on shares acquired by reinvestment of dividends or capital gain distributions. For the year ended February 28, 2018, the Fund was informed that EVD received approximately $300 of CDSCs paid by Class C shareholders and no CDSCs paid by Class A shareholders.
| 17 |
Eaton Vance
Focused Value Opportunities Fund
February 28, 2018
Notes to Financial Statements — continued
6 Purchases and Sales of Investments
Purchases and sales of investments, other than short-term obligations, aggregated $62,445,565 and $65,554,245, respectively, for the year ended February 28, 2018.
7 Shares of Beneficial Interest
The Fund’s Declaration of Trust permits the Trustees to issue an unlimited number of full and fractional shares of beneficial interest (without par value). Such shares may be issued in a number of different series (such as the Fund) and classes. Transactions in Fund shares were as follows:
| Year Ended February 28, | ||||||||
| Class A | 2018 | 2017 | ||||||
| Sales |
37,825 | 121,499 | ||||||
| Issued to shareholders electing to receive payments of distributions in Fund shares |
7,243 | 3,772 | ||||||
| Redemptions |
(115,420 | ) | (182,458 | ) | ||||
| Net decrease |
(70,352 | ) | (57,187 | ) | ||||
| Year Ended February 28, | ||||||||
| Class C | 2018 | 2017 | ||||||
| Sales |
21,729 | 47,472 | ||||||
| Issued to shareholders electing to receive payments of distributions in Fund shares |
2,144 | 574 | ||||||
| Redemptions |
(32,555 | ) | (19,595 | ) | ||||
| Net increase (decrease) |
(8,682 | ) | 28,451 | |||||
| Year Ended February 28, | ||||||||
| Class I | 2018 | 2017 | ||||||
| Sales |
1,077,666 | 1,062,888 | ||||||
| Issued to shareholders electing to receive payments of distributions in Fund shares |
110,509 | 5,758 | ||||||
| Redemptions |
(1,361,811 | ) | (1,416,817 | ) | ||||
| Net decrease |
(173,636 | ) | (348,171 | ) | ||||
At February 28, 2018, an Eaton Vance collective investment trust and donor advised and pooled income funds (established and maintained by a public charity) managed by EVM owned in the aggregate 80.2% of the value of the outstanding shares of the Fund.
8 Line of Credit
The Fund participates with other portfolios and funds managed by EVM and its affiliates in a $625 million unsecured line of credit agreement with a group of banks, which is in effect through October 30, 2018. Borrowings are made by the Fund solely to facilitate the handling of unusual and/or unanticipated short-term cash requirements. Interest is charged to the Fund based on its borrowings at an amount above either the Eurodollar rate or Federal Funds rate. In addition, a fee computed at an annual rate of 0.15% on the daily unused portion of the line of credit is allocated among the participating portfolios and funds at the end of each quarter. Because the line of credit is not available exclusively to the Fund, it may be unable to borrow some or all of its requested amounts at any particular time. The Fund did not have any significant borrowings or allocated fees during the year ended February 28, 2018.
| 18 |
Eaton Vance
Focused Value Opportunities Fund
February 28, 2018
Notes to Financial Statements — continued
9 Fair Value Measurements
Under generally accepted accounting principles for fair value measurements, a three-tier hierarchy to prioritize the assumptions, referred to as inputs, is used in valuation techniques to measure fair value. The three-tier hierarchy of inputs is summarized in the three broad levels listed below.
| • | Level 1 – quoted prices in active markets for identical investments |
| • | Level 2 – other significant observable inputs (including quoted prices for similar investments, interest rates, prepayment speeds, credit risk, etc.) |
| • | Level 3 – significant unobservable inputs (including a fund’s own assumptions in determining the fair value of investments) |
In cases where the inputs used to measure fair value fall in different levels of the fair value hierarchy, the level disclosed is determined based on the lowest level input that is significant to the fair value measurement in its entirety. The inputs or methodology used for valuing securities are not necessarily an indication of the risk associated with investing in those securities.
At February 28, 2018, the hierarchy of inputs used in valuing the Fund’s investments, which are carried at value, were as follows:
| Asset Description | Level 1 | Level 2 | Level 3 | Total | ||||||||||||
| Common Stocks |
||||||||||||||||
| Consumer Discretionary |
$ | 3,672,206 | $ | — | $ | — | $ | 3,672,206 | ||||||||
| Consumer Staples |
6,779,140 | — | — | 6,779,140 | ||||||||||||
| Energy |
7,671,093 | — | — | 7,671,093 | ||||||||||||
| Financials |
15,725,799 | 1,542,506 | — | 17,268,305 | ||||||||||||
| Health Care |
8,284,491 | — | — | 8,284,491 | ||||||||||||
| Industrials |
7,517,947 | — | — | 7,517,947 | ||||||||||||
| Information Technology |
6,175,900 | — | — | 6,175,900 | ||||||||||||
| Materials |
1,621,091 | — | — | 1,621,091 | ||||||||||||
| Real Estate |
3,519,820 | — | — | 3,519,820 | ||||||||||||
| Telecommunication Services |
2,450,924 | — | — | 2,450,924 | ||||||||||||
| Utilities |
4,924,104 | — | — | 4,924,104 | ||||||||||||
| Total Common Stocks |
$ | 68,342,515 | $ | 1,542,506 | * | $ | — | $ | 69,885,021 | |||||||
| Short-Term Investments |
$ | — | $ | 539,908 | $ | — | $ | 539,908 | ||||||||
| Total Investments |
$ | 68,342,515 | $ | 2,082,414 | $ | — | $ | 70,424,929 | ||||||||
| * | Includes foreign equity securities whose values were adjusted to reflect market trading of comparable securities or other correlated instruments that occurred after the close of trading in their applicable foreign markets. |
The Fund held no investments or other financial instruments as of February 28, 2017 whose fair value was determined using Level 3 inputs. At February 28, 2018, there were no investments transferred between Level 1 and Level 2 during the year then ended.
| 19 |
Eaton Vance
Focused Value Opportunities Fund
February 28, 2018
Report of Independent Registered Public Accounting Firm
To the Trustees of Eaton Vance Growth Trust and Shareholders of Eaton Vance Focused Value Opportunities Fund:
Opinion on the Financial Statements and Financial Highlights
We have audited the accompanying statement of assets and liabilities of Eaton Vance Focused Value Opportunities Fund (the “Fund”) (one of the funds constituting Eaton Vance Growth Trust), including the portfolio of investments, as of February 28, 2018, the related statement of operations for the year then ended, the statements of changes in net assets for each of the two years in the period then ended, the financial highlights for each of the five years in the period then ended, and the related notes. In our opinion, the financial statements and financial highlights present fairly, in all material respects, the financial position of the Fund as of February 28, 2018, and the results of its operations for the year then ended, the changes in its net assets for each of the two years in the period then ended, and the financial highlights for each of the five years in the period then ended, in conformity with accounting principles generally accepted in the United States of America.
Basis for Opinion
These financial statements and financial highlights are the responsibility of the Fund’s management. Our responsibility is to express an opinion on the Fund’s financial statements and financial highlights based on our audits. We are a public accounting firm registered with the Public Company Accounting Oversight Board (United States) (PCAOB) and are required to be independent with respect to the Fund in accordance with the U.S. federal securities laws and the applicable rules and regulations of the Securities and Exchange Commission and the PCAOB.
We conducted our audits in accordance with the standards of the PCAOB. Those standards require that we plan and perform the audit to obtain reasonable assurance about whether the financial statements and financial highlights are free of material misstatement, whether due to error or fraud. The Fund is not required to have, nor were we engaged to perform, an audit of its internal control over financial reporting. As part of our audits we are required to obtain an understanding of internal control over financial reporting but not for the purpose of expressing an opinion on the effectiveness of the Fund’s internal control over financial reporting. Accordingly, we express no such opinion.
Our audits included performing procedures to assess the risks of material misstatement of the financial statements and financial highlights, whether due to error or fraud, and performing procedures that respond to those risks. Such procedures included examining, on a test basis, evidence regarding the amounts and disclosures in the financial statements and financial highlights. Our audits also included evaluating the accounting principles used and significant estimates made by management, as well as evaluating the overall presentation of the financial statements and financial highlights. Our procedures included confirmation of securities owned as of February 28, 2018, by correspondence with the custodian and brokers; when replies were not received from brokers, we performed other auditing procedures. We believe that our audits provide a reasonable basis for our opinion.
/s/ Deloitte & Touche LLP
Boston, Massachusetts
April 20, 2018
We have served as the auditor of one or more Eaton Vance investment companies since 1959.
| 20 |
Eaton Vance
Focused Value Opportunities Fund
February 28, 2018
Federal Tax Information (Unaudited)
The Form 1099-DIV you receive in February 2019 will show the tax status of all distributions paid to your account in calendar year 2018. Shareholders are advised to consult their own tax adviser with respect to the tax consequences of their investment in the Fund. As required by the Internal Revenue Code and/or regulations, shareholders must be notified regarding the status of qualified dividend income for individuals, the dividends received deduction for corporations and capital gains dividends.
Qualified Dividend Income. For the fiscal year ended February 28, 2018, the Fund designates approximately $1,175,638, or up to the maximum amount of such dividends allowable pursuant to the Internal Revenue Code, as qualified dividend income eligible for the reduced tax rate of 15%.
Dividends Received Deduction. Corporate shareholders are generally entitled to take the dividends received deduction on the portion of the Fund’s dividend distribution that qualifies under tax law. For the Fund’s fiscal 2018 ordinary income dividends, 58.40% qualifies for the corporate dividends received deduction.
Capital Gains Dividends. The Fund hereby designates as a capital gain dividend with respect to the taxable year ended February 28, 2018, $6,765,658 or, if subsequently determined to be different, the net capital gain of such year.
| 21 |
Eaton Vance
Focused Value Opportunities Fund
February 28, 2018
Management and Organization
Fund Management. The Trustees of Eaton Vance Growth Trust (the Trust) are responsible for the overall management and supervision of the Trust’s affairs. The Trustees and officers of the Trust are listed below. Except as indicated, each individual has held the office shown or other offices in the same company for the last five years. Trustees and officers of the Trust hold indefinite terms of office. The “noninterested Trustees” consist of those Trustees who are not “interested persons” of the Trust, as that term is defined under the 1940 Act. The business address of each Trustee and officer is Two International Place, Boston, Massachusetts 02110. As used below, “EVC” refers to Eaton Vance Corp., “EV” refers to Eaton Vance, Inc., “EVM” refers to Eaton Vance Management, “BMR” refers to Boston Management and Research and “EVD” refers to Eaton Vance Distributors, Inc. EVC and EV are the corporate parent and trustee, respectively, of EVM and BMR. EVD is the Fund’s principal underwriter and a wholly-owned subsidiary of EVC. Each officer affiliated with Eaton Vance may hold a position with other Eaton Vance affiliates that is comparable to his or her position with EVM listed below. Each Trustee oversees 174 portfolios in the Eaton Vance Complex (including all master and feeder funds in a master feeder structure). Each officer serves as an officer of certain other Eaton Vance funds. Each Trustee and officer serves until his or her successor is elected.
| Name and Year of Birth | Position(s) with the Trust |
Trustee Since(1) |
Principal Occupation(s) and Directorships During Past Five Years and Other Relevant Experience | |||
| Interested Trustee | ||||||
| Thomas E. Faust Jr. 1958 |
Trustee | 2007 | Chairman, Chief Executive Officer and President of EVC, Director and President of EV, Chief Executive Officer and President of EVM and BMR, and Director of EVD. Trustee and/or officer of 174 registered investment companies. Mr. Faust is an interested person because of his positions with EVM, BMR, EVD, EVC and EV, which are affiliates of the Trust. Directorships in the Last Five Years.(2) Director of EVC and Hexavest Inc. (investment management firm). | |||
| Noninterested Trustees | ||||||
| Mark R. Fetting 1954 |
Trustee | 2016 | Private investor. Formerly held various positions at Legg Mason, Inc. (investment management firm) (2000-2012), including President, Chief Executive Officer, Director and Chairman (2008-2012), Senior Executive Vice President (2004-2008) and Executive Vice President (2001-2004). Formerly, President of Legg Mason family of funds (2001-2008). Formerly, Division President and Senior Officer of Prudential Financial Group, Inc. and related companies (investment management firm) (1991-2000). Directorships in the Last Five Years. None. | |||
| Cynthia E. Frost 1961 |
Trustee | 2014 | Private investor. Formerly, Chief Investment Officer of Brown University (university endowment) (2000-2012); Formerly, Portfolio Strategist for Duke Management Company (university endowment manager) (1995-2000); Formerly, Managing Director, Cambridge Associates (investment consulting company) (1989-1995); Formerly, Consultant, Bain and Company (management consulting firm) (1987-1989); Formerly, Senior Equity Analyst, BA Investment Management Company (1983-1985). Directorships in the Last Five Years. None. | |||
| George J. Gorman 1952 |
Trustee | 2014 | Principal at George J. Gorman LLC (consulting firm). Formerly, Senior Partner at Ernst & Young LLP (a registered public accounting firm) (1974-2009). Directorships in the Last Five Years. Formerly, Trustee of the BofA Funds Series Trust (11 funds) (2011-2014) and of the Ashmore Funds (9 funds) (2010-2014). | |||
| Valerie A. Mosley 1960 |
Trustee | 2014 | Chairwoman and Chief Executive Officer of Valmo Ventures (a consulting and investment firm). Former Partner and Senior Vice President, Portfolio Manager and Investment Strategist at Wellington Management Company, LLP (investment management firm) (1992-2012). Former Chief Investment Officer, PG Corbin Asset Management (1990-1992). Formerly worked in institutional corporate bond sales at Kidder Peabody (1986-1990). Directorships in the Last Five Years.(2) Director of Dynex Capital, Inc. (mortgage REIT) (since 2013). | |||
| William H. Park 1947 |
Chairperson of the Board and Trustee |
2016 (Chairperson) 2003 (Trustee) |
Private investor. Formerly, Consultant (management and transactional) (2012-2014). Formerly, Chief Financial Officer, Aveon Group L.P. (investment management firm) (2010-2011). Formerly, Vice Chairman, Commercial Industrial Finance Corp. (specialty finance company) (2006-2010). Formerly, President and Chief Executive Officer, Prizm Capital Management, LLC (investment management firm) (2002-2005). Formerly, Executive Vice President and Chief Financial Officer, United Asset Management Corporation (investment management firm) (1982-2001). Formerly, Senior Manager, Price Waterhouse (now PricewaterhouseCoopers) (a registered public accounting firm) (1972-1981). Directorships in the Last Five Years.(2) None. | |||
| 22 |
Eaton Vance
Focused Value Opportunities Fund
February 28, 2018
Management and Organization — continued
| Name and Year of Birth | Position(s) with the Trust |
Trustee Since(1) |
Principal Occupation(s) and Directorships During Past Five Years and Other Relevant Experience | |||
| Noninterested Trustees (continued) | ||||||
| Helen Frame Peters 1948 |
Trustee | 2008 | Professor of Finance, Carroll School of Management, Boston College. Formerly, Dean, Carroll School of Management, Boston College (2000-2002). Formerly, Chief Investment Officer, Fixed Income, Scudder Kemper Investments (investment management firm) (1998-1999). Formerly, Chief Investment Officer, Equity and Fixed Income, Colonial Management Associates (investment management firm) (1991-1998). Directorships in the Last Five Years.(2) None. | |||
| Susan J. Sutherland 1957 |
Trustee | 2015 | Private investor. Formerly, Associate, Counsel and Partner at Skadden, Arps, Slate, Meagher & Flom LLP (law firm) (1982-2013). Directorships in the Last Five Years. Formerly, Director of Montpelier Re Holdings Ltd. (global provider of customized insurance and reinsurance products) (2013-2015). | |||
| Harriett Tee Taggart 1948 |
Trustee | 2011 | Managing Director, Taggart Associates (a professional practice firm). Formerly, Partner and Senior Vice President, Wellington Management Company, LLP (investment management firm) (1983-2006). Ms. Taggart has apprised the Board of Trustees that she intends to retire as a Trustee of all Eaton Vance Funds in 2018. Directorships in the Last Five Years.(2) Director of Albemarle Corporation (chemicals manufacturer) (since 2007) and The Hanover Group (specialty property and casualty insurance company) (since 2009). | |||
| Scott E. Wennerholm 1959 |
Trustee | 2016 | Trustee at Wheelock College (postsecondary institution) (since 2012). Formerly, Consultant at GF Parish Group (executive recruiting firm) (2016-2017). Formerly, Chief Operating Officer and Executive Vice President at BNY Mellon Asset Management (investment management firm) (2005-2011). Formerly, Chief Operating Officer and Chief Financial Officer at Natixis Global Asset Management (investment management firm) (1997-2004). Formerly, Vice President at Fidelity Investments Institutional Services (investment management firm) (1994-1997). Directorships in the Last Five Years. None | |||
| Name and Year of Birth | Position(s) with the Trust |
Officer Since(3) |
Principal Occupation(s) During Past Five Years | |||
| Principal Officers who are not Trustees | ||||||
| Payson F. Swaffield 1956 |
President | 2003 | Vice President and Chief Income Investment Officer of EVM and BMR. Also Vice President of Calvert Research and Management (“CRM”). | |||
| Maureen A. Gemma 1960 |
Vice President, Secretary and Chief Legal Officer | 2005 | Vice President of EVM and BMR. Also Vice President of CRM. | |||
| James F. Kirchner 1967 |
Treasurer | 2007 | Vice President of EVM and BMR. Also Vice President of CRM. | |||
| Richard F. Froio 1968 |
Chief Compliance Officer | 2017 | Vice President of EVM and BMR since 2017. Formerly Deputy Chief Compliance Officer (Adviser/Funds) and Chief Compliance Officer (Distribution) at PIMCO (2012-2017) and Managing Director at BlackRock/Barclays Global Investors (2009-2012). | |||
| (1) | Year first appointed to serve as Trustee for a fund in the Eaton Vance family of funds. Each Trustee has served continuously since appointment unless indicated otherwise. |
| (2) | During their respective tenures, the Trustees (except for Mmes. Frost and Sutherland and Messrs. Fetting, Gorman and Wennerholm) also served as Board members of one or more of the following funds (which operated in the years noted): eUnitsTM 2 Year U.S. Market Participation Trust: Upside to Cap / Buffered Downside (launched in 2012 and terminated in 2014); and eUnitsTM 2 Year U.S. Market Participation Trust II: Upside to Cap / Buffered Downside (launched in 2012 and terminated in 2014). However, Ms. Mosley did not serve as a Board member of eUnitsTM 2 Year U.S. Market Participation Trust: Upside to Cap / Buffered Downside (launched in 2012 and terminated in 2014). |
| (3) | Year first elected to serve as officer of a fund in the Eaton Vance family of funds when the officer has served continuously. Otherwise, year of most recent election as an officer of a fund in the Eaton Vance family of funds. Titles may have changed since initial election. |
The SAI for the Fund includes additional information about the Trustees and officers of the Fund and can be obtained without charge on Eaton Vance’s website at www.eatonvance.com or by calling 1-800-262-1122.
| 23 |
Eaton Vance Funds
IMPORTANT NOTICES
Privacy. The Eaton Vance organization is committed to ensuring your financial privacy. Each of the financial institutions identified below has in effect the following policy (“Privacy Policy”) with respect to nonpublic personal information about its customers:
| • | Only such information received from you, through application forms or otherwise, and information about your Eaton Vance fund transactions will be collected. This may include information such as name, address, social security number, tax status, account balances and transactions. |
| • | None of such information about you (or former customers) will be disclosed to anyone, except as permitted by law (which includes disclosure to employees necessary to service your account). In the normal course of servicing a customer’s account, Eaton Vance may share information with unaffiliated third parties that perform various required services such as transfer agents, custodians and broker-dealers. |
| • | Policies and procedures (including physical, electronic and procedural safeguards) are in place that are designed to protect the confidentiality of such information. |
| • | We reserve the right to change our Privacy Policy at any time upon proper notification to you. Customers may want to review our Privacy Policy periodically for changes by accessing the link on our homepage: www.eatonvance.com. |
Our pledge of privacy applies to the following entities within the Eaton Vance organization: the Eaton Vance Family of Funds, Eaton Vance Management, Eaton Vance Investment Counsel, Eaton Vance Distributors, Inc., Eaton Vance Trust Company, Eaton Vance Management (International) Limited, Eaton Vance Advisers International Ltd., Eaton Vance Management’s Real Estate Investment Group and Boston Management and Research. In addition, our Privacy Policy applies only to those Eaton Vance customers who are individuals and who have a direct relationship with us. If a customer’s account (i.e., fund shares) is held in the name of a third-party financial advisor/broker-dealer, it is likely that only such advisor’s privacy policies apply to the customer. This notice supersedes all previously issued privacy disclosures. For more information about Eaton Vance’s Privacy Policy, please call 1-800-262-1122.
Delivery of Shareholder Documents. The Securities and Exchange Commission (SEC) permits funds to deliver only one copy of shareholder documents, including prospectuses, proxy statements and shareholder reports, to fund investors with multiple accounts at the same residential or post office box address. This practice is often called “householding” and it helps eliminate duplicate mailings to shareholders. Eaton Vance, or your financial advisor, may household the mailing of your documents indefinitely unless you instruct Eaton Vance, or your financial advisor, otherwise. If you would prefer that your Eaton Vance documents not be householded, please contact Eaton Vance at 1-800-262-1122, or contact your financial advisor. Your instructions that householding not apply to delivery of your Eaton Vance documents will typically be effective within 30 days of receipt by Eaton Vance or your financial advisor.
Portfolio Holdings. Each Eaton Vance Fund and its underlying Portfolio(s) (if applicable) will file a schedule of portfolio holdings on Form N-Q with the SEC for the first and third quarters of each fiscal year. The Form N-Q will be available on the Eaton Vance website at www.eatonvance.com, by calling Eaton Vance at 1-800-262-1122 or in the EDGAR database on the SEC’s website at www.sec.gov. Form N-Q may also be reviewed and copied at the SEC’s public reference room in Washington, D.C. (call 1-800-732-0330 for information on the operation of the public reference room).
Proxy Voting. From time to time, funds are required to vote proxies related to the securities held by the funds. The Eaton Vance Funds or their underlying Portfolios (if applicable) vote proxies according to a set of policies and procedures approved by the Funds’ and Portfolios’ Boards. You may obtain a description of these policies and procedures and information on how the Funds or Portfolios voted proxies relating to portfolio securities during the most recent 12-month period ended June 30, without charge, upon request, by calling 1-800-262-1122 and by accessing the SEC’s website at www.sec.gov.
| 24 |
| * | FINRA BrokerCheck. Investors may check the background of their Investment Professional by contacting the Financial Industry Regulatory Authority (FINRA). FINRA BrokerCheck is a free tool to help investors check the professional background of current and former FINRA-registered securities firms and brokers. FINRA BrokerCheck is available by calling 1-800-289-9999 and at www.FINRA.org. The FINRA BrokerCheck brochure describing this program is available to investors at www.FINRA.org. |
5305 2.28.18
Item 2. Code of Ethics
The registrant has adopted a code of ethics applicable to its Principal Executive Officer, Principal Financial Officer and Principal Accounting Officer. The registrant undertakes to provide a copy of such code of ethics to any person upon request, without charge, by calling 1-800-262-1122. The registrant has not amended the code of ethics as described in Form N-CSR during the period covered by this report. The registrant has not granted any waiver, including an implicit waiver, from a provision of the code of ethics as described in Form N-CSR during the period covered by this report.
Item 3. Audit Committee Financial Expert
The registrant’s Board has designated William H. Park, an independent trustee, as its audit committee financial expert. Mr. Park is a certified public accountant who is a private investor. Previously, he served as a consultant, as the Chief Financial Officer of Aveon Group, L.P. (an investment management firm), as the Vice Chairman of Commercial Industrial Finance Corp. (specialty finance company), as President and Chief Executive Officer of Prizm Capital Management, LLC (investment management firm), as Executive Vice President and Chief Financial Officer of United Asset Management Corporation (an institutional investment management firm) and as a Senior Manager at Price Waterhouse (now PricewaterhouseCoopers) (an independent registered public accounting firm).
Item 4. Principal Accountant Fees and Services
Eaton Vance Focused Growth Opportunities Fund and Eaton Vance Focused Value Opportunities Fund (the “Fund(s)”) are series of Eaton Vance Growth Trust (the “Trust”), a Massachusetts business trust, which, including the Funds, contains a total of 14 series (the “Series”). The Trust is registered under the Investment Company Act of 1940 as an open-end management investment company. This Form N-CSR relates to the Funds’ annual reports.
Rule 2-01(c)(1)(ii)(A) of Regulation S-X (the “Loan Rule”) prohibits an accounting firm, such as the Trust’s principal accountant, Deloitte & Touche LLP (“D&T”), from having certain financial relationships with their audit clients and affiliated entities. Specifically, the Loan Rule provides, in relevant part, that an accounting firm generally would not be independent if it or a “covered person” of the accounting firm (within the meaning of applicable SEC rules relating to auditor independence) receives a loan from a lender that is a “record or beneficial owner of more than ten percent of the audit client’s equity securities.” Based on information provided to the Audit Committee of the Board of Trustees (the “Audit Committee”) of the Eaton Vance family of funds by D&T, certain relationships between D&T and its affiliates (“Deloitte Entities”) and one or more lenders who are record owners of shares of one or more funds within the Eaton Vance family of funds (the “Funds”) implicate the Loan Rule, calling into question D&T’s independence with respect to the Funds. The Funds are providing this disclosure to explain the facts and circumstances as well as D&T’s conclusions concerning D&T’s objectivity and impartiality with respect to the audits of the Funds notwithstanding the existence of one or more breaches of the Loan Rule.
On June 20, 2016, the U.S. Securities and Exchange Commission (the “SEC”) issued no-action relief to another mutual fund complex (see Fidelity Management & Research Company et al., No-Action Letter (June 20, 2016) (the “No-Action Letter”)) related to an auditor independence issue arising under the Loan Rule. In the No-Action Letter, the SEC indicated that it would not recommend enforcement action against the fund group if the auditor is not in compliance with the Loan Rule provided that: (1) the auditor has complied with PCAOB Rule 3526(b)(1) and 3526(b)(2); (2) the auditor’s non-compliance under the Loan Rule is with respect to certain lending relationships; and (3) notwithstanding such non-compliance, the auditor has concluded that it is objective and impartial with respect to the issues encompassed within its engagement as auditor of the funds. Although the relief contained in the No-Action Letter was scheduled to expire eighteen months from issuance, it was extended via a subsequent no-action letter issued on September 22, 2017 (see Fidelity Management & Research Company et al., No-Action Letter (Sept. 22, 2017)).
Based on information provided by D&T to the Audit Committee, the requirements of the No-Action Letter appear to be met with respect to D&T’s lending relationships described above. Among other things, D&T has advised the Audit Committee of its conclusion that the consequences of the breach of the Loan Rule have been satisfactorily addressed, that D&T’s objectivity and impartiality in the planning and conduct of the audits of the Fund’s financial statements has not been compromised and that, notwithstanding the breach, D&T is in a position to continue as the auditor for the Funds and D&T does not believe any actions need to be taken with respect to previously issued reports by D&T. D&T has advised the Audit Committee that these conclusions were based in part on its consideration of the No-Action Letter and other relevant information communicated to the Audit Committee.
(a)-(d)
The following tables present the aggregate fees billed to each Fund for each Fund’s fiscal years ended February 28, 2017 and February 28, 2018 by D&T for professional services rendered for the audit of the Fund’s annual financial statements and fees billed for other services rendered by D&T during such period.
Eaton Vance Focused Growth Opportunities Fund
| Fiscal Years Ended |
2/28/17 | 2/28/18 | ||||||
| Audit Fees |
$ | 27,630 | $ | 27,630 | ||||
| Audit-Related Fees(1) |
$ | 0 | $ | 0 | ||||
| Tax Fees(2) |
$ | 9,227 | $ | 9,365 | ||||
| All Other Fees(3) |
$ | 0 | $ | 0 | ||||
|
|
|
|
|
|||||
| Total |
$ | 36,857 | $ | 36,995 | ||||
|
|
|
|
|
|||||
Eaton Vance Focused Value Opportunities Fund
| Fiscal Years Ended |
2/28/17 | 2/28/18 | ||||||
| Audit Fees |
$ | 27,630 | $ | 27,630 | ||||
| Audit-Related Fees(1) |
$ | 0 | $ | 0 | ||||
| Tax Fees(2) |
$ | 10,977 | $ | 10,615 | ||||
| All Other Fees(3) |
$ | 0 | $ | 0 | ||||
|
|
|
|
|
|||||
| Total |
$ | 38,607 | $ | 38,245 | ||||
|
|
|
|
|
|||||
| (1) | Audit-related fees consist of the aggregate fees billed for assurance and related services that are reasonably related to the performance of the audit of financial statements and are not reported under the category of audit fees. |
| (2) | Tax fees consist of the aggregate fees billed for professional services rendered by the principal accountant relating to tax compliance, tax advice, and tax planning and specifically include fees for tax return preparation and other tax related compliance/planning matters. |
| (3) | All other fees consist of the aggregate fees billed for products and services provided by the principal accountant other than audit, audit-related, and tax services. |
The various Series comprising the Trust have differing fiscal year ends (February 28, July 31, August 31, September 30 or November 30). The following table presents the aggregate audit, audit-related, tax, and other fees billed to all of the Series in the Trust by D&T for the last two fiscal years of each Series.
| Fiscal Years Ended* |
7/31/16 | 8/31/16 | 9/30/16 | 11/30/16* | 2/28/17 | 7/31/17 | 8/31/17 | 9/30/17 | 11/30/17 | 2/28/18 | ||||||||||||||||||||||||||||||
| Audit Fees |
$ | 92,000 | $ | 162,040 | $ | 87,580 | $ | 81,150 | $ | 55,260 | $ | 59,050 | $ | 162,040 | $ | 87,580 | $ | 81,150 | $ | 55,260 | ||||||||||||||||||||
| Audit-Related Fees(1) |
$ | 0 | $ | 0 | $ | 0 | $ | 0 | $ | 0 | $ | 0 | $ | 0 | $ | 0 | $ | 0 | $ | 0 | ||||||||||||||||||||
| Tax Fees(2) |
$ | 35,769 | $ | 58,654 | $ | 36,986 | $ | 43,500 | $ | 20,204 | $ | 20,034 | $ | 59,372 | $ | 35,708 | $ | 38,019 | $ | 19,980 | ||||||||||||||||||||
| All Other Fees(3) |
$ | 0 | $ | 0 | $ | 0 | $ | 0 | $ | 0 | $ | 0 | $ | 0 | $ | 0 | $ | 0 | $ | 0 | ||||||||||||||||||||
|
|
|
|
|
|
|
|
|
|
|
|
|
|
|
|
|
|
|
|
|
|||||||||||||||||||||
| Total |
$ | 127,769 | $ | 220,694 | $ | 124,566 | $ | 124,650 | $ | 75,464 | $ | 79,084 | $ | 221,412 | $ | 123,288 | $ | 119,169 | $ | 75,240 | ||||||||||||||||||||
|
|
|
|
|
|
|
|
|
|
|
|
|
|
|
|
|
|
|
|
|
|||||||||||||||||||||
| * | Series commenced operations on December 16, 2015. |
| (1) | Audit-related fees consist of the aggregate fees billed for assurance and related services that are reasonably related to the performance of the audit of financial statements and are not reported under the category of audit fees. Includes consent fee for N-14 registration statements related to fund mergers. |
| (2) | Tax fees consist of the aggregate fees billed for professional services rendered by the principal accountant relating to tax compliance, tax advice, and tax planning and specifically include fees for tax return preparation and other related tax compliance/planning matters. |
| (3) | All other fees consist of the aggregate fees billed for products and services provided by the principal accountant other than audit, audit-related, and tax services. |
(e)(1) The registrant’s audit committee has adopted policies and procedures relating to the pre-approval of services provided by the registrant’s principal accountant (the “Pre-Approval Policies”). The Pre-Approval Policies establish a framework intended to assist the audit committee in the proper discharge of its pre-approval responsibilities. As a general matter, the Pre-Approval Policies (i) specify certain types of audit, audit-related, tax, and other services determined to be pre-approved by the audit committee; and (ii) delineate specific procedures governing the mechanics of the pre-approval process, including the approval and monitoring of audit and non-audit service fees. Unless a service is specifically pre-approved under the Pre-Approval Policies, it must be separately pre-approved by the audit committee.
The Pre-Approval Policies and the types of audit and non-audit services pre-approved therein must be reviewed and ratified by the registrant’s audit committee at least annually. The registrant’s audit committee maintains full responsibility for the appointment, compensation, and oversight of the work of the registrant’s principal accountant.
(e)(2) No services described in paragraphs (b)-(d) above were approved by the registrant’s audit committee pursuant to the “de minimis exception” set forth in Rule 2-01(c)(7)(i)(C) of Regulation S-X.
(f) Not applicable.
(g) The following table presents (i) the aggregate non-audit fees (i.e., fees for audit-related, tax, and other services) billed for services rendered to all of the Series in the Trust by D&T for the last two fiscal years of each Series; and (ii) the aggregate non-audit fees (i.e., fees for audit-related, tax, and other services) billed to the Eaton Vance organization by D&T for the last two fiscal years of each Series.
| Fiscal Years Ended* |
7/31/16 | 8/31/16 | 9/30/16 | 11/30/16* | 2/28/17 | 7/31/17 | 8/31/17 | 9/30/17 | 11/30/17 | 2/28/18 | ||||||||||||||||||||||||||||||
| Registrant(1) |
$ | 35,769 | $ | 58,654 | $ | 36,986 | $ | 43,500 | $ | 20,204 | $ | 20,034 | $ | 59,372 | $ | 35,708 | $ | 38,019 | $ | 19,980 | ||||||||||||||||||||
| Eaton Vance(2) |
$ | 56,434 | $ | 56,434 | $ | 56,434 | $ | 48,500 | $ | 46,000 | $ | 148,018 | $ | 148,018 | $ | 148,018 | $ | 148,018 | $ | 148,018 | ||||||||||||||||||||
| * | Series commenced operations on December 16, 2015. |
| (1) | Includes all of the Series of the Trust. During the fiscal years reported above, certain of the Funds were “feeder” funds in a “master-feeder” fund structure or funds of funds. |
| (2) | Various subsidiaries of Eaton Vance Corp. act in either an investment advisory and/or service provider capacity with respect to the Series and/or their respective “master” funds (if applicable). |
(h) The registrant’s audit committee has considered whether the provision by the registrant’s principal accountant of non-audit services to the registrant’s investment adviser and any entity controlling, controlled by, or under common control with the adviser that provides ongoing services to the registrant that were not pre-approved pursuant to Rule 2-01(c)(7)(ii) of Regulation S-X is compatible with maintaining the principal accountant’s independence.
Item 5. Audit Committee of Listed Registrants
Not applicable.
Item 6. Schedule of Investments
Please see schedule of investments contained in the Report to Stockholders included under Item 1 of this Form N-CSR.
Item 7. Disclosure of Proxy Voting Policies and Procedures for Closed-End Management Investment Companies
Not applicable.
Item 8. Portfolio Managers of Closed-End Management Investment Companies
Not applicable.
Item 9. Purchases of Equity Securities by Closed-End Management Investment Company and Affiliated Purchasers
Not applicable.
Item 10. Submission of Matters to a Vote of Security Holders
No material changes.
Item 11. Controls and Procedures
(a) It is the conclusion of the registrant’s principal executive officer and principal financial officer that the effectiveness of the registrant’s current disclosure controls and procedures (such disclosure controls and procedures having been evaluated within 90 days of the date of this filing) provide reasonable assurance that the information required to be disclosed by the registrant has been recorded, processed, summarized and reported within the time period specified in the Commission’s rules and forms and that the information required to be disclosed by the registrant has been accumulated and communicated to the registrant’s principal executive officer and principal financial officer in order to allow timely decisions regarding required disclosure.
(b) There have been no changes in the registrant’s internal controls over financial reporting during the second fiscal quarter of the period covered by this report that has materially affected, or is reasonably likely to materially affect, the registrant’s internal control over financial reporting.
Item 12. Disclosure of Securities Lending Activities for Closed-End Management Investment Companies
Not applicable.
Item 13. Exhibits
| (a)(1) | Registrant’s Code of Ethics – Not applicable (please see Item 2). | |
| (a)(2)(i) | Treasurer’s Section 302 certification. | |
| (a)(2)(ii) | President’s Section 302 certification. | |
| (b) | Combined Section 906 certification. | |
Signatures
Pursuant to the requirements of the Securities Exchange Act of 1934 and the Investment Company Act of 1940, the registrant has duly caused this report to be signed on its behalf by the undersigned, thereunto duly authorized.
Eaton Vance Growth Trust
| By: | /s/ Payson F. Swaffield | |
| Payson F. Swaffield | ||
| President | ||
| Date: | April 26, 2018 | |
Pursuant to the requirements of the Securities Exchange Act of 1934 and the Investment Company Act of 1940, this report has been signed below by the following persons on behalf of the registrant and in the capacities and on the dates indicated.
| By: | /s/ James F. Kirchner | |
| James F. Kirchner | ||
| Treasurer | ||
| Date: | April 26, 2018 | |
| By: | /s/ Payson F. Swaffield | |
| Payson F. Swaffield | ||
| President | ||
| Date: | April 26, 2018 | |
EATON VANCE GROWTH TRUST
FORM N-CSR
Exhibit 13(a)(2)(i)
CERTIFICATION
I, James F. Kirchner, certify that:
1. I have reviewed this report on Form N-CSR of Eaton Vance Growth Trust;
2. Based on my knowledge, this report does not contain any untrue statement of a material fact or omit to state a material fact necessary to make the statements made, in light of the circumstances under which such statements were made, not misleading with respect to the period covered by this report;
3. Based on my knowledge, the financial statements, and other financial information included in this report, fairly present in all material respects the financial condition, results of operations, changes in net assets, and cash flows (if the financial statements are required to include a statement of cash flows) of the registrant as of, and for, the periods presented in this report;
4. The registrant’s other certifying officer(s) and I are responsible for establishing and maintaining disclosure controls and procedures (as defined in Rule 30a-3(c) under the Investment Company Act of 1940) and internal control over financial reporting (as defined in Rule 30a-3(d) under the Investment Company Act of 1940) for the registrant and have:
(a) Designed such disclosure controls and procedures, or caused such disclosure controls and procedures to be designed under our supervision, to ensure that material information relating to the registrant, including its consolidated subsidiaries, is made known to us by others within those entities, particularly during the period in which this report is being prepared;
(b) Designed such internal control over financial reporting, or caused such internal control over financial reporting to be designed under our supervision, to provide reasonable assurance regarding the reliability of financial reporting and the preparation of financial statements for external purposes in accordance with generally accepted accounting principles;
(c) Evaluated the effectiveness of the registrant’s disclosure controls and procedures and presented in this report our conclusions about the effectiveness of the disclosure controls and procedures, as of a date within 90 days prior to the filing date of this report based on such evaluation; and
(d) Disclosed in this report any change in the registrant’s internal control over financial reporting that occurred during the second fiscal quarter of the period covered by this report that has materially affected, or is reasonably likely to materially affect, the registrant’s internal control over financial reporting; and
5. The registrant’s other certifying officer(s) and I have disclosed to the registrant’s auditors and the audit committee of the registrant’s board of directors (or persons performing the equivalent functions):
(a) All significant deficiencies and material weaknesses in the design or operation of internal control over financial reporting which are reasonably likely to adversely affect the registrant’s ability to record, process, summarize, and report financial information; and
(b) Any fraud, whether or not material, that involves management or other employees who have a significant role in the registrant’s internal control over financial reporting.
| Date: April 26, 2018 | /s/ James F. Kirchner | |||||
| James F. Kirchner | ||||||
| Treasurer |
EATON VANCE GROWTH TRUST
FORM N-CSR
Exhibit 13(a)(2)(ii)
CERTIFICATION
I, Payson F. Swaffield, certify that:
1. I have reviewed this report on Form N-CSR of Eaton Vance Growth Trust;
2. Based on my knowledge, this report does not contain any untrue statement of a material fact or omit to state a material fact necessary to make the statements made, in light of the circumstances under which such statements were made, not misleading with respect to the period covered by this report;
3. Based on my knowledge, the financial statements, and other financial information included in this report, fairly present in all material respects the financial condition, results of operations, changes in net assets, and cash flows (if the financial statements are required to include a statement of cash flows) of the registrant as of, and for, the periods presented in this report;
4. The registrant’s other certifying officer(s) and I are responsible for establishing and maintaining disclosure controls and procedures (as defined in Rule 30a-3(c) under the Investment Company Act of 1940) and internal control over financial reporting (as defined in Rule 30a-3(d) under the Investment Company Act of 1940) for the registrant and have:
(a) Designed such disclosure controls and procedures, or caused such disclosure controls and procedures to be designed under our supervision, to ensure that material information relating to the registrant, including its consolidated subsidiaries, is made known to us by others within those entities, particularly during the period in which this report is being prepared;
(b) Designed such internal control over financial reporting, or caused such internal control over financial reporting to be designed under our supervision, to provide reasonable assurance regarding the reliability of financial reporting and the preparation of financial statements for external purposes in accordance with generally accepted accounting principles;
(c) Evaluated the effectiveness of the registrant’s disclosure controls and procedures and presented in this report our conclusions about the effectiveness of the disclosure controls and procedures, as of a date within 90 days prior to the filing date of this report based on such evaluation; and
(d) Disclosed in this report any change in the registrant’s internal control over financial reporting that occurred during the second fiscal quarter of the period covered by this report that has materially affected, or is reasonably likely to materially affect, the registrant’s internal control over financial reporting; and
5. The registrant’s other certifying officer(s) and I have disclosed to the registrant’s auditors and the audit committee of the registrant’s board of directors (or persons performing the equivalent functions):
(a) All significant deficiencies and material weaknesses in the design or operation of internal control over financial reporting which are reasonably likely to adversely affect the registrant’s ability to record, process, summarize, and report financial information; and
(b) Any fraud, whether or not material, that involves management or other employees who have a significant role in the registrant’s internal control over financial reporting.
| Date: April 26, 2018 | /s/ Payson F. Swaffield | |||||
| Payson F. Swaffield | ||||||
| President |
Form N-CSR Item 13(b) Exhibit
CERTIFICATION PURSUANT TO
18 U.S.C. SECTION 1350,
AS ADOPTED PURSUANT TO
SECTION 906 OF THE SARBANES-OXLEY ACT OF 2002
The undersigned hereby certify in their capacity as Treasurer and President, respectively, of Eaton Vance Growth Trust (the “Trust”) that:
| (a) | the Annual Report of the Trust on Form N-CSR for the period ended February 28, 2018 (the “Report”) fully complies with the requirements of Section 13(a) or 15(d) of the Securities Exchange Act of 1934, as amended; and |
| (b) | the information contained in the Report fairly presents, in all material respects, the financial condition and the results of operations of the Trust for such period. |
A signed original of this written statement required by section 906 has been provided to the Trust and will be retained by the Trust and furnished to the Securities and Exchange Commission or its staff upon request.
Eaton Vance Growth Trust
| Date: April 26, 2018 |
| /s/ James F. Kirchner |
| James F. Kirchner |
| Treasurer |
| Date: April 26, 2018 |
| /s/ Payson F. Swaffield |
| Payson F. Swaffield |
| President |
Serious News for Serious Traders! Try StreetInsider.com Premium Free!
You May Also Be Interested In
- Port Houston Regular Commission Meeting
- Riding the Trend: Baros Maldives' Immersive Water Therapy
- Cybeats Responds to OTC Markets Request on Recent Promotional Activity
Create E-mail Alert Related Categories
SEC FilingsSign up for StreetInsider Free!
Receive full access to all new and archived articles, unlimited portfolio tracking, e-mail alerts, custom newswires and RSS feeds - and more!
