

Form N-CSR Chartwell Funds For: Oct 31
 Tweet
Tweet Share
Share| OMB APPROVAL |
|
OMB Number: 3235-0570
Expires: August 31, 2020
Estimated average burden hours per response: 20.6 |
UNITED STATES
SECURITIES AND EXCHANGE COMMISSION
Washington, D.C. 20549
FORM N-CSR
CERTIFIED SHAREHOLDER REPORT OF REGISTERED
MANAGEMENT INVESTMENT COMPANIES
| Investment Company Act file number | 811-23244 |
| The Chartwell Funds |
| (Exact name of registrant as specified in charter) |
| 1205 Westlakes Drive, Suite 100 Berwyn, Pennsylvania | 19312 |
| (Address of principal executive offices) | (Zip code) |
Timothy J. Riddle
|
| The Chartwell Funds, 1205 Westlakes Drive, Suite 100 Berwyn, Pennsylvania 19312 |
| (Name and address of agent for service) |
With a copy to:
Alan R. Gedrich, Esq.
Stradley Ronon Stevens & Young, LLP
2005 Market Street, Suite 2600
Philadelphia, PA 19103-7018
| Registrant's telephone number, including area code: | (610) 296-1400 |
| Date of fiscal year end: | October 31 | |
| Date of reporting period: | October 31, 2019 |
Form N-CSR is to be used by management investment companies to file reports with the Commission not later than 10 days after the transmission to stockholders of any report that is required to be transmitted to stockholders under Rule 30e-1 under the Investment Company Act of 1940 (17 CFR 270.30e-1). The Commission may use the information provided on Form N-CSR in its regulatory, disclosure review, inspection, and policymaking roles.
A registrant is required to disclose the information specified by Form N-CSR, and the Commission will make this information public. A registrant is not required to respond to the collection of information contained in Form N-CSR unless the Form displays a currently valid Office of Management and Budget ("OMB") control number. Please direct comments concerning the accuracy of the information collection burden estimate and any suggestions for reducing the burden to the Secretary, Securities and Exchange Commission, 450 Fifth Street, NW, Washington, DC 20549-0609. The OMB has reviewed this collection of information under the clearance requirements of 44 U.S.C. § 3507.
| Item 1. | Reports to Stockholders. |

Berwyn Income Fund (BERIX)
Chartwell Mid Cap Value Fund (BERCX)
Chartwell Small Cap Value Fund (CWSIX)
Chartwell Short Duration High Yield Fund (CWFIX)
Chartwell Small Cap Growth Fund (CWSGX)
ANNUAL REPORT
October 31, 2019
Beginning on January 1, 2021, as permitted by regulations adopted by the U.S. Securities and Exchange Commission, paper copies of the Funds’ shareholder reports like this one will no longer be sent by mail, unless you specifically request paper copies of the reports from the Funds or from your financial intermediary, such as a broker-dealer or bank. Instead, the reports will be made available on a website, and you will be notified by mail each time a report is posted and provided with a website link to access the report.
If you have already elected to receive shareholder reports electronically, you will not be affected by this change and you need not take any action. You may elect to receive shareholder reports and other communications from the Funds electronically by contacting the Funds at 1-888-995-5505 or, if you own these shares through a financial intermediary, by contacting your financial intermediary.
You may elect to receive all future reports in paper free of charge. You can inform the Funds that you wish to continue receiving paper copies of your shareholder reports by contacting the Funds at 1-888-995-5505. If you own shares through a financial intermediary, you may contact your financial intermediary or follow instructions included with this document to elect to continue to receive paper copies of your shareholder reports. Your election to receive reports in paper will apply to all Funds held with the Fund complex or at your financial intermediary.
THE CHARTWELL FUNDS
LETTER FROM THE PRESIDENT
October 31, 2019 (Unaudited)
Dear Fellow Shareholder,
As we close out our mutual funds’ fiscal year, I want to thank you for trusting The Chartwell Funds with your assets. At Chartwell, we are committed to enhancing shareholder value every day through the quality of our research and portfolio implementation. As I write this letter, the markets are reaching new highs. Whether we are in a bull market or one with extraordinary volatility, we believe, active management and experience matter. We feel, over time, that our disciplined approach will reward our shareholders. And for that, we thank you for the trust which you have placed in The Chartwell Funds.
Highlighted below are the performance summaries of each of our funds for the fiscal year ending October 31, 2019. We welcome any questions you may have on the fund(s) performance. Inquiries may be directed to Shareholder Services at 888.995.5505 or via our web-site at https://www.chartwellip.com/.
Thank you and we look forward to serving as your mutual funds’ manager in the coming year.
Best Regards,

Timothy Riddle
President of The Chartwell Funds
1
BERWYN INCOME FUND
MANAGEMENT DISCUSSION OF FUND PERFORMANCE
October 31, 2019 (Unaudited)
The 1-year total return to shareholders of the Berwyn Income Fund (BERIX) for the fiscal year ended October 31, 2019 was 7.22 percent. Net asset value increased from $13.18 on October 31, 2018, to $13.26 on October 31, 2019. For the fiscal year, BERIX underperformed the benchmarks which includes the Bloomberg Barclays U.S. Aggregate Bond Index* -11.51% and the FTSE US Broad Investment-Grade Bond Index (USBIG) -11.64%. On March 1, 2019, we changed the portfolio management team, which now includes five individuals with deep experience in both fixed income and equities investing. BERIX’s underperformance for the fiscal year was primarily attributed to some of the inherited legacy positions which had been a drag on the performance. Almost all of these positions have been removed from the fund. In turn, the management team has diversified the fund across a wide array of asset classes, including stocks, corporate credit, preferreds, mortgage backed securities, federal agency debt, Treasuries and Treasury Inflation Protected Securities. We believe the new portfolio is prudently positioned to partake in market upturns while providing downside protection to our investors through high-quality, liquid investments.
|
* |
Effective March 1, 2019, the Fund’s primary benchmark was changed from the FTSE US Broad Investment-Grade Bond Index to the Bloomberg Barclays U.S. Aggregate Bond Index, which more closely aligns with the Fund’s investments. |
2
CHARTWELL MID CAP VALUE FUND
MANAGEMENT DISCUSSION OF FUND PERFORMANCE
October 31, 2019 (Unaudited)
The total return to shareholders of the Chartwell Mid Cap Value Fund (BERCX) for the fiscal year ended October 31, 2019 was 11.47%. Net asset value increased from $15.07 on October 31, 2018, to $15.54 on October 31, 2019. For the fiscal year, BERCX outperformed its reference index, the Russell Midcap Value Index with a return of 10.08%. As 2018 closed with a weak market, BERCX outperformed the Russell Midcap Value benchmark by 195 bps* for Q4 2018, returning -13.00% vs. the benchmark return of -14.95%. Allocation was a modest contributor as a small cash position was helpful, offset by an underweight in the defensive REIT sector during the market correction. The portfolio’s overall quality tilt was a significant tailwind. Regarding sector selection, eight of twelve sectors made positive contributions.
For the first six months of 2019, BERCX underperformed the Russell Midcap Value benchmark by 78 bps, returning 17.24% vs. the benchmark return of 18.02%. Sector allocation was not particularly impactful, but cash created a meaningful drag. Selection was good in nine of twelve sectors with Consumer Services the standout, but poor selection in Technology largely offset those contributions. In the third quarter, BERCX outpaced the Russell Midcap Value benchmark by 55 bps, returning 1.77% vs. the benchmark return of 1.22%. Allocation had little effect thus selection was the primary driver of outperformance, with strong results in a handful of sectors offsetting weakness elsewhere. Health Care and Basic Industry were particularly strong.
As we closed the fiscal year, we made changes in Consumer Staples and Business Services and sold an underperformer in Basic Industry. BERCX ended with an overweight in Business Services, Basic Industry and Consumer Cyclical and underweights in Technology, Consumer Staples and Utilities. BERCX’s positioning results primarily from bottom-up selection decisions but includes a small influence from our top-down economic outlook and sector prospects. We believe a modestly pro-cyclical tilt, balanced by higher quality and lower leverage, seems the best way to position the Fund in the current macro environment.
|
* |
A basis point or “bps” represents a unit equal to 1/100th of 1%. |
The performance data quoted here represents past performance and past performance is not a guarantee of future results. Investment return and principal value will fluctuate so that an investor’s shares, when redeemed, may be worth more or less than their original cost. Current performance may be lower or higher than the performance information quoted. The most recent month end performance may be obtained by calling (888) 995-5505.
3
CHARTWELL SMALL CAP VALUE FUND
MANAGEMENT DISCUSSION OF FUND PERFORMANCE
October 31, 2019 (Unaudited)
The total return to shareholders of the Chartwell Small Cap Value Fund (CWSIX) for the fiscal year ended October 31, 2019 was 7.54%. Net asset value decreased from $18.79 on October 31, 2018, to $18.67 on October 31, 2019. However, for the fiscal year, CWSIX significantly outperformed its reference index, the Russell 2000 Value Index with a return of 3.22%. As 2018 closed with a weak market, CWSIX outpaced the Russell 2000 Value benchmark by 154 bps in Q4 2018, returning -17.13% vs. the benchmark return of -18.67%. Allocation contributed modestly, with an underweight in Energy offsetting the negative impact of an underweight in REITs and an overweight in Capital Spending. The portfolio’s overall quality tilt was a tailwind. Outperformance was primarily driven by selection, with seven of twelve sectors making positive contributions.
In 2019, CWSIX’s performance continued to outpace the benchmark. From January 1, 2019, through the third quarter, the fund outperformed the Russell 2000 Value benchmark by 289 bps, returning 15.71% vs. the benchmark return of 12.82%. Allocation was more impactful than usual, with an underweight in Energy adding to relative returns. But selection was still the primary driver of outperformance, with nine of twelve sectors making positive contributions. Basic Industry was the standout contributor, but Technology and Business Services were a drag on performance.
Late in the fiscal year, we did not make any new investments but trimmed several winners and added opportunistically to smaller positions. The fund ended the fiscal year with overweights in Capital Spending, Basic Industry, and Consumer Staples and underweights in Financial Services, REITs, and Health Care. The portfolio positioning results primarily from bottom-up selection decisions but includes a small influence from our top-down economic outlook and sector prospects. We believe a modestly pro-cyclical tilt, balanced by higher quality and lower leverage, is the best way to position the portfolio in the current macro environment.
4
CHARTWELL SHORT DURATION HIGH YIELD FUND
MANAGEMENT DISCUSSION OF FUND PERFORMANCE
October 31, 2019 (Unaudited)
The 1-year total return to shareholders of the Chartwell Short Duration High Yield Fund (CWFIX) for the fiscal year ended October 31, 2019 was 5.89 percent. Net asset value increased from $9.48 on October 31, 2018, to $9.68 on October 31, 2019, and monthly dividends totaled $0.3497 per share for the twelve month period. For the fiscal year, CWFIX underperformed its reference indices, the Bloomberg Barclays Intermediate US Government/Credit Index -8.74% and the ICE BofAML 1-3 Year BB US Cash Payout High Yield Index -6.95%. Compared to the Bloomberg Barclays Intermediate US Government/Credit index, a significant decline in interest rates during the fiscal year was a headwind for the fund’s relative performance. Compared to the ICE BofAML 1-3 Year BB US Cash Payout High Yield Index, fund expenses and an underweight position in the Technology sector hurt relative performance, which was partially offset by an overweight position and strong credit selection in the Capital Goods sector. As previously disclosed, the fund invests in a narrow slice of the high yield bond market, for which we believe there is no good, replicable index. The fund seeks to generate income with an additional focus on relatively low volatility over full market cycles.
At the end of the fiscal year, the fund’s largest sector weights were Energy (15.0%), Financial Services (14.5%) and Materials (14.1%). The fund’s Energy exposure was comprised of four midstream operators with primarily contracted revenues, one exploration and production company and a land drilling operator. Financial Services exposure was comprised of a diversified group of operators, including specialty real estate finance and consumer finance companies. Capital goods exposure included a heavy equipment manufacturer, an engineered aerospace products manufacturer and two packaging companies. Historically, modest economic growth and low inflation has been a good environment for high yield bond returns. Absent a recession, we believe a portfolio of higher quality short maturity high yield bonds may be a potential source of consistent income in the future.
5
CHARTWELL SMALL CAP GROWTH FUND
MANAGEMENT DISCUSSION OF FUND PERFORMANCE
October 31, 2019 (Unaudited)
The 1-year total return to shareholders of the Chartwell Small Cap Growth Fund (CWSGX) for the fiscal year ended October 31, 2019 was 2.46 percent. Net asset value increased from $11.55 on October 31, 2018, to $11.78 on October 31, 2019. For the fiscal year ended October 31, 2019, CWSGX underperformed its reference index, the Russell 2000 Growth Index, which returned 6.40%. As we closed out 2018, the Chartwell Small Cap Growth Fund returned -22.31% as compared to the Russell 2000 Growth Index return of -21.65% for Q4 2018. The fund slightly underperformed the index in what has been the most volatile quarter since the 2008-2009 meltdown. Rolling into 2019, the Chartwell Small Cap Growth Fund returned 18.39% as compared to the Russell 2000 Growth Index return of 17.14% for Q1 2019. The strategy significantly outperformed the index in a rebound from the miserable market conditions that were seen in Q4 2018. The drivers behind the recovery was a course correction by the Federal Reserve; the prior policy of interest rate tightening wasn’t appropriate given the worldwide economic slowdown, and the Fed has clearly stated that new the monetary policy is neutral and data dependent. The top performing sector compared to the Russell 2000 Growth benchmark was the Technology sector, where strong stock selection led to alpha for CWSGX. There really wasn’t any underperforming sector in Q1 2019. The largest detractor to performance was CWSGX’s portfolio cash weighting that averaged 7.5%, which in hindsight was too high.
In Q2 2019, CWSGX continued to outperform its reference benchmark returning 3.65% as compared to the Russell 2000 Growth Index return of 2.75%. CWSGX’s outperformance was a result of market conditions continuing to favor growth stocks; where in general, investors seem more willing to pay a premium for assumed growth during economic slowdowns. However, in Q3 2019, CWSGX returned -6.89% as compared to the Russell 2000 Growth Index return of -4.17% for Q3 2019. In October 2019, CWSGX returned 1.38 percent and underperformed the Russell 2000 Growth Index return -2.85%, as there was a significant rotation towards cyclical stocks that occurred during the month of September 2019. Looking ahead, we are monitoring the macro economic data as investors are concerned that the current slowdown in the manufacturing segment extends into the services/consumer-driven segment of the economy. We continue to find compelling investment opportunities, particularly in the Real Estate and medical device industries. Given the dramatically lower interest rates seen globally, REITs as an asset class should continue to be in favor to investors due to their attractive dividend yield. We remain focused on generating alpha and producing the strongest investment results over the long run.
6
BERWYN INCOME FUND
PERFORMANCE INFORMATION
October 31, 2019 (Unaudited)
Comparison of the Change in Value of a $10,000 Investment
in Berwyn Income Fund versus the Bloomberg Barclays U.S. Aggregate Bond Index, the FTSE US Broad Investment-Grade Bond Index (USBIG), the ICE BofAML High Yield Master II Index and the Lipper Income Fund Index.

This graph compares a hypothetical $10,000 investment in the Fund with a similar investment in the Bloomberg Barclays U.S. Aggregate Bond Index, the FTSE US Broad Investment-Grade Bond Index (USBIG), the ICE BofAML High Yield Master II Index, and the Lipper Income Fund Index for the periods shown. Results include the reinvestment of all dividends and capital gains.
Effective March 1, 2019, the Fund’s primary benchmark was changed from the FTSE US Broad Investment-Grade Bond Index to the Bloomberg Barclays U.S. Aggregate Bond Index, which more closely aligns with the Fund’s investments.
The Bloomberg Barclays U.S. Aggregate Bond Index is an unmanaged index composed of the Bloomberg Barclays U.S. Government/Credit Index and the Bloomberg Barclays U.S. Mortgage-Backed Securities Index and includes Treasury issues, agency issues, corporate bond issues and mortgage-backed securities and is intended to be generally representative of the bond market as a whole. The FTSE US Broad Investment-Grade Bond Index (USBIG) measures performance of US dollar-denominated bonds issued in the US investment-grade bond market. Introduced in 1985, the index covers US Treasury, government-sponsored, collateralized, and corporate debt and provides a reliable representation of the US investment-grade bond market. The ICE BofAML High Yield
7
BERWYN INCOME FUND
PERFORMANCE INFORMATION (Continued)
October 31, 2019 (Unaudited)
Master II Index is a broad-based index consisting of all US dollar denominated high-yield bonds with a minimum outstanding amount of $100 million and a maturity of over one year. The Lipper Income Fund Index consists of a small number of the largest mutual funds in a particular category as tracked by Lipper Inc. These indices do not reflect expenses, fees, or sales charge, which would lower performance. The indices are unmanaged, and they are not available for investment.
Average Annual Total Returns |
|||
1 Year |
5 Years |
10 Years |
|
Berwyn Income Fund |
7.22% |
3.24% |
5.95% |
Bloomberg Barclays U.S. Aggregate Bond Index |
11.51% |
3.24% |
3.73% |
FTSE US Broad Investment-Grade Bond Index (USBIG) |
11.64% |
3.26% |
3.70% |
ICE BofAML High Yield Master II Index |
8.32% |
5.17% |
7.69% |
Lipper Income Fund Index |
9.29% |
4.43% |
6.19% |
The Fund acquired the assets and liabilities of the Berwyn Income Fund (the “IMST Predecessor Fund”), a series of Investment Managers Series Trust, on July 17, 2017. The IMST Predecessor Fund acquired the assets and liabilities of the Berwyn Income Fund (the “Berwyn Funds Predecessor Fund,” and together with the IMST Predecessor Fund, the “Predecessor Funds”), a series of The Berwyn Funds, on April 29, 2016. As a result of the reorganizations, the Fund is the accounting successor of the Predecessor Funds. Performance results shown reflect the performance of the IMST Predecessor Fund for the period from April 29, 2016 through July 17, 2017, and the performance of the Berwyn Funds Predecessor Fund for the period prior to April 29, 2016.
The performance data quoted here represents past performance and past performance is not a guarantee of future results. Investment return and principal value will fluctuate so that an investor’s shares, when redeemed, may be worth more or less than their original cost. Current performance may be lower or higher than the performance information quoted. The most recent month end performance may be obtained by calling (888) 995-5505.
Gross and net expense ratios for the Fund were 0.68% and 0.64%, respectively, as stated in the current prospectus dated March 1, 2019. For the Fund’s current one year expense ratios, please refer to the Financial Highlights section of this report. The Fund’s advisor has contractually agreed to reduce its fees and/or reimburse other operating expenses of the Fund to ensure that annual operating expenses do not exceed 0.64% of the Fund’s average daily net assets. This agreement is in effect until March 1, 2020, and it may be terminated prior to such date only by the Trust’s Board of Trustees. In the absence of such fee reductions and expense reimbursements, the Fund’s returns would have been lower.
Returns reflect the reinvestment of distributions made by the Fund, if any. The graph and performance table above do not reflect the deduction of taxes that a shareholder would pay on Fund distributions or the redemption of Fund shares. Shares redeemed within 30 days of purchase will be charged a redemption fee of 1.00%.
8
CHARTWELL MID CAP VALUE FUND
PERFORMANCE INFORMATION
October 31, 2019 (Unaudited)
Comparison of the Change in Value of a $10,000 Investment
in Chartwell Mid Cap Value Fund versus the Russell Midcap Value Index,
the S&P Mid-Cap 400 Index and the S&P 500 Index.

This graph compares a hypothetical $10,000 investment in the Fund with a similar investment in the Russell Midcap Value Index, the S&P Mid-Cap 400 Index and the S&P 500 Index for the periods shown. Results include the reinvestment of all dividends and capital gains.
The Russell Midcap Value Index measures the performance of those Russell Midcap companies with lower price/book ratios and lower forecasted growth values. The S&P 500 Index tracks the stocks of 500 large US companies. The S&P Mid-Cap 400 Index measures the performance of 400 selected companies with a mid-sized market capitalization. These indices do not reflect expenses, fees, or sales charge, which would lower performance. The indices are unmanaged, and they are not available for investment.
9
CHARTWELL MID CAP VALUE FUND
PERFORMANCE INFORMATION (Continued)
October 31, 2019 (Unaudited)
Average Annual Total Returns |
|||
1 Year |
5 Years |
10 Years |
|
Chartwell Mid Cap Value Fund |
11.47% |
6.38% |
9.27% |
Russell Midcap Value Index |
10.08% |
6.95% |
12.90% |
S&P Mid-Cap 400 Index |
9.02% |
8.37% |
13.21% |
S&P 500 Index |
14.33% |
10.78% |
13.70% |
The Fund acquired the assets and liabilities of the Berwyn Cornerstone Fund (the “IMST Predecessor Fund”), a series of Investment Managers Series Trust, on July 17, 2017. The IMST Predecessor Fund acquired the assets and liabilities of the Berwyn Cornerstone Fund (the “Berwyn Funds Predecessor Fund,” and together with the IMST Predecessor Fund, the “Predecessor Funds”), a series of The Berwyn Funds, on April 29, 2016. As a result of the reorganizations, the Fund is the accounting successor of the Predecessor Funds. Performance results shown reflect the performance of the IMST Predecessor Fund for the period from April 29, 2016 through July 17, 2017, and the performance of the Berwyn Funds Predecessor Fund for the period prior to April 29, 2016. The Fund’s principal investment strategies differ from those of the Predecessor Funds; therefore, the performance and average annual total returns shown for periods prior to the reorganization may have differed had the Fund’s current investment strategy been in effect during those periods.
The performance data quoted here represents past performance and past performance is not a guarantee of future results. Investment return and principal value will fluctuate so that an investor’s shares, when redeemed, may be worth more or less than their original cost. Current performance may be lower or higher than the performance information quoted. The most recent month end performance may be obtained by calling (888) 995-5505.
Gross and net expense ratios for the Fund were 1.57% and 0.90%, respectively, as stated in the current prospectus dated March 1, 2019, supplemented September 3, 2019. For the Fund’s current one year expense ratios, please refer to the Financial Highlights section of this report. The Fund’s advisor has contractually agreed to reduce its fees and/or reimburse other operating expenses of the Fund to ensure that annual operating expenses do not exceed 0.90% of the Fund’s average daily net assets. This agreement is in effect until March 1, 2020, and it may be terminated prior to such date only by the Trust’s Board of Trustees. In the absence of such fee reductions and expense reimbursements, the Fund’s returns would have been lower.
Returns reflect the reinvestment of distributions made by the Fund, if any. The graph and performance table above do not reflect the deduction of taxes that a shareholder would pay on Fund distributions or the redemption of Fund shares. Shares redeemed within 30 days of purchase will be charged a redemption fee of 1.00%.
10
CHARTWELL SMALL CAP VALUE FUND
PERFORMANCE INFORMATION
October 31, 2019 (Unaudited)
Comparison of the Change in Value of a $10,000 Investment
in Chartwell Small Cap Value Fund versus the Russell 2000 Value Index.
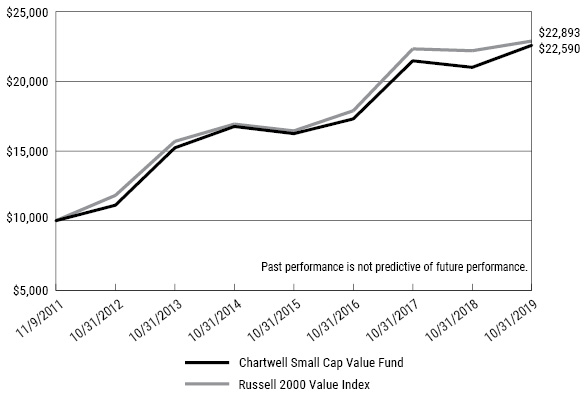
This graph compares a hypothetical $10,000 investment in the Fund’s shares, made at its inception, with a similar investment in the Russell 2000 Value Index. Results include the reinvestment of all dividends and capital gains. The performance figures include the performance for Class A shares for the periods prior to the start date of the current share class (March 16, 2012). Class A shares were liquidated on June 30, 2016.
The Russell 2000 Value Index measures the performance of the Russell 2000 companies with lower price-to-book ratios and lower forecasted growth values. This index does not reflect expenses, fees or sales charges, which would lower performance. The index is unmanaged, and it is not available for investment.
11
CHARTWELL SMALL CAP VALUE FUND
PERFORMANCE INFORMATION (Continued)
October 31, 2019 (Unaudited)
Average Annual Total Returns |
|||
1 Year |
5 Years |
Since |
|
Chartwell Small Cap Value Fund |
7.54% |
6.15% |
10.75% |
Russell 2000 Value Index |
3.22% |
6.24% |
10.94% |
(a) |
Inception date of the Fund was November 9, 2011. The performance figures include the performance for Class A for the periods prior to the start date of current share class (March 16, 2012). Class A shares were liquidated on June 30, 2016. |
On July 17, 2017, the Chartwell Small Cap Value Fund acquired all the assets and liabilities of the Chartwell Small Cap Value Fund, a series of the Investment Managers Series Trust (the “Predecessor Fund”). As a result of the acquisition, the Fund is the accounting successor of the Predecessor Fund. Performance results shown in the graph and the performance table above for the periods prior to July 17, 2017 reflect the performance of the Predecessor Fund.
The performance data quoted here represents past performance and past performance is not a guarantee of future results. Investment return and principal value will fluctuate so that an investor’s shares, when redeemed, may be worth more or less than their original cost. Current performance may be lower or higher than the performance information quoted. The most recent month end performance may be obtained by calling (888) 995-5505.
Gross and net expense ratios for the Fund were 1.08% and 1.05%, respectively, as stated in the current prospectus dated March 1, 2019. For the Fund’s current one year expense ratios, please refer to the Financial Highlights section of this report. The Fund’s advisor has contractually agreed to reduce its fees and/or reimburse other operating expenses of the Fund to ensure that annual operating expenses do not exceed 1.05% of the Fund’s average daily net assets. This agreement is in effect until March 1, 2020, and it may be terminated prior to such date only by the Trust’s Board of Trustees. In the absence of such fee reductions and expense reimbursements, the Fund’s returns would have been lower.
Returns reflect the reinvestment of distributions made by the Fund, if any. The graph and performance table above do not reflect the deduction of taxes that a shareholder would pay on Fund distributions or the redemption of Fund shares. Shares redeemed within 30 days of purchase will be charged a redemption fee of 1.00%.
12
CHARTWELL SHORT DURATION HIGH YIELD FUND
PERFORMANCE INFORMATION
October 31, 2019 (Unaudited)
Comparison of the Change in Value of a $10,000 Investment
in Chartwell Short Duration High Yield Fund versus
the ICE BofAML 1-3 Year BB US Cash Payout High Yield Index and
the Bloomberg Barclays Intermediate US Government/Credit Index.

This graph compares a hypothetical $10,000 investment in the Fund’s shares, made at its inception, with a similar investment in the ICE BofAML 1-3 Year BB US Cash Payout High Yield Index and the Bloomberg Barclays Intermediate US Government/Credit Index. Results include the reinvestment of all dividends and capital gains.
The ICE BofAML 1-3 Year BB US Cash Payout High Yield Index is a subset of the ICE BofAML US Cash Payout High Yield Index including all securities with a remaining term to final maturity less than 3 years and rated BB1 through BB3, inclusive. The Bloomberg Barclays Intermediate US Government/Credit Index is a broad-based flagship benchmark the measures the non-securitized component of the US Aggregate Index. It includes investment grade, US dollar-denominated, fixed-rate Treasuries, government-related and corporate securities. These indices do not reflect expenses, fees or sales charges, which would lower performance. These indices are unmanaged, and they are not available for investment.
13
CHARTWELL SHORT DURATION HIGH YIELD FUND
PERFORMANCE INFORMATION (Continued)
October 31, 2019 (Unaudited)
Average Annual Total Returns |
|||
1 Year |
5 Years |
Since |
|
Chartwell Short Duration High Yield Fund |
5.89% |
2.88% |
2.72% |
ICE BofAML 1-3 Year BB US Cash Payout High Yield Index |
6.95% |
4.34% |
4.13% |
Bloomberg Barclays Intermediate US Government/Credit Index |
8.74% |
2.61% |
2.62% |
(a) |
Commencement of operations was July 15, 2014. |
On July 17, 2017, the Chartwell Short Duration High Yield Fund acquired all the assets and liabilities of the Chartwell Short Duration High Yield Fund, a series of the Investment Managers Series Trust (the “Predecessor Fund”). As a result of the acquisition, the Fund is the accounting successor of the Predecessor Fund. Performance results shown in the graph and the performance table above for the periods prior to July 17, 2017 reflect the performance of the Predecessor Fund.
The performance data quoted here represents past performance and past performance is not a guarantee of future results. Investment return and principal value will fluctuate so that an investor’s shares, when redeemed, may be worth more or less than their original cost. Current performance may be lower or higher than the performance information quoted. The most recent month end performance may be obtained by calling (888) 995-5505.
Gross and net expense ratios for the Fund were 0.80% and 0.49%, respectively, as stated in the current prospectus dated March 1, 2019. For the Fund’s current one year expense ratios, please refer to the Financial Highlights section of this report. The Fund’s advisor has contractually agreed to reduce its fees and/or reimburse other operating expenses of the Fund to ensure that annual operating expenses do not exceed 0.49% of the Fund’s average daily net assets. This agreement is in effect until March 1, 2020, and it may be terminated prior to such date only by the Trust’s Board of Trustees. In the absence of such fee reductions and expense reimbursements, the Fund’s returns would have been lower.
Returns reflect the reinvestment of distributions made by the Fund, if any. The graph and performance table above do not reflect the deduction of taxes that a shareholder would pay on Fund distributions or the redemption of Fund shares. Shares redeemed within 30 days of purchase will be charged a redemption fee of 1.00%.
14
CHARTWELL SMALL CAP GROWTH FUND
PERFORMANCE INFORMATION
October 31, 2019 (Unaudited)
Comparison of the Change in Value of a $10,000 Investment
in Chartwell Small Cap Growth Fund versus the Russell 2000 Growth Index.
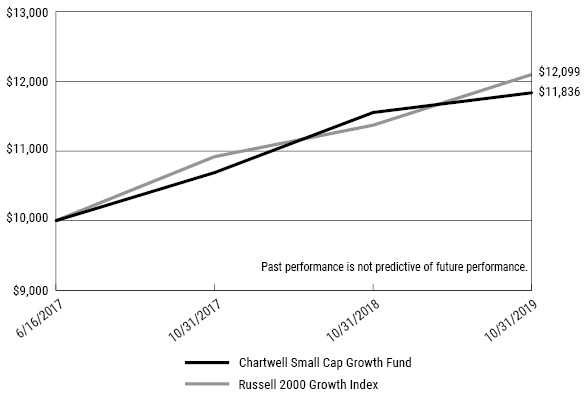
This graph compares a hypothetical $10,000 investment in the Fund, made at its inception, with a similar investment in the Russell 2000 Growth Index. Results include the reinvestment of all dividends and capital gains.
The Russell 2000 Growth Index measures the performance of the constituents that exhibit growth characteristics within the 2000 small-cap companies of the US stock market and is designed to represent the small-cap segment of the US equity universe. This index does not reflect expenses, fees or sales charge, which would lower performance. The index is unmanaged, and it is not available for investment.
15
CHARTWELL SMALL CAP GROWTH FUND
PERFORMANCE INFORMATION (Continued)
October 31, 2019 (Unaudited)
Average Annual Total Returns |
||
1 Year |
Since |
|
Chartwell Small Cap Growth Fund |
2.46% |
7.36% |
Russell 2000 Growth Index |
6.40% |
8.35% |
(a) |
Commencement of operations was June 16, 2017. |
The performance data quoted here represents past performance and past performance is not a guarantee of future results. Investment return and principal value will fluctuate so that an investor’s shares, when redeemed, may be worth more or less than their original cost. Current performance may be lower or higher than the performance information quoted. The most recent month end performance may be obtained by calling (888) 995-5505.
Gross and net expense ratios for the Fund were 2.16% and 1.06%, respectively, both including acquired fund fees and expenses of 0.01%, as stated in the current prospectus dated March 1, 2019. For the Fund’s current one year expense ratios, please refer to the Financial Highlights section of this report. The Fund’s advisor has contractually agreed to reduce its fees and/or reimburse other operating expenses of the Fund to ensure that annual operating expenses do not exceed 1.05% of the Fund’s average daily net assets. This agreement is in effect until March 1, 2020, and it may be terminated prior to such date only by the Trust’s Board of Trustees. In the absence of such fee reductions and expense reimbursements, the Fund’s returns would have been lower.
Returns reflect the reinvestment of distributions made by the Fund, if any. The graph and performance table above do not reflect the deduction of taxes that a shareholder would pay on Fund distributions or the redemption of Fund shares. Shares redeemed within 30 days of purchase will be charged a redemption fee of 1.00%.
16
BERWYN INCOME FUND |
||||||||
COMMON STOCKS — 28.6% |
Shares |
Value |
||||||
Communication Services — 0.3% |
||||||||
Diversified Telecommunication Services — 0.3% |
||||||||
AT&T, Inc. |
50,561 | $ | 1,946,093 | |||||
Verizon Communications, Inc. |
25,208 | 1,524,328 | ||||||
| 3,470,421 | ||||||||
Consumer Discretionary — 3.5% |
||||||||
Automobiles — 0.1% |
||||||||
General Motors Company |
23,812 | 884,854 | ||||||
Distributors — 0.9% |
||||||||
Genuine Parts Company |
91,142 | 9,349,346 | ||||||
Hotels, Restaurants & Leisure — 0.2% |
||||||||
Carnival Corporation |
20,561 | 881,861 | ||||||
Restaurant Brands International, Inc. |
12,155 | 795,423 | ||||||
Six Flags Entertainment Corporation |
9,562 | 403,421 | ||||||
| 2,080,705 | ||||||||
Household Durables — 0.3% |
||||||||
Toll Brothers, Inc. |
84,768 | 3,371,224 | ||||||
Internet & Direct Marketing Retail — 0.9% |
||||||||
Expedia Group, Inc. |
70,109 | 9,581,096 | ||||||
Specialty Retail — 0.7% |
||||||||
AutoZone, Inc. (a) |
5,456 | 6,243,737 | ||||||
Home Depot, Inc. (The) |
5,400 | 1,266,732 | ||||||
| 7,510,469 | ||||||||
Textiles, Apparel & Luxury Goods — 0.4% |
||||||||
Ralph Lauren Corporation |
36,202 | 3,477,564 | ||||||
Consumer Staples — 1.0% |
||||||||
Beverages — 0.1% |
||||||||
Coca-Cola Company (The) |
23,000 | 1,251,890 | ||||||
Food Products — 0.7% |
||||||||
Lamb Weston Holdings, Inc. |
85,406 | 6,665,084 | ||||||
Household Products — 0.1% |
||||||||
Procter & Gamble Company (The) |
7,801 | 971,303 | ||||||
See accompanying notes to financial statements. |
17 |
BERWYN INCOME FUND |
||||||||
COMMON STOCKS — 28.6% (Continued) |
Shares |
Value |
||||||
Consumer Staples — 1.0% (Continued) |
||||||||
Tobacco — 0.1% |
||||||||
Philip Morris International, Inc. |
14,139 | $ | 1,151,480 | |||||
Energy — 1.6% |
||||||||
Energy Equipment & Services — 0.1% |
||||||||
Helmerich & Payne, Inc. |
10,830 | 406,125 | ||||||
Oil, Gas & Consumable Fuels — 1.5% |
||||||||
ConocoPhillips |
14,927 | 823,971 | ||||||
Diamondback Energy, Inc. |
66,515 | 5,704,326 | ||||||
Exxon Mobil Corporation |
25,711 | 1,737,292 | ||||||
Hess Corporation |
14,956 | 983,357 | ||||||
Occidental Petroleum Corporation |
10,722 | 434,241 | ||||||
Pioneer Natural Resources Company |
43,085 | 5,300,317 | ||||||
Royal Dutch Shell plc - Class A - ADR (b) |
9,335 | 541,150 | ||||||
| 15,524,654 | ||||||||
Financials — 5.4% |
||||||||
Banks — 2.1% |
||||||||
BB&T Corporation |
15,855 | 841,108 | ||||||
First Hawaiian, Inc. |
28,657 | 783,196 | ||||||
JPMorgan Chase & Company |
20,372 | 2,544,870 | ||||||
KeyCorp |
295,096 | 5,302,875 | ||||||
M&T Bank Corporation |
22,307 | 3,491,715 | ||||||
Pinnacle Financial Partners, Inc. |
109,625 | 6,448,143 | ||||||
PNC Financial Services Group, Inc. (The) |
6,945 | 1,018,831 | ||||||
SunTrust Banks, Inc. |
12,339 | 843,247 | ||||||
| 21,273,985 | ||||||||
Capital Markets — 0.3% |
||||||||
Ares Capital Corporation |
72,052 | 1,318,552 | ||||||
CME Group, Inc. |
4,333 | 891,515 | ||||||
Morgan Stanley |
21,771 | 1,002,554 | ||||||
| 3,212,621 | ||||||||
Consumer Finance — 0.4% |
||||||||
Synchrony Financial |
123,010 | 4,350,864 | ||||||
Insurance — 2.5% |
||||||||
Allstate Corporation (The) |
89,230 | 9,495,856 | ||||||
Arthur J. Gallagher & Company |
13,530 | 1,234,207 | ||||||
Hanover Insurance Group, Inc. (The) |
53,538 | 7,051,490 | ||||||
Lincoln National Corporation |
117,911 | 6,659,613 | ||||||
18 |
See accompanying notes to financial statements. |
BERWYN INCOME FUND |
||||||||
COMMON STOCKS — 28.6% (Continued) |
Shares |
Value |
||||||
Financials — 5.4% (Continued) |
||||||||
Insurance — 2.5% (Continued) |
||||||||
Progressive Corporation (The) |
11,225 | $ | 782,382 | |||||
Prudential Financial, Inc. |
6,098 | 555,772 | ||||||
| 25,779,320 | ||||||||
Mortgage Real Estate Investment Trusts (REITs) — 0.1% |
||||||||
Blackstone Mortgage Trust, Inc. - Class A |
22,290 | 809,127 | ||||||
Health Care — 2.2% |
||||||||
Health Care Equipment & Supplies — 0.2% |
||||||||
Abbott Laboratories |
20,700 | 1,730,727 | ||||||
Health Care Providers & Services — 1.5% |
||||||||
Quest Diagnostics, Inc. (b) |
81,607 | 8,262,709 | ||||||
Universal Health Services, Inc. - Class B |
56,521 | 7,769,377 | ||||||
| 16,032,086 | ||||||||
Pharmaceuticals — 0.5% |
||||||||
Johnson & Johnson |
11,188 | 1,477,263 | ||||||
Merck & Company, Inc. |
22,829 | 1,978,361 | ||||||
Pfizer, Inc. |
43,110 | 1,654,131 | ||||||
| 5,109,755 | ||||||||
Industrials — 3.5% |
||||||||
Aerospace & Defense — 0.1% |
||||||||
Lockheed Martin Corporation |
3,160 | 1,190,309 | ||||||
Air Freight & Logistics — 0.1% |
||||||||
United Parcel Service, Inc. - Class B |
6,760 | 778,549 | ||||||
Construction & Engineering — 0.8% |
||||||||
Jacobs Engineering Group, Inc. |
84,768 | 7,932,589 | ||||||
Electrical Equipment — 0.7% |
||||||||
Emerson Electric Company |
16,672 | 1,169,541 | ||||||
Rockwell Automation, Inc. |
34,417 | 5,919,380 | ||||||
| 7,088,921 | ||||||||
Machinery — 0.9% |
||||||||
Caterpillar, Inc. |
6,310 | 869,518 | ||||||
Snap-on, Inc. (b) |
51,626 | 8,398,001 | ||||||
| 9,267,519 | ||||||||
Marine — 0.9% |
||||||||
Kirby Corporation (a) |
117,478 | 9,299,559 | ||||||
See accompanying notes to financial statements. |
19 |
BERWYN INCOME FUND |
||||||||
COMMON STOCKS — 28.6% (Continued) |
Shares |
Value |
||||||
Information Technology — 1.8% |
||||||||
Communications Equipment — 0.1% |
||||||||
Cisco Systems, Inc. |
16,546 | $ | 786,101 | |||||
Electronic Equipment, Instruments & Components — 0.7% |
||||||||
Dolby Laboratories, Inc. - Class A |
105,164 | 6,765,200 | ||||||
Semiconductors & Semiconductor Equipment — 0.2% |
||||||||
Intel Corporation |
26,743 | 1,511,782 | ||||||
Lam Research Corporation |
2,318 | 628,271 | ||||||
| 2,140,053 | ||||||||
Software — 0.7% |
||||||||
Microsoft Corporation |
11,191 | 1,604,453 | ||||||
Teradata Corporation (a) |
203,419 | 6,088,331 | ||||||
| 7,692,784 | ||||||||
Technology Hardware, Storage & Peripherals — 0.1% |
||||||||
Apple, Inc. |
1,610 | 400,504 | ||||||
Western Digital Corporation |
10,544 | 544,597 | ||||||
| 945,101 | ||||||||
Materials — 1.9% |
||||||||
Chemicals — 1.0% |
||||||||
Air Products & Chemicals, Inc. |
5,005 | 1,067,366 | ||||||
FMC Corporation |
103,991 | 9,515,177 | ||||||
| 10,582,543 | ||||||||
Construction Materials — 0.9% |
||||||||
Vulcan Materials Company |
64,373 | 9,196,970 | ||||||
Real Estate — 4.4% |
||||||||
Equity Real Estate Investment Trusts (REITs) — 4.4% |
||||||||
American Campus Communities, Inc. (b) |
118,548 | 5,925,029 | ||||||
Crown Castle International Corporation |
9,315 | 1,292,829 | ||||||
Duke Realty Corporation (b) |
333,975 | 11,735,881 | ||||||
Healthcare Trust of America, Inc. - Class A (b) |
309,347 | 9,589,757 | ||||||
Host Hotels & Resorts, Inc. |
362,018 | 5,933,475 | ||||||
Lamar Advertising Company - Class A (b) |
11,387 | 911,074 | ||||||
Mid-America Apartment Communities, Inc. |
63,608 | 8,840,876 | ||||||
Weyerhaeuser Company |
31,538 | 921,225 | ||||||
| 45,150,146 | ||||||||
Utilities — 3.0% |
||||||||
Electric Utilities — 0.3% |
||||||||
American Electric Power Company, Inc. (b) |
14,045 | 1,325,707 | ||||||
Exelon Corporation |
21,038 | 957,019 | ||||||
20 |
See accompanying notes to financial statements. |
BERWYN INCOME FUND |
||||||||
COMMON STOCKS — 28.6% (Continued) |
Shares |
Value |
||||||
Utilities — 3.0% (Continued) |
||||||||
Electric Utilities — 0.3% (Continued) |
||||||||
PPL Corporation |
30,695 | $ | 1,027,975 | |||||
| 3,310,701 | ||||||||
Multi-Utilities — 2.7% |
||||||||
Ameren Corporation |
108,096 | 8,399,059 | ||||||
CMS Energy Corporation |
159,976 | 10,225,666 | ||||||
Public Service Enterprise Group, Inc. |
149,141 | 9,442,117 | ||||||
| 28,066,842 | ||||||||
Total Common Stocks (Cost $278,790,938) |
$ | 294,188,587 | ||||||
PREFERRED STOCKS — 1.9% |
Shares |
Value |
||||||
Energy — 1.2% |
||||||||
Chesapeake Energy Corporation, 5.000% CV (c) |
418,633 | $ | 12,140,357 | |||||
Health Care — 0.1% |
||||||||
Becton, Dickinson and Company, 6.125% - Series A CV |
13,925 | 860,047 | ||||||
Industrials — 0.6% |
||||||||
Pitney Bowes, Inc., 6.700%, 3/7/2043 (c) |
336,655 | 6,988,958 | ||||||
Total Preferred Stocks (Cost $31,621,398) |
$ | 19,989,362 | ||||||
CORPORATE BONDS – 36.4% |
Par Value |
Value |
||||||
Communication Services – 1.4% |
||||||||
AT&T, Inc., 3.40%, due 5/15/2025 |
$ | 5,000,000 | $ | 5,239,013 | ||||
CenturyLink, Inc., 7.65%, due 3/15/2042 |
4,260,000 | 4,323,900 | ||||||
Cincinnati Bell, Inc., 8.00%, due 10/15/2025 (d) |
2,500,000 | 2,231,250 | ||||||
Consolidated Communications, Inc., 6.50%, due 10/1/2022 (b) |
2,500,000 | 2,256,250 | ||||||
T-Mobile USA, Inc., 4.00%, due 4/15/2022 |
750,000 | 774,157 | ||||||
| 14,824,570 | ||||||||
Consumer Discretionary — 9.2% |
||||||||
American Axle & Manufacturing, Inc., 6.25%, due 4/1/2025 (b) |
2,500,000 | 2,409,375 | ||||||
AutoNation, Inc., 3.80%, due 11/15/2027 (e) |
10,000,000 | 10,148,255 | ||||||
Bed Bath & Beyond, Inc., 5.165%, due 8/1/2044 |
10,263,000 | 7,444,267 | ||||||
Carriage Services, Inc., 6.625%, due 6/1/2026 (d) |
2,757,000 | 2,867,280 | ||||||
Clearwater Seafoods, Inc., 6.875%, due 5/1/2025 (d) |
2,500,000 | 2,568,750 | ||||||
See accompanying notes to financial statements. |
21 |
BERWYN INCOME FUND |
||||||||
CORPORATE BONDS – 36.4% (Continued) |
Par Value |
Value |
||||||
Consumer Discretionary — 9.2% (Continued) |
||||||||
Coach, Inc., 4.125%, due 7/15/2027 |
$ | 15,873,000 | $ | 16,169,385 | ||||
Diamond Sports Group, LLC/Diamond Sports Finance Company, 5.375%, due 8/15/2026 (d) |
2,000,000 | 2,090,000 | ||||||
Dollar Tree, Inc., 4.00%, due 5/15/2025 |
10,393,000 | 11,175,426 | ||||||
Downstream Development Authority of the Quapaw Tribe of Oklahoma, 10.50%, due 2/15/2023 (d) |
2,000,000 | 2,105,000 | ||||||
HLF Financing Sarl, LLC/Herbalife International, Inc., 7.25%, due 8/15/2026 (b)(d) |
2,500,000 | 2,615,625 | ||||||
L Brands, Inc., 5.25%, due 2/1/2028 (b) |
2,500,000 | 2,318,750 | ||||||
National CineMedia, LLC, 5.75%, due 8/15/2026 |
2,500,000 | 2,443,750 | ||||||
Penn National Gaming, Inc., 5.625%, due 1/15/2027 (b)(d) |
2,500,000 | 2,575,000 | ||||||
Quad Graphics, Inc., 7.00%, due 5/1/2022 (b) |
2,000,000 | 1,930,755 | ||||||
Sonic Automotive, Inc., 6.125%, due 3/15/2027 |
2,500,000 | 2,587,500 | ||||||
Tiffany & Company, 4.90%, due 10/1/2044 |
16,744,000 | 19,035,082 | ||||||
Truck Hero, Inc., 8.50%, due 4/21/2024 (d) |
2,600,000 | 2,580,500 | ||||||
Wolverine World Wide, Inc., 5.00%, due 9/1/2026 (d) |
1,500,000 | 1,518,750 | ||||||
| 94,583,450 | ||||||||
Consumer Staples — 0.5% |
||||||||
Clearwater Paper Corporation, 4.50%, due 2/1/2023 (b) |
2,500,000 | 2,509,375 | ||||||
KEHE Distributors, LLC, 8.625%, due 10/15/2026 (d) |
2,500,000 | 2,564,063 | ||||||
| 5,073,438 | ||||||||
Energy — 2.8% |
||||||||
Antero Resources Corporation, 5.375%, due 11/1/2021 (b) |
5,725,000 | 5,109,562 | ||||||
Blue Racer Midstream, LLC/Blue Racer Finance Corporation, 6.625%, due 7/15/2026 (d) |
1,903,000 | 1,779,305 | ||||||
Energy Transfer Partners, L.P., 6.25%, due 4/15/2049 (b) |
3,085,000 | 3,684,338 | ||||||
Ensign Drilling, Inc., 9.25%, due 4/15/2024 (d) |
4,000,000 | 3,400,000 | ||||||
Genesis Energy, L.P./Genesis Energy Finance Corporation, 5.625%, due 6/15/2024 (b) |
2,500,000 | 2,337,500 | ||||||
NLG Energy Partners, L.P., 6.125%, due 3/1/2025 |
2,490,000 | 2,303,250 | ||||||
Parkland Fuel Corporation, 5.875%, due 7/15/2027 (d) |
2,500,000 | 2,645,800 | ||||||
Sunoco, L.P./Sunoco Finance Corporation, Series WI, 4.875%, due 1/15/2023 |
4,000,000 | 4,105,000 | ||||||
Targa Resources Partners L.P., 5.25%, due 5/1/2023 |
4,000,000 | 4,015,000 | ||||||
| 29,379,755 | ||||||||
Financials — 11.2% |
||||||||
AAG FH, L.P./AAG FH Finco, Inc., 9.75%, due 7/15/2024 (d) |
2,550,000 | 2,352,375 | ||||||
Ares Capital Corporation, 3.50%, due 2/10/2023 |
6,185,000 | 6,279,577 | ||||||
Ares Capital Corporation, 4.20%, due 6/10/2024 (b) |
7,995,000 | 8,303,786 | ||||||
Bank of America Corporation, 2.878% (3MO LIBOR + 76), due 9/15/2026 (e) |
15,377,000 | 14,935,487 | ||||||
Citigroup, Inc., 3.352%, due 4/24/2025 |
8,900,000 | 9,259,201 | ||||||
22 |
See accompanying notes to financial statements. |
BERWYN INCOME FUND |
||||||||
CORPORATE BONDS – 36.4% (Continued) |
Par Value |
Value |
||||||
Financials — 11.2% (Continued) |
||||||||
Compass Group Diversified Holdings, LLC, 8.00%, due 5/1/2026 (d) |
$ | 2,500,000 | $ | 2,687,500 | ||||
Ford Motor Credit Company, LLC, 5.584%, due 3/18/2024 (b) |
6,360,000 | 6,778,289 | ||||||
General Motors Financial Company, Inc., 5.65%, due 1/17/2029 (b) |
6,669,000 | 7,456,982 | ||||||
Goldman Sachs Group, Inc. (The), 3.177% (3MO LIBOR + 105), due 6/5/2023 (e) |
10,536,000 | 10,629,247 | ||||||
Goldman Sachs Group, Inc. (The), 3.691%, due 6/5/2028 |
4,437,000 | 4,685,973 | ||||||
Icahn Enterprises, L.P., 5.875%, due 2/1/2022 |
4,000,000 | 4,035,000 | ||||||
Jefferies Group, LLC, 6.50%, due 1/20/2043 |
3,950,000 | 4,659,360 | ||||||
JPMorgan Chase & Company, 3.166% (3MO LIBOR + 123), due 10/24/2023 (e) |
17,734,000 | 18,043,731 | ||||||
Lincoln National Corporation, 3.05%, due 1/15/2030 |
4,330,000 | 4,373,979 | ||||||
Provident Funding Associates, L.P./PFG Finance Corporation, 6.375%, due 6/15/2025 (d) |
2,500,000 | 2,430,500 | ||||||
Springleaf Finance Corporation, 5.625%, due 3/15/2023 |
4,000,000 | 4,290,000 | ||||||
Starwood Property Trust, 5.00%, due 12/15/2021 |
3,580,000 | 3,705,300 | ||||||
| 114,906,287 | ||||||||
Health Care — 2.1% |
||||||||
Anthem, Inc., 3.65%, due 12/1/2027 (b) |
11,025,000 | 11,660,244 | ||||||
CVS Health Corporation, 4.30%, due 3/25/2028 (b) |
7,000,000 | 7,613,459 | ||||||
Horizon Pharma USA, Inc., 5.50%, due 8/1/2027 (d) |
2,435,000 | 2,541,531 | ||||||
| 21,815,234 | ||||||||
Industrials — 2.3% |
||||||||
ADT Corporation (The), 6.25%, due 10/15/2021 |
4,000,000 | 4,265,000 | ||||||
Avis Budget Group, Inc., 6.375%, due 4/1/2024 (d) |
2,000,000 | 2,082,500 | ||||||
FXI Holdings, Inc., 7.875%, due 11/1/2024 (d) |
2,400,000 | 2,132,400 | ||||||
Grinding Media, Inc., 7.375%, due 12/15/2023 (d) |
2,500,000 | 2,412,500 | ||||||
H&E Equipment Services, Inc., 5.625%, due 9/1/2025 |
2,500,000 | 2,628,125 | ||||||
Intertape Polymer Group, Inc., 7.00%, due 10/15/2026 (d) |
2,500,000 | 2,615,250 | ||||||
JPW Industries Holding Corporation, 9.00%, due 10/1/2024 (d) |
1,195,000 | 1,117,325 | ||||||
Neon Holdings, Inc., 10.125%, due 4/1/2026 (d) |
2,340,000 | 2,313,675 | ||||||
United Rentals North America, Inc., 4.625%, due 7/15/2023 |
4,000,000 | 4,086,000 | ||||||
| 23,652,775 | ||||||||
Information Technology — 2.1% |
||||||||
Apple, Inc., 3.85%, due 5/4/2043 |
4,000,000 | 4,489,966 | ||||||
Belo Corporation, 7.25%, due 9/15/2027 (b) |
2,500,000 | 2,850,000 | ||||||
CBS Radio, Inc., 7.25%, due 11/1/2024 (b)(d) |
2,500,000 | 2,606,250 | ||||||
Dell, Inc., 5.875%, due 6/15/2021 (d) |
2,644,000 | 2,684,665 | ||||||
Hewlett Packard Enterprise Company, 6.35%, due 10/15/2045 |
7,739,000 | 9,196,187 | ||||||
| 21,827,068 | ||||||||
See accompanying notes to financial statements. |
23 |
BERWYN INCOME FUND |
||||||||
CORPORATE BONDS – 36.4% (Continued) |
Par Value |
Value |
||||||
Materials — 2.6% |
||||||||
Cascades, Inc., 5.75%, due 7/15/2023 (d) |
$ | 1,750,000 | $ | 1,793,750 | ||||
Cliffs Natural Resources, Inc., 6.25%, due 10/1/2040 (b) |
4,320,000 | 3,672,000 | ||||||
Commercial Metals Company, 5.375%, due 7/15/2027 |
2,500,000 | 2,565,625 | ||||||
JW Aluminum Continuous Cast Company, 10.25%, due 6/1/2026 (d) |
2,500,000 | 2,631,250 | ||||||
Mercer International, Inc., 5.50%, due 1/15/2026 |
2,500,000 | 2,423,325 | ||||||
Mosaic Company (The), 4.05%, due 11/15/2027 (b) |
2,000,000 | 2,114,395 | ||||||
Mountain Province Diamonds, Inc., 8.00%, due 12/15/2022 (b)(d) |
2,500,000 | 2,425,000 | ||||||
Plastipak Holdings, Inc., 6.25%, due 10/15/2025 (b)(d) |
2,500,000 | 2,062,500 | ||||||
Schweitzer-Mauduit International, Inc., 6.875%, due 10/1/2026 (d) |
2,500,000 | 2,668,750 | ||||||
Steel Dynamics, Inc., 5.125%, due 10/1/2021 |
4,000,000 | 4,014,000 | ||||||
| 26,370,595 | ||||||||
Real Estate — 1.3% |
||||||||
Greystar Real Estate Partners, LLC, 5.75%, due 12/1/2025 (d) |
4,000,000 | 4,170,000 | ||||||
iStar, Inc., 6.00%, due 4/1/2022 |
1,560,000 | 1,600,950 | ||||||
iStar, Inc., 4.75%, due 10/1/2024 |
2,000,000 | 2,062,500 | ||||||
LGI Homes, Inc., 6.875%, due 7/15/2026 (d) |
2,500,000 | 2,587,500 | ||||||
TRI Pointe Group, Inc., 5.25%, due 6/1/2027 |
2,500,000 | 2,587,500 | ||||||
| 13,008,450 | ||||||||
Utilities — 0.9% |
||||||||
AES Corporation, 4.00%, due 3/15/2021 |
4,000,000 | 4,065,000 | ||||||
Suburban Propane Partners, L.P., 5.875%, due 3/1/2027 |
2,800,000 | 2,898,000 | ||||||
Talen Energy Supply, LLC, 6.625%, due 1/15/2028 (d) |
2,825,000 | 2,726,125 | ||||||
| 9,689,125 | ||||||||
Total Corporate Bonds (Cost $361,811,846) |
$ | 375,130,747 | ||||||
ASSET-BACKED SECURITIES — 1.5% |
Par Value |
Value |
||||||
Latitude Management Real Estate Investors, Inc., Series 2019-CRE3, 3.567% (1MO LIBOR + 140), due 12/22/2035 (d)(e) |
$ | 6,280,000 | $ | 6,307,444 | ||||
Onslow Bay Financial LLC, Series 2019-EXP3, 3.50%, due 10/25/2059 |
2,760,000 | 2,787,172 | ||||||
ORIX Credit Alliance Owner Trust, Series 2018-CRE1, 3.094% (1MO LIBOR + 118), due 6/15/2036 (d)(e) |
6,750,000 | 6,756,277 | ||||||
Total Asset-Backed Securities (Cost $15,827,757) |
$ | 15,850,893 | ||||||
24 |
See accompanying notes to financial statements. |
BERWYN INCOME FUND |
||||||||
MORTGAGE-BACKED SECURITIES — 5.9% |
Par Value |
Value |
||||||
Commercial — 5.9% |
||||||||
Agate Bay Mortgage Loan Trust, Series 2016-2, 3.50%, due 3/25/2046 (d) |
$ | 6,621,880 | $ | 6,752,881 | ||||
Bancorp Commercial Mortgage Trust (The), Series 2019-CRE5, 3.027% (1MO LIBOR + 100), due 1/15/2022 (d)(e) |
4,183,330 | 4,183,324 | ||||||
BDS Ltd., Series 2019-FL4, 3.013% (1MO LIBOR + 110), due 8/15/2036 (d)(e) |
3,640,000 | 3,641,128 | ||||||
Colony American Finance Ltd., Series 2019-1, 3.324%, due 1/15/2029 (d)(e) |
4,975,494 | 5,168,839 | ||||||
Credit Suisse Mortgage Trust, Series 2018-J1, 3.50%, due 2/25/2048 (d) |
6,467,665 | 6,587,122 | ||||||
Ellington Financial Mortgage Trust, Series 2019-1, 2.934%, due 6/25/2059 (d) |
5,547,007 | 5,581,511 | ||||||
Exantas Capital Corporation, Series 2019-RS07, 3.025% (1MO LIBOR + 100), due 4/15/2022 (d)(e) |
8,167,243 | 8,169,775 | ||||||
PSMC 2018-1 Trust, Series 2019-1, 4.00%, due 7/25/2049 (d) |
4,991,977 | 5,082,457 | ||||||
Starwood Mortgage Residential Trust, Series 2019-1, 2.941%, due 6/25/2049 (d) |
5,551,214 | 5,568,632 | ||||||
Wells Fargo Mortgage Back Securities, Series 2019-2, 4.00%, due 4/25/2049 (d) |
9,478,953 | 9,549,612 | ||||||
Total Mortgage-Backed Securities (Cost $60,151,430) |
$ | 60,285,281 | ||||||
U.S. GOVERNMENT AGENCY OBLIGATIONS — 15.8% |
Par Value |
Value |
||||||
Federal Farm Credit Bank — 5.1% |
||||||||
Federal Farm Credit Bank, 2.045% (1MO LIBOR + 200), 9/17/2021 (e) |
$ | 5,000,000 | $ | 4,988,701 | ||||
Federal Farm Credit Bank, 2.49%, 9/24/2025 |
5,555,000 | 5,556,081 | ||||||
Federal Farm Credit Bank, 2.99%, 4/16/2026 |
16,972,000 | 17,036,875 | ||||||
Federal Farm Credit Bank, 2.53%, 8/21/2026 |
5,000,000 | 4,962,308 | ||||||
Federal Farm Credit Bank, 2.625%, 2/12/2027 |
4,000,000 | 4,000,048 | ||||||
Federal Farm Credit Bank, 2.89%, 8/1/2028 |
10,550,000 | 10,550,034 | ||||||
Federal Farm Credit Bank, 3.50%, 2/1/2033 |
5,000,000 | 5,079,642 | ||||||
| 52,173,689 | ||||||||
See accompanying notes to financial statements. |
25 |
BERWYN INCOME FUND |
||||||||
U.S. GOVERNMENT AGENCY OBLIGATIONS — 15.8% (Continued) |
Par Value |
Value |
||||||
Federal Home Loan Bank — 1.5% |
||||||||
Federal Home Loan Bank, 3.13%, 10/30/2029 |
$ | 12,000,000 | $ | 12,000,061 | ||||
Federal Home Loan Bank, 3.50%, 6/6/2034 |
3,535,000 | 3,536,382 | ||||||
| 15,536,443 | ||||||||
Federal Home Loan Mortgage Corporation — 2.8% |
||||||||
Federal Home Loan Mortgage Corporation, 3.50%, 1/1/2048 |
9,583,399 | 9,932,103 | ||||||
Federal Home Loan Mortgage Corporation, 3.00%, 2/1/2048 |
4,423,032 | 4,516,894 | ||||||
Federal Home Loan Mortgage Corporation, 3.00%, 6/1/2049 |
6,756,959 | 6,873,623 | ||||||
Federal Home Loan Mortgage Corporation, 3.00%, 7/1/2049 |
7,265,825 | 7,390,994 | ||||||
| 28,713,614 | ||||||||
Federal National Mortgage Association — 4.4% |
||||||||
Federal National Mortgage Association, 3.00%, 9/1/2029 |
2,211,807 | 2,253,247 | ||||||
Federal National Mortgage Association, 2.45%, 4/7/2031 (f) |
645,000 | 644,577 | ||||||
Federal National Mortgage Association, 2.50%, 3/1/2032 |
15,695,703 | 15,927,172 | ||||||
Federal National Mortgage Association, 3.00%, 12/1/2033 |
5,034,285 | 5,154,801 | ||||||
Federal National Mortgage Association, 3.00%, 11/1/2038 |
9,585,236 | 9,864,512 | ||||||
Federal National Mortgage Association, 3.00%, 9/1/2049 |
11,857,135 | 12,067,797 | ||||||
| 45,912,106 | ||||||||
Small Business Administration — 2.0% |
||||||||
Small Business Administration Participation Certificates, 2.82%, 2/1/2037 |
12,886,786 | 13,312,936 | ||||||
Small Business Administration Participation Certificates, 3.20%, 3/1/2039 |
6,849,052 | 7,270,854 | ||||||
| 20,583,790 | ||||||||
Total U.S. Government Agency Obligations (Cost $160,687,346) |
$ | 162,919,642 | ||||||
U.S. TREASURY OBLIGATIONS — 7.0% |
Par Value |
Value |
||||||
U.S. Treasury Inflation-Protected Notes — 3.3% |
||||||||
U.S. Treasury Inflation-Protected Note, 1.125%, due 1/15/2021 |
$ | 6,350,820 | $ | 6,392,191 | ||||
U.S. Treasury Inflation-Protected Note, 0.625%, due 1/15/2024 |
6,817,210 | 6,932,731 | ||||||
U.S. Treasury Inflation-Protected Note, 0.875%, due 2/15/2047 |
18,546,384 | 20,059,420 | ||||||
| 33,384,342 | ||||||||
U.S. Treasury Notes — 3.7% |
||||||||
U.S. Treasury Note, 1.625%, due 7/31/2020 |
15,000,000 | 15,001,172 | ||||||
U.S. Treasury Note, 2.625%, due 3/31/2025 |
6,635,000 | 6,999,148 | ||||||
U.S. Treasury Note, 2.625%, due 2/15/2029 |
15,000,000 | 16,217,578 | ||||||
| 38,217,898 | ||||||||
Total U.S. Treasury Obligations (Cost $70,211,931) |
$ | 71,602,240 | ||||||
26 |
See accompanying notes to financial statements. |
BERWYN INCOME FUND |
||||||||
MONEY MARKET FUNDS — 2.8% |
Shares |
Value |
||||||
BlackRock Liquidity Funds FedFund Portfolio - Institutional Shares, 1.72% (g)(h) |
880,860 | $ | 880,860 | |||||
Fidelity Institutional Money Market Government Portfolio - Class I, 1.72% (g)(h) |
27,387,245 | 27,387,245 | ||||||
Invesco Short-Term Investment Trust Government & Agency Portfolio - Institutional Class, 1.71% (g)(h) |
778,142 | 778,142 | ||||||
Total Money Market Funds (Cost $29,046,247) |
$ | 29,046,247 | ||||||
Investments at Value — 99.9% (Cost $1,008,148,893) |
$ | 1,029,012,999 | ||||||
Other Assets in Excess of Liabilities — 0.1% |
1,234,627 | |||||||
Net Assets — 100.0% |
$ | 1,030,247,626 | ||||||
(a) |
Non-income producing security. |
(b) |
All or a portion of the security is on loan. The total value of the securities on loan as of October 31, 2019 is $27,569,496 (Note 8). |
(c) |
Security has a perpetual maturity date. |
(d) |
Security was purchased in a transaction exempt from registration in compliance with Rule 144A of the Securities Act of 1933. This security may be resold in transactions exempt from registration, normally to qualified institutional buyers. The total value of such securities is $153,931,671 as of October 31, 2019, representing 14.9% of net assets. |
(e) |
Variable rate security. Interest rate resets periodically. The rate shown is the effective interest rate as of October 31, 2019. For securities based on a published reference rate and spread, the reference rate and spread (in basis points) are indicated parenthetically. Certain variable rate securities are not based on a published reference rate and spread but are determined by the issuer or agent and are based on current market conditions. These securities, therefore, do not indicate a reference rate and spread. |
(f) |
Step coupon. Rate shown is the coupon in effect as of October 31, 2019. |
(g) |
The rate shown is the 7-day effective yield as of October 31, 2019. |
(h) |
All or a portion of this security was purchased with cash collateral held from securities on loan. The total value of such securities as of October 31, 2019 was $28,408,725 (Note 8). |
ADR – American Depositary Receipt |
|
CV – Convertible Security |
|
LIBOR – London Interbank Offered Rate |
|
See accompanying notes to financial statements. |
27 |
BERWYN INCOME FUND
SUMMARY OF INVESTMENTS
As of October 31, 2019 (Unaudited)
Security Type / Sector |
Percent of |
Common Stocks |
|
Financials |
5.4% |
Real Estate |
4.4% |
Consumer Discretionary |
3.5% |
Industrials |
3.5% |
Utilities |
3.0% |
Health Care |
2.2% |
Materials |
1.9% |
Information Technology |
1.8% |
Energy |
1.6% |
Consumer Staples |
1.0% |
Communication Services |
0.3% |
Total Common Stocks |
28.6% |
Preferred Stocks |
|
Energy |
1.2% |
Industrials |
0.6% |
Health Care |
0.1% |
Total Preferred Stocks |
1.9% |
Corporate Bonds |
|
Financials |
11.2% |
Consumer Discretionary |
9.2% |
Energy |
2.8% |
Materials |
2.6% |
Industrials |
2.3% |
Information Technology |
2.1% |
Health Care |
2.1% |
Communication Services |
1.4% |
Real Estate |
1.3% |
Utilities |
0.9% |
Consumer Staples |
0.5% |
Total Corporate Bonds |
36.4% |
Asset-Backed Securities |
1.5% |
Mortgage-Backed Securities |
5.9% |
U.S. Government Agency Obligations |
15.8% |
U.S. Treasury Obligations |
7.0% |
Money Market Funds |
2.8% |
Investments |
99.9% |
Other Assets in Excess of Liabilities |
0.1% |
Net Assets |
100.0% |
28
CHARTWELL MID CAP VALUE FUND |
||||||||
COMMON STOCKS — 93.8% |
Shares |
Value |
||||||
Consumer Discretionary — 12.4% |
||||||||
Distributors — 3.6% |
||||||||
Genuine Parts Company |
9,100 | $ | 933,478 | |||||
Household Durables — 1.3% |
||||||||
Toll Brothers, Inc. |
8,455 | 336,255 | ||||||
Internet & Direct Marketing Retail — 3.7% |
||||||||
Expedia Group, Inc. |
6,995 | 955,937 | ||||||
Specialty Retail — 2.4% |
||||||||
AutoZone, Inc. (a) |
538 | 615,676 | ||||||
Textiles, Apparel & Luxury Goods — 1.4% |
||||||||
Ralph Lauren Corporation |
3,613 | 347,065 | ||||||
Consumer Staples — 2.6% |
||||||||
Food Products — 2.6% |
||||||||
Lamb Weston Holdings, Inc. |
8,525 | 665,291 | ||||||
Energy — 4.3% |
||||||||
Oil, Gas & Consumable Fuels — 4.3% |
||||||||
Diamondback Energy, Inc. |
6,642 | 569,618 | ||||||
Pioneer Natural Resources Company |
4,295 | 528,371 | ||||||
| 1,097,989 | ||||||||
Financials — 16.6% |
||||||||
Banks — 5.9% |
||||||||
KeyCorp |
29,450 | 529,216 | ||||||
M&T Bank Corporation |
2,225 | 348,279 | ||||||
Pinnacle Financial Partners, Inc. |
10,940 | 643,491 | ||||||
| 1,520,986 | ||||||||
Consumer Finance — 1.7% |
||||||||
Synchrony Financial |
12,275 | 434,167 | ||||||
Insurance — 9.0% |
||||||||
Allstate Corporation (The) |
8,905 | 947,670 | ||||||
Hanover Insurance Group, Inc. (The) |
5,350 | 704,649 | ||||||
Lincoln National Corporation |
11,755 | 663,922 | ||||||
| 2,316,241 | ||||||||
See accompanying notes to financial statements. |
29 |
CHARTWELL MID CAP VALUE FUND |
||||||||
COMMON STOCKS — 93.8% (Continued) |
Shares |
Value |
||||||
Health Care — 6.2% |
||||||||
Health Care Providers & Services — 6.2% |
||||||||
Quest Diagnostics, Inc. |
8,156 | $ | 825,795 | |||||
Universal Health Services, Inc. - Class B |
5,637 | 774,862 | ||||||
| 1,600,657 | ||||||||
Industrials — 12.2% |
||||||||
Construction & Engineering — 3.1% |
||||||||
Jacobs Engineering Group, Inc. |
8,455 | 791,219 | ||||||
Electrical Equipment — 2.3% |
||||||||
Rockwell Automation, Inc. |
3,425 | 589,066 | ||||||
Machinery — 3.2% |
||||||||
Snap-on, Inc. |
5,140 | 836,124 | ||||||
Marine — 3.6% |
||||||||
Kirby Corporation (a) |
11,713 | 927,201 | ||||||
Information Technology — 5.0% |
||||||||
Electronic Equipment, Instruments & Components — 2.6% |
||||||||
Dolby Laboratories, Inc. - Class A |
10,495 | 675,144 | ||||||
Software — 2.4% |
||||||||
Teradata Corporation (a) |
20,299 | 607,549 | ||||||
Materials — 7.3% |
||||||||
Chemicals — 3.7% |
||||||||
FMC Corporation |
10,369 | 948,763 | ||||||
Construction Materials — 3.6% |
||||||||
Vulcan Materials Company |
6,425 | 917,940 | ||||||
Real Estate — 16.3% |
||||||||
Equity Real Estate Investment Trusts (REITs) — 16.3% |
||||||||
American Campus Communities, Inc. |
11,835 | 591,513 | ||||||
Duke Realty Corporation |
33,335 | 1,171,392 | ||||||
Healthcare Trust of America, Inc. - Class A (b) |
30,879 | 957,249 | ||||||
Host Hotels & Resorts, Inc. |
36,125 | 592,089 | ||||||
Mid-America Apartment Communities, Inc. |
6,355 | 883,281 | ||||||
| 4,195,524 | ||||||||
30 |
See accompanying notes to financial statements. |
CHARTWELL MID CAP VALUE FUND |
||||||||
COMMON STOCKS — 93.8% (Continued) |
Shares |
Value |
||||||
Utilities — 10.9% |
||||||||
Multi-Utilities — 10.9% |
||||||||
Ameren Corporation |
10,795 | $ | 838,772 | |||||
CMS Energy Corporation |
15,960 | 1,020,163 | ||||||
Public Service Enterprise Group, Inc. |
14,895 | 943,002 | ||||||
| 2,801,937 | ||||||||
Total Common Stocks (Cost $22,642,267) |
$ | 24,114,209 | ||||||
MONEY MARKET FUNDS — 4.8% |
Shares |
Value |
||||||
BlackRock Liquidity Funds FedFund Portfolio - Institutional Shares, 1.72% (c)(d) |
700 | $ | 700 | |||||
Fidelity Institutional Money Market Government Portfolio - Class I, 1.72% (c)(d) |
1,240,156 | 1,240,156 | ||||||
Invesco Short-Term Investment Trust Government & Agency Portfolio - Institutional Class, 1.71% (c)(d) |
618 | 618 | ||||||
Total Money Market Funds (Cost $1,241,474) |
$ | 1,241,474 | ||||||
Investments at Value – 98.6% (Cost $23,883,741) |
$ | 25,355,683 | ||||||
Other Assets in Excess of Liabilities — 1.4% |
347,849 | |||||||
Net Assets — 100.0% |
$ | 25,703,532 | ||||||
(a) |
Non-income producing security. |
(b) |
All or a portion of the security is on loan. The total value of the securities on loan as of October 31, 2019 is $21,855 (Note 8). |
(c) |
The rate shown is the 7-day effective yield as of October 31, 2019. |
(d) |
All or a portion of this security was purchased with cash collateral held from securities on loan. The total value of such securities as of October 31, 2019 was $22,560 (Note 8). |
See accompanying notes to financial statements. |
31 |
CHARTWELL MID CAP VALUE FUND
SUMMARY OF INVESTMENTS
As of October 31, 2019 (Unaudited)
Security Type / Sector |
Percent of |
Common Stocks |
|
Financials |
16.6% |
Real Estate |
16.3% |
Consumer Discretionary |
12.4% |
Industrials |
12.2% |
Utilities |
10.9% |
Materials |
7.3% |
Health Care |
6.2% |
Information Technology |
5.0% |
Energy |
4.3% |
Consumer Staples |
2.6% |
Total Common Stocks |
93.8% |
Money Market Funds |
4.8% |
Investments |
98.6% |
Other Assets in Excess of Liabilities |
1.4% |
Net Assets |
100.0% |
32
CHARTWELL SMALL CAP VALUE FUND |
||||||||
COMMON STOCKS — 96.9% |
Shares |
Value |
||||||
Communication Services — 1.4% |
||||||||
Media — 1.4% |
||||||||
Scholastic Corporation |
62,290 | $ | 2,398,165 | |||||
Consumer Discretionary — 7.3% |
||||||||
Hotels, Restaurants & Leisure — 3.6% |
||||||||
Cheesecake Factory, Inc. (The) (a) |
53,325 | 2,228,452 | ||||||
Denny’s Corporation (b) |
197,810 | 3,979,937 | ||||||
| 6,208,389 | ||||||||
Household Durables — 1.1% |
||||||||
TRI Pointe Group, Inc. (b) |
124,875 | 1,965,533 | ||||||
Textiles, Apparel & Luxury Goods — 2.6% |
||||||||
G-III Apparel Group Ltd. (b) |
58,880 | 1,478,477 | ||||||
Oxford Industries, Inc. |
17,125 | 1,179,227 | ||||||
Wolverine World Wide, Inc. |
61,925 | 1,837,934 | ||||||
| 4,495,638 | ||||||||
Consumer Staples — 2.8% |
||||||||
Food Products — 2.8% |
||||||||
Fresh Del Monte Produce, Inc. |
60,516 | 1,930,460 | ||||||
Sanderson Farms, Inc. (a) |
19,150 | 2,964,612 | ||||||
| 4,895,072 | ||||||||
Energy — 2.7% |
||||||||
Energy Equipment & Services — 2.2% |
||||||||
Apergy Corporation (b) |
64,250 | 1,617,172 | ||||||
Cactus, Inc. - Class A (b) |
72,000 | 2,139,840 | ||||||
| 3,757,012 | ||||||||
Oil, Gas & Consumable Fuels — 0.5% |
||||||||
SRC Energy, Inc. (b) |
280,875 | 876,330 | ||||||
Financials — 24.3% |
||||||||
Banks — 18.5% |
||||||||
Columbia Banking System, Inc. |
69,045 | 2,713,469 | ||||||
CVB Financial Corporation |
83,700 | 1,739,286 | ||||||
First Financial Bancorp (a) |
90,665 | 2,125,188 | ||||||
First Midwest Bancorp, Inc. |
91,900 | 1,887,626 | ||||||
FNB Corporation |
112,350 | 1,354,941 | ||||||
Hope Bancorp, Inc. |
119,510 | 1,705,408 | ||||||
Independent Bank Group, Inc. |
44,643 | 2,387,061 | ||||||
Renasant Corporation |
55,650 | 1,931,055 | ||||||
Sandy Spring Bancorp, Inc. |
72,575 | 2,503,837 | ||||||
See accompanying notes to financial statements. |
33 |
CHARTWELL SMALL CAP VALUE FUND |
||||||||
COMMON STOCKS — 96.9% (Continued) |
Shares |
Value |
||||||
Financials — 24.3% (Continued) |
||||||||
Banks — 18.5% (Continued) |
||||||||
South State Corporation |
32,320 | $ | 2,548,755 | |||||
Synovus Financial Corporation |
37,225 | 1,260,811 | ||||||
TowneBank |
72,992 | 2,050,345 | ||||||
UMB Financial Corporation |
28,370 | 1,851,426 | ||||||
Umpqua Holdings Corporation |
98,900 | 1,564,598 | ||||||
United Bankshares, Inc. |
42,750 | 1,690,335 | ||||||
United Community Banks, Inc. |
89,570 | 2,705,910 | ||||||
| 32,020,051 | ||||||||
Consumer Finance — 1.7% |
||||||||
PRA Group, Inc. (b) |
84,170 | 2,855,888 | ||||||
Insurance — 4.1% |
||||||||
American Equity Investment Life Holding Company |
71,113 | 1,755,069 | ||||||
Argo Group International Holdings Ltd. |
49,147 | 3,040,725 | ||||||
Selective Insurance Group, Inc. |
34,057 | 2,354,019 | ||||||
| 7,149,813 | ||||||||
Health Care — 2.1% |
||||||||
Biotechnology — 1.3% |
||||||||
Eagle Pharmaceuticals, Inc. (b) |
35,960 | 2,254,692 | ||||||
Pharmaceuticals — 0.8% |
||||||||
Phibro Animal Health Corporation - Class A |
56,975 | 1,365,121 | ||||||
Industrials — 24.6% |
||||||||
Air Freight & Logistics — 1.0% |
||||||||
Hub Group, Inc. - Class A (b) |
39,805 | 1,823,069 | ||||||
Commercial Services & Supplies — 6.3% |
||||||||
Interface, Inc. |
160,135 | 2,663,045 | ||||||
Knoll, Inc. |
88,466 | 2,365,581 | ||||||
Matthews International Corporation - Class A (a) |
27,820 | 1,028,784 | ||||||
McGrath RentCorp |
33,284 | 2,539,902 | ||||||
UniFirst Corporation |
11,075 | 2,224,303 | ||||||
| 10,821,615 | ||||||||
Construction & Engineering — 1.1% |
||||||||
Dycom Industries, Inc. (b) |
43,575 | 1,986,584 | ||||||
34 |
See accompanying notes to financial statements. |
CHARTWELL SMALL CAP VALUE FUND |
||||||||
COMMON STOCKS — 96.9% (Continued) |
Shares |
Value |
||||||
Industrials — 24.6% (Continued) |
||||||||
Machinery — 10.1% |
||||||||
Barnes Group, Inc. |
40,225 | $ | 2,351,151 | |||||
EnPro Industries, Inc. |
17,658 | 1,228,114 | ||||||
ESCO Technologies, Inc. |
33,295 | 2,813,095 | ||||||
Franklin Electric Company, Inc. |
38,255 | 2,060,032 | ||||||
Harsco Corporation (b) |
117,300 | 2,377,671 | ||||||
ITT, Inc. |
63,525 | 3,776,561 | ||||||
Mueller Water Products, Inc. - Series A |
237,810 | 2,782,377 | ||||||
| 17,389,001 | ||||||||
Professional Services — 2.4% |
||||||||
Korn Ferry |
52,665 | 1,932,279 | ||||||
TrueBlue, Inc. (b) |
97,745 | 2,238,360 | ||||||
| 4,170,639 | ||||||||
Road & Rail — 2.1% |
||||||||
Saia, Inc. (b) |
41,051 | 3,661,749 | ||||||
Trading Companies & Distributors — 1.6% |
||||||||
Rush Enterprises, Inc. - Class A |
62,485 | 2,729,970 | ||||||
Information Technology — 11.3% |
||||||||
Electronic Equipment, Instruments & Components — 2.4% |
||||||||
Plexus Corporation (a)(b) |
55,630 | 4,113,282 | ||||||
IT Services — 4.6% |
||||||||
CACI International, Inc. - Class A (b) |
19,870 | 4,445,913 | ||||||
ManTech International Corporation - Class A |
44,527 | 3,525,648 | ||||||
| 7,971,561 | ||||||||
Semiconductors & Semiconductor Equipment — 1.8% |
||||||||
Diodes, Inc. (a)(b) |
65,999 | 3,078,853 | ||||||
Software — 2.5% |
||||||||
CommVault Systems, Inc. (a)(b) |
43,773 | 2,174,205 | ||||||
Progress Software Corporation |
55,200 | 2,201,376 | ||||||
| 4,375,581 | ||||||||
Materials — 2.8% |
||||||||
Chemicals — 1.2% |
||||||||
Minerals Technologies, Inc. |
42,520 | 2,102,614 | ||||||
Paper & Forest Products — 1.6% |
||||||||
P.H. Glatfelter Company |
152,130 | 2,738,340 | ||||||
See accompanying notes to financial statements. |
35 |
CHARTWELL SMALL CAP VALUE FUND |
||||||||
COMMON STOCKS — 96.9% (Continued) |
Shares |
Value |
||||||
Real Estate — 11.1% |
||||||||
Equity Real Estate Investment Trusts (REITs) — 11.1% |
||||||||
Empire State Realty Trust, Inc. - Class A (a) |
103,490 | $ | 1,497,500 | |||||
First Industrial Realty Trust, Inc. |
69,775 | 2,938,225 | ||||||
Healthcare Realty Trust, Inc. |
81,651 | 2,839,005 | ||||||
Kite Realty Group Trust |
63,587 | 1,133,120 | ||||||
Pebblebrook Hotel Trust |
56,225 | 1,445,545 | ||||||
Piedmont Office Realty Trust, Inc. - Class A |
124,565 | 2,795,239 | ||||||
PS Business Parks, Inc. |
21,372 | 3,858,715 | ||||||
STAG Industrial, Inc. |
84,393 | 2,619,559 | ||||||
| 19,126,908 | ||||||||
Utilities — 6.5% |
||||||||
Electric Utilities — 0.5% |
||||||||
El Paso Electric Company |
13,770 | 918,597 | ||||||
Gas Utilities — 1.6% |
||||||||
Southwest Gas Holdings, Inc. |
30,860 | 2,694,078 | ||||||
Multi-Utilities — 4.4% |
||||||||
Avista Corporation |
39,920 | 1,917,358 | ||||||
Black Hills Corporation |
26,939 | 2,123,601 | ||||||
NorthWestern Corporation |
48,293 | 3,502,208 | ||||||
| 7,543,167 | ||||||||
Total Common Stocks (Cost $140,353,932) |
$ | 167,487,312 | ||||||
36 |
See accompanying notes to financial statements. |
CHARTWELL SMALL CAP VALUE FUND |
||||||||
MONEY MARKET FUNDS — 2.4% |
Shares |
Value |
||||||
BlackRock Liquidity Funds FedFund Portfolio - Institutional Shares, 1.72% (c)(d) |
115,494 | $ | 115,494 | |||||
Fidelity Institutional Money Market Government Portfolio - Class I, 1.72% (c)(d) |
3,868,121 | 3,868,121 | ||||||
Invesco Short-Term Investment Trust Government & Agency Portfolio - Institutional Class, 1.71% (c)(d) |
102,026 | 102,026 | ||||||
Total Money Market Funds (Cost $4,085,641) |
$ | 4,085,641 | ||||||
Investments at Value — 99.3% (Cost $144,439,573) |
$ | 171,572,953 | ||||||
Other Assets in Excess of Liabilities — 0.7% |
1,179,567 | |||||||
Net Assets — 100.0% |
$ | 172,752,520 | ||||||
(a) |
All or a portion of the security is on loan. The total value of the securities on loan as of October 31, 2019 is $3,618,367 (Note 8). |
(b) |
Non-income producing security. |
(c) |
The rate shown is the 7-day effective yield as of October 31, 2019. |
(d) |
This security was purchased with cash collateral held from securities on loan. The total value of such securities as of October 31, 2019 was $3,724,813 (Note 8). |
See accompanying notes to financial statements. |
37 |
CHARTWELL SMALL CAP VALUE FUND
SUMMARY OF INVESTMENTS
As of October 31, 2019 (Unaudited)
Security Type / Sector |
Percent of |
Common Stocks |
|
Industrials |
24.6% |
Financials |
24.3% |
Information Technology |
11.3% |
Real Estate |
11.1% |
Consumer Discretionary |
7.3% |
Utilities |
6.5% |
Consumer Staples |
2.8% |
Materials |
2.8% |
Energy |
2.7% |
Health Care |
2.1% |
Communication Services |
1.4% |
Total Common Stocks |
96.9% |
Money Market Funds |
2.4% |
Investments |
99.3% |
Other Assets in Excess of Liabilities |
0.7% |
Net Assets |
100.0% |
38
CHARTWELL SHORT DURATION HIGH YIELD FUND |
||||||||
CORPORATE BONDS — 94.3% |
Par Value |
Value |
||||||
Communication Services — 10.2% |
||||||||
AMC Networks, Inc., 5.00%, due 4/1/2024 |
$ | 2,300,000 | $ | 2,342,688 | ||||
CCO Holdings, LLC, 5.25%, due 9/30/2022 |
1,900,000 | 1,926,125 | ||||||
CCO Holdings, LLC, 5.125%, due 2/15/2023 |
800,000 | 817,000 | ||||||
Level 3 Financing, Inc., 5.375%, due 8/15/2022 |
1,597,000 | 1,602,989 | ||||||
Tegna, Inc., 5.125%, due 7/15/2020 |
343,000 | 343,857 | ||||||
T-Mobile USA, Inc., 4.00%, due 4/15/2022 |
2,300,000 | 2,374,083 | ||||||
| 9,406,742 | ||||||||
Consumer Discretionary — 9.5% |
||||||||
Fiat Chrysler Automobiles N.V., 4.50%, due 4/15/2020 |
2,300,000 | 2,317,250 | ||||||
GLP Capital, L.P./GLP Financing II, Inc., 4.375%, due 4/15/2021 |
2,300,000 | 2,346,552 | ||||||
Group 1 Automotive, Inc., 5.00%, due 6/1/2022 |
1,900,000 | 1,921,945 | ||||||
L Brands, Inc., 5.625%, due 2/15/2022 |
265,000 | 278,912 | ||||||
Lennar Corporation, 4.50%, due 11/15/2019 |
1,900,000 | 1,900,950 | ||||||
| 8,765,609 | ||||||||
Energy — 15.0% |
||||||||
Antero Resources Corporation, 5.375%, due 11/1/2021 |
2,300,000 | 2,052,750 | ||||||
DCP Midstream Operating L.P., 5.35%, due 3/15/2020 (a) |
2,300,000 | 2,317,250 | ||||||
Energy Transfer Operating, L.P., 7.50%, due 10/15/2020 |
1,865,000 | 1,956,865 | ||||||
Ensign Drilling, Inc., 9.25%, due 4/15/2024 (a) |
2,299,000 | 1,954,150 | ||||||
Sunoco, L.P./Sunoco Finance Corporation, Series WI, 4.875%, due 1/15/2023 |
2,300,000 | 2,360,375 | ||||||
Targa Resources Partners, L.P./Targa Resources Partners Finance Corporation, 5.25%, due 5/1/2023 |
1,989,000 | 1,996,459 | ||||||
Vistra Energy Corporation, 5.875%, due 6/1/2023 |
1,160,000 | 1,184,650 | ||||||
| 13,822,499 | ||||||||
Financials — 14.5% |
||||||||
CIT Group, Inc., 5.00%, due 8/15/2022 |
1,900,000 | 2,019,833 | ||||||
Icahn Enterprises, L.P., 6.25%, due 2/1/2022 |
2,300,000 | 2,354,625 | ||||||
Navient Corporation, 5.875%, due 3/25/2021 |
1,010,000 | 1,047,895 | ||||||
Navient Corporation, 6.625%, due 7/26/2021 |
1,215,000 | 1,283,344 | ||||||
SLM Corporation, 5.125%, due 4/5/2022 (b) |
1,745,000 | 1,801,712 | ||||||
Springleaf Finance Corporation, 5.625%, due 3/15/2023 |
1,070,000 | 1,147,575 | ||||||
Springleaf Finance Corporation, 6.125%, due 3/15/2024 |
1,230,000 | 1,308,413 | ||||||
Starwood Property Trust, 5.00%, due 12/15/2021 |
2,300,000 | 2,380,500 | ||||||
| 13,343,897 | ||||||||
See accompanying notes to financial statements. |
39 |
CHARTWELL SHORT DURATION HIGH YIELD FUND |
||||||||
CORPORATE BONDS — 94.3% (Continued) |
Par Value |
Value |
||||||
Health Care — 8.4% |
||||||||
Centene Corporation, 4.75%, due 5/15/2022 |
$ | 870,000 | $ | 888,487 | ||||
HCA, Inc., 7.50%, due 2/15/2022 |
2,300,000 | 2,551,850 | ||||||
Tenet Healthcare Corporation, 4.625%, due 7/15/2024 |
2,300,000 | 2,369,000 | ||||||
Valeant Pharmaceuticals International, 6.50%, due 3/15/2022 (a) |
1,865,000 | 1,918,619 | ||||||
| 7,727,956 | ||||||||
Industrials — 12.1% |
||||||||
ADT Corporation (The), 6.25%, due 10/15/2021 |
2,300,000 | 2,452,375 | ||||||
Arconic, Inc., 5.40%, due 4/15/2021 |
2,300,000 | 2,372,818 | ||||||
CNH Industrial Capital, LLC, 4.375%, due 11/6/2020 (b) |
1,900,000 | 1,938,456 | ||||||
Pitney Bowes, Inc., 3.875%, due 10/1/2021 (b) |
2,300,000 | 2,316,560 | ||||||
United Rentals North America, Inc., 4.625%, due 7/15/2023 |
1,990,000 | 2,032,785 | ||||||
| 11,112,994 | ||||||||
Information Technology — 1.4% |
||||||||
Dell International, LLC/EMC Corporation, 5.875%, due 6/15/2021 (a) |
1,258,000 | 1,277,348 | ||||||
Materials — 14.1% |
||||||||
ArcelorMittal, 5.50%, due 3/1/2021 (c) |
1,794,000 | 1,866,816 | ||||||
Ball Corporation, 5.00%, due 3/15/2022 |
2,300,000 | 2,432,250 | ||||||
Clearwater Paper Corporation, 4.50%, due 2/1/2023 (b) |
855,000 | 858,206 | ||||||
Crown Americas Capital Corporation IV, 4.50%, due 1/15/2023 |
2,300,000 | 2,403,500 | ||||||
Mercer International, Inc., 6.50%, due 2/1/2024 |
950,000 | 978,500 | ||||||
PolyOne Corporation, 5.25%, due 3/15/2023 (b) |
2,300,000 | 2,481,125 | ||||||
Steel Dynamics, Inc., 5.125%, due 10/1/2021 |
1,900,000 | 1,906,650 | ||||||
| 12,927,047 | ||||||||
Real Estate — 6.9% |
||||||||
CyrusOne, L.P., 5.00%, due 3/15/2024 |
1,970,000 | 2,029,100 | ||||||
Equinix, Inc., 5.375%, due 1/1/2022 |
1,990,000 | 2,029,203 | ||||||
iStar, Inc., 6.00%, due 4/1/2022 |
640,000 | 656,800 | ||||||
iStar, Inc., 4.75%, due 10/1/2024 |
1,535,000 | 1,582,969 | ||||||
| 6,298,072 | ||||||||
Utilities — 2.2% |
||||||||
AES Corporation, 4.00%, due 3/15/2021 |
1,990,000 | 2,022,338 | ||||||
Total Corporate Bonds (Cost $86,112,242) |
$ | 86,704,502 | ||||||
40 |
See accompanying notes to financial statements. |
CHARTWELL SHORT DURATION HIGH YIELD FUND |
||||||||
MONEY MARKET FUNDS — 5.4% |
Shares |
Value |
||||||
BlackRock Liquidity Funds FedFund Portfolio - Institutional Shares, 1.72% (d)(e) |
126,833 | $ | 126,833 | |||||
Fidelity Institutional Money Market Government Portfolio - Class I, 1.72% (d)(e) |
4,718,546 | 4,718,546 | ||||||
Invesco Short-Term Investment Trust Government & Agency Portfolio - Institutional Class, 1.71% (d)(e) |
112,043 | 112,043 | ||||||
Total Money Market Funds (Cost $4,957,422) |
$ | 4,957,422 | ||||||
Investments at Value — 99.7% (Cost $91,069,664) |
$ | 91,661,924 | ||||||
Other Assets in Excess of Liabilities — 0.3% |
252,499 | |||||||
Net Assets — 100.0% |
$ | 91,914,423 | ||||||
(a) |
Security was purchased in a transaction exempt from registration in compliance with Rule 144A of the Securities Act of 1933. This security may be resold in transactions exempt from registration, normally to qualified institutional buyers. The total value of such securities is $7,467,367 as of October 31, 2019, representing 8.1% of net assets. |
(b) |
All or a portion of the security is on loan. The total value of the securities on loan as of October 31, 2019 is $3,954,714 (Note 8). |
(c) |
Variable rate security. Interest rate resets periodically. The rate shown is the effective interest rate as of October 31, 2019. These variable rate securities are not based on a published reference rate and spread but are determined by the issuer or agent and are based on current market conditions. |
(d) |
The rate shown is the 7-day effective yield as of October 31, 2019. |
(e) |
All or a portion of this security was purchased with cash collateral held from securities on loan. The total value of such securities as of October 31, 2019 was $4,090,505 (Note 8). |
See accompanying notes to financial statements. |
41 |
CHARTWELL SHORT DURATION HIGH YIELD FUND
SUMMARY OF INVESTMENTS
As of October 31, 2019 (Unaudited)
Security Type / Sector |
Percent of |
Corporate Bonds |
|
Energy |
15.0% |
Financials |
14.5% |
Materials |
14.1% |
Industrials |
12.1% |
Communication Services |
10.2% |
Consumer Discretionary |
9.5% |
Health Care |
8.4% |
Real Estate |
6.9% |
Utilities |
2.2% |
Information Technology |
1.4% |
Total Corporate Bonds |
94.3% |
Money Market Funds |
5.4% |
Investments |
99.7% |
Other Assets in Excess of Liabilities |
0.3% |
Net Assets |
100.0% |
42
CHARTWELL SMALL CAP GROWTH FUND |
||||||||
COMMON STOCKS — 94.6% |
Shares |
Value |
||||||
Communication Services — 2.9% |
||||||||
Diversified Telecommunication Services — 1.8% |
||||||||
Bandwidth, Inc. - Class A (a) |
3,557 | $ | 199,726 | |||||
Vonage Holdings Corporation (a) |
16,395 | 160,179 | ||||||
| 359,905 | ||||||||
Entertainment — 1.1% |
||||||||
Liberty Media Corporation - Liberty Braves - Series C (a) |
2,346 | 68,996 | ||||||
Zynga, Inc. - Class A (a) |
26,911 | 166,041 | ||||||
| 235,037 | ||||||||
Consumer Discretionary — 10.7% |
||||||||
Diversified Consumer Services — 0.6% |
||||||||
WW International, Inc. (a) |
3,475 | 121,173 | ||||||
Hotels, Restaurants & Leisure — 4.5% |
||||||||
Boyd Gaming Corporation |
6,674 | 181,866 | ||||||
Eldorado Resorts, Inc. (a)(b) |
12,966 | 580,488 | ||||||
PlayAGS, Inc. (a) |
13,468 | 155,421 | ||||||
| 917,775 | ||||||||
Household Durables — 1.6% |
||||||||
Helen of Troy Ltd. (a) |
1,003 | 150,210 | ||||||
KB Home |
3,448 | 123,059 | ||||||
Lovesac Company (The) (a)(b) |
3,955 | 64,585 | ||||||
| 337,854 | ||||||||
Multi-Line Retail — 0.5% |
||||||||
Ollie’s Bargain Outlet Holdings, Inc. (a) |
1,624 | 103,741 | ||||||
Specialty Retail — 0.7% |
||||||||
Five Below, Inc. (a) |
1,146 | 143,376 | ||||||
Textiles, Apparel & Luxury Goods — 2.8% |
||||||||
Crocs, Inc. (a) |
2,681 | 93,808 | ||||||
Deckers Outdoor Corporation (a) |
3,213 | 491,268 | ||||||
| 585,076 | ||||||||
Consumer Staples — 3.0% |
||||||||
Food & Staples Retailing — 3.0% |
||||||||
Casey’s General Stores, Inc. |
2,221 | 379,369 | ||||||
Performance Food Group Company (a) |
5,881 | 250,590 | ||||||
| 629,959 | ||||||||
See accompanying notes to financial statements. |
43 |
CHARTWELL SMALL CAP GROWTH FUND |
||||||||
COMMON STOCKS — 94.6% (Continued) |
Shares |
Value |
||||||
Financials — 3.4% |
||||||||
Banks — 2.6% |
||||||||
CenterState Bank Corporation |
9,330 | $ | 236,609 | |||||
Webster Financial Corporation |
2,208 | 97,372 | ||||||
Western Alliance Bancorporation |
4,242 | 209,258 | ||||||
| 543,239 | ||||||||
Insurance — 0.8% |
||||||||
Selective Insurance Group, Inc. |
2,199 | 151,995 | ||||||
Health Care — 31.6% |
||||||||
Biotechnology — 9.4% |
||||||||
ACADIA Pharmaceuticals, Inc. (a) |
3,204 | 135,882 | ||||||
Amarin Corporation plc - ADR (a) |
25,525 | 419,120 | ||||||
Arena Pharmaceuticals, Inc. (a)(b) |
3,865 | 188,283 | ||||||
ArQule, Inc. (a) |
13,328 | 134,746 | ||||||
Biohaven Pharmaceutical Holding Company Ltd. (a) |
1,331 | 61,120 | ||||||
Blueprint Medicines Corporation (a) |
1,528 | 105,187 | ||||||
Castle Biosciences, Inc. (a) |
2,380 | 56,025 | ||||||
Coherus BioSciences, Inc. (a) |
10,032 | 174,256 | ||||||
FibroGen, Inc. (a) |
1,137 | 44,514 | ||||||
Iovance Biotherapeutics, Inc. (a) |
5,325 | 112,517 | ||||||
Krystal Biotech, Inc. (a) |
2,905 | 119,308 | ||||||
Mirati Therapeutics, Inc. (a) |
1,170 | 110,191 | ||||||
Natera, Inc. (a) |
5,242 | 201,922 | ||||||
Vericel Corporation (a) |
5,430 | 86,174 | ||||||
| 1,949,245 | ||||||||
Health Care Equipment & Supplies — 10.2% |
||||||||
Avanos Medical, Inc. (a) |
1,511 | 66,545 | ||||||
Haemonetics Corporation (a) |
5,899 | 712,186 | ||||||
ICU Medical, Inc. (a) |
1,683 | 271,990 | ||||||
Insulet Corporation (a) |
2,948 | 428,403 | ||||||
NovoCure Ltd. (a) |
2,794 | 200,162 | ||||||
Quidel Corporation (a)(b) |
3,357 | 191,013 | ||||||
Tandem Diabetes Care, Inc. (a) |
3,767 | 231,972 | ||||||
| 2,102,271 | ||||||||
Health Care Providers & Services — 3.5% |
||||||||
Addus HomeCare Corporation (a) |
3,398 | 286,146 | ||||||
Encompass Health Corporation (b) |
3,466 | 221,893 | ||||||
HealthEquity, Inc. (a)(b) |
1,963 | 111,479 | ||||||
LHC Group, Inc. (a) |
850 | 94,324 | ||||||
| 713,842 | ||||||||
44 |
See accompanying notes to financial statements. |
CHARTWELL SMALL CAP GROWTH FUND |
||||||||
COMMON STOCKS — 94.6% (Continued) |
Shares |
Value |
||||||
Health Care — 31.6% (Continued) |
||||||||
Life Sciences Tools & Services — 4.9% |
||||||||
Fluidigm Corporation (a)(b) |
6,320 | $ | 31,095 | |||||
ICON plc (a) |
4,856 | 713,346 | ||||||
PRA Health Sciences, Inc. (a) |
2,762 | 269,875 | ||||||
| 1,014,316 | ||||||||
Pharmaceuticals — 3.6% |
||||||||
Axsome Therapeutics, Inc. (a) |
2,947 | 70,964 | ||||||
Catalent, Inc. (a)(b) |
3,978 | 193,530 | ||||||
Horizon Therapeutics plc (a) |
11,341 | 327,868 | ||||||
MyoKardia, Inc. (a) |
1,454 | 83,358 | ||||||
Odonate Therapeutics, Inc. (a) |
1,963 | 62,345 | ||||||
| 738,065 | ||||||||
Industrials — 15.2% |
||||||||
Aerospace & Defense — 0.7% |
||||||||
Aerojet Rocketdyne Holdings, Inc. (a) |
3,235 | 139,849 | ||||||
HEICO Corporation |
4 | 493 | ||||||
| 140,342 | ||||||||
Building Products — 1.2% |
||||||||
Trex Company, Inc. (a) |
2,727 | 239,676 | ||||||
Commercial Services & Supplies — 3.2% |
||||||||
IAA, Inc. (a) |
4,807 | 183,387 | ||||||
Mobile Mini, Inc. |
5,300 | 199,386 | ||||||
UniFirst Corporation |
1,437 | 288,607 | ||||||
| 671,380 | ||||||||
Construction & Engineering — 0.7% |
||||||||
Dycom Industries, Inc. (a) |
2,971 | 135,448 | ||||||
Machinery — 5.6% |
||||||||
Alamo Group, Inc. |
1,241 | 132,861 | ||||||
Chart Industries, Inc. (a) |
6,954 | 407,713 | ||||||
Oshkosh Corporation |
3,685 | 314,625 | ||||||
RBC Bearings, Inc. (a) |
717 | 115,036 | ||||||
SPX FLOW, Inc. (a) |
4,196 | 189,995 | ||||||
| 1,160,230 | ||||||||
Professional Services — 1.0% |
||||||||
ASGN, Inc. (a) |
3,201 | 203,552 | ||||||
See accompanying notes to financial statements. |
45 |
CHARTWELL SMALL CAP GROWTH FUND |
||||||||
COMMON STOCKS — 94.6% (Continued) |
Shares |
Value |
||||||
Industrials — 15.2% (Continued) |
||||||||
Trading Companies & Distributors — 2.8% |
||||||||
Aircastle Ltd. |
4,698 | $ | 127,880 | |||||
H&E Equipment Services, Inc. |
6,011 | 204,013 | ||||||
SiteOne Landscape Supply, Inc. (a) |
2,855 | 251,411 | ||||||
| 583,304 | ||||||||
Information Technology — 20.1% |
||||||||
Electronic Equipment, Instruments & Components — 0.2% |
||||||||
Rogers Corporation (a)(b) |
312 | 42,270 | ||||||
IT Services — 7.0% |
||||||||
EVO Payments, Inc. - Class A (a) |
9,172 | 260,760 | ||||||
Genpact Ltd. |
7,155 | 280,261 | ||||||
InterXion Holding N.V. (a) |
4,087 | 360,555 | ||||||
ManTech International Corporation - Class A |
2,454 | 194,308 | ||||||
Science Applications International Corporation |
2,041 | 168,627 | ||||||
Verra Mobility Corporation (a)(b) |
12,567 | 180,337 | ||||||
| 1,444,848 | ||||||||
Semiconductors & Semiconductor Equipment — 3.0% |
||||||||
MACOM Technology Solutions Holdings, Inc. (a) |
9,527 | 216,644 | ||||||
Monolithic Power Systems, Inc. |
2,751 | 412,430 | ||||||
| 629,074 | ||||||||
Software — 9.9% |
||||||||
Altair Engineering, Inc. - Class A (a)(b) |
4,529 | 166,984 | ||||||
Five9, Inc. (a)(b) |
2,707 | 150,266 | ||||||
Mimecast Ltd. (a)(b) |
3,470 | 137,794 | ||||||
Nutanix, Inc. - Class A (a) |
11,014 | 321,829 | ||||||
Paylocity Holding Corporation (a)(b) |
3,587 | 368,026 | ||||||
Proofpoint, Inc. (a) |
3,661 | 422,369 | ||||||
Rapid7, Inc. (a) |
9,358 | 468,742 | ||||||
| 2,036,010 | ||||||||
Materials — 0.7% |
||||||||
Chemicals — 0.7% |
||||||||
Ingevity Corporation (a) |
1,628 | 137,094 | ||||||
46 |
See accompanying notes to financial statements. |
CHARTWELL SMALL CAP GROWTH FUND |
||||||||
COMMON STOCKS — 94.6% (Continued) |
Shares |
Value |
||||||
Real Estate — 7.0% |
||||||||
Equity Real Estate Investment Trusts (REITs) — 7.0% |
||||||||
Americold Realty Trust |
8,745 | $ | 350,587 | |||||
MGM Growth Properties, LLC - Class A |
11,841 | 369,558 | ||||||
NexPoint Residential Trust, Inc. |
4,489 | 218,928 | ||||||
Physicians Realty Trust |
8,183 | 152,777 | ||||||
QTS Realty Trust, Inc. - Class A |
3,855 | 206,589 | ||||||
Ryman Hospitality Properties, Inc. |
1,793 | 150,917 | ||||||
| 1,449,356 | ||||||||
Total Common Stocks (Cost $17,763,511) |
$ | 19,519,453 | ||||||
MONEY MARKET FUNDS — 13.8% |
Shares |
Value |
||||||
BlackRock Liquidity Funds FedFund Portfolio - Institutional Shares, 1.72% (c)(d) |
61,582 | $ | 61,582 | |||||
Fidelity Institutional Money Market Government Portfolio - Class I, 1.72% (c)(d) |
2,736,081 | 2,736,081 | ||||||
Invesco Short-Term Investment Trust Government & Agency Portfolio - Institutional Class, 1.71% (c)(d) |
54,401 | 54,401 | ||||||
Total Money Market Funds (Cost $2,852,064) |
$ | 2,852,064 | ||||||
Investments at Value — 108.4% (Cost $20,615,575) |
$ | 22,371,517 | ||||||
Liabilities in Excess of Other Assets — (8.4%) |
(1,734,892 | ) | ||||||
Net Assets — 100.0% |
$ | 20,636,625 | ||||||
(a) |
Non-income producing security. |
(b) |
All or a portion of the security is on loan. The total value of the securities on loan as of October 31, 2019 is $1,923,159 (Note 8). |
(c) |
The rate shown is the 7-day effective yield as of October 31, 2019. |
(d) |
All or a portion of this security was purchased with cash collateral held from securities on loan. The total value of such securities as of October 31, 2019 was $1,986,096 (Note 8). |
ADR – American Depositary Receipt |
|
See accompanying notes to financial statements. |
47 |
CHARTWELL SMALL CAP GROWTH FUND
SUMMARY OF INVESTMENTS
As of October 31, 2019 (Unaudited)
Security Type / Sector |
Percent of |
Common Stocks |
|
Health Care |
31.6% |
Information Technology |
20.1% |
Industrials |
15.2% |
Consumer Discretionary |
10.7% |
Real Estate |
7.0% |
Financials |
3.4% |
Consumer Staples |
3.0% |
Communication Services |
2.9% |
Materials |
0.7% |
Total Common Stocks |
94.6% |
Money Market Funds |
13.8% |
Investments |
108.4% |
Liabilities in Excess of Other Assets |
(8.4%) |
Net Assets |
100.0% |
48
CHARTWELL FUNDS |
||||||||||||
|
Berwyn |
Chartwell |
Chartwell |
|||||||||
ASSETS |
||||||||||||
Investments at cost |
$ | 1,008,148,893 | $ | 23,883,741 | $ | 144,439,573 | ||||||
Investments at value (Notes 2 and 7) |
$ | 1,029,012,999 | $ | 25,355,683 | $ | 171,572,953 | ||||||
Cash (a) |
20,041,901 | 1,001,455 | 5,007,854 | |||||||||
Receivable for capital shares sold |
346,778 | 378,132 | 52,303 | |||||||||
Receivable for investment securities sold |
6,721,480 | — | — | |||||||||
Dividends and interest receivable |
6,256,280 | 16,196 | 75,339 | |||||||||
Other assets |
47,737 | 10,078 | 15,789 | |||||||||
TOTAL ASSETS |
1,062,427,175 | 26,761,544 | 176,724,238 | |||||||||
LIABILITIES |
||||||||||||
Payable for capital shares redeemed |
1,352,318 | 1,003,073 | 83,358 | |||||||||
Payable for investment securities purchased |
1,850,555 | — | — | |||||||||
Payable for return of collateral received for securities on loan (Note 8) |
28,408,725 | 22,560 | 3,724,813 | |||||||||
Payable to Advisor (Note 3) |
389,754 | 7,922 | 114,363 | |||||||||
Payable to administrator (Note 3) |
38,300 | 3,900 | 8,700 | |||||||||
Other accrued expenses |
139,897 | 20,557 | 40,484 | |||||||||
TOTAL LIABILITIES |
32,179,549 | 1,058,012 | 3,971,718 | |||||||||
NET ASSETS |
$ | 1,030,247,626 | $ | 25,703,532 | $ | 172,752,520 | ||||||
NET ASSETS CONSIST OF: |
||||||||||||
Paid-in capital |
$ | 1,017,716,069 | $ | 23,856,320 | $ | 144,069,422 | ||||||
Accumulated earnings |
12,531,557 | 1,847,212 | 28,683,098 | |||||||||
NET ASSETS |
$ | 1,030,247,626 | $ | 25,703,532 | $ | 172,752,520 | ||||||
Shares of beneficial interest outstanding (unlimited number of shares authorized, par value $0.01) |
77,686,712 | 1,654,413 | 9,253,837 | |||||||||
Net asset value, offering price and redemption price per share (Note 2) |
$ | 13.26 | $ | 15.54 | $ | 18.67 | ||||||
(a) |
Includes $20,000,000, $1,000,000 and $5,000,000 held in an interest-bearing deposit account for Berwyn Income Fund, Chartwell Mid Cap Value Fund and Chartwell Small Cap Value Fund, respectively. The rate earned as of October 31, 2019 is 1.96% (Note 2(d)). |
See accompanying notes to financial statements. |
49 |
CHARTWELL FUNDS |
||||||||
|
Chartwell |
Chartwell |
||||||
ASSETS |
||||||||
Investments at cost |
$ | 91,069,664 | $ | 20,615,575 | ||||
Investments at value (Notes 2 and 7) |
$ | 91,661,924 | $ | 22,371,517 | ||||
Cash (a) |
4,004,319 | 866 | ||||||
Receivable for capital shares sold |
101,040 | 1,800 | ||||||
Receivable for investment securities sold |
— | 313,830 | ||||||
Dividends and interest receivable |
923,233 | 1,740 | ||||||
Other assets |
13,768 | 8,899 | ||||||
TOTAL ASSETS |
96,704,284 | 22,698,652 | ||||||
LIABILITIES |
||||||||
Payable for capital shares redeemed |
10,000 | — | ||||||
Payable for investment securities purchased |
634,257 | 48,523 | ||||||
Payable for return of collateral received for securities on loan (Note 8) |
4,090,505 | 1,986,096 | ||||||
Payable to Advisor (Note 3) |
22,839 | 2,486 | ||||||
Payable to administrator (Note 3) |
6,100 | 3,700 | ||||||
Other accrued expenses |
26,160 | 21,222 | ||||||
TOTAL LIABILITIES |
4,789,861 | 2,062,027 | ||||||
NET ASSETS |
$ | 91,914,423 | $ | 20,636,625 | ||||
NET ASSETS CONSIST OF: |
||||||||
Paid-in capital |
$ | 91,912,880 | $ | 19,054,710 | ||||
Accumulated earnings |
1,543 | 1,581,915 | ||||||
NET ASSETS |
$ | 91,914,423 | $ | 20,636,625 | ||||
Shares of beneficial interest outstanding (unlimited number of shares authorized, par value $0.01) |
9,499,590 | 1,752,397 | ||||||
Net asset value, offering price and redemption price per share (Note 2) |
$ | 9.68 | $ | 11.78 | ||||
(a) |
Includes $4,000,000 held in an interest-bearing deposit account for Chartwell Short Duration High Yield Fund. The rate earned as of October 31, 2019 is 1.96% (Note 2(d)). |
50 |
See accompanying notes to financial statements. |
CHARTWELL FUNDS |
||||||||||||
|
Berwyn |
Chartwell |
Chartwell |
|||||||||
INVESTMENT INCOME |
||||||||||||
Dividends |
$ | 10,871,196 | $ | 515,427 | $ | 3,341,766 | ||||||
Foreign withholding taxes on dividends |
(19,995 | ) | — | — | ||||||||
Interest |
34,555,643 | 3,680 | 102,591 | |||||||||
Securities lending income (Note 8) |
14,245 | 207 | 3,465 | |||||||||
TOTAL INVESTMENT INCOME |
45,421,089 | 519,314 | 3,447,822 | |||||||||
EXPENSES |
||||||||||||
Investment advisory fees (Note 3) |
6,356,328 | 183,972 | 1,793,699 | |||||||||
Transfer agent fees (Note 3) |
854,966 | 25,151 | 37,790 | |||||||||
Fund administration fees (Note 3) |
535,262 | 48,023 | 116,292 | |||||||||
Legal fees |
133,294 | 2,659 | 20,637 | |||||||||
Custodian and bank service fees |
105,694 | 6,960 | 24,944 | |||||||||
Registration and filing fees |
57,839 | 35,737 | 40,366 | |||||||||
Insurance expense |
67,521 | 1,014 | 11,602 | |||||||||
Trustees’ fees and expenses (Note 3) |
26,871 | 25,229 | 25,466 | |||||||||
Printing of shareholder reports |
41,338 | 1,515 | 11,042 | |||||||||
Audit and tax services fees |
13,600 | 13,600 | 13,600 | |||||||||
Other expenses |
148,357 | 9,859 | 32,189 | |||||||||
TOTAL EXPENSES |
8,341,070 | 353,719 | 2,127,627 | |||||||||
Less fee reductions by the Advisor (Note 3) |
(212,996 | ) | (102,814 | ) | (36,561 | ) | ||||||
NET EXPENSES |
8,128,074 | 250,905 | 2,091,066 | |||||||||
NET INVESTMENT INCOME |
37,293,015 | 268,409 | 1,356,756 | |||||||||
REALIZED AND UNREALIZED GAINS ON INVESTMENTS |
||||||||||||
Net realized gains on investment transactions |
679,622 | 167,581 | 730,657 | |||||||||
Net change in unrealized appreciation (depreciation) on investments |
49,852,893 | 2,176,985 | 11,242,254 | |||||||||
NET REALIZED AND UNREALIZED GAINS ON INVESTMENTS |
50,532,515 | 2,344,566 | 11,972,911 | |||||||||
NET INCREASE IN NET ASSETS RESULTING FROM OPERATIONS |
$ | 87,825,530 | $ | 2,612,975 | $ | 13,329,667 | ||||||
See accompanying notes to financial statements. |
51 |
CHARTWELL FUNDS |
||||||||
|
Chartwell |
Chartwell |
||||||
INVESTMENT INCOME |
||||||||
Dividends |
$ | 19,222 | $ | 124,656 | ||||
Interest |
3,330,008 | 3,316 | ||||||
Securities lending income (Note 8) |
1,799 | 5,433 | ||||||
TOTAL INVESTMENT INCOME |
3,351,029 | 133,405 | ||||||
EXPENSES |
||||||||
Investment advisory fees (Note 3) |
325,712 | 172,767 | ||||||
Fund administration fees (Note 3) |
70,367 | 46,386 | ||||||
Registration and filing fees |
43,059 | 32,663 | ||||||
Trustees’ fees and expenses (Note 3) |
25,297 | 25,225 | ||||||
Transfer agent fees (Note 3) |
16,161 | 14,142 | ||||||
Audit and tax services fees |
13,600 | 16,200 | ||||||
Pricing costs |
17,515 | 2,613 | ||||||
Custodian and bank service fees |
10,863 | 8,903 | ||||||
Legal fees |
8,763 | 2,212 | ||||||
Insurance expense |
4,556 | 619 | ||||||
Printing of shareholder reports |
1,755 | 1,944 | ||||||
Other expenses |
11,294 | 8,903 | ||||||
TOTAL EXPENSES |
548,942 | 332,577 | ||||||
Less fee reductions by the Advisor (Note 3) |
(149,868 | ) | (119,074 | ) | ||||
NET EXPENSES |
399,074 | 213,503 | ||||||
NET INVESTMENT INCOME (LOSS) |
2,951,955 | (80,098 | ) | |||||
REALIZED AND UNREALIZED GAINS (LOSSES) ON INVESTMENTS |
||||||||
Net realized gains (losses) on investment transactions |
209,404 | (47,099 | ) | |||||
Net change in unrealized appreciation (depreciation) on investments |
1,442,190 | 844,833 | ||||||
NET REALIZED AND UNREALIZED GAINS ON INVESTMENTS |
1,651,594 | 797,734 | ||||||
NET INCREASE IN NET ASSETS RESULTING FROM OPERATIONS |
$ | 4,603,549 | $ | 717,636 | ||||
52 |
See accompanying notes to financial statements. |
BERWYN INCOME FUND |
||||||||
|
Year |
Year |
||||||
FROM OPERATIONS |
||||||||
Net investment income |
$ | 37,293,015 | $ | 36,122,192 | ||||
Net realized gains from investment transactions |
679,622 | 42,041,712 | ||||||
Net change in unrealized appreciation (depreciation) on investments |
49,852,893 | (62,199,685 | ) | |||||
Net increase in net assets resulting from operations |
87,825,530 | 15,964,219 | ||||||
DISTRIBUTIONS TO SHAREHOLDERS (Note 2 and 4) |
(82,348,018 | ) | (87,029,297 | ) | ||||
FROM CAPITAL SHARE TRANSACTIONS |
||||||||
Proceeds from shares sold |
165,835,797 | 245,057,231 | ||||||
Reinvestment of distributions to shareholders |
79,458,128 | 83,791,853 | ||||||
Proceeds from redemption fees collected (Note 2) |
14,167 | 8,778 | ||||||
Payments for shares redeemed |
(710,832,878 | ) | (439,357,509 | ) | ||||
Net decrease in net assets from capital share transactions |
(465,524,786 | ) | (110,499,647 | ) | ||||
TOTAL DECREASE IN NET ASSETS |
(460,047,274 | ) | (181,564,725 | ) | ||||
NET ASSETS |
||||||||
Beginning of year |
1,490,294,900 | 1,671,859,625 | ||||||
End of year |
$ | 1,030,247,626 | $ | 1,490,294,900 | ||||
SUMMARY OF CAPITAL SHARE ACTIVITY |
||||||||
Shares sold |
12,783,350 | 18,113,539 | ||||||
Shares issued in reinvestment of distributions to shareholders |
6,236,576 | 6,239,835 | ||||||
Shares redeemed |
(54,373,349 | ) | (32,441,049 | ) | ||||
Net decrease in shares outstanding |
(35,353,423 | ) | (8,087,675 | ) | ||||
Shares outstanding, beginning of year |
113,040,135 | 121,127,810 | ||||||
Shares outstanding, end of year |
77,686,712 | 113,040,135 | ||||||
See accompanying notes to financial statements. |
53 |
CHARTWELL MID CAP VALUE FUND |
||||||||
|
Year |
Year |
||||||
FROM OPERATIONS |
||||||||
Net investment income |
$ | 268,409 | $ | 169,317 | ||||
Net realized gains from investment transactions |
167,581 | 1,457,980 | ||||||
Net change in unrealized appreciation (depreciation) on investments |
2,176,985 | (1,941,773 | ) | |||||
Net increase (decrease) in net assets resulting from operations |
2,612,975 | (314,476 | ) | |||||
DISTRIBUTIONS TO SHAREHOLDERS (Note 2 and 4) |
(1,644,533 | ) | (4,455,548 | ) | ||||
FROM CAPITAL SHARE TRANSACTIONS |
||||||||
Proceeds from shares sold |
5,932,732 | 10,779,969 | ||||||
Reinvestment of distributions to shareholders |
1,317,111 | 4,444,020 | ||||||
Payments for shares redeemed |
(7,836,397 | ) | (8,406,714 | ) | ||||
Net increase (decrease) in net assets from capital share transactions |
(586,554 | ) | 6,817,275 | |||||
TOTAL INCREASE IN NET ASSETS |
381,888 | 2,047,251 | ||||||
NET ASSETS |
||||||||
Beginning of year |
25,321,644 | 23,274,393 | ||||||
End of year |
$ | 25,703,532 | $ | 25,321,644 | ||||
SUMMARY OF CAPITAL SHARE ACTIVITY |
||||||||
Shares sold |
397,719 | 663,324 | ||||||
Shares issued in reinvestment of distributions to shareholders |
102,260 | 281,267 | ||||||
Shares redeemed |
(525,594 | ) | (519,212 | ) | ||||
Net increase (decrease) in shares outstanding |
(25,615 | ) | 425,379 | |||||
Shares outstanding, beginning of year |
1,680,028 | 1,254,649 | ||||||
Shares outstanding, end of year |
1,654,413 | 1,680,028 | ||||||
54 |
See accompanying notes to financial statements. |
CHARTWELL SMALL CAP VALUE FUND |
||||||||
|
Year |
Year |
||||||
FROM OPERATIONS |
||||||||
Net investment income |
$ | 1,356,756 | $ | 596,452 | ||||
Net realized gains from investment transactions |
730,657 | 14,476,892 | ||||||
Net change in unrealized appreciation (depreciation) on investments |
11,242,254 | (21,141,047 | ) | |||||
Net increase (decrease) in net assets resulting from operations |
13,329,667 | (6,067,703 | ) | |||||
DISTRIBUTIONS TO SHAREHOLDERS (Note 2 and 4) |
(15,260,911 | ) | (7,362,470 | ) | ||||
FROM CAPITAL SHARE TRANSACTIONS |
||||||||
Net assets received in conjunction with fund merger (Note 1) |
— | 79,889,004 | ||||||
Proceeds from shares sold |
33,091,902 | 43,514,398 | ||||||
Reinvestment of distributions to shareholders |
12,900,047 | 5,808,614 | ||||||
Proceeds from redemption fees collected (Note 2) |
1,176 | 906 | ||||||
Payments for shares redeemed |
(100,088,621 | ) | (52,541,148 | ) | ||||
Net increase (decrease) in net assets from capital share transactions |
(54,095,496 | ) | 76,671,774 | |||||
TOTAL INCREASE (DECREASE) IN NET ASSETS |
(56,026,740 | ) | 63,241,601 | |||||
NET ASSETS |
||||||||
Beginning of year |
228,779,260 | 165,537,659 | ||||||
End of year |
$ | 172,752,520 | $ | 228,779,260 | ||||
SUMMARY OF CAPITAL SHARE ACTIVITY |
||||||||
Shares received in conjunction with fund merger (Note 1) |
— | 4,032,734 | ||||||
Shares sold |
1,875,120 | 2,172,806 | ||||||
Shares issued in reinvestment of distributions to shareholders |
818,012 | 293,661 | ||||||
Shares redeemed |
(5,616,035 | ) | (2,571,800 | ) | ||||
Net increase (decrease) in shares outstanding |
(2,922,903 | ) | 3,927,401 | |||||
Shares outstanding, beginning of year |
12,176,740 | 8,249,339 | ||||||
Shares outstanding, end of year |
9,253,837 | 12,176,740 | ||||||
See accompanying notes to financial statements. |
55 |
CHARTWELL SHORT DURATION HIGH YIELD FUND |
||||||||
|
Year |
Year |
||||||
FROM OPERATIONS |
||||||||
Net investment income |
$ | 2,951,955 | $ | 1,605,479 | ||||
Net realized gains (losses) from investment transactions |
209,404 | (71,437 | ) | |||||
Net change in unrealized appreciation (depreciation) on investments |
1,442,190 | (1,107,265 | ) | |||||
Net increase in net assets resulting from operations |
4,603,549 | 426,777 | ||||||
DISTRIBUTIONS TO SHAREHOLDERS (Note 2 and 4) |
(2,983,171 | ) | (1,612,434 | ) | ||||
FROM CAPITAL SHARE TRANSACTIONS |
||||||||
Proceeds from shares sold |
28,495,123 | 42,769,054 | ||||||
Reinvestment of distributions to shareholders |
2,784,881 | 1,589,804 | ||||||
Proceeds from redemption fees collected (Note 2) |
2 | — | ||||||
Payments for shares redeemed |
(16,521,718 | ) | (2,828,085 | ) | ||||
Net increase in net assets from capital share transactions |
14,758,288 | 41,530,773 | ||||||
TOTAL INCREASE IN NET ASSETS |
16,378,666 | 40,345,116 | ||||||
NET ASSETS |
||||||||
Beginning of year |
75,535,757 | 35,190,641 | ||||||
End of year |
$ | 91,914,423 | $ | 75,535,757 | ||||
SUMMARY OF CAPITAL SHARE ACTIVITY |
||||||||
Shares sold |
2,956,306 | 4,477,408 | ||||||
Shares issued in reinvestment of distributions to shareholders |
289,630 | 166,614 | ||||||
Shares redeemed |
(1,716,129 | ) | (296,227 | ) | ||||
Net increase in shares outstanding |
1,529,807 | 4,347,795 | ||||||
Shares outstanding, beginning of year |
7,969,783 | 3,621,988 | ||||||
Shares outstanding, end of year |
9,499,590 | 7,969,783 | ||||||
56 |
See accompanying notes to financial statements. |
CHARTWELL SMALL CAP GROWTH FUND |
||||||||
|
Year |
Year |
||||||
FROM OPERATIONS |
||||||||
Net investment loss |
$ | (80,098 | ) | $ | (69,839 | ) | ||
Net realized gains (losses) from investment transactions |
(47,099 | ) | 98,488 | |||||
Net change in unrealized appreciation (depreciation) on investments |
844,833 | 651,691 | ||||||
Net increase in net assets resulting from operations |
717,636 | 680,340 | ||||||
DISTRIBUTIONS TO SHAREHOLDERS (Note 2 and 4) |
(70,964 | ) | (2,748 | ) | ||||
FROM CAPITAL SHARE TRANSACTIONS |
||||||||
Proceeds from shares sold |
3,964,802 | 11,117,978 | ||||||
Reinvestment of distributions to shareholders |
70,764 | 2,748 | ||||||
Proceeds from redemption fees collected (Note 2) |
1 | — | ||||||
Payments for shares redeemed |
(1,866,199 | ) | (721,776 | ) | ||||
Net increase in net assets from capital share transactions |
2,169,368 | 10,398,950 | ||||||
TOTAL INCREASE IN NET ASSETS |
2,816,040 | 11,076,542 | ||||||
NET ASSETS |
||||||||
Beginning of year |
17,820,585 | 6,744,043 | ||||||
End of year |
$ | 20,636,625 | $ | 17,820,585 | ||||
SUMMARY OF CAPITAL SHARE ACTIVITY |
||||||||
Shares sold |
362,801 | 973,342 | ||||||
Shares issued in reinvestment of distributions to shareholders |
7,048 | 245 | ||||||
Shares redeemed |
(160,368 | ) | (61,836 | ) | ||||
Net increase in shares outstanding |
209,481 | 911,751 | ||||||
Shares outstanding, beginning of year |
1,542,916 | 631,165 | ||||||
Shares outstanding, end of year |
1,752,397 | 1,542,916 | ||||||
See accompanying notes to financial statements. |
57 |
BERWYN INCOME FUND |
||||||||||||
Per Share Data for a Share Outstanding Throughout Each Year |
||||||||||||
|
|
Year |
Year |
|||||||||
Net asset value at beginning of year |
$ | 13.18 | $ | 13.80 | $ | 13.64 | ||||||
Income (loss) from investment operations: |
||||||||||||
Net investment income |
0.41 | 0.31 | 0.24 | (a) | ||||||||
Net realized and unrealized gains (losses) on affiliated and unaffiliated investment transactions |
0.50 | (0.19 | ) | 0.29 | ||||||||
Total from investment operations |
0.91 | 0.12 | 0.53 | |||||||||
Less distributions: |
||||||||||||
From net investment income |
(0.44 | ) | (0.30 | ) | (0.22 | ) | ||||||
From net realized gains on investments |
(0.39 | ) | (0.44 | ) | (0.15 | ) | ||||||
Total distributions |
(0.83 | ) | (0.74 | ) | (0.37 | ) | ||||||
Proceeds from redemption fees collected (Note 2) |
0.00 | (b) | 0.00 | (b) | 0.00 | (b) | ||||||
Net asset value at end of year |
$ | 13.26 | $ | 13.18 | $ | 13.80 | ||||||
Total return (c) |
7.22 | % | 0.88 | % | 3.98 | % | ||||||
Ratios/Supplementary data: |
||||||||||||
Net assets at end of year (000,000’s) |
$ | 1,030 | $ | 1,490 | $ | 1,672 | ||||||
Ratio of total expenses to average net assets: |
||||||||||||
Before fees reduced |
0.66 | % | 0.68 | % | 0.67 | % | ||||||
After fees reduced (d) |
0.64 | % | 0.64 | % | 0.64 | % | ||||||
Ratio of net investment income to average net assets: |
||||||||||||
Before fees reduced |
2.93 | % | 2.26 | % | 1.75 | % | ||||||
After fees reduced (d) |
2.95 | % | 2.29 | % | 1.78 | % | ||||||
Portfolio turnover rate |
137 | % | 75 | % | 69 | % | ||||||
(a) |
Based on average shares outstanding. |
(b) |
Amount rounds to less than $0.01 per share. |
(c) |
Total return is a measure of the change in value of an investment in the Fund over the period covered, which assumes any dividends or capital gains distributions are reinvested in shares of the Fund. The returns shown do not reflect the deduction of taxes a shareholder would pay on Fund distributions or the redemption of Fund shares. The returns would have been lower had the Advisor not reduced its fees. |
(d) |
Effective May 1, 2016, the Advisor had contractually agreed to reduce its fees and/or pay for operating expenses of the Fund to ensure that total annual operating expenses do not exceed 0.64% of the average daily net assets of the Fund (Note 3). |
58 |
See accompanying notes to financial statements. |
BERWYN INCOME FUND |
||||||||||||
Per Share Data for a Share Outstanding Throughout Each Period |
||||||||||||
|
For the Period |
Year |
Year |
|||||||||
Net asset value at beginning of period |
$ | 12.85 | $ | 13.61 | $ | 14.01 | ||||||
Income (loss) from investment operations: |
||||||||||||
Net investment income |
0.19 | (a) | 0.31 | 0.32 | ||||||||
Net realized and unrealized gains (losses) on affiliated and unaffiliated investment transactions |
0.79 | (0.76 | ) | 0.15 | ||||||||
Total from investment operations |
0.98 | (0.45 | ) | 0.47 | ||||||||
Less distributions: |
||||||||||||
From net investment income |
(0.19 | ) | (0.31 | ) | (0.34 | ) | ||||||
From net realized gains on investments |
— | (0.00 | )(b) | (0.53 | ) | |||||||
Total distributions |
(0.19 | ) | (0.31 | ) | (0.87 | ) | ||||||
Proceeds from redemption fees collected (Note 2) |
0.00 | (b) | 0.00 | (b) | 0.00 | (b) | ||||||
Net asset value at end of period |
$ | 13.64 | $ | 12.85 | $ | 13.61 | ||||||
Total return (c) |
7.68 | %(d) | (3.30 | %)(e) | 3.32 | % | ||||||
Ratios/Supplementary data: |
||||||||||||
Net assets at end of period (000,000’s) |
$ | 1,711 | $ | 1,742 | $ | 2,573 | ||||||
Ratio of total expenses to average net assets: |
||||||||||||
Before fees reduced |
0.67 | %(f) | 0.64 | % | 0.61 | % | ||||||
After fees reduced |
0.66 | %(f)(g) | 0.64 | % | 0.61 | % | ||||||
Ratio of net investment income to average net assets: |
||||||||||||
Before fees reduced |
1.74 | %(f) | 2.18 | % | 2.28 | % | ||||||
After fees reduced |
1.75 | %(f)(g) | 2.18 | % | 2.28 | % | ||||||
Portfolio turnover rate |
72 | %(d) | 45 | % | 45 | % | ||||||
(a) |
Based on average shares outstanding. |
(b) |
Amount rounds to less than $0.01 per share. |
(c) |
Total return is a measure of the change in value of an investment in the Fund over the period covered, which assumes any dividends or capital gains distributions are reinvested in shares of the Fund. The returns shown do not reflect the deduction of taxes a shareholder would pay on Fund distributions or the redemption of Fund shares. The return for the period of January 1, 2016 through October 31, 2016 would have been lower had the Advisor not reduced its fees. |
(d) |
Not annualized. |
(e) |
The Fund received payment from the Advisor of $1,601,595 for losses realized in the disposal of investments purchased in violation of investment restrictions, which otherwise would have reduced the total return by 0.07%. |
(f) |
Annualized. |
(g) |
Effective May 1, 2016, the Advisor had contractually agreed to reduce its fees and/or pay for operating expenses of the Fund to ensure that total annual operating expenses do not exceed 0.64% of the average daily net assets of the Fund (Note 3). |
* |
Fiscal year changed to October 31, effective September 30, 2016. |
See accompanying notes to financial statements. |
59 |
CHARTWELL MID CAP VALUE FUND |
||||||||||||
Per Share Data for a Share Outstanding Throughout Each Year |
||||||||||||
|
|
Year |
Year |
|||||||||
Net asset value at beginning of year |
$ | 15.07 | $ | 18.55 | $ | 15.46 | ||||||
Income from investment operations: |
||||||||||||
Net investment income |
0.17 | 0.11 | 0.16 | (a) | ||||||||
Net realized and unrealized gains on investment transactions |
1.34 | 0.03 | 3.48 | |||||||||
Total from investment operations |
1.51 | 0.14 | 3.64 | |||||||||
Less distributions: |
||||||||||||
From net investment income |
(0.11 | ) | (0.14 | ) | (0.25 | ) | ||||||
From net realized gains on investments |
(0.93 | ) | (3.48 | ) | (0.30 | ) | ||||||
Total distributions |
(1.04 | ) | (3.62 | ) | (0.55 | ) | ||||||
Proceeds from redemption fees collected (Note 2) |
— | — | 0.00 | (b) | ||||||||
Net asset value at end of year |
$ | 15.54 | $ | 15.07 | $ | 18.55 | ||||||
Total return (c) |
11.47 | % | (0.12 | %) | 23.95 | % | ||||||
Ratios/Supplementary data: |
||||||||||||
Net assets at end of year (000’s) |
$ | 25,704 | $ | 25,322 | $ | 23,274 | ||||||
Ratio of total expenses to average net assets: |
||||||||||||
Before fees waived/reduced |
1.44 | % | 1.57 | % | 1.71 | % | ||||||
After fees waived/reduced |
1.02 | %(d) | 1.05 | %(e) | 1.15 | % | ||||||
Ratio of net investment income to average net assets: |
||||||||||||
Before fees waived/reduced |
0.67 | % | 0.26 | % | 0.37 | % | ||||||
After fees waived/reduced |
1.09 | %(d) | 0.77 | %(e) | 0.93 | % | ||||||
Portfolio turnover rate |
36 | % | 65 | % | 159 | % | ||||||
(a) |
Based on average shares outstanding. |
(b) |
Amount rounds to less than $0.01 per share. |
(c) |
Total return is a measure of the change in value of an investment in the Fund over the period covered, which assumes any dividends or capital gains distributions re reinvested in shares of the Fund. The returns shown do not reflect the deduction of taxes a shareholder would pay on Fund distributions or the redemption of Fund shares. The returns would have been lower had the Advisor not reduced its fees or reimbursed expenses. |
(d) |
Effective September 1, 2019, the Advisor contractually agreed to reduce its fees and/or reimburse other operating expenses of the Fund to ensure that total annual operating expenses do not exceed 0.90% of the average daily net assets of the Fund. Prior to September 1, 2019, the annual operating expense limitation was 1.05% (Note 3). |
(e) |
Effective November 6, 2017, the Advisor contractually agreed to reduce its fees and/or reimburse other operating expenses of the Fund to ensure that total annual operating expenses do not exceed 1.05% of the average daily net assets of the Fund. Prior to November 6, 2017, the annual operating expense limitation was 1.15% (Note 3). |
60 |
See accompanying notes to financial statements. |
CHARTWELL MID CAP VALUE FUND |
||||||||||||
Per Share Data for a Share Outstanding Throughout Each Period |
||||||||||||
|
For the Period |
Year |
Year |
|||||||||
Net asset value at beginning of period |
$ | 13.31 | $ | 15.83 | $ | 17.62 | ||||||
Income (loss) from investment operations: |
||||||||||||
Net investment income |
0.20 | (a) | 0.12 | 0.12 | ||||||||
Net realized and unrealized gains (losses) on investment transactions |
1.95 | (2.52 | ) | (0.28 | ) | |||||||
Total from investment operations |
2.15 | (2.40 | ) | (0.16 | ) | |||||||
Less distributions: |
||||||||||||
From net investment income |
— | (0.12 | ) | (0.12 | ) | |||||||
From net realized gains on investments |
— | — | (1.51 | ) | ||||||||
Total distributions |
— | (0.12 | ) | (1.63 | ) | |||||||
Proceeds from redemption fees collected (Note 2) |
0.00 | (b) | 0.00 | (b) | 0.00 | (b) | ||||||
Net asset value at end of period |
$ | 15.46 | $ | 13.31 | $ | 15.83 | ||||||
Total return (c) |
16.15 | %(d) | (15.16 | %) | (0.97 | %) | ||||||
Ratios/Supplementary data: |
||||||||||||
Net assets at end of period (000’s) |
$ | 18,712 | $ | 16,817 | $ | 21,596 | ||||||
Ratio of total expenses to average net assets: |
||||||||||||
Before fees waived/reduced |
2.03 | %(e) | 1.81 | % | 1.68 | % | ||||||
After fees waived/reduced |
1.19 | %(e)(f) | 1.25 | %(g) | 1.25 | %(g) | ||||||
Ratio of net investment income to average net assets: |
||||||||||||
Before fees waived/reduced |
0.81 | %(e) | 0.24 | % | 0.28 | % | ||||||
After fees waived/reduced |
1.65 | %(e)(f) | 0.80 | %(g) | 0.71 | %(g) | ||||||
Portfolio turnover rate |
38 | %(d) | 30 | % | 38 | % | ||||||
(a) |
Based on average shares outstanding. |
(b) |
Amount rounds to less than $0.01 per share. |
(c) |
Total return is a measure of the change in value of an investment in the Fund over the period covered, which assumes any dividends or capital gains distributions are reinvested in shares of the Fund. The returns shown do not reflect the deduction of taxes a shareholder would pay on Fund distributions or the redemption of Fund shares. The returns would have been lower had the Advisor not reduced its fees or reimbursed expenses. |
(d) |
Not annualized. |
(e) |
Annualized. |
(f) |
The Advisor voluntarily agreed to waive a portion of its fees and/or reimburse the Fund for expenses above 1.15% through June 30, 2017. Prior to May 1, 2016, the annual operating expense limitation was 1.25%. |
(g) |
The Advisor voluntarily agreed to waive a portion of its fees and/or reimburse the Fund for expenses above 1.25%. |
* |
Fiscal year changed to October 31, effective September 30, 2016. |
See accompanying notes to financial statements. |
61 |
CHARTWELL SMALL CAP VALUE FUND |
||||||||||||||||||||
Per Share Data for a Share Outstanding Throughout Each Year |
||||||||||||||||||||
|
Year |
Year |
Year |
Year |
Year |
|||||||||||||||
Net asset value at beginning of year |
$ | 18.79 | $ | 20.07 | $ | 16.25 | $ | 15.38 | $ | 16.30 | ||||||||||
Income (loss) from investment operations: |
||||||||||||||||||||
Net investment income |
0.13 | 0.06 | 0.05 | (a) | 0.10 | (a) | 0.10 | (a) | ||||||||||||
Net realized and unrealized gains (losses) on investment transactions |
1.04 | (0.45 | ) | 3.86 | 0.89 | (0.59 | ) | |||||||||||||
Total from investment operations |
1.17 | (0.39 | ) | 3.91 | 0.99 | (0.49 | ) | |||||||||||||
Less distributions: |
||||||||||||||||||||
From net investment income |
(0.07 | ) | (0.05 | ) | (0.09 | ) | (0.11 | ) | (0.05 | ) | ||||||||||
From net realized gains on investments |
(1.22 | ) | (0.84 | ) | — | (0.01 | ) | (0.38 | ) | |||||||||||
Total distributions |
(1.29 | ) | (0.89 | ) | (0.09 | ) | (0.12 | ) | (0.43 | ) | ||||||||||
Proceeds from redemption fees collected (Note 2) |
0.00 | (b) | 0.00 | (b) | 0.00 | (b) | 0.00 | (b) | 0.00 | (b) | ||||||||||
Net asset value at end of year |
$ | 18.67 | $ | 18.79 | $ | 20.07 | $ | 16.25 | $ | 15.38 | ||||||||||
Total return (c) |
7.54 | % | (2.18 | %) | 24.09 | % | 6.51 | % | (3.06 | %) | ||||||||||
Ratios/Supplementary data: |
||||||||||||||||||||
Net assets at end of year (000’s) |
$ | 172,753 | $ | 228,779 | $ | 165,538 | $ | 162,782 | $ | 148,071 | ||||||||||
Ratio of total expenses to average net assets: |
||||||||||||||||||||
Before fees reduced and other expenses absorbed |
1.07 | % | 1.08 | % | 1.14 | % | 1.30 | % | 1.48 | % | ||||||||||
After fees reduced and other expenses absorbed (d) |
1.05 | % | 1.05 | % | 1.05 | % | 1.05 | % | 1.05 | % | ||||||||||
Ratio of net investment income to average net assets: |
||||||||||||||||||||
Before fees reduced and other expenses absorbed |
0.67 | % | 0.25 | % | 0.18 | % | 0.42 | % | 0.17 | % | ||||||||||
After fees reduced and other expenses absorbed (d) |
0.69 | % | 0.28 | % | 0.27 | % | 0.67 | % | 0.60 | % | ||||||||||
Portfolio turnover rate |
30 | % | 19 | % | 39 | % | 22 | % | 21 | % | ||||||||||
(a) |
Based on average shares outstanding. |
(b) |
Amount rounds to less than $0.01 per share. |
(c) |
Total return is a measure of the change in value of an investment in the Fund over the period covered, which assumes any dividends or capital gains distributions are reinvested in shares of the Fund. The returns shown do not reflect the deduction of taxes a shareholder would pay on Fund distributions or the redemption of Fund shares. The returns would have been lower had the Advisor not reduced its fees or reimbursed expenses. |
(d) |
The Advisor has contractually agreed to reduce its fees and/or reimburse other expenses of the Fund to ensure that the total annual operating expenses do not exceed 1.05% of average daily net assets (Note 3). |
62 |
See accompanying notes to financial statements. |
CHARTWELL SHORT DURATION HIGH YIELD FUND |
||||||||||||||||||||
Per Share Data for a Share Outstanding Throughout Each Year |
||||||||||||||||||||
|
Year |
Year |
Year |
Year |
Year |
|||||||||||||||
Net asset value at beginning of year |
$ | 9.48 | $ | 9.72 | $ | 9.62 | $ | 9.58 | $ | 9.92 | ||||||||||
Income (loss) from investment operations: |
||||||||||||||||||||
Net investment income |
0.35 | 0.29 | 0.31 | (a) | 0.33 | (a) | 0.29 | (a) | ||||||||||||
Net realized and unrealized gains (losses) on investment transactions |
0.20 | (0.24 | ) | 0.11 | 0.06 | (0.35 | ) | |||||||||||||
Total from investment operations |
0.55 | 0.05 | 0.42 | 0.39 | (0.06 | ) | ||||||||||||||
Less distributions: |
||||||||||||||||||||
From net investment income |
(0.35 | ) | (0.29 | ) | (0.32 | ) | (0.33 | ) | (0.28 | ) | ||||||||||
From net realized gains on investments |
— | — | — | (0.02 | ) | — | ||||||||||||||
Total distributions |
(0.35 | ) | (0.29 | ) | (0.32 | ) | (0.35 | ) | (0.28 | ) | ||||||||||
Proceeds from redemption fees collected (Note 2) |
0.00 | (b) | — | — | — | — | ||||||||||||||
Net asset value at end of year |
$ | 9.68 | $ | 9.48 | $ | 9.72 | $ | 9.62 | $ | 9.58 | ||||||||||
Total return (c) |
5.89 | % | 0.55 | % | 4.42 | % | 4.29 | % | (0.61 | %) | ||||||||||
Ratios/Supplementary data: |
||||||||||||||||||||
Net assets at end of year (000’s) |
$ | 91,914 | $ | 75,536 | $ | 35,191 | $ | 21,349 | $ | 19,571 | ||||||||||
Ratio of total expenses to average net assets: |
||||||||||||||||||||
Before fees reduced and other expenses absorbed |
0.67 | % | 0.80 | % | 1.16 | % | 1.50 | % | 2.15 | % | ||||||||||
After fees reduced and other expenses absorbed (d) |
0.49 | % | 0.49 | % | 0.61 | % | 0.65 | % | 0.52 | %(e) | ||||||||||
Ratio of net investment income to average net assets: |
||||||||||||||||||||
Before fees reduced and other expenses absorbed |
3.44 | % | 2.84 | % | 2.70 | % | 2.66 | % | 1.32 | % | ||||||||||
After fees reduced and other expenses absorbed (d) |
3.62 | % | 3.15 | % | 3.25 | % | 3.51 | % | 2.95 | %(e) | ||||||||||
Portfolio turnover rate |
41 | % | 26 | % | 62 | % | 52 | % | 40 | % | ||||||||||
(a) |
Based on average shares outstanding. |
(b) |
Amount rounds to less than $0.01 per share. |
(c) |
Total return is a measure of the change in value of an investment in the Fund over the period covered, which assumes any dividends or capital gains distributions are reinvested in shares of the Fund. The returns shown do not reflect the deduction of taxes a shareholder would pay on Fund distributions or the redemption of Fund shares. The returns would have been lower had the Advisor not reduced its fees or reimbursed expenses. |
(d) |
Effective August 11, 2017, the Advisor contractually agreed to reduce its fees and/or absorb expenses of the Fund to ensure that the total annual operating expenses do not exceed 0.49% of average daily net assets. Prior to August 11, 2017, the annual operating expense limit was 0.65% (Note 3). |
(e) |
The Advisor reduced its investment advisory fees and paid all of the Fund’s operating expenses through January 15, 2015. For the period January 16, 2015 through March 6, 2015, the Advisor agreed to an initial expense limitation which increased by 0.02% per day until the Fund reached its full contractual expense limitation. |
See accompanying notes to financial statements. |
63 |
CHARTWELL SMALL CAP GROWTH FUND |
||||||||||||
Per Share Data for a Share Outstanding Throughout Each Period |
||||||||||||
|
|
Year |
For the Period |
|||||||||
Net asset value at beginning of period |
$ | 11.55 | $ | 10.69 | $ | 10.00 | ||||||
Income (loss) from investment operations: |
||||||||||||
Net investment loss |
(0.04 | ) | (0.04 | ) | (0.03 | )(a) | ||||||
Net realized and unrealized gains on investment transactions |
0.32 | 0.90 | 0.72 | |||||||||
Total from investment operations |
0.28 | 0.86 | 0.69 | |||||||||
Less distributions: |
||||||||||||
From net investment income |
— | (0.00 | )(b) | — | ||||||||
From net realized gains on investments |
(0.05 | ) | — | — | ||||||||
Total distributions |
(0.05 | ) | (0.00 | )(b) | — | |||||||
Proceeds from redemption fees collected (Note 2) |
0.00 | (b) | — | — | ||||||||
Net asset value at end of period |
$ | 11.78 | $ | 11.55 | $ | 10.69 | ||||||
Total return (c) |
2.46 | % | 8.07 | % | 6.90 | %(d) | ||||||
Ratios/Supplementary data: |
||||||||||||
Net assets at end of period (000’s) |
$ | 20,637 | $ | 17,821 | $ | 6,744 | ||||||
Ratio of total expenses to average net assets: |
||||||||||||
Before fees waived/reduced and other expenses absorbed |
1.64 | % | 2.15 | % | 11.54 | %(e) | ||||||
After fees waived/reduced and other expenses absorbed (f) |
1.05 | % | 1.05 | % | 1.25 | %(e) | ||||||
Ratio of net investment loss to average net assets: |
||||||||||||
Before fees waived/reduced and other expenses absorbed |
(0.98 | %) | (1.56 | %) | (11.12 | %)(e) | ||||||
After fees waived/reduced and other expenses absorbed (f) |
(0.39 | %) | (0.45 | %) | (0.83 | %)(e) | ||||||
Portfolio turnover rate |
104 | % | 97 | % | 43 | %(d) | ||||||
* |
Commencement of operations. |
(a) |
Based on average shares outstanding. |
(b) |
Amount rounds to less than $0.01 per share. |
(c) |
Total return is a measure of the change in value of an investment in the Fund over the period covered, which assumes any dividends or capital gains distributions re reinvested in shares of the Fund. The returns shown do not reflect the deduction of taxes a shareholder would pay on Fund distributions or the redemption of Fund shares. The returns would have been lower had the Advisor not reduced its fees and reimbursed expenses. |
(d) |
Not annualized. |
(e) |
Annualized. |
(f) |
Effective November 6, 2017, the Advisor contractually agreed to reduce its fees and/or pay for operating expenses of the Fund to ensure that total annual operating expenses do not exceed 1.05% of the average daily net assets of the Fund. Prior to November 6, 2017, the annual operating expense limitation was 1.25% (Note 3). |
64 |
See accompanying notes to financial statements. |
CHARTWELL FUNDS
NOTES TO FINANCIAL STATEMENTS
October 31, 2019
Note 1 – Organization
Berwyn Income Fund, Chartwell Mid Cap Value Fund, Chartwell Small Cap Value Fund, Chartwell Short Duration High Yield Fund and Chartwell Small Cap Growth Fund (each a “Fund” and collectively the “Funds”) are each a diversified series of The Chartwell Funds, a Delaware statutory trust (the “Trust”) which is registered as an open-end management investment company under the Investment Company Act of 1940, as amended (the “1940 Act”).
Berwyn Income Fund’s primary investment objective is to provide investors with current income; seeking to preserve capital is a secondary consideration. The Fund commenced investment operations on September 3, 1987.
Chartwell Mid Cap Value Fund’s primary investment objective is to achieve long-term capital appreciation. The Fund commenced investment operations on May 1, 2002.
Chartwell Small Cap Value Fund’s primary investment objective is to seek long-term capital appreciation. The Fund commenced investment operations on March 16, 2012.
Chartwell Short Duration High Yield Fund’s primary investment objective is to seek income and long-term capital appreciation. The Fund commenced investment operations on July 15, 2014.
Chartwell Small Cap Growth Fund’s primary investment objective is to seek long-term capital appreciation. The Fund commenced investment operations on June 16, 2017.
As of the close of business on April 27, 2018, Chartwell Small Cap Value Fund (the “Acquiring Fund”) acquired the assets and assumed the liabilities of Berwyn Fund, a former series of the Trust (the “Acquired Fund”), in a tax-free reorganization in exchange for shares of the Acquiring Fund, pursuant to a plan of reorganization approved by the Acquired Fund’s shareholders. For financial reporting purposes, assets received and shares issued by the Acquiring Fund were recorded at fair value; however, the cost basis of the investments received from the Acquired Fund was carried forward to align ongoing reporting of the Acquiring Fund’s realized and unrealized gains and losses with amounts distributable to shareholders for tax purposes. The number and value of shares issued by the Acquiring Fund to shareholders of the Acquired Fund are presented on the Statements of Changes in Net Assets. Net assets and net unrealized depreciation as of the reorganization date were as follows:
Total Net Assets of |
Total Net Assets of |
Total Net Assets of |
Cost of Investments |
Net Unrealized |
|||||||||||||||
| $ | 79,889,004 | $ | 175,992,649 | $ | 255,881,653 | $ | 79,554,590 | $ | (437,953 | ) | |||||||||
Note 2 – Significant Accounting Policies
Each Fund follows accounting and reporting guidance under Financial Accounting Standards Board Accounting Standards Codification (“ASC”) Topic 946, “Financial Services – Investment
65
CHARTWELL FUNDS
NOTES TO FINANCIAL STATEMENTS (Continued)
Companies.” The following is a summary of the Funds’ significant accounting policies. These policies are in conformity with accounting principles generally accepted in the United States of America (“GAAP”).
|
(a) |
Valuation of Investments |
Each Fund values equity securities at the last reported sale price on the principal exchange or in the principal over the counter (“OTC”) market in which such securities are traded, as of the close of regular trading on the New York Stock Exchange on the day the securities are being valued or, if the last-quoted sales price is not readily available, the securities will be valued at the last bid or the mean between the last available bid and ask price. Securities traded on the NASDAQ are valued at the NASDAQ Official Closing Price. Investments in open-end investment companies are valued at the daily closing net asset value (“NAV”) of the respective investment company. Debt securities are typically valued by utilizing a price supplied by independent pricing service providers. The independent pricing service providers may use various valuation methodologies including matrix pricing and other analytical pricing models as well as market transactions and dealer quotations. These models generally consider such factors as yields or prices of bonds of comparable quality, type of issue, coupon, maturity, ratings and general market conditions. If a price is not readily available for a portfolio security, the security will be valued at fair value (the amount which a Fund might reasonably expect to receive for the security upon its current sale) as determined in good faith by Chartwell Investment Partners, LLC (the “Advisor”) as defined in Note 3, subject to review and approval by the Advisor’s Portfolio Pricing Committee (“APPC”), pursuant to procedures adopted by the Board of Trustees. The actions of the APPC are subsequently reviewed by the Board at its next regularly scheduled board meeting. The APPC meets as needed. The APPC is comprised of personnel of the Advisor (CFO, COO, CCO, the applicable portfolio manager or lead analyst).
|
(b) |
Share Valuation and Redemption Fees |
The NAV per share of each Fund is calculated as of the close of regular trading on the NYSE (normally 4:00 p.m., Eastern time) on each day that the NYSE is open for business. The NAV per share of each Fund is calculated by dividing the total value of the Fund’s assets, less its liabilities, by the number of its shares outstanding. The offering price and redemption price per share of each Fund is equal to the NAV per share next computed after receipt of an order to purchase or to redeem shares. However, a redemption fee of 1%, payable to the applicable Fund, generally will apply to shares that are redeemed within 30 days of purchase. During the years ended October 31, 2019 and 2018, proceeds from redemption fees were as follows:
|
2019 |
2018 |
||||||
Berwyn Income Fund |
$ | 14,167 | $ | 8,778 | ||||
Chartwell Mid Cap Value Fund |
— | — | ||||||
Chartwell Small Cap Value Fund |
1,176 | 906 | ||||||
Chartwell Short Duration High Yield Fund |
2 | — | ||||||
Chartwell Small Cap Growth Fund |
1 | — | ||||||
66
CHARTWELL FUNDS
NOTES TO FINANCIAL STATEMENTS (Continued)
|
(c) |
Investment Transactions, Investment Income and Expenses |
Investment transactions are accounted for on the trade date. Realized gains and losses on investments are determined on the identified cost basis. Dividend income is recorded net of applicable withholding taxes on the ex-dividend date and interest income is recorded on an accrual basis. Withholding taxes on foreign dividends, if applicable, are paid (a portion of which may be reclaimable) or provided for in accordance with the applicable country’s tax rules and rates and are disclosed on the Statements of Operations. Withholding tax reclaims are filed in certain countries to recover a portion of the amounts previously withheld. The Funds record a reclaim receivable based on a number of factors, including a jurisdiction’s legal obligation to pay reclaims, as well as payment history and market convention. Discounts or premiums on debt securities are accreted or amortized to interest income over the lives of the respective securities using the effective interest method. Expenses incurred by the Trust with respect to more than one Fund are allocated in proportion to the net assets of each Fund except where allocation of direct expenses to each Fund or an alternative allocation method can be more appropriately made.
|
(d) |
Cash Accounts |
At times, the Funds may invest cash in a sweep vehicle program whereby a bank, acting as agent of its customer, endeavors to place such amounts in excess of the FDIC standard maximum deposit insurance amount (currently $250,000) with one or more other FDIC-insured member banks in either demand deposit accounts or money market deposit accounts. Such deposits are in amounts at any such bank not in excess of the FDIC standard maximum deposit insurance amount such that the customer’s funds are FDIC-insured across the various banks at which such funds are deposited. TriState Capital Bank provides this service to its clients, including the Advisor. Both TriState Capital Bank and the Advisor are subsidiaries of TriState Capital Holdings. These deposits are not custodied by TriState Capital Bank, and TriState Capital Bank does not receive any fees relating to these deposits. These amounts are included as Cash on the Statements of Assets and Liabilities to the extent they are held by a Fund as of October 31, 2019.
|
(e) |
Federal Income Taxes |
The Funds intend to comply with the requirements of Subchapter M of the Internal Revenue Code applicable to regulated investment companies and to distribute substantially all of their net investment income and any net realized capital gains to their shareholders. Therefore, no provision is made for federal income or excise taxes. Due to the timing of distributions and the differences in accounting for net investment income and realized capital gains and losses for financial statement and federal income tax purposes, the fiscal year in which amounts are distributed may differ from the year in which the net investment income and realized capital gains and losses are recorded by the Funds.
Accounting for Uncertainty in Income Taxes (the “Income Tax Statement”) requires an evaluation of tax positions taken (or expected to be taken) in the course of preparing a Fund’s tax returns to determine whether these positions meet a “more-likely-than-not” standard that, based on the technical merits, have a more than fifty percent likelihood of being sustained by a taxing authority upon examination. A tax position that meets the “more-likely-than-not”
67
CHARTWELL FUNDS
NOTES TO FINANCIAL STATEMENTS (Continued)
recognition threshold is measured to determine the amount of benefit or expense to recognize in the financial statements. The Funds recognize interest and penalties, if any, as income tax expense on the Statements of Operations.
The Income Tax Statement requires management of the Funds to analyze tax positions taken in the prior three open tax years, if any, and tax positions expected to be taken in the Funds’ current tax year, as defined by the IRS statute of limitations for all major jurisdictions, including federal tax authorities and certain state tax authorities. As of and during the open periods (generally, three years) the Funds did not have a liability for any unrecognized tax expenses. The Funds have no examination in progress and are not aware of any tax positions for which it is reasonably likely that the total amounts of unrecognized tax expenses will significantly change in the next twelve months.
|
(f) |
Distributions to Shareholders |
Chartwell Mid Cap Value Fund, Chartwell Small Cap Value Fund and Chartwell Small Cap Growth Fund make distributions of net investment income and net realized capital gains, if any, at least annually. Berwyn Income Fund and Chartwell Short Duration High Yield Fund make distributions of net investment income monthly and net realized capital gains, if any, at least annually. Prior to July 1, 2019, Berwyn Income Fund made distributions of net investment income quarterly. Distributions to shareholders are recorded on the ex-dividend date. The amount and timing of distributions are determined in accordance with federal income tax regulations, which may differ from GAAP.
|
(g) |
Accounting Estimates |
The preparation of financial statements in conformity with GAAP requires management to make estimates and assumptions that affect the reported amounts of assets and liabilities and the disclosure of contingent assets and liabilities as of the date of the financial statements and the reported amounts of income and expenses during the reporting period. Actual results could differ from these estimates.
Note 3 – Investment Advisory and Other Agreements
The Trust, on behalf of the Funds, has entered into an Investment Advisory Agreement (the “Agreement”) with the Advisor. Under the terms of the Agreement, the Funds pay a monthly investment advisory fee to the Advisor at the following annual rates based on the average daily net assets of the Funds:
Berwyn Income Fund |
||||
First $1.75 billion |
0.50 | % | ||
Next $1.75 billion |
0.48 | % | ||
Thereafter |
0.46 | % | ||
Chartwell Mid Cap Value Fund |
0.75 | % | ||
Chartwell Small Cap Value Fund |
0.90 | % | ||
Chartwell Short Duration High Yield Fund |
0.40 | % | ||
Chartwell Small Cap Growth Fund |
0.85 | % |
68
CHARTWELL FUNDS
NOTES TO FINANCIAL STATEMENTS (Continued)
The Advisor has contractually agreed to reduce its fees and/or reimburse other operating expenses (excluding taxes, leverage interest, brokerage commissions, dividend and interest expenses on short sales, acquired fund fees and expenses, expenses incurred in connection with any merger or reorganization, and extraordinary expenses such as litigation expenses) in order to limit total annual operating expenses of each Fund as stated below. This agreement is in effect for a period of two years with respect to each Fund, and it may be terminated before the two-year term only by the Trust’s Board of Trustees. The table below reflects the expense cap for each Fund:
|
Expense Limit as a % |
|||
Berwyn Income Fund |
0.64 | % | ||
Chartwell Mid Cap Value Fund |
0.90 | %* | ||
Chartwell Small Cap Value Fund |
1.05 | % | ||
Chartwell Short Duration High Yield Fund |
0.49 | % | ||
Chartwell Small Cap Growth Fund |
1.05 | % | ||
* |
Effective September 1, 2019, the expense limit as a percentage of average daily net assets for Chartwell Mid Cap Value Fund was changed from 1.05% to 0.90%. |
During the year ended October 31, 2019, the Advisor reduced its fees and reimbursed other expenses as follows:
|
Advisory fees |
|||
Berwyn Income Fund |
$ | 212,996 | ||
Chartwell Mid Cap Value Fund |
102,814 | |||
Chartwell Small Cap Value Fund |
36,561 | |||
Chartwell Short Duration High Yield Fund |
149,868 | |||
Chartwell Small Cap Growth Fund |
119,074 | |||
The Advisor is permitted to seek reimbursement of fee reductions and expense reimbursements from each Fund for a period ending three years after the date of the reduction or reimbursement, provided that the reimbursement does not cause expenses to exceed the lesser of (a) the expense limitation amount in effect at the time such fees were reduced or reimbursements made, or (b) the expense limitation amount in effect at the time of the reimbursement. However, for Berwyn Income Fund and Chartwell Mid Cap Value Fund, the Advisor is not
69
CHARTWELL FUNDS
NOTES TO FINANCIAL STATEMENTS (Continued)
permitted to seek reimbursement of any advisory fee reductions or expense reimbursements prior to April 29, 2018. The Advisor may recapture all or a portion of fee reductions and expense reimbursements no later than the dates stated below:
|
Berwyn |
Chartwell |
Chartwell |
Chartwell |
Chartwell |
|||||||||||||||
October 31, 2020 |
$ | — | $ | — | $ | 155,138 | $ | 137,955 | $ | 93,645 | ||||||||||
October 31, 2021 |
227,945 | 59,204 | 50,320 | 158,590 | 170,579 | |||||||||||||||
October 31, 2022 |
212,996 | 102,814 | 36,561 | 149,868 | 119,074 | |||||||||||||||
Total |
$ | 440,941 | $ | 162,018 | $ | 242,019 | $ | 446,413 | $ | 383,298 | ||||||||||
The Advisor and the officers of the Advisor, together with their families, owned 27,377 shares, 30,861 shares, 96,720 shares, 31,790 shares and 33,785 shares of Berwyn Income Fund, Chartwell Mid Cap Value Fund, Chartwell Short Duration High Yield Fund, Chartwell Small Cap Value Fund and Chartwell Small Cap Growth Fund, respectively, as of October 31, 2019.
Ultimus Fund Solutions, LLC (“Ultimus”) provides administration, fund accounting and transfer agency services to the Funds. The Funds pay Ultimus fees in accordance with the agreements for such services. In addition, the Funds pay out-of-pocket expenses including, but not limited to, postage, supplies, and costs of pricing the Funds’ portfolio securities.
Berwyn Income Fund and Chartwell Mid Cap Value Fund compensate certain financial intermediaries for providing account maintenance and shareholder services to shareholder accounts held through such intermediaries. During the year ended October 31, 2019, Berwyn Income Fund, Chartwell Mid Cap Value Fund, Chartwell Small Cap Value Fund, Chartwell Short Duration High Yield Fund and Chartwell Small Cap Growth Fund paid $778,682, $12,233, $17,200, $3,800 and $2,000, respectively, to financial intermediaries for such services. These amounts are included in transfer agent fees on the Statements of Operations.
Foreside Fund Services, LLC (“Foreside”) serves as the Funds’ distributor.
Certain Trustees and officers of the Trust are also officers or employees of the Advisor and/or Ultimus. The Funds do not compensate Trustees and officers affiliated with the Funds’ Advisor or Ultimus. For their services to the Trust, each Independent Trustee receives an annual retainer of $35,000, plus $1,500 for each Board meeting attended in-person, and $1,000 for each Board meeting attended telephonically, plus reimbursement of related expenses. In addition, each member of the Audit Committee, which is comprised solely of Independent Trustees, receives $1,500 for each Audit Committee meeting attended in-person, and $1,000 for each Audit Committee meeting attended telephonically.
The Trust’s Chief Compliance Officer (“CCO”) is an officer of the Advisor.
70
CHARTWELL FUNDS
NOTES TO FINANCIAL STATEMENTS (Continued)
PRINCIPAL HOLDERS OF FUND SHARES
As of October 31, 2019, the following shareholders owned of record 25% or more of the outstanding shares of the following Funds:
NAME OF RECORD OWNER |
% Ownership |
Berwyn Income Fund |
|
Charles Schwab & Company, Inc. (for the benefit of its customers) |
28% |
Chartwell Mid Cap Value Fund |
|
National Financial Services Corp. (for the benefit of its customers) |
27% |
Chartwell Small Cap Value Fund |
|
UBS Group AG (for the benefit of its customers) |
26% |
Chartwell Short Duration High Yield Fund |
|
National Financial Services, LLC (for the benefit of its customers) |
27% |
Chartwell Small Cap Growth Fund |
|
National Financial Services, LLC (for the benefit of its customers) |
73% |
A beneficial owner of 25% or more of a Fund’s outstanding shares may be considered a controlling person. That shareholder’s vote could have a more significant effect on matters presented at a shareholders’ meeting.
Note 4 – Federal Income Taxes
At October 31, 2019, gross unrealized appreciation and depreciation of investments, based on cost for federal income tax purposes, were as follows:
|
Berwyn |
Chartwell |
||||||
Cost of investments |
$ | 1,011,982,503 | $ | 23,940,042 | ||||
Gross unrealized appreciation |
$ | 42,707,697 | $ | 2,492,623 | ||||
Gross unrealized depreciation |
(25,677,201 | ) | (1,076,982 | ) | ||||
Net unrealized appreciation on investments |
$ | 17,030,496 | $ | 1,415,641 | ||||
71
CHARTWELL FUNDS
NOTES TO FINANCIAL STATEMENTS (Continued)
|
Chartwell |
Chartwell |
Chartwell |
|||||||||
Cost of investments |
$ | 148,829,115 | $ | 91,077,018 | $ | 20,724,073 | ||||||
Gross unrealized appreciation |
$ | 34,317,533 | $ | 1,788,179 | $ | 2,482,363 | ||||||
Gross unrealized depreciation |
(11,573,695 | ) | (1,203,273 | ) | (834,919 | ) | ||||||
Net unrealized appreciation on investments |
$ | 22,743,838 | $ | 584,906 | $ | 1,647,444 | ||||||
The difference between the cost of investments for financial statement and federal income tax purposes is due to certain timing differences in recognizing capital gains and losses in security transactions under income tax regulations and GAAP. These “book/tax” differences are temporary in nature and are primarily due to the tax deferral of losses on wash sales.
As of October 31, 2019, the components of accumulated earnings (deficit) on a tax basis were as follows:
|
Berwyn |
Chartwell |
||||||
Net unrealized appreciation on investments |
$ | 17,030,496 | $ | 1,415,641 | ||||
Undistributed ordinary income |
551,832 | 208,099 | ||||||
Undistributed long-term capital gains |
— | 223,472 | ||||||
Accumulated capital and other losses |
(5,050,771 | ) | — | |||||
Total accumulated earnings |
$ | 12,531,557 | $ | 1,847,212 | ||||
|
Chartwell |
Chartwell |
Chartwell |
|||||||||
Net unrealized appreciation on investments |
$ | 22,743,838 | $ | 584,906 | $ | 1,647,444 | ||||||
Undistributed ordinary income |
987,171 | — | — | |||||||||
Undistributed long-term capital gains |
4,952,089 | — | 7,435 | |||||||||
Accumulated capital and other losses |
— | (583,363 | ) | (72,964 | ) | |||||||
Total accumulated earnings |
$ | 28,683,098 | $ | 1,543 | $ | 1,581,915 | ||||||
As of October 31, 2019, Berwyn Income Fund had a long-term capital loss carryforward for federal income tax purposes of $5,050,771 and Chartwell Short Duration High Yield Fund had a short-term capital loss carryforward for federal income tax purposes of $360,067 and a long-term capital loss carryforward for federal income tax purposes of $223,296, all of which may be carried forward indefinitely. These capital loss carryforwards are available to offset realized capital gains in future years, thereby reducing future taxable gain distributions.
72
CHARTWELL FUNDS
NOTES TO FINANCIAL STATEMENTS (Continued)
During the year ended October 31, 2019, Chartwell Short Duration High Yield Fund utilized $126,317 and $63,892 of short-term and long-term capital loss carryovers, respectively.
Net qualified late year losses, incurred after December 31, 2018 and within the taxable year, are deemed to arise on the first day of a Fund’s next taxable year. For the year ended October 31, 2019, Chartwell Small Cap Growth Fund deferred $72,964 of late year ordinary losses to November 1, 2019 for federal income tax purposes.
For the year ended October 31, 2019, the following reclassifications were made as a result of permanent differences between the financial statement and income tax reporting requirements:
|
Berwyn |
Chartwell |
Chartwell |
Chartwell |
Chartwell |
|||||||||||||||
Paid-in capital |
$ | — | $ | — | $ | (16,406 | ) | $ | (10,151 | ) | $ | (75,116 | ) | |||||||
Accumulated earnings |
$ | — | $ | — | $ | 16,406 | $ | 10,151 | $ | 75,116 | ||||||||||
Such reclassifications have no effect on each Fund’s total net assets or its NAV per share.
The tax character of distributions paid during the years ended October 31, 2019 and 2018 was as follows:
Berwyn Income Fund |
Chartwell Mid Cap Value Fund |
|||||||||||||||
|
2019 |
2018 |
2019 |
2018 |
||||||||||||
Distributions paid from: |
||||||||||||||||
Ordinary Income |
$ | 59,728,632 | $ | 34,645,637 | $ | 1,147,462 | $ | 1,611,013 | ||||||||
Net long-term capital gains |
22,619,386 | 52,383,660 | 497,071 | 2,844,535 | ||||||||||||
Total distributions paid |
$ | 82,348,018 | $ | 87,029,297 | $ | 1,644,533 | $ | 4,455,548 | ||||||||
Chartwell Small |
Chartwell Short Duration |
|||||||||||||||
|
2019 |
2018 |
2019 |
2018 |
||||||||||||
Distributions paid from: |
||||||||||||||||
Ordinary Income |
$ | 2,076,114 | $ | 340,645 | $ | 2,983,171 | $ | 1,612,434 | ||||||||
Net long-term capital gains |
13,184,797 | 7,021,825 | — | — | ||||||||||||
Total distributions paid |
$ | 15,260,911 | $ | 7,362,470 | $ | 2,983,171 | $ | 1,612,434 | ||||||||
73
CHARTWELL FUNDS
NOTES TO FINANCIAL STATEMENTS (Continued)
Chartwell Small Cap Growth Fund |
||||||||
|
2019 |
2018 |
||||||
Distributions paid from: |
||||||||
Ordinary Income |
$ | — | $ | 2,563 | ||||
Net long-term capital gains |
70,964 | 185 | ||||||
Total distributions paid |
$ | 70,964 | $ | 2,748 | ||||
Note 5 – Investment Transactions
During the year ended October 31, 2019, purchases and sales of investments, excluding short-term investments and U.S. government securities, were as follows:
|
Purchases |
Sales |
||||||
Berwyn Income Fund |
$ | 1,223,681,406 | $ | 1,763,158,629 | ||||
Chartwell Mid Cap Value Fund |
8,402,910 | 9,827,340 | ||||||
Chartwell Small Cap Value Fund |
57,963,461 | 122,155,254 | ||||||
Chartwell Short Duration High Yield Fund |
46,421,682 | 32,408,556 | ||||||
Chartwell Small Cap Growth Fund |
22,027,239 | 19,715,675 | ||||||
Note 6 – Indemnifications
In the normal course of business, the Funds enter into contracts that contain a variety of representations which provide general indemnifications. The Funds’ maximum exposure under these arrangements is unknown, as this would involve future claims that may be made against the Funds that have not yet occurred. However, the Funds expect the risk of loss to be remote.
Note 7 – Fair Value Measurements and Disclosure
ASC 820 defines fair value, establishes a framework for measuring fair value in accordance with GAAP, and expands disclosure about fair value measurements. It also provides guidance on determining when there has been a significant decrease in the volume and level of activity for an asset or a liability, when a transaction is not orderly, and how that information must be incorporated into a fair value measurement.
Various inputs are used in determining the value of each Fund’s investments. These inputs are summarized into three broad Levels as described below:
|
● |
Level 1 – Unadjusted quoted prices in active markets for identical assets or liabilities that a Fund has the ability to access. |
|
● |
Level 2 – Observable inputs other than quoted prices included in Level 1 that are observable for the asset or liability, either directly or indirectly. These inputs may include |
74
CHARTWELL FUNDS
NOTES TO FINANCIAL STATEMENTS (Continued)
quoted prices for the identical instrument on an inactive market, prices for similar instruments, interest rates, prepayment speeds, credit risk, yield curves, default rates and similar data.
|
● |
Level 3 – Unobservable inputs for the asset or liability, to the extent relevant observable inputs are not available, representing a Fund’s own assumptions about the assumptions a market participant would use in valuing the asset or liability, and would be based on the best information available. |
The availability of observable inputs can vary from security to security and is affected by a wide variety of factors, including, for example, the type of security, whether the security is new and not yet established in the marketplace, the liquidity of markets, and other characteristics particular to the security. To the extent that valuation is based on models or inputs that are less observable or unobservable in the market, the determination of fair value requires more judgment. Accordingly, the degree of judgment exercised in determining fair value is greatest for instruments categorized in Level 3.
The inputs used to measure fair value may fall into different Levels of the fair value hierarchy. In such cases, for disclosure purposes, the level in the fair value hierarchy within which the fair value measurement falls in its entirety is determined based on the lowest level input that is significant to the fair value measurement in its entirety.
The inputs or methodology used for valuing securities are not an indication of the risks associated with investing in those securities. The following is a summary of the inputs used, as of October 31, 2019, in valuing the Funds’ investments carried at fair value:
Berwyn Income Fund |
Level 1 |
Level 2 |
Level 3 |
Total |
||||||||||||
Investments |
||||||||||||||||
Common Stocks |
$ | 294,188,587 | $ | — | $ | — | $ | 294,188,587 | ||||||||
Preferred Stocks |
19,989,362 | — | — | 19,989,362 | ||||||||||||
Corporate Bonds |
— | 375,130,747 | — | 375,130,747 | ||||||||||||
Asset-Backed Securities |
— | 15,850,893 | — | 15,850,893 | ||||||||||||
Mortgage-Backed Securities |
— | 60,285,281 | — | 60,285,281 | ||||||||||||
U.S. Government Agency Obligations |
— | 162,919,642 | — | 162,919,642 | ||||||||||||
U.S. Treasury Obligations |
— | 71,602,240 | — | 71,602,240 | ||||||||||||
Money Market Funds |
29,046,247 | — | — | 29,046,247 | ||||||||||||
Total Investments |
$ | 343,224,196 | $ | 685,788,803 | $ | — | $ | 1,029,012,999 | ||||||||
75
CHARTWELL FUNDS
NOTES TO FINANCIAL STATEMENTS (Continued)
Chartwell Mid Cap Value Fund |
Level 1 |
Level 2 |
Level 3 |
Total |
||||||||||||
Investments |
||||||||||||||||
Common Stocks |
$ | 24,114,209 | $ | — | $ | — | $ | 24,114,209 | ||||||||
Money Market Funds |
1,241,474 | — | — | 1,241,474 | ||||||||||||
Total Investments |
$ | 25,355,683 | $ | — | $ | — | $ | 25,355,683 | ||||||||
Chartwell Small Cap Value |
Level 1 |
Level 2 |
Level 3 |
Total |
||||||||||||
Investments |
||||||||||||||||
Common Stocks |
$ | 167,487,312 | $ | — | $ | — | $ | 167,487,312 | ||||||||
Money Market Funds |
4,085,641 | — | — | 4,085,641 | ||||||||||||
Total Investments |
$ | 171,572,953 | $ | — | $ | — | $ | 171,572,953 | ||||||||
Chartwell Short Duration High Yield |
Level 1 |
Level 2 |
Level 3 |
Total |
||||||||||||
Investments |
||||||||||||||||
Corporate Bonds |
$ | — | $ | 86,704,502 | $ | — | $ | 86,704,502 | ||||||||
Money Market Funds |
4,957,422 | — | — | 4,957,422 | ||||||||||||
Total Investments |
$ | 4,957,422 | $ | 86,704,502 | $ | — | $ | 91,661,924 | ||||||||
Chartwell Small Cap Growth Fund |
Level 1 |
Level 2 |
Level 3 |
Total |
||||||||||||
Investments |
||||||||||||||||
Common Stocks |
$ | 19,519,453 | $ | — | $ | — | $ | 19,519,453 | ||||||||
Money Market Funds |
2,852,064 | — | — | 2,852,064 | ||||||||||||
Total Investments |
$ | 22,371,517 | $ | — | $ | — | $ | 22,371,517 | ||||||||
Refer to each Fund’s Schedule of Investments for a listing of the common stocks and/or corporate bonds, if applicable, by sector and/or industry type. The Funds did not hold derivative instruments or any assets or liabilities that were measured at fair value on a recurring basis using significant unobservable inputs (Level 3) as of or during the year ended October 31, 2019.
Note 8 – Securities Lending
Under the terms of the securities lending agreement with BMO Securities Lending (“BMO”), BMO is authorized to loan securities on behalf of the Funds to approved borrowers. The contractual maturity of securities lending transactions is on an overnight and continuous basis. In exchange, the Funds receive cash collateral in the amount of at least 100% of the value of the securities loaned. Any collateral shortfalls due to changes in security market prices are adjusted the next business day. The cash collateral is invested in short-term
76
CHARTWELL FUNDS
NOTES TO FINANCIAL STATEMENTS (Continued)
instruments as noted in each Fund’s Schedule of Investments. Although risk is mitigated by the collateral, the Funds could experience a delay in recovering their securities and possible loss of income or value if the borrower fails to return them. The agreement indemnifies the Funds from losses incurred in the event of a borrower’s material default of the terms and conditions of the borrower agreement. The agreement provides that after predetermined rebates to borrowers, the Funds each retain a portion of their respective net securities lending income and pay BMO the remaining portion.
As of October 31, 2019, the fair value of securities on loan and the collateral held were as follows:
|
Fair Value of |
Fair Value |
||||||
Berwyn Income Fund |
$ | 27,569,496 | $ | 28,408,725 | ||||
Chartwell Mid Cap Value Fund |
21,855 | 22,560 | ||||||
Chartwell Small Cap Value Fund |
3,618,367 | 3,724,813 | ||||||
Chartwell Short Duration High Yield Fund |
3,954,714 | 4,090,505 | ||||||
Chartwell Small Cap Growth Fund |
1,923,159 | 1,986,096 | ||||||
Note 9 – Sector Risk
If a Fund has significant investments in the securities of issuers in industries within a particular business sector, any development generally affecting that sector will have a greater impact on the value of the net assets of the Fund than would be the case if the Fund did not have significant investments in that sector. This may increase the risk of loss of an investment in a Fund and increase the volatility of a Fund’s NAV per share. From time to time, circumstances may affect a particular sector and the companies within such sector. For instance, economic or market factors, regulation or deregulation, and technological or other developments, may negatively impact all companies in a particular sector and therefore the value of a Fund’s portfolio could be adversely affected if it has significant holdings of securities of issuers in that sector. As of October 31, 2019, Chartwell Small Cap Growth Fund had 31.6% of the value of its net assets invested in stocks within the Health Care sector.
Note 10 – Events Subsequent to the Fiscal Year End
The Funds have adopted financial reporting rules regarding subsequent events which require an entity to recognize in the financial statements the effects of all subsequent events that provide additional evidence about conditions that existed at the date of the balance sheet. Management has evaluated the Funds’ related events and transactions that occurred through the date of issuance of the Funds’ financial statements. There were no events or transactions that occurred during the fiscal year that materially impacted the amounts or disclosures in the Funds’ financial statements.
77
CHARTWELL FUNDS
REPORT OF INDEPENDENT REGISTERED PUBLIC
ACCOUNTING FIRM
To the Board of Trustees of The Chartwell Funds
and the Shareholders of Berwyn Income Fund, Chartwell Mid Cap Value Fund,
Chartwell Small Cap Value Fund, Chartwell Short Duration High Yield Fund,
and Chartwell Small Cap Growth Fund
Opinion on the Financial Statements
We have audited the accompanying statements of assets and liabilities of Berwyn Income Fund, Chartwell Mid Cap Value Fund, Chartwell Small Cap Value Fund, Chartwell Short Duration High Yield Fund, and Chartwell Small Cap Growth Fund, each a series of shares of beneficial interest in The Chartwell Funds (the “Funds”), including the schedules of investments, as of October 31, 2019, and the related statements of operations for the year then ended, the statements of changes in net assets for each of the years in the two-year period then ended and the financial highlights for each of the years and the period June 16, 2017 through October 31, 2017 (commencement of operations for the Chartwell Small Cap Growth Fund) in the three-year period then ended, and the related notes (collectively referred to as the “financial statements”). We have also audited the financial highlights of Berwyn Income Fund and Chartwell Mid Cap Value Fund for each of the years during the two-year period ending December 31, 2015. In our opinion, the financial statements present fairly, in all material respects, the financial position of the Funds as of October 31, 2019, and the results of their operations, the changes in their net assets and their financial highlights for each of the years or periods detailed above, in conformity with accounting principles generally accepted in the United States of America. With respect to each of the Funds, and with the exception of the Chartwell Small Cap Growth Fund, the financial highlights for each of the periods presented in the table below have been audited by other auditors, whose report dated December 30, 2016 expressed an unqualified opinion on such financial highlights.
Fund |
Financial Highlights |
Berwyn Income Fund |
For the period January 1, 2016 through October 31, 2016 |
Chartwell Mid Cap Value Fund |
For the period January 1, 2016 through October 31, 2016 |
Chartwell Small Cap Value Fund |
For each of the years in the two-year period ended October 31, 2016 |
Chartwell Short Duration High Yield Fund |
For each of the years in the two-year period ended October 31, 2016 |
Basis for Opinion
These financial statements are the responsibility of the Funds’ management. Our responsibility is to express an opinion on the Funds’ financial statements based on our audits. We are a public accounting firm registered with the Public Company Accounting Oversight Board (United States) (“PCAOB”) and are required to be independent with respect to the Funds in accordance with the U.S. federal securities law and the applicable rules and regulations of the Securities and Exchange Commission and the PCAOB.
78
CHARTWELL FUNDS
REPORT OF INDEPENDENT REGISTERED PUBLIC
ACCOUNTING FIRM (Continued)
We conducted our audits in accordance with the standards of the PCAOB. Those standards require that we plan and perform the audits to obtain reasonable assurance about whether the financial statements are free of material misstatement, whether due to error or fraud. The Funds are not required to have, nor were we engaged to perform, an audit of their internal control over financial reporting. As part of our audits we are required to obtain an understanding of internal control over financial reporting but not for the purpose of expressing an opinion on the effectiveness of the Funds’ internal control over financial reporting. Accordingly, we express no such opinion.
Our audits included performing procedures to assess the risk of material misstatement of the financial statements, whether due to error or fraud, and performing procedures that respond to those risks. Such procedures included examining, on a test basis, evidence regarding the amounts and disclosures in the financial statements. Our procedures included confirmation of securities owned as of October 31, 2019 by correspondence with the custodian and brokers, or by other appropriate auditing procedures where replies from brokers were not received. Our audits also included evaluating the accounting principles used and significant estimates made by management, as well as evaluating the overall presentation of the financial statements. We believe that our audits provide a reasonable basis for our opinion.

BBD, LLP
We have served as the auditor of one or more of the Funds in The Chartwell Funds since 2017. Previously, we had served as the auditor of one or more of the Funds in the Berwyn Funds since 2003.
Philadelphia, Pennsylvania
December 18, 2019
79
CHARTWELL FUNDS
ABOUT YOUR FUNDS’ EXPENSES (Unaudited)
Expense Examples
As a shareholder of the Funds, you incur two types of costs: (1) transaction costs, which may include redemption fees; and (2) ongoing costs, including management fees and other Fund expenses. The examples below are intended to help you understand your ongoing costs (in dollars) of investing in the Funds and to compare these costs with the ongoing costs of investing in other mutual funds. A mutual fund’s ongoing costs are expressed as a percentage of its average net assets. This figure is known as the expense ratio.
These examples are based on an investment of $1,000 invested at the beginning of the period and held for the entire period from May 1, 2019 to October 31, 2019.
Actual Expenses
The information in the row titled “Based on Actual Fund Return” of the table below provides actual account values and actual expenses. You may use the information in these columns, together with the amount you invested, to estimate the expenses that you paid over the period. Simply divide your account value by $1,000 (for example, an $8,600 account value divided by $1,000 = 8.6), then multiply the result by the number in the appropriate row for your Fund, under the column titled “Expenses Paid During Period” to estimate the expenses you paid on your account during this period.
Hypothetical Example for Comparison Purposes
The information in the row titled “Based on Hypothetical 5% Return (before expenses)” of the table below provides hypothetical account values and hypothetical expenses based on each Fund’s actual expense ratios and an assumed rate of return of 5% per year before expenses, which is not each Fund’s actual return. The hypothetical account values and expenses may not be used to estimate the actual ending account balance or expenses you paid for the period. You may use this information to compare the ongoing costs of investing in the Funds with the ongoing costs of investing in other mutual funds. To do so, compare these 5% hypothetical examples with the 5% hypothetical examples that appear in the shareholder reports of the other mutual funds.
Please note that the expenses shown in the table are meant to highlight your ongoing costs only and do not reflect any transaction costs, such as sales charges (load) or redemption fees. Therefore, this information is useful in comparing ongoing costs only, and will not help you determine the relative total costs of owning different funds. In addition, if these transactional costs were included, your costs would have been higher.
80
CHARTWELL FUNDS
ABOUT YOUR FUNDS’ EXPENSES (Unaudited) (Continued)
|
Beginning |
Ending |
Net |
Expenses |
Berwyn Income Fund |
||||
Based on Actual Fund Return |
$1,000.00 |
$ 1,027.80 |
0.64% |
$3.27 |
Based on Hypothetical 5% Return (before expenses) |
$1,000.00 |
$ 1,021.98 |
0.64% |
$3.26 |
Chartwell Mid Cap Value Fund |
||||
Based on Actual Fund Return |
$1,000.00 |
$ 1,025.70 |
1.00% |
$5.09 |
Based on Hypothetical 5% Return (before expenses) |
$1,000.00 |
$ 1,020.18 |
1.00% |
$5.08 |
Chartwell Small Cap Value Fund |
||||
Based on Actual Fund Return |
$1,000.00 |
$ 1,014.10 |
1.05% |
$5.33 |
Based on Hypothetical 5% Return (before expenses) |
$1,000.00 |
$ 1,019.91 |
1.05% |
$5.35 |
Chartwell Short Duration High Yield Fund |
||||
Based on Actual Fund Return |
$1,000.00 |
$ 1,021.70 |
0.49% |
$2.50 |
Based on Hypothetical 5% Return (before expenses) |
$1,000.00 |
$ 1,022.74 |
0.49% |
$2.50 |
Chartwell Small Cap Growth Fund |
||||
Based on Actual Fund Return |
$1,000.00 |
$ 956.20 |
1.05% |
$5.18 |
Based on Hypothetical 5% Return (before expenses) |
$1,000.00 |
$ 1,019.91 |
1.05% |
$5.35 |
(a) |
Annualized, based on each Fund’s most recent one-half year expenses. |
(b) |
Expenses are equal to each Fund’s annualized net expense ratio multiplied by the average account value over the period, multiplied by 184/365 (to reflect the one-half year period). |
81
CHARTWELL FUNDS
OTHER INFORMATION (Unaudited)
Proxy Voting Policies and Procedures
A description of the Funds’ proxy voting policies and procedures related to portfolio securities is available without charge, upon request, by calling the Funds at 1-888-995-5505, or on the U.S. Securities and Exchange Commission (the “SEC”) website at www.sec.gov.
Proxy Voting Record
Information regarding how the Funds voted proxies for portfolio securities during the most recent 12-month period ended June 30, is also available, without charge and upon request, by calling the Funds at 1-888-995-5505, or by accessing the Funds’ Form N-PX on the SEC’s website at www.sec.gov.
Portfolio Disclosure
The Funds file a complete listing of portfolio holdings with the SEC as of the end of the first and third quarters of each fiscal year on Form N-Q or as an exhibit to its reports on Form N-Q’s successor form, Form N-PORT. These filings are available upon request by calling 1-888-995-5505. Furthermore, you may obtain a copy of the filings on the SEC’s website at www.sec.gov.
82
CHARTWELL FUNDS
FEDERAL TAX INFORMATION (Unaudited)
Dividends Received Deduction
For corporate shareholders, the following percentages of ordinary income dividends paid during the year ended December 31, 2018 qualify for the corporate dividends received deduction:
Berwyn Income Fund |
24.64 | % | ||
Chartwell Mid Cap Value Fund |
30.97 | % | ||
Chartwell Small Cap Value Fund |
100.00 | % | ||
Chartwell Short Duration High Yield Fund |
0.00 | % |
Qualified Dividend Income
The Funds have designated the maximum amount allowable of their net taxable income as qualified dividend income as provided in the Jobs and Growth Tax Relief Reconciliation Act of 2003. This amount was reflected on Form 1099-DIV for the calendar year 2018.
Capital Gain Distributions
For the year ended October 31, 2019, the following Funds designated long-term capital gain distributions:
Berwyn Income Fund |
$ | 22,619,386 | ||
Chartwell Mid Cap Value Fund |
$ | 497,071 | ||
Chartwell Small Cap Value Fund |
$ | 13,184,797 | ||
Chartwell Small Cap Growth Fund |
$ | 70,964 |
83
CHARTWELL FUNDS
BOARD OF TRUSTEES AND EXECUTIVE OFFICERS
(Unaudited)
The Board of Trustees has overall responsibility for management of the Trust’s affairs. The Trustees serve during the lifetime of the Trust and until its termination, or until death, resignation, retirement, or removal. The Trustees, in turn, elect the officers of the Trust to actively supervise its day-to-day operations. The officers have been elected for an annual term. The following are the Trustees and executive officers of the Trust:
Name, Address, Year of |
Term of |
Principal Occupation During the |
Number of |
Other |
“Independent” Trustees: |
||||
Gerald Frey (born 1946) Trustee |
Since 2017 |
Principal/General Partner, GSF Investments (1996-Present) |
5 |
None |
David M. O’Brien (born 1950) Trustee |
Since 2017 |
Retired (2012-Present) |
5 |
None |
Paul L. Rudy, III (born 1967) Trustee |
Since 2017 |
President, Graham Capital Company (2011-Present) |
5 |
None |
Interested Trustees: |
||||
Timothy J. Riddle † (born 1955) Chairman, Trustee, President and Chief Executive Officer |
Since 2017 |
Managing Partner and Chief Executive Officer, Chartwell Investment Partners, LLC (1997-Present) |
5 |
N/A |
84
CHARTWELL FUNDS
BOARD OF TRUSTEES AND EXECUTIVE OFFICERS
(Unaudited) (Continued)
Name, Address, Year of |
Term of |
Principal Occupation During the |
Number of |
Other |
Officers of the Trust: |
||||
Neil Walker (born 1980) Treasurer, Chief Financial Officer and Secretary |
Since 2017 |
Controller, Chartwell Investment Partners, LLC (2016-Present); Controller, The Killen Group (2011-2016) |
N/A |
N/A |
Michael Magee (born 1965) Executive Vice President |
Since 2017 |
Chief Operating Officer–Retail Division, Chartwell Investment Partners, LLC (2016-Present); Chief Operating Officer, The Killen Group (2013-2016) |
N/A |
N/A |
Gregory Hagar (born 1968) Vice President |
Since 2017 |
Managing Partner, Chief Financial Officer and Chief Operating Officer, Chartwell Investment Partners, LLC (1997-Present) |
N/A |
N/A |
LuAnn Molino (born 1963) Chief Compliance Officer |
Since 2017 |
Chief Compliance Officer, Marketing, Client Service, Chartwell Investment Partners, LLC (1997-Present) |
N/A |
N/A |
† |
Timothy J. Riddle is an “interested person” of the Trust by virtue of his affiliation with the Adviser and its affiliates. |
Additional information about the Trustees and executive officers is included in the Funds’ Statement of Additional Information which is available, without charge, upon request by calling (888) 995-5505.
85
CHARTWELL FUNDS
BOARD CONSIDERATION AND APPROVAL OF INVESTMENT ADVISORY AGREEMENT
(Unaudited)
At an in-person meeting held on May 23, 2019, the Board of Trustees (the “Trustees” or the “Board”) of The Chartwell Funds (the “Trust”), including the Trustees who are not “interested persons” of the Trust (the “Independent Trustees”) as defined in the Investment Company Act of 1940, as amended (the “1940 Act”), reviewed and approved the continuance of the Investment Advisory Agreement (the “Advisory Agreement”) between the Trust and Chartwell Investment Partners (the “Advisor”) with respect to the Berwyn Income Fund (“Income Fund”), Chartwell Mid Cap Value Fund (“Mid Cap Value Fund”), Chartwell Short Duration High Yield Fund (“High Yield Fund”), Chartwell Small Cap Growth Fund (“Small Cap Growth Fund”) and Chartwell Small Cap Value Fund (“Small Cap Value Fund”), each a series of the Trust (each, a “Fund” and together, the “Funds”), for an additional one-year period.
In considering the continuation of the Advisory Agreement, the Independent Trustees reviewed and considered information provided by the Advisor at the Meeting and throughout the year at meetings of the Board and its committees. The Independent Trustees also reviewed and considered the information and materials provided in response to a request for information submitted to the Advisor on behalf of the Board in connection with the proposed renewal of the Advisory Agreement, including statistical materials from Morningstar, an independent organization, comparing the performance of each Fund and the fees and expenses of each Fund with those of a peer group of funds. In connection with their review of each Fund, each Independent Trustee reviewed and considered all of the factors that he deemed relevant in approving the continuance of the Advisory Agreement, including, but not limited to: (i) the nature, extent and quality of the services provided by the Advisor; (ii) the investment performance of the Funds and the Advisor; (iii) the costs of the services provided and profits realized by the Advisor and its affiliates from their relationship with the Funds; (iv) the extent to which economies of scale are realized as the Funds grow; and (v) whether fee levels reflect these economies of scale for the benefit of Fund investors.
In their deliberations, the Independent Trustees considered all of the information provided, including the factors summarized below, in renewing the Advisory Agreement with respect to each Fund, noting that the Trustees did not identify any single factor as being more or less important than any of the others, and individual Trustees may have weighed certain factors differently. The Independent Trustees received a memorandum discussing the legal standards for their consideration of the continuation of the Investment Agreement and met separately with, and were assisted and advised by, their independent counsel.
Nature, Extent and of Quality of Services
The Trustees considered information about the nature, extent and quality of the services provided by the Advisor, including investment management services and operational and compliance support. The Trustees reviewed background, qualifications and experience of the Advisor’s personnel who are responsible for the day-to-day portfolio management of the Funds, or who provide significant other services to the Funds, as well as the changes in such personnel. The Trustees considered the Advisor’s responsibilities in serving as the Funds’ investment advisor, including: supervising and managing the investment and reinvestment of
86
CHARTWELL FUNDS
BOARD CONSIDERATION AND APPROVAL OF INVESTMENT ADVISORY AGREEMENT
(Unaudited) (Continued)
each Fund’s assets; voting, exercising consents and exercising all other rights appertaining to such securities and other assets on behalf of the Fund; supervising the investment program of the Fund and the composition of its investment portfolio; arranging for the purchase and sale of securities and other assets held in the investment portfolio of the Fund; monitoring compliance with various policies and procedures of the Funds; and periodic reporting to the Board. The Trustees were provided with, and considered information regarding, the Advisor’s investment decision-making process and its trading and investment research functions. The Trustees considered the Funds’ compliance program, the compliance reports periodically furnished to the Board, and the results of any regulatory exams. The Trustees also considered the marketing and distribution arrangements for the Funds and the current asset levels of the Funds. The Trustees concluded that they were satisfied with the nature, extent, and quality of services provided to each Fund by the Advisor under the Advisory Agreement.
Fund Performance
The Trustees reviewed the performance information for each Fund compiled by the Advisor and from Morningstar data for periods ended March 31, 2019. The Trustees reviewed each Fund’s performance in absolute terms and relative to the peer funds in its Morningstar investment category. The Trustees considered the size of each Fund in comparison to its peer funds, including whether the peer funds in each Morningstar investment category were part of a larger fund complex. The Trustees also reviewed the performance analysis prepared by the Advisor comparing each Fund’s performance relative to its benchmark index, over multiple performance periods, along with the Advisor’s explanation of the performance. Among other things, Trustees considered the following Fund-specific factors:
Income Fund. The Fund underperformed the category median for the one-, three-, and five-year periods, and the Fund outperformed the category median for the ten-year period. The Trustees considered that the Income Fund had recently transitioned to a new and expanded portfolio management team, which was not yet reflected in the performance results.
Mid Cap Value Fund. The Fund outperformed the category median for the one- and three-year periods and underperformed the category median for the five- and ten-year periods. The Trustees considered that the Fund has performed well relative to peers since it was repositioned in 2017.
High Yield Fund. The Fund underperformed the category median for the one- and three-year periods. The Trustees considered that the Fund maintains a higher average quality and shorter average maturity than the traditional high yield bond funds that are included in the Morningstar investment category.
Small Cap Growth Fund. The Fund underperformed the category median for the one-year period. The Trustees considered the Fund’s limited operational history, the impact of the challenging market environment in the fourth quarter of 2018, and the Advisor’s confidence in the Fund’s strategy and management team.
87
CHARTWELL FUNDS
BOARD CONSIDERATION AND APPROVAL OF INVESTMENT ADVISORY AGREEMENT
(Unaudited) (Continued)
Small Cap Value Fund. The Fund underperformed the category median for the one-, three- and five-year periods. The Trustees considered the impact of the challenging market environment in the fourth quarter of 2018, and the Advisor’s confidence in the Fund’s strategy and management team.
After considering the information provided and presented at the Meeting and at meetings throughout the year, including discussions with and explanations by the Advisor, the Trustees determined that the performance of each Fund was reasonable.
Advisory Fees and Expenses
The Board reviewed the fee and expense information for each Fund compiled from Morningstar data for periods as of the funds’ respective fiscal year ends. The Board compared each Fund’s actual advisory fee and total net expense ratio (after waivers) with the peer funds in its Morningstar investment category. The Board also considered the size of each Fund in comparison to its peer funds, including whether the funds in each Morningstar investment category were part of a larger fund complex. Additionally, the Board received and considered information about the fees charged to other accounts and strategies managed by the Advisor that use similar investment styles and noted that these accounts are not subject to the same regulatory requirements as the Funds and do not offer daily transactions. Among other things, the Trustees considered the following Fund-specific factors:
Income Fund. (1) The Fund’s actual advisory fee was higher than the category median of actual advisory fees charged to the peer funds included in the Fund’s Morningstar investment category; (2) the Fund’s total net expense ratio was lower than the category median of total net expense ratios of the peer funds in the Fund’s Morningstar investment category; (3) the Advisor agreed to continue to limit the Fund’s expense ratio for an additional year.
Mid Cap Value Fund. (1) The Fund’s actual advisory fee was slightly higher than the category median of actual advisory fees charged to the peer funds included in the Fund’s Morningstar investment category; (2) the Fund’s total net expense ratio was equal to the category median of total net expense ratios of the peer funds in the Fund’s Morningstar investment category; (3) the Advisor agreed to limit the Fund’s expense ratio for an additional year.
High Yield Fund. (1) The Fund’s actual advisory fee was lower than the category median of actual advisory fees charged to the peer funds included in the Fund’s Morningstar investment category; (2) the Fund’s total net expense ratio was below the category median of total net expense ratios of the peer funds in the Fund’s Morningstar investment category; (3) the Advisor agreed to limit the Fund’s expense ratio for an additional year.
Small Cap Growth Fund. (1) The Fund’s actual advisory fee was higher than the category median of actual advisory fees charged to the peer funds included in the Fund’s Morningstar investment category; (2) the Fund’s total net expense ratio was lower than the category median of total net expense ratios of the peer funds in the Fund’s Morningstar investment category; (3) the Advisor agreed to limit the Fund’s expense ratio for an additional year.
88
CHARTWELL FUNDS
BOARD CONSIDERATION AND APPROVAL OF INVESTMENT ADVISORY AGREEMENT
(Unaudited) (Continued)
Small Cap Value Fund. (1) The Fund’s actual advisory fee was higher than the category median of actual advisory fees charged to the peer funds in the Fund’s Morningstar investment category; (2) the Fund’s total net expense ratio was lower than the category median of total net expense ratios of the peer funds in the Fund’s Morningstar investment category; (3) the Advisor agreed to limit the Fund’s expense ratio for an additional year.
The Trustees concluded that the compensation paid to the Advisor under the Advisory Agreement and the total net expenses of each Fund, after waivers, were fair and reasonable in light of the nature and quality of the services to be provided by the Advisor to each Fund.
Costs of Services and Profitability
The Trustees considered the financial information provided by the Advisor, including the costs and profits with respect to each Fund. The Trustees concluded that the profits of the Advisor from its relationship with the Funds were reasonable.
The Trustees also considered the extent to which the Advisor might derive ancillary benefits as a result of its relationships with the Funds (other than the receipt of its investment advisory fee), including any research received from broker-dealers providing execution services to the Funds and the intangible benefits of its association with the Funds generally and any favorable publicity arising in connection with the Funds’ performance. Based upon its consideration of all these factors, the Trustees concluded that the level of profits realized by the Advisor from providing services to the Funds was not excessive in view of the nature, extent and quality of services provided to the Funds.
Economies of Scale
The Trustees considered the size of each Fund and noted the Advisor had instituted breakpoints in the advisory fee for the largest Fund, the Income Fund. The Trustees also noted that although there were no advisory fee breakpoints on the Mid Cap Value Fund, High Yield Fund, Small Cap Growth Fund and Small Cap Value Fund, the assets levels of those Funds were not currently likely to lead to significant economies of scale and that any such economies would be considered in the future as those Funds’ assets grow.
Conclusion
Based on its review, consideration and evaluation of all factors it believed relevant, including the above-described factors and conclusions, the Board, including the Independent Trustees, unanimously approved the continuation of the Advisory Agreement for an additional one-year period.
89
Chartwell Funds
Each a series of The Chartwell Funds
Investment Advisor
Chartwell Investment Partners, LLC
1205 Westlakes Drive, Suite 100
Berwyn, Pennsylvania 19312
Independent Registered Public Accounting Firm
BBD, LLP
1835 Market Street, 3rd Floor
Philadelphia, Pennsylvania 19103
Custodian
UMB Bank, n.a.
928 Grand Boulevard, 5th Floor
Kansas City, Missouri 64106
Fund Administrator, Transfer Agent and Fund Accountant
Ultimus Fund Solutions, LLC
225 Pictoria Drive, Suite 450
Cincinnati, OH 45246
Distributor
Foreside Fund Services, LLC
Three Canal Plaza, Suite 100
Portland, Maine 04101
www.foreside.com
This report and the financial statements contained herein are provided for the general information of the shareholders of the Chartwell Funds. This report is not authorized for distribution to prospective investors in the Funds unless preceded or accompanied by an effective prospectus.
| Item 2. | Code of Ethics. |
As of the end of the period covered by this report, the registrant has adopted a code of ethics that applies to the registrant’s principal executive officer, principal financial officer, principal accounting officer or controller, or persons performing similar functions, regardless of whether these individuals are employed by the registrant or a third party. Pursuant to Item 13(a)(1), a copy of registrant’s code of ethics is filed as an exhibit to this Form N-CSR. During the period covered by this report, the code of ethics has not been amended, and the registrant has not granted any waivers, including implicit waivers, from the provisions of the code of ethics.
| Item 3. | Audit Committee Financial Expert. |
The registrant’s board of trustees has determined that the registrant has at least one audit committee financial expert serving on its audit committee. The name of the audit committee financial expert is Paul L. Rudy, III. Mr. Rudy, III is “independent” for purposes of this Item.
| Item 4. | Principal Accountant Fees and Services. |
| (a) | Audit Fees. The aggregate fees billed for professional services rendered by the principal accountant for the audit of the registrant’s annual financial statements or for services that are normally provided by the accountant in connection with statutory and regulatory filings or engagements were $71,000 and $68,000 with respect to the registrant’s fiscal years ended October 31, 2019 and 2018, respectively. |
| (b) | Audit-Related Fees. No fees were billed in either of the last two fiscal years for assurance and related services by the principal accountant that are reasonably related to the performance of the audit of the registrant’s financial statements and are not reported under paragraph (a) of this Item. |
| (c) | Tax Fees. The aggregate fees billed for professional services rendered by the principal accountant for tax compliance, tax advice, and tax planning were $11,250 and $10,000 with respect to the registrant’s fiscal years ended October 31, 2019 and 2018, respectively. The services comprising these fees are the preparation of the registrant’s federal income and excise tax returns. |
| (d) | All Other Fees. No fees were billed in either of the last two fiscal years for products and services provided by the principal accountant, other than the services reported in paragraphs (a) through (c) of this Item. |
| (e)(1) | The audit committee has not adopted pre-approval policies and procedures described in paragraph (c)(7) of Rule 2-01 of Regulation S-X. |
| (e)(2) | None of the services described in paragraph (b) through (d) of this Item were approved by the audit committee pursuant to paragraph (c)(7)(i)(C) of Rule 2-01 of Regulation S-X. |
| (f) | Less than 50% of hours expended on the principal accountant’s engagement to audit the registrant’s financial statements for the most recent fiscal year were attributed to work performed by persons other than the principal accountant’s full-time, permanent employees. |
| (g) | During the fiscal years ended October 31, 2019 and 2018, aggregate non-audit fees of $11,250 and $10,000, respectively, were billed by the registrant’s accountant for services rendered to the registrant. No non-audit fees were billed in either of the last two fiscal years by the registrant’s accountant for services rendered to the registrant’s investment adviser (not including any sub-adviser whose role is primarily portfolio management and is subcontracted with or overseen by another investment adviser), and any entity controlling, controlled by, or under common control with the adviser that provides ongoing services to the registrant. |
| (h) | The principal accountant has not provided any non-audit services that were not previously approved to the registrant’s investment adviser (not including any sub-adviser whose role is primarily portfolio management and is subcontracted with or overseen by another investment adviser), and any entity controlling, controlled by, or under common control with the investment adviser that provides ongoing services to the registrant. |
| Item 5. | Audit Committee of Listed Registrants. |
Not applicable
| Item 6. | Investments. |
| (a) | Not applicable [schedule filed with Item 1] |
| (b) | Not applicable |
| Item 7. | Disclosure of Proxy Voting Policies and Procedures for Closed-End Management Investment Companies. |
Not applicable
| Item 8. | Portfolio Managers of Closed-End Management Investment Companies. |
Not applicable
| Item 9. | Purchases of Equity Securities by Closed-End Management Investment Company and Affiliated Purchasers. |
Not applicable
| Item 10. | Submission of Matters to a Vote of Security Holders. |
There have been no material changes to the procedures by which shareholders may recommend nominees to the registrant’s board of trustees.
| Item 11. | Controls and Procedures. |
(a) Based on their evaluation of the registrant’s disclosure controls and procedures (as defined in Rule 30a-3(c) under the Investment Company Act of 1940, as amended (the “Act”)) as of a date within 90 days of the filing date of this report, the registrant’s principal executive officer and principal financial officer have concluded that such disclosure controls and procedures are reasonably designed and are operating effectively to ensure that material information relating to the registrant is made known to them by others within those entities, particularly during the period in which this report is being prepared, and that the information required in filings on Form N-CSR is recorded, processed, summarized, and reported on a timely basis.
(b) There were no changes in the registrant’s internal control over financial reporting (as defined in Rule 30a-3(d) under the Investment Company Act of 1940) that occurred during the second fiscal quarter of the period covered by this report that have materially affected, or are reasonably likely to materially affect, the registrant’s internal control over financial reporting.
Item 12. Disclosure of Securities Lending Activities for Closed-End Management Investment Companies.
Not applicable
| Item 13. | Exhibits. |
File the exhibits listed below as part of this Form. Letter or number the exhibits in the sequence indicated.
(a)(1) Any code of ethics, or amendment thereto, that is the subject of the disclosure required by Item 2, to the extent that the registrant intends to satisfy the Item 2 requirements through filing of an exhibit: Attached hereto
(a)(2) A separate certification for each principal executive officer and principal financial officer of the registrant as required by Rule 30a-2(a) under the Act (17 CFR 270.30a-2(a)): Attached hereto
(a)(3) Any written solicitation to purchase securities under Rule 23c-1 under the Act (17 CFR 270.23c-1) sent or given during the period covered by the report by or on behalf of the registrant to 10 or more persons: Not applicable
(a)(4) Change in the registrant’s independent public accountants: Not applicable
(b) Certifications required by Rule 30a-2(b) under the Act (17 CFR 270.30a-2(b)): Attached hereto
| Exhibit 99.CODE ETH |
Code of Ethics |
| Exhibit 99.CERT |
Certifications required by Rule 30a-2(a) under the Act |
| Exhibit 99.906CERT |
Certifications required by Rule 30a-2(b) under the Act |
.
SIGNATURES
Pursuant to the requirements of the Securities Exchange Act of 1934 and the Investment Company Act of 1940, the registrant has duly caused this report to be signed on its behalf by the undersigned, thereunto duly authorized.
| (Registrant) | The Chartwell Funds | ||
| By (Signature and Title)* | /s/ Timothy J. Riddle | ||
| Timothy J. Riddle, Chairman, President and Chief Executive Officer (Principal Executive Officer) | |||
| Date | December 30, 2019 | ||
| Pursuant to the requirements of the Securities Exchange Act of 1934 and the Investment Company Act of 1940, this report has been signed below by the following persons on behalf of the registrant and in the capacities and on the dates indicated. | |||
| By (Signature and Title)* | /s/ Timothy J. Riddle | ||
| Timothy J. Riddle, Chairman, President and Chief Executive Officer (Principal Executive Officer) | |||
| Date | December 30, 2019 | ||
| By (Signature and Title)* | /s/ Neil Walker | ||
| Neil Walker, Treasurer and Chief Financial Officer (Principal Financial Officer) | |||
| Date | December 30, 2019 | ||
| * | Print the name and title of each signing officer under his or her signature. |
THE CHARTWELL FUNDS
Code of Ethics
Section 17(j) of the 1940 Act (“Section 17(j)”) and Rule 17j-1 thereunder (“Rule 17j-1”) are intended to address the potential conflicts of interest arising from the personal investment activities of the Fund’s personnel. Rule 17j-1 requires the Trust to adopt a code of ethics containing provisions reasonably necessary to prevent “Access Persons” from engaging in any conduct prohibited by the rule.
The Trust has adopted a code of ethics (the “Code of Ethics”) addressing personal transactions in securities within the context of Section 17(j) and Rule 17j-1. Personal trading of securities by Access Persons must be done in accordance with the requirements of the Trust’s Code of Ethics. In addition, a Code of Ethics has also been adopted by the Advisor and are applicable to its personnel which includes certain Trust Officers.
The Code of Ethics is based upon the principle that the officers, directors and employees of the Trust owe a fiduciary duty to, among others, the shareholders of the Funds, to conduct their personal securities transactions in a manner which does not interfere with Fund portfolio transactions or otherwise take unfair advantage of their relationship with the Fund. In accordance with this general principle, all Access Persons must:
| • | Execute personal securities transactions in compliance with the Code of Ethics; |
| • | Place the interests of shareholders of the Funds first; |
| • | Avoid any actual or potential conflict of interest or any abuse of their positions of trust and responsibility; and |
| • | Not take inappropriate advantage of their positions. |
Under the Code of Ethics, the Trust has identified each Fund Access Person and notified them of their obligations to make the following reports upon becoming an Access Person:
| • | An initial holdings report of securities owned; |
| • | A quarterly holdings report of securities owned; and, |
| • | An annual holdings report of securities owned. |
In lieu of quarterly and annual holdings reports, copies of brokerage statements for Trust Access Persons are mailed directly to Advisor’s Compliance department. Subject to certain enumerated exempted transactions, the Code of Ethics requires Access Persons to obtain prior approval of their personal investment transactions in securities from the Advisor’s Compliance Group and Trading Desk, unless the Board has approved the use of the Advisor’s policy. In addition, each Access Person is required to certify annually that (1) they have read and understand the Code of Ethics and recognize that they are subject to it and (2) they have complied with the requirements of the Code of Ethics and disclosed or reported all personal securities transactions required to be disclosed or reported pursuant to the Code of Ethics.
Under the Code of Ethics, the Compliance Officer or his/her designees is required to:
| • | Review the reports submitted by Access Persons; |
| • | Identify new Access Persons and notify them of their reporting obligations under the Code of Ethics; and |
| • | Maintain all records required under Rule 17j-1 of the 1940 Act. |
Primary oversight for implementation of each Code of Ethics rests with the CCO for the Trust and Advisor. At least annually, the CCO shall assess the efficiency the Codes of Ethics and recommend such changes as he or she deems necessary.
Please see Appendix 6 for further description of Service Provider, Trust, Fund, and/or CCO responsibilities pertaining to Personal Investment Activities.
Code of Ethics of Senior Personnel
Item 2 of Form N-CSR requires a Fund to disclose on an annual basis whether it has adopted a code of ethics that applies to the Fund’s principal executive officer, principal financial officer, principal accounting officer or controller, or persons performing similar functions, regardless of whether such individuals are employed by the Fund or a third party.
The Trust has adopted a code of ethics for senior personnel (the “Code of Conduct for Principal Executive Officer & Principal Financial Officer”) that sets forth specific policies to guide the performance of the Trust’s Chief Executive Officer, President, Chief Financial Officer and Treasurer (or persons performing similar functions). The Code of Ethics for Principal Executive Officer & Principal Financial Officer is designed to deter wrongdoing and to promote:
| • | Honest and ethical conduct, including the ethical handling of actual or apparent conflicts of interest between personal and professional relationships; |
| • | Full, fair, accurate, timely and understandable disclosure in reports and documents that the Fund files with, or submits to the SEC and in other public communications made by the Fund; |
| • | Compliance with applicable governmental laws, rules and regulations; |
The prompt internal reporting of violations of the Code of Ethics for Principal Executive Officer & Principal Financial Officer to an appropriate person or persons identified in the Code of Ethics for Principal Executive Officer & Principal Financial Officer; and
| • | Accountability for adherence to the Code of Ethics for Principal Executive Officer & Principal Financial Officer. |
Insider Trading
The Trust is committed to preventing insider trading and to govern personal trading to avoid any actual or potential conflicts of interest or any abuse of an individual’s position of the Trusts. Accordingly, the Trust forbids Trustees, Officers, Advisors, and members of their immediate families from trading, either personally or on behalf of others, while in possession of material nonpublic information or communicating material nonpublic information to others in violation of the law. The policy prohibits insider trading that applies to every Trustee, Officer, Service Provider, Advisor and extends to activities within and outside their duties on behalf of the Trust. In light of this commitment each Service Provider and Advisor must establish an insider trading policy to prevent insider trading and to govern personal securities trading in conjunction with the Codes of Ethics of the Service Provider and Advisor. In addition, the Trust’s, Service Providers, Advisor, and other persons considered “Access Persons” under the Code of Ethics of the respective Service Providers and Advisors must follow certain policies and procedures regarding securities trading and serving on other boards as set forth in such Codes of Ethics.
Please refer to Appendix 6.1 for further description of Code of Conduct for principal officers and Appendix 6.2 for further description of the Advisor’s Code of Ethics.
THE CHARTWELL FUNDS
Code of Ethics
1. BACKGROUND
Rule 17j-1 (the “Rule”) under the Investment Company Act of 1940, as amended (the “Investment Company Act”) requires the Chartwell Funds the “Trust”, as a registered investment company, to adopt a written Code of Ethics. The Rule also requires investment advisors and principal underwriters (each, a “Fund Organization”) of the Trusts to adopt a written Code of Ethics and to report to the Board of Trustees of each Trust any material compliance violations. The Board may only approve a Code of Ethics after it has made a determination that the Code of Ethics contains provisions designed to prevent “access persons” (summarized below and further defined in Exhibit 1) from engaging in fraud. In addition, certain key “investment personnel” (summarized below and defined in Exhibit 1) of a Fund Organization are subject to further pre-clearance procedures with respect to their investment in securities offered through an initial public offering (an “IPO”) or private placement (a “Limited Offering”). The Advisor of the Trust who has adopted a Code of Ethics, that has been approved by the Trust’s Chief Compliance Officer and the Board, are not required to follow this Code of Ethics.
2. KEY DEFINITIONS
For other definitions, see Exhibit 1
The term “Access Person” is defined to include: (i) any director, officer, general partner or key investment personnel of the Trust or of an investment advisor to the Trust; (ii) any supervised person of an investment advisor to the Trust who has access to nonpublic information regarding the portfolio holdings of any series of the Trust (each, a “Fund”), or who is involved in making securities recommendations for a Fund and (iii) any director, officer, or general partner of a principal underwriter who has knowledge of the investment activities of a series of the Trust. The Trust’s Compliance Officer (defined below) will notify an employee if that person fits the above definition and maintain a list of all Access Persons (see Exhibit 2)
The term “Investment Personnel” is defined to include (i) any employee of the Trust or of an investment advisor to the Trust who regular participates in making recommendations regarding the purchase or sale of securities of a Fund; and (ii) any natural person who controls the Trust or an investment advisor to the Trust who obtains information concerning recommendations made to a Fund regarding the purchase or sale of securities by a Fund. The Fund Compliance Officer (defined below) will notify an employee if that person fits the above definition and maintain a list of all Investment Personnel, (see Exhibit 2). Investment Personnel are also Access Persons.
The term “Reportable Fund” for a particular Access Person, means any mutual fund for which the investment advisor with whom the Access Person is associated, if any, (the “Associated Advisor”) serves as investment advisor (including any sub-advisor) or any mutual fund whose investment advisor or principal underwriter controls the Associated Advisor, is controlled by the Associated Advisor, or is under common control with the Associated Advisor.
3. GENERAL PROHIBITIONS UNDER THE RULE
The Rule prohibits fraudulent activities by affiliated persons of Trust or Fund Organization. Specifically, it is unlawful for any of these persons to:
| (a) | employ any device, scheme or artifice to defraud a Fund; |
| (b) | make any untrue statement of a material fact to a Fund or omit to state a material fact necessary in order to make the statements made to a Fund, in light of the circumstances under which they are made, not misleading; |
| (c) | to engage in any act, practice or course of business that operates or would operate as a fraud or deceit on a Fund; or |
| (d) | to engage in any manipulative practice with respect to a Fund. |
4. COMPLIANCE OFFICERS
In order to meet the requirements of the Rule, the Code of Ethics includes a procedure for detecting and preventing material trading abuses and requires all Access Persons to report personal securities transactions on an initial, quarterly and annual basis (the “Reports”). The officers of the Trust will appoint a compliance officer for each Fund Organization and for the Trust (each a “Fund Compliance Officer”) to receive and review Reports delivered to a Fund Compliance Officer in accordance with Section 5 below. In turn, the officers of the Trust will report to the Board any material violations of the Code of Ethics in accordance with Section 7 below.
5. ACCESS PERSON REPORTS
All Access Persons are required to submit the following reports to the Fund Compliance Officer for themselves and any immediate family member residing at the same address. In lieu of providing the Reports, an Access Person may submit brokerage statements or transaction confirmations that contain duplicate information. The Access Person should arrange to have brokerage statements and transaction confirmations sent directly to the Fund Compliance Officer (see Exhibit 3 for the form of an Authorization Letter):
| (a) | Initial Holdings Report. Within ten days of becoming an Access Person (and the information must be current as of no more than 45 days prior to becoming an Access Person), each Access Person must report the following information: |
| (1) | The title and type of security, and, as applicable, the exchange ticker symbol or CUSIP number, number of shares and principal amount of each Covered Security and/or Reportable Fund in which the Access Person had any direct or indirect beneficial ownership when the person became an Access Person; |
| (2) | The name of any broker, dealer or bank with whom the Access Person maintained an account in which any securities were held for the direct or indirect benefit of the Access Person; and |
| (3) | The date the report is submitted by the Access Person. |
A form of the Initial Holdings Report is attached as Exhibit 4.
| (b) | Quarterly Transaction Reports. Within thirty days of the end of each calendar quarter, each Access Person must report the following information |
| (1) | With respect to any transaction during the quarter in a Covered Security and/or Reportable Fund in which the Access Person had any direct or indirect beneficial ownership: |
| (i) | The date of the transaction, the title, and, as applicable, the exchange ticker symbol or CUSIP number, the interest rate and maturity date, the number of shares and the principal amount of each Covered Security and/or Reportable Fund involved; |
| (ii) | The nature of the transaction (i.e., purchase, sale); |
| (iii) | The price of the Covered Security and/or Reportable Fund at which the transaction was effected; |
| (iv) | The name of the broker, dealer or bank with or through which the transaction was effected; and |
| (v) | The date that the report is submitted by the Access Person. |
| (2) | With respect to any account established by the Access Person in which any securities were held during the quarter for the direct or indirect benefit of the Access Person: |
| (i) | The name of the broker, dealer or bank with whom the Access Person established the account; |
| (ii) | The date the account was established; and |
| (iii) | the date that the report is submitted by the Access Person. |
A form of the Quarterly Transaction Report is attached as Exhibit 5.
| (c) | Annual Holdings Reports. Each year, the Access Person must report the following information within 30 days of the end of the calendar year (and the information must be current as of no more than 45 days prior to the date of the report): |
| (1) | The date of the transaction, the title, and, as applicable, the exchange ticker symbol or CUSIP number, the interest rate and maturity date, the number of shares and the principal amount of each Covered Security and/or Reportable Fund in which the Access Person had any direct or indirect beneficial ownership; |
| (2) | The name of any broker, dealer or bank with whom the Access Person maintains an account in which any securities were held for the direct or indirect benefit of the Access Person; and |
| (3) | The date the report is submitted by the Access Person. |
A form of the Annual Holdings Report is attached as Exhibit 4.
6. EXCEPTIONS TO REPORTING REQUIREMENTS
| (a) | Principal Underwriter. An Access Person of a Fund’s principal underwriter is not required to make any Reports under Section 5 above if the principal underwriter: |
| (1) | is not an affiliated person of the Trust or any investment advisor to a Fund. |
| (2) | has no officer, director or general partner who serves as an officer, director or general partner of the Trust or of any investment advisor to a Fund. |
| (b) | Independent Trustee. A trustee of the Trust who is not an ‘interested person” of the Trust within the meaning of Section 2(a)(19) of the Investment Company Act (an “Independent Trustee”) is not required to: |
| (1) | file an Initial Holdings Report or Annual Holdings Report; and |
| (2) | file a Quarterly Transaction Report, unless the Independent Trustee knew, or, in the ordinary course of fulfilling his or her official duties as a trustee, should have known that during a 15 day period immediately before or after his or her transaction in a Covered Security, that a Fund purchased or sold the Covered Security, or a Fund or its investment advisor considered purchasing or selling the Covered Security. |
| (c) | No person shall be required to make any Reports under Section 5 with respect to transactions effected for any account over which such person does not have any direct or indirect influence or control. |
7. ADMINISTRATION OF THE CODE OF ETHICS--REPORTING VIOLATIONS AND CERTIFYING COMPLIANCE
| (a) | Each Fund Organization must use reasonable diligence and institute policies and procedures reasonably necessary to prevent its Access Persons from violating this Code of Ethics; |
| (b) | Each Fund Compliance Officer shall circulate the Code of Ethics and receive an acknowledgement from each Access Person that the Code of Ethics has been read and understood; |
| (c) | Each Fund Compliance Officer shall compare all Reports with completed and contemplated portfolio transactions of a Fund to determine whether a possible violation of the Code of Ethics and/or other applicable trading policies and procedures may have occurred. |
No Access Person shall review his or her own Report(s). The Fund Compliance Officer shall appoint an alternate to review his or her own Reports if the Fund Compliance Officer is also an Access Person.
| (d) | On an annual basis, each Fund Compliance Officer shall prepare a written report describing any issues arising under the Code of Ethics or procedures, including information about any material violations of the Code of Ethics or its underlying procedures and any sanctions imposed due to such violations and submit the information to the Compliance Officer for review by the Board; and |
| (e) | On an annual basis, each Fund Organization shall certify to the Board of Trustees that it has adopted procedures reasonably necessary to prevent its Access Persons from violating the Code of Ethics. |
8. COMPLIANCE WITH OTHER SECURITIES LAWS
This Code of Ethics is not intended to cover all possible areas of potential liability under the Investment Company Act or under the federal securities laws in general. For example, other provisions of Section 17 of the Investment Company Act prohibit various transactions between a registered investment company and affiliated persons, including the knowing sale or purchase of property to or from a registered investment company on a principal basis, and joint transactions (i.e., combining to achieve a substantial position in a security or commingling of funds) between an investment company and an affiliated person. Access Persons covered by this Code of Ethics are advised to seek advice before engaging in any transactions involving securities held or under consideration for purchase or sale by a Fund or if a transaction directly or indirectly involves themselves and the Trust other than the purchase or redemption of shares of a Fund or the performance of their normal business duties.
In addition, the Securities Exchange Act of 1934 may impose fiduciary obligations and trading restrictions on access persons and others in certain situations. It is expected that access persons will be sensitive to these areas of potential conflict, even though this Code of Ethics does not address specifically these other areas of fiduciary responsibility.
9. PROHIBITED TRADING PRACTICES
| (a) | No Access Person may purchase or sell directly or indirectly, any security in which he or she has, or by reason of such transactions acquires, any direct or indirect beneficial ownership if such action would violate any provision of section 3 or this Code and such security to his or her actual knowledge at the time of such purchase or sale: |
| (i) | is being considered for purchase or sale by a Fund; |
| (ii) | is in the process of being purchased or sold by a Fund (except that an access person may participate in a bunched transaction with the Fund if the price terms are the same in accordance with trading policies and procedures adopted by the Fund Organization). |
| (b) | Investment Personnel of a Fund or its investment advisor must obtain approval from the Fund or the Fund’s investment advisor before directly or indirectly acquiring beneficial ownership in any securities in an IPO or Limited Offering. |
| (c) | No Access Person may trade ahead of a Fund -- a practice known as “front running.” |
10. Insider Trading
Trustee and Officers of the Trust
The Trust forbids any Trustee or Officer from trading, either personally or on behalf of others, on material nonpublic information or communicating material nonpublic information to others in violation of law. This conduct is frequently referred to as “insider trading.” The Trust’s policy applies to every Trustee and Officer, and extends to activities within and outside their duties on behalf of the Trust. It is also unlawful for a Trustee or officers to use such information for manipulative, deceptive or fraudulent purposes.
Although Trustees and Officers may engage in personal investment activities, it is important that such practices avoid any appearance of impropriety and remain in full compliance with the law and the highest standards of ethics. Accordingly, Trustees and Officers must exercise good judgment when engaging in securities transactions and when relating to others information obtained as a result of their positions with the Trust. If an Officer or Trustee has any doubt whether a particular situation requires refraining from making an investment or sharing information with others, such doubt should be resolved against taking such action.
Service Providers, Advisor and Sub-Advisors
The Service Providers, Advisors and Sub-Advisors of the Trust have access to confidential information about clients of the Trust, investment advice provided to clients, securities transactions being effected for clients’ accounts and other sensitive information. In addition, from time to time, Service Providers, Advisors and Sub-Advisors or their personnel may come into possession of information that is “material” and “nonpublic” concerning a company or the trading market for its securities.
Trading securities while in possession of material, nonpublic information, or improperly communicating that information to others may expose to stringent penalties. Criminal sanctions may include the imposition of a monetary fine and/or imprisonment. The SEC can recover the profits gained or losses avoided through the illegal trading, impose a penalty of up to three times the illicit windfall, and/or issue an order censuring, suspending or permanently barring you from the securities industry. Finally, Trustees, Officers, Service Providers, Advisors, and Sub-Advisors may be sued by investors seeking to recover damages for insider trading violations.
It is unlawful for a, Service Provider, Advisor and Sub-Advisor or any of its Access Persons to use such information for manipulative, deceptive or fraudulent purposes. The kinds of activities prohibited include “front-running,” “scalping” and trading on inside information. “Front-Running” refers to a practice whereby a person takes a position in a security in order to profit based on his or her advance knowledge of upcoming trading by clients in that security which is expected to affect the market price. “Scalping” refers to a similar abuse of client accounts, and means the practice of taking a position in a security before recommending it to clients or effecting transactions on behalf of clients, and then selling out the supervised person’s personal position after the price of the security has risen on the basis of the recommendation or client transactions.
Depending upon the circumstances, Service Providers, Advisors and Sub-Advisors and any Access Person involved may be exposed to potential insider trading or tipping liability under the federal securities laws if an Advisor, Sub-Advisor or any Access Person advises clients concerning, or executes transactions in, securities with respect to which the Advisor or Sub-Advisors possesses material, nonpublic information. In addition a Service Provider, Advisor and Sub-Advisor may be deemed to possess material, nonpublic information known by any of its Access Persons, unless the Service Provider, Advisor and Sub-Advisor has implemented procedures to prevent the flow of that information to others within the Service Provider, Advisor or Sub-Advisor.
Section 204A of the Advisers Act requires that Advisors and Sub-Advisors establish, maintain and enforce written policies and procedures reasonably designed to prevent the misuse of material, nonpublic information by the Advisor and Sub-Advisor and its Access Persons. Violations of the laws against insider trading and tipping by supervised persons of Advisors and Sub-Advisors can expose the Advisors and Sub-Advisor and any Access Person involved to severe criminal and civil liability. In addition, Advisors and Sub-Advisors and their personnel have ethical and legal responsibilities to maintain the confidence of Advisor and Sub-Advisor clients, and to protect as valuable assets, confidential and proprietary information developed by or entrusted to the Advisor and Sub-Advisor.
Although Service Providers, Advisors and Sub-Advisors may respect the right of their Access Persons to engage in personal investment activities, it is important that such practices avoid any appearance of impropriety and remain in full compliance with the law and the highest standards of ethics. Accordingly, Access Persons must exercise good judgment when engaging in securities transactions and when relating to others information obtained as a result of employment with Service Providers, Advisors and Sub-Advisors. If an Access Person has any doubt whether a particular situation requires refraining from making an investment or sharing information with others, such doubt should be resolved against taking such action.
General Policies and Procedures Concerning Insider Trading and Tipping
The Trust has adopted the following policies and procedures to: (i) ensure the propriety of supervised person trading activity; (ii) protect and segment the flow of material, nonpublic and other confidential information relating to client advice and securities transactions, as well as other confidential information; (iii) avoid possible conflicts of interest; and (iv) identify trades that may violate the prohibitions against insider trading, tipping, front-running, scalping and other manipulative and deceptive devices prohibited by federal and state securities laws and rules.
No Trustee, Officer, or Access person of the Service Providers, Advisors and Sub-Advisors shall engage in transactions in any securities while in possession of material, nonpublic information regarding such securities (so called “insider trading”). Nor shall any Access Person communicate such material, nonpublic information to any person who might use such information to purchase or sell securities (so called “tipping”). The term “securities” includes options or derivative instruments with respect to such securities and other securities that are convertible into or exchangeable for such securities.
1. “Material.” The question of whether information is “material” is not always easily resolved. Generally speaking, information is “material” where there is a substantial likelihood that a reasonable investor could consider the information important in deciding whether to buy or sell the securities in question, or where the information, if disclosed, could be viewed by a reasonable investor as having significantly altered the “total mix” of information available. Where the nonpublic information relates to a possible or contingent event, materiality depends upon a balancing of both the probability that the event will occur and the anticipated magnitude of the event in light of the totality of the activities of the issuer involved. Common, but by no means exclusive, examples of “material” information include information concerning a company’s sales, earnings, dividends, significant acquisitions or mergers and major litigation. So called “market information,” such as information concerning an impending securities transaction, may also, depending upon the circumstances, be “material.” Because materiality determinations are often challenged with the benefit of hindsight, if a person has any doubt whether certain information is “material,” such doubt should be resolved against trading or communicating such information.
2. “Nonpublic.” Information is “nonpublic” until it has been made available to investors generally. In this respect, one must be able to point to some fact to show that the information is generally public, such as inclusion in reports filed with the SEC or press releases issued by the issuer of the securities, or reference to such information in publications of general circulation such as The Wall Street Journal or other publisher.
3. “Advisory Information.” Information concerning: (i) specific recommendations made to clients by Advisors and Sub-Advisors; or (ii) prospective securities transactions by clients of an Advisor or and Sub-Advisor (“Advisory Information”) is strictly confidential. Under some circumstances, Advisory Information may be material and nonpublic.
4. Prohibitions. In the handling of information obtained as a result of employment with Service Providers, Advisors and Sub-Advisors and when engaging in securities transactions, Service Providers, Advisors and Sub-Advisors Access Persons:
| • | Shall not disclose material, nonpublic or other confidential information (including Advisory Information) to anyone, inside or outside the Service Provider, Advisor or Sub-Advisor (including Immediate Family members), except to the Chief Compliance Officer or on a strict need-to-know basis and under circumstances that make it reasonable to believe that the information will not be misused or improperly disclosed by the recipient; |
| • | Shall refrain from recommending or suggesting that any person engage in transactions in any security while in possession of material, nonpublic information about that security; |
| • | Shall abstain from transactions for their own personal accounts or for the account of any client, in any security while in possession of material, nonpublic information regarding that security; and |
• Shall abstain from personal transactions in any security while in possession of Advisory Information regarding that security, except in compliance with the pre-clearance requirements.
Protection of Material, Nonpublic Information
No Trustee, Officer, or Access Person of the Service Providers, Advisors and Sub-Advisors shall intentionally seek, receive or accept information that he or she believes may be material and nonpublic.
On occasion, a company may, as a means to seek investors in restricted or private placement securities issued by it, send to Service Providers, Advisors and Sub-Advisors materials that contain material, nonpublic or other confidential information. Typically, such materials will be accompanied by a transmittal letter (and an inner, sealed package) that indicates the confidential nature of the enclosed materials and that the opening of the inner package constitutes an agreement to maintain the confidentiality of the information. In this circumstance, any supervised person of a Service Provider, Advisor and Sub-Advisor receiving any such materials should not open the inner package, but should immediately consult with the Chief Compliance Officer.
Additionally, one of the resources Advisors and Sub-Advisors may use in research efforts are “Expert Networks”. Information received through this channel is handled the same as any other channel. However, prior to engaging the service of an Expert Network, Advisors and Sub-Advisors must obtain and review their policies and procedures surrounding the protection and handling of material non-public information. In the event that an Access Person of Advisor or Sub-Advisor should come into possession of information concerning any company or the market for its securities that the person believes may be material and nonpublic, the Access Person should notify the his or her Chief Compliance Officer immediately.
In addition, such Access Person shall refrain from either disclosing the information to others or engaging in transactions (or recommending or suggesting that any person engage in transactions) in the securities to which such information relates.
Protection of Other Confidential Information
Information relating to past, present, or future activities of clients that has not been publicly disclosed shall not be disclosed to persons, within or outside of Service Providers, Advisors and Sub-Advisors, except for a proper purposes. Access Persons are expected to use their own good judgment in relating to others information in these areas.
Procedures to Safeguard Material, Nonpublic and Other Confidential Information
In the handling of material, nonpublic and other confidential information, including Advisory Information, Access Persons of Service Providers, Advisors and Sub-Advisors shall take appropriate steps to safeguard the confidentiality of such information. Although the offices of Service Providers are not generally open to the public or unannounced visitors, Access Persons must still take precautions to avoid storing nonpublic personal information in plain view in potentially public areas of the Service Provider’s offices. Particular care should be exercised when nonpublic personal information must be discussed or reviewed in public places such as restaurants, elevators, taxicabs, trains or airplanes, where that information may be overheard or observed by third parties.
Please refer to Appendix P.1 for further description of Service Provider, Trust, Fund, and/or CCO responsibilities pertaining to Personal Investment Activities.
11. Sanctions
As to any material violation of this Code of Ethics, each Fund Organization shall adopt trading policies and procedures that provide for sanctions of the Access Persons. Such sanctions may include, but are not limited to: (1) a written reprimand in the Access Person’s employment file; (2) a suspension from employment; and/or (3) termination from employment.
The Board may also impose sanctions as it deems appropriate, including sanctions against the Fund Organization or the Fund Compliance Officer for failure to adequately supervise its Access Persons.
ACKNOWLEDGED AND AGREED:
I have read, and I understand the terms of, this Code of Ethics.
By: _________________________________________________
Name:_______________________________________________
Title:________________________________________________
Fund Organization:______________________________________
Date:________________________________________________
Exhibit 1
Definitions
Access Person. (i) any director, officer, general partner or Advisory Person of a Fund or of a Fund’s investment advisor; (ii) any supervised person of an investment advisor to the Trust who has access to nonpublic information regarding the portfolio holdings of any series of the Trust (each, a “Fund”), or who is involved in making securities recommendations for a Fund; and (iii)any director, officer or general partner of a principal underwriter who, in the ordinary course of business, makes, participates in or obtains information regarding, the purchase or sale of Covered Securities by the Fund for which the principal underwriter acts, or whose functions or duties in the ordinary course of business relate to the making of any recommendation to the Fund regarding the purchase or sale of Covered Securities.
Advisory Person. (i) any employee of the Fund or of a Fund’s investment advisor (or of any company in a control relationship to the Fund or investment advisor) who, in connection with his or her regular functions or duties, makes, participates in, or obtains information regarding the purchase or sale of Covered Securities by a Fund, or whose functions relate to the making of any recommendations with respect to the purchases or sales; and (ii) any natural person in a control relationship to the Fund or an investment advisor who obtains information concerning recommendations made to the Fund with regard to the purchase or sale of Covered Securities by the Fund.
Control. The power to exercise a controlling influence over the management or policies of a company, unless such power is solely the result of an official position with such company.
Covered Security. Includes any Security (see below) but does not include (i) direct obligations of the Government of the United States; (ii) bankers’ acceptances, bank certificates of deposit, commercial paper and high quality short-term debt instruments, including repurchase agreements; (iii) shares issued by money market funds; and (iv) shares issued by open-end investment companies (i.e., mutual funds) other than Reportable Funds.
Fund. A series of the Trust.
Immediate Family Member. Includes any child, stepchild, grandchild, parent, stepparent, grandparent, spouse, sibling, father-in-law, mother-in-law, son-in-law, daughter-in-law, sister-in-law, brother-in-law (including adoptive relationship).
Initial Public Offering (IPO). An offering of securities registered under the Securities Act of 1933, the issuer of which, immediately before the registration, was not subject to the reporting requirements of Sections 13 or 15(d) of the Securities Exchange Act of 1934.
Investment Personnel. (i) any employee of the Trust, a Fund or investment advisor (or of any company in a control relationship to the Trust, a Fund or investment advisor) who, in connection with his or her regular functions or duties, makes or participates in making recommendations regarding the purchase or sale of security by the Fund; and (ii) any natural person who controls the Trust, a Fund or investment advisor and who obtains information concerning recommendations made to the Fund regarding the purchase or sale of securities by the Fund.
Limited Offering. An offering that is exempt from registration under the Securities Act of 1933 (the “Securities Act”) pursuant to Section 4(2) or Section 4(6) or pursuant to Rule 504, Rule 505, or Rule 506 under the Securities Act.
Purchase or Sale of a Covered Security. Includes, among other things, the writing of an option to purchase or sell a Covered Security.
Reportable Fund. Includes, for a particular Access Person, any registered investment company, including a Fund, for which the investment advisor with whom the Access Person is associated, if any, (the “Associated Advisor”) serves as investment advisor (as defined in Section 2(a)(20) of the Investment Company Act) or any registered investment company, including a Fund, whose investment advisor or principal underwriter controls the Associated Advisor, is controlled by the Associated Advisor, or is under common control with the Associated Advisor.
Security. Any note, stock, treasury stock, bond, debenture, evidence of indebtedness, certificate of interest or participation in any profit-sharing agreement, collateral trust certificate, preorganization certificate or subscription, transferable share, investment contract, voting-trust certificate, certificate of deposit for a security, fractional undivided interest in oil, gas, or other mineral rights, any put, call, straddle, option, or privilege on any security (including a certificate of deposit) or on any group or index of securities (including any interest therein or based on the value thereof), or any put, call, straddle, option, or privilege entered into on a national securities exchange relating to foreign currency, or, in general, any interest or instrument commonly known as a “security,” or any certificate of interest or participation in, temporary or interim certificate for, receipt for, guarantee of, or warrant or right to subscribe to or purchase, any of the foregoing.
Exhibit 2
List of Access Persons and Investment Personnel
| Name | Title | Acknowledgement of Receipt of Code of Ethics | Is this Person also an Investment Personnel? |
Exhibit 3
Form of Authorization Letter
Date
Name of Broker
Address
| Re: | Brokerage Statements of [name of employee] |
Ladies and Gentlemen:
The above referenced person is an employee of [name of Fund Organization]. Federal securities laws require that we monitor the personal securities transactions of certain key personnel. By this Authorization Letter, and the acknowledgement of the employee below, please forward duplicate copies of the employee’s brokerage statements and transaction confirmations to:
[Compliance Officer]
[Fund Organization]
[Address]
Should you have any questions, please contact the undersigned at [number].
Very truly yours,
AUTHORIZATION:
I hereby authorize you to release duplicate brokerage statements and transaction confirmations to my employer.
Signature:____________________________________
Name:______________________________________
SSN: _______________________________________
Account Number:______________________________
Exhibit 4
Initial Holdings Report & Annual Holdings Report
(Complete Initial within ten days of becoming an Access Person)
(Information to be current with 45 days of date of Report)
Date: ______________________________
Note: In lieu of this Report, you may submit duplicate copies of your brokerage statements
1. HOLDINGS
| Name and Type of Covered Security or Reportable Fund | Ticker Symbol or CUSIP | Number of Shares or Principal Amount |
2. BROKERAGE ACCOUNTS
|
Name of Institution and Account Holders’ Name (i.e., you, spouse, child) |
Account Number |
Have you requested duplicate statements? |
Reviewed:_________________________________________
(Compliance Officer signature)
Date:_____________________________________________
Exhibit 5
Quarterly Transaction Report
(Complete within thirty days of the quarter-end)
Date: ______________________________
Note: In lieu of this Report, you may submit duplicate copies of your brokerage statements
1. TRANSACTIONS
| Name of Covered Security or Reportable Fund |
Ticker Symbol or CUSIP |
Broker | Number of Shares or Interest Rate, Maturity Date & Principal Amount |
Nature of Transaction (i.e., buy, sale) |
Purchase Price | Date of Transaction |
2. BROKERAGE ACCOUNTS OPENED DURING QUARTER
|
Name of Institution and Account Holders’ Name (i.e., you, spouse, child) |
Account Number |
Have you requested duplicate statements? |
Reviewed: ________________________________________________
(Compliance Officer Signature)
Date: ____________________________________________________
THE CHARTWELL FUNDS
Undertaking Regarding Code of Ethics
1. BACKGROUND
Rule 17j-l (the “Rule”) under the Investment Company Act of 1940 (the “Investment Company Act”) requires The Chartwell Funds as registered investment companies, to adopt a written Code of Ethics. The Rule also requires investment advisors to and principal underwriters for (each a “Fund Organization”) the Trusts to adopt a written Code of’ Ethics and to report to the Boards of Trustees of the Trusts (each, a “Board”) any material compliance violations. The Board may only approve a Code of Ethics after it has made a determination that the Code of Ethics contains provisions designed to prevent “access persons” (as the term is explained below) from engaging in fraud. In addition, certain key “investment personnel” (as the term is explained below) of a Fund Organization are subject to further pre-clearance procedures with respect to their investment in securities offered through an initial public offering (an “IPO”) or private placements (a “Limited Offerings”).
2. KEY DEFINITIONS
The term “Access Person” is defined to include: (i) any director, officer, general partner or key investment personnel of the Trust or an investment advisor to the Trust; (ii) any supervised person of an investment advisor to the Trust who has access to nonpublic information regarding the portfolio holdings of any series of the Trust (a “Fund”), or who is involved in making securities recommendations for a Fund and (iii) any director, officer, or general partner of a principal underwriter who has knowledge of the investment activities of a series of the Trust. The Fund Compliance Officer (defined below) will notify an employee if that person fits the above definition and maintain a list of all Access Persons (see Exhibit 2)
The term “Investment Personnel” is defined to include (i) any employee of the Trust or an investment advisor to the Trust who regular participates in making recommendations regarding the purchase or sale of securities of a Fund; and (ii) any natural person who controls the Trust or an investment advisor to the Trust who obtains information concerning recommendations made to a Fund regarding the purchase or sale of securities by a Fund. The Fund Compliance Officer (defined below) will notify an employee if that person fits the above definition and maintain a list of all Investment Personnel, (see Exhibit 2). Investment Personnel are also Access Persons.
The term “Reportable Fund” for a particular Access Person, means any Fund for which the investment advisor with whom the Access Person is associated, if any, (the “Associated Advisor”) serves as investment advisor (including any sub-advisor) or any Fund whose investment advisor or principal underwriter controls the Associated Advisor, is controlled by the Associated Advisor, or is under common control with the Associated Advisor.
3. PROCEDURES IN PLACE
In order to meet the requirements of the Rule, a Code of Ethics should provide a procedure for detecting and preventing material trading abuses and, for each Fund, should require Access Persons to report personal securities transactions on an initial, quarterly and annual basis. The CCO or his/her designee should be designated within each Fund Organization to receive and review these reports.
A Fund Organization may adopt its own Code of Ethics, subject to the review and approval of the Board. Any subsequent material change to the Fund Organization’s Code of Ethics must be approved by the Board.
In the alternative, a Fund Organization may adopt the standard Code of Ethics for the Trust which is attached to this Undertaking. An investment advisor to a Fund should take care that its Form ADV properly reflects the terms of its Code of Ethics,
In the event a Fund Organization adopts its own Code of Ethics, the Board will review that code to ensure that, at a minimum, the following components are included:
| • | the appointment of a compliance officer and alternate to review personal securities transactions of Access Persons; |
| • | the maintenance by the compliance officer of a current list of all Access Persons and Investment Personnel; |
| • | an initial holdings report within ten days of the start of employment of an Access Person; |
| • | a requirement that all Access Person are to report quarterly transactions within thirty days of the end of each quarter; |
| • | a requirement that all Access Persons report certain securities holdings on an annual basis; |
| • | a review procedure by the compliance officer of all Access Person reports. |
| • | a method by which Access Persons are disciplined and/or sanctioned for failure to adhere to the Code of Ethics including the failure by an Access Person to submit reports on a timely basis; and |
| • | a procedure in place whereby Investment Personnel receive pre-clearance for an investment in an IPO or a Limited Offering. |
A Fund Organization may combine its Code of Ethics with other trading policies and procedures. However, in the event the Code of Ethics conflicts with the Fund Organization’s trading policies and procedures, the terms of the Code of Ethics shall prevail.
The Trust will file all Codes of Ethics with its registration statement.
4. ANNUAL ISSUES AND CERTIFICATION REPORT
A Fund Organization is required to periodically report to the Board on issues raised under its Code of Ethics. Specifically, on an annual basis (see paragraph 6 below), each Fund Organization must provide the Board (i) a written report that describes issues that arose during the previous year under the Code of Ethics including material code or procedure violations and sanctions imposed in response to those material violations and (ii) a certification that it has adopted procedures reasonably necessary to prevent its Access Persons from violating its Code of Ethics.
5. INITIAL CERTIFICATION
On behalf of the undersigned Fund Organization, the following duly authorized representative of the Fund Organization certifies that:
The Fund Organization has adopted the Trust’s Code of Ethics and it has adopted procedures reasonably necessary to prevent its Access Persons from violating the Code of Ethics.
The Fund Organization has adopted its own Code of Ethics which is attached to this Certification. Further, the Fund Organization acknowledges and certifies that it has adopted procedures reasonably necessary to prevent its Access Persons from violating its Code of Ethics.
Acknowledged and Certified:
By:___________________________________________
Name:_________________________________________
Title:__________________________________________
Date:__________________________________________
Name of Fund Organization:___________________________________________
(The investment advisor or principal underwriter)
Name of Compliance Officer:__________________________________________
Name of Alternate Officer:____________________________________________
Name of Fund:_____________________________________________________
(The Chartwell Funds)
6. ANNUAL RE-CERTIFICATION
(To be certified before each annual review meeting of the Board of Trustees)
| [ ] | The Fund Organization has had no material violations of its Code of Ethics or the procedures adopted to implement its Code of Ethics, other than those specified on the attached report. |
| [ ] | The Fund Organization acknowledges and certifies that it has procedures in place reasonably necessary to prevent Access Persons from violating its Code of Ethics. |
| [ ] | The Fund Organization has materially changed its Code of Ethics, the revised Code of Ethics was sent to the Board immediately for its approval and the Board approved the revised Code of Ethics within six months of the material change. |
Acknowledged and Certified:
By:________________________________________________
Name:______________________________________________
Title:_______________________________________________
Date:_______________________________________________
Name of Fund Organization: ___________________________________
(The investment advisor or principal underwriter)
Name of Compliance Officer:_______________________________
Name of Alternate Officer:_________________________________
Name of Fund:__________________________________________
(The Chartwell Funds)
CHARTWELL FUNDS TRUST
CODE OF CONDUCT
FOR
PRINCIPAL EXECUTIVE OFFICER & PRINCIPAL FINANCIAL OFFICER
The Trust requires their Principal Executive Officer, Principal Financial Officer, or other Trust officers performing similar functions (the “Principal Officers”), to maintain the highest ethical and legal standards while performing their duties and responsibilities to the Trust with particular emphasis on those duties that relate to the preparation and reporting of the financial information of the Funds. In addition to completing the forms in Exhibit A and Exhibit B, the following principles and responsibilities shall govern the professional conduct of the Principal Officers:
| 1. | HONEST AND ETHICAL CONDUCT |
The Principal Officers shall act with honesty and integrity, avoiding actual or apparent conflicts of interest in personal and professional relationships, and shall report any material transaction or relationship that reasonably could be expected to give rise to such conflict between their interests and those of a Fund to the Audit Committee, the full Board of Trustees of the Trust, and, in addition, to any other appropriate person or entity that may reasonably be expected to deal with any conflict of interest in timely and expeditious manner.
The Principal Officers shall act in good faith, responsibly, with due care, competence and diligence, without misrepresenting material facts or allowing their independent judgment to be subordinated or compromised.
| 2. | FINANCIAL RECORDS AND REPORTING |
The Principal Officers shall provide full, fair, accurate, timely and understandable disclosure in the reports and/or other documents to be filed with or submitted to the Securities and Exchange Commission or other applicable body by a Fund, or that is otherwise publicly disclosed or communicated. The Principal Officers shall comply with applicable rules and regulations of federal, state, and local governments, and other appropriate private and public regulatory agencies.
The Principal Officers shall respect the confidentiality of information acquired in the course of their work and shall not disclose such information except when authorized or legally obligated to disclose. The Principal Officers will not use confidential information acquired in the course of their duties as Principal Officers.
The Principal Officers shall share knowledge and maintain skills important and relevant to the Trust’s needs; shall proactively promote ethical behavior of the Trust’s employees and as a partner with industry peers and associates; and shall maintain control over and responsibly manage assets and resources employed or entrusted to them by the Trust.
| 3. | COMPLIANCE WITH LAWS, RULES AND REGULATIONS |
The Principal Officers shall establish and maintain mechanisms to oversee the compliance of the Funds with applicable federal, state or local law, regulation or administrative rule, and to identify, report and correct in a swift and certain manner, any detected deviations from applicable federal, state or local law regulation or rule.
| 4. | COMPLIANCE WITH THIS CODE OF ETHICS |
The Principal Officers shall promptly report any violations of this Code of Ethics to the Audit Committee as well as the full Board of Trustees of the Trust and shall be held accountable for strict adherence to this Code of Ethics. A proven failure to uphold the standards stated herein shall be grounds for such sanctions as shall be reasonably imposed by the Board of Trustees of the Trust.
| 5. | AMENDMENT AND WAIVER |
This Code of Ethics may only be amended or modified by approval of the Boards of Trustees. Any substantive amendment that is not technical or administrative in nature or any material waiver, implicit or otherwise, of any provision of this Code of Ethics, shall be communicated publicly in accordance with Item 2 of Form N-CSR under the Investment Company Act of 1940, as amended.
EXHIBIT A
ACKNOWLEDGEMENT
CODE OF CONDUCT
FOR
PRINCIPAL EXECUTIVE OFFICER & PRINCIPAL FINANCIAL OFFICER
Pursuant to the requirements of the Code of Conduct adopted by the Chartwell Funds Trust (the “Code”), I hereby acknowledge and affirm that I have received, read and understand the Code and agree to adhere and abide by the letter and spirit of its provisions.
Signature: _____________________
Print Name: ____________________
Title: _________________________
Date: _________________________
EXHIBIT B
ANNUAL CERTIFICATION
CODE OF CONDUCT
FOR
PRINCIPAL EXECUTIVE OFFICER & PRINCIPAL FINANCIAL OFFICER
Pursuant to the requirements of the Code of Conduct adopted by the Chartwell Funds Trust (the “Code”), I hereby acknowledge and affirm that since the date of the last annual certification given pursuant to the Code, I have complied with all requirements of the Code.
Signature: _____________________
Print Name: ____________________
Title: _________________________
Date: _________________________
EX-99.CERT
CERTIFICATIONS
I, Timothy J. Riddle, certify that:
1. I have reviewed this report on Form N-CSR of The Chartwell Funds;
2. Based on my knowledge, this report does not contain any untrue statement of a material fact or omit to state a material fact necessary to make the statements made, in light of the circumstances under which such statements were made, not misleading with respect to the period covered by this report;
3. Based on my knowledge, the financial statements, and other financial information included in this report, fairly present in all material respects the financial condition, results of operations, changes in net assets, and cash flows (if the financial statements are required to include a statement of cash flows) of the registrant as of, and for, the periods presented in this report;
4. The registrant’s other certifying officer(s) and I are responsible for establishing and maintaining disclosure controls and procedures (as defined in Rule 30a-3(c) under the Investment Company Act of 1940) and internal control over financial reporting (as defined in Rule 30a-3(d) under the Investment Company Act of 1940) for the registrant and have:
(a) Designed such disclosure controls and procedures, or caused such disclosure controls and procedures to be designed under our supervision, to ensure that material information relating to the registrant, including its consolidated subsidiaries, is made known to us by others within those entities, particularly during the period in which this report is being prepared;
(b) Designed such internal control over financial reporting, or caused such internal control over financial reporting to be designed under our supervision, to provide reasonable assurance regarding the reliability of financial reporting and the preparation of financial statements for external purposes in accordance with generally accepted accounting principles;
(c) Evaluated the effectiveness of the registrant’s disclosure controls and procedures and presented in this report our conclusions about the effectiveness of the disclosure controls and procedures, as of a date within 90 days prior to the filing date of this report based on such evaluation; and
(d) Disclosed in this report any change in the registrant’s internal control over financial reporting that occurred during the second fiscal quarter of the period covered by this report that has materially affected, or is reasonably likely to materially affect, the registrant’s internal control over financial reporting; and
5. The registrant’s other certifying officer(s) and I have disclosed to the registrant’s auditors and the audit committee of the registrant’s board of directors (or persons performing the equivalent functions):
(a) All significant deficiencies and material weaknesses in the design or operation of internal control over financial reporting which are reasonably likely to adversely affect the registrant’s ability to record, process, summarize, and report financial information; and
(b) Any fraud, whether or not material, that involves management or other employees who have a significant role in the registrant’s internal control over financial reporting.
| Date: December 30, 2019 | /s/ Timothy J. Riddle | |
| Timothy J. Riddle, Chairman, President and Chief Executive Officer | ||
| (Principal Executive Officer) | ||
CERTIFICATIONS
I, Neil Walker, certify that:
1. I have reviewed this report on Form N-CSR of The Chartwell Funds;
2. Based on my knowledge, this report does not contain any untrue statement of a material fact or omit to state a material fact necessary to make the statements made, in light of the circumstances under which such statements were made, not misleading with respect to the period covered by this report;
3. Based on my knowledge, the financial statements, and other financial information included in this report, fairly present in all material respects the financial condition, results of operations, changes in net assets, and cash flows (if the financial statements are required to include a statement of cash flows) of the registrant as of, and for, the periods presented in this report;
4. The registrant’s other certifying officer(s) and I are responsible for establishing and maintaining disclosure controls and procedures (as defined in Rule 30a-3(c) under the Investment Company Act of 1940) and internal control over financial reporting (as defined in Rule 30a-3(d) under the Investment Company Act of 1940) for the registrant and have:
(a) Designed such disclosure controls and procedures, or caused such disclosure controls and procedures to be designed under our supervision, to ensure that material information relating to the registrant, including its consolidated subsidiaries, is made known to us by others within those entities, particularly during the period in which this report is being prepared;
(b) Designed such internal control over financial reporting, or caused such internal control over financial reporting to be designed under our supervision, to provide reasonable assurance regarding the reliability of financial reporting and the preparation of financial statements for external purposes in accordance with generally accepted accounting principles;
(c) Evaluated the effectiveness of the registrant’s disclosure controls and procedures and presented in this report our conclusions about the effectiveness of the disclosure controls and procedures, as of a date within 90 days prior to the filing date of this report based on such evaluation; and
(d) Disclosed in this report any change in the registrant’s internal control over financial reporting that occurred during the second fiscal quarter of the period covered by this report that has materially affected, or is reasonably likely to materially affect, the registrant’s internal control over financial reporting; and
5. The registrant’s other certifying officer(s) and I have disclosed to the registrant’s auditors and the audit committee of the registrant’s board of directors (or persons performing the equivalent functions):
(a) All significant deficiencies and material weaknesses in the design or operation of internal control over financial reporting which are reasonably likely to adversely affect the registrant’s ability to record, process, summarize, and report financial information; and
(b) Any fraud, whether or not material, that involves management or other employees who have a significant role in the registrant’s internal control over financial reporting.
| Date: December 30, 2019 | /s/ Neil Walker | |
| Neil Walker, Treasurer and Chief Financial Officer | ||
| (Principal Financial Officer) |
EX-99.906CERT
CERTIFICATIONS
Timothy J. Riddle, Principal Executive Officer, and Neil Walker, Principal Financial Officer, of The Chartwell Funds (the “Registrant”), each certify to the best of his/her knowledge that:
| 1. | The Registrant’s periodic report on Form N-CSR for the period ended October 31, 2019 (the “Form N-CSR”) fully complies with the requirements of section 13(a) or section 15(d) of the Securities Exchange Act of 1934, as amended; and |
| 2. | The information contained in the Form N-CSR fairly presents, in all material respects, the financial condition and results of operations of the Registrant. |
| PRINCIPAL EXECUTIVE OFFICER | PRINCIPAL FINANCIAL OFFICER | ||
| The Chartwell Funds | The Chartwell Funds | ||
| /s/ Timothy J. Riddle | /s/ Neil Walker | ||
| Timothy J. Riddle, Chairman, President and | Neil Walker, Treasurer and Chief Financial Officer | ||
| Chief Executive Officer | |||
| Date: December 30, 2019 | Date: December 30, 2019 |
A signed original of this written statement required by Section 906, or other document authenticating, acknowledging or otherwise adopting the signature that appears in typed form within the electronic version of this written statement required by Section 906, has been provided to The Chartwell Funds and will be retained by The Chartwell Funds and furnished to the Securities and Exchange Commission or its staff upon request.
This certification is being furnished to the Securities and Exchange Commission solely pursuant to 18 U.S.C. 1350 and is not being filed as part of the Form N-CSR filed with the Securities and Exchange Commission.
Serious News for Serious Traders! Try StreetInsider.com Premium Free!
You May Also Be Interested In
- KBC Group: Update regarding the KBC Group share buyback programme
- Maximize Your Forex Trading Strategy - Harness the Market Momentum for Enhanced Results.
- Falcon Oil & Gas Ltd - Binding Term Sheet for Gas Sales Agreement to supply pilot gas to the Northern Territory Government
Create E-mail Alert Related Categories
SEC FilingsSign up for StreetInsider Free!
Receive full access to all new and archived articles, unlimited portfolio tracking, e-mail alerts, custom newswires and RSS feeds - and more!
