

Form N-CSR CRM Mutual Fund Trust For: Jun 30
 Tweet
Tweet Share
ShareUNITED STATES
SECURITIES AND EXCHANGE COMMISSION
Washington, D.C. 20549
FORM N-CSR
CERTIFIED SHAREHOLDER REPORT OF REGISTERED MANAGEMENT
INVESTMENT COMPANIES
Investment Company Act file number 811-21749
CRM Mutual Fund Trust
(Exact name of registrant as specified in charter)
c/o Cramer Rosenthal McGlynn, LLC.
28 Havemeyer Place
Greenwich, CT 06830
(Address of principal executive offices) (Zip code)
Corporation Service Company
2711 Centerville Road Suite 400
Wilmington, DE 19808
(Name and address of agent for service)
Copy to:
Lea Anne Copenhefer
Morgan, Lewis & Bockius LLP
One Federal Street
Boston, MA 02110
Registrant’s telephone number, including area code: 212-326-5300
Date of fiscal year end: June 30
Date of reporting period: June 30, 2021
Item 1. Reports to Stockholders.
The Report to Shareholders is attached herewith.
June 30, 2021
CRM Small Cap Value Fund
CRM Small/Mid Cap Value Fund
CRM Mid Cap Value Fund
CRM All Cap Value Fund
CRM Long/Short Opportunities Fund |
ANNUAL REPORT

ANNUAL REPORT |
June 30, 2021 |
President’s Message (Unaudited) |
Dear Fellow Shareholders:
While the first half of the fiscal year brought uncertainty as the world began to contemplate life beyond COVID-19, the double shot of fiscal and monetary support was the adrenaline shot needed to move the country from a 9% decline in GDP in the second quarter of 2020 to double digit growth in the second quarter of 2021. As that adrenaline high wears off, we look for the economy and the market to transition from early-cycle to mid-cycle recovery. This more sustainable level of economic growth will be a deceleration from the hyper growth, healing phase but should not be misconstrued as an economic slowdown. The recent rise in COVID-19 cases caused by the Delta variant and China’s recent restrictive policies and slower economic growth are causing investors to question the strength and durability of the global recovery. More recently, this has translated into a desire for safe haven investments such as U.S. Treasuries and large cap growth stocks. A redo of last cycle, which we believe is a mistake.
We find the market today is broadly supportive of value stocks, and particularly our style of relative value. After one of the fastest economic recoveries in U.S. history, we expect markets to recalibrate from unabated risk seeking and to a more balanced position between risk and reward. This next phase of the recovery should bring more selectivity.
We view the June Federal Reserve Open Market Committee meeting as marking the end of early cycle and, importantly, reducing the risk of hyperinflation. This next phase is typically longer in duration and favorable for stock selection. The market will have to absorb this notion of less accommodation, but we still expect to see healthy growth and attractive valuations, particularly in our part of the market. We can envision a more constructive earnings backdrop in the future as labor availability improves, raw material price increases level off and supply chains normalize. This environment should be conducive to stock selection rather than broad macro/factor investing.
The appetite for risk is healthy today given highly supportive central banks and the extraordinary fiscal stimulus. However, we must be vigilant when market sentiment is so positive. We will continue to identify companies that can operate in various economic environments. Importantly, we look to invest in those relative
1 |
value companies, which have pricing power that should allow them to price for higher inflation, while also being highly competitive in a more modest economic backdrop. What we are seeking to avoid in this V-shaped recovery are those highly leveraged, speculative companies, which are the investor darlings today, but will likely face their day of reckoning in the not-too-distant future. We expect this will inevitably occur when credit is not so abundant, and these companies lack the pricing power to operate in a normal to above-average inflationary background.
We continue to see a healthy investing environment for small to mid-cap value stocks. Historically, small cap stocks tend to lead the market following a recession and value stocks tend to outperform growth stocks when GDP is greater than 3%. After two years of P/E multiple expansion in 2019 and 2020, we expect market returns will be more driven by earnings growth. We look for value stocks, particularly small to mid-caps stocks, to generate the fastest earnings growth over the next two years while offering attractive valuations. Lastly, we believe a rising inflationary economy should be highly supportive of stock selection and active management.
We cannot finish this letter without mentioning the historical impact the rally in highly shorted, secularly challenged stocks by retail investors buying on margin (so called “meme stocks”) has on the market, and particularly smaller capitalization stocks. We believe these zombie companies have meaningfully amplified the returns of the indices this year. There are many root causes that have been laid out for this renaissance in retail trading including free trading, pandemic behavior as people were stuck at home, stimulus money, record savings levels, gamification and entertainment value, the strength and resonance of being part of a community, and an outgrowth of persistently low interest rates and Fed policy. Either way, history tells us that these low ROE, nonearners tend to underperform when inflation rises and GDP returns to historical levels. It is important to recognize that nonearners represent the highest percent of the Russell® Index since 1999/2000. Thus, the quality of the Russell® indices appears to be at one of its lowest levels, as represented by ROE and ROA, in its history. We believe this should provide a fruitful environment for active management.
The following is a discussion of factors that influenced the performance of the CRM Funds during the fiscal year ended June 30, 2021.
CRM Small Cap Value Fund returned 55.68% and 55.36% for the Institutional and Investor Share classes, respectively, in the period, as compared to 73.28% and 62.03% for the Russell® 2000 Value Index and the Russell® 2000 Index, respectively1. Despite strong performance during the period, the Fund lagged the benchmark due to stock selection in the Consumer Discretionary sector. This was due largely in part to companies such as AMC Entertainment Holdings and GameStop, which CRM does not hold. Leading contributors to performance for this period included (i)
2 |
branded apparel company, G-III Apparel Group, Ltd.; (ii) Valmont Industries, Inc., a manufacturer of poles and towers for infrastructure, communications, and utility end-markets as well as agricultural irrigation equipment; and (iii) BankUnited, Inc., a regional bank based in Florida and New York. G-III Apparel Group responded positively to vaccine news throughout November as well as a better-than-expected third quarter 2020 earnings report. The company continued to post better-than-expected earnings as a result of aggressive cost mitigation in 2020 and a measured recovery of revenues. Importantly, GIII completed the exit of its money-losing retail business in the fourth quarter of 2020. Valmont Industries, Inc. reported stronger quarterly results following greater optimism over its irrigation business as farmer incomes inflected positively amidst higher commodity prices. The company also recognized revenues on a key Middle East contract tied to food security. BankUnited reported better-than-expected third quarter 2020 and fourth quarter 2020 earnings due to improved credit quality. In addition, the company guided to a stabilizing net interest margin given its ability to lower deposit costs. Finally, the company continued to make solid progress on implementing cost savings from its BankUnited 2.0 profitability initiative.
Individual holdings that negatively impacted performance included (i) PAE Incorporated, a defense and government services contractor; (ii) Clearwater Paper Corporation, a domestic producer of private label consumer paper products, as well as solid bleached sulfate paperboard products; and (iii) Paya Holdings, Inc., a leading provider of integrated payment and frictionless commerce solutions that help customers accept and make payments. PAE Incorporated was a detractor in the period, as the company had to revise its revenue guidance for the year based on pandemic impacts to its non-labor component of revenue. The defense contractor sector similarly underperformed going in to the 2020 presidential election and federal spending pressures given rising pandemic stimulus costs, impacting future budget pressures. Clearwater paper suffered during the second half of the fiscal year from the oversupply of consumer bath tissue inventory at its customers, elevated commodity input pressure, and forced production downtime at its facilities. The company has taken steps to exit unprofitable capacity, as it works to bring down inventories at its customers and its own held finished product. Meanwhile, Clearwater’s paperboard segment is benefitting from strong demand and better pricing dynamics, which is partially moderating softer results in its consumer tissue segment. Paya Holdings Inc. came public via a SPAC transaction, which resulted in the shares being less well known by public investors relative to a traditional IPO. Consequently, the shares trade at a discount to peers despite faster revenue growth and comparable margins. The shares underperformed following the completion of a secondary offering in March.
CRM Small/Mid Cap Value Fund returned 68.26% and 67.80% for the Institutional and Investor Share classes, respectively, in the period, as compared to 63.23% and 57.79% for the Russell 2500™ Value Index and the Russell
3 |
2500™ Index, respectively2. Key drivers of strong absolute performance, and relative outperformance versus both benchmarks, in the Fund during the period were stock selection in the Industrials and Financials sectors. Individual holdings that were leading contributors to performance included (i) Sunrun, Inc., the leading residential solar installer in the U.S.; (ii) American Financial Group, Inc. a diversified insurer; and (iii) Valmont Industries, a leading company in utility and wireless infrastructure, as well as irrigation systems for agriculture. Sunrun announced the acquisition of Vivint Solar during the period. American Financial Group reported first quarter 2021 earnings that were better than expected, featuring stronger underwriting profit margins, healthy pricing, and solid premium growth. The company also closed on the sale of its Annuity business and announced a larger-than-expected special dividend with a portion of the sale proceeds. Valmont Industries reported stronger quarterly results during the period following greater optimism over its irrigation business as farmer incomes inflected positively amidst higher commodity prices. The company also recognized revenues on a key Middle East contract tied to food security.
Individual holdings that negatively affected performance included (i) MultiPlan Corporation, a healthcare transaction processor focused on reducing waste, fraud, and abuse; (ii) Webster Financial Corporation, a regional bank based in the Northeast; and (iii) TreeHouse Foods, Inc., the leading U.S. private label food manufacturer. MultiPlan underperformed during the period due to accusations surfacing from a short seller during the fourth quarter 2020 as well as management’s lack of providing 2021 guidance, which continued to depress investor interest in the company. Webster Financial Corporation came under some near-term pressure following the April 2021 announcement that it would be acquiring Sterling Bancorp., a regional bank similarly based in the Northeast. Typically, bank stocks engaging in acquisitions tend to underperform in the period from deal announcement until deal closure (expected in 4Q21) as the market digests potential integration risk. Treehouse Foods underperformed as more defensive names underperformed other more pro-cyclical areas of the market. In addition, given weaker private label category performance relative to branded within packaged food, Treehouse’s private label categories began to lose share, adding to concerns the company would not be able to accelerate its relatively poor organic growth performance over the next year or two.
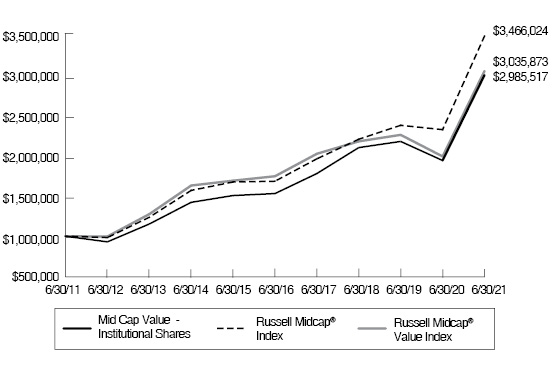
CRM Mid Cap Value Fund returned 54.44% and 54.09% for the Institutional and Investor Share classes, respectively, in the fiscal year, as compared to 53.06% and 49.80% for the Russell Midcap® Value Index and the Russell Midcap® Index, respectively3. Strong stock selection in most sectors contributed to the Fund’s relative outperformance versus both indices, and strong absolute performance. Stock selection in the Materials and Real Estate sectors acted as a slight headwind to performance. Individual holdings that contributed positively to performance during the period included (i) American Financial Group, Inc., a diversified insurer;
4 |
(ii) Envista Holdings Corporation, a provider of dental consumables, equipment, and services to dental professionals; and (iii) LKQ Corporation., a distributor for aftermarket automotive parts. American Financial Group reported first quarter 2021 earnings that were better than expected, featuring stronger underwriting profit margins, healthy pricing, and solid premium growth. The company also closed on the sale of its Annuity business and announced a larger-than-expected special dividend with a portion of the sale proceeds. Global dental volumes continued to sequentially improve from the April 2020 trough period. Domestically, volumes remain below the prior year period, but Envista’s profits outperformed expectations as improving mix and managing costs brought profits closer to prior year results. Several dental industry peers have similarly reported improved profitability results, as dental offices have remained open during the COVID-19 surges. Results in categories where Envista has been making investments were also above expectations, in infection prevention products and clear aligners, which are additive to sustainable growth and margins. Longer term revenue targets were also raised, as the company exited lower growth segments and products. LKQ Corporation saw continued improvement in many of its geographies from a product demand perspective. The company’s Specialty segment continued to grow above expectations, as elevated aftermarket recreational vehicle parts demand continued.
Holdings that detracted from Fund performance during the fiscal year included (i) MultiPlan Corporation, a healthcare transaction processor focused on reducing waste, fraud, and abuse; (ii) Mohawk Industries, Inc., a U.S. flooring manufacturer; and (iii) Webster Financial Corporation., a regional bank based in the Northeast. MultiPlan underperformed during the period due to accusations surfacing from a short seller during the fourth quarter 2020 as well as management’s lack of providing 2021 guidance, which continued to depress investor interest in the company. Mohawk Industries traded down amid the release of a detailed research report highlighting alleged aggressive accounting practices. In addition, the company reported it received subpoenas from the U.S. Attorney’s Office and SEC over related allegations. We sold the stock in the first half of the fiscal year as these events called into question the recovery from self-inflicted execution mistakes over the last few years and housing related earnings recovery potential. Webster Financial Corporation came under some near-term pressure following the April 2021 announcement that it would be acquiring Sterling Bancorp., a regional bank similarly based in the Northeast. Typically, bank stocks engaging in acquisitions tend to underperform in the period from deal announcement until deal closure (expected in 4Q21) as the market digests potential integration risk.
CRM All Cap Value Fund returned 54.66% and 54.42% for the Institutional and Investor Share classes, respectively, during the period, as compared to 45.40% and 44.16% for the Russell 3000® Value Index and the Russell 3000® Index, respectively4. Strong performance in the Fund during the period was due to positive stock selection in the Energy, Information Technology, Health Care,
5 |
and Consumer Discretionary sectors. Stock selection in the Materials sector was a slight headwind to performance Leading contributors to Fund performance were (i) American Financial Group, Inc., a diversified insurer; (ii) Valmont Industries, Inc., a manufacturer of poles and towers for infrastructure, communications, and utility end-markets as well as agricultural irrigation equipment; and (iii) BankUnited, Inc., a regional bank based in Florida and New York. American Financial Group reported first quarter 2021 earnings that were better than expected, featuring stronger underwriting profit margins, healthy pricing, and solid premium growth. The company also closed on the sale of its Annuity business and announced a larger-than-expected special dividend with a portion of the sale proceeds. Valmont Industries reported stronger quarterly results during the period following greater optimism over its irrigation business as farmer incomes inflected positively amidst higher commodity prices. The company also recognized revenues on a key Middle East contract tied to food security. BankUnited reported better-than-expected third quarter 2020 and fourth quarter 2020 earnings due to improved credit quality. In addition, the company guided to a stabilizing net interest margin given its ability to lower deposit costs. Finally, the company continued to make solid progress on implementing cost savings from its BankUnited 2.0 profitability initiative.
Individual holdings that negatively impacted performance included (i) MultiPlan Corporation, a healthcare transaction processor focused on reducing waste, fraud, and abuse; (ii) Qualcomm Inc., the leading provider of wireless communication technology to enterprises and consumers globally; and (iii) Webster Financial Corporation, a regional bank based in the Northeast. MultiPlan underperformed during the period due to accusations surfacing from a short seller during the fourth quarter 2020 as well as management’s lack of providing 2021 guidance, which continued to depress investor interest in the company. Qualcomm underperformed during the fiscal year as the communications industry is in the early stages of adopting 5G, the latest wireless standard. While the transition is well understood, we believe investor appreciation for its cadence is vastly misunderstood. In addition, the well-documented semiconductor shortage is causing the transition to elongate as supply is constrained. Investors misinterpreted slower growth early in 2021 as a reflection for 5G demand peaking. Webster Financial Corporation came under some near-term pressure following the April 2021 announcement that it would be acquiring Sterling Bancorp., a regional bank similarly based in the Northeast. Typically, bank stocks engaging in acquisitions tend to underperform in the period from deal announcement until deal closure (expected in 4Q21) as the market digests potential integration risk.
CRM Long/Short Opportunities Fund returned 19.49% in the fiscal year versus 40.79% for the S&P 500® Index5. During the fiscal year ended June 30, 2021, our long book contributed to overall performance with strong contribution from most sectors, particularly Industrials and Consumer Discretionary. The Fund’s short book detracted from performance with the majority of negative contribution coming
6 |
from Industrials, Information Technology, and Consumer Discretionary. In terms of exposure during the period, the Fund averaged approximately 101% gross long, 48% gross short, and 53% net long.
The top contributors in the long portfolio were (i) Sunrun, Inc., the leading residential solar installer in the U.S.; (ii) branded apparel company, G-III Apparel Group, Ltd.; and (iii) Valmont Industries, Inc., a manufacturer of poles and towers for infrastructure, communications, and utility end-markets as well as agricultural irrigation equipment. Sunrun announced the acquisition of Vivint Solar during the period. G-III Apparel Group responded positively to vaccine news throughout November as well as a better-than-expected third quarter 2020 earnings report. The company continued to post better-than-expected earnings as a result of aggressive cost mitigation in 2020 and a measured recovery of revenues. Importantly, GIII completed the exit of its money-losing retail business in the fourth quarter of 2020. Valmont Industries reported stronger quarterly results during the period following greater optimism over its irrigation business as farmer incomes inflected positively amidst higher commodity prices. The company also recognized revenues on a key Middle East contract tied to food security.
Top individual names that negatively impacted the long portfolio included (i) MultiPlan Corporation, a healthcare transaction processor focused on reducing waste, fraud, and abuse; (ii) Paya Holdings, Inc., a leading provider of integrated payment and frictionless commerce solutions that help customers accept and make payments; and (iii) Clearwater Paper Corporation, a domestic producer of private label consumer paper products, as well as solid bleached sulfate paperboard products. MultiPlan underperformed during the period due to accusations surfacing from a short seller during the fourth quarter 2020 as well as management’s lack of providing 2021 guidance, which continued to depress investor interest in the company. Paya Holdings came public via a SPAC transaction, which resulted in the shares being less well known by public investors relative to a traditional IPO. Consequently, the shares trade at a discount to peers despite faster revenue growth and comparable margins. The shares underperformed following the completion of a secondary offering in March 2021. Clearwater paper suffered during the second half of the fiscal year from the oversupply of consumer bath tissue inventory at its customers, elevated commodity input pressure, and forced production downtime at its facilities. The company has taken steps to exit unprofitable capacity, as it works to bring down inventories at its customers and its own held finished product. Meanwhile, Clearwater’s paperboard segment is benefitting from strong demand and better pricing dynamics, which is partially moderating softer results in its consumer tissue segment.
Our leading short contributors included (i) a linear media company; (ii) a for profit education company; and (iii) a legacy manufacturer of 3D printing equipment and a service provider to additive manufacturing customers. A linear media company with
7 |
a nascent OTT offering agreed to combine with the vast media portfolio of a telecom conglomerate, which we viewed negatively. This Newco takes the traditional business of high margin, programmed content aimed at a core base of aficionados to a more far flung global business that now includes sports programming, theatrical releases, and subscription media offerings that pit them more closely against Netflix, Disney, and Comcast. This merger also increases the leverage profile of the business and makes the business too large to be an acquisition target itself. A for profit education company is subject to higher regulatory scrutiny from the U.S. Department of Education, as well as operating challenges from a slower enrollment and higher marketing cost profile. A legacy manufacturer of 3D printing equipment and a service provider to additive manufacturing customers, saw its stock pressured as several new companies came public in the additive manufacturing space with aggressive plans to target printing for production environments.
The top detractors in the short portfolio were (i) an enterprise software company; (ii) a solar inverter company; and (iii) a leading LED manufacturer. An enterprise software company became the target of speculative retail frenzy early in the year, pushing the share price to stratospheric levels. We exited our position due to the nature of the speculative bubble. A leading solar inverter company appreciated despite significantly lowering fourth quarter 2020 guidance and announcing further delays in its storage product. Even with this news, clean energy ETFs and retail investors purchased the stock indiscriminately. A leading LED manufacturer appreciated on higher guidance provided for 2021 that we believe to be largely transitory as inventories are restocked, price increases are inflated due to the absence of competitive Chinese product in the key U.S. market, and as cost pressures catch up to results in late 2021 and through 2022.
Sincerely,

Ronald H. McGlynn
Trustee and President, CRM Mutual Fund Trust
8 |
1Russell 2000® Value Index is the Fund’s benchmark. The Russell 2000® Value Index measures the performance of those companies in the Russell 2000® Index with lower price-to-book ratios and lower forecasted growth values. The Russell 2000® Index is an unmanaged, capitalization weighted index of 2,000 small cap U.S. companies. It is not possible to invest directly in an index.
2Russell 2500™ Value Index is the Fund’s benchmark. The Russell 2500™ Value Index is an unmanaged index that measures the performance of those companies in the Russell 2500 Index with lower price-to-book ratios and lower forecasted growth values. The Russell 2500™ Index is an unmanaged index that measures the performance of the 2,500 smallest companies in the Russell 3000® Index. It is not possible to invest directly in an index.
3Russell Midcap® Value Index is the Fund’s benchmark. The Russell Midcap® Value Index measures the performance of those companies in the Russell Midcap® Index with lower price-to-book ratios and lower forecasted growth values. The Russell Midcap® Index measures the performance of the 800 smallest companies in the Russell 1000® Index, which represents the performance of the 1,000 largest companies in the U.S. equity market. It is not possible to invest directly in an index.
4Russell 3000® Value Index is the Fund’s benchmark. The Russell 3000® Value Index measures the performance of those companies in the Russell 3000® Index with lower price-to-book ratios and lower forecasted growth values. The Russell 3000® Index is an unmanaged, capitalization weighted index of the 3,000 largest U.S. companies, which represent approximately 98% of the investable U.S. equity market. It is not possible to invest directly in an index.
5S&P 500® Index is an index of 500 companies chosen for market size, liquidity and industry grouping, among other factors. The S&P 500® is designed to be a leading indicator of U.S. equities and is meant to reflect the risk/return characteristics of the large cap universe.
Performance quoted represents past performance and does not guarantee future results. Investment return and principal value will fluctuate. Shares, when redeemed, may be worth more or less than their original cost. Current performance may be lower or higher than that shown here. Performance data current to the most recent month-end is available by calling (800) CRM-2883. During the period, certain fees and expenses were waived by the Funds’ service providers. Without these waivers, total returns would have been lower. Additional performance figures for the Funds can be found in Comparison of Change in Value section of this report.
Fund holdings and sector allocations are subject to change at any time and are not recommendations to buy or sell any security. Please refer to the Schedules of Investments for a complete list of Fund holdings. The information contained herein is not a complete analysis of every aspect of any market, industry, security, or Fund. Opinions expressed herein are as of June 30, 2021 and are subject to change at any time, are not guaranteed, and should not be considered investment advice.
Investments in small and mid capitalization companies generally are more volatile due to limited product lines, fewer capital resources and less depth of management than larger companies. Value-based investments are subject to the risk that the broad market may not recognize their intrinsic values or that the investment has not been undervalued by the market. Investments in foreign securities, including emerging markets, involve special risks such as greater social, economic, regulatory, and political uncertainties, and currency fluctuation.
9 |
The Long/Short Opportunities Fund will hold long equity securities that the Fund’s adviser has identified as undervalued and take short positions (through short sales) in equity securities that the Fund’s adviser has identified as overvalued or poised for underperformance. Short sales involve significant risks, including the risk that the Fund may have to cover its short position at a higher price than the short sale price, resulting in a loss. Short sales involve borrowing securities and then selling them, which may cause the value of the Fund’s shares to be more volatile than if the Fund did not borrow.
This report must be preceded or accompanied by the current prospectus for the Funds. Before investing, you should carefully read the prospectus and consider the investment objectives, risks, charges and expenses of the Funds. Additional copies of the prospectus may be obtained at www.crmfunds.com or at 800-CRM-2883.
Distributed by ALPS Distributors, Inc.
10 |
CRM FUNDS CRM SMALL CAP VALUE FUND COMPARISON OF CHANGE IN VALUE (Unaudited) June 30, 2021 |
The following information compares the performance of the CRM Small Cap Value Fund (“Fund”) with the performance of the Russell 2000® Index and Russell 2000® Value Index. The Russell 2000® Index is an unmanaged, capitalization-weighted index of 2,000 small capitalization U.S. companies. The Russell 2000® Value Index measures the performance of those Russell 2000® Index companies with lower price-to-book ratios and lower forecasted growth values. Total return for the Fund assumes reinvestment of dividends and distributions. The index returns reflect the reinvestment of dividends, but exclude the effect of any expenses, which have been deducted from the Fund’s return. The performance in the below tables and graphs does not reflect the deduction of taxes the shareholder would pay on Fund distributions or redemption of Fund shares.
Compared to mutual funds that focus on large capitalization companies, shares of the Fund may be more volatile because of the Fund’s focus on smaller capitalization companies. These companies are more likely to have more limited product lines, fewer capital resources and less depth of management than larger companies.
CRM Small Cap Value Fund — Investor Shares vs. Russell 2000® Index and Russell 2000® Value Index1

CRM Funds |
||
11 |
CRM FUNDS CRM SMALL CAP VALUE FUND COMPARISON OF CHANGE IN VALUE (Unaudited) (Continued) June 30, 2021 |
Average Annual Total Returns |
|||
1 Year |
5 Years |
10 Years |
|
Small Cap Value Fund - Investor Shares |
55.36% |
10.59% |
8.97% |
Russell 2000® Index |
62.03% |
16.47% |
12.34% |
Russell 2000® Value Index |
73.28% |
13.62% |
10.85% |
Expense Ratio (per prospectus dated 10/28/20) — 1.17%
|
1 |
The Fund is professionally managed, while the indices are unmanaged and are not available for investment. |
This line graph for Investor Shares shows values based on an assumed investment of $10,000.
Performance quoted represents past performance and does not guarantee future results. Investment return and principal value will fluctuate. Shares, when redeemed, may be worth more or less than their original cost. Current performance may be lower or higher than that shown here. Performance data current to the most recent month-end is available by calling (800) CRM-2883. The Fund’s expense ratio may fluctuate over time, and vary from the Fund’s expenses for the period covered by this report. Please refer to the financial highlights for a more current expense ratio.
CRM Funds |
||
12 |
CRM FUNDS CRM SMALL CAP VALUE FUND COMPARISON OF CHANGE IN VALUE (Unaudited) (Concluded) June 30, 2021 |
CRM Small Cap Value Fund — Institutional Shares vs. Russell 2000® Index and Russell 2000® Value Index1

Average Annual Total Returns |
|||
1 Year |
5 Years |
10 Years |
|
Small Cap Value Fund - Institutional Shares |
55.68% |
10.85% |
9.22% |
Russell 2000® Index |
62.03% |
16.47% |
12.34% |
Russell 2000® Value Index |
73.28% |
13.62% |
10.85% |
Expense Ratio (per prospectus dated 10/28/20) — 0.93%
|
1 |
The Fund is professionally managed, while the indices are unmanaged and are not available for investment. |
The line graph for Institutional Shares shows values based on an assumed investment of $1,000,000.
Performance quoted represents past performance and does not guarantee future results. Investment return and principal value will fluctuate. Shares, when redeemed, may be worth more or less than their original cost. Current performance may be lower or higher than that shown here. Performance data current to the most recent month-end is available by calling (800) CRM-2883. The Fund’s expense ratio may fluctuate over time, and vary from the Fund’s expenses for the period covered by this report. Please refer to the financial highlights for a more current expense ratio.
CRM Funds |
||
13 |
CRM FUNDS CRM SMALL/MID CAP VALUE FUND COMPARISON OF CHANGE IN VALUE (Unaudited) June 30, 2021 |
The following information compares the performance of the CRM Small/Mid Cap Value Fund (“Fund”) with the performance of the Russell 2500™ Index and Russell 2500™ Value Index. The Russell 2500™ Value Index is an unmanaged index that measures the performance of those companies in the Russell 2500™ Index with lower price-to-book ratios and lower forecasted growth values. The Russell 2500™ Index measures the performance of the 2,500 smallest companies in the Russell 3000® Index, which represents the performance of the 3,000 largest U.S. companies. Total return for the Fund assumes reinvestment of dividends and distributions. The index returns reflect the reinvestment of dividends, but exclude the effect of any expenses, which have been deducted from the Fund’s return. The performance in the below tables and graphs does not reflect the deduction of taxes the shareholder would pay on Fund distributions or redemption of Fund shares.
Compared to mutual funds that focus on large capitalization companies, shares of the Fund may be more volatile because of the Fund’s focus on smaller capitalization companies. These companies are more likely to have more limited product lines, fewer capital resources and less depth of management than larger companies.
CRM Small/Mid Cap Value Fund — Investor Shares vs. Russell 2500™ Index and Russell 2500™ Value Index1

CRM Funds |
||
14 |
CRM FUNDS CRM SMALL/MID CAP VALUE FUND COMPARISON OF CHANGE IN VALUE (Unaudited) (Continued) June 30, 2021 |
Average Annual Total Returns |
|||
1 Year |
5 Years |
10 Years |
|
Small/Mid Cap Value Fund - Investor Shares |
67.80% |
15.23% |
11.19% |
Russell 2500TM Index |
57.79% |
16.35% |
12.86% |
Russell 2500TM Value Index |
63.23% |
12.29% |
10.93% |
Expense Ratio (per prospectus dated 10/28/20) — 1.18%
|
1 |
The Fund is professionally managed, while the indices are unmanaged and are not available for investment. |
The line graph for Investor Shares shows values based on an assumed investment of $10,000.
Performance quoted represents past performance and does not guarantee future results. Investment return and principal value will fluctuate. Shares, when redeemed, may be worth more or less than their original cost. Current performance may be lower or higher than that shown here. Performance data current to the most recent month-end is available by calling (800) CRM-2883. The Fund’s expense ratio may fluctuate over time, and vary from the Fund’s expenses for the period covered by this report. Please refer to the financial highlights for a more current expense ratio.
CRM Funds |
||
15 |
CRM FUNDS CRM SMALL/MID CAP VALUE FUND COMPARISON OF CHANGE IN VALUE (Unaudited) (Concluded) June 30, 2021 |
CRM Small/Mid Cap Value Fund — Institutional Shares vs.
Russell 2500™ Index and Russell 2500™ Value Index1

Average Annual Total Returns |
|||
1 Year |
5 Years |
10 Years |
|
Small/Mid Cap Value - Institutional Shares |
68.26% |
15.49% |
11.44% |
Russell 2500® Index |
57.79% |
16.35% |
12.86% |
Russell 2500® Value Index |
63.23% |
12.29% |
10.93% |
Expense Ratio (per prospectus dated 10/28/20) — 0.96%
|
1 |
The Fund is professionally managed, while the indices are unmanaged and are not available for investment. |
The line graph for Institutional Shares shows values based on an assumed investment of $1,000,000.
Performance quoted represents past performance and does not guarantee future results. Investment return and principal value will fluctuate. Shares, when redeemed, may be worth more or less than their original cost. Current performance may be lower or higher than that shown here. Performance data current to the most recent month-end is available by calling (800) CRM-2883. The Fund’s expense ratio may fluctuate over time, and vary from the Fund’s expenses for the period covered by this report. Please refer to the financial highlights for a more current expense ratio.
CRM Funds |
||
16 |
CRM FUNDS CRM MID CAP VALUE FUND COMPARISON OF CHANGE IN VALUE (Unaudited) June 30, 2021 |
The following information compares the performance of the CRM Mid Cap Value Fund (“Fund”) with the performance of the Russell Midcap® Index and Russell Midcap® Value Index. The Russell Midcap® Index measures the performance of 800 of the smallest companies in the Russell 1000® Index. The Russell 1000® Index measures the performance of the 1,000 largest companies in the Russell 3000® Index, which represents the performance of the 3,000 largest U.S. companies. The Russell Midcap® Value Index measures the performance of those Russell Midcap® Index companies with lower price-to-book ratios and lower forecasted growth values. Total return for the Fund assumes reinvestment of dividends and distributions. The index returns reflect reinvestment of dividends but exclude the effect of any expenses, which have been deducted from the Fund’s return. The performance in the below tables and graphs does not reflect the deduction of taxes the shareholder would pay on Fund distributions or redemption of Fund shares.
Compared to mutual funds that focus on large capitalization companies, shares of the Fund may be more volatile because the Fund invests in mid capitalization companies. These companies are more likely to have more limited product lines, fewer capital resources and less depth of management than larger companies.
CRM Mid Cap Value Fund — Investor Shares vs. Russell Midcap® Index and Russell Midcap® Value Index1

CRM Funds |
||
17 |
CRM FUNDS CRM MID CAP VALUE FUND COMPARISON OF CHANGE IN VALUE (Unaudited) (Continued) June 30, 2021 |
Average Annual Total Returns |
|||
1 Year |
5 Years |
10 Years |
|
Mid Cap Value Fund - Investor Shares |
54.09% |
14.14% |
11.33% |
Russell Midcap® Index |
49.80% |
15.62% |
13.24% |
Russell Midcap® Value Index |
53.06% |
11.79% |
11.75% |
Expense Ratio (per prospectus dated 10/28/20) — 1.17%
|
1 |
The Fund is professionally managed, while the indices are unmanaged and are not available for investment. |
The line graph for Investor Shares shows values based on an assumed investment of $10,000.
Performance quoted represents past performance and does not guarantee future results. Investment return and principal value will fluctuate. Shares, when redeemed, may be worth more or less than their original cost. Current performance may be lower or higher than that shown here. Performance data current to the most recent month-end is available by calling (800) CRM-2883. The Fund’s expense ratio may fluctuate over time, and vary from the Fund’s expenses for the period covered by this report. Please refer to the financial highlights for a more current expense ratio.
CRM Funds |
||
18 |
CRM FUNDS CRM MID CAP VALUE FUND COMPARISON OF CHANGE IN VALUE (Unaudited) (Concluded) June 30, 2021 |
CRM Mid Cap Value Fund — Institutional Shares vs. Russell Midcap® Index and Russell Midcap® Value Index1
Average Annual Total Returns |
|||
1 Year |
5 Years |
10 Years |
|
Mid Cap Value - Institutional Shares |
54.44% |
14.37% |
11.56% |
Russell Midcap® Index |
49.80% |
15.62% |
13.24% |
Russell Midcap® Value Index |
53.06% |
11.79% |
11.75% |
Expense Ratio (per prospectus dated 10/28/20) — 0.97%
|
1 |
The Fund is professionally managed, while the indices are unmanaged and are not available for investment. |
This line graph for Institutional Shares shows values based on an assumed investment of $1,000,000.
Performance quoted represents past performance and does not guarantee future results. Investment return and principal value will fluctuate. Shares, when redeemed, may be worth more or less than their original cost. Current performance may be lower or higher than that shown here. Performance data current to the most recent month-end is available by calling (800) CRM-2883. The Fund’s expense ratio may fluctuate over time, and vary from the Fund’s expenses for the period covered by this report. Please refer to the financial highlights for a more current expense ratio.
CRM Funds |
||
19 |
CRM FUNDS CRM ALL CAP VALUE FUND COMPARISON OF CHANGE IN VALUE (Unaudited) June 30, 2021 |
The following information compares the performance of the CRM All Cap Value Fund (“Fund”) with the performance of the Russell 3000® Index and the Russell 3000® Value Index. The Russell 3000® Index measures the performance of the 3,000 largest U.S. companies. The Russell 3000® Value Index measures the performance of those Russell 3000® companies with lower price-to-book ratios and lower forecasted growth values. Total return for the Fund assumes reinvestment of dividends and distributions. The index returns reflect the reinvestment of dividends but exclude the effect of any expenses, which have been deducted from the Fund’s return. The performance in the below tables and graphs does not reflect the deduction of taxes the shareholder would pay on Fund distributions or redemption of Fund shares.
Compared to mutual funds that focus exclusively on large capitalization companies, shares of the Fund may be more volatile because, while the Fund may invest in large capitalization companies, the Fund may also invest in small and mid capitalization companies. These companies are more likely to have more limited product lines, fewer capital resources and less depth of management than larger companies.
CRM All Cap Value Fund — Investor Shares vs. Russell 3000® Index and Russell 3000® Value Index1

CRM Funds |
||
20 |
CRM FUNDS CRM ALL CAP VALUE FUND COMPARISON OF CHANGE IN VALUE (Unaudited) (Continued) June 30, 2021 |
Average Annual Total Returns |
|||
1 Year |
5 Years |
10 Years |
|
All Cap Value Fund - Investor Shares2 |
54.42% |
12.31% |
9.95% |
Russell 3000® Index |
44.16% |
17.89% |
14.70% |
Russell 3000® Value Index |
45.40% |
11.99% |
11.54% |
Expense Ratios (per prospectus dated 10/28/20) — Gross: 1.51% Net: 1.46%3
|
1 |
The Fund is professionally managed, while the indices are unmanaged and are not available for investment. |
|
2 |
Total return would have been lower had certain fees and expenses not been waived and/or reimbursed. |
|
3 |
The investment adviser has a contractual obligation to waive a portion of its fees and to assume certain expenses of the Fund to the extent that the total annual fund operating expenses, excluding taxes, extraordinary expenses, brokerage commissions, interest and acquired fund fees and expenses, exceed 1.45% of average daily net assets of the share class. The expense limitation agreement is in effect until November 1, 2021 and the Board has approved the renewal of the agreement for an additional year until November 1, 2022. |
The line graph for Investor Shares shows values based on an assumed investment of $10,000.
Performance quoted represents past performance and does not guarantee future results. Investment return and principal value will fluctuate. Shares, when redeemed, may be worth more or less than their original cost. Current performance may be lower or higher than that shown here. Performance data current to the most recent month-end is available by calling (800) CRM-2883. The Fund’s expense ratio may fluctuate over time, and vary from the Fund’s expenses for the period covered by this report. Please refer to the financial highlights for a more current expense ratio.
CRM Funds |
||
21 |
CRM FUNDS CRM ALL CAP VALUE FUND COMPARISON OF CHANGE IN VALUE (Unaudited) (Continued) June 30, 2021 |
CRM All Cap Value Fund — Institutional Shares vs. Russell 3000® Index and Russell 3000® Value Index1

Average Annual Total Returns |
|||
1 Year |
5 Years |
10 Years |
|
All Cap Value Fund - Intitutional Shares2 |
54.66% |
12.56% |
10.21% |
Russell 3000® Index |
44.16% |
17.89% |
14.70% |
Russell 3000® Value Index |
45.40% |
11.99% |
11.54% |
Expense Ratios (per prospectus dated 10/28/20 - Gross: 1.26% Net: 1.21%3
|
1 |
The Fund is professionally managed, while the indices are unmanaged and are not available for investment. |
|
2 |
Total return would have been lower had certain fees and expenses not been waived and/or reimbursed. |
|
3 |
The investment adviser has a contractual obligation to waive a portion of its fees and to assume certain expenses of the Fund to the extent that the total annual fund operating expenses, excluding taxes, extraordinary expenses, brokerage commissions, interest and acquired fund fees and expenses, exceed 1.20% of average daily net assets of the share class. The expense limitation agreement is in effect until November 1, 2021 and the Board has approved the renewal of the agreement for an additional year until November 1, 2022. |
CRM Funds |
||
22 |
CRM FUNDS CRM ALL CAP VALUE FUND COMPARISON OF CHANGE IN VALUE (Unaudited) (Concluded) June 30, 2021 |
The line graph for Institutional Shares shows values based on an assumed investment of $1,000,000.
Performance quoted represents past performance and does not guarantee future results. Investment return and principal value will fluctuate. Shares, when redeemed, may be worth more or less than their original cost. Current performance may be lower or higher than that shown here. Performance data current to the most recent month-end is available by calling (800) CRM-2883. The Fund’s expense ratio may fluctuate over time, and vary from the Fund’s expenses for the period covered by this report. Please refer to the financial highlights for a more current expense ratio.
CRM Funds |
||
23 |
CRM FUNDS CRM LONG/SHORT OPPORTUNITIES FUND COMPARISON OF CHANGE IN VALUE (Unaudited) June 30, 2021 |
The following information compares the performance of the CRM Long/Short Opportunities Fund (“Fund”) with the performance of the S&P 500® Index. The S&P 500® Index is an index of 500 stocks chosen for market size, liquidity and industry grouping, among other factors. The S&P 500® is designed to be a leading indicator of U.S. equities and is meant to reflect the risk/return characteristics of the large cap universe. Total return for the Fund assumes reinvestment of dividends and distributions. The index returns reflect reinvestment of dividends but exclude the effect of any expenses, which have been deducted from the Fund’s return. The performance in the below table and graph does not reflect the deduction of taxes the shareholder would pay on Fund distributions or redemption of Fund shares.
The Fund will hold long equity securities that the Fund’s adviser has identified as undervalued and take short positions (through short sales) in equity securities that the Fund’s adviser has identified as overvalued or poised for underperformance. Short sales involve significant risks, including the risk that the Fund may have to cover its short position at a higher price than the short sale price, resulting in a loss. Short sales involve borrowing securities and then selling them, which may cause the value of the Fund’s shares to be more volatile than if the Fund did not borrow.
CRM Long/Short Opportunities Fund — Institutional Shares vs.
S&P 500® Index1

CRM Funds |
||
24 |
CRM FUNDS CRM LONG/SHORT OPPORTUNITIES FUND COMPARISON OF CHANGE IN VALUE (Unaudited) (Concluded) June 30, 2021 |
Average Annual |
||
1 Year |
Since |
|
Long/Short Opportunities Fund - Institutional Shares2 |
19.49% |
5.54% |
S&P 500® Index |
40.79% |
17.19% |
Expense Ratios (per prospectus dated 10/28/20) — Gross: 3.04% Net: 2.96%4
|
1 |
The Fund is professionally managed, while the index is unmanaged and is not available for investment. |
|
2 |
Total return would have been lower had certain fees and expenses not been waived and/or reimbursed. |
|
3 |
Return calculated since the Institutional Shares’ inception on August 16, 2016. |
|
4 |
The investment adviser has a contractual obligation to waive a portion of its fees and to assume certain expenses of the Fund to the extent that the total annual fund operating expenses, excluding taxes, extraordinary expenses, brokerage commissions, interest, dividends and interest expense relating to short sales and acquired fund fees and expenses, exceed 1.60% of average daily net assets of the Fund. The expense limitation agreement is in effect until November 1, 2021 and the Board has approved the renewal of the agreement for an additional year until November 1, 2022. |
The line graph for Institutional Shares shows values based on an assumed investment of $1,000,000.
Performance quoted represents past performance and does not guarantee future results. Investment return and principal value will fluctuate. Shares, when redeemed, may be worth more or less than their original cost. Current performance may be lower or higher than that shown here. Performance data current to the most recent month-end is available by calling (800) CRM-2883. The Fund’s expense ratio may fluctuate over time, and vary from the Fund’s expenses for the period covered by this report. Please refer to the financial highlights for a more current expense ratio.
CRM Funds |
||
25 |
CRM FUNDS EXPENSE DISCLOSURE (Unaudited)
|
DISCLOSURE OF FUND EXPENSES
The following Expense Tables are shown so that you can understand the impact of fees on your investment. All mutual funds have operating expenses. As a shareholder of a Fund, you incur ongoing costs, including management fees, shareholder servicing fees and other Fund expenses. A Fund’s expenses are expressed as a percentage of its average net assets. This figure is known as the expense ratio. The following examples are intended to help you understand the ongoing costs (in dollars) of investing in a Fund and to compare these costs with the ongoing costs of investing in other mutual funds. The examples are based on an investment of $1,000 made at the beginning of the period shown and held for the entire period (January 1, 2021 through June 30, 2021). The “Annualized Expense Ratio” reflects the actual expenses, net of fee waivers, where applicable, for the six-month period January 1, 2021 to June 30, 2021 and may be different from the expense ratio in the Financial Highlights which is for the fiscal year ended June 30, 2021.
The Expense Tables below illustrate your Fund’s expenses in two ways.
|
● |
Actual fund return. The first line of the table below provides information about actual account values and actual expenses. You may use the information in this line, together with the amount you invested, to estimate the expenses that you paid over the period. Simply divide your account value by $1,000 (for example, an $8,600 account value divided by $1,000 = 8.6), then multiply the result by the number in the first line under the heading entitled “Expenses Paid During Period” to estimate the expenses you paid on your account during the period. |
|
● |
Hypothetical 5% return. The second line of the table below provides information about hypothetical account values and hypothetical expenses based on the Fund’s actual expense ratio and an assumed rate of return of 5% per year before expenses, which is not the Fund’s actual return. The hypothetical account values and expenses may not be used to estimate the actual ending account balance or expenses you paid for the period. You may use this information to compare the ongoing cost of investing in the Fund and other funds. To do so, compare this 5% hypothetical example with the 5% hypothetical examples that appear in the shareholder reports of the other funds. |
Please note that the expenses shown in the tables are meant to highlight your ongoing costs only and do not reflect any transactional costs that may be levied by
CRM Funds |
||
26 |
CRM FUNDS EXPENSE DISCLOSURE (Unaudited) (Continued)
|
other funds, such as sales charges (loads), redemption fees, or exchange fees, if any. Therefore, the second line of the table is useful in comparing ongoing costs only, and will not help you determine the relative total cost of owning different funds. In addition, if these transactional costs were included, your costs would have been higher. The “Annualized Expense Ratio” reflects the actual expenses for the period indicated.
For the Six Months Ended June 30, 2021
Expense Table
Fund/Class |
Beginning |
Ending |
Annualized |
Expenses |
||||||||||||
CRM Small Cap Value Fund - Investor Shares |
||||||||||||||||
Actual Fund Return |
$ | 1,000.00 | $ | 1,180.30 | 1.12 | % | $ | 6.05 | ||||||||
Hypothetical (5% Return Before Expenses) |
$ | 1,000.00 | $ | 1,019.24 | 1.12 | % | $ | 5.61 | ||||||||
CRM Small Cap Value Fund - Institutional Shares |
||||||||||||||||
Actual Fund Return |
$ | 1,000.00 | $ | 1,181.70 | 0.88 | % | $ | 4.76 | ||||||||
Hypothetical (5% Return Before Expenses) |
$ | 1,000.00 | $ | 1,020.43 | 0.88 | % | $ | 4.41 | ||||||||
CRM Small/Mid Cap Value Fund - Investor Shares |
||||||||||||||||
Actual Fund Return |
$ | 1,000.00 | $ | 1,222.80 | 1.13 | % | $ | 6.23 | ||||||||
Hypothetical (5% Return Before Expenses) |
$ | 1,000.00 | $ | 1,019.19 | 1.13 | % | $ | 5.66 | ||||||||
CRM Small/Mid Cap Value Fund - Institutional Shares |
||||||||||||||||
Actual Fund Return |
$ | 1,000.00 | $ | 1,224.50 | 0.91 | % | $ | 5.02 | ||||||||
Hypothetical (5% Return Before Expenses) |
$ | 1,000.00 | $ | 1,020.28 | 0.91 | % | $ | 4.56 | ||||||||
CRM Mid Cap Value Fund - Investor Shares |
||||||||||||||||
Actual Fund Return |
$ | 1,000.00 | $ | 1,193.40 | 1.12 | % | $ | 6.09 | ||||||||
Hypothetical (5% Return Before Expenses) |
$ | 1,000.00 | $ | 1,019.24 | 1.12 | % | $ | 5.61 | ||||||||
CRM Funds |
||
27 |
CRM FUNDS EXPENSE DISCLOSURE (Unaudited) (Concluded)
|
Fund/Class |
Beginning |
Ending |
Annualized |
Expenses |
||||||||||||
CRM Mid Cap Value Fund - Institutional Shares |
||||||||||||||||
Actual Fund Return |
$ | 1,000.00 | $ | 1,194.90 | 0.91 | % | $ | 4.95 | ||||||||
Hypothetical (5% Return Before Expenses) |
$ | 1,000.00 | $ | 1,020.28 | 0.91 | % | $ | 4.56 | ||||||||
CRM All Cap Value Fund - Investor Shares |
||||||||||||||||
Actual Fund Return |
$ | 1,000.00 | $ | 1,159.30 | 1.36 | % | $ | 7.28 | ||||||||
Hypothetical (5% Return Before Expenses) |
$ | 1,000.00 | $ | 1,018.05 | 1.36 | % | $ | 6.80 | ||||||||
CRM All Cap Value Fund - Institutional Shares |
||||||||||||||||
Actual Fund Return |
$ | 1,000.00 | $ | 1,160.30 | 1.10 | % | $ | 5.89 | ||||||||
Hypothetical (5% Return Before Expenses) |
$ | 1,000.00 | $ | 1,019.34 | 1.10 | % | $ | 5.51 | ||||||||
CRM Long/Short Opportunities Fund - Institutional Shares |
||||||||||||||||
Actual Fund Return |
$ | 1,000.00 | $ | 1,009.60 | 2.99 | % | $ | 14.90 | ||||||||
Hypothetical (5% Return Before Expenses) |
$ | 1,000.00 | $ | 1,009.97 | 2.99 | % | $ | 14.90 | ||||||||
|
(1) |
The expense ratio for CRM Long/Short Opportunities Fund includes the impact of dividend expense and net interest expense (when applicable), on securities sold short. Excluding such expenses, the ratio of expenses to average net assets would have been 1.60%. |
|
(2) |
Expenses are equal to the Fund’s annualized expense ratio multiplied by the average account value over the period, multiplied by 181/ 365 (to reflect the most recent one-half year period). |
CRM Funds |
||
28 |
CRM FUNDS DISCLOSURE OF PORTFOLIO HOLDINGS (Unaudited)
|
PORTFOLIO HOLDINGS
June 30, 2021
The following tables present a summary of the portfolio holdings of each of the CRM Funds as a percentage of their total investments, before short-term investments held as collateral for loaned securities.
CRM Small Cap Value Fund- |
|
Common Stock |
|
Financials |
23.3% |
Industrials |
22.0 |
Consumer Discretionary |
18.1 |
Real Estate |
8.5 |
Technology |
8.4 |
Materials |
4.6 |
Energy |
3.6 |
Consumer Staples |
3.5 |
Utilities |
3.0 |
Health Care |
2.0 |
Communications |
1.8 |
Short-Term Investments |
1.2 |
100.0% |
|
CRM Small/Mid Cap Value Fund- |
|
Common Stock |
|
Industrials |
25.7% |
Financials |
17.1 |
Consumer Discretionary |
14.1 |
Materials |
8.7 |
Technology |
7.8 |
Health Care |
6.8 |
Energy |
5.9 |
Consumer Staples |
4.2 |
Real Estate |
4.2 |
Utilities |
3.0 |
Short-Term Investments |
2.5 |
100.0% |
|
CRM Mid Cap Value Fund- |
|
Common Stock |
|
Industrials |
23.1% |
Financials |
13.7 |
Technology |
12.9 |
Consumer Discretionary |
11.9 |
Health Care |
9.2 |
Materials |
8.7 |
Utilities |
6.1 |
Energy |
4.9 |
Real Estate |
3.1 |
Consumer Staples |
1.5 |
Short-Term Investments |
4.9 |
100.0% |
|
CRM All Cap Value Fund- |
|
Common Stock |
|
Financials |
20.8% |
Industrials |
19.8 |
Technology |
15.8 |
Consumer Discretionary |
14.4 |
Health Care |
9.5 |
Energy |
4.8 |
Materials |
4.4 |
Consumer Staples |
2.5 |
Real Estate |
2.3 |
Communications |
2.3 |
Utilities |
2.0 |
Short-Term Investments |
1.4 |
100.0% |
|
CRM Funds |
||
29 |
CRM FUNDS DISCLOSURE OF PORTFOLIO HOLDINGS (Unaudited) (Concluded)
|
The following tables present a summary of the portfolio holdings of the CRM Long/Short Opportunities Fund as a percentage of its total net assets.
CRM Long/Short Opportunities Fund- |
|
Common Stock |
|
Consumer Discretionary |
24.7% |
Industrials |
21.1 |
Technology |
15.4 |
Health Care |
8.3 |
Financials |
7.2 |
Energy |
5.8 |
Communications |
5.1 |
Utilities |
3.4 |
Consumer Staples |
3.3 |
Materials |
2.0 |
Short-Term Investments |
3.5 |
Common Stock Sold Short |
|
Utilities |
(0.6) |
Energy |
(0.7) |
Financials |
(0.3) |
Health Care |
(1.2) |
Communications |
(4.0) |
Technology |
(5.8) |
Industrials |
(7.6) |
Consumer Staples |
(9.1) |
Consumer Discretionary |
(9.2) |
61.3% |
|
Portfolio holdings are subject to change at any time.
CRM Funds |
||
30 |
CRM FUNDS CRM SMALL CAP VALUE FUND SCHEDULE OF INVESTMENTS June 30, 2021 |
Shares |
Value |
|||||||
COMMON STOCK — 98.6% |
||||||||
Communications — 1.8% |
||||||||
Telecommunications — 1.8% |
||||||||
| 416,995 | Vonage Holdings Corp.1 |
$ | 6,008,898 | |||||
Consumer Discretionary — 18.1% |
||||||||
Apparel & Textile Products — 3.9% |
||||||||
| 302,138 | Steven Madden Ltd. |
13,221,559 | ||||||
Consumer Services — 3.5% |
||||||||
| 1,280,123 | Regis Corp.1 |
11,981,951 | ||||||
Home Construction — 4.2% |
||||||||
| 252,814 | JELD-WEN Holding, Inc.1 |
6,638,896 | ||||||
| 140,334 | Skyline Champion Corp.1 |
7,479,802 | ||||||
| 14,118,698 | ||||||||
Leisure Facilities & Services — 2.1% |
||||||||
| 143,109 | BJ’s Restaurants, Inc.1 |
7,032,376 | ||||||
Wholesale - Discretionary — 4.4% |
||||||||
| 450,986 | G-III Apparel Group Ltd.1 |
14,819,400 | ||||||
Total Consumer Discretionary |
61,173,984 | |||||||
Consumer Staples — 3.5% |
||||||||
Beverages — 2.5% |
||||||||
| 505,469 | Primo Water Corp. |
8,456,496 | ||||||
Household Products — 1.0% |
||||||||
| 116,800 | Clearwater Paper Corp.1 |
3,383,696 | ||||||
Total Consumer Staples |
11,840,192 | |||||||
Energy — 3.6% |
||||||||
Oil & Gas Services & Equipment — 3.6% |
||||||||
| 467,554 | ChampionX Corp.1 |
11,992,760 | ||||||
Financials — 23.2% |
||||||||
Banking — 18.2% |
||||||||
| 150,947 | Amalgamated Financial Corp. |
2,359,302 | ||||||
| 315,860 | Associated Banc-Corp. |
6,468,813 | ||||||
| 269,754 | BancorpSouth Bank |
7,642,131 | ||||||
| 179,707 | BankUnited, Inc. |
7,671,692 | ||||||
Shares |
Value |
|||||||
Financials — (continued) |
||||||||
Banking — (continued) |
||||||||
| 344,904 | Central Pacific Financial Corp. |
$ | 8,988,198 | |||||
| 305,106 | Great Western Bancorp, Inc. |
10,004,426 | ||||||
| 278,723 | Hancock Whitney Corporation |
12,386,450 | ||||||
| 413,336 | Investors Bancorp, Inc. |
5,894,171 | ||||||
| 61,415,183 | ||||||||
Institutional Financial Services — 0.8% |
||||||||
| 46,883 | Moelis & Co., Class A |
2,667,174 | ||||||
Insurance — 2.7% |
||||||||
| 246,400 | James River Group Holdings, Ltd. |
9,244,928 | ||||||
Specialty Finance — 1.5% |
||||||||
| 89,422 | Stewart Information Services Corp. |
5,069,333 | ||||||
Total Financials |
78,396,618 | |||||||
Health Care — 2.0% |
||||||||
Medical Equipment & Devices — 2.0% |
||||||||
| 157,750 | Envista Holdings Corp.1 |
6,816,378 | ||||||
Industrials — 21.9% |
||||||||
Aerospace & Defense — 6.1% |
||||||||
| 191,880 | Barnes Group, Inc. |
9,833,850 | ||||||
| 213,177 | Kaman Corp. |
10,744,121 | ||||||
| 20,577,971 | ||||||||
Commercial Support Services — 3.4% |
||||||||
| 122,157 | Clean Harbors, Inc.1 |
11,377,703 | ||||||
Electrical Equipment — 3.7% |
||||||||
| 207,505 | SPX Corp.1 |
12,674,405 | ||||||
Industrial Intermediate Products — 3.5% |
||||||||
| 50,104 | Valmont Industries, Inc. |
11,827,049 | ||||||
Industrial Support Services — 1.9% |
||||||||
| 70,832 | Applied Industrial Technologies, Inc. |
6,449,962 | ||||||
See accompanying notes to financial statements. |
CRM Funds |
|
31 |
||
CRM FUNDS CRM SMALL CAP VALUE FUND SCHEDULE OF INVESTMENTS (Continued) June 30, 2021 |
Shares |
Value |
|||||||
Industrials — (continued) |
||||||||
Transportation & Logistics — 3.3% |
||||||||
| 183,484 | Kirby Corp.1 |
$ | 11,126,470 | |||||
Total Industrials |
74,033,560 | |||||||
Materials — 4.6% |
||||||||
Chemicals — 4.6% |
||||||||
| 113,758 | Ferro Corp.1 |
2,453,760 | ||||||
| 94,078 | HB Fuller Co. |
5,984,302 | ||||||
| 35,030 | Rogers Corp.1 |
7,034,024 | ||||||
Total Materials |
15,472,086 | |||||||
Real Estate — 8.5% |
||||||||
REIT — 8.5% |
||||||||
| 294,355 | American Assets Trust, Inc. |
10,976,498 | ||||||
| 223,467 | Corporate Office Properties Trust |
6,254,841 | ||||||
| 276,351 | Urban Edge Properties |
5,278,304 | ||||||
| 334,459 | Xenia Hotels & Resorts, Inc.1 |
6,264,417 | ||||||
Total Real Estate |
28,774,060 | |||||||
Technology — 8.4% |
||||||||
Software — 2.8% |
||||||||
| 87,029 | Agilysys, Inc.1 |
4,949,339 | ||||||
| 58,232 | Envestnet, Inc.1 |
4,417,480 | ||||||
| 9,366,819 | ||||||||
Technology Services — 5.6% |
||||||||
| 140,577 | Open Lending Corp.1 |
6,057,463 | ||||||
| 869,894 | PAE, Inc.1 |
7,742,056 | ||||||
| 464,851 | Paya Holdings, Inc.1 |
5,122,658 | ||||||
| 18,922,177 | ||||||||
Total Technology |
28,288,996 | |||||||
Utilities — 3.0% |
||||||||
Electric Utilities — 2.1% |
||||||||
| 107,357 | Black Hills Corp. |
7,045,840 | ||||||
Gas & Water Utilities — 0.9% |
||||||||
| 50,960 | SJW Group |
3,225,768 | ||||||
Total Utilities |
10,271,608 | |||||||
TOTAL COMMON STOCK (Cost $256,120,949) |
333,069,140 | |||||||
Shares |
Value |
|||||||
SHORT-TERM INVESTMENTS — 1.2% |
||||||||
| 2,011,219 | Blackrock Liquity Funds T-Fund, Institutional Series, 0.01%2 |
$ | 2,011,219 | |||||
| 2,011,216 | Federated Hermes Treasury Obligations Fund, Institutional Series, 0.01%2 |
2,011,216 | ||||||
TOTAL SHORT-TERM INVESTMENTS (Cost $4,022,435) |
4,022,435 | |||||||
TOTAL INVESTMENTS — 99.8% (Cost $260,143,384) |
337,091,575 | |||||||
OTHER ASSETS IN EXCESS OF LIABILITIES — 0.2% |
627,175 | |||||||
NET ASSETS — 100.0% |
$ | 337,718,750 | ||||||
See accompanying notes to financial statements. |
CRM Funds |
|
32 |
||
CRM FUNDS CRM SMALL CAP VALUE FUND SCHEDULE OF INVESTMENTS (Concluded) June 30, 2021 |
Assets |
Level 1 |
Level 2 |
Level 3 |
Investments |
||||||||||||
Common Stock |
$ | 333,069,140 | $ | — | $ | — | $ | 333,069,140 | ||||||||
Short-Term Investments |
4,022,435 | — | — | 4,022,435 | ||||||||||||
Total |
$ | 337,091,575 | $ | — | $ | — | $ | 337,091,575 | ||||||||
There were no transfers into or out of Level 3 related to securities held at June 30, 2021.
|
1 |
Non-income producing security. |
|
2 |
Rate disclosed is the seven day effective yield as of June 30, 2021. |
See accompanying notes to financial statements. |
CRM Funds |
|
33 |
||
CRM FUNDS CRM SMALL/MID CAP VALUE FUND SCHEDULE OF INVESTMENTS June 30, 2021 |
Shares |
Value |
|||||||
COMMON STOCK — 97.6% |
||||||||
Consumer Discretionary — 14.1% |
||||||||
Home Construction — 2.1% |
||||||||
| 126,643 | Skyline Champion Corp.1 |
$ | 6,750,072 | |||||
Leisure Facilities & Services — 1.4% |
||||||||
| 28,711 | Marriott Vacations Worldwide Corp.1 |
4,573,662 | ||||||
Retail - Discretionary — 2.2% |
||||||||
| 10,067 | RH1 |
6,835,493 | ||||||
Wholesale - Discretionary — 8.4% |
||||||||
| 401,243 | G-III Apparel Group Ltd.1 |
13,184,846 | ||||||
| 264,006 | LKQ Corp.1 |
12,994,375 | ||||||
| 26,179,221 | ||||||||
Total Consumer Discretionary |
44,338,448 | |||||||
Consumer Staples — 4.2% |
||||||||
Beverages — 2.7% |
||||||||
| 499,846 | Primo Water Corp.2 |
8,362,424 | ||||||
Food — 1.5% |
||||||||
| 168,556 | Nomad Foods Ltd.1 |
4,765,078 | ||||||
Total Consumer Staples |
13,127,502 | |||||||
Energy — 5.9% |
||||||||
Oil & Gas Producers — 2.2% |
||||||||
| 42,628 | Pioneer Natural Resources Co. |
6,927,903 | ||||||
Oil & Gas Services & Equipment — 2.5% |
||||||||
| 303,654 | ChampionX Corp.1 |
7,788,724 | ||||||
Renewable Energy — 1.2% |
||||||||
| 66,924 | Sunrun, Inc.1 |
3,733,021 | ||||||
Total Energy |
18,449,648 | |||||||
Financials — 17.2% |
||||||||
Banking — 7.0% |
||||||||
| 181,205 | BancorpSouth Bank |
5,133,538 | ||||||
| 259,326 | Great Western Bancorp, Inc. |
8,503,299 | ||||||
| 153,724 | Webster Financial Corp. |
8,199,638 | ||||||
| 21,836,475 | ||||||||
Financials — (continued) |
||||||||
Insurance — 10.2% |
||||||||
| 99,721 | American Financial Group, Inc. |
$ | 12,437,203 | |||||
| 30,993 | Assurant, Inc. |
4,840,487 | ||||||
| 238,528 | James River Group Holdings, Ltd. |
8,949,571 | ||||||
| 77,107 | W.R. Berkley Corp. |
5,739,074 | ||||||
| 31,966,335 | ||||||||
Total Financials |
53,802,810 | |||||||
Health Care — 6.8% |
||||||||
Health Care Facilities & Services — 2.4% |
||||||||
| 351,204 | Ortho Clincial Diagnostics Holdings PLC1,3 |
7,519,278 | ||||||
Medical Equipment & Devices — 4.4% |
||||||||
| 6,956 | Bio-Rad Laboratories, Inc., Class A1 |
4,481,681 | ||||||
| 215,353 | Envista Holdings Corp.1 |
9,305,403 | ||||||
| 13,787,084 | ||||||||
Total Health Care |
21,306,362 | |||||||
Industrials — 25.7% |
||||||||
Aerospace & Defense — 4.4% |
||||||||
| 193,438 | Kaman Corp. |
9,749,275 | ||||||
| 9,389 | Teledyne Technologies, Inc.1 |
3,932,395 | ||||||
| 13,681,670 | ||||||||
Commercial Support Services — 4.9% |
||||||||
| 95,495 | Clean Harbors, Inc.1 |
8,894,404 | ||||||
| 133,445 | Terminix Global Holdings, Inc.1 |
6,366,661 | ||||||
| 15,261,065 | ||||||||
Electrical Equipment — 5.7% |
||||||||
| 429,287 | Hayward Holdings, Inc.1,2 |
11,170,047 | ||||||
| 214,276 | nVent Electric PLC3 |
6,693,982 | ||||||
| 17,864,029 | ||||||||
See accompanying notes to financial statements. |
CRM Funds |
|
34 |
||
CRM FUNDS CRM SMALL/MID CAP VALUE FUND SCHEDULE OF INVESTMENTS (Continued) June 30, 2021 |
Shares |
Value |
|||||||
Industrials — (continued) |
||||||||
Industrial Intermediate Products — 3.6% |
||||||||
| 47,845 | Valmont Industries, Inc. |
$ | 11,293,812 | |||||
Industrial Support Services — 1.6% |
||||||||
| 56,485 | Applied Industrial Technologies, Inc. |
5,143,524 | ||||||
Machinery — 2.7% |
||||||||
| 63,688 | Regal-Beloit Corp. |
8,502,985 | ||||||
Transportation & Logistics — 2.8% |
||||||||
| 144,128 | Kirby Corp.1 |
8,739,922 | ||||||
Total Industrials |
80,487,007 | |||||||
Materials — 8.7% |
||||||||
Chemicals — 4.7% |
||||||||
| 81,486 | Ashland Global Holdings, Inc. |
7,130,025 | ||||||
| 87,024 | RPM International, Inc. |
7,717,289 | ||||||
| 14,847,314 | ||||||||
Construction Materials — 4.0% |
||||||||
| 29,222 | Carlisle Cos., Inc. |
5,592,506 | ||||||
| 47,636 | Eagle Materials, Inc. |
6,769,552 | ||||||
| 12,362,058 | ||||||||
Total Materials |
27,209,372 | |||||||
Real Estate — 4.2% |
||||||||
REIT — 4.2% |
||||||||
| 196,712 | American Assets Trust, Inc. |
7,335,390 | ||||||
| 205,614 | Corporate Office Properties Trust |
5,755,136 | ||||||
Total Real Estate |
13,090,526 | |||||||
Technology — 7.8% |
||||||||
Software — 5.7% |
||||||||
| 242,917 | Clarivate PLC1,3 |
6,687,505 | ||||||
| 29,376 | PTC, Inc.1 |
4,149,654 | ||||||
| 165,768 | Tenable Holdings, Inc.1 |
6,854,507 | ||||||
| 17,691,666 | ||||||||
Technology — (continued) |
||||||||
Technology Services — 2.1% |
||||||||
| 701,520 | Multiplan Corp.1,2 |
$ | 6,678,470 | |||||
Total Technology |
24,370,136 | |||||||
Utilities — 3.0% |
||||||||
Electric Utilities — 1.0% |
||||||||
| 50,904 | Black Hills Corp. |
3,340,830 | ||||||
Gas & Water Utilities — 2.0% |
||||||||
| 251,274 | Nisource, Inc. |
6,156,213 | ||||||
Total Utilities |
9,497,043 | |||||||
TOTAL COMMON STOCK (Cost $202,278,435) |
305,678,854 | |||||||
SHORT-TERM INVESTMENTS — 2.5% |
||||||||
| 3,963,432 | BlackRock Liquidity Funds T-Fund, Institutional Series, 0.01%4 |
3,963,432 | ||||||
| 3,963,433 | Federated Hermes Treasury Obligations Fund, Institutional Series, 0.01%4 |
3,963,433 | ||||||
TOTAL SHORT-TERM INVESTMENTS (Cost $7,926,865) |
7,926,865 | |||||||
TOTAL INVESTMENTS BEFORE SHORT-TERM INVESTMENTS HELD AS COLLATERAL FOR LOANED SECURITIES — 100.1% (Cost $210,205,300) |
313,605,719 | |||||||
SHORT-TERM INVESTMENTS HELD AS COLLATERAL FOR LOANED SECURITIES — 4.2% |
||||||||
TIME DEPOSITS — 2.0% |
||||||||
| 550,000 | Australia & New Zealand, 0.07%, 7/1/2021 |
550,000 | ||||||
| 580,000 | Barclays Bank PLC, 0.10%, 7/1/2021 |
580,000 | ||||||
| 550,000 | BNP Paribas, 0.06%, 7/1/2021 |
550,000 | ||||||
See accompanying notes to financial statements. |
CRM Funds |
|
35 |
||
CRM FUNDS CRM SMALL/MID CAP VALUE FUND SCHEDULE OF INVESTMENTS (Continued) June 30, 2021 |
Shares |
Value |
|||||||
TIME DEPOSITS — (continued) |
||||||||
| 420,000 | Canadian Imperial Bank of Canada, 0.05%, 7/1/2021 |
$ | 420,000 | |||||
| 580,000 | Credit Agricole CIB, 0.06%, 7/1/2021 |
580,000 | ||||||
| 370,000 | DNB Bank ASA, 0.03%, 7/1/2021 |
370,000 | ||||||
| 540,000 | Landesbank Baden-Wurttemberg, 0.05%, 7/1/2021 |
540,000 | ||||||
| 580,000 | Mizuho Bank Ltd., 0.08%, 7/1/2021 |
580,000 | ||||||
| 580,000 | National Australia Bank, 0.05%, 7/1/2021 |
580,000 | ||||||
| 570,000 | Royal Bank of Canada, 0.04%, 7/1/2021 |
570,000 | ||||||
| 530,000 | Skandinaviska Enskilda, 0.03%, 7/1/2021 |
530,000 | ||||||
| 580,000 | Svenska Handelsbanken, 0.03%, 7/1/2021 |
580,000 | ||||||
TOTAL TIME DEPOSITS |
6,430,000 | |||||||
MONEY MARKET FUNDS — 1.9% |
||||||||
| 1,186,000 | BlackRock Liquidity FedFund |
1,186,000 | ||||||
| 952,000 | Federated Government Obligations Fund |
952,000 | ||||||
| 880,000 | Goldman Sachs Financial Square Government Fund |
880,000 | ||||||
| 952,000 | Invesco Short-Term Investment Trust Government & Agency Portfolio |
952,000 | ||||||
| 1,030,000 | JPMorgan US Government Money Market Fund |
1,030,000 | ||||||
| 820,000 | Morgan Stanley Institutional Liquidity Funds |
820,000 | ||||||
TOTAL MONEY MARKET FUNDS |
5,820,000 | |||||||
Principal |
Value |
|||||||
REPURCHASE AGREEMENTS— 0.3% |
||||||||
| $ | 932,284 | With TD Securities USA, LLC.: at 0.05%, dated 6/30/21, to be repurchased on 7/1/21, repurchase price $932,285 (collateralized by US Treasury Securities, par values ranging from $84,369 - $266,909, coupon rates ranging from 0.13% to 2.63%, 9/30/21 - 2/29/24; Total Market Value $950,930) |
$ | 932,284 | ||||
TOTAL REPURCHASE AGREEMENTS |
932,284 | |||||||
TOTAL SHORT-TERM INVESTMENTS HELD AS COLLATERAL FOR LOANED SECURITIES – (Cost $13,182,284) |
13,182,284 | |||||||
TOTAL INVESTMENTS — 104.3% (Cost $223,387,584) |
326,788,003 | 5 | ||||||
LIABILITIES IN EXCESS OF OTHER ASSETS — (4.3)% |
(13,562,735 | ) | ||||||
NET ASSETS — 100.0% |
$ | 313,225,268 | ||||||
See accompanying notes to financial statements. |
CRM Funds |
|
36 |
||
CRM FUNDS CRM SMALL/MID CAP VALUE FUND SCHEDULE OF INVESTMENTS (Concluded) June 30, 2021 |
A Summary of inputs used to value the Fund’s investments as of June 30, 2021 is as follows (See Note 2 in Notes to Financial Statements):
Assets |
Level 1 |
Level 2 |
Level 3 |
Investments |
||||||||||||
Common Stock |
$ | 305,678,854 | — | — | $ | 305,678,854 | ||||||||||
Short-Term Investments |
7,926,865 | — | — | 7,926,865 | ||||||||||||
Short-Term Investments Held As Collateral For Loaned Securities |
5,820,000 | $ | 7,362,284 | — | 13,182,284 | |||||||||||
Total |
$ | 319,425,719 | $ | 7,362,284 | — | $ | 326,788,003 | |||||||||
There were no transfers into or out of Level 3 related to securities held at June 30, 2021.
|
1 |
Non-income producing security. |
|
2 |
Security partially or fully on loan. |
|
3 |
PLC – Public Limited Company |
|
4 |
Rate disclosed is the seven day effective yield as of June 30, 2021. |
|
5 |
At June 30, 2021, the market value of securities on loan for CRM Small/Mid Cap Value Fund was $13,134,738. In the event that the collateral received is insufficient to cover the value of the loaned securities and provided such collateral shortfall is not the result of investment losses, the Fund’s securities lending agent, The Bank of New York Mellon, has agreed to pay the amount of the shortfall to the Fund, or at its discretion, replace the loaned securities. |
See accompanying notes to financial statements. |
CRM Funds |
|
37 |
||
CRM FUNDS CRM MID CAP VALUE FUND SCHEDULE OF INVESTMENTS June 30, 2021 |
Shares |
Value |
|||||||
COMMON STOCK — 97.0% |
||||||||
Consumer Discretionary — 12.1% |
||||||||
Apparel & Textile Products — 3.8% |
||||||||
| 384,824 | Steven Madden Ltd. |
$ | 16,839,898 | |||||
Leisure Facilities & Services — 1.5% |
||||||||
| 40,140 | Marriott Vacations Worldwide Corp.1 |
6,394,302 | ||||||
Retail - Discretionary — 2.0% |
||||||||
| 243,927 | Nordstrom, Inc.1 |
8,920,410 | ||||||
Wholesale - Discretionary — 4.8% |
||||||||
| 428,889 | LKQ Corp.1 |
21,109,917 | ||||||
Total Consumer Discretionary |
53,264,527 | |||||||
Consumer Staples — 1.5% |
||||||||
Food — 1.5% |
||||||||
| 236,666 | Nomad Foods Ltd.1 |
6,690,548 | ||||||
Energy — 5.0% |
||||||||
Oil & Gas Producers — 2.1% |
||||||||
| 57,805 | Pioneer Natural Resources Co. |
9,394,469 | ||||||
Oil & Gas Services & Equipment — 2.9% |
||||||||
| 495,887 | ChampionX Corp.1 |
12,719,501 | ||||||
Total Energy |
22,113,970 | |||||||
Financials — 14.0% |
||||||||
Banking — 3.9% |
||||||||
| 255,709 | BancorpSouth Bank |
7,244,236 | ||||||
| 187,877 | Webster Financial Corp. |
10,021,359 | ||||||
| 17,265,595 | ||||||||
Institutional Financial Services — 2.7% |
||||||||
| 142,731 | State Street Corp. |
11,743,907 | ||||||
Insurance — 7.4% |
||||||||
| 140,500 | American Financial Group, Inc. |
17,523,161 | ||||||
| 43,196 | Assurant, Inc. |
6,746,351 | ||||||
| 110,294 | W.R. Berkley Corp. |
8,209,182 | ||||||
| 32,478,694 | ||||||||
Total Financials |
61,488,196 | |||||||
Health Care — 9.4% |
||||||||
Health Care Facilities & Services — 2.4% |
||||||||
| 498,275 | Ortho Clincial Diagnostics Holdings PLC1,2 |
$ | 10,668,068 | |||||
Medical Equipment & Devices — 7.0% |
||||||||
| 281,145 | Avantor, Inc.1 |
9,983,459 | ||||||
| 9,692 | Bio-Rad Laboratories, Inc., Class A1 |
6,244,459 | ||||||
| 331,531 | Envista Holdings Corp.1 |
14,325,454 | ||||||
| 30,553,372 | ||||||||
Total Health Care |
41,221,440 | |||||||
Industrials — 23.6% |
||||||||
Aerospace & Defense — 3.6% |
||||||||
| 14,091 | Teledyne Technologies, Inc.1 |
5,901,734 | ||||||
| 81,000 | Woodward, Inc. |
9,953,280 | ||||||
| 15,855,014 | ||||||||
Commercial Support Services — 2.0% |
||||||||
| 187,508 | Terminix Global Holdings, Inc.1 |
8,946,007 | ||||||
Electrical Equipment — 9.6% |
||||||||
| 69,245 | AMETEK, Inc. |
9,244,208 | ||||||
| 607,490 | Hayward Holdings, Inc.1,3 |
15,806,889 | ||||||
| 298,501 | nVent Electric PLC2 |
9,325,170 | ||||||
| 94,614 | Otis Worldwide Corp. |
7,736,587 | ||||||
| 42,112,854 | ||||||||
Industrial Intermediate Products — 3.6% |
||||||||
| 67,735 | Valmont Industries, Inc. |
15,988,846 | ||||||
Industrial Support Services — 1.9% |
||||||||
| 90,745 | Applied Industrial Technologies, Inc. |
8,263,240 | ||||||
Machinery — 2.9% |
||||||||
| 93,495 | Regal-Beloit Corp. |
12,482,517 | ||||||
Total Industrials |
103,648,478 | |||||||
See accompanying notes to financial statements. |
CRM Funds |
|
38 |
||
CRM FUNDS CRM MID CAP VALUE FUND SCHEDULE OF INVESTMENTS (Continued) June 30, 2021 |
Shares |
Value |
|||||||
Materials — 8.9% |
||||||||
Chemicals — 7.1% |
||||||||
| 91,370 | Ashland Global Holdings, Inc. |
$ | 7,994,875 | |||||
| 246,431 | Corteva, Inc. |
10,929,215 | ||||||
| 137,868 | RPM International, Inc. |
12,226,134 | ||||||
| 31,150,224 | ||||||||
Construction Materials — 1.8% |
||||||||
| 40,884 | Carlisle Cos., Inc. |
7,824,380 | ||||||
Total Materials |
38,974,604 | |||||||
Real Estate — 3.2% |
||||||||
REIT — 3.2% |
||||||||
| 138,175 | American Assets Trust, Inc. |
5,152,546 | ||||||
| 190,818 | Highwoods Properties, Inc. |
8,619,249 | ||||||
Total Real Estate |
13,771,795 | |||||||
Technology — 13.1% |
||||||||
Semiconductors — 2.6% |
||||||||
| 75,365 | Microchip Technology, Inc. |
11,285,155 | ||||||
Software — 5.8% |
||||||||
| 408,783 | Clarivate PLC1,2 |
11,253,796 | ||||||
| 40,957 | PTC, Inc.1 |
5,785,586 | ||||||
| 205,322 | Tenable Holdings, Inc.1 |
8,490,065 | ||||||
| 25,529,447 | ||||||||
Technology Services — 4.7% |
||||||||
| 42,063 | Morningstar, Inc. |
10,814,818 | ||||||
| 1,043,356 | Multiplan Corp.1,3 |
9,932,749 | ||||||
| 20,747,567 | ||||||||
Total Technology |
57,562,169 | |||||||
Utilities — 6.2% |
||||||||
Electric Utilities — 2.1% |
||||||||
| 139,422 | Black Hills Corp. |
9,150,266 | ||||||
Utilities — (continued) |
||||||||
Gas & Water Utilities — 4.1% |
||||||||
| 75,347 | Atmos Energy Corp. |
$ | 7,241,600 | |||||
| 446,975 | Nisource, Inc. |
10,950,888 | ||||||
| 18,192,488 | ||||||||
Total Utilities |
27,342,754 | |||||||
TOTAL COMMON STOCK (Cost $287,064,558) |
426,078,481 | |||||||
SHORT-TERM INVESTMENTS — 5.0% |
||||||||
| 10,870,220 | BlackRock Liquidity Funds T-Fund, Institutional Series, 0.01%4 |
10,870,220 | ||||||
| 10,870,221 | Federated Hermes Treasury Obligations Fund, Institutional Series, 0.01%4 |
10,870,221 | ||||||
TOTAL SHORT-TERM INVESTMENTS (Cost $21,740,441) |
21,740,441 | |||||||
TOTAL INVESTMENTS BEFORE SHORT-TERM INVESTMENTS HELD AS COLLATERAL FOR LOANED SECURITIES – 102.0% (Cost $308,804,999) |
447,818,922 | |||||||
SHORT-TERM INVESTMENTS HELD AS COLLATERAL FOR LOANED SECURITIES — 5.8% |
||||||||
TIME DEPOSITS — 3.3% |
||||||||
| 1,070,000 | Australia & New Zealand, 0.07%, July 1, 2021 |
1,070,000 | ||||||
| 1,140,000 | Barclays Bank PLC, 0.10%, July 1, 20212 |
1,140,000 | ||||||
| 1,080,000 | BNP Paribas, 0.06%, July 1, 2021 |
1,080,000 | ||||||
| 830,000 | Canadian Imperial Bank of Canada, 0.05%, July 1, 2021 |
830,000 | ||||||
See accompanying notes to financial statements. |
CRM Funds |
|
39 |
||
CRM FUNDS CRM MID CAP VALUE FUND SCHEDULE OF INVESTMENTS (Continued) June 30, 2021 |
Shares |
Value |
|||||||
TIME DEPOSITS — (continued) |
||||||||
| 1,140,000 | Credit Agricole CIB, 0.06%, July 1, 2021 |
$ | 1,140,000 | |||||
| 1,090,000 | DNB Bank ASA, 0.03%, July 1, 2021 |
1,090,000 | ||||||
| 850,000 | DZ Bank AG, 0.03%, July 1, 2021 |
850,000 | ||||||
| 1,050,000 | Landesbank Baden-Wurttemberg, 0.05%, July 1, 2021 |
1,050,000 | ||||||
| 1,140,000 | Mizuho Bank Ltd., 0.08%, July 1, 2021 |
1,140,000 | ||||||
| 1,140,000 | National Australia Bank, 0.05%, July 1, 2021 |
1,140,000 | ||||||
| 1,110,000 | Royal Bank of Canada, 0.04%, July 1, 2021 |
1,110,000 | ||||||
| 1,040,000 | Skandinaviska Enskilda, 0.03%, July 1, 2021 |
1,040,000 | ||||||
| 590,000 | Societe Generale SA, 0.07%, July 1, 2021 |
590,000 | ||||||
| 1,130,000 | Svenska Handelsbanken, 0.03%, July 1, 2021 |
1,130,000 | ||||||
TOTAL TIME DEPOSITS (Cost $14,400,000) |
14,400,000 | |||||||
MONEY MARKET FUNDS — 1.8% |
||||||||
| 2,104,000 | BlackRock Liquidity FedFund |
2,104,000 | ||||||
| 639,000 | Federated Government Obligations Fund |
639,000 | ||||||
| 499,000 | Goldman Sachs Financial Square Government Fund |
499,000 | ||||||
| 2,189,000 | Invesco Short-Term Investment Trust Government & Agency Portfolio |
2,189,000 | ||||||
| 1,539,000 | JPMorgan US Government Money Market Fund |
1,539,000 | ||||||
MONEY MARKET FUNDS — (continued) |
||||||||
| 990,000 | Morgan Stanley Institutional Liquidity Funds |
$ | 990,000 | |||||
TOTAL MONEY MARKET FUNDS (Cost $7,960,000) |
7,960,000 | |||||||
Principal |
||||||||
REPURCHASE AGREEMENTS — 0.7% |
||||||||
| $ | 3,237,968 | With Citibank: at 0.05%, dated 6/30/21, to be repurchased on 7/1/21, repurchase price $3,237,973 (collateralized by US Treasury Securities, par values ranging from $1 - $1,204,509, coupon rates ranging from 0.00% to 7.25%, 7/31/21 - 2/15/51; Total Market Value $3,302,727) |
3,237,968 | |||||
TOTAL REPURCHASE AGREEMENTS (Cost $3,237,968) |
3,237,968 | |||||||
TOTAL SHORT-TERM INVESTMENTS HELD AS COLLATERAL FOR LOANED SECURITIES (Cost $25,597,968) |
25,597,968 | |||||||
TOTAL INVESTMENTS — 107.8% (Cost $334,402,967) |
473,416,890 | 5 | ||||||
LIABILITIES IN EXCESS OF OTHER ASSETS — (7.8)% |
(34,359,104 | ) | ||||||
NET ASSETS — 100.0% |
$ | 439,057,786 | ||||||
See accompanying notes to financial statements. |
CRM Funds |
|
40 |
||
CRM FUNDS CRM MID CAP VALUE FUND SCHEDULE OF INVESTMENTS (Concluded) June 30, 2021 |
A Summary of inputs used to value the Fund’s investments as of June 30, 2021 is as follows (See Note 2 in Notes to Financial Statements):
Assets |
Level 1 |
Level 2 |
Level 3 |
Investments |
||||||||||||
Common Stock |
$ | 426,078,481 | — | — | $ | 426,078,481 | ||||||||||
Short-Term Investments |
21,740,441 | — | — | 21,740,441 | ||||||||||||
Short-Term Investments Held As Collateral For Loaned Securities |
7,960,000 | $ | 17,637,968 | — | 25,597,968 | |||||||||||
Total |
$ | 455,778,922 | $ | 17,637,968 | — | $ | 473,416,890 | |||||||||
There were no transfers into or out of Level 3 related to securities held at June 30, 2021.
|
1 |
Non-income producing security. |
|
2 |
PLC – Public Limited Company. |
|
3 |
Security partially or fully on loan. |
|
4 |
Rate disclosed is the seven day effective yield as of June 30, 2021. |
|
5 |
At June 30, 2021, the market value of securities on loan for CRM Mid Cap Value Fund was $25,739,639. In the event that the collateral received is insufficient to cover the value of the loaned securities and provided such collateral shortfall is no the result of investment losses, the Fund’s securities lending agent, The Bank of New York Mellon, has agreed to pay the amount of the shortfall to the Fund, or at its discretion, replace the loaned securities. |
See accompanying notes to financial statements. |
CRM Funds |
|
41 |
||
CRM FUNDS CRM ALL CAP VALUE FUND SCHEDULE OF INVESTMENTS June 30, 2021 |
Shares |
Value |
|||||||
COMMON STOCK — 97.2% |
||||||||
Communications — 2.2% |
||||||||
Telecommunications — 2.2% |
||||||||
| 42,394 | Vonage Holdings Corp.1 |
$ | 610,898 | |||||
Consumer Discretionary — 14.2% |
||||||||
Apparel & Textile Products — 3.2% |
||||||||
| 19,717 | Steven Madden Ltd. |
862,816 | ||||||
Home Construction — 1.7% |
||||||||
| 8,708 | Skyline Champion Corp.1 |
464,136 | ||||||
Leisure Facilities & Services — 3.7% |
||||||||
| 8,793 | BJ’s Restaurants, Inc.1 |
432,088 | ||||||
| 3,662 | Marriott Vacations Worldwide Corp.1 |
583,357 | ||||||
| 1,015,445 | ||||||||
Wholesale - Discretionary — 5.6% |
||||||||
| 20,121 | G-III Apparel Group Ltd.1 |
661,176 | ||||||
| 17,660 | LKQ Corp.1 |
869,225 | ||||||
| 1,530,401 | ||||||||
Total Consumer Discretionary |
3,872,798 | |||||||
Consumer Staples — 2.5% |
||||||||
Beverages — 2.5% |
||||||||
| 39,993 | Primo Water Corp. |
669,083 | ||||||
Energy — 4.7% |
||||||||
Oil & Gas Services & Equipment — 3.2% |
||||||||
| 33,812 | ChampionX Corp.1 |
867,278 | ||||||
Renewable Energy — 1.5% |
||||||||
| 4,370 | EnerSys |
427,080 | ||||||
Total Energy |
1,294,358 | |||||||
Financials — 20.5% |
||||||||
Banking — 7.8% |
||||||||
| 18,136 | Hancock Whitney Corporation |
805,963 | ||||||
| 4,075 | JPMorgan Chase & Co. |
633,826 | ||||||
| 12,711 | Webster Financial Corp. |
678,005 | ||||||
| 2,117,794 | ||||||||
Financials — (continued) |
||||||||
Institutional Financial Services — 3.5% |
||||||||
| 11,568 | State Street Corp. |
$ | 951,815 | |||||
Insurance — 9.2% |
||||||||
| 7,685 | American Financial Group, Inc. |
958,472 | ||||||
| 18,448 | American International Group, Inc. |
878,125 | ||||||
| 4,387 | Assurant, Inc. |
685,162 | ||||||
| 2,521,759 | ||||||||
Total Financials |
5,591,368 | |||||||
Health Care — 9.4% |
||||||||
Biotech & Pharma — 2.0% |
||||||||
| 3,333 | Johnson & Johnson |
549,078 | ||||||
Medical Equipment & Devices — 7.4% |
||||||||
| 19,276 | Avantor, Inc.1 |
684,492 | ||||||
| 2,476 | Danaher Corp. |
664,459 | ||||||
| 15,330 | Envista Holdings Corp.1 |
662,409 | ||||||
| 2,011,360 | ||||||||
Total Health Care |
2,560,438 | |||||||
Industrials — 19.5% |
||||||||
Aerospace & Defense — 5.2% |
||||||||
| 19,979 | Kaman Corp. |
1,006,942 | ||||||
| 3,393 | Woodward, Inc. |
416,932 | ||||||
| 1,423,874 | ||||||||
Commercial Support Services — 2.1% |
||||||||
| 12,016 | Terminix Global Holdings, Inc.1 |
573,283 | ||||||
Electrical Equipment — 2.5% |
||||||||
| 21,371 | nVent Electric PLC2 |
667,630 | ||||||
Industrial Intermediate Products — 3.6% |
||||||||
| 4,155 | Valmont Industries, Inc. |
980,788 | ||||||
Machinery — 1.9% |
||||||||
| 3,919 | Regal-Beloit Corp. |
523,226 | ||||||
Transportation & Logistics — 4.2% |
||||||||
| 19,024 | Kirby Corp.1 |
1,153,615 | ||||||
Total Industrials |
5,322,416 | |||||||
See accompanying notes to financial statements. |
CRM Funds |
|
42 |
||
CRM FUNDS CRM ALL CAP VALUE FUND SCHEDULE OF INVESTMENTS (Continued) June 30, 2021 |
Shares |
Value |
|||||||
Materials — 4.3% |
||||||||
Chemicals — 4.3% |
||||||||
| 6,986 | Ashland Global Holdings, Inc. |
$ | 611,275 | |||||
| 13,047 | Corteva, Inc. |
578,634 | ||||||
Total Materials |
1,189,909 | |||||||
Real Estate — 2.3% |
||||||||
REIT — 2.3% |
||||||||
| 32,867 | Xenia Hotels & Resorts, Inc.1 |
615,599 | ||||||
Technology — 15.6% |
||||||||
Semiconductors — 3.0% |
||||||||
| 3,367 | Microchip Technology, Inc. |
504,174 | ||||||
| 2,117 | QUALCOMM, Inc. |
302,583 | ||||||
| 806,757 | ||||||||
Software — 6.6% |
||||||||
| 21,426 | Clarivate PLC1,2 |
589,857 | ||||||
| 1,104 | Microsoft Corp. |
299,074 | ||||||
| 2,649 | PTC, Inc.1 |
374,198 | ||||||
| 13,034 | Tenable Holdings, Inc.1 |
538,956 | ||||||
| 1,802,085 | ||||||||
Technology Hardware — 1.6% |
||||||||
| 21,361 | DZS, Inc.1 |
443,241 | ||||||
Technology Services — 4.4% |
||||||||
| 73,521 | Multiplan Corp.1,3 |
699,920 | ||||||
| 46,439 | Paya Holdings, Inc.1 |
511,758 | ||||||
| 1,211,678 | ||||||||
Total Technology |
4,263,761 | |||||||
Utilities — 2.0% |
||||||||
Electric Utilities — 2.0% |
||||||||
| 7,434 | NextEra Energy, Inc. |
544,764 | ||||||
TOTAL COMMON STOCK (Cost $19,347,936) |
26,535,392 | |||||||
SHORT-TERM INVESTMENTS — 1.4% |
||||||||
| 188,688 | Blackrock Liquidity Funds T-Fund, Institutional Series, 0.01%4 |
188,688 | ||||||
SHORT-TERM INVESTMENTS — (continued) |
||||||||
| 188,688 | Federated Hermes Treasury Obligations Fund, Institutional Series, 0.01%4 |
$ | 188,688 | |||||
TOTAL SHORT-TERM INVESTMENTS (Cost $377,376) |
377,376 | |||||||
TOTAL INVESTMENTS BEFORE SHORT-TERM INVESTMENTS HELD AS COLLATERAL FOR LOANED SECURITIES — 98.6% (Cost $19,725,312) |
26,912,768 | |||||||
Principal |
||||||||
SHORT-TERM INVESTMENTS HELD AS COLLATERAL FOR LOANED SECURITIES — 1.2% |
||||||||
REPURCHASE AGREEMENTS — 1.2% |
||||||||
| $ | 339,640 | With HSBC Securities USA, Inc.: at 0.04%, dated 6/30/21, to be repurchased on 7/1/21, repurchase price $339,640 (collateralized by US Treasury Securities, par values ranging from $792 - $159,852, coupon rates ranging from 0.00% to 8.00%, 11/15/21 - 2/15/48; Total Market Value $346,433) |
339,640 | |||||
TOTAL SHORT-TERM INVESTMENTS HELD AS COLLATERAL FOR LOANED SECURITIES (Cost $339,640) |
339,640 | |||||||
TOTAL INVESTMENTS – 99.8% (Cost $20,064,952) |
27,252,408 | 5 | ||||||
OTHER ASSETS IN EXCESS OF LIABILITIES — 0.2% |
57,011 | |||||||
NET ASSETS — 100.0% |
$ | 27,309,419 | ||||||
See accompanying notes to financial statements. |
CRM Funds |
|
43 |
||
CRM FUNDS CRM ALL CAP VALUE FUND SCHEDULE OF INVESTMENTS (Concluded) June 30, 2021 |
A Summary of inputs used to value the Fund’s investments as of June 30, 2021 is as follows (See Note 2 in Notes to Financial Statements):
Assets |
Level 1 |
Level 2 |
Level 3 |
Investments |
||||||||||||
Common Stock |
$ | 26,535,392 | — | — | $ | 26,535,392 | ||||||||||
Short-Term Investments |
377,376 | — | — | 377,376 | ||||||||||||
Short-Term Investments Held As Collateral For Loaned Securities |
— | $ | 339,640 | — | 339,640 | |||||||||||
Total |
$ | 26,912,768 | $ | 339,640 | — | $ | 27,252,408 | |||||||||
There were no transfers into or out of Level 3 related to securities held at June 30, 2021.
|
1 |
Non-income producing security. |
|
2 |
PLC – Public Limited Company. |
|
3 |
Security partially or fully on loan. |
|
4 |
Rate disclosed is the seven day effective yield as of June 30, 2021. |
|
5 |
At June 30, 2021, the market value of securities on loan for CRM All Cap Value Fund was $349,546. In the event that the collateral received is insufficient to cover the value of the loaned securities and provided such collateral shortfall is not the result of investment losses, the Fund’s securities lending agent, The Bank of New York Mellon, has agreed to pay the amount of the shortfall to the Fund, or at its discretion, replace the loaned securities. |
See accompanying notes to financial statements. |
CRM Funds |
|
44 |
||
CRM FUNDS CRM LONG/SHORT OPPORTUNITIES FUND SCHEDULE OF INVESTMENTS June 30, 2021 |
Shares |
Value |
|||||||
COMMON STOCK — 96.3% |
||||||||
Communications — 5.1% |
||||||||
Entertainment Content — 2.7% |
||||||||
| 19,756 | Walt Disney Company (The)1 |
$ | 3,472,513 | |||||
Internet Media & Services — 2.4% |
||||||||
| 1,389 | Booking Holdings, Inc.1 |
3,039,256 | ||||||
Total Communications |
6,511,769 | |||||||
Consumer Discretionary — 24.7% |
||||||||
Apparel & Textile Products — 3.5% |
||||||||
| 103,564 | Steven Madden Ltd. |
4,531,960 | ||||||
Consumer Services — 2.2% |
||||||||
| 299,936 | Regis Corp.1 |
2,807,401 | ||||||
Home Construction — 3.4% |
||||||||
| 81,077 | Skyline Champion Corp.1 |
4,321,404 | ||||||
Leisure Facilities & Services — 4.3% |
||||||||
| 63,328 | BJ’s Restaurants, Inc.1 |
3,111,938 | ||||||
| 15,522 | Marriott Vacations Worldwide Corp.1 |
2,472,655 | ||||||
| 5,584,593 | ||||||||
Retail — Discretionary — 3.1% |
||||||||
| 52,489 | Nordstrom, Inc.1 |
1,919,523 | ||||||
| 2,954 | RH1 |
2,005,766 | ||||||
| 3,925,289 | ||||||||
Wholesale — Discretionary — 8.2% |
||||||||
| 170,247 | G-III Apparel Group Ltd.1 |
5,594,317 | ||||||
| 98,824 | LKQ Corp.1 |
4,864,118 | ||||||
| 10,458,435 | ||||||||
Total Consumer Discretionary |
31,629,082 | |||||||
Consumer Staples — 3.3% |
||||||||
Beverages — 3.3% |
||||||||
| 491,900 | Becle SAB de CV1 |
1,299,902 | ||||||
| 172,102 | Primo Water Corp. |
2,879,267 | ||||||
Total Consumer Staples |
4,179,169 | |||||||
Energy — 5.8% |
||||||||
Renewable Energy — 5.8% |
||||||||
| 19,753 | EnerSys |
$ | 1,930,461 | |||||
| 97,561 | Sunrun, Inc.1 |
5,441,952 | ||||||
Total Energy |
7,372,413 | |||||||
Financials — 7.2% |
||||||||
Banking — 5.5% |
||||||||
| 89,799 | Hancock Whitney Corp. |
3,990,667 | ||||||
| 55,811 | Webster Financial Corp. |
2,976,959 | ||||||
| 6,967,626 | ||||||||
Insurance — 1.7% |
||||||||
| 14,319 | Assurant, Inc. |
2,236,341 | ||||||
Total Financials |
9,203,967 | |||||||
Health Care — 8.3% |
||||||||
Medical Equipment & Devices — 8.3% |
||||||||
| 92,435 | Avantor, Inc.1 |
3,282,367 | ||||||
| 8,694 | Danaher Corp. |
2,333,122 | ||||||
| 116,256 | Envista Holdings Corp.1 |
5,023,421 | ||||||
Total Health Care |
10,638,910 | |||||||
Industrials — 21.1% |
||||||||
Aerospace & Defense — 5.6% |
||||||||
| 88,237 | Kaman Corp. |
4,447,144 | ||||||
| 21,877 | Woodward, Inc. |
2,688,246 | ||||||
| 7,135,390 | ||||||||
Commercial Support Services — 3.9% |
||||||||
| 53,188 | Clean Harbors, Inc.1 |
4,953,930 | ||||||
Electrical Equipment — 4.7% |
||||||||
| 231,853 | Hayward Holdings, Inc.1 |
6,032,815 | ||||||
Industrial Intermediate Products — 3.7% |
||||||||
| 19,832 | Valmont Industries, Inc. |
4,681,344 | ||||||
Transportation & Logistics — 3.2% |
||||||||
| 68,043 | Kirby Corp.1 |
4,126,127 | ||||||
Total Industrials |
26,929,606 | |||||||
See accompanying notes to financial statements. |
CRM Funds |
|
45 |
||
CRM FUNDS CRM LONG/SHORT OPPORTUNITIES FUND SCHEDULE OF INVESTMENTS (Continued) June 30, 2021 |
Shares |
Value |
|||||||
Materials — 2.0% |
||||||||
Chemicals — 2.0% |
||||||||
| 29,364 | Ashland Global Holdings, Inc. |
$ | 2,569,350 | |||||
Technology — 15.4% |
||||||||
Semiconductors — 1.8% |
||||||||
| 16,096 | QUALCOMM, Inc. |
2,300,601 | ||||||
Software — 10.2% |
||||||||
| 148,500 | Clarivate PLC1,2 |
4,088,205 | ||||||
| 2,065 | Confluent, Inc.1 |
98,088 | ||||||
| 32,887 | Jamf Holding Corp.1 |
1,104,017 | ||||||
| 10,359 | Microsoft Corp. |
2,806,253 | ||||||
| 121,192 | Tenable Holdings, Inc.1 |
5,011,289 | ||||||
| 13,107,852 | ||||||||
Technology Services — 3.4% |
||||||||
| 196,900 | PAE, Inc.1 |
1,752,410 | ||||||
| 234,949 | Paya Holdings, Inc.1 |
2,589,138 | ||||||
| 4,341,548 | ||||||||
Total Technology |
19,750,001 | |||||||
Utilities — 3.4% |
||||||||
Electric Utilities — 3.4% |
||||||||
| 59,628 | NextEra Energy, Inc. |
4,369,540 | ||||||
TOTAL COMMON STOCK (Cost $95,969,792) |
123,153,807 | |||||||
SHORT-TERM INVESTMENTS — 3.5% |
||||||||
| 2,235,924 | Blackrock Liquidity Funds T-Fund, Institutional Series, 0.01%3 |
2,235,924 | ||||||
| 2,235,924 | Federated Hermes Treasury Oligations Fund, Institutional Series, 0.01%3 |
2,235,924 | ||||||
TOTAL SHORT-TERM INVESTMENTS (Cost $4,471,848) |
4,471,848 | |||||||
TOTAL INVESTMENTS IN SECURITIES — 99.8% (Cost $100,441,640) |
127,625,655 | |||||||
COMMON STOCK SOLD SHORT — (38.5)% |
||||||||
Communications — (4.0)% |
||||||||
Advertising & Marketing — (0.3)% |
||||||||
| (5,054 | ) | Omnicom Group, Inc. |
$ | (404,269 | ) | |||
Entertainment Content — (1.3)% |
||||||||
| (23,663 | ) | Discovery, Inc. - Series A |
(725,981 | ) | ||||
| (23,143 | ) | Fox Corp., Class A |
(859,300 | ) | ||||
| (1,585,281 | ) | |||||||
Publishing & Broadcasting — (0.8)% |
||||||||
| (85,256 | ) | Pearson PLC2 |
(978,829 | ) | ||||
Telecommunications — (1.6)% |
||||||||
| (72,546 | ) | AT&T, Inc. |
(2,087,874 | ) | ||||
Total Communications |
(5,056,253 | ) | ||||||
Consumer Discretionary — (9.2)% |
||||||||
Apparel & Textile Products — (1.2)% |
||||||||
| (36,242 | ) | Tapestry, Inc. |
(1,575,802 | ) | ||||
Automotive — (0.7)% |
||||||||
| (82,094 | ) | Lordstown Motors Corp. |
(907,960 | ) | ||||
Consumer Services — (3.8)% |
||||||||
| (26,904 | ) | Adtalem Global Education, Inc. |
(958,859 | ) | ||||
| (7,060 | ) | Grand Canyon Education, Inc. |
(635,188 | ) | ||||
| (116,112 | ) | Perdoceo Education Corp. |
(1,424,694 | ) | ||||
| (23,497 | ) | Strategic Education, Inc. |
(1,787,182 | ) | ||||
| (4,805,923 | ) | |||||||
E-Commerce Discretionary — (0.5)% |
||||||||
| (29,922 | ) | CarParts.com, Inc. |
(609,212 | ) | ||||
Leisure Facilities & Services — (0.9)% |
||||||||
| (11,224 | ) | Shake Shack, Inc., Class A |
(1,201,192 | ) | ||||
Retail - Discretionary — (2.1)% |
||||||||
| (4,600 | ) | Canadian Tire Corp. Ltd. |
(727,837 | ) | ||||
See accompanying notes to financial statements. |
CRM Funds |
|
46 |
||
CRM FUNDS CRM LONG/SHORT OPPORTUNITIES FUND SCHEDULE OF INVESTMENTS (Continued) June 30, 2021 |
Shares |
Value |
|||||||
Consumer Discretionary — (continued) |
||||||||
Retail - Discretionary — (continued) |
||||||||
| (5,242 | ) | Lululemon Athletica, Inc. |
$ | (1,913,173 | ) | |||
| (2,641,010 | ) | |||||||
Total Consumer Discretionary |
(11,741,099 | ) | ||||||
Consumer Staples — (9.1)% |
||||||||
Food — (5.5)% |
||||||||
| (44,708 | ) | B&G Foods, Inc. |
(1,466,422 | ) | ||||
| (69,233 | ) | Beachbody Company, Inc. (The) |
(720,023 | ) | ||||
| (14,009 | ) | Beyond Meat, Inc. |
(2,206,277 | ) | ||||
| (9,451 | ) | JM Smucker Company (The) |
(1,224,566 | ) | ||||
| (21,850 | ) | Kellogg Co. |
(1,405,611 | ) | ||||
| (7,022,899 | ) | |||||||
Retail - Consumer Staples — (3.6)% |
||||||||
| (26,055 | ) | HelloFresh SE |
(2,533,194 | ) | ||||
| (54,729 | ) | Kroger Company (The) |
(2,096,668 | ) | ||||
| (4,629,862 | ) | |||||||
Total Consumer Staples |
(11,652,761 | ) | ||||||
Energy — (0.7)% |
||||||||
Renewable Energy — (0.7)% |
||||||||
| (3,362 | ) | SolarEdge Technologies, Inc. |
(929,156 | ) | ||||
Financials — (0.3)% |
||||||||
Banking — (0.3)% |
||||||||
| (4,700 | ) | National Bank of Canada |
(351,699 | ) | ||||
Health Care — (1.2)% |
||||||||
Health Care Facilities & Services — (1.2)% |
||||||||
| (19,601 | ) | HealthEquity, Inc. |
(1,577,488 | ) | ||||
Industrials — (7.6)% |
||||||||
Commercial Support Services — (0.4)% |
||||||||
| (5,533 | ) | Robert Half International, Inc. |
(492,271 | ) | ||||
Electrical Equipment — (4.4)% |
||||||||
| (9,041 | ) | Acuity Brands, Inc. |
(1,690,938 | ) | ||||
| (11,303 | ) | Belden, Inc. |
(571,593 | ) | ||||
Industrials — (continued) |
||||||||
Electrical Equipment — (continued) |
||||||||
| (26,316 | ) | Blink Charging Co. |
$ | (1,083,430 | ) | |||
| (40,743 | ) | Bloom Energy Corp., Class A |
(1,094,764 | ) | ||||
| (18,365 | ) | Philips Lighting NV |
(1,161,752 | ) | ||||
| (5,602,477 | ) | |||||||
Industrial Intermediate Products — (0.7)% |
||||||||
| (10,690 | ) | Proto Labs, Inc. |
(981,342 | ) | ||||
Transportation Equipment — (2.1)% |
||||||||
| (112,690 | ) | Hyliion Holdings Corp. |
(1,312,838 | ) | ||||
| (10,834 | ) | Volvo AB, Class B |
(260,668 | ) | ||||
| (13,224 | ) | Wabtec Corp. |
(1,088,335 | ) | ||||
| (2,661,841 | ) | |||||||
Total Industrials |
(9,737,931 | ) | ||||||
Technology — (5.8)% |
||||||||
Software — (4.0)% |
||||||||
| (10,469 | ) | Guidewire Software, Inc. |
(1,180,066 | ) | ||||
| (51,504 | ) | Materialise NV – ADR4 |
(1,240,731 | ) | ||||
| (27,283 | ) | Qualys, Inc. |
(2,747,125 | ) | ||||
| (5,167,922 | ) | |||||||
Technology Hardware — (1.8)% |
||||||||
| (56,738 | ) | 3D Systems Corp. |
(2,267,818 | ) | ||||
Total Technology |
(7,435,740 | ) | ||||||
Utilities — (0.6)% |
||||||||
Electric Utilities — (0.6)% |
||||||||
| (14,076 | ) | Avangrid, Inc. |
(723,929 | ) | ||||
TOTAL COMMON STOCK SOLD SHORT — (Proceeds - $48,220,715) |
(49,206,056 | ) | ||||||
OTHER ASSETS IN EXCESS OF LIABILITIES —38.7% |
49,510,817 | |||||||
NET ASSETS — 100.0% |
$ | 127,930,416 | ||||||
See accompanying notes to financial statements. |
CRM Funds |
|
47 |
||
CRM FUNDS CRM LONG/SHORT OPPORTUNITIES FUND SCHEDULE OF INVESTMENTS (Continued) June 30, 2021 |
A Summary of inputs used to value the Fund’s investments as of June 30, 2021 is as follows (See Note 2 in Notes to Financial Statements):
|
Level 1 |
Level 2 |
Level 3 |
Investments |
||||||||||||
Assets: |
||||||||||||||||
Investments in Securities: |
||||||||||||||||
Common Stock |
$ | 123,153,807 | — | — | $ | 123,153,807 | ||||||||||
Short-Term Investments |
4,471,848 | — | — | 4,471,848 | ||||||||||||
Total Assets – Investments in Securities |
$ | 127,625,655 | — | — | $ | 127,625,655 | ||||||||||
Other Financial Instruments:* |
||||||||||||||||
Total Return Swap Agreements – Equity Contracts |
— | $ | 749,351 | — | $ | 749,351 | ||||||||||
Total Assets – Other Financial Instruments |
$ | 127,625,655 | $ | 749,351 | — | $ | 128,375,006 | |||||||||
Liabilities: |
||||||||||||||||
Investments in Securities: |
||||||||||||||||
Common Stock Sold Short |
$ | (49,206,056 | ) | — | — | $ | (49,206,056 | ) | ||||||||
Total Assets – Investments in Securities |
$ | (49,206,056 | ) | — | — | $ | (49,206,056 | ) | ||||||||
Other Financial Instruments:* |
||||||||||||||||
Total Return Swap Agreements – Equity Contracts |
— | $ | (404,978 | ) | — | $ | (404,978 | ) | ||||||||
Total Liabilities – Other Financial Instruments |
$ | (49,206,056 | ) | $ | (404,978 | ) | — | $ | (49,611,034 | ) | ||||||
|
* |
Other financial instruments are derivative instruments not reflected in the Schedule of Investments, such as total return swap agreements, which are recorded at fair value. |
There were no transfers into or out of Level 3 related to securities held at June 30, 2021.
|
1 |
Non-income producing security. |
|
2 |
PLC – Public Limited Company. |
|
3 |
Rate disclosed is the seven day effective yield as of June 30, 2021. |
|
4 |
ADR – American Depositary Receipt. |
See accompanying notes to financial statements. |
CRM Funds |
|
48 |
||
CRM FUNDS CRM LONG/SHORT OPPORTUNITIES FUND SCHEDULE OF INVESTMENTS (Continued) June 30, 2021 |
OTC Total return swap agreements outstanding at June 30, 2021:
Counterparty |
Financing |
Termination |
Long (Short) |
Reference |
Fair |
Upfront |
Unrealized |
||||||||||||||||
Morgan Stanley |
0.75% (Fed Funds Rate + 0.65%) |
03/21/2022 | $ | 3,433,676 | American International Group |
$ | (23,931 | ) | $ | — | $ | (23,931 | ) | ||||||||||
Morgan Stanley |
0.75% (Fed Funds Rate + 0.65%) |
03/21/2022 | 2,928,751 | ChampionX Corporation |
739,163 | — | 739,163 | ||||||||||||||||
Morgan Stanley |
0.75% (Fed Funds Rate + 0.65%) |
03/21/2022 | 3,838,582 | Canadian National Railway |
(184,309 | ) | — | (184,309 | ) | ||||||||||||||
Morgan Stanley |
0.75% (Fed Funds Rate + 0.65%) |
03/21/2022 | 2,740,440 | Eagle Materials, Inc. |
(19,516 | ) | — | (19,516 | ) | ||||||||||||||
Morgan Stanley |
0.75% (Fed Funds Rate + 0.65%) |
03/21/2022 | 3,817,899 | State Street Corporation |
2,526 | — | 2,526 | ||||||||||||||||
Morgan Stanley |
(0.35%) (Fed Funds Rate minus 0.45%) |
07/28/2021 | (2,053,965 | ) | Morgan Stanley Custom Swap (MSCMS315) Index(3) |
(25,301 | ) | — | (25,301 | ) | |||||||||||||
Morgan Stanley |
(0.35%) (Fed Funds Rate minus 0.45%) |
07/28/2021 | (1,997,325 | ) | Morgan Stanley Custom Swap (MSCMS316) Index(3) |
(52,340 | ) | — | (52,340 | ) | |||||||||||||
Morgan Stanley |
(0.35%) (Fed Funds Rate minus 0.45%) |
07/28/2021 | (2,024,624 | ) | Morgan Stanley Custom Swap (MSCMS317) Index(3) |
(51,839 | ) | — | (51,839 | ) | |||||||||||||
Morgan Stanley |
(0.35%) (Fed Funds Rate minus 0.45%) |
07/28/2021 | (2,049,034 | ) | Morgan Stanley Custom Swap (MSCMS318) Index(3) |
(26,114 | ) | — | (26,114 | ) | |||||||||||||
Morgan Stanley |
(0.35%) (Fed Funds Rate minus 0.45%) |
07/28/2021 | (2,048,602 | ) | Morgan Stanley Custom Swap (MSCMS319) Index(3) |
(13,632 | ) | — | (13,632 | ) | |||||||||||||
Morgan Stanley |
(0.35%) (Fed Funds Rate minus 0.45%) |
07/28/2021 | (2,045,649 | ) | Morgan Stanley Custom Swap (MSCMS320) Index(3) |
(3,815 | ) | — | (3,815 | ) | |||||||||||||
Morgan Stanley |
(0.35%) (Fed Funds Rate minus 0.45%) |
07/28/2021 | (2,048,736 | ) | Morgan Stanley Custom Swap (MSCMS321) Index(3) |
4,682 | — | 4,682 | |||||||||||||||
Morgan Stanley |
(0.35%) (Fed Funds Rate minus 0.45%) |
07/28/2021 | (2,061,144 | ) | Morgan Stanley Custom Swap (MSCMS322) Index(3) |
(230 | ) | — | (230 | ) | |||||||||||||
Morgan Stanley |
(0.35%) (Fed Funds Rate minus 0.45%) |
07/28/2021 | (2,028,453 | ) | Morgan Stanley Custom Swap (MSCMS323) Index(3) |
2,980 | — | 2,980 | |||||||||||||||
Morgan Stanley |
(0.35%) (Fed Funds Rate minus 0.45%) |
07/28/2021 | (2,030,785 | ) | Morgan Stanley Custom Swap (MSCMS324) Index(3) |
(3,951 | ) | — | (3,951 | ) | |||||||||||||
Total Unrealized Appreciation |
$ | 749,351 | |||||||||||||||||||||
Total Unrealized (Depreciation) |
$ | (404,978 | ) | ||||||||||||||||||||
Total |
$ | 344,373 | $ | — | $ | 344,373 | |||||||||||||||||
See accompanying notes to financial statements. |
CRM Funds |
|
49 |
||
CRM FUNDS CRM LONG/SHORT OPPORTUNITIES FUND SCHEDULE OF INVESTMENTS (Continued) June 30, 2021 |
OTC Total return swap agreements outstanding at June 30, 2021 (continued):
|
(1) |
Paid monthly. |
|
(2) |
Morgan Stanley acts as the counterparty to the total return swap contracts listed above. The Fund either receives fees from, or pays fees to, the counterparty, depending upon the total return of the benchmark, and the agreed -upon floating rate financing rate. |
|
(3) |
See the tables below for the swap constituents. |
See accompanying notes to financial statements. |
CRM Funds |
|
50 |
||
CRM FUNDS CRM LONG/SHORT OPPORTUNITIES FUND SCHEDULE OF INVESTMENTS (Continued) June 30, 2021 |
The following table represents the individual positions and related values of underlying securities of Morgan Stanley Custom Basket (MSCMS315) Index total return swap with Morgan Stanley Bank as of June 30, 2021, termination date 7/28/21:
Reference Entity |
Shares |
Market |
% of Total |
|||||||||
Lululemon Athletica, Inc. |
149 | $ | 54,245 | 2.61 | % | |||||||
Cintas Corporation |
140 | 53,661 | 2.58 | % | ||||||||
O’Reilly Automotive, Inc. |
94 | 53,103 | 2.55 | % | ||||||||
Home Depot, Inc. (The) |
166 | 52,794 | 2.54 | % | ||||||||
Apple, Inc. |
385 | 52,750 | 2.54 | % | ||||||||
Best Buy Company, Inc. |
456 | 52,444 | 2.52 | % | ||||||||
Target Corporation |
217 | 52,399 | 2.52 | % | ||||||||
Tractor Supply Company |
281 | 52,370 | 2.52 | % | ||||||||
Moody’s Corporation |
144 | 52,362 | 2.52 | % | ||||||||
Costco Wholesale Corporation |
132 | 52,275 | 2.51 | % | ||||||||
Stanley Black & Decker, Inc. |
255 | 52,229 | 2.51 | % | ||||||||
United Parcel Service, Inc. - Class B |
250 | 52,015 | 2.50 | % | ||||||||
Agilent Technologies, Inc. |
349 | 51,600 | 2.48 | % | ||||||||
Mettler-Toledo International, Inc. |
37 | 51,442 | 2.47 | % | ||||||||
Dollar General Corporation |
237 | 51,373 | 2.47 | % | ||||||||
Fastenal Company |
983 | 51,100 | 2.46 | % | ||||||||
Amgen, Inc. |
209 | 50,999 | 2.45 | % | ||||||||
Eaton Corporation PLC |
342 | 50,747 | 2.44 | % | ||||||||
Rockwell Automation, Inc. |
177 | 50,639 | 2.44 | % | ||||||||
3M Company (The) |
255 | 50,565 | 2.43 | % | ||||||||
Waters Corporation |
146 | 50,498 | 2.43 | % | ||||||||
Automatic Data Processing, Inc. |
254 | 50,480 | 2.43 | % | ||||||||
VF Corporation |
615 | 50,478 | 2.43 | % | ||||||||
Starbucks Corporation |
450 | 50,329 | 2.42 | % | ||||||||
Caterpillar, Inc. |
231 | 50,235 | 2.42 | % | ||||||||
Pfizer, Inc. |
1,275 | 49,948 | 2.40 | % | ||||||||
Cummins, Inc. |
204 | 49,681 | 2.39 | % | ||||||||
AT&T, Inc. |
1,725 | 49,644 | 2.39 | % | ||||||||
Cognizant Technology Solutions Corporation |
716 | 49,590 | 2.39 | % | ||||||||
Fiserv, Inc. |
463 | 49,520 | 2.38 | % | ||||||||
Walgreens Boots Alliance, Inc. |
940 | 49,469 | 2.38 | % | ||||||||
Fox Corporation - Class A |
1,331 | 49,408 | 2.38 | % | ||||||||
International Paper Company (The) |
806 | 49,386 | 2.38 | % | ||||||||
CVS Health Corporation |
592 | 49,358 | 2.37 | % | ||||||||
Fidelity National Information Services, Inc. |
347 | 49,172 | 2.36 | % | ||||||||
McDonald’s Corporation |
213 | 49,150 | 2.36 | % | ||||||||
Emerson Electric Company |
510 | 49,106 | 2.36 | % | ||||||||
PACCAR, Inc. |
549 | 48,969 | 2.36 | % | ||||||||
W. W. Grainger, Inc. |
112 | 48,905 | 2.35 | % | ||||||||
See accompanying notes to financial statements. |
CRM Funds |
|
51 |
||
CRM FUNDS CRM LONG/SHORT OPPORTUNITIES FUND SCHEDULE OF INVESTMENTS (Continued) June 30, 2021 |
Reference Entity |
Shares |
Market |
% of Total |
|||||||||
Canadian Imperial Bank of Commerce (The) |
417 | $ | 47,526 | 2.29 | % | |||||||
Restaurant Brands International, Inc. |
733 | 47,266 | 2.27 | % | ||||||||
| $ | 2,079,230 | 100.00 | % | |||||||||
The following table represents the individual positions and related values of underlying securities of Morgan Stanley Custom Basket (MSCMS316) Index total return swap with Morgan Stanley Bank as of June 30, 2021, termination date 7/28/21:
Reference Entity |
Shares |
Market |
% of Total |
|||||||||
DocuSign, Inc. |
164 | $ | 45,964 | 2.24 | % | |||||||
Tractor Supply Company |
245 | 45,604 | 2.23 | % | ||||||||
Estée Lauder Companies, Inc (The) |
143 | 45,444 | 2.22 | % | ||||||||
Cintas Corporation |
118 | 45,253 | 2.21 | % | ||||||||
Rockwell Automation, Inc. |
158 | 45,223 | 2.21 | % | ||||||||
O’Reilly Automotive, Inc. |
80 | 45,132 | 2.20 | % | ||||||||
Home Depot, Inc. (The) |
141 | 45,076 | 2.20 | % | ||||||||
United Parcel Service, Inc. - Class B |
216 | 44,993 | 2.20 | % | ||||||||
Best Buy Company, Inc. |
391 | 44,991 | 2.20 | % | ||||||||
Stanley Black & Decker, Inc. |
219 | 44,947 | 2.19 | % | ||||||||
Target Corporation |
185 | 44,796 | 2.19 | % | ||||||||
Lululemon Athletica, Inc. |
123 | 44,756 | 2.18 | % | ||||||||
Apple, Inc. |
325 | 44,528 | 2.17 | % | ||||||||
Caterpillar, Inc. |
205 | 44,520 | 2.17 | % | ||||||||
Eaton Corporation PLC |
300 | 44,517 | 2.17 | % | ||||||||
Fastenal Company |
852 | 44,295 | 2.16 | % | ||||||||
Humana, Inc. |
100 | 44,223 | 2.16 | % | ||||||||
Costco Wholesale Corporation |
111 | 44,063 | 2.15 | % | ||||||||
Emerson Electric Company |
456 | 43,859 | 2.14 | % | ||||||||
West Pharmaceutical Services, Inc. |
122 | 43,707 | 2.13 | % | ||||||||
Moody’s Corporation |
121 | 43,693 | 2.13 | % | ||||||||
International Paper Company (The) |
711 | 43,615 | 2.13 | % | ||||||||
3M Company (The) |
220 | 43,613 | 2.13 | % | ||||||||
VF Corporation |
531 | 43,585 | 2.13 | % | ||||||||
Dollar General Corporation |
201 | 43,472 | 2.12 | % | ||||||||
Mettler-Toledo International, Inc. |
31 | 43,388 | 2.12 | % | ||||||||
Amgen, Inc. |
178 | 43,379 | 2.12 | % | ||||||||
McCormick & Company, Inc. |
489 | 43,229 | 2.11 | % | ||||||||
Automatic Data Processing, Inc. |
217 | 43,090 | 2.10 | % | ||||||||
Starbucks Corporation |
385 | 43,008 | 2.10 | % | ||||||||
AT&T, Inc. |
1,491 | 42,906 | 2.09 | % | ||||||||
Cognizant Technology Solutions Corporation |
619 | 42,903 | 2.09 | % | ||||||||
See accompanying notes to financial statements. |
CRM Funds |
|
52 |
||
CRM FUNDS CRM LONG/SHORT OPPORTUNITIES FUND SCHEDULE OF INVESTMENTS (Continued) June 30, 2021 |
Reference Entity |
Shares |
Market |
% of Total |
|||||||||
Fox Corporation - Class A |
1,153 | $ | 42,824 | 2.09 | % | |||||||
HCA Healthcare, Inc. |
207 | 42,750 | 2.09 | % | ||||||||
Waters Corporation |
124 | 42,729 | 2.08 | % | ||||||||
Church & Dwight Company, Inc. |
501 | 42,727 | 2.08 | % | ||||||||
Walgreens Boots Alliance, Inc. |
811 | 42,685 | 2.08 | % | ||||||||
Slack Technologies, Inc. - Class A |
963 | 42,654 | 2.08 | % | ||||||||
W. W. Grainger, Inc. |
97 | 42,558 | 2.08 | % | ||||||||
Pfizer, Inc. |
1,085 | 42,500 | 2.07 | % | ||||||||
CVS Health Corporation |
509 | 42,445 | 2.07 | % | ||||||||
McDonald’s Corporation |
183 | 42,317 | 2.06 | % | ||||||||
Ecolab, Inc. |
204 | 42,097 | 2.05 | % | ||||||||
Fiserv, Inc. |
393 | 41,998 | 2.05 | % | ||||||||
Fidelity National Information Services, Inc. |
294 | 41,613 | 2.03 | % | ||||||||
Canadian Imperial Bank of Commerce (The) |
364 | 41,407 | 2.02 | % | ||||||||
Restaurant Brands International, Inc. |
631 | 40,646 | 1.98 | % | ||||||||
| $ | 2,049,722 | 100.00 | % | |||||||||
The following table represents the individual positions and related values of underlying securities of Morgan Stanley Custom Basket (MSCMS317) Index total return swap with Morgan Stanley Bank as of June 30, 2021, termination date 7/28/21:
Reference Entity |
Shares |
Market |
% of Total |
|||||||||
Roku, Inc. |
88 | $ | 40,499 | 1.95 | % | |||||||
Tractor Supply Company |
190 | 35,294 | 1.70 | % | ||||||||
Cintas Corporation |
92 | 34,975 | 1.68 | % | ||||||||
Estée Lauder Companies, Inc (The) |
110 | 34,928 | 1.68 | % | ||||||||
Best Buy Company, Inc. |
302 | 34,709 | 1.67 | % | ||||||||
Eaton Corporation PLC |
233 | 34,571 | 1.67 | % | ||||||||
Constellation Brands, Inc. - Class A |
147 | 34,347 | 1.65 | % | ||||||||
O’Reilly Automotive, Inc. |
60 | 34,252 | 1.65 | % | ||||||||
Home Depot, Inc. (The) |
107 | 34,238 | 1.65 | % | ||||||||
Rockwell Automation, Inc. |
120 | 34,202 | 1.65 | % | ||||||||
Stanley Black & Decker, Inc. |
167 | 34,169 | 1.65 | % | ||||||||
United Parcel Service, Inc. - Class B |
164 | 34,166 | 1.65 | % | ||||||||
Lululemon Athletica, Inc. |
93 | 34,117 | 1.64 | % | ||||||||
Apple, Inc. |
249 | 34,109 | 1.64 | % | ||||||||
Target Corporation |
141 | 34,070 | 1.64 | % | ||||||||
Motorola Solutions, Inc. |
157 | 34,031 | 1.64 | % | ||||||||
ANSYS, Inc. |
98 | 34,023 | 1.64 | % | ||||||||
Humana, Inc. |
77 | 33,965 | 1.64 | % | ||||||||
See accompanying notes to financial statements. |
CRM Funds |
|
53 |
||
CRM FUNDS CRM LONG/SHORT OPPORTUNITIES FUND SCHEDULE OF INVESTMENTS (Continued) June 30, 2021 |
Reference Entity |
Shares |
Market |
% of Total |
|||||||||
Emerson Electric Company |
352 | $ | 33,888 | 1.63 | % | |||||||
Caterpillar, Inc. |
156 | 33,855 | 1.63 | % | ||||||||
Sysco Corporation |
435 | 33,812 | 1.63 | % | ||||||||
Clorox Company (The) |
188 | 33,792 | 1.63 | % | ||||||||
Moody’s Corporation |
93 | 33,758 | 1.63 | % | ||||||||
Costco Wholesale Corporation |
85 | 33,752 | 1.63 | % | ||||||||
3M Company (The) |
170 | 33,682 | 1.62 | % | ||||||||
International Paper Company (The) |
549 | 33,631 | 1.62 | % | ||||||||
Walgreens Boots Alliance, Inc. |
639 | 33,622 | 1.62 | % | ||||||||
VF Corporation |
408 | 33,457 | 1.61 | % | ||||||||
Automatic Data Processing, Inc. |
168 | 33,454 | 1.61 | % | ||||||||
Altria Group, Inc. |
702 | 33,452 | 1.61 | % | ||||||||
HCA Healthcare, Inc. |
161 | 33,358 | 1.61 | % | ||||||||
Fastenal Company |
641 | 33,317 | 1.61 | % | ||||||||
McCormick & Company, Inc. |
377 | 33,317 | 1.60 | % | ||||||||
Mettler-Toledo International, Inc. |
24 | 33,270 | 1.60 | % | ||||||||
Hershey Company (The) |
191 | 33,194 | 1.60 | % | ||||||||
General Mills, Inc. |
544 | 33,126 | 1.60 | % | ||||||||
West Pharmaceutical Services, Inc. |
92 | 33,118 | 1.60 | % | ||||||||
Starbucks Corporation |
296 | 33,115 | 1.59 | % | ||||||||
PepsiCo, Inc. |
223 | 33,105 | 1.59 | % | ||||||||
Church & Dwight Company, Inc. |
388 | 33,088 | 1.59 | % | ||||||||
Cisco Systems, Inc. |
624 | 33,071 | 1.59 | % | ||||||||
Dollar General Corporation |
153 | 33,054 | 1.59 | % | ||||||||
Align Technology, Inc. |
54 | 32,996 | 1.59 | % | ||||||||
Cognizant Technology Solutions Corporation |
476 | 32,937 | 1.59 | % | ||||||||
CVS Health Corporation |
394 | 32,900 | 1.58 | % | ||||||||
Kellogg Company (The) |
511 | 32,868 | 1.58 | % | ||||||||
Pfizer, Inc. |
837 | 32,783 | 1.58 | % | ||||||||
Hormel Foods Corporation |
685 | 32,716 | 1.58 | % | ||||||||
McDonald’s Corporation |
141 | 32,684 | 1.57 | % | ||||||||
Ecolab, Inc. |
158 | 32,643 | 1.57 | % | ||||||||
AT&T, Inc. |
1,134 | 32,638 | 1.57 | % | ||||||||
W. W. Grainger, Inc. |
74 | 32,600 | 1.57 | % | ||||||||
Slack Technologies, Inc. - Class A |
734 | 32,527 | 1.57 | % | ||||||||
Arista Networks, Inc. |
90 | 32,437 | 1.56 | % | ||||||||
Philip Morris International, Inc. |
327 | 32,363 | 1.56 | % | ||||||||
Fiserv, Inc. |
302 | 32,288 | 1.55 | % | ||||||||
Duke Energy Corporation |
326 | 32,200 | 1.55 | % | ||||||||
Kroger Company (The) |
838 | 32,121 | 1.55 | % | ||||||||
Zscaler, Inc. |
149 | 32,113 | 1.55 | % | ||||||||
Fox Corporation - Class A |
863 | 32,059 | 1.54 | % | ||||||||
Fidelity National Information Services, Inc. |
226 | 32,005 | 1.54 | % | ||||||||
See accompanying notes to financial statements. |
CRM Funds |
|
54 |
||
CRM FUNDS CRM LONG/SHORT OPPORTUNITIES FUND SCHEDULE OF INVESTMENTS (Continued) June 30, 2021 |
Reference Entity |
Shares |
Market |
% of Total |
|||||||||
Restaurant Brands International, Inc. |
491 | $ | 31,631 | 1.52 | % | |||||||
| $ | 2,076,462 | 100.00 | % | |||||||||
The following table represents the individual positions and related values of underlying securities of Morgan Stanley Custom Basket (MSCMS318) Index total return swap with Morgan Stanley Bank as of June 30, 2021, termination date 7/28/21:
Reference Entity |
Shares |
Market |
% of Total |
|||||||||
Generac Holdings, Inc. |
88 | $ | 36,421 | 1.76 | % | |||||||
Tractor Supply Company |
195 | 36,226 | 1.75 | % | ||||||||
Best Buy Company, Inc. |
314 | 36,124 | 1.74 | % | ||||||||
Estée Lauder Companies, Inc (The) |
113 | 36,025 | 1.74 | % | ||||||||
Cintas Corporation |
94 | 35,953 | 1.73 | % | ||||||||
Clorox Company (The) |
197 | 35,525 | 1.71 | % | ||||||||
Home Depot, Inc. (The) |
111 | 35,398 | 1.71 | % | ||||||||
Lululemon Athletica, Inc. |
97 | 35,374 | 1.71 | % | ||||||||
Eaton Corporation PLC |
239 | 35,372 | 1.71 | % | ||||||||
Apple, Inc. |
258 | 35,348 | 1.70 | % | ||||||||
Constellation Brands, Inc. - Class A |
151 | 35,347 | 1.70 | % | ||||||||
O’Reilly Automotive, Inc. |
62 | 35,344 | 1.70 | % | ||||||||
Target Corporation |
146 | 35,309 | 1.70 | % | ||||||||
Stanley Black & Decker, Inc. |
172 | 35,210 | 1.70 | % | ||||||||
ANSYS, Inc. |
101 | 35,182 | 1.70 | % | ||||||||
Costco Wholesale Corporation |
88 | 34,928 | 1.68 | % | ||||||||
United Parcel Service, Inc. - Class B |
168 | 34,926 | 1.68 | % | ||||||||
Caterpillar, Inc. |
160 | 34,853 | 1.68 | % | ||||||||
Rockwell Automation, Inc. |
122 | 34,839 | 1.68 | % | ||||||||
Moody’s Corporation |
96 | 34,790 | 1.68 | % | ||||||||
VF Corporation |
424 | 34,755 | 1.68 | % | ||||||||
3M Company (The) |
175 | 34,743 | 1.67 | % | ||||||||
Humana, Inc. |
78 | 34,707 | 1.67 | % | ||||||||
Mettler-Toledo International, Inc. |
25 | 34,665 | 1.67 | % | ||||||||
Church & Dwight Company, Inc. |
407 | 34,662 | 1.67 | % | ||||||||
Emerson Electric Company |
360 | 34,616 | 1.67 | % | ||||||||
McCormick & Company, Inc. |
392 | 34,596 | 1.67 | % | ||||||||
General Mills, Inc. |
568 | 34,594 | 1.67 | % | ||||||||
Walgreens Boots Alliance, Inc. |
658 | 34,592 | 1.67 | % | ||||||||
Dollar General Corporation |
160 | 34,531 | 1.66 | % | ||||||||
Hershey Company (The) |
198 | 34,530 | 1.66 | % | ||||||||
See accompanying notes to financial statements. |
CRM Funds |
|
55 |
||
CRM FUNDS CRM LONG/SHORT OPPORTUNITIES FUND SCHEDULE OF INVESTMENTS (Continued) June 30, 2021 |
Reference Entity |
Shares |
Market |
% of Total |
|||||||||
PepsiCo, Inc. |
233 | $ | 34,520 | 1.66 | % | |||||||
Automatic Data Processing, Inc. |
174 | 34,519 | 1.66 | % | ||||||||
Fastenal Company |
664 | 34,503 | 1.66 | % | ||||||||
Magna International, Inc. |
372 | 34,491 | 1.66 | % | ||||||||
Altria Group, Inc. |
722 | 34,427 | 1.66 | % | ||||||||
Starbucks Corporation |
308 | 34,404 | 1.66 | % | ||||||||
Ford Motor Company |
2,310 | 34,330 | 1.65 | % | ||||||||
Sysco Corporation |
441 | 34,317 | 1.65 | % | ||||||||
International Paper Company (The) |
559 | 34,296 | 1.65 | % | ||||||||
West Pharmaceutical Services, Inc. |
95 | 34,289 | 1.65 | % | ||||||||
Kellogg Company (The) |
532 | 34,230 | 1.65 | % | ||||||||
Align Technology, Inc. |
56 | 34,115 | 1.64 | % | ||||||||
Hormel Foods Corporation |
714 | 34,095 | 1.64 | % | ||||||||
General Motors Company |
576 | 34,070 | 1.64 | % | ||||||||
Cognizant Technology Solutions Corporation |
490 | 33,968 | 1.64 | % | ||||||||
AT&T, Inc. |
1,180 | 33,968 | 1.64 | % | ||||||||
Slack Technologies, Inc. - Class A |
766 | 33,938 | 1.64 | % | ||||||||
HCA Healthcare, Inc. |
164 | 33,924 | 1.64 | % | ||||||||
Pfizer, Inc. |
866 | 33,920 | 1.64 | % | ||||||||
CVS Health Corporation |
406 | 33,909 | 1.63 | % | ||||||||
McDonald’s Corporation |
147 | 33,865 | 1.63 | % | ||||||||
Fox Corporation - Class A |
911 | 33,817 | 1.63 | % | ||||||||
Philip Morris International, Inc. |
341 | 33,787 | 1.63 | % | ||||||||
Fiserv, Inc. |
315 | 33,641 | 1.62 | % | ||||||||
W. W. Grainger, Inc. |
77 | 33,601 | 1.62 | % | ||||||||
Ecolab, Inc. |
163 | 33,523 | 1.62 | % | ||||||||
Fidelity National Information Services, Inc. |
235 | 33,230 | 1.60 | % | ||||||||
Restaurant Brands International, Inc. |
513 | 33,053 | 1.59 | % | ||||||||
Canadian Imperial Bank of Commerce (The) |
288 | 32,811 | 1.58 | % | ||||||||
| $ | 2,075,046 | 100.00 | % | |||||||||
The following table represents the individual positions and related values of underlying securities of Morgan Stanley Custom Basket (MSCMS319) Index total return swap with Morgan Stanley Bank as of June 30, 2021, termination date 7/28/21:
Reference Entity |
Shares |
Market |
% of Total |
|||||||||
Estée Lauder Companies, Inc (The) |
152 | $ | 48,198 | 2.34 | % | |||||||
Generac Holdings, Inc. |
115 | 47,645 | 2.31 | % | ||||||||
Eaton Corporation PLC |
319 | 47,241 | 2.29 | % | ||||||||
See accompanying notes to financial statements. |
CRM Funds |
|
56 |
||
CRM FUNDS CRM LONG/SHORT OPPORTUNITIES FUND SCHEDULE OF INVESTMENTS (Continued) June 30, 2021 |
Reference Entity |
Shares |
Market |
% of Total |
|||||||||
Stanley Black & Decker, Inc. |
229 | $ | 47,036 | 2.28 | % | |||||||
Clorox Company (The) |
261 | 46,926 | 2.28 | % | ||||||||
Apple, Inc. |
340 | 46,548 | 2.26 | % | ||||||||
Caterpillar, Inc. |
214 | 46,497 | 2.25 | % | ||||||||
Cintas Corporation |
122 | 46,448 | 2.25 | % | ||||||||
ANSYS, Inc. |
134 | 46,396 | 2.25 | % | ||||||||
3M Company (The) |
233 | 46,350 | 2.25 | % | ||||||||
Humana, Inc. |
105 | 46,266 | 2.24 | % | ||||||||
Emerson Electric Company |
480 | 46,237 | 2.24 | % | ||||||||
Church & Dwight Company, Inc. |
542 | 46,230 | 2.24 | % | ||||||||
United Parcel Service, Inc. - Class B |
222 | 46,105 | 2.24 | % | ||||||||
McCormick & Company, Inc. |
522 | 46,089 | 2.24 | % | ||||||||
General Mills, Inc. |
756 | 46,080 | 2.23 | % | ||||||||
Hershey Company (The) |
264 | 46,040 | 2.23 | % | ||||||||
Align Technology, Inc. |
75 | 46,009 | 2.23 | % | ||||||||
PepsiCo, Inc. |
310 | 45,967 | 2.23 | % | ||||||||
Altria Group, Inc. |
964 | 45,960 | 2.23 | % | ||||||||
Automatic Data Processing, Inc. |
231 | 45,959 | 2.23 | % | ||||||||
Fastenal Company |
883 | 45,933 | 2.23 | % | ||||||||
Sysco Corporation |
590 | 45,902 | 2.23 | % | ||||||||
Moody’s Corporation |
127 | 45,900 | 2.23 | % | ||||||||
Kellogg Company (The) |
712 | 45,828 | 2.22 | % | ||||||||
Mettler-Toledo International, Inc. |
33 | 45,812 | 2.22 | % | ||||||||
International Paper Company (The) |
746 | 45,722 | 2.22 | % | ||||||||
Rockwell Automation, Inc. |
160 | 45,670 | 2.21 | % | ||||||||
Slack Technologies, Inc. - Class A |
1,028 | 45,556 | 2.21 | % | ||||||||
Magna International, Inc. |
492 | 45,555 | 2.21 | % | ||||||||
Hormel Foods Corporation |
954 | 45,545 | 2.21 | % | ||||||||
AT&T, Inc. |
1,582 | 45,536 | 2.21 | % | ||||||||
General Motors Company |
769 | 45,482 | 2.21 | % | ||||||||
West Pharmaceutical Services, Inc. |
126 | 45,410 | 2.20 | % | ||||||||
Ford Motor Company |
3,054 | 45,383 | 2.20 | % | ||||||||
Cognizant Technology Solutions Corporation |
655 | 45,359 | 2.20 | % | ||||||||
Philip Morris International, Inc. |
455 | 45,130 | 2.19 | % | ||||||||
W. W. Grainger, Inc. |
103 | 45,065 | 2.18 | % | ||||||||
Pfizer, Inc. |
1,150 | 45,018 | 2.18 | % | ||||||||
Fiserv, Inc. |
420 | 44,943 | 2.18 | % | ||||||||
HCA Healthcare, Inc. |
217 | 44,863 | 2.18 | % | ||||||||
Ecolab, Inc. |
217 | 44,636 | 2.16 | % | ||||||||
Fidelity National Information Services, Inc. |
312 | 44,206 | 2.14 | % | ||||||||
Kroger Company (The) |
1,143 | 43,798 | 2.12 | % | ||||||||
Canadian Imperial Bank of Commerce (The) |
383 | 43,653 | 2.12 | % | ||||||||
| $ | 2,062,132 | 100.00 | % | |||||||||
See accompanying notes to financial statements. |
CRM Funds |
|
57 |
||
CRM FUNDS CRM LONG/SHORT OPPORTUNITIES FUND SCHEDULE OF INVESTMENTS (Continued) June 30, 2021 |
The following table represents the individual positions and related values of underlying securities of Morgan Stanley Custom Basket (MSCMS320) Index total return swap with Morgan Stanley Bank as of June 30, 2021, termination date 7/28/21:
Reference Entity |
Shares |
Market |
% of Total |
|||||||||
Tractor Supply Company |
247 | $ | 45,870 | 2.24 | % | |||||||
Best Buy Company, Inc. |
398 | 45,731 | 2.23 | % | ||||||||
Stanley Black & Decker, Inc. |
223 | 45,699 | 2.23 | % | ||||||||
3M Company (The) |
230 | 45,690 | 2.23 | % | ||||||||
O’Reilly Automotive, Inc. |
80 | 45,564 | 2.22 | % | ||||||||
Eaton Corporation PLC |
306 | 45,403 | 2.22 | % | ||||||||
Apple, Inc. |
331 | 45,327 | 2.21 | % | ||||||||
Home Depot, Inc. (The) |
142 | 45,273 | 2.21 | % | ||||||||
Generac Holdings, Inc. |
109 | 45,232 | 2.21 | % | ||||||||
Mettler-Toledo International, Inc. |
33 | 45,185 | 2.20 | % | ||||||||
United Parcel Service, Inc. - Class B |
217 | 45,105 | 2.20 | % | ||||||||
Target Corporation |
186 | 45,074 | 2.20 | % | ||||||||
Emerson Electric Company |
468 | 45,063 | 2.20 | % | ||||||||
Caterpillar, Inc. |
207 | 45,043 | 2.20 | % | ||||||||
Automatic Data Processing, Inc. |
227 | 45,016 | 2.20 | % | ||||||||
Cintas Corporation |
118 | 44,980 | 2.19 | % | ||||||||
Lululemon Athletica, Inc. |
123 | 44,934 | 2.19 | % | ||||||||
L Brands, Inc. |
623 | 44,864 | 2.19 | % | ||||||||
Moody’s Corporation |
124 | 44,838 | 2.19 | % | ||||||||
Dollar General Corporation |
207 | 44,725 | 2.18 | % | ||||||||
Walgreens Boots Alliance, Inc. |
850 | 44,698 | 2.18 | % | ||||||||
Humana, Inc. |
101 | 44,678 | 2.18 | % | ||||||||
Costco Wholesale Corporation |
113 | 44,665 | 2.18 | % | ||||||||
International Paper Company (The) |
728 | 44,626 | 2.18 | % | ||||||||
Align Technology, Inc. |
73 | 44,626 | 2.18 | % | ||||||||
Fastenal Company |
858 | 44,599 | 2.18 | % | ||||||||
AT&T, Inc. |
1,544 | 44,449 | 2.17 | % | ||||||||
Slack Technologies, Inc. - Class A |
1,002 | 44,378 | 2.17 | % | ||||||||
HCA Healthcare, Inc. |
215 | 44,374 | 2.17 | % | ||||||||
Starbucks Corporation |
397 | 44,347 | 2.16 | % | ||||||||
Cognizant Technology Solutions Corporation |
640 | 44,344 | 2.16 | % | ||||||||
VF Corporation |
540 | 44,334 | 2.16 | % | ||||||||
West Pharmaceutical Services, Inc. |
123 | 44,297 | 2.16 | % | ||||||||
Rockwell Automation, Inc. |
155 | 44,282 | 2.16 | % | ||||||||
Magna International, Inc. |
476 | 44,110 | 2.15 | % | ||||||||
CVS Health Corporation |
528 | 44,095 | 2.15 | % | ||||||||
Fiserv, Inc. |
412 | 44,050 | 2.15 | % | ||||||||
See accompanying notes to financial statements. |
CRM Funds |
|
58 |
||
CRM FUNDS CRM LONG/SHORT OPPORTUNITIES FUND SCHEDULE OF INVESTMENTS (Continued) June 30, 2021 |
Reference Entity |
Shares |
Market |
% of Total |
|||||||||
McDonald’s Corporation |
190 | $ | 43,821 | 2.14 | % | |||||||
Restaurant Brands International, Inc. |
680 | 43,806 | 2.14 | % | ||||||||
Fox Corporation - Class A |
1,177 | 43,695 | 2.13 | % | ||||||||
W. W. Grainger, Inc. |
100 | 43,608 | 2.13 | % | ||||||||
General Motors Company |
736 | 43,549 | 2.12 | % | ||||||||
Kroger Company (The) |
1,129 | 43,254 | 2.11 | % | ||||||||
Fidelity National Information Services, Inc. |
305 | 43,139 | 2.10 | % | ||||||||
Ford Motor Company |
2,870 | 42,641 | 2.08 | % | ||||||||
Canadian Imperial Bank of Commerce (The) |
372 | 42,386 | 2.07 | % | ||||||||
| $ | 2,049,467 | 100.00 | % | |||||||||
The following table represents the individual positions and related values of underlying securities of Morgan Stanley Custom Basket (MSCMS321) Index total return swap with Morgan Stanley Bank as of June 30, 2021, termination date 7/28/21:
Reference Entity |
Shares |
Market |
% of Total |
|||||||||
Generac Holdings, Inc. |
261 | $ | 108,218 | 5.29 | % | |||||||
Apple, Inc. |
767 | 105,068 | 5.14 | % | ||||||||
Mettler-Toledo International, Inc. |
76 | 104,605 | 5.12 | % | ||||||||
ANSYS, Inc. |
300 | 103,996 | 5.09 | % | ||||||||
HCA Healthcare, Inc. |
501 | 103,502 | 5.06 | % | ||||||||
Humana, Inc. |
232 | 102,807 | 5.03 | % | ||||||||
Slack Technologies, Inc. - Class A |
2,315 | 102,553 | 5.02 | % | ||||||||
Moody’s Corporation |
283 | 102,458 | 5.01 | % | ||||||||
AT&T, Inc. |
3,555 | 102,310 | 5.01 | % | ||||||||
Pfizer, Inc. |
2,612 | 102,267 | 5.00 | % | ||||||||
West Pharmaceutical Services, Inc. |
285 | 102,220 | 5.00 | % | ||||||||
Realty Income Corporation |
1,528 | 101,948 | 4.99 | % | ||||||||
Cognizant Technology Solutions Corporation |
1,466 | 101,524 | 4.97 | % | ||||||||
Align Technology, Inc. |
166 | 101,286 | 4.95 | % | ||||||||
General Motors Company |
1,705 | 100,862 | 4.93 | % | ||||||||
Fiserv, Inc. |
943 | 100,826 | 4.93 | % | ||||||||
Magna International, Inc. |
1,081 | 100,150 | 4.90 | % | ||||||||
Ford Motor Company |
6,707 | 99,662 | 4.88 | % | ||||||||
Fidelity National Information Services, Inc. |
702 | 99,473 | 4.87 | % | ||||||||
Canadian Imperial Bank of Commerce (The) |
864 | 98,354 | 4.81 | % | ||||||||
| $ | 2,044,089 | 100.00 | % | |||||||||
See accompanying notes to financial statements. |
CRM Funds |
|
59 |
||
CRM FUNDS CRM LONG/SHORT OPPORTUNITIES FUND SCHEDULE OF INVESTMENTS (Continued) June 30, 2021 |
The following table represents the individual positions and related values of underlying securities of Morgan Stanley Custom Basket (MSCMS322) Index total return swap with Morgan Stanley Bank as of June 30, 2021, termination date 7/28/21:
Reference Entity |
Shares |
Market |
% of Total |
|||||||||
Generac Holdings, Inc. |
96 | $ | 39,978 | 1.94 | % | |||||||
Tractor Supply Company |
212 | 39,359 | 1.91 | % | ||||||||
Apple, Inc. |
287 | 39,242 | 1.90 | % | ||||||||
Mettler-Toledo International, Inc. |
28 | 39,079 | 1.90 | % | ||||||||
Dollar General Corporation |
180 | 38,945 | 1.89 | % | ||||||||
3M Company (The) |
196 | 38,899 | 1.89 | % | ||||||||
Clorox Company (The) |
216 | 38,843 | 1.88 | % | ||||||||
Best Buy Company, Inc. |
337 | 38,790 | 1.88 | % | ||||||||
Home Depot, Inc. (The) |
122 | 38,779 | 1.88 | % | ||||||||
O’Reilly Automotive, Inc. |
68 | 38,758 | 1.88 | % | ||||||||
Cummins, Inc. |
158 | 38,608 | 1.87 | % | ||||||||
Church & Dwight Company, Inc. |
453 | 38,587 | 1.87 | % | ||||||||
United Parcel Service, Inc. - Class B |
185 | 38,577 | 1.87 | % | ||||||||
ANSYS, Inc. |
111 | 38,536 | 1.87 | % | ||||||||
International Paper Company (The) |
629 | 38,535 | 1.87 | % | ||||||||
Eaton Corporation PLC |
260 | 38,526 | 1.87 | % | ||||||||
Cintas Corporation |
101 | 38,516 | 1.87 | % | ||||||||
Walgreens Boots Alliance, Inc. |
731 | 38,468 | 1.87 | % | ||||||||
Automatic Data Processing, Inc. |
193 | 38,382 | 1.86 | % | ||||||||
Caterpillar, Inc. |
176 | 38,372 | 1.86 | % | ||||||||
Target Corporation |
159 | 38,328 | 1.86 | % | ||||||||
Pfizer, Inc. |
978 | 38,315 | 1.86 | % | ||||||||
Fastenal Company |
737 | 38,308 | 1.86 | % | ||||||||
Lululemon Athletica, Inc. |
105 | 38,273 | 1.86 | % | ||||||||
PACCAR, Inc. |
429 | 38,255 | 1.86 | % | ||||||||
Costco Wholesale Corporation |
97 | 38,251 | 1.86 | % | ||||||||
Emerson Electric Company |
397 | 38,234 | 1.85 | % | ||||||||
Humana, Inc. |
86 | 38,226 | 1.85 | % | ||||||||
Slack Technologies, Inc. - Class A |
863 | 38,225 | 1.85 | % | ||||||||
Rockwell Automation, Inc. |
134 | 38,190 | 1.85 | % | ||||||||
Stanley Black & Decker, Inc. |
186 | 38,171 | 1.85 | % | ||||||||
West Pharmaceutical Services, Inc. |
106 | 38,037 | 1.85 | % | ||||||||
L Brands, Inc. |
528 | 38,028 | 1.84 | % | ||||||||
AT&T, Inc. |
1,320 | 37,994 | 1.84 | % | ||||||||
HCA Healthcare, Inc. |
184 | 37,977 | 1.84 | % | ||||||||
McDonald’s Corporation |
164 | 37,904 | 1.84 | % | ||||||||
Align Technology, Inc. |
62 | 37,892 | 1.84 | % | ||||||||
See accompanying notes to financial statements. |
CRM Funds |
|
60 |
||
CRM FUNDS CRM LONG/SHORT OPPORTUNITIES FUND SCHEDULE OF INVESTMENTS (Continued) June 30, 2021 |
Reference Entity |
Shares |
Market |
% of Total |
|||||||||
Moody’s Corporation |
104 | $ | 37,865 | 1.84 | % | |||||||
Ecolab, Inc. |
184 | 37,861 | 1.84 | % | ||||||||
CVS Health Corporation |
454 | 37,849 | 1.84 | % | ||||||||
VF Corporation |
460 | 37,752 | 1.83 | % | ||||||||
Restaurant Brands International, Inc. |
586 | 37,746 | 1.83 | % | ||||||||
Starbucks Corporation |
337 | 37,724 | 1.83 | % | ||||||||
W. W. Grainger, Inc. |
86 | 37,714 | 1.83 | % | ||||||||
Cognizant Technology Solutions Corporation |
541 | 37,473 | 1.82 | % | ||||||||
Magna International, Inc. |
404 | 37,440 | 1.82 | % | ||||||||
General Motors Company |
632 | 37,424 | 1.82 | % | ||||||||
Fiserv, Inc. |
350 | 37,404 | 1.81 | % | ||||||||
Realty Income Corporation |
560 | 37,361 | 1.81 | % | ||||||||
Ford Motor Company |
2,511 | 37,310 | 1.81 | % | ||||||||
Kroger Company (The) |
973 | 37,263 | 1.81 | % | ||||||||
Canadian Imperial Bank of Commerce (The) |
326 | 37,125 | 1.80 | % | ||||||||
Fox Corporation - Class A |
994 | 36,916 | 1.79 | % | ||||||||
Fidelity National Information Services, Inc. |
260 | 36,764 | 1.78 | % | ||||||||
| $ | 2,061,378 | 100.00 | % | |||||||||
The following table represents the individual positions and related values of underlying securities of Morgan Stanley Custom Basket (MSCMS323) Index total return swap with Morgan Stanley Bank as of June 30, 2021, termination date 7/28/21:
Reference Entity |
Shares |
Market |
% of Total |
|||||||||
Sysco Corporation |
665 | $ | 51,705 | 2.55 | % | |||||||
Constellation Brands, Inc. - Class A |
221 | 51,682 | 2.55 | % | ||||||||
Micron Technology, Inc. |
608 | 51,660 | 2.55 | % | ||||||||
Apple, Inc. |
376 | 51,507 | 2.54 | % | ||||||||
Generac Holdings, Inc. |
124 | 51,426 | 2.54 | % | ||||||||
LyondellBasell Industries NV - Class A |
498 | 51,276 | 2.53 | % | ||||||||
Estée Lauder Companies, Inc (The) |
161 | 51,258 | 2.53 | % | ||||||||
Altria Group, Inc. |
1,074 | 51,225 | 2.53 | % | ||||||||
General Motors Company |
864 | 51,146 | 2.53 | % | ||||||||
Motorola Solutions, Inc. |
236 | 51,098 | 2.52 | % | ||||||||
PepsiCo, Inc. |
345 | 51,077 | 2.52 | % | ||||||||
General Mills, Inc. |
837 | 51,006 | 2.52 | % | ||||||||
Philip Morris International, Inc. |
514 | 50,914 | 2.51 | % | ||||||||
Mettler-Toledo International, Inc. |
37 | 50,822 | 2.51 | % | ||||||||
Clorox Company (The) |
282 | 50,809 | 2.51 | % | ||||||||
See accompanying notes to financial statements. |
CRM Funds |
|
61 |
||
CRM FUNDS CRM LONG/SHORT OPPORTUNITIES FUND SCHEDULE OF INVESTMENTS (Continued) June 30, 2021 |
Reference Entity |
Shares |
Market |
% of Total |
|||||||||
McCormick & Company, Inc. |
575 | $ | 50,785 | 2.51 | % | |||||||
Church & Dwight Company, Inc. |
596 | 50,783 | 2.51 | % | ||||||||
Cisco Systems, Inc. |
957 | 50,726 | 2.51 | % | ||||||||
AT&T, Inc. |
1,761 | 50,687 | 2.50 | % | ||||||||
Hormel Foods Corporation |
1,061 | 50,666 | 2.50 | % | ||||||||
HCA Healthcare, Inc. |
245 | 50,643 | 2.50 | % | ||||||||
Kellogg Company (The) |
787 | 50,625 | 2.50 | % | ||||||||
Magna International, Inc. |
546 | 50,600 | 2.50 | % | ||||||||
Hershey Company (The) |
290 | 50,583 | 2.50 | % | ||||||||
Humana, Inc. |
114 | 50,441 | 2.49 | % | ||||||||
Slack Technologies, Inc. - Class A |
1,138 | 50,403 | 2.49 | % | ||||||||
ANSYS, Inc. |
145 | 50,387 | 2.49 | % | ||||||||
Ford Motor Company |
3,388 | 50,349 | 2.49 | % | ||||||||
Moody’s Corporation |
139 | 50,219 | 2.48 | % | ||||||||
Ecolab, Inc. |
243 | 50,135 | 2.48 | % | ||||||||
West Pharmaceutical Services, Inc. |
140 | 50,115 | 2.47 | % | ||||||||
Fiserv, Inc. |
469 | 50,106 | 2.47 | % | ||||||||
Cognizant Technology Solutions Corporation |
723 | 50,044 | 2.47 | % | ||||||||
Duke Energy Corporation |
507 | 50,034 | 2.47 | % | ||||||||
Fidelity National Information Services, Inc. |
353 | 50,027 | 2.47 | % | ||||||||
Realty Income Corporation |
747 | 49,873 | 2.46 | % | ||||||||
DocuSign, Inc. |
178 | 49,870 | 2.46 | % | ||||||||
Align Technology, Inc. |
82 | 49,830 | 2.46 | % | ||||||||
Zscaler, Inc. |
229 | 49,494 | 2.44 | % | ||||||||
Kroger Company (The) |
1,288 | 49,335 | 2.44 | % | ||||||||
| $ | 2,025,371 | 100.00 | % | |||||||||
The following table represents the individual positions and related values of underlying securities of Morgan Stanley Custom Basket (MSCMS324) Index total return swap with Morgan Stanley Bank as of June 30, 2021, termination date 7/28/21:
Reference Entity |
Shares |
Market |
% of Total |
|||||||||
Sysco Corporation |
671 | $ | 52,202 | 2.57 | % | |||||||
Micron Technology, Inc. |
613 | 52,069 | 2.56 | % | ||||||||
Altria Group, Inc. |
1,086 | 51,790 | 2.55 | % | ||||||||
General Mills, Inc. |
846 | 51,574 | 2.53 | % | ||||||||
Hershey Company (The) |
295 | 51,457 | 2.53 | % | ||||||||
Constellation Brands, Inc. - Class A |
220 | 51,453 | 2.53 | % | ||||||||
Philip Morris International, Inc. |
519 | 51,420 | 2.53 | % | ||||||||
See accompanying notes to financial statements. |
CRM Funds |
|
62 |
||
CRM FUNDS CRM LONG/SHORT OPPORTUNITIES FUND SCHEDULE OF INVESTMENTS (Concluded) June 30, 2021 |
Reference Entity |
Shares |
Market |
% of Total |
|||||||||
Generac Holdings, Inc. |
124 | $ | 51,398 | 2.53 | % | |||||||
PepsiCo, Inc. |
346 | 51,238 | 2.52 | % | ||||||||
McCormick & Company, Inc. |
580 | 51,218 | 2.52 | % | ||||||||
Kellogg Company (The) |
795 | 51,130 | 2.51 | % | ||||||||
Duke Energy Corporation |
518 | 51,123 | 2.51 | % | ||||||||
LyondellBasell Industries NV |
497 | 51,121 | 2.51 | % | ||||||||
General Motors Company |
864 | 51,106 | 2.51 | % | ||||||||
Apple, Inc. |
373 | 51,047 | 2.51 | % | ||||||||
Hormel Foods Corporation |
1,069 | 51,037 | 2.51 | % | ||||||||
AT&T, Inc. |
1,773 | 51,025 | 2.51 | % | ||||||||
HCA Healthcare, Inc. |
247 | 51,025 | 2.51 | % | ||||||||
Church & Dwight Company, Inc. |
598 | 50,980 | 2.51 | % | ||||||||
Clorox Company (The) |
283 | 50,957 | 2.50 | % | ||||||||
Fiserv, Inc. |
477 | 50,955 | 2.50 | % | ||||||||
Estée Lauder Companies, Inc (The) |
160 | 50,904 | 2.50 | % | ||||||||
Cisco Systems, Inc. |
960 | 50,899 | 2.50 | % | ||||||||
Waters Corporation |
147 | 50,880 | 2.50 | % | ||||||||
Humana, Inc. |
115 | 50,862 | 2.50 | % | ||||||||
Motorola Solutions, Inc. |
234 | 50,775 | 2.50 | % | ||||||||
Fidelity National Information Services, Inc. |
358 | 50,723 | 2.49 | % | ||||||||
West Pharmaceutical Services, Inc. |
141 | 50,685 | 2.49 | % | ||||||||
Magna International, Inc. |
546 | 50,551 | 2.48 | % | ||||||||
Mettler-Toledo International, Inc. |
36 | 50,365 | 2.48 | % | ||||||||
Slack Technologies, Inc. - Class A |
1,136 | 50,324 | 2.47 | % | ||||||||
Ford Motor Company |
3,385 | 50,305 | 2.47 | % | ||||||||
Ecolab, Inc. |
244 | 50,295 | 2.47 | % | ||||||||
Moody’s Corporation |
139 | 50,262 | 2.47 | % | ||||||||
Kroger Company (The) |
1,308 | 50,106 | 2.46 | % | ||||||||
ANSYS, Inc. |
144 | 50,024 | 2.46 | % | ||||||||
Cognizant Technology Solutions Corporation |
722 | 49,975 | 2.46 | % | ||||||||
DocuSign, Inc. |
179 | 49,936 | 2.45 | % | ||||||||
Realty Income Corporation |
748 | 49,908 | 2.45 | % | ||||||||
Zscaler, Inc. |
229 | 49,578 | 2.44 | % | ||||||||
| $ | 2,034,682 | 100.00 | % | |||||||||
See accompanying notes to financial statements. |
CRM Funds |
|
63 |
||
CRM FUNDS STATEMENTS OF ASSETS AND LIABILITIES JUNE 30, 2021 |
CRM Small Cap |
CRM Small/Mid |
CRM Mid Cap |
||||||||||
ASSETS: |
||||||||||||
Investments in securities |
||||||||||||
Investments in securities, at cost |
$ | 260,143,384 | $ | 223,387,584 | $ | 334,402,967 | ||||||
Net unrealized appreciation |
76,948,191 | 103,400,419 | 139,013,923 | |||||||||
Total investments in securities, at value1 |
337,091,575 | 326,788,003 | 473,416,890 | |||||||||
Receivable for securities sold |
1,337,670 | 509,800 | 768,924 | |||||||||
Dividends and interest receivable |
180,422 | 261,066 | 258,583 | |||||||||
Receivable for fund shares sold |
2,168 | 21,114 | 102,777 | |||||||||
Receivable for securities lending income |
393 | 2,338 | 1,724 | |||||||||
Other assets |
27,377 | 52,389 | 35,690 | |||||||||
Total Assets |
338,639,605 | 327,634,710 | 474,584,588 | |||||||||
LIABILITIES: |
||||||||||||
Obligation to return securities lending collateral |
— | 13,182,284 | 25,597,968 | |||||||||
Payable for securities purchased |
523,883 | 839,021 | 9,264,805 | |||||||||
Payable for fund shares redeemed |
92,900 | 68,602 | 228,171 | |||||||||
Accrued advisory fee |
211,546 | 217,637 | 272,412 | |||||||||
Trustees fees payable |
2,812 | 2,964 | 3,607 | |||||||||
Audit and tax fees |
21,854 | 22,882 | 27,670 | |||||||||
Other accrued expenses |
67,860 | 76,052 | 132,169 | |||||||||
Total Liabilities |
920,855 | 14,409,442 | 35,526,802 | |||||||||
NET ASSETS |
$ | 337,718,750 | $ | 313,225,268 | $ | 439,057,786 | ||||||
COMPONENTS OF NET ASSETS |
||||||||||||
Paid in capital |
$ | 236,758,362 | $ | 165,878,819 | $ | 241,280,825 | ||||||
Total distributable earnings |
100,960,388 | 147,346,449 | 197,776,961 | |||||||||
NET ASSETS |
$ | 337,718,750 | $ | 313,225,268 | $ | 439,057,786 | ||||||
NET ASSET VALUE PER SHARE |
||||||||||||
INVESTOR CLASS SHARES |
||||||||||||
Net assets |
$ | 38,548,344 | $ | 26,463,763 | $ | 187,541,170 | ||||||
Shares of Beneficial Interest Outstanding ($0.01 par value, unlimited authorized shares) |
2,222,267 | 1,721,589 | 6,767,131 | |||||||||
Net asset value, offering and redemption price per share |
$ | 17.35 | $ | 15.37 | $ | 27.71 | ||||||
INSISTUTIONAL CLASS SHARES |
||||||||||||
Net assets |
$ | 299,170,406 | $ | 286,761,505 | $ | 251,516,616 | ||||||
Shares of Beneficial Interest Outstanding ($0.01 par value, unlimited authorized shares) |
14,558,864 | 18,072,013 | 8,672,627 | |||||||||
Net asset value, offering and redemption price per share |
$ | 20.55 | $ | 15.87 | $ | 29.00 | ||||||
1 Includes securities loaned of: |
$ | — | $ | 13,134,738 | $ | 25,739,639 | ||||||
See accompanying notes to financial statements. |
CRM Funds |
|
64 |
||
CRM FUNDS STATEMENTS OF ASSETS AND LIABILITIES JUNE 30, 2021 |
CRM All Cap |
CRM Long/Short |
|||||||
ASSETS: |
||||||||
Investments in securities |
||||||||
Investments in securities, at cost |
$ | 20,064,952 | $ | 100,441,640 | ||||
Net unrealized appreciation |
7,187,456 | 27,184,015 | ||||||
Total investments in securities, at value1 |
27,252,408 | 127,625,655 | ||||||
Cash |
— | 24,829 | ||||||
Cash pledged with broker for securities sold short |
— | 42,699,041 | ||||||
Foreign currencies held with broker for securities sold short (cost $0 and $3,381,735, respectively) |
— | 3,403,780 | ||||||
Receivable for securities sold |
397,097 | 4,159,151 | ||||||
Dividends and interest receivable |
17,156 | 99,442 | ||||||
Receivable for fund shares sold |
8,057 | 509,934 | ||||||
Receivable for securities lending income |
73 | — | ||||||
Unrealized appreciation on swap agreements |
— | 749,351 | ||||||
Other assets |
16,351 | 32,629 | ||||||
Total Assets |
27,691,142 | 179,303,812 | ||||||
LIABILITIES: |
||||||||
Obligation to return securities lending collateral |
339,640 | — | ||||||
Cash received from broker for swap agreements |
— | 238,992 | ||||||
Securities sold short, at value (proceeds $0 and $48,220,715, respectively) |
— | 49,206,056 | ||||||
Unrealized depreciation on swap agreements |
— | 404,978 | ||||||
Payable for dividends on securities sold short |
— | 160,470 | ||||||
Payable for securities purchased |
— | 1,128,319 | ||||||
Payable for fund shares redeemed |
750 | 40,605 | ||||||
Accrued advisory fee |
15,899 | 149,728 | ||||||
Trustees fees payable |
224 | 1,131 | ||||||
Audit and tax fees |
9,926 | 15,629 | ||||||
Other accrued expenses |
15,284 | 27,488 | ||||||
Total Liabilities |
381,723 | 51,373,396 | ||||||
NET ASSETS |
$ | 27,309,419 | $ | 127,930,416 | ||||
COMPONENTS OF NET ASSETS |
||||||||
Paid in capital |
$ | 16,018,990 | $ | 113,697,629 | ||||
Total distributable earnings |
11,290,429 | 14,232,787 | ||||||
NET ASSETS |
$ | 27,309,419 | $ | 127,930,416 | ||||
NET ASSET VALUE PER SHARE |
||||||||
INVESTOR CLASS SHARES |
||||||||
Net assets |
$ | 8,916,260 | ||||||
Shares of Beneficial Interest Outstanding ($0.01 par value, unlimited authorized shares) |
1,004,257 | |||||||
Net asset value, offering and redemption price per share |
$ | 8.88 | ||||||
INSTITUTIONAL CLASS SHARES |
||||||||
Net assets |
$ | 18,393,159 | $ | 127,930,416 | ||||
Shares of Beneficial Interest Outstanding ($0.01 par value, unlimited authorized shares) |
2,016,333 | 11,008,525 | ||||||
Net asset value, offering and redemption price per share |
$ | 9.12 | $ | 11.62 | ||||
1 Includes securities loaned of: |
$ | 349,546 | $ | — | ||||
See accompanying notes to financial statements. |
CRM Funds |
|
65 |
||
CRM FUNDS STATEMENTS OF OPERATIONS FOR THE YEAR ENDED JUNE 30, 2021 |
CRM Small Cap |
CRM Small/Mid |
CRM Mid Cap |
||||||||||
INVESTMENT INCOME: |
||||||||||||
Dividends and interest |
$ | 4,130,882 | $ | 5,871,753 | $ | 7,247,194 | ||||||
Securities lending income |
6,995 | 33,655 | 36,707 | |||||||||
Foreign tax withheld |
(27,060 | ) | (17,040 | ) | — | |||||||
Total investment income |
4,110,817 | 5,888,368 | 7,283,901 | |||||||||
EXPENSES: |
||||||||||||
Investment advisory fees |
2,134,085 | 2,294,426 | 3,052,345 | |||||||||
Sub-Transfer agent fees - Institutional Shares |
20,921 | 85,581 | 102,132 | |||||||||
Shareholder Services - Investor Shares |
88,446 | 54,056 | 425,857 | |||||||||
Administration and accounting fees |
77,457 | 82,592 | 107,945 | |||||||||
Transfer agent fees |
65,129 | 69,285 | 90,905 | |||||||||
Trustee fees and expenses |
45,022 | 47,966 | 66,578 | |||||||||
Registration fees |
43,824 | 47,228 | 49,151 | |||||||||
Insurance fees |
35,861 | 37,800 | 54,961 | |||||||||
Legal fees |
31,310 | 33,401 | 45,731 | |||||||||
Audit and tax fees |
21,608 | 22,582 | 27,478 | |||||||||
Shareholder reports |
15,051 | 23,054 | 41,851 | |||||||||
Custody fees |
8,785 | 8,287 | 7,003 | |||||||||
Other expenses |
76,068 | 81,319 | 108,300 | |||||||||
Total expenses |
2,663,567 | 2,887,577 | 4,180,237 | |||||||||
NET INVESTMENT INCOME |
1,447,250 | 3,000,791 | 3,103,664 | |||||||||
NET REALIZED AND UNREALIZED GAIN ON INVESTMENTS |
||||||||||||
Net realized gain from: |
||||||||||||
Investments |
38,004,198 | 76,004,514 | 81,107,170 | |||||||||
Net change in unrealized appreciation on investments |
80,909,936 | 75,470,790 | 91,340,890 | |||||||||
Net realized and unrealized gain on investments |
118,914,134 | 151,475,304 | 172,448,060 | |||||||||
NET INCREASE IN NET ASSETS RESULTING FROM OPERATIONS |
$ | 120,361,384 | $ | 154,476,095 | $ | 175,551,724 | ||||||
See accompanying notes to financial statements. |
CRM Funds |
|
66 |
||
CRM FUNDS STATEMENTS OF OPERATIONS FOR THE YEAR ENDED JUNE 30, 2021 |
CRM All Cap |
CRM Long/Short |
|||||||
INVESTMENT INCOME: |
||||||||
Dividends and interest |
$ | 458,467 | $ | 612,334 | ||||
Securities lending income |
9,731 | — | ||||||
Foreign tax withheld |
(1,990 | ) | (14,459 | ) | ||||
Total investment income |
466,208 | 597,875 | ||||||
EXPENSES: |
||||||||
Investment advisory fees |
198,074 | 1,473,346 | ||||||
Dividend expense on securities sold short |
— | 774,841 | ||||||
Interest expense |
— | 387,788 | ||||||
Sub-Transfer agent fees - Institutional Shares |
315 | 18,601 | ||||||
Shareholder Services - Investor Shares |
19,845 | — | ||||||
Registration fees |
35,338 | 37,440 | ||||||
Transfer agent fees |
24,162 | 25,054 | ||||||
Administration and accounting fees |
13,051 | 31,075 | ||||||
Audit and tax fees |
9,734 | 15,708 | ||||||
Trustee fees and expenses |
4,699 | 14,236 | ||||||
Custody fees |
4,512 | 8,599 | ||||||
Insurance fees |
3,998 | 14,166 | ||||||
Legal fees |
3,221 | 10,528 | ||||||
Shareholder reports |
2,095 | 7,452 | ||||||
Other expenses |
20,428 | 33,330 | ||||||
Total expenses |
339,472 | 2,852,164 | ||||||
Expenses waived |
(3,660 | ) | (115,570 | ) | ||||
Net expenses |
335,812 | 2,736,594 | ||||||
NET INVESTMENT INCOME (LOSS) |
130,396 | (2,138,719 | ) | |||||
NET REALIZED AND UNREALIZED GAIN (LOSS) ON INVESTMENTS, DERIVATIVES AND FOREIGN CURRENCY |
||||||||
Net realized gain (loss) from: |
||||||||
Investments |
7,873,250 | 15,681,961 | ||||||
Securities sold short |
— | (19,250,390 | ) | |||||
Swap agreements |
— | (1,878,630 | ) | |||||
Foreign currency transactions |
— | 276,523 | ||||||
Net realized gain (loss) |
7,873,250 | (5,170,536 | ) | |||||
Net change in unrealized appreciation (depreciation) on: |
||||||||
Investments |
4,417,506 | 21,033,783 | ||||||
Securities sold short |
— | (1,538,184 | ) | |||||
Swap agreements |
— | 103,107 | ||||||
Foreign currency transactions |
— | (2,417 | ) | |||||
Net change in unrealized appreciation |
4,417,506 | 19,596,289 | ||||||
Net realized and unrealized gain on investments, derivatives and foreign currency |
12,290,756 | 14,425,753 | ||||||
NET INCREASE IN NET ASSETS RESULTING FROM OPERATIONS |
$ | 12,421,152 | $ | 12,287,034 | ||||
See accompanying notes to financial statements. |
CRM Funds |
|
67 |
||
CRM FUNDS STATEMENTS OF CHANGES IN NET ASSETS
|
CRM Small Cap Value Fund |
||||||||
Year Ended |
Year Ended |
|||||||
NET ASSETS - BEGINNING OF YEAR |
$ | 232,115,097 | $ | 325,349,323 | ||||
OPERATIONS |
||||||||
Net investment income |
1,447,250 | 1,380,602 | ||||||
Net realized gain (loss) from investments |
38,004,198 | (9,006,927 | ) | |||||
Net change in unrealized appreciation (depreciation) on investments |
80,909,936 | (55,588,689 | ) | |||||
Net increase (decrease) in net assets resulting from operations |
120,361,384 | (63,215,014 | ) | |||||
DISTRIBUTIONS TO SHAREHOLDERS |
||||||||
Investor Class |
(168,344 | ) | (3,814,720 | ) | ||||
Institutional Class |
(1,454,839 | ) | (16,284,198 | ) | ||||
Total distributions to shareholders |
(1,623,183 | ) | (20,098,918 | ) | ||||
CAPITAL SHARE TRANSACTIONS |
||||||||
Sale of shares - Investor Shares |
267,991 | 1,066,476 | ||||||
Sale of shares - Institutional Shares |
35,721,319 | 39,703,170 | ||||||
Reinvestment of distributions - Investor Class |
156,487 | 3,730,997 | ||||||
Reinvestment of distributions - Institutional Class |
1,329,633 | 14,870,115 | ||||||
Redemption of shares - Investor Class |
(10,335,074 | ) | (16,501,839 | ) | ||||
Redemption of shares - Institutional Class |
(40,274,904 | ) | (52,789,213 | ) | ||||
Net decrease from capital share transactions |
(13,134,548 | ) | (9,920,294 | ) | ||||
Total increase (decrease) in net assets |
105,603,653 | (93,234,226 | ) | |||||
NET ASSETS - END OF YEAR |
$ | 337,718,750 | $ | 232,115,097 | ||||
SHARE ACTIVITY |
||||||||
Investor Class: |
||||||||
Sold |
18,760 | 84,946 | ||||||
Issued on reinvestment of distributions |
10,867 | 248,237 | ||||||
Redeemed |
(795,195 | ) | (1,178,420 | ) | ||||
Net decrease |
(765,568 | ) | (845,237 | ) | ||||
Institutional Class: |
||||||||
Sold |
2,005,656 | 2,680,745 | ||||||
Issued on reinvestment of distributions |
78,076 | 837,281 | ||||||
Redeemed |
(2,479,372 | ) | (3,408,561 | ) | ||||
Net increase (decrease) |
(395,640 | ) | 109,465 | |||||
See accompanying notes to financial statements. |
CRM Funds |
|
68 |
||
CRM FUNDS STATEMENTS OF CHANGES IN NET ASSETS
|
CRM Small/Mid Cap Value Fund |
||||||||
Year Ended |
Year Ended |
|||||||
NET ASSETS - BEGINNING OF YEAR |
$ | 237,177,963 | $ | 278,418,803 | ||||
OPERATIONS |
||||||||
Net investment income |
3,000,791 | 1,056,057 | ||||||
Net realized gain from investments |
76,004,514 | 3,099,248 | ||||||
Net change in unrealized appreciation (depreciation) on investments |
75,470,790 | (31,855,774 | ) | |||||
Net increase (decrease) in net assets resulting from operations |
154,476,095 | (27,700,469 | ) | |||||
DISTRIBUTIONS TO SHAREHOLDERS |
||||||||
Investor Class |
(1,231,736 | ) | (584,788 | ) | ||||
Institutional Class |
(15,385,614 | ) | (7,212,793 | ) | ||||
Total distributions to shareholders |
(16,617,350 | ) | (7,797,581 | ) | ||||
CAPITAL SHARE TRANSACTIONS |
||||||||
Sale of shares - Investor Shares |
3,952,396 | 888,579 | ||||||
Sale of shares - Institutional Shares |
42,456,508 | 90,880,987 | ||||||
Reinvestment of distributions - Investor Class |
1,194,282 | 573,767 | ||||||
Reinvestment of distributions - Institutional Class |
15,179,709 | 7,193,058 | ||||||
Redemption of shares - Investor Class |
(4,495,480 | ) | (6,558,356 | ) | ||||
Redemption of shares - Institutional Class |
(120,098,855 | ) | (98,720,825 | ) | ||||
Net decrease from capital share transactions |
(61,811,440 | ) | (5,742,790 | ) | ||||
Total increase (decrease) in net assets |
76,047,305 | (41,240,840 | ) | |||||
NET ASSETS - END OF YEAR |
$ | 313,225,268 | $ | 237,177,963 | ||||
SHARE ACTIVITY |
||||||||
Investor Class: |
||||||||
Sold |
295,798 | 86,082 | ||||||
Issued on reinvestment of distributions |
97,333 | 49,849 | ||||||
Redeemed |
(346,756 | ) | (612,599 | ) | ||||
Net increase (decrease) |
46,375 | (476,668 | ) | |||||
Institutional Class: |
||||||||
Sold |
3,088,348 | 8,402,157 | ||||||
Issued on reinvestment of distributions |
1,199,977 | 607,009 | ||||||
Redeemed |
(8,311,017 | ) | (8,621,471 | ) | ||||
Net increase (decrease) |
(4,022,692 | ) | 387,695 | |||||
See accompanying notes to financial statements. |
CRM Funds |
|
69 |
||
CRM FUNDS STATEMENTS OF CHANGES IN NET ASSETS
|
CRM Mid Cap Value Fund |
||||||||
Year Ended |
Year Ended |
|||||||
NET ASSETS - BEGINNING OF YEAR |
$ | 355,358,590 | $ | 463,865,471 | ||||
OPERATIONS |
||||||||
Net investment income |
3,103,664 | 2,100,108 | ||||||
Net realized gain from investments |
81,107,170 | 6,834,503 | ||||||
Net change in unrealized appreciation (depreciation) on investments |
91,340,890 | (55,329,119 | ) | |||||
Net increase (decrease) in net assets resulting from operations |
175,551,724 | (46,394,508 | ) | |||||
DISTRIBUTIONS TO SHAREHOLDERS |
||||||||
Investor Class |
(3,324,082 | ) | (5,947,237 | ) | ||||
Institutional Class |
(4,771,658 | ) | (7,186,280 | ) | ||||
Total distributions to shareholders |
(8,095,740 | ) | (13,133,517 | ) | ||||
CAPITAL SHARE TRANSACTIONS |
||||||||
Sale of shares - Investor Shares |
11,421,455 | 14,793,454 | ||||||
Sale of shares - Institutional Shares |
40,148,943 | 36,256,400 | ||||||
Reinvestment of distributions - Investor Class |
3,272,938 | 5,866,784 | ||||||
Reinvestment of distributions - Institutional Class |
4,428,155 | 6,739,194 | ||||||
Redemption of shares - Investor Class |
(49,161,690 | ) | (60,602,327 | ) | ||||
Redemption of shares - Institutional Class |
(93,866,589 | ) | (52,032,361 | ) | ||||
Net decrease from capital share transactions |
(83,756,788 | ) | (48,978,856 | ) | ||||
Total increase (decrease) in net assets |
83,699,196 | (108,506,881 | ) | |||||
NET ASSETS - END OF YEAR |
$ | 439,057,786 | $ | 355,358,590 | ||||
SHARE ACTIVITY |
||||||||
Investor Class: |
||||||||
Sold |
467,366 | 735,472 | ||||||
Issued on reinvestment of distributions |
145,335 | 279,904 | ||||||
Redeemed |
(2,153,239 | ) | (3,073,764 | ) | ||||
Net decrease |
(1,540,538 | ) | (2,058,388 | ) | ||||
Institutional Class: |
||||||||
Sold |
1,633,299 | 1,816,297 | ||||||
Issued on reinvestment of distributions |
188,112 | 307,866 | ||||||
Redeemed |
(3,735,918 | ) | (2,540,884 | ) | ||||
Net decrease |
(1,914,507 | ) | (416,721 | ) | ||||
See accompanying notes to financial statements. |
CRM Funds |
|
70 |
||
CRM FUNDS STATEMENTS OF CHANGES IN NET ASSETS
|
CRM All Cap Value Fund |
||||||||
Year Ended |
Year Ended |
|||||||
NET ASSETS - BEGINNING OF YEAR |
$ | 25,200,275 | $ | 36,071,933 | ||||
OPERATIONS |
||||||||
Net investment income |
130,396 | 119,207 | ||||||
Net realized gain (loss) from investments |
7,873,250 | (504,138 | ) | |||||
Net change in unrealized appreciation (depreciation) on investments |
4,417,506 | (2,490,038 | ) | |||||
Net increase (decrease) in net assets resulting from operations |
12,421,152 | (2,874,969 | ) | |||||
DISTRIBUTIONS TO SHAREHOLDERS |
||||||||
Investor Class |
(201,693 | ) | (464,061 | ) | ||||
Institutional Class |
(732,769 | ) | (1,262,828 | ) | ||||
Total distributions to shareholders |
(934,462 | ) | (1,726,889 | ) | ||||
CAPITAL SHARE TRANSACTIONS |
||||||||
Sale of shares - Investor Shares |
394,164 | 1,091,387 | ||||||
Sale of shares - Institutional Shares |
6,014,048 | 5,292,178 | ||||||
Reinvestment of distributions - Investor Class |
169,619 | 423,885 | ||||||
Reinvestment of distributions - Institutional Class |
715,177 | 1,226,157 | ||||||
Redemption of shares - Investor Class |
(1,701,715 | ) | (2,744,524 | ) | ||||
Redemption of shares - Institutional Class |
(14,968,839 | ) | (11,558,883 | ) | ||||
Net decrease from capital share transactions |
(9,377,546 | ) | (6,269,800 | ) | ||||
Total increase (decrease) in net assets |
2,109,144 | (10,871,658 | ) | |||||
NET ASSETS - END OF YEAR |
$ | 27,309,419 | $ | 25,200,275 | ||||
SHARE ACTIVITY |
||||||||
Investor Class: |
||||||||
Sold |
57,076 | 183,256 | ||||||
Issued on reinvestment of distributions |
22,737 | 62,984 | ||||||
Redeemed |
(241,581 | ) | (404,933 | ) | ||||
Net decrease |
(161,768 | ) | (158,693 | ) | ||||
Institutional Class: |
||||||||
Sold |
786,663 | 829,319 | ||||||
Issued on reinvestment of distributions |
93,487 | 177,704 | ||||||
Redeemed |
(1,880,474 | ) | (1,737,300 | ) | ||||
Net decrease |
(1,000,324 | ) | (730,277 | ) | ||||
See accompanying notes to financial statements. |
CRM Funds |
|
71 |
||
CRM FUNDS STATEMENTS OF CHANGES IN NET ASSETS
|
CRM Long/Short Opportunities Fund |
||||||||
Year Ended |
Year Ended |
|||||||
NET ASSETS - BEGINNING OF YEAR |
$ | 56,540,273 | $ | 482,050,409 | ||||
OPERATIONS |
||||||||
Net investment loss |
(2,138,719 | ) | (2,752,199 | ) | ||||
Net realized gain (loss) from investments and foreign currency |
(5,170,536 | ) | 63,260,399 | |||||
Net change in unrealized appreciation (depreciation) on investments and foreign currency |
19,596,289 | (49,747,612 | ) | |||||
Net increase in net assets resulting from operations |
12,287,034 | 10,760,588 | ||||||
DISTRIBUTIONS TO SHAREHOLDERS |
||||||||
Institutional Class |
(4,340,824 | ) | (20,035,084 | ) | ||||
Total distributions to shareholders |
(4,340,824 | ) | (20,035,084 | ) | ||||
CAPITAL SHARE TRANSACTIONS |
||||||||
Sale of shares - Institutional Shares |
122,755,221 | 51,524,409 | ||||||
Reinvestment of distributions - Institutional Class |
4,329,863 | 19,967,847 | ||||||
Redemption of shares - Institutional Class |
(63,641,151 | ) | (487,727,896 | ) | ||||
Net increase (decrease) from capital share transactions |
63,443,933 | (416,235,640 | ) | |||||
Total increase (decrease) in net assets |
71,390,143 | (425,510,136 | ) | |||||
NET ASSETS - END OF YEAR |
$ | 127,930,416 | $ | 56,540,273 | ||||
SHARE ACTIVITY |
||||||||
Institutional Class: |
||||||||
Sold |
10,539,842 | 5,031,498 | ||||||
Issued on reinvestment of distributions |
387,287 | 1,988,830 | ||||||
Redeemed |
(5,444,550 | ) | (48,427,040 | ) | ||||
Net increase (decrease) |
5,482,579 | (41,406,712 | ) | |||||
See accompanying notes to financial statements. |
CRM Funds |
|
72 |
||
CRM FUNDS FINANCIAL HIGHLIGHTS
|
The following tables include selected data for a share outstanding throughout each period and other performance information derived from the financial statements. The total returns in the tables represent the rate an investor would have earned or lost on an investment in the funds (assuming reinvestment of all dividends and distributions). This information should be read in conjunction with the financial statements and notes thereto.
CRM Small Cap Value Fund — Investor Shares |
||||||||||||||||||||
For the Years Ended June 30, |
||||||||||||||||||||
2021 |
2020 |
2019 |
2018 |
2017 |
||||||||||||||||
Net Asset Value - Beginning of Year |
$ | 11.22 | $ | 15.34 | $ | 17.15 | $ | 18.06 | $ | 15.86 | ||||||||||
Investment operations: |
||||||||||||||||||||
Net investment income (loss)1 |
0.04 | 0.04 | 0.02 | 0.09 | 2 | (0.01 | ) | |||||||||||||
Net realized and unrealized gain (loss) on investments |
6.16 | (3.07 | ) | (0.22 | ) | 1.87 | 3.54 | |||||||||||||
Total from investment operations |
6.20 | (3.03 | ) | (0.20 | ) | 1.96 | 3.53 | |||||||||||||
Distributions to shareholders: |
||||||||||||||||||||
From net investment income |
(0.07 | ) | (0.03 | ) | (0.04 | ) | (0.09 | ) | (0.08 | ) | ||||||||||
From net realized gain on investments |
— | (1.06 | ) | (1.57 | ) | (2.78 | ) | (1.25 | ) | |||||||||||
Total distributions to shareholders |
(0.07 | ) | (1.09 | ) | (1.61 | ) | (2.87 | ) | (1.33 | ) | ||||||||||
Net Asset Value - End of Year |
$ | 17.35 | $ | 11.22 | $ | 15.34 | $ | 17.15 | $ | 18.06 | ||||||||||
Total return |
55.36 | % | (21.53 | )% | (0.17 | )% | 11.17 | % | 22.28 | % | ||||||||||
Ratios/Supplemental Data: |
||||||||||||||||||||
Ratios to average net assets: |
||||||||||||||||||||
Expenses |
1.15 | % | 1.16 | % | 1.15 | % | 1.13 | % | 1.15 | % | ||||||||||
Net investment income (loss) |
0.30 | % | 0.27 | % | 0.12 | % | 0.52 | %2 | (0.07 | )% | ||||||||||
Portfolio turnover rate |
63 | % | 60 | % | 48 | % | 49 | % | 91 | % | ||||||||||
Net Assets at end of year (000’s omitted) |
$ | 38,548 | $ | 33,526 | $ | 58,787 | $ | 76,779 | $ | 72,472 | ||||||||||
|
(1) |
Calculated using the average shares method. |
|
(2) |
For the year ended June 30, 2018, net investment income per share reflects special dividends which amount to $0.13 per share. Excluding the special dividends, the ratio of net investment income to average net assets would have been (0.22)%. |
See accompanying notes to financial statements. |
CRM Funds |
|
73 |
||
CRM FUNDS FINANCIAL HIGHLIGHTS
|
CRM Small Cap Value Fund — Institutional Shares |
||||||||||||||||||||
For the Years Ended June 30, |
||||||||||||||||||||
2021 |
2020 |
2019 |
2018 |
2017 |
||||||||||||||||
Net Asset Value - Beginning of Year |
$ | 13.28 | $ | 17.96 | $ | 19.77 | $ | 20.41 | $ | 17.78 | ||||||||||
Investment operations: |
||||||||||||||||||||
Net investment income1 |
0.09 | 0.08 | 0.07 | 0.16 | 2 | 0.03 | ||||||||||||||
Net realized and unrealized gain (loss) on investments |
7.28 | (3.63 | ) | (0.23 | ) | 2.11 | 3.97 | |||||||||||||
Total from investment operations |
7.37 | (3.55 | ) | (0.16 | ) | 2.27 | 4.00 | |||||||||||||
Distributions to shareholders: |
||||||||||||||||||||
From net investment income |
(0.10 | ) | (0.07 | ) | (0.08 | ) | (0.13 | ) | (0.12 | ) | ||||||||||
From net realized gain on investments |
— | (1.06 | ) | (1.57 | ) | (2.78 | ) | (1.25 | ) | |||||||||||
Total distributions to shareholders |
(0.10 | ) | (1.13 | ) | (1.65 | ) | (2.91 | ) | (1.37 | ) | ||||||||||
Net Asset Value - End of Year |
$ | 20.55 | $ | 13.28 | $ | 17.96 | $ | 19.77 | $ | 20.41 | ||||||||||
Total return |
55.68 | % | (21.34 | )% | 0.11 | % | 11.44 | % | 22.51 | % | ||||||||||
Ratios/Supplemental Data: |
||||||||||||||||||||
Ratios to average net assets: |
||||||||||||||||||||
Expenses |
0.91 | % | 0.92 | % | 0.91 | % | 0.89 | % | 0.91 | % | ||||||||||
Net investment income |
0.54 | % | 0.52 | % | 0.38 | % | 0.77 | %2 | 0.19 | % | ||||||||||
Portfolio turnover rate |
63 | % | 60 | % | 48 | % | 49 | % | 91 | % | ||||||||||
Net Assets at end of year (000’s omitted) |
$ | 299,170 | $ | 198,589 | $ | 266,562 | $ | 283,762 | $ | 348,689 | ||||||||||
|
(1) |
Calculated using the average shares method. |
|
(2) |
For the year ended June 30, 2018, net investment income per share reflects special dividends which amount to $0.15 per share. Excluding the special dividends, the ratio of net investment income to average net assets would have been 0.01%. |
See accompanying notes to financial statements. |
CRM Funds |
|
74 |
||
CRM FUNDS FINANCIAL HIGHLIGHTS
|
CRM Small/Mid Cap Value Fund — Investor Shares |
||||||||||||||||||||
For the Years Ended June 30, |
||||||||||||||||||||
2021 |
2020 |
2019 |
2018 |
2017 |
||||||||||||||||
Net Asset Value - Beginning of Year |
$ | 9.71 | $ | 11.36 | $ | 13.09 | $ | 14.54 | $ | 12.81 | ||||||||||
Investment operations: |
||||||||||||||||||||
Net investment income (loss)1 |
0.11 | 0.02 | 0.03 | (0.01 | ) | (0.01 | ) | |||||||||||||
Net realized and unrealized gain (loss) on investments |
6.29 | (1.35 | ) | (0.01 | ) | 2.15 | 2.04 | |||||||||||||
Total from investment operations |
6.40 | (1.33 | ) | 0.02 | 2.14 | 2.03 | ||||||||||||||
Distributions to shareholders: |
||||||||||||||||||||
From net investment income |
(0.03 | ) | (0.03 | ) | — | — | (0.30 | ) | ||||||||||||
From net realized gain on investments |
(0.71 | ) | (0.29 | ) | (1.75 | ) | (3.59 | ) | — | |||||||||||
Total distributions to shareholders |
(0.74 | ) | (0.32 | ) | (1.75 | ) | (3.59 | ) | (0.30 | ) | ||||||||||
Net Asset Value - End of Year |
$ | 15.37 | $ | 9.71 | $ | 11.36 | $ | 13.09 | $ | 14.54 | ||||||||||
Total return |
67.80 | % | (12.18 | )% | 1.91 | % | 16.75 | % | 15.87 | % | ||||||||||
Ratios/Supplemental Data: |
||||||||||||||||||||
Ratios to average net assets: |
||||||||||||||||||||
Expenses |
1.15 | % | 1.17 | % | 1.15 | % | 1.13 | % | 1.14 | % | ||||||||||
Net investment income (loss) |
0.83 | % | 0.22 | % | 0.21 | % | (0.05 | )% | (0.05 | )% | ||||||||||
Portfolio turnover rate |
59 | % | 80 | % | 45 | % | 48 | % | 76 | % | ||||||||||
Net Assets at end of year (000’s omitted) |
$ | 26,464 | $ | 16,259 | $ | 24,455 | $ | 29,116 | $ | 36,626 | ||||||||||
|
(1) |
Calculated using the average shares method. |
See accompanying notes to financial statements. |
CRM Funds |
|
75 |
||
CRM FUNDS FINANCIAL HIGHLIGHTS
|
CRM Small/Mid Cap Value Fund — Institutional Shares |
||||||||||||||||||||
For the Years Ended June 30, |
||||||||||||||||||||
2021 |
2020 |
2019 |
2018 |
2017 |
||||||||||||||||
Net Asset Value - Beginning of Year |
$ | 10.00 | $ | 11.70 | $ | 13.43 | $ | 14.80 | $ | 13.03 | ||||||||||
Investment operations: |
||||||||||||||||||||
Net investment income1 |
0.13 | 0.05 | 0.05 | 0.02 | 0.02 | |||||||||||||||
Net realized and unrealized gain (loss) on investments |
6.50 | (1.41 | ) | — | 2 | 2.20 | 2.08 | |||||||||||||
Total from investment operations |
6.63 | (1.36 | ) | 0.05 | 2.22 | 2.10 | ||||||||||||||
Distributions to shareholders: |
||||||||||||||||||||
From net investment income |
(0.05 | ) | (0.05 | ) | (0.03 | ) | — | (0.33 | ) | |||||||||||
From net realized gain on investments |
(0.71 | ) | (0.29 | ) | (1.75 | ) | (3.59 | ) | — | |||||||||||
Total distributions to shareholders |
(0.76 | ) | (0.34 | ) | (1.78 | ) | (3.59 | ) | (0.33 | ) | ||||||||||
Net Asset Value - End of Year |
$ | 15.87 | $ | 10.00 | $ | 11.70 | $ | 13.43 | $ | 14.80 | ||||||||||
Total return |
68.26 | % | (12.06 | )% | 2.13 | % | 17.03 | % | 16.19 | % | ||||||||||
Ratios/Supplemental Data: |
||||||||||||||||||||
Ratios to average net assets: |
||||||||||||||||||||
Expenses |
0.93 | % | 0.95 | % | 0.94 | % | 0.91 | % | 0.93 | % | ||||||||||
Net investment income |
0.99 | % | 0.44 | % | 0.42 | % | 0.16 | % | 0.13 | % | ||||||||||
Portfolio turnover rate |
59 | % | 80 | % | 45 | % | 48 | % | 76 | % | ||||||||||
Net Assets at end of year (000’s omitted) |
$ | 286,762 | $ | 220,919 | $ | 253,964 | $ | 261,428 | $ | 454,332 | ||||||||||
|
(1) |
Calculated using the average shares method. |
|
(2) |
Amount represents less than $0.005. |
See accompanying notes to financial statements. |
CRM Funds |
|
76 |
||
CRM FUNDS FINANCIAL HIGHLIGHTS
|
CRM Mid Cap Value Fund — Investor Shares |
||||||||||||||||||||
For the Years Ended June 30, |
||||||||||||||||||||
2021 |
2020 |
2019 |
2018 |
2017 |
||||||||||||||||
Net Asset Value - Beginning of Year |
$ | 18.34 | $ | 21.22 | $ | 22.58 | $ | 23.18 | $ | 20.80 | ||||||||||
Investment operations: |
||||||||||||||||||||
Net investment income1 |
0.15 | 0.08 | 0.08 | 0.14 | 2 | 0.13 | ||||||||||||||
Net realized and unrealized gain (loss) on investments |
9.67 | (2.33 | ) | 0.41 | 3.57 | 3.12 | ||||||||||||||
Total from investment operations |
9.82 | (2.25 | ) | 0.49 | 3.71 | 3.25 | ||||||||||||||
Distributions to shareholders: |
||||||||||||||||||||
From net investment income |
(0.09 | ) | (0.09 | ) | (0.04 | ) | (0.29 | ) | — | 3 | ||||||||||
From net realized gain on investments |
(0.36 | ) | (0.54 | ) | (1.81 | ) | (4.02 | ) | (0.87 | ) | ||||||||||
Total distributions to shareholders |
(0.45 | ) | (0.63 | ) | (1.85 | ) | (4.31 | ) | (0.87 | ) | ||||||||||
Net Asset Value - End of Year |
$ | 27.71 | $ | 18.34 | $ | 21.22 | $ | 22.58 | $ | 23.18 | ||||||||||
Total return |
54.09 | % | (10.98 | )% | 3.39 | % | 17.80 | % | 15.93 | % | ||||||||||
Ratios/Supplemental Data: |
||||||||||||||||||||
Ratios to average net assets: |
||||||||||||||||||||
Expenses |
1.15 | % | 1.16 | % | 1.14 | % | 1.11 | % | 1.15 | % | ||||||||||
Net investment income |
0.66 | % | 0.42 | % | 0.37 | % | 0.62 | %2 | 0.58 | % | ||||||||||
Portfolio turnover rate |
63 | % | 37 | % | 40 | % | 58 | % | 74 | % | ||||||||||
Net Assets at end of year (000’s omitted) |
$ | 187,541 | $ | 152,370 | $ | 220,014 | $ | 243,062 | $ | 229,541 | ||||||||||
|
(1) |
Calculated using the average shares method. |
|
(2) |
For the year ended June 30, 2018, net investment income per share reflects special dividends which amount to $0.13 per share. Excluding the special dividends, the ratio of net investment income to average net assets would have been 0.04%. |
|
(3) |
Amount represents less than $0.005. |
See accompanying notes to financial statements. |
CRM Funds |
|
77 |
||
CRM FUNDS FINANCIAL HIGHLIGHTS
|
CRM Mid Cap Value Fund — Institutional Shares |
||||||||||||||||||||
For the Years Ended June 30, |
||||||||||||||||||||
2021 |
2020 |
2019 |
2018 |
2017 |
||||||||||||||||
Net Asset Value - Beginning of Year |
$ | 19.17 | $ | 22.16 | $ | 23.49 | $ | 23.96 | $ | 21.46 | ||||||||||
Investment operations: |
||||||||||||||||||||
Net investment income1 |
0.20 | 0.12 | 0.13 | 0.19 | 2 | 0.15 | ||||||||||||||
Net realized and unrealized gain (loss) on investments |
10.12 | (2.44 | ) | 0.43 | 3.71 | 3.26 | ||||||||||||||
Total from investment operations |
10.32 | (2.32 | ) | 0.56 | 3.90 | 3.41 | ||||||||||||||
Distributions to shareholders: |
||||||||||||||||||||
From net investment income |
(0.13 | ) | (0.13 | ) | (0.08 | ) | (0.35 | ) | (0.04 | ) | ||||||||||
From net realized gain on investments |
(0.36 | ) | (0.54 | ) | (1.81 | ) | (4.02 | ) | (0.87 | ) | ||||||||||
Total distributions to shareholders |
(0.49 | ) | (0.67 | ) | (1.89 | ) | (4.37 | ) | (0.91 | ) | ||||||||||
Net Asset Value - End of Year |
$ | 29.00 | $ | 19.17 | $ | 22.16 | $ | 23.49 | $ | 23.96 | ||||||||||
Total return |
54.44 | % | (10.83 | )% | 3.61 | % | 18.04 | % | 16.19 | % | ||||||||||
Ratios/Supplemental Data: |
||||||||||||||||||||
Ratios to average net assets: |
||||||||||||||||||||
Expenses |
0.94 | % | 0.96 | % | 0.94 | % | 0.91 | % | 0.94 | % | ||||||||||
Net investment income |
0.84 | % | 0.59 | % | 0.58 | % | 0.82 | %2 | 0.63 | % | ||||||||||
Portfolio turnover rate |
63 | % | 37 | % | 40 | % | 58 | % | 74 | % | ||||||||||
Net Assets at end of year (000’s omitted) |
$ | 251,517 | $ | 202,989 | $ | 243,851 | $ | 312,290 | $ | 289,145 | ||||||||||
|
(1) |
Calculated using the average shares method. |
|
(2) |
For the year ended June 30, 2018, net investment income per share reflects special dividends which amount to $0.13 per share. Excluding the special dividends, the ratio of net investment income to average net assets would have been 0.24%. |
See accompanying notes to financial statements. |
CRM Funds |
|
78 |
||
CRM FUNDS FINANCIAL HIGHLIGHTS
|
CRM All Cap Value Fund — Investor Shares |
||||||||||||||||||||
For the Years Ended June 30, |
||||||||||||||||||||
2021 |
2020 |
2019 |
2018 |
2017 |
||||||||||||||||
Net Asset Value - Beginning of Year |
$ | 5.91 | $ | 6.99 | $ | 8.81 | $ | 9.28 | $ | 8.32 | ||||||||||
Investment operations: |
||||||||||||||||||||
Net investment income (loss)1 |
0.02 | 0.01 | 0.01 | (0.01 | ) | 0.03 | ||||||||||||||
Net realized and unrealized gain (loss) on investments |
3.16 | (0.67 | ) | (0.26 | ) | 1.00 | 1.32 | |||||||||||||
Total from investment operations |
3.18 | (0.66 | ) | (0.25 | ) | 0.99 | 1.35 | |||||||||||||
Distributions to shareholders: |
||||||||||||||||||||
From net investment income |
(0.02 | ) | (0.01 | ) | — | — | (0.03 | ) | ||||||||||||
From net realized gain on investments |
(0.19 | ) | (0.41 | ) | (1.57 | ) | (1.46 | ) | (0.36 | ) | ||||||||||
Total distributions to shareholders |
(0.21 | ) | (0.42 | ) | (1.57 | ) | (1.46 | ) | (0.39 | ) | ||||||||||
Net Asset Value - End of Year |
$ | 8.88 | $ | 5.91 | $ | 6.99 | $ | 8.81 | $ | 9.28 | ||||||||||
Total return |
54.42 | % | (10.16 | )% | (0.72 | )% | 11.20 | % | 16.66 | % | ||||||||||
Ratios/Supplemental Data: |
||||||||||||||||||||
Ratios to average net assets: |
||||||||||||||||||||
Expenses, including waiver/ reimbursement |
1.37 | % | 1.40 | % | 1.50 | % | 1.50 | % | 1.50 | % | ||||||||||
Expenses, excluding waiver/reimbursement |
1.39 | % | 1.50 | % | 2.20 | % | 1.93 | % | 1.95 | % | ||||||||||
Net investment income (loss), including waiver/reimbursement |
0.31 | % | 0.22 | % | 0.12 | % | (0.07 | )% | 0.36 | % | ||||||||||
Portfolio turnover rate |
87 | % | 65 | % | 112 | % | 72 | % | 91 | % | ||||||||||
Net Assets at end of year (000’s omitted) |
$ | 8,916 | $ | 6,893 | $ | 9,256 | $ | 4,694 | $ | 8,735 | ||||||||||
|
(1) |
Calculated using the average shares method. |
See accompanying notes to financial statements. |
CRM Funds |
|
79 |
||
CRM FUNDS FINANCIAL HIGHLIGHTS
|
CRM All Cap Value Fund — Institutional Shares |
||||||||||||||||||||
For the Years Ended June 30, |
||||||||||||||||||||
2021 |
2020 |
2019 |
2018 |
2017 |
||||||||||||||||
Net Asset Value - Beginning of Year |
$ | 6.07 | $ | 7.16 | $ | 8.98 | $ | 9.40 | $ | 8.44 | ||||||||||
Investment operations: |
||||||||||||||||||||
Net investment income1 |
0.04 | 0.03 | 0.03 | 0.01 | 0.05 | |||||||||||||||
Net realized and unrealized gain (loss) on investments |
3.24 | (0.68 | ) | (0.27 | ) | 1.03 | 1.33 | |||||||||||||
Total from investment operations |
3.28 | (0.65 | ) | (0.24 | ) | 1.04 | 1.38 | |||||||||||||
Distributions to shareholders: |
||||||||||||||||||||
From net investment income |
(0.04 | ) | (0.03 | ) | (0.01 | ) | — | (0.06 | ) | |||||||||||
From net realized gain on investments |
(0.19 | ) | (0.41 | ) | (1.57 | ) | (1.46 | ) | (0.36 | ) | ||||||||||
Total distributions to shareholders |
(0.23 | ) | (0.44 | ) | (1.58 | ) | (1.46 | ) | (0.42 | ) | ||||||||||
Net Asset Value - End of Year |
$ | 9.12 | $ | 6.07 | $ | 7.16 | $ | 8.98 | $ | 9.40 | ||||||||||
Total return |
54.66 | % | (9.87 | )% | (0.51 | )% | 11.63 | % | 16.71 | % | ||||||||||
Ratios/Supplemental Data: |
||||||||||||||||||||
Ratios to average net assets: |
||||||||||||||||||||
Expenses, including waiver/ reimbursement |
1.11 | % | 1.15 | % | 1.25 | % | 1.25 | % | 1.25 | % | ||||||||||
Expenses, excluding waiver/reimbursement |
1.13 | % | 1.25 | % | 1.96 | % | 1.68 | % | 1.73 | % | ||||||||||
Net investment income, including waiver/reimbursement |
0.52 | % | 0.47 | % | 0.36 | % | 0.18 | % | 0.53 | % | ||||||||||
Portfolio turnover rate |
87 | % | 65 | % | 112 | % | 72 | % | 91 | % | ||||||||||
Net Assets at end of year (000’s omitted) |
$ | 18,393 | $ | 18,307 | $ | 26,816 | $ | 14,082 | $ | 13,675 | ||||||||||
|
(1) |
Calculated using the average shares method. |
See accompanying notes to financial statements. |
CRM Funds |
|
80 |
||
CRM FUNDS FINANCIAL HIGHLIGHTS
|
CRM Long/Short Opportunities Fund — |
||||||||||||||||||||
For the Years Ended June 30, |
For the |
|||||||||||||||||||
2021 |
2020 |
2019 |
2018 |
20171 |
||||||||||||||||
Net Asset Value - Beginning of Period |
$ | 10.23 | $ | 10.27 | $ | 10.68 | $ | 10.25 | $ | 10.00 | ||||||||||
Investment operations: |
||||||||||||||||||||
Net investment loss2 |
(0.25 | ) | (0.10 | ) | (0.11 | ) | (0.10 | ) | (0.08 | ) | ||||||||||
Net realized and unrealized gain (loss) on investments, derivatives and foreign currency |
2.22 | 0.50 | (0.14 | ) | 0.55 | 0.33 | ||||||||||||||
Total from investment operations |
1.97 | 0.40 | (0.25 | ) | 0.45 | 0.25 | ||||||||||||||
Distributions to shareholders: |
||||||||||||||||||||
From net realized gain on investments |
(0.58 | ) | (0.44 | ) | (0.16 | ) | (0.02 | ) | — | |||||||||||
Total distributions to shareholders |
(0.58 | ) | (0.44 | ) | (0.16 | ) | (0.02 | ) | — | |||||||||||
Net Asset Value - End of Period |
$ | 11.62 | $ | 10.23 | $ | 10.27 | $ | 10.68 | $ | 10.25 | ||||||||||
Total return |
19.49 | % | 3.93 | % | (2.18 | )% | 4.44 | % | 2.50 | % | ||||||||||
Ratios to average net assets: |
||||||||||||||||||||
Expenses, including waiver/reimbursement |
2.79 | % | 2.95 | % | 3.03 | % | 2.80 | % | 2.44 | % | ||||||||||
Expenses, including waiver/reimbursement and excluding interest and dividend expense relating to short sales |
1.60 | % | 1.59 | % | 1.60 | % | 1.60 | % | 1.60 | % | ||||||||||
Expenses, excluding waiver/reimbursement |
2.90 | % | 3.03 | % | 3.10 | % | 2.85 | % | 2.59 | % | ||||||||||
Expenses, excluding waiver/reimbursement and interest and dividend expense relating to short sales |
1.71 | % | 1.67 | % | 1.67 | % | 1.65 | % | 1.75 | % | ||||||||||
Net investment loss, including waiver/reimbursement |
(2.18 | )% | (0.99 | )% | (1.03 | )% | (0.94 | )% | (0.93 | )% | ||||||||||
Portfolio turnover rate |
201 | % | 177 | % | 195 | % | 251 | % | 319 | % | ||||||||||
Net Assets at end of period (000’s omitted) |
$ | 127,930 | $ | 56,540 | $ | 482,050 | $ | 709,303 | $ | 448,108 | ||||||||||
|
(1) |
Inception date was August 16, 2016. All ratios for the period have been annualized. Total returns and portfolio turnover for the period have not been annualized. |
|
(2) |
Calculated using the average shares method. |
See accompanying notes to financial statements. |
CRM Funds |
|
81 |
||
CRM FUNDS NOTES TO FINANCIAL STATEMENTS — June 30, 2021
|
|
1. |
Description of the Funds. CRM Small Cap Value Fund (“Small Cap Value Fund”), CRM Small/Mid Cap Value Fund (“Small/Mid Cap Value Fund”), CRM Mid Cap Value Fund (“Mid Cap Value Fund”), CRM All Cap Value Fund (“All Cap Value Fund”) and CRM Long/Short Opportunities Fund (“Long/Short Opportunities Fund”) (each, a “Fund” and collectively, the “Funds”) are series of the CRM Mutual Fund Trust (the “Trust”). The Trust consists of five funds. A shareholder of one series is not deemed to be a shareholder of any other series. The Trust is registered under the Investment Company Act of 1940, as amended (the “1940 Act”), as an open-end management investment company and was organized as a Delaware statutory trust on March 30, 2005. |
Small Cap Value Fund, Small/Mid Cap Value Fund, Mid Cap Value Fund, and All Cap Value Fund: Each Fund offers Investor and Institutional Shares. Each class has different minimum investment requirements, fees and expenses. All classes of shares have identical voting, dividend and liquidation rights. Investor Shares are available to all investors and are subject to a shareholder servicing fee. Institutional Shares are offered only to those investors who invest in a Fund through an intermediary (i.e. broker) or through a consultant and who invest $1,000,000 or more or where related accounts total $1,000,000 or more when combined.
Long/Short Opportunities Fund: The Fund offers Institutional Shares. Shares are generally available for purchase and sale by registered investment advisers acting in a fiduciary capacity on behalf of their clients and by or through other qualified intermediaries and programs sponsored by such qualified financial intermediaries. Initial investments in the Fund are subject to a $100,000 minimum per registered investment adviser or qualified financial intermediary.
|
2. |
Significant Accounting Policies. The Funds’ financial statements have been prepared in conformity with U.S. generally accepted accounting principles (“U.S. GAAP”). The Funds are investment companies and follow the accounting and reporting requirements for investment companies under Financial Accounting Standards Board (“FASB”), Accounting Standards Codification Topic 946. The following is a summary of the significant accounting policies of the Funds: |
Security Valuation. The Funds value their investment securities based on current market values when such values are available. These prices normally are supplied by a pricing service.
CRM Funds |
||
82 |
CRM FUNDS NOTES TO FINANCIAL STATEMENTS — June 30, 2021 (Continued)
|
In valuing a Fund’s investment securities, a security listed on the New York Stock Exchange (the “Exchange”) (and not subject to restrictions against sale by the Fund on the Exchange) will be valued at its last sale price on the Exchange on the day the security is valued. Lacking any sales on such day, the security will be valued at the mean between the closing asked price and the closing bid price. Securities listed on other exchanges (and not subject to restriction against sale by the Fund on such exchanges) will be similarly valued, using quotations on the exchange on which the security is traded most extensively. Securities that are quoted on the NASDAQ Stock Market, for which there have been sales of such securities on such day, shall be valued at the last sale price reported on such system on the day the security is valued. If there are no such sales on such day, the value shall be the mean between the closing asked price and the closing bid price. The value of such securities quoted on the stock market system, but not listed on the national market system, shall be valued at the mean between the closing asked price and the closing bid price. Unlisted securities that are not quoted on the NASDAQ Stock Market and for which over-the-counter market quotations are readily available will be valued at the mean between the current bid and asked prices for such security in the over-the-counter market.
Short-term investments with remaining maturities of less than 61 days are valued at amortized cost, provided such amount approximates fair value. A Fund’s currency valuations, if any, are also valued at the close of regular trading on the Exchange. Investments in other open-end investment companies are valued at such investment company’s current day closing net asset value per share. Swaps and forward foreign currency exchange contracts are valued utilizing market quotations provided by a third-party pricing service. Option contracts are generally valued at the mean between the last bid and ask prices on the principal exchange where they are traded.
Securities that do not have a readily available current market value are valued in good faith by, or under the direction of, the Board of Trustees of the Trust (the “Board” or “Trustees”). In addition, the Funds may use fair value methodologies if it is determined that a significant event has occurred between the time at which a market price is determined and the time at which the Fund’s net asset value (“NAV”) is calculated and that may materially affect the value of the security. In particular, the value of foreign securities may be materially affected by events occurring after the close of the market on which they are valued, but before a Fund prices its shares. Securities trading
CRM Funds |
||
83 |
CRM FUNDS NOTES TO FINANCIAL STATEMENTS — June 30, 2021 (Continued)
|
in overseas markets present time zone arbitrage opportunities when events affecting portfolio security values occur after the close of the overseas market but prior to the close of the U.S. market. In addition, arbitrage opportunities may exist when trading in a portfolio security or securities is halted and does not resume before a fund calculates its NAV. These arbitrage opportunities may enable short-term traders to profit at the expense of long-term investors. Valuing securities using fair value methodologies involves greater reliance on judgment than valuing securities based on readily available market quotations. A Fund, when using fair value methodologies to price securities, may value those securities higher or lower than another fund using market quotations or its own fair value methodologies to price the same securities. There can be no assurance that a Fund could obtain the fair value assigned to a security if it were to sell the security.
The Funds disclose the value of their investments in a hierarchy based on the inputs used to value the investments. The disclosure hierarchy consists of three broad levels:
|
● Level 1 — |
quoted prices in active markets for identical securities |
Investments whose values are based on quoted market prices in active markets, and whose values are therefore classified as Level 1 prices, include active listed equity securities. The Funds do not adjust the quoted price for such investments, even in situations where the Funds hold a large position and a sale could reasonably impact the quoted price.
|
● Level 2 — |
other significant observable inputs (including quoted prices for similar securities, interest rates, prepayment speeds, credit risk, etc.) |
Investments that trade in markets that are not considered to be active, but whose values are based on quoted market prices, dealer quotations or valuations provided by alternative pricing sources supported by observable inputs are classified as Level 2 prices. These generally include certain U.S. government and sovereign obligations, most government agency securities, investment-grade corporate bonds and less liquid listed equity securities. In addition, foreign securities may require revised valuations if the values of the securities are materially affected by events occurring after the close of the market on which they are valued, but before a Fund prices its shares. As
CRM Funds |
||
84 |
CRM FUNDS NOTES TO FINANCIAL STATEMENTS — June 30, 2021 (Continued)
|
investments whose values are classified as Level 2 prices may include positions that are not traded in active markets and/or are subject to transfer restrictions, valuations may be adjusted to reflect illiquidity and/or non-transferability, which are generally based on available market information.
|
● Level 3 — |
significant unobservable inputs (including the Fund’s own assumptions in determining the fair value of investments) |
Investments whose values are classified as Level 3 prices have significant unobservable inputs, as they may trade infrequently or not at all. When observable prices are not available for these securities, the Funds use one or more valuation techniques for which sufficient and reliable data is available. The inputs used by the Funds in estimating the value of Level 3 prices may include the original transaction price, quoted prices for comparable companies or assets in active markets, completed or pending third-party transactions in the underlying investment or comparable issuers, and changes in financial ratios or cash flows. Level 3 prices may also be adjusted to reflect illiquidity and/or non-transferability, with the amount of such discount estimated by the Funds in the absence of market information. Assumptions used by the Funds due to the lack of observable inputs may significantly impact the resulting value and therefore the Funds’ results of operations.
The inputs or methodology used for valuing securities are not necessarily an indication of the risk associated with investing in those securities. A financial instrument’s level within the fair value hierarchy is based on the lowest level of any inputs both individually and in the aggregate that is significant to the fair value measurement. The Funds’ policy is to recognize transfers among levels as of the beginning of the reporting period. A summary of the inputs used to value the Funds’ investments as of June 30, 2021 is included with each Fund’s Schedule of Investments.
Foreign Currency Translations. The books and records of the Funds are maintained in U.S. dollars. Transactions denominated in foreign currencies are recorded at the prevailing exchange rates on the valuation date. The value of all assets and liabilities denominated in foreign currencies are translated into U.S. dollars at the exchange rate of such currencies against the U.S. dollar daily. The Funds do not isolate that portion of the results of operations resulting from changes in foreign exchange rates on investments from the fluctuations arising from changes in market prices of those investments. Such fluctuations
CRM Funds |
||
85 |
CRM FUNDS NOTES TO FINANCIAL STATEMENTS — June 30, 2021 (Continued)
|
are included with the net realized and unrealized gain or loss from investments that are disclosed within each Fund’s statement of operations, as applicable.
Federal Income Taxes. Each Fund is treated as a separate entity for federal income tax purposes and intends to continue to qualify as a “regulated investment company” (“RIC”) under Subchapter M of the Internal Revenue Code of 1986, as amended, and to distribute substantially all of its taxable income to its shareholders. Therefore, no Federal income tax provision has been made.
Accounting for Uncertainty in Income Taxes sets forth a minimum threshold for financial statement recognition of the benefit of a tax position taken or expected to be taken in a tax return. Management has analyzed each of the Fund’s tax positions and has concluded that no provision for U.S. income tax is required in each of the Fund’s financial statements. Each of the Fund’s federal tax returns for the prior three fiscal years remains subject to examination by the Internal Revenue Service. On an ongoing basis, management monitors the Funds’ tax positions to determine if any adjustments to its conclusions are necessary.
The Funds recognize interest and penalties, if any, related to unrecognized tax benefits as income tax expense on the Statements of Operations. During the year ended June 30, 2021, the Funds did not incur any interest or penalties.
Security Transactions and Investment Income. Investment security transactions are accounted for on a trade date basis for financial reporting purposes. Each Fund uses the specific identification method for determining realized gains and losses on investments for both financial and federal income tax reporting purposes. Interest income is recorded on the accrual basis and includes the amortization of premium and the accretion of discount. Dividend income and expense are recorded on the ex-dividend date. Foreign dividends are also recorded on the ex-dividend date, net of all tax withholdings not eligible for rebates. Withholding taxes on foreign dividends are recorded in accordance with the Fund’s understanding of the applicable country’s tax rules and rates. Distributions received from investments in Real Estate Investment Trusts (“REITs”) are recorded as dividend income on the ex-dividend date, subject to reclassification upon notice of the character of the distributions by the issuer or management estimate. The Funds record expenses as incurred. Common
CRM Funds |
||
86 |
CRM FUNDS NOTES TO FINANCIAL STATEMENTS — June 30, 2021 (Continued)
|
expenses of the Trust are allocated on a pro-rata basis amongst the series of the Trust based on relative net assets.
The Funds’ investments in certain countries are subjected to additional capital gain taxes. Such taxes are due upon sale of individual securities. The Funds accrue for taxes on the capital gains throughout the holding period based on the unrealized gain of the underlying securities, as applicable. The Funds held no such securities during the year ended June 30, 2021.
Class Accounting. In calculating the NAV per share for each class, investment income, realized and unrealized gains and losses and expenses other than class specific expenses, are allocated daily to each class of shares based upon the proportion of net assets of each class at the beginning of each day.
Repurchase Agreements. Each Fund (except Long/Short Opportunities Fund) may, through its custodian, receive delivery of the underlying securities used to collateralize repurchase agreements, the market value of which is required to be in an amount at least equal to 101% of the resale price. The Funds’ investment adviser is responsible for determining that the market value of these underlying securities is maintained at all times at a level at least equal to 101% of the resale price. In event of default of the obligation to repurchase, each Fund has the right to liquidate the collateral and apply the proceeds in satisfaction of the obligation. Provisions of each agreement require that the market value of the collateral is sufficient in the event of default; however, in the event of default or bankruptcy by the other party to the agreement, realization and/or retention of the collateral may be subject to legal proceedings.
Repurchase agreements are entered into by the Funds under Master Repurchase Agreements (“MRA”) which permit the Funds, under certain circumstances including an event of default (such as bankruptcy or insolvency), to offset payables and/or receivables under the MRA with collateral held and/or posted to the counterparty and create one single net payment due to or from the Fund.
CRM Funds |
||
87 |
CRM FUNDS NOTES TO FINANCIAL STATEMENTS — June 30, 2021 (Continued)
|
At June 30, 2021, the open repurchase agreements by counterparty which are subject to a MRA on a net payment basis are as follows:
Repurchase |
Fair Value |
Cash |
Net Amount2 |
|||||||||||||
Small/Mid Cap Value Fund |
||||||||||||||||
TD Securities USA, LLC |
$ | 932,284 | $ | 932,284 | $ | — | $ | — | ||||||||
Mid Cap Value Fund |
||||||||||||||||
Citibank |
$ | 3,237,968 | $ | 3,237,968 | $ | — | $ | — | ||||||||
All Cap Value Fund |
||||||||||||||||
HSBC Securities USA, Inc. |
$ | 339,640 | $ | 339,640 | $ | — | $ | — | ||||||||
|
1 |
The value of collateral shown in the table does not reflect value that exceeds the value of the repurchase agreement. Collateral with a value of $950,930, $3,302,727, and $346,433, respectively, has been received in connection with open repurchase agreements. |
|
2 |
Net exposure represents the receivable (payable) that would be due to (from) the counterparty in an event of default. |
Distributions to Shareholders. Dividends and distributions to shareholders are recorded on the ex-dividend date. Distributions from net investment income and net realized gains, if any, will be declared and paid annually.
Use of Estimates in the Preparation of Financial Statements. The preparation of financial statements in conformity with U.S. GAAP requires management to make estimates and assumptions that affect the reported amounts of assets and liabilities at the date of the financial statements and the reported amounts of revenues and expenses during the reporting period. Actual results could differ from those estimates.
|
3. |
Advisory Fees and Other Transactions with Affiliates. Cramer Rosenthal McGlynn, LLC (“CRM”) serves as investment adviser to the Funds. CRM receives an advisory fee from Small Cap Value Fund, Small/Mid Cap Value Fund, and Mid Cap Value Fund of 0.75% of each Fund’s first $1 billion of average daily net assets; 0.70% of each Fund’s next $1 billion of average daily net assets; and 0.65% of each Fund’s average daily net assets in excess of $2 billion. For its advisory services to All Cap Value Fund, CRM receives 0.70% of the Fund’s average daily net assets. |
CRM Funds |
||
88 |
CRM FUNDS NOTES TO FINANCIAL STATEMENTS — June 30, 2021 (Continued)
|
CRM has contractually agreed to waive a portion of its fees and assume certain expenses of the Funds to the extent that total annual fund operating expenses (excluding taxes, extraordinary expenses, brokerage commissions, acquired fund fees and expenses and interest) do not exceed the percentage of average daily net assets as follows:
Investor |
Institutional |
|
Small Cap Value Fund |
1.50% |
1.25% |
Small/Mid Cap Value Fund |
1.50% |
1.25% |
Mid Cap Value Fund |
1.50% |
1.25% |
All Cap Value Fund |
1.45% |
1.20% |
For its advisory services to Long/Short Opportunities Fund, CRM receives 1.50% of the Fund’s average daily net assets. CRM has contractually agreed to waive a portion of its fees and assume certain expenses of Long/Short Opportunities Fund to the extent that total annual fund operating expenses (excluding taxes, extraordinary expenses, brokerage commissions, interest, dividend and interest expenses related to short sales, and acquired fund fees and expenses) do not exceed the percentage of average daily net assets as follows:
Institutional |
|
Long/Short Opportunities Fund |
1.60% |
The expense limitation agreement is in effect until November 1, 2021 and the Board has approved the renewal of the agreement for an additional year until November 1, 2022. Prior to these dates, the arrangement may be terminated for a class of a Fund only by the vote of the Board of Trustees of the Fund.
CRM provides compliance services to the Trust. The Chief Compliance Officer (“CCO”) is an employee of CRM. The Trust reimburses CRM for the portion of his salary allocated to his duties as the CCO of the Trust at a rate of $75,000 per year which is allocated on a pro-rata basis amongst the series of the Trust based on relative net assets.
Compensation of Trustees and Officers. Except for the CCO of the Funds, trustees and officers of the Funds who are interested persons of CRM, as defined in the 1940 Act, receive no compensation from the Funds.
CRM Funds |
||
89 |
CRM FUNDS NOTES TO FINANCIAL STATEMENTS — June 30, 2021 (Continued)
|
Trustees of the Funds who are not interested persons of CRM, as defined in the 1940 Act (each an “Independent Trustee”), receive compensation and reimbursement of expenses. Each Independent Trustee receives aggregate annual compensation from the Trust at an annual rate of $60,000 which is allocated on a pro-rata basis amongst the series of the Trust based on relative net assets. Under a Deferred Compensation Plan (the “Plan”) adopted August 12, 2005, an Independent Trustee may elect to defer receipt of all, or a portion, of his annual compensation. If an Independent Trustee opts for deferral, then the deferred amounts are credited to an Independent Trustee’s deferral account and invested and reinvested in Institutional Shares of one or more of the Funds in the series of the Trust until such amounts are distributed in accordance with the Plan. No Independent Trustee deferred their compensation earned for the year ended June 30, 2021. Trustees’ fees reflected in the accompanying financial statements include total compensation earned, which were paid in cash. Each trustee serves during the continued lifetime of the Funds, or the earlier of when his or her successor is elected or qualified, the officer dies, resigns, is removed or becomes disqualified.
Shareholder Servicing Fees. The Board has adopted a Shareholder Servicing Plan which allows each Fund to obtain, for its Investor Shares, the services of CRM and other qualified financial institutions to act as shareholder servicing agents for its shareholders. Under the Shareholder Servicing Plan, each Fund may pay shareholder servicing agents, including CRM, monthly fees at an annual rate not to exceed 0.25% of the Fund’s average daily net assets attributable to its Investor Shares.
Sub-Transfer Agent Fees. Institutional Shares of each Fund are sold through certain intermediaries that provide accounting, recordkeeping, and/or other services to shareholders. The Board of Trustees has approved payment of the fees charged by these intermediaries for providing these sub-transfer agency services from the assets of the Institutional Shares of each Fund provided these fees do not exceed the charges the Fund would bear for these services if they were provided directly by the Funds’ transfer agent. CRM, as the Funds’ agent, remits these payments to the intermediaries. In some cases, where the sub-transfer agency fees of an intermediary are greater than the amounts paid to CRM by the Funds for that intermediary, CRM will pay the balance of those fees itself.
CRM Funds |
||
90 |
CRM FUNDS NOTES TO FINANCIAL STATEMENTS — June 30, 2021 (Continued)
|
|
4. |
Investment Securities Transactions. The cost of investments purchased and the proceeds from investments sold (excluding short-term investments) for the year ended June 30, 2021, were as follows: |
Purchases |
Sales |
Short Sales |
Purchases to |
|||||||||||||
Small Cap Value Fund |
$ | 171,795,276 | $ | 185,373,868 | $ | — | $ | — | ||||||||
Small/Mid Cap Value Fund |
172,434,440 | 249,284,121 | — | — | ||||||||||||
Mid Cap Value Fund |
245,376,325 | 340,075,655 | — | — | ||||||||||||
All Cap Value Fund |
23,624,746 | 34,099,072 | — | — | ||||||||||||
Long/Short Opportunities Fund |
185,813,885 | 150,358,753 | 100,840,993 | 94,312,974 | ||||||||||||
|
5. |
Securities Lending Agreement. Each Fund (except Long/Short Opportunities Fund) may lend their securities pursuant to a securities lending agreement (“Lending Agreement”) with The Bank of New York Mellon. Security loans made pursuant to the Lending Agreement are required at all times to be secured by cash collateral at least equal to 102% of the market value of the securities loaned. The market value of the loaned securities is determined at the close of business of the Fund and any additional required collateral is delivered to the Fund on the next business day. Cash collateral received, pursuant to investment guidelines established by the Funds and approved by the Board of Trustees, is invested in short-term fixed income securities rated in the highest rating category by nationally recognized statistical rating organizations (or of comparable quality if unrated) with a maturity date of 397 days or less, including corporate obligations and money market mutual funds. All such investments are made at the risk of the Funds and, as such, the Funds are liable for investment losses. The Bank of New York Mellon and the lender retain a portion of the earnings from the collateral investments, with the remainder being retained by the Fund. The Funds record securities lending income net of such allocations. In the event the borrower fails to return loaned securities and the collateral received is insufficient to cover the value of the loaned securities and provided such collateral shortfall is not the result of investment losses, The Bank of New York Mellon has agreed to pay the amount of the shortfall to the Funds, or at its discretion, replace the loaned securities. In the event of default or bankruptcy by The Bank of New York Mellon, realization and/or retention of the collateral may be subject to legal proceedings. |
CRM Funds |
||
91 |
CRM FUNDS NOTES TO FINANCIAL STATEMENTS — June 30, 2021 (Continued)
|
At June 30, 2021, the following Funds had securities on loan:
Market |
Cash |
|||||||
Small/Mid Cap Value Fund |
$ | 13,134,738 | $ | 13,182,284 | ||||
Mid Cap Value Fund |
25,739,639 | 25,597,968 | ||||||
All Cap Value Fund |
349,546 | 339,640 | ||||||
|
** |
Please note any reported shortfall in required collateral coverage of 102% is based on closing market value of securities on loan as of the date of the report. Any required collateral adjustment needed in order to bring coverage to 102% is done on the next business day. |
|
6. |
Short Sale Transactions. In short sale transactions, the Fund sells a security it does not hold in anticipation of a decline in the market price of that security. When the Fund makes a short sale, it will borrow the security sold short (borrowed bond) and deliver the security to the counterparty to which it sold the security short. An amount equal to the proceeds received by the Fund is reflected as an asset and an equivalent liability. The amount of the liability is subsequently marked-to-market to reflect the market value of the short sale. The Fund is required to repay the counterparty any dividends declared on the security sold short, which is shown as dividend expense in the Statements of Operations. The Fund is exposed to market risk based on the amount, if any, that the market value of the security increases beyond the market value at which the position was sold. Thus, a short sale of a security involves the risk that instead of declining, the price of the security sold short will rise. The short sale of securities involves the possibility of an unlimited loss since there is an unlimited potential for the market price of the security sold short to increase. A gain is limited to the price at which the Fund sold the security short. A realized gain or loss is recognized upon the termination of a short sale if the market price is either less than or greater than the proceeds originally received. There is no assurance that the Fund will be able to close out a short position at a particular time or at an acceptable price. |
The Fund is required to pledge cash or securities to the broker as collateral for the securities sold short. Collateral requirements are calculated daily based on the current market value of the short positions. Cash that has been pledged to secure the Fund’s obligation to cover the short positions is reported separately on the Statements of Assets and Liabilities. The Fund may receive from or pay to the broker the net of the following amounts: (i) income on cash collateral held at the broker and (ii) a financing charge to the extent the cash collateral
CRM Funds |
||
92 |
CRM FUNDS NOTES TO FINANCIAL STATEMENTS — June 30, 2021 (Continued)
|
is less than the margin requirement. The net amounts of income or fees are included as interest income or expense, as applicable, on securities sold short in the Statements of Operations.
During the year ended June 30, 2021, Long/Short Opportunities Fund participated in short sale transactions.
|
7. |
Federal Tax Information. The tax character of distributions utilized during the fiscal years ended June 30, 2021 and June 30, 2020, respectively, was as follows: |
Fund |
Ordinary |
Long-Term |
Total |
|||||||||
CRM Small Cap Value Fund |
$ | 1,623,183 | $ | 1,196,148 | $ | 2,819,331 | ||||||
CRM Small/Mid Cap Value Fund |
9,327,550 | 20,221,036 | 29,548,586 | |||||||||
CRM Mid Cap Value Fund |
1,955,708 | 15,753,135 | 17,708,843 | |||||||||
CRM All Cap Value Fund |
150,410 | 1,558,506 | 1,708,916 | |||||||||
CRM Long/Short Opportunities Fund |
— | 4,340,824 | 4,340,824 | |||||||||
Fund |
Ordinary |
Long-Term |
Total |
|||||||||
CRM Small Cap Value Fund |
$ | 2,892,549 | $ | 17,206,369 | $ | 20,098,918 | ||||||
CRM Small/Mid Cap Value Fund |
1,058,112 | 6,739,469 | 7,797,581 | |||||||||
CRM Mid Cap Value Fund |
2,522,659 | 10,610,858 | 13,133,517 | |||||||||
CRM All Cap Value Fund |
465,598 | 1,261,291 | 1,726,889 | |||||||||
CRM Long/Short Opportunities Fund |
— | 20,035,084 | 20,035,084 | |||||||||
Tax equalization allows a Fund to treat as distribution that portion of redemption proceeds representing a redeeming shareholder’s portion of undistributed taxable and net capital gains. The table below shows equalization amounts which resulted in a difference between tax distributions and book distributions as disclosed on the Statement of Changes for the year ended June
CRM Funds |
||
93 |
CRM FUNDS NOTES TO FINANCIAL STATEMENTS — June 30, 2021 (Continued)
|
30, 2021. Net investment income and net realized gains(losses), as disclosed on the Statements of Operations and net assets were not affected by these reclassifications.
Fund |
Equalization |
|||
CRM Small Cap Value Fund |
$ | 1,196,148 | ||
CRM Small/Mid Cap Value Fund |
12,931,236 | |||
CRM Mid Cap Value Fund |
9,613,103 | |||
CRM All Cap Value Fund |
774,454 | |||
CRM Long/Short Opportunities Fund |
— | |||
As of June 30, 2021, the components of accumulated earnings/ (deficit) on a tax basis were as follows:
Fund |
Undistributed |
Undistributed |
Post October |
Unrealized |
Total |
|||||||||||||||
CRM Small Cap Value Fund |
$ | 12,146,050 | $ | 16,972,341 | $ | — | $ | 71,841,997 | $ | 100,960,388 | ||||||||||
CRM Small/Mid Cap Value Fund |
25,990,982 | 20,471,459 | — | 100,884,008 | 147,346,449 | |||||||||||||||
CRM Mid Cap Value Fund |
12,270,739 | 49,818,252 | — | 135,687,970 | 197,776,961 | |||||||||||||||
CRM All Cap Value Fund |
2,824,655 | 1,745,748 | — | 6,720,026 | 11,290,429 | |||||||||||||||
CRM Long/Short Opportunities Fund |
— | 1,310,728 | (1,252,360 | ) | 14,174,419 | 14,232,787 | ||||||||||||||
The difference between book basis and tax basis unrealized appreciation, undistributed net investment income (loss) and accumulated net realized gains (losses) from investments is primarily attributable to the tax deferral of losses on wash sales, the mark-to-market on open Swaps and C-Corporation return of capital distributions.
Late year losses incurred after December 31 within the fiscal year are deemed to arise on the first business day of the following fiscal year for tax purposes. The CRM Long/Short Opportunities Fund incurred and elected to defer such late year losses as follows:
CRM Funds |
||
94 |
CRM FUNDS NOTES TO FINANCIAL STATEMENTS — June 30, 2021 (Continued)
|
Fund |
Late Year |
|||
CRM Small Cap Value Fund |
$ | — | ||
CRM Small/Mid Cap Value Fund |
— | |||
CRM Mid Cap Value Fund |
— | |||
CRM All Cap Value Fund |
— | |||
CRM Long/Short Opportunities Fund |
1,252,360 | |||
Permanent book and tax differences, primarily attributable to the book/tax basis treatment of net operating loss reclass and equalization credits, resulted in reclassifications for the Funds for the fiscal year ended June 30, 2021 as follows:
Fund |
Paid In |
Accumulated |
||||||
CRM Small Cap Value Fund |
$ | 1,196,148 | $ | (1,196,148 | ) | |||
CRM Small/Mid Cap Value Fund |
12,931,236 | (12,931,236 | ) | |||||
CRM Mid Cap Value Fund |
9,613,103 | (9,613,103 | ) | |||||
CRM All Cap Value Fund |
774,454 | (774,454 | ) | |||||
CRM Long/Short Opportunities Fund |
(1,360,807 | ) | 1,360,807 | |||||
The total cost of investments and net unrealized appreciation or depreciation for federal income tax purposes were different from amounts reported for financial reporting purposes. The federal tax cost, and related gross unrealized appreciation and depreciation of securities held by the Funds as of June 30, 2021 were as follows:
Tax Cost of |
Gross |
Gross |
Net Unrealized |
|||||||||||||
Small Cap Value Fund |
$ | 265,249,578 | $ | 83,593,895 | $ | (11,751,898 | ) | $ | 71,841,997 | |||||||
Small/Mid Cap Value Fund |
225,903,995 | 105,008,936 | (4,124,928 | ) | 100,884,008 | |||||||||||
Mid Cap Value Fund |
337,728,920 | 140,761,521 | (5,073,551 | ) | 135,687,970 | |||||||||||
All Cap Value Fund |
20,532,382 | 7,373,205 | (653,179 | ) | 6,720,026 | |||||||||||
Long/Short Opportunities Fund |
64,266,879 | 30,112,923 | (15,960,203 | ) | 14,152,720 | |||||||||||
|
8. |
Derivative Financial Instruments. Each Fund may, but is not required to, invest in derivative contracts, such as swaps and options on securities and securities indices, for a variety of purposes, including: in an attempt to hedge |
CRM Funds |
||
95 |
CRM FUNDS NOTES TO FINANCIAL STATEMENTS — June 30, 2021 (Continued)
|
against adverse changes in the market price of securities, interest rates or currency exchange rates; as a substitute for purchasing or selling securities, including short sales; to attempt to increase the Fund’s return as a non-hedging strategy that may be considered speculative; to manage portfolio characteristics; and as a cash flow management technique. Using swaps, options and other derivatives can increase Fund losses and reduce opportunities for gains when market prices, interest rates or the derivative instruments themselves behave in a way not anticipated by the Fund. Using derivatives may increase the volatility of the Fund’s net asset value and may not provide the result intended. Derivatives may have a leveraging effect on the Fund. Some derivatives have the potential for unlimited loss, regardless of the size of the Fund’s initial investment. Changes in a derivative’s value may not correlate well with the referenced asset or metric. The Fund also may have to sell assets at inopportune times to satisfy its obligations. Derivatives may be difficult to sell, unwind or value, and the counterparty may default on its obligations to the Fund.
Options. A Fund purchases and writes call and put options to increase or decrease its exposure to underlying instruments (including credit risk, equity risk, foreign currency exchange rate risk and/or interest rate risk) and/or, in the case of options written, to generate gains from options premiums.
A call option gives the purchaser (holder) of the option the right (but not the obligation) to buy, and obligates the seller (writer) to sell (when the option is exercised) the underlying instrument at the exercise or strike price at any time or at a specified time during the option period. A put option gives the holder the right to sell and obligates the writer to buy the underlying instrument at the exercise or strike price at any time or at a specified time during the option period.
Premiums paid on options purchased and premiums received on options written, as well as the daily fluctuation in market value, are included in the Statements of Assets and Liabilities. When an instrument is purchased or sold through the exercise of an option, the premium is offset against the cost or proceeds of the underlying instrument. When an option expires, a realized gain or loss is recorded in the Statements of Operations to the extent of the premiums received or paid. When an option is closed or sold, a gain or loss is recorded in the Statements of Operations to the extent the cost of the closing
CRM Funds |
||
96 |
CRM FUNDS NOTES TO FINANCIAL STATEMENTS — June 30, 2021 (Continued)
|
transaction exceeds the premiums received or paid). When the Fund writes an option, such option is covered by cash in an amount sufficient to cover the obligation. In purchasing and writing options, the Fund bears the risk of an unfavorable change in the value of the underlying instrument or the risk that the Fund may not be able to enter into a closing transaction due to an illiquid market. Exercise of a written option could result in the Fund purchasing or selling a security when it otherwise would not, or at a price different from the current market value.
As of June 30, 2021, the Funds did not hold any option contracts.
Forward Foreign Currency Exchange Contracts. A Fund enters into forward foreign currency exchange contracts to gain or reduce exposure, to foreign currencies (foreign currency exchange rate risk). A forward foreign currency exchange contract is an agreement between two parties to buy and sell a currency at a set exchange rate on a specified date. These contracts help to manage the overall exposure to the currencies in which some of the investments held by the Fund are denominated and, in some cases, may be used to obtain exposure to a particular market.
The contract is marked to market daily and the change in market value is recorded as unrealized appreciation (depreciation) in the Statements of Assets and Liabilities. When a contract is closed, a realized gain or loss is recorded in the Statements of Operations equal to the difference between the value at the time it was opened and the value at the time it was closed. Non-deliverable forward foreign currency exchange contracts are settled with the counterparty in cash without the delivery of foreign currency. The use of forward foreign currency exchange contracts involves the risk that the value of a forward foreign currency exchange contract changes unfavorably due to movements in the value of the referenced foreign currencies.
As of June 30, 2021, the Funds did not hold any forward foreign currency exchange contracts.
Swaps. A Fund enters into swap contracts to manage exposure to issuers, markets and securities. Such contracts are agreements between the Fund and a counterparty to make periodic net payments on a specified notional amount or a net payment upon termination. Swap agreements are privately negotiated in the OTC market and may be entered into as a bilateral contract (“OTC
CRM Funds |
||
97 |
CRM FUNDS NOTES TO FINANCIAL STATEMENTS — June 30, 2021 (Continued)
|
swaps”) or centrally cleared (“centrally cleared swaps”). For OTC swaps, any upfront premiums paid are recorded as assets and any upfront fees received are recorded as liabilities and are shown as swap premiums paid and swap premiums received, respectively, in the Statements of Assets and Liabilities and amortized over the term of the OTC swap. Payments received or made by the Fund for OTC swaps are recorded in the Statements of Operations as realized gains or losses, respectively. When an OTC swap is terminated, the Fund will record a realized gain or loss equal to the difference between the proceeds from (or cost of) the closing transaction and the Fund’s basis in the contract, if any. Generally, the basis of the contract is the premium received or paid.
In a centrally cleared swap, immediately following execution of the swap agreement, the swap agreement is novated to a central counterparty (the “CCP”) and the Fund’s counterparty on the swap agreement becomes the CCP. The Fund is required to interface with the CCP through a broker. Upon entering into a centrally cleared swap, the Fund is required to deposit initial margin with the broker in the form of cash or securities in an amount that varies depending on the size and risk profile of the particular swap. The daily change in valuation of centrally cleared swaps is recorded as a receivable or payable for variation margin in the Statements of Assets and Liabilities. Payments received from (paid to) the counterparty, including at termination, are recorded as realized gain (loss) in the Statements of Operations.
Swap transactions involve, to varying degrees, elements of interest rate, credit and market risk. Such risks involve the possibility that there will be no liquid market for these agreements, that the counterparty to the agreements may default on its obligation to perform or disagree as to the meaning of the contractual terms in the agreements, and that there may be unfavorable changes in interest rates and/or market values associated with these transactions.
Collateral Requirements. For derivatives traded under an International Swaps and Derivatives Association, Inc. Master Agreement (“ISDA MA”), the collateral requirements are typically calculated by netting the mark-to-market amount for each transaction under such agreement and comparing that amount to the value of any collateral currently pledged by the Fund and the counterparty.
CRM Funds |
||
98 |
CRM FUNDS NOTES TO FINANCIAL STATEMENTS — June 30, 2021 (Continued)
|
Generally, the amount of collateral due from or to a counterparty is subject to a certain minimum transfer amount threshold before a transfer is required, which is determined at the close of business of the Fund. Any additional required collateral is delivered to/pledged by the Fund on the next business day. Typically, the counterparty is not permitted to sell, re-pledge or use cash and non-cash collateral it receives. The Fund generally agrees not to use non-cash collateral that it receives but may, absent default or certain other circumstances defined in the underlying ISDA MA, be permitted to use cash collateral received. In such cases, interest may be paid pursuant to the collateral arrangement with the counterparty. To the extent amounts due to the Fund from its counterparties are not fully collateralized, they bear the risk of loss from counterparty non-performance. Likewise, to the extent the Fund has delivered collateral to a counterparty and stands ready to perform under the terms of its agreement with such counterparty, they bear the risk of loss from a counterparty in the amount of the value of the collateral in the event the counterparty fails to return such collateral. Based on the terms of agreements, collateral may not be required for all derivative contracts.
The following is a summary of the location of derivatives on Long/Short Opportunities Fund’s Statement of Assets and Liabilities as of June 30, 2021:
Location on the Statement of Assets and Liabilities |
||
Derivative Type |
Asset Derivatives |
Liability Derivatives |
Equity Contracts |
Unrealized appreciation on swap agreements |
Unrealized depreciation on swap agreements |
Asset Derivative Value |
||
Total |
Equity |
|
Swap Agreements |
$749,351 |
$749,351 |
Liability Derivative Value |
||
Total |
Equity |
|
Swap Agreements |
$404,978 |
$404,978 |
CRM Funds |
||
99 |
CRM FUNDS NOTES TO FINANCIAL STATEMENTS — June 30, 2021 (Continued)
|
The following is a summary of the location of derivatives on Long/Short Opportunities Fund’s Statement of Operations for the year ended June 30, 2021:
Location on the Statements of Operations |
||
Derivative Type |
Net Realized Gain (Loss) |
Net Change in Unrealized |
Equity Contracts |
Net realized gain (loss) from: Swap agreements |
Net change in unrealized appreciation (depreciation) on: swap Agreements |
Net Realized Gain (Loss) |
||
Total |
Equity |
|
Swap Agreements |
$(1,878,630) |
$(1,878,630) |
Net Change in Unrealized Appreciation (Depreciation) |
||
Total |
Equity |
|
Swap Agreements |
$103,107 |
$103,107 |
The table below summarizes the average balance of derivative holdings by Long/Short Opportunities Fund during the year ended June 30, 2021. The average balance of derivatives held is indicative of the trading volume of the Long/Short Opportunities Fund.
Derivative Volume |
Swap |
$1,661,846 |
In order to define its contractual rights and to secure rights that will help it mitigate its counterparty risk, a Fund may enter into an ISDA MA or similar agreement with its counterparties. An ISDA MA is a bilateral agreement between the Fund and a counterparty that governs certain OTC derivatives and typically contains, among other things, collateral posting terms and netting provisions in the event of a default and/or termination event. Under an ISDA MA, the Fund may, under certain circumstances, offset with the counterparty
CRM Funds |
||
100 |
CRM FUNDS NOTES TO FINANCIAL STATEMENTS — June 30, 2021 (Continued)
|
certain derivative financial instruments’ payables and/or receivables with collateral held and/or posted and create one single net payment. The provisions of the ISDA MA typically permit a single net payment in the event of default including the bankruptcy or insolvency of the counterparty. Bankruptcy or insolvency laws of a particular jurisdiction may restrict or prohibit the right of offset in bankruptcy, insolvency or other events. For example, notwithstanding what contractual rights may be included in an ISDA MA, such laws may prohibit the Fund from setting off amounts owed to a defaulting counterparty under an ISDA MA against amounts owed to the Fund by affiliates of the defaulting counterparty. The insolvency regimes of many jurisdictions do, however, generally permit set-off of simultaneous payables and receivables under certain types of financial contracts between the same legal entity upon a default of the entity, regardless of the existence of a contractual set-off right in those contracts. In addition, certain ISDA MA allow counterparties to OTC derivatives to terminate derivative contracts prior to maturity in the event the Fund’s net assets decline by a stated percentage or the Fund fails to meet the terms of its ISDA MA, which would cause the Fund to accelerate payment of any net liability owed to the counterparty.
Offsetting of Financial and Derivative Assets and Liabilities. For financial reporting purposes, the Funds do not offset derivative assets and derivative liabilities that are subject to netting arrangements in the Statements of Assets and Liabilities.
The following table presents derivative assets and liabilities net of amounts available for offset under an ISDA MA or similar agreement and, as applicable, the related collateral and potential loss exposure to Long/Short Opportunities Fund as of June 30, 2021:
Assets |
Liabilities |
|||||||
Derivative Financial Instruments: |
||||||||
Swap Agreements |
$ | 749,351 | $ | 404,978 | ||||
Total derivative assets and liabilities in the Statements of Assets and Liabilities |
749,351 | 404,978 | ||||||
Derivatives not subject to an ISDA MA or similar agreement |
— | — | ||||||
Total assets and liabilities subject to an ISDA MA |
$ | 749,351 | $ | 404,978 | ||||
CRM Funds |
||
101 |
CRM FUNDS NOTES TO FINANCIAL STATEMENTS — June 30, 2021 (Continued)
|
At June 30, 2021, derivative assets and liabilities by counterparty net of amounts available for offset under an ISDA MA and net of the related collateral received by the Long/Short Opportunities Fund are as follows:
Counterparty |
Derivative |
Derivative |
Value of |
Collateral |
Net |
Morgan Stanley |
$749,351 |
$(404,978) |
$344,373 |
$(344,373) |
$— |
|
1 |
Net exposure represents the receivable (payable) that would be due to (from) the counterparty in an event of default.
|
|
9. |
Risks. In the normal course of business, the Funds invest in securities and enter into transactions where risks exist due to fluctuations in the market (market risk) or failure of the issuer to meet all its obligations, including the ability to pay principal and interest when due (issuer credit risk). The value of securities held by a Fund may decline in response to certain events, including those directly involving the issuers of securities owned by the Fund. Changes arising from the general economy, the overall market and local, regional or global political or/and social instability, as well as currency, interest rate and price fluctuations, may also affect the securities’ value. |
In addition to the risks discussed above, Long/Short Opportunities Fund may also be exposed to counterparty credit risk, or the risk that an entity may fail to or be unable to perform on its commitments related to unsettled or open transactions. The Fund manages counterparty credit risk by entering into transactions only with counterparties that CRM believes have the financial resources to honor its obligations and by monitoring the financial stability of those counterparties. Financial assets, which potentially expose a Fund to market, issuer and counterparty credit risks, consist principally of financial instruments and receivables due from counterparties. The extent of Fund’s exposure to market, issuer and counterparty credit risks with respect to these financial assets is approximately its value recorded in the Statements of Assets and Liabilities, less any collateral held by the Fund.
A derivative contract may suffer mark-to-market loss if the value of the contract decreases due to an unfavorable change in the market rates or values of the underlying instrument. Losses can also occur if the counterparty does not perform under the contract.
CRM Funds |
||
102 |
CRM FUNDS NOTES TO FINANCIAL STATEMENTS — June 30, 2021 (Continued)
|
A Fund’s risk of loss from counterparty credit risk on OTC derivatives is generally limited to the aggregate unrealized gain less the value of any collateral held by the Fund.
For OTC options purchased, a Fund bears the risk of loss in the amount of the premiums paid plus the positive change in market values net of any collateral held by the Fund should the counterparty fail to perform under the contracts. Options written by a Fund do not typically give rise to counterparty credit risk, as options written generally obligate the Fund, and not the counterparty, to perform. A Fund may be exposed to counterparty credit risk with respect to options written to the extent the Fund deposits collateral with its counterparty to a written option. With exchange-traded options purchased and centrally cleared swaps, there is less counterparty credit risk to a Fund since the exchange or clearinghouse, as counterparty to such instruments, guarantees against possible default. The clearinghouse stands between the buyer and the seller of the contract; therefore, credit risk is limited to failure of the clearinghouse. While offset rights may exist under applicable law, the Fund does not have a contractual right of offset against a clearing broker or clearinghouse in event of a default (including the bankruptcy or insolvency). Additionally, credit risk exists in centrally cleared swaps with respect to initial and variation margin that is held in a clearing broker’s customer accounts. While clearing brokers are required to segregate customer margin from their own assets, in the event that a clearing broker becomes insolvent or goes into bankruptcy and at that time there is a shortfall in the aggregate amount of margin held by the clearing broker for all its clients, typically the shortfall would be allocated on a pro rata basis across all the clearing broker’s customers, potentially resulting in losses to the Fund.
The respiratory illness COVID-19 caused by a novel coronavirus has resulted in a global pandemic and major disruption to economies and markets around the world, including the United States. Financial markets have experienced extreme volatility and severe losses, and trading in many instruments has been disrupted. Liquidity for many instruments has been greatly reduced for periods of time. Some sectors of the economy and individual issuers have experienced particularly large losses. These circumstances may continue for an extended period of time, and may continue to affect adversely the value and liquidity of a Fund’s investments. The ultimate economic fallout from the pandemic, and the long-term impact on economies, markets, industries and individual issuers, are
CRM Funds |
||
103 |
CRM FUNDS NOTES TO FINANCIAL STATEMENTS — June 30, 2021 (Concluded)
|
not known. Governments and central banks, including the Federal Reserve in the U.S., have taken extraordinary and unprecedented actions to support local and global economies and the financial markets. These actions have resulted in significant expansion of public debt, including in the U.S. The impact of these measures, and whether they will be effective to mitigate the economic and market disruption, may not be known for some time. The consequences of high public debt, including its future impact on the economy and securities markets, likewise may not be known for some time.
|
10. |
Contractual Obligations. The Funds enter into contracts in the normal course of business that contain a variety of indemnification obligations. The Funds’ maximum exposure under these arrangements is unknown. |
However, the Funds have not had prior claims or losses pursuant to these contracts. Management has reviewed the Funds’ existing contracts and expects the risk of liability for indemnity claims to be remote.
|
11. |
Temporary Borrowing. Prior to October 2, 2020, each Fund (except Long/Short Opportunities Fund) participated in a $25 million revolving line of credit to be used for temporary or emergency purposes as an additional source of liquidity to fund redemptions by shareholders. This line of credit agreement was with the Bank of New York Mellon. Each participating Fund was charged an annual commitment fee, which was allocated across the Funds on the basis of each Fund’s allocation of the entire facility. Each Fund was permitted to borrow up to one third of its net assets under the agreement (subject to a maximum of $25 million), except that if a Fund had net assets of less than $100 million, such Fund was permitted to borrow up to a maximum of 20% of its net assets. The Funds were charged an annual commitment fee of 0.21%, plus an upfront fee of 0.03%, which was allocated proportionately to each Fund’s borrowing capabilities. For a Fund that utilized the revolving line of credit, interest was charged at a rate of 1.25% plus a negotiated alternative base rate, or overnight rate, depending upon the type of loan. There were no borrowings from July 1, 2020 to October 2, 2020. |
|
12. |
Subsequent Events. Management has evaluated the impact of all subsequent events on the Funds and has determined that no subsequent event currently requires recognition or disclosure in the financial statements. |
CRM Funds |
||
104 |
CRM FUNDS REPORT OF INDEPENDENT REGISTERED PUBLIC ACCOUNTING FIRM
|
To the Shareholders and Board of Trustees of CRM Mutual Fund Trust
Opinion on the Financial Statements
We have audited the accompanying statements of assets and liabilities of CRM Small Cap Value Fund, CRM Small/Mid Cap Value Fund, CRM Mid Cap Value Fund, CRM All Cap Value Fund, and the CRM Long/Short Opportunities Fund (the “Funds”), each a series of CRM Mutual Fund Trust (the “Trust”), including the schedules of investments, as of June 30, 2021, the related statements of operations for the year then ended, the statements of changes in net assets and financial highlights for each of the two years in the period then ended, and the related notes (collectively referred to as the “financial statements”). In our opinion, the financial statements present fairly, in all material respects, the financial position of the Funds as of June 30, 2021, the results of their operations for the year then ended, the changes in their net assets and their financial highlights for each of the two years in the period then ended, in conformity with accounting principles generally accepted in the United States of America.
The financial highlights for each of the three years in the period ended June 30, 2019, except for CRM Long/Short Opportunities Fund in which the financial highlights for each of the two years in the period ended June 30, 2019 and the period from August 16, 2016 (commencement of operations) though June 30, 2017 have been audited by other auditors, whose report dated August 22, 2019 expressed unqualified opinions on such financial highlights.
Basis for Opinion
These financial statements are the responsibility of the Funds’ management. Our responsibility is to express an opinion on the Funds’ financial statements based on our audits. We are a public accounting firm registered with the Public Company Accounting Oversight Board (United States) (“PCAOB”) and are required to be independent with respect to the Funds in accordance with the U.S. federal securities laws and the applicable rules and regulations of the Securities and Exchange Commission and the PCAOB. We have served as the auditor of one or more of the funds in the Trust since 2020.
We conducted our audits in accordance with the standards of the PCAOB. Those standards require that we plan and perform the audits to obtain reasonable assurance about whether the financial statements are free of material misstatement, whether due to error or fraud. The Funds are not required to have, nor were we engaged
105 |
CRM FUNDS REPORT OF INDEPENDENT REGISTERED PUBLIC ACCOUNTING FIRM (Concluded) |
to perform, an audit of the Funds’ internal control over financial reporting. As part of our audits we are required to obtain an understanding of internal control over financial reporting, but not for the purpose of expressing an opinion on the effectiveness of the Funds’ internal control over financial reporting. Accordingly, we express no such opinion.
Our audits included performing procedures to assess the risks of material misstatement of the financial statements, whether due to error or fraud, and performing procedures that respond to those risks. Such procedures included examining, on a test basis, evidence regarding the amounts and disclosures in the financial statements. Our audits also included evaluating the accounting principles used and significant estimates made by management, as well as evaluating the overall presentation of the financial statements. Our procedures included confirmation of securities owned as of June 30, 2021 by correspondence with the custodian and brokers; when replies were not received from brokers, we performed other auditing procedures. We believe that our audits provide a reasonable basis for our opinion.

TAIT, WELLER & BAKER LLP
Philadelphia, Pennsylvania
August 25, 2021
106 |
CRM FUNDS TAX INFORMATION (Unaudited)
|
For the fiscal year ended June 30, 2021, certain dividends may be subject to a maximum tax rate of 20%. For individual shareholders, a percentage of the ordinary income dividends (dividends from net investment income and short-term capital gains, if any) from the Funds qualifies for a maximum tax rate of 20%. Complete information is computed and reported in conjunction with your Form 1099-DIV.
For corporate shareholders, a percentage of the ordinary income dividends from the Funds qualify for the dividends-received deduction.
The percentages of ordinary income dividends which qualify for the maximum tax rate of 20% (“Qualified Dividends”) and the dividends-received deduction are as follows:
Qualified |
Dividends |
|
Small Cap Value Fund |
100.00% |
100.00% |
Small/Mid Cap Value Fund |
60.06% |
59.71% |
Mid Cap Value Fund |
100.00% |
100.00% |
All Cap Value Fund |
100.00% |
100.00% |
Long/Short Opportunities Fund |
0.00% |
0.00% |
In January 2022, shareholders of the Funds will receive Federal income tax information on all distributions paid to their accounts in calendar year 2021, including any distributions paid between July 1, 2021 and December 31, 2021.
107 |
CRM FUNDS STATEMENT REGARDING LIQUIDITY RISK MANAGEMENT PROGRAM (Unaudited) |
Rule 22e-4 (“Liquidity Rule”) under the Investment Company Act of 1940 (“1940 Act”) requires registered open-end funds to establish and implement a written Liquidity Risk Management Program reasonably designed to assess and manage its liquidity risk. The Trust must also periodically review its liquidity risk. In addition, a written report is provided to the Trust’s Board of Trustees annually which details the operation of the Trust’s program.
The Board of Trustees of the Trust met on June 3, 2021 to review the liquidity risk management program (the “Program”) applicable to the funds of the Trust (the “Funds”) pursuant to the Liquidity Rule. The Board has appointed the investment adviser to the Funds as the Program Administrator for each Fund’s Program. The Program Administrator provided the Board with an annual report (the “Report”) that addressed the operations of the Program and assessed the adequacy and effectiveness of the Program. The Report noted that the Program complied with the key factors for consideration under the Liquidity Rule for assessing, managing and periodically reviewing a Fund’s liquidity risk, including the following points.
Pursuant to its program, each Fund classifies the liquidity of its portfolio investments into one of the four categories defined by the SEC: “Highly Liquid”, “Moderately Liquid”, “Less Liquid” and “Illiquid”. These classifications are reported to the SEC on Form N-PORT. The Liquidity Rule requires open-end funds that are not invested primarily in “Highly Liquid” investments to establish a “Highly Liquid Investment Minimum” (“HLIM”), which is the minimum percentage of net assets that must be invested in Highly Liquid investments (i.e., cash or investments that are reasonably expected to be convertible into cash within three business days without significantly changing the market value of the investment). It was determined through periodic reviews that the Funds’ portfolio holdings have been primarily Highly Liquid and, therefore, the Trust does not need to establish a HLIM.
A Fund may not acquire an investment if, immediately after the acquisition, over 15% of the Fund’s net assets would consist of Illiquid investments (an investment that cannot reasonably be expected to be sold or disposed of in current market conditions in seven calendar days or less without the sale or disposition significantly changing the market value of the investment). A Fund is required to report to the SEC and the Fund’s Board of Trustees if the Fund holds illiquid investments in excess of the 15% limit. No such reporting was required during the past year. In addition, periodic stress testing confirmed that each Fund held sufficient liquid investments to cover all reasonably foreseeable levels of cash flow.
CRM Funds |
||
108 |
CRM FUNDS STATEMENT REGARDING LIQUIDITY RISK MANAGEMENT PROGRAM (Unaudited) (Concluded) |
There were no material changes to the Program during the reporting period. The report provided to the Board stated that the Program Administrator concluded that based on the operation of the Program during the reporting period, the Program is operating as intended and is effective in implementing the requirements of the Liquidity Rule.
CRM Funds |
||
109 |
CRM FUNDS TRUSTEES AND OFFICERS
|
Name and Age |
Position(s) Held with Fund |
Length of Time Served# |
Principal Occupation(s) During at Least the Past Five Years |
Number of Portfolios in Fund Complex Overseen by Trustee |
Other Board Memberships Held by Trustee During at Least the Past Five Years |
INTERESTED TRUSTEE: |
|||||
Ronald H. McGlynn, |
Trustee, President and Chief Executive Officer |
Trustee since 2018; President and Chief Executive Officer since 2005. |
Chairman, CRM (1973-2019), Chief Executive Officer from 1998-2011). |
5 |
None |
INDEPENDENT TRUSTEES: |
|||||
F. Gregory Ahern, |
Trustee |
Since 2017. |
Advisory Director, Sard Verbinnen (since 2016); Chief of Public Communications, Financial Industry Regulatory Authority (from 2012-2016). |
5 |
Chairman of Board, Westerly Hospital Foundation (since 2008); Vice Chairman of Board, Yale New Haven Westerly Hospital Foundation (since 2017). |
Rodney P. Wood, |
Trustee |
Since 2017. |
President, Detroit Lions, Inc. (since 2015); President, Ford Estates, LLC (2007-2015). |
5 |
None |
CRM Funds |
||
110 |
CRM FUNDS TRUSTEES AND OFFICERS (Concluded)
|
Name and Age |
Position(s) Held with Fund |
Length of Time Served# |
Principal Occupation(s) During at Least the Past Five Years |
Number of Portfolios in Fund Complex Overseen by Trustee |
Other Board Memberships Held by Trustee During at Least the Past Five Years |
OFFICERS: |
|||||
Michelle |
Treasurer and Principal Financial Officer |
Since 2018. |
Vice President and Controller, CRM |
N/A |
N/A |
Steven A. |
Secretary, Chief Legal Officer and Chief Compliance Officer |
Since 2005. |
Executive Vice President (since 2012), Senior Vice President (2008-2011), Chief Legal Officer and Chief Compliance Officer, CRM (since August 2005), Chief Operating Officer, CRM (since 2015). |
N/A |
N/A |
|
# |
Serves during the continued lifetime of the Funds or until he/she earlier dies, resigns or is removed, or if sooner, until the election and qualification of his or her successor. |
CRM Funds |
||
111 |
CRM FUNDS OTHER INFORMATION (Unaudited)
|
Quarterly Portfolio Schedule
For periods prior to the quarter ending March 31, 2019, the Trust has filed a complete schedule of portfolio holdings for each Fund with the SEC for the first and third quarters of each fiscal year on Form N-Q. Each Fund’s Form N-Qs are available on the SEC’s website at http://www.sec.gov. Effective March 31, 2019, the Trust files a complete schedule of portfolio holdings for each Fund with the SEC for the first and third quarters of each fiscal year as an exhibit to its reports on Form N-PORT. Form N-PORT is available of the SEC’s website at http://www.sec.gov.
Voting Proxies on Fund Portfolio Securities
A description of the policies and procedures that the Trust used to determine how to vote proxies relating to securities held in the Trust’s portfolios is available, without charge and upon request, by calling 800-CRM-2883 and on the SEC’s website at http://www.sec.gov. Information regarding how the Trust voted proxies relating to portfolio securities during the most recent twelve month period ended June 30 is available without charge and upon request by calling 800-CRM-2883, and on the SEC’s website listed above.
Statement of Additional Information
The Statement of Additional Information (“SAI”) for the Fund includes additional information about the Trustees and is available upon request, without charge, by calling 800-CRM-2883 or by visiting the Funds’ website at http://www.crmfunds.com.
CRM Funds |
||
112 |
CRM FUNDS OTHER INFORMATION (Unaudited) (Continued)
|
DISCUSSION OF BOARD CONSIDERATIONS IN APPROVING CONTINUANCE AND RENEWAL OF INVESTMENT ADVISORY AGREEMENT WITH CRM
In order for CRM to remain the Funds’ investment adviser, the Trustees’ Committee and Board of Trustees of the Trust (the “Board”) must determine annually whether to renew the Investment Advisory Agreement between the Trust and CRM with respect to the Funds. The Board evaluates CRM’s services, performance, personnel, profitability, risk management, compliance programs and other relevant factors throughout the year. In addition, in connection with its review of the Investment Advisory Agreement the Board reviewed and considered materials provided by CRM at a meeting held on June 3, 2021.
The materials and information reviewed and considered by the Board in connection with its review of the Investment Advisory Agreement included, among other items: (1) a memorandum from independent counsel setting forth the Board’s fiduciary duties under the 1940 Act and state law and the factors the Board should consider in its evaluation of the Investment Advisory Agreement; and (2) reports based on information provided by Morningstar comparing each Fund’s investment performance to the performance of the Fund’s benchmark index and other mutual funds, and comparing each Fund’s investment advisory fee and net expenses to those of other mutual funds. The Board also discussed and considered, with the assistance of independent counsel, reports of and presentations by CRM that described: (i) the nature, extent and quality of CRM’s services provided to the Funds; (ii) the experience and qualifications of the personnel providing those services; (iii) CRM’s investment philosophies and processes; (iv) CRM’s assets under management (“AUM”); (v) the investment advisory fees charged by CRM to the Funds as compared with the fees charged by CRM to other advisory accounts with similar investment objectives and strategies managed by CRM; (vi) CRM’s compliance and risk management procedures; and (vii) an analysis of the profits of CRM related to its services to the Funds. In addition the Board considered information related to the Funds provided at Board meetings and otherwise received throughout the year.
At the meeting held on June 3, 2021, the Board, including the Independent Trustees voting separately, in the exercise of the Trustees’ business judgment, approved the continuance and renewal of the Investment Advisory Agreement for another year with respect to each Fund.
CRM Funds |
||
113 |
CRM FUNDS OTHER INFORMATION (Unaudited) (Continued)
|
In considering the continuance and renewal of the Investment Advisory Agreement, the Board considered the following factors, none of which was determinative or controlling, and reached the following conclusions:
Nature, Extent and Quality of Services Provided
The Board considered the nature, extent and quality of services provided by CRM to the Funds and expected to be provided in the future. The Board reviewed the quality, size and experience of CRM’s professional portfolio management team. The Board reviewed CRM’s investment approach and research process, including CRM’s capabilities and experience in the development and implementation of its value-oriented investment process. Additionally, the Board considered CRM’s compliance programs and compliance record, risk management philosophy, policies and procedures, marketing strategies, CRM’s personnel and the Board’s dealings with CRM. Based on the foregoing, the Board concluded that CRM is able to provide investment and related services that are appropriate in nature, extent and quality in light of the Funds’ investment objectives, policies, strategies and operations, the competitive landscape of the investment company business and investor needs
Performance Information
In reaching its conclusions, the Board considered the investment performance of each Fund. The Board considered CRM’s focus on achieving long-term performance in a manner consistent with each Fund’s investment objective and investment strategies, as well as CRM’s value-oriented, research driven investment philosophy. The Board considered CRM’s experience in implementing its investment philosophy and concluded that this, along with CRM’s overall approach to investing, supported approval of the continuance of the Investment Advisory Agreement. The Board also discussed the information presented in the Board materials which compared each Fund’s performance against a benchmark index and other mutual funds with similar investment objectives and strategies identified by CRM from data provided by Morningstar. Where the Funds had underperformed their peer groups or benchmark indices, the Board considered CRM’s explanations for such underperformance and, as applicable, measures CRM had taken or proposed to take to improve performance. In particular, because CRM pursues a value strategy with respect to the Funds, the Board noted CRM’s explanation regarding past underperformance of value strategies generally versus growth strategies. Moreover, the Board considered that in order to provide a relevant sample size, the peer groups for the Funds (other
CRM Funds |
||
114 |
CRM FUNDS OTHER INFORMATION (Unaudited) (Continued)
|
than the Long/Short Opportunities Fund) included both funds that pursue a “blend” strategy as well as those that pursue a “value” strategy. The Board considered the following factors in relation to the performance of particular Funds:
Small Cap Value Fund
The Board noted that Institutional Shares of Small Cap Value Fund had underperformed the Fund’s benchmark index for the one-year, three-year, five-year, and ten-year periods ended March 31, 2021. The Board noted that Institutional Shares of the Fund ranked in the third quartile of funds with similar investment objectives and strategies for the one-year and five-year periods ended March 31, 2021, and ranked in the bottom quartile of funds with similar investment objectives and strategies for the three-year period ended March 31, 2021.
Small/Mid Cap Value Fund
The Board noted that Institutional Shares of Small/Mid Cap Value Fund had outperformed the Fund’s benchmark index for the three-year, five-year, and ten-year periods ended March 31, 2021, and underperformed the Fund’s benchmark index for the one-year period ended March 31, 2021. The Board noted that Institutional Shares of the Fund ranked in the top quartile of funds with similar investment objectives and strategies for the three-year and five-year periods ended March 31, 2021, and ranked at the 25th percentile of funds with similar investment objectives and strategies for the one-year period ended March 31, 2021.
Mid Cap Value Fund
The Board noted that Institutional Shares of Mid Cap Value Fund had outperformed the Fund’s benchmark index for the three-year and five-year periods ended March 31, 2021, and underperformed the Fund’s benchmark index for the one-year and ten-year periods ended March 31, 2021. The Board noted that Institutional Shares of the Fund ranked in the top quartile of funds with similar investment objectives and strategies for the five-year period ended March 31, 2021, ranked in the second quartile of funds with similar investment objectives and strategies for the three-year period ended March 31, 2021, and ranked in the third quartile of funds with similar investment objectives and strategies for the one-year period ended March 31, 2021.
CRM Funds |
||
115 |
CRM FUNDS OTHER INFORMATION (Unaudited) (Continued)
|
All Cap Value Fund
The Board noted that Institutional Shares of All Cap Value Fund had outperformed the Fund’s benchmark index for the one-year and five-year periods ended March 31, 2021, and underperformed the Fund’s benchmark index for the three-year and ten-year periods ended March 31, 2021. The Board noted that Institutional Shares of the Fund ranked in the bottom quartile for performance of funds with similar investment objectives and strategies for the one-year, three-year and five-year periods ended March 31, 2021.
Long/Short Opportunities Fund
The Board noted that Institutional Shares of Long/Short Opportunities Fund had underperformed the Fund’s benchmark index for the one-year and three-year periods ended March 31, 2021 and since the Fund’s inception on August 16, 2016. The Board noted that Institutional Shares of the Fund ranked in the second quartile of funds with similar investment objectives and strategies for the one-year and three-year periods ended March 31, 2021.
Conclusion as to Investment Performance
The Board determined that it would continue to monitor closely each Fund’s performance, but that the information it considered supported approval of the Investment Advisory Agreement.
Fees and Expenses
In reaching its conclusions, the Board considered the fees and expenses paid by each class of each Fund.
The Board considered the research and analysis conducted by CRM in order to identify investment opportunities for the Funds and attempt to distinguish itself from each Fund’s benchmark. The Board observed that CRM relies heavily on its own proprietary research to implement its value-oriented investment philosophy, and considered CRM’s experience in implementing its value-oriented investment philosophy. In addition, the Board compared the fees paid by each Fund with the fees paid by institutional separate accounts managed by CRM in a similar investment strategy to that of the applicable Fund, along with the fees paid by CRM’s sponsored Undertakings for the Collective Investment in Transferable Securities (UCITS) and Collective Investment Trust (CIT), respectively, in a similar
CRM Funds |
||
116 |
CRM FUNDS OTHER INFORMATION (Unaudited) (Continued)
|
investment strategy to that of the applicable Fund. In comparing the management fees by the Funds to those paid by institutional separate accounts, UCITS and CIT, the Board considered that the costs associated with the management of the Funds generally are greater than those associated with providing investment advisory services to other client accounts. The Board noted the additional complexities involved in the management of the Funds resulting from more frequent and less predictable cash flows and regulatory requirements, among other factors. The Board considered the additional services provided to the Funds that CRM does not perform for its other clients, or services that are broader in scope, including oversight of compliance with the regulatory and tax regimes to which the Funds are subject, oversight of third-party service providers, preparation of prospectuses, shareholder reports and other disclosure documents and preparation of materials for Board meetings. Moreover, the Board considered the business risks that CRM faces with respect to the Funds, including regulatory and reputational risks with respect to CRM’s investment decisions and compliance oversight on behalf of the Funds, and the substantial entrepreneurial risks that CRM assumes during the initial years of a Fund’s operations. In addition, the Board considered that there may be historical reasons for certain separate account fees, and the element of negotiation in regard to the level of fees paid by CRM’s separate account clients.
The Board also discussed the information presented in the Board materials, which compared the fees and expenses paid by each Fund with the fees and expenses paid by other mutual funds with similar investment objectives and strategies identified by CRM from data provided by Morningstar. In comparing expenses, it was noted that the funds in the 1st percentile represented the most expensive funds, while the funds in the 99th percentile represented the least expensive funds.
Small Cap Value Fund
The Board noted that, based on the information provided, the investment advisory fee for Small Cap Value Fund ranked at the 75th percentile for funds with similar investment objectives and strategies. The Board noted that the Fund’s investment advisory fee was lower than both the median and average advisory fee paid by funds with similar investment objectives and strategies. The Board noted that, based on the information provided, the total net annual operating expenses of Institutional Shares of Small Cap Value Fund ranked at the 75th percentile for funds with similar investment objectives and strategies. The Board noted that the total net annual operating expenses of Institutional Shares of the Fund were lower than both
CRM Funds |
||
117 |
CRM FUNDS OTHER INFORMATION (Unaudited) (Continued)
|
the median and the average net expenses paid by funds with similar investment objectives and strategies.
Small/Mid Cap Value Fund
The Board noted that, based on the information provided, the investment advisory fee for Small/Mid Cap Value Fund ranked at the 25th percentile for funds with similar investment objectives and strategies. The Board noted that the Fund’s investment advisory fee was higher than both the median and the average advisory fee paid by funds with similar investment objectives and strategies. The Board noted that, based on the information provided, the total net annual operating expenses of Investor Shares of Small/Mid Cap Value Fund ranked in the first quartile in expenses of funds with similar investment objectives and strategies. The Board noted that the total net annual operating expenses of Investor Shares of the Fund were higher than both the median and the average net expenses paid by funds with similar investment objectives and strategies.
Mid Cap Value Fund
The Board noted that based on the information provided, the investment advisory fee for Mid Cap Value Fund ranked at the 25th percentile for funds with similar investment objectives and strategies. The Board noted that the Fund’s investment advisory fee was higher than both the median and the average advisory fee paid by mutual funds with similar investment objectives and strategies. The Board noted that, based on the information provided, the total net annual operating expenses of Institutional Shares of Mid Cap Value Fund ranked in the first quartile in expenses of funds with similar investment objectives and strategies. The Board noted that the total net annual operating expenses of Institutional Shares of the Fund were higher than both the median and the average net expenses paid by funds with similar investment objectives and strategies.
All Cap Value Fund
The Board noted that, based on the information provided, the investment advisory fee for All Cap Value Fund ranked in the second quartile of funds with similar investment objectives and strategies. The Board noted that the Fund’s current investment advisory fee was equal to the median and higher than the average advisory fees paid by funds with similar investment objectives and strategies. The Board noted that, based on the information provided, the total net annual operating
CRM Funds |
||
118 |
CRM FUNDS OTHER INFORMATION (Unaudited) (Continued)
|
expenses of Institutional Shares of All Cap Value Fund ranked in the first quartile in expenses of funds with similar investment objectives and strategies. The Board noted that the total net annual operating expenses of Institutional Shares of the Fund were higher than both the median and the average net expenses paid by funds with similar investment objectives and strategies.
Long/Short Opportunities Fund
The Board noted that, based on the information provided, the investment advisory fee for Long/Short Opportunities Fund ranked in the first quartile of funds with similar investment objectives and strategies. The Board noted that the Fund’s investment advisory fee was higher than both the median and average advisory fees paid by funds with similar investment objectives and strategies. The Board noted that, based on the information provided, the total net annual operating expenses of Institutional Shares of Long/Short Opportunities Fund ranked in the first quartile in expenses of funds with similar investment objectives and strategies. The Board noted that the total net annual operating expenses of Institutional Shares of the Fund were higher than both the median and the average net expenses paid by funds with similar investment objectives and strategies.
Conclusion as to Fees and Expenses
In view of what it understood to be the costs of CRM’s proprietary research and CRM’s experience in implementing its value-oriented investment philosophy, the Board determined that the investment advisory fee paid by each Fund was reasonable in relation to the nature and quality of the services provided by CRM. The Board also indicated it would continue to monitor the Funds’ fees and expenses.
Economies of Scale
The Board considered whether economies of scale would be realized by CRM as each Fund’s assets increased, and the extent to which such economies of scale were reflected in the fees charged under the Investment Advisory Agreement. The Board observed that the Investment Advisory Agreement contains breakpoints that reduce the investment advisory fee rate paid by each Fund on assets above specified levels. The Board concluded that breakpoints were an effective way to share any economies of scale or other efficiencies with Fund shareholders as the Funds grow larger. In addition, the Board noted that expense subsidization, investment by CRM in proprietary research, and CRM’s resource allocation to the Funds may be
CRM Funds |
||
119 |
CRM FUNDS OTHER INFORMATION (Unaudited) (Continued)
|
relevant in considering the sharing of economies of scale, and that profitability also may be an indicator of the existence of any economies of scale. Accordingly, the Board determined that economies of scale, if any, were being appropriately shared with the Funds.
Profitability
The Board considered the information provided by CRM regarding CRM’s profitability in relation to the Funds and considered the methodology used by CRM in preparing the profitability information. The Board reviewed the financial results of CRM in relation to the Funds for the year ended December 31, 2020. The Board considered CRM’s profit margins with respect to the Funds in comparison to the limited industry data available. The Board also considered information regarding compensation provided to CRM personnel as a percentage of CRM’s net revenue, and compared such information to the limited industry data available. The Board indicated that the profitability of any adviser was affected by numerous factors, including its organizational structure, method for allocating expenses and the compensation to be paid to its employees, and, therefore, acknowledged the limitations inherent in any comparison of adviser profitability information. The Board also observed CRM’s profitability analysis reflected a loss to CRM on its management of All Cap Value Fund. The Board determined that, based on the information provided, the overall profit to CRM on the fees paid by the Funds was not excessive in view of the nature, quality and extent of the services provided.
Other Benefits
The Board considered the other benefits which CRM receives from its relationship with the Funds. They noted that CRM acts as the shareholder servicing agent for Investor Shares of the Funds and receives fees under a shareholder service plan in connection with the services CRM provides or arranges as the Funds’ shareholder servicing agent. The Board considered the fees received by CRM under the shareholder service plan, and the amounts paid by CRM to third-party shareholder servicing agents. The Board noted that the amounts paid by CRM to the Funds’ third-party shareholder servicing agents since the inception of the Trust exceeded the amounts paid by Investor Shares of the Funds to CRM under the shareholder servicing plan. The Board considered how CRM uses “soft” commission dollars generated by the Funds to pay for research and brokerage services and the ways in which CRM conducts portfolio transactions for the Funds and selects brokers.
CRM Funds |
||
120 |
CRM FUNDS OTHER INFORMATION (Unaudited) (Continued)
|
The Board determined that any other benefits derived by CRM from managing the Funds were reasonable.
General Conclusion
Based on the foregoing considerations, the Board, including the Independent Trustees voting separately, in the exercise of the Trustees’ business judgment, concluded that the terms of the Investment Advisory Agreement, including the fees payable thereunder, are fair and reasonable, and voted to approve the continuance and renewal of the Investment Advisory Agreement.
CRM Funds |
||
121 |
CRM FUNDS OTHER INFORMATION (Unaudited) (Continued)
|
Privacy Notice
(THIS PRIVACY NOTICE IS BEING DELIVERED WITH THE FUNDS’ SHAREHOLDER REPORT BUT IS NOT DEEMED TO BE A PART OF THE FUNDS’ SHAREHOLDER REPORT)
Set forth below is the policy of CRM Mutual Fund Trust (the “Trust”) concerning the collection and disclosure of non-public personal information regarding investors and prospective investors in the CRM Funds (the “Fund”) who are individuals investing for personal, family, or household purposes. The words “we” and “us” refers to the Trust and the Fund. The words “you” and “your” refers to investors and prospective investors in the Fund who are covered by this policy.
We use administrators, investment managers, custodians, transfer agents, securities brokers, and other third party businesses to conduct many aspects of our business, including processing initial investments, additional investments, redemptions, share transfers, and other transactions that you request. We refer to these third parties below as our “Service Agents.”
As we work together to achieve your investment goals, we will often share with our Service Agents personal and financial information, including, for example, your name, address and telephone number, your e-mail address, your purchases and redemptions of shares of the Funds, your banking arrangements, information on your family members, and your social security number. Our Service Agents may also receive these types of information from other firms that assist us in conducting our business. This information is collected in order to properly handle your account.
To protect the security of your personal and financial information, our Service Agents maintain physical, electronic, and procedural safeguards that meet the standards of applicable laws and regulations.
We may, and we may authorize our Service Agents to, use your personal and financial information and share it with us, other Service Agents, and affiliates of Service Agents in order to provide you with investment services, improve our services, make our procedures more efficient, implement security measures, and fight fraud.
We will not sell your personal and financial information to any outside party. We obtain from our Service Agents confidentiality agreements that prohibit them from selling or improperly using your personal or financial information.
CRM Funds |
||
122 |
CRM FUNDS OTHER INFORMATION (Unaudited) (Concluded)
|
On occasion, we and our Service Agents may be required to provide information about you and your transactions to governmental agencies, self-regulatory organizations, industry associations and similar bodies in order to fulfill legal and regulatory requirements. In addition, federal, state, and foreign laws give people involved in lawsuits and other legal proceedings the right under certain circumstances to obtain information from us and our Service Agents, including your personal and financial information. We and our Service Agents may make other disclosures to non-affiliated third parties as permitted by law.
CRM Funds |
||
123 |
[THIS PAGE INTENTIONALLY LEFT BLANK]
[THIS PAGE INTENTIONALLY LEFT BLANK]
[THIS PAGE INTENTIONALLY LEFT BLANK]

TRUSTEES
F. Gregory Ahern
Ronald H. McGlynn
Rodney P. Wood
INVESTMENT ADVISER
Cramer Rosenthal McGlynn, LLC
28 Havemeyer Place, 1st floor
Greenwich, CT 06830
DISTRIBUTOR
ALPS Distributors, Inc.
1290 Broadway, Suite 1000
Denver, CO 80203
ADMINISTRATOR & TRANSFER AGENT
Ultimus Fund Solutions, LLC
4221 N. 203rd Str., Suite 100
Elkhorn, NE 68022
CUSTODIAN
The Bank of New York Mellon
2 Hanson Place, 7th Floor
Brooklyn, NY 11217
LEGAL COUNSEL
Morgan, Lewis & Bockius LLP
One Federal Street
Boston, MA 02110
Investor Information:
800-CRM-2883
www.crmfunds.com
This report is authorized for distribution only to shareholders and to others who have received current prospectuses of the CRM Funds.
CRM-AR-21
Item 2. Code of Ethics.
The Registrant has adopted a code of ethics that applies to the Registrant’s Principal Executive and Principal Financial Officers. For the fiscal year ended June 30, 2021, there were no amendments to a provision of its code of ethics, nor were there any waivers, including implicit waivers granted from a provision of the code of ethics. A copy of the Registrant’s code of ethics is filed with this Form N-CSR under Item 13(a)(1).
Item 3. Audit Committee Financial Expert.
The Registrant’s Board of Trustees has determined that the Registrant has at least one audit committee financial expert serving on its Trustees Committee. The audit committee financial experts serving on the Registrant’s Trustees Committee are F. Gregory Ahern and Rodney P. Wood, each of whom is “independent,” as defined in Item 3(a)(2) of Form N-CSR.
Item 4. Principal Accountant Fees and Services.
Audit Fees
| (a) | The aggregate fees billed for professional services rendered by the principal accountant for the audit of the registrant’s annual financial statements or services that are normally provided by the accountant in connection with statutory and regulatory filings or engagements for the fiscal years ended June 30, 2021 and June 30, 2020 were $80,000 and $80,000, respectively. |
Audit-Related Fees
| (b) | The aggregate fees billed in each of the last two fiscal years for assurance and related services by the principal accountant that are reasonably related to the performance of the audit of the registrant’s financial statements and are not reported under paragraph (a) of this Item were $0 for 2021, and $0 for 2020. |
Tax Fees
| (c) | The aggregate fees billed for professional services rendered by the principal accountant for tax compliance, tax advice, and tax planning during the fiscal years ended June 30, 2021 and June 30, 2020 were $18,000 and $18,000, respectively. These fees related to services consisting of the review of U.S. federal income tax returns, annual excise distribution calculations, India tax compliance services and tax advisory services with regard to foreign equity securities. |
All Other Fees
| (d) | The aggregate fees billed in each of the last two fiscal years for products and services provided by the principal accountant, other than the services reported in paragraphs (a) through (c) of this Item were $0 for 2021, and $0 for 2020. |
| (e)(1) | The Trustees Committee of the Board of Trustees of the Registrant is required to pre-approve the engagement of independent accountants to (i) conduct the annual audit of the series of the Registrant (the “Funds”) and provide their opinion of the Funds’ financial statements, (ii) provide (a) any audit services to the Funds in addition to those described in clause (i) above and (b) non-audit services to the Funds, Cramer Rosenthal McGlynn, LLC (“CRM”) or any entity controlling, controlled by, or under common control with CRM that provides ongoing services to the Funds, if the engagement relates directly to the operations and financial reporting of the Funds. Accordingly, the Registrant’s Trustees Committee pre-approves all audit and non-audit services to be performed by the Registrant’s independent accountant before the accountant is engaged by the Registrant to perform such services. |
| (e)(2) | There were no services described in paragraphs (b) through (d) of this Item (including services required to be approved by the Trustees Committee pursuant to paragraph (c)(7)(ii) of Rule 2-01 of Regulation S-X) that were approved by the Trustees Committee pursuant to paragraph (c)(7)(i)(C) of Rule 2-01 of Regulation S-X. |
| (f) | Not Applicable. |
| (g) | The aggregate non-audit fees billed by the registrant’s accountant for services rendered to the registrant, and rendered to the registrant’s investment adviser (not including any sub-adviser whose role is primarily portfolio management and is subcontracted with or overseen by another investment adviser), and any entity controlling, controlled by, or under common control with the adviser that provides ongoing services to the registrant for each of the last two fiscal years ended June 30, 2021 and June 30, 2020 were $0 and $0, respectively. |
| (h) | The registrant’s audit committee of the board of directors has considered whether the provision of non-audit services that were rendered to the registrant’s investment adviser (not including any sub-adviser whose role is primarily portfolio management and is subcontracted with or overseen by another investment adviser), and any entity controlling, controlled by, or under common control with the investment adviser that provides ongoing services to the registrant that were not pre-approved pursuant to paragraph (c)(7)(ii) of Rule 2-01 of Regulation S-X is compatible with maintaining the principal accountant’s independence. |
Item 5. Audit Committee of Listed Registrants.
Not applicable.
Item 6. Investments.
| (a) | Schedule of Investments in securities of unaffiliated issuers as of the close of the reporting period is included as part of the report to shareholders filed under Item 1 of this Form. |
| (b) | Not applicable. |
Item 7. Disclosure of Proxy Voting Policies and Procedures for Closed-End Management Investment Companies.
Not applicable.
Item 8. Portfolio Managers of Closed-End Management Investment Companies.
Not applicable.
Item 9. Purchases of Equity Securities by Closed-End Management Investment Company and Affiliated Purchasers.
Not applicable.
Item 10. Submission of Matters to a Vote of Security Holders.
There have been no material changes to the procedures by which shareholders may recommend nominees to the Registrant’s Board of Trustees, where those changes were implemented after the registrant last provided disclosure in response to the requirements of Item 407(c)(2)(iv) of Regulation S-K (17 CFR 229.407) (as required by Item 22(b)(15) of Schedule 14A (17 CFR 240.14a-101)), or this Item.
Item 11. Controls and Procedures.
| (a) | The Registrant’s Principal Executive and Principal Financial Officers have concluded that the Registrant’s disclosure controls and procedures (as defined in Rule 30a-3(c) under the Investment Company Act of 1940 (17 CFR 270.30a-3(c))) are effective based on their evaluation of these controls and procedures required by Rule 30a-3(b) under the Investment Company Act of 1940 (17 CFR 270.30a-3(b)) and Rules 13a-15(b) or 15d-15(b) under the Securities Exchange Act of 1934, as amended (17 CFR 240.13a-15(b) or 240.15d-15(b)). |
| (b) | There were no changes in the Registrant’s internal control over financial reporting (as defined in Rule 30a-3(d) under the Investment Company Act of 1940 (17 CFR 270.30a-3(d))) that occurred during the period covered by this report that has materially affected, or is reasonably likely to materially affect, the Registrant’s internal control over financial reporting. |
Item 12. Disclosure of Securities Lending Activities for Closed-End Management Investment Companies.
Not applicable.
Item 13. Exhibits.
| (a)(1) | Code of Ethics for the Registrant’s Principal Executive and Principal Financial Officers described in Item 2 is filed herewith. |
| (a)(2) | Certifications of the Principal Executive Officer and Principal Financial Officer of the Registrant as required by Rule 30a-2(a) under the Investment Company Act of 1940 are filed herewith. |
SIGNATURES
Pursuant to the requirements of the Securities Exchange Act of 1934 and the Investment Company Act of 1940, the registrant has duly caused this report to be signed on its behalf by the undersigned, thereunto duly authorized.
| (Registrant) | CRM Mutual Fund Trust |
| By (Signature and Title)* | /s/ Ronald H. McGlynn | |
| Ronald H. McGlynn, President and Chief Executive Officer | ||
| (Principal Executive Officer) |
| Date: | 8/31/2021 |
Pursuant to the requirements of the Securities Exchange Act of 1934 and the Investment Company Act of 1940, this report has been signed below by the following persons on behalf of the registrant and in the capacities and on the dates indicated.
| By (Signature and Title)* | /s/ Ronald H. McGlynn | |
| Ronald H. McGlynn, President and Chief Executive Officer | ||
| (Principal Executive Officer) |
| Date: | 8/31/2021 |
| By (Signature and Title)* | /s/ Michelle Kaufmann | |
| Michelle Kaufmann, Treasurer | ||
| (Principal Financial Officer) |
| Date: | 8/31/2021 |
| * | Print the name and title of each signing officer under his or her signature. |
Sarbanes-oxley act CODE OF ETHICS
FOR PRINCIPAL EXECUTIVE AND PRINCIPAL
FINANCIAL OFFICERS OF CRM MUTUAL FUND TRUST
| I. | Covered Officers/Purpose of the Code |
This code of ethics (the “Code”)1 for CRM Mutual Fund Trust (the “Trust”) applies to the Trust’s President and Principal Executive Officer, Treasurer and Principal Accounting and Financial Officer (each, a “Covered Officer” and collectively, the “Covered Officers”) for the purpose of promoting:
| • | honest and ethical conduct, including the ethical handling of actual or apparent conflicts of interest between personal and professional relationships; |
| • | full, fair, accurate, timely and understandable disclosure in reports and documents that the Trust files with, or submits to, the Commission and in other public communications made by the Trust; |
| • | compliance with applicable laws and governmental rules and regulations; |
| • | an environment that encourages disclosure of ethical and compliance related concerns; |
| • | the prompt internal reporting of violations of this Code to an appropriate person or persons identified in this Code without fear of reprisal; and |
| • | accountability for adherence to this Code. |
Each Covered Officer should adhere to a high standard of business ethics and should be sensitive to situations that may give rise to apparent as well as actual conflicts of interest. The Covered Officers are integral to the Trust’s goal of creating a culture of high ethical standards and commitment to compliance.
| 1 | This Code shall be the sole code of ethics adopted by the Trust for purposes of Section 406 of the Sarbanes-Oxley Act of 2002, as amended, and the rules and forms applicable to registered investment companies thereunder. Insofar as other policies or procedures of the Trust, Cramer Rosenthal McGlynn, LLC, which serves as investment adviser to the series of the Trust (the “Adviser”), or the principal underwriter or other service providers of the Trust govern or purport to govern the behavior or activities of the Covered Officers who are subject to this Code, they are superseded by this Code to the extent that they overlap or conflict with the provisions of this Code. Certain conflicts of interest that may arise out of the relationships between Covered Officers and the Trust already are subject to conflict of interest provisions in, or in regulations adopted by the U.S. Securities and Exchange Commission (the “Commission”) pursuant to, the U.S. Investment Company Act of 1940, as amended (the “Investment Company Act”) and the U.S. Investment Advisers Act of 1940, as amended (the “Investment Advisers Act”). The compliance programs and procedures of the Trust and of the Adviser, are designed to prevent, or identify and correct, violations of these provisions. This Code does not, and is not intended to, repeat or replace these programs and procedures, and such conflicts fall outside of the parameters of this Code. For example, the Trust’s code of ethics under Rule 17j-1 of the Investment Company Act and the Adviser’s code of ethics under the Investment Advisers Act are separate requirements applying to the Covered Officers, and are not part of this Code. In addition, there are certain conflicts of interest that are covered by this Code that are not subject to provisions of the Investment Company Act and the Investment Advisers Act. |
1
| II. | Covered Officers Should Handle Ethically Actual and Apparent Conflicts of Interest |
A “conflict of interest” occurs when a Covered Officer’s private interest interferes with the interests of, or his service to, the Trust. For example, a conflict of interest would arise if a Covered Officer, or a member of his family, receives improper personal benefits as a result of his position with a Trust.
Certain conflicts of interest arise out of the relationship between Covered Officers and the Trust and already are subject to conflict of interest provisions in the Investment Company Act of 1940 (the “1940 Act”), as amended, and the Investment Advisers Act. For example, Covered Officers may not individually engage in certain transactions (such as the purchase or sale of securities or other property) with the Trust because of their status as “affiliated persons” of the Trust. The Trust’s Adviser has adopted and implemented a compliance program and procedures that are designed to prevent, identify and correct, violations of these provisions, as described above.
The following list provides examples of conflicts of interest under this Code, but Covered Officers should keep in mind that these examples are not exhaustive. The overarching principle is that the personal interest of a Covered Officer should not be placed improperly before the interest of the Trust.2
Each Covered Officer must:
| • | not use his personal influence or personal relationships improperly to influence investment decisions or financial reporting by the Trust whereby the Covered Officer would benefit personally to the detriment of the Trust; |
| • | not cause the Trust to take action, or fail to take action, for the individual personal benefit of the Covered Officer rather than the benefit of the Trust; |
| • | not use material non-public knowledge of Trust transactions made or contemplated for the Trust to trade personally or cause others to trade personally in contemplation of the market effect of such transactions; and |
| • | report at least annually affiliations or other relationships related to conflicts of interest covered by the Trust’s Directors and Officers Questionnaire, as described below. |
There are some potential conflicts of interest which must always be referred to the individual designated from time to time by the Board of the Trust as the compliance officer for purposes of this Code (the "Compliance Officer"). No action may be taken without his approval. Examples of these include:3
| 2 | Although typically not presenting an opportunity for improper personal benefit, conflicts may arise from, or as a result of, the contractual relationship between the Trust and the Adviser of which the Covered Officers are also officers or employees. As a result, this Code recognizes that the Covered Officers will, in the normal course of their duties (whether formally for the Trust or for the Adviser, or for both), be involved in establishing policies and implementing decisions that will have different effects on the Adviser and the Trust. The participation of the Covered Officers in such activities is inherent in the contractual relationship between the Trust and the Adviser and is consistent with the performance by the Covered Officers of their duties as officers of the Trust. Thus, if performed in conformity with the Investment Company Act and the Investment Advisers Act, such activities will be deemed to have been handled ethically for purposes of this Code. In addition, it is recognized by the Trust’s Board of Trustees (the “Board”) that the Covered Officers may also be officers or employees of one or more other investment companies covered by this Code or other codes. |
| 3 | Any activity or relationship that would present a conflict for the Covered Officer would also likely present a conflict for the Covered Officer if a member of the Covered Officer’s family engages in such an activity or has such a relationship. |
2
| • | service as a director on the board of any public or private company; |
| • | the receipt of any gifts from any person or entity with which the Trust has a current or prospective business relationship in excess of $100; |
| • | the receipt of any entertainment from any company with which the Trust has current or prospective business dealings unless such entertainment is business-related, reasonable in cost, appropriate as to time and place, and not so frequent as to raise any question of impropriety;4 |
| • | any ownership interest in, or any consulting or employment relationship with, any of the Trust’s service providers, other than the Investment Adviser or the Trust’s principal underwriter, administrator or any affiliated person thereof; and |
| • | a direct or indirect financial interest in commissions, transaction charges or spreads paid by a Trust for effecting portfolio transactions or for selling or redeeming shares other than an interest arising from the Covered Officer’s employment, such as compensation or equity ownership. |
| III. | Disclosure and Compliance |
Each Covered Officer should:
| • | familiarize himself with the disclosure requirements generally applicable to the Trust; |
| • | not knowingly misrepresent, or cause others to misrepresent, facts about the Trust to others, whether within or outside the Trust, including to the Trust’s trustees and auditors and to governmental regulators and self-regulatory organizations; |
| • | cooperate with the Trust’s independent accountants, regulatory agencies, and internal auditors in their review of the Trust and its operations; |
| • | to the extent appropriate within his area of responsibility, consult with the other officers and employees of the Trust and the Investment Adviser with the goal of promoting full, fair, accurate, timely and understandable disclosure in the reports and documents that the Trust file with, or submit to, the Commission and in other public communications made by the Trust; |
| • | have the responsibility to promote compliance with the standards and restrictions imposed by applicable laws, rules and regulations. |
| 4 | All Covered Officers are required to report activity of gifts and entertainment in accordance with the Adviser’s Sensitive Payments Policy. |
3
| IV. | Reporting and Accountability |
Each Covered Officer must:
| • | affirm in writing to the Board that he has received, read, and understands this Code; |
| • | annually affirm to the Board that he has complied with this Code; |
| • | report at least annually affiliations and other relationships related to conflicts of interest covered by the Trust’s Questionnaire for Trustees and Officers; |
| • | not retaliate against any trustee or other officer of the Trust and any partner or employee of the Investment Adviser, or any partner, officer, trustee, or employee of any of their affiliated persons for reports of potential violations that are made in good faith; and |
| • | notify the Compliance Officer promptly if he knows of any material violation of applicable laws, regulations, or of this Code has occurred, is occurring, or is about to occur. Failure to do so is itself a violation of this Code. |
The Compliance Officer is responsible for applying this Code to specific situations in which questions are presented under it and has the authority to interpret this Code in any particular situation.
The Trust will follow these procedures in investigating and enforcing this Code:
| • | the Compliance Officer will take all appropriate action to investigate any potential violations reported to him; |
| • | if, after such investigation, the Compliance Officer believes that no violation has occurred, the Compliance Officer is not required to take any further action; |
| • | any matter that the Compliance Officer believes is a violation will be reported to the Trustees Committee of the Trust (the “Committee”); |
| • | if the Committee concurs that a violation has occurred, the Committee will consider appropriate action. Appropriate action may include review of, and appropriate modifications to, applicable policies and procedures; notification to appropriate personnel of the Adviser or its partners; or a recommendation to the Board of the Trust to dismiss the Covered Officer as an officer of the Trust; |
| • | the Committee will be responsible for granting waivers, as appropriate, of any material violation of this Code reported to the Committee; and |
| • | any changes to or waivers of this Code will, to the extent required, be disclosed as provided by Commission rules. |
4
| V. | Sanctions |
The matters covered in this Code are of the utmost importance to the Trust and its shareholders and are essential to the Trust’s ability to conduct business. Each Covered Officer is expected to adhere to these rules (to the extent applicable) in carrying out his or her duties for the Trust. The conduct of each Covered Officer can positively influence the conduct of all officers, employees and agents of the Trust. The Trust will, if appropriate, take action against any Covered Officer whose actions are found to violate the Code. Appropriate sanctions for violations of the Code will depend on the materiality of the violation to the Trust.
| VI. | Amendments |
Any amendments to this Code must be approved by a majority vote of the Board, including a majority of Trustees who are not “interested persons” as defined in the Investment Company Act (the “Non-Interested Trustees”).
| VII. | Confidentiality |
All reports and records prepared or maintained pursuant to this Code will be considered confidential and shall be maintained and protected accordingly. Except as otherwise required by law or this Code, such matters shall not be disclosed to anyone other than the Board, the Committee, counsel to the Trust, counsel to the Non-Interested Trustees, the Adviser, its counsel, any administrator or underwriter for the Trust, or their counsel. The Compliance Officer, the Committee and the Board shall have the authority to make additional general or specific exceptions to this confidentiality policy.
| VIII. | Internal Use |
This Code is intended solely for the internal use by the Trust and does not constitute an admission, by or on behalf of the Trust, as to any fact, circumstance, or legal conclusion. Nor is this Code a waiver of any right or privilege of the Trust. This Code is a statement of certain fundamental principles, policies, and procedures that govern the Covered Officers in the conduct of the Trust’s business. It is not intended and does not create any rights in any employee, investor, supplier, creditor, shareholder or any other person.
Date: August 20, 2020
5
Certification Pursuant to Rule 30a-2(a) under the 1940 Act and Section 302 of the
Sarbanes-Oxley Act
I, Ronald H. McGlynn, certify that:
| 1. | I have reviewed this report on Form N-CSR of CRM Mutual Fund Trust; |
| 2. | Based on my knowledge, this report does not contain any untrue statement of a material fact or omit to state a material fact necessary to make the statements made, in light of the circumstances under which such statements were made, not misleading with respect to the period covered by this report; |
| 3. | Based on my knowledge, the financial statements, and other financial information included in this report, fairly present in all material respects the financial condition, results of operations, changes in net assets, and cash flows (if the financial statements are required to include a statement of cash flows) of the registrant as of, and for, the periods presented in this report; |
| 4. | The registrant’s other certifying officer(s) and I are responsible for establishing and maintaining disclosure controls and procedures (as defined in Rule 30a-3(c) under the Investment Company Act of 1940) and internal control over financial reporting (as defined in Rule 30a-3(d) under the Investment Company Act of 1940) for the registrant and have: |
| (a) | Designed such disclosure controls and procedures, or caused such disclosure controls and procedures to be designed under our supervision, to ensure that material information relating to the registrant, including its consolidated subsidiaries, is made known to us by others within those entities, particularly during the period in which this report is being prepared; |
| (b) | Designed such internal control over financial reporting, or caused such internal control over financial reporting to be designed under our supervision, to provide reasonable assurance regarding the reliability of financial reporting and the preparation of financial statements for external purposes in accordance with generally accepted accounting principles; |
| (c) | Evaluated the effectiveness of the registrant’s disclosure controls and procedures and presented in this report our conclusions about the effectiveness of the disclosure controls and procedures, as of a date within 90 days prior to the filing date of this report based on such evaluation; and |
| (d) | Disclosed in this report any change in the registrant’s internal control over financial reporting that occurred during the period covered by this report that has materially affected, or is reasonably likely to materially affect, the registrant’s internal control over financial reporting; and |
| 5. | The registrant’s other certifying officer(s) and I have disclosed to the registrant’s auditors and the audit committee of the registrant’s board of directors (or persons performing the equivalent functions): |
| (a) | All significant deficiencies and material weaknesses in the design or operation of internal control over financial reporting which are reasonably likely to adversely affect the registrant’s ability to record, process, summarize, and report financial information; and |
| (b) | Any fraud, whether or not material, that involves management or other employees who have a significant role in the registrant’s internal control over financial reporting. |
| Date: | 8/31/2021 | /s/ Ronald H. McGlynn | ||
| Ronald H. McGlynn, | ||||
| President and Chief Executive Officer | ||||
| (Principal Executive Officer) | ||||
Certification Pursuant to Rule 30a-2(a) under the 1940 Act and Section 302 of the
Sarbanes-Oxley Act
I, Michelle Kaufmann, certify that:
| 1. | I have reviewed this report on Form N-CSR of CRM Mutual Fund Trust; |
| 2. | Based on my knowledge, this report does not contain any untrue statement of a material fact or omit to state a material fact necessary to make the statements made, in light of the circumstances under which such statements were made, not misleading with respect to the period covered by this report; |
| 3. | Based on my knowledge, the financial statements, and other financial information included in this report, fairly present in all material respects the financial condition, results of operations, changes in net assets, and cash flows (if the financial statements are required to include a statement of cash flows) of the registrant as of, and for, the periods presented in this report; |
| 4. | The registrant’s other certifying officer(s) and I are responsible for establishing and maintaining disclosure controls and procedures (as defined in Rule 30a-3(c) under the Investment Company Act of 1940) and internal control over financial reporting (as defined in Rule 30a-3(d) under the Investment Company Act of 1940) for the registrant and have: |
| (a) | Designed such disclosure controls and procedures, or caused such disclosure controls and procedures to be designed under our supervision, to ensure that material information relating to the registrant, including its consolidated subsidiaries, is made known to us by others within those entities, particularly during the period in which this report is being prepared; |
| (b) | Designed such internal control over financial reporting, or caused such internal control over financial reporting to be designed under our supervision, to provide reasonable assurance regarding the reliability of financial reporting and the preparation of financial statements for external purposes in accordance with generally accepted accounting principles; |
| (c) | Evaluated the effectiveness of the registrant’s disclosure controls and procedures and presented in this report our conclusions about the effectiveness of the disclosure controls and procedures, as of a date within 90 days prior to the filing date of this report based on such evaluation; and |
| (d) | Disclosed in this report any change in the registrant’s internal control over financial reporting that occurred during the period covered by this report that has materially affected, or is reasonably likely to materially affect, the registrant’s internal control over financial reporting; and |
| 5. | The registrant’s other certifying officer(s) and I have disclosed to the registrant’s auditors and the audit committee of the registrant’s board of directors (or persons performing the equivalent functions): |
| (a) | All significant deficiencies and material weaknesses in the design or operation of internal control over financial reporting which are reasonably likely to adversely affect the registrant’s ability to record, process, summarize, and report financial information; and |
| (b) | Any fraud, whether or not material, that involves management or other employees who have a significant role in the registrant’s internal control over financial reporting. |
| Date: | 8/31/2021 | /s/ Michelle Kaufmann | ||
| Michelle Kaufmann, Treasurer | ||||
| (Principal Financial Officer) |
Certification Pursuant to Rule 30a-2(b) under the 1940 Act and Section 906 of the
Sarbanes-Oxley Act
I, Ronald H. McGlynn, President and Chief Executive Officer of CRM Mutual Fund Trust (the “Registrant”), with respect to the Registrant’s Form N-CSR for the period ended December 31, 2020 as filed with the Securities and Exchange Commission, certify to the best of my knowledge that:
| 1. | The Form N-CSR of the Registrant (the “Report”) fully complies with the requirements of Section 13(a) or 15(d) of the Securities Exchange Act of 1934, as amended; and |
| 2. | The information contained in the Report fairly presents, in all material respects, the financial condition and results of operations of the Registrant. |
| Date: | 8/31/2021 | /s/ Ronald H. McGlynn | ||
| Ronald H. McGlynn, President and Chief Executive Officer | ||||
| (Principal Executive Officer) |
I, Michelle Kaufmann, Treasurer of CRM Mutual Fund Trust (the “Registrant”), with respect to the Registrant’s Form N-CSR for the period ended December 31, 2020 as filed with the Securities and Exchange Commission, certify to the best of my knowledge that:
| 1. | The Form N-CSR of the Registrant (the “Report”) fully complies with the requirements of Section 13(a) or 15(d) of the Securities Exchange Act of 1934, as amended; and |
| 2. | The information contained in the Report fairly presents, in all material respects, the financial condition and results of operations of the Registrant. |
| Date: | 8/31/2021 | /s/ Michelle Kaufmann | ||
| Michelle Kaufmann, Treasurer | ||||
| (Principal Financial Officer) |
Serious News for Serious Traders! Try StreetInsider.com Premium Free!
You May Also Be Interested In
- Genomma Lab Internacional Announces Results for the First Quarter 2024
- OPERATION HOPE CEO JOHN HOPE BRYANT'S LATEST BOOK, 'FINANCIAL LITERACY FOR ALL,' DEBUTS AT #12 ON USA TODAY BESTSELLER LIST
- Renesas Reports Financial Results for the First Quarter Ended March 31, 2024
Create E-mail Alert Related Categories
SEC FilingsSign up for StreetInsider Free!
Receive full access to all new and archived articles, unlimited portfolio tracking, e-mail alerts, custom newswires and RSS feeds - and more!
