

Form N-CSR CAPITAL INCOME BUILDER For: Oct 31
 Tweet
Tweet Share
ShareUNITED STATES
SECURITIES AND EXCHANGE COMMISSION
Washington, D.C. 20549
FORM N-CSR
Certified Shareholder Report of
Registered Management Investment Companies
Investment Company Act File Number: 811-05085
Capital Income Builder
(Exact Name of Registrant as Specified in Charter)
333 South Hope Street
Los Angeles, California 90071
(Address of Principal Executive Offices)
Registrant's telephone number, including area code: (213) 486-9200
Date of fiscal year end: October 31
Date of reporting period: October 31, 2018
Michael W. Stockton
Capital Income Builder
333 South Hope Street
Los Angeles, California 90071
(Name and Address of Agent for Service)
ITEM 1 – Reports to Stockholders
|
Capital Income Builder®
Annual report |

Seeking income
growth opportunities
from around the world
Beginning January 1, 2021, as permitted by regulations adopted by the Securities and Exchange Commission, we intend to no longer mail paper copies of the fund’s shareholder reports, unless specifically requested from American Funds or your financial intermediary, such as a broker-dealer or bank. Instead, the reports will be made available on the American Funds website (americanfunds.com); you will be notified by mail and provided with a website link to access the report each time a report is posted. If you have already elected to receive shareholder reports electronically, you will not be affected by this change and do not need to take any action. If you prefer to receive shareholder reports and other communications electronically, you may update your mailing preferences with your financial intermediary, or enroll in e-delivery at americanfunds.com (for accounts held directly with the fund).
You may elect to receive paper copies of all future reports free of charge. If you invest through a financial intermediary, you may contact your financial intermediary to request that you continue to receive paper copies of your shareholder reports. If you invest directly with the fund, you may inform American Funds that you wish to continue receiving paper copies of your shareholder reports by contacting us at (800) 421-4225. Your election to receive reports in paper will apply to all funds held with American Funds or through your financial intermediary.
Capital Income Builder seeks to provide you with a level of current income that exceeds the average yield on U.S. stocks generally and to provide you with a growing stream of income over the years. The fund’s secondary objective is to provide you with growth of capital.
This fund is one of more than 40 offered by Capital Group, home of American Funds, one of the nation’s largest mutual fund families. For more than 85 years, Capital Group has invested with a long-term focus based on thorough research and attention to risk.
Fund results shown in this report, unless otherwise indicated, are for Class A shares at net asset value. If a sales charge (maximum 5.75%) had been deducted, the results would have been lower. Results are for past periods and are not predictive of results for future periods. Current and future results may be lower or higher than those shown. Share prices and returns will vary, so investors may lose money. Investing for short periods makes losses more likely. For current information and month-end results, visit americanfunds.com.
Here are the average annual total returns on a $1,000 investment with all distributions reinvested for periods ended September 30, 2018 (the most recent calendar quarter-end):
| Class A shares | 1 year | 5 years | 10 years |
| Reflecting 5.75% maximum sales charge | –4.90% | 4.29% | 5.71% |
For other share class results, visit americanfunds.com and americanfundsretirement.com.
The total annual fund operating expense ratio was 0.58% for Class A shares as of the prospectus dated January 1, 2019 (unaudited).
Investment results assume all distributions are reinvested and reflect applicable fees and expenses. When applicable, investment results reflect fee waivers, without which results would have been lower. Visit americanfunds.com for more information.
The fund’s 30-day yield for Class A shares as of November 30, 2018, reflecting the 5.75% maximum sales charge and calculated in accordance with the U.S. Securities and Exchange Commission formula, was 3.22%.
The return of principal for bond funds and for funds with significant underlying bond holdings is not guaranteed. Fund shares are subject to the same interest rate, inflation and credit risks associated with the underlying bond holdings. Investing outside the United States may be subject to additional risks, such as currency fluctuations, periods of illiquidity and price volatility. These risks may be heightened in connection with investments in developing countries. Refer to the fund prospectus and the Risk Factors section of this report for more information on these and other risks associated with investing in the fund.
Investments are not FDIC-insured, nor are they deposits of or guaranteed by a bank or any other entity, so they may lose value.
Contents
| 1 | Letter to investors |
| 6 | The value of a long-term perspective |
| 8 | Summary investment portfolio |
| 15 | Financial statements |
| 42 | Board of trustees and other officers |
Globally, equity markets declined over Capital Income Builder’s fiscal year, buffeted by trade tensions and concerns about slowing overseas growth, especially in China. Higher dividend-paying, more defensive sectors lagged the broader market amid higher interest rates. For the 12 months ended October 31, 2018, the fund recorded a total return of –3.16%, with all distributions reinvested. By way of comparison, the MSCI ACWI (All Country World Index), a measure of returns for more than 40 developed and emerging market country indexes, lost 0.52%. Meanwhile, Bloomberg Barclays U.S. Aggregate Index, a broad measure of U.S. fixed income markets, fell 2.05%. The fund’s peer group, as measured by the Lipper Global Equity Income Funds Average, declined 2.14% for the period.
Results at a glance
For periods ended October 31, 2018, with all distributions reinvested
| Cumulative total returns | Average annual total returns | |||||||||||||||
| Lifetime | ||||||||||||||||
| 1 year | 5 years | 10 years | (since 7/30/87) | |||||||||||||
| Capital Income Builder (Class A shares) | –3.16 | % | 3.94 | % | 7.56 | % | 8.89 | % | ||||||||
| MSCI ACWI (All Country World Index)1,2 | –0.52 | 6.15 | 9.75 | 6.84 | ||||||||||||
| Bloomberg Barclays U.S. Aggregate Index2 | –2.05 | 1.83 | 3.94 | 6.12 | ||||||||||||
| 70%/30% MSCI ACWI/Bloomberg Barclays Index1,2,3 | –0.84 | 4.96 | 8.22 | 6.89 | ||||||||||||
| Lipper Global Equity Income Funds Average4 | –2.14 | 4.09 | 7.89 | — | ||||||||||||
| 1 | From July 30, 1987, through December 31, 1987, the MSCI World Index was used because the MSCI ACWI did not exist. MSCI World Index results reflect dividends net of withholding taxes, and MSCI ACWI results reflect dividends gross of withholding taxes through December 31, 2000, and dividends net of withholding taxes thereafter. |
| 2 | The market indexes are unmanaged and, therefore, have no expenses. Investors cannot invest directly in an index. Sources: MSCI, Bloomberg Index Services Ltd. |
| 3 | The 70%/30% MSCI ACWI/Bloomberg Barclays Index blends the MSCI ACWI with the Bloomberg Barclays U.S. Aggregate Index by weighting their total returns at 70% and 30%, respectively. Results assume the blend is rebalanced monthly. |
| 4 | Lipper averages reflect the current composition of all eligible mutual funds (all share classes) within a given category. Source: Thomson Reuters Lipper. |
| Capital Income Builder | 1 |
Largest equity holdings
October 31, 2018
| Company | Percent of net assets | |||
| AbbVie | 2.6 | % | ||
| Royal Dutch Shell | 2.1 | |||
| Verizon Communications | 2.0 | |||
| Altria | 1.9 | |||
| Novartis | 1.7 | |||
| Coca-Cola | 1.7 | |||
| Microsoft | 1.6 | |||
| British American Tobacco | 1.5 | |||
| Philip Morris International | 1.4 | |||
| Amgen | 1.4 | |||
Dividend income
The fund paid regular dividends of $0.50 per share in December 2017 and in March, June and September of 2018. In addition, a special dividend of $0.145 per share was paid in December 2017. The fund strives to grow its dividend and provide a special dividend each fiscal year, though its ability to do so is dependent on market conditions. Prudence guides distribution decisions, as the fund strives to grow income while carefully managing risk. Capital Income Builder recorded a 12-month yield of 3.65%, greater than that of the Lipper Global Equity Income Funds Average (2.87%), MSCI ACWI (2.58%) and the Bloomberg Barclays U.S. Aggregate Index (3.59%).
Capital Income Builder’s annual dividends compared with inflation (dividends as declared and adjusted for reinvested capital gains)

| 2 | Capital Income Builder |
The dividend-investing environment
Globally, stocks fell as investors grew concerned that budding inflation pressures would cause the U.S. Federal Reserve to hike interest rates at a more rapid pace. Materials and industrial companies declined amid a slowdown in China. Growth worries also hit financial companies, especially in Europe. In contrast, promising research results and rising sales pushed up some drug companies, propelling the health care sector higher. Energy stocks rose amid higher oil prices.
This year was especially challenging for dividend-paying stocks. Higher interest rates make bonds more attractive, weighing down more rate-sensitive companies such as utilities. Meanwhile, consumer staples companies’ earnings have tended to be less impressive than those in other sectors.
Over the year, market leaders again were tech companies Apple and Microsoft, along with e-commerce giant Amazon. The fund can lag in environments in which e-commerce and tech companies drive market gains. With some exceptions, such firms tend to pay no (or very little) dividends, rendering them inappropriate for an income-oriented strategy like Capital Income Builder.
However, the market rout in October illustrated how quickly that situation can reverse. The MSCI ACWI declined 7.49% that month, as tech stocks fell sharply. The highest yielding stocks outpaced their lower yielding counterparts. Although dividend-paying companies may lose favor at certain points in the economic and market cycle, history shows that those environments do not last. Historically, higher yielding stocks have demonstrated valuable downside resilience and strong returns over the long term.
The Fed raised its benchmark rate four times during the period, by a total of 1 percentage point, which pushed interest rates higher, negatively impacting bond prices.
A history of income generated (Capital Income Builder’s 12-month yields versus its benchmarks — years ended October 31)

Capital Income Builder and Lipper Global Equity Income Funds Average numbers calculated by Lipper. MSCI ACWI numbers calculated by RIMES. Until September 30, 1998, yield data for the Lipper Global Equity Income Funds Average reflects the average yield of the fund and only two other funds.
| Capital Income Builder | 3 |
The New Geography of Investing®
Where a company does business can be more important than where it’s located. Here’s a look at Capital Income Builder’s portfolio through the revenue lens. The charts below show the countries and regions in which the fund’s equity investments are located, and where the revenue comes from.
Capital Income Builder Geographic Exposure
Equity portion breakdown by domicile (%)
| Region | Fund | Index | |||||||
| n | United States | 51 | % | 55 | % | ||||
| n | Canada | 4 | 3 | ||||||
| n | Europe | 34 | 19 | ||||||
| n | Japan | 2 | 8 | ||||||
| n | Asia-Pacific ex. Japan | 5 | 4 | ||||||
| n | Emerging markets | 4 | 11 | ||||||
| Total | 100 | % | 100 | % | |||||
Equity portion breakdown by revenue (%)

| Region | Fund | Index | |||||||
| n | United States | 43 | % | 41 | % | ||||
| n | Canada | 4 | 3 | ||||||
| n | Europe | 22 | 17 | ||||||
| n | Japan | 3 | 7 | ||||||
| n | Asia-Pacific ex. Japan | 5 | 4 | ||||||
| n | Emerging markets | 23 | 28 | ||||||
| Total | 100 | % | 100 | % | |||||
Source: Capital Group (as of October 31, 2018).
Compared with the MSCI ACWI as a percent of net assets.
Longer duration bonds and credit experienced greater losses than shorter duration or Treasury bonds, respectively.
A look at the portfolio
As of October 31, the consumer staples sector comprised the largest share of the fund’s equity holdings, accounting for 10.0% of total assets. Financials followed at 9.5%. Investments in U.S. equities represented 36.6% of the fund’s overall holdings, while non-U.S. equities made up 34.6%.
In share-price terms, seven of the 10 largest holdings in the fund gained over the period. Verizon rose after reporting better-than-expected profit and subscriber growth. Royal Dutch Shell gained on higher oil prices. Shares of Novartis advanced after the drugmaker raised its outlook and said it would acquire biopharmaceuticals company Endocyte. Biotech giant Amgen also advanced. Microsoft’s profit beat expectations on strong results in its cloud computing division. Coca-Cola also rose. In contrast, biotech firm AbbVie declined on poor clinical trial results for an experimental lung cancer treatment. Tobacco firms Philip Morris International and British American Tobacco fell on
| 4 | Capital Income Builder |
disappointing results for next-generation smoking products. However, rival tobacco company Altria rose.
Overall, the fund’s fixed income investments declined, but by less than its equity holdings. In addition to generating income, this portion of Capital Income Builder’s portfolio seeks to provide stability during volatile markets.
The road ahead
The current market environment is rife with uncertainty. In the eurozone, the economy has weakened, while a budget dispute between Italy and other EU members served as a reminder that political risk still exists in the region. China’s economy also has cooled, and it remains unclear whether the government’s efforts to stabilize growth and address economic imbalances will succeed. Meanwhile, the U.S. is clearly in the late stage of the economic cycle. All these factors make us extremely mindful of risk.
Given that the U.S. is late in the economic cycle, portfolio managers are paying close attention to leverage and are more sharply focused on monitoring balance sheets. We are seeking to avoid companies that are taking on debt to pay dividends. We continue to focus on companies that have strong business models, healthy balance sheets and a commitment to paying and growing dividends over time. Higher interest rates should help the fund by allowing us to reinvest bond coupon payments into higher yielding securities, thereby generating more income from the bond portfolio. We thank you for investing in Capital Income Builder, and we look forward to reporting to you again in six months.
Cordially,

James B. Lovelace

David A. Hoag

Steven T. Watson
Co-presidents
December 10, 2018
For current information about the fund, visit americanfunds.com.
| Capital Income Builder | 5 |
The value of a long-term perspective
Fund results shown are for Class A shares and reflect deduction of the maximum sales charge of 5.75% on the $10,000 investment.1 Thus, the net amount invested was $9,425. Results are for past periods and are not predictive of results for future periods. Current and future results may be lower or higher than those shown. Share prices and returns will vary, so investors may lose money. For current information and month-end results, visit americanfunds.com.
| 1 | As outlined in the prospectus, the sales charge is reduced for accounts (and aggregated investments) of $25,000 or more and is eliminated for purchases of $1 million or more. There is no sales charge on dividends or capital gain distributions that are reinvested in additional shares. |
| 2 | The market index is unmanaged and, therefore, has no expenses. Investors cannot invest directly in an index. |
| 3 | The 70%/30% MSCI ACWI/Bloomberg Barclays Index blends the MSCI ACWI (All Country World Index) with the Bloomberg Barclays U.S. Aggregate Index by weighting their total returns at 70% and 30%, respectively. Results assume the blend is rebalanced monthly. |
| 4 | From July 30, 1987, through December 31, 1987, the MSCI World Index was used because the MSCI ACWI (All Country World Index) did not exist. MSCI World Index results reflect dividends net of withholding taxes, and MSCI ACWI results reflect dividends gross of withholding taxes through December 31, 2000, and dividends net of withholding taxes thereafter. |
| 5 | For the period July 30, 1987, commencement of operations, through October 31, 1987. |
| 6 | Prior to January 1, 2009, dividends from net investment income were declared daily and paid to shareholders quarterly. As of January 1, 2009, the fund began declaring and distributing dividends on a periodic basis. Dividends reinvested reflect quarterly dividends actually paid during the period, while year-end values are adjusted for cumulative dividends accrued but not yet paid. |
The results shown are before taxes on fund distributions and sale of fund shares.

| 6 | Capital Income Builder |
How a $10,000 investment has grown
There have always been reasons not to invest. If you look beyond the negative headlines, however, you will find that despite occasional stumbles, financial markets have tended to reward investors over the long term. As the chart below shows, over its lifetime, Capital Income Builder has done demonstrably better than its primary benchmark. Dividends, particularly when reinvested, have accounted for a large portion of the fund’s overall results.

| Capital Income Builder | 7 |
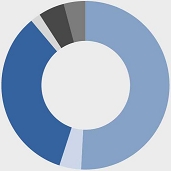
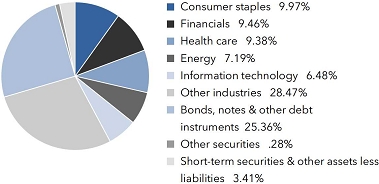
Summary investment portfolio October 31, 2018
| Industry sector diversification | Percent of net assets |
| Country diversification by domicile | Percent of net assets | |||
| United States | 59.95 | % | ||
| United Kingdom | 11.65 | |||
| Eurozone* | 8.70 | |||
| Switzerland | 4.39 | |||
| Canada | 3.45 | |||
| Hong Kong | 1.89 | |||
| Japan | 1.12 | |||
| China | 1.08 | |||
| Singapore | .99 | |||
| Other countries | 3.37 | |||
| Short-term securities & other assets less liabilities | 3.41 | |||
| * | Countries using the euro as a common currency; those represented in the fund’s portfolio are Belgium, Finland, France, Germany, Italy, Luxembourg, the Netherlands, Portugal and Spain. |
| Common stocks 70.95% | Shares | Value (000) | ||||||
| Consumer staples 9.97% | ||||||||
| Altria Group, Inc. | 28,505,300 | $ | 1,853,985 | |||||
| Coca-Cola Co. | 34,553,700 | 1,654,431 | ||||||
| British American Tobacco PLC | 25,479,111 | 1,105,175 | ||||||
| British American Tobacco PLC (ADR) | 7,866,157 | 341,391 | ||||||
| Philip Morris International Inc. | 16,366,100 | 1,441,362 | ||||||
| Nestlé SA | 12,677,971 | 1,071,488 | ||||||
| Imperial Brands PLC | 29,270,382 | 992,578 | ||||||
| Other securities | 1,479,397 | |||||||
| 9,939,807 | ||||||||
| Financials 9.46% | ||||||||
| Sampo Oyj, Class A | 22,444,340 | 1,033,642 | ||||||
| Zurich Insurance Group AG | 3,291,441 | 1,023,561 | ||||||
| CME Group Inc., Class A | 5,365,229 | 983,125 | ||||||
| JPMorgan Chase & Co. | 5,207,000 | 567,667 | ||||||
| Wells Fargo & Co. | 9,359,300 | 498,196 | ||||||
| Other securities | 5,319,706 | |||||||
| 9,425,897 | ||||||||
| Health care 9.38% | ||||||||
| AbbVie Inc. | 33,429,000 | 2,602,448 | ||||||
| Novartis AG | 19,230,200 | 1,684,826 | ||||||
| Amgen Inc. | 7,325,680 | 1,412,318 | ||||||
| Abbott Laboratories | 9,325,900 | 642,928 | ||||||
| GlaxoSmithKline PLC | 32,863,000 | 634,787 | ||||||
| Gilead Sciences, Inc. | 8,553,480 | 583,176 | ||||||
| Pfizer Inc. | 12,294,920 | 529,419 | ||||||
| Johnson & Johnson | 3,428,700 | 479,984 | ||||||
| AstraZeneca PLC | 4,669,948 | 357,551 | ||||||
| AstraZeneca PLC (ADR) | 2,841,600 | 110,197 | ||||||
| Other securities | 306,570 | |||||||
| 9,344,204 | ||||||||
| Energy 7.19% | ||||||||
| Royal Dutch Shell PLC, Class B | 47,639,755 | 1,561,909 | ||||||
| Royal Dutch Shell PLC, Class A (GBP denominated) | 13,464,305 | 430,338 | ||||||
| Royal Dutch Shell PLC, Class B (ADR) | 1,444,300 | 94,905 | ||||||
| Exxon Mobil Corp. | 15,933,815 | 1,269,606 | ||||||
| TOTAL SA | 8,820,745 | 519,123 | ||||||
| Enbridge Inc. (CAD denominated) | 12,396,985 | 386,285 | ||||||
| 8 | Capital Income Builder |
| Shares | Value (000) | |||||||
| Enbridge Inc. (CAD denominated)1 | 2,864,838 | $ | 89,267 | |||||
| TransCanada Corp. | 12,593,065 | 474,853 | ||||||
| Other securities | 2,338,521 | |||||||
| 7,164,807 | ||||||||
| Information technology 6.48% | ||||||||
| Microsoft Corp. | 14,524,940 | 1,551,409 | ||||||
| Broadcom Inc. | 6,282,700 | 1,404,121 | ||||||
| Intel Corp. | 22,943,450 | 1,075,589 | ||||||
| Taiwan Semiconductor Manufacturing Co., Ltd. | 90,212,800 | 682,216 | ||||||
| Other securities | 1,740,328 | |||||||
| 6,453,663 | ||||||||
| Utilities 5.70% | ||||||||
| Engie SA | 47,456,341 | 632,923 | ||||||
| Engie SA, bonus shares2 | 12,061,353 | 160,862 | ||||||
| SSE PLC | 44,315,320 | 646,590 | ||||||
| Dominion Energy, Inc. | 8,972,308 | 640,802 | ||||||
| E.On SE | 63,727,000 | 617,576 | ||||||
| National Grid PLC | 45,299,247 | 480,119 | ||||||
| Other securities | 2,502,999 | |||||||
| 5,681,871 | ||||||||
| Communication services 5.61% | ||||||||
| Verizon Communications Inc. | 34,318,684 | 1,959,254 | ||||||
| Vodafone Group PLC | 362,938,764 | 685,749 | ||||||
| AT&T Inc. | 17,010,210 | 521,873 | ||||||
| Other securities | 2,422,913 | |||||||
| 5,589,789 | ||||||||
| Real estate 4.89% | ||||||||
| Crown Castle International Corp. REIT | 10,066,938 | 1,094,679 | ||||||
| Link Real Estate Investment Trust REIT | 65,373,896 | 579,382 | ||||||
| Other securities | 3,200,489 | |||||||
| 4,874,550 | ||||||||
| Industrials 4.15% | ||||||||
| Lockheed Martin Corp. | 3,776,974 | 1,109,864 | ||||||
| Other securities | 3,028,177 | |||||||
| 4,138,041 | ||||||||
| Consumer discretionary 3.48% | ||||||||
| Las Vegas Sands Corp. | 14,921,000 | 761,419 | ||||||
| McDonald’s Corp. | 2,806,100 | 496,399 | ||||||
| Other securities | 2,206,732 | |||||||
| 3,464,550 | ||||||||
| Materials 2.13% | ||||||||
| Rio Tinto PLC | 18,146,000 | 882,192 | ||||||
| Other securities | 1,245,648 | |||||||
| 2,127,840 | ||||||||
| Miscellaneous 2.51% | ||||||||
| Other common stocks in initial period of acquisition | 2,501,249 | |||||||
| Total common stocks (cost: $64,218,754,000) | 70,706,268 | |||||||
| Preferred securities 0.01% | ||||||||
| Financials 0.01% | ||||||||
| Other securities | 8,515 | |||||||
| Total preferred securities (cost: $13,000,000) | 8,515 | |||||||
| Rights & warrants 0.00% | ||||||||
| Miscellaneous 0.00% | ||||||||
| Other rights & warrants in initial period of acquisition | 127 | |||||||
| Total rights & warrants (cost: $28,000) | 127 | |||||||
| Capital Income Builder | 9 |
| Convertible stocks 0.27% | Shares | Value (000) | ||||||
| Real estate 0.12% | ||||||||
| Crown Castle International Corp. REIT, Series A, 6.875% convertible preferred 2020 | 113,927 | $ | 119,054 | |||||
| Utilities 0.03% | ||||||||
| Other securities | 36,123 | |||||||
| Miscellaneous 0.12% | ||||||||
| Other convertible stocks in initial period of acquisition | 116,632 | |||||||
| Total convertible stocks (cost: $277,925,000) | 271,809 | |||||||
| Bonds, notes & other debt instruments 25.36% | Principal amount (000) |
|||||||
| U.S. Treasury bonds & notes 15.43% | ||||||||
| U.S. Treasury 14.39% | ||||||||
| U.S. Treasury 1.75% 2022 | $ | 675,000 | 647,521 | |||||
| U.S. Treasury 1.875% 2022 | 806,000 | 777,282 | ||||||
| U.S. Treasury 2.00% 20243 | 850,000 | 805,774 | ||||||
| U.S. Treasury 2.125% 2024 | 893,500 | 849,522 | ||||||
| U.S. Treasury 2.125% 2024 | 750,000 | 714,285 | ||||||
| U.S. Treasury 1.13%–8.75% 2019–20483 | 9,998,933 | 10,541,491 | ||||||
| 14,335,875 | ||||||||
| U.S. Treasury inflation-protected securities 1.04% | ||||||||
| U.S. Treasury Inflation-Protected Securities 0.38%–2.38% 2023–20474 | 1,092,421 | 1,037,268 | ||||||
| Total U.S. Treasury bonds & notes | 15,373,143 | |||||||
| Corporate bonds & notes 5.91% | ||||||||
| Health care 0.99% | ||||||||
| AbbVie Inc. 2.30%–4.88% 2020–2048 | 64,402 | 61,375 | ||||||
| Amgen Inc. 1.85% 2021 | 2,750 | 2,633 | ||||||
| Novartis AG 5.125% 2019 | 15,000 | 15,095 | ||||||
| Other securities | 904,338 | |||||||
| 983,441 | ||||||||
| Energy 0.92% | ||||||||
| Exxon Mobil Corp. 2.222% 2021 | 7,750 | 7,575 | ||||||
| Royal Dutch Shell PLC 1.75% 2021 | 10,865 | 10,418 | ||||||
| Other securities | 895,965 | |||||||
| 913,958 | ||||||||
| Communication services 0.61% | ||||||||
| Verizon Communications Inc. 4.13%–4.50% 2027–2046 | 35,441 | 34,215 | ||||||
| Other securities | 578,811 | |||||||
| 613,026 | ||||||||
| Consumer staples 0.56% | ||||||||
| Altria Group, Inc. 2.63%–9.25% 2019–2026 | 17,849 | 17,797 | ||||||
| British American Tobacco PLC 2.76%–4.54% 2022–20471 | 79,560 | 72,621 | ||||||
| Coca-Cola Co. 2.20% 2022 | 5,250 | 5,069 | ||||||
| Nestle Holdings, Inc. 3.35% 20231 | 14,000 | 13,916 | ||||||
| Philip Morris International Inc. 2.00%–4.25% 2020–2044 | 40,485 | 38,412 | ||||||
| Reynolds American Inc. 3.25%–5.85% 2020–2045 | 42,917 | 43,120 | ||||||
| Other securities | 362,572 | |||||||
| 553,507 | ||||||||
| Industrials 0.22% | ||||||||
| Lockheed Martin Corp. 1.85%–4.70% 2018–2046 | 23,145 | 23,024 | ||||||
| Other securities | 200,777 | |||||||
| 223,801 | ||||||||
| 10 | Capital Income Builder |
| Principal amount (000) | Value (000) | |||||||
| Information technology 0.12% | ||||||||
| Broadcom Ltd. 3.00%–3.88% 2022–2028 | $ | 57,740 | $ | 54,223 | ||||
| Microsoft Corp. 1.55%–3.70% 2021–2046 | 10,135 | 9,771 | ||||||
| Other securities | 56,273 | |||||||
| 120,267 | ||||||||
| Other 2.49% | ||||||||
| Other securities | 2,479,865 | |||||||
| Total corporate bonds & notes | 5,887,865 | |||||||
| Mortgage-backed obligations 3.48% | ||||||||
| Federal agency mortgage-backed obligations 3.37% | ||||||||
| Fannie Mae 0%–7.50% 2020–20485,6,7 | 1,632,110 | 1,653,263 | ||||||
| Other securities | 1,713,664 | |||||||
| 3,366,927 | ||||||||
| Other 0.11% | ||||||||
| Other securities | 101,051 | |||||||
| Total mortgage-backed obligations | 3,467,978 | |||||||
| Federal agency bonds & notes 0.06% | ||||||||
| Fannie Mae 1.25%–2.13% 2021–2026 | 67,730 | 63,674 | ||||||
| Other 0.48% | ||||||||
| Other securities | 475,631 | |||||||
| Total bonds, notes & other debt instruments (cost: $26,056,863,000) | 25,268,291 | |||||||
| Short-term securities 4.20% | ||||||||
| Coca-Cola Co. 2.27%–2.42% due 1/3/2019–1/23/20191 | 50,000 | 49,755 | ||||||
| ExxonMobil Corp. 2.22% due 11/26/2018 | 75,000 | 74,879 | ||||||
| Federal Home Loan Bank 2.02%–2.30% due 11/1/2018–1/29/2019 | 1,528,200 | 1,525,153 | ||||||
| U.S. Treasury Bills 1.98%–2.41% due 11/1/2018–4/25/2019 | 1,456,300 | 1,449,574 | ||||||
| Other securities | 1,090,557 | |||||||
| Total short-term securities (cost: $4,190,127,000) | 4,189,918 | |||||||
| Total investment securities 100.79% (cost: $94,756,697,000) | 100,444,928 | |||||||
| Other assets less liabilities (0.79)% | (791,261 | ) | ||||||
| Net assets 100.00% | $ | 99,653,667 | ||||||
This summary investment portfolio is designed to streamline the report and help investors better focus on the fund’s principal holdings. See the inside back cover for details on how to obtain a complete schedule of portfolio holdings.
As permitted by U.S. Securities and Exchange Commission regulations, “Miscellaneous” securities include holdings in their first year of acquisition that have not previously been publicly disclosed.
“Other securities” includes all issues that are not disclosed separately in the summary investment portfolio. “Other securities” also includes loan participations and assignments, which may be subject to legal or contractual restrictions on resale. The total value of all such loans was $7,006,000, which represented .01% of the net assets of the fund.
| Capital Income Builder | 11 |
Futures contracts
| Number of | Notional amount | 8 | Value at 10/31/2018 | 9 | Unrealized (depreciation) appreciation at 10/31/2018 | |||||||||||||
| Contracts | Type | contracts | Expiration | (000) | (000) | (000) | ||||||||||||
| 2 Year U.S. Treasury Note Futures | Long | 11,579 | January 2019 | $ | 2,315,800 | $ | 2,439,188 | $ | (96 | ) | ||||||||
| 5 Year U.S. Treasury Note Futures | Long | 18,573 | January 2019 | 1,857,300 | 2,087,286 | (4,992 | ) | |||||||||||
| 10 Year U.S. Treasury Note Futures | Short | 25 | December 2018 | (2,500 | ) | (2,961 | ) | 5 | ||||||||||
| 10 Year Ultra U.S. Treasury Note Futures | Short | 614 | December 2018 | (61,400 | ) | (76,817 | ) | (291 | ) | |||||||||
| 20 Year U.S. Treasury Bond Futures | Short | 136 | December 2018 | (13,600 | ) | (18,785 | ) | (47 | ) | |||||||||
| $ | (5,421 | ) | ||||||||||||||||
Forward currency contracts
| Contract amount | Unrealized appreciation (depreciation) | |||||||||
| Purchases (000) | Sales (000) | Counterparty | Settlement date | at 10/31/2018 (000) | ||||||
| USD1,518 | EUR1,285 | Bank of New York Mellon | 11/7/2018 | $ | 62 | |||||
| USD402,632 | GBP306,225 | Citibank | 11/16/2018 | 10,943 | ||||||
| GBP146,225 | USD192,284 | Morgan Stanley | 11/16/2018 | (5,249 | ) | |||||
| $ | 5,756 | |||||||||
Swap contracts
Interest rate swaps
| Receive | Pay | Expiration date | Notional (000) | Value at 10/31/2018 (000) | Upfront payments/ receipts (000) | Unrealized appreciation (depreciation) at 10/31/2018 (000) | ||||||||||||||
| 3-month USD-LIBOR | 3.002% | 9/28/2020 | $ | 126,200 | $ | 147 | $ | — | $ | 147 | ||||||||||
| 2.683% | U.S. EFFR | 9/28/2020 | 126,200 | (111 | ) | — | (111 | ) | ||||||||||||
| $ | — | $ | 36 | |||||||||||||||||
| 12 | Capital Income Builder |
Investments in affiliates
A company is an affiliate of the fund under the Investment Company Act of 1940 if the fund’s holdings in that company represent 5% or more of the outstanding voting shares. The value of the fund’s holdings in affiliated companies is included in “Other securities” under the respective industry sectors in the summary investment portfolio. Further details on these holdings and related transactions during the year ended October 31, 2018, appear below.
| Beginning shares or principal amount | Additions | Reductions | Ending shares or principal amount | Net realized (loss) gain (000) | Net unrealized (depreciation) appreciation (000) | Dividend or interest income (000) | Value of affiliates at 10/31/2018 (000) | |||||||||||||||||||||||||
| Common stocks 1.18% | ||||||||||||||||||||||||||||||||
| Consumer staples 0.02% | ||||||||||||||||||||||||||||||||
| Convenience Retail Asia Ltd. | 51,330,000 | — | — | 51,330,000 | $ | — | $ | (2,152 | ) | $ | 1,242 | $ | 21,600 | |||||||||||||||||||
| Financials 0.00% | ||||||||||||||||||||||||||||||||
| Sampo Oyj, Class A10 | 31,293,932 | 834,231 | 9,683,823 | 22,444,340 | (2,437 | ) | (176,989 | ) | 90,324 | — | ||||||||||||||||||||||
| Energy 0.11% | ||||||||||||||||||||||||||||||||
| Whitecap Resources Inc. | 21,385,000 | 1,344,000 | 600,500 | 22,128,500 | (3,574 | ) | (47,219 | ) | 5,450 | 108,251 | ||||||||||||||||||||||
| Information technology 0.40% | ||||||||||||||||||||||||||||||||
| VTech Holdings Ltd. | 20,089,300 | — | — | 20,089,300 | — | (49,894 | ) | 16,071 | 235,683 | |||||||||||||||||||||||
| Vanguard International Semiconductor Corp. | 114,815,725 | 15,100,000 | 44,900,030 | 85,015,695 | 5,898 | (5,717 | ) | 10,158 | 156,607 | |||||||||||||||||||||||
| 392,290 | ||||||||||||||||||||||||||||||||
| Utilities 0.00% | ||||||||||||||||||||||||||||||||
| EDP - Energias de Portugal, SA10 | 184,855,751 | 7,640,902 | 192,496,653 | — | 34,384 | 17,462 | 44,275 | — | ||||||||||||||||||||||||
| SSE PLC10 | 53,393,871 | 9,475,000 | 18,553,551 | 44,315,320 | (84,454 | ) | (67,634 | ) | 50,147 | — | ||||||||||||||||||||||
| — | ||||||||||||||||||||||||||||||||
| Communication services 0.19% | ||||||||||||||||||||||||||||||||
| Euskaltel, SA, non-registered shares | — | 11,611,000 | — | 11,611,000 | — | (11,599 | ) | 2,037 | 97,319 | |||||||||||||||||||||||
| Gannett Co., Inc. | 8,547,400 | — | — | 8,547,400 | — | 8,547 | 5,470 | 82,910 | ||||||||||||||||||||||||
| Zegona Communications PLC | — | 7,573,166 | — | 7,573,166 | — | (702 | ) | — | 10,648 | |||||||||||||||||||||||
| Com Hem Holding AB10 | 14,281,000 | — | 14,281,000 | — | 88,486 | (68,033 | ) | 9,984 | — | |||||||||||||||||||||||
| Modern Times Group MTG AB, Class B10 | 3,156,462 | 561,500 | 118,690 | 3,599,272 | (1,057 | ) | (6,290 | ) | 5,350 | — | ||||||||||||||||||||||
| 190,877 | ||||||||||||||||||||||||||||||||
| Consumer discretionary 0.46% | ||||||||||||||||||||||||||||||||
| Six Flags Entertainment Corp. | 6,035,558 | — | 3,035,558 | 3,000,000 | 60,266 | (75,217 | ) | 17,679 | 161,580 | |||||||||||||||||||||||
| Greene King PLC | 24,691,512 | — | — | 24,691,512 | — | (25,104 | ) | 10,816 | 152,312 | |||||||||||||||||||||||
| Dine Brands Global, Inc.11 | 1,095,551 | — | — | 1,095,551 | — | 36,624 | 3,133 | 88,783 | ||||||||||||||||||||||||
| AA PLC | 37,969,677 | 11,058,082 | 13,590,000 | 35,437,759 | (33,503 | ) | 1,442 | 739 | 45,342 | |||||||||||||||||||||||
| Leifheit AG, non-registered shares | 640,000 | — | 2,730 | 637,270 | (25 | ) | (11,285 | ) | 784 | 11,405 | ||||||||||||||||||||||
| Marston’s PLC10 | 50,687,428 | — | 31,191,228 | 19,496,200 | (22,680 | ) | 21,292 | 3,968 | — | |||||||||||||||||||||||
| 459,422 | ||||||||||||||||||||||||||||||||
| Total common stocks | 1,172,440 | |||||||||||||||||||||||||||||||
| Bonds, notes & other debt instruments 0.00% | ||||||||||||||||||||||||||||||||
| Utilities 0.00% | ||||||||||||||||||||||||||||||||
| EDP Finance BV 3.625% 20241,10 | $ | 15,450,000 | — | — | $ | 15,450,000 | — | (1,037 | ) | 567 | — | |||||||||||||||||||||
| Total 1.18% | $ | 41,304 | $ | (463,505 | ) | $ | 278,194 | $ | 1,172,440 | |||||||||||||||||||||||
| Capital Income Builder | 13 |
The following footnotes apply to either the individual securities noted or one or more of the securities aggregated and listed as a single line item.
| 1 | Acquired in a transaction exempt from registration under Rule 144A or Section 4(2) of the Securities Act of 1933. May be resold in the U.S. in transactions exempt from registration, normally to qualified institutional buyers. The total value of all such securities was $2,407,683,000, which represented 2.42% of the net assets of the fund. |
| 2 | Valued under fair value procedures adopted by authority of the board of trustees. The total value of all such securities, including those in “Miscellaneous” and “Other securities,” was $278,192,000, which represented .28% of the net assets of the fund. |
| 3 | All or a portion of this security was pledged as collateral. The total value of pledged collateral was $29,484,000, which represented .03% of the net assets of the fund. |
| 4 | Index-linked bond whose principal amount moves with a government price index. |
| 5 | Principal payments may be made periodically. Therefore, the effective maturity date may be earlier than the stated maturity date. |
| 6 | Coupon rate may change periodically. |
| 7 | Purchased on a TBA basis. |
| 8 | Notional amount is calculated based on the number of contracts and notional contract size. |
| 9 | Value is calculated based on the notional amount and current market price. |
| 10 | Unaffiliated issuer at 10/31/2018. |
| 11 | This security changed its name during the reporting period. |
Key to abbreviations and symbol
ADR = American Depositary Receipts
EFFR = Effective Federal Funds Rate
EUR = Euros
GBP = British pounds
LIBOR = London Interbank Offered Rate
TBA = To-be-announced
USD/$ = U.S. dollars
See notes to financial statements
| 14 | Capital Income Builder |
| Statement of assets and liabilities at October 31, 2018 |
(dollars in thousands) |
| Assets: | ||||||||
| Investment securities, at value: | ||||||||
| Unaffiliated issuers (cost: $93,300,068) | $ | 99,272,488 | ||||||
| Affiliated issuers (cost: $1,456,629) | 1,172,440 | $ | 100,444,928 | |||||
| Cash | 3,762 | |||||||
| Cash denominated in currencies other than U.S. dollars (cost: $5,395) | 5,398 | |||||||
| Unrealized appreciation on open forward currency contracts | 11,005 | |||||||
| Receivables for: | ||||||||
| Sales of investments | 1,696,442 | |||||||
| Sales of fund’s shares | 57,252 | |||||||
| Variation margin on futures contracts | 403 | |||||||
| Variation margin on swap contracts | 90 | |||||||
| Dividends and interest | 428,598 | |||||||
| Other | 716 | 2,183,501 | ||||||
| 102,648,594 | ||||||||
| Liabilities: | ||||||||
| Unrealized depreciation on open forward currency contracts | 5,249 | |||||||
| Payables for: | ||||||||
| Purchases of investments | 2,842,192 | |||||||
| Repurchases of fund’s shares | 91,017 | |||||||
| Investment advisory services | 17,228 | |||||||
| Services provided by related parties | 25,258 | |||||||
| Trustees’ deferred compensation | 1,621 | |||||||
| Variation margin on futures contracts | 5,510 | |||||||
| Variation margin on swap contracts | 96 | |||||||
| Other | 6,756 | 2,989,678 | ||||||
| Net assets at October 31, 2018 | $ | 99,653,667 | ||||||
| Net assets consist of: | ||||||||
| Capital paid in on shares of beneficial interest | $ | 94,370,365 | ||||||
| Total distributable earnings | 5,283,302 | |||||||
| Net assets at October 31, 2018 | $ | 99,653,667 |
See notes to financial statements
| Capital Income Builder | 15 |
(dollars and shares in thousands, except per-share amounts)
Shares of beneficial interest issued and outstanding (no
stated par value) —
unlimited shares authorized (1,717,890 total shares outstanding)
| Net assets | Shares outstanding | Net asset value per share | ||||||||||
| Class A | $ | 63,345,520 | 1,091,940 | $ | 58.01 | |||||||
| Class C | 3,888,788 | 66,968 | 58.07 | |||||||||
| Class T | 10 | — | * | 58.02 | ||||||||
| Class F-1 | 3,996,374 | 68,899 | 58.00 | |||||||||
| Class F-2 | 9,869,077 | 170,231 | 57.97 | |||||||||
| Class F-3 | 3,722,840 | 64,178 | 58.01 | |||||||||
| Class 529-A | 2,238,140 | 38,597 | 57.99 | |||||||||
| Class 529-C | 425,056 | 7,325 | 58.03 | |||||||||
| Class 529-E | 84,269 | 1,453 | 58.00 | |||||||||
| Class 529-T | 10 | — | * | 58.02 | ||||||||
| Class 529-F-1 | 104,256 | 1,798 | 58.00 | |||||||||
| Class R-1 | 100,486 | 1,732 | 58.00 | |||||||||
| Class R-2 | 486,571 | 8,390 | 58.00 | |||||||||
| Class R-2E | 40,108 | 694 | 57.77 | |||||||||
| Class R-3 | 857,642 | 14,787 | 58.00 | |||||||||
| Class R-4 | 732,479 | 12,632 | 57.99 | |||||||||
| Class R-5E | 20,285 | 350 | 57.94 | |||||||||
| Class R-5 | 213,714 | 3,682 | 58.04 | |||||||||
| Class R-6 | 9,528,042 | 164,234 | 58.01 | |||||||||
| * | Amount less than one thousand. |
See notes to financial statements
| 16 | Capital Income Builder |
| Statement of operations for the year ended October 31, 2018 |
(dollars in thousands) |
| Investment income: | ||||||||
| Income: | ||||||||
| Dividends (net of non-U.S. taxes of $128,503; also includes $277,627 from affiliates) | $ | 3,219,662 | ||||||
| Interest (includes $567 from affiliates) | 780,443 | $ | 4,000,105 | |||||
| Fees and expenses*: | ||||||||
| Investment advisory services | 240,604 | |||||||
| Distribution services | 252,163 | |||||||
| Transfer agent services | 82,773 | |||||||
| Administrative services | 25,544 | |||||||
| Reports to shareholders | 3,100 | |||||||
| Registration statement and prospectus | 1,647 | |||||||
| Trustees’ compensation | 550 | |||||||
| Auditing and legal | 284 | |||||||
| Custodian | 5,687 | |||||||
| Other | 2,515 | 614,867 | ||||||
| Net investment income | 3,385,238 | |||||||
| Net realized loss and unrealized depreciation: | ||||||||
| Net realized (loss) gain on: | ||||||||
| Investments: | ||||||||
| Unaffiliated issuers | (310,737 | ) | ||||||
| Affiliated issuers | 41,304 | |||||||
| Futures contracts | (49 | ) | ||||||
| Forward currency contracts | 13,594 | |||||||
| Swap contracts | (1 | ) | ||||||
| Currency transactions | (13,605 | ) | (269,494 | ) | ||||
| Net unrealized (depreciation) appreciation on: | ||||||||
| Investments: | ||||||||
| Unaffiliated issuers | (5,894,403 | ) | ||||||
| Affiliated issuers | (463,505 | ) | ||||||
| Futures contracts | (5,421 | ) | ||||||
| Forward currency contracts | 2,957 | |||||||
| Swap contracts | 36 | |||||||
| Currency translations | (2,822 | ) | (6,363,158 | ) | ||||
| Net realized loss and unrealized depreciation | (6,632,652 | ) | ||||||
| Net decrease in net assets resulting from operations | $ | (3,247,414 | ) |
| * | Additional information related to class-specific fees and expenses is included in the notes to financial statements. |
Statements of changes in net assets
(dollars in thousands)
| Year ended October 31 | ||||||||
| 2018 | 2017 | |||||||
| Operations: | ||||||||
| Net investment income | $ | 3,385,238 | $ | 3,525,400 | ||||
| Net realized (loss) gain | (269,494 | ) | 4,475,946 | |||||
| Net unrealized (depreciation) appreciation | (6,363,158 | ) | 4,602,328 | |||||
| Net (decrease) increase in net assets resulting from operations | (3,247,414 | ) | 12,603,674 | |||||
| Distributions paid to shareholders | (5,049,369 | ) | (3,449,826 | ) | ||||
| Net capital share transactions | 377,322 | (973,184 | ) | |||||
| Total (decrease) increase in net assets | (7,919,461 | ) | 8,180,664 | |||||
| Net assets: | ||||||||
| Beginning of year | 107,573,128 | 99,392,464 | ||||||
| End of year | $ | 99,653,667 | $ | 107,573,128 | ||||
See notes to financial statements
| Capital Income Builder | 17 |
Notes to financial statements
1. Organization
Capital Income Builder (the “fund”) is registered under the Investment Company Act of 1940 as an open-end, diversified management investment company. The fund seeks to provide a level of current income that exceeds the average yield on U.S. stocks generally and a growing stream of income over the years. Growth of capital is a secondary objective.
The fund has 19 share classes consisting of six retail share classes (Classes A, C, T, F-1, F-2 and F-3), five 529 college savings plan share classes (Classes 529-A, 529-C, 529-E, 529-T and 529-F-1) and eight retirement plan share classes (Classes R-1, R-2, R-2E, R-3, R-4, R-5E, R-5 and R-6). The 529 college savings plan share classes can be used to save for college education. The retirement plan share classes are generally offered only through eligible employer-sponsored retirement plans. The fund’s share classes are described further in the following table:
| Share class | Initial sales charge | Contingent deferred sales charge
upon redemption | Conversion feature | |||
| Classes A and 529-A | Up to 5.75% | None (except 1% for certain redemptions within 18 months of purchase without an initial sales charge) | None | |||
| Class C | None | 1% for redemptions within one year of purchase | Class C converts to Class F-1 after 10 years | |||
| Class 529-C | None | 1% for redemptions within one year of purchase | Class 529-C converts to Class 529-A after 10 years | |||
| Class 529-E | None | None | None | |||
| Classes T and 529-T* | Up to 2.50% | None | None | |||
| Classes F-1, F-2, F-3 and 529-F-1 | None | None | None | |||
| Classes R-1, R-2, R-2E, R-3, R-4, R-5E, R-5 and R-6 | None | None | None |
| * | Class T and 529-T shares are not available for purchase. |
Holders of all share classes have equal pro rata rights to the assets, dividends and liquidation proceeds of the fund. Each share class has identical voting rights, except for the exclusive right to vote on matters affecting only its class. Share classes have different fees and expenses (“class-specific fees and expenses”), primarily due to different arrangements for distribution, transfer agent and administrative services. Differences in class-specific fees and expenses will result in differences in net investment income and, therefore, the payment of different per-share dividends by each share class.
2. Significant accounting policies
The fund is an investment company that applies the accounting and reporting guidance issued in Topic 946 by the U.S. Financial Accounting Standards Board. The fund’s financial statements have been prepared to comply with U.S. generally accepted accounting principles (“U.S. GAAP”). These principles require the fund’s investment adviser to make estimates and assumptions that affect reported amounts and disclosures. Actual results could differ from those estimates. Subsequent events, if any, have been evaluated through the date of issuance in the preparation of the financial statements. The fund follows the significant accounting policies described in this section, as well as the valuation policies described in the next section on valuation.
Security transactions and related investment income — Security transactions are recorded by the fund as of the date the trades are executed with brokers. Realized gains and losses from security transactions are determined based on the specific identified cost of the securities. In the event a security is purchased with a delayed payment date, the fund will segregate liquid assets sufficient to meet its payment obligations. Dividend income is recognized on the ex-dividend date and interest income is recognized on an accrual basis. Market discounts, premiums and original issue discounts on fixed-income securities are amortized daily over the expected life of the security.
Class allocations — Income, fees and expenses (other than class-specific fees and expenses) and realized and unrealized gains and losses are allocated daily among the various share classes based on their relative net assets. Class-specific fees and expenses, such as distribution, transfer agent and administrative services, are charged directly to the respective share class.
Distributions paid to shareholders — Income dividends and capital gain distributions are recorded on the ex-dividend date.
| 18 | Capital Income Builder |
Currency translation — Assets and liabilities, including investment securities, denominated in currencies other than U.S. dollars are translated into U.S. dollars at the exchange rates supplied by one or more pricing vendors on the valuation date. Purchases and sales of investment securities and income and expenses are translated into U.S. dollars at the exchange rates on the dates of such transactions. The effects of changes in exchange rates on investment securities are included with the net realized gain or loss and net unrealized appreciation or depreciation on investments in the fund’s statement of operations. The realized gain or loss and unrealized appreciation or depreciation resulting from all other transactions denominated in currencies other than U.S. dollars are disclosed separately.
3. Valuation
Capital Research and Management Company (“CRMC”), the fund’s investment adviser, values the fund’s investments at fair value as defined by U.S. GAAP. The net asset value of each share class of the fund is generally determined as of approximately 4:00 p.m. New York time each day the New York Stock Exchange is open.
Methods and inputs — The fund’s investment adviser uses the following methods and inputs to establish the fair value of the fund’s assets and liabilities. Use of particular methods and inputs may vary over time based on availability and relevance as market and economic conditions evolve.
Equity securities are generally valued at the official closing price of, or the last reported sale price on, the exchange or market on which such securities are traded, as of the close of business on the day the securities are being valued or, lacking any sales, at the last available bid price. Prices for each security are taken from the principal exchange or market on which the security trades.
Fixed-income securities, including short-term securities, are generally valued at prices obtained from one or more pricing vendors. Vendors value such securities based on one or more of the inputs described in the following table. The table provides examples of inputs that are commonly relevant for valuing particular classes of fixed-income securities in which the fund is authorized to invest. However, these classifications are not exclusive, and any of the inputs may be used to value any other class of fixed-income security.
| Fixed-income class | Examples of standard inputs |
| All | Benchmark yields, transactions, bids, offers, quotations from dealers and trading systems, new issues, spreads and other relationships observed in the markets among comparable securities; and proprietary pricing models such as yield measures calculated using factors such as cash flows, financial or collateral performance and other reference data (collectively referred to as “standard inputs”) |
| Corporate bonds & notes; convertible securities | Standard inputs and underlying equity of the issuer |
| Bonds & notes of governments & government agencies | Standard inputs and interest rate volatilities |
| Mortgage-backed; asset-backed obligations | Standard inputs and cash flows, prepayment information, default rates, delinquency and loss assumptions, collateral characteristics, credit enhancements and specific deal information |
| Municipal securities | Standard inputs and, for certain distressed securities, cash flows or liquidation values using a net present value calculation based on inputs that include, but are not limited to, financial statements and debt contracts |
When the fund’s investment adviser deems it appropriate to do so (such as when vendor prices are unavailable or deemed to be not representative), fixed-income securities will be valued in good faith at the mean quoted bid and ask prices that are reasonably and timely available (or bid prices, if ask prices are not available) or at prices for securities of comparable maturity, quality and type.
Securities with both fixed-income and equity characteristics, or equity securities traded principally among fixed-income dealers, are generally valued in the manner described for either equity or fixed-income securities, depending on which method is deemed most appropriate by the fund’s investment adviser. Exchange-traded futures are generally valued at the official settlement price of, or the last reported sale price on, the exchange or market on which such instruments are traded, as of the close of business on the day the futures are being valued or, lacking any sales, at the last available bid price. Prices for each future are taken from the exchange or market on which the security trades. Forward currency contracts are valued at the mean of representative quoted bid and ask prices, generally based on prices supplied by one or more pricing vendors. Interest rate swaps are generally valued by pricing vendors based on market inputs that include the index and term of index, reset frequency, payer/receiver, currency and pay frequency.
Securities and other assets for which representative market quotations are not readily available or are considered unreliable by the fund’s investment adviser are fair valued as determined in good faith under fair valuation guidelines adopted by authority of the fund’s board of
| Capital Income Builder | 19 |
trustees as further described. The investment adviser follows fair valuation guidelines, consistent with U.S. Securities and Exchange Commission rules and guidance, to consider relevant principles and factors when making fair value determinations. The investment adviser considers relevant indications of value that are reasonably and timely available to it in determining the fair value to be assigned to a particular security, such as the type and cost of the security; contractual or legal restrictions on resale of the security; relevant financial or business developments of the issuer; actively traded similar or related securities; conversion or exchange rights on the security; related corporate actions; significant events occurring after the close of trading in the security; and changes in overall market conditions. In addition, the closing prices of equity securities that trade in markets outside U.S. time zones may be adjusted to reflect significant events that occur after the close of local trading but before the net asset value of each share class of the fund is determined. Fair valuations and valuations of investments that are not actively trading involve judgment and may differ materially from valuations that would have been used had greater market activity occurred.
Processes and structure — The fund’s board of trustees has delegated authority to the fund’s investment adviser to make fair value determinations, subject to board oversight. The investment adviser has established a Joint Fair Valuation Committee (the “Fair Valuation Committee”) to administer, implement and oversee the fair valuation process, and to make fair value decisions. The Fair Valuation Committee regularly reviews its own fair value decisions, as well as decisions made under its standing instructions to the investment adviser’s valuation teams. The Fair Valuation Committee reviews changes in fair value measurements from period to period and may, as deemed appropriate, update the fair valuation guidelines to better reflect the results of back testing and address new or evolving issues. The Fair Valuation Committee reports any changes to the fair valuation guidelines to the board of trustees. The fund’s board and audit committee also regularly review reports that describe fair value determinations and methods.
The fund’s investment adviser has also established a Fixed-Income Pricing Review Group to administer and oversee the fixed-income valuation process, including the use of fixed-income pricing vendors. This group regularly reviews pricing vendor information and market data. Pricing decisions, processes and controls over security valuation are also subject to additional internal reviews, including an annual control self-evaluation program facilitated by the investment adviser’s compliance group.
Classifications — The fund’s investment adviser classifies the fund’s assets and liabilities into three levels based on the inputs used to value the assets or liabilities. Level 1 values are based on quoted prices in active markets for identical securities. Level 2 values are based on significant observable market inputs, such as quoted prices for similar securities and quoted prices in inactive markets. Certain securities trading outside the U.S. may transfer between Level 1 and Level 2 due to valuation adjustments resulting from significant market movements following the close of local trading. Level 3 values are based on significant unobservable inputs that reflect the investment adviser’s determination of assumptions that market participants might reasonably use in valuing the securities. The valuation levels are not necessarily an indication of the risk or liquidity associated with the underlying investment. For example, U.S. government securities are reflected as Level 2 because the inputs used to determine fair value may not always be quoted prices in an active market. The following tables present the fund’s valuation levels as of October 31, 2018 (dollars in thousands):
| 20 | Capital Income Builder |
| Investment securities | ||||||||||||||||
| Level 1 | Level 2 | Level 3 | Total | |||||||||||||
| Assets: | ||||||||||||||||
| Common stocks: | ||||||||||||||||
| Consumer staples | $ | 9,939,807 | $ | — | $ | — | $ | 9,939,807 | ||||||||
| Financials | 9,425,897 | — | — | 9,425,897 | ||||||||||||
| Health care | 9,344,204 | — | — | 9,344,204 | ||||||||||||
| Energy | 7,164,807 | — | — | 7,164,807 | ||||||||||||
| Information technology | 6,453,663 | — | — | 6,453,663 | ||||||||||||
| Utilities | 5,521,009 | 160,862 | — | 5,681,871 | ||||||||||||
| Communication services | 5,589,520 | 269 | — | 5,589,789 | ||||||||||||
| Real estate | 4,772,611 | 101,939 | — | 4,874,550 | ||||||||||||
| Industrials | 4,138,041 | — | — | 4,138,041 | ||||||||||||
| Consumer discretionary | 3,464,550 | — | — | 3,464,550 | ||||||||||||
| Materials | 2,127,840 | — | — | 2,127,840 | ||||||||||||
| Miscellaneous | 2,500,625 | 624 | — | 2,501,249 | ||||||||||||
| Preferred securities | — | 8,515 | — | 8,515 | ||||||||||||
| Rights & warrants | — | — | 127 | 127 | ||||||||||||
| Convertible stocks | 271,809 | — | — | 271,809 | ||||||||||||
| Bonds, notes & other debt instruments: | ||||||||||||||||
| U.S. Treasury bonds & notes | — | 15,373,143 | — | 15,373,143 | ||||||||||||
| Corporate bonds & notes | — | 5,885,478 | 2,387 | 5,887,865 | ||||||||||||
| Mortgage-backed obligations | — | 3,467,978 | — | 3,467,978 | ||||||||||||
| Federal agency bonds & notes | — | 63,674 | — | 63,674 | ||||||||||||
| Other | — | 475,631 | — | 475,631 | ||||||||||||
| Short-term securities | — | 4,189,918 | — | 4,189,918 | ||||||||||||
| Total | $ | 70,714,383 | $ | 29,728,031 | $ | 2,514 | $ | 100,444,928 | ||||||||
| Other investments* | ||||||||||||||||
| Level 1 | Level 2 | Level 3 | Total | |||||||||||||
| Assets: | ||||||||||||||||
| Unrealized appreciation on futures contracts | $ | 5 | $ | — | $ | — | $ | 5 | ||||||||
| Unrealized appreciation on open forward currency contracts | — | 11,005 | — | 11,005 | ||||||||||||
| Unrealized appreciation on interest rate swaps | — | 147 | — | 147 | ||||||||||||
| Liabilities: | ||||||||||||||||
| Unrealized depreciation on futures contracts | (5,426 | ) | — | — | (5,426 | ) | ||||||||||
| Unrealized depreciation on open forward currency contracts | — | (5,249 | ) | — | (5,249 | ) | ||||||||||
| Unrealized depreciation on interest rate swaps | — | (111 | ) | — | (111 | ) | ||||||||||
| Total | $ | (5,421 | ) | $ | 5,792 | $ | — | $ | 371 | |||||||
| * | Futures contracts, forward currency contracts and interest rate swaps are not included in the investment portfolio. |
4. Risk factors
Investing in the fund may involve certain risks including, but not limited to, those described below.
Market conditions — The prices of, and the income generated by, the common stocks, bonds and other securities held by the fund may decline — sometimes rapidly or unpredictably — due to various factors, including events or conditions affecting the general economy or particular industries; overall market changes; local, regional or global political, social or economic instability; governmental, governmental agency or central bank responses to economic conditions; and currency exchange rate, interest rate and commodity price fluctuations. These risks may be heightened in the case of smaller capitalization stocks.
Issuer risks — The prices of, and the income generated by, securities held by the fund may decline in response to various factors directly related to the issuers of such securities, including reduced demand for an issuer’s goods or services, poor management performance, major litigation against the issuer, changes in government regulations affecting the issuer or its competitive environment and strategic initiatives such as mergers, acquisitions or dispositions and the market response to any such initiatives.
Investing in income-oriented stocks — The value of the fund’s securities and income provided by the fund may be reduced by changes in the dividend policies of, and the capital resources available for dividend payments at, the companies in which the fund invests.
| Capital Income Builder | 21 |
Investing in debt instruments — The prices of, and the income generated by, bonds and other debt securities held by the fund may be affected by changing interest rates and by changes in the effective maturities and credit ratings of these securities.
Rising interest rates will generally cause the prices of bonds and other debt securities to fall. A general rise in interest rates may cause investors to sell debt securities on a large scale, which could also adversely affect the price and liquidity of debt securities and could also result in increased redemptions from the fund. Falling interest rates may cause an issuer to redeem, call or refinance a debt security before its stated maturity, which may result in the fund failing to recoup the full amount of its initial investment and having to reinvest the proceeds in lower yielding securities. Longer maturity debt securities generally have greater sensitivity to changes in interest rates and may be subject to greater price fluctuations than shorter maturity debt securities.
Bonds and other debt securities are also subject to credit risk, which is the possibility that the credit strength of an issuer or guarantor will weaken or be perceived to be weaker, and/or an issuer of a debt security will fail to make timely payments of principal or interest and the security will go into default. A downgrade or default affecting any of the fund’s securities could cause the value of the fund’s shares to decrease. Lower quality debt securities generally have higher rates of interest and may be subject to greater price fluctuations than higher quality debt securities. Credit risk is gauged, in part, by the credit ratings of the debt securities in which the fund invests. However, ratings are only the opinions of the rating agencies issuing them and are not guarantees as to credit quality or an evaluation of market risk. The fund’s investment adviser relies on its own credit analysts to research issuers and issues in seeking to assess credit and default risks.
Investing outside the U.S. — Securities of issuers domiciled outside the U.S., or with significant operations or revenues outside the U.S., may lose value because of adverse political, social, economic or market developments (including social instability, regional conflicts, terrorism and war) in the countries or regions in which the issuers operate or generate revenue. These securities may also lose value due to changes in foreign currency exchange rates against the U.S. dollar and/or currencies of other countries. Issuers of these securities may be more susceptible to actions of foreign governments, such as nationalization, currency blockage or the imposition of price controls or punitive taxes each of which could adversely impact the value of these securities. Securities markets in certain countries may be more volatile and/or less liquid than those in the U.S. Investments outside the U.S. may also be subject to different accounting practices and different regulatory, legal and reporting standards and practices, and may be more difficult to value, than those in the U.S. In addition, the value of investments outside the U.S. may be reduced by foreign taxes, including foreign withholding taxes on interest and dividends. Further, there may be increased risks of delayed settlement of securities purchased or sold by the fund. The risks of investing outside the U.S. may be heightened in connection with investments in emerging markets.
Management — The investment adviser to the fund actively manages the fund’s investments. Consequently, the fund is subject to the risk that the methods and analyses, including models, tools and data, employed by the investment adviser in this process may be flawed or incorrect and may not produce the desired results. This could cause the fund to lose value or its investment results to lag relevant benchmarks or other funds with similar objectives.
5. Certain investment techniques
Index-linked bonds — The fund has invested in index-linked bonds, which are fixed-income securities whose principal value is periodically adjusted to a government price index. Over the life of an index-linked bond, interest is paid on the adjusted principal value. Increases or decreases in the principal value of index-linked bonds are recorded as interest income in the fund’s statement of operations.
Mortgage dollar rolls — The fund has entered into mortgage dollar roll transactions in which the fund sells a mortgage-backed security to a counterparty and simultaneously enters into an agreement with the same counterparty to buy back a similar security on a specific future date at a predetermined price. Mortgage dollar rolls are accounted for as purchase and sale transactions. Portfolio turnover rates excluding and including mortgage dollar rolls are presented at the end of the fund’s financial highlights table.
Loan transactions — The fund has entered into loan transactions in which the fund acquires a loan either through an agent, by assignment from another holder, or as a participation interest in another holder’s portion of a loan. The loan is often administered by a financial institution that acts as agent for the holders of the loan, and the fund may be required to receive approval from the agent and/or borrower prior to the sale of the investment. The loan’s interest rate and maturity date may change based on the terms of the loan, including potential early payments of principal.
Futures contracts — The fund has entered into futures contracts, which provide for the future sale by one party and purchase by another party of a specified amount of a specific financial instrument for a specified price, date, time and place designated at the time the contract is made. Futures contracts are used to strategically manage the fund’s interest rate sensitivity by increasing or decreasing the duration of the fund or a portion of the fund’s portfolio.
| 22 | Capital Income Builder |
Upon entering into futures contracts, and to maintain the fund’s open positions in futures contracts, the fund is required to deposit with a futures broker, or FCM, in a segregated account in the name of the FCM an amount of cash, U.S. government securities or other liquid securities, known as initial margin. The margin required for a particular futures contract is set by the exchange on which the contract is traded to serve as collateral, and may be significantly modified from time to time by the exchange during the term of the contract. Securities deposited as initial margin, if any, are disclosed in the investment portfolio and cash deposited as initial margin, if any, is reflected as restricted cash pledged for futures contracts in the fund’s statement of assets and liabilities.
On a daily basis, the fund pays or receives variation margin based on the increase or decrease in the value of the futures contracts and records variation margin on futures contracts in the statement of assets and liabilities. In addition, the fund segregates liquid assets equivalent to the fund’s outstanding obligations under the contract in excess of the initial margin and variation margin, if any. Futures contracts may involve a risk of loss in excess of the variation margin shown on the fund’s statement of assets and liabilities. The fund records realized gains or losses at the time the futures contract is closed or expires. Net realized gains or losses and net unrealized appreciation or depreciation from futures contracts are recorded in the fund’s statement of operations. The average month-end notional amount of futures contracts while held was $3,668,600,000.
Forward currency contracts — The fund has entered into forward currency contracts, which represent agreements to exchange currencies on specific future dates at predetermined rates. The fund’s investment adviser uses forward currency contracts to manage the fund’s exposure to changes in exchange rates. Upon entering into these contracts, risks may arise from the potential inability of counterparties to meet the terms of their contracts and from possible movements in exchange rates.
On a daily basis, the fund’s investment adviser values forward currency contracts and records unrealized appreciation or depreciation for open forward currency contracts in the fund’s statement of assets and liabilities. Realized gains or losses are recorded at the time the forward currency contract is closed or offset by another contract with the same broker for the same settlement date and currency.
Closed forward currency contracts that have not reached their settlement date are included in the respective receivables or payables for closed forward currency contracts in the fund’s statement of assets and liabilities. Net realized gains or losses from closed forward currency contracts and net unrealized appreciation or depreciation from open forward currency contracts are recorded in the fund’s statement of operations. The average month-end notional amount of open forward currency contracts while held was $488,876,000.
Interest rate swaps — The fund has entered into interest rate swap contracts, which are agreements to exchange one stream of future interest payments for another based on a specified notional amount. Typically, interest rate swaps exchange a fixed interest rate for a payment that floats relative to a benchmark or vice versa. The fund’s investment adviser uses interest rate swaps to seek to manage the interest rate sensitivity of the fund by increasing or decreasing the duration of the fund or a portion of the fund’s portfolio. Risks may arise as a result of the fund’s investment adviser incorrectly anticipating changes in interest rates, increased volatility, reduced liquidity and the potential inability of counterparties to meet the terms of their agreements.
Upon entering into an interest rate swap contract, the fund is required to deposit cash, U.S. government securities or other liquid securities, which is known as initial margin. Generally, the initial margin required for a particular interest rate swap is set and held as collateral by the clearinghouse on which the contract is cleared. The amount of initial margin required may be significantly modified from time to time by the clearinghouse during the term of the contract.
On a daily basis, the fund’s investment adviser records daily interest accruals related to the exchange of future payments as a receivable and payable in the fund’s statement of assets and liabilities. The fund also pays or receives a variation margin based on the increase or decrease in the value of the interest rate swaps, including accrued interest, and records variation margin on interest rate swaps in the statement of assets and liabilities. The fund records realized gains and losses on both the net accrued interest and any gain or loss recognized at the time the interest rate swap is closed or expires. Net realized gains or losses, as well as any net unrealized appreciation or depreciation, from interest rate swaps are recorded in the fund’s statement of operations. The average month-end notional amount of interest rate swaps while held was $252,400,000.
| Capital Income Builder | 23 |
The following tables present the financial statement impacts resulting from the fund’s use of futures contracts, forward currency contracts and interest rate swaps as of, or for the year ended, October 31, 2018 (dollars in thousands):
| Assets | Liabilities | |||||||||||||
| Contracts | Risk type | Location on statement of assets and liabilities | Value | Location on statement of assets and liabilities | Value | |||||||||
| Futures | Interest | Unrealized appreciation* | $ | 5 | Unrealized depreciation* | $ | 5,426 | |||||||
| Forward currency | Currency | Unrealized appreciation on open forward currency contracts | 11,005 | Unrealized depreciation on open forward currency contracts | 5,249 | |||||||||
| Swaps | Interest | Unrealized appreciation* | 147 | Unrealized depreciation* | 111 | |||||||||
| $ | 11,157 | $ | 10,786 | |||||||||||
| Net realized (loss) gain | Net unrealized (depreciation) appreciation | |||||||||||||
| Contracts | Risk type | Location on statement of operations | Value | Location on statement of operations | Value | |||||||||
| Futures | Interest | Net realized loss on futures contracts | $ | (49 | ) | Net unrealized depreciation on futures contracts | $ | (5,421 | ) | |||||
| Forward currency | Currency | Net realized gain on forward currency contracts | 13,594 | Net unrealized appreciation on forward currency contracts | 2,957 | |||||||||
| Swaps | Interest | Net realized loss on swap contracts | (1 | ) | Net unrealized appreciation on swap contracts | 36 | ||||||||
| $ | 13,544 | $ | (2,428 | ) | ||||||||||
| * | Includes cumulative appreciation/depreciation on futures contracts and interest rate swaps as reported in the applicable tables following the fund’s investment portfolio. Only current day’s variation margin is reported within the statement of assets and liabilities. |
Collateral — The fund participates in a collateral program that calls for the fund to either receive or pledge highly liquid assets, such as cash or U.S. government securities, as collateral due to its use of futures contracts, forward currency contracts, interest rate swaps and future delivery contracts. For futures contracts and interest rate swaps, the program calls for the fund to pledge collateral for initial and variation margin by contract. For forward currency contracts, the program calls for the fund to either receive or pledge collateral based on the net gain or loss on unsettled forward currency contracts by counterparty. For future delivery contracts, the program calls for the fund to either receive or pledge collateral based on the net gain or loss on unsettled contracts by certain counterparties. The purpose of the collateral is to cover potential losses that could occur in the event that either party cannot meet its contractual obligation. Non-cash collateral pledged by the fund, if any, is disclosed in the fund’s investment portfolio, and cash collateral pledged by the fund, if any, is held in a segregated account with the fund’s custodian, which is reflected as pledged cash in the fund’s statement of assets and liabilities.
Rights of offset — The fund has entered into enforceable master netting agreements with certain counterparties for forward currency contracts, where on any date amounts payable by each party to the other (in the same currency with respect to the same transaction) may be closed or offset by each party’s payment obligation. If an early termination date occurs under these agreements following an event of default or termination event, all obligations of each party to its counterparty are settled net through a single payment in a single currency (“close-out netting”). For financial reporting purposes, the fund does not offset financial assets and financial liabilities that are subject to these master netting arrangements in the statement of assets and liabilities.
The following table presents the fund’s forward currency contracts by counterparty that are subject to master netting agreements but that are not offset in the fund’s statement of assets and liabilities. The net amount column shows the impact of offsetting on the fund’s statement of assets and liabilities as of October 31, 2018, if close-out netting was exercised (dollars in thousands):
| Gross amounts recognized in the | Gross amounts not offset in the statement of assets and liabilities and subject to a master netting agreement | |||||||||||||||||||
| Counterparty | statement of assets and liabilities | Available to offset | Non-cash collateral* | Cash collateral | Net amount | |||||||||||||||
| Assets: | ||||||||||||||||||||
| Bank of New York Mellon | $ | 62 | $ | — | $ | — | $ | — | $ | 62 | ||||||||||
| Citibank | 10,943 | — | — | (10,200 | ) | 743 | ||||||||||||||
| Total | $ | 11,005 | $ | — | $ | — | $ | (10,200 | ) | $ | 805 | |||||||||
| 24 | Capital Income Builder |
| Gross amounts recognized in the | Gross amounts not offset in the statement of assets and liabilities and subject to a master netting agreement | |||||||||||||||||||
| Counterparty | statement of assets and liabilities | Available to offset | Non-cash collateral* | Cash collateral | Net amount | |||||||||||||||
| Liabilities: | ||||||||||||||||||||
| Morgan Stanley | $ | 5,249 | $ | — | $ | — | $ | — | $ | 5,249 | ||||||||||
| * | Non-cash collateral is shown on a settlement basis. |
6. Taxation and distributions
Federal income taxation — The fund complies with the requirements under Subchapter M of the Internal Revenue Code applicable to mutual funds and intends to distribute substantially all of its net taxable income and net capital gains each year. The fund is not subject to income taxes to the extent such distributions are made. Therefore, no federal income tax provision is required.
As of and during the period ended October 31, 2018, the fund did not have a liability for any unrecognized tax benefits. The fund recognizes interest and penalties, if any, related to unrecognized tax benefits as income tax expense in the statement of operations. During the period, the fund did not incur any significant interest or penalties.
The fund’s tax returns are not subject to examination by federal, state and, if applicable, non-U.S. tax authorities after the expiration of each jurisdiction’s statute of limitations, which is generally three years after the date of filing but can be extended in certain jurisdictions.
Non-U.S. taxation — Dividend and interest income are recorded net of non-U.S. taxes paid. The fund may file withholding tax reclaims in certain jurisdictions to recover a portion of amounts previously withheld. As a result of rulings from European courts, the fund filed for additional reclaims related to prior years. These reclaims are recorded when the amount is known and there are no significant uncertainties on collectability. Gains realized by the fund on the sale of securities in certain countries, if any, may be subject to non-U.S. taxes. If applicable, the fund records an estimated deferred tax liability based on unrealized gains to provide for potential non-U.S. taxes payable upon the sale of these securities.
Distributions — Distributions paid to shareholders are based on net investment income and net realized gains determined on a tax basis, which may differ from net investment income and net realized gains for financial reporting purposes. These differences are due primarily to different treatment for items such as currency gains and losses; short-term capital gains and losses; capital losses related to sales of certain securities within 30 days of purchase; unrealized appreciation of certain investments in securities outside the U.S.; cost of investments sold; net capital losses; amortization of premiums and discounts and income on certain investments. The fiscal year in which amounts are distributed may differ from the year in which the net investment income and net realized gains are recorded by the fund for financial reporting purposes.
During the year ended October 31, 2018, the fund reclassified $36,000 from total distributable earnings to capital paid in on shares of beneficial interest to align financial reporting with tax reporting.
As of October 31, 2018, the tax basis components of distributable earnings, unrealized appreciation (depreciation) and cost of investments were as follows (dollars in thousands):
| Undistributed ordinary income | $ | 572,023 | ||
| Capital loss carryforward* | (418,067 | ) | ||
| Gross unrealized appreciation on investments | 11,915,912 | |||
| Gross unrealized depreciation on investments | (6,782,470 | ) | ||
| Net unrealized appreciation on investments | 5,133,442 | |||
| Cost of investments | 95,311,857 |
| * | The capital loss carryforward will be used to offset any capital gains realized by the fund in future years. The fund will not make distributions from capital gains while a capital loss carryforward remains. |
| Capital Income Builder | 25 |
Distributions paid were characterized for tax purposes as follows (dollars in thousands):
| Year ended October 31, 2018 | Year ended October 31, 2017 | |||||||||||||||||||||||
| Share class | Ordinary income | Long-term capital gains | Total distributions paid | Ordinary income | Long-term capital gains | Total distributions paid | ||||||||||||||||||
| Class A | $ | 2,406,031 | $ | 892,642 | $ | 3,298,673 | $ | 2,359,038 | $ | — | $ | 2,359,038 | ||||||||||||
| Class B1 | 391 | — | 391 | |||||||||||||||||||||
| Class C | 121,377 | 61,815 | 183,192 | 137,803 | — | 137,803 | ||||||||||||||||||
| Class T2 | — | 3 | — | 3 | — | 3 | — | 3 | — | — | 3 | |||||||||||||
| Class F-1 | 154,917 | 59,130 | 214,047 | 150,862 | — | 150,862 | ||||||||||||||||||
| Class F-2 | 350,708 | 115,706 | 466,414 | 297,859 | — | 297,859 | ||||||||||||||||||
| Class F-34 | 133,976 | 40,712 | 174,688 | 46,662 | — | 46,662 | ||||||||||||||||||
| Class 529-A | 82,197 | 30,755 | 112,952 | 73,407 | — | 73,407 | ||||||||||||||||||
| Class 529-B1 | 31 | — | 31 | |||||||||||||||||||||
| Class 529-C | 12,486 | 6,614 | 19,100 | 17,038 | — | 17,038 | ||||||||||||||||||
| Class 529-E | 2,915 | 1,185 | 4,100 | 2,804 | — | 2,804 | ||||||||||||||||||
| Class 529-T2 | — | 3 | — | 3 | — | 3 | — | 3 | — | — | 3 | |||||||||||||
| Class 529-F-1 | 3,529 | 1,192 | 4,721 | 2,999 | — | 2,999 | ||||||||||||||||||
| Class R-1 | 3,035 | 1,528 | 4,563 | 3,264 | — | 3,264 | ||||||||||||||||||
| Class R-2 | 14,768 | 7,308 | 22,076 | 15,694 | — | 15,694 | ||||||||||||||||||
| Class R-2E | 1,105 | 420 | 1,525 | 594 | — | 594 | ||||||||||||||||||
| Class R-3 | 30,165 | 12,730 | 42,895 | 30,361 | — | 30,361 | ||||||||||||||||||
| Class R-4 | 27,250 | 10,484 | 37,734 | 26,460 | — | 26,460 | ||||||||||||||||||
| Class R-5E | 551 | 144 | 695 | 292 | — | 292 | ||||||||||||||||||
| Class R-5 | 8,841 | 2,984 | 11,825 | 8,225 | — | 8,225 | ||||||||||||||||||
| Class R-6 | 344,273 | 105,896 | 450,169 | 276,042 | — | 276,042 | ||||||||||||||||||
| Total | $ | 3,698,124 | $ | 1,351,245 | $ | 5,049,369 | $ | 3,449,826 | $ | — | $ | 3,449,826 | ||||||||||||
| 1 | Class B and 529-B shares were fully liquidated on May 5, 2017. |
| 2 | Class T and 529-T shares began investment operations on April 7, 2017. |
| 3 | Amount less than one thousand. |
| 4 | Class F-3 shares began investment operations on January 27, 2017. |
7. Fees and transactions with related parties
CRMC, the fund’s investment adviser, is the parent company of American Funds Distributors,® Inc. (“AFD”), the principal underwriter of the fund’s shares, and American Funds Service Company® (“AFS”), the fund’s transfer agent. CRMC, AFD and AFS are considered related parties to the fund.
Investment advisory services — The fund has an investment advisory and service agreement with CRMC that provides for monthly fees accrued daily. These fees are based on a series of decreasing annual rates beginning with 0.240% on the first $1 billion of average daily net assets and decreasing to 0.110% on such assets in excess of $115 billion. The agreement also provides for monthly fees, accrued daily, based on a series of decreasing rates beginning with 3.00% on the first $100,000,000 of the fund’s monthly gross income and decreasing to 2.50% on such income in excess of $100,000,000. For the year ended October 31, 2018, the investment advisory services fee was $240,604,000, which was equivalent to an annualized rate of 0.226% of average daily net assets.
Class-specific fees and expenses — Expenses that are specific to individual share classes are accrued directly to the respective share class. The principal class-specific fees and expenses are further described below:
| Distribution services — The fund has plans of distribution for all share classes, except Class F-2, F-3, R-5E, R-5 and R-6 shares. Under the plans, the board of trustees approves certain categories of expenses that are used to finance activities primarily intended to sell fund shares and service existing accounts. The plans provide for payments, based on an annualized percentage of average daily net assets, ranging from 0.30% to 1.00% as noted in this section. In some cases, the board of trustees has limited the amounts that may be paid to less than the maximum allowed by the plans. All share classes with a plan may use up to 0.25% of average daily net assets to pay service fees, or to compensate AFD for paying service fees, to firms that have entered into agreements with AFD to provide |
| 26 | Capital Income Builder |
| certain shareholder services. The remaining amounts available to be paid under each plan are paid to dealers to compensate them for their sales activities. | |
| Share class | Currently approved limits | Plan limits | |||||||
| Class A | 0.30 | % | 0.30 | % | |||||
| Class 529-A | 0.30 | 0.50 | |||||||
| Classes C, 529-C and R-1 | 1.00 | 1.00 | |||||||
| Class R-2 | 0.75 | 1.00 | |||||||
| Class R-2E | 0.60 | 0.85 | |||||||
| Classes 529-E and R-3 | 0.50 | 0.75 | |||||||
| Classes T, F-1, 529-T, 529-F-1 and R-4 | 0.25 | 0.50 | |||||||
| For Class A and 529-A shares, distribution-related expenses include the reimbursement of dealer and wholesaler commissions paid by AFD for certain shares sold without a sales charge. These share classes reimburse AFD for amounts billed within the prior 15 months but only to the extent that the overall annual expense limits are not exceeded. As of October 31, 2018, there were no unreimbursed expenses subject to reimbursement for Class A or 529-A shares. | |
| Transfer agent services — The fund has a shareholder services agreement with AFS under which the fund compensates AFS for providing transfer agent services to each of the fund’s share classes. These services include recordkeeping, shareholder communications and transaction processing. In addition, the fund reimburses AFS for amounts paid to third parties for performing transfer agent services on behalf of fund shareholders. | |
| Administrative services — The fund has an administrative services agreement with CRMC under which the fund compensates CRMC for providing administrative services to Class A, C, T, F, 529 and R shares. Administrative services are provided by CRMC to help assist third parties providing non-distribution services to fund shareholders. These services include providing in depth information on the fund and market developments that impact fund investments. Administrative services also include, but are not limited to, coordinating, monitoring and overseeing third parties that provide services to fund shareholders. The agreement between the fund and the investment adviser provides the fund the ability to charge an administrative services fee of 0.05% of average daily net assets for all share classes. Currently Class A shares pay an annual fee of 0.01% of average daily net assets (which could be increased as noted above) and Class C, T, F, 529 and R shares pay an annual fee of 0.05% of their respective average daily net assets. | |
| 529 plan services — Each 529 share class is subject to service fees to compensate the Virginia College Savings Plan (“Virginia529”) for its oversight and administration of the CollegeAmerica 529 college savings plan. The fee is based on the combined net assets invested in Class 529 and ABLE shares of the American Funds. Class ABLE shares are offered on other American Funds by Virginia529 through ABLEAmerica, a tax-advantaged savings program for individuals with disabilities. The quarterly fee is based on a series of decreasing annual rates beginning with 0.10% on the first $20 billion of the combined net assets invested in the American Funds and decreasing to 0.03% on such assets in excess of $100 billion. The fee for any given calendar quarter is accrued and calculated on the basis of the average net assets of Class 529 and ABLE shares of the American Funds for the last month of the prior calendar quarter. The fee is included in other expenses in the fund’s statement of operations. Virginia529 is not considered a related party to the fund. |
| Capital Income Builder | 27 |
| For the year ended October 31, 2018, class-specific expenses under the agreements were as follows (dollars in thousands): | |
| Share class | Distribution services | Transfer agent services | Administrative services | 529 plan services |
||||||||||||
| Class A | $172,098 | $56,616 | $6,912 | Not applicable | ||||||||||||
| Class C | 45,445 | 3,784 | 2,277 | Not applicable | ||||||||||||
| Class T | — | — | * | — | * | Not applicable | ||||||||||
| Class F-1 | 11,282 | 5,413 | 2,259 | Not applicable | ||||||||||||
| Class F-2 | Not applicable | 10,003 | 4,805 | Not applicable | ||||||||||||
| Class F-3 | Not applicable | 161 | 1,783 | Not applicable | ||||||||||||
| Class 529-A | 5,573 | 1,727 | 1,198 | $1,582 | ||||||||||||
| Class 529-C | 5,038 | 389 | 255 | 336 | ||||||||||||
| Class 529-E | 457 | 31 | 46 | 61 | ||||||||||||
| Class 529-T | — | — | * | — | * | — | * | |||||||||
| Class 529-F-1 | — | 70 | 49 | 64 | ||||||||||||
| Class R-1 | 1,137 | 117 | 57 | Not applicable | ||||||||||||
| Class R-2 | 4,103 | 1,931 | 275 | Not applicable | ||||||||||||
| Class R-2E | 220 | 75 | 18 | Not applicable | ||||||||||||
| Class R-3 | 4,827 | 1,492 | 484 | Not applicable | ||||||||||||
| Class R-4 | 1,983 | 814 | 397 | Not applicable | ||||||||||||
| Class R-5E | Not applicable | 23 | 8 | Not applicable | ||||||||||||
| Class R-5 | Not applicable | 123 | 120 | Not applicable | ||||||||||||
| Class R-6 | Not applicable | 4 | 4,601 | Not applicable | ||||||||||||
| Total class-specific expenses | $252,163 | $82,773 | $25,544 | $2,043 | ||||||||||||
| * | Amount less than one thousand. |
Trustees’ deferred compensation — Trustees who are unaffiliated with CRMC may elect to defer the cash payment of part or all of their compensation. These deferred amounts, which remain as liabilities of the fund, are treated as if invested in shares of the fund or other American Funds. These amounts represent general, unsecured liabilities of the fund and vary according to the total returns of the selected funds. Trustees’ compensation of $550,000 in the fund’s statement of operations reflects $448,000 in current fees (either paid in cash or deferred) and a net increase of $102,000 in the value of the deferred amounts.
Affiliated officers and trustees — Officers and certain trustees of the fund are or may be considered to be affiliated with CRMC, AFD and AFS. No affiliated officers or trustees received any compensation directly from the fund.
Security transactions with related funds — The fund may purchase from, or sell securities to, other funds managed by CRMC (or funds managed by certain affiliates of CRMC) under procedures adopted by the fund’s board of trustees. The funds involved in such transactions are considered related by virtue of having a common investment adviser (or affiliated investment advisers), common trustees and/or common officers. When such transactions occur, each transaction is executed at the current market price of the security and no brokerage commissions or fees are paid in accordance with Rule 17a-7 of the 1940 Act.
Interfund lending — Pursuant to an exemptive order issued by the SEC, the fund, along with other CRMC-managed funds (or funds managed by certain affiliates of CRMC), may participate in an interfund lending program. The program provides an alternate credit facility that permits the funds to lend or borrow cash for temporary purposes directly to or from one another, subject to the conditions of the exemptive order. The fund did not lend or borrow cash through the interfund lending program at any time during the year ended October 31, 2018.
| 28 | Capital Income Builder |
8. Capital share transactions
Capital share transactions in the fund were as follows (dollars and shares in thousands):
| Sales1 | Reinvestments of distributions | Repurchases1 | Net (decrease) increase | |||||||||||||||||||||||||||||
| Share class | Amount | Shares | Amount | Shares | Amount | Shares | Amount | Shares | ||||||||||||||||||||||||
| Year ended October 31, 2018 | ||||||||||||||||||||||||||||||||
| Class A | $ | 3,764,962 | 61,158 | $ | 3,228,495 | 52,447 | $ | (9,797,230 | ) | (159,923 | ) | $ | (2,803,773 | ) | (46,318 | ) | ||||||||||||||||
| Class C | 393,400 | 6,373 | 179,632 | 2,907 | (1,409,518 | ) | (22,897 | ) | (836,486 | ) | (13,617 | ) | ||||||||||||||||||||
| Class T | — | — | — | — | — | — | — | — | ||||||||||||||||||||||||
| Class F-1 | 740,612 | 11,996 | 208,019 | 3,378 | (1,320,599 | ) | (21,562 | ) | (371,968 | ) | (6,188 | ) | ||||||||||||||||||||
| Class F-2 | 3,723,446 | 60,975 | 445,452 | 7,252 | (2,454,044 | ) | (40,114 | ) | 1,714,854 | 28,113 | ||||||||||||||||||||||
| Class F-3 | 1,439,148 | 23,317 | 161,440 | 2,628 | (664,682 | ) | (10,878 | ) | 935,906 | 15,067 | ||||||||||||||||||||||
| Class 529-A | 406,239 | 6,515 | 112,927 | 1,836 | (395,729 | ) | (6,451 | ) | 123,437 | 1,900 | ||||||||||||||||||||||
| Class 529-C | 51,231 | 831 | 19,097 | 309 | (297,991 | ) | (4,758 | ) | (227,663 | ) | (3,618 | ) | ||||||||||||||||||||
| Class 529-E | 9,698 | 157 | 4,099 | 67 | (17,331 | ) | (282 | ) | (3,534 | ) | (58 | ) | ||||||||||||||||||||
| Class 529-T | — | — | 1 | — | 2 | — | — | 1 | — | 2 | ||||||||||||||||||||||
| Class 529-F-1 | 33,193 | 548 | 4,720 | 77 | (18,956 | ) | (309 | ) | 18,957 | 316 | ||||||||||||||||||||||
| Class R-1 | 11,129 | 181 | 4,558 | 74 | (29,786 | ) | (485 | ) | (14,099 | ) | (230 | ) | ||||||||||||||||||||
| Class R-2 | 100,899 | 1,640 | 22,035 | 356 | (180,748 | ) | (2,945 | ) | (57,814 | ) | (949 | ) | ||||||||||||||||||||
| Class R-2E | 19,250 | 315 | 1,525 | 25 | (10,753 | ) | (174 | ) | 10,022 | 166 | ||||||||||||||||||||||
| Class R-3 | 162,374 | 2,641 | 42,838 | 695 | (299,777 | ) | (4,887 | ) | (94,565 | ) | (1,551 | ) | ||||||||||||||||||||
| Class R-4 | 152,327 | 2,480 | 37,704 | 613 | (233,910 | ) | (3,808 | ) | (43,879 | ) | (715 | ) | ||||||||||||||||||||
| Class R-5E | 12,196 | 200 | 695 | 12 | (2,424 | ) | (40 | ) | 10,467 | 172 | ||||||||||||||||||||||
| Class R-5 | 61,050 | 984 | 11,778 | 191 | (82,755 | ) | (1,341 | ) | (9,927 | ) | (166 | ) | ||||||||||||||||||||
| Class R-6 | 2,073,825 | 33,633 | 450,024 | 7,327 | (496,463 | ) | (8,040 | ) | 2,027,386 | 32,920 | ||||||||||||||||||||||
| Total net increase (decrease) | $ | 13,154,979 | 213,944 | $ | 4,935,039 | 80,194 | $ | (17,712,696 | ) | (288,894 | ) | $ | 377,322 | 5,244 | ||||||||||||||||||
| Year ended October 31, 2017 | ||||||||||||||||||||||||||||||||
| Class A | $ | 4,887,638 | 81,385 | $ | 2,296,902 | 38,145 | $ | (11,036,777 | ) | (183,874 | ) | $ | (3,852,237 | ) | (64,344 | ) | ||||||||||||||||
| Class B3 | 163 | 3 | 387 | 7 | (89,681 | ) | (1,524 | ) | (89,131 | ) | (1,514 | ) | ||||||||||||||||||||
| Class C | 556,915 | 9,263 | 134,195 | 2,230 | (1,931,873 | ) | (32,149 | ) | (1,240,763 | ) | (20,656 | ) | ||||||||||||||||||||
| Class T4 | 10 | — | 2 | — | — | — | — | 10 | — | 2 | ||||||||||||||||||||||
| Class F-1 | 1,108,562 | 18,461 | 145,692 | 2,419 | (1,281,882 | ) | (21,259 | ) | (27,628 | ) | (379 | ) | ||||||||||||||||||||
| Class F-2 | 4,559,434 | 76,072 | 279,493 | 4,645 | (4,173,596 | ) | (69,237 | ) | 665,331 | 11,480 | ||||||||||||||||||||||
| Class F-35 | 3,181,060 | 52,158 | 41,557 | 670 | (230,443 | ) | (3,717 | ) | 2,992,174 | 49,111 | ||||||||||||||||||||||
| Class 529-A | 214,315 | 3,571 | 73,395 | 1,219 | (324,159 | ) | (5,382 | ) | (36,449 | ) | (592 | ) | ||||||||||||||||||||
| Class 529-B3 | 56 | 1 | 31 | 1 | (8,620 | ) | (147 | ) | (8,533 | ) | (145 | ) | ||||||||||||||||||||
| Class 529-C | 67,350 | 1,122 | 17,031 | 283 | (122,570 | ) | (2,041 | ) | (38,189 | ) | (636 | ) | ||||||||||||||||||||
| Class 529-E | 9,527 | 158 | 2,803 | 46 | (14,408 | ) | (239 | ) | (2,078 | ) | (35 | ) | ||||||||||||||||||||
| Class 529-T4 | 10 | — | 2 | — | 2 | — | 2 | — | — | 10 | — | 2 | ||||||||||||||||||||
| Class 529-F-1 | 22,284 | 372 | 2,998 | 49 | (15,108 | ) | (251 | ) | 10,174 | 170 | ||||||||||||||||||||||
| Class R-1 | 14,132 | 235 | 3,261 | 54 | (39,229 | ) | (654 | ) | (21,836 | ) | (365 | ) | ||||||||||||||||||||
| Class R-2 | 117,654 | 1,962 | 15,667 | 260 | (229,441 | ) | (3,819 | ) | (96,120 | ) | (1,597 | ) | ||||||||||||||||||||
| Class R-2E | 28,017 | 467 | 594 | 10 | (8,884 | ) | (150 | ) | 19,727 | 327 | ||||||||||||||||||||||
| Class R-3 | 235,826 | 3,927 | 30,286 | 503 | (322,016 | ) | (5,363 | ) | (55,904 | ) | (933 | ) | ||||||||||||||||||||
| Class R-4 | 219,302 | 3,658 | 26,445 | 439 | (229,472 | ) | (3,819 | ) | 16,275 | 278 | ||||||||||||||||||||||
| Class R-5E | 11,009 | 188 | 291 | 5 | (865 | ) | (15 | ) | 10,435 | 178 | ||||||||||||||||||||||
| Class R-5 | 73,654 | 1,231 | 8,188 | 136 | (68,854 | ) | (1,143 | ) | 12,988 | 224 | ||||||||||||||||||||||
| Class R-6 | 1,713,253 | 28,431 | 276,036 | 4,582 | (1,220,729 | ) | (20,092 | ) | 768,560 | 12,921 | ||||||||||||||||||||||
| Total net increase (decrease) | $ | 17,020,171 | 282,665 | $ | 3,355,252 | 55,703 | $ | (21,348,607 | ) | (354,875 | ) | $ | (973,184 | ) | (16,507 | ) | ||||||||||||||||
| 1 | Includes exchanges between share classes of the fund. |
| 2 | Amount less than one thousand. |
| 3 | Class B and 529-B shares were fully liquidated on May 5, 2017. |
| 4 | Class T and 529-T shares began investment operations on April 7, 2017. |
| 5 | Class F-3 shares began investment operations on January 27, 2017. |
| Capital Income Builder | 29 |
9. Investment transactions
The fund made purchases and sales of investment securities, excluding short-term securities and U.S. government obligations, if any, of $66,254,060,000 and $68,037,166,000, respectively, during the year ended October 31, 2018.
| 30 | Capital Income Builder |
Financial highlights
| (Loss) income from investment operations1 | Dividends and distributions | |||||||||||||||||||||||||||||||||||||||||||||||
| Period ended | Net asset value, beginning of period | Net investment income2 | Net (losses) gains on securities (both realized and unrealized) | Total from investment operations | Dividends (from net investment income) | Distributions (from capital gains) | Total dividends and distributions | Net asset value, end of period | Total return3 | Net assets, end of period (in millions) | Ratio of expenses to average net assets2 | Ratio of net income to average net assets2 | ||||||||||||||||||||||||||||||||||||
| Class A: | ||||||||||||||||||||||||||||||||||||||||||||||||
| 10/31/2018 | $ | 62.81 | $ | 1.95 | $ | (3.81 | ) | $ | (1.86 | ) | $ | (2.15 | ) | $ | (.79 | ) | $ | (2.94 | ) | $ | 58.01 | (3.16 | )% | $ | 63,346 | .58 | % | 3.18 | % | |||||||||||||||||||
| 10/31/2017 | 57.48 | 2.07 | 5.29 | 7.36 | (2.03 | ) | — | (2.03 | ) | 62.81 | 13.00 | 71,498 | .59 | 3.43 | ||||||||||||||||||||||||||||||||||
| 10/31/2016 | 57.96 | 1.91 | (.37 | ) | 1.54 | (2.02 | ) | — | (2.02 | ) | 57.48 | 2.74 | 69,127 | .60 | 3.34 | |||||||||||||||||||||||||||||||||
| 10/31/2015 | 60.76 | 1.97 | (2.38 | ) | (.41 | ) | (2.39 | ) | — | (2.39 | ) | 57.96 | (.69 | ) | 70,041 | .59 | 3.31 | |||||||||||||||||||||||||||||||
| 10/31/2014 | 58.25 | 2.64 | 2.28 | 4.92 | (2.41 | ) | — | (2.41 | ) | 60.76 | 8.64 | 70,314 | .62 | 4.44 | ||||||||||||||||||||||||||||||||||
| Class C: | ||||||||||||||||||||||||||||||||||||||||||||||||
| 10/31/2018 | 62.86 | 1.47 | (3.83 | ) | (2.36 | ) | (1.64 | ) | (.79 | ) | (2.43 | ) | 58.07 | (3.94 | ) | 3,889 | 1.37 | 2.39 | ||||||||||||||||||||||||||||||
| 10/31/2017 | 57.51 | 1.59 | 5.30 | 6.89 | (1.54 | ) | — | (1.54 | ) | 62.86 | 12.12 | 5,065 | 1.39 | 2.64 | ||||||||||||||||||||||||||||||||||
| 10/31/2016 | 57.98 | 1.46 | (.37 | ) | 1.09 | (1.56 | ) | — | (1.56 | ) | 57.51 | 1.92 | 5,822 | 1.40 | 2.54 | |||||||||||||||||||||||||||||||||
| 10/31/2015 | 60.77 | 1.50 | (2.39 | ) | (.89 | ) | (1.90 | ) | — | (1.90 | ) | 57.98 | (1.48 | ) | 6,367 | 1.38 | 2.51 | |||||||||||||||||||||||||||||||
| 10/31/2014 | 58.25 | 2.17 | 2.27 | 4.44 | (1.92 | ) | — | (1.92 | ) | 60.77 | 7.78 | 7,027 | 1.42 | 3.66 | ||||||||||||||||||||||||||||||||||
| Class T: | ||||||||||||||||||||||||||||||||||||||||||||||||
| 10/31/2018 | 62.83 | 2.09 | (3.83 | ) | (1.74 | ) | (2.28 | ) | (.79 | ) | (3.07 | ) | 58.02 | (2.96 | )4 | — | 5 | .36 | 4 | 3.40 | 4 | |||||||||||||||||||||||||||
| 10/31/20176,7 | 59.80 | 1.26 | 2.83 | 4.09 | (1.06 | ) | — | (1.06 | ) | 62.83 | 6.87 | 4,8 | — | 5 | .38 | 4,9 | 3.59 | 4,9 | ||||||||||||||||||||||||||||||
| Class F-1: | ||||||||||||||||||||||||||||||||||||||||||||||||
| 10/31/2018 | 62.81 | 1.91 | (3.83 | ) | (1.92 | ) | (2.10 | ) | (.79 | ) | (2.89 | ) | 58.00 | (3.26 | ) | 3,996 | .66 | 3.11 | ||||||||||||||||||||||||||||||
| 10/31/2017 | 57.48 | 2.02 | 5.30 | 7.32 | (1.99 | ) | — | (1.99 | ) | 62.81 | 12.92 | 4,716 | .67 | 3.35 | ||||||||||||||||||||||||||||||||||
| 10/31/2016 | 57.96 | 1.87 | (.37 | ) | 1.50 | (1.98 | ) | — | (1.98 | ) | 57.48 | 2.66 | 4,338 | .67 | 3.26 | |||||||||||||||||||||||||||||||||
| 10/31/2015 | 60.77 | 1.93 | (2.39 | ) | (.46 | ) | (2.35 | ) | — | (2.35 | ) | 57.96 | (.76 | ) | 3,987 | .65 | 3.25 | |||||||||||||||||||||||||||||||
| 10/31/2014 | 58.25 | 2.69 | 2.19 | 4.88 | (2.36 | ) | — | (2.36 | ) | 60.77 | 8.57 | 3,445 | .69 | 4.53 | ||||||||||||||||||||||||||||||||||
| Class F-2: | ||||||||||||||||||||||||||||||||||||||||||||||||
| 10/31/2018 | 62.78 | 2.06 | (3.82 | ) | (1.76 | ) | (2.26 | ) | (.79 | ) | (3.05 | ) | 57.97 | (3.00 | ) | 9,869 | .39 | 3.37 | ||||||||||||||||||||||||||||||
| 10/31/2017 | 57.45 | 2.18 | 5.29 | 7.47 | (2.14 | ) | — | (2.14 | ) | 62.78 | 13.22 | 8,922 | .41 | 3.61 | ||||||||||||||||||||||||||||||||||
| 10/31/2016 | 57.94 | 2.01 | (.36 | ) | 1.65 | (2.14 | ) | — | (2.14 | ) | 57.45 | 2.93 | 7,506 | .40 | 3.50 | |||||||||||||||||||||||||||||||||
| 10/31/2015 | 60.74 | 2.08 | (2.38 | ) | (.30 | ) | (2.50 | ) | — | (2.50 | ) | 57.94 | (.49 | ) | 5,284 | .40 | 3.50 | |||||||||||||||||||||||||||||||
| 10/31/2014 | 58.23 | 2.59 | 2.44 | 5.03 | (2.52 | ) | — | (2.52 | ) | 60.74 | 8.86 | 4,496 | .42 | 4.37 | ||||||||||||||||||||||||||||||||||
| Class F-3: | ||||||||||||||||||||||||||||||||||||||||||||||||
| 10/31/2018 | 62.81 | 2.13 | (3.82 | ) | (1.69 | ) | (2.32 | ) | (.79 | ) | (3.11 | ) | 58.01 | (2.88 | ) | 3,723 | .29 | 3.47 | ||||||||||||||||||||||||||||||
| 10/31/20176,10 | 58.52 | 1.66 | 4.27 | 5.93 | (1.64 | ) | — | (1.64 | ) | 62.81 | 10.23 | 8 | 3,085 | .30 | 9 | 3.53 | 9 | |||||||||||||||||||||||||||||||
| Class 529-A: | ||||||||||||||||||||||||||||||||||||||||||||||||
| 10/31/2018 | 62.79 | 1.91 | (3.82 | ) | (1.91 | ) | (2.10 | ) | (.79 | ) | (2.89 | ) | 57.99 | (3.24 | ) | 2,238 | .66 | 3.11 | ||||||||||||||||||||||||||||||
| 10/31/2017 | 57.47 | 2.02 | 5.29 | 7.31 | (1.99 | ) | — | (1.99 | ) | 62.79 | 12.91 | 2,304 | .67 | 3.36 | ||||||||||||||||||||||||||||||||||
| 10/31/2016 | 57.94 | 1.86 | (.36 | ) | 1.50 | (1.97 | ) | — | (1.97 | ) | 57.47 | 2.66 | 2,143 | .69 | 3.25 | |||||||||||||||||||||||||||||||||
| 10/31/2015 | 60.74 | 1.91 | (2.38 | ) | (.47 | ) | (2.33 | ) | — | (2.33 | ) | 57.94 | (.80 | ) | 2,170 | .68 | 3.22 | |||||||||||||||||||||||||||||||
| 10/31/2014 | 58.23 | 2.58 | 2.28 | 4.86 | (2.35 | ) | — | (2.35 | ) | 60.74 | 8.56 | 2,229 | .72 | 4.35 | ||||||||||||||||||||||||||||||||||
See end of table for footnotes.
| Capital Income Builder | 31 |
Financial highlights (continued)
| (Loss) income from investment operations1 | Dividends and distributions | |||||||||||||||||||||||||||||||||||||||||||||||
| Period ended | Net asset value, beginning of period | Net investment income2 | Net (losses) gains on securities (both realized and unrealized) | Total from investment operations | Dividends (from net investment income) | Distributions (from capital gains) | Total dividends and distributions | Net asset value, end of period | Total return3 | Net assets, end of period (in millions) | Ratio of expenses to average net assets2 | Ratio of net income to average net assets2 | ||||||||||||||||||||||||||||||||||||
| Class 529-C: | ||||||||||||||||||||||||||||||||||||||||||||||||
| 10/31/2018 | $ | 62.77 | $ | 1.43 | $ | (3.81 | ) | $ | (2.38 | ) | $ | (1.57 | ) | $ | (.79 | ) | $ | (2.36 | ) | $ | 58.03 | (3.97 | )% | $ | 425 | 1.42 | % | 2.33 | % | |||||||||||||||||||
| 10/31/2017 | 57.44 | 1.56 | 5.29 | 6.85 | (1.52 | ) | — | (1.52 | ) | 62.77 | 12.06 | 687 | 1.44 | 2.59 | ||||||||||||||||||||||||||||||||||
| 10/31/2016 | 57.91 | 1.42 | (.37 | ) | 1.05 | (1.52 | ) | — | (1.52 | ) | 57.44 | 1.86 | 665 | 1.46 | 2.48 | |||||||||||||||||||||||||||||||||
| 10/31/2015 | 60.71 | 1.45 | (2.38 | ) | (.93 | ) | (1.87 | ) | — | (1.87 | ) | 57.91 | (1.55 | ) | 694 | 1.46 | 2.44 | |||||||||||||||||||||||||||||||
| 10/31/2014 | 58.20 | 2.12 | 2.28 | 4.40 | (1.89 | ) | — | (1.89 | ) | 60.71 | 7.71 | 728 | 1.49 | 3.57 | ||||||||||||||||||||||||||||||||||
| Class 529-E: | ||||||||||||||||||||||||||||||||||||||||||||||||
| 10/31/2018 | 62.79 | 1.77 | (3.81 | ) | (2.04 | ) | (1.96 | ) | (.79 | ) | (2.75 | ) | 58.00 | (3.45 | ) | 84 | .88 | 2.88 | ||||||||||||||||||||||||||||||
| 10/31/2017 | 57.47 | 1.88 | 5.29 | 7.17 | (1.85 | ) | — | (1.85 | ) | 62.79 | 12.65 | 95 | .90 | 3.13 | ||||||||||||||||||||||||||||||||||
| 10/31/2016 | 57.94 | 1.73 | (.36 | ) | 1.37 | (1.84 | ) | — | (1.84 | ) | 57.47 | 2.42 | 89 | .92 | 3.02 | |||||||||||||||||||||||||||||||||
| 10/31/2015 | 60.74 | 1.77 | (2.38 | ) | (.61 | ) | (2.19 | ) | — | (2.19 | ) | 57.94 | (1.02 | ) | 91 | .92 | 2.98 | |||||||||||||||||||||||||||||||
| 10/31/2014 | 58.23 | 2.44 | 2.28 | 4.72 | (2.21 | ) | — | (2.21 | ) | 60.74 | 8.28 | 94 | .95 | 4.11 | ||||||||||||||||||||||||||||||||||
| Class 529-T: | ||||||||||||||||||||||||||||||||||||||||||||||||
| 10/31/2018 | 62.82 | 2.04 | (3.81 | ) | (1.77 | ) | (2.24 | ) | (.79 | ) | (3.03 | ) | 58.02 | (3.01 | )4 | — | 5 | .42 | 4 | 3.33 | 4 | |||||||||||||||||||||||||||
| 10/31/20176,7 | 59.80 | 1.24 | 2.83 | 4.07 | (1.05 | ) | — | (1.05 | ) | 62.82 | 6.84 | 4,8 | — | 5 | .42 | 4,9 | 3.55 | 4,9 | ||||||||||||||||||||||||||||||
| Class 529-F-1: | ||||||||||||||||||||||||||||||||||||||||||||||||
| 10/31/2018 | 62.81 | 2.04 | (3.82 | ) | (1.78 | ) | (2.24 | ) | (.79 | ) | (3.03 | ) | 58.00 | (3.03 | ) | 104 | .42 | 3.33 | ||||||||||||||||||||||||||||||
| 10/31/2017 | 57.48 | 2.16 | 5.29 | 7.45 | (2.12 | ) | — | (2.12 | ) | 62.81 | 13.17 | 93 | .44 | 3.58 | ||||||||||||||||||||||||||||||||||
| 10/31/2016 | 57.96 | 1.99 | (.37 | ) | 1.62 | (2.10 | ) | — | (2.10 | ) | 57.48 | 2.87 | 75 | .46 | 3.47 | |||||||||||||||||||||||||||||||||
| 10/31/2015 | 60.76 | 2.05 | (2.38 | ) | (.33 | ) | (2.47 | ) | — | (2.47 | ) | 57.96 | (.55 | ) | 69 | .46 | 3.44 | |||||||||||||||||||||||||||||||
| 10/31/2014 | 58.25 | 2.72 | 2.27 | 4.99 | (2.48 | ) | — | (2.48 | ) | 60.76 | 8.78 | 70 | .49 | 4.58 | ||||||||||||||||||||||||||||||||||
| Class R-1: | ||||||||||||||||||||||||||||||||||||||||||||||||
| 10/31/2018 | 62.80 | 1.45 | (3.82 | ) | (2.37 | ) | (1.64 | ) | (.79 | ) | (2.43 | ) | 58.00 | (3.94 | ) | 101 | 1.39 | 2.36 | ||||||||||||||||||||||||||||||
| 10/31/2017 | 57.46 | 1.58 | 5.30 | 6.88 | (1.54 | ) | — | (1.54 | ) | 62.80 | 12.10 | 123 | 1.39 | 2.63 | ||||||||||||||||||||||||||||||||||
| 10/31/2016 | 57.94 | 1.46 | (.38 | ) | 1.08 | (1.56 | ) | — | (1.56 | ) | 57.46 | 1.91 | 134 | 1.40 | 2.54 | |||||||||||||||||||||||||||||||||
| 10/31/2015 | 60.73 | 1.49 | (2.37 | ) | (.88 | ) | (1.91 | ) | — | (1.91 | ) | 57.94 | (1.48 | ) | 146 | 1.39 | 2.51 | |||||||||||||||||||||||||||||||
| 10/31/2014 | 58.22 | 2.16 | 2.27 | 4.43 | (1.92 | ) | — | (1.92 | ) | 60.73 | 7.79 | 152 | 1.42 | 3.64 | ||||||||||||||||||||||||||||||||||
| Class R-2: | ||||||||||||||||||||||||||||||||||||||||||||||||
| 10/31/2018 | 62.79 | 1.46 | (3.82 | ) | (2.36 | ) | (1.64 | ) | (.79 | ) | (2.43 | ) | 58.00 | (3.93 | ) | 487 | 1.39 | 2.37 | ||||||||||||||||||||||||||||||
| 10/31/2017 | 57.46 | 1.59 | 5.28 | 6.87 | (1.54 | ) | — | (1.54 | ) | 62.79 | 12.10 | 586 | 1.39 | 2.64 | ||||||||||||||||||||||||||||||||||
| 10/31/2016 | 57.94 | 1.45 | (.37 | ) | 1.08 | (1.56 | ) | — | (1.56 | ) | 57.46 | 1.92 | 628 | 1.40 | 2.54 | |||||||||||||||||||||||||||||||||
| 10/31/2015 | 60.73 | 1.51 | (2.37 | ) | (.86 | ) | (1.93 | ) | — | (1.93 | ) | 57.94 | (1.44 | ) | 680 | 1.35 | 2.54 | |||||||||||||||||||||||||||||||
| 10/31/2014 | 58.22 | 2.18 | 2.27 | 4.45 | (1.94 | ) | — | (1.94 | ) | 60.73 | 7.79 | 751 | 1.41 | 3.67 | ||||||||||||||||||||||||||||||||||
| Class R-2E: | ||||||||||||||||||||||||||||||||||||||||||||||||
| 10/31/2018 | 62.58 | 1.63 | (3.80 | ) | (2.17 | ) | (1.85 | ) | (.79 | ) | (2.64 | ) | 57.77 | (3.66 | ) | 40 | 1.09 | 2.67 | ||||||||||||||||||||||||||||||
| 10/31/2017 | 57.30 | 1.72 | 5.32 | 7.04 | (1.76 | ) | — | (1.76 | ) | 62.58 | 12.44 | 33 | 1.08 | 2.86 | ||||||||||||||||||||||||||||||||||
| 10/31/2016 | 57.88 | 1.60 | (.33 | ) | 1.27 | (1.85 | ) | — | (1.85 | ) | 57.30 | 2.27 | 12 | 1.11 | 2.80 | |||||||||||||||||||||||||||||||||
| 10/31/2015 | 60.71 | 1.75 | (2.41 | ) | (.66 | ) | (2.17 | ) | — | (2.17 | ) | 57.88 | (1.12 | ) | — | 5 | 1.00 | 2.93 | ||||||||||||||||||||||||||||||
| 10/31/20146,11 | 61.50 | .16 | (.41 | ) | (.25 | ) | (.54 | ) | — | (.54 | ) | 60.71 | (.39 | )4,8 | — | 5 | .15 | 4,8 | .28 | 4,8 | ||||||||||||||||||||||||||||
| 32 | Capital Income Builder |
| (Loss) income from investment operations1 | Dividends and distributions | |||||||||||||||||||||||||||||||||||||||||||||||
| Period ended | Net asset value, beginning of period | Net investment income2 | Net (losses) gains on securities (both realized and unrealized) | Total from investment operations | Dividends (from net investment income) | Distributions (from capital gains) | Total dividends and distributions | Net asset value, end of period | Total return3 | Net assets, end of period (in millions) | Ratio of expenses to average net assets2 | Ratio of net income to average net assets2 | ||||||||||||||||||||||||||||||||||||
| Class R-3: | ||||||||||||||||||||||||||||||||||||||||||||||||
| 10/31/2018 | $ | 62.80 | $ | 1.73 | $ | (3.82 | ) | $ | (2.09 | ) | $ | (1.92 | ) | $ | (.79 | ) | $ | (2.71 | ) | $ | 58.00 | (3.52 | )% | $ | 858 | .94 | % | 2.82 | % | |||||||||||||||||||
| 10/31/2017 | 57.47 | 1.86 | 5.29 | 7.15 | (1.82 | ) | — | (1.82 | ) | 62.80 | 12.61 | 1,026 | .94 | 3.08 | ||||||||||||||||||||||||||||||||||
| 10/31/2016 | 57.95 | 1.70 | (.37 | ) | 1.33 | (1.81 | ) | — | (1.81 | ) | 57.47 | 2.37 | 993 | .96 | 2.97 | |||||||||||||||||||||||||||||||||
| 10/31/2015 | 60.74 | 1.76 | (2.38 | ) | (.62 | ) | (2.17 | ) | — | (2.17 | ) | 57.95 | (1.04 | ) | 994 | .94 | 2.95 | |||||||||||||||||||||||||||||||
| 10/31/2014 | 58.23 | 2.42 | 2.28 | 4.70 | (2.19 | ) | — | (2.19 | ) | 60.74 | 8.26 | 1,049 | .98 | 4.08 | ||||||||||||||||||||||||||||||||||
| Class R-4: | ||||||||||||||||||||||||||||||||||||||||||||||||
| 10/31/2018 | 62.79 | 1.91 | (3.81 | ) | (1.90 | ) | (2.11 | ) | (.79 | ) | (2.90 | ) | 57.99 | (3.22 | ) | 732 | .64 | 3.12 | ||||||||||||||||||||||||||||||
| 10/31/2017 | 57.46 | 2.04 | 5.29 | 7.33 | (2.00 | ) | — | (2.00 | ) | 62.79 | 12.94 | 838 | .64 | 3.38 | ||||||||||||||||||||||||||||||||||
| 10/31/2016 | 57.95 | 1.86 | (.35 | ) | 1.51 | (2.00 | ) | — | (2.00 | ) | 57.46 | 2.68 | 751 | .65 | 3.24 | |||||||||||||||||||||||||||||||||
| 10/31/2015 | 60.75 | 1.94 | (2.38 | ) | (.44 | ) | (2.36 | ) | — | (2.36 | ) | 57.95 | (.74 | ) | 603 | .64 | 3.25 | |||||||||||||||||||||||||||||||
| 10/31/2014 | 58.24 | 2.60 | 2.28 | 4.88 | (2.37 | ) | — | (2.37 | ) | 60.75 | 8.58 | 582 | .67 | 4.38 | ||||||||||||||||||||||||||||||||||
| Class R-5E: | ||||||||||||||||||||||||||||||||||||||||||||||||
| 10/31/2018 | 62.75 | 2.03 | (3.81 | ) | (1.78 | ) | (2.24 | ) | (.79 | ) | (3.03 | ) | 57.94 | (3.04 | ) | 20 | .44 | 3.32 | ||||||||||||||||||||||||||||||
| 10/31/2017 | 57.45 | 2.18 | 5.27 | 7.45 | (2.15 | ) | — | (2.15 | ) | 62.75 | 13.18 | 11 | .43 | 3.60 | ||||||||||||||||||||||||||||||||||
| 10/31/20166,12 | 57.40 | 1.84 | .30 | 2.14 | (2.09 | ) | — | (2.09 | ) | 57.45 | 3.82 | 8 | — | 5 | .52 | 9 | 3.40 | 9 | ||||||||||||||||||||||||||||||
| Class R-5: | ||||||||||||||||||||||||||||||||||||||||||||||||
| 10/31/2018 | 62.84 | 2.10 | (3.82 | ) | (1.72 | ) | (2.29 | ) | (.79 | ) | (3.08 | ) | 58.04 | (2.93 | ) | 214 | .34 | 3.42 | ||||||||||||||||||||||||||||||
| 10/31/2017 | 57.50 | 2.22 | 5.30 | 7.52 | (2.18 | ) | — | (2.18 | ) | 62.84 | 13.29 | 242 | .34 | 3.69 | ||||||||||||||||||||||||||||||||||
| 10/31/2016 | 57.98 | 2.11 | (.44 | ) | 1.67 | (2.15 | ) | — | (2.15 | ) | 57.50 | 2.98 | 208 | .37 | 3.68 | |||||||||||||||||||||||||||||||||
| 10/31/2015 | 60.79 | 2.12 | (2.40 | ) | (.28 | ) | (2.53 | ) | — | (2.53 | ) | 57.98 | (.45 | ) | 394 | .34 | 3.56 | |||||||||||||||||||||||||||||||
| 10/31/2014 | 58.27 | 2.88 | 2.19 | 5.07 | (2.55 | ) | — | (2.55 | ) | 60.79 | 8.92 | 381 | .38 | 4.85 | ||||||||||||||||||||||||||||||||||
| Class R-6: | ||||||||||||||||||||||||||||||||||||||||||||||||
| 10/31/2018 | 62.82 | 2.13 | (3.82 | ) | (1.69 | ) | (2.33 | ) | (.79 | ) | (3.12 | ) | 58.01 | (2.88 | ) | 9,528 | .29 | 3.48 | ||||||||||||||||||||||||||||||
| 10/31/2017 | 57.49 | 2.24 | 5.30 | 7.54 | (2.21 | ) | — | (2.21 | ) | 62.82 | 13.33 | 8,249 | .30 | 3.72 | ||||||||||||||||||||||||||||||||||
| 10/31/2016 | 57.97 | 2.08 | (.37 | ) | 1.71 | (2.19 | ) | — | (2.19 | ) | 57.49 | 3.05 | 6,806 | .30 | 3.62 | |||||||||||||||||||||||||||||||||
| 10/31/2015 | 60.77 | 2.14 | (2.38 | ) | (.24 | ) | (2.56 | ) | — | (2.56 | ) | 57.97 | (.40 | ) | 5,222 | .30 | 3.60 | |||||||||||||||||||||||||||||||
| 10/31/2014 | 58.26 | 2.76 | 2.33 | 5.09 | (2.58 | ) | — | (2.58 | ) | 60.77 | 8.95 | 4,577 | .32 | 4.66 | ||||||||||||||||||||||||||||||||||
| Year ended October 31 | ||||||||||||||||||||
| Portfolio turnover rate for all share classes13 | 2018 | 2017 | 2016 | 2015 | 2014 | |||||||||||||||
| Excluding mortgage dollar roll transactions | 37 | % | 51 | % | 38 | % | 50 | % | Not available | |||||||||||
| Including mortgage dollar roll transactions | 73 | % | 73 | % | 47 | % | 63 | % | 55 | % | ||||||||||
| 1 | Based on average shares outstanding. |
| 2 | For the year ended October 31, 2014, this column reflects the impact of a corporate action event that resulted in a one-time increase to net investment income. If the corporate action event had not occurred, the Class A net investment income per share would have been lower by $.68; the Class A ratio of expenses to average net assets would have been lower by .03 percentage points; and the Class A ratio of net income to average net assets would have been lower by 1.15 percentage points. The impact to the other share classes would have been similar. |
| 3 | Total returns exclude any applicable sales charges, including contingent deferred sales charges. |
| 4 | All or a significant portion of assets in this class consisted of seed capital invested by CRMC and/or its affiliates. Fees for distribution services are not charged or accrued on these seed capital assets. If such fees were paid by the fund on seed capital assets, fund expenses would have been higher and net income and total return would have been lower. |
| 5 | Amount less than $1 million. |
| 6 | Based on operations for a period that is less than a full year. |
| 7 | Class T and 529-T shares began investment operations on April 7, 2017. |
| 8 | Not annualized. |
| 9 | Annualized. |
| 10 | Class F-3 shares began investment operations on January 27, 2017. |
| 11 | Class R-2E shares began investment operations on August 29, 2014. |
| 12 | Class R-5E shares began investment operations on November 20, 2015. |
| 13 | Refer to Note 5 for more information on mortgage dollar rolls. |
See notes to financial statements
| Capital Income Builder | 33 |
Report of Independent Registered Public Accounting Firm
To the Board of Trustees and Shareholders of Capital Income Builder
Opinion on the Financial Statements
We have audited the accompanying statement of assets and liabilities, including the summary investment portfolio, of Capital Income Builder (the “Fund”) as of October 31, 2018, the related statement of operations for the year ended October 31, 2018, the statement of changes in net assets for each of the two years in the period ended October 31, 2018, including the related notes, and the financial highlights for each of the periods indicated therein (collectively referred to as the “financial statements”). In our opinion, the financial statements present fairly, in all material respects, the financial position of the Fund as of October 31, 2018, the results of its operations for the year then ended, the changes in its net assets for each of the two years in the period ended October 31, 2018 and the financial highlights for each of the periods indicated therein in conformity with accounting principles generally accepted in the United States of America.
Basis for Opinion
These financial statements are the responsibility of the Fund’s management. Our responsibility is to express an opinion on the Fund’s financial statements based on our audits. We are a public accounting firm registered with the Public Company Accounting Oversight Board (United States) (“PCAOB”) and are required to be independent with respect to the Fund in accordance with the U.S. federal securities laws and the applicable rules and regulations of the Securities and Exchange Commission and the PCAOB.
We conducted our audits of these financial statements in accordance with the standards of the PCAOB. Those standards require that we plan and perform the audit to obtain reasonable assurance about whether the financial statements are free of material misstatement, whether due to error or fraud.
Our audits included performing procedures to assess the risks of material misstatement of the financial statements, whether due to error or fraud, and performing procedures that respond to those risks. Such procedures included examining, on a test basis, evidence regarding the amounts and disclosures in the financial statements. Our audits also included evaluating the accounting principles used and significant estimates made by management, as well as evaluating the overall presentation of the financial statements. Our procedures included confirmation of securities owned as of October 31, 2018 by correspondence with the custodian and brokers; when replies were not received from brokers, we performed other auditing procedures. We believe that our audits provide a reasonable basis for our opinion.
/s/ PricewaterhouseCoopers LLP
Los Angeles, California
December 10, 2018
We have served as the auditor of one or more investment companies in The Capital Group Companies Investment Company Complex since 1934.
| 34 | Capital Income Builder |
| Expense example | unaudited |
As a fund shareholder, you incur two types of costs: (1) transaction costs, such as initial sales charges on purchase payments and contingent deferred sales charges on redemptions (loads), and (2) ongoing costs, including management fees, distribution and service (12b-1) fees, and other expenses. This example is intended to help you understand your ongoing costs (in dollars) of investing in the fund so you can compare these costs with the ongoing costs of investing in other mutual funds. The example is based on an investment of $1,000 invested at the beginning of the period and held for the entire six-month period (May 1, 2018, through October 31, 2018).
Actual expenses:
The first line of each share class in the table on the following page provides information about actual account values and actual expenses. You may use the information in this line, together with the amount you invested, to estimate the expenses that you paid over the period. Simply divide your account value by $1,000 (for example, an $8,600 account value divided by $1,000 = 8.6), then multiply the result by the number in the first line under the heading titled “Expenses paid during period” to estimate the expenses you paid on your account during this period.
Hypothetical example for comparison purposes:
The second line of each share class in the table on the following page provides information about hypothetical account values and hypothetical expenses based on the actual expense ratio for the share class and an assumed rate of return of 5.00% per year before expenses, which is not the actual return of the share class. The hypothetical account values and expenses may not be used to estimate the actual ending account balance or expenses you paid for the period. You may use this information to compare the ongoing costs of investing in the fund and other funds. To do so, compare this 5.00% hypothetical example with the 5.00% hypothetical examples that appear in the shareholder reports of the other funds.
Notes:
Retirement plan participants may be subject to certain fees charged by the plan sponsor, and Class F-1, F-2, F-3 and 529-F-1 shareholders may be subject to fees charged by financial intermediaries, typically ranging from 0.75% to 1.50% of assets annually depending on services offered. You can estimate the impact of these fees by adding the amount of the fees to the total estimated expenses you paid on your account during the period as calculated above. In addition, your ending account value would be lower by the amount of these fees.
Note that the expenses shown in the table on the following page are meant to highlight your ongoing costs only and do not reflect any transactional costs, such as sales charges (loads). Therefore, the second line of each share class in the table is useful in comparing ongoing costs only and will not help you determine the relative total costs of owning different funds. In addition, if these transactional costs were included, your costs would have been higher.
| Capital Income Builder | 35 |
| Beginning account value 5/1/2018 | Ending account value 10/31/2018 | Expenses paid during period* | Annualized expense ratio | |||||||||||||
| Class A – actual return | $ | 1,000.00 | $ | 970.86 | $ | 2.88 | .58 | % | ||||||||
| Class A – assumed 5% return | 1,000.00 | 1,022.28 | 2.96 | .58 | ||||||||||||
| Class C – actual return | 1,000.00 | 967.04 | 6.79 | 1.37 | ||||||||||||
| Class C – assumed 5% return | 1,000.00 | 1,018.30 | 6.97 | 1.37 | ||||||||||||
| Class T – actual return | 1,000.00 | 972.07 | 1.79 | .36 | ||||||||||||
| Class T – assumed 5% return | 1,000.00 | 1,023.39 | 1.84 | .36 | ||||||||||||
| Class F-1 – actual return | 1,000.00 | 970.46 | 3.28 | .66 | ||||||||||||
| Class F-1 – assumed 5% return | 1,000.00 | 1,021.88 | 3.36 | .66 | ||||||||||||
| Class F-2 – actual return | 1,000.00 | 971.75 | 1.94 | .39 | ||||||||||||
| Class F-2 – assumed 5% return | 1,000.00 | 1,023.24 | 1.99 | .39 | ||||||||||||
| Class F-3 – actual return | 1,000.00 | 972.42 | 1.44 | .29 | ||||||||||||
| Class F-3 – assumed 5% return | 1,000.00 | 1,023.74 | 1.48 | .29 | ||||||||||||
| Class 529-A – actual return | 1,000.00 | 970.58 | 3.28 | .66 | ||||||||||||
| Class 529-A – assumed 5% return | 1,000.00 | 1,021.88 | 3.36 | .66 | ||||||||||||
| Class 529-C – actual return | 1,000.00 | 966.95 | 6.99 | 1.41 | ||||||||||||
| Class 529-C – assumed 5% return | 1,000.00 | 1,018.10 | 7.17 | 1.41 | ||||||||||||
| Class 529-E – actual return | 1,000.00 | 969.47 | 4.37 | .88 | ||||||||||||
| Class 529-E – assumed 5% return | 1,000.00 | 1,020.77 | 4.48 | .88 | ||||||||||||
| Class 529-T – actual return | 1,000.00 | 971.54 | 2.09 | .42 | ||||||||||||
| Class 529-T – assumed 5% return | 1,000.00 | 1,023.09 | 2.14 | .42 | ||||||||||||
| Class 529-F-1 – actual return | 1,000.00 | 971.62 | 2.09 | .42 | ||||||||||||
| Class 529-F-1 – assumed 5% return | 1,000.00 | 1,023.09 | 2.14 | .42 | ||||||||||||
| Class R-1 – actual return | 1,000.00 | 967.03 | 6.89 | 1.39 | ||||||||||||
| Class R-1 – assumed 5% return | 1,000.00 | 1,018.20 | 7.07 | 1.39 | ||||||||||||
| Class R-2 – actual return | 1,000.00 | 967.03 | 6.84 | 1.38 | ||||||||||||
| Class R-2 – assumed 5% return | 1,000.00 | 1,018.25 | 7.02 | 1.38 | ||||||||||||
| Class R-2E – actual return | 1,000.00 | 968.40 | 5.36 | 1.08 | ||||||||||||
| Class R-2E – assumed 5% return | 1,000.00 | 1,019.76 | 5.50 | 1.08 | ||||||||||||
| Class R-3 – actual return | 1,000.00 | 969.24 | 4.67 | .94 | ||||||||||||
| Class R-3 – assumed 5% return | 1,000.00 | 1,020.47 | 4.79 | .94 | ||||||||||||
| Class R-4 – actual return | 1,000.00 | 970.69 | 3.18 | .64 | ||||||||||||
| Class R-4 – assumed 5% return | 1,000.00 | 1,021.98 | 3.26 | .64 | ||||||||||||
| Class R-5E – actual return | 1,000.00 | 971.54 | 2.14 | .43 | ||||||||||||
| Class R-5E – assumed 5% return | 1,000.00 | 1,023.04 | 2.19 | .43 | ||||||||||||
| Class R-5 – actual return | 1,000.00 | 972.17 | 1.69 | .34 | ||||||||||||
| Class R-5 – assumed 5% return | 1,000.00 | 1,023.49 | 1.73 | .34 | ||||||||||||
| Class R-6 – actual return | 1,000.00 | 972.42 | 1.44 | .29 | ||||||||||||
| Class R-6 – assumed 5% return | 1,000.00 | 1,023.74 | 1.48 | .29 | ||||||||||||
| * | The “expenses paid during period” are equal to the “annualized expense ratio,” multiplied by the average account value over the period, multiplied by the number of days in the period, and divided by 365 (to reflect the one-half year period). |
| Tax information | unaudited |
We are required to advise you of the federal tax status of certain distributions received by shareholders during the fiscal year. The fund hereby designates the following amounts for the fund’s fiscal year ended October 31, 2018:
| Long-term capital gains | $ | 1,351,064,000 | ||
| Qualified dividend income | $ | 3,393,753,000 | ||
| Corporate dividends received deduction | $ | 1,303,329,000 | ||
| U.S. government income that may be exempt from state taxation | $ | 515,710,000 |
Individual shareholders should refer to their Form 1099 or other tax information, which will be mailed in January 2019, to determine the calendar year amounts to be included on their 2018 tax returns. Shareholders should consult their tax advisors.
| 36 | Capital Income Builder |
This page was intentionally left blank.
| Capital Income Builder | 37 |
This page was intentionally left blank.
| 38 | Capital Income Builder |
This page was intentionally left blank.
| Capital Income Builder | 39 |
Approval of Investment Advisory and Service Agreement
Capital Income Builder’s board has approved the fund’s Investment Advisory and Service Agreement (the “agreement”) with Capital Research and Management Company (“CRMC”) for an additional one-year term through October 31, 2019. The board approved the agreement following the recommendation of the fund’s Contracts Committee (the “committee”), which is composed of all of the fund’s independent board members. The board and the committee determined in the exercise of their business judgment that the fund’s advisory fee structure was fair and reasonable in relation to the services provided, and that approving the agreement was in the best interests of the fund and its shareholders.
In reaching this decision, the board and the committee took into account information furnished to them throughout the year and otherwise provided to them, as well as information prepared specifically in connection with their review of the agreement, and were advised by their independent counsel. They considered the following factors, among others, but did not identify any single issue or particular piece of information that, in isolation, was the controlling factor, and each board and committee member did not necessarily attribute the same weight to each factor.
1. Nature, extent and quality of services
The board and the committee considered the depth and quality of CRMC’s investment management process, including its global research capabilities; the experience, capability and integrity of its senior management and other personnel; the low turnover rates of its key personnel; the overall financial strength and stability of CRMC and the Capital Group organization; the resources and systems CRMC devotes to investment management, compliance, trading, portfolio accounting and other services; and the ongoing evolution of CRMC’s organizational structure designed to maintain and strengthen these qualities. The board and the committee also considered the nature, extent and quality of administrative, compliance and shareholder services provided by CRMC to the fund under the agreement and other agreements, as well as the benefits to fund shareholders from investing in a fund that is part of a large family of funds. The board and the committee concluded that the nature, extent and quality of the services provided by CRMC have benefited and should continue to benefit the fund and its shareholders.
2. Investment results
The board and the committee considered the investment results of the fund in light of its primary objectives of providing a level of current income that exceeds the average yield on U.S. stocks generally and a growing stream of income over the years and its secondary objective of providing growth of capital. They compared the fund’s investment results with those of other relevant funds (including funds that currently form the basis of the Lipper index for the category in which the fund is included), and data such as relevant market and fund indexes, over various periods through March 31, 2018. This report, including the letter to shareholders and related disclosures, contains certain information about the fund’s investment results. The board and the committee reviewed the fund’s investment results measured against various indexes, including the MSCI ACWI (All Country World Index), the Bloomberg Barclays U.S. Aggregate Index, the 70%/30% MSCI ACWI/Bloomberg Barclays Index and the Lipper Global Equity Income Funds Average. They reviewed the results for the one-year, three-year, five-year, 10-year, 20-year and lifetime periods, placing greater emphasis on longer term periods. They noted that the investment results of the fund compared favorably with the results of these indexes/average for the longer term periods (where data comparisons are available) and were mixed for shorter periods, while recognizing that none of the indexes/average is a perfect comparison given the fund’s distinguishing characteristics. The board and the committee concluded that the fund’s investment results have been satisfactory for renewal of the agreement, and that CRMC’s record in managing the fund indicated that its continued management should benefit the fund and its shareholders.
3. Advisory fees and total expenses
The board and the committee compared the advisory fees and total expense levels of the fund to those of other relevant funds. They observed that the fund’s advisory fees and expenses generally compared favorably to those of other similar funds included in the Lipper Income Funds category. The board and the committee also considered
| 40 | Capital Income Builder |
the breakpoint discounts in the fund’s advisory fee structure that reduce the level of fees charged by CRMC to the fund as fund assets increase. In addition, they reviewed information regarding the effective advisory fees charged to non-mutual fund clients by CRMC and its affiliates. They noted that, to the extent there were differences between the advisory fees paid by the fund and the advisory fees paid by those clients, the differences appropriately reflected the investment, operational, regulatory and market differences between advising the fund and the other clients. The board and the committee concluded that the fund’s cost structure was fair and reasonable in relation to the services provided, and that the fund’s shareholders receive reasonable value in return for the advisory fees and other amounts paid to CRMC by the fund.
4. Ancillary benefits
The board and the committee considered a variety of other benefits that CRMC and its affiliates receive as a result of CRMC’s relationship with the fund and other American Funds, including fees for administrative services provided to certain share classes; fees paid to CRMC’s affiliated transfer agent; sales charges and distribution fees received and retained by the fund’s principal underwriter, an affiliate of CRMC; and possible ancillary benefits to CRMC and its institutional management affiliates in managing other investment vehicles. The board and the committee reviewed CRMC’s portfolio trading practices, noting the benefits CRMC receives from the research obtained with commissions from portfolio transactions made on behalf of the fund. The board and the committee took these ancillary benefits into account in evaluating the reasonableness of the advisory fees and other amounts paid to CRMC by the fund.
5. Adviser financial information
The board and the committee reviewed information regarding CRMC’s costs of providing services to the American Funds, including personnel, systems and resources of investment, compliance, trading, accounting and other administrative operations. They considered CRMC’s costs and related cost allocation methodology as well as its willingness to invest in technology, infrastructure and staff to maintain and expand services and capabilities, respond to industry and regulatory developments, and attract and retain qualified personnel. They noted information regarding the compensation structure for CRMC’s investment professionals. They reviewed information on the profitability of the investment adviser and its affiliates. The board and the committee also compared CRMC’s profitability and compensation data to the reported results and data of several large, publicly held investment management companies. The board and the committee noted the competitiveness and cyclicality of both the mutual fund industry and the capital markets, and the importance in that environment of CRMC’s long-term profitability for maintaining its independence, company culture and management continuity. They further considered the breakpoint discounts in the fund’s advisory fee structure and CRMC’s sharing of any economies of scale, or efficiencies, through breakpoints and other fee reductions and costs voluntarily absorbed. The board and the committee concluded that the fund’s advisory fee structure reflected a reasonable sharing of benefits between CRMC and the fund’s shareholders.
| Capital Income Builder | 41 |
Board of trustees and other officers
Independent trustees1
| Name and year of birth | Year first elected a trustee of the fund2 |
Principal occupation(s) during past five years | Number of portfolios in fund complex overseen by trustee3 |
Other directorships4 held by trustee | ||||
| Joseph C. Berenato, 1946 Chairman of the Board (Independent and Non-Executive) |
2005 | Former Chairman and CEO, Ducommun Incorporated (aerospace components manufacturer) | 16 | None | ||||
| Mary Anne Dolan, 1947 | 2010 | Founder and President, MAD Ink (communications company); former Editor-in-Chief, The Los Angeles Herald Examiner (retired 1989) | 10 | None | ||||
| John G. Freund, 1953 | 2016 | Founder and Managing Director, Skyline Ventures (a venture capital investor in health care companies) | 6 | Collegium Pharmaceutical, Inc.; Proteon Therapeutics, Inc.; SI-Bone, Inc.; Sutro Biopharma, Inc.; Tetraphase Pharmaceuticals, Inc. | ||||
| Pedro J. Greer Jr., 1956 | 2016 | Physician; Chairman of the Board and Associate Dean, Florida International University | 3 | None | ||||
| R. Clark Hooper, 1946 | 2010 | Private investor | 81 | None | ||||
| Merit E. Janow, 1958 | 2001 | Dean and Professor, Columbia University, School of International and Public Affairs | 80 | MasterCard Incorporated; Trimble Inc. | ||||
| Leonade D. Jones, 1947 | 2010 | Retired; former Treasurer, The Washington Post Company (retired 1996) | 10 | None | ||||
| Earl Lewis Jr., PhD, 1955 | 2017 | Former President, The Andrew W. Mellon Foundation; former Executive Vice President, Provost, Emory University | 3 | 2U, Inc. | ||||
| Christopher E. Stone, 1956 | 2009 | Former President, Open Society Foundations | 6 | None |
Interested trustees5,6
| Name, year of birth and position with fund |
Year first elected a trustee or officer of the fund2 |
Principal occupation(s) during past five years and positions held with affiliated entities or the principal underwriter of the fund |
Number of portfolios in fund complex overseen by trustee3 |
Other directorships4 held by trustee | ||||
| James B. Lovelace, 1956 Co-President |
1992 | Partner — Capital Research Global Investors, Capital Research and Management Company; Director, Capital Research and Management Company | 2 | None | ||||
| Joyce E. Gordon, 1956 Senior Vice President |
1996 | Partner — Capital Research Global Investors, Capital Research and Management Company; Director, Capital Research and Management Company | 2 | None |
The fund’s statement of additional information includes further details about fund trustees and is available without charge upon request by calling American Funds Service Company at (800) 421-4225 or by visiting the American Funds website at americanfunds.com. The address for all trustees and officers of the fund is 333 South Hope Street, Los Angeles, CA 90071, Attention: Secretary.
See page 43 for footnotes.
| 42 | Capital Income Builder |
Other officers6
| Name, year of birth and position with fund |
Year first elected an officer of the fund2 |
Principal occupation(s) during past five years and positions held with affiliated entities or the principal underwriter of the fund | ||
| David A. Hoag, 1965 Co-President |
2006 | Partner — Capital Fixed Income Investors, Capital Research and Management Company; Partner — Capital Fixed Income Investors, Capital Bank and Trust Company;7 | ||
| Steven T. Watson, 1955 Co-President |
2017 | Partner — Capital International Investors, Capital International, Inc.7 | ||
| Donald H. Rolfe, 1972 Executive Vice President |
2008 | Senior Vice President and Senior Counsel — Fund Business Management Group, Capital Research and Management Company; Secretary, Capital Research and Management Company | ||
| Winnie Kwan, 1972 Senior Vice President |
2017 | Partner — Capital Research Global Investors, Capital International, Inc.7 | ||
| David M. Riley, 1967 Senior Vice President |
2006 | Partner — Capital Research Global Investors, Capital Research and Management Company; Director, Capital Strategy Research, Inc.7 | ||
| Bradley J. Vogt, 1965 Senior Vice President |
2010 | Chairman, Capital Research Company;7 Partner — Capital Research Global Investors, Capital Research and Management Company; Director, The Capital Group Companies, Inc.7 | ||
| Grant L. Cambridge, 1962 Vice President |
2014 | Partner — Capital Research Global Investors, Capital Research and Management Company | ||
| M. Taylor Hinshaw, 1973 Vice President |
2010 | Partner — Capital Research Global Investors, Capital Research and Management Company | ||
| Caroline Randall, 1974 Vice President |
2015 | Partner — Capital Research Global Investors, Capital Research Company7 Director, The Capital Group Companies, Inc.7 | ||
| Michael W. Stockton, 1967 Secretary |
2013 | Vice President — Fund Business Management Group, Capital Research and Management Company | ||
| Gregory F. Niland, 1971 Treasurer |
2016 | Vice President — Investment Operations, Capital Research and Management Company | ||
| Jennifer L. Butler, 1966 Assistant Secretary |
2013 | Assistant Vice President — Fund Business Management Group, Capital Research and Management Company | ||
| Brian C. Janssen, 1972 Assistant Treasurer |
2016 | Vice President — Investment Operations, Capital Research and Management Company | ||
| Dori Laskin, 1951 Assistant Treasurer |
2010 | Vice President — Investment Operations, Capital Research and Management Company |
| 1 | The term independent trustee refers to a trustee who is not an “interested person” of the fund within the meaning of the Investment Company Act of 1940. |
| 2 | Trustees and officers of the fund serve until their resignation, removal or retirement. |
| 3 | Funds managed by Capital Research and Management Company or its affiliates. |
| 4 | This includes all directorships/trusteeships (other than those in the American Funds or other funds managed by Capital Research and Management Company or its affiliates) that are held by each trustee as a trustee or director of a public company or a registered investment company. |
| 5 | The term interested trustee refers to a trustee who is an “interested person” within the meaning of the Investment Company Act of 1940, on the basis of their affiliation with the fund’s investment adviser, Capital Research and Management Company, or affiliated entities (including the fund’s principal underwriter). |
| 6 | All of the trustees and/or officers listed, with the exception of Grant L. Cambridge, M. Taylor Hinshaw and Caroline Randall, are officers and/or directors/trustees of one or more of the other funds for which Capital Research and Management Company serves as investment adviser. |
| 7 | Company affiliated with Capital Research and Management Company. |
| Capital Income Builder | 43 |
Board of trustees and other officers (continued)
Results of special meeting of shareholders
held November 28, 2018
Shares outstanding on August 31, 2018 (record date):
1,727,172,722 (all classes)
Total shares voting on November 28, 2018:
1,563,778,672 (90.5% of shares outstanding)
The Proposal: To elect board members:
| Votes for | Percent of shares voting for | Votes withheld | Percent of shares withheld | |||||||||||||
| Joseph C. Berenato | 1,525,947,775 | 97.6 | % | 37,830,897 | 2.4 | % | ||||||||||
| Mary Anne Dolan | 1,528,980,001 | 97.8 | 34,798,671 | 2.2 | ||||||||||||
| John G. Freund | 1,527,114,902 | 97.7 | 36,663,770 | 2.3 | ||||||||||||
| Pedro J. Greer, Jr. | 1,528,002,757 | 97.7 | 35,775,915 | 2.3 | ||||||||||||
| R. Clark Hooper | 1,526,554,795 | 97.6 | 37,223,877 | 2.4 | ||||||||||||
| Merit E. Janow | 1,528,076,374 | 97.7 | 35,702,298 | 2.3 | ||||||||||||
| Leonade D. Jones | 1,527,262,276 | 97.7 | 36,516,396 | 2.3 | ||||||||||||
| Winnie Kwan | 1,530,099,657 | 97.8 | 33,679,016 | 2.2 | ||||||||||||
| Sung Lee | 1,528,995,076 | 97.8 | 34,783,596 | 2.2 | ||||||||||||
| Earl Lewis, Jr. | 1,529,377,438 | 97.8 | 34,401,234 | 2.2 | ||||||||||||
| Christopher E. Stone | 1,529,166,426 | 97.8 | 34,612,246 | 2.2 | ||||||||||||
| 44 | Capital Income Builder |
Office of the fund and of the investment adviser
Capital Research and Management Company
333 South Hope Street
Los Angeles, CA 90071-1406
6455 Irvine Center Drive
Irvine, CA 92618-4518
Transfer agent for shareholder accounts
American Funds Service Company
(Write to the address near you.)
P.O. Box 6007
Indianapolis, IN 46206-6007
P.O. Box 2280
Norfolk, VA 23501-2280
Custodian of assets
JPMorgan Chase Bank
270 Park Avenue
New York, NY 10017-2070
Counsel
O’Melveny & Myers LLP
400 South Hope Street
Los Angeles, CA 90071-2899
Independent registered public accounting firm
PricewaterhouseCoopers LLP
601 South Figueroa Street
Los Angeles, CA 90017-3874
Principal underwriter
American Funds Distributors, Inc.
333 South Hope Street
Los Angeles, CA 90071-1406
Investors should carefully consider investment objectives, risks, charges and expenses. This and other important information is contained in the fund prospectus and summary prospectus, which can be obtained from your financial professional and should be read carefully before investing. You may also call American Funds Service Company (AFS) at (800) 421-4225 or visit the American Funds website at americanfunds.com. Fund shares offered through American Funds Distributors, Inc.
“American Funds Proxy Voting Procedures and Principles” — which describes how we vote proxies relating to portfolio securities — is available on the American Funds website or upon request by calling AFS. The fund files its proxy voting record with the U.S. Securities and Exchange Commission (SEC) for the 12 months ended June 30 by August 31. The proxy voting record is available free of charge on the SEC website at sec.gov and on the American Funds website.
A complete October 31, 2018, portfolio of Capital Income Builder’s investments is available free of charge by calling AFS or visiting the SEC website (where it is part of Form N-CSR).
Capital Income Builder files a complete list of its portfolio holdings with the SEC for the first and third quarters of each fiscal year on Form N-Q. This filing is available free of charge on the SEC website. Additionally, the list of portfolio holdings is available by calling AFS.
This report is for the information of shareholders of Capital Income Builder, but it also may be used as sales literature when preceded or accompanied by the current prospectus or summary prospectus, which gives details about charges, expenses, investment objectives and operating policies of the fund. If used as sales material after December 31, 2018, this report must be accompanied by an American Funds statistical update for the most recently completed calendar quarter.
Bloomberg® is a trademark of Bloomberg Finance L.P. (collectively with its affiliates, “Bloomberg”). Barclays® is a trademark of Barclays Bank Plc (collectively with its affiliates, “Barclays”), used under license. Neither Bloomberg nor Barclays approves or endorses this material, guarantees the accuracy or completeness of any information herein and, to the maximum extent allowed by law, neither shall have any liability or responsibility for injury or damages arising in connection therewith.
MSCI has not approved, reviewed or produced this report, makes no express or implied warranties or representations and is not liable whatsoever for any data in the report. You may not redistribute the MSCI data or use it as a basis for other indices or investment products.
The Capital Advantage®
Since 1931, American Funds by Capital Group has helped investors pursue long-term investment success. Our consistent approach — in combination with The Capital SystemSM — has resulted in a superior long-term track record.
Aligned with investor success
We base our decisions on a long-term perspective, which we believe aligns our goals with the interests of our clients. Our portfolio managers average 27 years of investment experience, including 22 years at our company, reflecting a career commitment to our long-term approach.1
The Capital System
The Capital System combines individual accountability with teamwork. Funds using The Capital System are divided into portions that are managed independently by investment professionals with diverse backgrounds, ages and investment approaches. An extensive global research effort is the backbone of our system.
American Funds’ superior long-term track record
Equity funds have beaten their Lipper peer indexes in 92% of 10-year periods and 99% of 20-year periods. Fixed income funds have beaten their Lipper indexes in 77% of 10-year periods and 80% of 20-year periods.2 Fund management fees have been among the lowest in the industry.3
| 1 | Portfolio manager experience as of December 31, 2017. |
| 2 | Based on Class F-2 share results for rolling periods through December 31, 2017. Periods covered are the shorter of the fund’s lifetime or since the comparable Lipper index inception date (except Capital Income Builder and SMALLCAP World Fund, for which the Lipper average was used). Expenses differ for each share class, so results will vary. Class F-2 shares were first offered on August 1, 2008. Class F-2 share results prior to the date of first sale are hypothetical based on Class A share results without a sales charge, adjusted for typical estimated expenses. Results for certain funds with an inception date after August 1, 2008, also include hypothetical returns because those funds’ Class F-2 shares sold after the funds’ date of first offering. Please see americanfunds.com for more information on specific expense adjustments and the actual dates of first sale. |
| 3 | On average, our management fees were in the lowest quintile 71% of the time, based on the 20-year period ended December 31, 2017, versus comparable Lipper categories, excluding funds of funds. |
All Capital Group trademarks referenced are registered trademarks owned by The Capital Group Companies, Inc. or an affiliated company.
All other company and product names mentioned are the trademarks or registered trademarks of their respective companies.

ITEM 2 – Code of Ethics
The Registrant has adopted a Code of Ethics that applies to its Principal Executive Officer and Principal Financial Officer. The Registrant undertakes to provide to any person without charge, upon request, a copy of the Code of Ethics. Such request can be made by calling 800/421-4225 or to the Secretary of the Registrant, 333 South Hope Street, Los Angeles, California 90071.
ITEM 3 – Audit Committee Financial Expert
The Registrant’s board has determined that John G. Freund, a member of the Registrant’s audit committee, is an “audit committee financial expert” and "independent," as such terms are defined in this Item. This designation will not increase the designee’s duties, obligations or liability as compared to his or her duties, obligations and liability as a member of the audit committee and of the board, nor will it reduce the responsibility of the other audit committee members. There may be other individuals who, through education or experience, would qualify as "audit committee financial experts" if the board had designated them as such. Most importantly, the board believes each member of the audit committee contributes significantly to the effective oversight of the Registrant’s financial statements and condition.
ITEM 4 – Principal Accountant Fees and Services
| Registrant: | |
| a) Audit Fees: | |
| 2017 | 177,000 | ||
| 2018 | 163,000 | ||
| b) Audit-Related Fees: | |||
| 2017 | None | ||
| 2018 | None | ||
| c) Tax Fees: | |||
| 2017 | 9,000 | ||
| 2018 | None | ||
| The tax fees consist of professional services relating to the preparation of the Registrant’s tax returns. | |||
| d) All Other Fees: | |||
| 2017 | None | ||
| 2018 | None | ||
| Adviser and affiliates (includes only fees for non-audit services billed to the adviser and affiliates for engagements that relate directly to the operations and financial reporting of the Registrant and were subject to the pre-approval policies described below): | |||
| a) Audit Fees: | |||
| Not Applicable | |||
| b) Audit-Related Fees: | |||
| 2017 | None | ||
| 2018 | None | ||
| The audit-related fees consist of assurance and related services relating to the examination of the Registrant’s transfer agent, principal underwriter and investment adviser conducted in accordance with Statement on Standards for Attestation Engagements Number 16 issued by the American Institute of Certified Public Accountants. | |||
| c) Tax Fees: | |||
| 2017 | None | ||
| 2018 | None | ||
| The tax fees consist of consulting services relating to the Registrant’s investments. | |||
| d) All Other Fees: | |||
| 2017 | 2,000 | ||
| 2018 | None | ||
| The other fees consist of subscription services related to an accounting research tool. | |||
| All audit and permissible non-audit services that the Registrant’s audit committee considers compatible with maintaining the independent registered public accounting firm’s independence are required to be pre-approved by the committee. The pre-approval requirement will extend to all non-audit services provided to the Registrant, the investment adviser, and any entity controlling, controlled by, or under common control with the investment adviser that provides ongoing services to the Registrant, if the engagement relates directly to the operations and financial reporting of the Registrant. The committee will not delegate its responsibility to pre-approve these services to the investment adviser. The committee may delegate to one or more committee members the authority to review and pre-approve audit and permissible non-audit services. Actions taken under any such delegation will be reported to the full committee at its next meeting. The pre-approval requirement is waived with respect to non-audit services if certain conditions are met. The pre-approval requirement was not waived for any of the non-audit services listed above provided to the Registrant, adviser and affiliates. | |||
| Aggregate non-audit fees paid to the Registrant’s auditors, including fees for all services billed to the Registrant, adviser and affiliates that provide ongoing services to the Registrant, were $62,000 for fiscal year 2017 and $0 for fiscal year 2018. The non-audit services represented by these amounts were brought to the attention of the committee and considered to be compatible with maintaining the auditors’ independence. | |||
ITEM 5 – Audit Committee of Listed Registrants
Not applicable to this Registrant, insofar as the Registrant is not a listed issuer as defined in Rule 10A-3 under the Securities Exchange Act of 1934.
ITEM 6 – Schedule of Investments

| Common stocks 70.95% Consumer staples 9.97% | Shares | Value (000) |
| Altria Group, Inc. | 28,505,300 | $1,853,985 |
| Coca-Cola Co. | 34,553,700 | 1,654,431 |
| British American Tobacco PLC | 25,479,111 | 1,105,175 |
| British American Tobacco PLC (ADR) | 7,866,157 | 341,391 |
| Philip Morris International Inc. | 16,366,100 | 1,441,362 |
| Nestlé SA | 12,677,971 | 1,071,488 |
| Imperial Brands PLC | 29,270,382 | 992,578 |
| Diageo PLC | 11,767,900 | 407,405 |
| Kellogg Co. | 3,000,000 | 196,440 |
| Procter & Gamble Co. | 1,708,260 | 151,488 |
| Danone SA | 1,787,516 | 126,701 |
| Carlsberg A/S, Class B | 1,119,891 | 123,535 |
| Kimberly-Clark Corp. | 1,000,000 | 104,300 |
| Reckitt Benckiser Group PLC | 1,130,900 | 91,545 |
| Hormel Foods Corp. | 1,668,681 | 72,821 |
| Hengan International Group Co. Ltd. | 7,975,000 | 63,154 |
| Japan Tobacco Inc. | 2,225,800 | 57,334 |
| Unilever PLC | 741,210 | 39,285 |
| Kraft Heinz Co. | 422,533 | 23,227 |
| Convenience Retail Asia Ltd.1 | 51,330,000 | 21,600 |
| PepsiCo, Inc. | 5,000 | 562 |
| 9,939,807 | ||
| Financials 9.46% | ||
| Sampo Oyj, Class A | 22,444,340 | 1,033,642 |
| Zurich Insurance Group AG | 3,291,441 | 1,023,561 |
| CME Group Inc., Class A | 5,365,229 | 983,125 |
| JPMorgan Chase & Co. | 5,207,000 | 567,667 |
| Wells Fargo & Co. | 9,359,300 | 498,196 |
| Principal Financial Group, Inc. | 9,262,000 | 435,962 |
| Royal Bank of Canada | 5,300,000 | 386,172 |
| Toronto-Dominion Bank (CAD denominated) | 5,721,700 | 317,411 |
| China Construction Bank Corp., Class H | 384,403,000 | 304,897 |
| HSBC Holdings PLC (GBP denominated) | 19,832,364 | 163,480 |
| HSBC Holdings PLC (HKD denominated) | 15,070,642 | 123,764 |
| DBS Group Holdings Ltd | 16,780,592 | 284,209 |
| Banco Santander, SA | 59,715,132 | 283,735 |
| Swedbank AB, Class A | 11,909,403 | 268,221 |
| Bank of China Ltd., Class H | 564,339,400 | 240,360 |
| Lloyds Banking Group PLC | 309,091,700 | 226,065 |
| BNP Paribas SA | 3,876,397 | 202,538 |
| Huntington Bancshares Inc. | 12,554,315 | 179,903 |
| Svenska Handelsbanken AB, Class A | 13,842,969 | 150,574 |
| Westpac Banking Corp. | 7,627,485 | 145,028 |
| UBS Group AG | 9,898,000 | 138,473 |
| Banca Mediolanum SpA | 22,921,506 | 133,056 |
| St. James’s Place PLC | 9,882,345 | 128,021 |
| Common stocks Financials (continued) | Shares | Value (000) |
| Oversea-Chinese Banking Corp. Ltd. | 15,999,765 | $124,057 |
| ABN AMRO Group NV, depository receipts | 4,638,185 | 114,000 |
| Bank of Montreal | 1,420,000 | 106,172 |
| American International Group, Inc. | 2,536,523 | 104,733 |
| Intesa Sanpaolo SpA | 43,137,112 | 95,422 |
| KBC Groep NV | 1,371,773 | 94,623 |
| Marsh & McLennan Companies, Inc. | 901,300 | 76,385 |
| PNC Financial Services Group, Inc. | 589,168 | 75,702 |
| Prudential PLC | 3,709,500 | 74,465 |
| Société Générale | 1,988,532 | 73,155 |
| BOC Hong Kong (Holdings) Ltd. | 18,375,000 | 68,655 |
| Mercury General Corp. | 1,100,000 | 65,241 |
| Invesco Ltd. | 2,747,036 | 59,638 |
| Insurance Australia Group Ltd. | 7,395,798 | 35,771 |
| MONETA Money Bank, AS, non-registered shares | 7,813,482 | 25,929 |
| Itaúsa - Investimentos Itaú SA, preferred nominative | 4,598,619 | 13,889 |
| 9,425,897 | ||
| Health care 9.38% | ||
| AbbVie Inc. | 33,429,000 | 2,602,448 |
| Novartis AG | 19,230,200 | 1,684,826 |
| Amgen Inc. | 7,325,680 | 1,412,318 |
| Abbott Laboratories | 9,325,900 | 642,928 |
| GlaxoSmithKline PLC | 32,863,000 | 634,787 |
| Gilead Sciences, Inc. | 8,553,480 | 583,176 |
| Pfizer Inc. | 12,294,920 | 529,419 |
| Johnson & Johnson | 3,428,700 | 479,984 |
| AstraZeneca PLC | 4,669,948 | 357,551 |
| AstraZeneca PLC (ADR) | 2,841,600 | 110,197 |
| Roche Holding AG, non-registered shares, nonvoting | 580,013 | 141,152 |
| Eli Lilly and Co. | 890,070 | 96,519 |
| Merck & Co., Inc. | 936,000 | 68,899 |
| 9,344,204 | ||
| Energy 7.19% | ||
| Royal Dutch Shell PLC, Class B | 47,639,755 | 1,561,909 |
| Royal Dutch Shell PLC, Class A (GBP denominated) | 13,464,305 | 430,338 |
| Royal Dutch Shell PLC, Class B (ADR) | 1,444,300 | 94,905 |
| Exxon Mobil Corp. | 15,933,815 | 1,269,606 |
| TOTAL SA | 8,820,745 | 519,123 |
| Enbridge Inc. (CAD denominated) | 12,396,985 | 386,285 |
| Enbridge Inc. (CAD denominated)2 | 2,864,838 | 89,267 |
| TransCanada Corp. | 12,593,065 | 474,853 |
| Chevron Corp. | 3,856,029 | 430,526 |
| Occidental Petroleum Corp. | 5,939,323 | 398,350 |
| BP PLC | 49,591,992 | 359,603 |
| Helmerich & Payne, Inc. | 3,774,845 | 235,135 |
| Williams Companies, Inc. | 8,825,400 | 214,722 |
| Suncor Energy Inc. | 5,525,900 | 185,365 |
| Schlumberger Ltd. | 3,412,800 | 175,111 |
| Inter Pipeline Ltd. | 9,370,200 | 151,964 |
| Whitecap Resources Inc.1 | 22,128,500 | 108,251 |
| Common stocks Energy (continued) | Shares | Value (000) |
| ConocoPhillips | 815,100 | $56,975 |
| Kinder Morgan, Inc. | 1,323,085 | 22,519 |
| 7,164,807 | ||
| Information technology 6.48% | ||
| Microsoft Corp. | 14,524,940 | 1,551,409 |
| Broadcom Inc. | 6,282,700 | 1,404,121 |
| Intel Corp. | 22,943,450 | 1,075,589 |
| Taiwan Semiconductor Manufacturing Co., Ltd. | 90,212,800 | 682,216 |
| Cisco Systems, Inc. | 9,378,000 | 429,043 |
| QUALCOMM Inc. | 5,237,820 | 329,406 |
| VTech Holdings Ltd.1 | 20,089,300 | 235,683 |
| Texas Instruments Inc. | 1,759,600 | 163,344 |
| HP Inc. | 6,510,140 | 157,155 |
| Vanguard International Semiconductor Corp.1 | 85,015,695 | 156,607 |
| Delta Electronics, Inc. | 20,417,000 | 85,777 |
| Western Union Co. | 4,712,000 | 85,004 |
| Micro Focus International PLC | 4,798,051 | 74,729 |
| Accenture PLC, Class A | 149,600 | 23,580 |
| 6,453,663 | ||
| Utilities 5.70% | ||
| Engie SA | 47,456,341 | 632,923 |
| Engie SA, bonus shares3 | 12,061,353 | 160,862 |
| SSE PLC | 44,315,320 | 646,590 |
| Dominion Energy, Inc. | 8,972,308 | 640,802 |
| E.On SE | 63,727,000 | 617,576 |
| National Grid PLC | 45,299,247 | 480,119 |
| American Electric Power Co., Inc. | 6,347,000 | 465,616 |
| Iberdrola, SA, non-registered shares | 52,752,409 | 373,796 |
| Exelon Corp. | 6,578,000 | 288,182 |
| Duke Energy Corp. | 3,173,000 | 262,185 |
| Edison International | 3,384,000 | 234,816 |
| Southern Co. | 4,758,000 | 214,253 |
| Naturgy Energy Group, SA | 8,540,111 | 210,097 |
| Enel SPA | 35,668,473 | 175,093 |
| Glow Energy PCL, foreign registered | 32,260,300 | 81,502 |
| Red Eléctrica de Corporación, SA | 2,869,968 | 59,487 |
| PG&E Corp. | 714,170 | 33,430 |
| Infratil Ltd. | 14,867,000 | 33,179 |
| Ratchaburi Electricity Generating Holding PCL, foreign registered | 21,810,000 | 32,238 |
| Sempra Energy | 199,500 | 21,969 |
| Power Assets Holdings Ltd. | 2,570,000 | 17,156 |
| 5,681,871 | ||
| Communication services 5.61% | ||
| Verizon Communications Inc. | 34,318,684 | 1,959,254 |
| Vodafone Group PLC | 362,938,764 | 685,749 |
| AT&T Inc. | 17,010,210 | 521,873 |
| BCE Inc. (CAD denominated) | 9,241,900 | 357,685 |
| Singapore Telecommunications Ltd. | 121,696,867 | 277,632 |
| Nippon Telegraph and Telephone Corp. | 5,955,000 | 250,687 |
| Koninklijke KPN NV | 77,536,827 | 205,152 |
| HKT Trust and HKT Ltd., units | 139,282,860 | 191,821 |
| ITV PLC | 81,248,760 | 154,688 |
| Common stocks Communication services (continued) | Shares | Value (000) |
| Modern Times Group MTG AB, Class B | 3,599,272 | $133,019 |
| SES SA, Class A (FDR) | 6,133,930 | 131,831 |
| 1&1 Drillisch AG | 2,850,000 | 127,314 |
| ProSiebenSat.1 Media SE | 4,391,101 | 101,560 |
| Euskaltel, SA, non-registered shares1 | 11,611,000 | 97,319 |
| Intouch Holdings PCL, foreign registered | 59,500,000 | 95,128 |
| Gannett Co., Inc.1 | 8,547,400 | 82,910 |
| CenturyLink, Inc. | 3,500,000 | 72,240 |
| BT Group PLC | 20,126,000 | 61,882 |
| TELUS Corp. | 1,118,508 | 38,302 |
| TalkTalk Telecom Group PLC | 16,791,663 | 25,756 |
| Zegona Communications PLC1 | 7,573,166 | 10,648 |
| Inmarsat PLC | 1,174,600 | 6,848 |
| Cumulus Media Inc., Class B3,4 | 18,482 | 269 |
| Cumulus Media Inc., Class A4 | 15,209 | 222 |
| 5,589,789 | ||
| Real estate 4.89% | ||
| Crown Castle International Corp. REIT | 10,066,938 | 1,094,679 |
| Link Real Estate Investment Trust REIT | 65,373,896 | 579,382 |
| Simon Property Group, Inc. REIT | 2,200,000 | 403,744 |
| Extra Space Storage Inc. REIT | 3,788,000 | 341,147 |
| Daito Trust Construction Co., Ltd. | 2,379,100 | 314,163 |
| American Tower Corp. REIT | 1,990,287 | 310,107 |
| Sun Hung Kai Properties Ltd. | 23,605,000 | 306,729 |
| Unibail-Rodamco-Westfield, non-registered shares REIT | 661,544 | 120,097 |
| Unibail-Rodamco-Westfield, non-registered shares REIT3 | 561,519 | 101,939 |
| Public Storage REIT | 973,255 | 199,975 |
| Digital Realty Trust, Inc. REIT | 1,913,590 | 197,597 |
| American Campus Communities, Inc. REIT | 4,872,388 | 192,508 |
| Iron Mountain Inc. REIT | 6,278,603 | 192,188 |
| Hospitality Properties Trust REIT | 4,941,000 | 126,588 |
| TAG Immobilien AG | 5,321,373 | 121,630 |
| Lamar Advertising Co. REIT, Class A | 1,591,278 | 116,673 |
| Nexity SA, Class A, non-registered shares | 1,762,815 | 84,498 |
| TLG Immobilien AG, non-registered shares | 1,500,000 | 38,125 |
| Ventas, Inc. REIT | 564,800 | 32,781 |
| 4,874,550 | ||
| Industrials 4.15% | ||
| Lockheed Martin Corp. | 3,776,974 | 1,109,864 |
| VINCI SA | 4,724,780 | 422,128 |
| Boeing Co. | 1,138,300 | 403,937 |
| Airbus SE, non-registered shares | 3,274,589 | 362,403 |
| Aena SME, SA, non-registered shares | 1,875,388 | 299,825 |
| Sydney Airport, units | 65,153,286 | 297,130 |
| United Parcel Service, Inc., Class B | 2,695,000 | 287,125 |
| Singapore Technologies Engineering Ltd | 73,375,000 | 188,053 |
| BAE Systems PLC | 19,522,249 | 131,205 |
| Air New Zealand Ltd. | 48,089,781 | 87,867 |
| Kühne + Nagel International AG | 600,400 | 83,519 |
| United Technologies Corp. | 650,700 | 80,823 |
| General Electric Co. | 7,327,000 | 74,003 |
| ALD SA | 4,925,000 | 73,466 |
| BTS Rail Mass Transit Growth Infrastructure Fund | 200,000,000 | 72,398 |
| Common stocks Industrials (continued) | Shares | Value (000) |
| Adecco Group AG | 1,178,100 | $57,715 |
| Capita PLC4 | 22,153,957 | 36,430 |
| Safran SA | 272,000 | 35,136 |
| Transurban Group | 3,367,786 | 27,045 |
| CTCI Corp. (Taiwan) | 5,649,000 | 7,969 |
| 4,138,041 | ||
| Consumer discretionary 3.48% | ||
| Las Vegas Sands Corp. | 14,921,000 | 761,419 |
| McDonald’s Corp. | 2,806,100 | 496,399 |
| Target Corp. | 4,000,000 | 334,520 |
| Hasbro, Inc. | 2,768,000 | 253,853 |
| Sands China Ltd. | 57,910,930 | 228,189 |
| Midea Group Co., Ltd., Class A | 38,349,163 | 203,675 |
| Starbucks Corp. | 3,350,000 | 195,205 |
| Six Flags Entertainment Corp.1 | 3,000,000 | 161,580 |
| Greene King PLC1 | 24,691,512 | 152,312 |
| NEXT PLC | 1,701,000 | 113,146 |
| InterContinental Hotels Group PLC | 1,759,090 | 92,412 |
| Dine Brands Global, Inc.1 | 1,095,551 | 88,783 |
| Daimler AG | 1,345,400 | 79,790 |
| Toyota Motor Corp. | 1,003,000 | 58,801 |
| AA PLC1 | 35,437,759 | 45,342 |
| Kering SA | 90,649 | 40,412 |
| Hyundai Motor Co. | 430,900 | 40,271 |
| BCA Marketplace PLC | 15,524,700 | 39,985 |
| Marston’s PLC | 19,496,200 | 24,771 |
| Matahari Department Store Tbk PT | 69,943,000 | 22,314 |
| Quang Viet Enterprise Co., Ltd. | 3,901,000 | 13,174 |
| Leifheit AG, non-registered shares1 | 637,270 | 11,405 |
| Chow Sang Sang Holdings International Ltd. | 4,194,000 | 6,792 |
| 3,464,550 | ||
| Materials 2.13% | ||
| Rio Tinto PLC | 18,146,000 | 882,192 |
| Nutrien Ltd. | 7,391,930 | 391,255 |
| Vale SA, ordinary nominative (ADR) | 10,395,000 | 156,964 |
| DowDuPont Inc. | 2,495,000 | 134,530 |
| BHP Billiton PLC | 6,036,000 | 120,543 |
| Evonik Industries AG | 3,793,832 | 117,740 |
| Linde PLC | 657,500 | 108,797 |
| Givaudan SA | 40,918 | 99,294 |
| Amcor Ltd. | 8,526,922 | 80,310 |
| BASF SE | 470,000 | 36,215 |
| 2,127,840 | ||
| Miscellaneous 2.51% | ||
| Other common stocks in initial period of acquisition | 2,501,249 | |
| Total common stocks (cost: $64,218,754,000) | 70,706,268 |
| Preferred securities 0.01% Financials 0.01% | Shares | Value (000) |
| CoBank, ACB, Class E, noncumulative2 | 13,000 | $8,515 |
| Total preferred securities (cost: $13,000,000) | 8,515 | |
| Rights & warrants 0.00% Miscellaneous 0.00% | ||
| Other rights & warrants in initial period of acquisition | 127 | |
| Total rights & warrants (cost: $28,000) | 127 | |
| Convertible stocks 0.27% Real estate 0.12% | ||
| Crown Castle International Corp. REIT, Series A, 6.875% convertible preferred 2020 | 113,927 | 119,054 |
| Utilities 0.03% | ||
| Dominion Energy, Inc., Series A units, 6.75% convertible preferred 2019 | 753,360 | 36,123 |
| Miscellaneous 0.12% | ||
| Other convertible stocks in initial period of acquisition | 116,632 | |
| Total convertible stocks (cost: $277,925,000) | 271,809 | |
| Bonds, notes & other debt instruments 25.36% U.S. Treasury bonds & notes 15.43% U.S. Treasury 14.39% | Principal amount (000) | |
| U.S. Treasury 1.25% 2019 | $10,000 | 9,858 |
| U.S. Treasury 1.75% 2019 | 6,785 | 6,728 |
| U.S. Treasury 3.125% 2019 | 100,000 | 100,334 |
| U.S. Treasury 8.125% 2019 | 93,440 | 97,450 |
| U.S. Treasury 1.125% 2020 | 51,950 | 50,741 |
| U.S. Treasury 1.25% 2020 | 40,700 | 39,881 |
| U.S. Treasury 1.375% 2020 | 70,000 | 68,516 |
| U.S. Treasury 1.375% 2020 | 69,577 | 67,561 |
| U.S. Treasury 1.375% 2020 | 16,500 | 16,194 |
| U.S. Treasury 1.50% 2020 | 23,008 | 22,549 |
| U.S. Treasury 1.625% 2020 | 52,000 | 50,904 |
| U.S. Treasury 1.75% 2020 | 36,615 | 35,817 |
| U.S. Treasury 2.50% 2020 | 26,000 | 25,863 |
| U.S. Treasury 2.50% 2020 | 1,751 | 1,741 |
| U.S. Treasury 2.625% 2020 | 42,000 | 41,824 |
| U.S. Treasury 3.625% 2020 | 700 | 707 |
| U.S. Treasury 8.50% 2020 | 76,000 | 81,488 |
| U.S. Treasury 8.75% 2020 | 179,000 | 195,037 |
| U.S. Treasury 8.75% 2020 | 165,000 | 181,825 |
| U.S. Treasury 1.125% 2021 | 89,668 | 85,429 |
| U.S. Treasury 1.75% 2021 | 75,161 | 72,545 |
| U.S. Treasury 2.00% 2021 | 96,000 | 93,439 |
| U.S. Treasury 2.25% 2021 | 42,570 | 41,819 |
| U.S. Treasury 3.125% 2021 | 75,000 | 75,407 |
| U.S. Treasury 3.625% 2021 | 31,600 | 32,104 |
| Bonds, notes & other debt instruments U.S. Treasury bonds & notes (continued) U.S. Treasury (continued) | Principal amount (000) | Value (000) |
| U.S. Treasury 8.00% 2021 | $337,500 | $387,136 |
| U.S. Treasury 8.125% 2021 | 124,000 | 141,238 |
| U.S. Treasury 1.625% 2022 | 11,000 | 10,469 |
| U.S. Treasury 1.75% 2022 | 675,000 | 647,521 |
| U.S. Treasury 1.875% 2022 | 806,000 | 777,282 |
| U.S. Treasury 1.875% 2022 | 36,000 | 34,560 |
| U.S. Treasury 2.00% 2022 | 41,100 | 39,611 |
| U.S. Treasury 2.00% 2022 | 34,650 | 33,370 |
| U.S. Treasury 2.125% 2022 | 327,052 | 316,197 |
| U.S. Treasury 7.25% 2022 | 182,500 | 210,490 |
| U.S. Treasury 7.625% 2022 | 39,700 | 46,726 |
| U.S. Treasury 1.50% 2023 | 64,170 | 60,335 |
| U.S. Treasury 1.625% 2023 | 39,450 | 37,173 |
| U.S. Treasury 1.625% 2023 | 3,000 | 2,830 |
| U.S. Treasury 2.125% 2023 | 116,269 | 111,527 |
| U.S. Treasury 2.25% 2023 | 150,000 | 144,661 |
| U.S. Treasury 2.375% 2023 | 125,000 | 122,021 |
| U.S. Treasury 2.50% 2023 | 9,000 | 8,824 |
| U.S. Treasury 2.625% 2023 | 11,047 | 10,877 |
| U.S. Treasury 2.75% 2023 | 405,997 | 401,827 |
| U.S. Treasury 2.75% 2023 | 348,020 | 344,745 |
| U.S. Treasury 2.75% 2023 | 140,000 | 138,589 |
| U.S. Treasury 2.875% 2023 | 171,740 | 170,869 |
| U.S. Treasury 2.875% 2023 | 124,220 | 123,584 |
| U.S. Treasury 6.25% 2023 | 350,000 | 401,026 |
| U.S. Treasury 7.125% 2023 | 299,800 | 349,780 |
| U.S. Treasury 2.00% 20245 | 850,000 | 805,774 |
| U.S. Treasury 2.00% 2024 | 205,050 | 194,558 |
| U.S. Treasury 2.00% 2024 | 50,000 | 47,345 |
| U.S. Treasury 2.125% 2024 | 893,500 | 849,522 |
| U.S. Treasury 2.125% 2024 | 750,000 | 714,285 |
| U.S. Treasury 2.125% 2024 | 220,000 | 210,496 |
| U.S. Treasury 2.125% 2024 | 100,000 | 94,922 |
| U.S. Treasury 2.25% 2024 | 141,375 | 136,228 |
| U.S. Treasury 2.25% 2024 | 125,000 | 119,595 |
| U.S. Treasury 2.25% 2024 | 55,000 | 52,598 |
| U.S. Treasury 2.25% 2024 | 55,000 | 52,536 |
| U.S. Treasury 7.50% 2024 | 331,274 | 412,619 |
| U.S. Treasury 2.75% 2025 | 150,000 | 147,393 |
| U.S. Treasury 2.875% 2025 | 150,000 | 148,377 |
| U.S. Treasury 2.875% 2025 | 100,000 | 98,820 |
| U.S. Treasury 3.00% 2025 | 2,137 | 2,127 |
| U.S. Treasury 6.875% 2025 | 145,145 | 178,925 |
| U.S. Treasury 7.625% 2025 | 250,000 | 315,342 |
| U.S. Treasury 2.00% 2026 | 95,400 | 87,839 |
| U.S. Treasury 6.00% 2026 | 206,000 | 245,373 |
| U.S. Treasury 6.50% 2026 | 178,000 | 221,096 |
| U.S. Treasury 6.75% 2026 | 35,000 | 43,878 |
| U.S. Treasury 2.25% 2027 | 482,196 | 449,291 |
| U.S. Treasury 2.25% 2027 | 125,000 | 116,306 |
| U.S. Treasury 2.25% 2027 | 75 | 70 |
| U.S. Treasury 2.375% 2027 | 50,000 | 47,195 |
| U.S. Treasury 6.125% 2027 | 317,000 | 391,264 |
| U.S. Treasury 6.375% 2027 | 85,000 | 106,200 |
| Bonds, notes & other debt instruments U.S. Treasury bonds & notes (continued) U.S. Treasury (continued) | Principal amount (000) | Value (000) |
| U.S. Treasury 6.625% 2027 | $65,000 | $81,737 |
| U.S. Treasury 2.75% 2028 | 100,000 | 96,773 |
| U.S. Treasury 2.875% 2028 | 400,480 | 391,281 |
| U.S. Treasury 2.875% 2028 | 55,029 | 53,801 |
| U.S. Treasury 5.25% 2028 | 89,000 | 104,903 |
| U.S. Treasury 5.50% 2028 | 140,000 | 167,509 |
| U.S. Treasury 5.25% 2029 | 25,000 | 29,551 |
| U.S. Treasury 6.125% 2029 | 30,000 | 38,058 |
| U.S. Treasury 6.25% 20305 | 193,000 | 250,114 |
| U.S. Treasury 2.75% 20475 | 60,000 | 52,888 |
| U.S. Treasury 3.00% 20475 | 179,092 | 166,212 |
| U.S. Treasury 3.00% 2048 | 3,166 | 2,934 |
| U.S. Treasury 3.125% 2048 | 43,274 | 41,111 |
| 14,335,875 | ||
| U.S. Treasury inflation-protected securities 1.04% | ||
| U.S. Treasury Inflation-Protected Security 0.625% 20236 | 191,854 | 188,176 |
| U.S. Treasury Inflation-Protected Security 2.375% 20256 | 172,422 | 185,867 |
| U.S. Treasury Inflation-Protected Security 2.00% 20266 | 56,278 | 59,768 |
| U.S. Treasury Inflation-Protected Security 0.375% 20276 | 154,613 | 145,582 |
| U.S. Treasury Inflation-Protected Security 0.375% 20276 | 82,461 | 77,659 |
| U.S. Treasury Inflation-Protected Security 0.50% 20286 | 240,712 | 193,299 |
| U.S. Treasury Inflation-Protected Security 0.75% 20286 | 51,337 | 49,748 |
| U.S. Treasury Inflation-Protected Security 2.125% 20416 | 852 | 990 |
| U.S. Treasury Inflation-Protected Security 0.75% 20426 | 52,501 | 46,699 |
| U.S. Treasury Inflation-Protected Security 1.375% 20446 | 79,599 | 80,698 |
| U.S. Treasury Inflation-Protected Security 0.875% 20476 | 9,792 | 8,782 |
| 1,037,268 | ||
| Total U.S. Treasury bonds & notes | 15,373,143 | |
| Corporate bonds & notes 5.91% Health care 0.99% | ||
| Abbott Laboratories 2.80% 2020 | 1,325 | 1,314 |
| Abbott Laboratories 2.90% 2021 | 15,030 | 14,772 |
| Abbott Laboratories 3.40% 2023 | 3,702 | 3,667 |
| Abbott Laboratories 3.75% 2026 | 8,756 | 8,636 |
| Abbott Laboratories 4.90% 2046 | 3,830 | 3,965 |
| AbbVie Inc. 2.50% 2020 | 19,135 | 18,892 |
| AbbVie Inc. 2.30% 2021 | 1,995 | 1,934 |
| AbbVie Inc. 3.20% 2022 | 10,015 | 9,793 |
| AbbVie Inc. 2.85% 2023 | 3,055 | 2,923 |
| AbbVie Inc. 3.75% 2023 | 10,000 | 9,917 |
| AbbVie Inc. 4.45% 2046 | 16,202 | 14,227 |
| AbbVie Inc. 4.875% 2048 | 4,000 | 3,689 |
| Aetna Inc. 2.80% 2023 | 1,095 | 1,046 |
| Allergan PLC 3.00% 2020 | 6,830 | 6,803 |
| Allergan PLC 3.45% 2022 | 8,840 | 8,702 |
| Allergan PLC 3.80% 2025 | 5,573 | 5,378 |
| Allergan PLC 4.75% 2045 | 1,000 | 940 |
| Amgen Inc. 1.85% 2021 | 2,750 | 2,633 |
| Anthem, Inc. 2.95% 2022 | 12,000 | 11,606 |
| AstraZeneca PLC 4.00% 2029 | 16,841 | 16,241 |
| Bayer US Finance II LLC 3.875% 20232 | 11,408 | 11,248 |
| Bonds, notes & other debt instruments Corporate bonds & notes (continued) Health care (continued) | Principal amount (000) | Value (000) |
| Bayer US Finance II LLC 4.375% 20282 | $57,371 | $55,671 |
| Becton, Dickinson and Co. 2.675% 2019 | 2,962 | 2,943 |
| Becton, Dickinson and Co. 2.894% 2022 | 2,595 | 2,508 |
| Becton, Dickinson and Co. 3.363% 2024 | 10,000 | 9,568 |
| Becton, Dickinson and Co. 3.734% 2024 | 1,504 | 1,460 |
| Becton, Dickinson and Co. 3.70% 2027 | 10,325 | 9,715 |
| Boston Scientific Corp. 2.85% 2020 | 6,735 | 6,681 |
| Boston Scientific Corp. 6.00% 2020 | 8,075 | 8,326 |
| Boston Scientific Corp. 3.375% 2022 | 3,150 | 3,110 |
| Cardinal Health, Inc. 4.368% 2047 | 3,210 | 2,702 |
| Celgene Corp. 3.25% 2023 | 10,000 | 9,705 |
| Centene Corp. 5.375% 20262 | 4,461 | 4,539 |
| Cigna Corp. 4.375% 20282 | 30,790 | 30,128 |
| Cigna Corp. 4.80% 20382 | 3,050 | 2,954 |
| Cigna Corp. 4.90% 20482 | 14,780 | 14,045 |
| CVS Health Corp. 4.30% 2028 | 44,900 | 43,881 |
| CVS Health Corp. 4.78% 2038 | 3,745 | 3,599 |
| CVS Health Corp. 5.05% 2048 | 19,875 | 19,448 |
| EMD Finance LLC 2.40% 20202 | 1,600 | 1,577 |
| EMD Finance LLC 2.95% 20222 | 9,800 | 9,539 |
| EMD Finance LLC 3.25% 20252 | 26,450 | 25,088 |
| Endo International PLC 5.875% 20242 | 225 | 227 |
| GlaxoSmithKline PLC 3.375% 2023 | 35,000 | 34,678 |
| HCA Inc. 5.875% 2026 | 5,000 | 5,125 |
| HCA Inc. 5.625% 2028 | 2,455 | 2,437 |
| Johnson & Johnson 2.625% 2025 | 10,000 | 9,512 |
| Johnson & Johnson 2.45% 2026 | 8,510 | 7,863 |
| Johnson & Johnson 2.90% 2028 | 12,519 | 11,713 |
| Laboratory Corporation of America Holdings 3.60% 2027 | 4,600 | 4,349 |
| Laboratory Corporation of America Holdings 4.70% 2045 | 6,900 | 6,419 |
| Mallinckrodt PLC 5.625% 20232 | 3,000 | 2,587 |
| McKesson Corp. 2.284% 2019 | 4,815 | 4,803 |
| Medtronic, Inc. 4.625% 2045 | 2,915 | 2,955 |
| Novartis AG 5.125% 2019 | 15,000 | 15,095 |
| Pfizer Inc. 3.20% 2023 | 15,500 | 15,358 |
| Pfizer Inc. 7.20% 2039 | 196 | 265 |
| Pfizer Inc. 4.20% 2048 | 927 | 892 |
| Roche Holdings, Inc. 3.00% 20252 | 1,715 | 1,634 |
| Shire PLC 2.40% 2021 | 4,625 | 4,448 |
| Shire PLC 2.875% 2023 | 24,539 | 23,137 |
| Shire PLC 3.20% 2026 | 36,855 | 33,460 |
| Teva Pharmaceutical Finance Co. BV 2.20% 2021 | 36,510 | 34,111 |
| Teva Pharmaceutical Finance Co. BV 2.80% 2023 | 61,042 | 53,909 |
| Teva Pharmaceutical Finance Co. BV 6.00% 2024 | 63,187 | 62,954 |
| Teva Pharmaceutical Finance Co. BV 3.15% 2026 | 164,050 | 133,876 |
| Teva Pharmaceutical Finance Co. BV 6.75% 2028 | 7,325 | 7,503 |
| Teva Pharmaceutical Finance Co. BV 4.10% 2046 | 26,177 | 17,991 |
| UnitedHealth Group Inc. 2.70% 2020 | 3,230 | 3,205 |
| UnitedHealth Group Inc. 2.125% 2021 | 2,000 | 1,949 |
| UnitedHealth Group Inc. 3.75% 2025 | 4,090 | 4,054 |
| Valeant Pharmaceuticals International, Inc. 6.50% 20222 | 4,713 | 4,890 |
| Valeant Pharmaceuticals International, Inc. 5.50% 20232 | 38,085 | 36,228 |
| Valeant Pharmaceuticals International, Inc. 5.875% 20232 | 1,615 | 1,550 |
| Valeant Pharmaceuticals International, Inc. 7.00% 20242 | 1,000 | 1,050 |
| Bonds, notes & other debt instruments Corporate bonds & notes (continued) Health care (continued) | Principal amount (000) | Value (000) |
| Valeant Pharmaceuticals International, Inc. 6.125% 20252 | $1,110 | $1,024 |
| WellPoint, Inc. 2.25% 2019 | 2,000 | 1,988 |
| Zimmer Holdings, Inc. 3.15% 2022 | 4,800 | 4,689 |
| 983,441 | ||
| Financials 0.95% | ||
| ACE Capital Trust II 9.70% 2030 | 7,210 | 10,052 |
| ACE INA Holdings Inc. 2.30% 2020 | 815 | 799 |
| ACE INA Holdings Inc. 2.875% 2022 | 2,910 | 2,844 |
| ACE INA Holdings Inc. 3.35% 2026 | 2,905 | 2,797 |
| ACE INA Holdings Inc. 4.35% 2045 | 3,230 | 3,195 |
| American Express Co. 2.20% 2020 | 16,500 | 16,119 |
| American International Group, Inc. 4.20% 2028 | 15,865 | 15,265 |
| American International Group, Inc. 4.75% 2048 | 20,475 | 18,965 |
| AXA SA 5.00% 20482 | 5,000 | 4,471 |
| Bank of America Corp. 2.816% 2023 (3-month USD-LIBOR + 0.93% on 7/21/2022)7 | 3,025 | 2,914 |
| Bank of America Corp. 3.55% 2024 (3-month USD-LIBOR + 0.78% on 3/5/2023)7 | 35,527 | 34,887 |
| Bank of America Corp. 3.593% 2028 (3-month USD-LIBOR + 1.37% on 7/21/2027)7 | 7,145 | 6,725 |
| Bank of America Corp. 3.97% 2029 (3-month USD-LIBOR + 1.07% on 3/5/2028)7 | 7,500 | 7,229 |
| Bank of America Corp. 4.271% 2029 (3-month USD-LIBOR +1.31% on 7/23/2028)7 | 23,670 | 23,372 |
| Bank of New York Mellon Corp. 2.10% 2019 | 15,000 | 14,982 |
| Barclays Bank PLC 5.14% 2020 | 15,525 | 15,879 |
| Barclays Bank PLC 4.972% 2029 (3-month USD-LIBOR + 1.902% on 5/16/2028)7 | 7,500 | 7,294 |
| Barclays Bank PLC 4.95% 2047 | 10,750 | 9,616 |
| BB&T Corp. 2.45% 2020 | 7,800 | 7,732 |
| Berkshire Hathaway Finance Corp. 4.20% 2048 | 26,310 | 25,245 |
| Berkshire Hathaway Inc. 2.20% 2021 | 2,500 | 2,451 |
| BNP Paribas 3.375% 20252 | 8,250 | 7,747 |
| Carlyle Investment Management (1-month USD-LIBOR + 2.00%) 4.436% 20192,3,8,9,10 | 1,884 | 1,884 |
| Carlyle Investment Management (1-month USD-LIBOR + 2.00%) 4.436% 20192,3,8,9,10 | 503 | 503 |
| Charles Schwab Corp. 4.00% 2029 | 5,600 | 5,538 |
| Citigroup Inc. 8.50% 2019 | 12,656 | 13,040 |
| Citigroup Inc. 3.40% 2021 | 7,750 | 7,720 |
| Citigroup Inc. 4.044% 2024 (3-month USD-LIBOR + 1.023% on 6/1/2023)7 | 8,500 | 8,497 |
| Citigroup Inc. 3.20% 2026 | 5,330 | 4,889 |
| Citigroup Inc. 4.65% 2048 | 6,320 | 6,131 |
| Crédit Agricole SA 3.75% 20232 | 3,275 | 3,203 |
| Credit Suisse Group AG 3.80% 2022 | 7,888 | 7,809 |
| Credit Suisse Group AG 2.997% 2023 (3-month USD-LIBOR + 1.20% on 12/14/2022)2,7 | 9,275 | 8,828 |
| Credit Suisse Group AG 3.80% 2023 | 12,050 | 11,852 |
| Credit Suisse Group AG 4.207% 2024 (3-month USD-LIBOR + 1.24% on 6/12/2023)2,7 | 19,250 | 19,138 |
| Credit Suisse Group AG 3.869% 2029 (3-month USD-LIBOR + 1.41% on 1/12/2028)2,7 | 5,000 | 4,641 |
| Danske Bank AS 3.875% 20232 | 9,250 | 9,004 |
| Discover Financial Services 10.25% 2019 | 4,334 | 4,530 |
| FS Energy and Power Fund 7.50% 20232 | 2,980 | 3,029 |
| General Motors Financial Co. 4.375% 2021 | 1,000 | 1,009 |
| Goldman Sachs Group, Inc. 5.75% 2022 | 7,500 | 7,929 |
| Goldman Sachs Group, Inc. 2.905% 2023 (3-month USD-LIBOR + 0.99% on 7/24/2022)7 | 20,480 | 19,714 |
| Goldman Sachs Group, Inc. 3.917% 202310 | 1,465 | 1,516 |
| Goldman Sachs Group, Inc. 3.814% 2029 (3-month USD-LIBOR + 1.158% on 4/23/2028)7 | 22,500 | 21,160 |
| Groupe BPCE SA 2.75% 2021 | 9,500 | 9,242 |
| HSBC Holdings PLC 3.95% 2024 (3-month USD-LIBOR + 0.987% on 5/18/2023)7 | 350 | 347 |
| HSBC Holdings PLC 4.583% 2029 (3-month USD-LIBOR + 1.535% on 6/19/2028)7 | 33,750 | 33,453 |
| Bonds, notes & other debt instruments Corporate bonds & notes (continued) Financials (continued) | Principal amount (000) | Value (000) |
| Intesa Sanpaolo SpA 5.017% 20242 | $9,100 | $8,033 |
| Intesa Sanpaolo SpA 3.875% 20272 | 7,500 | 6,207 |
| Intesa Sanpaolo SpA 3.875% 20282 | 10,000 | 8,163 |
| Jefferies Financial Group Inc. 5.50% 2023 | 1,630 | 1,688 |
| JPMorgan Chase & Co. 6.30% 2019 | 5,000 | 5,081 |
| JPMorgan Chase & Co. 4.625% 2021 | 5,000 | 5,144 |
| JPMorgan Chase & Co. 3.559% 2024 (3-month USD-LIBOR + 0.73% on 4/23/2023)7 | 25,275 | 24,918 |
| JPMorgan Chase & Co. 3.797% 2024 (3-month USD-LIBOR + 0.89% on 7/23/2023)7 | 15,000 | 14,917 |
| JPMorgan Chase & Co. 3.509% 2029 (3-month USD-LIBOR + 0.945% on 1/23/2028)7 | 21,050 | 19,662 |
| JPMorgan Chase & Co. 4.203% 2029 (3-month USD-LIBOR + 1.26% on 7/23/2028)7 | 23,606 | 23,279 |
| JPMorgan Chase & Co., Series I, junior subordinated 5.99% (undated) (3-month USD-LIBOR + 3.47% on 1/30/2019)7 | 35,506 | 35,684 |
| Lloyds Banking Group PLC 2.907% 2023 (3-month USD-LIBOR + 0.81% on 11/7/2022)7 | 3,600 | 3,423 |
| Lloyds Banking Group PLC 4.45% 2025 | 13,075 | 13,026 |
| Lloyds Banking Group PLC 4.375% 2028 | 5,375 | 5,147 |
| Metlife, Inc. 3.60% 2025 | 2,870 | 2,811 |
| Metropolitan Life Global Funding I 2.30% 20192 | 2,700 | 2,693 |
| Metropolitan Life Global Funding I 2.00% 20202 | 2,155 | 2,117 |
| Metropolitan Life Global Funding I 2.50% 20202 | 4,000 | 3,932 |
| Metropolitan Life Global Funding I 3.45% 20262 | 1,210 | 1,167 |
| Morgan Stanley 2.50% 2021 | 15,000 | 14,621 |
| Morgan Stanley 3.737% 2024 (3-month USD-LIBOR + 0.847% on 4/24/2023)7 | 16,000 | 15,816 |
| Morgan Stanley 3.875% 2026 | 7,525 | 7,298 |
| Morgan Stanley 3.625% 2027 | 5,740 | 5,430 |
| Morgan Stanley 4.457% 2039 (3-month USD-LIBOR + 1.431% on 4/22/2038)7 | 2,900 | 2,779 |
| Nationwide Building Society 4.363% 2024 (3-month USD-LIBOR + 1.392% on 8/1/2023)2,7 | 10,875 | 10,797 |
| Navient Corp. 6.75% 2026 | 12,500 | 11,969 |
| New York Life Global Funding 1.50% 20192 | 1,835 | 1,808 |
| New York Life Global Funding 2.10% 20192 | 3,000 | 2,997 |
| New York Life Global Funding 1.95% 20202 | 2,190 | 2,158 |
| New York Life Global Funding 1.95% 20202 | 2,000 | 1,954 |
| New York Life Global Funding 2.00% 20202 | 500 | 492 |
| New York Life Global Funding 1.70% 20212 | 14,000 | 13,367 |
| New York Life Global Funding 2.30% 20222 | 3,250 | 3,117 |
| Nuveen, LLC 4.00% 20282 | 5,900 | 5,911 |
| PRICOA Global Funding I 2.45% 20222 | 855 | 821 |
| Prudential Financial, Inc. 5.70% 2048 (3-month USD-LIBOR + 2.665% on 9/15/2028)7 | 7,500 | 7,279 |
| Royal Bank of Canada 2.125% 2020 | 5,250 | 5,181 |
| Royal Bank of Scotland PLC 5.076% 2030 (3-month USD-LIBOR + 1.905% on 1/27/2029)7 | 10,000 | 9,849 |
| Santander Holdings USA, Inc. 3.70% 2022 | 7,500 | 7,370 |
| Santander Holdings USA, Inc. 3.40% 2023 | 6,000 | 5,733 |
| Standard Chartered PLC 3.885% 2024 (3-month USD-LIBOR + 1.08% on 3/15/2023)2,7 | 5,000 | 4,869 |
| Travelers Companies, Inc. 4.00% 2047 | 1,315 | 1,216 |
| UBS Group AG 2.859% 2023 (3-month USD-LIBOR + 0.954% on 8/15/2022)2,7 | 5,000 | 4,793 |
| UniCredit SpA 3.75% 20222 | 13,635 | 12,894 |
| UniCredit SPA 5.861% 20322,7 | 1,900 | 1,631 |
| US Bancorp 2.00% 2020 | 1,000 | 986 |
| US Bancorp 2.625% 2022 | 7,750 | 7,552 |
| US Bancorp 3.40% 2023 | 20,375 | 20,201 |
| US Bancorp 3.15% 2027 | 4,000 | 3,775 |
| Wells Fargo & Co. 2.10% 2021 | 15,000 | 14,406 |
| Wells Fargo & Co. 2.625% 2022 | 14,025 | 13,475 |
| Wells Fargo & Co. 3.00% 2026 | 3,320 | 3,042 |
| Bonds, notes & other debt instruments Corporate bonds & notes (continued) Financials (continued) | Principal amount (000) | Value (000) |
| Wells Fargo & Co. 3.584% 2028 (3-month USD-LIBOR + 1.31% on 5/15/2027)7 | $2,065 | $1,967 |
| Wells Fargo & Co., Series K, junior subordinated 6.104% (undated) (3-month USD-LIBOR + 3.77% on 3/15/2019)7 | 71,606 | 72,233 |
| 942,065 | ||
| Energy 0.92% | ||
| Anadarko Petroleum Corp. 4.85% 2021 | 1,040 | 1,063 |
| Anadarko Petroleum Corp. 5.55% 2026 | 20,150 | 20,997 |
| Anadarko Petroleum Corp. 6.20% 2040 | 790 | 833 |
| Anadarko Petroleum Corp. 6.60% 2046 | 3,220 | 3,572 |
| Andeavor Logistics LP 3.50% 2022 | 10,345 | 10,110 |
| APT Pipelines Ltd. 4.20% 20252 | 2,220 | 2,172 |
| Ascent Resources Marcellus Holdings, Inc., Term Loan B, (3-month USD-LIBOR + 6.50%) 8.781% 20239,10,11 | 250 | 252 |
| Baker Hughes, a GE Co. 3.337% 2027 | 2,500 | 2,286 |
| Baker Hughes, a GE Co. 4.08% 2047 | 6,850 | 5,744 |
| Canadian Natural Resources Ltd. 2.95% 2023 | 5,565 | 5,363 |
| Canadian Natural Resources Ltd. 3.80% 2024 | 1,975 | 1,944 |
| Canadian Natural Resources Ltd. 3.85% 2027 | 11,105 | 10,562 |
| Canadian Natural Resources Ltd. 4.95% 2047 | 740 | 724 |
| Cenovus Energy Inc. 3.00% 2022 | 16,340 | 15,628 |
| Cenovus Energy Inc. 3.80% 2023 | 6,120 | 5,989 |
| Cenovus Energy Inc. 4.25% 2027 | 12,870 | 12,156 |
| Cenovus Energy Inc. 5.25% 2037 | 2,646 | 2,490 |
| Cenovus Energy Inc. 5.40% 2047 | 17,580 | 16,636 |
| Cheniere Energy Partners, LP 5.625% 20262 | 4,900 | 4,839 |
| Chevron Corp. 1.561% 2019 | 3,700 | 3,672 |
| Chevron Corp. 2.10% 2021 | 20,720 | 20,117 |
| Chevron Corp. 2.498% 2022 | 10,540 | 10,256 |
| Concho Resources Inc. 4.30% 2028 | 14,965 | 14,627 |
| Concho Resources Inc. 4.85% 2048 | 4,772 | 4,550 |
| Diamond Offshore Drilling, Inc. 4.875% 2043 | 12,185 | 8,347 |
| Ecopetrol SA 5.875% 2023 | 1,790 | 1,876 |
| Ecopetrol SA 5.875% 2045 | 715 | 683 |
| Enbridge Energy Partners, LP 9.875% 2019 | 5,000 | 5,114 |
| Enbridge Energy Partners, LP 5.20% 2020 | 650 | 664 |
| Enbridge Energy Partners, LP 5.875% 2025 | 30,860 | 33,629 |
| Enbridge Energy Partners, LP 5.50% 2040 | 3,500 | 3,593 |
| Enbridge Energy Partners, LP 7.375% 2045 | 44,155 | 54,977 |
| Enbridge Inc. 2.90% 2022 | 1,083 | 1,046 |
| Enbridge Inc. 4.00% 2023 | 10,895 | 10,891 |
| Enbridge Inc. 3.70% 2027 | 5,335 | 5,023 |
| Energy Transfer Partners, LP 4.00% 2027 | 1,325 | 1,227 |
| Energy Transfer Partners, LP 4.20% 2027 | 9,400 | 8,885 |
| Energy Transfer Partners, LP 6.125% 2045 | 2,295 | 2,301 |
| Energy Transfer Partners, LP 5.30% 2047 | 14,728 | 13,240 |
| Energy Transfer Partners, LP 5.40% 2047 | 11,986 | 10,953 |
| Energy Transfer Partners, LP 6.00% 2048 | 8,646 | 8,547 |
| Energy Transfer Partners, LP 6.25% (undated) (3-month USD-LIBOR + 4.028% on 2/15/2023)7 | 7,500 | 7,027 |
| Energy Transfer Partners, LP 6.625% 2049 (3-month USD-LIBOR + 4.155% on 2/15/2028)7 | 10,220 | 9,485 |
| EnLink Midstream Partners, LP 2.70% 2019 | 5,920 | 5,883 |
| EnLink Midstream Partners, LP 5.05% 2045 | 705 | 560 |
| EnLink Midstream Partners, LP 5.45% 2047 | 4,205 | 3,554 |
| Ensco PLC 5.20% 2025 | 4,265 | 3,513 |
| Ensco PLC 5.75% 2044 | 1,750 | 1,232 |
| Bonds, notes & other debt instruments Corporate bonds & notes (continued) Energy (continued) | Principal amount (000) | Value (000) |
| EQT Corp. 3.90% 2027 | $3,020 | $2,753 |
| Equinor ASA 3.625% 2028 | 17,905 | 17,426 |
| Exxon Mobil Corp. 2.222% 2021 | 7,750 | 7,575 |
| Husky Energy Inc. 7.25% 2019 | 4,500 | 4,686 |
| Jonah Energy LLC 7.25% 20252 | 2,500 | 2,000 |
| Kinder Morgan Energy Partners, LP 5.00% 2043 | 8,020 | 7,409 |
| Kinder Morgan Energy Partners, LP 5.40% 2044 | 6,230 | 6,109 |
| Kinder Morgan Energy Partners, LP 5.50% 2044 | 1,600 | 1,574 |
| Kinder Morgan, Inc. 3.15% 2023 | 1,190 | 1,149 |
| Kinder Morgan, Inc. 4.30% 2025 | 75,495 | 75,202 |
| Kinder Morgan, Inc. 4.30% 2028 | 18,630 | 18,045 |
| Kinder Morgan, Inc. 5.55% 2045 | 49,775 | 50,459 |
| Kinder Morgan, Inc. 5.05% 2046 | 8,095 | 7,676 |
| Marathon Oil Corp. 4.40% 2027 | 18,885 | 18,438 |
| MPLX LP 4.125% 2027 | 2,445 | 2,337 |
| MPLX LP 4.00% 2028 | 6,080 | 5,722 |
| MPLX LP 5.20% 2047 | 505 | 479 |
| Murphy Oil Corp. 5.75% 2025 | 6,700 | 6,681 |
| Neptune Energy Group Holdings Limited 6.625% 20252 | 2,455 | 2,397 |
| NGL Energy Partners LP 5.125% 2019 | 9,100 | 9,157 |
| NGPL PipeCo LLC 7.768% 20372 | 2,000 | 2,350 |
| Noble Corp. PLC 7.95% 20257 | 1,785 | 1,633 |
| Noble Corp. PLC 8.95% 20457 | 3,010 | 2,837 |
| Noble Energy, Inc. 3.85% 2028 | 3,465 | 3,183 |
| Noble Energy, Inc. 4.95% 2047 | 7,630 | 6,947 |
| NuStar Logistics, LP 5.625% 2027 | 5,000 | 4,800 |
| Pemex Project Funding Master Trust, Series 13, 6.625% 2035 | 10,000 | 9,200 |
| Petrobras Global Finance Co. 6.25% 2024 | 1,250 | 1,269 |
| Petrobras Global Finance Co. 7.375% 2027 | 1,365 | 1,419 |
| Petrobras Global Finance Co. 5.999% 2028 | 2,535 | 2,411 |
| Petrobras Global Finance Co. 5.75% 2029 | 1,620 | 1,503 |
| Petrobras Global Finance Co. 7.25% 2044 | 300 | 290 |
| Petrobras Global Finance Co. 6.85% 2115 | 1,035 | 922 |
| Petróleos Mexicanos 6.875% 2026 | 34,020 | 33,969 |
| Petróleos Mexicanos 6.50% 2027 | 2,470 | 2,400 |
| Petróleos Mexicanos 5.35% 20282 | 1,530 | 1,367 |
| Petróleos Mexicanos 6.50% 20292 | 1,420 | 1,359 |
| Petróleos Mexicanos 6.75% 2047 | 2,685 | 2,320 |
| Petróleos Mexicanos 6.35% 20482 | 10,178 | 8,487 |
| Phillips 66 4.30% 2022 | 11,525 | 11,772 |
| Phillips 66 Partners LP 3.605% 2025 | 540 | 516 |
| Phillips 66 Partners LP 3.55% 2026 | 2,600 | 2,433 |
| Phillips 66 Partners LP 3.75% 2028 | 670 | 622 |
| Phillips 66 Partners LP 4.68% 2045 | 160 | 146 |
| Phillips 66 Partners LP 4.90% 2046 | 735 | 681 |
| Pioneer Natural Resources Co. 3.45% 2021 | 685 | 682 |
| QEP Resources, Inc. 5.625% 2026 | 350 | 331 |
| QGOG Constellation SA 9.50% 2024 (5.26% PIK)2,9,12 | 502 | 243 |
| Royal Dutch Shell PLC 1.75% 2021 | 10,865 | 10,418 |
| Sabine Pass Liquefaction, LLC 5.625% 2025 | 6,450 | 6,743 |
| Sabine Pass Liquefaction, LLC 5.00% 2027 | 4,575 | 4,600 |
| Sabine Pass Liquefaction, LLC 4.20% 2028 | 1,275 | 1,216 |
| Schlumberger BV 4.00% 20252 | 19,919 | 19,733 |
| Targa Resources Partners LP 4.125% 2019 | 4,000 | 4,020 |
| Bonds, notes & other debt instruments Corporate bonds & notes (continued) Energy (continued) | Principal amount (000) | Value (000) |
| TC PipeLines, LP 4.375% 2025 | $1,984 | $1,946 |
| Tesoro Logistics LP 6.25% 2022 | 520 | 537 |
| Total Capital SA 3.883% 2028 | 5,280 | 5,305 |
| TransCanada Corp. 5.875% 2076 (3-month USD-LIBOR + 4.64% on 8/15/2026)7 | 61,650 | 60,842 |
| TransCanada Corp., junior subordinated, (3-month USD-LIBOR + 2.21%) 4.524% 206710 | 8,000 | 7,286 |
| TransCanada PipeLines Ltd. 4.25% 2028 | 22,005 | 21,577 |
| TransCanada PipeLines Ltd. 4.875% 2048 | 7,500 | 7,269 |
| TransCanada PipeLines Ltd. 5.10% 2049 | 5,000 | 5,023 |
| Transportadora de Gas Peru SA 4.25% 20282,9 | 1,090 | 1,061 |
| Valero Energy Partners LP 4.375% 2026 | 1,735 | 1,709 |
| Western Gas Partners LP 3.95% 2025 | 1,520 | 1,414 |
| Western Gas Partners LP 4.65% 2026 | 9,149 | 8,926 |
| Western Gas Partners LP 5.30% 2048 | 3,300 | 2,862 |
| Williams Partners LP 4.125% 2020 | 5,000 | 5,048 |
| Williams Partners LP 4.30% 2024 | 4,220 | 4,225 |
| 913,958 | ||
| Utilities 0.68% | ||
| Abu Dhabi National Energy Co. PJSC (TAQA) 4.375% 20252 | 10,000 | 9,894 |
| AES Corp. 6.00% 2026 | 3,700 | 3,802 |
| AES Corp. 5.125% 2027 | 5,000 | 4,950 |
| Atlantic City Electric Co. 4.00% 2028 | 5,485 | 5,512 |
| Berkshire Hathaway Energy Co. 4.45% 20492 | 2,000 | 1,926 |
| Calpine Corp. 5.25% 20262 | 4,125 | 3,805 |
| Centerpoint Energy, Inc. 2.50% 2022 | 6,000 | 5,734 |
| Centerpoint Energy, Inc. 3.85% 2024 | 19,500 | 19,510 |
| Cleveland Electric Illuminating Co. 8.875% 2018 | 21,700 | 21,745 |
| CMS Energy Corp. 5.05% 2022 | 5,460 | 5,680 |
| CMS Energy Corp. 3.00% 2026 | 11,064 | 10,327 |
| CMS Energy Corp. 3.45% 2027 | 3,485 | 3,316 |
| CMS Energy Corp. 4.875% 2044 | 1,275 | 1,311 |
| Commonwealth Edison Co. 2.95% 2027 | 7,450 | 6,857 |
| Consumers Energy Co. 3.80% 2028 | 2,400 | 2,391 |
| Consumers Energy Co. 4.05% 2048 | 11,425 | 10,936 |
| Consumers Energy Co. 4.35% 2049 | 1,225 | 1,220 |
| Dominion Resources, Inc. 2.579% 20207 | 2,325 | 2,290 |
| DTE Energy Co. 3.70% 2023 | 48,125 | 47,832 |
| Duke Energy Corp. 3.95% 2023 | 985 | 993 |
| Duke Energy Corp. 3.75% 2024 | 2,490 | 2,471 |
| Duke Energy Corp. 2.65% 2026 | 4,660 | 4,177 |
| Duke Energy Progress, LLC 3.70% 2028 | 7,875 | 7,751 |
| Edison International 2.40% 2022 | 1,800 | 1,699 |
| EDP Finance BV 3.625% 20242 | 15,450 | 14,664 |
| Electricité de France SA 5.00% 20482 | 7,500 | 6,932 |
| Emera Inc. 6.75% 2076 (3-month USD-LIBOR + 5.44% on 6/15/2026)7 | 20,554 | 21,530 |
| Emera US Finance LP 4.75% 2046 | 5,000 | 4,659 |
| Enel Finance International SA 3.625% 20272 | 10,300 | 8,961 |
| Enel Finance International SA 3.50% 20282 | 13,787 | 11,610 |
| Enel Finance International SA 4.875% 20292 | 22,269 | 20,869 |
| Entergy Corp. 4.00% 2022 | 4,435 | 4,464 |
| Entergy Corp. 2.95% 2026 | 7,750 | 7,030 |
| Entergy Louisiana, LLC 3.30% 2022 | 4,060 | 3,972 |
| Entergy Louisiana, LLC 4.20% 2048 | 7,950 | 7,689 |
| Eversource Energy 2.375% 2022 | 1,410 | 1,351 |
| Bonds, notes & other debt instruments Corporate bonds & notes (continued) Utilities (continued) | Principal amount (000) | Value (000) |
| Eversource Energy 2.75% 2022 | $528 | $517 |
| Eversource Energy 2.80% 2023 | 1,870 | 1,801 |
| Exelon Corp. 3.497% 20227 | 21,750 | 21,231 |
| Exelon Corp. 3.95% 2025 | 635 | 626 |
| Exelon Corp. 3.40% 2026 | 1,570 | 1,479 |
| FirstEnergy Corp. 3.90% 2027 | 65,458 | 62,636 |
| FirstEnergy Corp. 3.50% 20282 | 8,725 | 8,171 |
| FirstEnergy Corp., Series B, 4.25% 2023 | 17,000 | 17,174 |
| IPALCO Enterprises, Inc. 3.70% 2024 | 2,000 | 1,933 |
| Mississippi Power Co. 4.25% 2042 | 26,132 | 23,564 |
| National Rural Utilities Cooperative Finance Corp. 2.95% 2024 | 750 | 724 |
| National Rural Utilities Cooperative Finance Corp. 3.25% 2025 | 715 | 692 |
| National Rural Utilities Cooperative Finance Corp. 3.05% 2027 | 2,500 | 2,350 |
| NV Energy, Inc 6.25% 2020 | 14,370 | 15,140 |
| Pacific Gas and Electric Co. 2.45% 2022 | 1,050 | 991 |
| Pacific Gas and Electric Co. 3.25% 2023 | 26,804 | 25,597 |
| Pacific Gas and Electric Co. 3.85% 2023 | 3,637 | 3,554 |
| Pacific Gas and Electric Co. 4.25% 20232 | 20,755 | 20,673 |
| Pacific Gas and Electric Co. 3.40% 2024 | 11,055 | 10,472 |
| Pacific Gas and Electric Co. 3.75% 2024 | 1,457 | 1,410 |
| Pacific Gas and Electric Co. 3.50% 2025 | 1,285 | 1,199 |
| Pacific Gas and Electric Co. 2.95% 2026 | 1,461 | 1,299 |
| Pacific Gas and Electric Co. 3.30% 2027 | 636 | 567 |
| Pacific Gas and Electric Co. 3.30% 2027 | 499 | 449 |
| Pacific Gas and Electric Co. 4.65% 20282 | 4,255 | 4,195 |
| Pacific Gas and Electric Co. 3.75% 2042 | 430 | 342 |
| Pacific Gas and Electric Co. 4.00% 2046 | 3,500 | 2,860 |
| Pacific Gas and Electric Co. 3.95% 2047 | 1,488 | 1,206 |
| PacifiCorp., First Mortgage Bonds, 4.125% 2049 | 7,500 | 7,097 |
| Pennsylvania Electric Co. 3.25% 20282 | 6,000 | 5,517 |
| Progress Energy, Inc. 7.05% 2019 | 9,650 | 9,793 |
| Progress Energy, Inc. 7.00% 2031 | 4,000 | 4,960 |
| Progress Energy, Inc. 7.75% 2031 | 2,500 | 3,241 |
| Public Service Co. of Colorado 5.125% 2019 | 900 | 912 |
| Public Service Co. of Colorado 3.80% 2047 | 685 | 628 |
| Public Service Enterprise Group Inc. 2.00% 2021 | 13,500 | 12,869 |
| Puget Energy, Inc. 6.50% 2020 | 5,438 | 5,740 |
| Puget Energy, Inc. 5.625% 2022 | 6,525 | 6,873 |
| Puget Energy, Inc. 3.65% 2025 | 8,500 | 8,159 |
| SCANA Corp. 6.25% 2020 | 797 | 817 |
| SCANA Corp. 4.75% 2021 | 12,239 | 12,317 |
| SCANA Corp. 4.125% 2022 | 19,928 | 19,669 |
| South Carolina Electric & Gas Co. 4.25% 2028 | 4,400 | 4,381 |
| South Carolina Electric & Gas Co. 5.45% 2041 | 3,704 | 3,984 |
| South Carolina Electric & Gas Co. 4.35% 2042 | 491 | 464 |
| South Carolina Electric & Gas Co. 4.10% 2046 | 3,879 | 3,455 |
| Southwestern Public Service Co. 3.70% 2047 | 2,730 | 2,454 |
| Tampa Electric Co. 2.60% 2022 | 1,200 | 1,152 |
| Teco Finance, Inc. 5.15% 2020 | 13,275 | 13,530 |
| Virginia Electric and Power Co. 3.45% 2024 | 1,860 | 1,839 |
| Virginia Electric and Power Co., Series B, 3.45% 2022 | 1,330 | 1,322 |
| Virginia Electric and Power Co., Series B, 3.80% 2047 | 925 | 825 |
| Xcel Energy Inc. 4.70% 2020 | 18 | 18 |
| Bonds, notes & other debt instruments Corporate bonds & notes (continued) Utilities (continued) | Principal amount (000) | Value (000) |
| Xcel Energy Inc. 3.30% 2025 | $5,850 | $5,625 |
| Xcel Energy Inc. 6.50% 2036 | 3,000 | 3,717 |
| 674,070 | ||
| Communication services 0.61% | ||
| América Móvil, SAB de CV 6.45% 2022 | MXN45,000 | 1,992 |
| América Móvil, SAB de CV 8.46% 2036 | 147,200 | 6,287 |
| AT&T Inc. (3-month USD-LIBOR + 1.18%) 3.514% 202410 | $7,655 | 7,682 |
| AT&T Inc. 4.25% 2027 | 15,000 | 14,573 |
| AT&T Inc. 4.35% 2045 | 10,580 | 8,713 |
| CCO Holdings LLC and CCO Holdings Capital Corp. 3.579% 2020 | 3,150 | 3,147 |
| CCO Holdings LLC and CCO Holdings Capital Corp. 4.50% 2024 | 2,500 | 2,506 |
| CCO Holdings LLC and CCO Holdings Capital Corp. 5.50% 20262 | 3,275 | 3,197 |
| CCO Holdings LLC and CCO Holdings Capital Corp. 5.125% 20272 | 10,085 | 9,518 |
| CCO Holdings LLC and CCO Holdings Capital Corp. 3.75% 2028 | 2,800 | 2,541 |
| CCO Holdings LLC and CCO Holdings Capital Corp. 4.20% 2028 | 3,945 | 3,703 |
| CCO Holdings LLC and CCO Holdings Capital Corp. 5.00% 20282 | 8,375 | 7,841 |
| CCO Holdings LLC and CCO Holdings Capital Corp. 5.375% 2047 | 2,735 | 2,470 |
| CCO Holdings LLC and CCO Holdings Capital Corp. 5.75% 2048 | 24,780 | 23,475 |
| CenturyLink, Inc. 7.50% 2024 | 20,283 | 21,348 |
| CenturyLink, Inc., Series T, 5.80% 2022 | 5,725 | 5,732 |
| Comcast Corp. 3.70% 2024 | 9,345 | 9,320 |
| Comcast Corp. 3.95% 2025 | 8,130 | 8,115 |
| Comcast Corp. 2.35% 2027 | 3,220 | 2,819 |
| Comcast Corp. 3.15% 2028 | 10,015 | 9,214 |
| Comcast Corp. 4.15% 2028 | 24,620 | 24,449 |
| Comcast Corp. 4.75% 2044 | 3,500 | 3,428 |
| Comcast Corp. 4.00% 2047 | 3,655 | 3,191 |
| Comcast Corp. 4.00% 2048 | 10,000 | 8,749 |
| Comcast Corp. 4.70% 2048 | 16,500 | 16,034 |
| Cumulus Media New Holdings Inc., Term Loan, (3-month USD-LIBOR + 4.50%) 6.81% 20229,10,11 | 1,465 | 1,447 |
| Deutsche Telekom International Finance BV 2.82% 20222 | 4,875 | 4,744 |
| Deutsche Telekom International Finance BV 2.485% 20232 | 7,500 | 7,030 |
| Deutsche Telekom International Finance BV 4.375% 20282 | 7,500 | 7,360 |
| Frontier Communications Corp. 6.25% 2021 | 600 | 526 |
| Frontier Communications Corp. 10.50% 2022 | 5,250 | 4,397 |
| Frontier Communications Corp. 11.00% 2025 | 4,800 | 3,540 |
| Inmarsat PLC 6.50% 20242 | 3,619 | 3,578 |
| McGraw-Hill Global Education Holdings, LLC, Term Loan B, (3-month USD-LIBOR + 4.00%) 6.242% 20229,10,11 | 3,528 | 3,385 |
| NBC Universal Enterprise, Inc. 5.25% 20492 | 21,995 | 22,325 |
| Sirius XM Radio Inc. 5.00% 20272 | 6,475 | 6,117 |
| SoftBank Group Corp. 3.36% 20232,9 | 7,500 | 7,444 |
| Sprint Corp. 6.90% 2019 | 17,200 | 17,468 |
| Sprint Corp. 11.50% 2021 | 124,685 | 146,817 |
| Sprint Corp. 7.875% 2023 | 42,000 | 44,940 |
| Thomson Reuters Corp. 4.30% 2023 | 1,245 | 1,257 |
| Thomson Reuters Corp. 5.65% 2043 | 1,190 | 1,231 |
| Time Warner Cable Inc. 5.00% 2020 | 10,000 | 10,161 |
| Time Warner Inc. 3.80% 2027 | 4,535 | 4,253 |
| T-Mobile US, Inc. 6.375% 2025 | 3,600 | 3,721 |
| T-Mobile US, Inc. 6.50% 2026 | 10,650 | 11,262 |
| Univision Communications Inc. 6.75% 20222 | 1,039 | 1,062 |
| Univision Communications Inc. 5.125% 20232 | 8,505 | 8,033 |
| Bonds, notes & other debt instruments Corporate bonds & notes (continued) Communication services (continued) | Principal amount (000) | Value (000) |
| Verizon Communications Inc. 4.125% 2027 | $4,676 | $4,634 |
| Verizon Communications Inc. 4.50% 2033 | 27,265 | 26,554 |
| Verizon Communications Inc. 4.125% 2046 | 3,500 | 3,027 |
| Vodafone Group PLC 4.375% 2028 | 32,284 | 31,211 |
| Vodafone Group PLC 5.25% 2048 | 16,377 | 15,458 |
| 613,026 | ||
| Consumer staples 0.56% | ||
| Altria Group, Inc. 9.25% 2019 | 3,834 | 4,016 |
| Altria Group, Inc. 2.625% 2020 | 4,340 | 4,313 |
| Altria Group, Inc. 4.75% 2021 | 1,500 | 1,543 |
| Altria Group, Inc. 2.95% 2023 | 3,800 | 3,681 |
| Altria Group, Inc. 4.00% 2024 | 3,000 | 3,007 |
| Altria Group, Inc. 2.625% 2026 | 1,375 | 1,237 |
| Anheuser-Busch InBev NV 6.875% 2019 | 16,000 | 16,597 |
| Anheuser-Busch InBev NV 2.65% 2021 | 1,640 | 1,609 |
| Anheuser-Busch InBev NV 3.65% 2026 | 19,850 | 18,857 |
| Anheuser-Busch InBev NV 4.90% 2046 | 9,010 | 8,539 |
| Anheuser-Busch InBev NV 4.60% 2048 | 12,258 | 11,078 |
| British American Tobacco PLC 2.764% 20222 | 5,970 | 5,720 |
| British American Tobacco PLC 3.222% 20242 | 2,500 | 2,362 |
| British American Tobacco PLC 3.557% 20272 | 52,725 | 48,435 |
| British American Tobacco PLC 4.39% 20372 | 2,500 | 2,238 |
| British American Tobacco PLC 4.54% 20472 | 15,865 | 13,866 |
| Coca-Cola Co. 2.20% 2022 | 5,250 | 5,069 |
| Conagra Brands, Inc. 4.60% 2025 | 7,685 | 7,702 |
| Conagra Brands, Inc. 4.85% 2028 | 15,000 | 14,985 |
| Constellation Brands, Inc. 2.25% 2020 | 10,000 | 9,768 |
| Constellation Brands, Inc. 2.65% 2022 | 4,445 | 4,260 |
| Constellation Brands, Inc. 2.70% 2022 | 415 | 399 |
| Constellation Brands, Inc. 3.50% 2027 | 775 | 718 |
| Constellation Brands, Inc. 4.50% 2047 | 445 | 401 |
| Costco Wholesale Corp. 2.15% 2021 | 2,500 | 2,440 |
| Costco Wholesale Corp. 2.30% 2022 | 12,500 | 12,076 |
| Costco Wholesale Corp. 2.75% 2024 | 1,500 | 1,446 |
| General Mills, Inc. (3-month USD-LIBOR + 0.54%) 2.976% 202110 | 11,975 | 11,969 |
| General Mills, Inc. 3.20% 2021 | 2,840 | 2,821 |
| Keurig Dr. Pepper Inc. 3.551% 20212 | 9,105 | 9,068 |
| Keurig Dr. Pepper Inc. 4.057% 20232 | 10,650 | 10,597 |
| Keurig Dr. Pepper Inc. 4.597% 20282 | 26,497 | 26,168 |
| Keurig Dr. Pepper Inc. 4.985% 20382 | 5,351 | 5,167 |
| Keurig Dr. Pepper Inc. 5.085% 20482 | 18,667 | 17,940 |
| Molson Coors Brewing Co. 1.45% 2019 | 625 | 618 |
| Molson Coors Brewing Co. 1.90% 2019 | 430 | 428 |
| Molson Coors Brewing Co. 2.25% 2020 | 735 | 725 |
| Molson Coors Brewing Co. 2.10% 2021 | 2,920 | 2,797 |
| Molson Coors Brewing Co. 3.00% 2026 | 7,640 | 6,814 |
| Molson Coors Brewing Co. 4.20% 2046 | 5,480 | 4,635 |
| Nestle Holdings, Inc. 3.35% 20232 | 14,000 | 13,916 |
| PepsiCo, Inc. 2.00% 2021 | 1,750 | 1,698 |
| PepsiCo, Inc. 2.25% 2022 | 1,500 | 1,447 |
| Philip Morris International Inc. 2.00% 2020 | 4,175 | 4,114 |
| Philip Morris International Inc. 2.375% 2022 | 5,595 | 5,357 |
| Philip Morris International Inc. 2.50% 2022 | 11,000 | 10,556 |
| Bonds, notes & other debt instruments Corporate bonds & notes (continued) Consumer staples (continued) | Principal amount (000) | Value (000) |
| Philip Morris International Inc. 2.625% 2022 | $6,125 | $5,966 |
| Philip Morris International Inc. 3.375% 2025 | 2,500 | 2,414 |
| Philip Morris International Inc. 4.25% 2044 | 11,090 | 10,005 |
| Reckitt Benckiser Group PLC 2.375% 20222 | 10,370 | 9,916 |
| Reckitt Benckiser Treasury Services PLC 2.75% 20242 | 2,215 | 2,081 |
| Reynolds American Inc. 3.25% 2020 | 7,355 | 7,334 |
| Reynolds American Inc. 4.00% 2022 | 4,500 | 4,513 |
| Reynolds American Inc. 4.45% 2025 | 21,000 | 20,923 |
| Reynolds American Inc. 5.85% 2045 | 10,062 | 10,350 |
| Wal-Mart Stores, Inc. 3.55% 2025 | 80,000 | 79,783 |
| Wal-Mart Stores, Inc. 3.70% 2028 | 12,000 | 11,836 |
| WM. Wrigley Jr. Co. 2.90% 20192 | 2,000 | 1,995 |
| WM. Wrigley Jr. Co. 3.375% 20202 | 43,185 | 43,194 |
| 553,507 | ||
| Consumer discretionary 0.47% | ||
| Amazon.com, Inc. 2.80% 2024 | 91,000 | 86,913 |
| Amazon.com, Inc. 3.15% 2027 | 18,435 | 17,397 |
| Amazon.com, Inc. 3.875% 2037 | 8,750 | 8,267 |
| Amazon.com, Inc. 4.05% 2047 | 10,000 | 9,406 |
| Bayerische Motoren Werke AG 1.45% 20192 | 10,210 | 10,059 |
| Cedar Fair, LP 5.375% 2027 | 5,000 | 4,794 |
| DaimlerChrysler North America Holding Corp. 2.70% 20202 | 1,500 | 1,479 |
| DaimlerChrysler North America Holding Corp. 3.00% 20212 | 2,500 | 2,469 |
| DaimlerChrysler North America Holding Corp. 3.30% 20252 | 6,750 | 6,395 |
| Ford Motor Co. 5.291% 2046 | 15,000 | 12,604 |
| Ford Motor Credit Co. 2.597% 2019 | 810 | 801 |
| Ford Motor Credit Co. 3.219% 2022 | 4,390 | 4,199 |
| Ford Motor Credit Co. 3.664% 2024 | 1,000 | 911 |
| General Motors Co. 4.35% 2025 | 11,555 | 11,146 |
| General Motors Co. 5.20% 2045 | 3,920 | 3,415 |
| General Motors Co. 5.40% 2048 | 18,500 | 16,441 |
| General Motors Co. 5.95% 2049 | 5,000 | 4,691 |
| General Motors Financial Co. 3.70% 2020 | 15,890 | 15,867 |
| Home Depot, Inc. 4.40% 2021 | 10,000 | 10,250 |
| Hyundai Capital America 2.55% 20202 | 3,000 | 2,946 |
| Hyundai Capital America 2.75% 20202 | 5,000 | 4,901 |
| Hyundai Capital America 3.25% 20222 | 10,000 | 9,653 |
| International Game Technology 6.25% 20272 | 5,000 | 4,947 |
| Lennar Corp. 8.375% 2021 | 5,000 | 5,412 |
| Limited Brands, Inc. 5.25% 2028 | 5,250 | 4,482 |
| Lowe’s Companies, Inc. 4.05% 2047 | 4 | 4 |
| McDonald’s Corp. 2.625% 2022 | 1,035 | 1,007 |
| McDonald’s Corp. 3.70% 2026 | 7,015 | 6,856 |
| McDonald’s Corp. 3.50% 2027 | 9,985 | 9,546 |
| McDonald’s Corp. 4.875% 2045 | 5,600 | 5,621 |
| McDonald’s Corp. 4.45% 2047 | 13,950 | 13,096 |
| McDonald’s Corp. 4.45% 2048 | 3,000 | 2,819 |
| MGM Resorts International 5.75% 2025 | 7,500 | 7,350 |
| MGM Resorts International 4.625% 2026 | 4,925 | 4,469 |
| Morongo Band of Mission Indians, 7.00% 20392,9 | 5,000 | 4,989 |
| Netflix, Inc. 5.875% 20282 | 45,000 | 44,437 |
| Newell Rubbermaid Inc. 2.60% 2019 | 1,210 | 1,207 |
| Newell Rubbermaid Inc. 3.15% 2021 | 805 | 789 |
| Bonds, notes & other debt instruments Corporate bonds & notes (continued) Consumer discretionary (continued) | Principal amount (000) | Value (000) |
| NIKE, Inc. 3.875% 2045 | $7,145 | $6,605 |
| Petsmart, Inc. 7.125% 20232 | 7,100 | 5,005 |
| Petsmart, Inc. 5.875% 20252 | 5,645 | 4,445 |
| S.A.C.I. Falabella 3.75% 20272 | 4,560 | 4,145 |
| Sally Holdings LLC and Sally Capital Inc. 5.625% 2025 | 8,000 | 7,470 |
| Sands China Ltd. 4.60% 20232 | 13,500 | 13,349 |
| Sands China Ltd. 5.40% 20282 | 28,500 | 27,309 |
| Starbucks Corp. 4.00% 2028 | 6,480 | 6,308 |
| Starbucks Corp. 4.30% 2045 | 875 | 789 |
| Starbucks Corp. 3.75% 2047 | 3,885 | 3,217 |
| Starbucks Corp. 4.50% 2048 | 17,215 | 16,031 |
| Volkswagen Group of America Finance, LLC 2.40% 20202 | 4,070 | 3,997 |
| Wynn Las Vegas, LLC and Wynn Capital Corp. 5.25% 20272 | 7,820 | 7,087 |
| YUM! Brands, Inc. 4.75% 20272 | 5,000 | 4,713 |
| 472,505 | ||
| Industrials 0.22% | ||
| 3M Co. 2.25% 2023 | 3,500 | 3,355 |
| 3M Co. 2.25% 2026 | 3,625 | 3,270 |
| 3M Co. 3.625% 2028 | 13,780 | 13,641 |
| Airbus Group SE 2.70% 20232 | 4,445 | 4,283 |
| American Airlines, Inc. 5.50% 20192 | 2,000 | 2,028 |
| American Airlines, Inc., Series 2013-2, Class A, 4.95% 20249 | 333 | 341 |
| ARAMARK Corp. 5.00% 20282 | 5,000 | 4,756 |
| BNSF Funding Trust I 6.613% 2055 (3-month USD-LIBOR + 2.35% on 1/15/2026)7 | 6,700 | 7,336 |
| Camelot Finance SA, Term Loan, (3-month USD-LIBOR + 3.25%) 5.52% 20239,10,11 | 1,920 | 1,922 |
| Canadian National Railway Co. 3.20% 2046 | 1,480 | 1,222 |
| Continental Airlines, Inc., Series 2001-1, Class A-1, 6.703% 20229 | 935 | 1,000 |
| Continental Airlines, Inc., Series 2000-2, Class A1, 7.707% 20229 | 2,419 | 2,552 |
| Continental Airlines, Inc., Series 2000-1, Class A1, 8.048% 20229 | 3,775 | 3,910 |
| CSX Corp. 3.80% 2028 | 1,885 | 1,822 |
| Deck Chassis Acquisition Inc. 10.00% 20232 | 9,900 | 10,296 |
| ERAC USA Finance Co. 2.70% 20232 | 13,700 | 12,884 |
| FedEx Corp. 4.95% 2048 | 3,000 | 2,927 |
| General Electric Capital Corp. 2.342% 2020 | 5,984 | 5,803 |
| Harris Corp. 2.70% 2020 | 1,530 | 1,514 |
| Harris Corp. 3.832% 2025 | 410 | 400 |
| Lockheed Martin Corp. 1.85% 2018 | 1,685 | 1,684 |
| Lockheed Martin Corp. 2.50% 2020 | 5,020 | 4,932 |
| Lockheed Martin Corp. 3.10% 2023 | 1,910 | 1,872 |
| Lockheed Martin Corp. 3.55% 2026 | 6,000 | 5,866 |
| Lockheed Martin Corp. 4.50% 2036 | 1,960 | 1,984 |
| Lockheed Martin Corp. 4.70% 2046 | 6,570 | 6,686 |
| Norfolk Southern Corp. 3.65% 2025 | 10,000 | 9,872 |
| Northrop Grumman Corp. 2.55% 2022 | 10,020 | 9,642 |
| Northrop Grumman Corp. 3.25% 2028 | 19,675 | 18,196 |
| Rockwell Collins, Inc. 2.80% 2022 | 1,215 | 1,179 |
| Roper Technologies, Inc. 2.80% 2021 | 690 | 672 |
| Siemens AG 2.70% 20222 | 10,750 | 10,458 |
| Union Pacific Corp. 3.95% 2028 | 2,529 | 2,493 |
| Union Pacific Corp. 4.50% 2048 | 1,000 | 973 |
| United Rentals, Inc. 5.875% 2026 | 7,500 | 7,378 |
| United Rentals, Inc. 6.50% 2026 | 7,130 | 7,228 |
| United Technologies Corp. 2.30% 2022 | 1,185 | 1,136 |
| Bonds, notes & other debt instruments Corporate bonds & notes (continued) Industrials (continued) | Principal amount (000) | Value (000) |
| United Technologies Corp. 3.125% 2027 | $12,375 | $11,404 |
| United Technologies Corp. 4.125% 2028 | 31,405 | 30,968 |
| Westinghouse Air Brake Technologies Corp. (dba Wabtec Corp.) 4.15% 2024 | 4,005 | 3,916 |
| 223,801 | ||
| Materials 0.20% | ||
| Ball Corp. 4.375% 2020 | 1,225 | 1,228 |
| CF Industries, Inc. 5.375% 2044 | 3,500 | 3,093 |
| Chemours Co. 5.375% 2027 | 5,700 | 5,315 |
| Consolidated Energy Finance SA 6.50% 20262 | 3,060 | 3,049 |
| Dow Chemical Co. 4.125% 2021 | 2,650 | 2,691 |
| Dow Chemical Co. 4.625% 2044 | 1,250 | 1,150 |
| Ecolab Inc. 4.35% 2021 | 1,224 | 1,256 |
| First Quantum Minerals Ltd. 7.00% 20212 | 15,384 | 15,076 |
| First Quantum Minerals Ltd. 7.25% 20222 | 87,125 | 83,204 |
| Freeport-McMoRan Inc. 5.45% 2043 | 2,275 | 1,939 |
| International Flavors & Fragrances Inc. 5.00% 2048 | 7,150 | 7,041 |
| LYB International Finance BV 4.875% 2044 | 500 | 461 |
| LyondellBasell Industries NV 6.00% 2021 | 2,700 | 2,849 |
| Mosaic Co. 4.25% 2023 | 1,700 | 1,711 |
| Nova Chemicals Corp. 5.25% 20272 | 7,755 | 7,018 |
| Nutrien Ltd. 5.875% 2036 | 350 | 375 |
| Olin Corp. 5.125% 2027 | 7,145 | 6,690 |
| Olin Corp. 5.00% 2030 | 1,850 | 1,668 |
| Owens-Illinois, Inc. 6.375% 20252 | 5,000 | 5,050 |
| Praxair, Inc. 3.00% 2021 | 2,500 | 2,487 |
| Praxair, Inc. 2.20% 2022 | 1,000 | 958 |
| SABIC Capital II BV 4.00% 20232 | 7,995 | 7,920 |
| Sherwin-Williams Co. 2.75% 2022 | 1,560 | 1,503 |
| Sherwin-Williams Co. 3.125% 2024 | 330 | 314 |
| Sherwin-Williams Co. 3.45% 2027 | 23,785 | 22,032 |
| Sherwin-Williams Co. 4.50% 2047 | 3,055 | 2,754 |
| SPCM SA 4.875% 20252 | 9,999 | 9,274 |
| Westlake Chemical Corp. 5.00% 2046 | 1,985 | 1,867 |
| Westlake Chemical Corp. 4.375% 2047 | 1,280 | 1,088 |
| Yara International ASA 7.875% 20192 | 2,225 | 2,286 |
| 203,347 | ||
| Real estate 0.19% | ||
| Alexandria Real Estate Equities, Inc. 3.90% 2023 | 2,400 | 2,401 |
| Alexandria Real Estate Equities, Inc. 4.30% 2026 | 1,400 | 1,379 |
| Alexandria Real Estate Equities, Inc. 3.95% 2028 | 1,845 | 1,760 |
| Alexandria Real Estate Equities, Inc. 4.50% 2029 | 605 | 595 |
| American Campus Communities, Inc. 3.35% 2020 | 2,200 | 2,193 |
| American Campus Communities, Inc. 3.75% 2023 | 10,190 | 10,047 |
| American Campus Communities, Inc. 4.125% 2024 | 5,000 | 4,954 |
| American Campus Communities, Inc. 3.625% 2027 | 12,410 | 11,529 |
| Brandywine Operating Partnership, LP 3.95% 2023 | 170 | 169 |
| Camden Property Trust 4.10% 2028 | 7,000 | 6,962 |
| Corporate Office Properties LP 5.25% 2024 | 590 | 607 |
| Corporate Office Properties LP 5.00% 2025 | 2,170 | 2,186 |
| EPR Properties 4.50% 2025 | 3,635 | 3,561 |
| EPR Properties 4.75% 2026 | 1,935 | 1,871 |
| Equinix, Inc. 5.875% 2026 | 5,000 | 5,088 |
| Bonds, notes & other debt instruments Corporate bonds & notes (continued) Real estate (continued) | Principal amount (000) | Value (000) |
| Essex Portfolio LP 3.625% 2022 | $410 | $406 |
| Essex Portfolio LP 3.25% 2023 | 7,845 | 7,609 |
| Essex Portfolio LP 3.875% 2024 | 2,335 | 2,314 |
| Gaming and Leisure Properties, Inc. 5.375% 2026 | 5,000 | 4,981 |
| Gaming and Leisure Properties, Inc. 5.75% 2028 | 7,500 | 7,631 |
| Hospitality Properties Trust 5.00% 2022 | 2,000 | 2,043 |
| Hospitality Properties Trust 4.50% 2023 | 5,980 | 5,989 |
| Hospitality Properties Trust 4.50% 2025 | 1,965 | 1,899 |
| Hospitality Properties Trust 3.95% 2028 | 4,150 | 3,720 |
| Host Hotels & Resorts LP 4.50% 2026 | 650 | 641 |
| Howard Hughes Corp. 5.375% 20252 | 3,745 | 3,614 |
| Iron Mountain Inc. 4.875% 20272 | 740 | 662 |
| Iron Mountain Inc. 5.25% 20282 | 8,010 | 7,229 |
| iStar Inc. 4.625% 2020 | 3,200 | 3,184 |
| Kimco Realty Corp. 3.40% 2022 | 2,470 | 2,429 |
| Kimco Realty Corp. 3.125% 2023 | 3,175 | 3,048 |
| Kimco Realty Corp. 3.30% 2025 | 5,000 | 4,731 |
| Kimco Realty Corp. 4.45% 2047 | 2,265 | 2,032 |
| Public Storage 3.094% 2027 | 955 | 886 |
| Scentre Group 2.375% 20192 | 3,950 | 3,912 |
| Scentre Group 2.375% 20212 | 4,220 | 4,077 |
| Scentre Group 3.25% 20252 | 4,155 | 3,876 |
| Scentre Group 3.50% 20252 | 9,000 | 8,601 |
| Select Income REIT 4.15% 2022 | 1,035 | 1,020 |
| WEA Finance LLC 2.70% 20192 | 9,415 | 9,384 |
| WEA Finance LLC 3.25% 20202 | 22,370 | 22,272 |
| Westfield Corp. Ltd. 3.15% 20222 | 14,685 | 14,386 |
| 187,878 | ||
| Information technology 0.12% | ||
| Apple Inc. 1.55% 2021 | 12,130 | 11,610 |
| Apple Inc. 2.90% 2027 | 15,625 | 14,492 |
| Apple Inc. 3.20% 2027 | 2,875 | 2,737 |
| Apple Inc. 3.35% 2027 | 7,140 | 6,886 |
| Broadcom Ltd. 3.00% 2022 | 21,750 | 21,070 |
| Broadcom Ltd. 3.625% 2024 | 6,875 | 6,590 |
| Broadcom Ltd. 3.875% 2027 | 24,100 | 22,139 |
| Broadcom Ltd. 3.50% 2028 | 5,015 | 4,424 |
| Infor (US), Inc. 5.75% 20202 | 1,475 | 1,494 |
| International Business Machines Corp. 3.375% 2023 | 5,000 | 4,931 |
| Microsoft Corp. 1.55% 2021 | 1,625 | 1,557 |
| Microsoft Corp. 2.875% 2024 | 5,150 | 4,996 |
| Microsoft Corp. 3.30% 2027 | 2,460 | 2,388 |
| Microsoft Corp. 3.70% 2046 | 900 | 830 |
| NXP BV and NXP Funding LLC 4.125% 20202 | 1,500 | 1,500 |
| NXP BV and NXP Funding LLC 4.125% 20212 | 1,250 | 1,248 |
| Oracle Corp. (3-month USD-LIBOR + 0.58%) 3.016% 201910 | 5,000 | 5,005 |
| Oracle Corp. 1.90% 2021 | 4,750 | 4,564 |
| Oracle Corp. 4.00% 2046 | 2,000 | 1,806 |
| 120,267 | ||
| Total corporate bonds & notes | 5,887,865 |
| Bonds, notes & other debt instruments Mortgage-backed obligations 3.48% | Principal amount (000) | Value (000) |
| Arroyo Mortgage Trust, Series 2018-1, Class A1, 3.763% 20482,9,10 | $22,805 | $22,822 |
| Banc of America Mortgage Securities Inc., Series 2004-B, Class 1A1, 3.996% 20349,10 | 16 | 16 |
| Bear Stearns ARM Trust, Series 2003-8, Class IIIA, 3.723% 20349,10 | 612 | 578 |
| CS First Boston Mortgage Securities Corp., Series 2002-30, Class IA1, 7.50% 20329 | 212 | 236 |
| CS First Boston Mortgage Securities Corp., Series 2002-34, Class IA1, 7.50% 20329 | 116 | 126 |
| CS First Boston Mortgage Securities Corp., Series 2003-21, Class VA1, 6.50% 20339 | 165 | 177 |
| Fannie Mae 4.50% 20209 | 56 | 57 |
| Fannie Mae 6.00% 20219 | 257 | 264 |
| Fannie Mae 4.50% 20249 | 3,582 | 3,675 |
| Fannie Mae 4.50% 20249 | 866 | 886 |
| Fannie Mae 6.00% 20249 | 10 | 11 |
| Fannie Mae 3.50% 20339,13 | 39,938 | 39,907 |
| Fannie Mae 5.50% 20339 | 215 | 230 |
| Fannie Mae 6.00% 20369 | 3,477 | 3,790 |
| Fannie Mae 6.00% 20369 | 2,755 | 3,008 |
| Fannie Mae 6.00% 20369 | 2,323 | 2,535 |
| Fannie Mae 6.00% 20369 | 1,695 | 1,852 |
| Fannie Mae 6.00% 20369 | 633 | 689 |
| Fannie Mae 5.50% 20379 | 264 | 283 |
| Fannie Mae 6.50% 20379 | 961 | 1,070 |
| Fannie Mae 6.50% 20379 | 150 | 165 |
| Fannie Mae 6.50% 20379 | 140 | 145 |
| Fannie Mae 7.00% 20379 | 212 | 230 |
| Fannie Mae 7.50% 20379 | 310 | 338 |
| Fannie Mae 5.50% 20389 | 2,023 | 2,169 |
| Fannie Mae 5.50% 20389 | 2,017 | 2,168 |
| Fannie Mae 5.50% 20389 | 844 | 907 |
| Fannie Mae 5.50% 20389 | 489 | 525 |
| Fannie Mae 5.50% 20389 | 193 | 205 |
| Fannie Mae 6.00% 20389 | 1,214 | 1,326 |
| Fannie Mae 7.00% 20389 | 45 | 50 |
| Fannie Mae 5.50% 20399 | 171 | 182 |
| Fannie Mae 4.00% 20409 | 557 | 562 |
| Fannie Mae 6.00% 20409 | 8,337 | 9,103 |
| Fannie Mae 4.00% 20419 | 925 | 933 |
| Fannie Mae 4.00% 20419 | 556 | 561 |
| Fannie Mae 4.00% 20419 | 510 | 514 |
| Fannie Mae 4.00% 20419 | 243 | 245 |
| Fannie Mae 5.00% 20419 | 8,907 | 9,426 |
| Fannie Mae 6.00% 20419 | 5,908 | 6,491 |
| Fannie Mae 4.00% 20429 | 21,498 | 21,670 |
| Fannie Mae 4.00% 20429 | 12,722 | 12,825 |
| Fannie Mae 4.00% 20429 | 4,417 | 4,454 |
| Fannie Mae 4.00% 20429 | 3,169 | 3,195 |
| Fannie Mae 4.00% 20429 | 2,087 | 2,104 |
| Fannie Mae 4.00% 20429 | 1,467 | 1,479 |
| Fannie Mae 4.50% 20439 | 4,113 | 4,237 |
| Fannie Mae 4.00% 20449 | 10,707 | 10,769 |
| Fannie Mae 4.00% 20449 | 6,699 | 6,738 |
| Fannie Mae 4.00% 20449 | 6,471 | 6,508 |
| Fannie Mae 4.00% 20459 | 14,672 | 14,757 |
| Fannie Mae 3.00% 20469 | 69,859 | 66,179 |
| Fannie Mae 3.50% 20469 | 2,382 | 2,330 |
| Fannie Mae 4.00% 20469 | 42,762 | 42,949 |
| Fannie Mae 4.00% 20469 | 27,963 | 28,084 |
| Bonds, notes & other debt instruments Mortgage-backed obligations (continued) | Principal amount (000) | Value (000) |
| Fannie Mae 4.00% 20469 | $21,050 | $21,156 |
| Fannie Mae 4.00% 20469 | 19,732 | 19,795 |
| Fannie Mae 4.00% 20469 | 18,292 | 18,371 |
| Fannie Mae 4.00% 20469 | 15,356 | 15,405 |
| Fannie Mae 4.00% 20469 | 11,434 | 11,471 |
| Fannie Mae 4.00% 20469 | 6,409 | 6,437 |
| Fannie Mae 4.00% 20469 | 6,319 | 6,340 |
| Fannie Mae 4.00% 20469 | 4,822 | 4,838 |
| Fannie Mae 4.00% 20469 | 4,787 | 4,808 |
| Fannie Mae 4.50% 20469 | 4,126 | 4,236 |
| Fannie Mae 4.00% 20479 | 132,936 | 133,067 |
| Fannie Mae 4.00% 20479 | 45,485 | 45,530 |
| Fannie Mae 4.00% 20479 | 29,948 | 29,981 |
| Fannie Mae 4.00% 20479 | 25,490 | 25,605 |
| Fannie Mae 4.00% 20479 | 18,972 | 19,031 |
| Fannie Mae 4.00% 20479 | 11,862 | 11,900 |
| Fannie Mae 4.00% 20479 | 9,263 | 9,293 |
| Fannie Mae 4.00% 20479 | 2,949 | 2,954 |
| Fannie Mae 4.50% 20479 | 85,262 | 87,416 |
| Fannie Mae 4.50% 20479 | 67,327 | 69,029 |
| Fannie Mae 4.50% 20479 | 50,776 | 52,373 |
| Fannie Mae 7.00% 20479 | 58 | 63 |
| Fannie Mae 4.00% 20489,13 | 113,063 | 113,071 |
| Fannie Mae 4.50% 20489,13 | 303,650 | 310,464 |
| Fannie Mae 4.50% 20489 | 76,692 | 78,682 |
| Fannie Mae 4.50% 20489 | 74,009 | 75,907 |
| Fannie Mae 4.50% 20489 | 64,677 | 66,355 |
| Fannie Mae 4.50% 20489,13 | 59,290 | 60,713 |
| Fannie Mae 4.50% 20489 | 18,662 | 19,135 |
| Fannie Mae, Series 2006-78, Class CG, 4.50% 20219 | 1 | 1 |
| Fannie Mae, Series 2001-25, Class ZA, 6.50% 20319 | 463 | 483 |
| Fannie Mae, Series 2006-65, Class PF, (1-month USD-LIBOR + 0.28%) 2.561% 20369,10 | 1,320 | 1,312 |
| Fannie Mae, Series 2001-50, Class BA, 7.00% 20419 | 65 | 72 |
| Fannie Mae, Series 2002-W3, Class A5, 7.50% 20419 | 69 | 78 |
| Fannie Mae, Series 2017-M7, Class A2, Multi Family, 2.961% 20279,10 | 2,890 | 2,737 |
| Fannie Mae, Series 2006-32, Class OA, principal only, 0% 20369 | 1,415 | 1,169 |
| Fannie Mae, Series 2006-51, Class PO, principal only, 0% 20369 | 930 | 798 |
| Fannie Mae, Series 2006-96, Class OP, principal only, 0% 20369 | 309 | 261 |
| Fannie Mae, Series 2006-56, Class OG, principal only, 0% 20369 | 179 | 146 |
| Flagstar Mortgage Trust, Series 2018-3INV, Class A3, 4.00% 20482,9 | 28,467 | 28,259 |
| Freddie Mac 5.50% 20239 | 565 | 581 |
| Freddie Mac 3.50% 20339 | 53,921 | 53,988 |
| Freddie Mac 3.50% 20339 | 13,500 | 13,507 |
| Freddie Mac 5.00% 20389 | 1,175 | 1,241 |
| Freddie Mac 5.50% 20389 | 2,211 | 2,376 |
| Freddie Mac 5.00% 20399 | 9,167 | 9,685 |
| Freddie Mac 4.00% 20409 | 1,426 | 1,440 |
| Freddie Mac 6.00% 20409 | 89 | 98 |
| Freddie Mac 4.50% 20419 | 14,885 | 15,432 |
| Freddie Mac 4.50% 20419 | 538 | 558 |
| Freddie Mac 5.00% 20419 | 316 | 334 |
| Freddie Mac 5.50% 20419 | 4,139 | 4,441 |
| Freddie Mac 4.00% 20429 | 13,243 | 13,371 |
| Freddie Mac 4.50% 20439 | 1,777 | 1,824 |
| Freddie Mac 3.098% 20459,10 | 4,055 | 4,066 |
| Bonds, notes & other debt instruments Mortgage-backed obligations (continued) | Principal amount (000) | Value (000) |
| Freddie Mac 3.50% 20459 | $35,688 | $35,012 |
| Freddie Mac 3.50% 20469 | 423 | 409 |
| Freddie Mac 4.00% 20469 | 28,888 | 28,987 |
| Freddie Mac 4.00% 20469 | 15,956 | 16,010 |
| Freddie Mac 4.00% 20469 | 15,397 | 15,456 |
| Freddie Mac 4.00% 20469 | 4,025 | 4,040 |
| Freddie Mac 3.50% 20479 | 100,022 | 97,484 |
| Freddie Mac 3.50% 20479 | 23,555 | 22,957 |
| Freddie Mac 3.50% 20479 | 10,628 | 10,358 |
| Freddie Mac 3.50% 20479 | 7,254 | 7,070 |
| Freddie Mac 4.00% 20479 | 92,849 | 93,113 |
| Freddie Mac 4.50% 20479 | 1,892 | 1,943 |
| Freddie Mac 4.50% 20479 | 1,150 | 1,179 |
| Freddie Mac 6.50% 20479 | 332 | 353 |
| Freddie Mac 4.00% 20489,13 | 103,719 | 103,763 |
| Freddie Mac 4.00% 20489 | 14,091 | 14,112 |
| Freddie Mac 4.50% 20489 | 81,826 | 83,896 |
| Freddie Mac 4.50% 20489,13 | 53,600 | 54,900 |
| Freddie Mac 4.50% 20489 | 18,392 | 18,857 |
| Freddie Mac, Series 2890, Class KT, 4.50% 20199 | 25 | 25 |
| Freddie Mac, Series 2642, Class BL, 3.50% 20239 | 113 | 113 |
| Freddie Mac, Series 2122, Class QM, 6.25% 20299 | 1,314 | 1,377 |
| Freddie Mac, Series K716, Class A2, Multi Family, 3.13% 20219 | 8,590 | 8,569 |
| Freddie Mac, Series K023, Class A2, Multi Family, 2.307% 20229 | 18,009 | 17,455 |
| Freddie Mac, Series K020, Class A2, Multi Family, 2.373% 20229 | 10,110 | 9,848 |
| Freddie Mac, Series K021, Class A2, Multi Family, 2.396% 20229 | 41,420 | 40,349 |
| Freddie Mac, Series K024, Class A2, Multi Family, 2.573% 20229 | 5,965 | 5,822 |
| Freddie Mac, Series K718, Class A2, Multi Family, 2.791% 20229 | 11,565 | 11,397 |
| Freddie Mac, Series KS01, Class A2, Multi Family, 2.522% 20239 | 3,717 | 3,615 |
| Freddie Mac, Series K030, Class A2, Multi Family, 3.25% 20239 | 9,380 | 9,348 |
| Freddie Mac, Series K036, Class A2, Multi Family, 3.527% 20239 | 10,000 | 10,063 |
| Freddie Mac, Series K043, Class A2, Multi Family, 3.062% 20249 | 28,910 | 28,352 |
| Freddie Mac, Series K044, Class A2, Multi Family, 2.811% 20259 | 41,090 | 39,651 |
| Freddie Mac, Series K050, Class A2, Multi Family, 3.334% 20259 | 15,000 | 14,849 |
| Freddie Mac, Series K055, Class A2, Multi Family, 2.673% 20269 | 3,500 | 3,309 |
| Freddie Mac, Series K066, Class A2, Multi Family, 3.117% 20279 | 4,360 | 4,186 |
| Freddie Mac, Series K069, Class A2, Multi Family, 3.187% 20279,10 | 14,250 | 13,700 |
| Freddie Mac, Series K067, Class A2, Multi Family, 3.194% 20279 | 4,810 | 4,638 |
| Freddie Mac, Series K064, Class A2, Multi Family, 3.224% 20279,10 | 4,390 | 4,269 |
| Freddie Mac, Series K068, Class A2, Multi Family, 3.244% 20279 | 2,350 | 2,272 |
| Freddie Mac, Series K070, Class A2, Multi Family, 3.303% 20279,10 | 6,990 | 6,779 |
| Freddie Mac, Series 3135, Class OP, principal only, 0% 20269 | 496 | 453 |
| Freddie Mac, Series 3136, Class OP, principal only, 0% 20369 | 1,661 | 1,423 |
| Freddie Mac, Series 3155, Class FO, principal only, 0% 20369 | 927 | 812 |
| Freddie Mac, Series 3147, Class OD, principal only, 0% 20369 | 633 | 539 |
| Freddie Mac, Series 3149, Class MO, principal only, 0% 20369 | 482 | 433 |
| Freddie Mac, Series 3149, Class AO, principal only, 0% 20369 | 430 | 378 |
| Freddie Mac, Series 3117, Class OG, principal only, 0% 20369 | 265 | 235 |
| Freddie Mac Seasoned Credit Risk Transfer Trust, Series 2017-2, Class HA, 2.50% 20569 | 19,737 | 19,002 |
| Freddie Mac Seasoned Credit Risk Transfer Trust, Series 2017-2, Class MA, 3.00% 20569 | 18,727 | 18,059 |
| Freddie Mac Seasoned Credit Risk Transfer Trust, Series 2017-4, Class HT, 2.50% 20579,10 | 9,904 | 9,432 |
| Freddie Mac Seasoned Credit Risk Transfer Trust, Series 2018-2, Class MT, 3.50% 20579 | 15,374 | 14,976 |
| Freddie Mac Seasoned Credit Risk Transfer Trust, Series 2017-4, Class MT, 3.50% 20579 | 6,051 | 5,835 |
| Freddie Mac Seasoned Credit Risk Transfer Trust, Series 2017-4, Class M45T, 4.50% 20579 | 41,427 | 42,689 |
| Government National Mortgage Assn. 4.50% 20379 | 1,486 | 1,535 |
| Bonds, notes & other debt instruments Mortgage-backed obligations (continued) | Principal amount (000) | Value (000) |
| Government National Mortgage Assn. 6.00% 20399 | $2,328 | $2,516 |
| Government National Mortgage Assn. 6.50% 20399 | 394 | 425 |
| Government National Mortgage Assn. 3.50% 20409 | 242 | 239 |
| Government National Mortgage Assn. 5.00% 20409 | 2,284 | 2,382 |
| Government National Mortgage Assn. 5.50% 20409 | 3,023 | 3,200 |
| Government National Mortgage Assn. 4.50% 20419 | 2,467 | 2,541 |
| Government National Mortgage Assn. 5.00% 20419 | 2,916 | 3,037 |
| Government National Mortgage Assn. 6.50% 20419 | 1,483 | 1,625 |
| Government National Mortgage Assn. 4.50% 20459 | 39,079 | 40,653 |
| Government National Mortgage Assn. 4.50% 20459 | 5,282 | 5,494 |
| Government National Mortgage Assn. 4.50% 20459 | 3,654 | 3,801 |
| Government National Mortgage Assn. 3.50% 20489,13 | 66,375 | 65,199 |
| Government National Mortgage Assn. 4.50% 20489 | 82,000 | 84,240 |
| Government National Mortgage Assn. 5.00% 20489,13 | 332,951 | 346,191 |
| Government National Mortgage Assn. 5.00% 20489 | 50,000 | 52,151 |
| Government National Mortgage Assn. 5.00% 20489 | 1,094 | 1,143 |
| Government National Mortgage Assn. 4.501% 20619 | 649 | 652 |
| Government National Mortgage Assn. 4.546% 20629 | 3,277 | 3,297 |
| Government National Mortgage Assn. 4.614% 20629 | 1,359 | 1,371 |
| Government National Mortgage Assn. 4.766% 20629 | 980 | 990 |
| Government National Mortgage Assn. 5.024% 20649 | 86 | 87 |
| Government National Mortgage Assn. 5.038% 20649 | 148 | 149 |
| Government National Mortgage Assn. 5.048% 20649 | 97 | 99 |
| Government National Mortgage Assn. 5.069% 20649 | 101 | 103 |
| Government National Mortgage Assn. 5.046% 20659 | 81 | 82 |
| Government National Mortgage Assn., Series 2005-7, Class AO, principal only, 0% 20359 | 1,329 | 1,134 |
| Government National Mortgage Assn., Series 2007-8, Class LO, principal only, 0% 20379 | 939 | 824 |
| J.P. Morgan Chase Commercial Mortgage Securities Trust, Series 2006-LDP9, Class AM, 5.372% 20479 | 29 | 29 |
| Morgan Stanley Capital I Trust, Series 2011-C1, Class A4, 5.033% 20472,9,10 | 98 | 101 |
| Nationstar HECM Loan Trust, Series 2017-2A, Class A1, 2.0383% 20272,3,9,10 | 5,845 | 5,803 |
| Nationstar HECM Loan Trust, Series 2017-2A, Class M1, 2.8154% 20272,3,9 | 6,210 | 6,181 |
| Seasoned Loan Structured Transaction, Series 2018-1, Class A1, 3.50% 20289 | 1,421 | 1,411 |
| Sequoia Mortgage Trust, Series 2018-CH1, Class A1, 4.00% 20482,9,10 | 9,353 | 9,375 |
| Starwood Mortgage Residential Trust, Series 2018-IMC1, Class A1 3.793% 20482,9 | 17,487 | 17,528 |
| Towd Point Mortgage Trust, Series 2017-5, Class A1, 2.881% 20572,9,10 | 9,807 | 9,820 |
| 3,467,978 | ||
| Bonds & notes of governments & government agencies outside the U.S. 0.23% | ||
| Honduras (Republic of) 8.75% 2020 | 4,450 | 4,808 |
| Japan Bank for International Cooperation 2.125% 2020 | 21,400 | 21,043 |
| Panama (Republic of) 4.50% 20509 | 1,975 | 1,825 |
| Portuguese Republic 5.125% 2024 | 51,410 | 53,540 |
| Portuguese Republic 4.10% 2045 | €1,250 | 1,709 |
| Qatar (State of) 4.50% 20282 | $7,070 | 7,229 |
| Qatar (State of) 5.103% 20482 | 11,800 | 12,007 |
| Saudi Arabia (Kingdom of) 3.628% 20272 | 5,000 | 4,787 |
| Saudi Arabia (Kingdom of) 3.625% 20282 | 11,435 | 10,758 |
| Saudi Arabia (Kingdom of) 4.50% 20302 | 11,980 | 11,831 |
| Saudi Arabia (Kingdom of) 4.625% 20472 | 4,500 | 4,140 |
| Saudi Arabia (Kingdom of) 5.00% 20492 | 6,075 | 5,847 |
| United Mexican States 4.15% 2027 | 20,000 | 19,068 |
| United Mexican States, Series M, 6.50% 2021 | MXN1,520,500 | 71,221 |
| 229,813 |
| Bonds, notes & other debt instruments Asset-backed obligations 0.20% | Principal amount (000) | Value (000) |
| Aesop Funding LLC, Series 2013-2A, Class A, 2.97% 20202,9 | $8,230 | $8,231 |
| Aesop Funding LLC, Series 2014-2A, Class A, 2.50% 20212,9 | 7,500 | 7,429 |
| Aesop Funding LLC, Series 2016-1A, Class A, 2.99% 20222,9 | 4,010 | 3,946 |
| Angel Oak Capital Advisors LLC, Series 2013-9A, CLO, Class A1R, (3-month USD-LIBOR + 1.01%) 3.479% 20252,9,10 | 3,610 | 3,611 |
| CPS Auto Receivables Trust, Series 2016-A, Class B, 3.34% 20202,9 | 1,608 | 1,608 |
| CPS Auto Receivables Trust, Series 2016-A, Class C, 3.80% 20212,9 | 1,500 | 1,504 |
| CPS Auto Receivables Trust, Series 2015-A, Class C, 4.00% 20212,9 | 2,395 | 2,408 |
| CWABS, Inc., Series 2004-15, Class AF6, 4.613% 20359 | 89 | 90 |
| CWHEQ Revolving Home Equity Loan Trust, Series 2005-D, Class 2A, FSA insured, (1-month USD-LIBOR + 0.19%) 2.470% 20359,10 | 82 | 80 |
| CWHEQ Revolving Home Equity Loan Trust, Series 2006-F, Class 2A1A, FSA insured, (1-month USD-LIBOR + 0.14%) 2.420% 20369,10 | 4,002 | 3,809 |
| CWHEQ Revolving Home Equity Loan Trust, Series 2006-I, Class 2A, FSA insured, (1-month USD-LIBOR + 0.14%) 2.420% 20379,10 | 5,238 | 4,990 |
| CWHEQ Revolving Home Equity Loan Trust, Series 2007-B, Class A, FSA insured, (1-month USD-LIBOR + 0.15%) 2.430% 20379,10 | 11,089 | 10,700 |
| DRB Prime Student Loan Trust, Series 2015-D, Class A3, 2.50% 20362,9 | 386 | 384 |
| Drive Auto Receivables Trust, Series 2015-DA, Class C, 3.38% 20212,9 | 798 | 799 |
| Drive Auto Receivables Trust, Series 2016-AA, Class C, 3.91% 20212,9 | 4,475 | 4,487 |
| Drive Auto Receivables Trust, Series 2016-BA, Class C, 3.19% 20222,9 | 1,507 | 1,508 |
| Drivetime Auto Owner Trust, Series 2017-3A, Class A, 1.73% 20202,9 | 994 | 993 |
| Drivetime Auto Owner Trust, Series 2016-1A, Class C, 3.54% 20212,9 | 170 | 170 |
| Drivetime Auto Owner Trust, Series 2016-3A, Class C, 3.15% 20222,9 | 680 | 681 |
| Drivetime Auto Owner Trust, Series 2016-2A, Class C, 3.67% 20222,9 | 551 | 552 |
| Emerson Park Ltd., Series 2013-1A, CLO, Class A1AR, (3-month USD-LIBOR + 0.98%) 3.416% 20252,9,10 | 1,365 | 1,365 |
| Enterprise Fleet Financing LLC, Series 2017-1, Class A2, 2.13% 20222,9 | 3,810 | 3,788 |
| Exeter Automobile Receivables Trust, Series 2014-3A, Class C, 4.17% 20202,9 | 803 | 806 |
| Ford Credit Auto Owner Trust, Series 2017-1, Class A, 2.62% 20282,9 | 7,000 | 6,820 |
| Ford Credit Auto Owner Trust, Series 2018-2, Class A, 3.47% 20302,9 | 22,965 | 22,793 |
| Ford Credit Auto Owner Trust, Series 2018-1, Class A, 3.19% 20312,9 | 45,110 | 43,686 |
| IndyMac Home Equity Mortgage Loan Asset-Backed Trust, Series 2007-H1, Class A1, FSA insured, (1-month USD-LIBOR + 0.16%) 2.441% 20379,10 | 7,834 | 7,535 |
| Option One Mortgage Loan Trust, Series 2007-FXD2, Class IIA6, 5.68% 20379 | 2,377 | 2,331 |
| RAMP Trust, Series 2004-RS12, Class AI6, 4.547% 20349 | — | — |
| Santander Drive Auto Receivables Trust, Series 2015-2, Class C, 2.44% 20219 | 3,074 | 3,072 |
| Santander Drive Auto Receivables Trust, Series 2016-2, Class C, 2.66% 20219 | 1,855 | 1,849 |
| Santander Drive Auto Receivables Trust, Series 2015-3, Class C, 2.74% 20219 | 3,329 | 3,328 |
| Santander Drive Auto Receivables Trust, Series 2016-1, Class C, 3.09% 20229 | 7,550 | 7,555 |
| SLM Private Credit Student Loan Trust, Series 2008-7, Class A4, (3-month USD-LIBOR + 0.90%) 3.390% 20239,10 | 4,546 | 4,553 |
| SLM Private Credit Student Loan Trust, Series 2012-2, Class A, (1-month USD-LIBOR + 0.70%) 2.981% 20299,10 | 385 | 384 |
| Symphony Ltd., Series 2013-12A, CLO, Class AR, (3-month USD-LIBOR + 1.03%) 3.466% 20252,9,10 | 15,383 | 15,385 |
| Verizon Owner Trust, Series 2016-1A, Class A, 1.42% 20212,9 | 783 | 780 |
| Voya Ltd., Series 2014-3A, CLO, Class A1R, (3-month USD-LIBOR + 0.72%) 3.210% 20262,9,10 | 15,766 | 15,770 |
| Westlake Automobile Receivables Trust, Series 2016-1A, Class C, 3.29% 20212,9 | 336 | 336 |
| 200,116 | ||
| Federal agency bonds & notes 0.06% | ||
| Fannie Mae 1.25% 2021 | 30,500 | 29,132 |
| Fannie Mae 2.125% 2026 | 37,230 | 34,542 |
| 63,674 |
| Bonds, notes & other debt instruments Municipals 0.05% Illinois 0.02% | Principal amount (000) | Value (000) |
| G.O. Bonds, Pension Funding Series 2003, 5.10% 20339 | $24,030 | $22,714 |
| New Jersey 0.02% | ||
| Transportation Trust Fund Auth., Transportation System Rev. Ref. Bonds, Series 2013-B, 1.758% 2018 | 15,000 | 14,979 |
| California 0.01% | ||
| High-Speed Passenger Train G.O. Rev. Ref. Bonds, Series 2017-A, 2.367% 2022 | 3,875 | 3,779 |
| South Carolina 0.00% | ||
| Public Service Auth., Rev. Obligations (Santee Cooper), Series 2015-A, 5.00% 2055 | 1,605 | 1,659 |
| Public Service Auth., Rev. Obligations (Santee Cooper), Series 2015-E, 5.25% 2055 | 1,000 | 1,059 |
| 2,718 | ||
| Washington 0.00% | ||
| Energy Northwest, Columbia Generating Station Electric Rev. Bonds, Series 2015-B, 2.814% 2024 | 1,565 | 1,512 |
| 45,702 | ||
| Total bonds, notes & other debt instruments (cost: $26,056,863,000) | 25,268,291 | |
| Short-term securities 4.20% | ||
| CAFCO, LLC 2.25%–2.26% due 11/28/2018–12/10/20182 | 100,000 | 99,781 |
| Chariot Funding, LLC 2.45% due 1/16/20192 | 37,000 | 36,803 |
| Ciesco LLC 2.45% due 1/15/20192 | 68,000 | 67,647 |
| Coca-Cola Co. 2.27%–2.42% due 1/3/2019–1/23/20192 | 50,000 | 49,755 |
| ExxonMobil Corp. 2.22% due 11/26/2018 | 75,000 | 74,879 |
| Federal Farm Credit Banks 1.99%–2.03% due 11/2/2018–11/21/2018 | 75,000 | 74,966 |
| Federal Home Loan Bank 2.02%–2.30% due 11/1/2018–1/29/2019 | 1,528,200 | 1,525,153 |
| Freddie Mac 1.98%–2.27% due 11/2/2018–1/18/2019 | 175,000 | 174,814 |
| General Dynamics Corp. 2.22% due 11/6/20182 | 125,000 | 124,954 |
| IBM Corp. 2.29% due 12/17/20182 | 72,400 | 72,183 |
| IBM Credit LLC 2.30% due 12/14/20182 | 50,000 | 49,859 |
| John Deere Ltd. 2.48% due 1/23/20192 | 3,100 | 3,082 |
| Jupiter Securitization Co., LLC 2.30% due 11/27/20182 | 107,200 | 107,015 |
| Merck & Co. Inc. 2.38% due 1/15/2019–1/22/20192 | 86,500 | 86,051 |
| National Rural Utilities Cooperative Finance Corp. 2.31% due 12/7/2018 | 75,000 | 74,822 |
| Paccar Financial Corp. 2.21% due 11/5/2018 | 50,000 | 49,985 |
| Pfizer Inc. 2.32% due 1/17/20192 | 24,000 | 23,878 |
| Procter & Gamble Co. 2.21% due 12/13/20182 | 30,000 | 29,918 |
| Swedbank AB 2.17% due 11/1/2018 | 14,800 | 14,799 |
| U.S. Treasury Bills 1.98%–2.41% due 11/1/2018–4/25/2019 | 1,456,300 | 1,449,574 |
| Total short-term securities (cost: $4,190,127,000) | 4,189,918 | |
| Total investment securities 100.79% (cost: $94,756,697,000) | 100,444,928 | |
| Other assets less liabilities (0.79)% | (791,261) | |
| Net assets 100.00% | $99,653,667 |
| Contracts | Type | Number of contracts | Expiration | Notional amount14 (000) | Value at 10/31/201815 (000) | Unrealized (depreciation) appreciation at 10/31/2018 (000) |
| 2 Year U.S. Treasury Note Futures | Long | 11,579 | January 2019 | $2,315,800 | $2,439,188 | $(96) |
| 5 Year U.S. Treasury Note Futures | Long | 18,573 | January 2019 | 1,857,300 | 2,087,286 | (4,992) |
| 10 Year U.S. Treasury Note Futures | Short | 25 | December 2018 | (2,500) | (2,961) | 5 |
| 10 Year Ultra U.S. Treasury Note Futures | Short | 614 | December 2018 | (61,400) | (76,817) | (291) |
| 20 Year U.S. Treasury Bond Futures | Short | 136 | December 2018 | (13,600) | (18,785) | (47) |
| $(5,421) |
| Contract amount | Counterparty | Settlement date | Unrealized appreciation (depreciation) at 10/31/2018 (000) | |
| Purchases (000) | Sales (000) | |||
| USD1,518 | EUR1,285 | Bank of New York Mellon | 11/7/2018 | $62 |
| USD402,632 | GBP306,225 | Citibank | 11/16/2018 | 10,943 |
| GBP146,225 | USD192,284 | Morgan Stanley | 11/16/2018 | (5,249) |
| $5,756 | ||||
| Receive | Pay | Expiration date | Notional (000) | Value at 10/31/2018 (000) | Upfront payments/ receipts (000) | Unrealized appreciation (depreciation) at 10/31/2018 (000) |
| 3-month USD-LIBOR | 3.002% | 9/28/2020 | $126,200 | $147 | $— | $147 |
| 2.683% | U.S. EFFR | 9/28/2020 | 126,200 | (111) | — | (111) |
| $— | $36 |
| 1 | Represents an affiliated company as defined under the Investment Company Act of 1940. |
| 2 | Acquired in a transaction exempt from registration under Rule 144A or Section 4(2) of the Securities Act of 1933. May be resold in the U.S. in transactions exempt from registration, normally to qualified institutional buyers. The total value of all such securities was $2,407,683,000, which represented 2.42% of the net assets of the fund. |
| 3 | Valued under fair value procedures adopted by authority of the board of trustees. The total value of all such securities, including those in “Miscellaneous,“ was $278,192,000, which represented .28% of the net assets of the fund. |
| 4 | Security did not produce income during the last 12 months. |
| 5 | All or a portion of this security was pledged as collateral. The total value of pledged collateral was $29,484,000, which represented .03% of the net assets of the fund. |
| 6 | Index-linked bond whose principal amount moves with a government price index. |
| 7 | Step bond; coupon rate may change at a later date. |
| 8 | Value determined using significant unobservable inputs. |
| 9 | Principal payments may be made periodically. Therefore, the effective maturity date may be earlier than the stated maturity date. |
| 10 | Coupon rate may change periodically. |
| 11 | Loan participations and assignments; may be subject to legal or contractual restrictions on resale. The total value of all such loans was $7,006,000, which represented .01% of the net assets of the fund. |
| 12 | Payment in kind; the issuer has the option of paying additional securities in lieu of cash. Most recent payment was 100% cash unless otherwise noted. |
| 13 | Purchased on a TBA basis. |
| 14 | Notional amount is calculated based on the number of contracts and notional contract size. |
| 15 | Value is calculated based on the notional amount and current market price. |
| Key to abbreviations and symbols | |
| ADR = American Depositary Receipts | GBP = British pounds |
| Auth. = Authority | HKD = Hong Kong dollars |
| CAD = Canadian dollars | LIBOR = London Interbank Offered Rate |
| CLO = Collateralized Loan Obligations | MXN = Mexican pesos |
| dba = doing business as | Ref. = Refunding |
| EFFR = Effective Federal Funds Rate | Rev. = Revenue |
| EUR/€ = Euros | TBA = To-be-announced |
| FDR = Fiduciary Depositary Receipts | USD/$ = U.S. dollars |
| G.O. = General Obligation |
| MFGEFPX-012-1218O-S66106 | Capital Income Builder — Page 29 of 29 |
Report of Independent Registered Public Accounting Firm
To the Board of Trustees and Shareholders of Capital Income Builder
Opinion on the Financial Statements
We have audited the accompanying statement of assets and liabilities, including the summary investment portfolio, of Capital Income Builder (the "Fund") as of October 31, 2018, the related statement of operations for the year ended October 31, 2018, the statement of changes in net assets for each of the two years in the period ended October 31, 2018, including the related notes, and the financial highlights for each of the periods indicated therein (included in Item 1 of this Form N-CSR) and the investment portfolio (included in Item 6 of this Form N-CSR) as of October 31, 2018 (collectively referred to as the “financial statements”). In our opinion, the financial statements present fairly, in all material respects, the financial position of the Fund as of October 31, 2018, the results of its operations for the year then ended, the changes in its net assets for each of the two years in the period ended October 31, 2018 and the financial highlights for each of the periods indicated therein in conformity with accounting principles generally accepted in the United States of America.
Basis for Opinion
These financial statements are the responsibility of the Fund’s management. Our responsibility is to express an opinion on the Fund’s financial statements based on our audits. We are a public accounting firm registered with the Public Company Accounting Oversight Board (United States) (“PCAOB”) and are required to be independent with respect to the Fund in accordance with the U.S. federal securities laws and the applicable rules and regulations of the Securities and Exchange Commission and the PCAOB.
We conducted our audits of these financial statements in accordance with the standards of the PCAOB. Those standards require that we plan and perform the audit to obtain reasonable assurance about whether the financial statements are free of material misstatement, whether due to error or fraud.
Our audits included performing procedures to assess the risks of material misstatement of the financial statements, whether due to error or fraud, and performing procedures that respond to those risks. Such procedures included examining, on a test basis, evidence regarding the amounts and disclosures in the financial statements. Our audits also included evaluating the accounting principles used and significant estimates made by management, as well as evaluating the overall presentation of the financial statements. Our procedures included confirmation of securities owned as of October 31, 2018 by correspondence with the custodian and brokers; when replies were not received from brokers, we performed other auditing procedures. We believe that our audits provide a reasonable basis for our opinion.
/s/ PricewaterhouseCoopers LLP
Los Angeles, California
December 10, 2018
We have served as the auditor of one or more investment companies in The Capital Group Companies Investment Company Complex since 1934.
ITEM 7 – Disclosure of Proxy Voting Policies and Procedures for Closed-End Management Investment Companies
Not applicable to this Registrant, insofar as the Registrant is not a closed-end management investment company.
ITEM 8 – Portfolio Managers of Closed-End Management Investment Companies
Not applicable to this Registrant, insofar as the Registrant is not a closed-end management investment company.
ITEM 9 – Purchases of Equity Securities by Closed-End Management Investment Company and Affiliated Purchasers
Not applicable to this Registrant, insofar as the Registrant is not a closed-end management investment company.
ITEM 10 – Submission of Matters to a Vote of Security Holders
There have been no material changes to the procedures by which shareholders may recommend nominees to the Registrant’s board of trustees since the Registrant last submitted a proxy statement to its shareholders. The procedures are as follows. The Registrant has a nominating and governance committee comprised solely of persons who are not considered ‘‘interested persons’’ of the Registrant within the meaning of the Investment Company Act of 1940, as amended. The committee periodically reviews such issues as the board’s composition, responsibilities, committees, compensation and other relevant issues, and recommends any appropriate changes to the full board of trustees. While the committee normally is able to identify from its own resources an ample number of qualified candidates, it will consider shareholder suggestions of persons to be considered as nominees to fill future vacancies on the board. Such suggestions must be sent in writing to the nominating and governance committee of the Registrant, c/o the Registrant’s Secretary, and must be accompanied by complete biographical and occupational data on the prospective nominee, along with a written consent of the prospective nominee for consideration of his or her name by the nominating and governance committee.
ITEM 11 – Controls and Procedures
| (a) | The Registrant’s Principal Executive Officer and Principal Financial Officer have concluded, based on their evaluation of the Registrant’s disclosure controls and procedures (as such term is defined in Rule 30a-3 under the Investment Company Act of 1940), that such controls and procedures are adequate and reasonably designed to achieve the purposes described in paragraph (c) of such rule. |
| (b) | Effective May 28, 2018, the Capital Income Builder’s investment adviser implemented a new fixed income order management, trading, and compliance system. In connection with introducing this new system, additional automated and manual controls were implemented and some existing controls were modified. None of these changes were in response to any identified deficiency or weakness in the Capital Income Builder’s internal control over financial reporting. |
ITEM 12 – Exhibits
| (a)(1) | The Code of Ethics that is the subject of the disclosure required by Item 2 is attached as an exhibit hereto. |
| (a)(2) | The certifications required by Rule 30a-2 of the Investment Company Act of 1940 and Sections 302 and 906 of the Sarbanes-Oxley Act of 2002 are attached as exhibits hereto. |
SIGNATURES
Pursuant to the requirements of the Securities Exchange Act of 1934 and the Investment Company Act of 1940, the Registrant has duly caused this report to be signed on its behalf by the undersigned, thereunto duly authorized.
| CAPITAL INCOME BUILDER | |
| By /s/ Donald H. Rolfe | |
|
Donald H. Rolfe, Executive Vice President and Principal Executive Officer | |
| Date: December 31, 2018 |
Pursuant to the requirements of the Securities Exchange Act of 1934 and the Investment Company Act of 1940, this report has been signed below by the following persons on behalf of the Registrant and in the capacities and on the dates indicated.
| By /s/ Donald H. Rolfe |
|
Donald H. Rolfe, Executive Vice President and Principal Executive Officer |
| Date: December 31, 2018 |
| By /s/ Gregory F. Niland |
|
Gregory F. Niland, Treasurer and Principal Financial Officer |
| Date: December 31, 2018 |
Code of Ethics
The following Code of Ethics is in effect for the Registrant:
| The Fund has adopted the following standards in accordance with the requirements of Form N-CSR adopted by the Securities and Exchange Commission pursuant to Section 406 of the Sarbanes-Oxley Act of 2002 for the purpose of deterring wrongdoing and promoting: 1) honest and ethical conduct, including handling of actual or apparent conflicts of interest between personal and professional relationships; 2) full, fair, accurate, timely and understandable disclosure in reports and documents that a fund files with or submits to the Commission and in other public communications made by the fund; 3) compliance with applicable governmental laws, rules and regulations; 4) the prompt internal reporting of violations of the Code to an appropriate person or persons identified in the Code; and 5) accountability for adherence to the Code. These provisions shall apply to the principal executive officer or chief executive officer and treasurer (“Covered Officers”) of the Fund. | |||
| (1) | It is the responsibility of Covered Officers to foster, by their words and actions, a corporate culture that encourages honest and ethical conduct, including the ethical resolution of, and appropriate disclosure of conflicts of interest. Covered Officers should work to assure a working environment that is characterized by respect for law and compliance with applicable rules and regulations. | ||
| (2) | Each Covered Officer must act in an honest and ethical manner while conducting the affairs of the Fund, including the ethical handling of actual or apparent conflicts of interest between personal and professional relationships. Duties of Covered Officers include: | ||
| • | Acting with integrity; | ||
| • | Adhering to a high standard of business ethics; and | ||
| • | Not using personal influence or personal relationships to improperly influence investment decisions or financial reporting whereby the Covered Officer would benefit personally to the detriment of the Fund; | ||
| (3) | Each Covered Officer should act to promote full, fair, accurate, timely and understandable disclosure in reports and documents that the Fund files with or submits to, the Securities and Exchange Commission and in other public communications made by the Fund. | ||
| • | Covered Officers should familiarize themselves with disclosure requirements applicable to the Fund and disclosure controls and procedures in place to meet these requirements; and | ||
| • | Covered Officers must not knowingly misrepresent, or cause others to misrepresent facts about the Fund to others, including the Fund’s auditors, independent trustees, governmental regulators and self-regulatory organizations. | ||
| (4) | Any existing or potential violations of this Code of Ethics should be reported to The Capital Group Companies’ Personal Investing Committee. The Personal Investing Committee is authorized to investigate any such violations and report their findings to the Chairman of the Audit Committee of the Fund. The Chairman of the Audit Committee may report violations of the Code of Ethics to the Board or other appropriate entity including the Audit Committee, if he or she believes such a reporting is appropriate. The Personal Investing Committee may also determine the appropriate sanction for any violations of this Code of Ethics, including removal from office, provided that removal from office shall only be carried out with the approval of the Board. | ||
| (5) | Application of this Code of Ethics is the responsibility of the Personal Investing Committee, which shall report periodically to the Chairman of the Audit Committee of the Fund. | ||
| (6) | Material amendments to these provisions must be ratified by a majority vote of the Board. As required by applicable rules, substantive amendments to the Code of Ethics must be filed or appropriately disclosed. | ||
|
Capital Income Builder 333 South Hope Street Los Angeles, California 90071 (213) 486-9200 |
CERTIFICATION
I, Donald H. Rolfe, certify that:
| 1. | I have reviewed this report on Form N-CSR of Capital Income Builder; |
| 2. | Based on my knowledge, this report does not contain any untrue statement of a material fact or omit to state a material fact necessary to make the statements made, in light of the circumstances under which such statements were made, not misleading with respect to the period covered by this report; |
| 3. | Based on my knowledge, the financial statements, and other financial information included in this report, fairly present in all material respects the financial condition, results of operations, changes in net assets, and cash flows (if the financial statements are required to include a statement of cash flows) of the registrant as of, and for, the periods presented in this report; |
| 4. | The registrant's other certifying officer(s) and I are responsible for establishing and maintaining disclosure controls and procedures (as defined in rule 30a-3(c) under the Investment Company Act of 1940) and internal controls over financial reporting (as defined in Rule 30a-3(d) under the Investment Company Act of 1940) for the registrant and have: |
| a) Designed such disclosure controls and procedures, or caused such disclosure controls and procedures to be designed under our supervision, to ensure that material information relating to the registrant, including its consolidated subsidiaries, is made known to us by others within those entities, particularly during the period in which this report is being prepared; | |
| b) Designed such internal control over financial reporting, or caused such internal control over financial reporting to be designed under our supervision, to provide reasonable assurance regarding the reliability of financial reporting and the preparation of financial statements for external purposes in accordance with generally accepted accounting principles; | |
| c) Evaluated the effectiveness of the registrant's disclosure controls and procedures and presented in this report our conclusions about the effectiveness of the disclosure controls and procedures, as of a date within 90 days prior to the filing date of this report based on such evaluation; and | |
| d) Disclosed in this report any change in the registrant’s internal control over financial reporting that occurred during the registrant’s second fiscal quarter of the period covered by this report that has materially affected, or is reasonably likely to materially affect, the registrant’s internal control over financial reporting; and | |
| 5. | The registrant's other certifying officer(s) and I have disclosed to the registrant's auditors and the audit committee of the registrant's Board of Trustees (or persons performing the equivalent functions): |
| a) All significant deficiencies and material weaknesses in the design or operation of internal control over financial reporting which are reasonably likely to adversely affect the registrant’s ability to record, process, summarize, and report financial information; and | |
| b) Any fraud, whether or not material, that involves management or other employees who have a significant role in the registrant's internal control over financial reporting. |
Date: December 31, 2018
/s/ Donald H. Rolfe
Donald H. Rolfe, Executive Vice President and
Principal Executive Officer
Capital Income Builder
|
Capital Income Builder 333 South Hope Street Los Angeles, California 90071 (213) 486-9200 |
CERTIFICATION
I, Gregory F. Niland, certify that:
| 1. | I have reviewed this report on Form N-CSR of Capital Income Builder; |
| 2. | Based on my knowledge, this report does not contain any untrue statement of a material fact or omit to state a material fact necessary to make the statements made, in light of the circumstances under which such statements were made, not misleading with respect to the period covered by this report; |
| 3. | Based on my knowledge, the financial statements, and other financial information included in this report, fairly present in all material respects the financial condition, results of operations, changes in net assets, and cash flows (if the financial statements are required to include a statement of cash flows) of the registrant as of, and for, the periods presented in this report; |
| 4. | The registrant's other certifying officer(s) and I are responsible for establishing and maintaining disclosure controls and procedures (as defined in rule 30a-3(c) under the Investment Company Act of 1940) and internal controls over financial reporting (as defined in Rule 30a-3(d) under the Investment Company Act of 1940) for the registrant and have: |
| a) Designed such disclosure controls and procedures, or caused such disclosure controls and procedures to be designed under our supervision, to ensure that material information relating to the registrant, including its consolidated subsidiaries, is made known to us by others within those entities, particularly during the period in which this report is being prepared; | |
| b) Designed such internal control over financial reporting, or caused such internal control over financial reporting to be designed under our supervision, to provide reasonable assurance regarding the reliability of financial reporting and the preparation of financial statements for external purposes in accordance with generally accepted accounting principles; | |
| c) Evaluated the effectiveness of the registrant's disclosure controls and procedures and presented in this report our conclusions about the effectiveness of the disclosure controls and procedures, as of a date within 90 days prior to the filing date of this report based on such evaluation; and | |
| d) Disclosed in this report any change in the registrant’s internal control over financial reporting that occurred during the registrant’s second fiscal quarter of the period covered by this report that has materially affected, or is reasonably likely to materially affect, the registrant’s internal control over financial reporting; and | |
| 5. | The registrant's other certifying officer(s) and I have disclosed to the registrant's auditors and the audit committee of the registrant's Board of Trustees (or persons performing the equivalent functions): |
| a) All significant deficiencies and material weaknesses in the design or operation of internal control over financial reporting which are reasonably likely to adversely affect the registrant’s ability to record, process, summarize, and report financial information; and | |
| b) Any fraud, whether or not material, that involves management or other employees who have a significant role in the registrant's internal control over financial reporting. |
Date: December 31, 2018
/s/ Gregory F. Niland
Gregory F. Niland, Treasurer and
Principal Financial Officer
Capital Income Builder
|
Capital Income Builder 333 South Hope Street Los Angeles, California 90071 (213) 486-9200 |
CERTIFICATION PURSUANT TO 18 U.S.C. SECTION 1350,
AS ADOPTED PURSUANT TO
SECTION 906 OF THE SARBANES-OXLEY ACT OF 2002
DONALD H. ROLFE, Executive Vice President and Principal Executive Officer, and GREGORY F. NILAND, Treasurer and Principal Financial Officer of Capital Income Builder (the "Registrant"), each certify to the best of his knowledge that:
| 1) | The Registrant's periodic report on Form N-CSR for the period ended October 31, 2018 (the "Form N-CSR") fully complies with the requirements of Section 13(a) or 15(d) of the Securities Exchange Act of 1934, as amended; and |
| 2) | The information contained in the Form N-CSR fairly presents, in all material respects, the financial condition and results of operations of the Registrant. |
| Principal Executive Officer | Principal Financial Officer |
| CAPITAL INCOME BUILDER | CAPITAL INCOME BUILDER |
| /s/ Donald H. Rolfe | /s/ Gregory F. Niland |
| Donald H. Rolfe, Executive Vice President | Gregory F. Niland, Treasurer |
| Date: December 31, 2018 | Date: December 31, 2018 |
A signed original of this written statement required by Section 906 of the Sarbanes-Oxley Act of 2002 has been provided to CAPITAL INCOME BUILDER and will be retained by CAPITAL INCOME BUILDER and furnished to the Securities and Exchange Commission (the "Commission") or its staff upon request.
This certification is being furnished to the Commission solely pursuant to 18 U.S.C. Section 1350 and is not being filed as part of the Form N-CSR filed with the Commission.
Serious News for Serious Traders! Try StreetInsider.com Premium Free!
You May Also Be Interested In
- Ripple CTO Addresses XRP and Ripple Naming Confusion
- Kimball Electronics, Inc. Announces Date For Reporting Third Quarter Fiscal Year 2024 Financial Results
- CSE Bulletin: Delist - Tryp Therapeutics Inc. (TRYP)
Create E-mail Alert Related Categories
SEC FilingsSign up for StreetInsider Free!
Receive full access to all new and archived articles, unlimited portfolio tracking, e-mail alerts, custom newswires and RSS feeds - and more!
