

Form N-CSR Bernstein Fund Inc For: Sep 30
 Tweet
Tweet Share
Share
UNITED STATES
SECURITIES AND EXCHANGE COMMISSION
WASHINGTON, D.C. 20549
FORM N-CSR
CERTIFIED SHAREHOLDER REPORT OF REGISTERED
MANAGEMENT INVESTMENT COMPANIES
Investment Company Act file number: 811-23100
BERNSTEIN FUND, INC.
(Exact name of registrant as specified in charter)
1345 Avenue of the Americas, New York, New York 10105
(Address of principal executive offices) (Zip code)
Joseph J. Mantineo
AllianceBernstein L.P.
1345 Avenue of the Americas
New York, New York 10105
(Name and address of agent for service)
Registrant’s telephone number, including area code: (800) 221-5672
Date of fiscal year end: September 30, 2018
Date of reporting period: September 30, 2018
| ITEM 1. | REPORTS TO STOCKHOLDERS. |
BERNSTEIN FUND, INC.
Small Cap Core Portfolio
International Small Cap Portfolio
International Strategic Equities Portfolio
ANNUAL REPORT
SEPTEMBER 30, 2018
Table of Contents
| 1 | ||||
| 6 | ||||
| 9 | ||||
| 11 | ||||
| 12 | ||||
| 13 | ||||
| 30 | ||||
| 32 | ||||
| 33 | ||||
| 36 | ||||
| 45 | ||||
| 64 |
Before investing in any portfolio of the Bernstein Fund, Inc., a prospective investor should consider carefully the portfolio’s investment objectives and policies, charges, expenses and risks. These and other matters of importance to prospective investors are contained in the portfolios’ prospectus, an additional copy of which may be obtained by visiting our website at www.Bernstein.com and clicking on “Investments”, then “Mutual Fund Information—Prospectuses, SAIs and Shareholder Reports” or by calling your financial advisor or by calling Bernstein’s mutual fund shareholder help line at 212.756.4097. Please read the prospectus carefully before investing.
For performance information current to the most recent month-end, please call (collect) 212.486.5800.
This shareholder report must be preceded or accompanied by the Bernstein Fund, Inc. prospectus for individuals who are not shareholders of the Fund.
You may obtain a description of the Fund’s proxy voting policies and procedures, and information regarding how the Fund voted proxies relating to portfolio securities during the most recent 12-month period ended June 30, without charge. Simply visit www.AllianceBernstein.com, or go to the Securities and Exchange Commission’s website at www.sec.gov, or call AllianceBernstein at 800.227.4618.
The Fund will file its complete schedule of portfolio holdings with the Commission for the first and third quarters of each fiscal year. The Fund’s portfolio holdings reports are available on the Commission’s website at www.sec.gov. The Fund’s portfolio holdings reports may also be reviewed and copied at the Commission’s Public Reference Room in Washington, D.C.; information on the operation of the Public Reference Room may be obtained by calling 800.SEC.0330.
Investment Products Offered: · Are Not FDIC Insured · May Lose Value · Are Not Bank Guaranteed
Portfolio Manager Commentary (Unaudited)
To Our Shareholders—November 15, 2018
On the following pages, you will find the 2018 annual report for the Portfolios (collectively, the “Portfolios”, and individually, a “Portfolio”) of the Bernstein Fund, Inc. (the “Fund”). The annual report covers the six- and 12-month periods ended September 30, 2018, and includes financial statements as well as notes to the financial statements, information about the recent performance of the Portfolios and a listing of each Portfolio’s holdings as of the period end.
Equity returns diverged during the 12 months ended September 30, 2018, with US stocks standing out relative to their non-US counterparts. The disparity in equity returns—which emerged mid-way through the period—was partly spurred by intensifying tariff issues. It also mirrored broader economic activity, as the US economy accelerated while non-US countries slowed, following a period when global growth had been unusually synchronized. Interest rates rose, exerting downward pressure on US taxable bond returns, though tax-exempt bond returns were slightly positive.
Several factors buoyed sentiment around US stocks: extremely strong corporate earnings growth, corporate tax cuts, deregulation and a benign inflation backdrop. In contrast, non-US equities were hampered by diverse regional concerns, such as: Italian budget deficits in Europe and significant, though idiosyncratic, economic strains in select markets like Turkey and Argentina. A rising US dollar, higher US interest rates, and heightened vulnerability to trade tensions further depressed non-US markets, especially emerging markets.
Despite this year’s patterns, we continue to expect global equity allocations to provide better risk-adjusted returns than US-only strategies, over the long run. With US equity valuations high, and potential pressures on earnings coming from higher wage and input costs, valuations in non-US markets look more attractive. Overall, we expect that slower economic growth in the years ahead will likely contribute to lower returns on global stocks than have been experienced in the past. In addition, we are likely to see a gradual increase in global interest rates, constraining bond returns.
If you have any questions about your investments in the Portfolios, please contact your Bernstein Advisor by calling 212.756.4097, or visit www.Bernstein.com. As always, we are firmly dedicated to your investment success. Thank you for your continued interest in the Portfolios.
Sincerely,
Kathleen M. Fisher
President
Bernstein Fund, Inc.
Small Cap Core Portfolio
Investment Objectives and Strategy
The Portfolio seeks to provide long-term growth of capital. The Portfolio invests, under normal circumstances, at least 80% of its net assets (plus any borrowings for investment purposes) in equity securities of small-capitalization companies or other securities or instruments with similar economic characteristics, including derivatives related to equity securities. Equity securities are primarily common stocks, although, for purposes of the 80% policy, equity securities may also include preferred stocks, warrants, convertible securities, sponsored or unsponsored American Depositary Receipts (“ADRs”) and Global Depositary Receipts (“GDRs”) and equity real estate investment trusts (“REITs”). You will be notified at least 60 days prior to any change to the Portfolio’s 80% investment policy.
AllianceBernstein L.P. serves as the Portfolio’s investment manager (the “Adviser”). The Adviser invests the assets of the Portfolio primarily in a diversified portfolio of equity securities of small-capitalization companies located in the US. The Portfolio defines small-capitalization companies as those that, at the time of investment, fall within the capitalization range between the smallest company in the Russell 2000 Index (“Russell 2000”) and the largest company in the Russell 2000. The market capitalization of the companies included in the Portfolio’s definition of “small-capitalization” companies changes over time as the capitalization of the securities included in the Russell 2000 changes.
The Adviser utilizes both quantitative analysis and fundamental research to determine which securities will be held by the Portfolio and to manage risk. The Adviser applies
(Portfolio Manager Commentary continued on next page)
| 2018 Annual Report | 1 |
Portfolio Manager Commentary (continued)
quantitative analysis to all of the securities in the Portfolio’s research universe, which is composed primarily of securities in the Portfolio’s benchmark. Those securities that score highly on this quantitative analysis are then screened to eliminate those securities that the Adviser is recommending against purchasing based on its fundamental research, and a portfolio is constructed from the remaining highly ranked securities based on diversification and risk considerations. In its quantitative analysis, the Adviser considers a number of metrics that have historically provided some indication of favorable future returns, including metrics relating to valuation, quality, investor behavior and corporate behavior. In general, stocks are purchased when, in the view of the Adviser, they provide the highest expected returns, considering their contribution to the estimated risk of the Portfolio’s existing investments. Typically, growth in the size of a company’s market capitalization relative to other domestically traded companies does not cause the Adviser to dispose of the security. The Adviser expects to seek to manage the overall portfolio volatility of the Portfolio relative to the Russell 2000 by favoring securities that offer the best balance between return and targeted risk.
The Portfolio may also invest in exchange-traded funds (“ETFs”) and other investment companies from time to time.
The Portfolio expects to utilize derivatives, such as options, futures contracts, forwards and swaps. For example, the Portfolio may use stock index futures contracts to equitize cash. Derivatives may provide a more efficient and economical exposure to market segments than direct investments, and may also be a more efficient way to alter the Portfolio’s exposure.
Investment Results
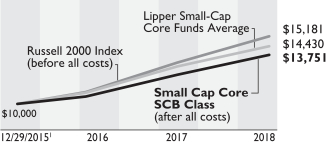
The table on page 9 shows the Portfolio’s performance compared to its benchmark, the Russell 2000 Index, for the six- and 12-month periods ended September 30, 2018. The table also includes the Portfolio’s peer group, as represented by the Lipper Small-Cap Core Funds Average (the “Lipper Average”). Funds in the Lipper Average have generally similar investment objectives to the Portfolio, although some of the funds may have different investment policies and sales and management fees and fund expenses.
The Portfolio underperformed the benchmark and outperformed the Lipper Average during both periods. Corporate earnings growth has been strong over the 12-month period, as the US economy continued to grow and benefit from tax cuts. Small-cap stocks delivered strong returns despite investor anxiety caused by the recent escalation in trade conflicts and the Portfolio participated in this rally.
The Portfolio maintains a long-term exposure to attractive valuation, high profitability and positive-sentiment stocks, which we believe should outperform over the long term. As the 12-month period progressed, growth stocks meaningfully outperformed their value peers. During both periods, the Portfolio’s exposure to value stocks was a significant detractor in this environment, whereas exposure to factors related to market sentiment contributed. An overweight in the materials sector, as well as value choices in automobiles and industrials detracted from performance, relative to the benchmark. An underweight to the real estate sector, in addition to stock selection in biotechnology, and the oil and gas space contributed.
The Portfolio utilized futures for investment purposes, which added to absolute performance for both periods.
International Small Cap Portfolio
Investment Objective and Strategy
The Portfolio seeks to provide long-term growth of capital. The Portfolio invests, under normal circumstances, at least 80% of its net assets (plus any borrowings for investment purposes) in equity securities of small-capitalization companies or other securities or instruments with similar economic characteristics, including derivatives related to equity securities. Equity securities are primarily common stocks, although, for purposes of the 80% policy, equity securities may also include preferred stocks, warrants, convertible securities, sponsored or unsponsored ADRs and GDRs and equity REITs. You will be notified at least 60 days prior to any change to the Portfolio’s 80% investment policy.
AllianceBernstein L.P. serves as the Portfolio’s Adviser. The Adviser invests the assets of the Portfolio primarily in a diversified portfolio of equity securities of small-capitalization companies located outside of the United States. Under normal circumstances, at least 65% of the Portfolio’s net assets are invested in companies located outside of the United States. The Portfolio defines small-capitalization companies as those that, at the time of investment, have market capitalizations within the market capitalization range of the Portfolio’s benchmark, the Morgan Stanley Capital International (“MSCI”) All Country World Index (“ACWI”) ex-USA Small Cap. The market capitalization of the companies included in the Portfolio’s definition of “small-capitalization” companies changes over time as the capitalization of the securities included in the MSCI ACWI ex-USA Small Cap changes.
The Portfolio’s exposure to non-US companies may change over time based on the Adviser’s assessment of market conditions and the investment merit of non-US issuers. Under
(Portfolio Manager Commentary continued on next page)
| 2 | Bernstein Fund, Inc. |
Portfolio Manager Commentary (continued)
normal circumstances, the Adviser invests in companies located in at least three countries other than the United States and, at times, may have exposure to issuers in several different countries. In determining a company’s location for purposes of the Portfolio’s investment policies and restrictions, the Adviser may consider: (1) the place of domicile, (2) where the company has an established presence and conducts its business and (3) where the company conducts a significant part of its economic activities. The Portfolio may invest in both developed and emerging-market countries and, at times, may invest significantly in emerging markets.
The Adviser seeks to identify attractive investment opportunities primarily through its fundamental investment research or quantitative analysis. In applying its fundamental research, the Adviser generally seeks to identify companies that possess both attractive valuation and compelling company- and/or industry-level investment catalysts. In applying its quantitative analysis, the Adviser typically considers a number of metrics that historically have provided some indication of favorable future returns, including metrics related to valuation, quality, investor behavior and corporate behavior. Utilizing these resources, the Adviser expects to allocate the Portfolio’s assets among issuers, industries and geographic locations to attempt to create a diversified portfolio of investments.
The Portfolio may invest in established companies and also in new and less-seasoned issuers. The Portfolio may also invest in ETFs and other investment companies from time to time.
The Portfolio expects to utilize derivatives, such as options, futures contracts, forwards and swaps. For example, the Portfolio may invest in currency derivatives as discussed below and in futures contracts to gain exposure to certain markets. Derivatives may provide a more efficient and economical exposure to market segments than direct investments, and may also be a more efficient way to alter the Portfolio’s exposure.
Fluctuations in currency exchange rates can have a dramatic impact on the returns of foreign equity securities. The Adviser may employ currency hedging strategies, including the use of currency-related derivatives, to seek to reduce currency risk in the Portfolio, but it is not required to do so. The Adviser may also take long and short positions in currencies or related derivatives for investment purposes, independent of any security positions. The Adviser may use stock index futures contracts to gain access to certain markets.
Investment Results
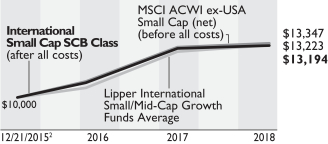
The table on page 9 shows the Portfolio’s performance compared to its benchmark, the MSCI ACWI ex-US Small Cap (net), for the six- and 12-month periods ended September 30, 2018. The table also includes the Portfolio’s peer group, as represented by the Lipper International Small/Mid-Cap Growth Funds Average. Funds in the Lipper Average have generally similar investment objectives to the Portfolio, although some of the funds may have different investment policies and sales and management fees and fund expenses.
For both periods, the Portfolio underperformed the benchmark and the Lipper Average. Relative performance was largely driven by stock selection in both periods, while country selection was positive and sector selection was largely neutral. For the 12-month period, positive stock selection in consumer staples, energy and financials was partially offset by weak stock selection in health care, information technology and industrials. An underweight in the strong-performing health care sector detracted from returns, as did an overweight position in China. The Chinese market was negatively affected by worries around the ongoing trade war between the US and China and a domestic slowdown; however, the Portfolio’s stock selection within China contributed strongly to returns.
For the six-month period, weak stock selection in the information technology, health care and materials sectors detracted from performance, while energy, financials and staples holdings again contributed. An underweight position in the strong-performing health care sector was a detractor, while an overweight to energy contributed as oil prices rose. An overweight in China detracted from returns, but stock selection within China contributed, while stock selection within Germany and Australia negatively affected performance.
The Portfolio utilized currency forwards for hedging purposes, which detracted from absolute performance for both periods.
International Strategic Equities Portfolio
Investment Objective and Strategy
The Portfolio seeks to provide long-term growth of capital. The Portfolio invests, under normal circumstances, at least 80% of its net assets (plus any borrowings for investment purposes) in equity securities or other securities or instruments with similar economic characteristics, including derivatives related to equity securities. Equity securities are primarily common stocks, although, for
(Portfolio Manager Commentary continued on next page)
| 2018 Annual Report | 3 |
Portfolio Manager Commentary (continued)
purposes of the 80% policy, equity securities may also include preferred stocks, warrants, convertible securities, sponsored or unsponsored ADRs and GDRs and equity REITs. You will be notified at least 60 days prior to any change to the Portfolio’s 80% investment policy.
AllianceBernstein L.P. serves as the Portfolio’s Adviser. The Adviser invests the assets of the Portfolio primarily (under normal circumstances, at least 65% of net assets) in equity securities of issuers in countries that make up the MSCI ACWI ex-US, which includes both developed and emerging-market countries. The Portfolio focuses on securities of large-cap and mid-cap companies. The Adviser expects to allocate fund assets among issuers in many foreign countries, but not necessarily in the same proportion that the countries are represented in the MSCI ACWI ex-US and may invest in issuers in countries outside of the MSCI ACWI ex-US. The Portfolio’s exposure among non-US countries may change over time based on the Adviser’s assessment of market conditions and the investment merit of particular non-US issuers. Under normal circumstances, the Adviser invests in companies located in at least three countries other than the United States and expects to have exposure to issuers in several different countries. In determining a company’s location for purposes of the Portfolio’s investment policies and restrictions, the Adviser may consider: (1) the place of domicile, (2) where the company has an established presence and conducts its business and (3) where the company conducts a significant part of its economic activities. The Portfolio may, at times, invest significantly in emerging markets.
The Adviser utilizes both fundamental and quantitative research to both determine which securities will be held by the Portfolio and to manage risk. Specifically, the Portfolio’s management team uses the universe of securities selected by the Adviser’s various fundamental investment teams focusing on international equity securities, and applies its quantitative analysis to these securities. In applying its quantitative analysis, the Adviser considers a number of metrics that have historically provided some indication of favorable future returns, including metrics relating to valuation, quality, investor behavior and corporate behavior. Utilizing these resources, the Adviser expects to allocate the Portfolio’s assets among issuers, industries and geographic locations to attempt to create a diversified portfolio of investments.
The Portfolio may also invest in ETFs and other investment companies from time to time.
The Portfolio expects to utilize derivatives, such as options, futures contracts, forwards and swaps. For example, the Portfolio may invest in currency derivatives as discussed below and in futures contracts to gain exposure to certain markets. Derivatives may provide a more efficient and economical exposure to market segments than direct investments, and may also be a more efficient way to alter the Portfolio’s exposure.
Fluctuations in currency exchange rates can have a dramatic impact on the returns of foreign equity securities. The Adviser may employ currency hedging strategies, including the use of currency-related derivatives, to seek to reduce currency risk in the Portfolio, but it is not required to do so. The Adviser may also take long and short positions in currencies or related derivatives for investment purposes, independent of any security positions. The Adviser may use stock index futures contracts to gain access to certain markets.
Investment Results
The table on page 9 shows the Portfolio’s performance compared to its benchmark, the MSCI ACWI ex-US (net), for the six- and 12-month periods ended September 30, 2018. The table also includes the Portfolio’s peer group, as represented by the Lipper International Multi-Cap Growth Funds Average. Funds in the Lipper Average have generally similar investment objectives to the Portfolio, although some of the funds may have different investment policies and sales and management fees and fund expenses.
The Portfolio underperformed the benchmark and the Lipper Average for both periods. International equity markets delivered low single-digit returns over the 12-month period; for the one-year period ended September 30, 2018, the MSCI ACWI (net) returned 1.76%, but over the six-month period, it fell 1.93%. The decline was seen across many developed and emerging countries, but several emerging markets—namely Turkey, Argentina and South Africa—were particularly weak.
For the 12-month period, security selection contributed to relative returns, while country selection was neutral. An overweight to Brazil, and underweights to Turkey and Peru detracted the most, while an overweight in Norway, and underweights in South Africa and Germany contributed. Stock selection in consumer staples, financials and information technology added to performance; selection in materials, real estate and industrials detracted. Currency contributions from the US dollar were more than offset by the negative impact from a currency overweight to Russia and Brazil.
(Portfolio Manager Commentary continued on next page)
| 4 | Bernstein Fund, Inc. |
Portfolio Manager Commentary (continued)
Over the six-month period, stock selection detracted from performance, particularly in real estate, industrials and financials, while consumer discretionary holdings contributed. Country selection also detracted, led by Brazil, the UK and China. Underweights in South Korea and South Africa positively impacted performance. Contributions from the US dollar were offset by currencies in China, Brazil and Russia.
During both periods, the Portfolio utilized futures and currency forwards for hedging purposes; futures had no material impact on absolute returns, and currency forwards detracted. Currency forwards are used to reduce the level of currency risk, which was achieved.
| 2018 Annual Report | 5 |
Disclosures and Risks (Unaudited)
Benchmark Disclosures
None of the following indices or averages reflects fees and expenses associated with the active management of a mutual fund portfolio. The Russell 2000® Index measures the performance of the small-cap segment of the US equity universe. The MSCI ACWI ex-USA Small Cap (net) measures the performance of the small-cap market segment across 22 of 23 developed markets (excluding the US) and 24 emerging-market countries. The MSCI ACWI ex-US (net, free float-adjusted, market capitalization weighted) represents the equity market performance of developed and emerging markets, excluding the United States. MSCI makes no express or implied warranties or representations, and shall have no liability whatsoever with respect to any MSCI data contained herein. The MSCI data may not be further redistributed or used as a basis for other indices, any securities or financial products. This report is not approved, reviewed or produced by MSCI. Net returns include the reinvestment of dividends after deduction of non-US withholding tax. Investors cannot invest directly in an index, and their results are not indicative of the performance for any specific investment, including the Portfolios.
A Word About Risk
All Portfolios:
The share price of the Portfolios will fluctuate and you may lose money. There is no guarantee that the Portfolios will achieve their investment objectives.
Market Risk: The Portfolios are subject to market risk, which is the risk that stock prices in general may decline over short or extended periods. Stock prices may decline in response to adverse changes in the economy or the economic outlook; deterioration in investor sentiment; interest-rate, currency and commodity price fluctuations; adverse geopolitical, social or environmental developments; issuer- and sector-specific considerations; and other factors. In the past decade, financial markets in the United States, Europe and elsewhere have experienced increased volatility, decreased liquidity and heightened uncertainty. These market conditions may recur from time to time and have an adverse impact on various securities markets. The US government and the Federal Reserve, as well as certain foreign governments and central banks, have taken steps to support financial markets. Other governments have tried to support markets by buying stocks and through other market interventions. Government intervention may not work as intended, particularly if the efforts are perceived by investors as being unlikely to achieve the desired results. The Federal Reserve has reduced its market support activities and has begun raising interest rates. Further Federal Reserve or other US or non-US governmental or central bank actions, including interest-rate increases or decreases, could negatively affect financial markets generally, increase market volatility and reduce the value and liquidity of securities in which the Portfolios invest.
Current political uncertainty surrounding the European Union (“EU”) and its membership may increase market volatility. The United Kingdom has voted to withdraw from the EU, and one or more other countries may withdraw from the EU and/or abandon the Euro, the common currency of the EU. The financial instability of some countries in the EU, together with the risk of that financial instability impacting other more stable countries, may increase the risk of investing in companies in Europe and worldwide. In addition, policy and legislative changes in the United States and in other countries are affecting many aspects of financial regulation, and may in some instances contribute to decreased liquidity and increased volatility in the financial markets. The impact of these changes, and the practical implications for market participants, may not be fully known for some time.
Economies and financial markets throughout the world are becoming increasingly interconnected. Economic, financial or political events, trading and tariff arrangements, terrorism, natural disasters and other circumstances in one country or region could have profound impacts on global economies or markets. As a result, whether or not the Portfolios invest in securities of issuers located in or with significant exposure to countries experiencing economic and financial difficulties, the value and liquidity of the Portfolios’ investments may be negatively affected.
Liquidity Risk: Liquidity risk exists when particular investments are difficult to purchase or sell, possibly preventing the Portfolios from selling out of these illiquid securities at an advantageous price. Illiquid securities may also be difficult to value. Derivatives and securities involving substantial market and credit risk tend to involve greater liquidity risk.
Redemption Risk: The Portfolios may experience heavy redemptions that could cause the Portfolios to liquidate their assets at inopportune times or at a loss or depressed value, which could cause the value of your investment to decline. Redemption risk is heightened during periods of overall market turmoil.
(Disclosures and Risks continued on next page)
| 6 | Bernstein Fund, Inc. |
Disclosures and Risks (continued)
Sector Risk: The Portfolios may have more risk because of concentrated investments in a particular market sector, such as the technology or financial services sector. Market or economic factors affecting that sector could have a major effect on the value of the Portfolios’ investments.
Capitalization Risk: Investments in small- and mid-capitalization companies may be more volatile than investments in large-capitalization companies. Investments in small- and mid-capitalization companies may have additional risks because these companies may have limited product lines, markets or financial resources.
Allocation Risk: The Portfolios may seek to focus on different investment disciplines or factors at different times as a means to achieve their investment objectives. In the event that the investment disciplines or factors to which the Portfolios have greater exposure perform worse than the investment disciplines or factors with less exposure, the Portfolios’ returns may be negatively affected.
Derivatives Risk: The Portfolios may use derivatives in currency hedging as well as for direct investments to gain access to certain markets, earn income, enhance return and broaden portfolio diversification, which entail greater risk than if used solely for hedging purposes. In addition to other risks such as the credit risk of the counterparty, derivatives involve the risk that changes in the value of the derivative may not correlate with relevant assets, rates or indices. Derivatives may be illiquid and difficult to price or unwind, and small changes may produce disproportionate losses for the Portfolios. Certain derivatives have the potential for unlimited loss, regardless of the size of the initial investment. Assets required to be set aside or posted to cover or secure derivatives positions may themselves go down in value, and these collateral and other requirements may limit investment flexibility. Some derivatives involve leverage, which can make the Portfolios more volatile and can compound other risks. The US government and foreign governments have been adopting and implementing regulations governing derivatives markets, including mandatory clearing of certain derivatives, margin, reporting and registration requirements. The ultimate impact of the regulations remains unclear. Additional regulation may make derivatives more costly, limit their availability or utility, otherwise adversely affect their performance, or disrupt markets.
Management Risk: The Portfolios are subject to management risk because they are actively managed investment portfolios. The Adviser will apply its investment techniques and risk analyses in making investment decisions for the Portfolios, but these techniques, analyses and decisions may not work as intended or may not produce the desired results. In some cases, derivatives and other investment techniques may be unavailable or the Adviser may determine not to use them, possibly even under market conditions where their use could benefit the Portfolios. In addition, the Adviser may change the Portfolios’ investment strategies or policies from time to time. Those changes may not lead to the results intended by the Adviser and could have an adverse effect on the Adviser and could have an adverse effect on the value or performance of the Portfolios.
REIT Risk: Investing in REITs involves certain unique risks in addition to those risks associated with investing in the real estate industry in general. Equity REITs may be affected by changes in the value of the underlying property owned by the REITs, while mortgage REITs may be affected by the quality of any credit extended. REITs are dependent upon management skills, are not diversified, and are subject to heavy cash flow dependency, default by borrowers and self-liquidation. Investing in REITs also involves risks similar to those associated with investing in small-capitalization companies. REITs may have limited financial resources, may trade less frequently and in a limited volume and may be subject to more abrupt or erratic price movements than larger company securities.
Investment in Other Investment Companies Risk: As with other investments, investments in other investment companies, including other registered funds advised by the Adviser and ETFs, are subject to market and selection risk. In addition, if the Portfolios acquire shares of investment companies, shareholders bear both their proportionate share of expenses in the Portfolios (including management and advisory fees) and, indirectly, the expenses of the investment companies.
International Strategic Equities and International Small Cap Portfolios
Foreign (Non-US) Securities Risk: Investments in foreign securities entail significant risks in addition to those customarily associated with investing in US securities. These risks include risks related to adverse market, economic, political and regulatory factors and social instability, all of which could disrupt the financial markets in which the Portfolios invest and adversely affect the value of the Portfolios’ assets.
(Disclosures and Risks continued on next page)
| 2018 Annual Report | 7 |
Disclosures and Risks (continued)
Country Concentration Risk: The Portfolios may not always be diversified among countries or regions and the effect on the share price of the Portfolios of specific risks such as political, regulatory and currency may be magnified due to concentration of the Portfolios’ investments in a particular country or region.
Emerging-Markets Securities Risk: The risks of investing in foreign (non-US) securities are heightened with respect to issuers in emerging-market countries because the markets are less developed and less liquid and there may be a greater amount of economic, political and social uncertainty, and these risks are even more pronounced in “frontier” markets, which are investable markets with lower total market capitalization and liquidity than the more developed emerging markets. In addition, the value of the Portfolios’ investments may decline because of factors such as unfavorable or unsuccessful government actions and reduction of government or central bank support.
Foreign Currency Risk: This is the risk that changes in foreign (non-US) currency exchange rates may negatively affect the value of the Portfolios’ investments or reduce the returns of the Portfolios. For example, the value of the Portfolios’ investments in foreign securities and foreign currency positions may decrease if the US dollar is strong (i.e., gaining value relative to other currencies) and other currencies are weak (i.e., losing value relative to the US dollar).
Actions by a Few Major Investors: In certain countries, volatility may be heightened by actions of a few major investors. For example, substantial increases or decreases in cash flows of mutual funds investing in these markets could significantly affect local stock prices and, therefore, share prices of the Portfolios.
These risks are discussed in further detail in the Portfolios’ prospectus.
An Important Note About Historical Performance
The performance shown on the following pages represents past performance and does not guarantee future results. Performance information is as of the dates shown. Current performance may be lower or higher than the performance information shown. You may obtain performance information current to the most recent month-end by calling 212.756.4097. The investment return and principal value of an investment in the Portfolios will fluctuate, so that shares, when redeemed, may be worth more or less than their original cost.
Investors should consider the investment objectives, risks, charges and expenses of the Portfolios carefully before investing. For copies of our prospectus or summary prospectus, which contain this and other information, visit www.Bernstein.com, click on “Investments”, then “Mutual Fund Information—Prospectuses, SAIs and Shareholder Reports”, or call Bernstein’s mutual fund shareholder help line at 212.756.4097 or contact your Bernstein Advisor. Please read the prospectus and/or summary prospectus carefully before investing.
| 8 | Bernstein Fund, Inc. |
Historical Performance (Unaudited)
Bernstein Fund Portfolios vs. Their Benchmarks and Lipper Averages
| TOTAL RETURNS | AVERAGE ANNUAL TOTAL RETURNS | |||||||||||||||
| THROUGH SEPTEMBER 30, 2018 | PAST SIX MONTHS |
PAST 12 MONTHS |
SINCE INCEPTION |
INCEPTION DATE | ||||||||||||
| Small Cap Core Portfolio1 |
|
12/29/2015 | ||||||||||||||
| SCB Class Shares |
9.30 | % | 12.44 | % | 12.25 | % | ||||||||||
| Advisor Class Shares |
9.45 | 12.64 | 12.51 | |||||||||||||
| Class Z Shares |
9.46 | 12.69 | 12.51 | |||||||||||||
| Russell 2000 Index |
11.61 | 15.24 | 16.35 | |||||||||||||
| Lipper Small-Cap Core Funds Average |
9.16 | 11.97 | 14.13 | |||||||||||||
| International Small Cap Portfolio2 |
|
12/21/2015 | ||||||||||||||
| SCB Class Shares |
-5.13 | 1.29 | 10.49 | |||||||||||||
| Advisor Class Shares |
-5.04 | 1.53 | 10.70 | |||||||||||||
| Class Z Shares |
-5.04 | 1.54 | 10.70 | |||||||||||||
| MSCI ACWI ex-USA Small Cap (net) |
-4.07 | 1.86 | 10.95 | |||||||||||||
| Lipper International Small/Mid-Cap Growth Funds Average |
-3.41 | 3.15 | 10.53 | |||||||||||||
| International Strategic Equities Portfolio3 |
|
12/21/2015 | ||||||||||||||
| SCB Class Shares |
-5.32 | 0.86 | 9.94 | |||||||||||||
| Advisor Class Shares |
-5.16 | 1.18 | 10.19 | |||||||||||||
| Class Z Shares |
-5.16 | 1.18 | 10.22 | |||||||||||||
| MSCI ACWI ex-US (net) |
-1.93 | 1.76 | 10.18 | |||||||||||||
| Lipper International Multi-Cap Growth Funds Average |
-1.49 | 2.90 | 9.24 | |||||||||||||
| 1 | The current prospectus table shows the total annual operating expense ratios for the Portfolio as 1.18%, 0.92% and 0.93% for SCB Class, Advisor Class and Class Z shares, respectively, gross of any fee waivers or expense reimbursements. The Financial Highlights section of this report sets forth expense ratio data for the current reporting period; the expense ratios shown above may differ from the expense ratios in the Financial Highlights section since they are based on different time periods. |
| 2 | The current prospectus table shows the total annual operating expense ratios for the Portfolio as 1.36%, 1.11% and 1.11% for SCB Class, Advisor Class and Class Z shares, respectively, gross of any fee waivers or expense reimbursements. Contractual fee waivers and/or expense reimbursements limit the Portfolio’s annual operating expense ratios exclusive of acquired fund fees and expenses other than the advisory fees of any registered funds advised by the Adviser in which the Portfolio may invest, interest expense, taxes, extraordinary expenses, and brokerage commissions and other transaction costs to 1.35%, 1.10% and 1.10% for SCB Class, Advisor Class and Class Z shares, respectively. These waivers may not be terminated prior to January 26, 2019. Any fees waived and expenses borne by the Adviser may be reimbursed by the Portfolio until the end of the third fiscal year after the fiscal period in which the fee was waived or the expense was borne, provided that no reimbursement payment will be made that would cause the Portfolio’s total annual operating expenses to exceed the expense limitations. Absent reimbursements or waivers, performance would have been lower. The Financial Highlights section of this report sets forth expense ratio data for the current reporting period; the expense ratios shown above may differ from the expense ratios in the Financial Highlights section since they are based on different time periods. |
| 3 | The current prospectus table shows the total annual operating expense ratios for the Portfolio as 1.09%, 0.84% and 0.86% for SCB Class, Advisor Class and Class Z shares, respectively, gross of any fee waivers or expense reimbursements. The Financial Highlights section of this report sets forth expense ratio data for the current reporting period; the expense ratios shown above may differ from the expense ratios in the Financial Highlights section since they are based on different time periods. |
See Disclosures, Risks and Note about Historical Performance on pages 6–8.
(Historical Performance continued on next page)
| 2018 Annual Report | 9 |
Historical Performance (continued from previous page)
| Small Cap Core—SCB Class Shares |
| Growth of a $10,000 Investment in the Portfolio |
|
|
| International Small Cap—SCB Class Shares |
| Growth of a $10,000 Investment in the Portfolio |
|
|
| International Strategic Equities—SCB Class Shares |
| Growth of a $10,000 Investment in the Portfolio |
|
|
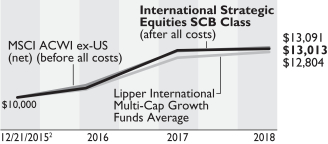
| Past performance is no guarantee of future results and an investment in the Portfolios could lose value. Each chart illustrates the total value of an assumed $10,000 investment as compared to the performance of each Portfolio’s respective benchmark and Lipper Average for the period since inception through September 30, 2018. |
| 1 | Inception date: 12/29/2015. |
| 2 | Inception date: 12/21/2015. |
See Disclosures, Risks and Note about Historical Performance on pages 6–8.
| 10 | Bernstein Fund, Inc. |
Expense Example—September 30, 2018 (Unaudited)
As a shareholder of a Portfolio, you incur various ongoing costs, including management fees and other Portfolio expenses. This example is intended to help you understand your ongoing costs (in dollars) of investing in the Portfolio and to compare these costs with the ongoing costs of investing in other mutual funds. The example is based on an investment of $1,000 invested at the beginning of the period and held for the entire period as indicated below.
Actual Expenses—The first line of the table below provides information about actual account values and actual expenses. You may use the information in this line, together with the amount you invested, to estimate the expenses that you paid over the period. Simply divide your account value by $1,000 (for example, an $8,600 account value divided by $1,000 = 8.6), then multiply the result by the number in the first line under the heading entitled “Expenses Paid During Period” to estimate the expenses you paid on your account during this period.
Hypothetical Example for Comparison Purposes—The second line of the table below provides information about hypothetical account values and hypothetical expenses based on a Portfolio’s actual expense ratio and an assumed annual rate of return of 5% before expenses, which is not the Portfolio’s actual return. The hypothetical account values and expenses may not be used to estimate the actual ending account balance or expenses you paid for the period. You may use this information to compare the ongoing costs of investing in the Portfolio and other funds by comparing this 5% hypothetical example with the 5% hypothetical examples that appear in the shareholder reports of other funds. Please note that the expenses shown in the table are meant to highlight your ongoing costs only and do not reflect any transactional costs, such as sales charges (loads), or contingent deferred sales charges on redemptions. Therefore, the second line of the table is useful in comparing ongoing costs only, and will not help you determine the relative total costs of owning different funds. In addition, if these transactional costs were included, your costs would have been higher.
| SMALL CAP CORE PORTFOLIO | BEGINNING ACCOUNT VALUE APRIL 1, 2018 |
ENDING ACCOUNT VALUE SEPTEMBER 30, 2018 |
EXPENSES PAID DURING PERIOD* |
ANNUALIZED EXPENSE RATIO* |
||||||||||||||||||||
| SCB Class |
||||||||||||||||||||||||
| Actual |
$ | 1,000 | $ | 1,093.00 | $ | 5.98 | 1.14 | % | ||||||||||||||||
| Hypothetical** |
$ | 1,000 | $ | 1,019.35 | $ | 5.77 | 1.14 | % | ||||||||||||||||
| Advisor Class |
||||||||||||||||||||||||
| Actual |
$ | 1,000 | $ | 1,094.50 | $ | 4.67 | 0.89 | % | ||||||||||||||||
| Hypothetical** |
$ | 1,000 | $ | 1,020.61 | $ | 4.51 | 0.89 | % | ||||||||||||||||
| Class Z |
||||||||||||||||||||||||
| Actual |
$ | 1,000 | $ | 1,094.60 | $ | 4.57 | 0.87 | % | ||||||||||||||||
| Hypothetical** |
$ | 1,000 | $ | 1,020.71 | $ | 4.41 | 0.87 | % | ||||||||||||||||
| INTERNATIONAL SMALL CAP PORTFOLIO | BEGINNING ACCOUNT VALUE APRIL 1, 2018 |
ENDING ACCOUNT VALUE SEPTEMBER 30, 2018 |
EXPENSES PAID DURING PERIOD* |
ANNUALIZED EXPENSE RATIO* |
TOTAL EXPENSES PAID DURING PERIOD+ |
TOTAL ANNUALIZED EXPENSE RATIO+ |
||||||||||||||||||
| SCB Class |
||||||||||||||||||||||||
| Actual |
$ | 1,000 | $ | 948.70 | $ | 6.55 | 1.34 | % | $ | 6.59 | 1.35 | % | ||||||||||||
| Hypothetical** |
$ | 1,000 | $ | 1,018.35 | $ | 6.78 | 1.34 | % | $ | 6.83 | 1.35 | % | ||||||||||||
| Advisor Class |
||||||||||||||||||||||||
| Actual |
$ | 1,000 | $ | 949.60 | $ | 5.33 | 1.09 | % | $ | 5.38 | 1.10 | % | ||||||||||||
| Hypothetical** |
$ | 1,000 | $ | 1,019.60 | $ | 5.52 | 1.09 | % | $ | 5.57 | 1.10 | % | ||||||||||||
| Class Z |
||||||||||||||||||||||||
| Actual |
$ | 1,000 | $ | 949.60 | $ | 5.33 | 1.09 | % | $ | 5.38 | 1.10 | % | ||||||||||||
| Hypothetical** |
$ | 1,000 | $ | 1,019.60 | $ | 5.52 | 1.09 | % | $ | 5.57 | 1.10 | % | ||||||||||||
| INTERNATIONAL STRATEGIC EQUITIES PORTFOLIO | BEGINNING ACCOUNT VALUE APRIL 1, 2018 |
ENDING ACCOUNT VALUE SEPTEMBER 30, 2018 |
EXPENSES PAID DURING PERIOD* |
ANNUALIZED EXPENSE RATIO* |
||||||||||||||||||||
| SCB Class |
||||||||||||||||||||||||
| Actual |
$ | 1,000 | $ | 946.80 | $ | 4.88 | 1.00 | % | ||||||||||||||||
| Hypothetical** |
$ | 1,000 | $ | 1,020.05 | $ | 5.06 | 1.00 | % | ||||||||||||||||
| Advisor Class |
||||||||||||||||||||||||
| Actual |
$ | 1,000 | $ | 948.40 | $ | 3.66 | 0.75 | % | ||||||||||||||||
| Hypothetical** |
$ | 1,000 | $ | 1,021.31 | $ | 3.80 | 0.75 | % | ||||||||||||||||
| Class Z |
||||||||||||||||||||||||
| Actual |
$ | 1,000 | $ | 948.40 | $ | 3.71 | 0.76 | % | ||||||||||||||||
| Hypothetical** |
$ | 1,000 | $ | 1,021.26 | $ | 3.85 | 0.76 | % | ||||||||||||||||
| * | Expenses are equal to the classes’ annualized expense ratios, multiplied by the average account value over the period, multiplied by 183/365 (to reflect the one-half year period). |
| ** | Assumes 5% annual return before expenses. |
| + | In connection with the Portfolios’ investments in affiliated/unaffiliated underlying portfolios, the Portfolios incur no direct expenses, but bear proportionate shares of the fees and expenses (i.e., operating, administrative and investment advisory fees) of the affiliated/unaffiliated underlying portfolios. The Adviser has contractually agreed to waive its fees from the Portfolios in an amount equal to the Portfolios’ pro rata share of certain acquired fund fees and expenses of the affiliated underlying portfolios. The Portfolios’ total expenses are equal to the classes’ annualized expense ratio plus the Portfolio’s pro rata share of the weighted average expense ratio of the affiliated/unaffiliated underlying portfolios in which it invests, multiplied by the average account value over the period, multiplied by 183/365 (to reflect the one-half year period). |
| 2018 Annual Report | 11 |
Portfolio Summary—September 30, 2018 (Unaudited)
| Small Cap Core Portfolio | ||||||
| Sector Breakdown1 |
|
|||||
| Financials |
17.5% | |||||
| Health Care |
16.7% | |||||
| Consumer Discretionary |
14.7% | |||||
| Industrials |
14.0% | |||||
| Information Technology |
13.4% | |||||
| Real Estate |
6.6% | |||||
| Energy |
5.5% | |||||
| Materials |
4.8% | |||||
| Consumer Staples |
3.0% | |||||
| Utilities |
2.6% | |||||
| Communication Services |
1.2% | |||||
| International Small Cap Portfolio | ||||||
| Sector Breakdown1 |
|
Country Breakdown1 | ||||
| Industrials |
22.6 | % |
| |||
| Consumer Discretionary |
12.2 | % | ||||
| Information Technology |
11.5 | % | ||||
| Financials |
10.4 | % | ||||
| Consumer Staples |
9.9 | % | ||||
| Materials |
7.6 | % | ||||
| Energy |
6.8 | % | ||||
| Health Care |
6.6 | % | ||||
| Real Estate |
6.2 | % | ||||
| Communication Services |
4.2 | % | ||||
| Utilities |
1.9 | % | ||||
| Funds and Investment Trusts
|
|
0.1
|
%
| |||
| International Strategic Equities Portfolio | ||||||
| Sector Breakdown1 |
|
Country Breakdown1 | ||||
| Financials |
17.7 | % |
| |||
| Consumer Discretionary |
16.9 | % | ||||
| Information Technology |
10.7 | % | ||||
| Energy |
10.6 | % | ||||
| Health Care |
10.5 | % | ||||
| Industrials |
9.1 | % | ||||
| Consumer Staples |
8.5 | % | ||||
| Communication Services |
7.1 | % | ||||
| Materials |
4.1 | % | ||||
| Real Estate |
3.1 | % | ||||
| Utilities
|
|
1.7
|
%
| |||
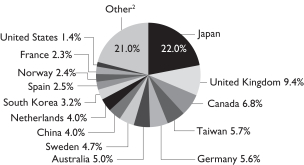
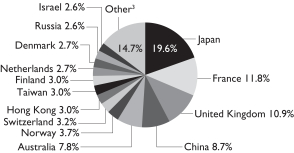
| 1 | All data are as of September 30, 2018. The Portfolio’s country and sector breakdowns are expressed as a percentage of each Portfolio’s long-term investments and may vary over time. Each Portfolio may also invest in other financial instruments, including derivative instruments, which provide investment exposure to a variety of asset classes (see “Schedule of Investments” section of the Small Cap Core, International Small Cap and International Strategic Equities Portfolios). |
| 2 | “Other” represents 10.3% in MSCI EM Index countries, 10.4% in MSCI EAFE Index countries and 0.3% in other emerging-market countries. |
| 3 | “Other” represents 4.2% in MSCI EM Index countries, 6.9% in MSCI EAFE Index countries and 3.6% in other emerging-market countries. |
| Please note: The sector classifications presented herein are based on the Global Industry Classification Standard (GICS) which was developed by Morgan Stanley Capital International and Standard & Poor’s. The components are divided into sector, industry group, and industry sub-indices as classified by the GICS for each of the market capitalization indices in the broad market. These sector classifications are broadly defined. The “Schedule of Investments” section of the report reflects more specific industry information and is consistent with the investment restrictions discussed in the Portfolio’s prospectus. |
| 12 | Bernstein Fund, Inc. |
Bernstein Fund, Inc.
Schedule of Investments
Small Cap Core Portfolio
September 30, 2018
| Company | Shares | U.S. $ Value | ||||||
| COMMON STOCKS–99.1% |
|
|||||||
| Financials–17.3% |
| |||||||
| Banks–8.3% | ||||||||
| 1st Source Corp. |
28,510 | $ | 1,500,196 | |||||
| Bank of NT Butterfield & Son Ltd. (The) |
121,330 | 6,292,174 | ||||||
| Cathay General Bancorp |
135,400 | 5,610,976 | ||||||
| Community Trust Bancorp, Inc. |
49,860 | 2,311,011 | ||||||
| Eagle Bancorp, Inc.(a) |
78,320 | 3,962,992 | ||||||
| Enterprise Financial Services Corp. |
19,650 | 1,042,433 | ||||||
| FCB Financial Holdings, Inc.–Class A(a) |
65,850 | 3,121,290 | ||||||
| Fidelity Southern Corp. |
28,980 | 718,124 | ||||||
| First Citizens BancShares, Inc./NC–Class A |
9,180 | 4,151,930 | ||||||
| First Financial Corp./IN |
49,810 | 2,500,462 | ||||||
| Great Southern Bancorp, Inc. |
41,730 | 2,309,755 | ||||||
| Great Western Bancorp, Inc. |
125,570 | 5,297,798 | ||||||
| Guaranty Bancorp |
34,300 | 1,018,710 | ||||||
| Hancock Whitney Corp. |
106,620 | 5,069,781 | ||||||
| Hanmi Financial Corp. |
99,610 | 2,480,289 | ||||||
| Hope Bancorp, Inc. |
83,770 | 1,354,561 | ||||||
| International Bancshares Corp. |
105,680 | 4,755,600 | ||||||
| Republic Bancorp, Inc./KY–Class A |
62,300 | 2,872,030 | ||||||
| S&T Bancorp, Inc. |
50,160 | 2,174,938 | ||||||
| State Bank Financial Corp. |
63,170 | 1,906,471 | ||||||
| Synovus Financial Corp. |
70,930 | 3,247,885 | ||||||
| TCF Financial Corp. |
127,000 | 3,023,870 | ||||||
| Texas Capital Bancshares, Inc.(a) |
39,530 | 3,267,154 | ||||||
| Umpqua Holdings Corp. |
159,300 | 3,313,440 | ||||||
| Western Alliance Bancorp(a) |
73,140 | 4,160,935 | ||||||
| Wintrust Financial Corp. |
41,720 | 3,543,697 | ||||||
|
|
|
|||||||
| 81,008,502 | ||||||||
|
|
|
|||||||
| Capital Markets–1.1% | ||||||||
| Blucora, Inc.(a) |
39,210 | 1,578,203 | ||||||
| Evercore, Inc.–Class A |
24,710 | 2,484,591 | ||||||
| Houlihan Lokey, Inc. |
62,540 | 2,809,922 | ||||||
| Stifel Financial Corp. |
30,140 | 1,544,976 | ||||||
| Waddell & Reed Financial, Inc.–Class A |
95,900 | 2,031,162 | ||||||
|
|
|
|||||||
| 10,448,854 | ||||||||
|
|
|
|||||||
| Consumer Finance–1.1% | ||||||||
| Encore Capital Group, Inc.(a) |
48,980 | 1,755,933 | ||||||
| Green Dot Corp.–Class A(a) |
58,290 | 5,177,318 | ||||||
| Nelnet, Inc.–Class A |
56,790 | 3,246,684 | ||||||
|
|
|
|||||||
| 10,179,935 | ||||||||
|
|
|
|||||||
| Diversified Financial Services–0.3% | ||||||||
| FGL Holdings(a) |
225,790 | 2,020,820 | ||||||
| Texas Pacific Land Trust |
1,380 | 1,190,333 | ||||||
|
|
|
|||||||
| 3,211,153 | ||||||||
|
|
|
|||||||
| Insurance–3.6% | ||||||||
| Ambac Financial Group, Inc.(a) |
102,920 | 2,101,626 | ||||||
| American Equity Investment Life Holding Co. |
121,884 | 4,309,818 | ||||||
| Assured Guaranty Ltd. |
121,590 | $ | 5,134,746 | |||||
| CNO Financial Group, Inc. |
218,870 | 4,644,421 | ||||||
| Employers Holdings, Inc. |
34,140 | 1,546,542 | ||||||
| First American Financial Corp. |
60,090 | 3,100,043 | ||||||
| Genworth Financial, Inc.–Class A(a) |
499,650 | 2,083,541 | ||||||
| Heritage Insurance Holdings, Inc. |
84,400 | 1,250,808 | ||||||
| National Western Life Group, Inc.–Class A |
8,070 | 2,575,944 | ||||||
| Primerica, Inc. |
24,270 | 2,925,749 | ||||||
| Third Point Reinsurance Ltd.(a) |
105,660 | 1,373,580 | ||||||
| Universal Insurance Holdings, Inc. |
89,220 | 4,331,631 | ||||||
|
|
|
|||||||
| 35,378,449 | ||||||||
|
|
|
|||||||
| Mortgage Real Estate Investment Trusts (REITs)–0.3% |
| |||||||
| AG Mortgage Investment Trust, Inc. |
100,900 | 1,834,362 | ||||||
| PennyMac Mortgage Investment Trust |
55,170 | 1,116,641 | ||||||
|
|
|
|||||||
| 2,951,003 | ||||||||
|
|
|
|||||||
| Thrifts & Mortgage Finance–2.6% | ||||||||
| Axos Financial, Inc.(a) |
63,440 | 2,181,702 | ||||||
| BankUnited, Inc. |
76,150 | 2,695,710 | ||||||
| Essent Group Ltd.(a) |
129,780 | 5,742,765 | ||||||
| Federal Agricultural Mortgage Corp.–Class C |
11,530 | 832,235 | ||||||
| MGIC Investment Corp.(a) |
600,600 | 7,993,986 | ||||||
| NMI Holdings, Inc.–Class A(a) |
93,310 | 2,113,471 | ||||||
| Walker & Dunlop, Inc. |
75,450 | 3,989,796 | ||||||
|
|
|
|||||||
| 25,549,665 | ||||||||
|
|
|
|||||||
| 168,727,561 | ||||||||
|
|
|
|||||||
| Health Care–16.5% | ||||||||
| Biotechnology–5.4% | ||||||||
| Adamas Pharmaceuticals, Inc.(a) |
30,490 | 610,410 | ||||||
| Aimmune Therapeutics, Inc.(a) |
51,080 | 1,393,462 | ||||||
| Array BioPharma, Inc.(a) |
148,120 | 2,251,424 | ||||||
| Ascendis Pharma A/S (Sponsored ADR)(a) |
14,200 | 1,006,212 | ||||||
| Audentes Therapeutics, Inc.(a) |
45,140 | 1,787,093 | ||||||
| BeiGene Ltd. (Sponsored ADR)(a) |
4,980 | 857,656 | ||||||
| Biohaven Pharmaceutical Holding Co., Ltd.(a) |
27,110 | 1,017,981 | ||||||
| Blueprint Medicines Corp.(a) |
33,500 | 2,615,010 | ||||||
| Clovis Oncology, Inc.(a) |
12,260 | 360,076 | ||||||
| CytomX Therapeutics, Inc.(a) |
44,670 | 826,395 | ||||||
| Deciphera Pharmaceuticals, Inc.(a) |
43,470 | 1,683,158 | ||||||
| Eagle Pharmaceuticals, Inc./DE(a) |
23,160 | 1,605,683 | ||||||
| Emergent BioSolutions, Inc.(a) |
55,130 | 3,629,208 | ||||||
| Enanta Pharmaceuticals, Inc.(a) |
17,890 | 1,528,879 | ||||||
| Exact Sciences Corp.(a) |
27,720 | 2,187,662 | ||||||
| Halozyme Therapeutics, Inc.(a) |
100,390 | 1,824,086 | ||||||
| Ligand Pharmaceuticals, Inc.(a) |
16,200 | 4,446,738 | ||||||
| Loxo Oncology, Inc.(a) |
19,963 | 3,410,279 | ||||||
| Madrigal Pharmaceuticals, Inc.(a) |
8,900 | 1,905,757 | ||||||
| Myriad Genetics, Inc.(a) |
69,210 | 3,183,660 | ||||||
| Neurocrine Biosciences, Inc.(a) |
14,340 | 1,763,103 | ||||||
| Pieris Pharmaceuticals, Inc.(a) |
112,280 | 628,768 | ||||||
| REGENXBIO, Inc.(a) |
31,620 | 2,387,310 | ||||||
| Retrophin, Inc.(a) |
59,190 | 1,700,529 | ||||||
| Sarepta Therapeutics, Inc.(a) |
7,090 | 1,145,106 | ||||||
| Spark Therapeutics, Inc.(a) |
28,220 | 1,539,401 | ||||||
| 2018 Annual Report | 13 |
Schedule of Investments (continued)
| Company | Shares | U.S. $ Value | ||||||
| Ultragenyx Pharmaceutical, Inc.(a) |
35,380 | $ | 2,700,909 | |||||
| Vanda Pharmaceuticals, Inc.(a) |
96,050 | 2,204,348 | ||||||
|
|
|
|||||||
| 52,200,303 | ||||||||
|
|
|
|||||||
| Health Care Equipment & Supplies–4.7% | ||||||||
| AngioDynamics, Inc.(a) |
36,070 | 784,162 | ||||||
| Atrion Corp. |
5,010 | 3,480,948 | ||||||
| Avanos Medical, Inc.(a) |
31,310 | 2,144,735 | ||||||
| AxoGen, Inc.(a) |
17,240 | 635,294 | ||||||
| Cantel Medical Corp. |
10,420 | 959,265 | ||||||
| CONMED Corp. |
23,490 | 1,860,878 | ||||||
| Globus Medical, Inc.–Class A(a) |
91,500 | 5,193,540 | ||||||
| Haemonetics Corp.(a) |
44,150 | 5,058,707 | ||||||
| ICU Medical, Inc.(a) |
6,310 | 1,784,153 | ||||||
| Inogen, Inc.(a) |
5,750 | 1,403,690 | ||||||
| Integer Holdings Corp.(a) |
38,250 | 3,172,837 | ||||||
| iRhythm Technologies, Inc.(a) |
15,870 | 1,502,254 | ||||||
| LivaNova PLC(a) |
25,440 | 3,153,797 | ||||||
| Masimo Corp.(a) |
23,170 | 2,885,592 | ||||||
| Merit Medical Systems, Inc.(a) |
36,550 | 2,245,997 | ||||||
| Neogen Corp.(a) |
34,230 | 2,448,472 | ||||||
| OraSure Technologies, Inc.(a) |
42,920 | 663,114 | ||||||
| Orthofix Medical, Inc.(a) |
56,850 | 3,286,498 | ||||||
| Penumbra, Inc.(a) |
11,980 | 1,793,406 | ||||||
| Tactile Systems Technology, Inc.(a) |
24,990 | 1,775,540 | ||||||
|
|
|
|||||||
| 46,232,879 | ||||||||
|
|
|
|||||||
| Health Care Providers & Services–2.8% | ||||||||
| Addus HomeCare Corp.(a) |
37,790 | 2,650,968 | ||||||
| Amedisys, Inc.(a) |
33,310 | 4,162,418 | ||||||
| AMN Healthcare Services, Inc.(a) |
62,110 | 3,397,417 | ||||||
| Chemed Corp. |
9,310 | 2,975,290 | ||||||
| Diplomat Pharmacy, Inc.(a) |
51,350 | 996,704 | ||||||
| LHC Group, Inc.(a) |
24,710 | 2,544,883 | ||||||
| Molina Healthcare, Inc.(a) |
21,190 | 3,150,953 | ||||||
| RadNet, Inc.(a) |
85,130 | 1,281,206 | ||||||
| Tivity Health, Inc.(a) |
27,960 | 898,914 | ||||||
| WellCare Health Plans, Inc.(a) |
14,980 | 4,800,940 | ||||||
|
|
|
|||||||
| 26,859,693 | ||||||||
|
|
|
|||||||
| Health Care Technology–0.3% | ||||||||
| HealthStream, Inc. |
62,500 | 1,938,125 | ||||||
| Medidata Solutions, Inc.(a) |
17,540 | 1,285,857 | ||||||
|
|
|
|||||||
| 3,223,982 | ||||||||
|
|
|
|||||||
| Life Sciences Tools & Services–0.5% | ||||||||
| Cambrex Corp.(a) |
8,320 | 569,088 | ||||||
| ICON PLC(a) |
16,830 | 2,587,612 | ||||||
| PRA Health Sciences, Inc.(a) |
19,650 | 2,165,234 | ||||||
|
|
|
|||||||
| 5,321,934 | ||||||||
|
|
|
|||||||
| Pharmaceuticals–2.8% | ||||||||
| Aerie Pharmaceuticals, Inc.(a) |
30,140 | 1,855,117 | ||||||
| Amphastar Pharmaceuticals, Inc.(a) |
78,500 | 1,510,340 | ||||||
| Catalent, Inc.(a) |
46,330 | 2,110,331 | ||||||
| Corcept Therapeutics, Inc.(a) |
93,870 | 1,316,057 | ||||||
| Endo International PLC(a) |
168,900 | 2,842,587 | ||||||
| GW Pharmaceuticals PLC (Sponsored ADR)(a) |
6,800 | 1,174,632 | ||||||
| Horizon Pharma PLC(a) |
154,510 | $ | 3,025,306 | |||||
| Innoviva, Inc.(a) |
120,540 | 1,837,030 | ||||||
| Intersect ENT, Inc.(a) |
21,640 | 622,150 | ||||||
| Lannett Co., Inc.(a) |
42,250 | 200,688 | ||||||
| Mallinckrodt PLC(a) |
99,910 | 2,928,362 | ||||||
| MyoKardia, Inc.(a) |
27,060 | 1,764,312 | ||||||
| Phibro Animal Health Corp.–Class A |
40,670 | 1,744,743 | ||||||
| Revance Therapeutics, Inc.(a) |
63,360 | 1,574,496 | ||||||
| Supernus Pharmaceuticals, Inc.(a) |
57,920 | 2,916,272 | ||||||
|
|
|
|||||||
| 27,422,423 | ||||||||
|
|
|
|||||||
| 161,261,214 | ||||||||
|
|
|
|||||||
| Consumer Discretionary–14.5% | ||||||||
| Auto Components–0.7% | ||||||||
| Cooper-Standard Holdings, Inc.(a) |
21,440 | 2,572,371 | ||||||
| Stoneridge, Inc.(a) |
57,930 | 1,721,680 | ||||||
| Tower International, Inc. |
102,240 | 3,092,760 | ||||||
|
|
|
|||||||
| 7,386,811 | ||||||||
|
|
|
|||||||
| Automobiles–0.5% | ||||||||
| Thor Industries, Inc. |
32,790 | 2,744,523 | ||||||
| Winnebago Industries, Inc. |
62,370 | 2,067,565 | ||||||
|
|
|
|||||||
| 4,812,088 | ||||||||
|
|
|
|||||||
| Diversified Consumer Services–2.1% | ||||||||
| Adtalem Global Education, Inc.(a) |
85,960 | 4,143,272 | ||||||
| Grand Canyon Education, Inc.(a) |
16,780 | 1,892,784 | ||||||
| Hillenbrand, Inc. |
111,770 | 5,845,571 | ||||||
| K12, Inc.(a) |
138,510 | 2,451,627 | ||||||
| Sotheby’s(a) |
17,460 | 858,857 | ||||||
| Strategic Education, Inc. |
29,627 | 4,059,788 | ||||||
| Weight Watchers International, Inc.(a) |
22,230 | 1,600,338 | ||||||
|
|
|
|||||||
| 20,852,237 | ||||||||
|
|
|
|||||||
| Hotels, Restaurants & Leisure–3.1% | ||||||||
| Bloomin’ Brands, Inc. |
159,570 | 3,157,890 | ||||||
| Brinker International, Inc. |
60,540 | 2,829,034 | ||||||
| Churchill Downs, Inc. |
6,500 | 1,805,050 | ||||||
| Denny’s Corp.(a) |
197,090 | 2,901,165 | ||||||
| Hilton Grand Vacations, Inc.(a) |
79,490 | 2,631,119 | ||||||
| Penn National Gaming, Inc.(a) |
159,610 | 5,254,361 | ||||||
| Pinnacle Entertainment, Inc.(a) |
62,880 | 2,118,427 | ||||||
| Ruth’s Hospitality Group, Inc. |
110,700 | 3,492,585 | ||||||
| Texas Roadhouse, Inc.–Class A |
41,740 | 2,892,165 | ||||||
| Wingstop, Inc. |
49,180 | 3,357,519 | ||||||
|
|
|
|||||||
| 30,439,315 | ||||||||
|
|
|
|||||||
| Household Durables–0.8% | ||||||||
| Beazer Homes USA, Inc.(a) |
105,030 | 1,102,815 | ||||||
| Helen of Troy Ltd.(a) |
28,560 | 3,738,504 | ||||||
| TopBuild Corp.(a) |
46,280 | 2,629,630 | ||||||
|
|
|
|||||||
| 7,470,949 | ||||||||
|
|
|
|||||||
| Internet & Direct Marketing Retail–1.8% | ||||||||
| Etsy, Inc.(a) |
84,030 | 4,317,461 | ||||||
| GrubHub, Inc.(a) |
17,030 | 2,360,699 | ||||||
| Nutrisystem, Inc. |
113,530 | 4,206,287 | ||||||
| 14 | Bernstein Fund, Inc. |
| Company | Shares | U.S. $ Value | ||||||
| Shutterstock, Inc. |
19,130 | $ | 1,044,115 | |||||
| Stamps.com, Inc.(a) |
25,420 | 5,750,004 | ||||||
|
|
|
|||||||
| 17,678,566 | ||||||||
|
|
|
|||||||
| Leisure Products–0.4% | ||||||||
| MCBC Holdings, Inc.(a) |
47,250 | 1,695,330 | ||||||
| Sturm Ruger & Co., Inc. |
39,270 | 2,711,593 | ||||||
|
|
|
|||||||
| 4,406,923 | ||||||||
|
|
|
|||||||
| Multiline Retail–1.0% | ||||||||
| Big Lots, Inc. |
66,350 | 2,772,767 | ||||||
| Dillard’s, Inc.–Class A |
24,960 | 1,905,446 | ||||||
| Ollie’s Bargain Outlet Holdings, Inc.(a) |
49,400 | 4,747,340 | ||||||
|
|
|
|||||||
| 9,425,553 | ||||||||
|
|
|
|||||||
| Specialty Retail–2.7% | ||||||||
| Abercrombie & Fitch Co.–Class A |
74,690 | 1,577,453 | ||||||
| American Eagle Outfitters, Inc. |
70,380 | 1,747,535 | ||||||
| Chico’s FAS, Inc. |
162,240 | 1,406,621 | ||||||
| Children’s Place, Inc. (The) |
21,470 | 2,743,866 | ||||||
| Citi Trends, Inc. |
54,500 | 1,567,965 | ||||||
| Five Below, Inc.(a) |
35,470 | 4,613,228 | ||||||
| RH(a) |
18,930 | 2,480,019 | ||||||
| Signet Jewelers Ltd. |
71,640 | 4,723,225 | ||||||
| Sleep Number Corp.(a) |
78,630 | 2,892,012 | ||||||
| Tailored Brands, Inc. |
87,440 | 2,202,614 | ||||||
|
|
|
|||||||
| 25,954,538 | ||||||||
|
|
|
|||||||
| Textiles, Apparel & Luxury Goods–1.4% | ||||||||
| Deckers Outdoor Corp.(a) |
41,500 | 4,921,070 | ||||||
| Fossil Group, Inc.(a) |
33,400 | 777,552 | ||||||
| G-III Apparel Group Ltd.(a) |
72,410 | 3,489,438 | ||||||
| Vera Bradley, Inc.(a) |
102,460 | 1,563,540 | ||||||
| Wolverine World Wide, Inc. |
64,970 | 2,537,078 | ||||||
|
|
|
|||||||
| 13,288,678 | ||||||||
|
|
|
|||||||
| 141,715,658 | ||||||||
|
|
|
|||||||
| Industrials–13.8% | ||||||||
| Aerospace & Defense–0.5% | ||||||||
| Curtiss-Wright Corp. |
24,290 | 3,337,932 | ||||||
| Vectrus, Inc.(a) |
39,260 | 1,224,519 | ||||||
|
|
|
|||||||
| 4,562,451 | ||||||||
|
|
|
|||||||
| Air Freight & Logistics–0.4% | ||||||||
| Echo Global Logistics, Inc.(a) |
56,130 | 1,737,224 | ||||||
| Forward Air Corp. |
20,910 | 1,499,247 | ||||||
| XPO Logistics, Inc.(a) |
9,630 | 1,099,457 | ||||||
|
|
|
|||||||
| 4,335,928 | ||||||||
|
|
|
|||||||
| Airlines–0.5% | ||||||||
| Hawaiian Holdings, Inc. |
85,870 | 3,443,387 | ||||||
| SkyWest, Inc. |
22,280 | 1,312,292 | ||||||
|
|
|
|||||||
| 4,755,679 | ||||||||
|
|
|
|||||||
| Building Products–1.6% | ||||||||
| Builders FirstSource, Inc.(a) |
275,030 | 4,037,440 | ||||||
| Continental Building Products, Inc.(a) |
105,580 | 3,964,529 | ||||||
| NCI Building Systems, Inc.(a) |
170,670 | $ | 2,585,651 | |||||
| Patrick Industries, Inc.(a) |
30,130 | 1,783,696 | ||||||
| Trex Co., Inc.(a) |
49,090 | 3,778,948 | ||||||
|
|
|
|||||||
| 16,150,264 | ||||||||
|
|
|
|||||||
| Commercial Services & Supplies–1.6% | ||||||||
| ACCO Brands Corp. |
330,650 | 3,736,345 | ||||||
| Brady Corp.–Class A |
24,190 | 1,058,313 | ||||||
| Casella Waste Systems, Inc.–Class A(a) |
54,490 | 1,692,459 | ||||||
| Deluxe Corp. |
32,510 | 1,851,120 | ||||||
| Ennis, Inc. |
55,600 | 1,137,020 | ||||||
| Kimball International, Inc.–Class B |
72,300 | 1,211,025 | ||||||
| Quad/Graphics, Inc. |
73,810 | 1,538,200 | ||||||
| SP Plus Corp.(a) |
46,320 | 1,690,680 | ||||||
| Steelcase, Inc.–Class A |
68,860 | 1,273,910 | ||||||
|
|
|
|||||||
| 15,189,072 | ||||||||
|
|
|
|||||||
| Construction & Engineering–1.9% | ||||||||
| Comfort Systems USA, Inc. |
48,130 | 2,714,532 | ||||||
| EMCOR Group, Inc. |
64,880 | 4,873,137 | ||||||
| MasTec, Inc.(a) |
26,120 | 1,166,258 | ||||||
| Primoris Services Corp. |
175,078 | 4,345,436 | ||||||
| Quanta Services, Inc.(a) |
74,990 | 2,503,166 | ||||||
| Tutor Perini Corp.(a) |
162,310 | 3,051,428 | ||||||
|
|
|
|||||||
| 18,653,957 | ||||||||
|
|
|
|||||||
| Electrical Equipment–1.1% | ||||||||
| Atkore International Group, Inc.(a) |
164,930 | 4,375,593 | ||||||
| EnerSys |
25,000 | 2,178,250 | ||||||
| Generac Holdings, Inc.(a) |
69,010 | 3,892,854 | ||||||
|
|
|
|||||||
| 10,446,697 | ||||||||
|
|
|
|||||||
| Machinery–2.1% | ||||||||
| Alamo Group, Inc. |
12,480 | 1,143,293 | ||||||
| Barnes Group, Inc. |
27,900 | 1,981,737 | ||||||
| Global Brass & Copper Holdings, Inc. |
78,290 | 2,888,901 | ||||||
| Greenbrier Cos., Inc. (The) |
43,470 | 2,612,547 | ||||||
| Harsco Corp.(a) |
65,460 | 1,868,883 | ||||||
| Hyster-Yale Materials Handling, Inc. |
26,040 | 1,602,241 | ||||||
| Kadant, Inc. |
15,670 | 1,690,009 | ||||||
| Meritor, Inc.(a) |
213,170 | 4,126,971 | ||||||
| Wabash National Corp. |
160,090 | 2,918,441 | ||||||
|
|
|
|||||||
| 20,833,023 | ||||||||
|
|
|
|||||||
| Professional Services–2.3% | ||||||||
| ASGN, Inc.(a) |
48,860 | 3,856,520 | ||||||
| Barrett Business Services, Inc. |
39,120 | 2,612,434 | ||||||
| FTI Consulting, Inc.(a) |
46,580 | 3,409,190 | ||||||
| ICF International, Inc. |
36,420 | 2,747,889 | ||||||
| Insperity, Inc. |
38,500 | 4,541,075 | ||||||
| Kforce, Inc. |
36,740 | 1,381,424 | ||||||
| TriNet Group, Inc.(a) |
24,360 | 1,371,955 | ||||||
| TrueBlue, Inc.(a) |
91,970 | 2,395,818 | ||||||
|
|
|
|||||||
| 22,316,305 | ||||||||
|
|
|
|||||||
| Road & Rail–0.5% | ||||||||
| ArcBest Corp. |
40,470 | 1,964,819 | ||||||
| Knight-Swift Transportation Holdings, Inc. |
23,457 | 808,797 | ||||||
| Saia, Inc.(a) |
24,240 | 1,853,148 | ||||||
|
|
|
|||||||
| 4,626,764 | ||||||||
|
|
|
|||||||
| 2018 Annual Report | 15 |
Schedule of Investments (continued)
| Company | Shares | U.S. $ Value | ||||||
| Trading Companies & Distributors–1.3% | ||||||||
| Applied Industrial Technologies, Inc. |
42,590 | $ | 3,332,667 | |||||
| BMC Stock Holdings, Inc.(a) |
161,850 | 3,018,503 | ||||||
| GMS, Inc.(a) |
110,750 | 2,569,400 | ||||||
| Rush Enterprises, Inc.–Class A |
57,130 | 2,245,780 | ||||||
| Titan Machinery, Inc.(a) |
117,280 | 1,816,081 | ||||||
|
|
|
|||||||
| 12,982,431 | ||||||||
|
|
|
|||||||
| 134,852,571 | ||||||||
|
|
|
|||||||
| Information Technology–13.3% | ||||||||
| Communications Equipment–1.6% | ||||||||
| Ciena Corp.(a) |
158,560 | 4,953,415 | ||||||
| Comtech Telecommunications Corp. |
64,130 | 2,325,995 | ||||||
| Finisar Corp.(a) |
108,500 | 2,066,925 | ||||||
| InterDigital, Inc./PA |
50,630 | 4,050,400 | ||||||
| Ubiquiti Networks, Inc. |
25,690 | 2,539,713 | ||||||
|
|
|
|||||||
| 15,936,448 | ||||||||
|
|
|
|||||||
| Electronic Equipment, Instruments & Components–2.9% |
| |||||||
| Anixter International, Inc.(a) |
35,630 | 2,504,789 | ||||||
| ePlus, Inc.(a) |
38,230 | 3,543,921 | ||||||
| II-VI, Inc.(a) |
13,820 | 653,686 | ||||||
| Insight Enterprises, Inc.(a) |
32,760 | 1,771,988 | ||||||
| Jabil, Inc. |
117,260 | 3,175,401 | ||||||
| Littelfuse, Inc. |
13,240 | 2,620,063 | ||||||
| Novanta, Inc.(a) |
15,470 | 1,058,148 | ||||||
| PC Connection, Inc. |
30,380 | 1,181,478 | ||||||
| Sanmina Corp.(a) |
110,400 | 3,047,040 | ||||||
| SYNNEX Corp. |
37,990 | 3,217,753 | ||||||
| Tech Data Corp.(a) |
39,510 | 2,827,731 | ||||||
| TTM Technologies, Inc.(a) |
135,160 | 2,150,396 | ||||||
|
|
|
|||||||
| 27,752,394 | ||||||||
|
|
|
|||||||
| IT Services–2.9% | ||||||||
| Booz Allen Hamilton Holding Corp. |
64,020 | 3,177,313 | ||||||
| CACI International, Inc.–Class A(a) |
29,200 | 5,377,180 | ||||||
| Convergys Corp. |
127,640 | 3,030,174 | ||||||
| Genpact Ltd. |
41,160 | 1,259,908 | ||||||
| ManTech International Corp./VA–Class A |
47,690 | 3,018,777 | ||||||
| MAXIMUS, Inc. |
69,390 | 4,514,513 | ||||||
| Perficient, Inc.(a) |
127,920 | 3,409,068 | ||||||
| Science Applications International Corp. |
26,943 | 2,171,606 | ||||||
| WNS Holdings Ltd. (ADR)(a) |
40,990 | 2,080,242 | ||||||
|
|
|
|||||||
| 28,038,781 | ||||||||
|
|
|
|||||||
| Semiconductors & Semiconductor Equipment–1.9% |
| |||||||
| Cabot Microelectronics Corp. |
16,000 | 1,650,720 | ||||||
| Cirrus Logic, Inc.(a) |
108,590 | 4,191,574 | ||||||
| Cypress Semiconductor Corp. |
125,670 | 1,820,958 | ||||||
| Kulicke & Soffa Industries, Inc. |
126,070 | 3,005,509 | ||||||
| MKS Instruments, Inc. |
14,870 | 1,191,830 | ||||||
| Monolithic Power Systems, Inc. |
14,670 | 1,841,525 | ||||||
| Semtech Corp.(a) |
41,800 | 2,324,080 | ||||||
| Silicon Laboratories, Inc.(a) |
22,280 | 2,045,304 | ||||||
| SMART Global Holdings, Inc.(a) |
29,740 | 854,728 | ||||||
|
|
|
|||||||
| 18,926,228 | ||||||||
|
|
|
|||||||
| Software–3.9% | ||||||||
| Appfolio, Inc.–Class A(a) |
31,080 | $ | 2,436,672 | |||||
| Aspen Technology, Inc.(a) |
26,920 | 3,066,457 | ||||||
| Blackbaud, Inc. |
10,680 | 1,083,806 | ||||||
| Bottomline Technologies DE, Inc.(a) |
45,180 | 3,285,038 | ||||||
| Envestnet, Inc.(a) |
20,570 | 1,253,742 | ||||||
| Fair Isaac Corp.(a) |
13,010 | 2,973,436 | ||||||
| j2 Global, Inc. |
58,990 | 4,887,321 | ||||||
| New Relic, Inc.(a) |
43,750 | 4,122,562 | ||||||
| Nutanix, Inc.–Class A(a) |
28,220 | 1,205,558 | ||||||
| Paycom Software, Inc.(a) |
7,520 | 1,168,683 | ||||||
| Pegasystems, Inc. |
39,350 | 2,463,310 | ||||||
| Progress Software Corp. |
69,540 | 2,454,067 | ||||||
| Trade Desk, Inc. (The)–Class A(a) |
31,580 | 4,765,738 | ||||||
| Verint Systems, Inc.(a) |
62,740 | 3,143,274 | ||||||
|
|
|
|||||||
| 38,309,664 | ||||||||
|
|
|
|||||||
| Technology Hardware, Storage & Peripherals–0.1% |
| |||||||
| NCR Corp.(a) |
29,150 | 828,152 | ||||||
|
|
|
|||||||
| 129,791,667 | ||||||||
|
|
|
|||||||
| Real Estate–6.6% | ||||||||
| Equity Real Estate Investment Trusts (REITs)–5.7% |
| |||||||
| CareTrust REIT, Inc. |
92,740 | 1,642,425 | ||||||
| Chesapeake Lodging Trust |
55,160 | 1,768,981 | ||||||
| CoreCivic, Inc. |
56,930 | 1,385,107 | ||||||
| CorEnergy Infrastructure Trust, Inc. |
63,460 | 2,384,827 | ||||||
| CoreSite Realty Corp. |
26,520 | 2,947,433 | ||||||
| Cousins Properties, Inc. |
229,010 | 2,035,899 | ||||||
| CubeSmart |
88,920 | 2,536,888 | ||||||
| First Industrial Realty Trust, Inc. |
77,170 | 2,423,138 | ||||||
| InfraREIT, Inc. |
122,480 | 2,590,452 | ||||||
| iStar, Inc. |
235,370 | 2,629,083 | ||||||
| MedEquities Realty Trust, Inc. |
106,952 | 1,039,573 | ||||||
| Monmouth Real Estate Investment Corp.–Class A |
94,465 | 1,579,455 | ||||||
| National Health Investors, Inc. |
27,060 | 2,045,465 | ||||||
| National Storage Affiliates Trust |
91,000 | 2,315,040 | ||||||
| Pebblebrook Hotel Trust |
60,310 | 2,193,475 | ||||||
| PotlatchDeltic Corp. |
38,090 | 1,559,785 | ||||||
| Ryman Hospitality Properties, Inc. |
52,480 | 4,522,202 | ||||||
| Sabra Health Care REIT, Inc. |
142,560 | 3,295,987 | ||||||
| Select Income REIT |
64,960 | 1,425,222 | ||||||
| STAG Industrial, Inc. |
128,600 | 3,536,500 | ||||||
| Summit Hotel Properties, Inc. |
141,660 | 1,916,660 | ||||||
| Sun Communities, Inc. |
4,670 | 474,192 | ||||||
| Sunstone Hotel Investors, Inc. |
171,000 | 2,797,560 | ||||||
| Xenia Hotels & Resorts, Inc. |
167,580 | 3,971,646 | ||||||
|
|
|
|||||||
| 55,016,995 | ||||||||
|
|
|
|||||||
| Real Estate Management & Development–0.9% | ||||||||
| Marcus & Millichap, Inc.(a) |
95,580 | 3,317,582 | ||||||
| RE/MAX Holdings, Inc.–Class A |
43,430 | 1,926,120 | ||||||
| RMR Group, Inc. (The)–Class A |
38,380 | 3,561,664 | ||||||
|
|
|
|||||||
| 8,805,366 | ||||||||
|
|
|
|||||||
| 63,822,361 | ||||||||
|
|
|
|||||||
| 16 | Bernstein Fund, Inc. |
| Company | Shares | U.S. $ Value | ||||||
| Energy–5.4% | ||||||||
| Energy Equipment & Services–1.7% | ||||||||
| Archrock, Inc. |
134,880 | $ | 1,645,536 | |||||
| Cactus, Inc.–Class A(a) |
65,230 | 2,497,004 | ||||||
| Mammoth Energy Services, Inc. |
105,430 | 3,068,013 | ||||||
| Matrix Service Co.(a) |
125,900 | 3,103,435 | ||||||
| McDermott International, Inc.(a) |
74,364 | 1,370,529 | ||||||
| ProPetro Holding Corp.(a) |
215,710 | 3,557,058 | ||||||
| RPC, Inc. |
109,500 | 1,695,060 | ||||||
|
|
|
|||||||
| 16,936,635 | ||||||||
|
|
|
|||||||
| Oil, Gas & Consumable Fuels–3.7% | ||||||||
| Arch Coal, Inc. |
38,740 | 3,463,356 | ||||||
| CONSOL Energy, Inc.(a) |
58,630 | 2,392,690 | ||||||
| CVR Energy, Inc. |
84,390 | 3,394,166 | ||||||
| Delek US Holdings, Inc. |
104,440 | 4,431,389 | ||||||
| HollyFrontier Corp. |
28,470 | 1,990,053 | ||||||
| Matador Resources Co.(a) |
101,930 | 3,368,787 | ||||||
| Par Pacific Holdings, Inc.(a) |
39,830 | 812,532 | ||||||
| Peabody Energy Corp. |
114,080 | 4,065,811 | ||||||
| Penn Virginia Corp.(a) |
23,010 | 1,853,225 | ||||||
| QEP Resources, Inc.(a) |
184,720 | 2,091,030 | ||||||
| REX American Resources Corp.(a) |
25,250 | 1,907,638 | ||||||
| SM Energy Co. |
61,590 | 1,941,933 | ||||||
| SRC Energy, Inc.(a) |
256,830 | 2,283,219 | ||||||
| W&T Offshore, Inc.(a) |
193,180 | 1,862,255 | ||||||
|
|
|
|||||||
| 35,858,084 | ||||||||
|
|
|
|||||||
| 52,794,719 | ||||||||
|
|
|
|||||||
| Materials–4.8% | ||||||||
| Chemicals–2.0% | ||||||||
| Huntsman Corp. |
46,860 | 1,275,998 | ||||||
| Ingevity Corp.(a) |
33,400 | 3,402,792 | ||||||
| KMG Chemicals, Inc. |
18,180 | 1,373,681 | ||||||
| Kronos Worldwide, Inc. |
81,810 | 1,329,412 | ||||||
| Orion Engineered Carbons SA |
94,830 | 3,044,043 | ||||||
| Rayonier Advanced Materials, Inc. |
106,120 | 1,955,791 | ||||||
| Stepan Co. |
7,770 | 676,068 | ||||||
| Trinseo SA |
83,980 | 6,575,634 | ||||||
|
|
|
|||||||
| 19,633,419 | ||||||||
|
|
|
|||||||
| Construction Materials–0.2% | ||||||||
| Summit Materials, Inc.–Class A(a) |
109,050 | 1,982,529 | ||||||
|
|
|
|||||||
| Containers & Packaging–0.2% | ||||||||
| Graphic Packaging Holding Co. |
140,450 | 1,967,705 | ||||||
|
|
|
|||||||
| Metals & Mining–1.2% | ||||||||
| Cleveland-Cliffs, Inc.(a) |
276,420 | 3,499,477 | ||||||
| Commercial Metals Co. |
121,270 | 2,488,461 | ||||||
| Schnitzer Steel Industries, Inc.–Class A |
29,417 | 795,730 | ||||||
| Warrior Met Coal, Inc. |
166,300 | 4,496,752 | ||||||
|
|
|
|||||||
| 11,280,420 | ||||||||
|
|
|
|||||||
| Paper & Forest Products–1.2% | ||||||||
| Boise Cascade Co. |
66,680 | 2,453,824 | ||||||
| Louisiana-Pacific Corp. |
199,390 | 5,281,841 | ||||||
| Verso Corp.(a) |
124,000 | $ | 4,175,080 | |||||
|
|
|
|||||||
| 11,910,745 | ||||||||
|
|
|
|||||||
| 46,774,818 | ||||||||
|
|
|
|||||||
| Consumer Staples–3.0% | ||||||||
| Beverages–0.5% | ||||||||
| Boston Beer Co., Inc. (The)–Class A(a) |
10,120 | 2,909,500 | ||||||
| National Beverage Corp.(a) |
18,920 | 2,206,450 | ||||||
|
|
|
|||||||
| 5,115,950 | ||||||||
|
|
|
|||||||
| Food & Staples Retailing–0.4% | ||||||||
| SpartanNash Co. |
41,120 | 824,867 | ||||||
| United Natural Foods, Inc.(a) |
33,020 | 988,949 | ||||||
| US Foods Holding Corp.(a) |
57,480 | 1,771,534 | ||||||
|
|
|
|||||||
| 3,585,350 | ||||||||
|
|
|
|||||||
| Food Products–1.2% | ||||||||
| Cal-Maine Foods, Inc. |
27,070 | 1,307,481 | ||||||
| Fresh Del Monte Produce, Inc. |
35,400 | 1,199,706 | ||||||
| John B Sanfilippo & Son, Inc. |
32,900 | 2,348,402 | ||||||
| Nomad Foods Ltd.(a) |
209,360 | 4,241,634 | ||||||
| Sanderson Farms, Inc. |
22,420 | 2,317,555 | ||||||
|
|
|
|||||||
| 11,414,778 | ||||||||
|
|
|
|||||||
| Household Products–0.2% | ||||||||
| Central Garden & Pet Co.–Class A(a) |
59,880 | 1,984,423 | ||||||
|
|
|
|||||||
| Personal Products–0.7% | ||||||||
| Medifast, Inc. |
13,280 | 2,942,184 | ||||||
| USANA Health Sciences, Inc.(a) |
30,170 | 3,636,994 | ||||||
|
|
|
|||||||
| 6,579,178 | ||||||||
|
|
|
|||||||
| 28,679,679 | ||||||||
|
|
|
|||||||
| Utilities–2.6% | ||||||||
| Electric Utilities–1.4% | ||||||||
| ALLETE, Inc. |
41,450 | 3,109,165 | ||||||
| Otter Tail Corp. |
30,120 | 1,442,748 | ||||||
| PNM Resources, Inc. |
108,730 | 4,289,398 | ||||||
| Portland General Electric Co. |
94,520 | 4,311,057 | ||||||
|
|
|
|||||||
| 13,152,368 | ||||||||
|
|
|
|||||||
| Gas Utilities–0.6% | ||||||||
| Chesapeake Utilities Corp. |
19,770 | 1,658,703 | ||||||
| New Jersey Resources Corp. |
27,260 | 1,256,686 | ||||||
| ONE Gas, Inc. |
25,190 | 2,072,633 | ||||||
| Southwest Gas Holdings, Inc. |
16,127 | 1,274,517 | ||||||
|
|
|
|||||||
| 6,262,539 | ||||||||
|
|
|
|||||||
| Independent Power and Renewable Electricity Producers–0.5% |
| |||||||
| Ormat Technologies, Inc. |
40,610 | 2,197,407 | ||||||
| Vistra Energy Corp.(a) |
115,214 | 2,866,524 | ||||||
|
|
|
|||||||
| 5,063,931 | ||||||||
|
|
|
|||||||
| Multi-Utilities–0.1% | ||||||||
| NorthWestern Corp. |
19,030 | 1,116,300 | ||||||
|
|
|
|||||||
| 25,595,138 | ||||||||
|
|
|
|||||||
| 2018 Annual Report | 17 |
Schedule of Investments (continued)
| Company | Shares | U.S. $ Value | ||||||
| Communication Services–1.3% | ||||||||
| Diversified Telecommunication Services–0.5% |
|
|||||||
| Vonage Holdings Corp.(a) |
345,370 | $ | 4,890,439 | |||||
|
|
|
|||||||
| Entertainment–0.2% | ||||||||
| MSG Networks, Inc.(a) |
71,180 | 1,836,444 | ||||||
|
|
|
|||||||
| Interactive Media & Services–0.1% | ||||||||
| Care.com, Inc.(a) |
45,450 | 1,004,900 | ||||||
|
|
|
|||||||
| Media–0.5% | ||||||||
| Entravision Communications Corp.–Class A |
449,140 | 2,200,786 | ||||||
| Nexstar Media Group, Inc.–Class A |
31,700 | 2,580,380 | ||||||
|
|
|
|||||||
| 4,781,166 | ||||||||
|
|
|
|||||||
| 12,512,949 | ||||||||
|
|
|
|||||||
| Total Common Stocks (cost $820,159,899) |
966,528,335 | |||||||
|
|
|
|||||||
| SHORT-TERM INVESTMENTS–0.6% | ||||||||
| Investment Companies–0.6% | ||||||||
| AB Fixed Income Shares, Inc.– |
5,289,174 | $ | 5,289,174 | |||||
|
|
|
|||||||
| Total Investments—99.7% (cost $825,449,073) |
|
971,817,509 | ||||||
| Other assets less liabilities—0.3% |
3,221,836 | |||||||
|
|
|
|||||||
| Net Assets—100.0% |
|
$ | 975,039,345 | |||||
|
|
|
|||||||
| FUTURES (see Note 3) |
|
|||||||||||||||||||||
| Description | Number of Contracts |
Expiration Month |
Notional (000) |
Original Value |
Value at September 30, 2018 |
Unrealized Appreciation/ (Depreciation) |
||||||||||||||||
| Purchased Contracts |
| |||||||||||||||||||||
| Russell 2000 E Mini Futures |
238 | December 2018 | USD | 12 | $ | 20,342,222 | $ | 20,239,520 | $ | (102,702) | ||||||||||||
| (a) | Non-income producing security. |
| (b) | Affiliated investments. |
| (c) | The rate shown represents the 7-day yield as of period end. |
| (d) | To obtain a copy of the fund’s shareholder report, please go to the Securities and Exchange Commission’s website at www.sec.gov, or call AB at (800) 227-4618. |
Glossary:
ADR—American Depositary Receipt
REIT—Real Estate Investment Trust
See notes to financial statements.
| 18 | Bernstein Fund, Inc. |
Schedule of Investments
Bernstein Fund, Inc.
Schedule of Investments
International Small Cap Portfolio
September 30, 2018
| Company | Shares | U.S. $ Value | ||||||
| COMMON STOCKS–95.3% |
| |||||||
| Industrials–21.5% |
| |||||||
| Aerospace & Defense–2.5% |
| |||||||
| Embraer SA |
1,817,000 | $ | 8,921,794 | |||||
| Saab AB–Class B |
269,708 | 13,563,409 | ||||||
| Senior PLC |
2,614,284 | 10,624,541 | ||||||
|
|
|
|||||||
| 33,109,744 | ||||||||
|
|
|
|||||||
| Air Freight & Logistics–0.5% |
| |||||||
| bpost SA |
91,660 | 1,487,461 | ||||||
| Oesterreichische Post AG |
66,277 | 2,771,097 | ||||||
| Panalpina Welttransport Holding AG |
20,050 | 2,914,875 | ||||||
|
|
|
|||||||
| 7,173,433 | ||||||||
|
|
|
|||||||
| Airlines–0.7% |
| |||||||
| Aeroflot PJSC (GDR)(a) |
131,320 | 1,076,432 | ||||||
| Air New Zealand Ltd. |
1,337,200 | 2,739,757 | ||||||
| Qantas Airways Ltd. |
1,190,500 | 5,074,210 | ||||||
|
|
|
|||||||
| 8,890,399 | ||||||||
|
|
|
|||||||
| Commercial Services & Supplies–3.1% |
| |||||||
| Befesa SA(a)(b) |
166,039 | 8,607,612 | ||||||
| Biffa PLC(a) |
2,334,460 | 7,667,694 | ||||||
| Kokuyo Co., Ltd. |
539,446 | 9,714,240 | ||||||
| Rentokil Initial PLC |
2,929,433 | 12,135,839 | ||||||
| Transcontinental, Inc.–Class A |
128,140 | 2,271,827 | ||||||
|
|
|
|||||||
| 40,397,212 | ||||||||
|
|
|
|||||||
| Construction & Engineering–2.6% |
| |||||||
| Burkhalter Holding AG |
30,180 | 2,387,087 | ||||||
| Daiho Corp. |
108,200 | 3,067,032 | ||||||
| FLSmidth & Co. A/S |
147,906 | 9,197,189 | ||||||
| Galliford Try PLC |
227,210 | 2,988,086 | ||||||
| Koninklijke Volkerwessels NV |
128,460 | 2,699,589 | ||||||
| Kyudenko Corp. |
143,331 | 5,688,214 | ||||||
| Mirait Holdings Corp. |
112,700 | 1,943,497 | ||||||
| Wilson Bayly Holmes-Ovcon Ltd. |
245,403 | 2,665,181 | ||||||
| Yurtec Corp. |
360,900 | 3,025,828 | ||||||
|
|
|
|||||||
| 33,661,703 | ||||||||
|
|
|
|||||||
| Electrical Equipment–1.8% |
| |||||||
| HEG Ltd. |
47,860 | 2,213,836 | ||||||
| Signify NV(a) |
388,891 | 10,066,384 | ||||||
| TKH Group NV |
196,053 | 11,044,722 | ||||||
|
|
|
|||||||
| 23,324,942 | ||||||||
|
|
|
|||||||
| Industrial Conglomerates–1.5% |
| |||||||
| Mytilineos Holdings SA |
685,222 | 6,803,614 | ||||||
| Rheinmetall AG |
118,765 | 12,414,507 | ||||||
|
|
|
|||||||
| 19,218,121 | ||||||||
|
|
|
|||||||
| Machinery–5.4% |
| |||||||
| ATS Automation Tooling Systems, Inc.(b) |
622,666 | $ | 11,579,327 | |||||
| Biesse SpA |
79,544 | 2,822,506 | ||||||
| Bodycote PLC |
593,472 | 7,000,025 | ||||||
| Deutz AG |
1,003,833 | 8,929,584 | ||||||
| Glory Ltd. |
208,348 | 5,087,798 | ||||||
| IHI Corp. |
320,486 | 12,142,020 | ||||||
| IMA Industria Macchine Automatiche SpA |
35,253 | 2,948,757 | ||||||
| Komax Holding AG |
9,003 | 2,905,801 | ||||||
| Makino Milling Machine Co., Ltd. |
159,100 | 6,792,682 | ||||||
| Nabtesco Corp. |
210,607 | 5,599,627 | ||||||
| Rational AG |
4,051 | 2,932,525 | ||||||
| Syncmold Enterprise Corp. |
1,205,000 | 2,261,156 | ||||||
|
|
|
|||||||
| 71,001,808 | ||||||||
|
|
|
|||||||
| Professional Services–2.3% |
| |||||||
| Amadeus Fire AG |
24,600 | 2,786,351 | ||||||
| Intertrust NV(a) |
450,617 | 8,338,373 | ||||||
| L&T Technology Services Ltd.(a) |
184,102 | 4,419,057 | ||||||
| NICE Information Service Co., Ltd. |
276,020 | 2,561,494 | ||||||
| TeamLease Services Ltd.(b) |
24,880 | 866,169 | ||||||
| Teleperformance |
57,640 | 10,874,066 | ||||||
|
|
|
|||||||
| 29,845,510 | ||||||||
|
|
|
|||||||
| Road & Rail–0.1% |
| |||||||
| VRL Logistics Ltd.(b) |
559,000 | 2,059,496 | ||||||
|
|
|
|||||||
| Trading Companies & Distributors–1.0% |
| |||||||
| Daiichi Jitsugyo Co., Ltd. |
46,200 | 1,589,812 | ||||||
| Howden Joinery Group PLC |
512,030 | 3,126,832 | ||||||
| Inaba Denki Sangyo Co., Ltd. |
63,800 | 2,817,061 | ||||||
| SIG PLC |
1,761,380 | 2,910,013 | ||||||
| Yuasa Trading Co., Ltd. |
79,600 | 2,858,073 | ||||||
|
|
|
|||||||
| 13,301,791 | ||||||||
|
|
|
|||||||
| 281,984,159 | ||||||||
|
|
|
|||||||
| Consumer Discretionary–11.7% |
| |||||||
| Auto Components–3.5% |
| |||||||
| Aisan Industry Co., Ltd. |
148,500 | 1,291,224 | ||||||
| Apollo Tyres Ltd. |
2,333,280 | 6,800,029 | ||||||
| Hankook Tire Co., Ltd. |
263,448 | 11,893,196 | ||||||
| Kasai Kogyo Co., Ltd. |
211,200 | 2,208,270 | ||||||
| NGK Spark Plug Co., Ltd. |
411,194 | 11,986,135 | ||||||
| Tianneng Power International Ltd. |
1,834,000 | 1,621,287 | ||||||
| Toyo Tire & Rubber Co., Ltd. |
515,694 | 9,295,535 | ||||||
|
|
|
|||||||
| 45,095,676 | ||||||||
|
|
|
|||||||
| Hotels, Restaurants & Leisure–2.2% |
| |||||||
| 888 Holdings PLC |
954,580 | 2,478,298 | ||||||
| Bloomberry Resorts Corp. |
48,303,694 | 7,838,122 | ||||||
| LeoVegas AB(a) |
112,980 | 765,043 | ||||||
| Melco International Development Ltd. |
294,000 | 585,285 | ||||||
| Recipe Unlimited Corp. |
128,130 | 2,885,690 | ||||||
| Round One Corp. |
129,800 | 1,719,365 | ||||||
| Sushiro Global Holdings Ltd. |
201,420 | 11,927,287 | ||||||
|
|
|
|||||||
| 28,199,090 | ||||||||
|
|
|
|||||||
| 2018 Annual Report | 19 |
Schedule of Investments (continued)
| Company | Shares | U.S. $ Value | ||||||
| Household Durables–0.4% |
| |||||||
| Dorel Industries, Inc.–Class B |
143,590 | $ | 2,544,633 | |||||
| Haseko Corp. |
235,400 | 3,057,356 | ||||||
|
|
|
|||||||
| 5,601,989 | ||||||||
|
|
|
|||||||
| Internet & Direct Marketing Retail–0.2% |
| |||||||
| Moneysupermarket.com Group PLC |
811,418 | 2,952,544 | ||||||
|
|
|
|||||||
| Leisure Products–2.0% |
| |||||||
| Amer Sports Oyj(b) |
332,130 | 13,572,076 | ||||||
| Games Workshop Group PLC |
65,760 | 3,244,243 | ||||||
| Spin Master Corp.(a)(b) |
228,548 | 9,063,003 | ||||||
|
|
|
|||||||
| 25,879,322 | ||||||||
|
|
|
|||||||
| Specialty Retail–2.0% |
| |||||||
| EDION Corp. |
939,391 | 10,503,422 | ||||||
| Geo Holdings Corp. |
158,700 | 2,399,930 | ||||||
| Giordano International Ltd. |
4,466,000 | 2,239,143 | ||||||
| Halfords Group PLC |
673,991 | 2,779,927 | ||||||
| Kohnan Shoji Co., Ltd. |
29,100 | 735,847 | ||||||
| Mobilezone Holding AG |
89,810 | 1,060,931 | ||||||
| Senao International Co., Ltd. |
1,251,000 | 1,664,061 | ||||||
| Super Retail Group Ltd. |
398,540 | 2,554,069 | ||||||
| T-Gaia Corp. |
105,900 | 2,765,789 | ||||||
|
|
|
|||||||
| 26,703,119 | ||||||||
|
|
|
|||||||
| Textiles, Apparel & Luxury Goods–1.4% |
| |||||||
| China Lilang Ltd. |
2,001,000 | 1,868,445 | ||||||
| Geox SpA |
1,073,610 | 2,699,987 | ||||||
| HUGO BOSS AG |
147,617 | 11,356,930 | ||||||
| LF Corp. |
98,020 | 2,301,963 | ||||||
| Li Ning Co., Ltd.(b) |
11,000 | 10,410 | ||||||
|
|
|
|||||||
| 18,237,735 | ||||||||
|
|
|
|||||||
| 152,669,475 | ||||||||
|
|
|
|||||||
| Information Technology–11.0% |
| |||||||
| Communications Equipment–0.2% |
| |||||||
| VTech Holdings Ltd. |
249,800 | 2,883,332 | ||||||
|
|
|
|||||||
| Electronic Equipment, Instruments & Components–2.5% |
| |||||||
| AT&S Austria Technologie & Systemtechnik AG |
239,772 | 5,534,895 | ||||||
| Chilisin Electronics Corp. |
1,149,000 | 3,521,459 | ||||||
| Compeq Manufacturing Co., Ltd. |
5,637,000 | 4,445,990 | ||||||
| CONEXIO Corp. |
149,000 | 2,745,191 | ||||||
| Egis Technology, Inc. |
199,000 | 720,634 | ||||||
| Electrocomponents PLC |
330,330 | 3,090,268 | ||||||
| Inficon Holding AG(b) |
5,850 | 2,988,648 | ||||||
| Kaga Electronics Co., Ltd. |
56,100 | 1,168,381 | ||||||
| Nissha Co., Ltd. |
266,591 | 5,197,708 | ||||||
| Ryoyo Electro Corp. |
171,800 | 2,656,034 | ||||||
| Test Research, Inc. |
678,000 | 1,073,717 | ||||||
|
|
|
|||||||
| 33,142,925 | ||||||||
|
|
|
|||||||
| IT Services–3.3% |
| |||||||
| Altran Technologies SA |
840,640 | 7,290,152 | ||||||
| CANCOM SE |
59,820 | 2,699,313 | ||||||
| Computacenter PLC |
153,430 | $ | 2,530,075 | |||||
| Global Dominion Access SA(a)(b) |
482,210 | 2,932,834 | ||||||
| Larsen & Toubro Infotech Ltd.(a) |
108,460 | 2,918,402 | ||||||
| NEC Networks & System Integration Corp. |
123,300 | 2,859,430 | ||||||
| NET One Systems Co., Ltd. |
74,700 | 1,793,400 | ||||||
| Nihon Unisys Ltd. |
666,039 | 17,180,317 | ||||||
| Softcat PLC |
267,050 | 2,769,552 | ||||||
|
|
|
|||||||
| 42,973,475 | ||||||||
|
|
|
|||||||
| Semiconductors & Semiconductor Equipment–3.2% |
| |||||||
| ASPEED Technology, Inc. |
41,000 | 819,006 | ||||||
| BE Semiconductor Industries NV |
64,924 | 1,369,987 | ||||||
| Hua Hong Semiconductor Ltd.(a) |
2,226,000 | 4,771,910 | ||||||
| Koh Young Technology, Inc. |
29,160 | 2,868,691 | ||||||
| Macronix International |
5,236,007 | 4,362,127 | ||||||
| Melexis NV |
33,610 | 2,601,735 | ||||||
| Realtek Semiconductor Corp. |
1,486,000 | 6,622,008 | ||||||
| Siltronic AG |
89,177 | 10,905,500 | ||||||
| SUMCO Corp. |
460,206 | 6,704,102 | ||||||
|
|
|
|||||||
| 41,025,066 | ||||||||
|
|
|
|||||||
| Software–0.4% |
| |||||||
| Com2uSCorp |
17,070 | 2,255,090 | ||||||
| Enghouse Systems Ltd. |
48,060 | 3,053,679 | ||||||
|
|
|
|||||||
| 5,308,769 | ||||||||
|
|
|
|||||||
| Technology Hardware, Storage & Peripherals–1.4% |
| |||||||
| Aten International Co., Ltd. |
954,000 | 2,555,530 | ||||||
| Gigabyte Technology Co., Ltd. |
1,293,000 | 2,040,090 | ||||||
| Logitech International SA |
76,770 | 3,443,076 | ||||||
| Neopost SA |
107,690 | 3,273,378 | ||||||
| Primax Electronics Ltd. |
2,140,000 | 3,420,106 | ||||||
| Riso Kagaku Corp. |
119,300 | 2,883,677 | ||||||
| Roland DG Corp. |
35,300 | 853,640 | ||||||
|
|
|
|||||||
| 18,469,497 | ||||||||
|
|
|
|||||||
| 143,803,064 | ||||||||
|
|
|
|||||||
| Financials–9.9% |
| |||||||
| Banks–4.2% |
| |||||||
| 77 Bank Ltd. (The) |
181,774 | 4,319,811 | ||||||
| Bank Pembangunan Daerah Jawa Timur Tbk PT |
62,800,500 | 2,739,590 | ||||||
| Israel Discount Bank Ltd.–Class A |
2,811,447 | 9,360,714 | ||||||
| Kiatnakin Bank PCL |
1,103,400 | 2,568,154 | ||||||
| Miyazaki Bank Ltd. (The) |
90,600 | 2,654,770 | ||||||
| Norwegian Finans Holding ASA(b) |
222,840 | 2,723,519 | ||||||
| Shikoku Bank Ltd. (The) |
140,800 | 1,719,234 | ||||||
| Spar Nord Bank A/S |
292,770 | 2,714,959 | ||||||
| SpareBank 1 Nord Norge |
359,790 | 3,048,769 | ||||||
| SpareBank 1 SMN |
275,420 | 3,076,794 | ||||||
| SpareBank 1 SR-Bank ASA |
658,431 | 8,008,133 | ||||||
| TOMONY Holdings, Inc. |
314,300 | 1,341,753 | ||||||
| Towa Bank Ltd. (The) |
271,100 | 2,519,649 | ||||||
| Unicaja Banco SA(a) |
4,938,721 | 8,046,422 | ||||||
|
|
|
|||||||
| 54,842,271 | ||||||||
|
|
|
|||||||
| 20 | Bernstein Fund, Inc. |
| Company | Shares | U.S. $ Value | ||||||
| Capital Markets–2.5% |
| |||||||
| Burford Capital Ltd. |
534,064 | $ | 13,516,687 | |||||
| Euronext NV(a) |
50,552 | 3,321,534 | ||||||
| Gluskin Sheff & Associates, Inc. |
213,526 | 2,466,464 | ||||||
| IG Group Holdings PLC |
280,440 | 2,311,896 | ||||||
| Intermediate Capital Group PLC |
667,586 | 9,468,569 | ||||||
| Kyokuto Securities Co., Ltd. |
90,300 | 1,149,133 | ||||||
|
|
|
|||||||
| 32,234,283 | ||||||||
|
|
|
|||||||
| Consumer Finance–0.4% |
| |||||||
| Jaccs Co., Ltd. |
126,500 | 2,675,295 | ||||||
| Sun Hung Kai & Co., Ltd. |
4,506,000 | 2,304,105 | ||||||
|
|
|
|||||||
| 4,979,400 | ||||||||
|
|
|
|||||||
| Diversified Financial Services–0.2% |
| |||||||
| KBC Ancora |
56,060 | 2,847,633 | ||||||
|
|
|
|||||||
| Insurance–1.3% |
| |||||||
| ASR Nederland NV |
240,323 | 11,455,227 | ||||||
| IDI Insurance Co., Ltd. |
44,900 | 2,765,395 | ||||||
| Saga PLC |
1,767,390 | 3,008,535 | ||||||
|
|
|
|||||||
| 17,229,157 | ||||||||
|
|
|
|||||||
| Thrifts & Mortgage Finance–1.3% |
| |||||||
| Aareal Bank AG |
134,476 | 5,607,178 | ||||||
| Charter Court Financial Services Group PLC(a) |
631,330 | 2,754,988 | ||||||
| Deutsche Pfandbriefbank AG(a) |
208,990 | 3,124,105 | ||||||
| Genworth MI Canada, Inc. |
89,501 | 2,951,146 | ||||||
| OneSavings Bank PLC |
546,120 | 2,890,334 | ||||||
|
|
|
|||||||
| 17,327,751 | ||||||||
|
|
|
|||||||
| 129,460,495 | ||||||||
|
|
|
|||||||
| Consumer Staples–9.5% |
| |||||||
| Beverages–1.2% |
| |||||||
| Carlsberg Brewery Malaysia Bhd |
577,400 | 2,790,383 | ||||||
| Fevertree Drinks PLC |
73,590 | 3,457,607 | ||||||
| Royal Unibrew A/S |
107,520 | 8,850,537 | ||||||
|
|
|
|||||||
| 15,098,527 | ||||||||
|
|
|
|||||||
| Food & Staples Retailing–1.5% |
| |||||||
| Arcs Co., Ltd. |
106,600 | 2,890,208 | ||||||
| Axfood AB |
156,200 | 2,923,668 | ||||||
| cocokara fine, Inc. |
183,477 | 11,769,899 | ||||||
| Rami Levy Chain Stores Hashikma Marketing 206 Ltd. |
56,690 | 2,675,106 | ||||||
|
|
|
|||||||
| 20,258,881 | ||||||||
|
|
|
|||||||
| Food Products–4.6% |
| |||||||
| Astral Foods Ltd. |
157,390 | 2,744,399 | ||||||
| Bakkafrost P/F |
53,650 | 3,272,887 | ||||||
| Costa Group Holdings Ltd. |
460,770 | 2,373,069 | ||||||
| Feed One Co., Ltd. |
1,348,900 | 2,516,827 | ||||||
| Health & Happiness H&H International Holdings Ltd.(b) |
1,522,700 | 9,176,061 | ||||||
| Morinaga Milk Industry Co., Ltd. |
208,924 | 5,675,749 | ||||||
| Nichirei Corp. |
416,039 | $ | 11,037,510 | |||||
| Samyang Foods Co., Ltd. |
71,623 | 5,023,683 | ||||||
| Showa Sangyo Co., Ltd. |
58,400 | 1,505,299 | ||||||
| Uni-President China Holdings Ltd. |
9,082,000 | 9,666,409 | ||||||
| Yihai International Holding Ltd. |
3,349,000 | 7,593,651 | ||||||
|
|
|
|||||||
| 60,585,544 | ||||||||
|
|
|
|||||||
| Personal Products–1.7% |
| |||||||
| TCI Co., Ltd. |
1,369,921 | 22,023,258 | ||||||
|
|
|
|||||||
| Tobacco–0.5% |
| |||||||
| Scandinavian Tobacco Group A/S(a) |
419,316 | 6,430,526 | ||||||
|
|
|
|||||||
| 124,396,736 | ||||||||
|
|
|
|||||||
| Materials–7.2% |
| |||||||
| Chemicals–0.6% |
| |||||||
| China General Plastics Corp. |
1,374,627 | 1,147,492 | ||||||
| Huchems Fine Chemical Corp. |
41,234 | 927,305 | ||||||
| Nantex Industry Co., Ltd. |
2,734,597 | 2,628,529 | ||||||
| Ube Industries Ltd. |
116,900 | 3,180,462 | ||||||
|
|
|
|||||||
| 7,883,788 | ||||||||
|
|
|
|||||||
| Construction Materials–1.5% |
| |||||||
| Buzzi Unicem SpA |
355,121 | 7,363,546 | ||||||
| CSR Ltd. |
2,596,979 | 7,074,833 | ||||||
| Ibstock PLC(a) |
1,777,587 | 5,458,124 | ||||||
|
|
|
|||||||
| 19,896,503 | ||||||||
|
|
|
|||||||
| Containers & Packaging–0.7% |
| |||||||
| BillerudKorsnas AB |
708,932 | 9,149,552 | ||||||
|
|
|
|||||||
| Metals & Mining–3.5% |
| |||||||
| Gerdau SA (Preference Shares) |
1,531,571 | 6,519,099 | ||||||
| Granges AB |
241,462 | 2,875,510 | ||||||
| Lundin Mining Corp. |
1,218,043 | 6,450,210 | ||||||
| Nippon Light Metal Holdings Co., Ltd. |
525,700 | 1,174,752 | ||||||
| Northern Star Resources Ltd. |
602,370 | 3,616,354 | ||||||
| OZ Minerals Ltd. |
1,294,358 | 8,725,450 | ||||||
| Sims Metal Management Ltd. |
274,962 | 2,513,241 | ||||||
| St Barbara Ltd. |
989,870 | 2,498,631 | ||||||
| Western Areas Ltd. |
1,934,055 | 3,718,172 | ||||||
| Yamato Kogyo Co., Ltd. |
268,883 | 8,338,390 | ||||||
|
|
|
|||||||
| 46,429,809 | ||||||||
|
|
|
|||||||
| Paper & Forest Products–0.9% |
| |||||||
| Canfor Corp.(b) |
131,020 | 2,442,582 | ||||||
| Canfor Pulp Products, Inc. |
134,540 | 2,547,787 | ||||||
| Nippon Paper Industries Co., Ltd. |
81,000 | 1,490,645 | ||||||
| Norbord, Inc. |
72,450 | 2,400,697 | ||||||
| Western Forest Products, Inc. |
1,576,350 | 2,575,077 | ||||||
|
|
|
|||||||
| 11,456,788 | ||||||||
|
|
|
|||||||
| 94,816,440 | ||||||||
|
|
|
|||||||
| Energy–6.5% |
| |||||||
| Energy Equipment & Services–0.2% |
| |||||||
| Aker Solutions ASA(a)(b) |
428,430 | 3,047,370 | ||||||
|
|
|
|||||||
| 2018 Annual Report | 21 |
Schedule of Investments (continued)
| Company | Shares | U.S. $ Value | ||||||
| Oil, Gas & Consumable Fuels–6.3% |
| |||||||
| Aker BP ASA |
242,693 | $ | 10,276,410 | |||||
| Beach Energy Ltd. |
5,972,183 | 9,245,892 | ||||||
| Bukit Asam Tbk PT |
9,751,500 | 2,824,426 | ||||||
| Esso Thailand PCL |
2,660,400 | 1,283,672 | ||||||
| Gran Tierra Energy, Inc.(b) |
1,811,265 | 6,899,256 | ||||||
| Indo Tambangraya Megah Tbk PT |
1,400,500 | 2,429,533 | ||||||
| Itochu Enex Co., Ltd. |
289,700 | 2,929,941 | ||||||
| Motor Oil Hellas Corinth Refineries SA |
485,124 | 12,673,203 | ||||||
| Premier Oil PLC(b) |
5,006,183 | 8,974,575 | ||||||
| Saras SpA |
1,202,940 | 2,571,570 | ||||||
| Showa Shell Sekiyu KK |
649,789 | 13,783,999 | ||||||
| Whitehaven Coal Ltd. |
864,720 | 3,394,989 | ||||||
| Z Energy Ltd. |
1,034,244 | 4,898,378 | ||||||
|
|
|
|||||||
| 82,185,844 | ||||||||
|
|
|
|||||||
| 85,233,214 | ||||||||
|
|
|
|||||||
| Health Care–6.3% |
| |||||||
| Biotechnology–0.2% |
| |||||||
| BioGaia AB–Class B |
54,610 | 2,743,588 | ||||||
|
|
|
|||||||
| Health Care Equipment & Supplies–2.5% |
| |||||||
| Ansell Ltd. |
531,954 | 9,703,290 | ||||||
| Arjo AB–Class B |
859,780 | 2,907,081 | ||||||
| Getinge AB–Class B |
874,879 | 10,047,372 | ||||||
| Microlife Corp. |
425,000 | 1,172,380 | ||||||
| Microport Scientific Corp. |
748,000 | 989,272 | ||||||
| St. Shine Optical Co., Ltd. |
351,000 | 7,721,491 | ||||||
|
|
|
|||||||
| 32,540,886 | ||||||||
|
|
|
|||||||
| Health Care Providers & Services–0.8% |
| |||||||
| Attendo AB(a) |
323,740 | 3,042,852 | ||||||
| China Pioneer Pharma Holdings Ltd. |
9,405,000 | 2,102,455 | ||||||
| Medical Facilities Corp. |
232,840 | 2,586,811 | ||||||
| Vital KSK Holdings, Inc. |
255,700 | 2,885,813 | ||||||
|
|
|
|||||||
| 10,617,931 | ||||||||
|
|
|
|||||||
| Pharmaceuticals–2.8% |
| |||||||
| Boiron SA |
35,520 | 2,391,950 | ||||||
| China Shineway Pharmaceutical Group Ltd. |
4,624,000 | 6,311,656 | ||||||
| Chong Kun Dang Pharmaceutical Corp. |
13,720 | 1,459,099 | ||||||
| DongKook Pharmaceutical Co., Ltd. |
44,845 | 2,653,062 | ||||||
| Faes Farma SA |
689,733 | 2,912,957 | ||||||
| Galenica AG(a)(b) |
52,760 | 3,009,793 | ||||||
| Huons Co., Ltd. |
24,674 | 2,201,473 | ||||||
| Indivior PLC(b) |
2,290,316 | 5,492,980 | ||||||
| Samjin Pharmaceutical Co., Ltd. |
57,229 | 3,002,498 | ||||||
| Tsumura & Co. |
192,578 | 6,651,549 | ||||||
|
|
|
|||||||
| 36,087,017 | ||||||||
|
|
|
|||||||
| 81,989,422 | ||||||||
|
|
|
|||||||
| Real Estate–5.9% |
| |||||||
| Equity Real Estate Investment Trusts (REITs)–2.5% |
| |||||||
| Abacus Property Group |
711,540 | 1,754,607 | ||||||
| Allied Properties Real Estate Investment Trust |
130,695 | $ | 4,361,053 | |||||
| Dream Global Real Estate Investment Trust |
161,970 | 1,862,157 | ||||||
| Frasers Logistics & Industrial Trust(a) |
2,266,500 | 1,773,151 | ||||||
| Green REIT PLC |
1,029,210 | 1,804,397 | ||||||
| Heiwa Real Estate REIT, Inc. |
1,858 | 1,872,673 | ||||||
| Inmobiliaria Colonial Socimi SA |
566,384 | 5,873,640 | ||||||
| Invesco Office J-Reit, Inc. |
13,112 | 1,871,637 | ||||||
| Killam Apartment Real Estate Investment Trust |
520,338 | 6,497,930 | ||||||
| Mapletree North Asia Commercial Trust(a) |
2,178,800 | 1,816,288 | ||||||
| Safestore Holdings PLC |
249,000 | 1,686,473 | ||||||
| Wereldhave NV |
49,030 | 1,725,623 | ||||||
|
|
|
|||||||
| 32,899,629 | ||||||||
|
|
|
|||||||
| Real Estate Management & Development–3.4% |
| |||||||
| ADO Properties SA(a) |
159,839 | 9,577,299 | ||||||
| CA Immobilien Anlagen AG |
362,353 | 12,949,458 | ||||||
| China Overseas Property Holdings Ltd. |
7,860,000 | 2,254,344 | ||||||
| Colliers International Group, Inc. |
38,220 | 2,960,485 | ||||||
| Daikyo, Inc. |
142,500 | 2,896,847 | ||||||
| Dongwon Development Co., Ltd. |
737,105 | 2,736,865 | ||||||
| Hung Sheng Construction Ltd. |
1,016,600 | 1,008,501 | ||||||
| Nexity SA |
47,590 | 2,630,269 | ||||||
| Origin Property PCL |
1,635,800 | 874,953 | ||||||
| Times China Holdings Ltd. |
3,766,000 | 4,002,288 | ||||||
| Watkin Jones PLC |
1,021,850 | 2,607,820 | ||||||
|
|
|
|||||||
| 44,499,129 | ||||||||
|
|
|
|||||||
| 77,398,758 | ||||||||
|
|
|
|||||||
| Communication Services–4.0% |
| |||||||
| Diversified Telecommunication Services–0.8% |
| |||||||
| Com Hem Holding AB |
632,209 | 10,444,799 | ||||||
|
|
|
|||||||
| Entertainment–1.5% |
| |||||||
| Entertainment One Ltd. |
1,918,888 | 10,332,846 | ||||||
| Soft-World International Corp. |
505,000 | 1,200,120 | ||||||
| Toei Animation Co., Ltd. |
244,758 | 7,599,064 | ||||||
|
|
|
|||||||
| 19,132,030 | ||||||||
|
|
|
|||||||
| Interactive Media & Services–0.5% |
| |||||||
| Addcn Technology Co., Ltd. |
119,000 | 1,091,589 | ||||||
| carsales.com Ltd. |
284,000 | 2,968,036 | ||||||
| Mixi, Inc. |
119,700 | 2,871,034 | ||||||
|
|
|
|||||||
| 6,930,659 | ||||||||
|
|
|
|||||||
| Media–1.2% |
| |||||||
| APG SGA SA |
7,660 | 2,731,812 | ||||||
| IPSOS |
86,921 | 2,661,410 | ||||||
| Mediaset Espana Comunicacion SA |
373,790 | 2,721,271 | ||||||
| Megacable Holdings SAB de CV |
1,478,990 | 7,627,302 | ||||||
|
|
|
|||||||
| 15,741,795 | ||||||||
|
|
|
|||||||
| 52,249,283 | ||||||||
|
|
|
|||||||
| 22 | Bernstein Fund, Inc. |
| Company | Shares | U.S. $ Value | ||||||||||||||||||||
| Utilities–1.8% |
| |||||||||||||||||||||
| Electric Utilities–0.6% |
| |||||||||||||||||||||
| Contact Energy Ltd. |
1,958,453 | $ | 7,567,745 | |||||||||||||||||||
|
|
|
|||||||||||||||||||||
| Gas Utilities–0.6% |
| |||||||||||||||||||||
| Cia de Gas de Sao Paulo–COMGAS–Class A (Preference Shares) |
196,260 | 2,392,899 | ||||||||||||||||||||
| Shizuoka Gas Co., Ltd. |
295,700 | 2,619,919 | ||||||||||||||||||||
| Superior Plus Corp. |
297,140 | 2,916,994 | ||||||||||||||||||||
|
|
|
|||||||||||||||||||||
| 7,929,812 | ||||||||||||||||||||||
|
|
|
|||||||||||||||||||||
| Multi-Utilities–0.6% | ||||||||||||||||||||||
| Hera SpA |
982,300 | 3,054,736 | ||||||||||||||||||||
| Iren SpA |
1,149,080 | 2,817,390 | ||||||||||||||||||||
| Telecom Plus PLC |
211,160 | 2,867,855 | ||||||||||||||||||||
|
|
|
|||||||||||||||||||||
| 8,739,981 | ||||||||||||||||||||||
|
|
|
|||||||||||||||||||||
| 24,237,538 | ||||||||||||||||||||||
|
|
|
|||||||||||||||||||||
| Total Common Stocks (cost $1,155,228,095) |
1,248,238,584 | |||||||||||||||||||||
|
|
|
|||||||||||||||||||||
| INVESTMENT COMPANIES–0.1% |
| |||||||||||||||||||||
| Funds and Investment Trusts–0.1% | ||||||||||||||||||||||
| iShares MSCI EAFE Small-Cap ETF(c) |
23,130 | $ | 1,440,536 | |||||||||||||||||||
|
|
|
|||||||||||||||||||||
| SHORT-TERM INVESTMENTS–3.8% | ||||||||||||||||||||||
| Investment Companies–3.8% | ||||||||||||||||||||||
| AB Fixed Income Shares, Inc.–Government Money Market Portfolio–Class AB, 1.98%(c)(d)(e) |
49,415,027 | 49,415,027 | ||||||||||||||||||||
|
|
|
|||||||||||||||||||||
| Total Investments—99.2% (cost $1,206,165,277) |
1,299,094,147 | |||||||||||||||||||||
| Other assets less liabilities—0.8% |
10,932,581 | |||||||||||||||||||||
|
|
|
|||||||||||||||||||||
| Net Assets—100.0% | $ | 1,310,026,728 | ||||||||||||||||||||
|
|
|
|||||||||||||||||||||
| FORWARD CURRENCY EXCHANGE CONTRACTS (see Note 3) |
| |||||||||||||||||||||
| Counterparty | Contracts to Deliver (000) |
In Exchange For (000) |
Settlement Date |
Unrealized Appreciation/ (Depreciation) |
||||||||||||||||||
| Bank of America, NA |
NOK | 79,530 | USD | 9,595 | 12/14/18 | $ | (207,016 | ) | ||||||||||||||
| Bank of America, NA |
USD | 2,655 | PLN | 9,646 | 12/14/18 | (34,425 | ) | |||||||||||||||
| Barclays Bank PLC |
USD | 3,433 | KRW | 3,811,296 | 11/15/18 | 4,761 | ||||||||||||||||
| Barclays Bank PLC |
USD | 1,866 | KRW | 2,057,158 | 11/15/18 | (10,693 | ) | |||||||||||||||
| Barclays Bank PLC |
USD | 3,426 | TWD | 104,398 | 12/11/18 | 21,095 | ||||||||||||||||
| Barclays Bank PLC |
USD | 3,137 | INR | 217,596 | 12/13/18 | (170,914 | ) | |||||||||||||||
| Barclays Bank PLC |
SEK | 29,069 | USD | 3,240 | 12/14/18 | (51,538 | ) | |||||||||||||||
| Barclays Bank PLC |
USD | 7,704 | CHF | 7,419 | 12/14/18 | (92,204 | ) | |||||||||||||||
| Barclays Bank PLC |
USD | 20,216 | JPY | 2,233,956 | 12/14/18 | (442,740 | ) | |||||||||||||||
| Citibank, NA |
USD | 3,822 | CLP | 2,508,873 | 10/12/18 | (6,602 | ) | |||||||||||||||
| Citibank, NA |
USD | 5,158 | KRW | 5,833,010 | 11/15/18 | 103,408 | ||||||||||||||||
| Citibank, NA |
TWD | 686,081 | USD | 22,447 | 12/11/18 | (205,660 | ) | |||||||||||||||
| Citibank, NA |
USD | 13,488 | INR | 938,239 | 12/13/18 | (698,061 | ) | |||||||||||||||
| Citibank, NA |
EUR | 28,539 | USD | 33,329 | 12/14/18 | (5,882 | ) | |||||||||||||||
| Citibank, NA |
SEK | 87,943 | USD | 9,722 | 12/14/18 | (235,141 | ) | |||||||||||||||
| Citibank, NA |
USD | 7,401 | ZAR | 106,236 | 12/14/18 | 38,968 | ||||||||||||||||
| Credit Suisse International |
AUD | 7,786 | USD | 5,656 | 12/14/18 | 24,592 | ||||||||||||||||
| Credit Suisse International |
USD | 12,008 | AUD | 16,342 | 12/14/18 | (188,840 | ) | |||||||||||||||
| Credit Suisse International |
USD | 4,249 | JPY | 475,435 | 12/14/18 | (40,378 | ) | |||||||||||||||
| Natwest Markets PLC |
JPY | 647,595 | USD | 5,815 | 12/14/18 | 83,535 | ||||||||||||||||
| Natwest Markets PLC |
NZD | 7,272 | USD | 4,744 | 12/14/18 | (78,084 | ) | |||||||||||||||
| Natwest Markets PLC |
USD | 9,443 | CAD | 12,151 | 12/14/18 | (21,548 | ) | |||||||||||||||
| Natwest Markets PLC |
USD | 8,661 | SGD | 11,896 | 12/14/18 | 54,794 | ||||||||||||||||
| State Street Bank & Trust Co. |
USD | 6,359 | MYR | 25,636 | 11/29/18 | (169,966 | ) | |||||||||||||||
| State Street Bank & Trust Co. |
AUD | 6,659 | USD | 4,782 | 12/14/18 | (33,765 | ) | |||||||||||||||
| 2018 Annual Report | 23 |
Schedule of Investments (continued)
| Counterparty | Contracts to Deliver (000) |
In Exchange For (000) |
Settlement Date |
Unrealized Appreciation/ (Depreciation) |
||||||||||||||||||
| State Street Bank & Trust Co. |
EUR | 4,486 | USD | 5,270 | 12/14/18 | $ | 30,405 | |||||||||||||||
| State Street Bank & Trust Co. |
EUR | 3,352 | USD | 3,859 | 12/14/18 | (56,406 | ) | |||||||||||||||
| State Street Bank & Trust Co. |
USD | 3,106 | CHF | 3,056 | 12/14/18 | 28,875 | ||||||||||||||||
| State Street Bank & Trust Co. |
USD | 32,128 | GBP | 24,590 | 12/14/18 | 32,308 | ||||||||||||||||
| State Street Bank & Trust Co. |
USD | 3,828 | SEK | 33,403 | 12/14/18 | (46,331 | ) | |||||||||||||||
|
|
|
|||||||||||||||||||||
| $ | (2,373,453 | ) | ||||||||||||||||||||
|
|
|
|||||||||||||||||||||
| (a) | Security is exempt from registration under Rule 144A of the Securities Act of 1933. These securities are considered restricted, but liquid and may be resold in transactions exempt from registration, normally to qualified institutional buyers. At September 30, 2018, the aggregate market value of these securities amounted to $112,029,196 or 8.6% of net assets. |
| (b) | Non-income producing security. |
| (c) | To obtain a copy of the fund’s shareholder report, please go to the Securities and Exchange Commission’s website at www.sec.gov. Additionally, shareholder reports for AB funds can be obtained by calling AB at (800) 227-4618. |
| (d) | Affiliated investments. |
| (e) | The rate shown represents the 7-day yield as of period end. |
Currency Abbreviations:
AUD—Australian Dollar
CAD—Canadian Dollar
CHF—Swiss Franc
CLP—Chilean Peso
EUR—Euro
GBP—Great British Pound
INR—Indian Rupee
JPY—Japanese Yen
KRW—South Korean Won
MYR—Malaysian Ringgit
NOK—Norwegian Krone
NZD—New Zealand Dollar
PLN—Polish Zloty
SEK—Swedish Krona
SGD—Singapore Dollar
TWD—New Taiwan Dollar
USD—United States Dollar
ZAR—South African Rand
Glossary:
EAFE—Europe, Australia, and Far East
ETF—Exchange Traded Fund
GDR—Global Depositary Receipt
MSCI—Morgan Stanley Capital International
PJSC—Public Joint Stock Company
REIT—Real Estate Investment Trust
See notes to financial statements.
| 24 | Bernstein Fund, Inc. |
Schedule of Investments
Bernstein Fund, Inc.
Schedule of Investments
International Strategic Equities Portfolio
September 30, 2018
| Company | Shares | U.S. $ Value | ||||||
| COMMON STOCKS–98.0% |
|
|||||||
| Financials–17.3% | ||||||||
| Banks–9.6% | ||||||||
| Bank Hapoalim BM |
4,581,150 | $ | 33,545,902 | |||||
| China Construction Bank Corp.–Class H |
12,566,000 | 10,983,944 | ||||||
| Credicorp Ltd. |
382,910 | 85,419,563 | ||||||
| DBS Group Holdings Ltd. |
2,212,600 | 42,210,085 | ||||||
| DNB ASA |
2,465,090 | 51,876,566 | ||||||
| Erste Group Bank AG(a) |
490,510 | 20,364,383 | ||||||
| Hana Financial Group, Inc. |
486,970 | 19,553,206 | ||||||
| HDFC Bank Ltd. |
709,840 | 19,643,738 | ||||||
| Jyske Bank A/S |
789,270 | 38,217,779 | ||||||
| KB Financial Group, Inc. |
532,470 | 25,933,403 | ||||||
| Mitsubishi UFJ Financial Group, Inc. |
8,790,700 | 54,613,879 | ||||||
|
|
|
|||||||
| 402,362,448 | ||||||||
|
|
|
|||||||
| Capital Markets–2.2% | ||||||||
| IG Group Holdings PLC |
5,206,970 | 42,925,299 | ||||||
| Partners Group Holding AG |
60,600 | 48,038,729 | ||||||
|
|
|
|||||||
| 90,964,028 | ||||||||
|
|
|
|||||||
| Consumer Finance–0.4% | ||||||||
| Bharat Financial Inclusion Ltd.(a) |
1,172,700 | 16,815,162 | ||||||
|
|
|
|||||||
| Diversified Financial Services–1.2% | ||||||||
| ORIX Corp. |
3,189,100 | 51,636,698 | ||||||
|
|
|
|||||||
| Insurance–2.7% | ||||||||
| ASR Nederland NV |
1,298,120 | 61,876,139 | ||||||
| NN Group NV |
1,097,810 | 48,997,967 | ||||||
|
|
|
|||||||
| 110,874,106 | ||||||||
|
|
|
|||||||
| Thrifts & Mortgage Finance–1.2% | ||||||||
| Housing Development Finance Corp., Ltd. |
1,523,700 | 36,788,012 | ||||||
| Indiabulls Housing Finance Ltd. |
1,154,140 | 13,619,522 | ||||||
|
|
|
|||||||
| 50,407,534 | ||||||||
|
|
|
|||||||
| 723,059,976 | ||||||||
|
|
|
|||||||
| Consumer Discretionary–16.6% | ||||||||
| Automobiles–3.7% | ||||||||
| Honda Motor Co., Ltd. |
1,085,100 | 32,679,144 | ||||||
| Peugeot SA |
2,180,570 | 58,822,474 | ||||||
| Subaru Corp. |
2,115,200 | 64,839,957 | ||||||
|
|
|
|||||||
| 156,341,575 | ||||||||
|
|
|
|||||||
| Household Durables–3.3% | ||||||||
| Auto Trader Group PLC(b) |
5,434,780 | 31,615,461 | ||||||
| Nikon Corp. |
4,167,100 | 78,305,256 | ||||||
| Persimmon PLC |
862,750 | 26,561,757 | ||||||
|
|
|
|||||||
| 136,482,474 | ||||||||
|
|
|
|||||||
| Internet & Direct Marketing Retail–3.8% | ||||||||
| Alibaba Group Holding Ltd. (Sponsored ADR)(a) |
758,660 | $ | 124,996,822 | |||||
| Ctrip.com International Ltd. (ADR)(a) |
881,520 | 32,766,098 | ||||||
|
|
|
|||||||
| 157,762,920 | ||||||||
|
|
|
|||||||
| Leisure Products–1.0% |
| |||||||
| Amer Sports Oyj(a) |
1,018,880 | 41,635,253 | ||||||
|
|
|
|||||||
| Multiline Retail–1.3% |
| |||||||
| Marks & Spencer Group PLC |
8,653,360 | 32,557,734 | ||||||
| Next PLC |
289,070 | 20,687,601 | ||||||
|
|
|
|||||||
| 53,245,335 | ||||||||
|
|
|
|||||||
| Textiles, Apparel & Luxury Goods–3.5% |
| |||||||
| Hermes International |
118,680 | 78,628,335 | ||||||
| Moncler SpA |
1,571,510 | 67,618,016 | ||||||
|
|
|
|||||||
| 146,246,351 | ||||||||
|
|
|
|||||||
| 691,713,908 | ||||||||
|
|
|
|||||||
| Information Technology–10.5% |
| |||||||
| Communications Equipment–2.0% |
| |||||||
| Nokia Oyj |
14,610,080 | 81,228,621 | ||||||
|
|
|
|||||||
| IT Services–3.0% |
| |||||||
| Capgemini SE |
733,580 | 92,356,084 | ||||||
| Otsuka Corp. |
905,500 | 33,775,203 | ||||||
|
|
|
|||||||
| 126,131,287 | ||||||||
|
|
|
|||||||
| Semiconductors & Semiconductor Equipment–1.5% |
| |||||||
| Taiwan Semiconductor Manufacturing Co., Ltd. |
7,544,000 | 64,376,970 | ||||||
|
|
|
|||||||
| Software–3.2% |
| |||||||
| Check Point Software Technologies Ltd.(a) |
267,550 | 31,482,609 | ||||||
| Constellation Software, Inc./Canada |
65,730 | 48,337,363 | ||||||
| Nice Ltd.(a) |
191,710 | 21,836,484 | ||||||
| Oracle Corp. Japan |
383,300 | 30,883,357 | ||||||
|
|
|
|||||||
| 132,539,813 | ||||||||
|
|
|
|||||||
| Technology Hardware, Storage & Peripherals–0.8% |
| |||||||
| Samsung Electronics Co., Ltd. |
777,850 | 32,553,686 | ||||||
|
|
|
|||||||
| 436,830,377 | ||||||||
|
|
|
|||||||
| Energy–10.4% |
| |||||||
| Oil, Gas & Consumable Fuels–10.4% |
| |||||||
| China Petroleum & Chemical Corp.–Class H |
46,672,000 | 46,893,646 | ||||||
| JXTG Holdings, Inc. |
8,307,100 | 62,833,156 | ||||||
| LUKOIL PJSC (Sponsored ADR) |
659,420 | 50,450,286 | ||||||
| Repsol SA |
3,241,687 | 64,533,332 | ||||||
| Royal Dutch Shell PLC–Class B |
2,328,530 | 81,513,804 | ||||||
| Tatneft PJSC (Sponsored ADR) |
748,790 | 57,132,636 | ||||||
| TOTAL SA |
1,070,910 | 69,631,370 | ||||||
|
|
|
|||||||
| 432,988,230 | ||||||||
|
|
|
|||||||
| 2018 Annual Report | 25 |
Schedule of Investments (continued)
| Company | Shares | U.S. $ Value | ||||||
| Health Care–10.3% |
|
|||||||
| Health Care Equipment & Supplies–3.2% |
| |||||||
| Cochlear Ltd. |
503,290 | $ | 72,974,996 | |||||
| Essilor International Cie Generale d’Optique SA |
425,120 | 62,926,128 | ||||||
|
|
|
|||||||
| 135,901,124 | ||||||||
|
|
|
|||||||
| Health Care Providers & Services–0.5% |
| |||||||
| Sonic Healthcare Ltd. |
1,115,860 | 20,077,179 | ||||||
|
|
|
|||||||
| Pharmaceuticals–6.6% |
| |||||||
| Astellas Pharma, Inc. |
5,034,500 | 87,917,317 | ||||||
| Novo Nordisk A/S–Class B |
1,528,630 | 71,945,059 | ||||||
| Roche Holding AG |
343,060 | 82,957,156 | ||||||
| Sanofi |
132,830 | 11,867,987 | ||||||
| Teva Pharmaceutical Industries Ltd. (Sponsored ADR) |
884,270 | 19,047,176 | ||||||
|
|
|
|||||||
| 273,734,695 | ||||||||
|
|
|
|||||||
| 429,712,998 | ||||||||
|
|
|
|||||||
| Industrials–9.0% |
| |||||||
| Aerospace & Defense–1.2% |
| |||||||
| BAE Systems PLC |
5,957,140 | 48,848,340 | ||||||
|
|
|
|||||||
| Airlines–3.1% |
| |||||||
| Japan Airlines Co., Ltd. |
2,203,400 | 79,194,849 | ||||||
| Qantas Airways Ltd. |
11,221,962 | 47,830,823 | ||||||
|
|
|
|||||||
| 127,025,672 | ||||||||
|
|
|
|||||||
| Industrial Conglomerates–0.5% |
| |||||||
| Jardine Strategic Holdings Ltd. |
550,200 | 19,969,024 | ||||||
|
|
|
|||||||
| Machinery–1.0% |
| |||||||
| IHI Corp. |
1,131,800 | 42,879,684 | ||||||
|
|
|
|||||||
| Professional Services–3.2% |
| |||||||
| Intertek Group PLC |
957,800 | 62,307,131 | ||||||
| RELX PLC(a) |
1,438,200 | 30,215,443 | ||||||
| Teleperformance |
224,450 | 42,343,582 | ||||||
|
|
|
|||||||
| 134,866,156 | ||||||||
|
|
|
|||||||
| 373,588,876 | ||||||||
|
|
|
|||||||
| Consumer Staples–8.3% |
| |||||||
| Beverages–1.5% |
| |||||||
| Pernod Ricard SA |
387,730 | 63,590,708 | ||||||
|
|
|
|||||||
| Food & Staples Retailing–1.0% |
| |||||||
| Wesfarmers Ltd. |
1,150,010 | 41,410,946 | ||||||
|
|
|
|||||||
| Food Products–2.4% |
| |||||||
| Orkla ASA |
7,144,270 | 60,362,087 | ||||||
| Salmar ASA |
781,950 | 39,063,796 | ||||||
|
|
|
|||||||
| 99,425,883 | ||||||||
|
|
|
|||||||
| Household Products–2.9% |
| |||||||
| Reckitt Benckiser Group PLC |
718,260 | 65,613,050 | ||||||
| Unicharm Corp. |
1,700,100 | 56,248,909 | ||||||
|
|
|
|||||||
| 121,861,959 | ||||||||
|
|
|
|||||||
| Personal Products–0.5% |
|
|||||||
| TCI Co., Ltd. |
1,241,000 | $ | 19,950,686 | |||||
|
|
|
|||||||
| 346,240,182 | ||||||||
|
|
|
|||||||
| Communication Services–7.0% |
| |||||||
| Diversified Telecommunication Services–3.0% |
| |||||||
| China Telecom Corp., Ltd.–Class H |
22,462,000 | 11,165,852 | ||||||
| China Unicom Hong Kong Ltd. |
19,660,000 | 22,967,876 | ||||||
| Nippon Telegraph & Telephone Corp. |
2,008,500 | 90,644,295 | ||||||
|
|
|
|||||||
| 124,778,023 | ||||||||
|
|
|
|||||||
| Entertainment–0.5% |
| |||||||
| CTS Eventim AG & Co. KGaA |
470,730 | 21,104,259 | ||||||
|
|
|
|||||||
| Interactive Media & Services–3.5% |
| |||||||
| REA Group Ltd. |
989,130 | 61,368,102 | ||||||
| Tencent Holdings Ltd. |
2,069,800 | 84,511,648 | ||||||
|
|
|
|||||||
| 145,879,750 | ||||||||
|
|
|
|||||||
| 291,762,032 | ||||||||
|
|
|
|||||||
| Materials–4.0% |
| |||||||
| Chemicals–2.7% |
| |||||||
| Covestro AG(b) |
199,370 | 16,138,448 | ||||||
| Formosa Chemicals & Fibre Corp. |
9,425,000 | 39,496,848 | ||||||
| Sinopec Shanghai Petrochemical Co., Ltd.–Class H |
34,252,000 | 20,890,217 | ||||||
| Tosoh Corp. |
2,319,700 | 35,727,846 | ||||||
|
|
|
|||||||
| 112,253,359 | ||||||||
|
|
|
|||||||
| Metals & Mining–1.3% |
| |||||||
| Agnico Eagle Mines Ltd. |
1,665 | 56,873 | ||||||
| South32 Ltd. |
20,236,040 | 56,869,437 | ||||||
|
|
|
|||||||
| 56,926,310 | ||||||||
|
|
|
|||||||
| 169,179,669 | ||||||||
|
|
|
|||||||
| Real Estate–3.0% |
| |||||||
| Equity Real Estate Investment Trusts (REITs)–0.5% |
| |||||||
| H&R Real Estate Investment Trust |
1,306,570 | 20,099,521 | ||||||
|
|
|
|||||||
| Real Estate Management & Development–2.5% |
| |||||||
| CK Asset Holdings Ltd. |
10,060,000 | 75,411,660 | ||||||
| Wharf Real Estate Investment Co., Ltd. |
4,436,000 | 28,579,131 | ||||||
|
|
|
|||||||
| 103,990,791 | ||||||||
|
|
|
|||||||
| 124,090,312 | ||||||||
|
|
|
|||||||
| Utilities–1.6% |
| |||||||
| Electric Utilities–1.2% |
| |||||||
| EDP–Energias de Portugal SA |
13,452,000 | 49,635,437 | ||||||
|
|
|
|||||||
| Multi-Utilities–0.4% |
| |||||||
| AGL Energy Ltd. |
1,285,880 | 18,139,064 | ||||||
|
|
|
|||||||
| 67,774,501 | ||||||||
|
|
|
|||||||
| Total Common Stocks (cost $3,857,863,157) |
4,086,941,061 | |||||||
|
|
|
|||||||
| 26 | Bernstein Fund, Inc. |
| Company | Shares | U.S. $ Value | ||||||
| SHORT-TERM INVESTMENTS–1.4% | ||||||||
| Investment Companies–1.4% | ||||||||
| AB Fixed Income Shares, Inc.–Government Money Market Portfolio–Class AB, 1.98%(c)(d)(e) |
58,802,140 | $ | 58,802,140 | |||||
|
|
|
|||||||
| Total Investments—99.4% (cost $3,916,665,297) |
|
4,145,743,201 | ||||||
| Other assets less liabilities—0.6% |
25,219,062 | |||||||
|
|
|
|||||||
| Net Assets—100.0% | $ | 4,170,962,263 | ||||||
|
|
|
|||||||
| FORWARD CURRENCY EXCHANGE CONTRACTS (see Note 3) |
| |||||||||||||||||||
| Counterparty | Contracts to Deliver (000) |
In Exchange For (000) |
Settlement Date |
Unrealized Appreciation/ (Depreciation) |
||||||||||||||||
| Australia and New Zealand Banking Group Ltd. |
AUD | 104,078 | USD | 73,965 | 10/16/18 | $ | (1,272,836 | ) | ||||||||||||
| Australia and New Zealand Banking Group Ltd. |
USD | 8,175 | AUD | 11,351 | 10/16/18 | 30,234 | ||||||||||||||
| Australia and New Zealand Banking Group Ltd. |
JPY | 236,600 | USD | 2,092 | 11/14/18 | 3,075 | ||||||||||||||
| Bank of America, NA |
USD | 25,145 | CNY | 172,607 | 10/25/18 | (49,151 | ) | |||||||||||||
| Bank of America, NA |
EUR | 355 | USD | 419 | 11/14/18 | 4,996 | ||||||||||||||
| Bank of America, NA |
RUB | 4,406,247 | USD | 66,536 | 11/14/18 | (422,699 | ) | |||||||||||||
| Barclays Bank PLC |
BRL | 203,257 | USD | 50,719 | 10/02/18 | 389,949 | ||||||||||||||
| Barclays Bank PLC |
USD | 50,765 | BRL | 203,257 | 10/02/18 | (435,552 | ) | |||||||||||||
| Barclays Bank PLC |
USD | 196,046 | CAD | 255,798 | 10/16/18 | 2,060,310 | ||||||||||||||
| Barclays Bank PLC |
USD | 7,557 | NOK | 61,249 | 10/16/18 | (26,939 | ) | |||||||||||||
| Barclays Bank PLC |
USD | 10,916 | SGD | 15,013 | 10/16/18 | 69,385 | ||||||||||||||
| Barclays Bank PLC |
USD | 40,892 | ZAR | 618,751 | 10/16/18 | 2,781,037 | ||||||||||||||
| Barclays Bank PLC |
USD | 43,608 | CNY | 299,199 | 10/25/18 | (107,258 | ) | |||||||||||||
| Barclays Bank PLC |
USD | 50,597 | BRL | 203,257 | 11/05/18 | (385,595 | ) | |||||||||||||
| Barclays Bank PLC |
JPY | 376,664 | USD | 3,348 | 11/14/18 | 22,554 | ||||||||||||||
| Barclays Bank PLC |
USD | 8,232 | KRW | 9,252,702 | 11/15/18 | 113,807 | ||||||||||||||
| Barclays Bank PLC |
TWD | 295,021 | USD | 9,610 | 12/11/18 | (130,881 | ) | |||||||||||||
| Citibank, NA |
BRL | 203,257 | USD | 50,765 | 10/02/18 | 435,552 | ||||||||||||||
| Citibank, NA |
USD | 49,042 | BRL | 203,257 | 10/02/18 | 1,287,207 | ||||||||||||||
| Citibank, NA |
PEN | 287,778 | USD | 86,933 | 10/12/18 | (134,943 | ) | |||||||||||||
| Citibank, NA |
USD | 9,008 | PEN | 29,902 | 10/12/18 | 38,990 | ||||||||||||||
| Citibank, NA |
AUD | 3,428 | USD | 2,489 | 10/16/18 | 10,967 | ||||||||||||||
| Citibank, NA |
EUR | 5,638 | USD | 6,571 | 10/16/18 | 18,103 | ||||||||||||||
| Citibank, NA |
GBP | 18,316 | USD | 23,913 | 10/16/18 | 25,497 | ||||||||||||||
| Citibank, NA |
JPY | 8,561,740 | USD | 76,943 | 10/16/18 | 1,512,436 | ||||||||||||||
| Citibank, NA |
NOK | 73,841 | USD | 9,038 | 10/16/18 | (40,372 | ) | |||||||||||||
| Citibank, NA |
USD | 8,994 | CAD | 11,677 | 10/16/18 | 49,152 | ||||||||||||||
| Citibank, NA |
USD | 30,604 | MXN | 588,407 | 10/16/18 | 769,540 | ||||||||||||||
| Citibank, NA |
CNY | 652,967 | USD | 96,973 | 10/25/18 | 2,036,538 | ||||||||||||||
| Citibank, NA |
EUR | 21,296 | USD | 25,113 | 11/14/18 | 304,054 | ||||||||||||||
| Citibank, NA |
USD | 52,248 | KRW | 59,087,146 | 11/15/18 | 1,047,501 | ||||||||||||||
| 2018 Annual Report | 27 |
Schedule of Investments (continued)
| Counterparty | Contracts to Deliver (000) |
In Exchange For (000) |
Settlement Date |
Unrealized Appreciation/ (Depreciation) |
||||||||||||||||||
| Citibank, NA |
TWD | 359,022 | USD | 11,742 | 12/11/18 | $ | (111,462 | ) | ||||||||||||||
| Citibank, NA |
INR | 870,641 | USD | 12,271 | 12/13/18 | 402,555 | ||||||||||||||||
| Citibank, NA |
USD | 26,884 | INR | 1,875,859 | 12/13/18 | (1,312,566 | ) | |||||||||||||||
| Morgan Stanley & Co., Inc. |
USD | 8,508 | CLP | 5,673,784 | 10/12/18 | 119,973 | ||||||||||||||||
| Morgan Stanley & Co., Inc. |
AUD | 3,435 | USD | 2,470 | 10/16/18 | (13,486 | ) | |||||||||||||||
| Morgan Stanley & Co., Inc. |
NOK | 651,359 | USD | 78,387 | 10/16/18 | (1,691,291 | ) | |||||||||||||||
| Natwest Markets PLC |
NOK | 150,271 | USD | 17,986 | 10/16/18 | (488,084 | ) | |||||||||||||||
| Natwest Markets PLC |
USD | 8,552 | GBP | 6,556 | 10/16/18 | (1,171 | ) | |||||||||||||||
| Nomura Global Financial Products, Inc. |
JPY | 1,114,047 | USD | 9,936 | 10/16/18 | 121,057 | ||||||||||||||||
| Nomura Global Financial Products, Inc. |
USD | 72,586 | SEK | 654,885 | 10/16/18 | 1,184,398 | ||||||||||||||||
| Nomura Global Financial Products, Inc. |
JPY | 894,700 | USD | 7,952 | 11/14/18 | 53,288 | ||||||||||||||||
| Nomura Global Financial Products, Inc. |
USD | 9,179 | GBP | 7,008 | 11/14/18 | (27,030 | ) | |||||||||||||||
| Societe Generale |
EUR | 65,846 | USD | 76,410 | 10/16/18 | (124,683 | ) | |||||||||||||||
| Societe Generale |
HKD | 334,299 | USD | 42,618 | 10/16/18 | (93,091 | ) | |||||||||||||||
| Societe Generale |
USD | 1,225 | HKD | 9,612 | 10/16/18 | 2,663 | ||||||||||||||||
| Societe Generale |
USD | 12,687 | PLN | 46,926 | 10/16/18 | 45,184 | ||||||||||||||||
| Societe Generale |
ILS | 50,849 | USD | 14,238 | 11/14/18 | 212,126 | ||||||||||||||||
| Societe Generale |
JPY | 473,151 | USD | 4,184 | 11/14/18 | 6,449 | ||||||||||||||||
| State Street Bank & Trust Co. |
AUD | 54,226 | USD | 39,758 | 10/16/18 | 558,046 | ||||||||||||||||
| State Street Bank & Trust Co. |
ILS | 65,568 | USD | 18,410 | 10/16/18 | 365,160 | ||||||||||||||||
| State Street Bank & Trust Co. |
SGD | 21,286 | USD | 15,465 | 10/16/18 | (111,524 | ) | |||||||||||||||
| State Street Bank & Trust Co. |
USD | 107,175 | CHF | 104,067 | 10/16/18 | (1,003,807 | ) | |||||||||||||||
| State Street Bank & Trust Co. |
USD | 23,088 | EUR | 19,853 | 10/16/18 | (12,387 | ) | |||||||||||||||
| State Street Bank & Trust Co. |
USD | 27,840 | GBP | 21,384 | 10/16/18 | 49,575 | ||||||||||||||||
| State Street Bank & Trust Co. |
USD | 13,982 | HKD | 109,680 | 10/16/18 | 30,521 | ||||||||||||||||
| State Street Bank & Trust Co. |
USD | 23,381 | THB | 767,795 | 10/16/18 | 370,933 | ||||||||||||||||
| State Street Bank & Trust Co. |
USD | 9,971 | CNY | 68,348 | 10/25/18 | (33,261 | ) | |||||||||||||||
| State Street Bank & Trust Co. |
USD | 24,337 | MYR | 98,115 | 11/29/18 | (650,499 | ) | |||||||||||||||
| State Street Bank & Trust Co. |
USD | 23,996 | TWD | 733,555 | 12/11/18 | 223,817 | ||||||||||||||||
| UBS AG |
EUR | 3,909 | USD | 4,534 | 10/16/18 | (9,947 | ) | |||||||||||||||
| UBS AG |
ILS | 215,122 | USD | 60,023 | 10/16/18 | 817,956 | ||||||||||||||||
| UBS AG |
USD | 6,948 | CAD | 9,023 | 10/16/18 | 39,990 | ||||||||||||||||
| UBS AG |
USD | 21,088 | ZAR | 303,731 | 10/16/18 | 350,445 | ||||||||||||||||
| UBS AG |
USD | 8,426 | CNY | 57,804 | 10/25/18 | (21,370 | ) | |||||||||||||||
| UBS AG |
AUD | 23,162 | USD | 16,833 | 11/14/18 | 85,534 | ||||||||||||||||
| UBS AG |
USD | 10,567 | GBP | 8,018 | 11/14/18 | (96,177 | ) | |||||||||||||||
| UBS AG |
USD | 16,314 | KRW | 18,361,985 | 11/15/18 | 248,346 | ||||||||||||||||
| UBS AG |
INR | 1,005,218 | USD | 13,682 | 12/13/18 | (20,992 | ) | |||||||||||||||
|
|
|
|||||||||||||||||||||
| $ | 9,469,846 | |||||||||||||||||||||
|
|
|
|||||||||||||||||||||
| (a) | Non-income producing security. |
| (b) | Security is exempt from registration under Rule 144A of the Securities Act of 1933. These securities are considered restricted, but liquid and may be resold in transactions exempt from registration, normally to qualified institutional buyers. At September 30, 2018, the aggregate market value of these securities amounted to $47,753,909 or 1.1% of net assets. |
| (c) | Affiliated investments. |
| (d) | The rate shown represents the 7-day yield as of period end. |
| (e) | To obtain a copy of the fund’s shareholder report, please go to the Securities and Exchange Commission’s website at www.sec.gov, or call AB at (800) 227-4618. |
| 28 | Bernstein Fund, Inc. |
Currency Abbreviations:
AUD—Australian Dollar
BRL—Brazilian Real
CAD—Canadian Dollar
CHF—Swiss Franc
CLP—Chilean Peso
CNY—Chinese Yuan Renminbi
EUR—Euro
GBP—Great British Pound
HKD—Hong Kong Dollar
ILS—Israeli Shekel
INR—Indian Rupee
JPY—Japanese Yen
KRW—South Korean Won
MXN—Mexican Peso
MYR—Malaysian Ringgit
NOK—Norwegian Krone
PEN—Peruvian Sol
PLN—Polish Zloty
RUB—Russian Ruble
SEK—Swedish Krona
SGD—Singapore Dollar
THB—Thailand Baht
TWD—New Taiwan Dollar
USD—United States Dollar
ZAR—South African Rand
Glossary:
ADR—American Depositary Receipt
PJSC—Public Joint Stock Company
See notes to financial statements.
| 2018 Annual Report | 29 |
Statement of Assets and Liabilities—September 30, 2018
| SMALL CAP
CORE PORTFOLIO |
INTERNATIONAL SMALL CAP PORTFOLIO |
INTERNATIONAL STRATEGIC EQUITIES PORTFOLIO |
||||||||||
| ASSETS |
| |||||||||||
| Investments in securities at value |
| |||||||||||
| Unaffiliated issuers |
$ | 966,528,335 | $ | 1,249,679,120 | $ | 4,086,941,061 | ||||||
| Affiliated issuers |
5,289,174 | 49,415,027 | 58,802,140 | |||||||||
| Foreign currencies, at value (a) |
0 | 5,596,087 | 8,016,294 | |||||||||
| Cash |
16,121 | 0 | 566,969 | |||||||||
| Cash collateral due from broker |
903,210 | 1,138,000 | 1,927,998 | |||||||||
| Receivables: |
| |||||||||||
| Unaffiliated interest and dividends |
800,509 | 2,521,658 | 13,888,725 | |||||||||
| Affiliated dividends |
3,745 | 64,361 | 131,235 | |||||||||
| Foreign withholding tax reclaims |
0 | 1,386,844 | 3,551,104 | |||||||||
| Investment securities sold |
0 | 16,987 | 0 | |||||||||
| Capital shares sold |
2,440,085 | 4,271,858 | 3,672,241 | |||||||||
| Variation margin on futures |
51,196 | 0 | 0 | |||||||||
| Unrealized appreciation of forward currency exchange contracts |
0 | 422,741 | 18,298,900 | |||||||||
|
|
|
|
|
|
|
|||||||
| Total assets |
976,032,375 | 1,314,512,683 | 4,195,796,667 | |||||||||
|
|
|
|
|
|
|
|||||||
| LIABILITIES |
| |||||||||||
| Cash collateral due to broker |
0 | 0 | 3,773,000 | |||||||||
| Payables: |
| |||||||||||
| Investment securities purchased and foreign currency transactions |
0 | 182,114 | 8,674,448 | |||||||||
| Management fee |
581,578 | 926,308 | 2,161,280 | |||||||||
| Capital shares redeemed |
231,293 | 266,308 | 851,770 | |||||||||
| Custody fee payable |
69,018 | 167,611 | 251,911 | |||||||||
| Transfer Agent fee |
42,293 | 33,061 | 47,664 | |||||||||
| Shareholder servicing fee |
2,034 | 13,293 | 33,355 | |||||||||
| Accrued expenses |
66,814 | 101,066 | 211,922 | |||||||||
| Unrealized depreciation of forward currency exchange contracts |
0 | 2,796,194 | 8,829,054 | |||||||||
|
|
|
|
|
|
|
|||||||
| Total liabilities |
993,030 | 4,485,955 | 24,834,404 | |||||||||
|
|
|
|
|
|
|
|||||||
| NET ASSETS |
$ | 975,039,345 | $ | 1,310,026,728 | $ | 4,170,962,263 | ||||||
|
|
|
|
|
|
|
|||||||
| Cost of investments |
| |||||||||||
| Unaffiliated issuers |
$ | 820,159,899 | $ | 1,156,750,250 | $ | 3,857,863,157 | ||||||
| Affiliated issuers |
5,289,174 | 49,415,027 | 58,802,140 | |||||||||
| NET ASSETS CONSIST OF: |
| |||||||||||
| Capital stock, at par |
$ | 7,519 | $ | 10,538 | $ | 33,372 | ||||||
| Additional paid-in capital |
765,256,624 | 1,121,857,480 | 3,828,757,161 | |||||||||
| Distributable earnings |
209,775,202 | 188,158,710 | 342,171,730 | |||||||||
|
|
|
|
|
|
|
|||||||
| $ | 975,039,345 | $ | 1,310,026,728 | $ | 4,170,962,263 | |||||||
|
|
|
|
|
|
|
|||||||
(a) Cost: $0, $5,579,329 and $8,135,921, respectively. (Note 1)
See Notes to Financial Statements.
| 30 | Bernstein Fund, Inc. |
| SMALL CAP
CORE PORTFOLIO |
INTERNATIONAL SMALL CAP PORTFOLIO |
INTERNATIONAL STRATEGIC EQUITIES PORTFOLIO |
||||||||||
| CALCULATION OF MAXIMUM OFFERING PRICE |
| |||||||||||
| SCB Class Shares |
| |||||||||||
| Net Assets |
$ | 10,864,826 | $ | 71,728,882 | $ | 181,606,243 | ||||||
| Shares of capital stock outstanding |
840,435 | 5,786,869 | 14,581,240 | |||||||||
|
|
|
|
|
|
|
|||||||
| Net asset value and offering price per share |
$ | 12.93 | $ | 12.40 | $ | 12.45 | ||||||
|
|
|
|
|
|
|
|||||||
| Advisor Class Shares |
| |||||||||||
| Net Assets |
$ | 752,304,986 | $ | 810,446,941 | $ | 2,568,425,793 | ||||||
| Shares of capital stock outstanding |
58,009,765 | 65,180,213 | 205,549,092 | |||||||||
|
|
|
|
|
|
|
|||||||
| Net asset value and offering price per share |
$ | 12.97 | $ | 12.43 | $ | 12.50 | ||||||
|
|
|
|
|
|
|
|||||||
| Class Z Shares |
| |||||||||||
| Net Assets |
$ | 211,869,533 | $ | 427,850,905 | $ | 1,420,930,227 | ||||||
| Shares of capital stock outstanding |
16,343,872 | 34,417,539 | 113,591,096 | |||||||||
|
|
|
|
|
|
|
|||||||
| Net asset value and offering price per share |
$ | 12.96 | $ | 12.43 | $ | 12.51 | ||||||
|
|
|
|
|
|
|
|||||||
See Notes to Financial Statements.
| 2018 Annual Report | 31 |
Statement of Operations—for the year ended September 30, 2018
| SMALL CAP
CORE PORTFOLIO |
INTERNATIONAL SMALL CAP PORTFOLIO |
INTERNATIONAL STRATEGIC EQUITIES PORTFOLIO |
||||||||||
| INVESTMENT INCOME | ||||||||||||
| Income: |
||||||||||||
| Dividends |
||||||||||||
| Unaffiliated issuers (a) |
$ | 10,241,471 | $ | 30,550,551 | $ | 105,390,092 | ||||||
| Affiliated issuers |
35,623 | 515,233 | 1,305,452 | |||||||||
| Other income |
881 | 1,121 | 3,359 | |||||||||
|
|
|
|
|
|
|
|||||||
| Total income |
10,277,975 | 31,066,905 | 106,698,903 | |||||||||
|
|
|
|
|
|
|
|||||||
| Expenses: |
||||||||||||
| Management fee (see Note 2A) |
7,382,596 | 12,462,680 | 28,731,433 | |||||||||
| Shareholder servicing fee (see Note 2B) |
26,927 | 190,805 | 447,538 | |||||||||
| Custodian fee |
169,043 | 470,592 | 654,559 | |||||||||
| Transfer Agent fee—Non-Retail Class |
4,819 | 19,650 | 16,036 | |||||||||
| Transfer Agent fee—Advisor Class |
321,615 | 193,164 | 205,013 | |||||||||
| Transfer Agent fee—Class Z |
38,651 | 84,882 | 278,062 | |||||||||
| Registration fees |
63,956 | 99,824 | 244,908 | |||||||||
| Directors’ fees and expenses |
29,826 | 40,104 | 123,274 | |||||||||
| Auditing and tax fees |
47,009 | 70,623 | 51,736 | |||||||||
| Recoupment of previously reimbursed expenses (see Note 2A) |
0 | 141,360 | 0 | |||||||||
| Legal fees |
22,796 | 27,341 | 81,029 | |||||||||
| Printing fees |
18,185 | 47,947 | 36,959 | |||||||||
| Miscellaneous |
41,549 | 51,738 | 98,765 | |||||||||
|
|
|
|
|
|
|
|||||||
| Total expenses |
8,166,972 | 13,900,710 | 30,969,312 | |||||||||
| Less: expenses waived and reimbursed by the Manager |
(4,228 | ) | (60,694 | ) | (592,497 | ) | ||||||
|
|
|
|
|
|
|
|||||||
| Net expenses |
8,162,744 | 13,840,016 | 30,376,815 | |||||||||
|
|
|
|
|
|
|
|||||||
| Net investment income |
2,115,231 | 17,226,889 | 76,322,088 | |||||||||
|
|
|
|
|
|
|
|||||||
| REALIZED AND UNREALIZED GAIN (LOSS) ON INVESTMENT AND FOREIGN CURRENCY TRANSACTIONS | ||||||||||||
| Net realized gain (loss) on: |
||||||||||||
| Investment transactions (b) |
70,950,060 | 94,986,151 | 42,925,894 | |||||||||
| Forward currency exchange contracts |
0 | (3,622,617 | ) | (5,779,442 | ) | |||||||
| Futures |
3,271,459 | 0 | (93,716 | ) | ||||||||
| Foreign currency transactions |
0 | (1,706,205 | ) | (3,672,037 | ) | |||||||
|
|
|
|
|
|
|
|||||||
| Net realized gain on investment transactions and foreign currency transactions |
74,221,519 | 89,657,329 | 33,380,699 | |||||||||
|
|
|
|
|
|
|
|||||||
| Net change in unrealized appreciation/depreciation of: |
||||||||||||
| Investments (c) |
34,224,760 | (93,274,056 | ) | (108,147,615 | ) | |||||||
| Forward currency exchange contracts |
0 | (3,219,413 | ) | 7,383,701 | ||||||||
| Futures |
(1,003,030 | ) | 0 | 0 | ||||||||
| Foreign currency denominated assets and liabilities |
0 | (199 | ) | (225,528 | ) | |||||||
|
|
|
|
|
|
|
|||||||
| Net change in unrealized appreciation/depreciation of investments and foreign currency denominated assets and liabilities |
33,221,730 | (96,493,668 | ) | (100,989,442 | ) | |||||||
|
|
|
|
|
|
|
|||||||
| Net realized and unrealized gain (loss) on investment transactions and foreign currency transactions |
107,443,249 | (6,836,339 | ) | (67,608,743 | ) | |||||||
|
|
|
|
|
|
|
|||||||
| Net increase in net assets resulting from operations |
$ | 109,558,480 | $ | 10,390,550 | $ | 8,713,345 | ||||||
|
|
|
|
|
|
|
|||||||
(a) Net of foreign withholding taxes of $19,396, $3,923,274 and $10,760,355, respectively.
(b) Net of foreign capital gains taxes of $0, $787,759 and $0, respectively.
(c) Net of increase in accrued foreign capital gains taxes of $0, $(73,452) and $0, respectively.
See Notes to Financial Statements.
| 32 | Bernstein Fund, Inc. |
Statement of Changes in Net Assets
| SMALL CAP CORE PORTFOLIO |
INTERNATIONAL SMALL CAP PORTFOLIO |
|||||||||||||||||||
| YEAR ENDED 9/30/18 |
YEAR ENDED 9/30/17 |
YEAR ENDED 9/30/18 |
YEAR ENDED 9/30/17 |
|||||||||||||||||
| INCREASE (DECREASE) IN NET ASSETS FROM | ||||||||||||||||||||
| Operations: |
||||||||||||||||||||
| Net investment income |
$ | 2,115,231 | $ | 2,415,710 | $ | 17,226,889 | $ | 7,210,699 | ||||||||||||
| Net realized gain on investment transactions and foreign currency transactions |
74,221,519 | 47,226,145 | 89,657,329 | 29,605,750 | ||||||||||||||||
| Net change in unrealized appreciation/depreciation of investments |
33,221,730 | 71,518,211 | (96,493,668 | ) | 122,874,640 | |||||||||||||||
| Contributions from affiliates (see Note 2A) |
0 | 0 | 0 | 2,415 | ||||||||||||||||
|
|
|
|
|
|
|
|
|
|||||||||||||
| Net increase in net assets resulting from operations |
109,558,480 | 121,160,066 | 10,390,550 | 159,693,504 | ||||||||||||||||
|
|
|
|
|
|
|
|
|
|||||||||||||
| Distributions to shareholders (a)* |
(53,215,294 | ) | (2,070,664 | ) | (41,753,868 | ) | (17,002,892 | ) | ||||||||||||
|
|
|
|
|
|
|
|
|
|
|
|||||||||||
| Capital-share transactions: |
||||||||||||||||||||
| Net proceeds from sales of shares |
111,792,211 | 144,669,429 | 309,703,695 | 373,247,420 | ||||||||||||||||
| Net proceeds from sales of shares issued to shareholders on reinvestment of dividends |
51,634,967 | 1,683,335 | 40,024,827 | 15,960,643 | ||||||||||||||||
|
|
|
|
|
|
|
|
|
|||||||||||||
| Total proceeds from shares sold |
163,427,178 | 146,352,764 | 349,728,522 | 389,208,063 | ||||||||||||||||
| Cost of shares redeemed |
(130,305,101 | ) | (115,380,133 | ) | (82,193,642 | ) | (116,805,625 | ) | ||||||||||||
|
|
|
|
|
|
|
|
|
|||||||||||||
| Net increase in net assets from capital-share transactions |
33,122,077 | 30,972,631 | 267,534,880 | 272,402,438 | ||||||||||||||||
|
|
|
|
|
|
|
|
|
|||||||||||||
| Net increase in net assets |
89,465,263 | 150,062,033 | 236,171,562 | 415,093,050 | ||||||||||||||||
| NET ASSETS: | ||||||||||||||||||||
| Beginning of period |
885,574,082 | 735,512,049 | 1,073,855,166 | 658,762,116 | ||||||||||||||||
|
|
|
|
|
|
|
|
|
|||||||||||||
| End of period |
$ | 975,039,345 | $ | 885,574,082 | $ | 1,310,026,728 | $ | 1,073,855,166 | ||||||||||||
|
|
|
|
|
|
|
|
|
|||||||||||||
(a) See page 35 for share class information on dividend distributions for the Portfolios.
* The prior year’s amounts have been reclassified to conform with the current year’s presentation. See Note 7, New Accounting Pronouncements, in the Notes to Financial Statements for more information.
See Notes to Financial Statements.
| 2018 Annual Report | 33 |
Statement of Changes in Net Assets (continued)
| INTERNATIONAL STRATEGIC EQUITIES PORTFOLIO |
||||||||
| YEAR ENDED 9/30/18 |
YEAR ENDED 9/30/17 |
|||||||
| INCREASE (DECREASE) IN NET ASSETS FROM | ||||||||
| Operations: |
||||||||
| Net investment income |
$ | 76,322,088 | $ | 31,236,856 | ||||
| Net realized gain on investment transactions and foreign currency transactions |
33,380,699 | 64,257,696 | ||||||
| Net change in unrealized appreciation/depreciation of investments |
(100,989,442 | ) | 258,100,375 | |||||
|
|
|
|
|
|||||
| Net increase in net assets resulting from operations |
8,713,345 | 353,594,927 | ||||||
|
|
|
|
|
|||||
| Distributions to shareholders (a)* |
(97,041,724 | ) | (20,974,714 | ) | ||||
|
|
|
|
|
|||||
| Capital-share transactions: |
||||||||
| Net proceeds from sales of shares |
1,193,401,258 | 1,752,230,315 | ||||||
| Net proceeds from sales of shares issued to shareholders on reinvestment of dividends |
93,754,598 | 19,090,466 | ||||||
|
|
|
|
|
|||||
| Total proceeds from shares sold |
1,287,155,856 | 1,771,320,781 | ||||||
| Cost of shares redeemed |
(218,083,402 | ) | (142,185,394 | ) | ||||
|
|
|
|
|
|||||
| Net increase in net assets from capital-share transactions |
1,069,072,454 | 1,629,135,387 | ||||||
|
|
|
|
|
|||||
| Net increase in net assets |
980,744,075 | 1,961,755,600 | ||||||
| NET ASSETS: | ||||||||
| Beginning of period |
3,190,218,188 | 1,228,462,588 | ||||||
|
|
|
|
|
|||||
| End of period |
$ | 4,170,962,263 | $ | 3,190,218,188 | ||||
|
|
|
|
|
|||||
(a) See page 35 for share class information on dividend distributions for the Portfolios.
* The prior year’s amounts have been reclassified to conform with the current year’s presentation. See Note 7, New Accounting Pronouncements, in the Notes to Financial Statements for more information.
See Notes to Financial Statements.
| 34 | Bernstein Fund, Inc. |
| SMALL CAP CORE PORTFOLIO |
||||||||
| YEAR ENDED 9/30/18 |
YEAR ENDED 9/30/17 |
|||||||
| Distributions to shareholders:* |
||||||||
| SCB Class |
$ | (586,489 | ) | $ | (7,038 | ) | ||
| Advisor Class |
(41,690,187 | ) | (1,673,434 | ) | ||||
| Class Z |
(10,938,618 | ) | (390,192 | ) | ||||
|
|
|
|
|
|||||
| $ | (53,215,294 | ) | $ | (2,070,664 | ) | |||
|
|
|
|
|
|||||
| INTERNATIONAL SMALL CAP PORTFOLIO |
||||||||
| YEAR ENDED 9/30/18 |
YEAR ENDED 9/30/17 |
|||||||
| Distributions to shareholders:* |
||||||||
| SCB Class |
$ | (2,714,284 | ) | $ | (1,004,783 | ) | ||
| Advisor Class |
(24,112,388 | ) | (9,631,507 | ) | ||||
| Class Z |
(14,927,196 | ) | (6,366,602 | ) | ||||
|
|
|
|
|
|||||
| $ | (41,753,868 | ) | $ | (17,002,892 | ) | |||
|
|
|
|
|
|||||
| INTERNATIONAL STRATEGIC EQUITIES PORTFOLIO |
||||||||
| YEAR ENDED 9/30/18 |
YEAR ENDED 9/30/17 |
|||||||
| Distributions to shareholders:* |
||||||||
| SCB Class |
$ | (4,530,477 | ) | $ | (1,251,620 | ) | ||
| Advisor Class |
(55,027,970 | ) | (12,785,371 | ) | ||||
| Class Z |
(37,483,277 | ) | (6,937,723 | ) | ||||
|
|
|
|
|
|||||
| $ | (97,041,724 | ) | $ | (20,974,714 | ) | |||
|
|
|
|
|
|||||
* The prior year’s amounts have been reclassified to conform with the current year’s presentation. See Note 7, New Accounting Pronouncements, in the Notes to Financial Statements for more information.
See Notes to Financial Statements.
| 2018 Annual Report | 35 |
Selected per share data and ratios for a share of capital stock outstanding for each respective Portfolio for each of the periods presented:
| SMALL CAP CORE PORTFOLIO |
||||||||||||
| SCB CLASS | ||||||||||||
| YEAR ENDED 9/30/18 |
YEAR ENDED 9/30/17 |
FOR THE PERIOD 12/29/15(a) TO 9/30/16 |
||||||||||
| Net asset value, beginning of period |
$ | 12.21 | $ | 10.54 | $ | 10.00 | ||||||
|
|
|
|
|
|
|
|||||||
| Income from investment operations: |
||||||||||||
| Net investment income (loss) (b)(c) |
(0.00 | ) (e) | 0.01 | 0.01 | ||||||||
| Net realized and unrealized gain on investment transactions and foreign currency transactions |
1.44 | 1.67 | 0.53 | (d) | ||||||||
|
|
|
|
|
|
|
|||||||
| Total from investment operations |
1.44 | 1.68 | 0.54 | |||||||||
|
|
|
|
|
|
|
|||||||
| Less dividends and distributions: |
||||||||||||
| Dividends from net investment income |
(0.01 | ) | (0.01 | ) | (0.00 | ) (e) | ||||||
| Distributions from net realized gain on investment transactions |
(0.71 | ) | 0 | 0 | ||||||||
|
|
|
|
|
|
|
|||||||
| Total dividends and distributions |
(0.72 | ) | (0.01 | ) | 0 | |||||||
|
|
|
|
|
|
|
|||||||
| Net asset value, end of period |
$ | 12.93 | $ | 12.21 | $ | 10.54 | ||||||
|
|
|
|
|
|
|
|||||||
| Total return (f) |
12.44% | 15.98% | 5.45% | |||||||||
| RATIOS/SUPPLEMENTAL DATA | ||||||||||||
| Net assets, end of period (000 omitted) |
$10,865 | $10,276 | $4,870 | |||||||||
| Average net assets (000 omitted) |
$10,771 | $7,467 | $2,314 | |||||||||
| Ratio to average net assets of: |
||||||||||||
| Expenses, net of waivers/reimbursements |
1.14% | 1.18% | 1.30% | * | ||||||||
| Expenses, before waivers/reimbursements |
1.14% | 1.19% | 1.40% | * | ||||||||
| Net investment income (loss) (c) |
(0.02)% | 0.05% | 0.16% | * | ||||||||
| Portfolio turnover rate |
102% | 165% | 88% | |||||||||
See Footnote Summary on page 44.
See Notes to Financial Statements.
| 36 | Bernstein Fund, Inc. |
| SMALL CAP CORE PORTFOLIO |
||||||||||||
| ADVISOR CLASS | ||||||||||||
| YEAR ENDED 9/30/18 |
YEAR ENDED 9/30/17 |
FOR THE PERIOD 12/29/15(a) TO 9/30/16 |
||||||||||
| Net asset value, beginning of period |
$ | 12.25 | $ | 10.56 | $ | 10.00 | ||||||
|
|
|
|
|
|
|
|||||||
| Income from investment operations |
||||||||||||
| Investment income, net (b)(c) |
0.03 | 0.03 | 0.04 | |||||||||
| Net realized and unrealized gain on investment transactions and foreign currency transactions |
1.44 | 1.69 | 0.53 | (d) | ||||||||
|
|
|
|
|
|
|
|||||||
| Total from investment operations |
1.47 | 1.72 | 0.57 | |||||||||
|
|
|
|
|
|
|
|||||||
| Less dividends and distributions: |
||||||||||||
| Dividends from net investment income |
(0.04 | ) | (0.03 | ) | (0.01 | ) | ||||||
| Distributions from net realized gain on investment transactions |
(0.71 | ) | 0 | 0 | ||||||||
|
|
|
|
|
|
|
|||||||
| Total dividends and distributions |
(0.75 | ) | (0.03 | ) | (0.01 | ) | ||||||
|
|
|
|
|
|
|
|||||||
| Net asset value, end of period |
$ | 12.97 | $ | 12.25 | $ | 10.56 | ||||||
|
|
|
|
|
|
|
|||||||
| Total return (f) |
12.64% | 16.29% | 5.65% | |||||||||
| RATIOS/SUPPLEMENTAL DATA | ||||||||||||
| Net assets, end of period (000 omitted) |
$752,305 | $695,958 | $603,862 | |||||||||
| Average net assets (000 omitted) |
$718,801 | $654,649 | $175,999 | |||||||||
| Ratio to average net assets of: |
||||||||||||
| Expenses, net of waivers/reimbursements |
0.89% | 0.92% | 1.05% | * | ||||||||
| Expenses, before waivers/reimbursements |
0.89% | 0.93% | 1.15% | * | ||||||||
| Net investment income (c) |
0.23% | 0.30% | 0.49% | * | ||||||||
| Portfolio turnover rate |
102% | 165% | 88% | |||||||||
See Footnote Summary on page 44.
See Notes to Financial Statements.
| 2018 Annual Report | 37 |
Financial Highlights (continued)
Selected per share data and ratios for a share of capital stock outstanding for each respective Portfolio for each of the periods presented:
| SMALL CAP CORE PORTFOLIO |
||||||||||||
| CLASS Z | ||||||||||||
| YEAR ENDED 9/30/18 |
YEAR ENDED 9/30/17 |
FOR THE PERIOD 12/29/15(a) TO 9/30/16 |
||||||||||
| Net asset value, beginning of period |
$ | 12.24 | $ | 10.56 | $ | 10.00 | ||||||
|
|
|
|
|
|
|
|||||||
| Income from investment operations |
||||||||||||
| Investment income, net (b)(c) |
0.03 | 0.03 | 0.04 | |||||||||
| Net realized and unrealized gain on investment transactions and foreign currency transactions |
1.44 | 1.68 | 0.53 | (d) | ||||||||
|
|
|
|
|
|
|
|||||||
| Total from investment operations |
1.47 | 1.71 | 0.57 | |||||||||
|
|
|
|
|
|
|
|||||||
| Less dividends and distributions: |
||||||||||||
| Dividends from net investment income |
(0.04 | ) | (0.03 | ) | (0.01 | ) | ||||||
| Distributions from net realized gain on investment transactions |
(0.71 | ) | 0 | 0 | ||||||||
|
|
|
|
|
|
|
|||||||
| Total dividends and distributions |
(0.75 | ) | (0.03 | ) | (0.01 | ) | ||||||
|
|
|
|
|
|
|
|||||||
| Net asset value, end of period |
$ | 12.96 | $ | 12.24 | $ | 10.56 | ||||||
|
|
|
|
|
|
|
|||||||
| Total return (f) |
12.69% | 16.22% | 5.65% | |||||||||
| RATIOS/SUPPLEMENTAL DATA | ||||||||||||
| Net assets, end of period (000 omitted) |
$211,869 | $179,340 | $126,780 | |||||||||
| Average net assets (000 omitted) |
$193,253 | $144,513 | $36,539 | |||||||||
| Ratio to average net assets of: |
||||||||||||
| Expenses, net of waivers/reimbursements |
0.86% | 0.93% | 1.05% | * | ||||||||
| Expenses, before waivers/reimbursements |
0.86% | 0.94% | 1.35% | * | ||||||||
| Net investment income (c) |
0.25% | 0.30% | 0.49% | * | ||||||||
| Portfolio turnover rate |
102% | 165% | 88% | |||||||||
See Footnote Summary on page 44.
See Notes to Financial Statements.
| 38 | Bernstein Fund, Inc. |
| INTERNATIONAL SMALL CAP PORTFOLIO |
||||||||||||
| SCB CLASS | ||||||||||||
| YEAR ENDED 9/30/18 |
YEAR ENDED 9/30/17 |
FOR THE PERIOD 12/21/15(a) TO 9/30/16 |
||||||||||
| Net asset value, beginning of period |
$ | 12.70 | $ | 10.92 | $ | 10.00 | ||||||
|
|
|
|
|
|
|
|||||||
| Income from investment operations: |
||||||||||||
| Investment income, net (b)(c) |
0.14 | 0.08 | 0.11 | |||||||||
| Net realized and unrealized gain on investment transactions and foreign currency transactions |
0.02 | 1.96 | 0.81 | |||||||||
| Contributions from affiliates |
0 | 0.00 | (e) | 0 | ||||||||
|
|
|
|
|
|
|
|||||||
| Total from investment operations |
0.16 | 2.04 | 0.92 | |||||||||
|
|
|
|
|
|
|
|||||||
| Less dividends and distributions: |
||||||||||||
| Dividends from net investment income |
(0.14 | ) | (0.14 | ) | 0 | |||||||
| Distributions from net realized gain on investment transactions |
(0.32 | ) | (0.12 | ) | 0 | |||||||
|
|
|
|
|
|
|
|||||||
| Total dividends and distributions |
(0.46 | ) | (0.26 | ) | 0 | |||||||
|
|
|
|
|
|
|
|||||||
| Net asset value, end of period |
$ | 12.40 | $ | 12.70 | $ | 10.92 | ||||||
|
|
|
|
|
|
|
|||||||
| Total return (f) |
1.29% | 19.28% | 9.20% | |||||||||
| RATIOS/SUPPLEMENTAL DATA | ||||||||||||
| Net assets, end of period (000 omitted) |
$71,729 | $73,531 | $37,226 | |||||||||
| Average net assets (000 omitted) |
$76,322 | $55,325 | $14,117 | |||||||||
| Ratio to average net assets of: |
||||||||||||
| Expenses, net of waivers/reimbursements |
1.35% | 1.35% | 1.35% | * | ||||||||
| Expenses, before waivers/reimbursements |
1.35% | 1.36% | 1.53% | * | ||||||||
| Net investment income (c) |
1.07% | 0.75% | 1.38% | * | ||||||||
| Portfolio turnover rate |
81% | 65% | 51% | |||||||||
See Footnote Summary on page 44.
See Notes to Financial Statements.
| 2018 Annual Report | 39 |
Financial Highlights (continued)
Selected per share data and ratios for a share of capital stock outstanding for each respective Portfolio for each of the periods presented:
| INTERNATIONAL SMALL CAP PORTFOLIO |
||||||||||||
| ADVISOR CLASS | ||||||||||||
| YEAR ENDED 9/30/18 |
YEAR ENDED 9/30/17 |
FOR THE PERIOD 12/21/15(a) TO 9/30/16 |
||||||||||
| Net asset value, beginning of period |
$ | 12.72 | $ | 10.93 | $ | 10.00 | ||||||
|
|
|
|
|
|
|
|||||||
| Income from investment operations |
||||||||||||
| Investment income, net (b)(c) |
0.18 | 0.10 | 0.15 | |||||||||
| Net realized and unrealized gain on investment transactions and foreign currency transactions |
0.01 | 1.96 | 0.78 | |||||||||
| Contributions from affiliates |
0 | 0.00 | (e) | 0 | ||||||||
|
|
|
|
|
|
|
|||||||
| Total from investment operations |
0.19 | 2.06 | 0.93 | |||||||||
|
|
|
|
|
|
|
|||||||
| Less dividends and distributions: |
||||||||||||
| Dividends from net investment income |
(0.16 | ) | (0.15 | ) | 0 | |||||||
| Distributions from net realized gain on investment transactions |
(0.32 | ) | (0.12 | ) | 0 | |||||||
|
|
|
|
|
|
|
|||||||
| Total dividends and distributions |
(0.48 | ) | (0.27 | ) | 0 | |||||||
|
|
|
|
|
|
|
|||||||
| Net asset value, end of period |
$ | 12.43 | $ | 12.72 | $ | 10.93 | ||||||
|
|
|
|
|
|
|
|||||||
| Total return (f) |
1.53% | 19.51% | 9.30% | |||||||||
| RATIOS/SUPPLEMENTAL DATA | ||||||||||||
| Net assets, end of period (000 omitted) |
$810,447 | $608,324 | $367,468 | |||||||||
| Average net assets (000 omitted) |
$745,535 | $460,362 | $230,324 | |||||||||
| Ratio to average net assets of: |
||||||||||||
| Expenses, net of waivers/reimbursements |
1.10% | 1.10% | 1.10% | * | ||||||||
| Expenses, before waivers/reimbursements |
1.10% | 1.11% | 1.22% | * | ||||||||
| Net investment income (c) |
1.43% | 0.93% | 1.87% | * | ||||||||
| Portfolio turnover rate |
81% | 65% | 51% | |||||||||
See Footnote Summary on page 44.
See Notes to Financial Statements.
| 40 | Bernstein Fund, Inc. |
| INTERNATIONAL SMALL CAP PORTFOLIO |
||||||||||||
| CLASS Z | ||||||||||||
| YEAR ENDED 9/30/18 |
YEAR ENDED 9/30/17 |
FOR THE PERIOD 12/21/15(a) TO 9/30/16 |
||||||||||
| Net asset value, beginning of period |
$ | 12.72 | $ | 10.93 | $ | 10.00 | ||||||
|
|
|
|
|
|
|
|||||||
| Income from investment operations |
||||||||||||
| Investment income, net (b)(c) |
0.18 | 0.10 | 0.15 | |||||||||
| Net realized and unrealized gain on investment transactions and foreign currency transactions |
0.02 | 1.96 | 0.78 | |||||||||
| Contributions from affiliates |
0 | 0.00 | (e) | 0 | ||||||||
|
|
|
|
|
|
|
|||||||
| Total from investment operations |
0.20 | 2.06 | 0.93 | |||||||||
|
|
|
|
|
|
|
|||||||
| Less dividends and distributions: |
||||||||||||
| Dividends from net investment income |
(0.17 | ) | (0.15 | ) | 0 | |||||||
| Distributions from net realized gain on investment transactions |
(0.32 | ) | (0.12 | ) | 0 | |||||||
|
|
|
|
|
|
|
|||||||
| Total dividends and distributions |
(0.49 | ) | (0.27 | ) | 0 | |||||||
|
|
|
|
|
|
|
|||||||
| Net asset value, end of period |
$ | 12.43 | $ | 12.72 | $ | 10.93 | ||||||
|
|
|
|
|
|
|
|||||||
| Total return (f) |
1.54% | 19.52% | 9.30% | |||||||||
| RATIOS/SUPPLEMENTAL DATA | ||||||||||||
| Net assets, end of period (000 omitted) |
$427,851 | $392,000 | $254,068 | |||||||||
| Average net assets (000 omitted) |
$424,411 | $291,438 | $187,312 | |||||||||
| Ratio to average net assets of: |
||||||||||||
| Expenses, net of waivers/reimbursements |
1.10% | 1.10% | 1.10% | * | ||||||||
| Expenses, before waivers/reimbursements |
1.10% | 1.11% | 1.26% | * | ||||||||
| Net investment income (c) |
1.36% | 0.87% | 1.92% | * | ||||||||
| Portfolio turnover rate |
81% | 65% | 51% | |||||||||
See Footnote Summary on page 44.
See Notes to Financial Statements.
| 2018 Annual Report | 41 |
Financial Highlights (continued)
Selected per share data and ratios for a share of capital stock outstanding for each respective Portfolio for each of the periods presented:
| INTERNATIONAL STRATEGIC EQUITIES PORTFOLIO |
||||||||||||
| SCB CLASS | ||||||||||||
| YEAR ENDED 9/30/18 |
YEAR ENDED 9/30/17 |
FOR THE PERIOD 12/21/15(a) TO 9/30/16 |
||||||||||
| Net asset value, beginning of period |
$ | 12.69 | $ | 10.57 | $ | 10.00 | ||||||
|
|
|
|
|
|
|
|||||||
| Income from investment operations: |
||||||||||||
| Investment income, net (b)(c) |
0.22 | 0.18 | 0.21 | |||||||||
| Net realized and unrealized gain (loss) on investment transactions and foreign currency transactions |
(0.11 | ) | 2.11 | 0.36 | (d) | |||||||
|
|
|
|
|
|
|
|||||||
| Total from investment operations |
0.11 | 2.29 | 0.57 | |||||||||
|
|
|
|
|
|
|
|||||||
| Less dividends and distributions: |
||||||||||||
| Dividends from net investment income |
(0.09 | ) | (0.14 | ) | (0.00 | ) (e) | ||||||
| Distributions from net realized gain on investment transactions |
(0.26 | ) | (0.03 | ) | 0 | |||||||
|
|
|
|
|
|
|
|||||||
| Total dividends and distributions |
(0.35 | ) | (0.17 | ) | (0.00 | ) | ||||||
|
|
|
|
|
|
|
|||||||
| Net asset value, end of period |
$ | 12.45 | $ | 12.69 | $ | 10.57 | ||||||
|
|
|
|
|
|
|
|||||||
| Total return (f) |
0.86% | 22.01% | 5.75% | |||||||||
| RATIOS/SUPPLEMENTAL DATA | ||||||||||||
| Net assets, end of period (000 omitted) |
$181,606 | $152,725 | $68,977 | |||||||||
| Average net assets (000 omitted) |
$179,015 | $106,248 | $27,169 | |||||||||
| Ratio to average net assets of: |
||||||||||||
| Expenses, net of waivers/reimbursements |
1.03% | 1.17% | 1.20% | * | ||||||||
| Expenses, before waivers/reimbursements |
1.04% | 1.23% | 1.34% | * | ||||||||
| Net investment income (c) |
1.69% | 1.62% | 2.70% | * | ||||||||
| Portfolio turnover rate |
69% | 69% | 79% | |||||||||
See Footnote Summary on page 44.
See Notes to Financial Statements.
| 42 | Bernstein Fund, Inc. |
| INTERNATIONAL STRATEGIC EQUITIES PORTFOLIO |
||||||||||||
| ADVISOR CLASS | ||||||||||||
| YEAR ENDED 9/30/18 |
YEAR ENDED 9/30/17 |
FOR THE PERIOD 12/21/15(a) TO 9/30/16 |
||||||||||
| Net asset value, beginning of period |
$ | 12.72 | $ | 10.57 | $ | 10.00 | ||||||
|
|
|
|
|
|
|
|||||||
| Income from investment operations |
||||||||||||
| Investment income, net (b)(c) |
0.26 | 0.21 | 0.23 | |||||||||
| Net realized and unrealized gain (loss) on investment transactions and foreign currency transactions |
(0.11 | ) | 2.11 | 0.35 | (d) | |||||||
|
|
|
|
|
|
|
|||||||
| Total from investment operations |
0.15 | 2.32 | 0.58 | |||||||||
|
|
|
|
|
|
|
|||||||
| Less dividends and distributions: |
||||||||||||
| Dividends from net investment income |
(0.11 | ) | (0.14 | ) | (0.01 | ) | ||||||
| Distributions from net realized gain on investment transactions |
(0.26 | ) | (0.03 | ) | 0 | |||||||
|
|
|
|
|
|
|
|||||||
| Total dividends and distributions |
(0.37 | ) | (0.17 | ) | (0.01 | ) | ||||||
|
|
|
|
|
|
|
|||||||
| Net asset value, end of period |
$ | 12.50 | $ | 12.72 | $ | 10.57 | ||||||
|
|
|
|
|
|
|
|||||||
| Total return (f) |
1.18% | 22.38% | 5.75% | |||||||||
| RATIOS/SUPPLEMENTAL DATA | ||||||||||||
| Net assets, end of period (000 omitted) |
$2,568,426 | $1,760,819 | $737,765 | |||||||||
| Average net assets (000 omitted) |
$2,275,780 | $1,023,860 | $459,166 | |||||||||
| Ratio to average net assets of: |
||||||||||||
| Expenses, net of waivers/reimbursements |
0.77% | 0.93% | 0.95% | * | ||||||||
| Expenses, before waivers/reimbursements |
0.79% | 0.98% | 1.06% | * | ||||||||
| Net investment income (c) |
2.05% | 1.85% | 2.93% | * | ||||||||
| Portfolio turnover rate |
69% | 69% | 79% | |||||||||
See Footnote Summary on page 44.
See Notes to Financial Statements.
| 2018 Annual Report | 43 |
Financial Highlights (continued)
Selected per share data and ratios for a share of capital stock outstanding for each respective Portfolio for each of the periods presented:
| INTERNATIONAL STRATEGIC EQUITIES PORTFOLIO |
||||||||||||
| CLASS Z | ||||||||||||
| YEAR ENDED 9/30/18 |
YEAR ENDED 9/30/17 |
FOR THE PERIOD 12/21/15(a) TO 9/30/16 |
||||||||||
| Net asset value, beginning of period |
$ | 12.73 | $ | 10.58 | $ | 10.00 | ||||||
|
|
|
|
|
|
|
|||||||
| Income from investment operations |
||||||||||||
| Investment income, net (b)(c) |
0.25 | 0.20 | 0.24 | |||||||||
| Net realized and unrealized gain (loss) on investment transactions and foreign currency transactions |
(0.10 | ) | 2.12 | 0.35 | (d) | |||||||
|
|
|
|
|
|
|
|||||||
| Total from investment operations |
0.15 | 2.32 | 0.59 | |||||||||
|
|
|
|
|
|
|
|||||||
| Less dividends and distributions: |
| |||||||||||
| Dividends from net investment income |
(0.11 | ) | (0.14 | ) | (0.01 | ) | ||||||
| Distributions from net realized gain on investment transactions |
(0.26 | ) | (0.03 | ) | 0 | |||||||
|
|
|
|
|
|
|
|||||||
| Total dividends and distributions |
(0.37 | ) | (0.17 | ) | (0.01 | ) | ||||||
|
|
|
|
|
|
|
|||||||
| Net asset value, end of period |
$ | 12.51 | $ | 12.73 | $ | 10.58 | ||||||
|
|
|
|
|
|
|
|||||||
| Total return (f) |
1.18% | 22.35% | 5.85% | |||||||||
| RATIOS/SUPPLEMENTAL DATA | ||||||||||||
| Net assets, end of period (000 omitted) |
$1,420,930 | $1,276,674 | $421,721 | |||||||||
| Average net assets (000 omitted) |
$1,390,312 | $605,465 | $295,180 | |||||||||
| Ratio to average net assets of: |
||||||||||||
| Expenses, net of waivers/reimbursements |
0.79% | 0.94% | 0.95% | * | ||||||||
| Expenses, before waivers/reimbursements |
0.80% | 1.00% | 1.10% | * | ||||||||
| Net investment income (c) |
1.91% | 1.74% | 3.04% | * | ||||||||
| Portfolio turnover rate |
69% | 69% | 79% | |||||||||
| (a) | Commencement of operations. |
| (b) | Based on average shares outstanding. |
| (c) | Net of fees and expenses waived by the Adviser. |
| (d) | Due to timing of sales and repurchase of capital shares, the net realized and unrealized gain (loss) per share is not in accordance with the Portfolios’ change in net realized and unrealized gain (loss) on investment transactions for the period. |
| (e) | Amount is less than $.005. |
| (f) | Total investment return is calculated assuming an initial investment made at the net asset value at the beginning of the period, reinvestment of all dividends and distributions at net asset value during the period, and redemption on the last day of the period. Total return does not reflect the deduction of taxes that a shareholder would pay on fund distributions or the redemption of fund shares. Total investment return calculated for a period of less than one year is not annualized. |
| * | Annualized, except for certain non-recurring fees. |
See Notes to Financial Statements.
| 44 | Bernstein Fund, Inc. |
| NOTE 1. | Organization and Significant Accounting Policies |
Bernstein Fund, Inc. (the “Fund”) is a managed open-end registered investment company, incorporated in Maryland on September 11, 2015. The Fund operates as a series company currently comprised of three portfolios: Small Cap Core Portfolio, International Small Cap Portfolio and International Strategic Equities Portfolio (hereafter collectively referred to as the “Portfolios” and each individually a “Portfolio”) with the following share classes offered: SCB Class, Advisor Class and Class Z. Class Z shares are currently offered exclusively to registered investment companies (or their series) managed by AllianceBernstein L.P. (the “Adviser”).
Each Portfolio has its own investment objectives. Each class of shares has identical voting, dividend, liquidation and other rights, except that the classes bear different distribution and transfer agency expenses. Each class has exclusive voting rights with respect to its distribution plan, as applicable. The financial statements have been prepared in conformity with U.S. generally accepted accounting principles (“U.S. GAAP”) which require management to make certain estimates and assumptions that affect the reported amounts of assets and liabilities in the financial statements and amounts of income and expenses during the reporting period. Actual results could differ from those estimates. Each Portfolio is an investment company under U.S. GAAP and follows the accounting and reporting guidance applicable to investment companies. The following is a summary of significant accounting policies followed by the Portfolios.
| A. | Portfolio Valuation |
Portfolio securities are valued at their current market value determined on the basis of market quotations or, if market quotations are not readily available or are deemed unreliable, at “fair value” as determined in accordance with procedures established by and under the general supervision of the Fund’s Board of Directors (the “Board”).
In general, the market values of securities which are readily available and deemed reliable are determined as follows: securities listed on a national securities exchange (other than securities listed on the NASDAQ Stock Market, Inc. (“NASDAQ”)) or on a foreign securities exchange are valued at the last sale price at the close of the exchange or foreign securities exchange. If there has been no sale on such day, the securities are valued at the last traded price from the previous day. Securities listed on more than one exchange are valued by reference to the principal exchange on which the securities are traded; securities listed only on NASDAQ are valued in accordance with the NASDAQ Official Closing Price; listed or over the counter (“OTC”) market put or call options are valued at the mid level between the current bid and ask prices. If either a current bid or current ask price is unavailable, the Adviser will have discretion to determine the best valuation (e.g., last trade price in the case of listed options); open futures are valued using the closing settlement price or, in the absence of such a price, the most recent quoted bid price. If there are no quotations available for the day of valuation, the last available closing settlement price is used; U.S. Government securities and any other debt instruments having 60 days or less remaining until maturity are generally valued at market by an independent pricing vendor, if a market price is available. If a market price is not available, the securities are valued at amortized cost. This methodology is commonly used for short term securities that have an original maturity of 60 days or less, as well as short term securities that had an original term to maturity that exceeded 60 days. In instances when amortized cost is utilized, the Valuation Committee (the “Committee”) must reasonably conclude that the utilization of amortized cost is approximately the same as the fair value of the security. Such factors the Committee will consider include, but are not limited to, an impairment of the creditworthiness of the issuer or material changes in interest rates. Fixed-income securities, including mortgage-backed and asset-backed securities, may be valued on the basis of prices provided by a pricing service or at a price obtained from one or more of the major broker-dealers. In cases where broker-dealer quotes are obtained, the Adviser may establish procedures whereby changes in market yields or spreads are used to adjust, on a daily basis, a recently obtained quoted price on a security. Swaps and other derivatives are valued daily, primarily using independent pricing services, independent pricing models using market inputs, as well as third party broker-dealers or counterparties. Open end mutual funds are valued at the closing net asset value per share, while exchange traded funds are valued at the closing market price per share.
Securities for which market quotations are not readily available (including restricted securities) or are deemed unreliable are valued at fair value as deemed appropriate by the Adviser. Factors considered in making this determination may include, but are not limited to, information obtained by contacting the issuer, analysts, analysis of the issuer’s financial statements or other available documents. In addition, the Portfolios may use fair value pricing for securities primarily traded in non-U.S. markets because most foreign markets close well before the Portfolios value their securities at 4:00 p.m., Eastern Time. The earlier close of these foreign markets gives rise to the possibility that significant events,
| 2018 Annual Report | 45 |
Notes to Financial Statements (continued)
including broad market moves, may have occurred in the interim and may materially affect the value of those securities. To account for this, the Portfolios generally value many of their foreign equity securities using fair value prices based on third party vendor modeling tools to the extent available.
| B. | Fair Value Measurements |
In accordance with U.S. GAAP regarding fair value measurements, fair value is defined as the price that the Portfolios would receive to sell an asset or pay to transfer a liability in an orderly transaction between market participants at the measurement date. U.S. GAAP establishes a framework for measuring fair value, and a three-level hierarchy for fair value measurements based upon the transparency of inputs to the valuation of an asset or liability (including those valued based on their market values as described in Note A above). Inputs may be observable or unobservable and refer broadly to the assumptions that market participants would use in pricing the asset or liability. Observable inputs reflect the assumptions market participants would use in pricing the asset or liability based on market data obtained from sources independent of the Portfolios. Unobservable inputs reflect the Portfolios’ own assumptions about the assumptions that market participants would use in pricing the asset or liability based on the best information available in the circumstances. Each investment is assigned a level based upon the observability of the inputs which are significant to the overall valuation. The three-tier hierarchy of inputs is summarized below.
| • | Level 1—quoted prices in active markets for identical investments |
| • | Level 2—other significant observable inputs (including quoted prices for similar investments, interest rates, prepayment speeds, credit risk, etc.) |
| • | Level 3—significant unobservable inputs (including the Portfolios’ own assumptions in determining the fair value of investments) |
The fair value of debt instruments, such as bonds, and over-the-counter derivatives is generally based on market price quotations, recently executed market transactions (where observable) or industry recognized modeling techniques and are generally classified as Level 2. Pricing vendor inputs to Level 2 valuations may include quoted prices for similar investments in active markets, interest rate curves, coupon rates, currency rates, yield curves, option adjusted spreads, default rates, credit spreads and other unique security features in order to estimate the relevant cash flows which are then discounted to calculate fair values. If these inputs are unobservable and significant to the fair value, these investments will be classified as Level 3. In addition, non-agency rated investments are classified as Level 3.
Where readily available market prices or relevant bid prices are not available for certain equity investments, such investments may be valued based on similar publicly traded investments, movements in relevant indices since last available prices or based upon underlying company fundamentals and comparable company data (such as multiples to earnings or other multiples to equity). Where an investment is valued using an observable input, such as another publicly traded security, the investment will be classified as Level 2. If management determines that an adjustment is appropriate based on restrictions on resale, illiquidity or uncertainty, and such adjustment is a significant component of the valuation, the investment will be classified as Level 3. An investment will also be classified as Level 3 where management uses company fundamentals and other significant inputs to determine the valuation.
The following tables summarize the valuation of the Portfolios’ investments by the above fair value hierarchy levels as of September 30, 2018:
| SMALL CAP CORE PORTFOLIO INVESTMENTS IN SECURITIES: |
LEVEL 1 | LEVEL 2 | LEVEL 3 | TOTAL | ||||||||||||
| Assets: |
| |||||||||||||||
| Common Stocks (a) |
$ | 966,528,335 | $ | 0 | $ | 0 | $ | 966,528,335 | ||||||||
| Short-Term Investments |
5,289,174 | 0 | 0 | 5,289,174 | ||||||||||||
| Total Investments in Securities |
971,817,509 | 0 | 0 | 971,817,509 | ||||||||||||
| Other Financial Instruments (b): |
||||||||||||||||
| Assets |
0 | 0 | 0 | 0 | ||||||||||||
| Liabilities: |
| |||||||||||||||
| Futures |
(102,702 | ) | 0 | 0 | (102,702 | ) (c) | ||||||||||
| Total (d) |
$ | 971,714,807 | $ | 0 | $ | 0 | $ | 971,714,807 | ||||||||
| 46 | Bernstein Fund, Inc. |
| INTERNATIONAL SMALL CAP
PORTFOLIO INVESTMENTS IN SECURITIES: |
LEVEL 1 | LEVEL 2 | LEVEL 3 | TOTAL | ||||||||||||
| Assets: |
| |||||||||||||||
| Common Stocks: |
||||||||||||||||
| Industrials |
$ | 49,908,513 | $ | 232,075,646 | $ | 0 | $ | 281,984,159 | ||||||||
| Consumer Discretionary |
14,493,326 | 138,176,149 | 0 | 152,669,475 | ||||||||||||
| Information Technology |
6,327,057 | 137,476,007 | 0 | 143,803,064 | ||||||||||||
| Financials |
8,172,598 | 121,287,897 | 0 | 129,460,495 | ||||||||||||
| Consumer Staples |
11,965,308 | 112,431,428 | 0 | 124,396,736 | ||||||||||||
| Materials |
22,935,452 | 71,880,988 | 0 | 94,816,440 | ||||||||||||
| Energy |
19,572,459 | 65,660,755 | 0 | 85,233,214 | ||||||||||||
| Health Care |
12,731,885 | 69,257,537 | 0 | 81,989,422 | ||||||||||||
| Real Estate |
33,043,300 | 44,355,458 | 0 | 77,398,758 | ||||||||||||
| Communication Services |
10,359,114 | 41,890,169 | 0 | 52,249,283 | ||||||||||||
| Utilities |
8,177,748 | 16,059,790 | 0 | 24,237,538 | ||||||||||||
| Investment Companies |
1,440,536 | 0 | 0 | 1,440,536 | ||||||||||||
| Short-Term Investments |
49,415,027 | 0 | 0 | 49,415,027 | ||||||||||||
| Total Investments in Securities |
248,542,323 | 1,050,551,824 | (e) | 0 | 1,299,094,147 | |||||||||||
| Other Financial Instruments (b): |
||||||||||||||||
| Assets: |
| |||||||||||||||
| Forward Currency Exchange Contracts |
0 | 422,741 | 0 | 422,741 | ||||||||||||
| Liabilities: |
| |||||||||||||||
| Forward Currency Exchange Contracts |
0 | (2,796,194 | ) | 0 | (2,796,194 | ) | ||||||||||
| Total (f)(g) |
$ | 248,542,323 | $ | 1,048,178,371 | $ | 0 | $ | 1,296,720,694 | ||||||||
| INTERNATIONAL STRATEGIC EQUITIES PORTFOLIO INVESTMENTS IN SECURITIES: |
LEVEL 1 | LEVEL 2 | LEVEL 3 | TOTAL | ||||||||||||
| Assets: |
| |||||||||||||||
| Common Stocks: |
||||||||||||||||
| Financials |
$ | 105,063,301 | $ | 617,996,675 | $ | 0 | $ | 723,059,976 | ||||||||
| Consumer Discretionary |
157,762,920 | 533,950,988 | 0 | 691,713,908 | ||||||||||||
| Information Technology |
79,819,972 | 357,010,405 | 0 | 436,830,377 | ||||||||||||
| Energy |
57,160,645 | 375,827,585 | 0 | 432,988,230 | ||||||||||||
| Health Care |
19,047,176 | 410,665,822 | 0 | 429,712,998 | ||||||||||||
| Industrials |
30,215,443 | 343,373,433 | 0 | 373,588,876 | ||||||||||||
| Consumer Staples |
0 | 346,240,182 | 0 | 346,240,182 | ||||||||||||
| Communication Services |
0 | 291,762,032 | 0 | 291,762,032 | ||||||||||||
| Materials |
56,873 | 169,122,796 | 0 | 169,179,669 | ||||||||||||
| Real Estate |
20,099,521 | 103,990,791 | 0 | 124,090,312 | ||||||||||||
| Utilities |
49,635,437 | 18,139,064 | 0 | 67,774,501 | ||||||||||||
| Short-Term Investments |
58,802,140 | 0 | 0 | 58,802,140 | ||||||||||||
| Total Investments in Securities |
577,663,428 | 3,568,079,773 | (e) | 0 | 4,145,743,201 | |||||||||||
| Other Financial Instruments (b): |
||||||||||||||||
| Assets: |
| |||||||||||||||
| Forward Currency Exchange Contracts |
0 | 18,298,900 | 0 | 18,298,900 | ||||||||||||
| Liabilities: |
| |||||||||||||||
| Forward Currency Exchange Contracts |
0 | (8,829,054 | ) | 0 | (8,829,054 | ) | ||||||||||
| Total (g)(h) |
$ | 577,663,428 | $ | 3,577,549,619 | $ | 0 | $ | 4,155,213,047 | ||||||||
| 2018 Annual Report | 47 |
Notes to Financial Statements (continued)
| (a) | See Schedule of Investments for sector classifications. |
| (b) | Other financial instruments are derivative instruments, such as futures, forwards and swaps, which are valued at the unrealized appreciation/(depreciation) on the instrument. Other financial instruments may also include swaps with upfront premiums, options written and swaptions written which are valued at market value. |
| (c) | Only variation margin receivable/(payable) at period end is reported within the statement of assets and liabilities. This amount reflects cumulative unrealized appreciation/(depreciation) on futures and centrally cleared swaps as reported in the schedule of investments. Centrally cleared swaps with upfront premiums are presented here at market value. |
| (d) | There were no transfers between any levels during the reporting period. |
| (e) | A significant portion of the Portfolio’s foreign equity investments are categorized as Level 2 investments since they are valued using fair value prices based on third party vendor modeling tools to the extent available, see Note 1.A. |
| (f) | An amount of $35,687,194 was transferred from Level 1 to Level 2 due to the above mentioned foreign equity fair valuation using third party vendor modeling tools during the reporting period. |
| (g) | There were de minimis transfers under 1% of net assets from Level 2 to Level 1 during the reporting period. |
| (h) | There were no transfers from Level 1 to Level 2 during the reporting period. |
The Portfolios recognize all transfers between levels of the fair value hierarchy assuming the financial instruments were transferred at the beginning of the reporting period.
The Adviser established the Committee to oversee the pricing and valuation of all securities held in the Portfolios. The Committee operates under pricing and valuation policies and procedures established by the Adviser and approved by the Board, including pricing policies which set forth the mechanisms and processes to be employed on a daily basis to implement these policies and procedures. In particular, the pricing policies describe how to determine market quotations for securities and other instruments. The Committee’s responsibilities include: 1) fair value and liquidity determinations (and oversight of any third parties to whom any responsibility for fair value and liquidity determinations is delegated), and 2) regular monitoring of the Adviser’s pricing and valuation policies and procedures and modification or enhancement of these policies and procedures (or recommendation of the modification of these policies and procedures) as the Committee believes appropriate.
The Committee is also responsible for monitoring the implementation of the pricing policies by the Adviser’s Pricing Group (the “Pricing Group”) and any third party which performs certain pricing functions in accordance with the pricing policies. The Pricing Group is responsible for the oversight of the third party on a day-to-day basis. The Committee and the Pricing Group perform a series of activities to provide reasonable assurance of the accuracy of prices including: 1) periodic vendor due diligence meetings, review of methodologies, new developments and processes at vendors, 2) daily comparison of security valuation versus prior day for all securities that exceeded established thresholds, and 3) daily review of unpriced, stale, and variance reports with exceptions reviewed by senior management and the Committee.
In addition, several processes outside of the pricing process are used to monitor valuation issues including: 1) performance and performance attribution reports are monitored for anomalous impacts based upon benchmark performance, and 2) portfolio managers review all portfolios for performance and analytics (which are generated using the Adviser’s prices).
| C. | Foreign Currency Translation |
The accounting records of the Portfolios are maintained in U.S. dollars. Prices of securities and other assets and liabilities denominated in non-U.S. currencies are translated into U.S. dollars using the exchange rate at 4:00 p.m., Eastern Time. Amounts related to the purchases and sales of securities, investment income and expenses are translated at the rates of exchange prevailing on the respective dates of such transactions.
Net realized gain or loss on foreign currency transactions represents net foreign exchange gains or losses from the disposition of foreign currencies, currency gains or losses realized between the trade and settlement dates on security transactions and the difference between the amount of dividends, interest and foreign withholding taxes recorded on the
| 48 | Bernstein Fund, Inc. |
Portfolios’ books and the U.S. dollar equivalent amount actually received or paid. Net unrealized currency gains and losses arising from valuing foreign currency denominated assets and liabilities, other than security investments, at the current exchange rate are reflected as part of unrealized appreciation/depreciation on foreign currencies.
The Portfolios do not isolate that portion of the results of operations arising as a result of changes in the foreign exchange rates from the changes in the market prices of securities held at period end. The Portfolios do isolate the effect of changes in foreign exchange rates from changes in market prices of securities sold during the year, as required by the Internal Revenue Code. The International Small Cap Portfolio and International Strategic Equities Portfolio may invest in foreign securities and foreign currency transactions that may involve risks not associated with domestic investments as a result of the level of governmental supervision and regulation of foreign securities markets and the possibility of political or economic instability, among others.
| D. | Taxes |
Each Portfolio is treated as a separate entity for federal income tax purposes. Each Portfolio intends to continue to comply with the requirements of Subchapter M of the Internal Revenue Code of 1986 as they apply to regulated investment companies. By so complying, each Portfolio will not be subject to federal and state income taxes to the extent that all of its income is distributed. The Portfolios may be subject to taxes imposed by countries in which they invest. Such taxes are generally based on income and/or capital gains earned or repatriated. Taxes are accrued and applied to net investment income, net realized gains and net unrealized appreciation/depreciation as such income and/or gains are earned based on, management’s understanding of applicable local tax law.
In accordance with U.S. GAAP requirements regarding accounting for uncertainties in income taxes, management has analyzed the Portfolios’ tax positions taken or expected to be taken on federal and state income tax returns for all open tax years (the current and the prior two tax years) and has concluded that no provision for income tax is required in the Portfolios’ financial statements.
| E. | Security Transactions and Related Investment Income |
Security transactions are accounted for on the trade date (the date the buy or sell order is executed). Securities gains and losses are calculated on the identified cost basis. Interest income is recorded on the accrual basis and dividend income is recorded on the ex-dividend date or as soon as the Portfolios are informed of the dividend. The Portfolios amortize premiums and accrete discounts as adjustments to interest income.
| F. | Securities Transactions on a When-Issued or Delayed-Delivery Basis |
Each Portfolio may purchase securities on a when-issued basis or purchase or sell securities on a delayed-delivery basis. At the time a Portfolio commits to purchase a security on a when-issued or delayed-delivery basis, the Portfolio will record the transaction and use the security’s value in determining the Portfolio’s net asset value. At the time a Portfolio commits to sell a security on a delayed-delivery basis, the Portfolio will record the transaction and exclude the security’s value in determining the Portfolio’s net asset value.
| G. | Class Allocations |
All income earned and expenses incurred by the Portfolios are borne on a pro-rata basis by each outstanding class of shares, based on the proportionate interest in the Portfolio represented by the shares of such class, except for class specific expenses which are allocated to the respective class. Expenses of the Fund are charged proportionately to each Portfolio or based on other appropriate methods. Realized and unrealized gains and losses are allocated among the various share classes based on respective net assets.
| H. | Distribution of Income and Gains |
Dividends from net investment income, if any, will be paid to shareholders at least once a year.
Distributions of net realized gains, less any available loss carryforwards, if any, for all the Portfolios will be paid to shareholders at least once a year, and recorded on the ex-dividend date.
| 2018 Annual Report | 49 |
Notes to Financial Statements (continued)
Elements of realized gains and net investment income may be recorded in different accounting periods for financial reporting (book) and federal income tax (tax) purposes (temporary differences). To the extent that such distributions required for tax purposes exceed income and gains recorded for book purposes as a result of such temporary differences, “excess distributions” are reflected in the accompanying statement of assets and liabilities. To the extent distributions exceed income and gains for tax purposes, such distributions would be shown as “return of capital” on the statement of changes in net assets. Certain other differences—permanent differences—arise because treatment of elements of income and gains is different between book and tax accounting. Permanent differences are reclassified in the year they arise.
Permanent differences have no effect on net assets. The effects of such permanent differences on each Portfolio, due to the utilization of earnings and profits distributed to shareholders on redemption of shares are reflected as adjustments to the components of net assets as of September 30, 2018, as shown below:
| PORTFOLIO | INCREASE (DECREASE) TO ADDITIONAL PAID-IN CAPITAL |
INCREASE (DECREASE) TO DISTRIBUTABLE EARNINGS/ ACCUMULATED LOSS |
||||||
| Small Cap Core |
$ | 3,530,451 | $ | (3,530,451 | ) | |||
| International Small Cap |
0 | 0 | ||||||
| International Strategic Equities |
0 | 0 | ||||||
| I. | Organization and Offering Expenses |
Offering costs of $103,529, $103,639 and $103,529 have been deferred and were fully amortized on a straight line basis over a one year period starting from December 29, 2015 (commencement of operations) for Small Cap Core Portfolio and from December 21, 2015 (commencement of operations) for International Small Cap Portfolio and International Strategic Equities Portfolio, respectively.
| NOTE 2. | Investment Management and Transactions with Affiliated Persons |
| A. | Management Fee |
Under the Investment Management Agreement between the Fund and the Adviser, the Adviser manages the investment of each Portfolio’s assets, places purchase and sale orders, and bears various expenses, including the salaries and expenses of all personnel except those of outside directors. In addition, the Adviser agrees to permit its directors, officers and employees who may be elected directors or officers of the Fund to serve in the capacities to which they are elected. The Adviser renders these services subject to the general oversight of the Board.
The Portfolios pay the Adviser an investment management fee at an annualized rate as follows:
Small Cap Core Portfolio: 0.80% of the Portfolio’s average daily net assets.
International Small Cap Portfolio: 1.00% of the Portfolio’s average daily net assets.
| ANNUAL PERCENTAGE OF AVERAGE DAILY NET ASSETS OF EACH PORTFOLIO | ||||||||||||
| FIRST $2.5 BILLION |
NEXT $2.5 BILLION |
THEREAFTER | ||||||||||
| International Strategic Equities | 0.75 | % | 0.65 | % | 0.60 | % | ||||||
Prior to January 1, 2018, the below Portfolio paid the Adviser an investment management fee, based on an annual rate, for such services as follows:
| ANNUAL PERCENTAGE OF AVERAGE DAILY NET ASSETS OF EACH PORTFOLIO | ||||||||||||||||||||||||
| PORTFOLIO | FIRST $1 BILLION |
NEXT $3 BILLION |
NEXT $2 BILLION |
NEXT $2 BILLION |
NEXT $2 BILLION |
THEREAFTER | ||||||||||||||||||
| International Strategic Equities | 0.925 | % | 0.850 | % | 0.800 | % | 0.750 | % | 0.650 | % | 0.600 | % | ||||||||||||
| 50 | Bernstein Fund, Inc. |
Prior to January 1, 2018, the Adviser waived the annual investment management fees of the International Strategic Equities Portfolio by an amount equal to 0.05% per annum of the average net assets of the Portfolio. For the year ended September 30, 2018, such waiver amounted to $419,834.
The Adviser has agreed to waive its fees and bear certain expenses to the extent necessary to limit the total portfolio operating expenses (excluding acquired fund fees and expenses other than the advisory fees of any AB mutual funds in which the Portfolios may invest, interest expense, taxes, extraordinary expenses, and brokerage commissions and other transaction costs) as a percentage of daily average net assets on an annual basis (the “Expense Caps”) as follows:
| PORTFOLIO | SCB CLASS | ADVISOR CLASS | CLASS Z | |||||||||
| Small Cap Core | 1.30 | % | 1.05 | % | 1.05 | % | ||||||
| International Small Cap | 1.35 | % | 1.10 | % | 1.10 | % | ||||||
The Expense Caps described above for Small Cap Core and International Small Cap may not be terminated by the Adviser before January 26, 2019. Effective January 27, 2018, the Expense Caps for International Strategic Equities of 1.20%, 0.95% and 0.95% of the daily average net assets for SCB Class, Advisor Class and Class Z shares, respectively, were terminated. During the year ended September 30, 2018, there were no such reimbursement/waivers.
Any fees waived and expenses borne by the Adviser for the Portfolios through September 30, 2016 are subject to repayment by the Portfolios until September 30, 2019, such waivers that are subject to repayment amounted to:
| PORTFOLIO | AMOUNT | |||||||
| Small Cap Core |
$ | 161,882 | ||||||
| International Small Cap |
420,136 | |||||||
| International Strategic Equities |
425,084 | |||||||
Any fees waived and expenses borne by the Adviser from October 1, 2016 through January 4, 2017 are subject to repayment by the Portfolios until September 30, 2020; such waivers that are subject to repayment amounted to:
| PORTFOLIO | AMOUNT | |||||||
| Small Cap Core |
$ | 0 | ||||||
| International Small Cap |
20,030 | |||||||
| International Strategic Equities |
1,709 | |||||||
During the year ended September 30, 2017, the Small Cap Core Portfolio, International Small Cap Portfolio and International Strategic Equities Portfolio made repayments to the Adviser in the amounts of $161,882, $27,230 and $426,793, respectively. During the year ended September 30, 2018, the International Small Cap Portfolio made repayments to the Adviser in the amount of $141,360. In any case, no repayment will be made that would cause the Portfolios’ total annual fund operating expenses to exceed the net fee percentage set forth per the Expense Caps.
Pursuant to the investment management agreement, the Portfolio may reimburse the Adviser for certain legal and accounting services provided to the Portfolio by the Adviser. During the year ended September 30, 2018, there was no such reimbursement.
During the year ended September 30, 2017, the Adviser reimbursed the International Small Cap Portfolio $2,415 for trading losses incurred due to trade entry errors.
| B. | Shareholder Servicing Fee; Transfer Agency Fee |
Under the Shareholder Servicing Agreement between the Fund and the Adviser, the Adviser pays expenses it incurs in providing shareholder servicing to the Fund, the Portfolios and individual shareholders. Such services include, but are not limited to, providing information to shareholders concerning their fund investments, systematic withdrawal plans, fund dividend payments and reinvestments, shareholder account or transactions status, net asset value of shares, fund performance, fund services, plans and options, fund investment policies, portfolio holdings and tax consequences of
| 2018 Annual Report | 51 |
Notes to Financial Statements (continued)
fund investments; dealing with shareholder complaints and other correspondence relating to fund matters; and communications with shareholders when proxies are being solicited from them with respect to voting their fund shares. Under the agreement, the fee paid by each Portfolio to the Adviser for services is 0.25% of the average daily net assets of SCB Class Shares.
The Fund compensates AllianceBernstein Investor Services, Inc. (“ABIS”), a wholly-owned subsidiary of the Adviser, under a Transfer Agency Agreement for providing personnel and facilities to perform transfer agency services for the Fund. ABIS may make payments to intermediaries that provide omnibus account services, sub accounting services and/or networking services. For the year ended September 30, 2018, the compensation retained by ABIS amounted to: Small Cap Core Portfolio, $260,686; International Small Cap Portfolio, $235,200; and International Strategic Equities Portfolio, $428,001.
| C. | Distribution Arrangements |
Under the Distribution Agreement between the Fund, on behalf of each Portfolio, and Sanford C. Bernstein & Co., LLC (the “Distributor”), the Distributor agrees to act as agent to sell shares of the Portfolios. The Distributor receives no fee for this service, and furthermore agrees to pay all expenses arising from the performance of its obligations under this agreement. The Distributor is a wholly owned subsidiary of the Adviser.
| D. | Investments in Affiliated Issuers |
The Portfolios may invest in AB Government Money Market Portfolio (the “Government Money Market Portfolio”) which has a contractual annual advisory fee rate of .20% of the portfolio’s average daily net assets and bears its own expenses. Effective August 1, 2018, the Adviser has contractually agreed to waive .10% of the advisory fee of Government Money Market Portfolio until August 31, 2019. In connection with the investment by the Portfolios in the Government Money Market Portfolio, the Adviser has contractually agreed to waive its advisory fee from the Portfolios in an amount equal to each Portfolios’ pro rata share of the effective advisory fee of Government Money Market Portfolio, as borne indirectly by the Portfolios as an acquired fund fee and expense. For the year ended September 30, 2018, such waivers amounted to:
| PORTFOLIO | AMOUNT | |||||||
| Small Cap Core |
$ | 4,228 | ||||||
| International Small Cap |
60,694 | |||||||
| International Strategic Equities |
172,663 | |||||||
A summary of the Portfolios’ transactions in shares of the Government Money Market Portfolio for the year ended September 30, 2018 is as follows:
| PORTFOLIO |
MARKET VALUE 9/30/17 (000) |
PURCHASES AT COST (000) |
SALES PROCEEDS (000) |
MARKET VALUE 9/30/18 (000) |
DIVIDEND INCOME (000) |
|||||||||||||||
| Small Cap Core |
$ | 5,090 | $ | 115,201 | $ | 115,002 | $ | 5,289 | $ | 36 | ||||||||||
| International Small Cap |
23,305 | 329,334 | 303,224 | 49,415 | 515 | |||||||||||||||
| International Strategic Equities |
81,234 | 1,354,362 | 1,376,794 | 58,802 | 1,305 | |||||||||||||||
Brokerage commissions paid on investment transactions and brokerage commissions paid to Sanford C. Bernstein & Co., LLC and Sanford C. Bernstein & Co., Ltd., affiliates of the Adviser, for the year ended September 30, 2018 were as follows:
| PORTFOLIO | TOTAL COMMISSIONS |
SANFORD C. BERNSTEIN & CO., LLC |
SANFORD C. BERNSTEIN & CO., LTD. |
|||||||||
| Small Cap Core |
$ | 833,507 | $ | 0 | $ | 0 | ||||||
| International Small Cap |
1,228,641 | 0 | 0 | |||||||||
| International Strategic Equities |
4,265,919 | 0 | 0 | |||||||||
| 52 | Bernstein Fund, Inc. |
| NOTE 3. | Investment Security Transactions |
| A. | Purchases and Sales |
For the year ended September 30, 2018, the Portfolios had purchases and sales transactions, excluding transactions in short-term instruments, as follows:
| PORTFOLIO |
PURCHASES EXCLUDING U.S. GOVERNMENT SECURITIES |
PURCHASES OF U.S. GOVERNMENT SECURITIES |
SALES EXCLUDING U.S. GOVERNMENT SECURITIES |
SALES OF U.S. GOVERNMENT SECURITIES |
||||||||||||
| Small Cap Core |
$ | 937,292,630 | $ | 0 | $ | 956,069,343 | $ | 0 | ||||||||
| International Small Cap |
1,162,890,226 | 0 | 968,595,822 | 0 | ||||||||||||
| International Strategic Equities |
3,600,533,701 | 0 | 2,551,506,305 | 0 | ||||||||||||
The cost of investments for federal income tax purposes, gross unrealized appreciation and unrealized depreciation are as follows:
| GROSS UNREALIZED | NET UNREALIZED APPRECIATION (DEPRECIATION) |
|||||||||||||||
| PORTFOLIO | COST | APPRECIATION | (DEPRECIATION) | |||||||||||||
| Small Cap Core |
$ | 829,443,893 | $ | 174,416,730 | $ | (32,043,114 | ) | $ | 142,373,616 | |||||||
| International Small Cap |
1,218,923,109 | 159,666,013 | (79,794,713 | ) | 79,871,300 | |||||||||||
| International Strategic Equities |
3,918,122,508 | 342,435,103 | (115,310,501 | ) | 227,124,602 | |||||||||||
| B. | Derivative Financial Instruments |
Each Portfolio may use derivatives in an effort to earn income and enhance returns, to replace more traditional direct investments, to obtain exposure to otherwise inaccessible markets (collectively, “investment purposes”), or to hedge or adjust the risk profile of its portfolio.
The principal types of derivatives utilized by the Portfolios, as well as the methods in which they may be used are:
| • | Futures |
Each Portfolio may buy or sell futures for investment purposes or for the purpose of hedging its portfolio against adverse effects of potential movements in the market. The Portfolios bear the market risk that arises from changes in the value of these instruments and the imperfect correlation between movements in the price of the futures and movements in the price of the assets, reference rates or indices which they are designed to track. Among other things, the Portfolios may purchase or sell futures for foreign currencies or options thereon for non-hedging purposes as a means of making direct investment in foreign currencies, as described below under “Currency Transactions”.
At the time a Portfolio enters into futures, a Portfolio deposits and maintains as collateral an initial margin with the broker, as required by the exchange on which the transaction is effected. Such amount is shown as cash collateral due from broker on the statement of assets and liabilities. Pursuant to the contract, the Portfolios agree to receive from or pay to the broker an amount of cash equal to the daily fluctuation in the value of the contract. Such receipts or payments are known as variation margin and are recorded by the Portfolios as unrealized gains or losses. Risks may arise from the potential inability of a counterparty to meet the terms of the contract. The credit/counterparty risk for exchange-traded futures is generally less than privately negotiated futures, since the clearinghouse, which is the issuer or counterparty to each exchange-traded future, has robust risk mitigation standards, including the requirement to provide initial and variation margin. When the contract is closed, the Portfolios record a realized gain or loss equal to the difference between the value of the contract at the time it was opened and the time it was closed.
Use of long futures subjects the Portfolios to risk of loss in excess of the amounts shown on the statement of assets and liabilities, up to the notional value of the futures. Use of short futures subjects the Portfolios to unlimited risk of loss. Each Portfolio may enter into futures only on exchanges or boards of trade. The exchange or board of trade acts as the counterparty to each futures transactions; therefore, the Portfolios’ credit risk is subject to failure of the exchange or board of trade. Under some circumstances, futures exchanges may establish daily limits on the amount that the price of futures can vary from the previous day’s settlement price, which could effectively prevent liquidation of unfavorable positions.
| 2018 Annual Report | 53 |
Notes to Financial Statements (continued)
During the year ended September 30, 2018, the Small Cap Core Portfolio held futures for non-hedging purposes and International Strategic Equities Portfolio held futures for hedging purposes.
| • | Forward Currency Exchange Contracts |
Each Portfolio may enter into forward currency exchange contracts on either a spot (i.e., cash) or forward basis. Spot contracts are entered into at the rate then prevailing in the currency-exchange market. Forward currency exchange contracts obligate the contracting parties to purchase or sell a specific currency at a specified future date at a specified price. The Portfolios will generally not enter into a forward currency exchange contract with a term greater than one year. The gain or loss arising from the difference between the original contract and the closing of such contract would be included in net realized gain or loss on foreign currency transactions. Fluctuations in the value of open forward currency exchange contracts are recorded for financial reporting purposes as unrealized appreciation and/or depreciation by the Portfolio. Risks may arise from the potential inability of a counterparty to meet the terms of a contract and from unanticipated movements in the value of a foreign currency relative to the U.S. dollar.
Forward currency exchange contracts used to protect the Portfolios from adverse currency movements involve the risk that the Adviser may not accurately predict currency movements. As a result, total return could be adversely affected. The Adviser may seek investment opportunities by taking long or short positions in currencies through the use of currency-related derivatives, including forward currency exchange contracts, futures and options on futures, swaps and other options. The Adviser may enter into foreign currency transactions for investment opportunities when it anticipates that a foreign currency will appreciate or depreciate in value.
Under certain circumstances, the Portfolios may commit a substantial portion or the entire value of the Portfolios to the consummation of these contracts. The Adviser will consider the effect that a substantial commitment of assets to forward currency exchange contracts would have on the investment program of the Portfolios and the flexibility of the Portfolios to purchase additional securities.
During the year ended September 30, 2018, the International Small Cap Portfolio and International Strategic Equities Portfolio held forward currency exchange contracts for hedging purposes.
A Portfolio typically enters into International Swaps and Derivatives Association, Inc. Master Agreements (“ISDA Master Agreement”) with its OTC derivative contract counterparties in order to, among other things, reduce its credit risk to OTC counterparties. ISDA Master Agreements include provisions for general obligations, representations, collateral and events of default or termination. Under an ISDA Master Agreement, a Portfolio typically may offset with the OTC counterparty certain derivative financial instruments’ payables and/or receivables with collateral held and/or posted and create one single net payment (close-out netting) in the event of default or termination. In the event of a default by an OTC counterparty, the return of collateral with market value in excess of a Portfolio’s net liability, held by the defaulting party, may be delayed or denied.
A Portfolio’s ISDA Master Agreements may contain provisions for early termination of OTC derivative transactions in the event the net assets of a Portfolio decline below specific levels (“net asset contingent features”). If these levels are triggered, a Portfolio’s OTC counterparty has the right to terminate such transaction and require the Portfolio to pay or receive a settlement amount in connection with the terminated transaction. If OTC derivatives were held at period end, please refer to netting arrangements by the OTC counterparty tables below for additional details.
During the year ended September 30, 2018, the Portfolios had entered into the following derivatives:
| SMALL CAP CORE PORTFOLIO | ASSET DERIVATIVES | LIABILITY DERIVATIVES | ||||||||||
| DERIVATIVE TYPE | STATEMENT OF
ASSETS LOCATION |
FAIR VALUE | STATEMENT OF
ASSETS AND LIABILITIES LOCATION |
FAIR VALUE | ||||||||
| Equity contracts |
Receivable/Payable for variation margin on futures |
$ | 102,702 | * | ||||||||
| Total |
$ | 102,702 | ||||||||||
| * | Only variation margin receivable/payable at period end is reported within the statement of assets and liabilities. This amount reflects cumulative unrealized appreciation/(depreciation) on futures and centrally cleared swaps as reported in the schedule of investments. |
| 54 | Bernstein Fund, Inc. |
| DERIVATIVE TYPE |
LOCATION OF GAIN OR (LOSS)
ON STATEMENT OF OPERATIONS |
REALIZED GAIN OR (LOSS) ON DERIVATIVES |
CHANGE IN UNREALIZED APPRECIATION OR (DEPRECIATION) |
|||||||
| Equity contracts |
Net realized gain (loss) on futures; Net change in unrealized appreciation/depreciation of futures |
$ | 3,271,459 | $ | (1,003,030 | ) | ||||
| Total |
$ | 3,271,459 | $ | (1,003,030 | ) | |||||
| INTERNATIONAL SMALL CAP PORTFOLIO |
ASSET DERIVATIVES | LIABILITY DERIVATIVES | ||||||||||
| DERIVATIVE TYPE |
STATEMENT OF ASSETS AND LIABILITIES LOCATION |
FAIR VALUE | STATEMENT OF ASSETS AND LIABILITIES LOCATION |
FAIR VALUE | ||||||||
| Foreign currency contracts |
Unrealized appreciation on forward currency exchange contracts |
$ | 422,741 | Unrealized depreciation on forward currency exchange contracts |
$ | 2,796,194 | ||||||
| Total |
$ | 422,741 | $ | 2,796,194 | ||||||||
| DERIVATIVE TYPE |
LOCATION OF GAIN OR (LOSS) ON DERIVATIVES WITHIN STATEMENT OF OPERATIONS |
REALIZED GAIN OR (LOSS) ON DERIVATIVES |
CHANGE IN UNREALIZED APPRECIATION OR (DEPRECIATION) |
|||||||
| Foreign exchange contracts |
Net realized gain (loss) on forward currency exchange contracts; Net change in unrealized appreciation/depreciation of forward currency exchange contracts |
$ | (3,622,617 | ) | $ | (3,219,413 | ) | |||
| Total |
$ | (3,622,617 | ) | $ | (3,219,413 | ) | ||||
| INTERNATIONAL STRATEGIC EQUITIES PORTFOLIO |
ASSET DERIVATIVES | LIABILITY DERIVATIVES | ||||||||||
| DERIVATIVE TYPE |
STATEMENT OF ASSETS LOCATION |
FAIR VALUE | STATEMENT OF
ASSETS AND LIABILITIES LOCATION |
FAIR VALUE | ||||||||
| Foreign currency contracts |
Unrealized appreciation on forward currency exchange contracts |
$ | 18,298,900 | Unrealized depreciation on forward currency exchange contracts |
$ | 8,829,054 | ||||||
| Total |
$ | 18,298,900 | $ | 8,829,054 | ||||||||
| DERIVATIVE TYPE |
LOCATION OF GAIN OR (LOSS)
ON STATEMENT OF OPERATIONS |
REALIZED GAIN OR (LOSS) ON DERIVATIVES |
CHANGE IN UNREALIZED APPRECIATION OR (DEPRECIATION) |
|||||||
| Equity contracts |
Net realized gain (loss) on futures; Net change in unrealized appreciation/depreciation of futures |
$ | (93,716 | ) | $ | 0 | ||||
| Foreign currency contracts |
Net realized gain (loss) on forward currency exchange contracts; Net change in unrealized appreciation/depreciation of forward currency exchange contracts |
(5,779,442 | ) | 7,383,701 | ||||||
| Total |
$ | (5,873,158 | ) | $ | 7,383,701 | |||||
| 2018 Annual Report | 55 |
Notes to Financial Statements (continued)
The following tables represent the average monthly volume of the Portfolios’ derivative transactions during the year ended September 30, 2018:
| SMALL CAP CORE PORTFOLIO | ||||
| Futures: |
||||
| Average original value of buy contracts |
$ | 18,564,632 | ||
| INTERNATIONAL SMALL CAP PORTFOLIO | ||||
| Forward Currency Exchange Contracts: |
||||
| Average principal amount of buy contracts |
$ | 182,197,110 | ||
| Average principal amount of sale contracts |
$ | 155,193,079 | ||
| INTERNATIONAL STRATEGIC EQUITIES PORTFOLIO | ||||
| Futures: |
||||
| Average original value of buy contracts |
$ | 48,568,898 | (a) | |
| Forward Currency Exchange Contracts: |
||||
| Average principal amount of buy contracts |
$ | 1,004,124,396 | ||
| Average principal amount of sale contracts |
$ | 980,374,462 | ||
| (a) | Positions were open for eight months during the year. |
For financial reporting purposes, the Portfolios do not offset derivative assets and derivative liabilities that are subject to netting arrangements in the statement of assets and liabilities.
All OTC derivatives held at period end were subject to netting arrangements. The following tables present the Portfolios’ derivative assets and liabilities by OTC counterparty net of amounts available for offset under ISDA Master Agreements (“MA”) and net of the related collateral received/pledged by the Portfolios as of September 30, 2018. Exchange-traded derivatives and centrally cleared swaps are not subject to netting arrangements and as such are excluded from the tables.
| INTERNATIONAL SMALL CAP PORTFOLIO | ||||||||||||||||||||
| COUNTERPARTY | DERIVATIVES ASSETS SUBJECT TO A MA |
DERIVATIVES AVAILABLE FOR OFFSET |
CASH COLLATERAL RECEIVED* |
SECURITY COLLATERAL RECEIVED* |
NET AMOUNT
OF DERIVATIVES ASSETS |
|||||||||||||||
| Barclays Bank PLC |
$ | 25,856 | $ | (25,856 | ) | $0 | $ | 0 | $ | 0 | ||||||||||
| Citibank, NA |
142,376 | (142,376 | ) | 0 | 0 | 0 | ||||||||||||||
| Credit Suisse International |
24,592 | (24,592 | ) | 0 | 0 | 0 | ||||||||||||||
| Natwest Markets PLC |
138,329 | (99,632 | ) | 0 | 0 | 38,697 | ||||||||||||||
| State Street Bank & Trust Co. |
91,588 | (91,588 | ) | 0 | 0 | 0 | ||||||||||||||
| Total |
$ | 422,741 | $ | (384,044 | ) | $0 | $ | 0 | $ | 38,697 | ^ | |||||||||
| COUNTERPARTY | DERIVATIVES LIABILITIES SUBJECT TO A MA |
DERIVATIVES AVAILABLE FOR OFFSET |
CASH COLLATERAL PLEDGED* |
SECURITY COLLATERAL PLEDGED* |
NET AMOUNT
OF DERIVATIVES LIABILITIES |
|||||||||||||||
| Bank of America, NA |
$ | 241,441 | $ | 0 | $ | 0 | $ | 0 | $ | 241,441 | ||||||||||
| Barclays Bank PLC |
768,089 | (25,856 | ) | (260,000 | ) | 0 | 482,233 | |||||||||||||
| Citibank, NA |
1,151,346 | (142,376 | ) | (878,000 | ) | 0 | 130,970 | |||||||||||||
| Credit Suisse International |
229,218 | (24,592 | ) | 0 | 0 | 204,626 | ||||||||||||||
| Natwest Markets PLC |
99,632 | (99,632 | ) | 0 | 0 | 0 | ||||||||||||||
| State Street Bank & Trust Co. |
306,468 | (91,588 | ) | 0 | 0 | 214,880 | ||||||||||||||
| Total |
$ | 2,796,194 | $ | (384,044 | ) | $ | (1,138,000 | ) | $ | 0 | $ | 1,274,150 | ^ | |||||||
| 56 | Bernstein Fund, Inc. |
| * | The actual collateral received/pledged may be more than the amount reported due to over-collateralization. |
| ^ | Net amount represents the net receivable/payable that would be due from/to the counterparty in the event of default or termination. The net amount from OTC financial derivative instruments can only be netted across transactions governed under the same master agreement with the same counterparty. |
| INTERNATIONAL STRATEGIC EQUITIES PORTFOLIO | ||||||||||||||||||||
| COUNTERPARTY | DERIVATIVES ASSETS SUBJECT TO A MA |
DERIVATIVES AVAILABLE FOR OFFSET |
CASH COLLATERAL RECEIVED* |
SECURITY COLLATERAL RECEIVED* |
NET AMOUNT
OF DERIVATIVES ASSETS |
|||||||||||||||
| Australia and New Zealand Banking Group Ltd. |
$ | 33,309 | $ | (33,309 | ) | $ | 0 | $ | 0 | $ | 0 | |||||||||
| Bank of America, NA |
4,996 | (4,996 | ) | 0 | 0 | 0 | ||||||||||||||
| Barclays Bank PLC |
5,437,042 | (1,086,225 | ) | 0 | 0 | 4,350,817 | ||||||||||||||
| Citibank, NA |
7,938,092 | (1,599,343 | ) | (3,773,000 | ) | 0 | 2,565,749 | |||||||||||||
| Morgan Stanley & Co., Inc. |
119,973 | (119,973 | ) | 0 | 0 | 0 | ||||||||||||||
| Nomura Global Financial Products, Inc. |
1,358,743 | (27,030 | ) | 0 | 0 | 1,331,713 | ||||||||||||||
| Societe Generale |
266,422 | (217,774 | ) | 0 | 0 | 48,648 | ||||||||||||||
| State Street Bank & Trust Co. |
1,598,052 | (1,598,052 | ) | 0 | 0 | 0 | ||||||||||||||
| UBS AG |
1,542,271 | (148,486 | ) | 0 | (397,586 | ) | 996,199 | |||||||||||||
| Total |
$ | 18,298,900 | $ | (4,835,188 | ) | $ | (3,773,000 | ) | $ | (397,586 | ) | $ | 9,293,126 | ^ | ||||||
| COUNTERPARTY | DERIVATIVES LIABILITIES SUBJECT TO A MA |
DERIVATIVES AVAILABLE FOR OFFSET |
CASH COLLATERAL PLEDGED* |
SECURITY COLLATERAL PLEDGED* |
NET AMOUNT
OF DERIVATIVES LIABILITIES |
|||||||||||||||
| Australia and New Zealand Banking Group Ltd. |
$ | 1,272,836 | $ | (33,309 | ) | $ | 0 | $ | 0 | $ | 1,239,527 | |||||||||
| Bank of America, NA |
471,850 | (4,996 | ) | 0 | 0 | 466,854 | ||||||||||||||
| Barclays Bank PLC |
1,086,225 | (1,086,225 | ) | 0 | 0 | 0 | ||||||||||||||
| Citibank, NA |
1,599,343 | (1,599,343 | ) | 0 | 0 | 0 | ||||||||||||||
| Morgan Stanley & Co., Inc. |
1,704,777 | (119,973 | ) | 0 | 0 | 1,584,804 | ||||||||||||||
| Natwest Markets PLC |
489,255 | 0 | 0 | 0 | 489,255 | |||||||||||||||
| Nomura Global Financial Products, Inc. |
27,030 | (27,030 | ) | 0 | 0 | 0 | ||||||||||||||
| Societe Generale |
217,774 | (217,774 | ) | 0 | 0 | 0 | ||||||||||||||
| State Street Bank & Trust Co. |
1,811,478 | (1,598,052 | ) | (213,426 | ) | 0 | 0 | |||||||||||||
| UBS AG |
148,486 | (148,486 | ) | 0 | 0 | 0 | ||||||||||||||
| Total |
$ | 8,829,054 | $ | (4,835,188 | ) | $ | (213,426 | ) | $ | 0 | $ | 3,780,440 | ^ | |||||||
| * | The actual collateral received/pledged may be more than the amount reported due to over-collateralization. |
| ^ | Net amount represents the net receivable/payable that would be due from/to the counterparty in the event of default or termination. The net amount from OTC financial derivative instruments can only be netted across transactions governed under the same master agreement with the same counterparty. |
| C. | Currency Transactions |
The Portfolios may invest in non-U.S. Dollar-denominated securities on a currency hedged or unhedged basis. The Portfolios may seek investment opportunities by taking long or short positions in currencies through the use of currency-related derivatives, including forward currency exchange contracts, futures and options on futures, swaps, and other
| 2018 Annual Report | 57 |
Notes to Financial Statements (continued)
options. The Portfolios may enter into transactions for investment opportunities when it anticipates that a foreign currency will appreciate or depreciate in value but securities denominated in that currency are not held by the Portfolios and do not present attractive investment opportunities. Such transactions may also be used when the Adviser believes that it may be more efficient than a direct investment in a foreign currency-denominated security. The Portfolios may also conduct currency exchange contracts on a spot basis (i.e., for cash at the spot rate prevailing in the currency exchange market for buying or selling currencies).
| NOTE 4. | Distributions to Shareholders |
The tax character of distributions paid during the fiscal years ended September 30, 2018 and September 30, 2017 were as follows:
| PORTFOLIO | 2018 | 2017 | ||||||
| Small Cap Core |
||||||||
| Distributions paid from: |
||||||||
| Ordinary income |
$ | 43,711,826 | $ | 2,070,664 | ||||
| Long-term capital gains |
9,503,468 | 0 | ||||||
|
|
|
|
|
|||||
| Total distributions paid |
$ | 53,215,294 | $ | 2,070,664 | ||||
|
|
|
|
|
|||||
| International Small Cap |
||||||||
| Distributions paid from: |
||||||||
| Ordinary income |
$ | 26,750,515 | $ | 17,002,892 | ||||
| Long-term capital gains |
15,003,353 | 0 | ||||||
|
|
|
|
|
|||||
| Total distributions paid |
$ | 41,753,868 | $ | 17,002,892 | ||||
|
|
|
|
|
|||||
| International Strategic Equities |
||||||||
| Distributions paid from: |
||||||||
| Ordinary income |
$ | 45,938,248 | $ | 18,490,651 | ||||
| Long-term capital gains |
51,103,476 | 2,484,063 | ||||||
|
|
|
|
|
|||||
| Total distributions paid |
$ | 97,041,724 | $ | 20,974,714 | ||||
|
|
|
|
|
|||||
As of September 30, 2018, the components of accumulated earnings/(deficit) on a tax basis were as follows:
| PORTFOLIO | UNDISTRIBUTED ORDINARY INCOME |
UNDISTRIBUTED LONG-TERM |
ACCUMULATED CAPITAL AND OTHER LOSSES |
UNREALIZED APPRECIATION/ |
TOTAL ACCUMULATED EARNINGS/ (DEFICIT) |
|||||||||||||||
| Small Cap Core |
$ | 13,887,914 | $ | 53,513,672 | $ | 0 | $ | 142,373,616 | $ | 209,775,202 | ||||||||||
| International Small Cap |
33,264,087 | 75,014,795 | 0 | 79,879,828 | 188,158,710 | |||||||||||||||
| International Strategic Equities |
71,121,269 | 44,105,765 | 0 | 226,944,696 | 342,171,730 | |||||||||||||||
| (a) | The differences between book-basis and tax-basis unrealized appreciation/(depreciation) are attributable primarily to the tax treatment of the tax deferral of losses on wash sales, the tax treatment of passive foreign investment companies (PFICs), and the realization for tax purposes of gains/losses on certain derivative instruments. |
For tax purposes, net realized capital losses may be carried over to offset future capital gains, if any. Portfolios are permitted to carry forward capital losses incurred in taxable years beginning after December 22, 2010 for an indefinite period, and such losses will retain their character as either short-term or long-term capital losses. As of September 30, 2018, all three Portfolios did not have any capital loss carryforwards.
| 58 | Bernstein Fund, Inc. |
| NOTE 5. | Risks Involved in Investing in the Portfolios |
Foreign (Non-U.S.) Securities Risk—Investments in foreign securities entail significant risks in addition to those customarily associated with investing in U.S. securities. These risks include risks related to adverse market, economic, political, regulatory factors and social instability, all of which could disrupt the financial markets in which the Portfolios invest and adversely affect the value of the Portfolios’ assets.
Country Concentration Risk—The Portfolios may not always be diversified among countries or regions and the effect on the share price of the Portfolios of specific risks such as political, regulatory and currency may be magnified due to concentration of the Portfolios’ investments in a particular country or region.
Sector Risk—The Portfolios may have more risk because of concentrated investments in a particular market sector, such as the technology or financial services sector. Market or economic factors affecting that sector could have a major effect on the value of the Portfolios’ investments.
Emerging Markets Securities Risk—The risks of investing in foreign (non-U.S.) securities are heightened with respect to issuers in emerging-market countries because the markets are less developed and less liquid and there may be a greater amount of economic, political and social uncertainty, and these risks are even more pronounced in “frontier” markets, which are investable markets with lower total market capitalization and liquidity than the more developed emerging markets. In addition, the value of the Portfolios’ investments may decline because of factors such as unfavorable or unsuccessful government actions and reduction of government or central bank support.
Foreign Currency Risk—This is the risk that changes in foreign (non-U.S.) currency exchange rates may negatively affect the value of the Portfolios’ investments or reduce the returns of the Portfolios. For example, the value of the Portfolios’ investments in foreign securities and foreign currency positions may decrease if the U.S. Dollar is strong (i.e., gaining value relative to other currencies) and other currencies are weak (i.e., losing value relative to the U.S. Dollar).
Actions by a Few Major Investors—In certain countries, volatility may be heightened by actions of a few major investors. For example, substantial increases or decreases in cash flows of mutual funds investing in these markets could significantly affect local stock prices and, therefore, share prices of the Portfolios.
Liquidity Risk—Liquidity risk exists when particular investments are difficult to purchase or sell, possibly preventing the Portfolios from selling out of these illiquid securities at an advantageous price. Illiquid securities may also be difficult to value. Derivatives and securities involving substantial market and credit risk tend to involve greater liquidity risk.
Redemption Risk—The Portfolios may experience heavy redemptions that could cause the Portfolios to liquidate their assets at inopportune times or at a loss or depressed value, which could cause the value of your investment to decline. Redemption risk is heightened during periods of overall market turmoil.
Market Risk—The Portfolios are subject to market risk, which is the risk that stock prices in general may decline over short or extended periods. Stock prices may decline in response to adverse changes in the economy or the economic outlook; deterioration in investor sentiment; interest rate, currency and commodity price fluctuations; adverse geopolitical, social or environmental developments; issuer- and sector-specific considerations; and other factors. In the past decade, financial markets in the United States, Europe and elsewhere have experienced increased volatility, decreased liquidity and heightened uncertainty. These market conditions may recur from time to time and have an adverse impact on various securities markets. The U.S. Government and the Federal Reserve, as well as certain foreign governments and central banks, have taken steps to support financial markets. Other governments have tried to support markets by buying stocks and through other market interventions. Government intervention may not work as intended, particularly if the efforts are perceived by investors as being unlikely to achieve the desired results. The Federal Reserve has reduced its market support activities and has begun raising interest rates. Further Federal Reserve or other U.S. or non-U.S. governmental or central bank actions, including interest rate increases or decreases, could negatively affect financial markets generally, increase market volatility and reduce the value and liquidity of securities in which the Portfolios invest.
Current political uncertainty surrounding the European Union (“EU”) and its membership may increase market volatility. The United Kingdom has voted to withdraw from the EU, and one or more other countries may withdraw from the EU and/or abandon the Euro, the common currency of the EU. The financial instability of some countries in the EU, together with the risk of that financial instability impacting other more stable countries, may increase the risk of investing in
| 2018 Annual Report | 59 |
Notes to Financial Statements (continued)
companies in Europe and worldwide. In addition, policy and legislative changes in the United States and in other countries are affecting many aspects of financial regulation, and may in some instances contribute to decreased liquidity and increased volatility in the financial markets. The impact of these changes, and the practical implications for market participants, may not be fully known for some time.
Economies and financial markets throughout the world are becoming increasingly interconnected. Economic, financial or political events, trading and tariff arrangements, terrorism, natural disasters and other circumstances in one country or region could have profound impacts on global economies or markets. As a result, whether or not the Portfolios invest in securities of issuers located in or with significant exposure to countries experiencing economic and financial difficulties, the value and liquidity of the Portfolios’ investments may be negatively affected.
Capitalization Risk—Investments in small- and mid-capitalization companies may be more volatile than investments in large-cap companies. Investments in small-cap companies may have additional risks because these companies have limited product lines, markets or financial resources.
Allocation Risk—The Portfolios may seek to focus on different investment disciplines or factors at different times as a means to achieve their investment objectives. In the event that the investment disciplines or factors to which the Portfolios have greater exposure perform worse than the investment disciplines or factors with less exposure, the Portfolios’ returns may be negatively affected.
Derivatives Risk—The Portfolios may use derivatives in currency hedging as well as for direct investments to gain access to certain markets, earn income, enhance return and broaden portfolio diversification, which entail greater risk than if used solely for hedging purposes. In addition to other risks such as the credit risk of the counterparty, derivatives involve the risk that changes in the value of the derivative may not correlate with relevant assets, rates or indices. Derivatives may be illiquid and difficult to price or unwind, and small changes may produce disproportionate losses for the Portfolios. Certain derivatives have the potential for unlimited loss, regardless of the size of the initial investment. Assets required to be set aside or posted to cover or secure derivatives positions may themselves go down in value, and these collateral and other requirements may limit investment flexibility. Some derivatives involve leverage, which can make the Portfolios more volatile and can compound other risks. The U.S. government and foreign governments are in the process of adopting and implementing regulations governing derivatives markets, including mandatory clearing of certain derivatives, margin, reporting and registration requirements. The ultimate impact of the regulations remains unclear. Additional regulation may make derivatives more costly, limit their availability or utility, otherwise adversely affect their performance, or disrupt markets.
Management Risk—The Portfolios are subject to management risk because they are actively managed investment portfolios. The Adviser will apply its investment techniques and risk analyses in making investment decisions for the Portfolios, but these techniques, analyses and decisions may not work as intended or may not produce the desired results. In some cases, derivatives and other investment techniques may be unavailable or the Adviser may determine not to use them, possibly even under market conditions where their use could benefit the Portfolios. In addition, the Adviser may change the Portfolios’ investment strategies or policies from time to time. Those changes may not lead to the results intended by the Adviser and could have an adverse effect on the value or performance of the Portfolios.
REIT Risk—Investing in REITs involves certain unique risks in addition to those risks associated with investing in the real estate industry in general. Equity REITs may be affected by changes in the value of the underlying property owned by the REITs, while mortgage REITs may be affected by the quality of any credit extended. REITs are dependent upon management skills, are not diversified, and are subject to heavy cash flow dependency, default by borrowers and self-liquidation. Investing in REITs also involves risks similar to those associated with investing in small-capitalization companies. REITs may have limited financial resources, may trade less frequently and in a limited volume and may be subject to more abrupt or erratic price movements than larger company securities.
Investment in Other Investment Companies Risk—As with other investments, investments in other investment companies, including other registered funds advised by the Adviser and ETFs, are subject to market and selection risk. In addition, if the Portfolios acquire shares of investment companies, shareholders bear both their proportionate share of expenses in the Portfolios (including management and advisory fees) and, indirectly, the expenses of the investment companies.
| 60 | Bernstein Fund, Inc. |
Cybersecurity Risk—Cybersecurity incidents may allow an unauthorized party to gain access to Portfolio assets, customer data (including private shareholder information), or proprietary information, or cause the Portfolios, the Adviser, and/or its service providers (including, but not limited to, fund accountants, custodians, sub-custodians, transfer agents and financial intermediaries) to suffer data breaches, data corruption or lose operational functionality.
Indemnification Risk—In the ordinary course of business, the Portfolios enter into contracts that contain a variety of indemnifications. The Portfolios’ maximum exposure under these arrangements is unknown. However, the Portfolios have not had prior claims or losses pursuant to these indemnification provisions and expect the risk of loss thereunder to be remote. Therefore, the Portfolios have not accrued any liability in connection with these indemnification provisions.
| NOTE 6. | Capital-Share Transactions |
The Fund has authorized 27 billion shares of common stock, par value $0.0001 per share. Each SCB Class, Advisor Class and Class Z of the Portfolios is allocated 1 billion shares. The balance of the authorized shares have been allocated to share classes that are currently not offered.
Share transactions for each Portfolio for the years ended September 30, 2018 and September 30, 2017, were as follows:
| SMALL CAP CORE PORTFOLIO | ||||||||||||||||||||
| SHARES | AMOUNT | |||||||||||||||||||
| YEAR ENDED 9/30/18 |
YEAR ENDED 9/30/17 |
YEAR ENDED 9/30/18 |
YEAR ENDED 9/30/17 |
|||||||||||||||||
| SCB Class Shares |
| |||||||||||||||||||
| Shares sold |
126,863 | 470,811 | $ | 1,538,717 | $ | 5,411,903 | ||||||||||||||
| Shares issued to shareholders on reinvestment of dividends and distributions |
49,711 | 497 | 582,617 | 5,911 | ||||||||||||||||
| Shares redeemed |
(177,518 | ) | (91,837 | ) | (2,188,869 | ) | (1,058,048 | ) | ||||||||||||
|
|
|
|
|
|
|
|
|
|||||||||||||
| Net increase (decrease) |
(944 | ) | 379,471 | $ | (67,535 | ) | $ | 4,359,766 | ||||||||||||
|
|
|
|
|
|
|
|
|
|||||||||||||
| Advisor Class Shares |
| |||||||||||||||||||
| Shares sold |
7,576,048 | 7,825,561 | $ | 93,744,852 | $ | 90,029,115 | ||||||||||||||
| Shares issued to shareholders on reinvestment of dividends and distributions |
3,416,907 | 108,173 | 40,114,486 | 1,287,265 | ||||||||||||||||
| Shares redeemed |
(9,814,913 | ) | (8,287,958 | ) | (121,124,528 | ) | (95,775,891 | ) | ||||||||||||
|
|
|
|
|
|
|
|
|
|||||||||||||
| Net increase (decrease) |
1,178,042 | (354,224 | ) | $ | 12,734,810 | $ | (4,459,511 | ) | ||||||||||||
|
|
|
|
|
|
|
|
|
|||||||||||||
| Class Z Shares |
| |||||||||||||||||||
| Shares sold |
1,342,318 | 4,183,658 | $ | 16,508,642 | $ | 49,228,411 | ||||||||||||||
| Shares issued to shareholders on reinvestment of dividends and distributions |
932,469 | 32,786 | 10,937,864 | 390,159 | ||||||||||||||||
| Shares redeemed |
(580,101 | ) | (1,573,475 | ) | (6,991,704 | ) | (18,546,194 | ) | ||||||||||||
|
|
|
|
|
|
|
|
|
|||||||||||||
| Net increase |
1,694,686 | 2,642,969 | $ | 20,454,802 | $ | 31,072,376 | ||||||||||||||
|
|
|
|
|
|
|
|
|
|||||||||||||
| 2018 Annual Report | 61 |
Notes to Financial Statements (continued)
| INTERNATIONAL SMALL CAP PORTFOLIO | ||||||||||||||||||||
| SHARES | AMOUNT | |||||||||||||||||||
| YEAR ENDED 9/30/18 |
YEAR ENDED 9/30/17 |
YEAR ENDED 9/30/18 |
YEAR ENDED 9/30/17 |
|||||||||||||||||
| SCB Class Shares |
| |||||||||||||||||||
| Shares sold |
737,715 | 2,749,565 | $ | 9,546,259 | $ | 30,237,045 | ||||||||||||||
| Shares issued to shareholders on reinvestment of dividends and distributions |
207,896 | 90,510 | 2,579,987 | 918,683 | ||||||||||||||||
| Shares redeemed |
(950,701 | ) | (458,054 | ) | (12,268,574 | ) | (5,326,496 | ) | ||||||||||||
|
|
|
|
|
|
|
|
|
|||||||||||||
| Net increase (decrease) |
(5,090 | ) | 2,382,021 | $ | (142,328 | ) | $ | 25,829,232 | ||||||||||||
|
|
|
|
|
|
|
|
|
|||||||||||||
| Advisor Class Shares |
| |||||||||||||||||||
| Shares sold |
20,358,948 | 18,529,910 | $ | 262,216,436 | $ | 208,924,146 | ||||||||||||||
| Shares issued to shareholders on reinvestment of dividends and distributions |
1,813,014 | 854,715 | 22,517,644 | 8,675,357 | ||||||||||||||||
| Shares redeemed |
(4,807,168 | ) | (5,198,655 | ) | (62,164,075 | ) | (59,299,709 | ) | ||||||||||||
|
|
|
|
|
|
|
|
|
|||||||||||||
| Net increase |
17,364,794 | 14,185,970 | $ | 222,570,005 | $ | 158,299,794 | ||||||||||||||
|
|
|
|
|
|
|
|
|
|||||||||||||
| Class Z Shares |
| |||||||||||||||||||
| Shares sold |
2,987,880 | 11,222,032 | $ | 37,941,000 | $ | 134,086,229 | ||||||||||||||
| Shares issued to shareholders on reinvestment of dividends and distributions |
1,201,868 | 627,252 | 14,927,196 | 6,366,603 | ||||||||||||||||
| Shares redeemed |
(588,230 | ) | (4,286,011 | ) | (7,760,993 | ) | (52,179,420 | ) | ||||||||||||
|
|
|
|
|
|
|
|
|
|||||||||||||
| Net increase |
3,601,518 | 7,563,273 | $ | 45,107,203 | $ | 88,273,412 | ||||||||||||||
|
|
|
|
|
|
|
|
|
|||||||||||||
| INTERNATIONAL STRATEGIC EQUITIES PORTFOLIO | ||||||||||||||||||||
| SHARES | AMOUNT | |||||||||||||||||||
| YEAR ENDED 9/30/18 |
YEAR ENDED 9/30/17 |
YEAR ENDED 9/30/18 |
YEAR ENDED 9/30/17 |
|||||||||||||||||
| SCB Class Shares |
| |||||||||||||||||||
| Shares sold |
3,981,702 | 6,259,282 | $ | 51,671,126 | $ | 70,571,599 | ||||||||||||||
| Shares issued to shareholders on reinvestment of dividends and distributions |
344,818 | 106,631 | 4,341,257 | 1,099,369 | ||||||||||||||||
| Shares redeemed |
(1,783,569 | ) | (855,882 | ) | (23,081,364 | ) | (9,910,861 | ) | ||||||||||||
|
|
|
|
|
|
|
|
|
|||||||||||||
| Net increase |
2,542,951 | 5,510,031 | $ | 32,931,019 | $ | 61,760,107 | ||||||||||||||
|
|
|
|
|
|
|
|
|
|||||||||||||
| 62 | Bernstein Fund, Inc. |
| INTERNATIONAL STRATEGIC EQUITIES PORTFOLIO | ||||||||||||||||||||
| SHARES | AMOUNT | |||||||||||||||||||
| YEAR ENDED 9/30/18 |
YEAR ENDED 9/30/17 |
YEAR ENDED 9/30/18 |
YEAR ENDED 9/30/17 |
|||||||||||||||||
| Advisor Class Shares |
| |||||||||||||||||||
| Shares sold |
76,216,135 | 78,248,043 | $ | 986,549,066 | $ | 933,571,440 | ||||||||||||||
| Shares issued to shareholders on reinvestment of dividends and distributions |
4,121,463 | 1,072,119 | 51,930,438 | 11,053,548 | ||||||||||||||||
| Shares redeemed |
(13,250,418 | ) | (10,643,383 | ) | (171,145,141 | ) | (121,214,577 | ) | ||||||||||||
|
|
|
|
|
|
|
|
|
|||||||||||||
| Net increase |
67,087,180 | 68,676,779 | $ | 867,334,363 | $ | 823,410,411 | ||||||||||||||
|
|
|
|
|
|
|
|
|
|||||||||||||
| Class Z Shares |
| |||||||||||||||||||
| Shares sold |
12,152,892 | 60,643,893 | $ | 155,181,066 | $ | 748,087,276 | ||||||||||||||
| Shares issued to shareholders on reinvestment of dividends and distributions |
2,970,119 | 671,593 | 37,482,903 | 6,937,549 | ||||||||||||||||
| Shares redeemed |
(1,810,090 | ) | (882,266 | ) | (23,856,897 | ) | (11,059,956 | ) | ||||||||||||
|
|
|
|
|
|
|
|
|
|||||||||||||
| Net increase |
13,312,921 | 60,433,220 | $ | 168,807,072 | $ | 743,964,869 | ||||||||||||||
|
|
|
|
|
|
|
|
|
|||||||||||||
At September 30, 2018, certain AllianceBerstein mutual funds owned 16%, 24% and 24% of Small Cap Core Portfolio, International Small Cap Portfolio and International Strategic Equities Portfolio, respectively, in aggregate of the Portfolios’ outstanding shares. Significant transactions by such shareholders, if any, may impact the Portfolios’ performance.
| NOTE 7. | Recent Accounting Pronouncements |
In August 2018, the Financial Accounting Standards Board issued an Accounting Standards Update, ASU 2018-13, Fair Value Measurement (Topic 820), Disclosure Framework Changes to the Disclosure Requirements for Fair Value Measurement which removes, modifies and adds disclosures to Topic 820. The amendments in this ASU 2018-13 apply to all entities that are required, under existing U.S. GAAP, to make disclosures about recurring or nonrecurring fair value measurements. The amendments in this ASU 2018-13 are effective for all entities for fiscal years, and interim periods within those fiscal years, beginning after December 15, 2019. At this time, management is evaluating the implications of these changes on the financial statements.
In October 2018, the U.S. Securities and Exchange Commission adopted amendments to certain disclosure requirements included in Regulation S-X that had become “redundant, duplicative, overlapping, outdated or superseded, in light of the other Commission disclosure requirements, GAAP or changes in the information environment.” The compliance date for the amendments to Regulation S-X was November 5, 2018 (for reporting period end dates of September 30, 2018 or after). Management has evaluated the impact of the amendments and determined the effect of the adoption of the rules will simplify certain disclosure requirements on the financial statements.
| NOTE 8. | Subsequent Events |
Management has evaluated subsequent events for possible recognition or disclosure in the financial statements through the date the financial statements are issued. Management has determined that there are no material events that would require disclosure in the Portfolios’ financial statements through this date.
| 2018 Annual Report | 63 |
Report of Independent Registered Public Accounting Firm
To the Board of Directors of Bernstein Fund, Inc. and Shareholders of Small Cap Core Portfolio, International Small Cap Portfolio and International Strategic Equities Portfolio
Opinions on the Financial Statements
We have audited the accompanying statements of assets and liabilities, including the schedules of investments, of Small Cap Core Portfolio, International Small Cap Portfolio and International Strategic Equities Portfolio (constituting Bernstein Fund, Inc., hereafter collectively referred to as the “Funds”) as of September 30, 2018, the related statements of operations for the year ended September 30, 2018, the statements of changes in net assets for each of the two years in the period ended September 30, 2018, including the related notes, and the financial highlights for each of the periods indicated therein (collectively referred to as the “financial statements”). In our opinion, the financial statements present fairly, in all material respects, the financial position of each of the Funds as of September 30, 2018, the results of each of their operations for the year then ended, the changes in each of their net assets for each of the two years in the period ended September 30, 2018 and each of the financial highlights for each of the periods indicated therein in conformity with accounting principles generally accepted in the United States of America.
Basis for Opinions
These financial statements are the responsibility of the Funds’ management. Our responsibility is to express an opinion on the Funds’ financial statements based on our audits. We are a public accounting firm registered with the Public Company Accounting Oversight Board (United States) (“PCAOB”) and are required to be independent with respect to the Funds in accordance with the U.S. federal securities laws and the applicable rules and regulations of the Securities and Exchange Commission and the PCAOB.
We conducted our audits of these financial statements in accordance with the standards of the PCAOB. Those standards require that we plan and perform the audit to obtain reasonable assurance about whether the financial statements are free of material misstatement, whether due to error or fraud.
Our audits included performing procedures to assess the risks of material misstatement of the financial statements, whether due to error or fraud, and performing procedures that respond to those risks. Such procedures included examining, on a test basis, evidence regarding the amounts and disclosures in the financial statements. Our audits also included evaluating the accounting principles used and significant estimates made by management, as well as evaluating the overall presentation of the financial statements. Our procedures included confirmation of securities owned as of September 30, 2018 by correspondence with the custodian, transfer agent and brokers; when replies were not received from brokers, we performed other auditing procedures. We believe that our audits provide a reasonable basis for our opinions.
PricewaterhouseCoopers LLP
New York, New York
November 28, 2018
We have served as the auditor of one or more the investment companies in the AB Group of Mutual Funds since at least 1985. We have not been able to determine the specific year we began serving as auditor.
| 64 | Bernstein Fund, Inc. |
2018 Federal Tax Information (Unaudited)
For Federal income tax purposes, the following information is furnished with respect to the distributions paid by each applicable Portfolio during the taxable year ended September 30, 2018. For corporate shareholders, the following percentages of dividends paid by each Portfolio qualify for the dividends received deduction.
| PORTFOLIO |
DIVIDENDS RECEIVED DEDUCTION % |
|||||||
| Small Cap Core |
18.52 | % | ||||||
For the taxable year ended September 30, 2018, each Portfolio designates the following amounts as the maximum amount that may be considered qualified dividend income for individual shareholders.
| PORTFOLIO | QUALIFIED DIVIDEND INCOME |
|||||||
| Small Cap Core |
$ | 6,798,934 | ||||||
| International Small Cap |
11,836,842 | |||||||
| International Strategic Equities |
33,957,464 | |||||||
Shareholders should not use the above information to prepare their income tax returns. The information necessary to complete your income tax returns will be included with your Form 1099-DIV which will be sent to you separately in January 2019.
| 2018 Annual Report | 65 |
Bernstein Fund, Inc.
BOARD OF DIRECTORS
Debra Perry(1)(3)
Chair
Kathleen Fisher
President
Bart Friedman(1)
Director
R. Jay Gerken(1)
Director
William Kristol(1)
Director
Donald K. Peterson(1)
Director
OFFICERS
Andrew Birse(2),
Vice President
Peter Chocian(2),
Vice President
Serdar Kalaycioglu(2),
Vice President
Samantha Lau(2),
Vice President
Stuart Rae(2),
Vice President
Shri Singhvi(2),
Vice President
Sammy Suzuki(2),
Vice President
Nelson Yu(2),
Vice President
Joseph J. Mantineo,
Treasurer and Chief Financial Officer
Emilie D. Wrapp,
Secretary
Michael B. Reyes,
Senior Analyst
Phyllis J. Clarke,
Controller
Vincent S. Noto,
Chief Compliance Officer
CUSTODIAN AND ACCOUNTING AGENT
State Street Bank and Trust Company
State Street Corporation CCB/5
1 Iron Street
Boston, MA 02210
PRINCIPAL UNDERWRITER
AllianceBernstein Investments, Inc.
1345 Avenue of the Americas
New York, NY 10105
TRANSFER AGENT
AllianceBernstein Investor Services, Inc.
P.O. Box 786003
San Antonio, TX 78278-6003
Toll-Free (800) 221-5672
INDEPENDENT REGISTERED PUBLIC ACCOUNTING FIRM
PricewaterhouseCoopers LLP
300 Madison Avenue
New York, NY 10017
LEGAL COUNSEL
Willkie Farr & Gallagher LLP
787 Seventh Avenue
New York, NY 10019-6099
(1) Member of the Audit Committee, the Governance, Nominating and Compensation Committee, and the Independent Directors Committee.
(2) The day-to-day management of, and investment decisions for, the Portfolios are made by the senior management teams. Messrs. Rae and Suzuki are the investment professionals with the most significant responsibility for the day-to-day management of the International Strategic Equities Portfolio. Messrs. Birse, Chocian and Yu are the investment professionals with the most significant responsibility for the day-to-day management of the International Small Cap Portfolio. Ms. Lau and Messrs. Kalaycioglu and Singhvi are the investment professionals with the most significant responsibility for the day-to-day management of the Small Cap Core Portfolio.
(3) Member of the Special Pricing Committee.
| 66 | Bernstein Fund, Inc. |
| DIRECTORS’ INFORMATION |
|
|||||||
| Name,
Address+, Age, (Year of Election*) |
Principal Occupation(s) During Past Five (5) Years and Other Information |
Portfolios in Fund Complex Overseen By Director |
Other Directorships Currently Held by Director | |||||
| INTERESTED DIRECTOR |
||||||||
| Kathleen Fisher,** c/o AllianceBernstein L.P. 1345 Avenue of the Americas New York, NY 10105 64 (2017) |
Senior Vice President of the Manager with which she has been associated since prior to 2013. She is the Head of Wealth and Investment Strategies of the Manager’s Bernstein Private Wealth Management unit since 2014, leading the team responsible for developing and communicating asset allocation advice and investment strategies for Bernstein’s high-net-worth clients. Since 2013, Ms. Fisher has overseen research on investment planning and wealth transfer issues facing high-net-worth families, endowments and foundations. She has been a National Managing Director of Bernstein since 2009. She joined AB in 2001 as a Senior Portfolio Manager. Prior to joining AB, she spent 15 years at J.P. Morgan, most recently as a managing director advising banks on acquisitions, divestitures and financing techniques. Prior thereto, she held positions at both Morgan Stanley and at the Federal Reserve Bank of New York. | 18 | Southwestern Vermont Health Care; and Hildene—The Lincoln Family Home | |||||
| DISINTERESTED DIRECTORS |
||||||||
| Debra Perry,#^ Chair of the Board 67 (2011) |
Formerly, Senior Managing Director of Global Ratings and Research, Moody’s Investors Service, Inc. from 2001 to 2004; Chief Administrative Officer, Moody’s, from 1999 to 2001; Chief Credit Officer, Moody’s, from 2000 to 2001; Group Managing Director for the Finance, Securities and Insurance Ratings Groups, Moody’s Corp., from 1996 to 1999; Earlier she held executive positions with First Boston Corporation and Chemical Bank. | 18 | Assurant, Inc., since 2017; Genworth Financial, Inc. since 2016; Korn/Ferry International from 2008-present; PartnerRe, from 2013-2016; Bank of America Funds Series Trust, from 2011-2016 | |||||
| Bart Friedman,# 73 (2005) |
Senior Counsel at Cahill Gordon & Reindel LLP (law firm) since January 2017; Senior Partner since prior to 2013. |
18 | Chair of the Audit Committee of The Brookings Institution; Chair of the Audit and Compensation Committees of Lincoln Center for the Performing Arts; and Ovid Therapeutics, Inc. | |||||
| 2018 Annual Report | 67 |
Bernstein Fund, Inc. (continued)
| DIRECTORS’ INFORMATION (continued) |
|
|||||||
| Name,
Address+, Age, (Year of Election*) |
Principal Occupation(s) During Past Five (5) Years and Other Information |
Portfolios in Fund Complex Overseen By Director |
Other Directorships Currently Held by Director | |||||
| R. Jay Gerken,# 67 (2013) |
Formerly, President and Chief Executive Officer of Legg Mason Partners Fund Advisor, LLC, and President & Board Member of The Legg Mason and Western Asset mutual funds from 2005 until June 2013. Previously, he was the President and Chair of the funds boards of the Citigroup Asset Management mutual funds (2002-2005); Portfolio Manager and Managing Director, Smith Barney Asset Management (1993-2001) and President & CEO, Directions Management of Shearson Lehman, Inc. (1988-1993). | 18 | Cedar Lawn Corporation; New Jersey Chapter of The Nature Conservancy; United Methodist Foundation of New Jersey; and Associated Banc-Corp | |||||
| William Kristol,# 65 (1994) |
Editor, The Weekly Standard since prior to 2013. He is a regular contributor on ABC’s This Week and on ABC’s special events and elections coverage, and appears frequently on other leading political commentary shows. | 18 | Manhattan Institute; John M. Ashbrook Center for Public Affairs at Ashland University; The Salvatori Center at Claremont McKenna College; The Shalem Foundation; The Institute for the Study of War; and Defending Democracy Together | |||||
| Donald K. Peterson,# 69 (2007) |
Formerly, Chairman and Chief Executive Officer, Avaya Inc. from 2002 to 2006; President and Chief Executive Officer, Avaya Inc. from 2000 to 2001; President, Enterprise Systems Group in 2000; Chief Financial Officer, Lucent Technologies from 1996 to 2000; Chief Financial Officer, AT&T, Communications Services Group from 1995 to 1996; President, Nortel Communications Systems, Inc. from 1994 to 1995. Prior thereto, he was at Nortel from 1976 to 1995. | 18 | Worcester Polytechnic Institute, (Emeritus); Member of the Board of TIAA-CREF; and Member of the Board of TIAA-Bank, FSB | |||||
* There is no stated term of office for the Directors.
+ The address for each of the Fund’s Disinterested Directors is c/o AllianceBernstein L.P., Attention: Legal and Compliance Department—Mutual Fund Legal, 1345 Avenue of the Americas, New York, NY 10105.
** Ms. Fisher is an “interested person” as defined by the Investment Company Act of 1940, because of her affiliation with AllianceBernstein.
# Member of the Audit Committee, the Governance, Nominating, and Compensation Committee, and the Independent Directors Committee.
^ Member of the Special Pricing Committee.
| 68 | Bernstein Fund, Inc. |
| MANAGEMENT OF THE FUND | ||||
| Name, Address,* and Age | Principal Position(s) Held with Fund |
Principal Occupation During Past Five (5) Years | ||
| Kathleen Fisher, 64 |
President | See biography above. | ||
| Andrew Birse, 40 |
Vice President | Senior Vice President of the Manager**, with which he has been associated since prior to 2013. | ||
| Peter Chocian, 46 |
Vice President | Vice President of the Manager**, with which he has been associated since prior to 2013. | ||
| Serdar Kalaycioglu, 41 |
Vice President | Senior Vice President of the Manager**, with which he has been associated since prior to 2013. | ||
| Samantha S. Lau, 46 |
Vice President | Senior Vice President of the Manager**, with which she has been associated since prior to 2013. | ||
| Stuart Rae, 53 |
Vice President | Senior Vice President of the Manager**, with which he has been associated since prior to 2013. | ||
| Shri Singhvi, 44 |
Vice President | Senior Vice President of the Manager**, with which he has been associated since prior to 2013. | ||
| Sammy Suzuki, 47 |
Vice President | Senior Vice President of the Manager**, with which he has been associated since prior to 2013. | ||
| Nelson Yu, 47 |
Vice President | Senior Vice President of the Manager**, with which he has been associated since prior to 2013. | ||
| Emilie D. Wrapp, 63 |
Secretary | Senior Vice President, Assistant General Counsel and Assistant Secretary of ABI**, with which she has been associated since prior to 2013. | ||
| Michael B. Reyes, 42 |
Senior Analyst | Vice President of the Manager**, with which he has been associated since prior to 2013. | ||
| Joseph J. Mantineo, 59 |
Treasurer and Chief Financial Officer | Senior Vice President of AllianceBernstein Investor Services (“ABIS”)**, with which he has been associated since prior to 2013. | ||
| 2018 Annual Report | 69 |
Bernstein Fund, Inc. (continued)
| MANAGEMENT OF THE FUND (continued) | ||||
| Name, Address,* and Age | Principal Position(s) Held with Fund |
Principal Occupation During Past Five (5) Years | ||
| Phyllis J. Clarke, 57 |
Controller | Vice President of ABIS**, with which she has been associated since prior to 2013. | ||
| Vincent S. Noto, 53 |
Chief Compliance Officer | Senior Vice President since 2015 and Mutual Fund Chief Compliance Officer of the Manager** since 2014. Prior thereto, he was Vice President and Director of Mutual Fund Compliance of the Manager** since 2012. | ||
* The address for each of the Fund’s Officers is 1345 Avenue of the Americas, New York, NY 10105.
** The Manager, ABI and ABIS are affiliates of the Fund.
The Fund’s Statement of Additional Information (“SAI”) has additional information about the Fund’s Directors and Officers and is available without charge upon request. Contact your financial representative or AB at (212) 486-5800, or visit www.bernstein.com, for a free prospectus or SAI.
| 70 | Bernstein Fund, Inc. |
Board Consideration of Investment Management Arrangement
Bernstein Fund, Inc. (the “Fund”) is subject to Section 15 of the Investment Company Act of 1940, as amended. Section 15 provides that any investment advisory agreement with a registered investment company such as the Fund may continue in effect for a period of more than two years from the date of its execution, only so long as such continuance is specifically approved at least annually by the board of directors (or by vote of a majority of the outstanding voting securities of the investment company). Pursuant to this requirement, the Fund’s Board of Directors, including the Directors who are not interested persons of the Fund (the “Independent Directors”), unanimously approved the continuation of the Investment Management Agreement between the Fund, on behalf of the International Strategic Equities Portfolio, International Small Cap Portfolio, and Small Cap Core Portfolio (each, a “Portfolio” and collectively, the “Portfolios”) and AllianceBernstein L.P. (the “Adviser”)(the “Investment Management Agreement”) at a meeting held on October 24-25, 2018.
Section 15 of the Investment Company Act also provides that an investment advisory agreement will terminate automatically upon its “assignment,” which includes any transfer of a controlling block of outstanding voting securities of an investment adviser or the parent company of an investment adviser. Such transfer is often referred to as a “Change of Control Event.”
AXA S.A. (“AXA”) has announced to the public its plans to divest its remaining ownership interest in AXA Equitable Holdings, Inc. (“AXA Equitable”), over time in one or more transactions, subject to market conditions (the “Plan”). AXA is the holding company for an international group of insurance and related financial services companies. AXA formerly owned all of the outstanding shares of common stock of AXA Equitable. After selling a minority stake of AXA Equitable in an initial public offering during May, 2018, AXA is currently a majority owner of AXA Equitable, which is an indirect parent of AllianceBernstein Corporation, the general partner of the Adviser. AXA Equitable also indirectly holds a majority of the outstanding partnership interests of the Adviser. It is anticipated that one or more future transactions under the Plan could be deemed a Change of Control Event resulting in the automatic termination of the Investment Management Agreement.
Because it is anticipated that one or more of the transactions contemplated by the Plan could be deemed a Change of Control Event for the Adviser resulting in the automatic termination of the Investment Management Agreement, the Board, including the Independent Directors, has approved a new investment advisory agreement with the Adviser (the “Proposed Agreement”), in connection with the Plan. The Board unanimously approved the Proposed Agreement at a meeting held on July 26, 2018, subject as to each Portfolio to approval by stockholders of that Portfolio. Stockholders have been asked to approve the Proposed Agreement at a meeting initially called for October 11, 2018 and held on November 14, 2018. The Proposed Agreement would be effective for a Portfolio after the first Change of Control Event that occurs after stockholder approval for that Portfolio.
The following discussion describes the considerations in connection with the Board’s review of the Investment Management Agreement and the Proposed Agreement (each, an “Agreement”).
The Board received preliminary information about the Plan from the Adviser at a special telephonic meeting of the Board held on June 18, 2018. During that meeting, the Independent Directors also met separately in an executive session with their independent counsel. Following that meeting, counsel to the Independent Directors sent a letter to the Adviser dated June 20, 2018, that contained a list of information requested by the Independent Directors with respect to the Plan and the Proposed Agreement. The Adviser responded in writing to the letter. Following receipt of the Adviser’s responses, the Independent Directors met with the Fund’s Senior Analyst and counsel to the Independent Directors via a telephone conference on July 23, 2018, during which the Independent Directors reviewed the responses to their requests for information, and evaluated extensive additional materials relating to the approval of the Proposed Agreement. Following the July 23, 2018 meeting, the Independent Directors, through counsel, requested certain additional information in a letter to the Adviser dated July 24, 2018. On July 26, 2018, the Board held an in-person meeting, at which representatives of the Adviser responded to the requests for additional information, and the Board discussed its review of the Proposed Agreement and the materials the Directors had been provided. During the July 26, 2018 meeting, the Independent Directors met separately with their independent counsel and the Senior Analyst in executive sessions. The Board then approved the Proposed Agreement as described below.
Prior to and following its approval of the Proposed Agreement, the Board undertook the process to review annually the continuation of the Investment Management Agreement between the Fund and the Adviser. In connection with that
| 2018 Annual Report | 71 |
Board Consideration of Investment Management Arrangement (continued)
process, counsel to the Independent Directors sent a letter to the Adviser dated August 9, 2018, that contained a list of information requested by the Independent Directors to conduct their annual review. In addition to reviewing information in connection with the July 26, 2018 meeting, the Board of Directors, including the Independent Directors, met in person and received and evaluated extensive materials relating to the continuation of the Investment Management Agreement from the Adviser during meetings in September and October 2018. In addition, the Board received materials from the Senior Analyst and an independent fee consultant as described below. On September 20, 2018, the Board of Directors held an in-person meeting to discuss its review of the Investment Management Agreement and the materials the Directors had been provided. Also on September 20, 2018, the Independent Directors met separately with their independent counsel and the Senior Analyst and the independent fee consultant in executive sessions. Following the September 20, 2018 meeting, the Independent Directors, through counsel, requested certain additional information by means of a letter from their independent counsel dated September 26, 2018, and the Adviser provided certain additional information by means of a letter dated October 3, 2018. The Independent Directors held a telephonic meeting on October 15, 2018 with their independent counsel and the Senior Analyst to discuss the contract renewal materials and supplemental materials. Following that meeting the Independent Directors, through counsel, requested further information from the Adviser. On October 24-25, 2018, the Board of Directors held an in-person meeting to continue their review of the Investment Management Agreement. During this meeting, the Adviser provided further information to the Board relating to contract renewal, and the Independent Directors also met separately with counsel to the Independent Directors as well as the Senior Analyst to review the contract renewal materials provided by the Adviser and a report prepared by the Senior Analyst. At the conclusion of this meeting, the Board approved the continuation of the Investment Management Agreement for an additional annual term as described below. Also, after considering the additional information the Board had received in connection with their consideration of the continuation of the Investment Management Agreement, and in light of their approval of the continuation of the Investment Management Agreement, the Board further determined that it was unnecessary to seek any modification of the Proposed Agreement.
In approving each Agreement, the Board, including the Independent Directors, considered all information it deemed reasonably necessary to evaluate the terms of the Agreements and considered whether each Agreement would be in the best interests of the Fund. In particular, the Board considered the information that was provided to them by the Adviser in response to their requests including information regarding the Plan, as well as information prepared by the Senior Analyst and the independent fee consultant at the request of the Board. The Fund’s Senior Analyst assists the Board (as well as the boards of other funds sponsored by the Adviser) in evaluating investment management agreements and certain other plans and agreements to which the Adviser or its affiliates provide services to the Funds. The Board also considered other information provided to the Board in connection with the July 26, 2018, September 20, 2018, and October 24-25, 2018 meetings and throughout the past year. In approving the Proposed Agreement at the July 26, 2018 Board meeting, the Board considered the information it had received through that date, including the information provided to the Board in connection with its most recent approval of the Investment Management Agreement; in approving the continuation of the Investment Management Agreement at the October 24-25, 2018 Board meeting, and in determining at that meeting that it was unnecessary to seek any modification of the Proposed Agreement, the Board considered information it had received after, as well as before and at, the July 26, 2018 meeting.
The information considered by the Board included information with respect to the Plan and the nature, extent and quality of services provided, investment performance, fees and expenses, profitability, economies of scale, and fall-out benefits and other revenue.
In the Board’s consideration of the factors discussed below, no single factor was considered in isolation or to be determinative to the decision of the Board to approve an Agreement. Rather, the Board concluded, in light of a weighing and balancing of all factors considered and in the exercise of the Directors’ business judgment, that it was in the best interests of the Fund to approve the Agreements including the fees to be charged for services thereunder, as summarized below.
Fees and Expenses
The Board, including the Independent Directors, compared the fees and expense ratios of each Portfolio (before and after any fee waivers and expense reimbursements) against fees and expense ratios of a peer group of funds with similar investment objectives (“peer group”). Both the peer group and the funds within the peer group, with respect to the fee and expense data, were available from Strategic Insight, an independent provider of investment company data. The Senior
| 72 | Bernstein Fund, Inc. |
Analyst also performed analyses of the advisory fees, and compared such analyses to the Portfolios’ peer groups. In addition, the Board received and considered information from an independent fee consultant regarding the fees of the Portfolios as well as their investment performance.
The Board also received and considered information about the services rendered, and the fee rates charged, to other clients advised by the Adviser, including information about any recent advisory fee changes with respect to other investment companies advised by the Adviser. The Board noted the differences between the services provided to the Portfolios in comparison to those provided to other types of clients, including institutional clients and other investment companies for which the Adviser acted as subadviser, and the differences in the entrepreneurial and other risks borne by the Adviser in serving the Portfolios compared to other types of clients.
The Directors also considered the fact that the Proposed Agreement would have terms and conditions identical to those of the Investment Management Agreement with the exception of the effective date under the Proposed Agreement.
On the basis of its review and consideration of the fees as described above and the Board’s consideration of the other factors described below, and in light of the Adviser’s agreement to continue fee waivers and/or expense caps applicable to the International Small Cap and Small Cap Core Portfolios, the Board concluded that the contractual advisory fees as proposed were reasonable.
Nature, Extent and Quality of Services Provided
The Board, including the Independent Directors, considered the nature, quality and extent of services performed by the Adviser and its affiliates gained from their experience as Directors of the Fund, their overall confidence in the Adviser’s integrity and competence they have gained from that experience, and the Adviser’s initiative in identifying and raising potential issues with the Directors. The Board also considered the Adviser’s responsiveness, frankness and attention to concerns raised by the Directors from time to time, including the Adviser’s willingness to consider and implement organizational changes designed to improve investment results and the services provided to the Portfolios. The Board also considered the scope and quality of the Adviser’s investment management capabilities, other resources dedicated to performing its services, the quality of its compliance, administrative and other services provided to the Portfolios and the background and experience of the Adviser’s senior management. The Board reviewed the qualifications, backgrounds and responsibilities of the investment staff primarily responsible for day-to-day portfolio management services for each Portfolio and noted the Adviser’s commitment to strong research and investment management capabilities throughout changing market environments. The Board reviewed the compliance and administrative services of the Adviser that support the investment advisory services provided to the Portfolios and noted that such staff appeared sufficient to provide a high level of service to the Portfolios. The Board also considered how the organizational capabilities and financial condition of the Adviser may affect the nature and quality of its services. In that regard, the Board considered the potential impacts of the relocation of substantial operations of the Adviser from the New York City area to Nashville, Tennessee. The Board further reviewed information about the Plan, and the statements of the Adviser that it will continue to operate as an independent, publicly-traded US asset manager, that the Plan is not anticipated to change the Adviser’s current management structure or strategy, and that the Adviser does not believe that the Plan will have a material impact on the Adviser with respect to its operations, personnel, organizational structure, or capitalization, financial and other resources.
In considering the nature and quality of the services provided by the Adviser, the Board, including the Independent Directors, received and considered information about each Portfolio’s investment performance, as well as the performance of its peer group and the performance of an appropriate benchmark index. The Board was provided with performance data versus each Portfolio’s peer group, for the 1-year period ended May 31, 2018 (for the consideration of approval of the Proposed Agreement) and ended July 31, 2018 and September 30, 2018 (for the review of the continuation of the Investment Management Agreement) and versus each Portfolio’s benchmark index for the year to date, 1-year, and since inception for the relevant periods. In addition, the Directors considered information showing performance compared to peer groups and benchmarks for rolling calendar year periods and the year to date. The Directors also receive detailed comparative performance information for the Portfolios at each regular Board meeting during the year. The Board recognized that the benchmark indices do not account for fees and expenses incurred by a fund, including the Portfolios. The Directors also considered how peer groups have changed over time and how comparisons may differ depending upon the selection of the peer groups or benchmark indices.
| 2018 Annual Report | 73 |
Board Consideration of Investment Management Arrangement (continued)
Where the Portfolios had underperformed their peer groups or benchmark indices, the Directors considered the Adviser’s explanations for performance and, as applicable, measures the Adviser had taken or proposed to take to improve performance. The Directors noted generally the Adviser’s continued efforts to enhance the services provided to the Portfolios. The Directors also noted that they would continue to monitor investment performance closely.
The Board concluded that the Adviser had the experience and resources necessary to provide services of appropriate nature, quality and scope with respect to the Portfolios.
Profitability
The Board, including the Independent Directors, considered the level of the Adviser’s profits in respect of its management of the respective Portfolios. The materials provided to the Independent Directors included information indicating the profitability of the Portfolios to the Adviser for calendar years 2016 and 2017, which had been reviewed by an independent consultant. The Directors reviewed the assumptions and methods of allocation used by the Adviser in preparing fund-specific profitability data and noted that there are many potentially acceptable allocation methodologies for information of this type. The Directors noted that they received information regarding all revenues and expenses of the Adviser’s relationship with the Fund, including those relating to the Adviser’s subsidiaries that provide transfer agency, distribution and brokerage services to the Fund, and that they had focused on profitability before taxes and distribution expenses. The Directors also received presentations at the July 26, 2018 and September 20, 2018 Board meetings from the independent consultant who reviewed the Adviser’s method of calculating profitability. The Directors recognized that it is difficult to make comparisons of profitability among fund advisory contracts because comparative information is not generally publicly available and is affected by numerous factors including different cost accounting methodologies. The Directors also considered that the profitability information did not reflect recent fee reductions implemented for the International Strategic Equities Portfolio on January 1, 2018.
After reviewing all relevant factors, the Directors, including the Independent Directors, concluded that the levels of the Adviser’s profits in respect of its management of the Portfolios were not excessive.
Economies of Scale
The Board, including the Independent Directors, considered whether there have been economies of scale in respect of the management of the Portfolios, whether the Portfolios have appropriately benefited from any economies of scale, and whether there is potential for realization of any further economies of scale.
At the July 26, 2018 Board meeting, the Directors received a presentation from an independent consultant regarding possible economies of scale with respect to the Proposed Agreement. The Directors discussed with the independent consultant possible ways in which any such economies of scale may be shared with the Portfolios, including by investment in enhanced services. The Directors also considered the Senior Analyst Report which they received in connection with the review of the Investment Management Agreement, which included a discussion of possible economies of scale and information reflecting changes in asset levels of the Portfolios and in the profitability of the Adviser over various periods. At the September 20, 2018 Board meeting, the Directors also received a presentation from outside counsel experienced in mutual fund fee litigation regarding potential economies of scale.
After reviewing the profitability and economies of scale information provided by the Adviser, the Board concluded that the benefits of any economies of scale were appropriately being shared with Portfolio investors by way of, among other things and as applicable, establishing advisory fees at levels that contemplated future achievement of scale, recent fee reductions for the International Strategic Equities Portfolio, breakpoint arrangements as currently in effect for the International Strategic Equities Portfolio, the fact that the International Small Cap and Small Cap Core Portfolios are research-intensive and may be capacity-constrained (making breakpoints impractical), expense caps and waivers applying to the International Small Cap and Small Cap Core Portfolios, and the Adviser’s continued reinvestment in the business, including by researching and implementing new product enhancements, although the Adviser decreased its operating expenses and staff in recent years. The Directors also noted that they would continue to monitor the growth of the Portfolios.
| 74 | Bernstein Fund, Inc. |
Fall-Out Benefits and Other Revenue
The Board, including the Independent Directors, also took into account so-called “fall-out benefits” to the Adviser, such as soft dollar arrangements (whereby the Adviser receives the benefit of research services from many of the brokers and dealers that execute purchases and sales of securities on behalf of its clients on an agency basis), Rule 12b-1 fees and sales charges received by the principal underwriter (which is a wholly owned subsidiary of the Adviser) with respect to the retail share classes of certain Portfolios, and transfer agency fees paid by the retail share classes of certain Portfolios to a wholly-owned subsidiary of the Adviser. The Directors recognized that the Adviser’s profitability would be lower without these benefits. They also considered other benefits potentially derived from an increase in the Adviser’s business as a result of its relationship with the Fund. The Directors concluded that these fall-out benefits to the Adviser were acceptable.
Advisory Fee Rate Schedule
On the basis of the information considered, the Board determined to approve the Proposed Agreement and the continuation of the Investment Management Agreement for an additional annual term, without change to the Portfolios’ contractual fee schedules, as set forth below.
| ADVISORY FEE SCHEDULE | ||
| International Small Cap Portfolio | 1.00% of the Portfolio’s average net assets. | |
| International Strategic Equities Portfolio | 0.75% of the first $2.5 billion of the Portfolio’s average net assets; 0.65% of the excess over $2.5 billion up to $5 billion; and 0.60% of the excess of the Portfolio’s average net assets over $5 billion. | |
| Small Cap Core Portfolio | 0.80% of the Portfolio’s average net assets. |
| 2018 Annual Report | 75 |

Distributor
BERNSTEIN FUND, INC.
1345 AVENUE OF THE AMERICAS, NEW YORK, NY 10105
(212) 756-4097
ISCEC-0151-0918
ITEM 2. CODE OF ETHICS.
(a) The registrant has adopted a code of ethics that applies to its principal executive officer, principal financial officer and principal accounting officer. A copy of the registrant’s code of ethics is filed herewith as Exhibit 12(a)(1).
(b) During the period covered by this report, no material amendments were made to the provisions of the code of ethics adopted in 2(a) above.
(c) During the period covered by this report, no implicit or explicit waivers to the provisions of the code of ethics adopted in 2(a) above were granted.
ITEM 3. AUDIT COMMITTEE FINANCIAL EXPERT.
The registrant’s Board of Directors has determined that independent directors Donald K. Peterson, Debra Perry, Suzanne Brenner and R. Jay Gerken qualify as audit committee financial experts.
ITEM 4. PRINCIPAL ACCOUNTANT FEES AND SERVICES.
(a) - (c) The following table sets forth the aggregate fees billed by the independent registered public accounting firm Pricewaterhouse Coopers LLP, for the Fund’s last two fiscal years for professional services rendered for (i) the audit of the Fund’s annual financial statements included in the Fund’s annual report to stockholders; and (ii) assurance and related services that are reasonably related to the performance of the audit of the Fund’s financial statements. Included in the table are (i) tax compliance, tax advice and tax return preparation fees paid to Ernst & Young LLP.
| Audit Fees |
Audit-Related Fees |
Tax Fees* |
||||||||||||||
| Bernstein Fund Inc. Small Cap Core Portfolio |
2017 | $ | 16,275.00 | $ | — | $ | 24,927 | |||||||||
| 2018 | $ | 21,701.00 | $ | 800 | $ | 29,977 | ||||||||||
| Bernstein Fund Inc. International Small Cap Portfolio |
2017 | $ | 18,750.00 | $ | — | $ | 24,311 | |||||||||
| 2018 | $ | 25,000.00 | $ | 800 | $ | 40,186 | ||||||||||
| Bernstein Fund Inc. International Strategic Equities Portfolio |
2017 | $ | 18,750.00 | $ | — | $ | 21,764 | |||||||||
| 2018 | $ | 25,000.00 | $ | 800 | $ | 23,424 | ||||||||||
| * | Paid to Ernst & Young LLP. |
(d) Not applicable.
(e) (1) Beginning with audit and non-audit service contracts entered into on or after May 6, 2003, the Fund’s Audit Committee policies and procedures require the pre-approval of all audit and non-audit services provided to the Fund by the Fund’s independent registered public accounting firm. The Fund’s Audit Committee policies and procedures also require pre-approval of all audit and non-audit services provided to the Adviser and Service Affiliates to the extent that these services are directly related to the operations or financial reporting of the Fund.
(e) (2) All of the amounts for Audit Fees, Audit-Related Fees and Tax Fees in the table under Item 4 (a)–(c) are for services pre-approved by the Fund’s Audit Committee.
(f) Not applicable.
(g) The following table sets forth the aggregate non-audit services provided to the Fund, the Fund’s Adviser and entities that control, are controlled by or under common control with the Adviser that provide ongoing services to the Fund:
| All Fees for Non-Audit Services Provided to the Portfolio, the Adviser and Service Affiliates |
Total Amount of (Portion
Comprised of |
|||||||||||
| Bernstein Fund Inc. Small Cap Core Portfolio |
2017 | * | $ | 5,438,501 | $ | 24,927 | ||||||
| $ | — | |||||||||||
| $ | (24,927 | ) | ||||||||||
| 2018 | $ | 3,889,159 | $ | 30,777 | ||||||||
| $ | (800 | ) | ||||||||||
| $ | (29,977 | ) | ||||||||||
| Bernstein Fund Inc. International Small Cap Portfolio |
2017 | * | $ | 5,437,885 | $ | 24,311 | ||||||
| $ | — | |||||||||||
| $ | (24,311 | ) | ||||||||||
| 2018 | $ | 3,899,368 | $ | 40,986 | ||||||||
| $ | (800 | ) | ||||||||||
| $ | (40,186 | ) | ||||||||||
| Bernstein Fund Inc. International Strategic Equities Portfolio |
2017 | * | $ | 5,435,338 | $ | 21,764 | ||||||
| $ | — | |||||||||||
| $ | (21,764 | ) | ||||||||||
| 2018 | $ | 3,882,606 | $ | 24,224 | ||||||||
| $ | (800 | ) | ||||||||||
| $ | (23,424 | ) | ||||||||||
| * | 2017 amounts revised to remove certain expenses that are not applicable. |
(h) The Audit Committee of the Fund has considered whether the provision of any non-audit services not pre-approved by the Audit Committee provided by the Fund’s independent registered public accounting firm to the Adviser and Service Affiliates is compatible with maintaining the auditor’s independence.
ITEM 5. AUDIT COMMITTEE OF LISTED REGISTRANTS.
Not applicable to the registrant.
ITEM 6. SCHEDULE OF INVESTMENTS.
Please see Schedule of Investments contained in the Report to Shareholders included under Item 1 of this Form N-CSR.
ITEM 7. DISCLOSURE OF PROXY VOTING POLICIES AND PROCEDURES FOR CLOSED-END MANAGEMENT INVESTMENT COMPANIES.
Not applicable to the registrant.
ITEM 8. PORTFOLIO MANAGERS OF CLOSED-END MANAGEMENT INVESTMENT COMPANIES.
Not applicable to the registrant.
ITEM 9. PURCHASES OF EQUITY SECURITIES BY CLOSED-END MANAGEMENT INVESTMENT COMPANY AND AFFILIATED PURCHASERS.
Not applicable to the registrant.
ITEM 10. SUBMISSION OF MATTERS TO A VOTE OF SECURITY HOLDERS.
There have been no material changes to the procedures by which shareholders may recommend nominees to the Fund’s Board of Directors since the Fund last provided disclosure in response to this item.
ITEM 11. CONTROLS AND PROCEDURES.
(a) The registrant’s principal executive officer and principal financial officer have concluded that the registrant’s disclosure controls and procedures (as defined in Rule 30a-2(c) under the Investment Company Act of 1940, as amended) are effective at the reasonable assurance level based on their evaluation of these controls and procedures as of a date within 90 days of the filing date of this document.
(b) There were no significant changes in the registrant’s internal controls over financial reporting during the second fiscal quarter of the period that could significantly affect these controls subsequent to the date of their evaluation, including any corrective actions with regard to significant deficiencies and material weaknesses.
ITEM 12. EXHIBITS.
The following exhibits are attached to this Form N-CSR:
| EXHIBIT NO. |
DESCRIPTION OF EXHIBIT | |
| 12 (a) (1) | Code of Ethics that is subject to the disclosure of Item 2 hereof | |
| 12 (b) (1) | Certification of Principal Executive Officer Pursuant to Section 302 of the Sarbanes-Oxley Act of 2002 | |
| 12 (b) (2) | Certification of Principal Financial Officer Pursuant to Section 302 of the Sarbanes-Oxley Act of 2002 | |
| 12 (c) | Certification of Principal Executive Officer and Principal Financial Officer Pursuant to Section 906 of the Sarbanes-Oxley Act of 2002 | |
SIGNATURES
Pursuant to the requirements of the Securities Exchange Act of 1934 and the Investment Company Act of 1940, the registrant has duly caused this report to be signed on its behalf by the undersigned, thereunto duly authorized.
(Registrant): Bernstein Fund, Inc.
| By: | /s/ Kathleen M. Fisher | |
| Kathleen M. Fisher | ||
| President | ||
| Date: | November 29, 2018 | |
Pursuant to the requirements of the Securities Exchange Act of 1934 and the Investment Company Act of 1940, this report has been signed below by the following persons on behalf of the registrant and in the capacities and on the dates indicated.
| By: | /s/ Kathleen M. Fisher | |
| Kathleen M. Fisher | ||
| President | ||
| Date: | November 29, 2018 | |
| By: | /s/ Joseph J. Mantineo | |
| Joseph J. Mantineo | ||
| Treasurer and Chief Financial Officer | ||
| Date: | November 29, 2018 | |
Exhibit 12(a) (1)
CODE OF ETHICS FOR PRINCIPAL EXECUTIVE AND SENIOR FINANCIAL OFFICERS
| I. | Covered Officers/Purpose of the Code |
The AllianceBernstein Mutual Fund Complex’s code of ethics (this “Code”) for the investment companies within the complex (collectively, the “Funds” and each, a “Company”) applies to each Company’s Principal Executive Officer, Principal Financial and Accounting Officer and Controller (the “Covered Officers,” each of whom is set forth in Exhibit A) for the purpose of promoting:
| • | honest and ethical conduct, including the ethical handling of actual or apparent conflicts of interest between personal and professional relationships; |
| • | full, fair, accurate, timely and understandable disclosure in reports and documents that a registrant files with, or submits to, the Securities and Exchange Commission (“SEC”) and in other public communications made by the Company; |
| • | compliance with applicable laws and governmental rules and regulations; |
| • | the prompt internal reporting of violations of the Code to an appropriate person or persons identified in the Code; and |
| • | accountability for adherence to the Code. |
Each Covered Officer should adhere to a high standard of business ethics and should be sensitive to situations that may give rise to actual as well as apparent conflicts of interest.
| II. | Covered Officers Should Handle Ethically Actual and Apparent Conflicts of Interest |
Overview. A “conflict of interest” occurs when a Covered Officer’s private interest interferes with the interests of, or his service to, the Company. For example, a conflict of interest would arise if a Covered Officer, or a member of his family, receives improper personal benefits as a result of his position with the Company. For the purposes of this Code, members of the Covered Officer’s family include his or her spouse, children, stepchildren, financial dependents, parents and stepparents.
Certain conflicts of interest arise out of the relationships between Covered Officers and the Company and already are subject to conflict of interest provisions in the Investment Company Act of 1940 (“Investment Company Act”) and the Investment Advisers Act of 1940 (“Investment Advisers Act”). For example, Covered Officers may not individually engage in certain transactions (such as the purchase or sale of securities or other property) with the Company because of their status as “affiliated persons” of the Company. The Company’s and the investment adviser’s compliance programs and procedures are designed to prevent, or identify and correct, violations of these provisions. This Code does not, and is not intended to, repeat or replace these programs and procedures, and such conflicts fall outside of the parameters of this Code.
Although typically not presenting an opportunity for improper personal benefit, conflicts arise from, or as a result of, the contractual relationship between the Company and the investment adviser of which the Covered Officers are also officers or employees. As a result, this Code recognizes that the Covered Officers will, in the normal course of their duties (whether formally for the Company or for the adviser, or for both), be involved in establishing policies and implementing decisions that will have different effects on the adviser and the Company. The participation of the Covered Officers in such activities is inherent in the contractual relationship between the Company and the adviser and is consistent with the performance by the Covered Officers of their duties as officers of the Company. Thus, if performed in conformity with the provisions of the Investment Company Act and the Investment Advisers Act, such activities will be deemed to have been handled ethically. In addition, it is recognized by the Company’s Board of Directors or Trustees (the “Directors”) that the Covered Officers may also be officers or employees of one or more of the other Funds or of other investment companies covered by this or other codes.
Other conflicts of interest are covered by the Code, even if such conflicts of interest are not subject to provisions in the Investment Company Act and the Investment Advisers Act. The following list provides examples of conflicts of interest under the Code, but Covered Officers should keep in mind that these examples are not exhaustive. The overarching principle is that the personal interest of a Covered Officer should not be placed improperly before the interest of the Company.
Each Covered Officer must:
| • | not use his personal influence or personal relationships improperly to influence investment decisions or financial reporting by the Company whereby the Covered Officer would benefit personally to the detriment of the Company; |
| • | not cause the Company to take action, or fail to take action, for the individual personal benefit of the Covered Officer rather than the benefit of the Company; |
| • | not use material non-public knowledge of portfolio transactions made or contemplated for the Company to trade personally or cause others to trade personally in contemplation of the market effect of such transactions; |
2
There are some conflict of interest situations, whether involving a Covered Officer directly or a member of his family, that should always be discussed with the General Counsel of Alliance Capital Management L.P. (the “General Counsel”), if material. Examples of these include:
| • | service as a director on the board of directors or trustees of any public or private company (other than a not-for-profit organization); |
| • | the receipt of any non-nominal gifts; |
| • | the receipt of any entertainment from any company with which the Company has current or prospective business dealings unless such entertainment is business-related, reasonable in cost, appropriate as to time and place, and not so frequent as to raise any question of impropriety; |
| • | any ownership interest in, or any consulting or employment relationship with, any of the Company’s service providers, other than its investment adviser, principal underwriter, administrator or any affiliated person thereof; |
| • | a direct or indirect financial interest in commissions, transaction charges or spreads paid by the Company for effecting portfolio transactions or for selling or redeeming shares other than an interest arising from the Covered Officer’s employment, such as compensation or equity ownership. |
| III. | Disclosure and Compliance |
| • | Each Covered Officer should familiarize himself with the disclosure requirements and disclosure controls and procedures generally applicable to the Company; |
| • | each Covered Officer should not knowingly misrepresent, or cause others to misrepresent, facts about the Company to others, whether within or outside the Company, including to the Company’s directors and auditors, and to governmental regulators and self-regulatory organizations; |
| • | each Covered Officer should, to the extent appropriate within his area of responsibility, consult with other officers and employees of the Funds and the adviser with the goal of promoting full, fair, accurate, timely and understandable disclosure in the reports and documents the Funds file with, or submit to, the SEC and in other public communications made by the Funds; and |
3
| • | it is the responsibility of each Covered Officer to promote compliance with the standards and restrictions imposed by applicable laws, rules and regulations. |
| IV. | Reporting and Accountability |
Each Covered Officer must:
| • | upon adoption of the Code (or thereafter as applicable, upon becoming a Covered Officer), affirm in writing to the General Counsel that he has received, read, and understands the Code; |
| • | annually thereafter affirm to the General Counsel that he has complied with the requirements of the Code; |
| • | complete at least annually a questionnaire relating to affiliations or other relationships that may give rise to conflicts of interest; |
| • | not retaliate against any other Covered Officer or any employee of the Company or their affiliated persons for reports of potential violations that are made in good faith; and |
| • | notify the General Counsel promptly if he knows of any violation of this Code. Failure to do so is itself a violation of this Code. |
The General Counsel is responsible for applying this Code to specific situations in which questions are presented under it and has the authority to interpret this Code in any particular situation. However, waivers sought by a Covered Officer will be considered by the Company’s Audit Committee (the “Committee”).
The Company will follow these procedures in investigating and enforcing this Code:
| • | the General Counsel will take all appropriate action to investigate any potential violations reported to him; |
| • | if, after such investigation, the General Counsel believes that no material violation has occurred, the General Counsel is not required to take any further action; |
| • | any matter that the General Counsel believes is a material violation will be reported to the Committee; |
| • | if the Committee concurs that a material violation has occurred, it will inform and make a recommendation to the Directors, who will consider appropriate action, which may include review of, and appropriate modifications to, applicable policies and procedures; notification to appropriate personnel of the investment adviser or its board; or a recommendation to dismiss the Covered Officer; |
| • | the Committee will be responsible for granting waivers, as appropriate; and |
| • | any changes to or waivers of this Code will, to the extent required, be disclosed as provided by SEC rules. |
4
| V. | Other Policies and Procedures |
This Code shall be the sole code of ethics adopted by the Company for purposes of Section 406 of the Sarbanes-Oxley Act and the rules and forms applicable to registered investment companies thereunder. Insofar as other policies or procedures of the Company, the Company’s adviser, principal underwriter, or other service providers govern or purport to govern the behavior or activities of the Covered Officers who are subject to this Code, it is understood that this Code is in all respects separate and apart from, and operates independently of, any such policies and procedures. In particular, the Company’s and its investment adviser’s and principal underwriter's codes of ethics under Rule 17j-l under the Investment Company Act are separate requirements applying to the Covered Officers and others, and are not part of this Code.
| VI. | Amendments |
Any amendments to this Code, other than amendments to Exhibit A, must be approved or ratified by a majority vote of the Directors, including a majority of independent directors.
| VII. | Confidentiality |
All reports and records prepared or maintained pursuant to this Code will be considered confidential and shall be maintained and protected accordingly. Except as otherwise required by law or this Code, such matters shall not be disclosed to anyone other than the Directors, the investment adviser, their counsel, counsel to the Company and, if deemed appropriate by the Directors of the Company, to the Directors of the other Funds.
| VIII. | Internal Use |
The Code is intended solely for internal use by the Funds and does not constitute an admission, by or on behalf of any Company, as to any fact, circumstance, or legal conclusion.
Date: July 22, 2003, as amended March 17, 2004
5
Exhibit A
Persons Covered by this Code of Ethics
Principal Executive Officer
Principal Financial and Accounting Officer
Controller
6
Exhibit 12(b)(1)
CERTIFICATION OF PRINCIPAL EXECUTIVE OFFICER
I, Kathleen M. Fisher, President of Bernstein Fund, Inc., certify that:
1. I have reviewed this report on Form N-CSR of Bernstein Fund, Inc.;
2. Based on my knowledge, this report does not contain any untrue statement of a material fact or omit to state a material fact necessary to make the statements made, in light of the circumstances under which such statements were made, not misleading with respect to the period covered by this report;
3. Based on my knowledge, the financial statements, and other financial information included in this report, fairly present in all material respects the financial condition, results of operations, changes in net assets, and cash flows (if the financial statements are required to include a statement of cash flows) of the registrant as of, and for, the periods presented in this report;
4. The registrant’s other certifying officers and I are responsible for establishing and maintaining disclosure controls and procedures (as defined in Rule 30a-3(c) under the Investment Company Act of 1940) and internal control over financial reporting (as defined in Rule 30a-3(d) under the Investment Company Act of 1940) for the registrant and have:
| a) | designed such disclosure controls and procedures to ensure that material information relating to the registrant, including its consolidated subsidiaries, is made known to us by others within those entities, particularly during the period in which this report is being prepared; |
| b) | designed such internal control over financial reporting to provide reasonable assurance regarding the reliability of financial reporting and the preparation of financial statements for external purposes in accordance with generally accepted accounting principles; |
| c) | evaluated the effectiveness of the registrant’s disclosure controls and procedures and presented in this report our conclusions about the effectiveness of the disclosure controls and procedures, as of a date within 90 days prior to the filing date of this report based on such evaluation; and |
| d) | disclosed in this report any change in the registrant’s internal control over financial reporting that occurred during the second fiscal quarter of the period covered by this report that has materially affected, or is reasonably likely to materially affect, the registrant’s internal control over financial reporting; and |
5. The registrant’s other certifying officers and I have disclosed to the registrant’s auditors and the audit committee of the registrant’s board of directors (or persons performing the equivalent functions):
a) all significant deficiencies and material weaknesses in the design or operation of internal control over financial reporting which are reasonably likely to adversely affect the registrant’s ability to record, process, summarize, and report financial information; and
b) any fraud, whether or not material, that involves management or other employees who have a significant role in the registrant’s internal control over financial reporting.
Date: November 29, 2018
| /s/ Kathleen M. Fisher |
| Kathleen M. Fisher |
| President |
Exhibit 12(b)(2)
CERTIFICATION OF PRINCIPAL FINANCIAL OFFICER
I, Joseph J. Mantineo, Treasurer and Chief Financial Officer of Bernstein Fund, Inc., certify that:
1. I have reviewed this report on Form N-CSR of Bernstein Fund, Inc.;
2. Based on my knowledge, this report does not contain any untrue statement of a material fact or omit to state a material fact necessary to make the statements made, in light of the circumstances under which such statements were made, not misleading with respect to the period covered by this report;
3. Based on my knowledge, the financial statements, and other financial information included in this report, fairly present in all material respects the financial condition, results of operations, changes in net assets, and cash flows (if the financial statements are required to include a statement of cash flows) of the registrant as of, and for, the periods presented in this report;
4. The registrant’s other certifying officers and I are responsible for establishing and maintaining disclosure controls and procedures (as defined in Rule 30a-3(c) under the Investment Company Act of 1940) and internal control over financial reporting (as defined in Rule 30a-3(d) under the Investment Company Act of 1940) for the registrant and have:
| a) | designed such disclosure controls and procedures to ensure that material information relating to the registrant, including its consolidated subsidiaries, is made known to us by others within those entities, particularly during the period in which this report is being prepared; |
| b) | designed such internal control over financial reporting to provide reasonable assurance regarding the reliability of financial reporting and the preparation of financial statements for external purposes in accordance with generally accepted accounting principles; |
| c) | evaluated the effectiveness of the registrant’s disclosure controls and procedures presented in this report our conclusions about the effectiveness of the disclosure controls and procedures, as of a date within 90 days prior to the filing date of this report based on such evaluation; and |
| d) | disclosed in this report any change in the registrant’s internal control over financial reporting that occurred during the second fiscal quarter of the period covered by this report that has materially affected, or is reasonably likely to materially affect, the registrant’s internal control over financial reporting; and |
5. The registrant’s other certifying officers and I have disclosed to the registrant’s auditors and the audit committee of the registrant’s board of directors (or persons performing the equivalent functions):
a) all significant deficiencies and material weaknesses in the design or operation of internal control over financial reporting which are reasonably likely to adversely affect the registrant’s ability to record, process, summarize, and report financial information; and
b) any fraud, whether or not material, that involves management or other employees who have a significant role in the registrant’s internal control over financial reporting.
Date: November 29, 2018
| /s/ Joseph J. Mantineo |
| Joseph J. Mantineo |
| Treasurer and Chief Financial Officer |
EXHIBIT 12(c)
CERTIFICATION PURSUANT TO SECTION 906 OF THE
SARBANES-OXLEY ACT
Pursuant to 18 U.S.C. 1350, each of the undersigned, being the Principal Executive Officer and Principal Financial Officer of Bernstein Fund, Inc. (the “Registrant”), hereby certifies that the Registrant’s report on Form N-CSR for the period ended September 30, 2018 (the “Report”) fully complies with the requirements of Section 13(a) or 15(d) of the Securities Exchange Act of 1934 and that the information contained in the Report fairly presents, in all material respects, the financial condition and results of operations of the Registrant.
Date: November 29, 2018
| By: | /s/ Kathleen M. Fisher | |
| Kathleen M. Fisher | ||
| President | ||
| By: | /s/ Joseph J. Mantineo | |
| Joseph J. Mantineo | ||
| Treasurer and Chief Financial Officer | ||
This certification is being furnished solely pursuant to Section 906 of the Sarbanes-Oxley Act of 2002 and is not being filed as part of the Report or as a separate disclosure document.
A signed original of this written statement required by Section 906 has been provided to the Registrant and will be retained by the Registrant and furnished to the Securities and Exchange Commission or its staff upon request.
Serious News for Serious Traders! Try StreetInsider.com Premium Free!
You May Also Be Interested In
- Bernstein on Tesla: 'Widespread deployment of FSD is 5 - 10 years away'
- Bernstein SocGen Group Has 3 Problems with CNH Industrial NV (CNHI) CEO Change
- Bitcoin halving: Here are 5 key investor questions and answers
Create E-mail Alert Related Categories
SEC FilingsRelated Entities
Sanford C. BernsteinSign up for StreetInsider Free!
Receive full access to all new and archived articles, unlimited portfolio tracking, e-mail alerts, custom newswires and RSS feeds - and more!
