

Form N-CSR BARON INVESTMENT FUNDS For: Sep 30
 Tweet
Tweet Share
Share| OMB APPROVAL | ||||||
|
OMB Number: |
3235-0570 | |||||
|
Expires: |
July 31, 2022 | |||||
|
Estimated average burden |
||||||
|
Hours per response |
20.6 | |||||
UNITED STATES
SECURITIES AND EXCHANGE COMMISSION
Washington, DC 20549
FORM N-CSR
CERTIFIED SHAREHOLDER REPORT OF REGISTERED
MANAGEMENT INVESTMENT COMPANIES
Investment Company Act file number: 811-5032
BARON INVESTMENT FUNDS TRUST f/k/a
BARON ASSET FUND
(Exact Name of Registrant as Specified in Charter)
767 Fifth Avenue, 49th Floor
New York, NY 10153
(Address of Principal Executive Offices) (Zip Code)
Patrick M. Patalino, General Counsel
c/o Baron Investment Funds Trust
767 Fifth Avenue, 49th Floor
New York, NY 10153
(Name and Address of Agent for Service)
(Registrant’s Telephone Number, including Area Code): 212-583-2000
Date of fiscal year end: September 30
Date of reporting period: September 30, 2021
Form N-CSR is to be used by management investment companies to file reports with the Commission not later than 10 days after the transmission to stockholders of any report that is required to be transmitted to stockholders under Rule 30e-1 under the Investment Company Act of 1940 (17CRF 270.30e-1). The Commission may use the information provided on Form N-CSR in its regulatory, disclosure review, inspection, and policymaking roles.
A registrant is required to disclose the information specified by Form N-CSR, and the Commission will make this information public. A registrant is not required to respond to the collection of information contained in Form N-CSR unless the Form displays a currently valid Office of Management and Budget (“OMB”) control number. Please direct comments concerning the accuracy of the information collection burden estimate and suggestions for reducing the burden to Secretary, Securities and Exchange Commission, 450 5th Street, NW, Washington, D.C. 20549-0609. The OMB has reviewed this collection of information under the clearance requirements of 44 U.S.C. Section 3507.
Persons who are to respond to the collection of information contained in this form are not required to respond unless the form displays a currently valid OMB control number.
SEC 2569 (5-07)
Item 1. Report to Stockholders.
Baron Asset Fund
Baron Growth Fund
Baron Small Cap Fund
Baron Opportunity Fund
Baron Fifth Avenue Growth Fund
Baron Discovery Fund
Baron Durable Advantage Fund
September 30, 2021
DEAR BARON INVESTMENT FUNDS SHAREHOLDER:
In this report, you will find audited financial statements for Baron Asset Fund, Baron Growth Fund, Baron Small Cap Fund, Baron Opportunity Fund, Baron Fifth Avenue Growth Fund, Baron Discovery Fund, and Baron Durable Advantage Fund (the “Funds”) for the year ended September 30, 2021. The U.S. Securities and Exchange Commission (the “SEC”) requires mutual funds to furnish these statements semi-annually to their shareholders. We hope you find these statements informative and useful.
We thank you for choosing to join us as fellow shareholders in Baron Funds. We will continue to work hard to justify your confidence.
Sincerely,

|

|

| ||
| Ronald Baron Chief Executive Officer November 23, 2021 |
Linda S. Martinson Chairman, President and Chief Operating Officer November 23, 2021 |
Peggy Wong Treasurer and Chief Financial Officer November 23, 2021 |
This Annual Financial Report is for the Baron Investment Funds Trust, which currently has seven series: Baron Asset Fund, Baron Growth Fund, Baron Small Cap Fund, Baron Opportunity Fund, Baron Fifth Avenue Growth Fund, Baron Discovery Fund, and Baron Durable Advantage Fund. If you are interested in Baron Select Funds, which contains the Baron Partners Fund, Baron Focused Growth Fund, Baron International Growth Fund, Baron Real Estate Fund, Baron Emerging Markets Fund, Baron Global Advantage Fund, Baron Real Estate Income Fund, Baron WealthBuilder Fund, Baron Health Care Fund, Baron FinTech Fund, and Baron New Asia Fund series, please visit the Funds’ website at www.BaronFunds.com or contact us at 1-800-99BARON.
The Funds’ Proxy Voting Policy is available without charge and can be found on the Funds’ website at www.BaronFunds.com, by clicking on the “Regulatory Documents” link at the bottom left corner of the homepage or by calling 1-800-99BARON and on the SEC’s website at www.sec.gov. The Funds’ most current proxy voting record, Form N-PX, is also available on the Funds’ website and on the SEC’s website.
The Funds file their complete schedules of portfolio holdings with the SEC for the first and third quarters of each fiscal year as an exhibit to their reports on Form N-PORT. The Funds’ Form N-PORT reports are available on the SEC’s website at www.sec.gov. Schedules of portfolio holdings current to the most recent quarter are also available on the Funds’ website.
Some of the comments contained in this report are based on current management expectations and are considered “forward-looking statements.” Actual future results, however, may prove to be different from our expectations. You can identify forward-looking statements by words such as “estimate,” “may,” “expect,” “should,” “could,” “believe,” “plan” and other similar terms. We cannot promise future returns and our opinions are a reflection of our best judgment at the time this report is compiled.
The views expressed in this report reflect those of BAMCO, Inc. (“BAMCO” or the “Adviser”) only through the end of the period stated in this report. The views are not intended as recommendations or investment advice to any person reading this report and are subject to change at any time without notice based on market and other conditions.
Past performance is no guarantee of future results. The investment return and principal value of an investment will fluctuate; an investor’s shares, when redeemed, may be worth more or less than their original cost. For more complete information about Baron Funds, including charges and expenses, call, write or go to www.BaronFunds.com for a prospectus or summary prospectus. Read them carefully before you invest or send money. This report is not authorized for use as an offer of sale or a solicitation of an offer to buy shares of the Funds, unless accompanied or preceded by the Funds’ current prospectus or summary prospectus.
| Baron Asset Fund (Unaudited) | September 30, 2021 |
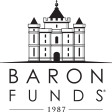
COMPARISON OF THE CHANGE IN VALUE OF $10,000 INVESTMENT IN BARON ASSET FUND (RETAIL SHARES)
IN RELATION TO THE RUSSELL MIDCAP GROWTH INDEX AND THE S&P 500 INDEX
| AVERAGE ANNUAL TOTAL RETURNS FOR THE PERIODS ENDED SEPTEMBER 30, 2021 |
| |||||||||||||||||||
| One Year |
Three Years |
Five Years |
Ten Years |
Since Inception (June 12, 1987) |
||||||||||||||||
| Baron Asset Fund — Retail Shares1,2 |
24.96% | 18.41% | 20.13% | 17.69% | 12.35% | |||||||||||||||
| Baron Asset Fund — Institutional Shares1,2,4 |
25.29% | 18.72% | 20.45% | 18.00% | 12.46% | |||||||||||||||
| Baron Asset Fund — R6 Shares1,2,4 |
25.28% | 18.72% | 20.44% | 18.00% | 12.46% | |||||||||||||||
| Russell Midcap Growth Index1 |
30.45% | 19.14% | 19.27% | 17.54% | 11.08% | 3 | ||||||||||||||
| S&P 500 Index1 |
30.00% | 15.99% | 16.90% | 16.63% | 10.46% | |||||||||||||||
| 1 | The Russell MidcapTM Growth Index measures the performance of medium-sized U.S. companies that are classified as growth and the S&P 500 Index of 500 widely held large cap U.S. companies. The indexes and the Fund are with dividends reinvested, which positively impact the performance results. The indexes are unmanaged. The index performance is not Fund performance; one cannot invest directly into an index. |
| 2 | Past performance is not predictive of future performance. The performance data does not reflect the deduction of taxes that a shareholder would pay on Fund distributions or redemption of Fund shares. The Fund’s transfer agency expenses may be reduced by expense offsets from an unaffiliated transfer agent, without which performance would have been lower. |
| 3 | For the period June 30, 1987 to September 30, 2021. |
| 4 | Performance for the Institutional Shares prior to May 29, 2009 is based on the performance of the Retail Shares. Performance for the R6 Shares prior to January 29, 2016 is based on the performance of the Institutional Shares, and prior to May 29, 2009 is based on the Retail Shares. The Retail Shares have a distribution fee, but Institutional Shares and R6 Shares do not. If the annual returns for the Institutional Shares and R6 Shares prior to May 29, 2009 did not reflect this fee, the returns would be higher. |
2
| September 30, 2021 (Unaudited) | Baron Asset Fund |
TOP TEN HOLDINGS AS OF SEPTEMBER 30, 2021
| Percent of Net Assets |
||||
| Gartner, Inc. |
7.4% | |||
| IDEXX Laboratories, Inc. |
6.8% | |||
| Mettler-Toledo International, Inc. |
4.3% | |||
| Vail Resorts, Inc. |
3.3% | |||
| ANSYS, Inc. |
3.2% | |||
| Bio-Techne Corporation |
3.1% | |||
| Verisk Analytics, Inc. |
3.1% | |||
| West Pharmaceutical Services, Inc. |
3.1% | |||
| CoStar Group, Inc. |
3.0% | |||
| Ceridian HCM Holding Inc. |
3.0% | |||
| 40.3% | ||||
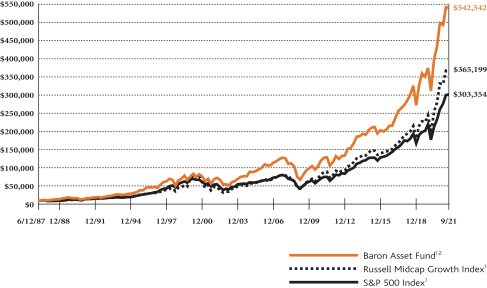
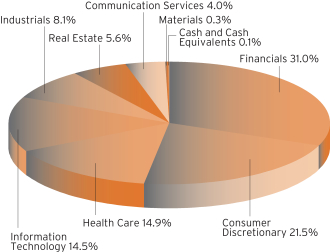
SECTOR BREAKDOWN AS OF SEPTEMBER 30, 2021†
(as a percentage of net assets)
MANAGEMENT’S DISCUSSION OF FUND PERFORMANCE
For the 12 months ended September 30, 2021, Baron Asset Fund1 increased 24.96%, while the Russell Midcap Growth Index rose 30.45% and the S&P 500 Index rose 30.00%.
Baron Asset Fund invests primarily in medium-sized growth companies for the long term, using a value-oriented purchase discipline. The Fund purchases companies that we believe have sustainable competitive advantages, strong financial characteristics, and exceptional management; and operate in industries with favorable growth characteristics.
U.S. markets mostly continued their upward trajectory from the March 2020 trough throughout the period. Positive news on vaccines kicked things off, exciting investors about the prospects of a return to normalcy. Additional fiscal and monetary support as well as strong corporate profits and continued low interest rates also kept the rally going. All these factors helped outweigh concerns about inflation, supply chain issues, labor shortages, and the surge of the COVID-19 Delta variant for much of the period.
Health Care, Information Technology, and Financials investments contributed the most. No sector detracted from performance.
Gartner, Inc. was the top contributor. After taking a hit during the pandemic due to the shutdown of its events business, shares of this provider of syndicated research increased on financial results that bested analyst forecasts. Growth in the research business has stabilized and is poised to return to double-digit levels. We expect improved revenue growth combined with renewed focus on cost control will drive margin expansion and enhanced free cash flow generation. Gartner’s balance sheet is in excellent shape, and we expect an acceleration in repurchases.
Wix.com Ltd. was the top detractor. Shares of the leading provider of software that helps micro-businesses build and maintain their websites declined later in the period after the company reported financial results that showed some slowdown in new customer additions as a result of lapping accelerated COVID-19 trends. We retain conviction in Wix’s long-term opportunity as it enables small businesses to transition online in a post-pandemic world.
The economic and investment outlook is more uncertain than in the last few quarters. Headwinds, including supply chain disruptions, workforce shortages, rising interest rates, and inflation, seem less likely to resolve quickly. The Federal Reserve has signaled a less accommodating monetary policy going forward. These concerns notwithstanding, we still expect economic growth to be strong through the end of this year and into 2022 as the pandemic wanes and normalcy returns. We think our companies will be able to handle near-term cost pressures and profits will revert to uptrends. We do believe inflation will stay elevated and interest rates will trend higher.
We continue to adhere to our longstanding investment methodology while working hard to identify beneficiaries of secular trends in technology and consumer preferences, many of which have been accelerated by the pandemic. We remain optimistic that this approach will generate strong performance for our portfolio, regardless of the economic climate.
| † | Sector levels are provided from the Global Industry Classification Standard (“GICS”), developed and exclusively owned by MSCI, Inc. and Standard & Poor’s Financial Services LLC, unless otherwise stated that they have been reclassified or classified by the Adviser. All GICS data is provided “as is” with no warranties. |
| 1 | Performance information reflects results of the Retail Shares. |
3
| Baron Growth Fund (Unaudited) | September 30, 2021 |
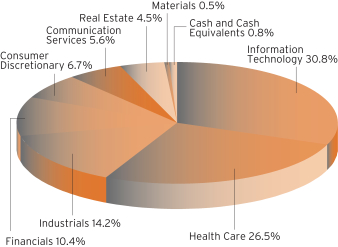
COMPARISON OF THE CHANGE IN VALUE OF $10,000 INVESTMENT IN BARON GROWTH FUND (RETAIL SHARES)
IN RELATION TO THE RUSSELL 2000 GROWTH INDEX AND THE S&P 500 INDEX
| AVERAGE ANNUAL TOTAL RETURNS FOR THE PERIODS ENDED SEPTEMBER 30, 2021 |
| |||||||||||||||||||
| One Year |
Three Years |
Five Years |
Ten Years |
Since Inception (December 31, 1994) |
||||||||||||||||
| Baron Growth Fund — Retail Shares1,2 |
36.19% | 19.45% | 20.85% | 17.33% | 14.11% | |||||||||||||||
| Baron Growth Fund — Institutional Shares1,2,3 |
36.55% | 19.75% | 21.16% | 17.64% | 14.25% | |||||||||||||||
| Baron Growth Fund — R6 Shares1,2,3 |
36.56% | 19.75% | 21.16% | 17.64% | 14.25% | |||||||||||||||
| Russell 2000 Growth Index1 |
33.27% | 11.70% | 15.34% | 15.74% | 8.89% | |||||||||||||||
| S&P 500 Index1 |
30.00% | 15.99% | 16.90% | 16.63% | 10.82% | |||||||||||||||
| 1 | The Russell 2000® Growth Index measures the performance of small-sized U.S. companies that are classified as growth and the S&P 500 Index of 500 widely held large cap U.S. companies. The indexes and the Fund are with dividends reinvested, which positively impact the performance results. The indexes are unmanaged. The index performance is not Fund performance; one cannot invest directly into an index. |
| 2 | Past performance is not predictive of future performance. The performance data does not reflect the deduction of taxes that a shareholder would pay on Fund distributions or redemption of Fund shares. The Fund’s transfer agency expenses may be reduced by expense offsets from an unaffiliated transfer agent, without which performance would have been lower. |
| 3 | Performance for the Institutional Shares prior to May 29, 2009 is based on the performance of the Retail Shares. Performance for the R6 Shares prior to January 29, 2016 is based on the performance of the Institutional Shares, and prior to May 29, 2009 is based on the Retail Shares. The Retail Shares have a distribution fee, but Institutional Shares and R6 Shares do not. If the annual returns for the Institutional Shares and R6 Shares prior to May 29, 2009 did not reflect this fee, the returns would be higher. |
4
| September 30, 2021 (Unaudited) | Baron Growth Fund |
TOP TEN HOLDINGS AS OF SEPTEMBER 30, 2021
| Percent of Net Assets |
||||
| MSCI, Inc. |
11.0% | |||
| Vail Resorts, Inc. |
7.3% | |||
| Gartner, Inc. |
5.2% | |||
| FactSet Research Systems, Inc. |
5.1% | |||
| CoStar Group, Inc. |
5.0% | |||
| IDEXX Laboratories, Inc. |
4.8% | |||
| Penn National Gaming, Inc. |
4.6% | |||
| Bio-Techne Corporation |
4.5% | |||
| ANSYS, Inc. |
4.3% | |||
| Choice Hotels International, Inc. |
4.1% | |||
| 55.9% | ||||
SECTOR BREAKDOWN AS OF SEPTEMBER 30, 2021†
(as a percentage of net assets)
MANAGEMENT’S DISCUSSION OF FUND PERFORMANCE
For the 12 months ended September 30, 2021, Baron Growth Fund1 increased 36.19%, while the Russell 2000 Growth Index increased 33.27% and the S&P 500 Index increased 30.00%.
Baron Growth Fund invests primarily in small-sized U.S. growth companies for the long term. Through independent research, we utilize an investment approach that we believe allows us to look at a business’s fundamental characteristics and beyond the current market environment. We invest based on the potential profitability of a business at what we believe are attractive valuations.
U.S. markets mostly continued their upward trajectory from the March 2020 trough throughout the period. Positive news on vaccines kicked things off, exciting investors about the prospects of a return to normalcy. Additional fiscal and monetary support as well as strong corporate profits and continued low interest rates also kept the rally going. All these factors helped outweigh concerns about inflation, supply chain issues, labor shortages, and the surge of the COVID-19 Delta variant for much of the period.
Financials, Health Care, and Consumer Discretionary contributed the most. Materials was a slight detractor.
MSCI, Inc. was the top contributor. Shares of this leading provider of investment decision support tools rose on strong earnings results and optimism from management regarding the economic and market backdrop going forward. MSCI also enhanced its private markets capabilities with the acquisition of Real Capital Analytics. We retain long-term conviction as the company owns strong, “all weather” franchises and remains positioned, in our view, to benefit from numerous secular tailwinds in the investment community.
Specialty insurer Kinsale Capital Group, Inc. was the top detractor. The stock more than doubled from March through November of 2020, which may have led to profit-taking in the period. In addition, the stock migrated from a small-cap to a mid-cap index, which likely led to forced selling from small-cap funds. We continue to own Kinsale because we believe the company has a long runway for growth in an attractive segment of the insurance market.
The economic and investment outlook is more uncertain than in the last few quarters. Headwinds, including supply chain disruptions, workforce shortages, rising interest rates, and inflation, seem less likely to resolve quickly. The Federal Reserve has signaled a less accommodating monetary policy going forward. These concerns notwithstanding, we still expect economic growth to be strong through the end of this year and into 2022 as the pandemic wanes and normalcy returns. We think our companies will be able to handle near-term cost pressures and profits will revert to uptrends. We do believe inflation will stay elevated and interest rates will trend higher.
We continue to adhere to our longstanding investment methodology while working hard to identify beneficiaries of secular trends in technology and consumer preferences, many of which have been positively impacted by the pandemic. We remain optimistic that this approach will generate strong performance for our portfolio, regardless of the economic climate.
| † | Sector levels are provided from the Global Industry Classification Standard (“GICS”), developed and exclusively owned by MSCI, Inc. and Standard & Poor’s Financial Services LLC, unless otherwise stated that they have been reclassified or classified by the Adviser. All GICS data is provided “as is” with no warranties. |
| 1 | Performance information reflects results of the Retail Shares. |
5
| Baron Small Cap Fund (Unaudited) | September 30, 2021 |
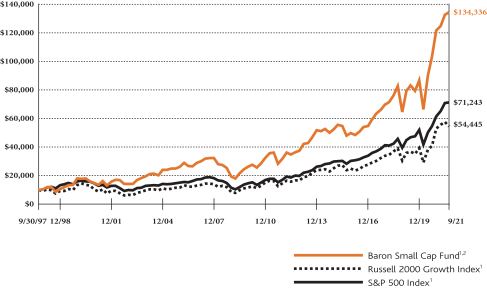
COMPARISON OF THE CHANGE IN VALUE OF $10,000 INVESTMENT IN BARON SMALL CAP FUND (RETAIL SHARES)
IN RELATION TO THE RUSSELL 2000 GROWTH INDEX AND THE S&P 500 INDEX
| AVERAGE ANNUAL TOTAL RETURNS FOR THE PERIODS ENDED SEPTEMBER 30, 2021 |
| |||||||||||||||||||
| One Year |
Three Years |
Five Years |
Ten Years |
Since Inception (September 30, 1997) |
||||||||||||||||
| Baron Small Cap Fund — Retail Shares1,2 |
29.77% | 17.55% | 19.98% | 16.85% | 11.43% | |||||||||||||||
| Baron Small Cap Fund — Institutional Shares1,2,3 |
30.11% | 17.86% | 20.29% | 17.15% | 11.58% | |||||||||||||||
| Baron Small Cap Fund — R6 Shares1,2,3 |
30.09% | 17.86% | 20.29% | 17.15% | 11.58% | |||||||||||||||
| Russell 2000 Growth Index1 |
33.27% | 11.70% | 15.34% | 15.74% | 7.32% | |||||||||||||||
| S&P 500 Index1 |
30.00% | 15.99% | 16.90% | 16.63% | 8.53% | |||||||||||||||
| 1 | The Russell 2000® Growth Index measures the performance of small-sized U.S. companies that are classified as growth and the S&P 500 Index of 500 widely held large cap U.S. companies. The indexes and the Fund are with dividends reinvested, which positively impact the performance results. The indexes are unmanaged. The index performance is not Fund performance; one cannot invest directly into an index. |
| 2 | Past performance is not predictive of future performance. The performance data does not reflect the deduction of taxes that a shareholder would pay on Fund distributions or redemption of Fund shares. The Fund’s transfer agency expenses may be reduced by expense offsets from an unaffiliated transfer agent, without which performance would have been lower. |
| 3 | Performance for the Institutional Shares prior to May 29, 2009 is based on the performance of the Retail Shares. Performance for the R6 Shares prior to January 29, 2016 is based on the performance of the Institutional Shares, and prior to May 29, 2009 is based on the Retail Shares. The Retail Shares have a distribution fee, but Institutional Shares and R6 Shares do not. If the annual returns for the Institutional Shares and R6 Shares prior to May 29, 2009 did not reflect this fee, the returns would be higher. |
6
| September 30, 2021 (Unaudited) | Baron Small Cap Fund |
TOP TEN HOLDINGS AS OF SEPTEMBER 30, 2021
| Percent of Net Assets |
||||
| Gartner, Inc. |
5.4% | |||
| ICON Plc |
3.7% | |||
| ASGN Incorporated |
3.3% | |||
| Installed Building Products, Inc. |
3.0% | |||
| SiteOne Landscape Supply, Inc. |
3.0% | |||
| Floor & Decor Holdings, Inc. |
2.8% | |||
| Vertiv Holdings, LLC |
2.8% | |||
| Guidewire Software, Inc. |
2.7% | |||
| DexCom, Inc. |
2.1% | |||
| SBA Communications Corp. |
2.0% | |||
| 30.8% | ||||
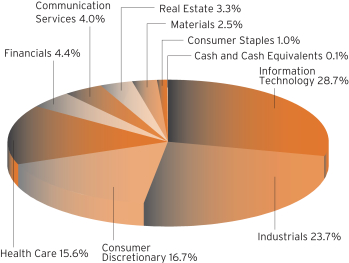
SECTOR BREAKDOWN AS OF SEPTEMBER 30, 2021†
(as a percentage of net assets)
MANAGEMENT’S DISCUSSION OF FUND PERFORMANCE
For the 12 months ended September 30, 2021, Baron Small Cap Fund1 increased 29.77%, while the Russell 2000 Growth Index increased 33.27% and the S&P 500 Index increased 30.00%.
Baron Small Cap Fund invests primarily in small-cap growth companies for the long term. The Fund invests in what we believe are well-run small-cap growth businesses that can be purchased at prices that represent a significant discount to our assessment of future value.
U.S. markets mostly continued their upward trajectory from the March 2020 trough throughout the period. Positive news on vaccines kicked things off, exciting investors about the prospects of a return to normalcy. Additional fiscal and monetary support as well as strong corporate profits and continued low interest rates also kept the rally going. All these factors helped outweigh concerns about inflation, supply chain issues, labor shortages, and the surge of the COVID-19 Delta variant for much of the period.
Holdings in Information Technology, Industrials, and Health Care contributed the most. Real Estate investments detracted slightly.
Gartner, Inc. was the top contributor. After taking a hit during the pandemic due to the shutdown of its events business, shares of this provider of syndicated research increased on financial results that bested analyst forecasts. Growth in the research business has stabilized and is poised to return to double-digit levels. We expect improved revenue growth combined with renewed focus on cost control will drive margin expansion and enhanced free cash flow generation. Gartner’s balance sheet is in excellent shape, and we expect an acceleration in repurchases.
Clarivate Plc, a provider of IP and scientific information, tools, and services, was the top detractor. The stock fell on mixed financial results coupled with a broader rotation out of high-growth technology-related stocks that benefited earlier in the pandemic. The disclosure of a second request from the Federal Trade Commission on Clarivate’s pending acquisition of ProQuest also weighed on shares. We believe the ProQuest acquisition will close and Clarivate will be a steady earnings compounder with M&A optionality, which should drive solid returns over a multi-year period.
The economic and investment outlook is more uncertain than in the last few quarters. Headwinds, including supply chain disruptions, workforce shortages, rising interest rates, and inflation, seem less likely to resolve quickly. The Federal Reserve has signaled a less accommodating monetary policy going forward. These concerns notwithstanding, we still expect economic growth to be strong through the end of this year and into 2022 as the pandemic wanes and normalcy returns. We do believe inflation will stay elevated and interest rates will trend higher.
Even when the macroeconomic picture gets confusing, we believe the most important thing to focus on is the actual performance of our holdings. We think our companies will be able to handle near-term cost pressures and profits will revert to uptrends. None of the macro factors we discuss above should obscure the fact that we are in an era of great opportunity, and we believe our companies will continue to thrive and grow their value.
| † | Sector levels are provided from the Global Industry Classification Standard (“GICS”), developed and exclusively owned by MSCI, Inc. and Standard & Poor’s Financial Services LLC, unless otherwise stated that they have been reclassified or classified by the Adviser. All GICS data is provided “as is” with no warranties. |
| 1 | Performance information reflects results of the Retail Shares. |
7
| Baron Opportunity Fund (Unaudited) | September 30, 2021 |
COMPARISON OF THE CHANGE IN VALUE OF $10,000 INVESTMENT IN BARON OPPORTUNITY FUND† (RETAIL SHARES)
IN RELATION TO THE RUSSELL 3000 GROWTH INDEX AND THE S&P 500 INDEX

| AVERAGE ANNUAL TOTAL RETURNS FOR THE PERIODS ENDED SEPTEMBER 30, 2021 |
| |||||||||||||||||||
| One Year |
Three Years |
Five Years |
Ten Years |
Since Inception (February 29, 2000) |
||||||||||||||||
| Baron Opportunity Fund — Retail Shares1,2 |
33.58% | 33.88% | 32.60% | 21.19% | 10.60% | |||||||||||||||
| Baron Opportunity Fund — Institutional Shares1,2,3 |
33.91% | 34.26% | 32.95% | 21.52% | 10.77% | |||||||||||||||
| Baron Opportunity Fund — R6 Shares1,2,3 |
33.94% | 34.26% | 32.96% | 21.53% | 10.77% | |||||||||||||||
| Russell 3000 Growth Index1 |
27.57% | 21.27% | 22.30% | 19.40% | 6.96% | |||||||||||||||
| S&P 500 Index1 |
30.00% | 15.99% | 16.90% | 16.63% | 7.51% | |||||||||||||||
| † | The Fund’s 3-, 5-, and 10-year historical performance was impacted by gains from IPOs, and there is no guarantee that these results can be repeated or that the Fund’s level of participation in IPOs will be the same in the future. |
| 1 | The Russell 3000® Growth Index measures the performance of those companies classified as growth among the largest 3,000 U.S. companies, and the S&P 500 Index of 500 widely held large cap U.S. companies. The indexes and the Fund are with dividends reinvested, which positively impact the performance results. The indexes are unmanaged. The index performance is not Fund performance; one cannot invest directly into an index. |
| 2 | Past performance is not predictive of future performance. The performance data does not reflect the deduction of taxes that a shareholder would pay on Fund distributions or redemption of Fund shares. The Adviser reimburses certain Fund expenses pursuant to a contract expiring on August 29, 2032, unless renewed for another 11-year term and the Fund’s transfer agency expenses may be reduced by expense offsets from an unaffiliated transfer agent, without which performance would have been lower. |
| 3 | Performance for the Institutional Shares prior to May 29, 2009 is based on the performance of the Retail Shares. Performance for the R6 Shares prior to August 31, 2016 is based on the performance of the Institutional Shares, and prior to May 29, 2009 is based on the Retail Shares. The Retail Shares have a distribution fee, but Institutional Shares and R6 Shares do not. If the annual returns for the Institutional Shares and R6 Shares prior to May 29, 2009 did not reflect this fee, the returns would be higher. |
8
| September 30, 2021 (Unaudited) | Baron Opportunity Fund |
TOP TEN HOLDINGS AS OF SEPTEMBER 30, 2021
| Percent of Net Assets |
||||
| Microsoft Corporation |
8.6% | |||
| Alphabet Inc. |
6.5% | |||
| Amazon.com, Inc. |
4.9% | |||
| Tesla, Inc. |
3.3% | |||
| ZoomInfo Technologies Inc. |
3.0% | |||
| Acceleron Pharma Inc. |
2.8% | |||
| Ceridian HCM Holding Inc. |
2.7% | |||
| NVIDIA Corporation |
2.6% | |||
| Gartner, Inc. |
2.5% | |||
| argenx SE |
2.1% | |||
| 39.0% | ||||
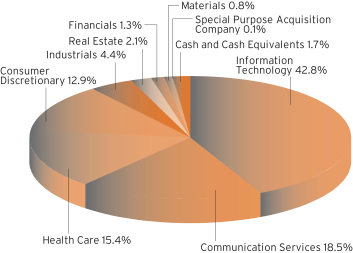
SECTOR BREAKDOWN AS OF SEPTEMBER 30, 2021†
(as a percentage of net assets)
MANAGEMENT’S DISCUSSION OF FUND PERFORMANCE
For the 12 months ended September 30, 2021, Baron Opportunity Fund1 increased 33.58%, while the Russell 3000 Growth Index increased 27.57% and the S&P 500 Index increased 30.00%.
Baron Opportunity Fund invests primarily in U.S. growth companies that we believe are driving or benefiting from innovation through development of pioneering, transformative, or technologically advanced products and services. The Fund invests in high-growth businesses of any market capitalization, selected for their capital appreciation potential.
U.S. markets mostly continued their upward trajectory from the March 2020 trough throughout the period. Positive news on vaccines kicked things off, exciting investors about the prospects of a return to normalcy. Additional fiscal and monetary support as well as strong corporate profits and continued low interest rates also kept the rally going. All these factors helped outweigh concerns about inflation, supply chain issues, labor shortages, and the surge of the COVID-19 Delta variant for much of the period.
Information Technology, Communication Services, and Health Care contributed the most. Financials and Real Estate detracted slightly.
Alphabet Inc. was the top contributor. Shares of the parent company of Google were up given continued recovery in advertising spend, strong cloud revenue growth, and improved cost controls. We maintain conviction in Alphabet’s merits as it continues to benefit from growth in mobile and online video advertising, which accrues to its core assets of search, YouTube, and the Google ad network. We are further encouraged by Alphabet’s investments in AI, autonomous driving (Waymo), and life sciences (Verily, Calico).
Alibaba Group Holding Limited was the top detractor. Alibaba is the largest retailer and e-commerce company in China. The company operates shopping platforms Taobao and Tmall and owns 33% of Ant Group, which operates Alipay, China’s largest third-party online payment provider. Shares were down given crackdowns by Chinese regulators on various aspects of digital technology and consumerism. We believe Alibaba’s core business remains highly profitable, complemented by rapid growth in the cloud business and inflection in the Cainiao logistics and New Retail segments.
This continues to be a time of significant unknowns. However, we don’t have to answer the unanswerable to deliver strong investment returns. Rather, we are focusing our research, analysis, and investment decisions, as we always do, on what we can know and what matters. This means identifying the durable secular growth trends we believe will drive economic growth regardless of short-term economic cycles or stock market gyrations as well as the companies with sustainable competitive advantages, profitable business models, and long-term-oriented managers driving or riding those trends. We establish and monitor short- and long-term price targets for all our holdings and target companies using internal projections of revenues, earnings, and free cash flow and appropriate multiples, and we buy or add to our stakes in these companies at prices where we believe we can deliver substantial returns.
| † | Sector levels are provided from the Global Industry Classification Standard (“GICS”), developed and exclusively owned by MSCI, Inc. and Standard & Poor’s Financial Services LLC, unless otherwise stated that they have been reclassified or classified by the Adviser. All GICS data is provided “as is” with no warranties. |
| 1 | Performance information reflects results of the Retail Shares. |
9
| Baron Fifth Avenue Growth Fund (Unaudited) | September 30, 2021 |
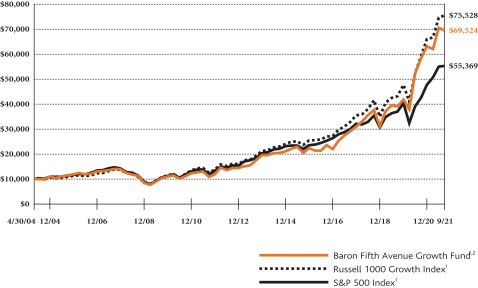
COMPARISON OF THE CHANGE IN VALUE OF $10,000 INVESTMENT IN BARON FIFTH AVENUE GROWTH FUND
(RETAIL SHARES) IN RELATION TO THE RUSSELL 1000 GROWTH INDEX AND THE S&P 500 INDEX
| AVERAGE ANNUAL TOTAL RETURNS FOR THE PERIODS ENDED SEPTEMBER 30, 2021 |
| |||||||||||||||||||
| One Year |
Three Years |
Five Years |
Ten Years |
Since Inception (April 30, 2004) |
||||||||||||||||
| Baron Fifth Avenue Growth Fund — Retail Shares1,2 |
19.13% | 22.62% | 24.20% | 20.34% | 11.78% | |||||||||||||||
| Baron Fifth Avenue Growth Fund — Institutional Shares1,2,3 |
19.44% | 22.93% | 24.52% | 20.65% | 11.98% | |||||||||||||||
| Baron Fifth Avenue Growth Fund — R6 Shares1,2,3 |
19.45% | 22.93% | 24.52% | 20.65% | 11.98% | |||||||||||||||
| Russell 1000 Growth Index1 |
27.32% | 22.00% | 22.84% | 19.68% | 12.31% | |||||||||||||||
| S&P 500 Index1 |
30.00% | 15.99% | 16.90% | 16.63% | 10.33% | |||||||||||||||
| 1 | The Russell 1000® Growth Index measures the performance of large-sized U.S. companies that are classified as growth and the S&P 500 Index of 500 widely held large cap U.S. companies. The indexes and the Fund are with dividends reinvested, which positively impact the performance results. The indexes are unmanaged. The index performance is not Fund performance; one cannot invest directly into an index. |
| 2 | Past performance is not predictive of future performance. The performance data does not reflect the deduction of taxes that a shareholder would pay on Fund distributions or redemption of Fund shares. The Adviser reimburses certain Fund expenses pursuant to a contract expiring on August 29, 2032, unless renewed for another 11-year term and the Fund’s transfer agency expenses may be reduced by expense offsets from an unaffiliated transfer agent, without which performance would have been lower. |
| 3 | Performance for the Institutional Shares prior to May 29, 2009 is based on the performance of the Retail Shares. Performance for the R6 Shares prior to January 29, 2016 is based on the performance of the Institutional Shares, and prior to May 29, 2009 is based on the Retail Shares. The Retail Shares have a distribution fee, but Institutional Shares and R6 Shares do not. If the annual returns for the Institutional Shares and R6 Shares prior to May 29, 2009 did not reflect this fee, the returns would be higher. |
10
| September 30, 2021 (Unaudited) | Baron Fifth Avenue Growth Fund |
TOP TEN HOLDINGS AS OF SEPTEMBER 30, 2021
| Percent of Net Assets |
||||
| Amazon.com, Inc. |
7.6% | |||
| Alphabet Inc. |
6.9% | |||
| ServiceNow, Inc. |
4.8% | |||
| Facebook, Inc. |
4.7% | |||
| EPAM Systems, Inc. |
4.3% | |||
| Adobe Inc. |
3.8% | |||
| Intuitive Surgical, Inc. |
3.7% | |||
| Veeva Systems Inc. |
3.5% | |||
| ASML Holding N.V. |
3.3% | |||
| Mastercard Incorporated |
3.2% | |||
| 45.8% | ||||
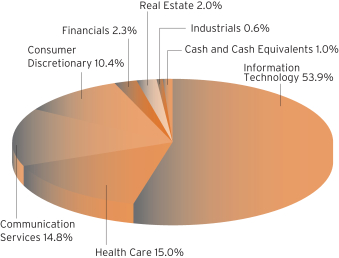
SECTOR BREAKDOWN AS OF SEPTEMBER 30, 2021†
(as a percentage of net assets)
MANAGEMENT’S DISCUSSION OF FUND PERFORMANCE
For the 12 months ended September 30, 2021, Baron Fifth Avenue Growth Fund1 increased 19.13%, while the Russell 1000 Growth Index increased 27.32% and the S&P 500 Index increased 30.00%.
Baron Fifth Avenue Growth Fund focuses on identifying and investing in what we believe are unique companies with sustainable competitive advantages and the ability to redeploy capital at high rates of return. The portfolio is constructed on a bottom-up basis, with the quality of ideas and conviction level the most important determinants of the size of each investment. We expect our highest conviction businesses to have meaningful weight in the portfolio. Sector weightings are incidental to portfolio construction, and sector exposure is a result of stock selection.
U.S. markets mostly continued their upward trajectory from the March 2020 trough throughout the period. Positive news on vaccines kicked things off, exciting investors about the prospects of a return to normalcy. Additional fiscal and monetary support as well as strong corporate profits and continued low interest rates also kept the rally going. All these factors helped outweigh concerns about inflation, supply chain issues, labor shortages, and the surge of the COVID-19 Delta variant for much of the period.
Information Technology, Communication Services, and Health Care holdings contributed the most. Industrials holdings detracted slightly.
Alphabet Inc. was the top contributor. Shares of the parent company of Google were up given continued recovery in advertising spend, strong cloud revenue growth, and improved cost controls. We maintain conviction in Alphabet’s merits as it continues to benefit from growth in mobile and online video advertising, which accrues to its core assets of search, YouTube, and the Google ad network. We are further encouraged by Alphabet’s investments in AI, autonomous driving (Waymo), and life sciences (Verily, Calico).
Alibaba Group Holding Limited was the top detractor. Alibaba is the largest retailer and e-commerce company in China. The company operates shopping platforms Taobao and Tmall and owns 33% of Ant Group, which operates Alipay, China’s largest third-party online payment provider. Shares were down given crackdowns by Chinese regulators on various aspects of digital technology and consumerism. We exited our position.
The economic and investment outlook is more uncertain than in the last few quarters. Headwinds, including supply chain disruptions, workforce shortages, rising interest rates, and inflation, seem less likely to resolve quickly. The Federal Reserve has signaled a less accommodating monetary policy going forward. These concerns notwithstanding, we still expect economic growth to be strong through the end of this year and into 2022 as the pandemic wanes and normalcy returns. We think our companies will be able to handle near-term cost pressures and profits will revert to uptrends. We do believe inflation will stay elevated and interest rates will trend higher.
Our goal remains to maximize long-term returns without taking significant risks of a permanent loss of capital. We are optimistic about the prospects of our investments and continue searching for new ideas while remaining patient and investing only when we believe companies are trading significantly below their intrinsic values.
| † | Sector levels are provided from the Global Industry Classification Standard (“GICS”), developed and exclusively owned by MSCI, Inc. and Standard & Poor’s Financial Services LLC, unless otherwise stated that they have been reclassified or classified by the Adviser. All GICS data is provided “as is” with no warranties. |
| 1 | Performance information reflects results of the Retail Shares. |
11
| Baron Discovery Fund (Unaudited) | September 30, 2021 |
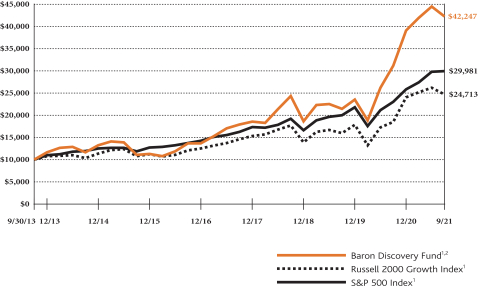
COMPARISON OF THE CHANGE IN VALUE OF $10,000 INVESTMENT IN BARON DISCOVERY FUND† (RETAIL SHARES)
IN RELATION TO THE RUSSELL 2000 GROWTH INDEX AND THE S&P 500 INDEX
| AVERAGE ANNUAL TOTAL RETURNS FOR THE PERIODS ENDED SEPTEMBER 30, 2021 |
| |||||||||||||||
| One Year |
Three Years |
Five Years |
Since Inception (September 30, 2013) |
|||||||||||||
| Baron Discovery Fund — Retail Shares1,2 |
35.61% | 20.16% | 25.23% | 19.74% | ||||||||||||
| Baron Discovery Fund — Institutional Shares1,2 |
35.97% | 20.48% | 25.55% | 20.03% | ||||||||||||
| Baron Discovery Fund — R6 Shares1,2,3 |
35.97% | 20.49% | 25.56% | 20.04% | ||||||||||||
| Russell 2000 Growth Index1 |
33.27% | 11.70% | 15.34% | 11.97% | ||||||||||||
| S&P 500 Index1 |
30.00% | 15.99% | 16.90% | 14.71% | ||||||||||||
| † | The Fund’s 1-, 3-, and 5-year historical performance was impacted by gains from IPOs, and there is no guarantee that these results can be repeated or that the Fund’s level of participation in IPOs will be the same in the future. |
| 1 | The Russell 2000® Growth Index measures the performance of small-sized U.S. companies that are classified as growth and the S&P 500 Index of 500 widely held large cap U.S. companies. The indexes and the Fund are with dividends reinvested, which positively impact the performance results. The indexes are unmanaged. The index performance is not Fund performance; one cannot invest directly into an index. |
| 2 | Past performance is not predictive of future performance. The performance data does not reflect the deduction of taxes that a shareholder would pay on Fund distributions or redemption of Fund shares. The Adviser reimburses certain Fund expenses pursuant to a contract expiring on August 29, 2032, unless renewed for another 11-year term and the Fund’s transfer agency expenses may be reduced by expense offsets from an unaffiliated transfer agent, without which performance would have been lower. |
| 3 | Performance for the R6 Shares prior to August 31, 2016 is based on the performance of the Institutional Shares. |
12
| September 30, 2021 (Unaudited) | Baron Discovery Fund |
TOP TEN HOLDINGS AS OF SEPTEMBER 30, 2021
| Percent of Net Assets |
||||
| Endava plc |
2.7% | |||
| The Beauty Health Company |
2.6% | |||
| Future plc |
2.3% | |||
| Mercury Systems, Inc. |
2.2% | |||
| S4 Capital plc |
2.2% | |||
| Progyny, Inc. |
2.1% | |||
| Floor & Decor Holdings, Inc. |
2.1% | |||
| Axonics, Inc. |
2.0% | |||
| Kinsale Capital Group, Inc. |
2.0% | |||
| Advanced Energy Industries, Inc. |
2.0% | |||
| 22.2% | ||||
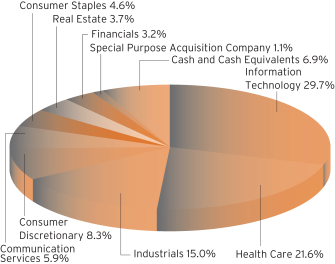
SECTOR BREAKDOWN AS OF SEPTEMBER 30, 2021†
(as a percentage of net assets)
MANAGEMENT’S DISCUSSION OF FUND PERFORMANCE
For the 12 months ended September 30, 2021, Baron Discovery Fund1 increased 35.61%, while the Russell 2000 Growth Index increased 33.27% and the S&P 500 Index increased 30.00%.
Baron Discovery Fund invests primarily in small-sized U.S. companies which at time of purchase have market capitalizations up to the largest market cap stock in the Russell 2000 Growth Index at June 30, or companies with market capitalizations up to $2.5 billion, whichever is larger.
U.S. markets mostly continued their upward trajectory from the March 2020 trough throughout the period. Positive news on vaccines kicked things off, exciting investors about the prospects of a return to normalcy. Additional fiscal and monetary support as well as strong corporate profits and continued low interest rates also kept the rally going. All these factors helped outweigh concerns about inflation, supply chain issues, labor shortages, and the surge of the COVID-19 Delta variant for much of the period.
Information Technology, Health Care, and Industrials contributed the most. Materials detracted slightly in the period.
Pacific Biosciences of California, Inc. (“PacBio”) was the top contributor. Shares of this provider of long-read DNA sequencing systems rose on increasing investor conviction around the potential for PacBio’s platform as it lowers sequencing costs and seeks to move beyond its current commercial niche. We sold our position as the stock price reached our longer-term price target.
Mercury Systems, Inc., a leading Tier 2 defense electronics integration company, was the top detractor. Shares were down along with the broader defense industry due to concerns that defense spending will be a lower priority under the new administration. In addition, management took down 2021 guidance due to some program delays. We believe Mercury will see organic re-acceleration as well as acquisitions and the share price is a bargain.
The economic and investment outlook is more uncertain than in the last few quarters. Headwinds, including supply chain disruptions, workforce shortages, rising interest rates, and inflation, seem less likely to resolve quickly. The Federal Reserve has signaled a less accommodating monetary policy going forward. These concerns notwithstanding, we still expect economic growth to be strong through the end of this year and into 2022 as the pandemic wanes and normalcy returns. We think our companies will be able to handle near-term cost pressures and profits will revert to uptrends. We do believe inflation will stay elevated and interest rates will trend higher.
Over the longer term, we remain encouraged by the prospects for our investments. We try not to be sidetracked by the macro “noise” and instead focus our energies on managing our existing investments and finding new ones. We continue to find high-quality, fast-growing small companies with significant stock appreciation potential.
| † | Sector levels are provided from the Global Industry Classification Standard (“GICS”), developed and exclusively owned by MSCI, Inc. and Standard & Poor’s Financial Services LLC, unless otherwise stated that they have been reclassified or classified by the Adviser. All GICS data is provided “as is” with no warranties. |
| 1 | Performance information reflects results of the Retail Shares. |
13
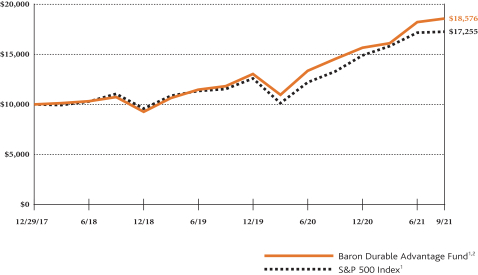
| Baron Durable Advantage Fund (Unaudited) | September 30, 2021 |
COMPARISON OF THE CHANGE IN VALUE OF $10,000 INVESTMENT IN BARON DURABLE ADVANTAGE FUND
(RETAIL SHARES) IN RELATION TO THE S&P 500 INDEX
| AVERAGE ANNUAL TOTAL RETURNS FOR THE PERIODS ENDED SEPTEMBER 30, 2021 |
| |||||||||||
| One Year |
Three Years |
Since Inception (December 29, 2017) |
||||||||||
| Baron Durable Advantage Fund — Retail Shares1,2 |
27.70% | 20.04% | 17.96% | |||||||||
| Baron Durable Advantage Fund — Institutional Shares1,2 |
28.01% | 20.31% | 18.23% | |||||||||
| Baron Durable Advantage Fund — R6 Shares1,2 |
28.01% | 20.32% | 18.21% | |||||||||
| S&P 500 Index1 |
30.00% | 15.99% | 15.66% | |||||||||
| 1 | The S&P 500 Index measures the performance of 500 widely held large cap U.S. companies. The index and the Fund are with dividends reinvested, which positively impact the performance results. The index is unmanaged. The index performance is not Fund performance; one cannot invest directly into an index. |
| 2 | Past performance is not predictive of future performance. The performance data does not reflect the deduction of taxes that a shareholder would pay on Fund distributions or redemption of Fund shares. The Adviser reimburses certain Fund expenses pursuant to a contract expiring on August 29, 2032, unless renewed for another 11-year term and the Fund’s transfer agency expenses may be reduced by expense offsets from an unaffiliated transfer agent, without which performance would have been lower. |
14
| September 30, 2021 (Unaudited) | Baron Durable Advantage Fund |
TOP TEN HOLDINGS AS OF SEPTEMBER 30, 2021
| Percent of Net Assets |
||||
| Microsoft Corporation |
8.9% | |||
| Alphabet Inc. |
7.4% | |||
| Facebook, Inc. |
5.1% | |||
| Danaher Corporation |
4.3% | |||
| UnitedHealth Group Incorporated |
4.2% | |||
| Adobe Inc. |
4.1% | |||
| Visa, Inc. |
4.0% | |||
| IHS Markit Ltd. |
3.5% | |||
| Mastercard Incorporated |
3.4% | |||
| Accenture plc |
3.3% | |||
| 48.2% | ||||
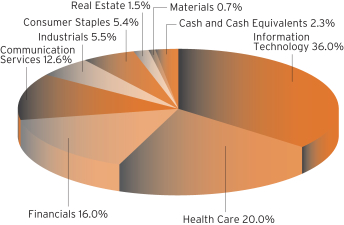
SECTOR BREAKDOWN AS OF SEPTEMBER 30, 2021†
(as a percentage of net assets)
MANAGEMENT’S DISCUSSION OF FUND PERFORMANCE
For the 12 months ended September 30, 2021, Baron Durable Advantage Fund1 increased 27.70% while the S&P 500 Index increased 30.00%.
Baron Durable Advantage Fund invests primarily in large-sized U.S. companies with competitive advantages and market capitalizations no smaller than the top 90th percentile by market capitalization of the S&P 500 Index at June 30, or companies with market capitalizations above $10 billion, whichever is smaller. The Fund emphasizes businesses with excess free cash flow that can be returned to shareholders.
U.S. markets mostly continued their upward trajectory from the March 2020 trough throughout the period. Positive news on vaccines kicked things off, exciting investors about the prospects of a return to normalcy. Additional fiscal and monetary support as well as strong corporate profits and continued low interest rates also kept the rally going. All these factors helped outweigh concerns about inflation, supply chain issues, labor shortages, and the surge of the COVID-19 Delta variant for much of the period.
Information Technology, Communication Services, and Health Care investments contributed the most. Consumer Discretionary holdings detracted slightly.
Alphabet Inc. was the top contributor. Shares of the parent company of Google were up given continued recovery in advertising spend, strong cloud revenue growth, and improved cost controls. We maintain conviction in Alphabet’s merits as it continues to benefit from growth in mobile and online video advertising, which accrues to its core assets of search, YouTube, and the Google ad network. We are further encouraged by Alphabet’s investments in AI, autonomous driving (Waymo), and life sciences (Verily, Calico).
AstraZeneca PLC was the top detractor. Shares of this multi-national pharmaceutical company were impacted by negative news involving AstraZeneca’s joint development with Oxford University of a viral-based COVID-19 vaccine. Given mixed results due to an unforeseen error in dosing that occurred in the Brazilian market, the vaccine timelines slipped, hurting share performance. We exited our position.
The economic and investment outlook is more uncertain than in the last few quarters. Headwinds, including supply chain disruptions, workforce shortages, rising interest rates, and inflation, seem less likely to resolve quickly. The Federal Reserve has signaled a less accommodating monetary policy going forward. These concerns notwithstanding, we still expect economic growth to be strong through the end of this year and into 2022 as the pandemic wanes and normalcy returns. We think our companies will be able to handle near-term cost pressures and profits will revert to uptrends. We do believe inflation will stay elevated and interest rates will trend higher.
We believe investing in great businesses at attractive valuations will enable us to earn excess risk-adjusted returns over the long term. We look for companies with strong and durable competitive advantages, proven track records of successful capital allocation, high returns on invested capital, and high free cash flow generation, a significant portion of which is regularly returned to shareholders as dividends or share repurchases. We are optimistic about the prospects of the companies we own while continuing to search for new ideas and opportunities.
| † | Sector levels are provided from the Global Industry Classification Standard (“GICS”), developed and exclusively owned by MSCI, Inc. and Standard & Poor’s Financial Services LLC, unless otherwise stated that they have been reclassified or classified by the Adviser. All GICS data is provided “as is” with no warranties. |
| 1 | Performance information reflects results of the Retail Shares. |
15
| Baron Asset Fund | September 30, 2021 |
|
SEPTEMBER 30, 2021
|
| Shares | Cost | Value | ||||||||||
| Common Stocks (98.54%) | ||||||||||||
| Communication Services (5.64%) | ||||||||||||
| Cable & Satellite (0.93%) |
| |||||||||||
| 330,000 | Liberty Broadband Corporation, Cl C1 |
$ | 23,532,283 | $ | 56,991,000 | |||||||
| Interactive Media & Services (4.71%) |
||||||||||||
| 450,000 | Pinterest, Inc., Cl A1 |
17,342,210 | 22,927,500 | |||||||||
| 1,378,144 | Tripadvisor, Inc.1 |
48,150,707 | 46,650,174 | |||||||||
| 1,287,965 | Zillow Group, Inc., Cl C1 |
44,039,787 | 113,521,235 | |||||||||
| 1,755,709 | ZoomInfo Technologies Inc., Cl A1 |
44,675,583 | 107,431,834 | |||||||||
|
|
|
|
|
|||||||||
| 154,208,287 | 290,530,743 | |||||||||||
|
|
|
|
|
|||||||||
| Total Communication Services |
177,740,570 | 347,521,743 | ||||||||||
|
|
|
|
|
|||||||||
| Consumer Discretionary (6.71%) | ||||||||||||
| Education Services (0.34%) |
||||||||||||
| 150,000 | Bright Horizons Family Solutions, Inc.1 |
16,921,054 | 20,913,000 | |||||||||
| Hotels, Resorts & Cruise Lines (1.80%) |
||||||||||||
| 546,442 | Choice Hotels International, Inc. |
5,198,084 | 69,053,876 | |||||||||
| 543,233 | Hyatt Hotels Corp., Cl A1 |
16,817,762 | 41,883,264 | |||||||||
|
|
|
|
|
|||||||||
| 22,015,846 | 110,937,140 | |||||||||||
| Internet & Direct Marketing Retail (1.30%) |
||||||||||||
| 1,000,000 | Farfetch Limited, Cl A1,2 |
28,985,121 | 37,480,000 | |||||||||
| 1,075,000 | Stitch Fix, Inc., Cl A1 |
63,486,884 | 42,946,250 | |||||||||
|
|
|
|
|
|||||||||
| 92,472,005 | 80,426,250 | |||||||||||
| Leisure Facilities (3.27%) |
| |||||||||||
| 603,538 | Vail Resorts, Inc.1,5 |
11,683,688 | 201,611,869 | |||||||||
|
|
|
|
|
|||||||||
| Total Consumer Discretionary |
143,092,593 | 413,888,259 | ||||||||||
|
|
|
|
|
|||||||||
| Financials (10.40%) | ||||||||||||
| Asset Management & Custody Banks (0.76%) |
||||||||||||
| 237,514 | T. Rowe Price Group, Inc. |
5,729,987 | 46,719,004 | |||||||||
| Financial Exchanges & Data (4.85%) |
||||||||||||
| 370,725 | FactSet Research Systems, Inc. |
19,898,420 | 146,354,816 | |||||||||
| 257,267 | MarketAxess Holdings, Inc. |
31,487,484 | 108,229,654 | |||||||||
| 30,000 | MSCI, Inc. |
7,783,774 | 18,250,200 | |||||||||
| 326,189 | Tradeweb Markets, Inc., Cl A |
11,978,713 | 26,349,547 | |||||||||
|
|
|
|
|
|||||||||
| 71,148,391 | 299,184,217 | |||||||||||
| Insurance Brokers (0.60%) |
||||||||||||
| 158,421 | Willis Towers Watson plc2 |
19,439,430 | 36,826,546 | |||||||||
| Investment Banking & Brokerage (2.16%) |
||||||||||||
| 1,825,936 | The Charles Schwab Corp. |
1,609,715 | 133,001,178 | |||||||||
| Property & Casualty Insurance (1.36%) |
||||||||||||
| 2,203,444 | Arch Capital Group Ltd.1,2 |
7,933,936 | 84,127,492 | |||||||||
| Regional Banks (0.67%) |
| |||||||||||
| 216,421 | First Republic Bank |
5,518,736 | 41,743,282 | |||||||||
|
|
|
|
|
|||||||||
| Total Financials |
111,380,195 | 641,601,719 | ||||||||||
|
|
|
|
|
|||||||||
| Shares | Cost | Value | ||||||||||
| Common Stocks (continued) | ||||||||||||
| Health Care (26.46%) | ||||||||||||
| Biotechnology (0.62%) |
| |||||||||||
| 136,925 | Acceleron Pharma, Inc.1 |
$ | 13,026,017 | $ | 23,564,793 | |||||||
| 48,366 | argenx SE, ADR1,2 |
15,852,353 | 14,606,532 | |||||||||
|
|
|
|
|
|||||||||
| 28,878,370 | 38,171,325 | |||||||||||
| Health Care Equipment (9.31%) |
||||||||||||
| 173,000 | DexCom, Inc.1 |
55,276,880 | 94,606,780 | |||||||||
| 673,630 | IDEXX Laboratories, Inc.1 |
12,186,829 | 418,930,497 | |||||||||
| 161,644 | Teleflex, Inc. |
29,645,959 | 60,867,048 | |||||||||
|
|
|
|
|
|||||||||
| 97,109,668 | 574,404,325 | |||||||||||
| Health Care Supplies (4.55%) |
||||||||||||
| 215,418 | The Cooper Companies, Inc. |
36,713,299 | 89,034,414 | |||||||||
| 50,000 | Warby Parker, Inc., Cl A1 |
2,704,500 | 2,652,500 | |||||||||
| 444,404 | West Pharmaceutical Services, Inc. |
19,259,047 | 188,667,274 | |||||||||
|
|
|
|
|
|||||||||
| 58,676,846 | 280,354,188 | |||||||||||
| Health Care Technolgy (2.15%) |
| |||||||||||
| 459,386 | Veeva Systems, Inc., Cl A1 |
27,115,596 | 132,381,264 | |||||||||
| Life Sciences Tools & Services (9.83%) |
||||||||||||
| 100,682 | 10X Genomics, Inc., Cl A1 |
3,926,598 | 14,657,285 | |||||||||
| 399,986 | Bio-Techne Corporation |
39,595,546 | 193,821,216 | |||||||||
| 336,000 | Guardant Health, Inc.1,4 |
29,804,184 | 42,003,360 | |||||||||
| 217,552 | Illumina, Inc.1 |
9,280,300 | 88,241,267 | |||||||||
| 194,117 | Mettler-Toledo International, Inc.1 |
11,674,111 | 267,368,991 | |||||||||
|
|
|
|
|
|||||||||
| 94,280,739 | 606,092,119 | |||||||||||
|
|
|
|
|
|||||||||
| Total Health Care |
306,061,219 | 1,631,403,221 | ||||||||||
|
|
|
|
|
|||||||||
| Industrials (13.58%) | ||||||||||||
| Environmental & Facilities Services (0.94%) |
||||||||||||
| 1,643,418 | Rollins, Inc. |
24,597,482 | 58,061,958 | |||||||||
| Industrial Conglomerates (1.90%) |
| |||||||||||
| 262,192 | Roper Technologies, Inc. |
27,877,853 | 116,971,717 | |||||||||
| Industrial Machinery (1.14%) |
| |||||||||||
| 340,760 | IDEX Corporation |
24,525,881 | 70,520,282 | |||||||||
| Research & Consulting Services (9.60%) |
||||||||||||
| 2,230,474 | Clarivate Plc1,2 |
35,903,681 | 48,847,380 | |||||||||
| 2,154,930 | CoStar Group, Inc.1 |
42,162,593 | 185,453,276 | |||||||||
| 1,468,500 | TransUnion |
79,691,638 | 164,927,235 | |||||||||
| 961,206 | Verisk Analytics, Inc. |
23,863,743 | 192,500,726 | |||||||||
|
|
|
|
|
|||||||||
| 181,621,655 | 591,728,617 | |||||||||||
|
|
|
|
|
|||||||||
| Total Industrials |
258,622,871 | 837,282,574 | ||||||||||
|
|
|
|
|
|||||||||
| Information Technology (30.81%) | ||||||||||||
| Application Software (15.20%) |
| |||||||||||
| 571,856 | ANSYS, Inc.1 |
20,310,482 | 194,688,375 | |||||||||
| 395,300 | Aspen Technology, Inc.1 |
40,628,908 | 48,542,840 | |||||||||
| 390,000 | Avalara, Inc.1 |
55,839,446 | 68,160,300 | |||||||||
| 1,636,093 | Ceridian HCM Holding, Inc.1 |
64,026,866 | 184,256,794 | |||||||||
| 609,340 | Clearwater Analytics Holdings, Inc., Cl A1 |
13,205,253 | 15,605,197 | |||||||||
| 125,000 | Fair Isaac Corp.1 |
51,657,237 | 49,741,250 | |||||||||
| 1,421,809 | Guidewire Software, Inc.1 |
77,473,157 | 169,010,436 | |||||||||
| 63,861 | HubSpot, Inc.1 |
38,242,458 | 43,175,784 | |||||||||
| 290,000 | RingCentral, Inc., Cl A1 |
65,867,482 | 63,075,000 | |||||||||
| 771,076 | SS&C Technologies Holdings, Inc. |
20,933,204 | 53,512,674 | |||||||||
| 669,000 | The Trade Desk, Inc., Cl A1 |
13,112,791 | 47,030,700 | |||||||||
|
|
|
|
|
|||||||||
| 461,297,284 | 936,799,350 | |||||||||||
| 16 | See Notes to Financial Statements. |
| September 30, 2021 | Baron Asset Fund |
STATEMENT OF NET ASSETS (Continued)
|
SEPTEMBER 30, 2021
|
| Shares | Cost | Value | ||||||||||
| Common Stocks (continued) | ||||||||||||
| Information Technology (continued) | ||||||||||||
| Data Processing & Outsourced Services (1.21%) |
||||||||||||
| 614,217 | Fidelity National Information Services, Inc. |
$ | 35,255,588 | $ | 74,737,925 | |||||||
| Electronic Components (1.07%) |
||||||||||||
| 900,000 | Amphenol Corp., Cl A |
42,881,684 | 65,907,000 | |||||||||
| Internet Services & Infrastructure (3.56%) |
||||||||||||
| 592,103 | Verisign, Inc.1 |
27,318,889 | 121,387,036 | |||||||||
| 500,000 | Wix.com Ltd.1,2 |
46,031,911 | 97,985,000 | |||||||||
|
|
|
|
|
|||||||||
| 73,350,800 | 219,372,036 | |||||||||||
| IT Consulting & Other Services (8.60%) |
||||||||||||
| 132,000 | EPAM Systems, Inc.1 |
75,568,309 | 75,303,360 | |||||||||
| 1,497,323 | Gartner, Inc.1 |
32,461,274 | 455,006,513 | |||||||||
|
|
|
|
|
|||||||||
| 108,029,583 | 530,309,873 | |||||||||||
| Technology Distributors (1.17%) |
||||||||||||
| 397,363 | CDW Corp. |
26,228,965 | 72,328,013 | |||||||||
|
|
|
|
|
|||||||||
| Total Information Technology |
747,043,904 | 1,899,454,197 | ||||||||||
|
|
|
|
|
|||||||||
| Materials (0.48%) | ||||||||||||
| Specialty Chemicals (0.48%) |
| |||||||||||
| 1,853,529 | Diversey Holdings Ltd.1,2 |
27,802,935 | 29,730,605 | |||||||||
|
|
|
|
|
|||||||||
| Real Estate (4.46%) | ||||||||||||
| Real Estate Services (0.86%) |
| |||||||||||
| 542,323 | CBRE Group, Inc., Cl A1 |
6,067,334 | 52,800,567 | |||||||||
| Specialized REITs (3.60%) |
||||||||||||
| 205,000 | Alexandria Real Estate Equities, Inc.4 |
30,958,643 | 39,169,350 | |||||||||
| 80,416 | Equinix, Inc. |
5,298,108 | 63,539,094 | |||||||||
| 360,856 | SBA Communications Corp. |
9,303,270 | 119,288,168 | |||||||||
|
|
|
|
|
|||||||||
| 45,560,021 | 221,996,612 | |||||||||||
|
|
|
|
|
|||||||||
| Total Real Estate |
51,627,355 | 274,797,179 | ||||||||||
|
|
|
|
|
|||||||||
| Total Common Stocks |
1,823,371,642 | 6,075,679,497 | ||||||||||
|
|
|
|
|
|||||||||
| Private Preferred Stocks (0.65%) | ||||||||||||
| Industrials (0.65%) | ||||||||||||
| Aerospace & Defense (0.65%) |
||||||||||||
| 96,298 | Space Exploration Technologies Corp., Cl N1,3,4,8 |
26,000,460 | 39,979,078 | |||||||||
|
|
|
|
|
|||||||||
| Principal Amount | Cost | Value | ||||||||||
| Short Term Investments (0.91%) | ||||||||||||
| $56,289,320 | Repurchase Agreement with Fixed Income Clearing Corp., dated 9/30/2021, 0.00% due 10/1/2021; Proceeds at maturity - $56,289,320; (Fully collateralized by $56,471,000 U.S. Treasury Note, 1.625% due 5/15/2031 Market value - $57,415,125)7 |
$ | 56,289,320 | $ | 56,289,320 | |||||||
|
|
|
|
|
|||||||||
| Total Investments (100.10%) |
$ | 1,905,661,422 | 6,171,947,895 | |||||||||
|
|
|
|||||||||||
| Liabilities Less Cash and Other Assets (-0.10%)6 |
(6,276,686 | ) | ||||||||||
|
|
|
|||||||||||
| Net Assets |
$ | 6,165,671,209 | ||||||||||
|
|
|
|||||||||||
| |
Retail Shares (Equivalent to $120.59 per
share |
|
$ | 2,871,697,681 | ||||||||
|
|
|
|||||||||||
| |
Institutional Shares (Equivalent to $126.47 per
share |
|
$ | 3,108,205,976 | ||||||||
|
|
|
|||||||||||
| |
R6 Shares (Equivalent to $126.45 per
share |
|
$ | 185,767,552 | ||||||||
|
|
|
|||||||||||
| % | Represents percentage of net assets. |
| 1 | Non-income producing securities. |
| 2 | Foreign corporation. |
| 3 | At September 30, 2021, the market value of restricted and fair valued securities amounted to $39,979,078 or 0.65% of net assets. This security is not deemed liquid. See Note 6 regarding Restricted Securities. |
| 4 | The Adviser has reclassified/classified certain securities in or out of this sub-industry. Such reclassifications/classifications are not supported by S&P or MSCI (unaudited). |
| 5 | All or a portion of these securities are segregated for an unfunded commitment. Total value of securities segregated is $15,032,250. |
| 6 | Includes net unrealized depreciation of $346,731 on an unfunded commitment with a special purpose acquisition company to purchase a when-issued private investment in a public entity. |
| 7 | Level 2 security. See Note 7 regarding Fair Value Measurements. |
| 8 | Level 3 security. See Note 7 regarding Fair Value Measurements. |
| ADR | American Depositary Receipt. |
All securities are Level 1, unless otherwise noted.
| See Notes to Financial Statements. | 17 |
| Baron Growth Fund | September 30, 2021 |
STATEMENT OF NET ASSETS
|
SEPTEMBER 30, 2021
|
| Shares | Cost | Value | ||||||||||
| Common Stocks (99.44%) | ||||||||||||
| Communication Services (4.05%) | ||||||||||||
| Alternative Carriers (3.42%) |
| |||||||||||
| 7,900,000 | Iridium Communications, Inc.1,4 |
$ | 48,702,979 | $ | 314,815,000 | |||||||
| Movies & Entertainment (0.63%) |
| |||||||||||
| 3,000,000 | Manchester United plc, Cl A2 |
40,663,063 | 58,110,000 | |||||||||
|
|
|
|
|
|||||||||
| Total Communication Services |
89,366,042 | 372,925,000 | ||||||||||
|
|
|
|
|
|||||||||
| Consumer Discretionary (21.47%) | ||||||||||||
| Casinos & Gaming (5.86%) |
| |||||||||||
| 440,000 | Boyd Gaming Corporation1 |
11,056,072 | 27,834,400 | |||||||||
| 5,860,000 | Penn National Gaming, Inc.1 |
76,269,257 | 424,615,600 | |||||||||
| 1,695,000 | Red Rock Resorts, Inc., Cl A1 |
31,464,689 | 86,817,900 | |||||||||
|
|
|
|
|
|||||||||
| 118,790,018 | 539,267,900 | |||||||||||
| Education Services (1.98%) |
||||||||||||
| 1,310,000 | Bright Horizons Family Solutions, Inc.1 |
41,415,154 | 182,640,200 | |||||||||
| Hotels, Resorts & Cruise Lines (6.27%) |
||||||||||||
| 3,000,000 | Choice Hotels International, Inc.4 |
72,782,127 | 379,110,000 | |||||||||
| 1,255,000 | Marriott Vacations Worldwide Corp. |
67,098,661 | 197,449,150 | |||||||||
|
|
|
|
|
|||||||||
| 139,880,788 | 576,559,150 | |||||||||||
| Leisure Facilities (7.26%) |
||||||||||||
| 2,000,000 | Vail Resorts, Inc.1,6 |
56,102,209 | 668,100,000 | |||||||||
| Restaurants (0.10%) |
||||||||||||
| 665,166 | Krispy Kreme, Inc.1 |
11,123,467 | 9,312,324 | |||||||||
|
|
|
|
|
|||||||||
| Total Consumer Discretionary |
367,311,636 | 1,975,879,574 | ||||||||||
|
|
|
|
|
|||||||||
| Financials (30.96%) | ||||||||||||
| Asset Management & Custody Banks (2.72%) |
||||||||||||
| 1,925,000 | The Carlyle Group, Inc. |
39,343,287 | 91,014,000 | |||||||||
| 1,900,000 | Cohen & Steers, Inc. |
41,176,154 | 159,163,000 | |||||||||
|
|
|
|
|
|||||||||
| 80,519,441 | 250,177,000 | |||||||||||
| Financial Exchanges & Data (18.88%) |
||||||||||||
| 1,200,000 | FactSet Research Systems, Inc. |
59,954,575 | 473,736,000 | |||||||||
| 980,000 | Morningstar, Inc. |
20,062,517 | 253,849,400 | |||||||||
| 1,660,000 | MSCI, Inc. |
31,110,586 | 1,009,844,400 | |||||||||
|
|
|
|
|
|||||||||
| 111,127,678 | 1,737,429,800 | |||||||||||
| Investment Banking & Brokerage (0.84%) |
||||||||||||
| 450,000 | Houlihan Lokey, Inc. |
19,625,873 | 41,445,000 | |||||||||
| 575,000 | Moelis & Co., Cl A |
10,512,876 | 35,575,250 | |||||||||
|
|
|
|
|
|||||||||
| 30,138,749 | 77,020,250 | |||||||||||
| Life & Health Insurance (2.71%) |
||||||||||||
| 1,625,000 | Primerica, Inc. |
34,117,583 | 249,648,750 | |||||||||
| Property & Casualty Insurance (5.56%) |
||||||||||||
| 9,165,000 | Arch Capital Group Ltd.1,2 |
28,618,247 | 349,919,700 | |||||||||
| 1,000,000 | Kinsale Capital Group, Inc. |
35,007,763 | 161,700,000 | |||||||||
|
|
|
|
|
|||||||||
| 63,626,010 | 511,619,700 | |||||||||||
| Thrifts & Mortgage Finance (0.25%) |
||||||||||||
| 520,000 | Essent Group Ltd.2 |
14,300,210 | 22,885,200 | |||||||||
|
|
|
|
|
|||||||||
| Total Financials |
333,829,671 | 2,848,780,700 | ||||||||||
|
|
|
|
|
|||||||||
| Shares | Cost | Value | ||||||||||
| Common Stocks (continued) | ||||||||||||
| Health Care (14.88%) | ||||||||||||
| Biotechnology (0.33%) |
||||||||||||
| 600,000 | Denali Therapeutics, Inc.1 |
$ | 11,149,573 | $ | 30,270,000 | |||||||
| Health Care Equipment (4.80%) |
||||||||||||
| 710,000 | IDEXX Laboratories, Inc.1 |
10,098,555 | 441,549,000 | |||||||||
| Health Care Supplies (2.96%) |
||||||||||||
| 1,147,434 | Neogen Corp.1 |
13,141,411 | 49,833,059 | |||||||||
| 525,000 | West Pharmaceutical Services, Inc. |
17,892,374 | 222,883,500 | |||||||||
|
|
|
|
|
|||||||||
| 31,033,785 | 272,716,559 | |||||||||||
| Health Care Technology (0.54%) |
||||||||||||
| 900,000 | Schrödinger, Inc.1 |
12,855,679 | 49,212,000 | |||||||||
| Life Sciences Tools & Services (5.83%) |
||||||||||||
| 300,000 | Adaptive Biotechnologies Corporation1 |
8,492,535 | 10,197,000 | |||||||||
| 845,000 | Bio-Techne Corporation |
44,647,907 | 409,461,650 | |||||||||
| 85,000 | Mettler-Toledo International, Inc.1 |
3,889,531 | 117,075,600 | |||||||||
|
|
|
|
|
|||||||||
| 57,029,973 | 536,734,250 | |||||||||||
| Pharmaceuticals (0.42%) |
||||||||||||
| 598,076 | Dechra Pharmaceuticals PLC (United Kingdom)2 |
18,422,044 | 39,083,614 | |||||||||
|
|
|
|
|
|||||||||
| Total Health Care |
140,589,609 | 1,369,565,423 | ||||||||||
|
|
|
|
|
|||||||||
| Industrials (7.90%) | ||||||||||||
| Building Products (2.05%) |
||||||||||||
| 1,850,000 | Trex Company, Inc.1 |
16,703,505 | 188,570,500 | |||||||||
| Environmental & Facilities Services (0.20%) |
||||||||||||
| 1,220,102 | BrightView Holdings, Inc.1 |
15,117,285 | 18,008,706 | |||||||||
| Industrial Machinery (0.61%) |
||||||||||||
| 4,275,000 | Marel hf (Netherlands)2 |
18,281,671 | 29,216,480 | |||||||||
| 3,303,044 | Velo3D, Inc.1,3,5,9 |
33,030,440 | 27,018,900 | |||||||||
|
|
|
|
|
|||||||||
| 51,312,111 | 56,235,380 | |||||||||||
| Research & Consulting Services (5.04%) |
||||||||||||
| 5,390,000 | CoStar Group, Inc.1 |
22,535,814 | 463,863,400 | |||||||||
|
|
|
|
|
|||||||||
| Total Industrials |
105,668,715 | 726,677,986 | ||||||||||
|
|
|
|
|
|||||||||
| Information Technology (14.50%) | ||||||||||||
| Application Software (9.12%) |
||||||||||||
| 725,000 | Altair Engineering, Inc., Cl A1 |
11,330,019 | 49,981,500 | |||||||||
| 1,150,000 | ANSYS, Inc.1 |
26,542,827 | 391,517,500 | |||||||||
| 1,025,000 | Guidewire Software, Inc.1 |
31,789,104 | 121,841,750 | |||||||||
| 1,000,000 | Pegasystems, Inc. |
13,997,009 | 127,100,000 | |||||||||
| 740,741 | SmartRent, Inc.1 |
7,407,410 | 9,644,448 | |||||||||
| 2,000,000 | SS&C Technologies Holdings, Inc. |
15,291,856 | 138,800,000 | |||||||||
|
|
|
|
|
|||||||||
| 106,358,225 | 838,885,198 | |||||||||||
| Electronic Components (0.18%) |
||||||||||||
| 60,000 | Littelfuse, Inc. |
6,452,400 | 16,396,200 | |||||||||
| IT Consulting & Other Services (5.20%) |
||||||||||||
| 1,575,000 | Gartner, Inc.1 |
22,061,706 | 478,611,000 | |||||||||
|
|
|
|
|
|||||||||
| Total Information Technology |
134,872,331 | 1,333,892,398 | ||||||||||
|
|
|
|
|
|||||||||
| 18 | See Notes to Financial Statements. |
| September 30, 2021 | Baron Growth Fund |
STATEMENT OF NET ASSETS (Continued)
|
SEPTEMBER 30, 2021
|
| Shares | Cost | Value | ||||||||||
| Common Stocks (continued) | ||||||||||||
| Materials (0.05%) | ||||||||||||
| Commodity Chemicals (0.05%) |
||||||||||||
| 418,777 | Zymergen, Inc., Series D1,3,9 |
$ | 9,350,000 | $ | 4,979,259 | |||||||
|
|
|
|
|
|||||||||
| Real Estate (5.63%) | ||||||||||||
| Diversified REITs (0.08%) |
||||||||||||
| 200,000 | American Assets Trust, Inc. |
3,437,272 | 7,484,000 | |||||||||
| Office REITs (1.27%) |
||||||||||||
| 3,700,000 | Douglas Emmett, Inc. |
39,249,426 | 116,957,000 | |||||||||
| Specialized REITs (4.28%) |
||||||||||||
| 750,000 | Alexandria Real Estate Equities, Inc.5 |
26,054,962 | 143,302,500 | |||||||||
| 5,400,000 | Gaming and Leisure Properties, Inc. |
114,745,147 | 250,128,000 | |||||||||
|
|
|
|
|
|||||||||
| 140,800,109 | 393,430,500 | |||||||||||
|
|
|
|
|
|||||||||
| Total Real Estate |
183,486,807 | 517,871,500 | ||||||||||
|
|
|
|
|
|||||||||
| Total Common Stocks |
1,364,474,811 | 9,150,571,840 | ||||||||||
|
|
|
|
|
|||||||||
| Private Convertible Preferred Stocks (0.45%) | ||||||||||||
| Industrials (0.18%) | ||||||||||||
| Electrical Components & Equipment (0.18%) |
||||||||||||
| 59,407,006 | Northvolt AB, Series E (Sweden)2,3,5,9 |
9,374,988 | 16,346,194 | |||||||||
|
|
|
|
|
|||||||||
| Materials (0.27%) | ||||||||||||
| Fertilizers & Agricultural Chemicals (0.27%) |
||||||||||||
| 80,440 | Farmers Business Network, Inc., Series G1,3,5,9 |
5,000,000 | 4,782,962 | |||||||||
| 341,838 | Farmers Business Network, Inc., Series F1,3,5,9 |
11,300,002 | 20,059,054 | |||||||||
|
|
|
|
|
|||||||||
| Total Materials |
16,300,002 | 24,842,016 | ||||||||||
|
|
|
|
|
|||||||||
| Total Private Convertible Preferred Stocks |
25,674,990 | 41,188,210 | ||||||||||
|
|
|
|
|
|||||||||
| Warrants (0.00%) | ||||||||||||
| Consumer Discretionary (0.00%) | ||||||||||||
| Hotels, Resorts & Cruise Lines (0.00%) |
||||||||||||
| 96,515 | OneSpaWorld Holdings Ltd. Warrants, Exp 3/19/20241,2,5 |
0 | 289,545 | |||||||||
|
|
|
|
|
|||||||||
| Principal Amount | Cost | Value | ||||||||||
| Short Term Investments (0.10%) | ||||||||||||
| $8,848,377 | Repurchase Agreement with Fixed Income Clearing Corp., dated 9/30/2021, 0.00% due 10/1/2021; Proceeds at maturity - $8,848,377; (Fully collateralized by $9,072,200 U.S. Treasury Note, 1.25% due 9/30/2028 Market value - $9,025,424)8 |
$ | 8,848,377 | $ | 8,848,377 | |||||||
|
|
|
|
|
|||||||||
| Total Investments (99.99%) |
$ | 1,398,998,178 | 9,200,897,972 | |||||||||
|
|
|
|||||||||||
| Cash and Other Assets Less Liabilities (0.01%)7 |
1,073,452 | |||||||||||
|
|
|
|||||||||||
| Net Assets |
$ | 9,201,971,424 | ||||||||||
|
|
|
|||||||||||
| |
Retail Shares (Equivalent to $117.64 per
share |
|
$ | 3,041,361,238 | ||||||||
|
|
|
|||||||||||
| |
Institutional Shares (Equivalent to $122.73 per
share |
|
$ | 5,934,832,087 | ||||||||
|
|
|
|||||||||||
| |
R6 Shares (Equivalent to $122.75 per
share |
|
$ | 225,778,099 | ||||||||
|
|
|
|||||||||||
| % | Represents percentage of net assets. |
| 1 | Non-income producing securities. |
| 2 | Foreign corporation. |
| 3 | At September 30, 2021, the market value of restricted and fair valued securities amounted to $73,186,369 or 0.80% of net assets. These securities are not deemed liquid. See Note 6 regarding Restricted Securities. |
| 4 | See Note 10 regarding “Affiliated” companies. |
| 5 | The Adviser has reclassified/classified certain securities in or out of this sub-industry. Such reclassifications/classifications are not supported by S&P or MSCI (unaudited). |
| 6 | All or a portion of these securities are segregated for an unfunded commitment. Total value of securities segregated is $26,389,950. |
| 7 | Includes net unrealized depreciation of $746,100 on unfunded commitments with special purpose acquisition companies to purchase when-issued private investments in a public entities. |
| 8 | Level 2 security. See Note 7 regarding Fair Value Measurements. |
| 9 | Level 3 security. See Note 7 regarding Fair Value Measurements. |
All securities are Level 1, unless otherwise noted.
| See Notes to Financial Statements. | 19 |
| Baron Small Cap Fund | September 30, 2021 |
STATEMENT OF NET ASSETS
|
SEPTEMBER 30, 2021
|
| Shares | Cost | Value | ||||||||||
| Common Stocks (99.93%) | ||||||||||||
| Communication Services (3.96%) | ||||||||||||
| Cable & Satellite (1.66%) |
||||||||||||
| 80,000 | Liberty Broadband Corporation, Cl A1 |
$ | 319,985 | $ | 13,468,000 | |||||||
| 260,000 | Liberty Broadband Corporation, Cl C1 |
1,017,091 | 44,902,000 | |||||||||
| 625,000 | Liberty Media Corp.-Liberty SiriusXM, Cl C1 |
1,322,731 | 29,668,750 | |||||||||
|
|
|
|
|
|||||||||
| 2,659,807 | 88,038,750 | |||||||||||
| Movies & Entertainment (2.30%) |
||||||||||||
| 1,250,000 | Liberty Media Corporation-Liberty Formula One, Cl C1 |
22,521,105 | 64,262,500 | |||||||||
| 225,000 | Madison Square Garden Entertainment Corp.1 |
3,552,159 | 16,350,750 | |||||||||
| 225,000 | Madison Square Garden Sports Corp.1 |
8,416,556 | 41,838,750 | |||||||||
|
|
|
|
|
|||||||||
| 34,489,820 | 122,452,000 | |||||||||||
|
|
|
|
|
|||||||||
| Total Communication Services |
37,149,627 | 210,490,750 | ||||||||||
|
|
|
|
|
|||||||||
| Consumer Discretionary (16.73%) | ||||||||||||
| Auto Parts & Equipment (0.96%) |
||||||||||||
| 4,250,000 | Holley, Inc.1 |
42,725,069 | 50,745,000 | |||||||||
| Casinos & Gaming (4.16%) |
||||||||||||
| 925,000 | DraftKings, Inc., Cl A1 |
11,844,047 | 44,548,000 | |||||||||
| 1,025,000 | Penn National Gaming, Inc.1 |
18,170,393 | 74,271,500 | |||||||||
| 2,000,000 | Red Rock Resorts, Inc., Cl A1 |
43,795,020 | 102,440,000 | |||||||||
|
|
|
|
|
|||||||||
| 73,809,460 | 221,259,500 | |||||||||||
| Education Services (1.64%) |
||||||||||||
| 625,000 | Bright Horizons Family Solutions, Inc.1 |
19,174,147 | 87,137,500 | |||||||||
| General Merchandise Stores (0.62%) |
|
|||||||||||
| 550,000 | Ollie’s Bargain Outlet Holdings, Inc.1 |
32,232,509 | 33,154,000 | |||||||||
| Home Improvement Retail (2.84%) |
|
|||||||||||
| 1,250,000 | Floor & Decor Holdings, Inc., Cl A1 |
44,151,665 | 150,987,500 | |||||||||
| Homebuilding (3.02%) |
||||||||||||
| 1,500,000 | Installed Building Products, Inc.4 |
83,052,523 | 160,725,000 | |||||||||
| Hotels, Resorts & Cruise Lines (0.47%) |
|
|||||||||||
| 2,000,000 | Membership Collective Group, Inc., Cl A1 |
27,900,478 | 24,880,000 | |||||||||
| Leisure Facilities (1.18%) |
||||||||||||
| 800,000 | Planet Fitness, Inc., Cl A1 |
28,416,505 | 62,840,000 | |||||||||
| Restaurants (1.31%) |
||||||||||||
| 1,100,000 | The Cheesecake Factory, Inc.1 |
26,921,175 | 51,700,000 | |||||||||
| 418,182 | Dutch Bros, Inc., Cl A1 |
9,618,186 | 18,115,644 | |||||||||
|
|
|
|
|
|||||||||
| 36,539,361 | 69,815,644 | |||||||||||
| Specialized Consumer Services (0.53%) |
|
|||||||||||
| 1,000,000 | European Wax Center, Inc., Cl A1 |
17,067,333 | 28,010,000 | |||||||||
|
|
|
|
|
|||||||||
| Total Consumer Discretionary |
405,069,050 | 889,554,144 | ||||||||||
|
|
|
|
|
|||||||||
| Consumer Staples (0.97%) | ||||||||||||
| Packaged Foods & Meats (0.97%) |
|
|||||||||||
| 3,000,000 | UTZ Brands, Inc. |
49,020,000 | 51,390,000 | |||||||||
|
|
|
|
|
|||||||||
| Shares | Cost | Value | ||||||||||
| Common Stocks (continued) | ||||||||||||
| Financials (4.41%) | ||||||||||||
| Insurance Brokers (1.88%) |
||||||||||||
| 3,000,000 | BRP Group, Inc., Cl A1 |
$ | 48,364,954 | $ | 99,870,000 | |||||||
| Investment Banking & Brokerage (1.08%) |
||||||||||||
| 625,000 | Houlihan Lokey, Inc. |
28,909,333 | 57,562,500 | |||||||||
| Property & Casualty Insurance (1.45%) |
|
|||||||||||
| 475,000 | Kinsale Capital Group, Inc. |
67,820,848 | 76,807,500 | |||||||||
|
|
|
|
|
|||||||||
| Total Financials |
145,095,135 | 234,240,000 | ||||||||||
|
|
|
|
|
|||||||||
| Health Care (15.62%) | ||||||||||||
| Health Care Equipment (7.21%) |
||||||||||||
| 1,000,000 | Axonics, Inc.1 |
35,459,918 | 65,090,000 | |||||||||
| 300,000 | CryoPort, Inc.1 |
13,683,573 | 19,953,000 | |||||||||
| 200,000 | DexCom, Inc.1 |
2,652,860 | 109,372,000 | |||||||||
| 95,000 | IDEXX Laboratories, Inc.1 |
1,314,205 | 59,080,500 | |||||||||
| 320,000 | Inspire Medical Systems, Inc.1,5 |
16,558,159 | 74,521,600 | |||||||||
| 1,000,000 | Silk Road Medical, Inc.1,5 |
38,972,604 | 55,030,000 | |||||||||
|
|
|
|
|
|||||||||
| 108,641,319 | 383,047,100 | |||||||||||
| Health Care Supplies (0.35%) |
||||||||||||
| 500,000 | Figs, Inc., Cl A1 |
12,760,012 | 18,570,000 | |||||||||
| Life Sciences Tools & Services (5.86%) |
||||||||||||
| 250,000 | Guardant Health, Inc.1,5 |
4,953,266 | 31,252,500 | |||||||||
| 750,000 | ICON plc1,2 |
49,241,341 | 196,515,000 | |||||||||
| 2,652,592 | MaxCyte, Inc. (United Kingdom)1,5,6 |
31,357,616 | 32,353,980 | |||||||||
| 37,500 | Mettler-Toledo International, Inc.1 |
1,817,455 | 51,651,000 | |||||||||
|
|
|
|
|
|||||||||
| 87,369,678 | 311,772,480 | |||||||||||
| Managed Health Care (0.97%) |
||||||||||||
| 800,000 | HealthEquity, Inc.1 |
13,208,487 | 51,808,000 | |||||||||
| Pharmaceuticals (1.23%) |
||||||||||||
| 1,000,000 | Dechra Pharmaceuticals PLC (United Kingdom)2 |
28,027,985 | 65,348,909 | |||||||||
|
|
|
|
|
|||||||||
| Total Health Care |
250,007,481 | 830,546,489 | ||||||||||
|
|
|
|
|
|||||||||
| Industrials (23.71%) | ||||||||||||
| Aerospace & Defense (3.35%) |
||||||||||||
| 2,350,000 | Kratos Defense & Security Solutions, Inc.1 |
35,335,984 | 52,428,500 | |||||||||
| 1,000,000 | Mercury Systems, Inc.1 |
25,872,953 | 47,420,000 | |||||||||
| 125,000 | TransDigm Group, Inc.1 |
0 | 78,071,250 | |||||||||
|
|
|
|
|
|||||||||
| 61,208,937 | 177,919,750 | |||||||||||
| Building Products (2.83%) |
||||||||||||
| 1,090,609 | TheThe AZEK Co., Inc.1 |
25,084,007 | 39,839,947 | |||||||||
| 3,000,000 | Janus International |
30,000,000 | 36,720,000 | |||||||||
| 725,000 | Trex Company, Inc.1 |
27,101,408 | 73,899,250 | |||||||||
|
|
|
|
|
|||||||||
| 82,185,415 | 150,459,197 | |||||||||||
| Diversified Support Services (1.00%) |
||||||||||||
| 1,850,000 | Driven Brands Holdings, Inc.1 |
45,803,401 | 53,446,500 | |||||||||
| Electrical Components & Equipment (3.46%) |
||||||||||||
| 1,200,000 | Shoals Technologies Group, Inc., Cl A1 |
32,825,720 | 33,456,000 | |||||||||
| 6,250,000 | Vertiv Holdings Co. |
61,620,882 | 150,562,500 | |||||||||
|
|
|
|
|
|||||||||
| 94,446,602 | 184,018,500 | |||||||||||
| 20 | See Notes to Financial Statements. |
| September 30, 2021 | Baron Small Cap Fund |
STATEMENT OF NET ASSETS (Continued)
|
SEPTEMBER 30, 2021
|
| Shares | Cost | Value | ||||||||||
| Common Stocks (continued) | ||||||||||||
| Industrials (continued) | ||||||||||||
| Environmental & Facilities Services (1.18%) |
||||||||||||
| 500,000 | Waste Connections, Inc.2 |
$ | 21,833,333 | $ | 62,965,000 | |||||||
| Human Resource & Employment Services (3.93%) |
||||||||||||
| 1,550,000 | ASGN, Inc.1 |
34,021,695 | 175,367,000 | |||||||||
| 1,750,000 | First Advantage Corp.1 |
26,390,061 | 33,337,500 | |||||||||
|
|
|
|
|
|||||||||
| 60,411,756 | 208,704,500 | |||||||||||
| Industrial Machinery (2.22%) |
||||||||||||
| 500,000 | John Bean Technologies Corp. |
42,775,112 | 70,275,000 | |||||||||
| 225,000 | RBC Bearings, Incorporated1 |
24,593,639 | 47,745,000 | |||||||||
|
|
|
|
|
|||||||||
| 67,368,751 | 118,020,000 | |||||||||||
| Research & Consulting Services (1.65%) |
|
|||||||||||
| 4,000,000 | Clarivate Plc1,2 |
44,078,833 | 87,600,000 | |||||||||
| Trading Companies & Distributors (4.09%) |
||||||||||||
| 3,250,000 | Hillman Solutions Corp.1,5 |
37,752,933 | 38,772,500 | |||||||||
| 500,000 | Hydrofarm Holdings Group, Inc.1,5 |
23,336,421 | 18,925,000 | |||||||||
| 800,000 | SiteOne Landscape Supply, Inc.1 |
19,405,950 | 159,576,000 | |||||||||
|
|
|
|
|
|||||||||
| 80,495,304 | 217,273,500 | |||||||||||
|
|
|
|
|
|||||||||
| Total Industrials |
557,832,332 | 1,260,406,947 | ||||||||||
|
|
|
|
|
|||||||||
| Information Technology (28.69%) | ||||||||||||
| Application Software (11.16%) |
||||||||||||
| 750,000 | Altair Engineering, Inc., Cl A1 |
11,935,619 | 51,705,000 | |||||||||
| 800,000 | Aspen Technology, Inc.1 |
29,983,938 | 98,240,000 | |||||||||
| 850,000 | Ceridian HCM Holding, Inc.1 |
23,711,721 | 95,727,000 | |||||||||
| 500,000 | Clearwater Analytics Holdings, Inc., Cl A1 |
10,820,073 | 12,805,000 | |||||||||
| 5,000,000 | E2open Parent Holdings, Inc.1 |
50,859,472 | 56,500,000 | |||||||||
| 1,886,792 | E2open Parent Holdings, Inc., Cl A1,3,7 |
19,999,995 | 20,547,165 | |||||||||
| 1,225,000 | Guidewire Software, Inc.1 |
31,269,358 | 145,615,750 | |||||||||
| 3,500,000 | SmartRent, Inc. (formerly, Fifth Wall Acquisition Corp. I)1,5 |
38,625,571 | 45,570,000 | |||||||||
| 950,000 | The Trade Desk, Inc., Cl A1 |
3,372,500 | 66,785,000 | |||||||||
|
|
|
|
|
|||||||||
| 220,578,247 | 593,494,915 | |||||||||||
| Data Processing & Outsourced Services (5.53%) |
||||||||||||
| 750,000 | Nuvei Corp., (Canada), 144A1,2 |
20,780,312 | 86,640,000 | |||||||||
| 3,500,000 | Paya Holdings, Inc., Cl A1 |
36,561,336 | 38,045,000 | |||||||||
| 3,500,000 | Repay Holdings Corporation1 |
30,228,850 | 80,605,001 | |||||||||
| 405,170 | Shift4 Payments, Inc., Cl A1 |
9,677,975 | 31,408,778 | |||||||||
| 325,000 | WEX, Inc.1 |
13,547,002 | 57,245,500 | |||||||||
|
|
|
|
|
|||||||||
| 110,795,475 | 293,944,279 | |||||||||||
| Electronic Equipment & Instruments (1.81%) |
|
|||||||||||
| 1,200,000 | Cognex Corp. |
9,420,069 | 96,264,000 | |||||||||
| Internet Services & Infrastructure (1.11%) |
|
|||||||||||
| 300,000 | Wix.com Ltd.1,2 |
15,501,799 | 58,791,000 | |||||||||
| IT Consulting & Other Services (8.58%) |
|
|||||||||||
| 750,000 | Endava plc, ADR1,2 |
23,557,249 | 101,887,500 | |||||||||
| 950,000 | Gartner, Inc.1 |
14,034,173 | 288,686,000 | |||||||||
| 2,250,000 | Grid Dynamics Holdings, Inc.1 |
22,274,704 | 65,745,000 | |||||||||
|
|
|
|
|
|||||||||
| 59,866,126 | 456,318,500 | |||||||||||
| Systems Software (0.50%) |
||||||||||||
| 682,429 | Jamf Holding Corp.1,5 |
19,287,457 | 26,287,165 | |||||||||
|
|
|
|
|
|||||||||
| Total Information Technology |
435,449,173 | 1,525,099,859 | ||||||||||
|
|
|
|
|
|||||||||
| Shares | Cost | Value | ||||||||||
| Common Stocks (continued) | ||||||||||||
| Materials (2.49%) | ||||||||||||
| Metal & Glass Containers (0.91%) |
|
|||||||||||
| 800,000 | Berry Global Group, Inc.1 |
$ | 12,652,147 | $ | 48,704,000 | |||||||
| Specialty Chemicals (1.58%) |
||||||||||||
| 1,809,631 | Avient Corp. |
57,788,524 | 83,876,396 | |||||||||
|
|
|
|
|
|||||||||
| Total Materials |
70,440,671 | 132,580,396 | ||||||||||
|
|
|
|
|
|||||||||
| Real Estate (3.35%) | ||||||||||||
| Specialized REITs (3.35%) |
||||||||||||
| 2,500,000 | Americold Realty Trust5 |
51,727,682 | 72,625,000 | |||||||||
| 320,000 | SBA Communications Corp. |
1,289,008 | 105,782,400 | |||||||||
|
|
|
|
|
|||||||||
| Total Real Estate |
53,016,690 | 178,407,400 | ||||||||||
|
|
|
|
|
|||||||||
| Total Common Stocks |
2,003,080,159 | 5,312,715,985 | ||||||||||
|
|
|
|
|
|||||||||
| Principal Amount | ||||||||||||
| Short Term Investments (0.06%) | ||||||||||||
| $2,983,303 | Repurchase Agreement with Fixed Income Clearing Corp., dated 9/30/2021, 0.00% due 10/1/2021; Proceeds at maturity - $2,983,303; (Fully collateralized by $2,904,600 U.S. Treasury Bond, 2.25% due 5/15/2041 Market value - $3,043,023)6 |
2,983,303 | 2,983,303 | |||||||||
|
|
|
|
|
|||||||||
| Total Investments (99.99%) |
$ | 2,006,063,462 | 5,315,699,288 | |||||||||
|
|
|
|||||||||||
| Cash and Other Assets Less Liabilities (0.01%) |
757,259 | |||||||||||
|
|
|
|||||||||||
| Net Assets |
$ | 5,316,456,547 | ||||||||||
|
|
|
|||||||||||
| |
Retail Shares (Equivalent to $40.67 per
share |
|
$ | 1,829,446,479 | ||||||||
|
|
|
|||||||||||
| |
Institutional Shares (Equivalent to $43.12 per
share |
|
$ | 3,214,212,037 | ||||||||
|
|
|
|||||||||||
| |
R6 Shares (Equivalent to $43.10 per
share |
|
$ | 272,798,031 | ||||||||
|
|
|
|||||||||||
| % | Represents percentage of net assets. |
| 1 | Non-income producing securities. |
| 2 | Foreign corporation. |
| 3 | At September 30, 2021, the market value of restricted and fair valued securities amounted to $20,547,165 or 0.39% of net assets. This security is not deemed liquid. See Note 6 regarding Restricted Securities. |
| 4 | See Note 10 regarding “Affiliated” companies. |
| 5 | The Adviser has reclassified/classified certain securities in or out of this sub-industry. Such reclassifications/classifications are not supported by S&P or MSCI (unaudited). |
| 6 | Level 2 security. See Note 7 regarding Fair Value Measurements. |
| 7 | Level 3 security. See Note 7 regarding Fair Value Measurements. |
| ADR | American Depositary Receipt. |
| 144A | Security is exempt from registration pursuant to Rule 144A under the Securities Act of 1933. This security may be resold in transactions that are exempt from registration, normally to qualified institutional buyers. At September 30, 2021, the market value of Rule 144A securities amounted to $86,640,000 or 1.63% of net assets. |
All securities are Level 1, unless otherwise noted.
| See Notes to Financial Statements. | 21 |
| Baron Opportunity Fund | September 30, 2021 |
STATEMENT OF NET ASSETS
|
SEPTEMBER 30, 2021
|
| Shares | Cost | Value | ||||||||||
| Common Stocks (95.00%) | ||||||||||||
| Communication Services (18.54%) | ||||||||||||
| Interactive Home Entertainment (1.45%) |
|
|||||||||||
| 114,000 | Electronic Arts, Inc. |
$ | 13,119,491 | $ | 16,216,500 | |||||||
| 47,500 | Take-Two Interactive Software, Inc.1 |
5,288,028 | 7,318,325 | |||||||||
|
|
|
|
|
|||||||||
| 18,407,519 | 23,534,825 | |||||||||||
| Interactive Media & Services (15.01%) |
|
|||||||||||
| 39,550 | Alphabet, Inc., Cl C1,5 |
53,222,693 | 105,413,011 | |||||||||
| 321,000 | Pinterest, Inc., Cl A1 |
8,876,431 | 16,354,950 | |||||||||
| 428,000 | Snap, Inc., Cl A1 |
6,424,269 | 31,616,360 | |||||||||
| 699,406 | Tripadvisor, Inc.1 |
23,476,136 | 23,674,893 | |||||||||
| 199,303 | Zillow Group, Inc., Cl C1 |
12,604,492 | 17,566,566 | |||||||||
| 778,369 | ZoomInfo Technologies Inc., Cl A1 |
25,572,629 | 47,628,399 | |||||||||
|
|
|
|
|
|||||||||
| 130,176,650 | 242,254,179 | |||||||||||
| Movies & Entertainment (2.08%) |
||||||||||||
| 650,000 | Endeavor Group Holdings, Inc., Cl A1 |
15,600,000 | 18,635,500 | |||||||||
| 24,425 | Netflix, Inc.1 |
3,966,732 | 14,907,555 | |||||||||
|
|
|
|
|
|||||||||
| 19,566,732 | 33,543,055 | |||||||||||
|
|
|
|
|
|||||||||
| Total Communication Services |
168,150,901 | 299,332,059 | ||||||||||
|
|
|
|
|
|||||||||
| Consumer Discretionary (11.57%) | ||||||||||||
| Automobile Manufacturers (3.26%) |
|
|||||||||||
| 67,900 | Tesla, Inc.1 |
2,677,714 | 52,655,092 | |||||||||
| Education Services (0.84%) |
||||||||||||
| 1,350,000 | Nerdy, Inc.1,4 |
15,485,331 | 13,486,500 | |||||||||
| Internet & Direct Marketing Retail (7.47%) |
|
|||||||||||
| 35,000 | Alibaba Group Holding Ltd. ADR1,2 |
2,433,089 | 5,181,750 | |||||||||
| 24,275 | Amazon.com, Inc.1 |
29,742,115 | 79,744,346 | |||||||||
| 8,529 | MercadoLibre, Inc.1 |
4,838,488 | 14,323,603 | |||||||||
| 533,000 | Stitch Fix, Inc., Cl A1 |
28,973,389 | 21,293,350 | |||||||||
|
|
|
|
|
|||||||||
| 65,987,081 | 120,543,049 | |||||||||||
|
|
|
|
|
|||||||||
| Total Consumer Discretionary |
84,150,126 | 186,684,641 | ||||||||||
|
|
|
|
|
|||||||||
| Financials (1.33%) | ||||||||||||
| Consumer Finance (0.97%) |
||||||||||||
| 990,099 | SoFi Technologies, Inc.1 |
9,900,990 | 15,722,772 | |||||||||
| Financial Exchanges & Data (0.36%) |
|
|||||||||||
| 13,600 | MarketAxess Holdings, Inc. |
2,665,441 | 5,721,384 | |||||||||
|
|
|
|
|
|||||||||
| Total Financials |
12,566,431 | 21,444,156 | ||||||||||
|
|
|
|
|
|||||||||
| Health Care (15.39%) | ||||||||||||
| Biotechnology (7.82%) |
||||||||||||
| 265,779 | Acceleron Pharma, Inc.1 |
22,137,670 | 45,740,566 | |||||||||
| 113,639 | argenx SE, ADR1,2 |
13,172,425 | 34,318,978 | |||||||||
| 487,600 | Arrowhead Pharmaceuticals, Inc.1 |
22,064,385 | 30,440,868 | |||||||||
| 141,086 | Natera, Inc.1,4 |
16,131,117 | 15,722,624 | |||||||||
|
|
|
|
|
|||||||||
| 73,505,597 | 126,223,036 | |||||||||||
| Health Care Equipment (4.04%) |
||||||||||||
| 525,000 | Butterfly Network, Inc.1 |
5,250,000 | 5,481,000 | |||||||||
| 131,100 | Edwards Lifesciences Corp.1 |
7,561,453 | 14,841,831 | |||||||||
| 17,235 | Intuitive Surgical, Inc.1 |
7,296,036 | 17,134,175 | |||||||||
| 134,500 | Shockwave Medical, Inc.1 |
6,674,952 | 27,690,860 | |||||||||
|
|
|
|
|
|||||||||
| 26,782,441 | 65,147,866 | |||||||||||
| Health Care Supplies (0.38%) |
||||||||||||
| 165,779 | Figs, Inc., Cl A1 |
5,156,730 | 6,157,032 | |||||||||
| Health Care Technology (0.39%) |
||||||||||||
| 116,374 | Schrödinger, Inc.1 |
2,485,556 | 6,363,330 | |||||||||
| Shares | Cost | Value | ||||||||||
| Common Stocks (continued) | ||||||||||||
| Health Care (continued) | ||||||||||||
| Life Sciences Tools & Services (2.76%) |
|
|||||||||||
| 50,419 | 10X Genomics, Inc., Cl A1 |
$ | 3,006,785 | $ | 7,339,998 | |||||||
| 235,096 | CareDx, Inc.1,4 |
7,719,306 | 14,898,034 | |||||||||
| 98,637 | Guardant Health, Inc.1,4 |
10,366,504 | 12,330,611 | |||||||||
| 24,415 | Illumina, Inc.1 |
3,703,768 | 9,902,968 | |||||||||
|
|
|
|
|
|||||||||
| 24,796,363 | 44,471,611 | |||||||||||
|
|
|
|
|
|||||||||
| Total Health Care |
132,726,687 | 248,362,875 | ||||||||||
|
|
|
|
|
|||||||||
| Industrials (3.18%) | ||||||||||||
| Aerospace & Defense (0.94%) |
||||||||||||
| 682,969 | Kratos Defense & Security Solutions, Inc.1 |
11,162,207 | 15,237,038 | |||||||||
| Industrial Machinery (0.56%) |
| |||||||||||
| 836,708 | Markforged Holding Corp.1 |
7,237,382 | 5,488,805 | |||||||||
| 425,000 | Velo3D, Inc.1,4 |
4,238,907 | 3,557,250 | |||||||||
|
|
|
|
|
|||||||||
| 11,476,289 | 9,046,055 | |||||||||||
| Research & Consulting Services (1.68%) |
|
|||||||||||
| 315,330 | CoStar Group, Inc. 1 |
12,772,623 | 27,137,300 | |||||||||
|
|
|
|
|
|||||||||
| Total Industrials |
35,411,119 | 51,420,393 | ||||||||||
|
|
|
|
|
|||||||||
| Information Technology (42.78%) | ||||||||||||
| Application Software (14.14%) |
| |||||||||||
| 34,900 | Adobe, Inc.1 |
8,174,023 | 20,092,628 | |||||||||
| 49,000 | Atlassian Corp. PLC, Cl A1,2 |
11,935,490 | 19,179,580 | |||||||||
| 75,000 | Avalara, Inc.1 |
10,855,775 | 13,107,750 | |||||||||
| 383,070 | Ceridian HCM Holding, Inc.1 |
28,971,891 | 43,141,344 | |||||||||
| 69,346 | Clearwater Analytics Holdings, Inc., Cl A1 |
1,248,228 | 1,775,951 | |||||||||
| 232,100 | Guidewire Software, Inc.1 |
11,878,404 | 27,589,727 | |||||||||
| 25,000 | HubSpot, Inc.1 |
13,504,652 | 16,902,250 | |||||||||
| 108,100 | RingCentral, Inc., Cl A1 |
20,153,567 | 23,511,750 | |||||||||
| 39,500 | ServiceNow, Inc.1,4 |
9,588,431 | 24,579,665 | |||||||||
| 333,283 | SimilarWeb Ltd.1,2 |
7,167,469 | 6,975,613 | |||||||||
| 116,910 | The Trade Desk, Inc., Cl A1 |
278,394 | 8,218,773 | |||||||||
| 92,900 | Workday, Inc., Cl A1 |
22,587,105 | 23,214,781 | |||||||||
|
|
|
|
|
|||||||||
| 146,343,429 | 228,289,812 | |||||||||||
| Data Processing & Outsourced Services (7.37%) |
|
|||||||||||
| 3,000 | Adyen N.V., (Netherlands), 144A1,2,7 |
2,422,754 | 8,386,085 | |||||||||
| 72,300 | MasterCard Incorporated, Cl A |
16,486,273 | 25,137,264 | |||||||||
| 115,200 | PayPal Holdings, Inc.1 |
16,572,834 | 29,976,192 | |||||||||
| 54,500 | Square, Inc., Cl A1 |
10,459,131 | 13,071,280 | |||||||||
| 184,054 | Toast, Inc., Cl A1 |
7,362,160 | 9,193,497 | |||||||||
| 149,300 | Visa, Inc., Cl A |
25,109,011 | 33,256,575 | |||||||||
|
|
|
|
|
|||||||||
| 78,412,163 | 119,020,893 | |||||||||||
| Electronic Equipment & Instruments (1.32%) |
|
|||||||||||
| 345,133 | PAR Technology Corp.1 |
14,931,208 | 21,229,131 | |||||||||
| Internet Services & Infrastructure (1.59%) |
|
|||||||||||
| 220,677 | GDS Holdings Limited, ADR1,2 |
11,246,223 | 12,492,525 | |||||||||
| 67,043 | Wix.com Ltd.1,2 |
3,803,923 | 13,138,417 | |||||||||
|
|
|
|
|
|||||||||
| 15,050,146 | 25,630,942 | |||||||||||
| IT Consulting & Other Services (4.18%) |
|
|||||||||||
| 202,368 | Endava plc, ADR1,2 |
6,819,469 | 27,491,693 | |||||||||
| 131,587 | Gartner, Inc.1 |
6,742,678 | 39,986,657 | |||||||||
|
|
|
|
|
|||||||||
| 13,562,147 | 67,478,350 | |||||||||||
| Semiconductors (4.00%) |
| |||||||||||
| 1,770,000 | indie Semiconductor, Inc., Cl A1 |
17,169,776 | 21,788,700 | |||||||||
| 206,400 | NVIDIA Corp. |
18,021,140 | 42,757,824 | |||||||||
|
|
|
|
|
|||||||||
| 35,190,916 | 64,546,524 | |||||||||||
| 22 | See Notes to Financial Statements. |
| September 30, 2021 | Baron Opportunity Fund |
STATEMENT OF NET ASSETS (Continued)
|
SEPTEMBER 30, 2021
|
| Shares | Cost | Value | ||||||||||
| Common Stocks (continued) | ||||||||||||
| Information Technology (continued) | ||||||||||||
| Systems Software (10.18%) |
| |||||||||||
| 61,723 | Crowdstrike Holdings, Inc., Cl A1 |
$ | 3,067,061 | $ | 15,170,279 | |||||||
| 493,900 | Microsoft Corporation |
78,400,719 | 139,240,288 | |||||||||
| 32,508 | Snowflake, Inc., Cl A1,4 |
3,900,960 | 9,831,394 | |||||||||
|
|
|
|
|
|||||||||
| 85,368,740 | 164,241,961 | |||||||||||
|
|
|
|
|
|||||||||
| Total Information Technology |
388,858,749 | 690,437,613 | ||||||||||
|
|
|
|
|
|||||||||
| Real Estate (2.06%) | ||||||||||||
| Real Estate Services (1.36%) |
| |||||||||||
| 1,073,230 | Opendoor Technologies, Inc.1 |
10,732,300 | 22,033,412 | |||||||||
| Specialized REITs (0.70%) |
||||||||||||
| 14,225 | Equinix, Inc. |
2,122,124 | 11,239,599 | |||||||||
|
|
|
|
|
|||||||||
| Total Real Estate |
12,854,424 | 33,273,011 | ||||||||||
|
|
|
|
|
|||||||||
| Special Purpose Acquisition Company (0.15%) | ||||||||||||
| 231,800 | Khosla Ventures Acquisition Co. II, Cl A1 |
2,455,228 | 2,359,724 | |||||||||
|
|
|
|
|
|||||||||
| Total Common Stocks |
837,173,665 | 1,533,314,472 | ||||||||||
|
|
|
|
|
|||||||||
| Private Common Stocks (0.30%) | ||||||||||||
| Industrials (0.30%) | ||||||||||||
| 9,099 | Space Exploration Technologies Corp., Cl A1,3,4,8 |
3,821,489 | 3,777,541 | |||||||||
| 2,806 | Space Exploration Technologies Corp., Cl C1,3,4,8 |
1,178,492 | 1,164,939 | |||||||||
|
|
|
|
|
|||||||||
| Total Private Common Stocks |
4,999,981 | 4,942,480 | ||||||||||
|
|
|
|
|
|||||||||
| Private Convertible Preferred Stocks (2.15%) | ||||||||||||
| Consumer Discretionary (1.35%) | ||||||||||||
| Automobile Manufacturers (1.35%) |
|
|||||||||||
| 484,183 | Rivian Automotive, Inc., Series E1,3,4,8 |
7,499,995 | 17,425,746 | |||||||||
| 122,117 | Rivian Automotive, Inc., Series F1,3,4,8 |
4,500,011 | 4,440,174 | |||||||||
|
|
|
|
|
|||||||||
| Total Consumer Discretionary |
12,000,006 | 21,865,920 | ||||||||||
|
|
|
|
|
|||||||||
| Materials (0.80%) | ||||||||||||
| Fertilizers & Agricultural Chemicals (0.80%) |
|
|||||||||||
| 219,321 | Farmers Business Network, Inc., Series F1,3,4,8 |
7,250,007 | 12,869,756 | |||||||||
|
|
|
|
|
|||||||||
| Total Private Convertible Preferred Stocks |
19,250,013 | 34,735,676 | ||||||||||
|
|
|
|
|
|||||||||
| Private Preferred Stocks (0.88%) | ||||||||||||
| Industrials (0.88%) | ||||||||||||
| Aerospace & Defense (0.48%) |
||||||||||||
| 18,519 | Space Exploration Technologies Corp., Cl N1,3,4,8 |
5,000,130 | 7,688,348 | |||||||||
| Trucking (0.40%) |
||||||||||||
| 266,956 | GM Cruise Holdings, Cl G1,3,4,8 |
7,034,290 | 6,479,022 | |||||||||
|
|
|
|
|
|||||||||
| Total Private Preferred Stocks |
12,034,420 | 14,167,370 | ||||||||||
|
|
|
|
|
|||||||||
| Shares | Cost | Value | ||||||||||
| Warrants (0.01%) | ||||||||||||
| Communication Services (0.01%) | ||||||||||||
| Interactive Media & Services (0.01%) |
|
|||||||||||
| 106,682 | Taboola.com Ltd., 6/29/20261,2 |
$ | 192,759 | $ | 197,362 | |||||||
|
|
|
|
|
|||||||||
| Principal Amount | ||||||||||||
| Short Term Investments (1.86%) | ||||||||||||
| $29,940,909 | Repurchase Agreement with |
29,940,909 | 29,940,909 | |||||||||
|
|
|
|
|
|||||||||
| Total Investments (100.20%) |
$ | 903,591,747 | 1,617,298,269 | |||||||||
|
|
|
|||||||||||
| Liabilities Less Cash and Other Assets (-0.20%)6 |
(3,262,186 | ) | ||||||||||
|
|
|
|||||||||||
| Net Assets |
$ | 1,614,036,083 | ||||||||||
|
|
|
|||||||||||
| |
Retail Shares (Equivalent to $43.49 per
share |
|
$ | 866,473,654 | ||||||||
|
|
|
|||||||||||
| |
Institutional Shares (Equivalent to $45.85 per
share |
|
$ | 711,422,767 | ||||||||
|
|
|
|||||||||||
| |
R6 Shares (Equivalent to $45.90 per
share |
|
$ | 36,139,662 | ||||||||
|
|
|
|||||||||||
| % | Represents percentage of net assets. |
| 1 | Non-income producing securities. |
| 2 | Foreign corporation. |
| 3 | At September 30, 2021, the market value of restricted and fair valued securities amounted to $53,845,526 or 3.34% of net assets. These securities are not deemed liquid. See Note 6 regarding Restricted Securities. |
| 4 | The Adviser has reclassified/classified certain securities in or out of this sub-industry. Such reclassifications/classifications are not supported by S&P or MSCI (unaudited). |
| 5 | All or a portion of these securities are segregated for unfunded commitments. Total value of securities segregated is $13,326,550. |
| 6 | Includes net unrealized depreciation of $299,342 on unfunded commitments with special purpose acquisition companies to purchase when-issued private investments in public entities. |
| 7 | Level 2 security. See Note 7 regarding Fair Value Measurements. |
| 8 | Level 3 security. See Note 7 regarding Fair Value Measurements. |
| ADR | American Depositary Receipt. |
| 144A | Security is exempt from registration pursuant to Rule 144A under the Securities Act of 1933. This security may be resold in transactions that are exempt from registration, normally to qualified institutional buyers. At September 30, 2021, the market value of Rule 144A securities amounted to $8,386,085 or 0.52% of net assets. |
All securities are Level 1, unless otherwise noted.
| See Notes to Financial Statements. | 23 |
| Baron Fifth Avenue Growth Fund | September 30, 2021 |
STATEMENT OF NET ASSETS
|
SEPTEMBER 30, 2021
|
| Shares | Cost | Value | ||||||||||
| Common Stocks (98.09%) | ||||||||||||
| Communication Services (14.83%) | ||||||||||||
| Interactive Home Entertainment (0.97%) |
|
|||||||||||
| 25,415 | Sea Ltd., ADR1,2 |
$ | 8,094,524 | $ | 8,100,523 | |||||||
| Interactive Media & Services (13.86%) |
| |||||||||||
| 11,490 | Alphabet, Inc., Cl A1 |
17,696,238 | 30,718,745 | |||||||||
| 10,283 | Alphabet, Inc., Cl C1 |
4,420,382 | 27,407,383 | |||||||||
| 116,389 | Facebook, Inc., Cl A1 |
16,229,480 | 39,501,262 | |||||||||
| 301,416 | ZoomInfo Technologies Inc., Cl A1 |
9,285,584 | 18,443,645 | |||||||||
|
|
|
|
|
|||||||||
| 47,631,684 | 116,071,035 | |||||||||||
|
|
|
|
|
|||||||||
| Total Communication Services |
55,726,208 | 124,171,558 | ||||||||||
|
|
|
|
|
|||||||||
| Consumer Discretionary (9.99%) | ||||||||||||
| Internet & Direct Marketing Retail (9.99%) |
||||||||||||
| 19,267 | Amazon.com, Inc.1 |
8,804,069 | 63,292,866 | |||||||||
| 12,138 | MercadoLibre, Inc.1 |
7,661,536 | 20,384,557 | |||||||||
|
|
|
|
|
|||||||||
| Total Consumer Discretionary |
16,465,605 | 83,677,423 | ||||||||||
|
|
|
|
|
|||||||||
| Financials (2.30%) | ||||||||||||
| Financial Exchanges & Data (2.30%) |
|
|||||||||||
| 45,219 | S&P Global, Inc. |
10,911,824 | 19,213,101 | |||||||||
|
|
|
|
|
|||||||||
| Health Care (15.02%) | ||||||||||||
| Biotechnology (3.86%) |
||||||||||||
| 112,455 | Acceleron Pharma, Inc.1 |
11,815,692 | 19,353,505 | |||||||||
| 42,879 | argenx SE, ADR1,2 |
12,945,859 | 12,949,458 | |||||||||
|
|
|
|
|
|||||||||
| 24,761,551 | 32,302,963 | |||||||||||
| Health Care Equipment (3.72%) |
||||||||||||
| 31,366 | Intuitive Surgical, Inc.1 |
13,622,943 | 31,182,509 | |||||||||
| Health Care Technology (3.46%) |
||||||||||||
| 100,453 | Veeva Systems, Inc., Cl A1 |
7,493,348 | 28,947,541 | |||||||||
| Life Sciences Tools & Services (3.98%) |
|
|||||||||||
| 90,959 | 10X Genomics, Inc., Cl A1 |
9,317,474 | 13,241,811 | |||||||||
| 49,489 | Illumina, Inc.1 |
7,204,506 | 20,073,234 | |||||||||
|
|
|
|
|
|||||||||
| 16,521,980 | 33,315,045 | |||||||||||
|
|
|
|
|
|||||||||
| Total Health Care |
62,399,822 | 125,748,058 | ||||||||||
|
|
|
|
|
|||||||||
| Information Technology (53.92%) | ||||||||||||
| Application Software (12.96%) |
||||||||||||
| 54,742 | Adobe, Inc.1 |
27,393,137 | 31,516,064 | |||||||||
| 84,251 | RingCentral, Inc., Cl A1 |
18,380,517 | 18,324,593 | |||||||||
| 64,177 | ServiceNow, Inc.1,3 |
26,333,590 | 39,935,422 | |||||||||
| 78,303 | Splunk, Inc.1 |
9,872,185 | 11,331,227 | |||||||||
| 28,394 | Zoom Video Communications, Inc., Cl A1 |
10,484,592 | 7,425,031 | |||||||||
|
|
|
|
|
|||||||||
| 92,464,021 | 108,532,337 | |||||||||||
| Data Processing & Outsourced Services (14.24%) |
||||||||||||
| 6,218 | Adyen N.V., 144A (Netherlands)1,2,5 |
4,711,862 | 17,381,559 | |||||||||
| 77,774 | MasterCard Incorporated, Cl A |
7,508,689 | 27,040,464 | |||||||||
| 86,502 | PayPal Holdings, Inc.1 |
18,667,515 | 22,508,685 | |||||||||
| 103,821 | Square, Inc., Cl A1 |
23,693,250 | 24,900,429 | |||||||||
| 98,916 | Toast, Inc., Cl A1 |
3,956,640 | 4,940,854 | |||||||||
| 100,918 | Visa, Inc., Cl A |
6,191,852 | 22,479,485 | |||||||||
|
|
|
|
|
|||||||||
| 64,729,808 | 119,251,476 | |||||||||||
| Shares | Cost | Value | ||||||||||
| Common Stocks (continued) | ||||||||||||
| Information Technology (continued) | ||||||||||||
| Internet Services & Infrastructure (4.69%) |
||||||||||||
| 18,649 | Shopify, Inc., Cl A1,2 |
$ | 23,830,050 | $ | 25,283,941 | |||||||
| 71,087 | Wix.com Ltd.1,2 |
10,110,189 | 13,930,919 | |||||||||
|
|
|
|
|
|||||||||
| 33,940,239 | 39,214,860 | |||||||||||
| IT Consulting & Other Services (4.33%) |
||||||||||||
| 63,602 | EPAM Systems, Inc.1 |
9,148,341 | 36,283,669 | |||||||||
| Semiconductor Equipment (3.28%) |
|
|||||||||||
| 36,842 | ASML Holding N.V.2 |
3,568,785 | 27,451,343 | |||||||||
| Semiconductors (2.98%) |
||||||||||||
| 120,401 | NVIDIA Corp. |
18,553,380 | 24,942,271 | |||||||||
| Systems Software (11.44%) |
||||||||||||
| 93,792 | Crowdstrike Holdings, Inc., Cl A1 |
5,972,732 | 23,052,198 | |||||||||
| 83,835 | Datadog, Inc., Cl A1,3 |
2,263,545 | 11,850,077 | |||||||||
| 256,769 | Dynatrace, Inc.1,3 |
11,122,881 | 18,222,896 | |||||||||
| 49,773 | Snowflake, Inc., Cl A1,3 |
6,209,275 | 15,052,848 | |||||||||
| 81,789 | Twilio, Inc., Cl A1,3 |
11,034,337 | 26,094,781 | |||||||||
| 28,607 | UiPath, Inc., Cl A1 |
1,601,992 | 1,505,014 | |||||||||
|
|
|
|
|
|||||||||
| 38,204,762 | 95,777,814 | |||||||||||
|
|
|
|
|
|||||||||
| Total Information Technology |
260,609,336 | 451,453,770 | ||||||||||
|
|
|
|
|
|||||||||
| Real Estate (2.03%) | ||||||||||||
| Specialized REITs (2.03%) |
||||||||||||
| 21,508 | Equinix, Inc. |
4,587,574 | 16,994,116 | |||||||||
|
|
|
|
|
|||||||||
| Total Common Stocks |
410,700,369 | 821,258,026 | ||||||||||
|
|
|
|
|
|||||||||
| Private Common Stocks (0.18%) | ||||||||||||
| Industrials (0.18%) | ||||||||||||
| 2,730 | Space Exploration Technologies Corp., Cl A1,3,4,6 |
1,146,573 | 1,133,387 | |||||||||
| 841 | Space Exploration Technologies Corp., Cl C1,3,4,6 |
353,211 | 349,149 | |||||||||
|
|
|
|
|
|||||||||
| Total Private Common Stocks |
1,499,784 | 1,482,536 | ||||||||||
|
|
|
|
|
|||||||||
| Private Convertible Preferred Stocks (0.35%) | ||||||||||||
| Consumer Discretionary (0.35%) | ||||||||||||
| Automobile Manufacturers (0.35%) |
| |||||||||||
| 81,411 | Rivian Automotive, Inc., Series F1,3,4,6 |
2,999,995 | 2,960,104 | |||||||||
|
|
|
|
|
|||||||||
| Private Preferred Stocks (0.39%) | ||||||||||||
| Industrials (0.39%) | ||||||||||||
| Trucking (0.39%) |
| |||||||||||
| 133,288 | GM Cruise Holdings, Cl G1,3,4,6 |
3,512,139 | 3,234,900 | |||||||||
|
|
|
|
|
|||||||||
| 24 | See Notes to Financial Statements. |
| September 30, 2021 | Baron Fifth Avenue Growth Fund |
STATEMENT OF NET ASSETS (Continued)
|
SEPTEMBER 30, 2021
|
| Principal Amount | Cost | Value | ||||||||||
| Short Term Investments (1.00%) | ||||||||||||
| $8,370,965 | Repurchase Agreement with Fixed Income Clearing Corp., dated 9/30/2021, 0.00% due 10/1/2021; Proceeds at
maturity - $8,370,965; (Fully collateralized by $9,133,500 U.S. Treasury Note, 0.625% due 5/15/2030 |
$ | 8,370,965 | $ | 8,370,965 | |||||||
|
|
|
|
|
|||||||||
| Total Investments (100.01%) |
$ | 427,083,252 | 837,306,531 | |||||||||
|
|
|
|||||||||||
| Liabilities Less Cash and Other Assets (-0.01%) |
(96,211 | ) | ||||||||||
|
|
|
|||||||||||
| Net Assets |
$ | 837,210,320 | ||||||||||
|
|
|
|||||||||||
| |
Retail Shares (Equivalent to $55.33 per
share |
|
$ | 187,861,080 | ||||||||
|
|
|
|||||||||||
| |
Institutional Shares (Equivalent to $56.82 per
share |
|
$ | 609,786,466 | ||||||||
|
|
|
|||||||||||
| |
R6 Shares (Equivalent to $56.84 per
share |
|
$ | 39,562,774 | ||||||||
|
|
|
|||||||||||
| % | Represents percentage of net assets. |
| 1 | Non-income producing securities. |
| 2 | Foreign corporation. |
| 3 | The Adviser has reclassified/classified certain securities in or out of this sub-industry. Such reclassifications/classifications are not supported by S&P or MSCI (unaudited). |
| 4 | At September 30, 2021, the market value of restricted and fair valued securities amounted to $7,677,540 or 0.92% of net assets. These securities are not deemed liquid. See Note 6 regarding Restricted Securities. |
| 5 | Level 2 security. See Note 7 regarding Fair Value Measurements. |
| 6 | Level 3 security. See Note 7 regarding Fair Value Measurements. |
| ADR | American Depositary Receipt. |
| 144A | Security is exempt from registration pursuant to Rule 144A under the Securities Act of 1933. This security may be resold in transactions that are exempt from registration, normally to qualified institutional buyers. At September 30, 2021, the market value of Rule 144A securities amounted to $17,381,559 or 2.08% of net assets. |
All securities are Level 1, unless otherwise noted.
| See Notes to Financial Statements. | 25 |
| Baron Discovery Fund | September 30, 2021 |
STATEMENT OF NET ASSETS
|
SEPTEMBER 30, 2021
|
| Shares | Cost | Value | ||||||||||
| Common Stocks (93.12%) | ||||||||||||
| Communication Services (5.93%) | ||||||||||||
| Advertising (2.17%) |
||||||||||||
| 3,875,000 | S4 Capital PLC (United Kingdom)1,2 |
$ | 12,841,181 | $ | 44,118,935 | |||||||
| Interactive Media & Services (1.00%) |
|
|||||||||||
| 600,000 | Tripadvisor, Inc.1 |
20,442,129 | 20,310,000 | |||||||||
| Movies & Entertainment (0.43%) |
| |||||||||||
| 185,000 | Liberty Media Corporation-Liberty Formula One, Cl A1 |
5,634,811 | 8,704,250 | |||||||||
| Publishing (2.33%) |
||||||||||||
| 950,000 | Future PLC (United Kingdom)2 |
18,404,637 | 47,233,114 | |||||||||
|
|
|
|
|
|||||||||
| Total Communication Services |
57,322,758 | 120,366,299 | ||||||||||
|
|
|
|
|
|||||||||
| Consumer Discretionary (8.34%) | ||||||||||||
| Casinos & Gaming (2.46%) |
| |||||||||||
| 2,673,000 | Melco International |
5,107,059 | 3,148,780 | |||||||||
| 150,371 | Penn National Gaming, Inc.1 |
2,663,946 | 10,895,883 | |||||||||
| 700,000 | Red Rock Resorts, Inc., Cl A1 |
17,350,047 | 35,854,000 | |||||||||
|
|
|
|
|
|||||||||
| 25,121,052 | 49,898,663 | |||||||||||
| Home Improvement Retail (2.08%) |
| |||||||||||
| 350,000 | Floor & Decor Holdings, Inc., Cl A1 |
11,227,099 | 42,276,500 | |||||||||
| Hotels, Resorts & Cruise Lines (0.92%) |
|
|||||||||||
| 1,500,000 | Membership Collective Group, Inc.1 |
20,762,901 | 18,660,000 | |||||||||
| Internet & Direct Marketing Retail (0.47%) |
| |||||||||||
| 350,000 | MYT Netherlands |
9,100,000 | 9,415,000 | |||||||||
| Restaurants (1.06%) |
||||||||||||
| 425,000 | The Cheesecake Factory, Inc.1 |
14,758,560 | 19,975,000 | |||||||||
| 9,266 | Wingstop, Inc. |
766,969 | 1,518,975 | |||||||||
|
|
|
|
|
|||||||||
| 15,525,529 | 21,493,975 | |||||||||||
| Specialty Stores (1.35%) |
||||||||||||
| 1,300,000 | Petco Health & Wellness Co., Inc.1 |
27,164,882 | 27,430,000 | |||||||||
|
|
|
|
|
|||||||||
| Total Consumer Discretionary |
108,901,463 | 169,174,138 | ||||||||||
|
|
|
|
|
|||||||||
| Consumer Staples (4.64%) | ||||||||||||
| Packaged Foods & Meats (0.73%) |
| |||||||||||
| 100,000 | Laird Superfood, Inc.1 |
2,547,796 | 1,908,000 | |||||||||
| 750,000 | UTZ Brands, Inc. |
12,255,000 | 12,847,500 | |||||||||
|
|
|
|
|
|||||||||
| 14,802,796 | 14,755,500 | |||||||||||
| Personal Products (2.56%) |
||||||||||||
| 2,000,000 | The Beauty Health Co.1 |
21,322,653 | 51,940,000 | |||||||||
| Soft Drinks (1.35%) |
||||||||||||
| 875,000 | Fevertree Drinks PLC |
26,629,565 | 27,458,332 | |||||||||
|
|
|
|
|
|||||||||
| Total Consumer Staples |
62,755,014 | 94,153,832 | ||||||||||
|
|
|
|
|
|||||||||
| Financials (3.22%) | ||||||||||||
| Insurance Brokers (1.23%) |
||||||||||||
| 750,007 | BRP Group, Inc., Cl A1 |
15,155,098 | 24,967,733 | |||||||||
| Property & Casualty Insurance (1.99%) |
||||||||||||
| 250,000 | Kinsale Capital Group, Inc. |
20,250,978 | 40,425,000 | |||||||||
|
|
|
|
|
|||||||||
| Total Financials |
35,406,076 | 65,392,733 | ||||||||||
|
|
|
|
|
|||||||||
| Shares | Cost | Value | ||||||||||
| Common Stocks (continued) | ||||||||||||
| Health Care (21.60%) | ||||||||||||
| Biotechnology (1.43%) |
||||||||||||
| 106,000 | Biohaven Pharmaceutical Holding Co. Ltd.1,2 |
$ | 4,582,203 | $ | 14,724,460 | |||||||
| 620,143 | Recursion Pharmaceuticals, Inc., Cl A1 |
12,216,506 | 14,269,490 | |||||||||
|
|
|
|
|
|||||||||
| 16,798,709 | 28,993,950 | |||||||||||
| Health Care Equipment (9.32%) |
||||||||||||
| 1,135,000 | Acutus Medical, Inc.1 |
21,335,786 | 10,033,400 | |||||||||
| 580,084 | AxoGen, Inc.1 |
9,919,925 | 9,165,327 | |||||||||
| 637,982 | Axonics, Inc.1 |
28,878,670 | 41,526,249 | |||||||||
| 202,500 | CryoPort, Inc.1 |
5,127,704 | 13,468,275 | |||||||||
| 114,823 | Inari Medical, Inc.1 |
4,216,755 | 9,312,145 | |||||||||
| 682,985 | Inogen, Inc.1 |
31,469,030 | 29,429,824 | |||||||||
| 50,000 | Inspire Medical Systems, Inc.1,4 |
2,923,748 | 11,644,000 | |||||||||
| 640,208 | Silk Road Medical, Inc.1,4 |
27,145,351 | 35,230,646 | |||||||||
| 4,060,000 | ViewRay, Inc.1 |
20,943,586 | 29,272,600 | |||||||||
|
|
|
|
|
|||||||||
| 151,960,555 | 189,082,466 | |||||||||||
| Health Care Services (0.67%) |
| |||||||||||
| 323,963 | Accolade, Inc.1 |
9,020,518 | 13,661,520 | |||||||||
| Health Care Supplies (1.46%) |
| |||||||||||
| 2,629,967 | Cerus Corp.1 |
14,027,651 | 16,016,499 | |||||||||
| 2,365,363 | Sientra, Inc.1 |
17,781,625 | 13,553,530 | |||||||||
|
|
|
|
|
|||||||||
| 31,809,276 | 29,570,029 | |||||||||||
| Health Care Technology (0.88%) |
| |||||||||||
| 418,543 | Definitive Healthcare Corp.1 |
11,300,661 | 17,926,197 | |||||||||
| Life Sciences Tools & Services (3.98%) |
| |||||||||||
| 547,558 | CareDx, Inc.1,4 |
13,105,658 | 34,698,751 | |||||||||
| 150,000 | Olink Holding AB, ADR1,2 |
5,649,156 | 3,637,500 | |||||||||
| 68,980 | Seer, Inc.1 |
1,310,620 | 2,381,879 | |||||||||
| 861,926 | Veracyte, Inc.1,4 |
25,343,693 | 40,036,463 | |||||||||
|
|
|
|
|
|||||||||
| 45,409,127 | 80,754,593 | |||||||||||
| Managed Health Care (2.09%) |
| |||||||||||
| 758,279 | Progyny, Inc.1 |
19,842,501 | 42,463,624 | |||||||||
| Pharmaceuticals (1.77%) |
| |||||||||||
| 1,291,732 | Revance Therapeutics, Inc.1 |
28,479,368 | 35,987,653 | |||||||||
|
|
|
|
|
|||||||||
| Total Health Care |
314,620,715 | 438,440,032 | ||||||||||
|
|
|
|
|
|||||||||
| Industrials (14.96%) | ||||||||||||
| Aerospace & Defense (3.45%) |
| |||||||||||
| 1,102,370 | Kratos Defense & Security Solutions, Inc.1 |
19,500,520 | 24,593,875 | |||||||||
| 957,680 | Mercury Systems, Inc.1 |
52,325,093 | 45,413,185 | |||||||||
|
|
|
|
|
|||||||||
| 71,825,613 | 70,007,060 | |||||||||||
| Building Products (1.11%) |
| |||||||||||
| 220,000 | Trex Company, Inc.1 |
7,416,878 | 22,424,600 | |||||||||
| Diversified Support Services (0.88%) |
||||||||||||
| 1,000,000 | ACV Auctions, Inc., Cl A1 |
28,687,917 | 17,890,000 | |||||||||
| Environmental & Facilities Services (1.82%) |
||||||||||||
| 599,642 | Montrose Environmental Group, Inc.1 |
10,554,326 | 37,021,897 | |||||||||
| Heavy Electrical Equipment (0.88%) |
||||||||||||
| 528,900 | TPI Composites, Inc.1 |
10,257,577 | 17,850,375 | |||||||||
| 26 | See Notes to Financial Statements. |
| September 30, 2021 | Baron Discovery Fund |
STATEMENT OF NET ASSETS (Continued)
|
SEPTEMBER 30, 2021
|
| Shares | Cost | Value | ||||||||||
| Common Stocks (continued) | ||||||||||||
| Industrials (continued) | ||||||||||||
| Industrial Machinery (4.17%) |
| |||||||||||
| 86,600 | ESCO Technologies, Inc. |
$ | 4,658,023 | $ | 6,668,200 | |||||||
| 200,000 | Helios Technologies, Inc. |
7,717,454 | 16,422,000 | |||||||||
| 253,105 | Kornit Digital Ltd.1,2 |
8,856,307 | 36,634,418 | |||||||||
| 1,705,185 | Markforged Holding Corp.1 |
14,565,524 | 11,186,013 | |||||||||
| 1,040,000 | Velo3D, Inc.1,4 |
10,641,845 | 8,704,800 | |||||||||
| 618,272 | Velo3D, Inc., (formerly, Jaws Spitfire Acquisition Corp.)3,4,8 |
6,182,720 | 5,057,465 | |||||||||
|
|
|
|
|
|||||||||
| 52,621,873 | 84,672,896 | |||||||||||
| Trading Companies & Distributors (2.65%) |
||||||||||||
| 500,000 | Hydrofarm Holdings Group, Inc.1,4 |
25,269,555 | 18,925,000 | |||||||||
| 175,000 | SiteOne Landscape Supply, Inc.1,5 |
9,431,317 | 34,907,250 | |||||||||
|
|
|
|
|
|||||||||
| 34,700,872 | 53,832,250 | |||||||||||
|
|
|
|
|
|||||||||
| Total Industrials |
216,065,056 | 303,699,078 | ||||||||||
|
|
|
|
|
|||||||||
| Information Technology (29.68%) | ||||||||||||
| Application Software (6.41%) |
| |||||||||||
| 1,000,000 | Alkami Technology, Inc.1 |
30,552,625 | 24,680,000 | |||||||||
| 625,663 | Clearwater Analytics |
14,626,090 | 16,023,230 | |||||||||
| 600,000 | DoubleVerify Holdings, Inc.1 |
18,527,343 | 20,496,000 | |||||||||
| 200,000 | Everbridge, Inc.1 |
22,401,606 | 30,208,000 | |||||||||
| 2,500,000 | SmartRent, Inc. (formerly, Fifth Wall Acquisition Corp. I)1,4 |
31,046,952 | 32,550,000 | |||||||||
| 500,000 | Viant Technology, Inc., Cl A1 |
13,515,462 | 6,110,000 | |||||||||
|
|
|
|
|
|||||||||
| 130,670,078 | 130,067,230 | |||||||||||
| Data Processing & Outsourced Services (0.76%) |
||||||||||||
| 200,000 | Shift4 Payments, Inc., Cl A1 |
7,218,579 | 15,504,000 | |||||||||
| Electronic Equipment & Instruments (3.81%) |
||||||||||||
| 460,321 | Advanced Energy Industries, Inc. |
34,345,774 | 40,393,168 | |||||||||
| 10,431 | Novanta, Inc.1,2 |
272,590 | 1,611,589 | |||||||||
| 575,000 | PAR Technology Corp.1 |
21,254,484 | 35,368,250 | |||||||||
|
|
|
|
|
|||||||||
| 55,872,848 | 77,373,007 | |||||||||||
| IT Consulting & Other Services (2.68%) |
| |||||||||||
| 400,000 | Endava plc, ADR1,2 |
10,717,821 | 54,340,000 | |||||||||
| Semiconductor Equipment (3.05%) |
| |||||||||||
| 115,000 | Brooks Automation, Inc. |
12,170,966 | 11,770,250 | |||||||||
| 585,800 | Ichor Holdings Ltd.1,2 |
16,144,595 | 24,070,522 | |||||||||
| 255,000 | Nova Ltd., (formerly, Nova Measuring Instruments Ltd.)1,2 |
8,116,967 | 26,083,950 | |||||||||
|
|
|
|
|
|||||||||
| 36,432,528 | 61,924,722 | |||||||||||
| Semiconductors (2.91%) |
| |||||||||||
| 725,000 | Allegro MicroSystems, Inc.1 |
10,150,000 | 23,171,000 | |||||||||
| 2,910,000 | indie Semiconductor, Inc., Cl A1 |
27,712,225 | 35,822,100 | |||||||||
|
|
|
|
|
|||||||||
| 37,862,225 | 58,993,100 | |||||||||||
| Systems Software (10.06%) |
| |||||||||||
| 997,500 | Couchbase, Inc.1,4 |
29,191,929 | 31,032,225 | |||||||||
| 333,775 | Dynatrace, Inc.1,4 |
6,243,606 | 23,688,012 | |||||||||
| 578,460 | ForgeRock, Inc., Cl A1,4 |
17,534,310 | 22,519,448 | |||||||||
| 1,234,531 | Ping Identity Holding Corp.1 |
25,203,528 | 30,332,426 | |||||||||
| 215,000 | Qualys, Inc.1 |
18,211,240 | 23,927,350 | |||||||||
| 815,000 | Sailpoint Technologies Holdings, Inc.1 |
42,481,737 | 34,947,200 | |||||||||
| 621,000 | Varonis Systems, Inc.1 |
19,427,813 | 37,787,850 | |||||||||
|
|
|
|
|
|||||||||
| 158,294,163 | 204,234,511 | |||||||||||
|
|
|
|
|
|||||||||
| Total Information Technology |
437,068,242 | 602,436,570 | ||||||||||
|
|
|
|
|
|||||||||
| Shares | Cost | Value | ||||||||||
| Common Stocks (continued) | ||||||||||||
| Real Estate (3.65%) | ||||||||||||
| Industrial REITs (1.19%) |
| |||||||||||
| 425,000 | Rexford Industrial Realty, Inc. |
$ | 17,240,450 | $ | 24,118,750 | |||||||
| Office REITs (1.46%) |
| |||||||||||
| 1,000,000 | JBG SMITH Properties |
33,666,311 | 29,610,000 | |||||||||
| Specialized REITs (1.00%) |
| |||||||||||
| 700,000 | Americold Realty Trust4 |
19,240,492 | 20,335,000 | |||||||||
|
|
|
|
|
|||||||||
| Total Real Estate |
70,147,253 | 74,063,750 | ||||||||||
|
|
|
|
|
|||||||||
| Special Purpose Acquisition Company (1.10%) | ||||||||||||
| 1,200,000 | Khosla Ventures |
12,706,516 | 12,216,000 | |||||||||
| 1,000,000 | Live Oak Acquisition |
9,986,703 | 9,980,000 | |||||||||
|
|
|
|
|
|||||||||
| Total Special Purpose Acquisition Company |
22,693,219 | 22,196,000 | ||||||||||
|
|
|
|
|
|||||||||
| Total Common Stocks |
1,324,979,796 | 1,889,922,432 | ||||||||||
|
|
|
|
|
|||||||||
| Principal Amount | ||||||||||||
| Short Term Investments (6.68%) | ||||||||||||
| $135,649,363 | Repurchase Agreement with Fixed Income Clearing Corp., dated 9/30/2021, 0.00% due 10/1/2021; Proceeds at maturity - $135,649,363; (Fully collateralized by $139,079,500 U.S. Treasury Note, 1.25% due 9/30/2028 Market value - $138,362,406)7 |
135,649,363 | 135,649,363 | |||||||||
|
|
|
|
|
|||||||||
| Total Investments (99.80%) |
$ | 1,460,629,159 | 2,025,571,795 | |||||||||
|
|
|
|||||||||||
| Cash and Other Assets Less Liabilities6 (0.20%) |
4,027,589 | |||||||||||
|
|
|
|||||||||||
| Net Assets |
$ | 2,029,599,384 | ||||||||||
|
|
|
|||||||||||
| |
Retail Shares (Equivalent to $36.93 per share |
$ | 270,330,428 | |||||||||
|
|
|
|||||||||||
| |
Institutional Shares (Equivalent to $37.68 per share |
$ | 1,721,197,181 | |||||||||
|
|
|
|||||||||||
| |
R6 Shares (Equivalent to $37.68 per share |
$ | 38,071,775 | |||||||||
|
|
|
|||||||||||
| % | Represents percentage of net assets. |
| 1 | Non-income producing securities. |
| 2 | Foreign corporation. |
| 3 | At September 30, 2021, the market value of restricted and fair valued securities amounted to $5,057,465 or 0.25% of net assets. This security is not deemed liquid. See Note 6 regarding Restricted Securities. |
| 4 | The Adviser has reclassified/classified certain securities in or out of this sub-industry. Such reclassifications/classifications are not supported by S&P or MSCI (unaudited). |
| 5 | All or a portion of these securities are segregated for an unfunded commitment. Total value of securities segregated is $7,579,860. |
| 6 | Includes unrealized depreciation of $170,095 on an unfunded commitment with a special purpose acquisition company to purchase a when-issued private investment in a public entity. |
| 7 | Level 2 security. See Note 7 regarding Fair Value Measurements. |
| 8 | Level 3 security. See Note 7 regarding Fair Value Measurements. |
| ADR | American Depositary Receipt. |
All securities are Level 1, unless otherwise noted.
| See Notes to Financial Statements. | 27 |
| Baron Durable Advantage Fund | September 30, 2021 |
STATEMENT OF NET ASSETS
|
SEPTEMBER 30, 2021
|
| Shares | Cost | Value | ||||||||||
| Common Stocks (97.70%) | ||||||||||||
| Communication Services (12.58%) | ||||||||||||
| Interactive Media & Services (12.58%) |
||||||||||||
| 172 | Alphabet, Inc., Cl A1 |
$ | 488,101 | $ | 459,845 | |||||||
| 975 | Alphabet, Inc., Cl C1 |
1,659,810 | 2,598,677 | |||||||||
| 6,248 | Facebook, Inc., Cl A1 |
1,667,340 | 2,120,509 | |||||||||
|
|
|
|
|
|||||||||
| Total Communication Services |
3,815,251 | 5,179,031 | ||||||||||
|
|
|
|
|
|||||||||
| Consumer Staples (5.41%) | ||||||||||||
| Distillers & Vintners (1.97%) |
||||||||||||
| 3,835 | Constellation Brands, Inc., Cl A |
811,065 | 807,996 | |||||||||
| Hypermarkets & Super Centers (2.29%) |
||||||||||||
| 2,099 | Costco Wholesale Corp. |
740,504 | 943,186 | |||||||||
| Personal Products (1.15%) |
||||||||||||
| 1,582 | The Estée Lauder Companies, Inc., Cl A |
394,728 | 474,489 | |||||||||
|
|
|
|
|
|||||||||
| Total Consumer Staples |
1,946,297 | 2,225,671 | ||||||||||
|
|
|
|
|
|||||||||
| Financials (16.03%) | ||||||||||||
| Asset Management & Custody Banks (3.35%) |
| |||||||||||
| 1,644 | BlackRock, Inc. |
1,256,580 | 1,378,757 | |||||||||
| Financial Exchanges & Data (10.61%) |
| |||||||||||
| 5,074 | CME Group, Inc. |
958,043 | 981,210 | |||||||||
| 3,568 | Moody’s Corp. |
881,776 | 1,267,032 | |||||||||
| 2,100 | MSCI, Inc. |
884,036 | 1,277,514 | |||||||||
| 1,977 | S&P Global, Inc. |
462,402 | 840,008 | |||||||||
|
|
|
|
|
|||||||||
| 3,186,257 | 4,365,764 | |||||||||||
| Property & Casualty Insurance (2.07%) |
||||||||||||
| 22,364 | Arch Capital Group Ltd.1,2 |
850,759 | 853,858 | |||||||||
|
|
|
|
|
|||||||||
| Total Financials |
5,293,596 | 6,598,379 | ||||||||||
|
|
|
|
|
|||||||||
| Health Care (19.95%) | ||||||||||||
| Health Care Equipment (4.31%) |
| |||||||||||
| 5,823 | Danaher Corp. |
1,151,417 | 1,772,754 | |||||||||
| Life Sciences Tools & Services (11.48%) |
| |||||||||||
| 6,441 | Agilent Technologies, Inc. |
881,659 | 1,014,651 | |||||||||
| 4,774 | Iqvia Holdings, Inc.1 |
882,665 | 1,143,564 | |||||||||
| 442 | Mettler-Toledo International, Inc.1 |
472,779 | 608,793 | |||||||||
| 25,382 | Stevanato Group SpA1,2 |
533,022 | 642,419 | |||||||||
| 2,301 | Thermo Fisher Scientific, Inc. |
926,009 | 1,314,630 | |||||||||
|
|
|
|
|
|||||||||
| 3,696,134 | 4,724,057 | |||||||||||
| Managed Health Care (4.16%) |
| |||||||||||
| 4,383 | UnitedHealth Group, Incorporated |
1,543,857 | 1,712,613 | |||||||||
|
|
|
|
|
|||||||||
| Total Health Care |
6,391,408 | 8,209,424 | ||||||||||
|
|
|
|
|
|||||||||
| Industrials (5.52%) | ||||||||||||
| Aerospace & Defense (2.04%) |
| |||||||||||
| 7,092 | HEICO Corp., Cl A |
784,515 | 839,906 | |||||||||
| Research & Consulting Services (3.48%) |
| |||||||||||
| 12,275 | IHS Markit Ltd.2 |
1,116,317 | 1,431,510 | |||||||||
|
|
|
|
|
|||||||||
| Total Industrials |
1,900,832 | 2,271,416 | ||||||||||
|
|
|
|
|
|||||||||
| Information Technology (36.03%) | ||||||||||||
| Application Software (9.61%) |
| |||||||||||
| 2,925 | Adobe, Inc.1 |
1,278,820 | 1,683,981 | |||||||||
| 763 | Fair Isaac Corp.1 |
312,482 | 303,620 | |||||||||
| 2,488 | Intuit, Inc. |
1,108,372 | 1,342,301 | |||||||||
| 8,987 | SS&C Technologies Holdings, Inc. |
562,339 | 623,698 | |||||||||
|
|
|
|
|
|||||||||
| 3,262,013 | 3,953,600 | |||||||||||
| Shares | Cost | Value | ||||||||||
| Common Stocks (continued) | ||||||||||||
| Information Technology (continued) | ||||||||||||
| Data Processing & Outsourced Services (7.37%) |
||||||||||||
| 3,978 | MasterCard Incorporated, Cl A |
$ | 1,238,614 | $ | 1,383,071 | |||||||
| 7,419 | Visa, Inc., Cl A |
1,639,604 | 1,652,582 | |||||||||
|
|
|
|
|
|||||||||
| 2,878,218 | 3,035,653 | |||||||||||
| Electronic Manufacturing Services (1.98%) |
| |||||||||||
| 5,942 | TE Connectivity Ltd.2 |
743,041 | 815,361 | |||||||||
| IT Consulting & Other Services (3.35%) |
| |||||||||||
| 4,315 | Accenture plc, Cl A2 |
1,064,673 | 1,380,455 | |||||||||
| Semiconductors (4.81%) |
||||||||||||
| 1,969 | Monolithic Power Systems, Inc. |
750,581 | 954,335 | |||||||||
| 5,330 | Texas Instruments, Inc. |
896,539 | 1,024,479 | |||||||||
|
|
|
|
|
|||||||||
| 1,647,120 | 1,978,814 | |||||||||||
| Systems Software (8.91%) |
| |||||||||||
| 13,007 | Microsoft Corporation |
2,918,283 | 3,666,934 | |||||||||
|
|
|
|
|
|||||||||
| Total Information Technology |
12,513,348 | 14,830,817 | ||||||||||
|
|
|
|
|
|||||||||
| Materials (0.70%) | ||||||||||||
| Specialty Chemicals (0.70%) |
| |||||||||||
| 1,388 | Ecolab, Inc. |
285,843 | 289,565 | |||||||||
|
|
|
|
|
|||||||||
| Real Estate (1.48%) | ||||||||||||
| Specialized REITs (1.48%) |
| |||||||||||
| 1,697 | Alexandria Real Estate Equities, Inc.3 |
261,495 | 324,246 | |||||||||
| 359 | Equinix, Inc. |
178,765 | 283,656 | |||||||||
|
|
|
|
|
|||||||||
| Total Real Estate |
440,260 | 607,902 | ||||||||||
|
|
|
|
|
|||||||||
| Total Common Stocks |
32,586,835 | 40,212,205 | ||||||||||
|
|
|
|
|
|||||||||
| Principal Amount | ||||||||||||
| Short Term Investments (8.23%) | ||||||||||||
| $3,386,820 | Repurchase Agreement with Fixed Income Clearing Corp., dated 9/30/2021, 0.00% due 10/1/2021; Proceeds at maturity - $3,386,820; (Fully collateralized by $3,472,500 U.S. Treasury Note, 1.25% due 9/30/2028 Market value - $3,454,596)4 |
3,386,820 | 3,386,820 | |||||||||
|
|
|
|
|
|||||||||
| Total Investments (105.93%) |
$ | 35,973,655 | 43,599,025 | |||||||||
|
|
|
|||||||||||
| Liabilities Less Cash and Other Assets (-5.93%) |
(2,441,111 | ) | ||||||||||
|
|
|
|||||||||||
| Net Assets |
$ | 41,157,914 | ||||||||||
|
|
|
|||||||||||
| |
Retail Shares (Equivalent to $18.47 per share |
$ | 9,746,212 | |||||||||
|
|
|
|||||||||||
| |
Institutional Shares (Equivalent to $18.63 per share |
$ | 27,135,571 | |||||||||
|
|
|
|||||||||||
| |
R6 Shares (Equivalent to $18.63 per share |
$ | 4,276,131 | |||||||||
|
|
|
|||||||||||
| % | Represents percentage of net assets. |
| 1 | Non-income producing securities. |
| 2 | Foreign corporation. |
| 3 | The Adviser has reclassified/classified certain securities in or out of this sub-industry. Such reclassifications/classifications are not supported by S&P or MSCI (unaudited). |
| 4 | Level 2 security. See Note 7 regarding Fair Value Measurements. |
All securities are Level 1, unless otherwise noted.
| 28 | See Notes to Financial Statements. |
| September 30, 2021 | Baron Funds |
STATEMENTS OF ASSETS AND LIABILITIES
|
SEPTEMBER 30, 2021
|
| Baron Asset Fund |
Baron Growth Fund |
Baron Small Cap Fund |
Baron Opportunity Fund |
|||||||||||||
| Assets: |
||||||||||||||||
| Investments in securities, at value* |
||||||||||||||||
| Unaffiliated investments |
$ | 6,171,947,895 | $ | 8,506,972,972 | $ | 5,154,974,288 | $ | 1,617,298,269 | ||||||||
| “Affiliated” investments |
— | 693,925,000 | 160,725,000 | — | ||||||||||||
|
|
|
|
|
|
|
|
|
|||||||||
| Total investments, at value |
6,171,947,895 | 9,200,897,972 | 5,315,699,288 | 1,617,298,269 | ||||||||||||
| Receivable for securities sold |
2,117,495 | — | 2,242,089 | 2,535,429 | ||||||||||||
| Receivable for shares sold |
1,844,146 | 5,758,504 | 3,045,724 | 1,431,643 | ||||||||||||
| Dividends and interest receivable |
609,786 | 3,835,071 | 1,084,547 | — | ||||||||||||
| Prepaid expenses |
20,514 | 28,920 | 16,708 | 6,563 | ||||||||||||
|
|
|
|
|
|
|
|
|
|||||||||
| 6,176,539,836 | 9,210,520,467 | 5,322,088,356 | 1,621,271,904 | |||||||||||||
|
|
|
|
|
|
|
|
|
|||||||||
| Liabilities: |
||||||||||||||||
| Payable for securities purchased |
7,617,722 | — | — | 4,397,820 | ||||||||||||
| Payable for shares redeemed |
1,524,488 | 6,275,890 | 2,338,227 | 495,948 | ||||||||||||
| Due to custodian bank |
618,000 | 649,000 | 2,635,204 | 1,805,541 | ||||||||||||
| Trustee fees payable (Note 4) |
75,440 | 110,400 | 65,190 | 19,190 | ||||||||||||
| Distribution fees payable (Note 4) |
699 | 313 | 974 | 722 | ||||||||||||
| Investment advisory fees payable (Note 4) |
337 | 83 | 257 | 625 | ||||||||||||
| Net unrealized depreciation on unfunded commitments |
346,731 | 746,100 | — | 299,342 | ||||||||||||
| Accrued expenses and other payables |
685,210 | 767,257 | 591,957 | 216,633 | ||||||||||||
|
|
|
|
|
|
|
|
|
|||||||||
| 10,868,627 | 8,549,043 | 5,631,809 | 7,235,821 | |||||||||||||
|
|
|
|
|
|
|
|
|
|||||||||
| Net Assets |
$ | 6,165,671,209 | $ | 9,201,971,424 | $ | 5,316,456,547 | $ | 1,614,036,083 | ||||||||
|
|
|
|
|
|
|
|
|
|||||||||
| Net Assets consist of: |
||||||||||||||||
| Paid-in capital |
$ | 1,486,731,296 | $ | 778,469,579 | $ | 1,422,060,856 | $ | 771,071,236 | ||||||||
| Distributable earnings/(losses) |
4,678,939,913 | 8,423,501,845 | 3,894,395,691 | 842,964,847 | ||||||||||||
|
|
|
|
|
|
|
|
|
|||||||||
| Net Assets |
$ | 6,165,671,209 | $ | 9,201,971,424 | $ | 5,316,456,547 | $ | 1,614,036,083 | ||||||||
|
|
|
|
|
|
|
|
|
|||||||||
| Retail Shares: |
||||||||||||||||
| Net Assets |
$ | 2,871,697,681 | $ | 3,041,361,238 | $ | 1,829,446,479 | $ | 866,473,654 | ||||||||
| Shares Outstanding ($0.01 par value; indefinite shares authorized) |
23,812,800 | 25,852,465 | 44,983,254 | 19,922,040 | ||||||||||||
|
|
|
|
|
|
|
|
|
|||||||||
| Net Asset Value and Offering Price Per Share |
$ | 120.59 | $ | 117.64 | $ | 40.67 | $ | 43.49 | ||||||||
|
|
|
|
|
|
|
|
|
|||||||||
| Institutional Shares: |
||||||||||||||||
| Net Assets |
$ | 3,108,205,976 | $ | 5,934,832,087 | $ | 3,214,212,037 | $ | 711,422,767 | ||||||||
| Shares Outstanding ($0.01 par value; indefinite shares authorized) |
24,576,421 | 48,355,821 | 74,547,365 | 15,516,269 | ||||||||||||
|
|
|
|
|
|
|
|
|
|||||||||
| Net Asset Value and Offering Price Per Share |
$ | 126.47 | $ | 122.73 | $ | 43.12 | $ | 45.85 | ||||||||
|
|
|
|
|
|
|
|
|
|||||||||
| R6 Shares: |
||||||||||||||||
| Net Assets |
$ | 185,767,552 | $ | 225,778,099 | $ | 272,798,031 | $ | 36,139,662 | ||||||||
| Shares Outstanding ($0.01 par value; indefinite shares authorized) |
1,469,128 | 1,839,378 | 6,329,204 | 787,311 | ||||||||||||
|
|
|
|
|
|
|
|
|
|||||||||
| Net Asset Value and Offering Price Per Share |
$ | 126.45 | $ | 122.75 | $ | 43.10 | $ | 45.90 | ||||||||
|
|
|
|
|
|
|
|
|
|||||||||
| *Investments in securities, at cost: |
||||||||||||||||
| Unaffiliated investments |
$ | 1,905,661,422 | $ | 1,277,513,072 | $ | 1,923,010,939 | $ | 903,591,747 | ||||||||
| “Affiliated” investments |
— | 121,485,106 | 83,052,523 | — | ||||||||||||
|
|
|
|
|
|
|
|
|
|||||||||
| Total investments, at cost |
$ | 1,905,661,422 | $ | 1,398,998,178 | $ | 2,006,063,462 | $ | 903,591,747 | ||||||||
|
|
|
|
|
|
|
|
|
|||||||||
| See Notes to Financial Statements. | 29 |
| Baron Funds | September 30, 2021 |
STATEMENTS OF ASSETS AND LIABILITIES (Continued)
|
SEPTEMBER 30, 2021
|
| Baron Fifth Avenue Growth Fund |
Baron Discovery Fund |
Baron Durable Advantage Fund |
||||||||||
| Assets: |
||||||||||||
| Investments in securities, at value* |
||||||||||||
| Unaffiliated investments |
$ | 837,306,531 | $ | 2,025,571,795 | $ | 43,599,025 | ||||||
| “Affiliated” investments |
— | — | — | |||||||||
|
|
|
|
|
|
|
|||||||
| Total investments, at value |
837,306,531 | 2,025,571,795 | 43,599,025 | |||||||||
| Receivable for securities sold |
— | 5,312,323 | — | |||||||||
| Receivable for shares sold |
285,068 | 5,735,271 | 326,813 | |||||||||
| Dividends and interest receivable |
— | 384,882 | 5,358 | |||||||||
| Prepaid expenses |
2,940 | 5,979 | 76 | |||||||||
|
|
|
|
|
|
|
|||||||
| 837,594,539 | 2,037,010,250 | 43,931,272 | ||||||||||
|
|
|
|
|
|
|
|||||||
| Liabilities: |
||||||||||||
| Payable for securities purchased |
— | 5,536,481 | 2,696,048 | |||||||||
| Payable for shares redeemed |
237,724 | 1,404,008 | — | |||||||||
| Due to custodian bank |
— | 57,066 | — | |||||||||
| Trustee fees payable (Note 4) |
9,700 | 20,030 | 426 | |||||||||
| Distribution fees payable (Note 4) |
114 | 859 | 902 | |||||||||
| Investment advisory fees payable (Note 4) |
861 | 996 | 365 | |||||||||
| Net unrealized depreciation on unfunded commitments |
— | 170,095 | — | |||||||||
| Accrued expenses and other payables |
135,820 | 221,331 | 75,617 | |||||||||
|
|
|
|
|
|
|
|||||||
| 384,219 | 7,410,866 | 2,773,358 | ||||||||||
|
|
|
|
|
|
|
|||||||
| Net Assets |
$ | 837,210,320 | $ | 2,029,599,384 | $ | 41,157,914 | ||||||
|
|
|
|
|
|
|
|||||||
| Net Assets consist of: |
||||||||||||
| Paid-in capital |
$ | 406,009,872 | $ | 1,400,788,110 | $ | 33,404,110 | ||||||
| Distributable earnings/(losses) |
431,200,448 | 628,811,274 | 7,753,804 | |||||||||
|
|
|
|
|
|
|
|||||||
| Net Assets |
$ | 837,210,320 | $ | 2,029,599,384 | $ | 41,157,914 | ||||||
|
|
|
|
|
|
|
|||||||
| Retail Shares: |
||||||||||||
| Net Assets |
$ | 187,861,080 | $ | 270,330,428 | $ | 9,746,212 | ||||||
| Shares Outstanding ($0.01 par value; indefinite shares authorized) |
3,395,464 | 7,319,989 | 527,742 | |||||||||
|
|
|
|
|
|
|
|||||||
| Net Asset Value and Offering Price Per Share |
$ | 55.33 | $ | 36.93 | $ | 18.47 | ||||||
|
|
|
|
|
|
|
|||||||
| Institutional Shares: |
||||||||||||
| Net Assets |
$ | 609,786,466 | $ | 1,721,197,181 | $ | 27,135,571 | ||||||
| Shares Outstanding ($0.01 par value; indefinite shares authorized) |
10,732,044 | 45,684,460 | 1,456,740 | |||||||||
|
|
|
|
|
|
|
|||||||
| Net Asset Value and Offering Price Per Share |
$ | 56.82 | $ | 37.68 | $ | 18.63 | ||||||
|
|
|
|
|
|
|
|||||||
| R6 Shares: |
||||||||||||
| Net Assets |
$ | 39,562,774 | $ | 38,071,775 | $ | 4,276,131 | ||||||
| Shares Outstanding ($0.01 par value; indefinite shares authorized) |
696,059 | 1,010,404 | 229,572 | |||||||||
|
|
|
|
|
|
|
|||||||
| Net Asset Value and Offering Price Per Share |
$ | 56.84 | $ | 37.68 | $ | 18.63 | ||||||
|
|
|
|
|
|
|
|||||||
| *Investments in securities, at cost: |
||||||||||||
| Unaffiliated investments |
$ | 427,083,252 | $ | 1,460,629,159 | $ | 35,973,655 | ||||||
| “Affiliated” investments |
— | — | — | |||||||||
|
|
|
|
|
|
|
|||||||
| Total investments, at cost |
$ | 427,083,252 | $ | 1,460,629,159 | $ | 35,973,655 | ||||||
|
|
|
|
|
|
|
|||||||
| 30 | See Notes to Financial Statements. |
| September 30, 2021 | Baron Funds |
|
FOR THE YEAR ENDED SEPTEMBER 30, 2021
|
| Baron Asset Fund |
Baron Growth Fund |
Baron Small Cap Fund |
Baron Opportunity Fund |
|||||||||||||
| Investment income: |
||||||||||||||||
| Income: |
||||||||||||||||
| Dividends — Unaffiliated investments |
$ | 16,541,431 | $ | 45,634,546 | $ | 43,985,799 | $ | 1,807,851 | ||||||||
| Dividends — “Affiliated” investments |
— | 1,350,000 | 2,165,988 | — | ||||||||||||
| Interest |
29 | — | — | 12 | ||||||||||||
| Securities lending income, net |
— | — | — | — | ||||||||||||
| Foreign taxes withheld on dividends |
— | (61,103 | ) | (83,522 | ) | — | ||||||||||
|
|
|
|
|
|
|
|
|
|||||||||
| Total income |
16,541,460 | 46,923,443 | 46,068,265 | 1,807,863 | ||||||||||||
|
|
|
|
|
|
|
|
|
|||||||||
| Expenses: |
||||||||||||||||
| Investment advisory fees (Note 4) |
59,622,517 | 87,408,966 | 51,842,467 | 14,909,820 | ||||||||||||
| Distribution fees — Retail Shares (Note 4) |
7,012,901 | 7,259,067 | 4,351,478 | 2,109,557 | ||||||||||||
| Shareholder servicing agent fees and expenses — Retail Shares |
326,820 | 252,495 | 187,265 | 107,110 | ||||||||||||
| Shareholder servicing agent fees and expenses — Institutional Shares |
106,265 | 190,440 | 102,075 | 29,354 | ||||||||||||
| Shareholder servicing agent fees and expenses — R6 Shares |
7,933 | 9,370 | 11,664 | 1,486 | ||||||||||||
| Reports to shareholders |
882,870 | 879,200 | 795,900 | 188,910 | ||||||||||||
| Trustee fees and expenses (Note 4) |
278,683 | 404,170 | 242,045 | 74,861 | ||||||||||||
| Custodian and fund accounting fees |
226,025 | 285,164 | 194,589 | 125,159 | ||||||||||||
| Registration and filing fees |
144,850 | 172,580 | 148,350 | 163,560 | ||||||||||||
| Professional fees |
132,940 | 198,350 | 81,600 | 69,845 | ||||||||||||
| Line of credit fees |
65,132 | 93,780 | 56,244 | 17,117 | ||||||||||||
| Insurance expense |
63,888 | 98,773 | 57,284 | 12,171 | ||||||||||||
| Administration fees |
55,739 | 60,511 | 54,024 | 47,883 | ||||||||||||
| Miscellaneous expenses |
2,125 | 2,500 | 2,125 | 2,158 | ||||||||||||
|
|
|
|
|
|
|
|
|
|||||||||
| Total operating expenses |
68,928,688 | 97,315,366 | 58,127,110 | 17,858,991 | ||||||||||||
| Interest expense on borrowings |
863 | 303,501 | — | 5,469 | ||||||||||||
|
|
|
|
|
|
|
|
|
|||||||||
| Total expenses |
68,929,551 | 97,618,867 | 58,127,110 | 17,864,460 | ||||||||||||
| Reimbursement of expenses by Adviser — Retail Shares (Note 4) |
— | — | — | — | ||||||||||||
| Reimbursement of expenses by Adviser — Institutional Shares (Note 4) |
— | — | — | — | ||||||||||||
| Reimbursement of expenses by Adviser — R6 Shares (Note 4) |
— | — | — | — | ||||||||||||
|
|
|
|
|
|
|
|
|
|||||||||
| Net expenses |
68,929,551 | 97,618,867 | 58,127,110 | 17,864,460 | ||||||||||||
|
|
|
|
|
|
|
|
|
|||||||||
| Net investment loss |
(52,388,091 | ) | (50,695,424 | ) | (12,058,845 | ) | (16,056,597 | ) | ||||||||
|
|
|
|
|
|
|
|
|
|||||||||
| Realized and unrealized gain (loss) on investments: |
||||||||||||||||
| Net realized gain (loss) on investments sold — Unaffiliated investments |
521,599,222 | 627,630,041 | 598,416,987 | 146,600,460 | ||||||||||||
| Net realized gain (loss) on investments sold — “Affiliated” investments |
— | 37,015,079 | 21,903,612 | — | ||||||||||||
| Net realized gain (loss) on foreign currency transactions |
— | 372 | (25,646 | ) | (2,468 | ) | ||||||||||
| Change in net unrealized appreciation (depreciation) of: |
||||||||||||||||
| Investments — Unaffiliated investments |
811,330,864 | 1,530,595,259 | 694,321,044 | 242,329,550 | ||||||||||||
| Investments — “Affiliated” investments |
— | 450,512,120 | (1,701,776 | ) | — | |||||||||||
| Unfunded commitments |
(346,731 | ) | (746,100 | ) | — | (299,342 | ) | |||||||||
| Foreign currency translations |
— | — | 32 | — | ||||||||||||
|
|
|
|
|
|
|
|
|
|||||||||
| Net gain (loss) on investments |
1,332,583,355 | 2,645,006,771 | 1,312,914,253 | 388,628,200 | ||||||||||||
|
|
|
|
|
|
|
|
|
|||||||||
| Voluntary payment from Adviser1 |
— | 739,525 | — | — | ||||||||||||
|
|
|
|
|
|
|
|
|
|||||||||
| Net increase (decrease) in net assets resulting from operations |
$ | 1,280,195,264 | $ | 2,595,050,872 | $ | 1,300,855,408 | $ | 372,571,603 | ||||||||
|
|
|
|
|
|
|
|
|
|||||||||
| 1 | See Note 4f. |
| See Notes to Financial Statements. | 31 |
| Baron Funds | September 30, 2021 |
STATEMENTS OF OPERATIONS (Continued)
|
FOR THE YEAR ENDED SEPTEMBER 30, 2021
|
| Baron Fifth Avenue Growth Fund |
Baron Discovery Fund |
Baron Durable Advantage Fund |
||||||||||
| Investment income: |
||||||||||||
| Income: |
||||||||||||
| Dividends — Unaffiliated investments |
$ | 851,424 | $ | 1,721,507 | $ | 154,011 | ||||||
| Dividends — “Affiliated” investments |
— | — | — | |||||||||
| Interest |
— | — | — | |||||||||
| Securities lending income, net |
75,955 | — | — | |||||||||
| Foreign taxes withheld on dividends |
(19,180 | ) | — | (109 | ) | |||||||
|
|
|
|
|
|
|
|||||||
| Total income |
908,199 | 1,721,507 | 153,902 | |||||||||
|
|
|
|
|
|
|
|||||||
| Expenses: |
||||||||||||
| Investment advisory fees (Note 4) |
5,287,943 | 16,234,330 | 152,910 | |||||||||
| Distribution fees — Retail Shares (Note 4) |
470,915 | 629,082 | 14,832 | |||||||||
| Shareholder servicing agent fees and expenses — Retail Shares |
40,923 | 41,460 | 14,394 | |||||||||
| Shareholder servicing agent fees and expenses — Institutional Shares |
27,082 | 62,495 | 10,636 | |||||||||
| Shareholder servicing agent fees and expenses — R6 Shares |
1,680 | 1,367 | 146 | |||||||||
| Reports to shareholders |
64,335 | 258,580 | 2,731 | |||||||||
| Trustee fees and expenses (Note 4) |
35,626 | 70,982 | 1,129 | |||||||||
| Custodian and fund accounting fees |
46,611 | 81,487 | 7,663 | |||||||||
| Registration and filing fees |
110,080 | 169,900 | 64,524 | |||||||||
| Professional fees |
44,803 | 53,070 | 56,292 | |||||||||
| Line of credit fees |
8,577 | 19,013 | 277 | |||||||||
| Insurance expense |
6,573 | 12,861 | 171 | |||||||||
| Administration fees |
46,061 | 48,048 | 44,374 | |||||||||
| Miscellaneous expenses |
2,126 | 2,156 | 2,891 | |||||||||
|
|
|
|
|
|
|
|||||||
| Total operating expenses |
6,193,335 | 17,684,831 | 372,970 | |||||||||
| Interest expense on borrowings |
— | — | — | |||||||||
|
|
|
|
|
|
|
|||||||
| Total expenses |
6,193,335 | 17,684,831 | 372,970 | |||||||||
| Reimbursement of expenses by Adviser — Retail Shares (Note 4) |
(35,737 | ) | — | (57,118 | ) | |||||||
| Reimbursement of expenses by Adviser — Institutional Shares (Note 4) |
(20,237 | ) | — | (111,534 | ) | |||||||
| Reimbursement of expenses by Adviser — R6 Shares (Note 4) |
(793 | ) | — | (24,814 | ) | |||||||
|
|
|
|
|
|
|
|||||||
| Net expenses |
6,136,568 | 17,684,831 | 179,504 | |||||||||
|
|
|
|
|
|
|
|||||||
| Net investment loss |
(5,228,369 | ) | (15,963,324 | ) | (25,602 | ) | ||||||
|
|
|
|
|
|
|
|||||||
| Realized and unrealized gain (loss) on investments: |
||||||||||||
| Net realized gain (loss) on investments sold — Unaffiliated investments |
25,183,060 | 91,796,346 | 249,372 | |||||||||
| Net realized gain (loss) on investments sold — “Affiliated” investments |
— | — | — | |||||||||
| Net realized gain (loss) on foreign currency transactions |
(3,938 | ) | 11,655 | 9 | ||||||||
| Change in net unrealized appreciation (depreciation) of: |
||||||||||||
| Investments — Unaffiliated investments |
106,431,535 | 276,524,882 | 4,673,988 | |||||||||
| Investments — “Affiliated” investments |
— | — | — | |||||||||
| Unfunded commitments |
— | (170,095 | ) | — | ||||||||
| Foreign currency translations |
— | (33 | ) | (5 | ) | |||||||
|
|
|
|
|
|
|
|||||||
| Net gain (loss) on investments |
131,610,657 | 368,162,755 | 4,923,364 | |||||||||
|
|
|
|
|
|
|
|||||||
| Net increase (decrease) in net assets resulting from operations |
$ | 126,382,288 | $ | 352,199,431 | $ | 4,897,762 | ||||||
|
|
|
|
|
|
|
|||||||
| 32 | See Notes to Financial Statements. |
| September 30, 2021 | Baron Funds |
STATEMENTS OF CHANGES IN NET ASSETS
|
|
| Baron Asset Fund | Baron Growth Fund | Baron Small Cap Fund | ||||||||||||||||||||||
| For the Year Ended September 30, 2021 |
For the Year Ended September 30, 2020 |
For the Year Ended September 30, 2021 |
For the Year Ended September 30, 2020 |
For the Year Ended September 30, 2021 |
For the Year Ended September 30, 2020 |
|||||||||||||||||||
| Increase (Decrease) in Net Assets: |
||||||||||||||||||||||||
| Operations: |
||||||||||||||||||||||||
| Net investment income (loss) |
$ | (52,388,091 | ) | $ | (31,884,054 | ) | $ | (50,695,424 | ) | $ | (19,420,956 | ) | $ | (12,058,845 | ) | $ | (32,421,633 | ) | ||||||
| Net realized gain (loss) |
521,599,222 | 173,965,572 | 664,645,492 | 394,007,115 | 620,294,953 | 509,963,898 | ||||||||||||||||||
| Change in net unrealized appreciation (depreciation) |
810,984,133 | 841,541,313 | 1,980,361,279 | 846,921,993 | 692,619,300 | 605,788,312 | ||||||||||||||||||
| Voluntary payment from Adviser1 |
— | — | 739,525 | — | — | — | ||||||||||||||||||
|
|
|
|
|
|
|
|
|
|
|
|
|
|||||||||||||
| Increase (decrease) in net assets resulting from operations |
1,280,195,264 | 983,622,831 | 2,595,050,872 | 1,221,508,152 | 1,300,855,408 | 1,083,330,577 | ||||||||||||||||||
|
|
|
|
|
|
|
|
|
|
|
|
|
|||||||||||||
| Distributions to shareholders from: |
||||||||||||||||||||||||
| Distributable earnings — Retail Shares |
(83,393,943 | ) | (40,552,872 | ) | (129,694,548 | ) | (94,740,238 | ) | (172,031,316 | ) | (135,343,515 | ) | ||||||||||||
| Distributable earnings — Institutional Shares |
(82,971,616 | ) | (35,026,357 | ) | (238,672,050 | ) | (154,792,579 | ) | (301,283,099 | ) | (205,916,210 | ) | ||||||||||||
| Distributable earnings — R6 Shares |
(4,853,119 | ) | (1,921,115 | ) | (8,726,380 | ) | (5,468,144 | ) | (23,695,921 | ) | (14,741,046 | ) | ||||||||||||
|
|
|
|
|
|
|
|
|
|
|
|
|
|||||||||||||
| Decrease in net assets from distributions to shareholders |
(171,218,678 | ) | (77,500,344 | ) | (377,092,978 | ) | (255,000,961 | ) | (497,010,336 | ) | (356,000,771 | ) | ||||||||||||
|
|
|
|
|
|
|
|
|
|
|
|
|
|||||||||||||
| Capital share transactions: |
||||||||||||||||||||||||
| Proceeds from the sale of shares — Retail Shares |
117,901,509 | 139,669,263 | 143,409,884 | 175,592,079 | 205,450,106 | 87,292,783 | ||||||||||||||||||
| Proceeds from the sale of shares — Institutional Shares |
521,269,301 | 564,707,309 | 748,201,621 | 729,983,269 | 736,976,454 | 460,566,456 | ||||||||||||||||||
| Proceeds from the sale of shares — R6 Shares |
18,911,470 | 25,089,988 | 28,050,223 | 45,272,784 | 51,146,197 | 55,606,956 | ||||||||||||||||||
| Net asset value of shares issued in reinvestment of distributions — Retail Shares |
80,591,772 | 39,326,659 | 126,441,145 | 92,664,059 | 167,569,328 | 132,348,628 | ||||||||||||||||||
| Net asset value of shares issued in reinvestment of distributions — Institutional Shares |
79,896,649 | 33,774,344 | 229,865,089 | 148,813,744 | 283,821,699 | 194,127,046 | ||||||||||||||||||
| Net asset value of shares issues in reinvestment of distribution — R6 Shares |
4,853,119 | 1,921,116 | 8,726,380 | 5,468,144 | 23,695,921 | 14,741,046 | ||||||||||||||||||
| Cost of shares redeemed — Retail Shares |
(345,577,646 | ) | (361,027,993 | ) | (495,912,634 | ) | (559,417,252 | ) | (312,878,639 | ) | (394,679,950 | ) | ||||||||||||
| Cost of shares redeemed — Institutional Shares |
(554,212,105 | ) | (514,445,516 | ) | (1,085,044,504 | ) | (1,046,419,927 | ) | (1,036,493,218 | ) | (656,020,912 | ) | ||||||||||||
| Cost of shares redeemed — R6 Shares |
(18,242,712 | ) | (14,512,092 | ) | (31,188,227 | ) | (36,505,282 | ) | (61,101,320 | ) | (48,024,639 | ) | ||||||||||||
|
|
|
|
|
|
|
|
|
|
|
|
|
|||||||||||||
| Increase (decrease) in net assets derived from capital share transactions |
(94,608,643 | ) | (85,496,922 | ) | (327,451,023 | ) | (444,548,382 | ) | 58,186,528 | (154,042,586 | ) | |||||||||||||
|
|
|
|
|
|
|
|
|
|
|
|
|
|||||||||||||
| Net increase (decrease) in net assets |
1,014,367,943 | 820,625,565 | 1,890,506,871 | 521,958,809 | 862,031,600 | 573,287,220 | ||||||||||||||||||
|
|
|
|
|
|
|
|
|
|
|
|
|
|||||||||||||
| Net Assets: |
||||||||||||||||||||||||
| Beginning of year |
5,151,303,266 | 4,330,677,701 | 7,311,464,553 | 6,789,505,744 | 4,454,424,947 | 3,881,137,727 | ||||||||||||||||||
|
|
|
|
|
|
|
|
|
|
|
|
|
|||||||||||||
| End of year |
$ | 6,165,671,209 | $ | 5,151,303,266 | $ | 9,201,971,424 | $ | 7,311,464,553 | $ | 5,316,456,547 | $ | 4,454,424,947 | ||||||||||||
|
|
|
|
|
|
|
|
|
|
|
|
|
|||||||||||||
| Capital share transactions — Retail Shares |
||||||||||||||||||||||||
| Shares sold |
1,048,197 | 1,642,554 | 1,329,997 | 2,212,166 | 5,246,358 | 3,030,099 | ||||||||||||||||||
| Shares issued in reinvestment of distributions |
772,248 | 458,513 | 1,288,172 | 1,128,681 | 4,833,266 | 4,538,705 | ||||||||||||||||||
| Shares redeemed |
(3,083,230 | ) | (4,273,435 | ) | (4,734,275 | ) | (7,125,863 | ) | (8,200,073 | ) | (13,787,523 | ) | ||||||||||||
|
|
|
|
|
|
|
|
|
|
|
|
|
|||||||||||||
| Net increase (decrease) |
(1,262,785 | ) | (2,172,368 | ) | (2,116,106 | ) | (3,785,016 | ) | 1,879,551 | (6,218,719 | ) | |||||||||||||
|
|
|
|
|
|
|
|
|
|
|
|
|
|||||||||||||
| Capital share transactions — Institutional Shares |
||||||||||||||||||||||||
| Shares sold |
4,448,129 | 6,359,953 | 6,802,398 | 9,162,426 | 17,916,951 | 15,418,261 | ||||||||||||||||||
| Shares issued in reinvestment of distributions |
731,587 | 377,789 | 2,249,676 | 1,748,898 | 7,737,778 | 6,346,095 | ||||||||||||||||||
| Shares redeemed |
(4,674,173 | ) | (5,776,850 | ) | (9,642,068 | ) | (12,778,153 | ) | (25,023,899 | ) | (21,608,710 | ) | ||||||||||||
|
|
|
|
|
|
|
|
|
|
|
|
|
|||||||||||||
| Net increase (decrease) |
505,543 | 960,892 | (589,994 | ) | (1,866,829 | ) | 630,830 | 155,646 | ||||||||||||||||
|
|
|
|
|
|
|
|
|
|
|
|
|
|||||||||||||
| Capital share transactions — R6 Shares |
||||||||||||||||||||||||
| Shares sold |
163,468 | 283,023 | 250,257 | 550,626 | 1,255,551 | 1,807,365 | ||||||||||||||||||
| Shares issued in reinvestment of distributions |
44,447 | 21,494 | 85,387 | 64,255 | 646,194 | 482,049 | ||||||||||||||||||
| Shares redeemed |
(153,961 | ) | (161,503 | ) | (278,643 | ) | (443,847 | ) | (1,502,914 | ) | (1,628,737 | ) | ||||||||||||
|
|
|
|
|
|
|
|
|
|
|
|
|
|||||||||||||
| Net increase (decrease) |
53,954 | 143,014 | 57,001 | 171,034 | 398,831 | 660,677 | ||||||||||||||||||
|
|
|
|
|
|
|
|
|
|
|
|
|
|||||||||||||
| 1 | See Note 4f. |
| See Notes to Financial Statements. | 33 |
| Baron Funds | September 30, 2021 |
STATEMENTS OF CHANGES IN NET ASSETS (Continued)
|
|
| Baron Opportunity Fund | Baron Fifth Avenue Growth Fund | |||||||||||||||
| For the Year Ended September 30, 2021 |
For the Year Ended September 30, 2020 |
For the Year Ended September 30, 2021 |
For the Year Ended September 30, 2020 |
|||||||||||||
| Increase (Decrease) in Net Assets: |
||||||||||||||||
| Operations: |
||||||||||||||||
| Net investment income (loss) |
$ | (16,056,597 | ) | $ | (6,575,772 | ) | $ | (5,228,369 | ) | $ | (2,018,503 | ) | ||||
| Net realized gain (loss) |
146,597,992 | 101,370,176 | 25,179,122 | 2,634,924 | ||||||||||||
| Change in net unrealized appreciation (depreciation) |
242,030,208 | 289,129,611 | 106,431,535 | 155,505,076 | ||||||||||||
|
|
|
|
|
|
|
|
|
|||||||||
| Increase (decrease) in net assets resulting from operations |
372,571,603 | 383,924,015 | 126,382,288 | 156,121,497 | ||||||||||||
|
|
|
|
|
|
|
|
|
|||||||||
| Distributions to shareholders from: |
||||||||||||||||
| Distributable earnings — Retail Shares |
(52,365,778 | ) | (21,327,179 | ) | (689,834 | ) | (3,490,662 | ) | ||||||||
| Distributable earnings — Institutional Shares |
(32,020,901 | ) | (7,094,221 | ) | (1,548,437 | ) | (5,396,461 | ) | ||||||||
| Distributable earnings — R6 Shares |
(1,947,521 | ) | (1,079,435 | ) | (124,992 | ) | (703,371 | ) | ||||||||
|
|
|
|
|
|
|
|
|
|||||||||
| Decrease in net assets from distributions to shareholders |
(86,334,200 | ) | (29,500,835 | ) | (2,363,263 | ) | (9,590,494 | ) | ||||||||
|
|
|
|
|
|
|
|
|
|||||||||
| Capital share transactions: |
||||||||||||||||
| Proceeds from the sale of shares — Retail Shares |
281,790,567 | 260,053,140 | 40,552,091 | 43,462,691 | ||||||||||||
| Proceeds from the sale of shares — Institutional Shares |
436,910,712 | 280,583,112 | 279,779,017 | 131,761,478 | ||||||||||||
| Proceeds from the sale of shares — R6 Shares |
2,145,302 | 354,601 | 434,811 | 79,881 | ||||||||||||
| Net asset value of shares issued in reinvestment of distributions — Retail Shares |
50,408,936 | 20,703,884 | 664,220 | 3,365,849 | ||||||||||||
| Net asset value of shares issued in reinvestment of distributions — Institutional Shares |
31,726,872 | 6,811,664 | 1,456,269 | 5,225,784 | ||||||||||||
| Net asset value of shares issues in reinvestment of distribution — R6 Shares |
1,942,787 | 1,079,435 | 124,992 | 703,371 | ||||||||||||
| Cost of shares redeemed — Retail Shares |
(278,264,972 | ) | (160,438,528 | ) | (61,114,480 | ) | (36,475,724 | ) | ||||||||
| Cost of shares redeemed — Institutional Shares |
(278,557,907 | ) | (94,846,299 | ) | (108,821,753 | ) | (41,814,866 | ) | ||||||||
| Cost of shares redeemed — R6 Shares |
(434,249 | ) | (107,949 | ) | (382,769 | ) | (694,165 | ) | ||||||||
|
|
|
|
|
|
|
|
|
|||||||||
| Increase (decrease) in net assets derived from capital share transactions |
247,668,048 | 314,193,060 | 152,692,398 | 105,614,299 | ||||||||||||
|
|
|
|
|
|
|
|
|
|||||||||
| Net increase (decrease) in net assets |
533,905,451 | 668,616,240 | 276,711,423 | 252,145,302 | ||||||||||||
|
|
|
|
|
|
|
|
|
|||||||||
| Net Assets: |
||||||||||||||||
| Beginning of year |
1,080,130,632 | 411,514,392 | 560,498,897 | 308,353,595 | ||||||||||||
|
|
|
|
|
|
|
|
|
|||||||||
| End of year |
$ | 1,614,036,083 | $ | 1,080,130,632 | $ | 837,210,320 | $ | 560,498,897 | ||||||||
|
|
|
|
|
|
|
|
|
|||||||||
| Capital share transactions — Retail Shares |
||||||||||||||||
| Shares sold |
6,929,242 | 9,635,838 | 791,323 | 1,112,952 | ||||||||||||
| Shares issued in reinvestment of distributions |
1,418,771 | 922,633 | 14,013 | 101,381 | ||||||||||||
| Shares redeemed |
(6,795,284 | ) | (6,246,974 | ) | (1,204,230 | ) | (1,017,802 | ) | ||||||||
|
|
|
|
|
|
|
|
|
|||||||||
| Net increase (decrease) |
1,552,729 | 4,311,497 | (398,894 | ) | 196,531 | |||||||||||
|
|
|
|
|
|
|
|
|
|||||||||
| Capital share transactions — Institutional Shares |
||||||||||||||||
| Shares sold |
9,947,143 | 9,983,852 | 5,405,985 | 3,119,515 | ||||||||||||
| Shares issued in reinvestment of distributions |
848,766 | 290,352 | 29,983 | 152,282 | ||||||||||||
| Shares redeemed |
(6,411,277 | ) | (3,355,186 | ) | (2,044,977 | ) | (1,124,759 | ) | ||||||||
|
|
|
|
|
|
|
|
|
|||||||||
| Net increase (decrease) |
4,384,632 | 6,919,018 | 3,390,991 | 2,147,038 | ||||||||||||
|
|
|
|
|
|
|
|
|
|||||||||
| Capital share transactions — R6 Shares |
||||||||||||||||
| Shares sold |
46,717 | 12,697 | 7,771 | 2,041 | ||||||||||||
| Shares issued in reinvestment of distributions |
51,918 | 45,953 | 2,572 | 20,514 | ||||||||||||
| Shares redeemed |
(9,648 | ) | (4,380 | ) | (7,020 | ) | (16,337 | ) | ||||||||
|
|
|
|
|
|
|
|
|
|||||||||
| Net increase (decrease) |
88,987 | 54,270 | 3,323 | 6,218 | ||||||||||||
|
|
|
|
|
|
|
|
|
|||||||||
| 34 | See Notes to Financial Statements. |
| September 30, 2021 | Baron Funds |
STATEMENTS OF CHANGES IN NET ASSETS (Continued)
|
|
| Baron Discovery Fund | Baron Durable Advantage Fund | |||||||||||||||
| For the Year Ended September 30, 2021 |
For the Year Ended September 30, 2020 |
For the Year Ended September 30, 2021 |
For the Year Ended September 30, 2020 |
|||||||||||||
| Increase (Decrease) in Net Assets: |
||||||||||||||||
| Operations: |
||||||||||||||||
| Net investment income (loss) |
$ | (15,963,324 | ) | $ | (5,660,071 | ) | $ | (25,602 | ) | $ | 14,722 | |||||
| Net realized gain (loss) |
91,808,001 | 38,501,502 | 249,381 | 38,112 | ||||||||||||
| Change in net unrealized appreciation (depreciation) |
276,354,754 | 231,660,000 | 4,673,983 | 2,203,020 | ||||||||||||
|
|
|
|
|
|
|
|
|
|||||||||
| Increase (decrease) in net assets resulting from operations |
352,199,431 | 264,501,431 | 4,897,762 | 2,255,854 | ||||||||||||
|
|
|
|
|
|
|
|
|
|||||||||
| Distributions to shareholders from: |
||||||||||||||||
| Distributable earnings — Retail Shares |
(6,337,567 | ) | (171,734 | ) | (4,063 | ) | (5,349 | ) | ||||||||
| Distributable earnings — Institutional Shares |
(29,923,673 | ) | (593,926 | ) | (7,750 | ) | (8,806 | ) | ||||||||
| Distributable earnings — R6 Shares |
(741,937 | ) | (10,037 | ) | (1,663 | ) | (3,041 | ) | ||||||||
|
|
|
|
|
|
|
|
|
|||||||||
| Decrease in net assets from distributions to shareholders |
(37,003,177 | ) | (775,697 | ) | (13,476 | ) | (17,196 | ) | ||||||||
|
|
|
|
|
|
|
|
|
|||||||||
| Capital share transactions: |
||||||||||||||||
| Proceeds from the sale of shares — Retail Shares |
139,737,935 | 48,067,529 | 9,806,360 | 4,199,326 | ||||||||||||
| Proceeds from the sale of shares — Institutional Shares |
920,664,644 | 286,987,230 | 18,222,606 | 4,452,049 | ||||||||||||
| Proceeds from the sale of shares — R6 Shares |
24,318,756 | 6,223,324 | 1,038,549 | 1,713,710 | ||||||||||||
| Net asset value of shares issued in reinvestment of distributions — Retail Shares |
6,287,081 | 170,515 | 4,026 | 5,215 | ||||||||||||
| Net asset value of shares issued in reinvestment of distributions — Institutional Shares |
28,249,535 | 560,845 | 7,750 | 8,806 | ||||||||||||
| Net asset value of shares issues in reinvestment of distribution — R6 Shares |
741,937 | 10,037 | 1,663 | 3,041 | ||||||||||||
| Cost of shares redeemed — Retail Shares |
(94,280,977 | ) | (54,092,453 | ) | (5,279,107 | ) | (2,753,121 | ) | ||||||||
| Cost of shares redeemed — Institutional Shares |
(242,852,333 | ) | (149,219,982 | ) | (2,007,425 | ) | (2,381,959 | ) | ||||||||
| Cost of shares redeemed — R6 Shares |
(8,132,869 | ) | (1,671,275 | ) | (16,324 | ) | (55,567 | ) | ||||||||
|
|
|
|
|
|
|
|
|
|||||||||
| Increase (decrease) in net assets derived from capital share transactions |
774,733,709 | 137,035,770 | 21,778,098 | 5,191,500 | ||||||||||||
|
|
|
|
|
|
|
|
|
|||||||||
| Net increase (decrease) in net assets |
1,089,929,963 | 400,761,504 | 26,662,384 | 7,430,158 | ||||||||||||
|
|
|
|
|
|
|
|
|
|||||||||
| Net Assets: |
||||||||||||||||
| Beginning of year |
939,669,421 | 538,907,917 | 14,495,530 | 7,065,372 | ||||||||||||
|
|
|
|
|
|
|
|
|
|||||||||
| End of year |
$ | 2,029,599,384 | $ | 939,669,421 | $ | 41,157,914 | $ | 14,495,530 | ||||||||
|
|
|
|
|
|
|
|
|
|||||||||
| Capital share transactions — Retail Shares |
||||||||||||||||
| Shares sold |
3,870,281 | 2,148,215 | 564,903 | 326,160 | ||||||||||||
| Shares issued in reinvestment of distributions |
203,927 | 8,077 | 212 | 372 | ||||||||||||
| Shares redeemed |
(2,619,489 | ) | (2,615,815 | ) | (311,407 | ) | (215,823 | ) | ||||||||
|
|
|
|
|
|
|
|
|
|||||||||
| Net increase (decrease) |
1,454,719 | (459,523 | ) | 253,708 | 110,709 | |||||||||||
|
|
|
|
|
|
|
|
|
|||||||||
| Capital share transactions — Institutional Shares |
||||||||||||||||
| Shares sold |
24,844,227 | 12,803,664 | 1,011,124 | 338,023 | ||||||||||||
| Shares issued in reinvestment of distributions |
900,240 | 26,183 | 405 | 624 | ||||||||||||
| Shares redeemed |
(6,561,498 | ) | (7,127,814 | ) | (108,630 | ) | (177,007 | ) | ||||||||
|
|
|
|
|
|
|
|
|
|||||||||
| Net increase (decrease) |
19,182,969 | 5,702,033 | 902,899 | 161,640 | ||||||||||||
|
|
|
|
|
|
|
|
|
|||||||||
| Capital share transactions — R6 Shares |
||||||||||||||||
| Shares sold |
678,416 | 262,178 | 60,974 | 130,606 | ||||||||||||
| Shares issued in reinvestment of distributions |
23,636 | 469 | 87 | 216 | ||||||||||||
| Shares redeemed |
(223,403 | ) | (74,529 | ) | (970 | ) | (4,279 | ) | ||||||||
|
|
|
|
|
|
|
|
|
|||||||||
| Net increase (decrease) |
478,649 | 188,118 | 60,091 | 126,543 | ||||||||||||
|
|
|
|
|
|
|
|
|
|||||||||
| See Notes to Financial Statements. | 35 |
| Baron Funds | September 30, 2021 |
1. ORGANIZATION
Baron Investment Funds Trust (the “Trust”) is registered under the Investment Company Act of 1940, as amended (the “1940 Act”), as an open-end management investment company established as a Massachusetts business trust on February 19, 1987, and accordingly follows the investment company accounting and reporting guidance of the Financial Accounting Standards Board (“FASB”) Accounting Standard Codification Topic 946 Financial Services – Investment Companies. The Trust currently offers seven series (individually, a “Fund” and collectively, the “Funds”): Baron Asset Fund, Baron Growth Fund, Baron Small Cap Fund, Baron Opportunity Fund, Baron Fifth Avenue Growth Fund, Baron Discovery Fund, and Baron Durable Advantage Fund.
Each Fund offers Retail Shares, Institutional Shares, and R6 Shares. Each class of shares differs only in its ongoing fees, expenses and eligibility requirements. Retail Shares are offered to all investors. Institutional Shares are for investments in the amount of $1 million or more per Fund. Institutional Shares are intended for certain financial intermediaries that offer shares of Baron Funds through fee-based platforms, retirement platforms, or other platforms. R6 Shares are for investments in the amount of $5 million or more per Fund. R6 Shares are available only to qualified 401(a) plans (including 401(k) plans, Keogh plans, profit sharing plans, money purchase pension plans, target benefit plans, defined benefit pension plans, and Taft-Hartley multi-employer pension plans), endowment funds and foundations, any state, county or city, or its instrumentality, department, authority, or agency, 457 plans, including 457(a) governmental entity plans and tax-exempt plans, accounts registered to insurance companies, trust companies and bank trust departments, investment companies, both affiliated and not affiliated with BAMCO, Inc. (the “Adviser”), and any entity that is considered a corporation for tax purposes, including corporate non-qualified deferred compensation plans of such corporations. Each class of shares has equal rights to earnings and assets, except that each class bears different expenses for distribution and shareholder servicing. Each Fund’s investment income, realized and unrealized gains or losses on investments and foreign currency, and expenses other than those attributable to a specific class are allocated to each class based on its relative net assets. Each class of shares has exclusive voting rights with respect to matters that affect just that class. The investment goals of the Funds are as follows:
Baron Asset Fund seeks capital appreciation through long-term investments primarily in securities of medium-sized companies with undervalued assets or favorable growth prospects.
Baron Growth Fund seeks capital appreciation through long-term investments primarily in securities of small-sized growth companies.
Baron Small Cap Fund seeks capital appreciation through investments primarily in securities of small-sized growth companies.
Baron Opportunity Fund seeks capital appreciation through investments primarily in growth companies that benefit from technology advances.
Baron Fifth Avenue Growth Fund seeks capital appreciation through investments primarily in securities of large-sized growth companies.
Baron Discovery Fund seeks capital appreciation through investments primarily in securities of small-sized growth companies.
Baron Durable Advantage Fund seeks capital appreciation through long-term investments primarily in securities of large-sized companies.
2. SIGNIFICANT ACCOUNTING POLICIES
The following is a summary of significant accounting policies followed by the Funds. The policies are in conformity with accounting principles generally accepted in the United States of America (“GAAP”). The preparation of financial statements in accordance with GAAP requires management to make estimates and assumptions that affect the reported amounts of assets and liabilities at the date of the financial statements and the amounts of income and expenses during the period. Actual results could differ from those estimates. Events occurring subsequent to the date of the Statements of Assets and Liabilities and through the date of issuance of the financial statements have been evaluated for adjustment to or disclosure in the financial statements.
a) Security Valuation. The Funds’ share prices or net asset values (“NAV”) are calculated as of the scheduled close of the regular trading session (usually 4 p.m. E.T. or such other time as of which the Funds’ NAVs are calculated (the “NAV Calculation Time”)) on the New York Stock Exchange (the “Exchange”) on any day the Exchange is scheduled to be open. Portfolio securities traded on any national stock exchange are valued based on the last sale price on the exchange where such shares are principally traded. For securities traded on NASDAQ, the Funds use the NASDAQ Official Closing Price. If there are no sales on a given day, the value of the security may be the average of the most recent bid and asked quotations on such exchange or the last sale price from a prior day. Where market quotations are not readily available, or, if in the Adviser’s judgment, they do not accurately reflect the fair value of a security, or an event occurs after the market close but before the Funds are priced that materially affects the value of a security, the security will be valued by the Adviser using policies and procedures approved by the Board of Trustees (the “Board”). Some of the more common reasons that may necessitate that a security be valued using “fair value” pricing may include, but are not limited to: trading of the security has been halted or suspended; or the security has not been traded for an extended period of time. The Adviser has a Fair Valuation Committee (the “Committee”) comprised of senior management representatives and the Committee reports to the Board every quarter. Factors the Committee may consider when valuing a security include whether a current price is stale, there is recent news, the security is thinly traded, transactions are infrequent or quotations are genuine. There can be no guarantee, however, that a fair valuation used by the Funds on any given day will more accurately reflect the market value of an investment than the closing price of such investment in its market.
U.S. Government obligations, money market instruments, and other debt instruments held by the Funds with a remaining maturity of 60 days or less are generally valued at amortized cost, which approximates fair value. Debt instruments having a greater remaining maturity will be valued on the basis of prices obtained from a pricing service approved by the Board or at the mean of the bid and ask prices from the dealer maintaining an active market in that security. The value of the Funds’ investments in convertible bonds/convertible preferred stocks is determined primarily by obtaining valuations from independent pricing services based on readily available bid quotations or, if quotations are not available, by methods which include various considerations such as yields or prices of securities of comparable quality, coupon, maturity and type; indications as to values from dealers; and general market conditions. Other inputs used by an independent pricing service to value convertible bonds/convertible preferred stocks generally include underlying stock data, conversion premiums, listed bond and preferred stock prices and other market information which may include benchmark curves, trade execution data, sensitivity analysis, when available, or an estimated value calculated based on the price of the underlying common share on the valuation date adjusted for accrued and unpaid dividends. Open-end investment companies, including securities lending collateral invested in registered investment company money market funds, are valued at their NAV each day.
36
| September 30, 2021 | Baron Funds |
NOTES TO FINANCIAL STATEMENTS (Continued)
2. SIGNIFICANT ACCOUNTING POLICIES (Continued)
Non-U.S. equity securities traded on foreign securities exchanges are generally valued using an independent pricing vendor that provides daily fair value adjustment factors based on information such as local closing price, relevant general and sector indexes, currency fluctuations, and depositary receipts, as applicable. Securities valued using such adjustment factors are classified as Level 2 in the fair value hierarchy. The models of the independent pricing vendor generate an adjustment factor for each security, which is applied to the local closing price to adjust it for post-closing market movements up to the time the Funds are valued and translated into U.S. dollars. If the vendor does not provide an adjustment factor for a security, the security is valued based on its most recent local closing price and translated into U. S. dollars. The Adviser may also fair value securities in other situations, for example, when a particular foreign market is closed but the Funds are open. Other mutual funds may adjust the prices of their securities by different amounts.
b) Securities Transactions, Investment Income and Expense Allocation. Securities transactions are recorded on a trade date basis. Realized gain and loss from securities transactions are recorded on an identified cost basis for financial reporting and federal income tax purposes. Dividend income is recognized on the ex-dividend date and interest income is recognized on an accrual basis, which includes the accretion of discounts and amortization of premiums. Non-cash dividends received in the form of stock, if any, are recognized on the ex-dividend date and recorded as non-cash dividend income at fair value. Certain dividends from foreign securities will be recorded as soon as the Funds are informed of the dividend if such information is obtained subsequent to the ex-dividend date. Distributions received from certain investments held by the Funds may be comprised of dividends, realized gains and returns of capital. The Funds originally estimate the expected classification of such payments. The amounts may subsequently be reclassified upon receipt of information from the issuer. The Funds are charged for those expenses of the Trust that are directly attributable to each Fund, such as advisory and custodian fees. Expenses that are not directly attributable to a Fund are typically allocated among the Funds in proportion to their respective net assets.
c) Foreign Currency Translations. Values of assets and liabilities denominated in foreign currencies are translated into U.S. dollars using the price of such currencies at the NAV Calculation Time. Purchases and sales of investments and dividend income are converted at the prevailing rate of exchange on the respective dates of such transactions. Net realized gain (loss) on foreign currency transactions includes gain (loss) arising from the fluctuation in the exchange rates between trade and settlement dates on security transactions and currency gain (loss) between the accrual and payment dates on dividends and foreign withholding taxes. The Funds do not isolate that portion of the results of operations resulting from changes in foreign exchange rates on investments from the fluctuations arising from changes in market prices of securities held. Such fluctuations are included with the net realized and unrealized gain or loss from investments and foreign currency transactions on the Statements of Operations. The Funds may invest in foreign securities and foreign currency transactions that may involve risks not associated with domestic investments as a result of the level of governmental supervision and regulation of foreign securities markets and the possibility of political or economic instability, among others.
Pursuant to U.S. federal income tax regulations, gains and losses from certain foreign currency transactions and the foreign currency portion of gains and losses realized on sales and maturities of foreign denominated debt securities are generally treated as ordinary income for U.S. federal income tax purposes.
d) Securities Lending. The Funds may lend securities to certain brokers under the terms of a master netting agreement. Upon such loans, the Funds receive collateral which is maintained by the custodian. The Funds may pay fees to the custodian for administering the securities lending program. The Funds earn interest on such collateral and earn income in the form of negotiated lenders’ fees, both of which are included in securities lending income in the Statements of Operations. Securities loaned are required to be secured at all times by collateral equal to at least 102% of the market value of the securities loaned. Risks may arise upon entering into securities lending to the extent that the value of the collateral is less than the value of the securities loaned due to the changes in the value of collateral or the loaned securities. The collateral is marked-to-market daily and settled on the next business day. The Funds may receive collateral in the form of cash or other eligible securities, such as a letter of credit issued by a U.S. bank or securities issued or guaranteed by the U.S. government. Securities purchased with cash collateral are subject to the risks inherent in investing in these securities.
Baron Fifth Avenue Growth Fund participated in securities lending activities during the year ended September 30, 2021. There were no securities on loan at September 30, 2021.
e) Repurchase Agreements. The Funds may invest in repurchase agreements, which are short term investments whereby the Funds acquire ownership of a debt security and the seller agrees to repurchase the security at a future date at a specified price. When entering into repurchase agreements, it is the Funds’ policy that their custodian take possession of the underlying collateral securities, the market value of which, at all times, equals at least 102% of the principal amount of the repurchase transaction. To the extent that any repurchase transaction exceeds one business day, the value of the collateral is marked-to-market to ensure the adequacy of the collateral. If the seller defaults and the market value of the collateral declines or if bankruptcy proceedings are commenced with respect to the seller of the security, realization of the collateral by the Funds may be delayed or limited. The information required to be disclosed by FASB Accounting Standards Update No. 2011-11 for the Funds’ investments in repurchase agreements at September 30, 2021, including the fair value of the repurchase agreement and the amount of collateral, can be found in each respective Fund’s Statement of Net Assets.
f) Master Limited Partnerships. The Funds may invest in master limited partnerships (“MLPs”). MLPs are limited partnerships or limited liability companies, whose partnership units or limited liability interests are listed and traded on a U.S. securities exchange, and are treated as publicly traded partnerships for federal income tax purposes. To qualify to be treated as a partnership for tax purposes, an MLP must receive at least 90% of its income from qualifying sources as set forth in Section 7704(d) of the Internal Revenue Code of 1986, as amended. These qualifying sources include interest, dividend, real property rent, gain from sale or other disposition of real property and income from activities such as the exploration, development, mining, production, processing, refining, transportation, storage and marketing of mineral or natural resources.
37
| Baron Funds | September 30, 2021 |
NOTES TO FINANCIAL STATEMENTS (Continued)
2. SIGNIFICANT ACCOUNTING POLICIES (Continued)
g) Special Purpose Acquisition Company. The Funds may acquire an interest in a special purpose acquisition company (“SPAC”) in an initial public offering (“IPO”), via a private placement or a secondary market transaction. A SPAC is typically a publicly traded company that raises investment capital via an IPO for the purpose of acquiring the equity securities of one or more existing companies via merger, combination, acquisition or other similar transactions. To the extent the SPAC is invested in cash or similar securities, this may negatively affect a Fund’s performance if the Fund is invested in the SPAC during such period. There is no guarantee that the SPACs will complete an acquisition or that any acquisitions that are completed will be profitable. Some SPACs may pursue acquisitions only within certain industries or regions, which may increase the volatility of their prices. These transactions will require the approval of the respective shareholders and are subject to other customary closing conditions, including the receipt of certain regulatory approvals. If these conditions are not met, the SPAC’s acquisition may not close and, to the extent a Fund had committed to participate in a private placement (i.e., PIPE transaction, defined below) the Fund will no longer be obligated to fulfill its commitment.
h) Private Investment in Public Equity. The Funds may acquire equity securities of an issuer that are issued through a private investment in public equity (“PIPE”) transaction, including through commitments to purchase securities on a when-issued basis. A Fund will generally earmark an amount of cash or high quality securities equal to the amount of its commitment to purchase the when-issued securities. PIPE transactions typically involve the purchase of securities directly from a publicly traded company in a private placement transaction, including securities issued by a SPAC, typically at a discount to the market price of the company’s securities. There is a risk that if the market price of the securities drops below a set threshold, the company may have to issue additional stock at a significantly reduced price, which may dilute the value of a Fund’s investment. Shares in PIPEs generally are not registered with the SEC until after a certain time period from the date the private sale is completed. This restriction can last an uncertain amount of time and may be many months. Until the public registration process is completed, securities acquired via a PIPE are restricted as to resale and a Fund cannot freely trade the securities. Generally, such restrictions cause these securities to be illiquid during this time. PIPEs may contain provisions that the issuer will pay specified financial penalties to the holder if the issuer does not publicly register the restricted equity securities within a specified period of time, but there is no assurance that the restricted equity securities will be publicly registered, or that the registration will remain in effect.
Publicly traded securities acquired via a PIPE transaction are typically valued at a discount to the market price of an issuer’s common stock and classified as Level 2 in the fair value hierarchy. Discounts are applied due to certain trading restrictions imposed or a lack of marketability preceding the conversion to publicly traded securities. The primary inputs used in determining the discount are the length of the lock-up time period and volatility of the underlying security.
As of September 30, 2021, certain Funds had commitments to purchase when-issued securities through PIPE transactions with SPACs. The commitments are contingent upon the SPACs acquiring the securities of the target companies. The Statements of Assets and Liabilities separately present unrealized appreciation (depreciation) on unfunded commitments, the Statements of Operations present the change in unrealized appreciation (depreciation) on unfunded commitments, and each Fund’s Statement of Net Assets contains a related footnote.
i) Federal and Foreign Income Taxes. The Trust treats each Fund as a separate entity for federal income tax purposes. Each Fund intends to meet the requirements of the Internal Revenue Code of 1986, as amended, applicable to regulated investment companies, and to distribute to its shareholders substantially all of its net investment income and any net realized capital gains at least annually. None of the Funds will be subject to federal or state income taxes to the extent that they qualify as regulated investment companies and substantially all of their income is distributed.
The Funds may be subject to foreign taxes on income and gains on investments that are accrued based upon the Funds’ understanding of the tax rules and regulations that exist in the countries in which the Funds invest. Foreign governments may also impose taxes or other payments on investments with respect to foreign securities. Such taxes are accrued as applicable.
j) Restricted Securities. The Funds may invest in securities that are restricted as to public sale in accordance with the Securities Act of 1933. Such assets are valued by the Adviser pursuant to policies and procedures approved by the Board.
k) Distributions to Shareholders. Income and capital gain distributions to shareholders are determined in accordance with income tax regulations which may differ from GAAP. These differences are primarily due to differing treatments for net investment loss, foreign currency gains and losses, non-deductible interest expense, reclassification of distributions, partnership basis adjustments, income from passive foreign investment companies, late-year loss deferral, post-October loss deferral, and wash sale loss deferral.
l) Commitments and Contingencies. In the normal course of business, the Funds may enter into contracts and agreements that contain a variety of representations and warranties, which provide general indemnification. The maximum exposure to the Funds under these agreements is unknown, as this would involve future claims that may be made against the Funds that have not yet occurred. However, based on experience, the Funds expect the risk of loss to be remote.
m) Cash and Cash Equivalents. The Funds consider all short term liquid investments with a maturity of three months or less when purchased to be cash equivalents.
3. PURCHASES AND SALES OF SECURITIES
Purchases and sales of securities, other than short term securities, for the year ended September 30, 2021 were as follows:
| Fund | Purchases | Sales | ||||||
| Baron Asset Fund |
$ | 559,103,412 | $ | 905,725,571 | ||||
| Baron Growth Fund |
118,363,081 | 853,234,191 | ||||||
| Baron Small Cap Fund |
793,431,493 | 1,144,379,200 | ||||||
| Baron Opportunity Fund |
749,966,345 | 560,346,364 | ||||||
| Baron Fifth Avenue Growth Fund |
309,385,227 | 114,774,503 | ||||||
| Baron Discovery Fund |
1,206,158,243 | 541,948,332 | ||||||
| Baron Durable Advantage Fund |
24,297,496 | 2,410,113 | ||||||
38
| September 30, 2021 | Baron Funds |
NOTES TO FINANCIAL STATEMENTS (Continued)
4. INVESTMENT ADVISORY FEES AND OTHER TRANSACTIONS WITH AFFILIATES
a) Investment Advisory Fees. The Adviser, a wholly owned subsidiary of Baron Capital Group, Inc. (“BCG”), serves as investment adviser to the Funds. As compensation for services rendered, the Adviser receives a fee payable monthly from Baron Asset Fund, Baron Growth Fund, Baron Small Cap Fund, Baron Opportunity Fund, and Baron Discovery Fund equal to 1% per annum of the average daily net assets of the respective Funds. The Adviser receives a fee payable monthly equal to 0.70% per annum of Baron Fifth Avenue Growth Fund’s average daily net assets and 0.65% per annum of Baron Durable Advantage Fund’s average daily net assets.
For Baron Opportunity Fund, Baron Fifth Avenue Growth Fund, Baron Discovery Fund, and Baron Durable Advantage Fund, the Adviser has contractually agreed to reduce its fee or reimburse Fund expenses, to the extent required to limit the net annual operating expense ratio (excluding portfolio transaction costs, interest, dividend and extraordinary expenses), as follows:
| Annual Operating Expense Ratio Cap |
||||||||||||
| Fund | Retail Shares |
Institutional Shares |
R6 Shares |
|||||||||
| Baron Opportunity Fund |
1.50 | % | 1.25 | % | 1.24 | % | ||||||
| Baron Fifth Avenue Growth Fund |
1.00 | % | 0.75 | % | 0.75 | % | ||||||
| Baron Discovery Fund |
1.35 | % | 1.10 | % | 1.09 | % | ||||||
| Baron Durable Advantage Fund |
0.95 | % | 0.70 | % | 0.70 | % | ||||||
b) Distribution Fees. Baron Capital, Inc. (“BCI”), a wholly owned subsidiary of BCG, is a registered limited purpose broker-dealer and the distributor of the Funds’ shares. The Funds are authorized to pay BCI a distribution fee payable monthly pursuant to a distribution plan under Rule 12b-1 of the 1940 Act equal to 0.25% per annum of the Retail Shares’ average daily net assets of the respective Funds.
c) Trustee Fees. Certain Trustees of the Trust are interested persons (as defined by the 1940 Act) of the Trust. None of these Trustees received compensation for his or her services as a Trustee of the Trust. None of the Funds’ officers received compensation from the Funds for their services as an officer.
d) Fund Accounting and Administration Fees. The Funds have entered into an agreement with State Street Bank and Trust Company (“State Street”) to perform accounting and certain administrative services. State Street is compensated for fund accounting services based on a percentage of the Funds’ net assets, plus fixed annual fees for the administrative services.
e) Cross Trades. The Funds are permitted to purchase securities from, or sell securities to, other Funds within the Trust, the funds in Baron Select Funds, and other entities advised or subadvised by the Adviser, pursuant to “Cross-Trading Procedures” adopted by the Board. These procedures have been designed to ensure that any cross-trade of securities by the respective Baron Fund from or to another fund/other entity that is or could be considered an affiliate of a Fund under certain limited circumstances by virtue of having a common investment adviser, common officers, or common trustees complies with Rule 17a-7 under the 1940 Act. Further, as defined under these procedures, each cross-trade is effected at the current market price and with no commissions. Pursuant to these procedures, for the year ended September 30, 2021, the Funds engaged in the following cross-trades:
| Purchases | Sales | Net Realized Gains (Losses) |
||||||||||
| Baron Small Cap Fund |
$ | 1,093,572 | $ | 655,481 | $ | 2,327 | ||||||
| Baron Opportunity Fund |
— | 7,144,405 | 1,971,002 | |||||||||
f) Voluntary Payment. The Adviser made a voluntary payment to Baron Growth Fund in the amount of $739,525 to compensate the Fund for a loss incurred due
to a pricing error. The impact of this payment increased the Fund’s total return by 0.01%.
5. LINE OF CREDIT
The Funds, together with other funds in Baron Select Funds (except Baron Partners Fund), participate in a committed line of credit agreement with State Street to be used for temporary purposes, primarily for financing redemptions. Each fund may borrow up to the lesser of $200 million or the maximum amount each fund may borrow under the 1940 Act, the limitations included in each fund’s prospectus, or any limit or restriction under any law or regulation to which each fund is subject or any agreement to which each fund is a party; provided that the aggregate outstanding principal amount of all loans to any of the funds may not exceed $200 million. Interest is charged to each fund, based on its borrowings, at a rate per annum equal to the higher of the Overnight Bank Funding Rate plus 0.10% or the Overnight Federal Funds Rate plus 0.10%; plus a margin of 1.00%. An upfront fee of 0.05% is incurred on the commitment amount and a commitment fee of 0.20% per annum is incurred on the unused portion of the line of credit. Both fees are allocated to the participating funds based on their relative net assets. During the year ended September 30, 2021, Baron Asset Fund, Baron Growth Fund and Baron Opportunity Fund had borrowings under the line of credit and incurred interest expense of $863, $303,501 and $5,469, respectively. For the 10 days during which there were borrowings, Baron Asset Fund had an average daily balance on the line of credit of $2.6 million at a weighted average interest rate of 1.20%. For the 241 days during which there were borrowings, Baron Growth Fund had an average daily balance on the line of credit of $38.5 million at a weighted average interest rate of 1.19%. For the 22 days during which there were borrowings, Baron Opportunity Fund had an average daily balance on the line of credit of $7.6 million at a weighted average interest rate of 1.20%.
39
| Baron Funds | September 30, 2021 |
NOTES TO FINANCIAL STATEMENTS (Continued)
6. RESTRICTED SECURITIES
At September 30, 2021, investments in securities included securities that are restricted and/or illiquid. Restricted securities are often purchased in private placement transactions, are not registered under the Securities Act of 1933, may have contractual restrictions on resale and are valued pursuant to the policies and procedures for fair value pricing approved by the Board. An illiquid investment is any investment that the Funds reasonably expect cannot be sold or disposed of in current market conditions in seven calendar days or less without the sale or disposition significantly changing the market value of the investment, as determined pursuant to the provisions of the Liquidity Rule governing classification of portfolio securities. The Funds may receive more or less than this valuation in an actual sale and that difference could be material. At September 30, 2021, the Funds held investments in restricted and/or illiquid securities that were valued pursuant to policies and procedures for fair value pricing as follows:
| Baron Asset Fund | ||||||||
| Name of Issuer | Acquisition Date(s) | Value | ||||||
| Private Preferred Stocks |
||||||||
| Space Exploration Technologies Corp. |
8/4/2020 | $ | 39,979,078 | |||||
|
|
|
|||||||
| (Cost $26,000,460) (0.65% of Net Assets) |
||||||||
| Baron Growth Fund | ||||||||
| Name of Issuer | Acquisition Date(s) | Value | ||||||
| Common Stocks |
||||||||
| Velo3D, Inc. |
4/30/2021 | $ | 27,018,900 | |||||
| Zymergen, Inc. |
7/29/2020 | 4,979,259 | ||||||
| Private Convertible Preferred Stocks |
||||||||
| Farmers Business Network, Inc. |
7/31/2020-9/15/2021 | 24,842,016 | ||||||
| Northvolt AB |
9/21/2020 | 16,346,194 | ||||||
|
|
|
|||||||
| Total Restricted Securities |
$ | 73,186,369 | ||||||
|
|
|
|||||||
| (Cost $68,055,430)† (0.80% of Net Assets) |
||||||||
| Baron Small Cap Fund | ||||||||
| Name of Issuer | Acquisition Date(s) | Value | ||||||
| Common Stocks |
||||||||
| E2open Parent Holdings, Inc. |
5/27/2021 | $ | 20,547,165 | |||||
|
|
|
|||||||
| (Cost $19,999,995) (0.39% of Net Assets) |
||||||||
| Baron Opportunity Fund | ||||||||
| Name of Issuer | Acquisition Date(s) | Value | ||||||
| Private Common Stocks |
||||||||
| Space Exploration Technologies Corp. |
3/25/21 | $ | 4,942,480 | |||||
| Private Convertible Preferred Stocks |
||||||||
| Farmers Business Network, Inc. |
7/31/2020 | 12,869,756 | ||||||
| Rivian Automotive, Inc. |
7/10/2020-1/19/2021 | 21,865,920 | ||||||
| Private Preferred Stocks |
||||||||
| GM Cruise Holdings |
1/19/2021 | 6,479,022 | ||||||
| Space Exploration Technologies Corp. |
8/4/2020 | 7,688,348 | ||||||
|
|
|
|||||||
| Total Restricted Securities |
$ | 53,845,526 | ||||||
|
|
|
|||||||
| (Cost $36,284,414)† (3.34% of Net Assets) |
||||||||
| † | See Statements of Net Assets for cost of individual securities. |
40
| September 30, 2021 | Baron Funds |
NOTES TO FINANCIAL STATEMENTS (Continued)
6. RESTRICTED SECURITIES (Continued)
| Baron Fifth Avenue Growth Fund | ||||||||
| Name of Issuer | Acquisition Date(s) | Value | ||||||
| Private Common Stocks |
||||||||
| Space Exploration Technologies Corp. |
3/25/2021-4/8/2021 | $ | 1,482,536 | |||||
| Private Convertible Preferred Stocks |
||||||||
| Rivian Automotive, Inc. |
1/19/2021 | 2,960,104 | ||||||
| Private Preferred Stocks |
||||||||
| GM Cruise Holdings LLC |
1/19/2021 | 3,234,900 | ||||||
|
|
|
|||||||
| Total Restricted Securities |
$ | 7,677,540 | ||||||
|
|
|
|||||||
| (Cost $8,011,918)† (0.92% of Net Assets) |
||||||||
| Baron Discovery Fund | ||||||||
| Name of Issuer | Acquisition Date(s) | Value | ||||||
| Common Stocks |
||||||||
| Velo3D, Inc. |
4/30/2021 | $ | 5,057,465 | |||||
|
|
|
|||||||
| (Cost $6,182,720) (0.25% of Net Assets) |
||||||||
| † | See Statements of Net Assets for cost of individual securities. |
7. FAIR VALUE MEASUREMENTS
Fair value is defined by GAAP as the price that the Funds would receive upon selling an investment in a timely transaction to an independent buyer in the principal or most advantageous market for the investment. GAAP provides a three-tier hierarchy to maximize the use of observable market data and minimize the use of unobservable inputs and to establish classification of fair value measurements for disclosure purposes. Inputs refer broadly to the assumptions that market participants would use in pricing the asset or liability. Inputs may be observable or unobservable. Observable inputs are based on market data obtained from sources independent of the Funds. Unobservable inputs are inputs that reflect the Funds’ own assumptions based on the best information available in the circumstances. The three-tier hierarchy of inputs is summarized in the three broad Levels listed below.
| • | Level 1 — quoted prices in active markets for identical assets or liabilities; |
| • | Level 2 — prices determined using other inputs that are observable either directly or indirectly through corroboration with observable market data (which could include quoted prices for similar assets or liabilities, interest rates, credit risk, etc.); |
| • | Level 3 — prices determined using unobservable inputs when quoted prices or observable inputs are unavailable, such as when there is little or no market activity for an asset or liability (unobservable inputs reflect each Fund’s own assumptions in determining the fair value of assets or liabilities and would be based on the best information available). |
The inputs or methodology used for valuing securities are not necessarily an indication of the risk or liquidity associated with investing in those securities. For example, non-U.S. securities, with markets that close hours before the Funds value their holdings, may require revised valuations to more accurately reflect their fair value. Since these values obtained from quoted prices in an active market are adjusted, such securities are reflected as Level 2.
The Funds have procedures to determine the fair value of securities and other financial instruments for which market prices are not readily available or which may not be reliably priced. Under these procedures, the Funds primarily employ a market-based approach that may use related or comparable assets or liabilities, recent transactions, market multiples, book values, and other relevant information for the investment to determine its fair value. The Funds may also use an income-based valuation approach in which the anticipated future cash flows of the investment are discounted to calculate fair value. Discounts may also be applied due to the nature or duration of any restrictions on the disposition of the investments. Due to the inherent uncertainty of valuations of such investments, the fair values may differ significantly from the values that would have been used had an active market existed.
41
| Baron Funds | September 30, 2021 |
NOTES TO FINANCIAL STATEMENTS (Continued)
7. FAIR VALUE MEASUREMENTS (Continued)
The following is a summary of the inputs used as of September 30, 2021 in valuing the Funds’ investments carried at fair value:
| Baron Asset Fund | ||||||||||||||||
| Description | Quoted Prices in Active Markets for Identical Assets (Level 1) |
Other Observable Inputs (Level 2) |
Unobservable Inputs (Level 3) |
Total | ||||||||||||
| Common Stocks† |
$ | 6,075,679,497 | $ | — | $ | — | $ | 6,075,679,497 | ||||||||
| Private Preferred Stocks |
— | — | 39,979,078 | 39,979,078 | ||||||||||||
| Short Term Investments |
— | 56,289,320 | — | 56,289,320 | ||||||||||||
|
|
|
|
|
|
|
|
|
|||||||||
| Total Investments |
$ | 6,075,679,497 | $ | 56,289,320 | $ | 39,979,078 | $ | 6,171,947,895 | ||||||||
|
|
|
|
|
|
|
|
|
|||||||||
| Unrealized appreciation (depreciation) on unfunded commitments |
$ | — | $ | — | $ | (346,731 | ) | $ | (346,731 | ) | ||||||
|
|
|
|
|
|
|
|
|
|||||||||
| Baron Growth Fund | ||||||||||||||||
| Description | Quoted Prices in Active Markets for Identical Assets (Level 1) |
Other Observable Inputs (Level 2) |
Unobservable Inputs (Level 3) |
Total | ||||||||||||
| Common Stocks† |
$ | 9,118,573,681 | $ | — | $ | 31,998,159 | $ | 9,150,571,840 | ||||||||
| Private Convertible Preferred Stocks† |
— | — | 41,188,210 | 41,188,210 | ||||||||||||
| Short Term Investments |
— | 8,848,377 | — | 8,848,377 | ||||||||||||
| Warrants |
289,545 | — | — | 289,545 | ||||||||||||
|
|
|
|
|
|
|
|
|
|||||||||
| Total Investments |
$ | 9,118,863,226 | $ | 8,848,377 | $ | 73,186,369 | $ | 9,200,897,972 | ||||||||
|
|
|
|
|
|
|
|
|
|||||||||
| Unrealized appreciation (depreciation) on unfunded commitments |
$ | — | $ | — | $ | (746,100 | ) | $ | (746,100 | ) | ||||||
|
|
|
|
|
|
|
|
|
|||||||||
| Baron Small Cap Fund | ||||||||||||||||
| Description | Quoted Prices in Active Markets for Identical Assets (Level 1) |
Other Observable Inputs (Level 2) |
Unobservable Inputs (Level 3) |
Total | ||||||||||||
| Common Stocks† |
$ | 5,259,814,840 | $ | 32,353,980 | $ | 20,547,165 | $ | 5,312,715,985 | ||||||||
| Short Term Investments |
— | 2,983,303 | — | 2,983,303 | ||||||||||||
|
|
|
|
|
|
|
|
|
|||||||||
| Total Investments |
$ | 5,259,814,840 | $ | 35,337,283 | $ | 20,547,165 | $ | 5,315,699,288 | ||||||||
|
|
|
|
|
|
|
|
|
|||||||||
| Baron Opportunity Fund | ||||||||||||||||
| Description | Quoted Prices in Active Markets for Identical Assets (Level 1) |
Other Observable Inputs (Level 2) |
Unobservable Inputs (Level 3) |
Total | ||||||||||||
| Common Stocks† |
$ | 1,524,928,387 | $ | 8,386,085 | $ | — | $ | 1,533,314,472 | ||||||||
| Private Common Stocks† |
— | — | 4,942,480 | 4,942,480 | ||||||||||||
| Private Convertible Preferred Stocks† |
— | — | 34,735,676 | 34,735,676 | ||||||||||||
| Private Preferred Stocks† |
— | — | 14,167,370 | 14,167,370 | ||||||||||||
| Warrants |
197,362 | — | — | 197,362 | ||||||||||||
| Short Term Investments |
— | 29,940,909 | — | 29,940,909 | ||||||||||||
|
|
|
|
|
|
|
|
|
|||||||||
| Total Investments |
$ | 1,525,125,749 | $ | 38,326,994 | $ | 53,845,526 | $ | 1,617,298,269 | ||||||||
|
|
|
|
|
|
|
|
|
|||||||||
| Unrealized appreciation (depreciation) on unfunded commitments |
$ | — | $ | — | $ | (299,342 | ) | $ | (299,342 | ) | ||||||
|
|
|
|
|
|
|
|
|
|||||||||
| † | See Statements of Net Assets for additional detailed categorizations. |
42
| September 30, 2021 | Baron Funds |
NOTES TO FINANCIAL STATEMENTS (Continued)
7. FAIR VALUE MEASUREMENTS (Continued)
| Baron Fifth Avenue Growth Fund | ||||||||||||||||
| Description | Quoted Prices in Active Markets for Identical Assets (Level 1) |
Other Observable Inputs (Level 2) |
Unobservable Inputs (Level 3) |
Total | ||||||||||||
| Common Stocks† |
$ | 803,876,467 | $ | 17,381,559 | $ | — | $ | 821,258,026 | ||||||||
| Private Common Stocks† |
— | — | 1,482,536 | 1,482,536 | ||||||||||||
| Private Convertible Preferred Stocks |
— | — | 2,960,104 | 2,960,104 | ||||||||||||
| Private Preferred Stocks |
— | — | 3,234,900 | 3,234,900 | ||||||||||||
| Short Term Investments |
— | 8,370,965 | — | 8,370,965 | ||||||||||||
|
|
|
|
|
|
|
|
|
|||||||||
| Total Investments |
$ | 803,876,467 | $ | 25,752,524 | $ | 7,677,540 | $ | 837,306,531 | ||||||||
|
|
|
|
|
|
|
|
|
|||||||||
| Baron Discovery Fund | ||||||||||||||||
| Description | Quoted Prices in Active Markets for Identical Assets (Level 1) |
Other Observable Inputs (Level 2) |
Unobservable Inputs (Level 3) |
Total | ||||||||||||
| Common Stocks† |
$ | 1,881,716,187 | $ | 3,148,780 | $ | 5,057,465 | $ | 1,889,922,432 | ||||||||
| Short Term Investments |
— | 135,649,363 | — | 135,649,363 | ||||||||||||
|
|
|
|
|
|
|
|
|
|||||||||
| Total Investments |
$ | 1,881,716,187 | $ | 138,798,143 | $ | 5,057,465 | $ | 2,025,571,795 | ||||||||
|
|
|
|
|
|
|
|
|
|||||||||
| Unrealized appreciation (depreciation) on unfunded commitments |
$ | — | $ | — | $ | (170,095 | ) | $ | (170,095 | ) | ||||||
|
|
|
|
|
|
|
|
|
|||||||||
| Baron Durable Advantage Fund | ||||||||||||||||
| Description | Quoted Prices in Active Markets for Identical Assets (Level 1) |
Other Observable Inputs (Level 2) |
Unobservable Inputs (Level 3) |
Total | ||||||||||||
| Common Stocks† |
$ | 40,212,205 | $ | — | $ | — | $ | 40,212,205 | ||||||||
| Short Term Investments |
— | 3,386,820 | — | 3,386,820 | ||||||||||||
|
|
|
|
|
|
|
|
|
|||||||||
| Total Investments |
$ | 40,212,205 | $ | 3,386,820 | $ | — | $ | 43,599,025 | ||||||||
|
|
|
|
|
|
|
|
|
|||||||||
| † | See Statements of Net Assets for additional detailed categorizations. |
43
| Baron Funds | September 30, 2021 |
NOTES TO FINANCIAL STATEMENTS (Continued)
7. FAIR VALUE MEASUREMENTS (Continued)
The following is a reconciliation of investments in which unobservable inputs (Level 3) were used in determining fair value:
| Baron Asset Fund | ||||||||||||||||||||||||||||||||||||||||
| Investments in Securities |
Balance as of September 30, 2020 |
Accrued Premiums/ Discounts |
Net Realized Gain (Loss) |
Change in Net Unrealized Appreciation (Depreciation) |
Purchases | Sales/ Distributions |
Transfers Into Level 3 |
Transfers Out of Level 3 |
Balance as of September 30, 2021 |
Change in Net Unrealized Appreciation (Depreciation) from Investments still held at September 30, 2021 |
||||||||||||||||||||||||||||||
| Private Preferred Stocks |
||||||||||||||||||||||||||||||||||||||||
| Industrials |
$ | 23,258,856 | $ | — | $ | — | $ | 16,720,222 | $ | — | $ | — | $ | — | $ | — | $ | 39,979,078 | $ | 16,720,222 | ||||||||||||||||||||
| Private Partnerships |
||||||||||||||||||||||||||||||||||||||||
| Financials |
182,756 | — | 602,920 | (182,756 | ) | — | (602,920 | ) | — | — | — | — | ||||||||||||||||||||||||||||
|
|
|
|
|
|
|
|
|
|
|
|
|
|
|
|
|
|
|
|
|
|||||||||||||||||||||
| Total |
$ | 23,441,612 | $ | — | $ | 602,920 | $ | 16,537,466 | $ | — | $ | (602,920 | ) | $ | — | $ | — | $ | 39,979,078 | $ | 16,720,222 | |||||||||||||||||||
|
|
|
|
|
|
|
|
|
|
|
|
|
|
|
|
|
|
|
|
|
|||||||||||||||||||||
| Unfunded Commitments |
$ | — | $ | — | $ | — | $ | (346,731 | ) | $ | — | $ | — | $ | — | $ | — | $ | (346,731 | ) | $ | (346,731 | ) | |||||||||||||||||
|
|
|
|
|
|
|
|
|
|
|
|
|
|
|
|
|
|
|
|
|
|||||||||||||||||||||
| Baron Growth Fund | ||||||||||||||||||||||||||||||||||||||||
| Investments in Securities |
Balance as of September 30, 2020 |
Accrued Premiums/ Discounts |
Net Realized Gain (Loss) |
Change in Net Unrealized Appreciation (Depreciation) |
Purchases | Sales/ Distributions |
Transfers Into Level 3 |
Transfers Out of Level 3 |
Balance as of September 30, 2021 |
Change in Net Unrealized Appreciation (Depreciation) from Investments still held at September 30, 2021 |
||||||||||||||||||||||||||||||
| Common Stock |
||||||||||||||||||||||||||||||||||||||||
| Industrials |
$ | — | $ | — | $ | — | $ | (6,011,540 | ) | $ | 33,030,440 | $ | — | $ | — | $ | — | $ | 27,018,900 | $ | (6,011,540 | ) | ||||||||||||||||||
| Materials |
8,153,595 | — | — | (3,174,336 | ) | — | — | — | — | 4,979,259 | (3,174,336 | ) | ||||||||||||||||||||||||||||
| Private Convertible Preferred Stocks |
||||||||||||||||||||||||||||||||||||||||
| Industrials |
8,377,635 | — | — | 7,968,559 | — | — | — | — | 16,346,194 | 7,968,559 | ||||||||||||||||||||||||||||||
| Materials |
10,197,028 | — | — | 9,644,988 | 5,000,000 | — | — | — | 24,842,016 | 9,644,988 | ||||||||||||||||||||||||||||||
| Private Partnerships |
||||||||||||||||||||||||||||||||||||||||
| Financials |
61,517 | — | 202,947 | (61,517 | ) | — | (202,947 | ) | — | — | — | — | ||||||||||||||||||||||||||||
|
|
|
|
|
|
|
|
|
|
|
|
|
|
|
|
|
|
|
|
|
|||||||||||||||||||||
| Total |
$ | 26,789,775 | $ | — | $ | 202,947 | $ | 8,366,154 | $ | 38,030,440 | $ | (202,947 | ) | $ | — | $ | — | $ | 73,186,369 | $ | 8,427,671 | |||||||||||||||||||
|
|
|
|
|
|
|
|
|
|
|
|
|
|
|
|
|
|
|
|
|
|||||||||||||||||||||
| Unfunded Commitments |
$ | — | $ | — | $ | — | $ | (746,100 | ) | $ | — | $ | — | $ | — | $ | — | $ | (746,100 | ) | $ | (746,100 | ) | |||||||||||||||||
|
|
|
|
|
|
|
|
|
|
|
|
|
|
|
|
|
|
|
|
|
|||||||||||||||||||||
| Baron Small Cap Fund | ||||||||||||||||||||||||||||||||||||||||
| Investments in Securities |
Balance as of September 30, 2020 |
Accrued Premiums/ Discounts |
Net Realized Gain (Loss) |
Change in Net Unrealized Appreciation (Depreciation) |
Purchases | Sales/ Distributions |
Transfers Into Level 3 |
Transfers Out of Level 3 |
Balance as of September 30, 2021 |
Change in Net Unrealized Appreciation (Depreciation) from Investments still held at September 30, 2021 |
||||||||||||||||||||||||||||||
| Common Stocks |
||||||||||||||||||||||||||||||||||||||||
| Information Technology |
$ | — | $ | — | $ | — | $ | 547,170 | $ | 19,999,995 | $ | — | $ | — | $ | — | $ | 20,547,165 | $ | 547,170 | ||||||||||||||||||||
|
|
|
|
|
|
|
|
|
|
|
|
|
|
|
|
|
|
|
|
|
|||||||||||||||||||||
44
| September 30, 2021 | Baron Funds |
NOTES TO FINANCIAL STATEMENTS (Continued)
7. FAIR VALUE MEASUREMENTS (Continued)
| Baron Opportunity Fund | ||||||||||||||||||||||||||||||||||||||||
| Investments in Securities |
Balance as of September 30, 2020 |
Accrued Premiums/ Discounts |
Net Realized Gain (Loss) |
Change in Net Unrealized Appreciation (Depreciation) |
Purchases | Sales/ Distributions |
Transfers Into Level 3 |
Transfers Out of Level 3 |
Balance as of September 30, 2021 |
Change in Net Unrealized Appreciation (Depreciation) from Investments still held at September 30, 2021 |
||||||||||||||||||||||||||||||
| Private Common Stocks |
||||||||||||||||||||||||||||||||||||||||
| Industrials |
$ | — | $ | — | $ | — | $ | (57,501 | ) | $ | 4,999,981 | $ | — | $ | — | $ | — | $ | 4,942,480 | $ | (57,501 | ) | ||||||||||||||||||
| Private Convertible Preferred Stocks |
||||||||||||||||||||||||||||||||||||||||
| Consumer Discretionary |
7,892,183 | — | — | 9,473,726 | 4,500,011 | — | — | — | 21,865,920 | 9,473,726 | ||||||||||||||||||||||||||||||
| Materials |
6,542,346 | — | — | 6,327,410 | — | — | — | — | 12,869,756 | 6,327,410 | ||||||||||||||||||||||||||||||
| Private Preferred Stocks |
||||||||||||||||||||||||||||||||||||||||
| Industrials |
4,472,894 | — | — | 2,660,186 | 7,034,290 | — | — | — | 14,167,370 | 2,660,186 | ||||||||||||||||||||||||||||||
|
|
|
|
|
|
|
|
|
|
|
|
|
|
|
|
|
|
|
|
|
|||||||||||||||||||||
| Total |
$ | 18,907,423 | $ | — | $ | — | $ | 18,403,821 | $ | 16,534,282 | $ | — | $ | — | $ | — | $ | 53,845,526 | $ | 18,403,821 | ||||||||||||||||||||
|
|
|
|
|
|
|
|
|
|
|
|
|
|
|
|
|
|
|
|
|
|||||||||||||||||||||
| Unfunded Commitments |
$ | — | $ | — | $ | — | $ | (299,342 | ) | $ | — | $ | — | $ | — | $ | — | $ | (299,342 | ) | $ | (299,342 | ) | |||||||||||||||||
|
|
|
|
|
|
|
|
|
|
|
|
|
|
|
|
|
|
|
|
|
|||||||||||||||||||||
| Baron Fifth Avenue Growth Fund | ||||||||||||||||||||||||||||||||||||||||
| Investments in Securities |
Balance as of September 30, 2020 |
Accrued Premiums/ Discounts |
Net Realized Gain (Loss) |
Change in Net Unrealized Appreciation (Depreciation) |
Purchases | Sales/ Distributions |
Transfers Into Level 3 |
Transfers Out of Level 3 |
Balance as of September 30, 2021 |
Change in Net Unrealized Appreciation (Depreciation) from Investments still held at September 30, 2021 |
||||||||||||||||||||||||||||||
| Private Common Stocks |
||||||||||||||||||||||||||||||||||||||||
| Industrials |
$ | — | $ | — | $ | — | $ | (17,248 | ) | $ | 1,499,784 | $ | — | $ | — | $ | — | $ | 1,482,536 | $ | (17,248 | ) | ||||||||||||||||||
| Private Convertible Preferred Stocks |
||||||||||||||||||||||||||||||||||||||||
| Consumer Discretionary |
— | — | — | (39,891 | ) | 2,999,995 | — | — | — | 2,960,104 | (39,891 | ) | ||||||||||||||||||||||||||||
| Private Preferred Stocks |
||||||||||||||||||||||||||||||||||||||||
| Industrials |
— | — | — | (277,239 | ) | 3,512,139 | — | — | — | 3,234,900 | (277,239 | ) | ||||||||||||||||||||||||||||
|
|
|
|
|
|
|
|
|
|
|
|
|
|
|
|
|
|
|
|
|
|||||||||||||||||||||
| Total |
$ | — | $ | — | $ | — | $ | (334,378 | ) | $ | 8,011,918 | $ | — | $ | — | $ | — | $ | 7,677,540 | $ | (334,378 | ) | ||||||||||||||||||
|
|
|
|
|
|
|
|
|
|
|
|
|
|
|
|
|
|
|
|
|
|||||||||||||||||||||
45
| Baron Funds | September 30, 2021 |
NOTES TO FINANCIAL STATEMENTS (Continued)
7. FAIR VALUE MEASUREMENTS (Continued)
| Baron Discovery Fund | ||||||||||||||||||||||||||||||||||||||||
| Investments in Securities |
Balance as of September 30, 2020 |
Accrued Premiums/ Discounts |
Net Realized Gain (Loss) |
Change in Net Unrealized Appreciation (Depreciation) |
Purchases | Sales/ Distributions |
Transfers Into Level 3 |
Transfers Out of Level 3 |
Balance as of September 30, 2021 |
Change in Net Unrealized Appreciation (Depreciation) from Investments still held at September 30, 2021 |
||||||||||||||||||||||||||||||
| Common Stocks |
||||||||||||||||||||||||||||||||||||||||
| Industrials |
$ | — | $ | — | $ | — | $ | (1,125,255 | ) | $ | 6,182,720 | $ | — | $ | — | $ | — | $ | 5,057,465 | $ | (1,125,255 | ) | ||||||||||||||||||
|
|
|
|
|
|
|
|
|
|
|
|
|
|
|
|
|
|
|
|
|
|||||||||||||||||||||
| Unfunded Commitments |
$ | — | $ | — | $ | — | $ | (170,095 | ) | $ | — | $ | — | $ | — | $ | — | $ | (170,095 | ) | $ | (170,095 | ) | |||||||||||||||||
|
|
|
|
|
|
|
|
|
|
|
|
|
|
|
|
|
|
|
|
|
|||||||||||||||||||||
Unobservable valuation inputs developed by the Adviser for significant (greater than 1% of net assets) Level 3 investments as of September 30, 2021 were as follows:
| Baron Opportunity Fund | ||||||||||||
| Sector | Company | Fair Value as of September 30, 2021 |
Valuation Technique | Unobservable Input | Weighted Average used on September 30, 2021 |
Range used on September 30, 2021 | ||||||
|
Private Convertible Preferred Stocks: Consumer Discretionary |
Rivian Automotive Inc. |
$21,865,920 | Combination of recent transaction, current value via comparable companies, option-pricing, and scenario analysis methods | Change in the composite equity index of comparable companies | -0.76% | (3.23)% - 1.34% | ||||||
| Discount for lack of marketability |
8.01% | 8.01% | ||||||||||
| Estimated volatility of the returns of equity1 | 40.11% | 22.75% - 54.25% | ||||||||||
| Scenario Probabilities: Scenario A / Scenario B2 | 90% / 10% | 10% - 90% | ||||||||||
| 1 | The volatility was calculated as a weighted average of the volatilities of the individual comparable companies. Some companies have a higher weight in the calculation than others. |
| 2 | Scenario A represents an IPO Event, while Scenario B represents a Liquidation/M&A Event. |
8. INCOME TAXES AND DISTRIBUTIONS TO SHAREHOLDERS
Federal income tax regulations differ from GAAP. Therefore, distributions determined in accordance with tax regulations may differ in amount or character from net investment income and net realized gain for financial reporting purposes. Net investment income (loss) and net realized and unrealized gain (loss) differ for financial statement and tax purposes due to differing treatments of net investment loss, foreign currency gains and losses, non-deductible interest expense, reclassification of distributions, partnership basis adjustments, income from passive foreign investment companies, late year loss deferral, post-October loss deferral and wash sale loss deferral. Financial reporting records are adjusted for permanent book/tax differences to reflect tax character. Financial records are not adjusted for temporary differences.
For the year ended September 30, 2021, the Funds recorded the following permanent reclassifications to reflect tax character. Reclassifications between income, gains and paid-in capital relate primarily to the tax treatment of net investment loss, foreign currency gains and losses, passive foreign investment companies, REITs, and partnership basis adjustments. Results of operations and net assets were not affected by these reclassifications.
| Fund | Distributable Earnings/ |
Paid-In Capital | ||||||
| Baron Asset Fund |
$ | — | $ | — | ||||
| Baron Growth Fund |
32,587,521 | (32,587,521 | ) | |||||
| Baron Small Cap Fund |
17,505,681 | (17,505,681 | ) | |||||
| Baron Opportunity Fund |
— | — | ||||||
| Baron Fifth Avenue Growth Fund |
2,779,081 | (2,779,081 | ) | |||||
| Baron Discovery Fund |
— | — | ||||||
| Baron Durable Advantage Fund |
— | — | ||||||
46
| September 30, 2021 | Baron Funds |
NOTES TO FINANCIAL STATEMENTS (Continued)
8. INCOME TAXES AND DISTRIBUTIONS TO SHAREHOLDERS (Continued)
As of September 30, 2021, the components of net assets on a tax basis were as follows:
| Baron Asset Fund |
Baron Growth Fund |
Baron Small Cap Fund |
Baron Opportunity Fund |
|||||||||||||
| Cost of investments |
$ | 1,906,175,801 | $ | 1,406,122,035 | $ | 2,006,099,561 | $ | 905,219,286 | ||||||||
|
|
|
|
|
|
|
|
|
|||||||||
| Gross tax unrealized appreciation |
4,294,945,608 | 7,815,066,555 | 3,317,385,773 | 727,483,428 | ||||||||||||
| Gross tax unrealized depreciation |
(29,173,514 | ) | (20,290,618 | ) | (7,786,046 | ) | (15,404,445 | ) | ||||||||
|
|
|
|
|
|
|
|
|
|||||||||
| Net tax unrealized appreciation (depreciation) |
4,265,772,094 | 7,794,775,937 | 3,309,599,727 | 712,078,983 | ||||||||||||
| Net tax unrealized currency appreciation (depreciation) |
— | — | 33 | — | ||||||||||||
| Net tax unrealized appreciation (depreciation) on unfunded commitments |
(346,731 | ) | (746,100 | ) | — | (299,342 | ) | |||||||||
| Undistributed (accumulated) net investment income (loss) |
— | — | — | 73,083,401 | ||||||||||||
| Undistributed (accumulated) net realized gain (loss) |
444,713,095 | 664,172,520 | 586,208,162 | 58,101,805 | ||||||||||||
| Qualified late year loss deferral |
(31,198,545 | ) | (34,700,512 | ) | (1,412,231 | ) | — | |||||||||
| Capital loss carryforwards |
— | — | — | — | ||||||||||||
| Paid-in capital |
1,486,731,296 | 778,469,579 | 1,422,060,856 | 771,071,236 | ||||||||||||
|
|
|
|
|
|
|
|
|
|||||||||
| Net Assets |
$ | 6,165,671,209 | $ | 9,201,971,424 | $ | 5,316,456,547 | $ | 1,614,036,083 | ||||||||
|
|
|
|
|
|
|
|
|
|||||||||
| Baron Fifth Avenue Growth Fund |
Baron Discovery Fund |
Baron Durable Advantage Fund |
||||||||||
| Cost of investments |
$ | 427,095,692 | $ | 1,467,720,881 | $ | 35,973,655 | ||||||
|
|
|
|
|
|
|
|||||||
| Gross tax unrealized appreciation |
413,770,120 | 646,544,835 | 7,665,557 | |||||||||
| Gross tax unrealized depreciation |
(3,559,281 | ) | (88,693,921 | ) | (40,187 | ) | ||||||
|
|
|
|
|
|
|
|||||||
| Net tax unrealized appreciation (depreciation) |
410,210,839 | 557,850,914 | 7,625,370 | |||||||||
| Net tax unrealized currency appreciation (depreciation) |
— | 684 | — | |||||||||
| Net tax unrealized appreciation (depreciation) on unfunded commitments |
— | (170,095 | ) | — | ||||||||
| Undistributed (accumulated) net investment income (loss) |
— | 42,827,655 | — | |||||||||
| Undistributed (accumulated) net realized gain (loss) |
25,182,764 | 28,302,116 | 152,404 | |||||||||
| Qualified late year loss deferral |
(4,193,155 | ) | — | (23,970 | ) | |||||||
| Capital loss carryforwards |
— | — | — | |||||||||
| Paid-in capital |
406,009,872 | 1,400,788,110 | 33,404,110 | |||||||||
|
|
|
|
|
|
|
|||||||
| Net Assets |
$ | 837,210,320 | $ | 2,029,599,384 | $ | 41,157,914 | ||||||
|
|
|
|
|
|
|
|||||||
As of September 30, 2021, the Funds had no capital loss carryforwards. During the year ended September 30, 2021, Baron Durable Advantage Fund utilized capital loss carryforwards of $95,946.
The tax character of distributions paid during the years ended September 30, 2021 and September 30, 2020 was as follows:
| Year Ended September 30, 2021 |
Year Ended September 30, 2020 |
|||||||||||||||
| Fund | Ordinary1 | Long Term Capital Gain |
Ordinary1 | Long Term Capital Gain |
||||||||||||
| Baron Asset Fund |
$ | — | $ | 171,218,678 | $ | — | $ | 77,500,344 | ||||||||
| Baron Growth Fund |
— | 377,092,978 | — | 255,000,961 | ||||||||||||
| Baron Small Cap Fund |
— | 497,010,336 | — | 356,000,771 | ||||||||||||
| Baron Opportunity Fund |
5,801,202 | 80,532,998 | — | 29,500,835 | ||||||||||||
| Baron Fifth Avenue Growth Fund |
— | 2,363,263 | 239,510 | 9,350,984 | ||||||||||||
| Baron Discovery Fund |
— | 37,003,177 | — | 775,697 | ||||||||||||
| Baron Durable Advantage Fund |
13,454 | 22 | 17,196 | — | ||||||||||||
| 1 | For tax purposes, short-term capital gains are considered ordinary income distributions. |
The Funds follow the provisions of FASB Codification Section 740 (“ASC Section 740”) “Accounting for Uncertainty in Income Taxes” which clarifies the accounting for uncertainty in tax positions taken or expected to be taken on a tax return. ASC Section 740 sets forth a threshold for financial statement recognition, measurement and disclosure of tax positions taken or expected to be taken on a tax return. The Funds are required to recognize the tax effects of certain tax positions under a “more likely than not” standard, that based on their technical merits, have more than 50% likelihood of being sustained upon examination. Management has analyzed the tax positions taken on the Funds’ federal income tax returns for all open years (current and prior three years), and has concluded that no provision for federal income tax is required in the Funds’ financial statements. At September 30, 2021. the Funds did not have any uncertain tax benefits that require recognition, de-recognition or disclosure. The Funds’ federal, state and local income and federal excise tax returns for which the applicable statutes of limitations have not expired (current and prior three years) are subject to examination by the Internal Revenue Service and state departments of revenue.
47
| Baron Funds | September 30, 2021 |
NOTES TO FINANCIAL STATEMENTS (Continued)
9. OWNERSHIP CONCENTRATION
As of September 30, 2021, the officers, trustees, and portfolio managers owned, directly or indirectly, 16.63% of Baron Durable Advantage Fund. As a result of their ownership, these investors may be able to materially affect the outcome of matters presented to Baron Durable Advantage Fund shareholders.
10. TRANSACTIONS IN “AFFILIATED” COMPANIES1
BARON GROWTH FUND
| Name of Issuer | Value at September 30, 2020 |
Purchase Cost |
Sales Return of |
Change in Net Unrealized Appreciation (Depreciation) |
Realized (Losses) |
Dividend Income |
Shares Held at September 30, 2021 |
Value at September 30, 2021 |
% of Net Assets at September 30, 2021 |
|||||||||||||||||||||||||||
| “Affiliated” Company as of September 30, 2021: |
| |||||||||||||||||||||||||||||||||||
| Choice Hotels International, Inc. |
$ | 257,880,000 | $ | — | $ | — | $ | 121,230,000 | $ | — | $ | 1,350,000 | 3,000,000 | $ | 379,110,000 | 4.12 | % | |||||||||||||||||||
| Iridium Communications, Inc. |
226,383,000 | — | 36,122,869 | 95,411,082 | 29,143,787 | — | 7,900,000 | 314,815,000 | 3.42 | % | ||||||||||||||||||||||||||
|
|
|
|
|
|
|
|
|
|
|
|
|
|
|
|||||||||||||||||||||||
| $ | 484,263,000 | $ | — | $ | 36,122,869 | $ | 216,641,082 | $ | 29,143,787 | $ | 1,350,000 | $ | 693,925,000 | |||||||||||||||||||||||
|
|
|
|
|
|
|
|
|
|
|
|
|
|
|
|||||||||||||||||||||||
| No longer an “Affiliated” Company as of September 30, 2021: |
| |||||||||||||||||||||||||||||||||||
| Vail Resorts, Inc. |
$ | 436,498,800 | $ | — | $ | 10,141,130 | $ | 233,871,038 | $ | 7,871,292 | $ | — | 2,000,000 | $ | 668,100,000 | 7.26 | % | |||||||||||||||||||
|
|
|
|
|
|
|
|
|
|
|
|
|
|
|
|||||||||||||||||||||||
BARON SMALL CAP FUND
| Name of Issuer | Value at September 30, 2020 |
Purchase Cost |
Sales Return of |
Change in Net Unrealized Appreciation (Depreciation) |
Realized (Losses) |
Dividend Income |
Shares Held at September 30, 2021 |
Value at September 30, 2021 |
% of Net Assets at September 30, 2021 |
|||||||||||||||||||||||||||
| “Affiliated” Company as of September 30, 2021: |
| |||||||||||||||||||||||||||||||||||
| Installed Building Products, Inc. |
$ | 170,431,250 | $ | — | $ | 22,953,566 | $ | 4,037,350 | $ | 9,209,966 | $ | 1,425,000 | 1,500,000 | $ | 160,725,000 | 3.02 | % | |||||||||||||||||||
|
|
|
|
|
|
|
|
|
|
|
|
|
|
|
|||||||||||||||||||||||
| No longer an “Affiliated” Company as of September 30, 2021: |
| |||||||||||||||||||||||||||||||||||
| Paya Holdings, Inc. (formerly, FinTech Acquisition Corp. III) 2 |
$ | 25,775,000 | $ | 10,583,654 | $ | — | $ | 1,686,346 | $ | — | $ | — | 3,500,000 | $ | 38,045,000 | 0.72 | % | |||||||||||||||||||
| Repay Holdings Corporation |
88,762,203 | — | 6,711,771 | (5,386,052 | ) | 3,940,621 | — | 3,500,000 | 80,605,001 | 1.52 | % | |||||||||||||||||||||||||
| UTZ Brands, Inc. |
73,390,000 | — | 27,425,952 | (4,026,000 | ) | 9,451,952 | 740,988 | 3,000,000 | 51,390,000 | 0.97 | % | |||||||||||||||||||||||||
| Whole Earth |
16,680,000 | — | 16,757,891 | 3,320,000 | (3,242,109 | ) | — | — | — | 0.00 | % | |||||||||||||||||||||||||
| Whole Earth |
1,333,420 | — | 2,543,182 | (1,333,420 | ) | 2,543,182 | — | — | — | 0.00 | % | |||||||||||||||||||||||||
|
|
|
|
|
|
|
|
|
|
|
|
|
|
|
|||||||||||||||||||||||
| $ | 205,940,623 | $ | 10,583,654 | $ | 53,438,796 | $ | (5,739,126 | ) | $ | 12,693,646 | $ | 740,988 | $ | 170,040,001 | ||||||||||||||||||||||
|
|
|
|
|
|
|
|
|
|
|
|
|
|
|
|||||||||||||||||||||||
| 1 | An “Affiliated” company (“affiliated person” as defined in the 1940 Act), is a company in which a Fund held 5% or more of the company’s outstanding voting securities at any time during the year ended September 30, 2021. |
| 2 | No longer an “Affiliated” company due to merger with Paya Holdings, Inc. on October 19, 2020. |
48
| September 30, 2021 | Baron Funds |
BARON ASSET FUND
Selected data for a share outstanding throughout each year:
| Income (loss) from investment operations: |
Less distributions to shareholders from: |
Ratios to Average Net Assets: |
Supplemental Data: |
|||||||||||||||||||||||||||||||||||||||||||||||||
| Net asset value, beginning of year ($) |
Net investment income (loss) ($) |
Net realized and unrealized gain on investments ($) |
Total from investment operations ($) |
Net investment income ($) |
Net realized gain on investments ($) |
Total distributions ($) |
Net asset value, end of year ($) |
Total return (%) |
Operating expenses (%) |
Net investment income (loss) (%) |
Net assets (in millions), end of year ($) |
Portfolio turnover rate (%) |
||||||||||||||||||||||||||||||||||||||||
| RETAIL SHARES |
| |||||||||||||||||||||||||||||||||||||||||||||||||||
| Year Ended September 30, |
| |||||||||||||||||||||||||||||||||||||||||||||||||||
| 2021 |
99.64 | (1.16 | )1 | 25.50 | 24.34 | 0.00 | (3.39 | ) | (3.39 | ) | 120.59 | 24.96 | 1.29 | 5 | (1.02 | ) | 2,871.7 | 9.54 | ||||||||||||||||||||||||||||||||||
| 2020 |
82.28 | (0.72 | )1 | 19.58 | 18.86 | 0.00 | (1.50 | ) | (1.50 | ) | 99.64 | 23.22 | 1.31 | (0.82 | ) | 2,498.6 | 9.28 | |||||||||||||||||||||||||||||||||||
| 2019 |
81.43 | (0.56 | )1 | 6.17 | 5.61 | 0.00 | (4.76 | ) | (4.76 | ) | 82.28 | 7.82 | 1.30 | (0.73 | ) | 2,242.0 | 11.83 | |||||||||||||||||||||||||||||||||||
| 2018 |
70.87 | (0.59 | )1 | 16.09 | 15.50 | 0.00 | (4.94 | ) | (4.94 | ) | 81.43 | 23.11 | 1.30 | (0.79 | ) | 2,259.7 | 9.87 | |||||||||||||||||||||||||||||||||||
| 2017 |
60.67 | (0.48 | )1 | 13.48 | 13.00 | 0.00 | (2.80 | ) | (2.80 | ) | 70.87 | 22.41 | 1.31 | (0.75 | ) | 1,979.1 | 10.35 | |||||||||||||||||||||||||||||||||||
| 2016 |
60.88 | (0.25 | )1 | 6.63 | 6.38 | 0.00 | (6.59 | ) | (6.59 | ) | 60.67 | 11.14 | 1.31 | (0.43 | ) | 1,802.6 | 12.54 | |||||||||||||||||||||||||||||||||||
| 2015 |
63.75 | (0.41 | )1 | 1.71 | 1.30 | 0.00 | (4.17 | ) | (4.17 | ) | 60.88 | 1.81 | 1.31 | (0.62 | ) | 1,804.3 | 13.53 | |||||||||||||||||||||||||||||||||||
| 2014 |
61.37 | (0.44 | )1 | 8.42 | 7.98 | 0.00 | (5.60 | ) | (5.60 | ) | 63.75 | 13.59 | 1.31 | (0.70 | ) | 2,000.5 | 11.26 | |||||||||||||||||||||||||||||||||||
| 2013 |
52.03 | (0.34 | )1 | 13.44 | 13.10 | 0.00 | (3.76 | ) | (3.76 | ) | 61.37 | 27.17 | 1.32 | (0.62 | ) | 2,024.2 | 12.04 | |||||||||||||||||||||||||||||||||||
| 2012 |
49.00 | (0.14 | )1 | 10.94 | 10.80 | 0.00 | (7.77 | ) | (7.77 | ) | 52.03 | 24.65 | 1.33 | (0.28 | ) | 1,845.6 | 13.11 | |||||||||||||||||||||||||||||||||||
| INSTITUTIONAL SHARES |
| |||||||||||||||||||||||||||||||||||||||||||||||||||
| Year Ended September 30, |
| |||||||||||||||||||||||||||||||||||||||||||||||||||
| 2021 |
104.08 | (0.91 | )1 | 26.69 | 25.78 | 0.00 | (3.39 | ) | (3.39 | ) | 126.47 | 25.29 | 1.03 | 5 | (0.76 | ) | 3,108.2 | 9.54 | ||||||||||||||||||||||||||||||||||
| 2020 |
85.67 | (0.52 | )1 | 20.43 | 19.91 | 0.00 | (1.50 | ) | (1.50 | ) | 104.08 | 23.53 | 1.05 | (0.57 | ) | 2,505.4 | 9.28 | |||||||||||||||||||||||||||||||||||
| 2019 |
84.36 | (0.38 | )1 | 6.45 | 6.07 | 0.00 | (4.76 | ) | (4.76 | ) | 85.67 | 8.11 | 1.05 | (0.48 | ) | 1,979.7 | 11.83 | |||||||||||||||||||||||||||||||||||
| 2018 |
73.07 | (0.41 | )1 | 16.64 | 16.23 | 0.00 | (4.94 | ) | (4.94 | ) | 84.36 | 23.43 | 1.04 | (0.53 | ) | 1,315.7 | 9.87 | |||||||||||||||||||||||||||||||||||
| 2017 |
62.30 | (0.33 | )1 | 13.90 | 13.57 | 0.00 | (2.80 | ) | (2.80 | ) | 73.07 | 22.76 | 1.04 | (0.50 | ) | 1,021.0 | 10.35 | |||||||||||||||||||||||||||||||||||
| 2016 |
62.19 | (0.10 | )1 | 6.80 | 6.70 | 0.00 | (6.59 | ) | (6.59 | ) | 62.30 | 11.44 | 1.04 | (0.17 | ) | 723.3 | 12.54 | |||||||||||||||||||||||||||||||||||
| 2015 |
64.87 | (0.24 | )1 | 1.73 | 1.49 | 0.00 | (4.17 | ) | (4.17 | ) | 62.19 | 2.09 | 1.04 | (0.36 | ) | 719.1 | 13.53 | |||||||||||||||||||||||||||||||||||
| 2014 |
62.20 | (0.28 | )1 | 8.55 | 8.27 | 0.00 | (5.60 | ) | (5.60 | ) | 64.87 | 13.90 | 1.04 | (0.43 | ) | 689.8 | 11.26 | |||||||||||||||||||||||||||||||||||
| 2013 |
52.55 | (0.21 | )1 | 13.62 | 13.41 | 0.00 | (3.76 | ) | (3.76 | ) | 62.20 | 27.51 | 1.05 | (0.38 | ) | 506.1 | 12.04 | |||||||||||||||||||||||||||||||||||
| 2012 |
49.30 | 0.01 | 1 | 11.01 | 11.02 | 0.00 | (7.77 | ) | (7.77 | ) | 52.55 | 24.99 | 1.06 | 0.02 | 386.7 | 13.11 | ||||||||||||||||||||||||||||||||||||
| R6 SHARES |
| |||||||||||||||||||||||||||||||||||||||||||||||||||
| Year Ended September 30, |
| |||||||||||||||||||||||||||||||||||||||||||||||||||
| 2021 |
104.07 | (0.91 | )1 | 26.68 | 25.77 | 0.00 | (3.39 | ) | (3.39 | ) | 126.45 | 25.28 | 1.04 | 5 | (0.76 | ) | 185.8 | 9.54 | ||||||||||||||||||||||||||||||||||
| 2020 |
85.65 | (0.52 | )1 | 20.44 | 19.92 | 0.00 | (1.50 | ) | (1.50 | ) | 104.07 | 23.55 | 1.05 | (0.57 | ) | 147.3 | 9.28 | |||||||||||||||||||||||||||||||||||
| 2019 |
84.35 | (0.38 | )1 | 6.44 | 6.06 | 0.00 | (4.76 | ) | (4.76 | ) | 85.65 | 8.09 | 1.05 | (0.47 | ) | 109.0 | 11.83 | |||||||||||||||||||||||||||||||||||
| 2018 |
73.06 | (0.41 | )1 | 16.64 | 16.23 | 0.00 | (4.94 | ) | (4.94 | ) | 84.35 | 23.43 | 1.04 | (0.54 | ) | 73.5 | 9.87 | |||||||||||||||||||||||||||||||||||
| 2017 |
62.30 | (0.34 | )1 | 13.90 | 13.56 | 0.00 | (2.80 | ) | (2.80 | ) | 73.06 | 22.74 | 1.04 | (0.51 | ) | 22.5 | 10.35 | |||||||||||||||||||||||||||||||||||
| 20164 |
53.85 | (0.21 | )1 | 8.68 | 8.47 | 0.00 | (0.02 | ) | (0.02 | ) | 62.30 | 15.73 | 2 | 1.04 | 3 | (0.52 | )3 | 7.8 | 12.54 | |||||||||||||||||||||||||||||||||
| 1 | Based on average shares outstanding. |
| 2 | Not Annualized. |
| 3 | Annualized. |
| 4 | For the period January 29, 2016 (initial offering of R6 Shares) to September 30, 2016. |
| 5 | Interest expense rounds to less than 0.01% |
| See Notes to Financial Statements. | 49 |
| Baron Funds | September 30, 2021 |
FINANCIAL HIGHLIGHTS (Continued)
BARON GROWTH FUND
Selected data for a share outstanding throughout each year:
| Income (loss) from investment operations: |
Less distributions to shareholders from: |
Ratios to Average Net Assets: |
Supplemental Data: |
|||||||||||||||||||||||||||||||||||||||||||||||||
| Net asset value, beginning of year ($) |
Net investment income (loss) ($) |
Net realized and unrealized gain (loss) on investments ($) |
Total from investment operations ($) |
Net investment income ($) |
Net realized gain on investments ($) |
Total distributions ($) |
Net asset value, end of year ($) |
Total return (%) |
Operating expenses (%) |
Net investment income (loss) (%) |
Net assets (in millions), end of year ($) |
Portfolio turnover rate (%) |
||||||||||||||||||||||||||||||||||||||||
| RETAIL SHARES |
| |||||||||||||||||||||||||||||||||||||||||||||||||||
| Year Ended September 30, |
| |||||||||||||||||||||||||||||||||||||||||||||||||||
| 2021 |
90.65 | (0.81 | )1 | 32.65 | 31.84 | 0.00 | (4.85 | ) | (4.85 | ) | 117.64 | 36.19 | 8 | 1.29 | 2 | (0.75 | ) | 3,041.4 | 1.37 | |||||||||||||||||||||||||||||||||
| 2020 |
78.95 | (0.35 | )1 | 15.10 | 14.75 | 0.00 | (3.05 | ) | (3.05 | ) | 90.65 | 19.08 | 1.30 | 2 | (0.44 | ) | 2,535.3 | 1.63 | ||||||||||||||||||||||||||||||||||
| 2019 |
80.68 | (0.16 | )1 | 3.56 | 3.40 | 0.00 | (5.13 | ) | (5.13 | ) | 78.95 | 5.09 | 1.29 | 2 | (0.21 | ) | 2,507.0 | 1.93 | ||||||||||||||||||||||||||||||||||
| 2018 |
71.77 | (0.17 | )1 | 16.98 | 16.81 | 0.00 | (7.90 | ) | (7.90 | ) | 80.68 | 25.55 | 1.29 | 2 | (0.24 | ) | 2,747.8 | 2.92 | ||||||||||||||||||||||||||||||||||
| 2017 |
67.13 | (0.16 | )1 | 12.44 | 12.28 | 0.00 | (7.64 | ) | (7.64 | ) | 71.77 | 20.47 | 1.30 | 2 | (0.25 | ) | 2,666.6 | 3.32 | ||||||||||||||||||||||||||||||||||
| 2016 |
68.25 | 0.08 | 1 | 4.83 | 4.91 | 0.00 | (6.03 | ) | (6.03 | ) | 67.13 | 7.60 | 1.30 | 2 | 0.12 | 2,917.2 | 4.68 | |||||||||||||||||||||||||||||||||||
| 2015 |
70.46 | (0.27 | )1 | 1.28 | 1.01 | 0.00 | (3.22 | ) | (3.22 | ) | 68.25 | 1.27 | 1.29 | 2 | (0.37 | ) | 3,511.2 | 6.95 | ||||||||||||||||||||||||||||||||||
| 2014 |
68.67 | 0.06 | 1 | 3.45 | 3.51 | (0.03 | ) | (1.69 | ) | (1.72 | ) | 70.46 | 5.11 | 1.29 | 2 | 0.08 | 4,076.1 | 13.15 | ||||||||||||||||||||||||||||||||||
| 2013 |
58.19 | (0.12 | )1 | 16.37 | 16.25 | (0.18 | ) | (5.59 | ) | (5.77 | ) | 68.67 | 30.76 | 1.30 | (0.20 | ) | 4,644.2 | 9.63 | ||||||||||||||||||||||||||||||||||
| 2012 |
46.18 | 0.20 | 1 | 12.64 | 12.84 | 0.00 | (0.83 | ) | (0.83 | ) | 58.19 | 28.12 | 1.32 | 0.38 | 4,073.5 | 13.70 | ||||||||||||||||||||||||||||||||||||
| INSTITUTIONAL SHARES |
| |||||||||||||||||||||||||||||||||||||||||||||||||||
| Year Ended September 30, |
| |||||||||||||||||||||||||||||||||||||||||||||||||||
| 2021 |
94.15 | (0.56 | )1 | 33.99 | 33.43 | 0.00 | (4.85 | ) | (4.85 | ) | 122.73 | 36.55 | 8 | 1.03 | 2 | (0.50 | ) | 5.934.8 | 1.37 | |||||||||||||||||||||||||||||||||
| 2020 |
81.69 | (0.16 | )1 | 15.67 | 15.51 | 0.00 | (3.05 | ) | (3.05 | ) | 94.15 | 19.38 | 1.04 | 2 | (0.20 | ) | 4,608.4 | 1.63 | ||||||||||||||||||||||||||||||||||
| 2019 |
83.09 | 0.03 | 1 | 3.70 | 3.73 | 0.00 | (5.13 | ) | (5.13 | ) | 81.69 | 5.36 | 1.04 | 2 | 0.03 | 4,150.9 | 1.93 | |||||||||||||||||||||||||||||||||||
| 2018 |
73.52 | 0.01 | 1 | 17.46 | 17.47 | 0.00 | (7.90 | ) | (7.90 | ) | 83.09 | 25.86 | 1.03 | 2 | 0.01 | 4,134.2 | 2.92 | |||||||||||||||||||||||||||||||||||
| 2017 |
68.42 | 0.00 | 1,5 | 12.74 | 12.74 | 0.00 | (7.64 | ) | (7.64 | ) | 73.52 | 20.79 | 1.04 | 2 | 0.00 | 6 | 3,433.5 | 3.32 | ||||||||||||||||||||||||||||||||||
| 2016 |
69.28 | 0.24 | 1 | 4.93 | 5.17 | 0.00 | (6.03 | ) | (6.03 | ) | 68.42 | 7.88 | 1.05 | 2 | 0.37 | 3,043.3 | 4.68 | |||||||||||||||||||||||||||||||||||
| 2015 |
71.33 | (0.09 | )1 | 1.28 | 1.19 | (0.02 | ) | (3.22 | ) | (3.24 | ) | 69.28 | 1.51 | 1.04 | 2 | (0.12 | ) | 3,440.4 | 6.95 | |||||||||||||||||||||||||||||||||
| 2014 |
69.32 | 0.20 | 1 | 3.53 | 3.73 | (0.03 | ) | (1.69 | ) | (1.72 | ) | 71.33 | 5.39 | 1.04 | 2 | 0.28 | 3,694.5 | 13.15 | ||||||||||||||||||||||||||||||||||
| 2013 |
58.70 | 0.02 | 1 | 16.52 | 16.54 | (0.33 | ) | (5.59 | ) | (5.92 | ) | 69.32 | 31.10 | 1.05 | 0.04 | 2,976.7 | 9.63 | |||||||||||||||||||||||||||||||||||
| 2012 |
46.46 | 0.45 | 1 | 12.62 | 13.07 | 0.00 | (0.83 | ) | (0.83 | ) | 58.70 | 28.45 | 1.06 | 0.83 | 1,747.3 | 13.70 | ||||||||||||||||||||||||||||||||||||
| R6 SHARES |
| |||||||||||||||||||||||||||||||||||||||||||||||||||
| Year Ended September 30, |
| |||||||||||||||||||||||||||||||||||||||||||||||||||
| 2021 |
94.16 | (0.56 | )1 | 34.00 | 33.44 | 0.00 | (4.85 | ) | (4.85 | ) | 122.75 | 36.56 | 8 | 1.03 | 2 | (0.50 | ) | 225.8 | 1.37 | |||||||||||||||||||||||||||||||||
| 2020 |
81.70 | (0.17 | )1 | 15.68 | 15.51 | 0.00 | (3.05 | ) | (3.05 | ) | 94.16 | 19.38 | 1.04 | 2 | (0.20 | ) | 167.8 | 1.63 | ||||||||||||||||||||||||||||||||||
| 2019 |
83.10 | 0.00 | 1,5 | 3.73 | 3.73 | 0.00 | (5.13 | ) | (5.13 | ) | 81.70 | 5.36 | 1.04 | 2 | 0.00 | 6 | 131.6 | 1.93 | ||||||||||||||||||||||||||||||||||
| 2018 |
73.52 | (0.00 | )1,5 | 17.48 | 17.48 | 0.00 | (7.90 | ) | (7.90 | ) | 83.10 | 25.88 | 1.04 | 2 | (0.00 | )6 | 107.4 | 2.92 | ||||||||||||||||||||||||||||||||||
| 2017 |
68.42 | (0.11 | )1 | 12.85 | 12.74 | 0.00 | (7.64 | ) | (7.64 | ) | 73.52 | 20.79 | 1.05 | 2 | (0.15 | ) | 12.5 | 3.32 | ||||||||||||||||||||||||||||||||||
| 20167 |
60.02 | (0.15 | )1 | 8.55 | 8.40 | 0.00 | 0.00 | 0.00 | 68.42 | 14.00 | 3 | 1.05 | 2,4 | (0.33 | )4 | 2.3 | 4.68 | |||||||||||||||||||||||||||||||||||
| 1 | Based on average shares outstanding. |
| 2 | Interest expense rounds to less than 0.01%. |
| 3 | Not Annualized. |
| 4 | Annualized. |
| 5 | Less than $0.01 per share. |
| 6 | Less than 0.01%. |
| 7 | For the period January 29, 2016 (initial offering of R6 Shares) to September 30, 2016. |
| 8 | The Adviser made a voluntary payment to the Fund in the amount of $739,525 to compensate the Fund for a loss incurred due to a valuation error. The impact of this payment increased the Fund’s total return by 0.01%. |
| 50 | See Notes to Financial Statements. |
| September 30, 2021 | Baron Funds |
FINANCIAL HIGHLIGHTS (Continued)
BARON SMALL CAP FUND
Selected data for a share outstanding throughout each year:
| Income (loss) from investment operations: |
Less distributions to shareholders from: |
Ratios to Average Net Assets: |
Supplemental Data: |
|||||||||||||||||||||||||||||||||||||||||||||||||
| Net asset value, beginning of year ($) |
Net investment income (loss) ($) |
Net realized and unrealized gain (loss) on Investment ($) |
Total from investment operations ($) |
Net investment income ($) |
Net realized gain on investments ($) |
Total distributions ($) |
Net asset value, end of year ($) |
Total return (%) |
Operating expenses (%) |
Net investment income (loss) (%) |
Net assets (in millions), end of year ($) |
Portfolio turnover rate (%) |
||||||||||||||||||||||||||||||||||||||||
| RETAIL SHARES |
| |||||||||||||||||||||||||||||||||||||||||||||||||||
| Year Ended September 30, |
| |||||||||||||||||||||||||||||||||||||||||||||||||||
| 2021 |
35.06 | (0.16 | )1 | 9.89 | 9.73 | 0.00 | (4.12 | ) | (4.12 | ) | 40.67 | 29.77 | 1.29 | (0.40 | ) | 1,829.5 | 15.70 | |||||||||||||||||||||||||||||||||||
| 2020 |
29.44 | (0.29 | )1 | 8.73 | 8.44 | 0.00 | (2.82 | ) | (2.82 | ) | 35.06 | 30.60 | 1.31 | (0.98 | ) | 1,511.3 | 16.93 | |||||||||||||||||||||||||||||||||||
| 2019 |
33.68 | (0.27 | )1 | (1.36 | ) | (1.63 | ) | 0.00 | (2.61 | ) | (2.61 | ) | 29.44 | (4.17 | ) | 1.31 | (0.95 | ) | 1,451.9 | 13.44 | ||||||||||||||||||||||||||||||||
| 2018 |
30.64 | (0.32 | )1 | 7.21 | 6.89 | 0.00 | (3.85 | ) | (3.85 | ) | 33.68 | 25.00 | 1.30 | (1.05 | ) | 1,831.3 | 14.19 | |||||||||||||||||||||||||||||||||||
| 2017 |
30.59 | (0.04 | )1 | 5.77 | 5.73 | 0.00 | (5.68 | ) | (5.68 | ) | 30.64 | 22.45 | 1.31 | 4 | (0.15 | ) | 1,730.3 | 28.95 | ||||||||||||||||||||||||||||||||||
| 2016 |
30.34 | (0.18 | )1 | 3.84 | 3.66 | 0.00 | (3.41 | ) | (3.41 | ) | 30.59 | 12.89 | 1.32 | 4 | (0.64 | ) | 1,826.3 | 10.25 | ||||||||||||||||||||||||||||||||||
| 2015 |
33.68 | (0.21 | )1 | (1.10 | ) | (1.31 | ) | 0.00 | (2.03 | ) | (2.03 | ) | 30.34 | (4.32 | ) | 1.30 | (0.61 | ) | 2,601.4 | 14.66 | ||||||||||||||||||||||||||||||||
| 2014 |
32.83 | (0.01 | )1 | 2.14 | 2.13 | 0.00 | (1.28 | ) | (1.28 | ) | 33.68 | 6.52 | 1.30 | (0.04 | ) | 3,192.8 | 16.41 | |||||||||||||||||||||||||||||||||||
| 2013 |
26.14 | (0.12 | )1 | 7.61 | 7.49 | 0.00 | (0.80 | ) | (0.80 | ) | 32.83 | 29.51 | 1.31 | (0.42 | ) | 3,626.1 | 20.35 | |||||||||||||||||||||||||||||||||||
| 2012 |
20.84 | (0.19 | )1 | 5.96 | 5.77 | 0.00 | (0.47 | ) | (0.47 | ) | 26.14 | 28.09 | 1.31 | (0.76 | ) | 3,081.8 | 28.02 | |||||||||||||||||||||||||||||||||||
| INSTITUTIONAL SHARES |
| |||||||||||||||||||||||||||||||||||||||||||||||||||
| Year Ended September 30, |
| |||||||||||||||||||||||||||||||||||||||||||||||||||
| 2021 |
36.86 | (0.06 | )1 | 10.44 | 10.38 | 0.00 | (4.12 | ) | (4.12 | ) | 43.12 | 30.11 | 1.03 | (0.15 | ) | 3,214.2 | 15.70 | |||||||||||||||||||||||||||||||||||
| 2020 |
30.74 | (0.23 | )1 | 9.17 | 8.94 | 0.00 | (2.82 | ) | (2.82 | ) | 36.86 | 30.96 | 1.05 | (0.74 | ) | 2,724.6 | 16.93 | |||||||||||||||||||||||||||||||||||
| 2019 |
34.95 | (0.21 | )1 | (1.39 | ) | (1.60 | ) | 0.00 | (2.61 | ) | (2.61 | ) | 30.74 | (3.91 | ) | 1.05 | (0.69 | ) | 2,267.3 | 13.44 | ||||||||||||||||||||||||||||||||
| 2018 |
31.58 | (0.25 | )1 | 7.47 | 7.22 | 0.00 | (3.85 | ) | (3.85 | ) | 34.95 | 25.33 | 1.04 | (0.79 | ) | 2,696.7 | 14.19 | |||||||||||||||||||||||||||||||||||
| 2017 |
31.29 | 0.02 | 1 | 5.95 | 5.97 | 0.00 | (5.68 | ) | (5.68 | ) | 31.58 | 22.76 | 1.05 | 4 | 0.06 | 2,404.6 | 28.95 | |||||||||||||||||||||||||||||||||||
| 2016 |
30.88 | (0.12 | )1 | 3.94 | 3.82 | 0.00 | (3.41 | ) | (3.41 | ) | 31.29 | 13.21 | 1.06 | 4 | (0.41 | ) | 1,680.7 | 10.25 | ||||||||||||||||||||||||||||||||||
| 2015 |
34.16 | (0.13 | )1 | (1.12 | ) | (1.25 | ) | 0.00 | (2.03 | ) | (2.03 | ) | 30.88 | (4.08 | ) | 1.04 | (0.37 | ) | 1,923.2 | 14.66 | ||||||||||||||||||||||||||||||||
| 2014 |
33.20 | 0.06 | 1 | 2.18 | 2.24 | 0.00 | (1.28 | ) | (1.28 | ) | 34.16 | 6.79 | 1.04 | 0.18 | 2,057.4 | 16.41 | ||||||||||||||||||||||||||||||||||||
| 2013 |
26.36 | (0.05 | )1 | 7.69 | 7.64 | 0.00 | (0.80 | ) | (0.80 | ) | 33.20 | 29.85 | 1.05 | (0.16 | ) | 1,775.7 | 20.35 | |||||||||||||||||||||||||||||||||||
| 2012 |
20.96 | (0.13 | )1 | 6.00 | 5.87 | 0.00 | (0.47 | ) | (0.47 | ) | 26.36 | 28.41 | 1.05 | (0.53 | ) | 1,111.0 | 28.02 | |||||||||||||||||||||||||||||||||||
| R6 SHARES |
| |||||||||||||||||||||||||||||||||||||||||||||||||||
| Year Ended September 30, |
| |||||||||||||||||||||||||||||||||||||||||||||||||||
| 2021 |
36.85 | (0.06 | )1 | 10.43 | 10.37 | 0.00 | (4.12 | ) | (4.12 | ) | 43.10 | 30.09 | 1.04 | (0.16 | ) | 272.8 | 15.70 | |||||||||||||||||||||||||||||||||||
| 2020 |
30.73 | (0.23 | )1 | 9.17 | 8.94 | 0.00 | (2.82 | ) | (2.82 | ) | 36.85 | 30.97 | 1.05 | (0.74 | ) | 218.5 | 16.93 | |||||||||||||||||||||||||||||||||||
| 2019 |
34.94 | (0.21 | )1 | (1.39 | ) | (1.60 | ) | 0.00 | (2.61 | ) | (2.61 | ) | 30.73 | (3.91 | ) | 1.05 | (0.70 | ) | 161.9 | 13.44 | ||||||||||||||||||||||||||||||||
| 2018 |
31.57 | (0.26 | )1 | 7.48 | 7.22 | 0.00 | (3.85 | ) | (3.85 | ) | 34.94 | 25.34 | 1.05 | (0.82 | ) | 155.2 | 14.19 | |||||||||||||||||||||||||||||||||||
| 2017 |
31.29 | (0.08 | )1 | 6.04 | 5.96 | 0.00 | (5.68 | ) | (5.68 | ) | 31.57 | 22.72 | 1.06 | 4 | (0.28 | ) | 101.8 | 28.95 | ||||||||||||||||||||||||||||||||||
| 20165 |
26.06 | (0.17 | )1 | 5.40 | 5.23 | 0.00 | 0.00 | 0.00 | 31.29 | 20.07 | 2 | 1.06 | 3,4 | (0.85 | )3 | 3.7 | 10.25 | |||||||||||||||||||||||||||||||||||
| 1 | Based on average shares outstanding. |
| 2 | Not Annualized. |
| 3 | Annualized. |
| 4 | Interest expense rounds to less than 0.01%. |
| 5 | For the period January 29, 2016 (initial offering of R6 Shares) to September 30, 2016. |
| See Notes to Financial Statements. | 51 |
| Baron Funds | September 30, 2021 |
FINANCIAL HIGHLIGHTS (Continued)
BARON OPPORTUNITY FUND
Selected data for a share outstanding throughout each year:
| Income (loss) from investment operations: |
Less distributions to shareholders from: |
Ratios to Average Net Assets: |
Supplemental Data: |
|||||||||||||||||||||||||||||||||||||||||||||||||
| Net asset value, beginning of year ($) |
Net investment income (loss) ($) |
Net realized and unrealized gain (loss) on investments ($) |
Total from investment operations ($) |
Net investment income ($) |
Net realized gain on investments ($) |
Total distributions ($) |
Net asset value, end of year ($) |
Total return (%) |
Operating expenses (%) |
Net investment income (loss) (%) |
Net assets (in millions), end of year ($) |
Portfolio turnover rate (%) |
||||||||||||||||||||||||||||||||||||||||
| RETAIL SHARES |
|
|||||||||||||||||||||||||||||||||||||||||||||||||||
| Year Ended September 30, |
|
|||||||||||||||||||||||||||||||||||||||||||||||||||
| 2021 |
35.11 | (0.49 | )1 | 11.65 | 11.16 | 0.00 | (2.78 | ) | (2.78 | ) | 43.49 | 33.58 | 1.31 | 3 | (1.19 | ) | 866.5 | 38.74 | ||||||||||||||||||||||||||||||||||
| 2020 |
21.53 | (0.30 | )1 | 15.56 | 15.26 | 0.00 | (1.68 | ) | (1.68 | ) | 35.11 | 75.25 | 1.34 | 3 | (1.14 | ) | 644.9 | 42.52 | ||||||||||||||||||||||||||||||||||
| 2019 |
22.02 | (0.22 | )1 | 0.66 | 0.44 | 0.00 | (0.93 | ) | (0.93 | ) | 21.53 | 2.51 | 1.34 | 3 | (1.07 | ) | 302.6 | 37.10 | ||||||||||||||||||||||||||||||||||
| 2018 |
18.53 | (0.22 | )1 | 6.36 | 6.14 | 0.00 | (2.65 | ) | (2.65 | ) | 22.02 | 37.41 | 1.37 | 3 | (1.13 | ) | 363.6 | 23.97 | ||||||||||||||||||||||||||||||||||
| 2017 |
16.87 | (0.20 | )1 | 3.75 | 3.55 | 0.00 | (1.89 | ) | (1.89 | ) | 18.53 | 24.32 | 1.41 | 3 | (1.18 | ) | 201.4 | 32.62 | ||||||||||||||||||||||||||||||||||
| 2016 |
17.12 | (0.13 | )1 | 1.70 | 1.57 | 0.00 | (1.82 | ) | (1.82 | ) | 16.87 | 9.19 | 1.41 | 3 | (0.83 | ) | 207.0 | 32.38 | ||||||||||||||||||||||||||||||||||
| 2015 |
18.61 | (0.21 | )1 | (0.25 | ) | (0.46 | ) | 0.00 | (1.03 | ) | (1.03 | ) | 17.12 | (2.70 | ) | 1.38 | 3 | (1.10 | ) | 232.2 | 41.87 | |||||||||||||||||||||||||||||||
| 2014 |
19.26 | (0.24 | )1 | 0.79 | 0.55 | 0.00 | (1.20 | ) | (1.20 | ) | 18.61 | 2.87 | 2 | 1.35 | (1.24 | ) | 331.2 | 63.40 | ||||||||||||||||||||||||||||||||||
| 2013 |
15.61 | (0.17 | )1 | 4.06 | 3.89 | 0.00 | (0.24 | ) | (0.24 | ) | 19.26 | 25.39 | 1.37 | (1.02 | ) | 359.9 | 70.44 | |||||||||||||||||||||||||||||||||||
| 2012 |
12.83 | (0.17 | )1 | 2.95 | 2.78 | 0.00 | 0.00 | 0.00 | 15.61 | 21.67 | 1.39 | (1.16 | ) | 332.4 | 88.56 | |||||||||||||||||||||||||||||||||||||
| INSTITUTIONAL SHARES |
|
|||||||||||||||||||||||||||||||||||||||||||||||||||
| Year Ended September 30, |
|
|||||||||||||||||||||||||||||||||||||||||||||||||||
| 2021 |
36.79 | (0.41 | )1 | 12.25 | 11.84 | 0.00 | (2.78 | ) | (2.78 | ) | 45.85 | 33.91 | 1.05 | 3 | (0.93 | ) | 711.4 | 38.74 | ||||||||||||||||||||||||||||||||||
| 2020 |
22.42 | (0.25 | )1 | 16.30 | 16.05 | 0.00 | (1.68 | ) | (1.68 | ) | 36.79 | 75.82 | 1.08 | 3 | (0.88 | ) | 409.5 | 42.52 | ||||||||||||||||||||||||||||||||||
| 2019 |
22.83 | (0.18 | )1 | 0.70 | 0.52 | 0.00 | (0.93 | ) | (0.93 | ) | 22.42 | 2.78 | 1.09 | 3 | (0.82 | ) | 94.4 | 37.10 | ||||||||||||||||||||||||||||||||||
| 2018 |
19.08 | (0.18 | )1 | 6.58 | 6.40 | 0.00 | (2.65 | ) | (2.65 | ) | 22.83 | 37.73 | 1.11 | 3 | (0.88 | ) | 96.4 | 23.97 | ||||||||||||||||||||||||||||||||||
| 2017 |
17.27 | (0.16 | )1 | 3.86 | 3.70 | 0.00 | (1.89 | ) | (1.89 | ) | 19.08 | 24.65 | 1.14 | 3 | (0.92 | ) | 51.7 | 32.62 | ||||||||||||||||||||||||||||||||||
| 2016 |
17.45 | (0.08 | )1 | 1.72 | 1.64 | 0.00 | (1.82 | ) | (1.82 | ) | 17.27 | 9.44 | 1.13 | 3 | (0.46 | ) | 43.3 | 32.38 | ||||||||||||||||||||||||||||||||||
| 2015 |
18.89 | (0.16 | )1 | (0.25 | ) | (0.41 | ) | 0.00 | (1.03 | ) | (1.03 | ) | 17.45 | (2.38 | ) | 1.10 | 3 | (0.84 | ) | 91.7 | 41.87 | |||||||||||||||||||||||||||||||
| 2014 |
19.49 | (0.19 | )1 | 0.79 | 0.60 | 0.00 | (1.20 | ) | (1.20 | ) | 18.89 | 3.10 | 2 | 1.08 | (0.97 | ) | 109.4 | 63.40 | ||||||||||||||||||||||||||||||||||
| 2013 |
15.75 | (0.13 | )1 | 4.11 | 3.98 | 0.00 | (0.24 | ) | (0.24 | ) | 19.49 | 25.74 | 1.11 | (0.79 | ) | 101.3 | 70.44 | |||||||||||||||||||||||||||||||||||
| 2012 |
12.91 | (0.13 | )1 | 2.97 | 2.84 | 0.00 | 0.00 | 0.00 | 15.75 | 22.00 | 1.13 | (0.90 | ) | 62.5 | 88.56 | |||||||||||||||||||||||||||||||||||||
| R6 SHARES |
|
|||||||||||||||||||||||||||||||||||||||||||||||||||
| Year Ended September 30, |
|
|||||||||||||||||||||||||||||||||||||||||||||||||||
| 2021 |
36.82 | (0.41 | )1 | 12.27 | 11.86 | 0.00 | (2.78 | ) | (2.78 | ) | 45.90 | 33.94 | 1.05 | 3 | (0.93 | ) | 36.1 | 38.74 | ||||||||||||||||||||||||||||||||||
| 2020 |
22.45 | (0.24 | )1 | 16.29 | 16.05 | 0.00 | (1.68 | ) | (1.68 | ) | 36.82 | 75.71 | 1.08 | 3 | (0.87 | ) | 25.7 | 42.52 | ||||||||||||||||||||||||||||||||||
| 2019 |
22.86 | (0.18 | )1 | 0.70 | 0.52 | 0.00 | (0.93 | ) | (0.93 | ) | 22.45 | 2.78 | 1.08 | 3 | (0.81 | ) | 14.5 | 37.10 | ||||||||||||||||||||||||||||||||||
| 2018 |
19.09 | (0.17 | )1 | 6.59 | 6.42 | 0.00 | (2.65 | ) | (2.65 | ) | 22.86 | 37.83 | 1.09 | 3 | (0.82 | ) | 14.0 | 23.97 | ||||||||||||||||||||||||||||||||||
| 2017 |
17.28 | (0.16 | )1 | 3.86 | 3.70 | 0.00 | (1.89 | ) | (1.89 | ) | 19.09 | 24.64 | 1.12 | 3 | (0.89 | ) | 1.0 | 32.62 | ||||||||||||||||||||||||||||||||||
| 20166 |
16.88 | (0.02 | )1 | 0.42 | 0.40 | 0.00 | 0.00 | 0.00 | 17.28 | 2.37 | 4 | 1.12 | 3,5 | (1.25 | )5 | 0.5 | 32.38 | |||||||||||||||||||||||||||||||||||
| 1 | Based on average shares outstanding . |
| 2 | The Adviser made a voluntary payment to the Fund in the amount of $140,762 to compensate the Fund for a loss incurred due to a trade processing error. The impact of this payment increased the Fund’s total return by 0.03%. |
| 3 | Interest expense rounds to less than 0.01%. |
| 4 | Not Annualized. |
| 5 | Annualized. |
| 6 | For the period August 31, 2016 (initial offering of R6 Shares) to September 30, 2016. |
| 52 | See Notes to Financial Statements. |
| September 30, 2021 | Baron Funds |
FINANCIAL HIGHLIGHTS (Continued)
BARON FIFTH AVENUE GROWTH FUND
Selected data for a share outstanding throughout each year:
| Income (loss) from investment operations: |
Less distributions to shareholders from: |
Ratios to Average Net Assets: | Supplemental Data: |
|||||||||||||||||||||||||||||||||||||||||||||||||||||||||
| Net asset value, beginning of year ($) |
Net investment income (loss) ($) |
Net realized and unrealized gain on investments ($) |
Total from investment operations ($) |
Net investment income ($) |
Net realized gain on investments ($) |
Total distributions ($) |
Net asset value, end of year ($) |
Total return (%) |
Operating expenses (%) |
Less: Reimbursement of expenses by Adviser (%) |
Net operating expenses (%) |
Net investment income (loss) (%) |
Net assets (in millions), end of year ($) |
Portfolio turnover rate (%) |
||||||||||||||||||||||||||||||||||||||||||||||
| RETAIL SHARES |
| |||||||||||||||||||||||||||||||||||||||||||||||||||||||||||
| Year Ended September 30, |
| |||||||||||||||||||||||||||||||||||||||||||||||||||||||||||
| 2021 |
46.62 | (0.46 | )1 | 9.35 | 8.89 | 0.00 | (0.18 | ) | (0.18 | ) | 55.33 | 19.13 | 2 | 1.02 | (0.02 | ) | 1.00 | (0.88 | ) | 187.8 | 15.87 | |||||||||||||||||||||||||||||||||||||||
| 2020 |
32.10 | (0.26 | )1 | 15.77 | 15.51 | 0.00 | (0.99 | ) | (0.99 | ) | 46.62 | 49.56 | 2 | 1.05 | (0.05 | ) | 1.00 | (0.70 | ) | 176.9 | 11.57 | |||||||||||||||||||||||||||||||||||||||
| 2019 |
31.02 | 0.07 | 1 | 1.01 | 1.08 | 0.00 | 0.00 | 0.00 | 32.10 | 3.48 | 2 | 1.06 | (0.06 | ) | 1.00 | 0.23 | 115.5 | 21.24 | ||||||||||||||||||||||||||||||||||||||||||
| 2018 |
24.04 | (0.17 | )1 | 7.15 | 6.98 | 0.00 | 0.00 | 0.00 | 31.02 | 29.03 | 2 | 1.09 | (0.08 | ) | 1.01 | (0.61 | ) | 132.2 | 8.81 | |||||||||||||||||||||||||||||||||||||||||
| 2017 |
19.35 | (0.11 | )1 | 4.80 | 4.69 | 0.00 | 0.00 | 0.00 | 24.04 | 24.24 | 2 | 1.12 | 3 | (0.02 | ) | 1.10 | (0.50 | ) | 87.5 | 13.94 | ||||||||||||||||||||||||||||||||||||||||
| 2016 |
16.91 | (0.08 | )1 | 2.52 | 2.44 | 0.00 | 0.00 | 0.00 | 19.35 | 14.43 | 2 | 1.26 | (0.04 | ) | 1.22 | (0.43 | ) | 73.5 | 19.30 | |||||||||||||||||||||||||||||||||||||||||
| 2015 |
16.83 | (0.09 | )1 | 0.17 | 7 | 0.08 | 0.00 | 0.00 | 0.00 | 16.91 | 0.48 | 2 | 1.32 | (0.02 | ) | 1.30 | (0.49 | ) | 71.5 | 14.54 | ||||||||||||||||||||||||||||||||||||||||
| 2014 |
14.42 | (0.05 | )1 | 2.46 | 2.41 | 0.00 | 0.00 | 0.00 | 16.83 | 16.71 | 2 | 1.37 | (0.07 | ) | 1.30 | (0.29 | ) | 53.2 | 16.84 | |||||||||||||||||||||||||||||||||||||||||
| 2013 |
11.83 | 0.02 | 1 | 2.57 | 2.59 | 0.00 | 0.00 | 0.00 | 14.42 | 21.89 | 2 | 1.47 | (0.17 | ) | 1.30 | 0.14 | 47.8 | 22.91 | ||||||||||||||||||||||||||||||||||||||||||
| 2012 |
8.98 | (0.03 | )1 | 2.88 | 2.85 | 0.00 | 0.00 | 0.00 | 11.83 | 31.74 | 2 | 1.55 | (0.25 | ) | 1.30 | (0.30 | ) | 34.8 | 79.07 | |||||||||||||||||||||||||||||||||||||||||
| INSTITUTIONAL SHARES |
|
|||||||||||||||||||||||||||||||||||||||||||||||||||||||||||
| Year Ended September 30, |
| |||||||||||||||||||||||||||||||||||||||||||||||||||||||||||
| 2021 |
47.75 | (0.34 | )1 | 9.59 | 9.25 | 0.00 | (0.18 | ) | (0.18 | ) | 56.82 | 19.44 | 2 | 0.75 | (0.00 | )6 | 0.75 | (0.63 | ) | 609.8 | 15.87 | |||||||||||||||||||||||||||||||||||||||
| 2020 |
32.80 | (0.17 | )1 | 16.15 | 15.98 | (0.04 | ) | (0.99 | ) | (1.03 | ) | 47.75 | 49.93 | 2 | 0.78 | (0.03 | ) | 0.75 | (0.45 | ) | 350.5 | 11.57 | ||||||||||||||||||||||||||||||||||||||
| 2019 |
31.62 | 0.17 | 1 | 1.01 | 1.18 | 0.00 | 0.00 | 0.00 | 32.80 | 3.73 | 2 | 0.80 | (0.05 | ) | 0.75 | 0.56 | 170.4 | 21.24 | ||||||||||||||||||||||||||||||||||||||||||
| 2018 |
24.44 | (0.10 | )1 | 7.28 | 7.18 | 0.00 | 0.00 | 0.00 | 31.62 | 29.38 | 2 | 0.82 | (0.06 | ) | 0.76 | (0.36 | ) | 152.2 | 8.81 | |||||||||||||||||||||||||||||||||||||||||
| 2017 |
19.62 | (0.05 | )1 | 4.87 | 4.82 | 0.00 | 0.00 | 0.00 | 24.44 | 24.57 | 0.84 | 3 | 0.00 | 0.84 | (0.24 | ) | 89.5 | 13.94 | ||||||||||||||||||||||||||||||||||||||||||
| 2016 |
17.10 | (0.03 | )1 | 2.55 | 2.52 | 0.00 | 0.00 | 0.00 | 19.62 | 14.74 | 2 | 0.98 | (0.01 | ) | 0.97 | (0.19 | ) | 81.9 | 19.30 | |||||||||||||||||||||||||||||||||||||||||
| 2015 |
17.00 | (0.04 | )1 | 0.16 | 7 | 0.12 | (0.02 | ) | 0.00 | (0.02 | ) | 17.10 | 0.72 | 1.04 | 0.00 | 1.04 | (0.23 | ) | 74.7 | 14.54 | ||||||||||||||||||||||||||||||||||||||||
| 2014 |
14.53 | (0.01 | )1 | 2.48 | 2.47 | 0.00 | 0.00 | 0.00 | 17.00 | 17.00 | 2 | 1.08 | (0.03 | ) | 1.05 | (0.08 | ) | 56.0 | 16.84 | |||||||||||||||||||||||||||||||||||||||||
| 2013 |
11.89 | 0.05 | 1 | 2.59 | 2.64 | 0.00 | 0.00 | 0.00 | 14.53 | 22.20 | 2 | 1.18 | (0.13 | ) | 1.05 | 0.36 | 33.8 | 22.91 | ||||||||||||||||||||||||||||||||||||||||||
| 2012 |
9.00 | (0.01 | )1 | 2.90 | 2.89 | 0.00 | 0.00 | 0.00 | 11.89 | 32.11 | 2 | 1.26 | (0.21 | ) | 1.05 | (0.05 | ) | 18.9 | 79.07 | |||||||||||||||||||||||||||||||||||||||||
| R6 SHARES |
|
|||||||||||||||||||||||||||||||||||||||||||||||||||||||||||
| Year Ended September 30, |
| |||||||||||||||||||||||||||||||||||||||||||||||||||||||||||
| 2021 |
47.76 | (0.34 | )1 | 9.60 | 9.26 | 0.00 | (0.18 | ) | (0.18 | ) | 56.84 | 19.45 | 2 | 0.75 | (0.00 | )6 | 0.75 | (0.63 | ) | 39.6 | 15.87 | |||||||||||||||||||||||||||||||||||||||
| 2020 |
32.81 | (0.17 | )1 | 16.15 | 15.98 | (0.04 | ) | (0.99 | ) | (1.03 | ) | 47.76 | 49.92 | 2 | 0.78 | (0.03 | ) | 0.75 | (0.45 | ) | 33.1 | 11.57 | ||||||||||||||||||||||||||||||||||||||
| 2019 |
31.63 | 0.17 | 1 | 1.01 | 1.18 | 0.00 | 0.00 | 0.00 | 32.81 | 3.73 | 2 | 0.79 | (0.04 | ) | 0.75 | 0.54 | 22.5 | 21.24 | ||||||||||||||||||||||||||||||||||||||||||
| 2018 |
24.45 | (0.11 | )1 | 7.29 | 7.18 | 0.00 | 0.00 | 0.00 | 31.63 | 29.37 | 2 | 0.80 | (0.05 | ) | 0.75 | (0.37 | ) | 21.4 | 8.81 | |||||||||||||||||||||||||||||||||||||||||
| 2017 |
19.63 | (0.06 | )1 | 4.88 | 4.82 | 0.00 | 0.00 | 0.00 | 24.45 | 24.55 | 0.84 | 3 | 0.00 | 0.84 | (0.27 | ) | 4.7 | 13.94 | ||||||||||||||||||||||||||||||||||||||||||
| 20168 |
17.03 | (0.05 | )1 | 2.65 | 2.60 | 0.00 | 0.00 | 0.00 | 19.63 | 15.27 | 2,4 | 0.85 | 5 | (0.01 | )5 | 0.84 | 5 | (0.37 | )5 | 1.4 | 19.30 | |||||||||||||||||||||||||||||||||||||||
| 1 | Based on average shares outstanding. |
| 2 | The total returns would have been lower had certain expenses not been reduced during the period shown. |
| 3 | Interest expense rounds to less than 0.01%. |
| 4 | Not Annualized. |
| 5 | Annualized. |
| 6 | Less than 0.01%. |
| 7 | The amount shown for a share outstanding does not correspond with the aggregate realized and unrealized gain (loss) on investments for the period due to the timing of sales and redemptions of Fund shares in relation to fluctuating market values of investments of the Fund. |
| 8 | For the period January 29, 2016 (initial offering of R6 Shares) to September 30, 2016. |
| See Notes to Financial Statements. | 53 |
| Baron Funds | September 30, 2021 |
FINANCIAL HIGHLIGHTS (Continued)
BARON DISCOVERY FUND
Selected data for a share outstanding throughout each year:
| Income (loss) from investment operations: |
Less distributions to shareholders from: |
Ratios to Average Net Assets: | Supplemental Data: |
|||||||||||||||||||||||||||||||||||||||||||||||||||||||||
| Net asset value, beginning of year ($) |
Net investment income (loss) ($) |
Net realized and unrealized gain (loss) on investments ($) |
Total from investment operations ($) |
Net investment income ($) |
Net realized gain on investments ($) |
Total distributions ($) |
Net asset value, end of year ($) |
Total return (%) |
Operating expenses (%) |
Less: Reimbursement of expenses by Adviser (%) |
Net operating expenses (%) |
Net investment income (loss) (%) |
Net assets (in millions), end of year ($) |
Portfolio turnover rate (%) |
||||||||||||||||||||||||||||||||||||||||||||||
| RETAIL SHARES |
| |||||||||||||||||||||||||||||||||||||||||||||||||||||||||||
| Year Ended September 30, |
| |||||||||||||||||||||||||||||||||||||||||||||||||||||||||||
| 2021 |
28.17 | (0.43 | )1 | 10.25 | 9.82 | 0.00 | (1.06 | ) | (1.06 | ) | 36.93 | 35.61 | 1.31 | 0.00 | 1.31 | (1.20 | ) | 270.3 | 36.52 | |||||||||||||||||||||||||||||||||||||||||
| 2020 |
19.41 | (0.24 | )1 | 9.03 | 8.79 | 0.00 | (0.03 | ) | (0.03 | ) | 28.17 | 45.33 | 1.35 | 0.00 | 1.35 | (1.09 | ) | 165.2 | 43.36 | |||||||||||||||||||||||||||||||||||||||||
| 2019 |
23.77 | (0.22 | )1 | (2.64 | ) | (2.86 | ) | 0.00 | (1.50 | ) | (1.50 | ) | 19.41 | (11.93 | )3 | 1.36 | (0.01 | ) | 1.35 | (1.10 | ) | 122.7 | 55.94 | |||||||||||||||||||||||||||||||||||||
| 2018 |
17.56 | 0.09 | 1 | 6.13 | 6.22 | (0.01 | ) | 0.00 | (0.01 | ) | 23.77 | 35.41 | 3 | 1.40 | 8 | (0.05 | ) | 1.35 | 0.45 | 108.2 | 72.25 | |||||||||||||||||||||||||||||||||||||||
| 2017 |
13.40 | (0.17 | )1 | 4.33 | 4.16 | 0.00 | 0.00 | 0.00 | 17.56 | 31.04 | 3 | 1.47 | (0.12 | ) | 1.35 | (1.11 | ) | 131.2 | 40.97 | |||||||||||||||||||||||||||||||||||||||||
| 2016 |
11.13 | 0.16 | 1 | 2.38 | 2.54 | 0.00 | (0.27 | ) | (0.27 | ) | 13.40 | 23.24 | 3 | 1.88 | (0.53 | ) | 1.35 | 1.38 | 18.6 | 90.74 | ||||||||||||||||||||||||||||||||||||||||
| 2015 |
11.68 | (0.13 | )1 | (0.42 | ) | (0.55 | ) | 0.00 | 0.00 | 0.00 | 11.13 | (4.71 | )3,4 | 1.57 | (0.22 | ) | 1.35 | (0.97 | ) | 19.9 | 114.82 | |||||||||||||||||||||||||||||||||||||||
| 2014 |
10.00 | (0.10 | )1 | 1.78 | 2 | 1.68 | 0.00 | 0.00 | 0.00 | 11.68 | 16.80 | 3 | 2.16 | (0.81 | ) | 1.35 | (0.85 | ) | 16.6 | 109.40 | ||||||||||||||||||||||||||||||||||||||||
| INSTITUTIONAL SHARES |
| |||||||||||||||||||||||||||||||||||||||||||||||||||||||||||
| Year Ended September 30, |
| |||||||||||||||||||||||||||||||||||||||||||||||||||||||||||
| 2021 |
28.65 | (0.35 | )1 | 10.44 | 10.09 | 0.00 | (1.06 | ) | (1.06 | ) | 37.68 | 35.97 | 1.05 | 0.00 | 1.05 | (0.94 | ) | 1,721.2 | 36.52 | |||||||||||||||||||||||||||||||||||||||||
| 2020 |
19.68 | (0.19 | )1 | 9.19 | 9.00 | 0.00 | (0.03 | ) | (0.03 | ) | 28.65 | 45.77 | 1.08 | 0.00 | 1.08 | (0.82 | ) | 759.2 | 43.36 | |||||||||||||||||||||||||||||||||||||||||
| 2019 |
24.03 | (0.18 | )1 | (2.67 | ) | (2.85 | ) | 0.00 | (1.50 | ) | (1.50 | ) | 19.68 | (11.75 | ) | 1.10 | 0.00 | 1.10 | (0.88 | ) | 409.4 | 55.94 | ||||||||||||||||||||||||||||||||||||||
| 2018 |
17.74 | 0.01 | 1 | 6.32 | 6.33 | (0.04 | ) | 0.00 | (0.04 | ) | 24.03 | 35.74 | 3 | 1.12 | 8 | (0.02 | ) | 1.10 | 0.05 | 280.2 | 72.25 | |||||||||||||||||||||||||||||||||||||||
| 2017 |
13.50 | (0.13 | )1 | 4.37 | 4.24 | 0.00 | 0.00 | 0.00 | 17.74 | 31.41 | 3 | 1.23 | (0.13 | ) | 1.10 | (0.85 | ) | 113.6 | 40.97 | |||||||||||||||||||||||||||||||||||||||||
| 2016 |
11.19 | 0.12 | 1 | 2.46 | 2.58 | 0.00 | (0.27 | ) | (0.27 | ) | 13.50 | 23.47 | 3 | 1.49 | (0.39 | ) | 1.10 | 1.06 | 22.8 | 90.74 | ||||||||||||||||||||||||||||||||||||||||
| 2015 |
11.71 | (0.10 | )1 | (0.42 | ) | (0.52 | ) | 0.00 | 0.00 | 0.00 | 11.19 | (4.44 | )3,4 | 1.25 | (0.15 | ) | 1.10 | (0.72 | ) | 53.9 | 114.82 | |||||||||||||||||||||||||||||||||||||||
| 2014 |
10.00 | (0.08 | )1 | 1.79 | 2 | 1.71 | 0.00 | 0.00 | 0.00 | 11.71 | 17.10 | 3 | 1.91 | (0.81 | ) | 1.10 | (0.64 | ) | 48.7 | 109.40 | ||||||||||||||||||||||||||||||||||||||||
| R6 SHARES |
| |||||||||||||||||||||||||||||||||||||||||||||||||||||||||||
| Year Ended September 30, |
| |||||||||||||||||||||||||||||||||||||||||||||||||||||||||||
| 2021 |
28.65 | (0.35 | )1 | 10.44 | 10.09 | 0.00 | (1.06 | ) | (1.06 | ) | 37.68 | 35.97 | 1.05 | 0.00 | 1.05 | (0.94 | ) | 38.1 | 36.52 | |||||||||||||||||||||||||||||||||||||||||
| 2020 |
19.68 | (0.19 | )1 | 9.19 | 9.00 | 0.00 | (0.03 | ) | (0.03 | ) | 28.65 | 45.77 | 1.08 | 0.00 | 1.08 | (0.83 | ) | 15.3 | 43.36 | |||||||||||||||||||||||||||||||||||||||||
| 2019 |
24.03 | (0.18 | )1 | (2.67 | ) | (2.85 | ) | 0.00 | (1.50 | ) | (1.50 | ) | 19.68 | (11.75 | ) | 1.09 | 0.00 | 1.09 | (0.88 | ) | 6.8 | 55.94 | ||||||||||||||||||||||||||||||||||||||
| 2018 |
17.74 | 0.03 | 1 | 6.30 | 6.33 | (0.04 | ) | 0.00 | (0.04 | ) | 24.03 | 35.75 | 3 | 1.10 | 8 | (0.01 | ) | 1.09 | 0.15 | 5.6 | 72.25 | |||||||||||||||||||||||||||||||||||||||
| 2017 |
13.50 | (0.12 | )1 | 4.36 | 4.24 | 0.00 | 0.00 | 0.00 | 17.74 | 31.41 | 3 | 1.22 | (0.13 | ) | 1.09 | (0.79 | ) | 3.2 | 40.97 | |||||||||||||||||||||||||||||||||||||||||
| 20165 |
12.89 | (0.01 | )1 | 0.62 | 0.61 | 0.00 | 0.00 | 0.00 | 13.50 | 4.73 | 3,6 | 1.48 | 7 | (0.39 | )7 | 1.09 | 7 | (0.66 | )7 | 2.0 | 90.74 | |||||||||||||||||||||||||||||||||||||||
| 1 | Based on average shares outstanding. |
| 2 | The amount shown for a share outstanding does not correspond with the aggregate realized and unrealized gain (loss) on investments for the period due to the timing of sales and redemptions of Fund shares in relation to fluctuating market values of investments of the Fund. |
| 3 | The total returns would have been lower had certain expenses not been reduced during the period shown. |
| 4 | The Adviser made a voluntary payment to the Fund in the amount of $1,000 to compensate the Fund for a loss incurred due to a trade processing error. The impact of this payment increased the Fund’s total return by less than 0.01%. |
| 5 | For the period August 31, 2016 (initial offering of R6 Shares) to September 30, 2016. |
| 6 | Not Annualized. |
| 7 | Annualized. |
| 8 | Interest expense rounds to less than 0.01%. |
| 54 | See Notes to Financial Statements. |
| September 30, 2021 | Baron Funds |
FINANCIAL HIGHLIGHTS (Continued)
BARON DURABLE ADVANTAGE FUND
Selected data for a share outstanding throughout each year:
| Income (loss) from investment operations: |
Less distributions to shareholders from: |
Ratios to Average Net Assets: | Supplemental Data: |
|||||||||||||||||||||||||||||||||||||||||||||||||||||||||
| Net asset value, beginning of year ($) |
Net investment income (loss) ($) |
Net realized and unrealized gain on investments ($) |
Total from investment operations ($) |
Net investment income ($) |
Net realized gain on investments ($) |
Total distributions ($) |
Net asset value, end of year ($) |
Total return (%) |
Operating expenses (%) |
Less: Reimbursement of expenses by Adviser (%) |
Net operating expenses (%) |
Net investment income (loss) (%) |
Net assets (in millions), end of year ($) |
Portfolio turnover rate (%) |
||||||||||||||||||||||||||||||||||||||||||||||
| RETAIL SHARES |
| |||||||||||||||||||||||||||||||||||||||||||||||||||||||||||
| Year Ended September 30, |
| |||||||||||||||||||||||||||||||||||||||||||||||||||||||||||
| 2021 |
14.47 | (0.05 | )1 | 4.06 | 4.01 | (0.01 | ) | 0.00 | (0.01 | ) | 18.47 | 27.70 | 3 | 1.91 | (0.96 | ) | 0.95 | (0.29 | ) | 9.8 | 10.58 | |||||||||||||||||||||||||||||||||||||||
| 2020 |
11.77 | (0.00 | )1,2 | 2.72 | 2.72 | (0.02 | ) | 0.00 | (0.02 | ) | 14.47 | 23.10 | 3 | 2.80 | (1.85 | ) | 0.95 | (0.01 | ) | 4.0 | 16.55 | |||||||||||||||||||||||||||||||||||||||
| 2019 |
10.74 | 0.03 | 1 | 1.03 | 1.06 | (0.03 | ) | 0.00 | (0.03 | ) | 11.77 | 9.97 | 3 | 6.22 | (5.27 | ) | 0.95 | 0.25 | 1.9 | 13.23 | ||||||||||||||||||||||||||||||||||||||||
| 20186 |
10.00 | 0.01 | 1 | 0.73 | 0.74 | 0.00 | 0.00 | 0.00 | 10.74 | 7.40 | 3,4 | 7.45 | 5 | (6.50 | )5 | 0.95 | 5 | 0.19 | 5 | 0.6 | 5.85 | 4 | ||||||||||||||||||||||||||||||||||||||
| INSTITUTIONAL SHARES |
| |||||||||||||||||||||||||||||||||||||||||||||||||||||||||||
| Year Ended September 30, |
| |||||||||||||||||||||||||||||||||||||||||||||||||||||||||||
| 2021 |
14.56 | (0.01 | )1 | 4.09 | 4.08 | (0.01 | ) | 0.00 | (0.01 | ) | 18.63 | 28.01 | 3 | 1.48 | (0.78 | ) | 0.70 | (0.05 | ) | 27.1 | 10.58 | |||||||||||||||||||||||||||||||||||||||
| 2020 |
11.82 | 0.03 | 1 | 2.73 | 2.76 | (0.02 | ) | 0.00 | (0.02 | ) | 14.56 | 23.34 | 3 | 2.40 | (1.70 | ) | 0.70 | 0.22 | 8.0 | 16.55 | ||||||||||||||||||||||||||||||||||||||||
| 2019 |
10.76 | 0.06 | 1 | 1.03 | 1.09 | (0.03 | ) | 0.00 | (0.03 | ) | 11.82 | 10.23 | 3 | 4.91 | (4.21 | ) | 0.70 | 0.52 | 4.7 | 13.23 | ||||||||||||||||||||||||||||||||||||||||
| 20186 |
10.00 | 0.04 | 1 | 0.72 | 0.76 | 0.00 | 0.00 | 0.00 | 10.76 | 7.60 | 3,4 | 5.71 | 5 | (5.01 | )5 | 0.70 | 5 | 0.46 | 5 | 3.0 | 5.85 | 4 | ||||||||||||||||||||||||||||||||||||||
| R6 SHARES |
| |||||||||||||||||||||||||||||||||||||||||||||||||||||||||||
| Year Ended September 30, |
| |||||||||||||||||||||||||||||||||||||||||||||||||||||||||||
| 2021 |
14.56 | (0.01 | )1 | 4.09 | 4.08 | (0.01 | ) | 0.00 | (0.01 | ) | 18.63 | 28.01 | 3 | 1.47 | (0.77 | ) | 0.70 | (0.04 | ) | 4.3 | 10.58 | |||||||||||||||||||||||||||||||||||||||
| 2020 |
11.82 | 0.03 | 1 | 2.73 | 2.76 | (0.02 | ) | 0.00 | (0.02 | ) | 14.56 | 23.34 | 3 | 1.93 | (1.23 | ) | 0.70 | 0.23 | 2.5 | 16.55 | ||||||||||||||||||||||||||||||||||||||||
| 2019 |
10.75 | 0.06 | 1 | 1.04 | 1.10 | (0.03 | ) | 0.00 | (0.03 | ) | 11.82 | 10.34 | 3 | 4.65 | (3.95 | ) | 0.70 | 0.53 | 0.5 | 13.23 | ||||||||||||||||||||||||||||||||||||||||
| 20186 |
10.00 | 0.04 | 1 | 0.71 | 0.75 | 0.00 | 0.00 | 0.00 | 10.75 | 7.50 | 3,4 | 5.24 | 5 | (4.54 | )5 | 0.70 | 5 | 0.46 | 5 | 0.4 | 5.85 | 4 | ||||||||||||||||||||||||||||||||||||||
| 1 | Based on average shares outstanding. |
| 2 | Less than $0.01 per share. |
| 3 | The total returns would have been lower had certain expenses not been reduced during the period shown. |
| 4 | Not Annualized. |
| 5 | Annualized. |
| 6 | For the period January 2, 2018 (commencement of operations) to September 30, 2018. |
| See Notes to Financial Statements. | 55 |
| Baron Funds | September 30, 2021 |
REPORT OF INDEPENDENT REGISTERED PUBLIC ACCOUNTING FIRM
To the Board of Trustees of Baron Investment Funds Trust and Shareholders of Baron Asset Fund, Baron Growth Fund, Baron Small Cap Fund, Baron Opportunity Fund, Baron Fifth Avenue Growth Fund, Baron Discovery Fund and Baron Durable Advantage Fund
Opinions on the Financial Statements
We have audited the accompanying statements of assets and liabilities, including the statements of net assets, of Baron Asset Fund, Baron Growth Fund, Baron Small Cap Fund, Baron Opportunity Fund, Baron Fifth Avenue Growth Fund, Baron Discovery Fund and Baron Durable Advantage Fund (constituting the Baron Investment Funds Trust, hereafter collectively referred to as the “Funds”) as of September 30, 2021, the related statements of operations for the year ended September 30, 2021, the statements of changes in net assets for each of the two years in the period ended September 30, 2021, including the related notes, and the financial highlights for each of the periods indicated therein (collectively referred to as the “financial statements”). In our opinion, the financial statements present fairly, in all material respects, the financial position of each of the Funds as of September 30, 2021, the results of each of their operations for the year then ended, the changes in each of their net assets for each of the two years in the period ended September 30, 2021 and each of the financial highlights for each of the periods indicated therein in conformity with accounting principles generally accepted in the United States of America.
Basis for Opinions
These financial statements are the responsibility of the Funds’ management. Our responsibility is to express an opinion on the Funds’ financial statements based on our audits. We are a public accounting firm registered with the Public Company Accounting Oversight Board (United States) (PCAOB) and are required to be independent with respect to the Funds in accordance with the U.S. federal securities laws and the applicable rules and regulations of the Securities and Exchange Commission and the PCAOB.
We conducted our audits of these financial statements in accordance with the standards of the PCAOB. Those standards require that we plan and perform the audit to obtain reasonable assurance about whether the financial statements are free of material misstatement, whether due to error or fraud.
Our audits included performing procedures to assess the risks of material misstatement of the financial statements, whether due to error or fraud, and performing procedures that respond to those risks. Such procedures included examining, on a test basis, evidence regarding the amounts and disclosures in the financial statements. Our audits also included evaluating the accounting principles used and significant estimates made by management, as well as evaluating the overall presentation of the financial statements. Our procedures included confirmation of securities owned as of September 30, 2021 by correspondence with the custodian, brokers, transfer agents and portfolio companies; when replies were not received from brokers, we performed other auditing procedures. We believe that our audits provide a reasonable basis for our opinions.

PricewaterhouseCoopers LLP
New York, New York
November 23, 2021
We have served as the auditor of one or more investment companies in the Baron group of funds since 1987.
56
| September 30, 2021 | Baron Funds |
STATEMENT REGARDING LIQUIDITY RISK MANAGEMENT PROGRAM
The Trust has adopted a liquidity risk management program (the “LRMP”) pursuant to the requirements of Rule 22e-4 under the 1940 Act, which requires registered open-end funds (other than money market funds) to adopt and implement a written liquidity risk management program that is reasonably designed to assess and manage fund liquidity risk. The rule is designed to promote effective liquidity risk management throughout the open-end fund industry, thereby reducing liquidity risk — i.e., the risk that a fund could not meet requests to redeem shares issued by the fund without significant dilution of remaining investors’ interests in the fund.
Pursuant to the requirements of Rule 22e-4, the LRMP is required to include policies and procedures reasonably designed to incorporate the following elements, and the LRMP complies with these requirements: (1) assessment, management and periodic review of liquidity risk; (2) classification of each Fund’s investments into one of the four liquidity categories in Rule 22e-4; (3) if the Fund does not primarily hold assets that are considered highly liquid investments (cash and other investments reasonably expected to be convertible into cash in current market conditions in three business days or less without the conversion into cash significantly changing the market value of the investment), determination of a “highly liquid investment minimum” (as defined in Rule 22e-4 and in the LRMP, the “HLIM”) and compliance with additional related requirements; (4) prohibition on the acquisition of any “illiquid investment” (as defined in Rule 22e-4) if immediately after the acquisition the Fund would have invested more than 15% of its net assets in illiquid investments; and (5) if the Funds reserve the right to engage in redemptions in-kind, establishment of policies and procedures regarding how and when the Funds will engage in such redemptions in-kind. There have been no material changes to the LRMP since it was initially approved by the Board.
The Board has approved the Adviser to administer the LRMP (the “Program Administrator”). The Program Administrator has delegated its responsibilities to a Liquidity Risk Management Committee (the “LRM Committee”), comprised of a cross-functional group of key representatives from various departments of the Program Administrator, including Operations; Accounting; Legal and Compliance; Trading; and Portfolio and Risk Analytics. In addition, the Trust has contracted with a third party liquidity assessment vendor to support the classification of Fund investments.
Pursuant to the requirements of Rule 22e-4, the Board must review, no less frequently than annually, a written report prepared by the Program Administrator that addresses the operation of the program and assesses its adequacy and effectiveness of implementation, including, if applicable, the operation of the HLIM, and any material changes to the program. The Board received a written report in May 2021 (the “Annual Report”).
The Annual Report states that the Adviser, as the Program Administrator, acting primarily through the LRM Committee, has assessed the operation of the LRMP and believes that the LRMP is adequate and effective in its implementation. The Program Administrator and the LRM Committee initially determined that each Fund primarily holds assets that are highly liquid investments, and the Annual Report states that this determination continues to be maintained so that no Fund needs to maintain a HLIM. In addition, the Annual Report states that, since the LRMP was implemented, no Fund has breached its limit on illiquid investments.
57
| Baron Funds | September 30, 2021 |
The federal tax status of distributions paid by the Funds during the year ended September 30, 2021 are listed below.
During the fiscal year ended September 30, 2021, the Funds’ distributions to shareholders included:
| Fund | Ordinary Income1,3 |
Long-Term Capital Gains2,3 |
||||||
| Baron Asset Fund |
$ | — | $ | 171,218,678 | ||||
| Baron Growth Fund |
— | 377,092,978 | ||||||
| Baron Small Cap Fund |
— | 497,010,336 | ||||||
| Baron Opportunity Fund |
5,801,202 | 80,532,998 | ||||||
| Baron Fifth Avenue Growth Fund |
— | 2,363,263 | ||||||
| Baron Discovery Fund |
— | 37,003,177 | ||||||
| Baron Durable Advantage Fund |
13,454 | 22 | ||||||
| 1 | For tax purposes, short-term capital gains are considered ordinary income distributions. |
| 2 | Long-term capital gains are subject to a maximum allowable rate of 20% for individuals pursuant to The Tax Cuts and Jobs Act of 2017. |
| 3 | Under the Patient Protection and Affordable Care Act, higher income taxpayers must pay a 3.8% additional tax on net investment income. |
Of the total ordinary income distributions paid by Baron Opportunity Fund and Baron Durable Advantage Fund, 12.84% and 100.00%, respectively, is qualified dividend income subject to a reduced tax rate and 12.02% and 100.00%, respectively, qualifies for the corporate dividends received deduction.
The information and distributions reported may differ from the information and distributions taxable to the shareholders for the calendar year ending December 31, 2021. The information necessary to complete your income tax return for the calendar year ending December 31, 2021 will be listed on the Form 1099-DIV, which will be mailed to you in January 2022.
58
| September 30, 2021 | Baron Funds |
As a shareholder of the Funds, you incur ongoing expenses. Ongoing expenses include advisory fees, distribution and service (12b-1) fees and other Fund expenses. The information on this page is intended to help you understand your ongoing costs of investing in the Funds and to compare these costs with the ongoing costs of investing in other mutual funds.
The information in the following table is based on an investment of $1,000 invested on April 1, 2021 and held for the six months ended September 30, 2021.
ACTUAL EXPENSES
The table below titled “Based on Actual Total Return” provides information about actual account values and actual expenses. You may use the information provided in this table, together with the amount you invested, to estimate the expenses that you paid over the period. To estimate the expenses you paid on your account, divide your ending account value by $1,000 (for example, an $8,600 ending account value divided by $1,000 = 8.6), then multiply the result by the number under the heading titled “Expenses Paid During the Period”.
BASED ON ACTUAL TOTAL RETURN FOR THE SIX MONTHS ENDED SEPTEMBER 30, 20211
| Actual Total Return |
Beginning Account Value April 1, 2021 |
Ending Account Value September 30, 2021 |
Annualized Expense Ratio |
Expenses Paid During the Period2 |
||||||||||||||||
| Baron Asset Fund — Retail Shares |
9.73 | % | $ | 1,000.00 | $ | 1,097.30 | 1.29 | % | $ | 6.78 | ||||||||||
| Baron Asset Fund — Institutional Shares |
9.88 | % | $ | 1,000.00 | $ | 1,098.80 | 1.03 | % | $ | 5.42 | ||||||||||
| Baron Asset Fund — R6 Shares |
9.88 | % | $ | 1,000.00 | $ | 1,098.80 | 1.03 | % | $ | 5.42 | ||||||||||
| Baron Growth Fund — Retail Shares |
11.57 | % | $ | 1,000.00 | $ | 1,115.70 | 1.29 | % | $ | 6.84 | ||||||||||
| Baron Growth Fund — Institutional Shares |
11.71 | % | $ | 1,000.00 | $ | 1,117.10 | 1.03 | % | $ | 5.47 | ||||||||||
| Baron Growth Fund — R6 Shares |
11.71 | % | $ | 1,000.00 | $ | 1,117.10 | 1.03 | % | $ | 5.47 | ||||||||||
| Baron Small Cap Fund — Retail Shares |
7.62 | % | $ | 1,000.00 | $ | 1,076.20 | 1.29 | % | $ | 6.71 | ||||||||||
| Baron Small Cap Fund — Institutional Shares |
7.77 | % | $ | 1,000.00 | $ | 1,077.70 | 1.03 | % | $ | 5.36 | ||||||||||
| Baron Small Cap Fund — R6 Shares |
7.75 | % | $ | 1,000.00 | $ | 1,077.50 | 1.03 | % | $ | 5.36 | ||||||||||
| Baron Opportunity Fund — Retail Shares |
7.76 | % | $ | 1,000.00 | $ | 1,077.60 | 1.31 | % | $ | 6.82 | ||||||||||
| Baron Opportunity Fund — Institutional Shares |
7.91 | % | $ | 1,000.00 | $ | 1,079.10 | 1.05 | % | $ | 5.47 | ||||||||||
| Baron Opportunity Fund — R6 Shares |
7.90 | % | $ | 1,000.00 | $ | 1,079.00 | 1.06 | % | $ | 5.52 | ||||||||||
| Baron Fifth Avenue Growth Fund — Retail Shares |
12.07 | % | $ | 1,000.00 | $ | 1,120.70 | 3 | 1.00 | %4 | $ | 5.32 | |||||||||
| Baron Fifth Avenue Growth Fund — Institutional Shares |
12.20 | % | $ | 1,000.00 | $ | 1,122.00 | 3 | 0.75 | %4 | $ | 3.99 | |||||||||
| Baron Fifth Avenue Growth Fund — R6 Shares |
12.22 | % | $ | 1,000.00 | $ | 1,122.20 | 3 | 0.75 | %4 | $ | 3.99 | |||||||||
| Baron Discovery Fund — Retail Shares |
0.63 | % | $ | 1,000.00 | $ | 1,006.30 | 1.31 | % | $ | 6.59 | ||||||||||
| Baron Discovery Fund — Institutional Shares |
0.78 | % | $ | 1,000.00 | $ | 1,007.80 | 1.05 | % | $ | 5.28 | ||||||||||
| Baron Discovery Fund — R6 Shares |
0.75 | % | $ | 1,000.00 | $ | 1,007.50 | 1.05 | % | $ | 5.28 | ||||||||||
| Baron Durable Advantage Fund — Retail Shares |
15.34 | % | $ | 1,000.00 | $ | 1,153.40 | 3 | 0.95 | %4 | $ | 5.13 | |||||||||
| Baron Durable Advantage Fund — Institutional Shares |
15.48 | % | $ | 1,000.00 | $ | 1,154.80 | 3 | 0.70 | %4 | $ | 3.78 | |||||||||
| Baron Durable Advantage Fund — R6 Shares |
15.48 | % | $ | 1,000.00 | $ | 1,154.80 | 3 | 0.70 | %4 | $ | 3.78 | |||||||||
| 1 | Assumes reinvestment of all dividends and capital gain distributions, if any. |
| 2 | Expenses are equal to each share class’ respective annualized expense ratio multiplied by the average account value over the period, multiplied by the number of days in the most recent fiscal half-year, then divided by 365. |
| 3 | Ending account value assumes the return earned after waiver and would have been lower if a portion of the expenses had not been waived. |
| 4 | Annualized expense ratios are adjusted to reflect fee waiver. |
59
| Baron Funds | September 30, 2021 |
FUND EXPENSES (Unaudited) (Continued)
HYPOTHETICAL EXAMPLE FOR COMPARISON PURPOSES
The table below titled “Based on Hypothetical Total Return” provides information about hypothetical account values and hypothetical expenses based on the actual expense ratio and an assumed rate of return of 5% per year before expenses, which is not the Funds’ actual return. The hypothetical account values and expenses may not be used to estimate the actual ending account values and expenses you paid for the period. You may use the information provided in this table to compare the ongoing costs of investing in the Funds and other funds. To do so, compare the 5% hypothetical example relating to the Funds with the 5% hypothetical examples that appear in the shareholder reports of other funds.
BASED ON HYPOTHETICAL TOTAL RETURN FOR THE SIX MONTHS ENDED SEPTEMBER 30, 2021
| Hypothetical Annualized Total Return |
Beginning Account Value April 1, 2021 |
Ending Account Value September 30, 2021 |
Annualized Expense Ratio |
Expenses Paid During the Period2 |
||||||||||||||||
| Baron Asset Fund — Retail Shares |
5.00 | % | $ | 1,000.00 | $ | 1,018.60 | 1.29 | % | $ | 6.53 | ||||||||||
| Baron Asset Fund — Institutional Shares |
5.00 | % | $ | 1,000.00 | $ | 1,019.90 | 1.03 | % | $ | 5.22 | ||||||||||
| Baron Asset Fund — R6 Shares |
5.00 | % | $ | 1,000.00 | $ | 1,019.90 | 1.03 | % | $ | 5.22 | ||||||||||
| Baron Growth Fund — Retail Shares |
5.00 | % | $ | 1,000.00 | $ | 1,018.60 | 1.29 | % | $ | 6.53 | ||||||||||
| Baron Growth Fund — Institutional Shares |
5.00 | % | $ | 1,000.00 | $ | 1,019.90 | 1.03 | % | $ | 5.22 | ||||||||||
| Baron Growth Fund — R6 Shares |
5.00 | % | $ | 1,000.00 | $ | 1,019.90 | 1.03 | % | $ | 5.22 | ||||||||||
| Baron Small Cap Fund — Retail Shares |
5.00 | % | $ | 1,000.00 | $ | 1,018.60 | 1.29 | % | $ | 6.53 | ||||||||||
| Baron Small Cap Fund — Institutional Shares |
5.00 | % | $ | 1,000.00 | $ | 1,019.90 | 1.03 | % | $ | 5.22 | ||||||||||
| Baron Small Cap Fund — R6 Shares |
5.00 | % | $ | 1,000.00 | $ | 1,019.90 | 1.03 | % | $ | 5.22 | ||||||||||
| Baron Opportunity Fund — Retail Shares |
5.00 | % | $ | 1,000.00 | $ | 1,018.50 | 1.31 | % | $ | 6.63 | ||||||||||
| Baron Opportunity Fund — Institutional Shares |
5.00 | % | $ | 1,000.00 | $ | 1,019.80 | 1.05 | % | $ | 5.32 | ||||||||||
| Baron Opportunity Fund — R6 Shares |
5.00 | % | $ | 1,000.00 | $ | 1,019.75 | 1.06 | % | $ | 5.37 | ||||||||||
| Baron Fifth Avenue Growth Fund — Retail Shares |
5.00 | % | $ | 1,000.00 | $ | 1,020.05 | 3 | 1.00 | %4 | $ | 5.06 | |||||||||
| Baron Fifth Avenue Growth Fund — Institutional Shares |
5.00 | % | $ | 1,000.00 | $ | 1,021.31 | 3 | 0.75 | %4 | $ | 3.80 | |||||||||
| Baron Fifth Avenue Growth Fund — R6 Shares |
5.00 | % | $ | 1,000.00 | $ | 1,021.31 | 3 | 0.75 | %4 | $ | 3.80 | |||||||||
| Baron Discovery Fund — Retail Shares |
5.00 | % | $ | 1,000.00 | $ | 1,018.50 | 1.31 | % | $ | 6.63 | ||||||||||
| Baron Discovery Fund — Institutional Shares |
5.00 | % | $ | 1,000.00 | $ | 1,019.80 | 1.05 | % | $ | 5.32 | ||||||||||
| Baron Discovery Fund — R6 Shares |
5.00 | % | $ | 1,000.00 | $ | 1,019.80 | 1.05 | % | $ | 5.32 | ||||||||||
| Baron Durable Advantage Fund — Retail Shares |
5.00 | % | $ | 1,000.00 | $ | 1,020.31 | 3 | 0.95 | %4 | $ | 4.81 | |||||||||
| Baron Durable Advantage Fund — Institutional Shares |
5.00 | % | $ | 1,000.00 | $ | 1,021.56 | 3 | 0.70 | %4 | $ | 3.55 | |||||||||
| Baron Durable Advantage Fund — R6 Shares |
5.00 | % | $ | 1,000.00 | $ | 1,021.56 | 3 | 0.70 | %4 | $ | 3.55 | |||||||||
| 1 | Assumes reinvestment of all dividends and capital gain distributions, if any. |
| 2 | Expenses are equal to each share class’ respective annualized expense ratio multiplied by the average account value over the period, multiplied by the number of days in the most recent fiscal half-year, then divided by 365. |
| 3 | Ending account value assumes the return earned after waiver and would have been lower if a portion of the expenses had not been waived. |
| 4 | Annualized expense ratios are adjusted to reflect fee waiver. |
60
| September 30, 2021 | Baron Funds |
DISCLOSURE REGARDING THE APPROVAL OF THE INVESTMENT ADVISORY AGREEMENTS FOR THE FUNDS BY THE BOARD OF TRUSTEES (Unaudited)
The Board of Trustees (the “Board”) of Baron Investment Funds Trust (the “Trust”) met on May 5, 2021 to discuss the selection of BAMCO, Inc. (the “Adviser”) as the investment adviser and the approval of the investment advisory agreements for Baron Asset Fund, Baron Growth Fund, Baron Small Cap Fund, Baron Opportunity Fund, Baron Fifth Avenue Growth Fund, Baron Discovery Fund, and Baron Durable Advantage Fund (each, a “Fund” and collectively, the “Funds”). The members of the Board who are not “interested persons” (as defined in the Investment Company Act of 1940, as amended) of the Trust (the “Independent Trustees”) met in a separate session to discuss and consider the renewal of the investment advisory agreements for the Funds. Representatives of Broadridge Financial Solutions, Inc. (“Broadridge”), an independent provider of investment company data, provided reports to the Board and attended the Board meeting. The Trustees received a substantial amount of information from the Adviser and from Broadridge, and were advised by independent legal counsel. Based on its evaluation of this and other information, the Board, including a majority of the Independent Trustees, approved the continuation of the investment advisory agreements for the Funds for an additional one-year period.
In reaching its determination, the Board considered various factors that it deemed relevant, including the factors listed below.
1. NATURE, EXTENT AND QUALITY OF SERVICES
The Trustees considered the information provided, including, for many, their experience and knowledge gained from their service as Trustees and their experience generally, including the following, which they had considered in past years and remained, in their thinking, material to their consideration:
| • | Their confidence in the senior personnel, portfolio management, the financial condition of the Adviser and its affiliates and the Adviser’s available resources; |
| • | The nature, extent and quality of the services provided by the Adviser, including: intensive devotion to research, selection of broker/dealers for Fund portfolio transactions, relationships with and supervision of third party service providers, such as the Funds’ custodian and transfer agent, the quality of shareholder reports, the ability to monitor adherence to investment guidelines and restrictions, the legal, accounting and compliance services provided to the Funds and the support services provided to the Board; |
| • | The Adviser’s investment principles and processes and the historical performance of the Funds as compared to similar funds managed by other advisers and other funds managed by the Adviser over comparable periods; |
| • | The advisory fees and total expense ratios of the Funds and comparisons to similar funds managed by other advisers over comparable periods. They observed that, for most of the Funds, while the advisory fee was comparatively higher, the net operating expenses paid by the Funds (total expense ratio) were within the range of those of the funds in their respective peer groups; and |
| • | Additional services provided by the Adviser. |
The Board concluded that the nature, extent and quality of the services the Adviser provides to each Fund, including performance consistent with its investing principles, supported approval of the investment advisory agreement for each Fund.
2. INVESTMENT PERFORMANCE OF THE FUNDS AND THE ADVISER
As part of its consideration of the investment performance of the Funds and the Adviser, the Board took into account the analyses performed by and discussed with representatives of Broadridge. The Board considered for each Fund, among other information, Broadridge’s comparisons of the expense ratio and contractual advisory fee with those of peer group funds selected by Broadridge and Morningstar category medians. The Board also considered, among other performance information, Broadridge’s comparisons of each Fund’s annualized total return and related risk metrics over one-, three-, five- and ten-year periods, where applicable, against peer group funds and Morningstar category medians. After considering all the information, the Board concluded that the Adviser continued to invest in accordance with its long-standing principles and that each Fund’s performance remained consistent with expectations for the Adviser’s investment style, in light of recent market conditions.
3. COSTS OF SERVICES PROVIDED AND PROFITS TO BE REALIZED BY THE ADVISER
The Board considered comparisons of the advisory fees charged and services provided by the Adviser and its investment adviser affiliate to sub-advised accounts and separately managed accounts. The Board considered that, while the advisory fees for the other clients are the same as, or lower than, the fees for the Funds, the Adviser or its affiliate performs significantly fewer services for those clients compared with those provided by the Adviser to the Funds. The Board also considered a profitability analysis prepared by the Adviser and discussed with the representatives of the Adviser that the Adviser has continued to invest in quality personnel, systems and facilities, and otherwise continued to invest in its business, irrespective of fund flows.
The Board also considered benefits that accrue to the Adviser and its affiliates from their relationship with the Funds. The Board considered the costs of portfolio management, including the types of investments made for the Funds, the personnel and systems necessary for implementation of investment strategies, and the pre-tax profits realized by the Adviser and its affiliates from their relationship with the Funds.
4. ECONOMIES OF SCALE AND BENEFITS TO INVESTORS
The Board considered the extent to which each Fund’s advisory fee reflected economies of scale for the benefit of Fund shareholders, appreciating that the economies of scale analysis is predicated on generally predictable increasing assets and noting the small size of certain Funds and the significant fluctuation in assets in recent years. The Board considered that small- and mid-cap investment strategies require more attention by the Adviser than a strategy that involves other types of investing, particularly as asset size increases. The Board considered that the Adviser was continuing to grow and upgrade its staff and invest in its business. The Board members reiterated their intention to continue to consider the extent of economies of scale, asset growth and the Adviser’s plans to invest further to support the Funds.
The Board concluded that the advisory fee for each Fund was supported by the entirety of the presentation and particularly in light of the services provided as discussed at this meeting.
After due consideration of the above-enumerated factors and other factors it deemed relevant, the Board, including a majority of the Independent Trustees, approved the continuance of each Fund’s investment advisory agreement.
61
| Baron Funds | September 30, 2021 |
MANAGEMENT OF THE FUNDS (Unaudited)
Board of Trustees and Officers.
Trustees of the Trust, together with information as to their positions with the Trust, principal occupations and other board memberships and affiliations for the past five years, are shown below. Each Trustee serves as Trustee of the Trust until its termination; until the Trustee’s retirement, resignation or death; or as otherwise specified in the Trust’s organizational documents. Unless otherwise noted, the address of each Officer and Trustee is Baron Investment Funds Trust, 767 Fifth Avenue, 49th Floor, New York, NY 10153. All Trustees listed below, whether Interested or Independent, serve as Trustees for the Trust. Additional information about the Trustees and Officers of the Trust can be found in the Trust’s Statement of Additional Information (the “SAI”) which may be obtained without charge by writing or calling 1-800-99BARON. The SAI is also available on the Baron Funds® website, www.BaronFunds.com.
| Name, Address & Age | Position(s) Held With the Funds |
Term of Office and Length of Time Served |
Principal Occupation(s) During the Past Five Years |
Number of Portfolios in Fund Complex Overseen by Trustee |
Other Directorships Held by Trustee | |||||
| Interested Trustees |
||||||||||
| Ronald Baron(1),(2) 767 Fifth Avenue New York, NY 10153 Age: 78 |
Chief Executive Officer, Trustee and Portfolio Manager | 34 years | Director, Chairman and CEO: the Firm* (1982-Present); Trustee: Baron Investment Funds Trust (1987-Present); Trustee: Baron Select Funds (2003-Present); Portfolio Manager: Baron USA Partners Fund, Ltd. (2003-Present). | 18 | None | |||||
| Linda S. Martinson(1),(2) 767 Fifth Avenue New York, NY 10153 Age: 66 |
Chairman, President, Chief Operating Officer and Trustee | 34 years | Director: the Firm* (2003-Present); Secretary: the Firm* (1997-2008); President: the Firm* (2007-Present); Chief Operating Officer: the Firm (2006-Present); Chairman (2010-Present), President (2007-Present), Trustee (1987-Present): Baron Investment Funds Trust; Chairman (2010-Present), President (2007-Present), Trustee (2003-Present): Baron Select Funds; Director: Baron USA Partners Fund, Ltd. (2006-Present). | 18 | None | |||||
| Independent Trustees |
||||||||||
| Thomas J. Folliard(3),(4),(5) 767 Fifth Avenue New York, NY 10153 Age: 56 |
Trustee | 3 years | Non-Executive Chair of the Board: CarMax, Inc. (2016-Present); President and Chief Executive Officer: CarMax, Inc. (2006-2016); Trustee: Baron Investment Funds Trust (2017-Present), Baron Select Funds (2017-Present). | 18 | Director: PulteGroup, Inc. (2012-Present). | |||||
| Abraham (Avi) Nachmany(4),(5) 767 Fifth Avenue New York, NY 10153 Age: 69 |
Trustee | 2 years | Independent mutual fund industry consultant (2016-Present); Director of Research E.V.P., Co-Founder Strategic Insight (1986-2015); Advisory Board Member: Baron Investment Funds Trust and Baron Select Funds (5/2019-5/2020); Trustee: Baron Investment Funds Trust, Baron Select Funds (5/2020-Present). |
18 | None | |||||
| Raymond Noveck(3),(4),(5) 767 Fifth Avenue New York, NY 10153 Age: 78 |
Lead Trustee | 34 years | Private Investor (1999-Present); Trustee: Baron Investment Funds Trust (1987-Present), Baron Select Funds (2003-Present); Founder and President of Strategic Systems, Inc., provider of “The Medical Information Line” (1989-1999); Executive Vice President, Lifetime Corporation (1987-1989). | 18 | None | |||||
| Anita Rival(4),(5) 767 Fifth Avenue New York, NY 10153 Age: 57 |
Trustee | 6 years | Advisory Board Member: Impala Asset Management, LLC (2014-Present); Advisory Board Member: ValueAct Capital, LLC (2014-Present); Senior Advisor: Magnetar Capital (2011-2012); Trustee: Baron Investment Funds Trust, Baron Select Funds (2013-Present). | 18 | Director: Golub Capital BDC, Inc. (2011-Present). | |||||
| David A. Silverman, MD(4),(5) 767 Fifth Avenue New York, NY 10153 Age: 71 |
Trustee | 34 years | Physician at NYU/ Langone Medical Center and Faculty at New York University School of Medicine (1976-Present); Trustee: Baron Investment Funds Trust (1987-Present), Baron Select Funds (2003-Present). | 18 | None | |||||
62
| September 30, 2021 | Baron Funds |
MANAGEMENT OF THE FUNDS (Unaudited) (Continued)
| Name, Address & Age | Position(s) Held With the Funds |
Term of Office and Length of Time Served |
Principal Occupation(s) During the Past Five Years |
Number of Portfolios in Fund Complex Overseen by Trustee |
Other Directorships Held by Trustee | |||||
| Independent Trustees (continued) |
||||||||||
| Marvelle Sullivan(4),(5) 767 Fifth Avenue New York, NY 10153 |
Trustee | 1 year | Founder and CEO: Marvelle Co. LLC (2019-Present); Managing Director: J.P. Morgan (2017-2019); Global Head of M&A: Novartis (2009-2017); Advisory Board Member: Baron Investment Funds Trust and Baron Select Funds (2/2020-5/2020); Trustee: Baron Investment Funds Trust and Baron Select Funds (5/2020-Present). | 18 | None | |||||
| Alejandro (Alex) Yemenidjian(3),(4),(5) 767 Fifth Avenue New York, NY 10153 Age: 65 |
Trustee | 15 years | Chairman and CEO: Tropicana Las Vegas (gaming) (2009-2015); Chairman and CEO: Armenco Holdings, LLC (investment company) (2005-Present); Managing Partner: Armenco Capital LLC (investment company) (2013-Present); Chief Executive Officer: Oshidori International Holdings, Ltd. (2019-Present); Trustee: Baron Investment Funds Trust (2006-Present), Baron Select Funds (2006-Present). | 18 | Director: Guess?, Inc. (2005-Present) | |||||
| Errol Taylor(4),(5) 767 Fifth Avenue New York, NY 10153 Age: 65 |
Trustee | <1 year | Partner: Milbank LLP (2003-2020); Partner and Member Executive Committee (1987-2003); Senior Research Associate: Bristol-Myers Squibb Company (1977-1987). Trustee: Baron Investment Funds Trust and Baron Select Funds (12/2020-Present). | Trustee: New York Law School (2014-Present); Trustee: Clark Atlanta University (2017-Present). | ||||||
| Additional Officers of the Funds |
||||||||||
| Louis Beasley 767 Fifth Avenue New York, NY 10153 Age: 49 |
Vice President and Chief Compliance Officer | 6 years | Chief Compliance Officer: Baron Capital Group, Inc., BAMCO, Inc., Baron Capital Management Inc., Baron Investment Funds Trust, Baron Select Funds, Baron USA Partners Fund, Ltd (2014-Present); Vice President: the Firm* (2014-Present); Principal and Director of Investment Management Compliance and Risk Management: Bessemer Trust (2006-2014). | N/A | N/A | |||||
| Clifford Greenberg 767 Fifth Avenue New York, NY 10153 Age: 62 |
Senior Vice President and co-Chief Investment Officer | 24 years | Director, Senior Vice President and Co-CIO: the Firm*; Senior Vice President: Baron Investment Funds Trust, Baron Select Funds; Portfolio Manager: Baron Small Cap Fund. | N/A | N/A | |||||
| Patrick M. Patalino 767 Fifth Avenue New York, NY 10153 Age: 53 |
Vice President, General Counsel and Secretary | 14 years | Vice President, General Counsel and Secretary: the Firm*, Baron Investment Funds Trust, Baron Select Funds; General Counsel: Baron USA Partners Fund, Ltd. | N/A | N/A | |||||
| Andrew Peck 767 Fifth Avenue New York, NY 10153 Age: 52 |
Senior Vice President and co-Chief Investment Officer | 18 years | Senior Vice President and Co-CIO: the Firm*, Baron Investment Funds Trust, Baron Select Funds; Portfolio Manager: Baron Asset Fund. | N/A | N/A | |||||
| Peggy C. Wong 767 Fifth Avenue New York, NY 10153 Age: 60 |
Treasurer and Chief Financial Officer | 34 years | Chief Financial Officer and Treasurer: the Firm*, Baron Investment Funds Trust, Baron Select Funds. | N/A | N/A | |||||
| * | The “Firm” means BCG along with its subsidiaries BCI, Baron Capital Management, Inc. and BAMCO. |
| (1) | Trustees deemed to be “Interested Trustees” by reason of their employment with the Adviser and BCI. |
| (2) | Members of the Executive Committee, which is empowered to exercise all of the powers, including the power to declare dividends, of the full Board when the full Board is not in session. |
| (3) | Members of the Audit Committee. |
| (4) | Members of the Nominating Committee. |
| (5) | Members of the Independent Trustees Committee. |
63
Privacy Notice
The Funds collect nonpublic personal information about you from the following sources:
| ∎ | Information we receive from you on applications or other forms; |
| ∎ | Information about your transactions with us, our Adviser or others; and |
| ∎ | Information we receive from third parties, such as credit reporting agencies. |
“Nonpublic personal information” is private information about you that we obtain in connection with providing a financial product or service to you.
We may share your name and address with other Baron Funds and the Adviser and its affiliates for the purpose of sending you information about our products that we believe may be of interest to you and informing you of our upcoming Baron Investment Conference and for sending required information.
We do not disclose any nonpublic personal information about our customers to anyone, except as permitted or required by law. Examples of permitted disclosures under the law include sharing with companies that work for us to provide you services, such as the Transfer Agent or mailing house. All such companies that act on our behalf are contractually obligated to keep the information that we provide to them confidential and to use the information only to provide the services that we have asked them to perform for you and us.
We restrict access to nonpublic information about you to those employees who need to know that information to provide products or services to you. We maintain physical, electronic and procedural safeguards to guard your nonpublic personal information.
This privacy notice is also available at all times on the Baron Funds® website, www.BaronFunds.com or by calling 1-800-99BARON.
Go Paperless!
It’s fast, simple and a smart way to help the environment.
Enjoy the speed and convenience of receiving Fund documents electronically.
For more information, and to enroll today, go to www.baronfunds.com/edelivery.
767 Fifth Avenue, 49th Fl.
New York, NY 10153
1.800.99.BARON
212-583-2000
www.BaronFunds.com
SEPTEMBER 30
Item 2. Code of Ethics.
The Registrant has adopted a Code of Ethics for Principal Executive and Senior Financial Officers (the “Code”). Upon request, the Registrant will provide a copy of the Code to any person without charge. To obtain a copy of the Code, please send your request to [email protected] or call 1-800-99BARON (1-800-992-2766).
Item 3. Audit Committee Financial Expert.
The Registrant’s Board of Trustees has determined that the Registrant has three audit committee financial experts serving on its Audit Committee, Raymond Noveck, Alex Yemenidjian, and Thomas J. Folliard. Mr. Noveck, Mr. Yemenidjian, and Mr. Folliard are “independent” for purposes of Item 3(a)(2) of Form N-CSR.
Item 4. Principal Accountant Fees and Services.
The following table shows the fees paid to PricewaterhouseCoopers, LLP, the Registrant’s principal accounting firm during the fiscal years ended September 30, 2021 and September 30, 2020:
| (a) | Audit Fees: for professional services rendered for the audit of the Registrant’s annual financial statements or services that are normally provided in connection with statutory and regulatory filings or engagements: |
| 2021 | 2020 | |||||||
| Baron Investment Funds Trust |
$ | 323,229 | $ | 333,960 | ||||
| (b) | Audit-Related Fees: for assurance and related services that are reasonably related to the performance of the audit and are not included as Audit Fees: |
| 2021 | 2020 | |||||||
| Baron Investment Funds Trust |
$ | 0 | $ | 0 | ||||
| (c) | Tax Fees: for professional services rendered for tax compliance, tax advice and tax planning: |
| 2021 | 2020 | |||||||
| Baron Investment Funds Trust |
$ | 93,978 | $ | 103,973 | ||||
The Tax Fees represent services provided in connection with the preparation of tax returns and year-end distribution review.
| (d) | All Other Fees: for products and services provided by such accounting firm that are not included in (a), (b) or (c) above: |
| 2021 | 2020 | |||||||
| Baron Investment Funds Trust |
$ | 0 | $ | 0 | ||||
| e) | Audit Committee Pre-Approval Policies and Procedures: (i) Pursuant to paragraph (c)(7) of Rule 2-01 of Regulation S-X and to its charter, the Audit Committee shall pre-approve all audit and non-audit services provided by the independent auditors and in connection therewith to review and evaluate the qualifications, independence and performance of the Fund’s independent auditors; (ii) 100% of the services described in each of items 4(b) through 4(d) were approved by the Audit Committee pursuant to paragraph (c)(7)(i)(C) of Rule 2-01 of Regulation S-X. |
| (f) | Not Applicable. |
| (g) | The aggregate non-audit fees billed by the registrant’s accountant for services rendered to the registrant, and rendered to the registrant’s investment adviser (not including any sub-adviser whose role is primarily portfolio management and is subcontracted with or overseen by another investment adviser), and any entity controlling, controlled by, or under common control with the adviser that provides ongoing services to the registrant for the last two fiscal years is as follows: |
2021: $34,000
2020: $33,000
Item 5. Audit Committee of Listed Registrants.
The Registrant has a separately-designated standing Audit Committee established in accordance with Section 3(a)(58)(A) of the Securities Exchange Act of 1934. The members of the Audit Committee are Raymond Noveck, Alex Yemenidjian, and Thomas J. Folliard.
Item 6. Schedule of Investments.
Included herein under Item 1.
Item 7. Disclosure of Proxy Voting Policies and Procedures for Closed-End Management Investment Companies.
Not applicable.
Item 8. Portfolio Managers of Closed-End Management Investment Companies.
Not applicable.
Item 9. Purchases of Equity Securities by Closed-End Management Investment Company and Affiliated Purchasers.
Not applicable.
Item 10. Submission of Matters to a Vote of Security Holders.
Not applicable.
Item 11. Controls and Procedures.
(a) The Registrant’s principal executive officer and principal financial officer have concluded that the Registrant’s disclosure controls and procedures (as defined in Rule 30a-3(c) under the Investment Company Act of 1940 (the “1940 Act”)) are effective based on their evaluation of these controls and procedures as of a date within 90 days of the filing date of this report.
(b) There were no changes in the Registrant’s internal control over financial reporting (as defined in Rule 30a-3(d) under the 1940 Act) that occurred during the Registrant’s second fiscal quarter of the period covered by this report that have materially affected, or are reasonably likely to materially affect, the Registrant’s internal control over financial reporting.
Item 12. Exhibits.
(a)(1) Not applicable.
SIGNATURES
Pursuant to the requirements of the Securities Exchange Act of 1934 and the Investment Company Act of 1940, the registrant has duly caused this report to be signed on its behalf by the undersigned, thereunto duly authorized.
| BARON INVESTMENT FUNDS TRUST | ||
| By: | /s/ Ronald Baron | |
| Ronald Baron | ||
| Chief Executive Officer | ||
| Date: December 6, 2021 | ||
Pursuant to the requirements of the Securities Exchange Act of 1934 and the Investment Company Act of 1940, this report has been signed below by the following persons on behalf of the registrant and in the capacities and on the dates indicated.
| By: | /s/ Ronald Baron | |
| Ronald Baron | ||
| Chief Executive Officer | ||
| Date: December 6, 2021 | ||
| By: | /s/ Peggy Wong | |
| Peggy Wong | ||
| Treasurer and Chief Financial Officer | ||
| Date: December 6, 2021 | ||
CERTIFICATION PURSUANT TO SECTION 302
OF
THE SARBANES OXLEY ACT
I, Ronald Baron, certify that:
| 1. | I have reviewed this report on Form N-CSR of Baron Investment Funds Trust; |
| 2. | Based on my knowledge, this report does not contain any untrue statement of a material fact or omit to state a material fact necessary to make the statements made, in light of the circumstances under which such statements were made, not misleading with respect to the period covered by this report; |
| 3. | Based on my knowledge, the financial statements, and other financial information included in this report, fairly present in all material respects the financial condition, results of operations, changes in net assets, and cash flows (if the financial statements are required to include a statement of cash flows) of the registrant as of, and for, the periods presented in this report; |
| 4. | The registrant’s other certifying officer and I are responsible for establishing and maintaining disclosure controls and procedures (as defined in Rule 30a-3(c) under the Investment Company Act of 1940) and internal control over financial reporting (as defined in Rule 30a-3(d) under the Investment Company Act of 1940) for the registrant and have: |
| (a) | Designed such disclosure controls and procedures, or caused such disclosure controls and procedures to be designed under our supervision, to ensure that material information relating to the registrant, including its consolidated subsidiaries, is made known to us by others within those entities, particularly during the period in which this report is being prepared; |
| (b) | Designed such internal control over financial reporting, or caused such internal control over financial reporting to be designed under our supervision, to provide reasonable assurance regarding the reliability of financial reporting and the preparation of financial statements for external purposes in accordance with generally accepted accounting principles; |
| (c) | Evaluated the effectiveness of the registrant’s disclosure controls and procedures and presented in this report our conclusions about the effectiveness of the disclosure controls and procedures, as of a date within 90 days prior to the filing date of this report, based on such evaluation; and |
| (d) | Disclosed in this report any change in the registrant’s internal control over financial reporting that occurred during the period covered by this report that has materially affected, or is reasonably likely to materially affect, the registrant’s internal control over financial reporting; and |
| 5. | The registrant’s other certifying officer and I have disclosed to the registrant’s auditors and the audit committee of the registrant’s board of directors (or persons performing equivalent functions): |
| a) | All significant deficiencies and material weaknesses in the design or operation of internal controls over financial reporting which are reasonably likely to adversely affect the registrant’s ability to record, process, summarize, and report financial information; and |
| b) | Any fraud, whether or not material, that involves management or other employees who have a significant role in the registrant’s internal control over financial reporting. |
| Date: December 6, 2021 |
| /s/ Ronald Baron |
| Ronald Baron Chief Executive Officer |
CERTIFICATION PURSUANT TO SECTION 302
OF
THE SARBANES OXLEY ACT
I, Peggy Wong, certify that:
| 1. | I have reviewed this report on Form N-CSR of Baron Investment Funds Trust; |
| 2. | Based on my knowledge, this report does not contain any untrue statement of a material fact or omit to state a material fact necessary to make the statements made, in light of the circumstances under which such statements were made, not misleading with respect to the period covered by this report; |
| 3. | Based on my knowledge, the financial statements, and other financial information included in this report, fairly present in all material respects the financial condition, results of operations, changes in net assets, and cash flows (if the financial statements are required to include a statement of cash flows) of the registrant as of, and for, the periods presented in this report; |
| 4. | The registrant’s other certifying officer and I are responsible for establishing and maintaining disclosure controls and procedures (as defined in Rule 30a-3(c) under the Investment Company Act of 1940) and internal control over financial reporting (as defined in Rule 30a-3(d) under the Investment Company Act of 1940) for the registrant and have: |
| (a) | Designed such disclosure controls and procedures, or caused such disclosure controls and procedures to be designed under our supervision, to ensure that material information relating to the registrant, including its consolidated subsidiaries, is made known to us by others within those entities, particularly during the period in which this report is being prepared; |
| (b) | Designed such internal control over financial reporting, or caused such internal control over financial reporting to be designed under our supervision, to provide reasonable assurance regarding the reliability of financial reporting and the preparation of financial statements for external purposes in accordance with generally accepted accounting principles; |
| (c) | Evaluated the effectiveness of the registrant’s disclosure controls and procedures and presented in this report our conclusions about the effectiveness of the disclosure controls and procedures, as of a date within 90 days prior to the filing date of this report, based on such evaluation; and |
| (d) | Disclosed in this report any change in the registrant’s internal control over financial reporting that occurred during the period covered by this report that has materially affected, or is reasonably likely to materially affect, the registrant’s internal control over financial reporting; and |
| 5. | The registrant’s other certifying officer and I have disclosed to the registrant’s auditors and the audit committee of the registrant’s board of directors (or persons performing equivalent functions): |
| a) | All significant deficiencies and material weaknesses in the design or operation of internal controls over financial reporting which are reasonably likely to adversely affect the registrant’s ability to record, process, summarize, and report financial information; and |
| b) | Any fraud, whether or not material, that involves management or other employees who have a significant role in the registrant’s internal control over financial reporting. |
| Date: December 6, 2021 |
| /s/ Peggy Wong |
| Peggy Wong |
| Treasurer and Chief Financial Officer |
CERTIFICATION PURSUANT TO SECTION 906
OF
THE SARBANES OXLEY ACT
The undersigned hereby certifies, to the best of his knowledge, that:
1. The Form N-CSR of BARON INVESTMENT FUNDS TRUST (the “Issuer”) and its separate series for the period ended September 30, 2021 (the “Report”) fully complies with the requirements of Section 13(a) or 15(d) of the Securities Exchange Act of 1934, as applicable; and
2. The information contained in the Report fairly presents, in all material respects, the financial condition and results of operations of the Issuer.
| By: | /s/ Ronald Baron |
Date: December 6, 2021 | ||||
| Ronald Baron Chief Executive Officer |
CERTIFICATION PURSUANT TO SECTION 906
OF
THE SARBANES OXLEY ACT
The undersigned hereby certifies, to the best of her knowledge, that:
1. The Form N-CSR of BARON INVESTMENT FUNDS TRUST (the “Issuer”) and its separate series for the period ended September 30, 2021 (the “Report”) fully complies with the requirements of Section 13(a) or 15(d) of the Securities Exchange Act of 1934, as applicable; and
2. The information contained in the Report fairly presents, in all material respects, the financial condition and results of operations of the Issuer.
| By: | /s/ Peggy Wong |
Date: December 6, 2021 | ||||
| Peggy Wong Treasurer and Chief Financial Officer |
Serious News for Serious Traders! Try StreetInsider.com Premium Free!
You May Also Be Interested In
- Compelling Coarse Ore Flotation Results Indicate Throughput Upside for Kharmagtai
- Cambridge Bancorp Announces First Quarter 2024 Results and Declares Quarterly Dividend
- Cyngn Joins John Deere Supply Base
Create E-mail Alert Related Categories
SEC FilingsSign up for StreetInsider Free!
Receive full access to all new and archived articles, unlimited portfolio tracking, e-mail alerts, custom newswires and RSS feeds - and more!
