

Form N-CSR AMERICAN FUNDS SHORT-TER For: Jul 31
 Tweet
Tweet Share
ShareUNITED STATES
SECURITIES AND EXCHANGE COMMISSION
Washington, D.C. 20549
FORM N-CSR
Certified Shareholder Report of
Registered Management Investment Companies
Investment Company Act File Number: 811-05750
American Funds Short-Term Tax-Exempt Bond Fund
(Exact Name of Registrant as Specified in Charter)
333 South Hope Street
Los Angeles, California 90071
(Address of Principal Executive Offices)
Registrant's telephone number, including area code: (213) 486-9200
Date of fiscal year end: July 31
Date of reporting period: July 31, 2018
Steven I. Koszalka
American Funds Short-Term Tax-Exempt Bond Fund
333 South Hope Street
Los Angeles, California 90071
(Name and Address of Agent for Service)
ITEM 1 – Reports to Stockholders
|
American Funds Short-Term Tax-Exempt Bond Fund® |
|
| Annual reports for the year ended July 31, 2018 |

Invest in
municipal bonds
for tax-advantaged
income.
American Funds Short-Term Tax-Exempt Bond Fund seeks to provide current income exempt from regular federal income tax, consistent with the maturity and quality standards described in the prospectus, and to preserve capital.
Limited Term Tax-Exempt Bond Fund of America seeks to provide current income exempt from regular federal income tax, consistent with the maturity and quality standards described in the prospectus, and to preserve capital.
The Tax-Exempt Bond Fund of America seeks to provide a high level of current income exempt from federal income tax, consistent with the preservation of capital.
American High-Income Municipal Bond Fund seeks to provide a high level of current income exempt from regular federal income tax.
The Tax-Exempt Fund of California seeks to provide a high level of current income exempt from regular federal and California state income taxes. Its secondary objective is preservation of capital.
American Funds Tax-Exempt Fund of New York seeks to provide a high level of current income exempt from regular federal, New York state and New York City income taxes. Its secondary objective is preservation of capital.
Each fund is one of more than 40 offered by Capital Group, home of American Funds, one of the nation’s largest mutual fund families. For more than 85 years, Capital Group has invested with a long-term focus based on thorough research and attention to risk.
Fund results shown in this report, unless otherwise indicated, are for Class A shares at net asset value. If a sales charge had been deducted (maximum 2.50% for American Funds Short-Term Tax-Exempt Bond Fund and Limited Term Tax-Exempt Bond Fund of America; 3.75% for The Tax-Exempt Bond Fund of America, American High-Income Municipal Bond Fund, The Tax-Exempt Fund of California and American Funds Tax-Exempt Fund of New York), the results would have been lower. Results are for past periods and are not predictive of results for future periods. Current and future results may be lower or higher than those shown. Share prices and returns will vary, so investors may lose money. Investing for short periods makes losses more likely. For current information and month-end results, visit americanfunds.com.
Here are the total returns on a $1,000 investment with all distributions reinvested for periods ended June 30, 2018 (the most recent calendar quarter-end), and the total annual fund operating expense ratios as of the prospectus dated October 1, 2018 (unaudited):
| Cumulative total returns | Average annual total returns | Gross | ||||||||||||||
| Class A shares | 1 year | 5 years | 10 years/Lifetime* | expense ratios | ||||||||||||
| Reflecting 2.50% maximum sales charge | ||||||||||||||||
| American Funds Short-Term Tax-Exempt Bond Fund | –2.18 | % | 0.25 | % | 0.83 | % | .58 | % | ||||||||
| Limited Term Tax-Exempt Bond Fund of America | –1.84 | 1.14 | 2.71 | .59 | ||||||||||||
| Reflecting 3.75% maximum sales charge | ||||||||||||||||
| The Tax-Exempt Bond Fund of America | –1.71 | 2.82 | 3.92 | .52 | ||||||||||||
| American High-Income Municipal Bond Fund | 0.55 | 4.66 | 5.08 | .68 | ||||||||||||
| The Tax-Exempt Fund of California | –1.56 | 3.10 | 4.37 | .60 | ||||||||||||
| American Funds Tax-Exempt Fund of New York | –2.50 | 2.44 | 3.09 | .72 | † | |||||||||||
| * | Applicable only to American Funds Tax-Exempt Fund of New York, which began operations on 11/1/10. All other funds reflect 10-year results. |
| † | The net expense ratio for American Funds Tax-Exempt Fund of New York is .68% as of the prospectus dated October 1, 2018 (unaudited). |
For other share class results, visit americanfunds.com.
The 10-year investment result for American Funds Short-Term Tax-Exempt Bond Fund includes the fund’s results as a money market fund through the date of its conversion (August 7, 2009) to a short-term tax-exempt bond fund, and therefore is not representative of the fund’s results had it operated as a short-term tax-exempt bond fund for the full term of that period. Investment results assume all distributions are reinvested and reflect applicable fees and expenses. When applicable, investment results reflect fee waivers and/or expense reimbursements, without which results would have been lower. The investment adviser is currently reimbursing a portion of other expenses for American Funds Tax-Exempt Fund of New York. Investment results and the net expense ratio reflect the reimbursement, without which the results would have been lower and the expense ratio would have been higher. This reimbursement will be in effect through at least October 1, 2019, unless modified or terminated by the fund’s board. The adviser may elect at its discretion to extend, modify or terminate the reimbursement at that time. Visit americanfunds.com for more information.
A summary of each fund’s 30-day yield can be found on page 3.
Investments are not FDIC-insured, nor are they deposits of or guaranteed by a bank or any other entity, so they may lose value.
We are pleased to present this report for American Funds Short-Term Tax-Exempt Bond Fund, Limited Term Tax-Exempt Bond Fund of America, The Tax-Exempt Bond Fund of America, American High-Income Municipal Bond Fund, The Tax-Exempt Fund of California and American Funds Tax-Exempt Fund of New York. It covers the 12-month period ended July 31, 2018, the conclusion of the funds’ fiscal year.
Rising interest rates, investor enthusiasm for riskier assets and uncertainty about the implications of tax reform weighed on the municipal bond market over the period. Yet in spite of this, tax-exempt bond prices generally finished higher, and all six funds generated positive results. Total returns ranged from 4.05% for American High-Income Municipal Bond Fund to 0.24% for American Funds Short-Term Tax-Exempt Bond Fund. (See pages 4 through 16 for fund specific results and information.)
Economic and market overview
Municipal bond yields rose modestly during the funds’ fiscal year, but total returns outpaced the broader taxable fixed income market. Signs of emerging inflation and uncertainty around global trade policy sparked bouts of volatility. In taxable fixed income markets, bond prices fell on pressure from interest rate hikes and signs of higher inflation amid robust U.S. economic growth. The yield on the benchmark 10-year Treasury note climbed 66 basis points to end the period at 2.96%. At the end of April it briefly drifted above 3% for the first time in four years. By way of comparison, the yield on AAA-rated municipal bonds, as measured by Bloomberg Valuation Service (BVAL), rose 60 basis points to 2.49%.
The U.S. economy grew 4.1% in the second quarter, powered by strong exports and a rebound in consumer spending. The unemployment rate hit 3.8% in May, matching the lowest reading in nearly 50 years. This tight labor market helped to push wages to their highest average growth in a decade. There were also signs of inflation picking up. At 2.9% year-over-year in June, the Consumer Price Index (CPI) hit a level not seen since 2012. Core CPI, which removes volatile food and energy prices, rose to 2.2%. The Federal Reserve continued to reduce its balance sheet. However, the central bank also increased sales of Treasury bonds to help fund the federal deficit. As expected, it raised the federal funds rate by 25 basis points in June to a range of 1.75% to 2.00%, its second hike of the year. Chairman Jay Powell continued to stress that rate increases would be gradual.
The passage of the Tax Cuts and Jobs Act of 2017 (TCJA) in December fueled municipal market instability early in 2018 as investors grappled with its potential impact on tax-exempt bonds. The legislation also resulted in distortions in supply-and-demand dynamics in the municipal market. One provision eliminated the tax-exempt status for advance refunding bonds, which local governments utilize to reduce their interest rate expenses. Municipal bond issuance set a new single-month record last December, as local governments sought to issue before the law took effect. The $62.5 billion in offerings surpassed the old record of $54.7 billion set in December 1985, just prior to the last comprehensive tax overhaul. Since the start of the year, however, issuance has declined substantially. As of June 30, municipal bond issuance was $161 billion, about 20% lower than the $201 billion issued in the first half of 2017.
Demand for municipal bonds has been generally solid since January. Year-to-date fund inflows stood at about $13.7 billion at the end of July, according to data from the Investment Company Institute. This demand, coupled with lower supply, resulted in tighter spreads, which helped
| American Funds Tax-Exempt Funds | 1 |
drive the positive market return. Municipal bonds of lower credit quality recorded the strongest gains of the period, as reflected in the 6.82% increase posted by the Barclays High Yield Municipal Bond Index (a market value-weighted index composed of municipal bonds rated below BBB/Baa). By comparison, the Barclays Municipal Bond Index, a broad measure of the investment-grade market (bonds rated BBB/Baa and above), advanced 0.99%.
Inside the portfolios
The funds covered in this report continued to focus chiefly on revenue bonds, which support essential services such as water, sewer and electric utilities. This approach proved additive, as revenue bonds produced higher returns than general obligation bonds overall. As has been the case for a number of years — given much tighter spreads across the municipal curve, the stronger economy and rising rates — most of the funds took a relatively conservative approach to the market, maintaining comparatively short duration positions and focusing on bonds of higher quality.
Looking ahead
With the economy healthy and the Fed proceeding with rate hikes, we expect a more challenging environment going forward. We are preparing for muted returns and further volatility. Any increase in supply could put some downward pressure on valuations. After a strong rally in 2017, the municipal bond market has continued to deliver positive results, particularly among higher yielding bonds. In contrast to the taxable market, spreads have gotten increasingly tighter. Given what is in our view limited reward potential for taking additional risk at this point in the market cycle, we are focusing on higher quality bonds across the portfolios.
That said, while broader interest rate moves may create instability in munis, we continue to identify what we believe are promising investment opportunities, chiefly with respect to revenue bond issuers in sectors such as not-for-profit hospitals, transportation, housing and education. Lastly, despite the tax cuts, the after-tax income potential of municipal bonds remains compelling, and we believe municipal bond funds can continue to play a key role in diversified portfolios.
We thank you for the confidence you have placed in us and endeavor to be responsible stewards of your capital.
We look forward to reporting to you again in six months’ time.
Sincerely,

Neil L. Langberg
President, American Funds Short-Term Tax-Exempt Bond Fund, Limited Term Tax-Exempt Bond Fund of America and The Tax-Exempt Fund of California

Chad M. Rach
President, American High-Income Municipal Bond Fund

Jerome H. Solomon
President, American Funds Tax-Exempt Fund of New York

Karl J. Zeile
President, The Tax-Exempt Bond Fund of America
September 13, 2018
For current information about the funds, visit americanfunds.com.
The market indexes shown are unmanaged and, therefore, have no expenses. Investors cannot invest directly in an index. Bloomberg Barclays source: Bloomberg Index Services Ltd.
| 2 | American Funds Tax-Exempt Funds |
Funds’ 30-day yields
Below is a summary of each fund’s 30-day yield and 12-month distribution rate for Class A shares as of August 31, 2018. Both measures reflect the 2.50%/3.75% maximum sales charge. Each fund’s 30-day yield is calculated in accordance with the U.S. Securities and Exchange Commission (SEC) formula. The SEC yield reflects the rate at which each fund is earning income on its current portfolio of securities while the distribution rate reflects the funds’ past dividends paid to shareholders. Accordingly, the funds’ SEC yields and distribution rates may differ. The equivalent taxable yield assumes a 43.4% tax rate.1
| Class A shares | SEC 30-day yield | Equivalent taxable yield | 12-month distribution rate | |||||||||
| Reflecting 2.50% maximum sales charge | ||||||||||||
| American Funds Short-Term Tax-Exempt Bond Fund | 1.52 | % | 2.69 | % | 1.32 | % | ||||||
| Limited Term Tax-Exempt Bond Fund of America | 1.73 | 3.06 | 1.96 | |||||||||
| Reflecting 3.75% maximum sales charge | ||||||||||||
| The Tax-Exempt Bond Fund of America | 2.27 | 4.01 | 2.80 | |||||||||
| American High-Income Municipal Bond Fund | 2.92 | 5.16 | 3.52 | |||||||||
| The Tax-Exempt Fund of California | 1.85 | 4.03 | 2 | 2.80 | ||||||||
| American Funds Tax-Exempt Fund of New York | 2.02 | 4.01 | 3 | 2.46 | ||||||||
| 1 | Based on 2018 federal tax rates. For the year 2018, there will be an Unearned Income Medicare Contribution Tax of 3.8% that applies to net investment income for taxpayers whose modified adjusted gross income exceeds $200,000 (for single filers) and $250,000 (for married filing jointly). Thus taxpayers in the highest tax bracket will face a combined 40.8% marginal tax rate on their investment income. The federal rates do not include an adjustment for the loss of personal exemptions and the phaseout of itemized deductions that are applicable to certain taxable income levels. |
| 2 | For investors in the 54.10% federal and California state tax bracket. |
| 3 | For investors in the 49.62% federal, New York state and New York City tax bracket. |
The return of principal for bond funds and for funds with significant underlying bond holdings is not guaranteed. Fund shares are subject to the same interest rate, inflation and credit risks associated with the underlying bond holdings. Income may be subject to state or local income taxes and/or federal alternative minimum taxes. Also, certain other income (such as distributions from gains on the sale of certain bonds purchased at less than par value, for The Tax-Exempt Bond Fund of America), as well as capital gain distributions, may be taxable. High-yield/lower rated bonds are subject to greater fluctuations in value and risk of loss of income and principal than investment-grade/higher rated bonds. The Tax-Exempt Fund of California and American Funds Tax-Exempt Fund of New York are more susceptible to factors adversely affecting issuers of each state’s tax-exempt securities than a more widely diversified municipal bond fund. Refer to the funds’ prospectus and the Risk Factors section of this report for more information on these and other risks associated with investing in the funds.
| American Funds Tax-Exempt Funds | 3 |
American Funds Short-Term Tax-Exempt Bond Fund
The fund registered a total return of 0.24% for the fiscal year, trailing the 0.48% return of the Bloomberg Barclays Municipal Short 1–5 Years Index, a market value-weighted index that includes investment-grade tax-exempt bonds (rated BBB/Baa and above) with maturities of one to five years. The fund also lagged the Lipper Short Municipal Debt Funds Average, a peer group measure, which recorded a 0.61% return.
The fund paid monthly dividends totaling 13 cents a share for the 12 months. This amounts to a federally tax-exempt income return of 1.33% for investors who reinvested dividends. This is equivalent to a taxable income return of 2.25% for investors in the 40.8%1 maximum federal tax bracket. A portion of the fund’s return also may be exempt from some state and local taxes.
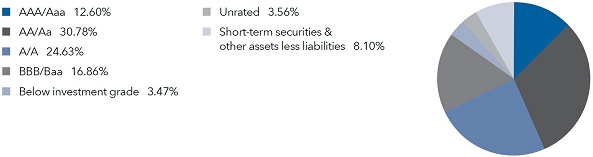
In a period of rising rates and tightening credit spreads, the fund’s managers maintained a conservative approach to the market, focusing on higher quality bonds. As of July 31, 2018, some 74% of the portfolio was invested in bonds rated AAA/Aaa or AA/Aa. Among the fund’s largest contributors were revenue bonds supporting toll roads and hospital facilities.
The market index is unmanaged and, therefore, has no expenses. Investors cannot invest directly in an index. Bloomberg Barclays source: Bloomberg Index Services Ltd. Lipper averages reflect the current composition of all eligible mutual funds (all share classes) within a given category. Lipper source: Thomson Reuters Lipper. Lipper categories are dynamic and averages may have few funds, especially over longer periods. To see the number of funds included in the Lipper category for each fund’s lifetime, please view the Quarterly Statistical Update, available at americanfunds.com.
Tax-exempt yields vs. taxable yields
Find your estimated taxable income below to determine your federal tax rate,2 then look in the far right column to see what you would have had to earn from a taxable investment to equal the fund’s 1.30% tax-exempt distribution rate3 as of July 31, 2018.
| If your taxable income is … | … then your federal | The fund’s tax-exempt distribution rate of 1.30% is | ||||||||||||||
| Single | Joint | tax rate is … | equivalent to a taxable rate of … | |||||||||||||
| $ | 0 – | 9,525 | $ | 0 – | 19,050 | 10.0 | % | 1.44 | % | |||||||
| 9,526 – | 38,700 | 19,051 – | 77,400 | 12.0 | 1.48 | |||||||||||
| 38,701 – | 82,500 | 77,401 – | 165,000 | 22.0 | 1.67 | |||||||||||
| 82,501 – | 157,500 | 165,001 – | 250,000 | 24.0 | 1.71 | |||||||||||
| – | 250,001 – | 315,000 | 27.8 | 1 | 1.80 | |||||||||||
| 157,501 – | 200,000 | – | 32.0 | 1.91 | ||||||||||||
| – | 315,001 – | 400,000 | 35.8 | 1 | 2.02 | |||||||||||
| 200,001 – | 500,000 | 400,001 – | 600,000 | 38.8 | 1 | 2.12 | ||||||||||
| Over 500,000 | Over 600,000 | 40.8 | 1 | 2.20 | ||||||||||||
| 1 | For the year 2018, there will be an Unearned Income Medicare Contribution Tax of 3.8% that applies to net investment income for taxpayers whose modified adjusted gross income exceeds $200,000 (for single filers) and $250,000 (for married filing jointly). Thus taxpayers in the highest tax bracket will face a combined 40.8% marginal tax rate on their investment income. |
| 2 | Based on 2018 federal tax rates. The federal rates do not include an adjustment for the loss of personal exemptions and the phaseout of itemized deductions that are applicable to certain taxable income levels. |
| 3 | The distribution rate is based on dividends paid over the last 12 months divided by the maximum offering price as of July 31, 2018. Capital gain distributions, if any, are added back at the maximum offering price to determine the rate. |
Fund results shown on the following page are for Class A shares and, unless otherwise indicated, reflect deduction of the maximum sales charge of 2.50% on the $10,000 investment.1 Thus, the net amount invested was $9,750. Results are for past periods and are not predictive of results for future periods. Current and future results may be lower or higher than those shown. Share prices and returns will vary, so investors may lose money. For current information and month-end results, visit americanfunds.com.
| 4 | American Funds Tax-Exempt Funds |
How a $10,000 investment has grown
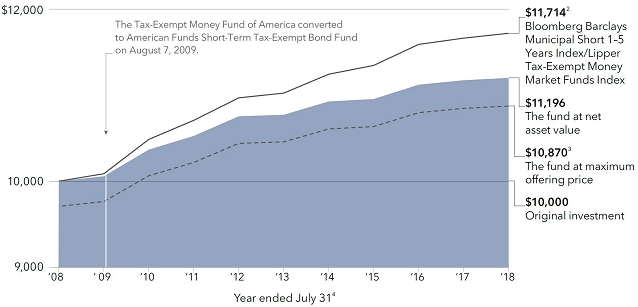
| 1 | As outlined in the prospectus, the sales charge is reduced for accounts (and aggregated investments) of $500,000 or more and is eliminated for purchases of $1 million or more. There is no sales charge on dividends or capital gain distributions that are reinvested in additional shares. |
| 2 | Consists of the Lipper Tax-Exempt Money Market Funds Index through July 31, 2009 (the period ended prior to the fund’s conversion from a tax-exempt money market fund to a short-term tax-exempt bond fund), and the Bloomberg Barclays Municipal Short 1–5 Years Index thereafter. Results of the Lipper Tax-Exempt Money Market Funds Index do not reflect any sales charges. Source: Thomson Reuters Lipper. The Bloomberg Barclays index is unmanaged and, therefore, has no expenses. Investors cannot invest directly in an index. Bloomberg Barclays source: Bloomberg Index Services Ltd. |
| 3 | Prior to August 7, 2009, the fund was operated as a money market fund and did not have an initial sales charge. |
| 4 | In 2009, the fund changed its fiscal year-end from September 30 to July 31. |
The results shown are before taxes on fund distributions and sale of fund shares.
Average annual total returns based on a $1,000 investment
For periods ended July 31, 2018*
| 1 year | 5 years | 10 years | ||||
| Class A shares | –2.26% | 0.28% | 0.84% |
| * | Assumes reinvestment of all distributions and payment of the maximum 2.50% sales charge. |
The 10-year investment result includes the fund’s results as a money market fund through the date of its conversion (August 7, 2009) to a short-term tax-exempt bond fund, and therefore is not representative of the fund’s results had it operated as a short-term tax-exempt bond fund for the full term of that period. Investment results assume all distributions are reinvested and reflect applicable fees and expenses. When applicable, investment results reflect expense reimbursements, without which results would have been lower. Visit americanfunds.com for more information.
Portfolio quality summary*
Percent of net assets
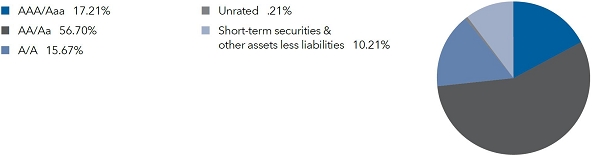
| * | Bond ratings, which typically range from AAA/Aaa (highest) to D (lowest), are assigned by credit rating agencies such as Standard & Poor’s, Moody’s and/or Fitch as an indication of an issuer’s creditworthiness. In assigning a credit rating to a security, the fund looks specifically to the ratings assigned to the issuer of the security by Standard & Poor’s, Moody’s and/or Fitch. If agency ratings differ, the security will be considered to have received the highest of those ratings, consistent with the fund’s investment policies. Securities in the “unrated” category (above) have not been rated by a rating agency; however, the investment adviser performs its own credit analysis and assigns comparable ratings that are used for compliance with the fund’s investment policies. The ratings are not covered by the Report of Independent Registered Public Accounting Firm. |
| American Funds Tax-Exempt Funds | 5 |
Limited Term Tax-Exempt Bond Fund of America
The fund generated a total return of 0.40% for the 12 months ended July 31. It outpaced the Bloomberg Barclays Municipal Short-Intermediate 1–10 Years Index, a market value-weighted index that includes investment-grade tax-exempt bonds (rated BBB/Baa and above) with maturities of one to 10 years, which rose 0.21%. The fund also bested the 0.39% return of the Lipper Short-Intermediate Municipal Debt Funds Average, a peer group measure.
The fund paid monthly dividends totaling 31 cents a share for the fiscal year. Those individuals who reinvested dividends received a federally tax-exempt income return of 2.00%. This is equivalent to a taxable income return of 3.38% for investors in the 40.8%1 maximum federal tax bracket.
The fund’s managers positioned the portfolio fairly conservatively, seeking to maintain a relatively short duration. This approach helped the fund outpace the broader market, particularly during the first half of the period when the yield curve flattened somewhat. As of July 31, 2018, 55.1% of the portfolio was invested in bonds rated AAA/Aaa or AA/Aa.
The market index is unmanaged and, therefore, has no expenses. Investors cannot invest directly in an index. Bloomberg Barclays source: Bloomberg Index Services Ltd. Lipper averages reflect the current composition of all eligible mutual funds (all share classes) within a given category. Lipper source: Thomson Reuters Lipper. Lipper categories are dynamic and averages may have few funds, especially over longer periods. To see the number of funds included in the Lipper category for each fund’s lifetime, please view the Quarterly Statistical Update, available at americanfunds.com.
Tax-exempt yields vs. taxable yields
Find your estimated taxable income below to determine your federal tax rate,2 then look in the far right column to see what you would have had to earn from a taxable investment to equal the fund’s 1.96% tax-exempt distribution rate3 as of July 31, 2018.
| If your taxable income is … | … then your federal | The fund’s tax-exempt distribution rate of 1.96% is | ||||||||||||||
| Single | Joint | tax rate is … | equivalent to a taxable rate of … | |||||||||||||
| $ | 0 – | 9,525 | $ | 0 – | 19,050 | 10.0 | % | 2.18 | % | |||||||
| 9,526 – | 38,700 | 19,051 – | 77,400 | 12.0 | 2.23 | |||||||||||
| 38,701 – | 82,500 | 77,401 – | 165,000 | 22.0 | 2.51 | |||||||||||
| 82,501 – | 157,500 | 165,001 – | 250,000 | 24.0 | 2.58 | |||||||||||
| – | 250,001 – | 315,000 | 27.8 | 1 | 2.71 | |||||||||||
| 157,501 – | 200,000 | – | 32.0 | 2.88 | ||||||||||||
| – | 315,001 – | 400,000 | 35.8 | 1 | 3.05 | |||||||||||
| 200,001 – | 500,000 | 400,001 – | 600,000 | 38.8 | 1 | 3.20 | ||||||||||
| Over 500,000 | Over 600,000 | 40.8 | 1 | 3.31 | ||||||||||||
| 1 | For the year 2018, there will be an Unearned Income Medicare Contribution Tax of 3.8% that applies to net investment income for taxpayers whose modified adjusted gross income exceeds $200,000 (for single filers) and $250,000 (for married filing jointly). Thus taxpayers in the highest tax bracket will face a combined 40.8% marginal tax rate on their investment income. |
| 2 | Based on 2018 federal tax rates. The federal rates do not include an adjustment for the loss of personal exemptions and the phaseout of itemized deductions that are applicable to certain taxable income levels. |
| 3 | The distribution rate is based on dividends paid over the last 12 months divided by the maximum offering price as of July 31, 2018. Capital gain distributions, if any, are added back at the maximum offering price to determine the rate. |
Fund results shown on the following page are for Class A shares and, unless otherwise indicated, reflect deduction of the maximum sales charge of 2.50% on the $10,000 investment.* Thus, the net amount invested was $9,750. Results are for past periods and are not predictive of results for future periods. Current and future results may be lower or higher than those shown. Share prices and returns will vary, so investors may lose money. For current information and month-end results, visit americanfunds.com.
| 6 | American Funds Tax-Exempt Funds |
How a $10,000 investment has grown

| * | As outlined in the prospectus, the sales charge is reduced for accounts (and aggregated investments) of $500,000 or more and is eliminated for purchases of $1 million or more. There is no sales charge on dividends or capital gain distributions that are reinvested in additional shares. |
| † | The index is unmanaged and, therefore, has no expenses. Investors cannot invest directly in an index. Bloomberg Barclays source: Bloomberg Index Services Ltd. |
The results shown are before taxes on fund distributions and sale of fund shares.
Average annual total returns based on a $1,000 investment
For periods ended July 31, 2018*
| 1 year | 5 years | 10 years | ||||
| Class A shares | –2.09% | 1.18% | 2.68% |
| * | Assumes reinvestment of all distributions and payment of the maximum 2.50% sales charge. |
Investment results assume all distributions are reinvested and reflect applicable fees and expenses. When applicable, investment results reflect fee waivers, without which results would have been lower. Visit americanfunds.com for more information.
Portfolio quality summary*
Percent of net assets

| * | Bond ratings, which typically range from AAA/Aaa (highest) to D (lowest), are assigned by credit rating agencies such as Standard & Poor’s, Moody’s and/or Fitch as an indication of an issuer’s creditworthiness. In assigning a credit rating to a security, the fund looks specifically to the ratings assigned to the issuer of the security by Standard & Poor’s, Moody’s and/or Fitch. If agency ratings differ, the security will be considered to have received the highest of those ratings, consistent with the fund’s investment policies. Securities in the “unrated” category (above) have not been rated by a rating agency; however, the investment adviser performs its own credit analysis and assigns comparable ratings that are used for compliance with the fund’s investment policies. The ratings are not covered by the Report of Independent Registered Public Accounting Firm. |
| American Funds Tax-Exempt Funds | 7 |
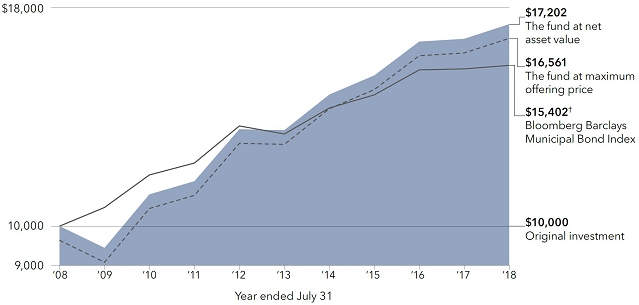
The Tax-Exempt Bond Fund of America
The fund produced a 1.60% total return for the fiscal year, significantly beating the 0.99% return of the Bloomberg Barclays Municipal Bond Index, a market value-weighted index designed to represent the long-term investment-grade (bonds rated BBB/Baa and above) tax-exempt bond market. It also surpassed the 1.48% total return of the Lipper General & Insured Municipal Debt Funds Average, a peer group measure.
For the fiscal year, the fund paid monthly dividends totaling about 38 cents a share, amounting to a federally tax-exempt income return of 2.93% for investors who reinvested dividends. This is equivalent to a taxable income return of 4.95% for investors in the 40.8%1 maximum federal tax bracket. The fund does not invest in bonds subject to the Alternative Minimum Tax (AMT).
The fund’s managers took a relatively conservative approach to the market, seeking to carefully manage interest rate exposure. This approach helped the fund outpace the broader market, particularly during the first half of the period when the yield curve flattened somewhat. At the close of the period approximately 85% of the portfolio consisted of revenue bonds. Among the largest concentrations were holdings backing health care and transportation initiatives.
The market index is unmanaged and, therefore, has no expenses. Investors cannot invest directly in an index. Bloomberg Barclays source: Bloomberg Index Services Ltd. Lipper averages reflect the current composition of all eligible mutual funds (all share classes) within a given category. Lipper source: Thomson Reuters Lipper. Lipper categories are dynamic and averages may have few funds, especially over longer periods. To see the number of funds included in the Lipper category for each fund’s lifetime, please view the Quarterly Statistical Update, available at americanfunds.com.
Tax-exempt yields vs. taxable yields
Find your estimated taxable income below to determine your federal tax rate,2 then look in the far right column to see what you would have had to earn from a taxable investment to equal the fund’s 2.82% tax-exempt distribution rate3 as of July 31, 2018.
| If your taxable income is … | … then your federal | The fund’s tax-exempt distribution rate of 2.82% is | ||||||||||||||
| Single | Joint | tax rate is … | equivalent to a taxable rate of … | |||||||||||||
| $ | 0 – | 9,525 | $ | 0 – | 19,050 | 10.0 | % | 3.13 | % | |||||||
| 9,526 – | 38,700 | 19,051 – | 77,400 | 12.0 | 3.20 | |||||||||||
| 38,701 – | 82,500 | 77,401 – | 165,000 | 22.0 | 3.62 | |||||||||||
| 82,501 – | 157,500 | 165,001 – | 250,000 | 24.0 | 3.71 | |||||||||||
| – | 250,001 – | 315,000 | 27.8 | 1 | 3.91 | |||||||||||
| 157,501 – | 200,000 | – | 32.0 | 4.15 | ||||||||||||
| – | 315,001 – | 400,000 | 35.8 | 1 | 4.39 | |||||||||||
| 200,001 – | 500,000 | 400,001 – | 600,000 | 38.8 | 1 | 4.61 | ||||||||||
| Over 500,000 | Over 600,000 | 40.8 | 1 | 4.76 | ||||||||||||
| 1 | For the year 2018, there will be an Unearned Income Medicare Contribution Tax of 3.8% that applies to net investment income for taxpayers whose modified adjusted gross income exceeds $200,000 (for single filers) and $250,000 (for married filing jointly). Thus taxpayers in the highest tax bracket will face a combined 40.8% marginal tax rate on their investment income. |
| 2 | Based on 2018 federal tax rates. The federal rates do not include an adjustment for the loss of personal exemptions and the phaseout of itemized deductions that are applicable to certain taxable income levels. |
| 3 | The distribution rate is based on dividends paid over the last 12 months divided by the maximum offering price as of July 31, 2018. Capital gain distributions, if any, are added back at the maximum offering price to determine the rate. |
Fund results shown on the following page are for Class A shares and, unless otherwise indicated, reflect deduction of the maximum sales charge of 3.75% on the $10,000 investment.* Thus, the net amount invested was $9,625. Results are for past periods and are not predictive of results for future periods. Current and future results may be lower or higher than those shown. Share prices and returns will vary, so investors may lose money. For current information and month-end results, visit americanfunds.com.
| 8 | American Funds Tax-Exempt Funds |
How a $10,000 investment has grown
![]()
| * | As outlined in the prospectus, the sales charge is reduced for accounts (and aggregated investments) of $100,000 or more and is eliminated for purchases of $1 million or more. There is no sales charge on dividends or capital gain distributions that are reinvested in additional shares. |
| † | The index is unmanaged and, therefore, has no expenses. Investors cannot invest directly in an index. Bloomberg Barclays source: Bloomberg Index Services Ltd. |
The results shown are before taxes on fund distributions and sale of fund shares.
Average annual total returns based on a $1,000 investment
For periods ended July 31, 2018*
| 1 year | 5 years | 10 years | ||||
| Class A shares | –2.24% | 3.06% | 3.92% |
| * | Assumes reinvestment of all distributions and payment of the maximum 3.75% sales charge. |
Investment results assume all distributions are reinvested and reflect applicable fees and expenses. When applicable, investment results reflect fee waivers, without which results would have been lower. Visit americanfunds.com for more information.
Portfolio quality summary*
Percent of net assets

| * | Bond ratings, which typically range from AAA/Aaa (highest) to D (lowest), are assigned by credit rating agencies such as Standard & Poor’s, Moody’s and/or Fitch as an indication of an issuer’s creditworthiness. In assigning a credit rating to a security, the fund looks specifically to the ratings assigned to the issuer of the security by Standard & Poor’s, Moody’s and/or Fitch. If agency ratings differ, the security will be considered to have received the highest of those ratings, consistent with the fund’s investment policies. Securities in the “unrated” category (above) have not been rated by a rating agency; however, the investment adviser performs its own credit analysis and assigns comparable ratings that are used for compliance with the fund’s investment policies. The ratings are not covered by the Report of Independent Registered Public Accounting Firm. |
| American Funds Tax-Exempt Funds | 9 |
American High-Income Municipal Bond Fund
The fund produced a total return of 4.05% for the fiscal year, exceeding the 0.99% return of the Bloomberg Barclays Municipal Bond Index, a measure of the investment-grade municipal market. The fund, which seeks to provide a high level of tax-exempt income by investing in both high-yield and investment-grade municipal bonds, also bettered the 3.97% return of the Lipper High Yield Municipal Debt Funds Average (a peer group measure). However, the fund couldn’t match the 6.82% gain of the Bloomberg Barclays High Yield Municipal Bond Index (a market value-weighted index composed of municipal bonds rated below BBB/Baa).
For the 12 months, the fund paid monthly dividends totaling about 58 cents a share, amounting to a federally tax-exempt income return of 3.74% for investors who reinvested dividends. This is equivalent to a taxable income return of 6.32% for investors in the 40.8%1 maximum federal tax bracket. A portion of the fund’s return also may be exempt from some state and local taxes.
Over a period that saw high-yield municipal bonds outpace the broader tax-exempt market, the fund’s return was solid. However, a relatively light concentration in Puerto Rico- and Virgin Islands-backed issues dampened the fund’s total return on a relative basis.
The market indexes are unmanaged and, therefore, have no expenses. Investors cannot invest directly in an index. Bloomberg Barclays source: Bloomberg Index Services Ltd. Lipper averages reflect the current composition of all eligible mutual funds (all share classes) within a given category. Lipper source: Thomson Reuters Lipper. Lipper categories are dynamic and averages may have few funds, especially over longer periods. To see the number of funds included in the Lipper category for each fund’s lifetime, please view the Quarterly Statistical Update, available at americanfunds.com.
Tax-exempt yields vs. taxable yields
Find your estimated taxable income below to determine your federal tax rate,2 then look in the far right column to see what you would have had to earn from a taxable investment to equal the fund’s 3.53% tax-exempt distribution rate3 as of July 31, 2018.
| If your taxable income is … | … then your federal | The fund’s tax-exempt distribution rate of 3.53% is | ||||||||||||||
| Single | Joint | tax rate is … | equivalent to a taxable rate of … | |||||||||||||
| $ | 0 – | 9,525 | $ | 0 – | 19,050 | 10.0 | % | 3.92 | % | |||||||
| 9,526 – | 38,700 | 19,051 – | 77,400 | 12.0 | 4.01 | |||||||||||
| 38,701 – | 82,500 | 77,401 – | 165,000 | 22.0 | 4.53 | |||||||||||
| 82,501 – | 157,500 | 165,001 – | 250,000 | 24.0 | 4.64 | |||||||||||
| – | 250,001 – | 315,000 | 27.8 | 1 | 4.89 | |||||||||||
| 157,501 – | 200,000 | – | 32.0 | 5.19 | ||||||||||||
| – | 315,001 – | 400,000 | 35.8 | 1 | 5.50 | |||||||||||
| 200,001 – | 500,000 | 400,001 – | 600,000 | 38.8 | 1 | 5.77 | ||||||||||
| Over 500,000 | Over 600,000 | 40.8 | 1 | 5.96 | ||||||||||||
| 1 | For the year 2018, there will be an Unearned Income Medicare Contribution Tax of 3.8% that applies to net investment income for taxpayers whose modified adjusted gross income exceeds $200,000 (for single filers) and $250,000 (for married filing jointly). Thus taxpayers in the highest tax bracket will face a combined 40.8% marginal tax rate on their investment income. |
| 2 | Based on 2018 federal tax rates. The federal rates do not include an adjustment for the loss of personal exemptions and the phaseout of itemized deductions that are applicable to certain taxable income levels. |
| 3 | The distribution rate is based on dividends paid over the last 12 months divided by the maximum offering price as of July 31, 2018. Capital gain distributions, if any, are added back at the maximum offering price to determine the rate. |
Fund results shown on the following page are for Class A shares and, unless otherwise indicated, reflect deduction of the maximum sales charge of 3.75% on the $10,000 investment.* Thus, the net amount invested was $9,625. Results are for past periods and are not predictive of results for future periods. Current and future results may be lower or higher than those shown. Share prices and returns will vary, so investors may lose money. For current information and month-end results, visit americanfunds.com.
| 10 | American Funds Tax-Exempt Funds |
How a $10,000 investment has grown
| * | As outlined in the prospectus, the sales charge is reduced for accounts (and aggregated investments) of $100,000 or more and is eliminated for purchases of $1 million or more. There is no sales charge on dividends or capital gain distributions that are reinvested in additional shares. |
| † | The index is unmanaged and, therefore, has no expenses. Investors cannot invest directly in an index. Bloomberg Barclays source: Bloomberg Index Services Ltd. |
The results shown are before taxes on fund distributions and sale of fund shares.
Average annual total returns based on a $1,000 investment
For periods ended July 31, 2018*
| 1 year | 5 years | 10 years | ||||
| Class A shares | 0.17% | 5.06% | 5.17% |
| * | Assumes reinvestment of all distributions and payment of the maximum 3.75% sales charge. |
Investment results assume all distributions are reinvested and reflect applicable fees and expenses. When applicable, investment results reflect fee waivers, without which results would have been lower. Visit americanfunds.com for more information.
Portfolio quality summary*
Percent of net assets

| * | Bond ratings, which typically range from AAA/Aaa (highest) to D (lowest), are assigned by credit rating agencies such as Standard & Poor’s, Moody’s and/or Fitch as an indication of an issuer’s creditworthiness. In assigning a credit rating to a security, the fund looks specifically to the ratings assigned to the issuer of the security by Standard & Poor’s, Moody’s and/or Fitch. If agency ratings differ, the security will be considered to have received the highest of those ratings, consistent with the fund’s investment policies. Securities in the “unrated” category (above) have not been rated by a rating agency; however, the investment adviser performs its own credit analysis and assigns comparable ratings that are used for compliance with the fund’s investment policies. The ratings are not covered by the Report of Independent Registered Public Accounting Firm. |
| American Funds Tax-Exempt Funds | 11 |
The Tax-Exempt Fund of California
The fund posted a 1.77% total return for the fiscal year. It finished ahead of the Bloomberg Barclays California Municipal Index, a market value-weighted index that includes only investment-grade tax-exempt bonds (rated BBB/Baa and above) of issuers within the state of California, which climbed 1.15%. The fund also outpaced the 1.55% total return of the Lipper California Municipal Debt Funds Average, a peer group measure.
For the period, the fund paid monthly dividends totaling 51 cents a share. Those investors who reinvested dividends received an income return of 2.92%. This is equivalent to a taxable income return of 6.36% for investors in the 54.10%1 effective combined federal and California tax bracket.
The state’s finances remain quite healthy. Higher tax rates have driven demand for sources of tax-exempt income, as credit spreads have tightened across the spectrum. Given what the managers believe is limited potential reward for additional risk, they are maintaining a conservative approach, concentrating on bonds of relatively higher quality and shorter duration.
The market index is unmanaged and, therefore, has no expenses. Investors cannot invest directly in an index. Bloomberg Barclays source: Bloomberg Index Services Ltd. Lipper averages reflect the current composition of all eligible mutual funds (all share classes) within a given category. Lipper source: Thomson Reuters Lipper. Lipper categories are dynamic and averages may have few funds, especially over longer periods. To see the number of funds included in the Lipper category for each fund’s lifetime, please view the Quarterly Statistical Update, available at americanfunds.com.
Tax-exempt yields vs. taxable yields
Find your estimated 2018 taxable income below to determine your combined federal and California tax rate,2 then look in the far right column to see what you would have had to earn from a taxable investment to equal the fund’s 2.81% tax-exempt distribution rate3 as of July 31, 2018.
| If your taxable income is … | … then your combined federal and California | The fund’s tax-exempt distribution rate of 2.81% is | ||||||||||||||
| Single | Joint | state tax rate is … | equivalent to a taxable rate of … | |||||||||||||
| $ | 0 – | 8,223 | $ | 0 – | 16,446 | 11.00 | % | 3.16 | % | |||||||
| 8,224 – | 9,525 | 16,447 – | 19,050 | 12.00 | 3.19 | |||||||||||
| 9,526 – | 19,495 | 19,051 – | 38,990 | 14.00 | 3.27 | |||||||||||
| 19,496 – | 30,769 | 38,991 – | 61,538 | 16.00 | 3.35 | |||||||||||
| 30,770 – | 38,700 | 61,539 – | 77,400 | 18.00 | 3.43 | |||||||||||
| 38,701 – | 42,711 | 77,401 – | 85,422 | 28.00 | 3.90 | |||||||||||
| 42,712 – | 53,980 | 85,423 – | 107,960 | 30.00 | 4.01 | |||||||||||
| 53,981 – | 82,500 | 107,961 – | 165,000 | 31.30 | 4.09 | |||||||||||
| 82,501 – | 157,500 | 165,001 – | 250,000 | 33.30 | 4.21 | |||||||||||
| – | 250,001 – | 315,000 | 37.10 | 1 | 4.47 | |||||||||||
| 157,501 – | 200,000 | – | 41.30 | 4.79 | ||||||||||||
| – | 315,001 – | 400,000 | 45.10 | 1 | 5.12 | |||||||||||
| 200,001 – | 275,738 | 400,001 – | 551,476 | 48.10 | 1 | 5.41 | ||||||||||
| 275,739 – | 330,884 | 551,477 – | 600,000 | 49.10 | 1 | 5.52 | ||||||||||
| 330,885 – | 500,000 | – | 50.10 | 1 | 5.63 | |||||||||||
| – | 600,001 – | 661,768 | 51.10 | 1 | 5.75 | |||||||||||
| 500,001 – | 551,473 | 661,769 – | 1,000,000 | 52.10 | 1 | 5.87 | ||||||||||
| 551,474 – | 1,000,000 | 1,000,001 – | 1,102,946 | 53.10 | 1 | 5.99 | ||||||||||
| Over 1,000,000 | Over 1,102,946 | 54.10 | 1 | 6.12 | ||||||||||||
| 1 | For the year 2018, there will be an Unearned Income Medicare Contribution Tax of 3.8% that applies to net investment income for taxpayers whose modified adjusted gross income exceeds $200,000 (for single filers) and $250,000 (for married filing jointly). Thus taxpayers in the highest tax bracket will face a combined 54.10% marginal tax rate on their investment income. |
| 2 | Based on 2018 federal and 2017 California tax rates. (State rates from 1.0% to 13.3% are individually calculated for each bracket. The federal brackets are expanded to include additional state brackets.) The effective combined tax rates paid by California residents may be lower than those shown due to the availability of income tax deductions. |
| 3 | The distribution rate is based on dividends paid over the last 12 months divided by the maximum offering price as of July 31, 2018. Capital gains distributions, if any, are added back at the maximum offering price to determine the rate. |
Fund results shown on the following page are for Class A shares and, unless otherwise indicated, reflect deduction of the maximum sales charge of 3.75% on the $10,000 investment.* Thus, the net amount invested was $9,625. Results are for past periods and are not predictive of results for future periods. Current and future results may be lower or higher than those shown. Share prices and returns will vary, so investors may lose money. For current information and month-end results, visit americanfunds.com.
| 12 | American Funds Tax-Exempt Funds |
How a $10,000 investment has grown

| * | As outlined in the prospectus, the sales charge is reduced for accounts (and aggregated investments) of $100,000 or more and is eliminated for purchases of $1 million or more. There is no sales charge on dividends or capital gain distributions that are reinvested in additional shares. |
| † | The index is unmanaged and, therefore, has no expenses. Investors cannot invest directly in an index. Bloomberg Barclays source: Bloomberg Index Services Ltd. |
The results shown are before taxes on fund distributions and sale of fund shares.
Average annual total returns based on a $1,000 investment
For periods ended July 31, 2018*
| 1 year | 5 years | 10 years | ||||
| Class A shares | –2.06% | 3.34% | 4.41% |
| * | Assumes reinvestment of all distributions and payment of the maximum 3.75% sales charge. |
Investment results assume all distributions are reinvested and reflect applicable fees and expenses. When applicable, investment results reflect fee waivers, without which results would have been lower. Visit americanfunds.com for more information.
Portfolio quality summary*
Percent of net assets

| * | Bond ratings, which typically range from AAA/Aaa (highest) to D (lowest), are assigned by credit rating agencies such as Standard & Poor’s, Moody’s and/or Fitch as an indication of an issuer’s creditworthiness. In assigning a credit rating to a security, the fund looks specifically to the ratings assigned to the issuer of the security by Standard & Poor’s, Moody’s and/or Fitch. If agency ratings differ, the security will be considered to have received the highest of those ratings, consistent with the fund’s investment policies. Securities in the “unrated” category (above) have not been rated by a rating agency; however, the investment adviser performs its own credit analysis and assigns comparable ratings that are used for compliance with the fund’s investment policies. The ratings are not covered by the Report of Independent Registered Public Accounting Firm. |
| American Funds Tax-Exempt Funds | 13 |
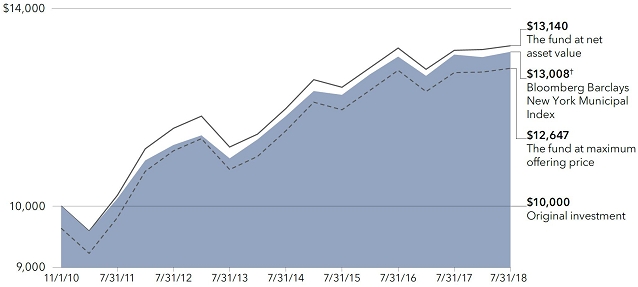
American Funds Tax-Exempt Fund of New York
The fund recorded a total return of 0.75% for the fiscal year, outpacing the 0.49% gain of the Bloomberg Barclays New York Municipal Index, a market value-weighted index that includes only investment-grade tax-exempt bonds (rated BBB/Baa and above) of issuers within the state of New York. By way of comparison, the Lipper New York Municipal Debt Funds Average, a peer group measure, advanced 0.94%.
The fund paid monthly dividends totaling 27 cents a share for the 12 months. This represents an income return of 2.53% for those who reinvested dividends. For investors in the 49.62%1 combined effective federal and New York state bracket, this is equivalent to a taxable income return of 5.02%.
The fund received positive contributions from revenue bonds supporting a wide range of initiatives. The portfolio’s two highest concentrations at the close of the period were in revenue bonds supporting higher education and hospital facilities.
The market index is unmanaged and, therefore, has no expenses. Investors cannot invest directly in an index. Bloomberg Barclays source: Bloomberg Index Services Ltd. Lipper averages reflect the current composition of all eligible mutual funds (all share classes) within a given category. Lipper source: Thomson Reuters Lipper. Lipper categories are dynamic and averages may have few funds, especially over longer periods. To see the number of funds included in the Lipper category for each fund’s lifetime, please view the Quarterly Statistical Update, available at americanfunds.com.
Tax-exempt yields vs. taxable yields
Find your estimated 2018 taxable income below to determine your combined federal and New York state tax rate,2,3 then look in the far right column to see what you would have had to earn from a taxable investment to equal the fund’s 2.45% tax-exempt distribution rate4 as of July 31, 2018.
| If your taxable income is … | … then your combined federal and New York | The fund’s tax-exempt distribution rate of 2.45% is | ||||||||||||||
| Single | Joint | state tax rate is … | equivalent to a taxable rate of … | |||||||||||||
| $ | 0 – | 8,500 | $ | 0 – | 17,150 | 14.00 | % | 2.85 | % | |||||||
| 8,501 – | 9,525 | 17,151 – | 19,050 | 14.50 | 2.87 | |||||||||||
| 9,526 – | 11,700 | 19,051 – | 23,600 | 16.50 | 2.93 | |||||||||||
| 11,701 – | 13,900 | 23,601 – | 27,900 | 17.25 | 2.96 | |||||||||||
| 13,901 – | 21,400 | 27,901 – | 43,000 | 17.90 | 2.98 | |||||||||||
| 21,401 – | 38,700 | 43,001 – | 77,400 | 18.45 | 3.00 | |||||||||||
| 38,701 – | 80,650 | 77,401 – | 161,550 | 28.45 | 3.42 | |||||||||||
| 80,651 – | 82,500 | 161,551 – | 165,000 | 28.65 | 3.43 | |||||||||||
| 82,501 – | 157,500 | 165,001 – | 250,000 | 30.65 | 3.53 | |||||||||||
| – | 250,001 – | 315,000 | 34.45 | 1 | 3.74 | |||||||||||
| 157,501 – | 200,000 | – | 38.65 | 3.99 | ||||||||||||
| – | 315,001 – | 323,200 | 42.45 | 1 | 4.26 | |||||||||||
| – | 323,201 – | 400,000 | 42.65 | 1 | 4.27 | |||||||||||
| 200,001 – | 215,400 | – | 45.45 | 1 | 4.49 | |||||||||||
| 215,401 – | 500,000 | 400,001 – | 600,000 | 45.65 | 1 | 4.51 | ||||||||||
| 500,001 – | 1,077,550 | 600,001 – | 2,155,350 | 47.65 | 1 | 4.68 | ||||||||||
| Over 1,077,550 | Over 2,155,350 | 49.62 | 1 | 4.86 | ||||||||||||
| 1 | For the year 2018, there will be an Unearned Income Medicare Contribution Tax of 3.8% that applies to net investment income for taxpayers whose modified adjusted gross income exceeds $200,000 (for single filers) and $250,000 (for married filing jointly). Thus taxpayers in the highest tax bracket will face a combined 49.62% marginal tax rate on their investment income. |
| 2 | Income generated by the fund’s investments is also generally exempt from New York City taxes, offering additional tax advantages to New York City residents. |
| 3 | Based on 2018 federal and 2017 New York state tax rates. (State rates from 4.00% to 8.82% are individually calculated for each bracket. The federal brackets are expanded to include additional state brackets.) The effective combined tax rates paid by New York residents may be lower than those shown due to the availability of income tax deductions. |
| 4 | The distribution rate is based on dividends paid over the last 12 months divided by the maximum offering price as of July 31, 2018. Capital gain distributions, if any, are added back at the maximum offering price to determine the rate. |
Fund results shown on the following page are for Class A shares and, unless otherwise indicated, reflect deduction of the maximum sales charge of 3.75% on the $10,000 investment.* Thus, the net amount invested was $9,625. Results are for past periods and are not predictive of results for future periods. Current and future results may be lower or higher than those shown. Share prices and returns will vary, so investors may lose money. For current information and month-end results, visit americanfunds.com.
| 14 | American Funds Tax-Exempt Funds |
How a $10,000 investment has grown
(for the period November 1, 2010, to July 31, 2018, with dividends reinvested)
| * | As outlined in the prospectus, the sales charge is reduced for accounts (and aggregated investments) of $100,000 or more and is eliminated for purchases of $1 million or more. There is no sales charge on dividends or capital gain distributions that are reinvested in additional shares. |
| † | The index is unmanaged and, therefore, has no expenses. Investors cannot invest directly in an index. Bloomberg Barclays source: Bloomberg Index Services Ltd. |
The results shown are before taxes on fund distributions and sale of fund shares.
Average annual total returns based on a $1,000 investment
For periods ended July 31, 2018*
| 1 year | 5 years | Lifetime | ||||
| Class A shares | –3.02% | 2.72% | 3.08% |
| * | Assumes reinvestment of all distributions and payment of the maximum 3.75% sales charge. |
Investment results assume all distributions are reinvested and reflect applicable fees and expenses. When applicable, investment results reflect expense reimbursements, without which results would have been lower. The investment adviser is currently reimbursing a portion of other expenses. This reimbursement will be in effect through at least October 1, 2018, unless modified or terminated by the fund’s board. The adviser may elect at its discretion to extend, modify or terminate the reimbursement at that time. Visit americanfunds.com for more information.
Portfolio quality summary*
Percent of net assets
| * | Bond ratings, which typically range from AAA/Aaa (highest) to D (lowest), are assigned by credit rating agencies such as Standard & Poor’s, Moody’s and/or Fitch as an indication of an issuer’s creditworthiness. In assigning a credit rating to a security, the fund looks specifically to the ratings assigned to the issuer of the security by Standard & Poor’s, Moody’s and/or Fitch. If agency ratings differ, the security will be considered to have received the highest of those ratings, consistent with the fund’s investment policies. Securities in the “unrated” category (above) have not been rated by a rating agency; however, the investment adviser performs its own credit analysis and assigns comparable ratings that are used for compliance with the fund’s investment policies. The ratings are not covered by the Report of Independent Registered Public Accounting Firm. |
| American Funds Tax-Exempt Funds | 15 |
Results at a glance
For periods ended July 31, 2018, with distributions reinvested
| Cumulative total returns | Average annual total returns | |||||||||||||||
| 1 year | 5 years | 10 years | Lifetime* | |||||||||||||
| American Funds Short-Term Tax-Exempt Bond
Fund (Class A shares) | 0.24 | % | 0.78 | % | — | 1.20 | % | |||||||||
| Bloomberg Barclays Municipal Short 1–5 Years Index | 0.48 | 1.23 | — | 1.67 | ||||||||||||
| Lipper Short Municipal Debt Funds Average | 0.61 | 0.74 | — | 1.12 | ||||||||||||
| Limited Term Tax-Exempt Bond Fund of America (Class A shares) | 0.40 | 1.69 | 2.94 | % | 3.81 | |||||||||||
| Bloomberg Barclays Municipal Short-Intermediate 1–10 Years Index | 0.21 | 2.08 | 3.11 | 4.06 | ||||||||||||
| Lipper Short-Intermediate Municipal Debt Funds Average | 0.39 | 1.50 | 2.35 | 3.37 | ||||||||||||
| The Tax-Exempt Bond Fund of America (Class A shares) | 1.60 | 3.84 | 4.33 | 6.36 | ||||||||||||
| Bloomberg Barclays Municipal Bond Index | 0.99 | 3.76 | 4.41 | — | † | |||||||||||
| Lipper General & Insured Municipal Debt Funds Average | 1.48 | 3.90 | 4.18 | 6.15 | ||||||||||||
| American High-Income Municipal Bond Fund (Class A shares) | 4.05 | 5.86 | 5.57 | 5.52 | ||||||||||||
| Bloomberg Barclays Municipal Bond Index | 0.99 | 3.76 | 4.41 | 5.24 | ||||||||||||
| Bloomberg Barclays High Yield Municipal Bond Index | 6.82 | 6.11 | 6.09 | — | † | |||||||||||
| Lipper High Yield Municipal Debt Funds Average | 3.97 | 5.70 | 4.99 | 5.04 | ||||||||||||
| The Tax-Exempt Fund of California (Class A shares) | 1.77 | 4.13 | 4.80 | 5.44 | ||||||||||||
| Bloomberg Barclays California Municipal Index | 1.15 | 4.15 | 4.74 | — | † | |||||||||||
| Lipper California Municipal Debt Funds Average | 1.55 | 4.48 | 4.58 | 5.45 | ||||||||||||
| American Funds Tax-Exempt Fund of New York (Class A shares) | 0.75 | 3.51 | — | 3.59 | ||||||||||||
| Bloomberg Barclays New York Municipal Index | 0.49 | 3.71 | — | 3.45 | ||||||||||||
| Lipper New York Municipal Debt Funds Average | 0.94 | 3.69 | — | 3.20 | ||||||||||||
| * | Since 8/7/09 (American Funds Short-Term Tax-Exempt Bond Fund), 10/6/93 (Limited Term Tax-Exempt Bond Fund of America), 10/3/79 (The Tax-Exempt Bond Fund of America), 9/26/94 (American High-Income Municipal Bond Fund), 10/28/86 (The Tax-Exempt Fund of California) and 11/1/10 (American Funds Tax-Exempt Fund of New York). |
| † | This index did not exist at the fund’s inception. |
The market indexes are unmanaged and, therefore, have no expenses. Investors cannot invest directly in an index. Bloomberg Barclays source: Bloomberg Index Services Ltd. Lipper averages reflect the current composition of all eligible mutual funds (all share classes) within a given category. Lipper source: Thomson Reuters Lipper. Lipper categories are dynamic and averages may have few funds, especially over longer periods. To see the number of funds included in the Lipper category for each fund’s lifetime, please view the Quarterly Statistical Update, available at americanfunds.com.
| 16 | American Funds Tax-Exempt Funds |
American Funds Short-Term Tax-Exempt Bond Fund
Summary investment portfolio July 31, 2018
| Bonds, notes & other debt instruments 89.79% | Principal amount (000) | Value (000) | ||||||
| Alabama 2.21% | ||||||||
| Black Belt Energy Gas Dist., Gas Supply Rev. Bonds, Series 2016-A, 4.00% 2046 (put 2021) | $ | 7,500 | $ | 7,826 | ||||
| Other securities | 13,769 | |||||||
| 21,595 | ||||||||
| California 6.14% | ||||||||
| Bay Area Toll Auth., San Francisco Bay Area Toll Bridge Rev. Bonds, Series 2006-C-1, (SIFMA Municipal Swap Index + 0.90%) 1.84% 2045 (put 2023)1 | 6,600 | 6,720 | ||||||
| Bay Area Toll Auth., San Francisco Bay Area Toll Bridge Rev. Bonds, Series 2007-E-3, (SIFMA Municipal Swap Index + 0.70%) 1.64% 2047 (put 2019)1 | 3,000 | 3,010 | ||||||
| Bay Area Toll Auth., San Francisco Bay Area Toll Bridge Rev. Bonds, Series 2008-A-1, (SIFMA Municipal Swap Index + 0.90%) 1.84% 2045 (put 2023)1 | 1,250 | 1,273 | ||||||
| Bay Area Toll Auth., San Francisco Bay Area Toll Bridge Rev. Bonds, Series 2014-G, (SIFMA Municipal Swap Index + 0.60%) 1.54% 2034 (put 2020)1 | 2,000 | 2,011 | ||||||
| Bay Area Toll Auth., San Francisco Bay Area Toll Bridge Rev. Bonds, Series 2017-D, (3-month USD-LIBOR x 0.70 + 0.55%) 2.186% 2045 (put 2021)1 | 500 | 504 | ||||||
| Infrastructure and Econ. Dev. Bank, Rev. Ref. Bonds (Pacific Gas and Electric Company), Series 2008-F, 1.75% 2026 (put 2022) | 6,070 | 5,766 | ||||||
| Other securities | 40,776 | |||||||
| 60,060 | ||||||||
| Florida 3.10% | ||||||||
| Citizens Property Insurance Corp., Personal Lines Account/Commercial Lines Account Senior Secured Bonds, Series 2012-A-1, 5.00% 2019 | 7,450 | 7,660 | ||||||
| JEA, Electric System Rev. Bonds, Series 2012-B, 5.00% 2026 (preref. 2021) | 4,650 | 5,093 | ||||||
| Other securities | 17,537 | |||||||
| 30,290 | ||||||||
| Georgia 1.63% | ||||||||
| County of Floyd, Dev. Auth., Pollution Control Rev. Bonds (Georgia Power Company Plant Hammond Project), Series 2010, 2.35% 2022 (put 2020) | 4,000 | 4,023 | ||||||
| Other securities | 11,895 | |||||||
| 15,918 | ||||||||
| Illinois 10.27% | ||||||||
| Build Illinois Bonds, Sales Tax Rev. Bonds, Series 2013, 5.00% 2020 | 6,300 | 6,617 | ||||||
| Educational Facs. Auth., Rev. Bonds (University of Chicago), Series 1998-B, 1.65% 2025 (put 2019) | 10,390 | 10,390 | ||||||
| Housing Dev. Auth., Multi Family Housing Rev. Notes (Marshall Field Garden Apartment Homes), Series 2015, (SIFMA Municipal Swap Index + 1.00%) 1.94% 2050 (put 2025)1 | 5,525 | 5,474 | ||||||
| Regional Transportation Auth., G.O. Rev. Ref. Bonds, Series 2017-A, 5.00% 2023 | 5,000 | 5,602 | ||||||
| Other securities | 72,367 | |||||||
| 100,450 | ||||||||
| Indiana 1.88% | ||||||||
| Dev. Fin. Auth., Solid Waste Disposal Rev. Bonds (Waste Management, Inc. Project), Series 2001, AMT, 1.75% 2031 (put 2018) | 500 | 500 | ||||||
| Hobart Building Corp. (Lake County), First Mortgage Bonds, Series 2006, National insured, 6.50% 2029 (preref. 2020) | 6,000 | 6,421 | ||||||
| Other securities | 11,508 | |||||||
| 18,429 | ||||||||
| Kansas 0.92% | ||||||||
| Dept. of Transportation, Highway Rev. Bonds, Series 2004-C-3, (1-month USD-LIBOR x 0.70 + 0.40%) 1.865% 20231 | 5,000 | 5,014 | ||||||
| Other securities | 4,012 | |||||||
| 9,026 | ||||||||
| Kentucky 0.72% | ||||||||
| Property and Buildings Commission, Rev. Ref. Bonds (Project No. 112), Series 2016-B, 5.00% 2022 | 4,500 | 4,991 | ||||||
| Other securities | 2,020 | |||||||
| 7,011 | ||||||||
| American Funds Tax-Exempt Funds | 17 |
American Funds Short-Term Tax-Exempt Bond Fund
| Bonds, notes & other debt instruments (continued) | Principal amount (000) | Value (000) | ||||||
| Maryland 1.33% | ||||||||
| University System, Auxiliary Fac. and Tuition Rev. Ref. Bonds, Series 2017-B, 5.00% 2021 | $ | 4,500 | $ | 4,878 | ||||
| Other securities | 8,130 | |||||||
| 13,008 | ||||||||
| Massachusetts 2.91% | ||||||||
| Housing Fin. Agcy., Single Family Housing Rev. Bonds, Series 167, 4.00% 2043 | 790 | 819 | ||||||
| Housing Fin. Agcy., Single Family Housing Rev. Bonds, Series 169, 4.00% 2044 | 505 | 523 | ||||||
| Housing Fin. Agcy., Single Family Housing Rev. Bonds, Series 172, 4.00% 2045 | 1,000 | 1,041 | ||||||
| Housing Fin. Agcy., Single Family Housing Rev. Bonds, Series 181, 4.00% 2044 | 785 | 819 | ||||||
| Housing Fin. Agcy., Single Family Housing Rev. Bonds, Series 183, 3.50% 2046 | 805 | 828 | ||||||
| Housing Fin. Agcy., Single Family Housing Rev. Ref. Bonds, Series 160, AMT, 3.75% 2034 | 300 | 306 | ||||||
| Housing Fin. Agcy., Single Family Housing Rev. Ref. Bonds, Series 162, 2.75% 2041 | 235 | 237 | ||||||
| Housing Fin. Agcy., Single Family Housing Rev. Ref. Bonds, Series 165, 2.65% 2041 | 810 | 815 | ||||||
| Housing Fin. Agcy., Single Family Housing Rev. Ref. Bonds, Series 171, 4.00% 2044 | 570 | 592 | ||||||
| Housing Fin. Agcy., Single Family Housing Rev. Ref. Bonds, Series 177, AMT, 4.00% 2039 | 3,125 | 3,252 | ||||||
| Housing Fin. Agcy., Single Family Housing Rev. Ref. Bonds, Series 188, AMT, 4.00% 2043 | 815 | 856 | ||||||
| Other securities | 18,388 | |||||||
| 28,476 | ||||||||
| Minnesota 1.52% | ||||||||
| Housing Fin. Agcy., Homeownership Fin. Bonds (Mortgage-Backed Securities Program), Series 2011-G, 4.25% 2035 | 280 | 287 | ||||||
| Housing Fin. Agcy., Residential Housing Fin. Bonds, Series 2012-D, 4.00% 2040 | 435 | 446 | ||||||
| Housing Fin. Agcy., Residential Housing Fin. Bonds, Series 2013-A, AMT, 3.00% 2031 | 510 | 516 | ||||||
| Housing Fin. Agcy., Residential Housing Fin. Bonds, Series 2014-A, 4.00% 2038 | 805 | 838 | ||||||
| Housing Fin. Agcy., Residential Housing Fin. Bonds, Series 2014-C, AMT, 4.00% 2045 | 6,420 | 6,697 | ||||||
| Housing Fin. Agcy., Residential Housing Fin. Bonds, Series 2015-A, AMT, 4.00% 2041 | 655 | 680 | ||||||
| Housing Fin. Agcy., Residential Housing Fin. Bonds, Series 2015-E, AMT, 3.50% 2046 | 695 | 714 | ||||||
| Housing Fin. Agcy., Residential Housing Fin. Bonds, Series 2016-E, 4.00% 2047 | 210 | 219 | ||||||
| Housing Fin. Agcy., Residential Housing Fin. Bonds, Series 2017-E, 4.00% 2048 | 975 | 1,028 | ||||||
| Other securities | 3,481 | |||||||
| 14,906 | ||||||||
| Nebraska 1.43% | ||||||||
| Central Plains Energy Project, Gas Supply Rev. Ref. Bonds, Series 2014, 5.00% 2039 (put 2019) | 6,700 | 6,981 | ||||||
| Other securities | 7,043 | |||||||
| 14,024 | ||||||||
| Nevada 1.53% | ||||||||
| County of Clark, Pollution Control Rev. Ref. Bonds (Southern California Edison Company), Series 2010, 1.875% 2031 (put 2020) | 5,500 | 5,470 | ||||||
| Other securities | 9,439 | |||||||
| 14,909 | ||||||||
| New Jersey 2.93% | ||||||||
| Econ. Dev. Auth., School Facs. Construction Rev. Ref. Bonds, Series 2014-PP, 5.00% 2019 | 4,000 | 4,109 | ||||||
| Housing and Mortgage Fin. Agcy., Single Family Housing Rev. Bonds, Series 2018-A, 4.50% 2048 | 5,000 | 5,367 | ||||||
| Other securities | 19,186 | |||||||
| 28,662 | ||||||||
| New Mexico 0.92% | ||||||||
| City of Farmington, Pollution Control Rev. Ref. Bonds (Southern California Edison Company Four Corners Project), Series 2005-A, 1.875% 2029 (put 2020) | 2,000 | 1,989 | ||||||
| City of Farmington, Pollution Control Rev. Ref. Bonds (Southern California Edison Company Four Corners Project), Series 2005-B, 1.875% 2029 (put 2020) | 2,250 | 2,238 | ||||||
| City of Farmington, Pollution Control Rev. Ref. Bonds (Southern California Edison Company Four Corners Project), Series 2011, 1.875% 2029 (put 2020) | 2,000 | 1,989 | ||||||
| Other securities | 2,730 | |||||||
| 8,946 | ||||||||
| 18 | American Funds Tax-Exempt Funds |
American Funds Short-Term Tax-Exempt Bond Fund
| Principal amount (000) |
Value (000) |
|||||||
| New York 8.34% | ||||||||
| Dormitory Auth., State Personal Income Tax Rev. Bonds (General Purpose), Series 2017-B, 5.00% 2023 | $ | 5,000 | $ | 5,647 | ||||
| Metropolitan Transportation Auth., Transportation Rev. Bonds, Series 2015-A-2, (SIFMA Municipal Swap Index + 0.58%) 1.52% 2039 (put 2020)1 | 6,250 | 6,258 | ||||||
| Metropolitan Transportation Auth., Transportation Rev. Ref. Bonds, Series 2002-D-2A, Assured Guaranty Municipal insured, (1-month USD-LIBOR x 0.69 + 0.68%) 2.123% 2032 (put 2021)1 | 4,000 | 4,033 | ||||||
| New York City Housing Dev. Corp., Multi Family Housing Rev. Bonds (Sustainable Neighborhood Bonds), Series 2017-C-2, 1.70% 2021 | 5,250 | 5,206 | ||||||
| Thruway Auth., General Rev. Junior Indebtedness Obligations, Series 2013-A, 5.00% 2019 | 4,700 | 4,823 | ||||||
| Other securities | 55,596 | |||||||
| 81,563 | ||||||||
| North Dakota 0.99% | ||||||||
| Housing Fin. Agcy., Housing Fin. Program Bonds (Home Mortgage Fin. Program), Series 2016-B, AMT, 4.00% 2047 | 4,005 | 4,183 | ||||||
| Other securities | 5,498 | |||||||
| 9,681 | ||||||||
| Ohio 1.79% | ||||||||
| Water Dev. Auth., Solid Waste Disposal Rev. Bonds (Waste Management Inc. Project), Series 2002, AMT, 1.70% 2022 (put 2018) | 2,500 | 2,500 | ||||||
| Other securities | 15,021 | |||||||
| 17,521 | ||||||||
| Pennsylvania 3.23% | ||||||||
| Econ. Dev. Fncg. Auth., UPMC Rev. Bonds, Series 2017-A, 4.00% 2018 | 4,780 | 4,816 | ||||||
| Housing Fin. Agcy., Single Family Mortgage Rev. Bonds, Series 2015-118-A, AMT, 3.50% 2040 | 5,490 | 5,621 | ||||||
| Other securities | 21,152 | |||||||
| 31,589 | ||||||||
| Texas 10.40% | ||||||||
| Clear Creek Independent School Dist., Unlimited Tax School Building Bonds, Series 2013-B, 3.00% 2032 (put 2019) | 5,000 | 5,066 | ||||||
| Cypress-Fairbanks Independent School Dist., Unlimited Tax School Building Bonds, Series 2017-A-2, 2.50% 2036 (put 2019) | 4,000 | 4,033 | ||||||
| City of Houston, Combined Utility System Rev. Ref. Bonds, Series 2018-C, (1-month USD-LIBOR x 0.70 + 0.36%) 1.811% 2034 (put 2021)1 | 5,650 | 5,655 | ||||||
| City of Houston, Public Improvement Rev. Ref. Bonds, Series 2017-A, 5.00% 2020 | 2,850 | 2,996 | ||||||
| North Texas Tollway Auth., System Rev. Ref. Bonds, Series 2011-A, (SIFMA Municipal Swap Index + 0.80%) 1.74% 2050 (put 2019)1 | 4,095 | 4,095 | ||||||
| North Texas Tollway Auth., System Rev. Ref. Bonds, Series 2012-C, 1.95% 2038 (put 2019) | 2,380 | 2,380 | ||||||
| North Texas Tollway Auth., System Rev. Ref. Bonds, Series 2017-A, 5.00% 2019 | 4,500 | 4,567 | ||||||
| City of San Antonio, Electric and Gas Systems Rev. Ref. Bonds, Series 2009-A, 5.25% 2024 (preref. 2019) | 1,100 | 1,121 | ||||||
| City of San Antonio, Electric and Gas Systems Rev. Ref. Bonds, Series 2012-C, 2.00% 2027 (put 2018) | 1,625 | 1,627 | ||||||
| City of San Antonio, Electric and Gas Systems Rev. Ref. Bonds, Series 2015-A, 2.25% 2033 (put 2019) | 9,000 | 9,065 | ||||||
| City of San Antonio, Electric and Gas Systems Rev. Ref. Bonds, Series 2015-B, 2.00% 2033 (put 2021) | 3,040 | 3,023 | ||||||
| Transportation Commission, G.O. Mobility Fund Bonds, Series 2014-B, (SIFMA Municipal Swap Index + 0.38%) 1.32% 2041 (put 2018)1 | 6,500 | 6,501 | ||||||
| Other securities | 51,626 | |||||||
| 101,755 | ||||||||
| Washington 3.07% | ||||||||
| Econ. Dev. Fin. Auth., Solid Waste Disposal Rev. Bonds (Waste Management, Inc. Project), Series 2008, 2.125% 20202 | 5,000 | 5,002 | ||||||
| Various Purpose G.O. Rev. Ref. Bonds, Series 2018-R-C, 5.00% 2021 | 5,000 | 5,472 | ||||||
| Other securities | 19,561 | |||||||
| 30,035 | ||||||||
| American Funds Tax-Exempt Funds | 19 |
American Funds Short-Term Tax-Exempt Bond Fund
| Bonds, notes & other debt instruments (continued) | Principal amount (000) | Value (000) | ||||||
| Wisconsin 4.26% | ||||||||
| G.O. Bonds, Series 2013-A, 5.00% 2025 (preref. 2022) | $ | 5,000 | $ | 5,554 | ||||
| G.O. Bonds, Series 2015-A, 5.00% 2031 (preref. 2023) | 5,000 | 5,686 | ||||||
| Health and Educational Facs. Auth., Rev. Bonds (Ascension Health Senior Credit Group), Series 2013-B-1, 1.375% 2038 (put 2019) | 2,150 | 2,137 | ||||||
| Health and Educational Facs. Auth., Rev. Bonds (Ascension Health Senior Credit Group), Series 2013-B-2, 4.00% 2043 (put 2019) | 6,000 | 6,109 | ||||||
| Health and Educational Facs. Auth., Rev. Bonds (Ascension Health Senior Credit Group), Series 2013-B-3, 5.00% 2043 (put 2020) | 4,500 | 4,753 | ||||||
| Housing and Econ. Dev. Auth., Home Ownership Rev. Bonds, Series 2016-A, AMT, 3.50% 2046 | 5,415 | 5,563 | ||||||
| Public Fin. Auth., Solid Waste Disposal Rev. Ref. Bonds (Waste Management, Inc. Project), Series 2016-A-4, AMT, 2.00% 2033 (put 2021) | 1,500 | 1,473 | ||||||
| Other securities | 10,426 | |||||||
| 41,701 | ||||||||
| Other states & U.S. territories 18.27% | ||||||||
| Other securities | 178,698 | |||||||
| Total bonds, notes & other debt instruments (cost: $882,948,000) | 878,253 | |||||||
| Short-term securities 10.38% | ||||||||
| State of Arizona, City of Phoenix, Industrial Dev. Auth., Health Care Facs. Rev. Bonds (Mayo Clinic), Series 2014-A, 1.38% 20521 | 7,000 | 7,000 | ||||||
| State of Maryland, County of Montgomery, IAM Commercial Paper, Series 2009, 1.64% 8/2/2018 | 5,000 | 5,000 | ||||||
| State of Maryland, County of Montgomery, IAM Commercial Paper, Series 2009-B, 1.13% 8/9/2018 | 2,000 | 2,000 | ||||||
| State of Michigan, Strategic Fund, Demand Limited Obligation Rev. Bonds (Air Products and Chemicals, Inc. Project), Series 2007, 1.45% 20421 | 18,980 | 18,980 | ||||||
| State of Missouri, Health and Educational Facs. Auth., Demand Educational Facs. Rev. Bonds (Washington University), Series 2000-B, 1.49% 20401 | 5,000 | 5,000 | ||||||
| State of New York, Metropolitan Transportation Auth., Transportation Rev. Bonds, Series 2017-C-2A, 4.00% 5/15/2019 | 7,300 | 7,445 | ||||||
| State of New York, New York City Transitional Fin. Auth., Future Tax Secured Bonds, Series 2010-G-5, 1.05% 20341 | 1,500 | 1,500 | ||||||
| State of New York, New York City Transitional Fin. Auth., Future Tax Secured Rev. Ref. Bonds, Series 2015-E-3, 1.50% 20451 | 1,000 | 1,000 | ||||||
| State of New York, New York City Transitional Fin. Auth., Future Tax Secured Rev. Ref. Bonds, Series 2016-E-4, 1.50% 20451 | 3,500 | 3,500 | ||||||
| State of New York, New York City Transitional Fin. Auth., Recovery Bonds, Fiscal 2003, Series 2002-1-C, 1.50% 20221 | 2,880 | 2,880 | ||||||
| State of Pennsylvania, Econ. Dev. Fncg. Auth., Solid Waste Disposal Rev. Bonds (Waste Management, Inc. Project), Series 2013, AMT, 1.80% 2045 (put 2018)1,3 | 1,200 | 1,200 | ||||||
| State of Texas, City of Houston, Tax and Rev. Anticipation Notes, Series 2018, 4.00% 6/28/2019 | 4,000 | 4,089 | ||||||
| State of Texas, Tax and Rev. Anticipation Notes, Series 2017, 4.00% 8/30/2018 | 12,000 | 12,026 | ||||||
| State of Washington, Central Puget Sound Regional Transit Auth., Sales Tax Improvement Green Bonds, Series 2015-S-2B, (SIFMA Municipal Swap Index + 0.45%) 1.39% 2045 (put 2023)1 | 6,150 | 6,155 | ||||||
| Other securities | 23,775 | |||||||
| Total short-term securities (cost: $101,533,000) | 101,550 | |||||||
| Total investment securities 100.17% (cost: $984,481,000) | 979,803 | |||||||
| Other assets less liabilities (0.17)% | (1,616 | ) | ||||||
| Net assets 100.00% | $ | 978,187 | ||||||
This summary investment portfolio is designed to streamline the report and help investors better focus on the fund’s principal holdings. See the inside back cover for details on how to obtain a complete schedule of portfolio holdings.
| 20 | American Funds Tax-Exempt Funds |
American Funds Short-Term Tax-Exempt Bond Fund
“Other securities” includes all issues that are not disclosed separately in the summary investment portfolio.
Futures contracts
| Number of | Notional amount |
4 | Value at 7/31/2018 |
5 | Unrealized depreciation at 7/31/2018 |
||||||||
| Contracts | Type | contracts | Expiration | (000) | (000) | (000) | |||||||
| 2 Year U.S. Treasury Note Futures | Long | 280 | October 2018 | $56,000 | $59,185 | $(101 | ) |
| 1 | Coupon rate may change periodically. For short-term securities, the date of the next scheduled coupon rate change is considered to be the maturity date. |
| 2 | Acquired in a transaction exempt from registration under Rule 144A of the Securities Act of 1933. May be resold in the U.S. in transactions exempt from registration, normally to qualified institutional buyers. The total value of all such securities was $5,002,000, which represented .51% of the net assets of the fund. |
| 3 | For short-term securities, the mandatory put date is considered to be the maturity date. |
| 4 | Notional amount is calculated based on the number of contracts and notional contract size. |
| 5 | Value is calculated based on the notional amount and current market price. |
Key to abbreviations and symbol
Agcy. = Agency
AMT = Alternative Minimum Tax
Auth. = Authority
Dept. = Department
Dev. = Development
Dist. = District
Econ. = Economic
Fac. = Facility
Facs. = Facilities
Fin. = Finance
Fncg. = Financing
G.O. = General Obligation
LIBOR = London Interbank Offered Rate
LOC = Letter of Credit
Preref. = Prerefunded
Redev. = Redevelopment
Ref. = Refunding
Rev. = Revenue
SIFMA = Securities Industry and Financial Markets Association
USD/$ = U.S. dollars
See Notes to Financial Statements
| American Funds Tax-Exempt Funds | 21 |
Limited Term Tax-Exempt Bond Fund of America
Summary investment portfolio July 31, 2018
| Bonds, notes & other debt instruments 92.26% | Principal amount (000) | Value (000) | ||||||
| Alabama 1.31% | ||||||||
| Black Belt Energy Gas Dist., Gas Supply Rev. Bonds, Series 2016-A, 4.00% 2046 (put 2021) | $ | 14,500 | $ | 15,131 | ||||
| Other securities | 36,722 | |||||||
| 51,853 | ||||||||
| California 7.79% | ||||||||
| Bay Area Toll Auth., San Francisco Bay Area Toll Bridge Rev. Bonds, Series 2006-C-1, (SIFMA Municipal Swap Index + 0.90%) 1.84% 2045 (put 2023)1 | 20,500 | 20,873 | ||||||
| Bay Area Toll Auth., San Francisco Bay Area Toll Bridge Rev. Bonds, Series 2007-C-1, (SIFMA Municipal Swap Index + 0.90%) 1.84% 2047 (put 2023)1 | 3,500 | 3,564 | ||||||
| Bay Area Toll Auth., San Francisco Bay Area Toll Bridge Rev. Bonds, Series 2007-E-3, (SIFMA Municipal Swap Index + 0.70%) 1.64% 2047 (put 2019)1 | 1,000 | 1,003 | ||||||
| Bay Area Toll Auth., San Francisco Bay Area Toll Bridge Rev. Bonds, Series 2008-B-1, (SIFMA Municipal Swap Index + 1.10%) 2.04% 2045 (put 2024)1 | 2,500 | 2,572 | ||||||
| Bay Area Toll Auth., San Francisco Bay Area Toll Bridge Rev. Bonds, Series 2014-G, (SIFMA Municipal Swap Index + 0.60%) 1.54% 2034 (put 2020)1 | 2,500 | 2,514 | ||||||
| Bay Area Toll Auth., San Francisco Bay Area Toll Bridge Rev. Bonds, Series 2014-H, (SIFMA Municipal Swap Index + 0.70%) 1.64% 2034 (put 2021)1 | 10,480 | 10,602 | ||||||
| Bay Area Toll Auth., San Francisco Bay Area Toll Bridge Rev. Bonds, Series 2017-D, (3-month USD-LIBOR x 0.70 + 0.55%) 2.186% 2045 (put 2021)1 | 3,000 | 3,025 | ||||||
| Northern California Gas Auth. No. 1, Gas Project Rev. Bonds, Series 2007-B, (3-month USD-LIBOR + 0.67%) 2.286% 20271 | 11,870 | 11,634 | ||||||
| Other securities | 252,966 | |||||||
| 308,753 | ||||||||
| Florida 4.91% | ||||||||
| Citizens Property Insurance Corp., Personal Lines Account/Commercial Lines Account Secured Bonds, Series 2012-A-1, 5.00% 2022 | 10,200 | 11,307 | ||||||
| Housing Fin. Corp., Homeowner Mortgage Rev. Bonds, Series 2017-1, 4.00% 2048 | 11,665 | 12,320 | ||||||
| County of Miami-Dade, Aviation Rev. Ref. Bonds, Series 2012-A, AMT, 5.00% 2021 | 11,600 | 12,661 | ||||||
| Other securities | 158,453 | |||||||
| 194,741 | ||||||||
| Georgia 2.15% | ||||||||
| Main Street Natural Gas, Inc., Gas Supply Rev. Bonds, Series 2018-A, 4.00% 2048 (put 2023) | 15,000 | 15,993 | ||||||
| Municipal Electric Auth., Project One Bonds, Series 2011-A, 5.00% 2021 | 11,490 | 12,281 | ||||||
| Public Gas Partners, Inc., Gas Project Rev. Ref. Bonds (Gas Supply Pool No. 1), Series A, 5.00% 2018 | 10,930 | 10,994 | ||||||
| Other securities | 45,847 | |||||||
| 85,115 | ||||||||
| Illinois 12.95% | ||||||||
| Build Illinois Bonds, Sales Tax Rev. Ref. Bonds, Series 2010, 5.00% 2019 | 2,250 | 2,309 | ||||||
| Build Illinois Bonds, Sales Tax Rev. Ref. Bonds, Series 2016-C, 4.00% 2026 | 11,805 | 12,704 | ||||||
| City of Chicago, O’Hare International Airport, General Airport Rev. Bonds, Series 2011-B, 5.00% 2019 | 2,785 | 2,826 | ||||||
| City of Chicago, O’Hare International Airport, General Airport Rev. Bonds, Series 2012-B, AMT, 5.00% 2024 | 2,000 | 2,172 | ||||||
| City of Chicago, O’Hare International Airport, General Airport Rev. Bonds, Series 2013-A, AMT, 5.00% 2022 | 3,055 | 3,337 | ||||||
| City of Chicago, O’Hare International Airport, General Airport Rev. Bonds, Series 2017-D, 5.00% 2026 | 4,000 | 4,661 | ||||||
| City of Chicago, O’Hare International Airport, General Airport Rev. Bonds, Series 2017-D, 5.25% 2029 | 1,500 | 1,761 | ||||||
| City of Chicago, O’Hare International Airport, General Airport Rev. Ref. Bonds, Series 2012-A, AMT, 5.00% 2025 | 6,170 | 6,684 | ||||||
| City of Chicago, O’Hare International Airport, General Airport Rev. Ref. Bonds, Series 2013-A, AMT, 5.00% 2021 | 10,000 | 10,699 | ||||||
| City of Chicago, O’Hare International Airport, General Airport Rev. Ref. Bonds, Series 2013-A, AMT, 5.00% 2023 | 5,000 | 5,563 | ||||||
| City of Chicago, O’Hare International Airport, Passenger Fac. Charge Rev. Ref. Bonds, Series 2012-B, AMT, 4.00% 2020 | 8,000 | 8,241 | ||||||
| City of Chicago, O’Hare International Airport, Passenger Fac. Charge Rev. Ref. Bonds, Series 2012-B, AMT, 5.00% 2019 | 2,000 | 2,028 | ||||||
| 22 | American Funds Tax-Exempt Funds |
Limited Term Tax-Exempt Bond Fund of America
| Principal amount (000) | Value (000) | |||||||
| City of Chicago, O’Hare International Airport, Passenger Fac. Charge Rev. Ref. Bonds, Series 2013-B, AMT, 5.00% 2022 | $ | 3,000 | $ | 3,277 | ||||
| City of Chicago, Water Rev. Bonds, Series 2000, 5.00% 2022 | 10,500 | 11,627 | ||||||
| Fin. Auth., Rev. Bonds (Clean Water Initiative Revolving Fund), Series 2016, 5.00% 2028 | 10,590 | 12,286 | ||||||
| G.O. Bonds, Series 2014, 5.00% 2024 | 5,000 | 5,365 | ||||||
| G.O. Bonds, Series 2016, 5.00% 2025 | 5,000 | 5,396 | ||||||
| G.O. Bonds, Series 2017-B, 5.00% 2019 | 10,000 | 10,324 | ||||||
| G.O. Bonds, Series 2017-D, BMA insured, 5.00% 2020 | 9,000 | 9,380 | ||||||
| G.O. Bonds, Series 2017-D, BMA insured, 5.00% 2024 | 5,000 | 5,374 | ||||||
| G.O. Rev. Ref. Bonds, Series 2012, 5.00% 2019 | 5,000 | 5,131 | ||||||
| G.O. Rev. Ref. Bonds, Series 2016, 5.00% 2026 | 7,500 | 8,082 | ||||||
| City of Granite, Solid Waste Disposal Rev. Bonds (Waste Management, Inc. Project), Series 2002-A, AMT, 2.25% 2027 (put 2019) | 20,000 | 20,004 | ||||||
| Housing Dev. Auth., Multi Family Housing Rev. Notes (Marshall Field Garden Apartment Homes), Series 2015, (SIFMA Municipal Swap Index + 1.00%) 1.94% 2050 (put 2025)1 | 11,625 | 11,518 | ||||||
| Railsplitter Tobacco Settlement Auth., Tobacco Settlement Rev. Bonds, Series 2010, 5.50% 2023 (preref. 2021) | 12,925 | 14,235 | ||||||
| Regional Transportation Auth., G.O. Rev. Ref. Bonds, Series 2017-A, 5.00% 2027 | 10,000 | 11,613 | ||||||
| Regional Transportation Auth., G.O. Rev. Ref. Bonds, Series 2017-A, 5.00% 2028 | 10,000 | 11,588 | ||||||
| Other securities | 305,457 | |||||||
| 513,642 | ||||||||
| Massachusetts 2.77% | ||||||||
| Housing Fin. Agcy., Single Family Housing Rev. Bonds, Series 190, 4.00% 2048 | 10,000 | 10,560 | ||||||
| Other securities | 99,421 | |||||||
| 109,981 | ||||||||
| Michigan 3.80% | ||||||||
| Housing Dev. Auth., Single Family Mortgage Rev. Bonds, Series 2016-B, 3.50% 2047 | 18,070 | 18,601 | ||||||
| County of Wayne, Airport Auth., Airport Rev. Ref. Bonds (Detroit Metropolitan Wayne County Airport), Series 2011-A, AMT, 5.00% 2020 | 10,000 | 10,696 | ||||||
| Other securities | 121,347 | |||||||
| 150,644 | ||||||||
| Nebraska 1.07% | ||||||||
| Central Plains Energy Project, Gas Supply Rev. Ref. Bonds, Series 2014, 5.00% 2039 (put 2019) | 11,850 | 12,346 | ||||||
| Other securities | 29,943 | |||||||
| 42,289 | ||||||||
| Nevada 2.28% | ||||||||
| County of Clark, Highway Rev. Ref. Bonds (Motor Vehicle Fuel Tax), Series 2011, 5.00% 2020 | 12,320 | 13,082 | ||||||
| County of Clark, Pollution Control Rev. Ref. Bonds (Southern California Edison Company), Series 2010, 1.875% 2031 (put 2020) | 18,150 | 18,051 | ||||||
| Other securities | 59,116 | |||||||
| 90,249 | ||||||||
| New Jersey 3.34% | ||||||||
| Housing and Mortgage Fin. Agcy., Single Family Housing Rev. Bonds, Series 2018-A, 4.50% 2048 | 10,000 | 10,734 | ||||||
| Other securities | 121,626 | |||||||
| 132,360 | ||||||||
| New York 7.30% | ||||||||
| Metropolitan Transportation Auth., Transportation Rev. Bonds, Series 2003-B, FGIC-National insured, 5.25% 2020 | 5,500 | 5,940 | ||||||
| Metropolitan Transportation Auth., Transportation Rev. Bonds, Series 2008-C, 5.50% 2018 | 1,880 | 1,903 | ||||||
| Metropolitan Transportation Auth., Transportation Rev. Bonds, Series 2012-E, 5.00% 2020 | 3,250 | 3,492 | ||||||
| Metropolitan Transportation Auth., Transportation Rev. Bonds, Series 2014-C, 5.00% 2024 | 5,000 | 5,783 | ||||||
| Metropolitan Transportation Auth., Transportation Rev. Bonds, Series 2015-A-1, 5.00% 2027 | 3,150 | 3,609 | ||||||
| Metropolitan Transportation Auth., Transportation Rev. Bonds, Series 2015-A-2, (SIFMA Municipal Swap Index + 0.58%) 1.52% 2039 (put 2020)1 | 12,250 | 12,265 | ||||||
| American Funds Tax-Exempt Funds | 23 |
Limited Term Tax-Exempt Bond Fund of America
| Bonds, notes & other debt instruments (continued) | Principal amount (000) | Value (000) | ||||||
| New York (continued) | ||||||||
| Metropolitan Transportation Auth., Transportation Rev. Ref. Bonds, Series 2012-D, 5.00% 2020 | $ | 7,000 | $ | 7,521 | ||||
| New York City G.O. Bonds, Series 2012-I, 5.00% 2020 | 5,000 | 5,331 | ||||||
| New York City G.O. Bonds, Series 2014-A, 5.00% 2025 | 3,000 | 3,453 | ||||||
| New York City G.O. Bonds, Series 2014-G, 5.00% 2023 | 1,500 | 1,708 | ||||||
| New York City G.O. Bonds, Series 2015-C, 5.00% 2028 | 1,000 | 1,152 | ||||||
| New York City G.O. Bonds, Series 2017-A, 5.00% 2026 | 5,000 | 5,921 | ||||||
| New York City G.O. Bonds, Series 2017-C, 5.00% 2026 | 3,500 | 4,145 | ||||||
| New York City G.O. Bonds, Series 2017-C, 5.00% 2027 | 5,000 | 5,922 | ||||||
| New York City G.O. Bonds, Series 2017-C, 5.00% 2028 | 4,300 | 5,068 | ||||||
| Transportation Dev. Corp., Special Facs. Rev. Bonds (Delta Air Lines, Inc. LaGuardia Airport Terminals C & D Redev. Project), Series 2018, AMT 5.00% 2025 | 10,000 | 11,264 | ||||||
| Other securities | 205,071 | |||||||
| 289,548 | ||||||||
| Ohio 2.16% | ||||||||
| County of Allen, Hospital Facs. Rev. Bonds (Mercy Health), Series 2017-B, 5.00% 2047 (put 2022) | 9,425 | 10,422 | ||||||
| Other securities | 75,261 | |||||||
| 85,683 | ||||||||
| South Dakota 0.36% | ||||||||
| Housing Dev. Auth., Homeownership Mortgage Bonds, Series 2016-D, 3.50% 2046 | 10,150 | 10,475 | ||||||
| Other securities | 3,944 | |||||||
| 14,419 | ||||||||
| Texas 9.32% | ||||||||
| County of Harris, Cultural Education Facs. Fin. Corp., Medical Facs. Rev. Ref. Bonds (Baylor College of Medicine), Series 2015, (1-month USD-LIBOR x 0.70 + 0.80%) 2.892% 2045 (put 2020)1 | 13,000 | 13,001 | ||||||
| County of Harris, Toll Road Rev. Bonds, Series 2012-B, (SIFMA Municipal Swap Index + 0.70%) 1.64% 2021 (put 2018)1 | 13,500 | 13,503 | ||||||
| North Texas Tollway Auth., System Rev. Ref. Bonds, Series 2017-A, 5.00% 2019 | 13,500 | 13,700 | ||||||
| City of San Antonio, Electric and Gas Systems Rev. Ref. Bonds, Series 2015-A, 2.25% 2033 (put 2019) | 16,000 | 16,115 | ||||||
| Other securities | 313,060 | |||||||
| 369,379 | ||||||||
| Virginia 0.48% | ||||||||
| County of Wise, Industrial Dev. Auth., Solid Waste and Sewage Disposal Rev. Bonds (Virginia Electric and Power Co. Project), Series 2009-A, 2.15% 2040 (put 2020) | 11,500 | 11,511 | ||||||
| Other securities | 7,430 | |||||||
| 18,941 | ||||||||
| Washington 2.68% | ||||||||
| Health Care Facs. Auth., Rev. Bonds (Catholic Health Initiatives), Series 2013-B-1, (SIFMA Municipal Swap Index + 1.00%) 1.94% 2035 (put 2021)1 | 15,100 | 15,144 | ||||||
| Other securities | 91,022 | |||||||
| 106,166 | ||||||||
| Wisconsin 3.07% | ||||||||
| G.O. Bonds, Series 2015-A, 5.00% 2031 (preref. 2023) | 12,385 | 14,083 | ||||||
| Health and Educational Facs. Auth., Health Facs. Rev. Bonds (SSM Health Care), Series 2018-B, 5.00% 2038 (put 2023) | 11,000 | 12,108 | ||||||
| Health and Educational Facs. Auth., Rev. Bonds (Ascension Health Senior Credit Group), Series 2013-B-3, 5.00% 2043 (put 2020) | 10,310 | 10,890 | ||||||
| Transportation Rev. Ref. Bonds, Series 2017-2, 5.00% 2022 | 10,450 | 11,662 | ||||||
| Other securities | 73,120 | |||||||
| 121,863 | ||||||||
| 24 | American Funds Tax-Exempt Funds |
Limited Term Tax-Exempt Bond Fund of America
| Principal amount (000) | Value (000) | |||||||
| Other states & U.S. territories 24.52% | ||||||||
| Other securities | $ | 972,749 | ||||||
| Total bonds, notes & other debt instruments (cost: $3,646,247,000) | 3,658,375 | |||||||
| Short-term securities 6.82% | ||||||||
| State of Arizona, City of Phoenix, Industrial Dev. Auth., Health Care Facs. Rev. Bonds (Mayo Clinic), Series 2014-A, 1.38% 20521 | $ | 12,000 | 12,000 | |||||
| State of Illinois, Fin. Auth., Demand Rev. Bonds (University of Chicago Medical Center), Series 2009-E-1, JPMorgan Chase LOC, 1.45% 20431 | 14,100 | 14,100 | ||||||
| State of Mississippi, Business Fin. Corp., Gulf Opportunity Zone Industrial Dev. Rev. Bonds (Chevron U.S.A. Inc. Project), Series 2007-A, 1.48% 20301 | 5,000 | 5,000 | ||||||
| State of Mississippi, Business Fin. Corp., Gulf Opportunity Zone Industrial Dev. Rev. Bonds (Chevron U.S.A. Inc. Project), Series 2011-E, 1.48% 20351 | 7,100 | 7,100 | ||||||
| State of New York, Metropolitan Transportation Auth., Transportation Rev. Bonds, Series 2017-C-2A, 4.00% 5/15/2019 | 18,000 | 18,357 | ||||||
| State of New York, New York City G.O. Bonds, Fiscal 2006, Series E, Subseries E-2, 1.49% 20341 | 10,775 | 10,775 | ||||||
| State of New York, New York City G.O. Bonds, Series 2006-L-5, 1.49% 20351 | 20,000 | 20,000 | ||||||
| State of New York, Triborough Bridge and Tunnel Auth., General Rev. Bonds (MTA Bridges and Tunnels), Series 2003-B-1, 1.49% 20331 | 9,905 | 9,905 | ||||||
| State of New York, Triborough Bridge and Tunnel Auth., General Rev. Bonds (MTA Bridges and Tunnels), Series 2005-B-2, 1.42% 20321 | 4,600 | 4,600 | ||||||
| State of Oregon, Full Faith and Credit Tax Anticipation Notes, Series 2017-A, 5.00% 9/28/2018 | 12,000 | 12,069 | ||||||
| State of Pennsylvania, Econ. Dev. Fncg. Auth., Solid Waste Disposal Rev. Bonds (Republic Services, Inc. Project), Series 2014, AMT, 1.85% 2044 (put 2018) | 12,000 | 12,000 | ||||||
| State of Texas, City of Houston, IAM Commercial Paper, Series 2018-E-2, 1.34% 9/4/2018 | 6,500 | 6,500 | ||||||
| State of Texas, City of Houston, Tax and Rev. Anticipation Notes, Series 2018, 4.00% 6/28/2019 | 5,000 | 5,112 | ||||||
| State of Texas, Tax and Rev. Anticipation Notes, Series 2017, 4.00% 8/30/2018 | 28,050 | 28,112 | ||||||
| Other securities | 104,879 | |||||||
| Total short-term securities (cost: $270,494,000) | 270,509 | |||||||
| Total investment securities 99.08% (cost: $3,916,741,000) | 3,928,884 | |||||||
| Other assets less liabilities 0.92% | 36,427 | |||||||
| Net assets 100.00% | $ | 3,965,311 | ||||||
This summary investment portfolio is designed to streamline the report and help investors better focus on the fund’s principal holdings. See the inside back cover for details on how to obtain a complete schedule of portfolio holdings.
“Other securities” includes all issues that are not disclosed separately in the summary investment portfolio. “Other securities” also includes securities (with an aggregate value of $23,812,000, which represented .60% of the net assets of the fund) which were acquired in transactions exempt from registration under Rule 144A of the Securities Act of 1933 and may be resold in the U.S. in transactions exempt from registration, normally to qualified institutional buyers.
Futures contracts
| Contracts | Type | Number of contracts | Expiration | Notional amount (000) | 2 | Value at 7/31/2018 (000) | 3 | Unrealized appreciation at 7/31/2018 (000) | ||||||||||
| 5 Year U.S. Treasury Note Futures | Long | 600 | October 2018 | $ | 60,000 | $ | 67,875 | $ | 90 | |||||||||
| 1 | Coupon rate may change periodically. For short-term securities, the date of the next scheduled coupon rate change is considered to be the maturity date. |
| 2 | Notional amount is calculated based on the number of contracts and notional contract size. |
| 3 | Value is calculated based on the notional amount and current market price. |
| American Funds Tax-Exempt Funds | 25 |
Limited Term Tax-Exempt Bond Fund of America
Key to abbreviations and symbol
Agcy. = Agency
AMT = Alternative Minimum Tax
Auth. = Authority
Dept. = Department
Dev. = Development
Dist. = District
Econ. = Economic
Fac. = Facility
Facs. = Facilities
Fin. = Finance
Fncg. = Financing
G.O. = General Obligation
LIBOR = London Interbank Offered Rate
LOC = Letter of Credit
Preref. = Prerefunded
Redev. = Redevelopment
Ref. = Refunding
Rev. = Revenue
SIFMA = Securities Industry and Financial Markets Association
USD/$ = U.S. dollars
See Notes to Financial Statements
| 26 | American Funds Tax-Exempt Funds |
The Tax-Exempt Bond Fund of America
Summary investment portfolio July 31, 2018
| Bonds, notes & other debt instruments 93.84% | Principal amount (000) | Value (000) | ||||||
| Alabama 1.43% | ||||||||
| Black Belt Energy Gas Dist., Gas Supply Rev. Bonds, Series 2016-A, 4.00% 2046 (put 2021) | $ | 40,000 | $ | 41,740 | ||||
| Other securities | 230,909 | |||||||
| 272,649 | ||||||||
| California 7.45% | ||||||||
| Bay Area Toll Auth., San Francisco Bay Area Toll Bridge Rev. Bonds, Series 2008-B-1, (SIFMA Municipal Swap Index + 1.10%) 2.04% 2045 (put 2024)1 | 30,850 | 31,742 | ||||||
| Foothill/Eastern Transportation Corridor Agcy., Toll Road Rev. Ref. Bonds, Series 2013-A, 6.00% 2053 | 24,000 | 27,740 | ||||||
| Other securities | 1,357,784 | |||||||
| 1,417,266 | ||||||||
| Colorado 2.20% | ||||||||
| Health Facs. Auth., Health Facs. Rev. Bonds (Evangelical Lutheran Good Samaritan Society Project), Series 2012, 5.00% 2042 | 29,815 | 31,524 | ||||||
| Other securities | 387,949 | |||||||
| 419,473 | ||||||||
| Connecticut 1.21% | ||||||||
| Health and Educational Facs. Auth., Rev. Bonds (Yale University Issue), Series 2017-C-2, 5.00% 2057 (put 2023) | 30,000 | 33,825 | ||||||
| Other securities | 196,257 | |||||||
| 230,082 | ||||||||
| District of Columbia 1.67% | ||||||||
| Water and Sewer Auth., Public Utility Rev. Green Bonds, Series 2017-A, 5.00% 2052 | 24,900 | 28,287 | ||||||
| Other securities | 290,098 | |||||||
| 318,385 | ||||||||
| Florida 6.49% | ||||||||
| Orlando-Orange County Expressway Auth., Rev. Ref. Bonds, Series 2013-A, 5.00% 2035 | 27,350 | 30,386 | ||||||
| Tampa-Hillsborough County Expressway Auth., Rev. Ref. Bonds, Series 2017-B, 4.00% 2042 | 39,670 | 40,815 | ||||||
| Other securities | 1,163,292 | |||||||
| 1,234,493 | ||||||||
| Georgia 2.33% | ||||||||
| Main Street Natural Gas, Inc., Gas Supply Rev. Bonds, Series 2018-A, 4.00% 2048 (put 2023) | 42,500 | 45,314 | ||||||
| Other securities | 397,441 | |||||||
| 442,755 | ||||||||
| Illinois 13.23% | ||||||||
| City of Chicago, Transit Auth., Sales Tax Receipts Rev. Bonds, Series 2014, Assured Guaranty Municipal insured, 5.25% 2049 | 27,500 | 30,490 | ||||||
| City of Chicago, Transit Auth., Sales Tax Receipts Rev. Bonds, Series 2017, Assured Guaranty Municipal insured, 5.00% 2051 | 33,585 | 35,820 | ||||||
| Fin. Auth., Rev. Bonds (Mercy Health Corp.), Series 2016, 5.00% 2046 | 34,260 | 37,069 | ||||||
| Fin. Auth., Rev. Bonds (The Cable Foundation), Series 2016-A, 5.00% 2045 | 26,575 | 28,756 | ||||||
| Fin. Auth., Student Housing Rev. Bonds (CHF-DeKalb II, LLC - Northern Illinois University Project), Series 2011, 6.875% 2043 | 32,250 | 34,878 | ||||||
| Housing Dev. Auth., Homeowner Mortgage Rev. Bonds, Series 2018-A-1, 4.00% 2048 | 27,430 | 28,878 | ||||||
| Housing Dev. Auth., Multi Family Housing Rev. Notes (Marshall Field Garden Apartment Homes), Series 2015, (SIFMA Municipal Swap Index + 1.00%) 1.94% 2050 (put 2025)1 | 27,800 | 27,545 | ||||||
| Toll Highway Auth., Toll Highway Rev. Bonds, Series 2013-A, 5.00% 2038 | 34,430 | 37,704 | ||||||
| Other securities | 2,256,378 | |||||||
| 2,517,518 | ||||||||
| American Funds Tax-Exempt Funds | 27 |
The Tax-Exempt Bond Fund of America
| Bonds, notes & other debt instruments (continued) | Principal amount (000) | Value (000) | ||||||
| Kansas 0.72% | ||||||||
| Dept. of Transportation, Highway Rev. Bonds, Series 2004-C-4, (1-month USD-LIBOR x 0.70 + 0.50%) 1.964% 20241 | $ | 28,000 | $ | 28,084 | ||||
| University of Kansas Hospital Auth., Health Facs. and Improvement Rev. Bonds (University of Kansas Health System), Series 2017-A, 5.00% 2047 | 44,740 | 49,992 | ||||||
| Other securities | 58,145 | |||||||
| 136,221 | ||||||||
| Kentucky 0.78% | ||||||||
| Public Energy Auth., Gas Supply Rev. Bonds, Series 2018-A, 4.00% 2048 (put 2024) | 34,400 | 36,622 | ||||||
| Other securities | 111,268 | |||||||
| 147,890 | ||||||||
| Louisiana 1.71% | ||||||||
| Public Facs. Auth., Rev. and Rev. Ref. Bonds (Ochsner Clinic Foundation Project), Series 2017, 5.00% 2046 | 25,895 | 28,583 | ||||||
| Other securities | 295,910 | |||||||
| 324,493 | ||||||||
| Michigan 3.57% | ||||||||
| Hospital Fin. Auth., Hospital Rev. and Rev. Ref. Bonds (Trinity Health Credit Group), Series 2017-A, 4.00% 2036 | 31,480 | 32,494 | ||||||
| Housing Dev. Auth., Single Family Mortgage Rev. Bonds, Series 2016-B, 3.50% 2047 | 28,410 | 29,245 | ||||||
| Housing Dev. Auth., Single Family Mortgage Rev. Bonds, Series 2018-A, 4.00% 2048 | 36,900 | 39,026 | ||||||
| Other securities | 578,288 | |||||||
| 679,053 | ||||||||
| New Jersey 2.08% | ||||||||
| Housing and Mortgage Fin. Agcy., Single Family Housing Rev. Bonds, Series 2018-A, 4.50% 2048 | 40,000 | 42,935 | ||||||
| Other securities | 352,753 | |||||||
| 395,688 | ||||||||
| New York 7.10% | ||||||||
| Mortgage Agcy., Homeowner Mortgage Rev. Bonds, Series 208, 4.00% 2048 | 30,900 | 32,573 | ||||||
| New York City G.O. Bonds, Fiscal 2017, Series 2016-A-1, 5.00% 2030 | 740 | 861 | ||||||
| New York City G.O. Bonds, Fiscal 2017, Series 2016-A-1, 5.00% 2037 | 2,000 | 2,276 | ||||||
| New York City G.O. Bonds, Fiscal 2017, Series 2016-B-1, 5.00% 2032 | 1,500 | 1,739 | ||||||
| New York City G.O. Bonds, Fiscal 2017, Series 2016-B-1, 5.00% 2034 | 1,000 | 1,150 | ||||||
| New York City G.O. Bonds, Fiscal 2017, Series 2016-B-1, 5.00% 2037 | 2,500 | 2,858 | ||||||
| New York City G.O. Bonds, Fiscal 2017, Series 2016-B-1, 5.00% 2038 | 1,500 | 1,710 | ||||||
| New York City G.O. Bonds, Fiscal 2017, Series 2016-B-1, 5.00% 2041 | 1,500 | 1,709 | ||||||
| New York City G.O. Bonds, Fiscal 2018, Series 2017-B-1, 5.00% 2035 | 2,950 | 3,409 | ||||||
| New York City G.O. Bonds, Fiscal 2018, Series 2017-C, 5.00% 2026 | 1,500 | 1,776 | ||||||
| New York City G.O. Bonds, Fiscal 2018, Series 2017-C, 5.00% 2029 | 4,800 | 5,711 | ||||||
| New York City G.O. Bonds, Fiscal 2018, Series 2017-C, 5.00% 2030 | 8,075 | 9,562 | ||||||
| New York City G.O. Bonds, Fiscal 2018, Series 2017-C, 5.00% 2031 | 3,620 | 4,267 | ||||||
| New York City G.O. Bonds, Series 2013-F-1, 5.00% 2037 | 3,000 | 3,323 | ||||||
| New York City G.O. Bonds, Series 2013-H, 5.00% 2023 | 2,475 | 2,819 | ||||||
| New York City G.O. Bonds, Series 2013-J, 5.00% 2023 | 500 | 569 | ||||||
| New York City G.O. Bonds, Series 2014-A, 5.00% 2024 | 5,500 | 6,361 | ||||||
| New York City G.O. Bonds, Series 2014-G, 5.00% 2023 | 2,500 | 2,847 | ||||||
| New York City G.O. Bonds, Series 2014-J, 5.00% 2030 | 2,000 | 2,276 | ||||||
| New York City G.O. Bonds, Series 2015-A, 5.00% 2026 | 8,000 | 9,344 | ||||||
| New York City G.O. Bonds, Series 2015-C, 5.00% 2028 | 1,000 | 1,152 | ||||||
| New York City G.O. Bonds, Series 2015-C, 5.00% 2030 | 10,000 | 11,433 | ||||||
| New York City G.O. Bonds, Series 2015-C, 5.00% 2032 | 3,500 | 3,988 | ||||||
| New York City G.O. Bonds, Series 2015-C, 5.00% 2033 | 1,000 | 1,136 | ||||||
| New York City G.O. Bonds, Series 2015-D, 5.00% 2030 | 2,560 | 2,927 | ||||||
| New York City G.O. Bonds, Series 2017-A, 5.00% 2026 | 10,000 | 11,842 | ||||||
| New York City G.O. Bonds, Series 2017-A, 5.00% 2027 | 1,500 | 1,791 | ||||||
| New York City G.O. Bonds, Series 2017-A, 5.00% 2028 | 1,000 | 1,188 | ||||||
| New York City G.O. Bonds, Series 2017-C, 5.00% 2026 | 5,000 | 5,921 | ||||||
| New York City G.O. Bonds, Series 2017-C, 5.00% 2028 | 2,200 | 2,593 | ||||||
| 28 | American Funds Tax-Exempt Funds |
The Tax-Exempt Bond Fund of America
| Principal amount (000) | Value (000) | |||||||
| New York City G.O. Bonds, Series 2018-E-1, 5.00% 2032 | $ | 2,575 | $ | 3,022 | ||||
| New York City G.O. Bonds, Series 2018-E-1, 5.00% 2037 | 6,345 | 7,332 | ||||||
| New York City G.O. Bonds, Series 2018-F-1, 5.00% 2037 | 2,000 | 2,313 | ||||||
| Utility Debt Securitization Auth., Restructuring Bonds, Series 2017, 5.00% 2041 | 31,500 | 36,612 | ||||||
| Other securities | 1,161,440 | |||||||
| 1,351,830 | ||||||||
| North Carolina 0.52% | ||||||||
| Housing Fin. Agcy., Home Ownership Rev. Ref. Bonds, Series 39-B, 4.00% 2048 | 25,950 | 27,478 | ||||||
| Other securities | 72,324 | |||||||
| 99,802 | ||||||||
| Ohio 2.38% | ||||||||
| Buckeye Tobacco Settlement Fncg. Auth., Tobacco Settlement Asset-Backed Bonds, Series 2007-A-2, 6.50% 2047 | 27,115 | 27,928 | ||||||
| Other securities | 424,688 | |||||||
| 452,616 | ||||||||
| Pennsylvania 4.19% | ||||||||
| County of Montgomery, Industrial Dev. Auth., Retirement Communities Rev. Bonds (ACTS Retirement-Life Communities, Inc. Obligated Group), Series 2016, 5.00% 2036 | 26,650 | 29,462 | ||||||
| Other securities | 768,729 | |||||||
| 798,191 | ||||||||
| Tennessee 1.22% | ||||||||
| Metropolitan Government of Nashville and Davidson County, G.O. Improvement Bonds, Series 2013-A, 5.00% 2029 (preref. 2023) | 31,610 | 35,711 | ||||||
| Other securities | 197,244 | |||||||
| 232,955 | ||||||||
| Texas 9.87% | ||||||||
| City of Austin, Water and Wastewater System Rev. Ref. Bonds, Series 2016, 5.00% 2041 | 26,405 | 30,107 | ||||||
| City of Austin, Water and Wastewater System Rev. Ref. Bonds, Series 2016, 5.00% 2045 | 26,860 | 30,542 | ||||||
| G.O. Bonds, Water Financial Assistance Bonds (Water Infrastructure Fund), Series 2009-A, 5.00% 2028 | 1,500 | 1,500 | ||||||
| G.O. Bonds, Water Financial Assistance Bonds (Water Infrastructure Fund), Series 2011-A, 5.00% 2021 | 1,400 | 1,529 | ||||||
| G.O. Bonds, Water Financial Assistance Bonds (Water Infrastructure Fund), Series 2013-B, 5.00% 2026 | 1,600 | 1,808 | ||||||
| Grand Parkway Transportation Corp., Grand Parkway System Toll Rev. Bonds, Series 2013-B, 5.00% 2053 | 32,800 | 35,932 | ||||||
| Transportation Commission, G.O. Mobility Fund Bonds, Series 2014-A, 5.00% 2044 | 15,000 | 16,892 | ||||||
| Transportation Commission, G.O. Mobility Fund Bonds, Series 2014-B, (SIFMA Municipal Swap Index + 0.38%) 1.32% 2041 (put 2018)1 | 1,500 | 1,500 | ||||||
| Transportation Commission, Highway Improvement G.O. Bonds, Series 2016, 5.00% 2043 | 10,020 | 11,331 | ||||||
| Water Dev. Board, State Water Implementation Rev. Fund, Rev. Bonds (Master Trust), Series 2017-A, 5.00% 2042 | 34,675 | 39,973 | ||||||
| Other securities | 1,706,458 | |||||||
| 1,877,572 | ||||||||
| United States 0.20% | ||||||||
| Freddie Mac, Multi Family Certificates, Class A, Series 2017-M-042, (SIFMA Municipal Swap Index + 0.30%) 1.24% 20331 | 37,430 | 37,430 | ||||||
| Virginia 2.80% | ||||||||
| City of Newport News, Industrial Dev. Auth., Health Systems Rev. Ref. Bonds (Custodial Receipts), Series 2015, 5.33% 20452 | 41,100 | 43,305 | ||||||
| Other securities | 488,592 | |||||||
| 531,897 | ||||||||
| American Funds Tax-Exempt Funds | 29 |
The Tax-Exempt Bond Fund of America
| Bonds, notes & other debt instruments (continued) | Principal amount (000) | Value (000) | ||||||
| Washington 2.85% | ||||||||
| Various Purpose G.O. Rev. Ref. Bonds, Series 2018-R-D, 5.00% 2035 | $ | 26,605 | $ | 30,819 | ||||
| Health Care Facs. Auth., Rev. Bonds (Catholic Health Initiatives), Series 2013-B-1, (SIFMA Municipal Swap Index + 1.00%) 1.94% 2035 (put 2021)1 | 49,750 | 49,894 | ||||||
| Other securities | 461,364 | |||||||
| 542,077 | ||||||||
| Wisconsin 1.94% | ||||||||
| General Fund Annual Appropriation Rev. Ref. Bonds, Series 2009-A, 6.00% 2036 (preref. 2019) | 54,460 | 56,310 | ||||||
| Other securities | 313,066 | |||||||
| 369,376 | ||||||||
| Other states & U.S. territories 15.90% | ||||||||
| Other securities | 3,025,301 | |||||||
| Total bonds, notes & other debt instruments (cost: $17,599,519,000) | 17,855,013 | |||||||
| Short-term securities 6.10% | ||||||||
| State of Maryland, County of Montgomery, IAM Commercial Paper, Series 2009, 1.64% 8/2/2018 | 30,900 | 30,900 | ||||||
| State of Maryland, County of Montgomery, IAM Commercial Paper, Series 2009, 1.65% 8/1/2018 | 13,000 | 13,000 | ||||||
| State of Maryland, County of Montgomery, IAM Commercial Paper, Series 2009-A, 1.19% 9/4/2018 | 30,000 | 30,000 | ||||||
| State of Maryland, County of Montgomery, IAM Commercial Paper, Series 2009-A, 1.27% 10/3/2018 | 6,000 | 6,000 | ||||||
| State of Maryland, County of Montgomery, IAM Commercial Paper, Series 2009-B, 1.13% 8/7/2018 | 3,000 | 3,000 | ||||||
| State of Maryland, County of Montgomery, IAM Commercial Paper, Series 2009-B, 1.13% 8/9/2018 | 2,500 | 2,500 | ||||||
| State of Maryland, County of Montgomery, IAM Commercial Paper, Series 2010-B, 1.10% 8/14/2018 | 25,000 | 25,000 | ||||||
| State of Minnesota, Health Care Facs. Rev. Bonds, IAM Commercial Paper, 1.28% 8/13/2018 | 30,000 | 30,000 | ||||||
| State of Mississippi, Business Fin. Corp., Gulf Opportunity Zone Industrial Dev. Rev. Bonds (Chevron U.S.A. Inc. Project), Series 2007-A, 1.48% 20301 | 50,000 | 50,000 | ||||||
| State of Mississippi, Business Fin. Corp., Gulf Opportunity Zone Industrial Dev. Rev. Bonds (Chevron U.S.A. Inc. Project), Series 2011-F, 0.05% 20351 | 5,000 | 5,000 | ||||||
| State of New York, Metropolitan Transportation Auth., Transportation Rev. Bond Anticipation Notes, Series 2018-A-1, 4.00% 2019 | 35,000 | 35,828 | ||||||
| State of New York, Metropolitan Transportation Auth., Transportation Rev. Bonds, Series 2017-C-2A, 4.00% 5/15/20193 | 66,000 | 67,309 | ||||||
| State of New York, New York City G.O. Bonds, Fiscal 2006, Series E, Subseries E-2, 1.49% 20341 | 14,505 | 14,505 | ||||||
| State of New York, New York City G.O. Bonds, Series 2006-H-1, 1.50% 20361 | 5,235 | 5,235 | ||||||
| State of New York, New York City G.O. Bonds, Series 2006-L-5, 1.49% 20351 | 36,000 | 36,000 | ||||||
| State of New York, New York City G.O. Bonds, Series 2008-J-3, 1.56% 20231 | 55,900 | 55,900 | ||||||
| State of New York, New York City G.O. Bonds, Series 2008-J-5, 1.55% 20281 | 16,035 | 16,035 | ||||||
| State of New York, New York City G.O. Bonds, Series 2008-L-3, 1.55% 20361 | 14,120 | 14,120 | ||||||
| State of New York, New York City G.O. Bonds, Series 2013-F-3, 1.55% 20421 | 7,000 | 7,000 | ||||||
| State of New York, New York City Transitional Fin. Auth., Future Tax Secured Bonds, Fiscal 2016, Series 2015-A-4, 1.49% 20411 | 1,000 | 1,000 | ||||||
| State of New York, New York City Transitional Fin. Auth., Future Tax Secured Bonds, Series 2010-G-5, 1.05% 20341 | 3,000 | 3,000 | ||||||
| State of New York, New York City Transitional Fin. Auth., Future Tax Secured Rev. Ref. Bonds, Fiscal 2003, Series 2002-A-2, 1.56% 20291 | 30,100 | 30,100 | ||||||
| State of New York, New York City Transitional Fin. Auth., Future Tax Secured Rev. Ref. Bonds, Series 2015-E-3, 1.50% 20451 | 1,500 | 1,500 | ||||||
| State of New York, New York City Transitional Fin. Auth., Future Tax Secured Rev. Ref. Bonds, Series 2016-E-4, 1.50% 20451 | 4,470 | 4,470 | ||||||
| State of New York, New York City Transitional Fin. Auth., Recovery Bonds, Fiscal 2003, Series 2002-1-C, 1.50% 20221 | 430 | 430 | ||||||
| 30 | American Funds Tax-Exempt Funds |
The Tax-Exempt Bond Fund of America
| Principal amount (000) | Value (000) | |||||||
| State of New York, New York City Transitional Fin. Auth., Future Tax Secured Bonds, Series 2003-C-5, 1.53% 20311 | $ | 13,640 | $ | 13,640 | ||||
| State of Ohio, County of Franklin, Rev. Bonds (CHE Trinity Health Credit Group), Series 2013-OH, 1.80% 2046 (put 2018)3 | 34,000 | 34,000 | ||||||
| State of Texas, Lower Colorado River Auth., Rev. Bonds, 1.08% 8/22/2018 | 33,489 | 33,489 | ||||||
| State of Texas, Lower Colorado River Auth., Rev. Bonds, 1.32% 8/20/2018 | 8,000 | 8,000 | ||||||
| State of Texas, Tax and Rev. Anticipation Notes, Series 2017, 4.00% 8/30/2018 | 205,005 | 205,453 | ||||||
| Other securities | 379,255 | |||||||
| Total short-term securities (cost: $1,161,598,000) | 1,161,669 | |||||||
| Total investment securities 99.94% (cost: $18,761,117,000) | 19,016,682 | |||||||
| Other assets less liabilities 0.06% | 11,380 | |||||||
| Net assets 100.00% | $ | 19,028,062 | ||||||
This summary investment portfolio is designed to streamline the report and help investors better focus on the fund’s principal holdings. See the inside back cover for details on how to obtain a complete schedule of portfolio holdings.
“Other securities” includes all issues that are not disclosed separately in the summary investment portfolio. “Other securities” includes a security which was valued under fair value procedures adopted by authority of the board of trustees. The total value of the security which was valued under fair value procedures was $6,551,000, which represented .03% of the net assets of the fund.
Futures contracts
| Contracts | Type | Number of contracts | Expiration | Notional amount (000) | 4 | Value at 7/31/2018 (000) | 5 | Unrealized (depreciation) appreciation at 7/31/2018 (000) | ||||||||||
| 5 Year U.S. Treasury Note Futures | Long | 7,000 | October 2018 | $ 700,000 | $ 791,875 | $ | (73 | ) | ||||||||||
| 30 Year Ultra U.S. Treasury Bond Futures | Short | 1,300 | September 2018 | (130,000 | ) | (203,978 | ) | 1,942 | ||||||||||
| $ | 1,869 | |||||||||||||||||
| 1 | Coupon rate may change periodically. For short-term securities, the date of the next scheduled coupon rate change is considered to be the maturity date. |
| 2 | Acquired in a transaction exempt from registration under Rule 144A of the Securities Act of 1933. May be resold in the U.S. in transactions exempt from registration, normally to qualified institutional buyers. The total value of all such securities, including those in “Other securities,” was $322,378,000, which represented 1.69% of the net assets of the fund. |
| 3 | For short-term securities, the mandatory put date is considered to be the maturity date. |
| 4 | Notional amount is calculated based on the number of contracts and notional contract size. |
| 5 | Value is calculated based on the notional amount and current market price. |
| American Funds Tax-Exempt Funds | 31 |
The Tax-Exempt Bond Fund of America
Key to abbreviations and symbol
Agcy. = Agency
Auth. = Authority
Dept. = Department
Dev. = Development
Dist. = District
Econ. = Economic
Fac. = Facility
Facs. = Facilities
Fin. = Finance
Fncg. = Financing
G.O. = General Obligation
LIBOR = London Interbank Offered Rate
LOC = Letter of Credit
Preref. = Prerefunded
Redev. = Redevelopment
Ref. = Refunding
Rev. = Revenue
SIFMA = Securities Industry and Financial Markets Association
USD/$ = U.S. dollars
See Notes to Financial Statements
| 32 | American Funds Tax-Exempt Funds |
American High-Income Municipal Bond Fund
Summary investment portfolio July 31, 2018
| Bonds, notes & other debt instruments 93.32% | Principal amount (000) | Value (000) | ||||||
| Arizona 2.25% | ||||||||
| City of Phoenix, Industrial Dev. Auth., Education Fac. Rev. Bonds (Legacy Traditional Schools East Mesa and Cadence Campuses), Series 2017-A, 4.00% 20221 | $ | 15,000 | $ | 14,712 | ||||
| Other securities | 131,124 | |||||||
| 145,836 | ||||||||
| Colorado 4.88% | ||||||||
| City and County of Denver, Dept. of Aviation, Special Facs. Airport Rev. Ref. Bonds (United Air Lines Project), Series 2017, AMT, 5.00% 2032 | 8,905 | 9,557 | ||||||
| Health Facs. Auth., Rev. Ref. Bonds (Frasier Meadows), Series 2017-A, 5.25% 2047 | 12,230 | 13,286 | ||||||
| Other securities | 294,020 | |||||||
| 316,863 | ||||||||
| District of Columbia 1.05% | ||||||||
| Tobacco Settlement Fncg. Corp., Tobacco Settlement Asset-Backed Bonds, Series 2006-A, 0% 2046 | 169,320 | 29,941 | ||||||
| Other securities | 38,502 | |||||||
| 68,443 | ||||||||
| Florida 5.61% | ||||||||
| North Broward Hospital Dist., Rev. Bonds (Broward Health), Series 2017-B, 5.00% 2042 | 17,500 | 18,832 | ||||||
| Other securities | 345,384 | |||||||
| 364,216 | ||||||||
| Georgia 1.79% | ||||||||
| County of Burke, Dev. Auth., Pollution Control Rev. Bonds (Oglethorpe Power Corp. - Vogtle Project), Series 2017-C, 4.125% 2045 | 18,800 | 18,753 | ||||||
| Other securities | 97,452 | |||||||
| 116,205 | ||||||||
| Hawaii 0.27% | ||||||||
| Dept. of Budget and Fin., Special Purpose Rev. Ref. Bonds (Hawaiian Electric Co., Inc.), Series 2017-B, AMT, 4.00% 2037 | 13,800 | 14,031 | ||||||
| Other securities | 3,149 | |||||||
| 17,180 | ||||||||
| Illinois 14.66% | ||||||||
| City of Chicago, Board of Education, Unlimited Tax G.O. Bonds (Dedicated Alternate Rev.), Series 2015-C, 5.25% 2039 | 7,145 | 7,405 | ||||||
| City of Chicago, Board of Education, Unlimited Tax G.O. Bonds (Dedicated Rev.), Series 2010-F, 5.00% 2018 | 800 | 806 | ||||||
| City of Chicago, Board of Education, Unlimited Tax G.O. Bonds (Dedicated Rev.), Series 2010-F, 5.00% 2018 (escrowed to maturity) | 200 | 202 | ||||||
| City of Chicago, Board of Education, Unlimited Tax G.O. Bonds (Dedicated Rev.), Series 2011-A, 5.50% 2039 | 1,625 | 1,671 | ||||||
| City of Chicago, Board of Education, Unlimited Tax G.O. Bonds (Dedicated Rev.), Series 2016-B, 6.50% 2046 | 6,650 | 7,615 | ||||||
| City of Chicago, Board of Education, Unlimited Tax G.O. Bonds (Dedicated Rev.), Series 2017-A, 7.00% 20461 | 23,560 | 28,204 | ||||||
| City of Chicago, Board of Education, Unlimited Tax G.O. Bonds (Dedicated Rev.), Series 2017-C, 5.00% 2030 | 3,000 | 3,157 | ||||||
| City of Chicago, Board of Education, Unlimited Tax G.O. Rev. Ref. Bonds (Dedicated Rev.), Series 2008-C, 5.00% 2029 | 1,610 | 1,613 | ||||||
| City of Chicago, Board of Education, Unlimited Tax G.O. Rev. Ref. Bonds (Dedicated Rev.), Series 2008-C, 5.25% 2025 | 1,500 | 1,505 | ||||||
| City of Chicago, Board of Education, Unlimited Tax G.O. Rev. Ref. Bonds (Dedicated Rev.), Series 2017-B, 6.75% 20301 | 3,500 | 4,207 | ||||||
| City of Chicago, Board of Education, Unlimited Tax G.O. Rev. Ref. Bonds (Dedicated Rev.), Series 2017-B, 7.00% 20421 | 28,185 | 33,837 | ||||||
| City of Chicago, Board of Education, Unlimited Tax G.O. Rev. Ref. Bonds (Dedicated Rev.), Series 2017-C, 5.00% 2021 | 2,000 | 2,083 | ||||||
| City of Chicago, Board of Education, Unlimited Tax G.O. Rev. Ref. Bonds (Dedicated Rev.), Series 2017-C, 5.00% 2024 | 2,000 | 2,107 | ||||||
| American Funds Tax-Exempt Funds | 33 |
American High-Income Municipal Bond Fund
| Bonds, notes & other debt instruments (continued) | Principal amount (000) | Value (000) | ||||||
| Illinois (continued) | ||||||||
| City of Chicago, Board of Education, Unlimited Tax G.O. Rev. Ref. Bonds (Dedicated Rev.), Series 2017-C, 5.00% 2025 | $ | 4,000 | $ | 4,218 | ||||
| City of Chicago, Board of Education, Unlimited Tax G.O. Rev. Ref. Bonds (Dedicated Rev.), Series 2017-D, 5.00% 2021 | 1,500 | 1,562 | ||||||
| City of Chicago, Board of Education, Unlimited Tax G.O. Rev. Ref. Bonds (Dedicated Rev.), Series 2017-F, 5.00% 2024 | 2,000 | 2,107 | ||||||
| City of Chicago, Board of Education, Unlimited Tax G.O. Rev. Ref. Bonds (Dedicated Rev.), Series 2017-G, 5.00% 2044 | 5,000 | 5,131 | ||||||
| City of Chicago, Board of Education, Unlimited Tax G.O. Rev. Ref. Bonds (Dedicated Rev.), Series 2017-H, 5.00% 2036 | 10,000 | 10,346 | ||||||
| City of Chicago, Board of Education, Unlimited Tax G.O. Rev. Ref. Bonds (Dedicated Rev.), Series 2017-H, 5.00% 2046 | 7,800 | 7,992 | ||||||
| City of Chicago, Chicago Midway Airport, Rev. Ref. Bonds, Series 2014-A, AMT, 5.00% 2041 | 13,000 | 14,060 | ||||||
| City of Chicago, School Reform Board of Trustees of the Board of Education, Unlimited Tax G.O. Bonds (Dedicated Tax Rev.), Capital Appreciation Bonds, Series 1999-A, National insured, 0% 2025 | 1,015 | 756 | ||||||
| City of Chicago, School Reform Board of Trustees of the Board of Education, Unlimited Tax G.O. Bonds (Dedicated Tax Rev.), Capital Appreciation Bonds, Series 1999-A, National insured, 0% 2031 | 2,170 | 1,176 | ||||||
| City of Chicago, School Reform Board of Trustees of the Board of Education, Unlimited Tax G.O. Bonds (Dedicated Tax Rev.), Series 1998-B-1, National insured, 0% 2031 | 5,060 | 2,742 | ||||||
| City of Chicago, School Reform Board of Trustees of the Board of Education, Unlimited Tax G.O. Bonds (Dedicated Tax Rev.), Series 1999-A, National insured, 0% 2018 | 2,135 | 2,119 | ||||||
| City of Chicago, School Reform Board of Trustees of the Board of Education, Unlimited Tax G.O. Bonds (Dedicated Tax Rev.), Series 1999-A, National insured, 0% 2024 | 2,070 | 1,630 | ||||||
| City of Chicago, School Reform Board of Trustees of the Board of Education, Unlimited Tax G.O. Bonds (Dedicated Tax Rev.), Series 2011-A, 5.00% 2041 | 12,405 | 12,556 | ||||||
| City of Chicago, School Reform Board of Trustees of the Board of Education, Unlimited Tax G.O. Bonds (Dedicated Tax Rev.), Series 2012-A, 5.00% 2042 | 7,580 | 7,641 | ||||||
| City of Chicago, School Reform Board of Trustees of the Board of Education, Unlimited Tax G.O. Bonds (Dedicated Tax Rev.), Series 2016-A, 7.00% 2044 | 6,510 | 7,578 | ||||||
| City of Chicago, Transit Auth., Sales Tax Receipts Rev. Bonds, Series 2017, Assured Guaranty Municipal insured, 5.00% 2051 | 21,750 | 23,197 | ||||||
| Fin. Auth., Rev. Bonds (Friendship Village Schaumburg), Series 2017, 5.125% 2045 | 16,750 | 16,689 | ||||||
| Fin. Auth., Rev. Bonds (Mercy Health Corp.), Series 2016, 5.00% 2040 | 12,000 | 13,035 | ||||||
| Fin. Auth., Rev. Bonds (Mercy Health Corp.), Series 2016, 5.00% 2046 | 17,165 | 18,572 | ||||||
| Fin. Auth., Student Housing Rev. Bonds (CHF-DeKalb II, LLC - Northern Illinois University Project), Series 2011, 6.875% 2043 | 16,510 | 17,855 | ||||||
| G.O. Bonds, Series 2013, 5.00% 2021 | 860 | 903 | ||||||
| G.O. Bonds, Series 2013, 5.00% 2023 | 685 | 731 | ||||||
| G.O. Bonds, Series 2014, 5.00% 2026 | 2,025 | 2,151 | ||||||
| G.O. Bonds, Series 2014, 5.00% 2027 | 2,000 | 2,142 | ||||||
| G.O. Bonds, Series 2014, 5.00% 2039 | 13,550 | 14,010 | ||||||
| G.O. Bonds, Series 2016, 4.00% 2032 | 6,000 | 5,795 | ||||||
| G.O. Bonds, Series 2016, 5.00% 2025 | 1,000 | 1,076 | ||||||
| G.O. Bonds, Series 2016, 5.00% 2028 | 1,500 | 1,602 | ||||||
| G.O. Bonds, Series 2016, 5.00% 2033 | 4,000 | 4,224 | ||||||
| G.O. Bonds, Series 2016, 5.00% 2038 | 1,000 | 1,048 | ||||||
| G.O. Bonds, Series 2016, Assured Guaranty Municipal insured, 5.00% 2041 | 2,125 | 2,213 | ||||||
| G.O. Bonds, Series 2017-A, 5.00% 2018 | 1,000 | 1,007 | ||||||
| G.O. Bonds, Series 2017-A, 5.00% 2035 | 1,000 | 1,059 | ||||||
| G.O. Bonds, Series 2017-A, 5.00% 2036 | 3,000 | 3,172 | ||||||
| G.O. Bonds, Series 2017-C, 5.00% 2029 | 7,500 | 8,033 | ||||||
| G.O. Bonds, Series 2017-D, 5.00% 2027 | 8,500 | 9,213 | ||||||
| G.O. Bonds, Series 2017-D, BMA insured, 5.00% 2026 | 10,000 | 10,805 | ||||||
| G.O. Bonds, Series 2017-D, BMA insured, 5.00% 2028 | 4,500 | 4,841 | ||||||
| G.O. Rev. Ref. Bonds, Series 2012, 4.00% 2025 | 405 | 406 | ||||||
| G.O. Rev. Ref. Bonds, Series 2016, 5.00% 2026 | 3,000 | 3,233 | ||||||
| G.O. Rev. Ref. Bonds, Series 2016, 5.00% 2028 | 3,000 | 3,221 | ||||||
| G.O. Rev. Ref. Bonds, Series 2016, Assured Guaranty Municipal insured, 4.00% 2030 | 750 | 778 | ||||||
| Other securities | 604,598 | |||||||
| 951,635 | ||||||||
| 34 | American Funds Tax-Exempt Funds |
American High-Income Municipal Bond Fund
| Principal amount (000) | Value (000) | |||||||
| Indiana 1.54% | ||||||||
| Fin. Auth., Midwestern Disaster Relief Rev. Bonds (Ohio Valley Electric Corp. Project), Series 2012-A, 5.00% 2032 | $ | 17,560 | $ | 17,632 | ||||
| Other securities | 82,595 | |||||||
| 100,227 | ||||||||
| Massachusetts 2.40% | ||||||||
| Dev. Fin. Agcy., Rev. Bonds (Linden Ponds, Inc. Fac.), Series 2011-A-1, 6.25% 2046 | 14,253 | 14,744 | ||||||
| Dev. Fin. Agcy., Rev. Bonds (Linden Ponds, Inc. Fac.), Series 2016-A, 4.68% 20211 | 13,930 | 14,011 | ||||||
| Educational Fncg. Auth., Education Loan Rev. Bonds, Series 2016-J, AMT, 3.50% 2033 | 23,225 | 23,091 | ||||||
| Educational Fncg. Auth., Education Loan Rev. Bonds, Series 2017-A, AMT, 3.625% 2032 | 15,000 | 15,108 | ||||||
| Other securities | 88,823 | |||||||
| 155,777 | ||||||||
| Michigan 2.83% | ||||||||
| County of Wayne, Airport Auth., Airport Rev. Ref. Bonds (Detroit Metropolitan Wayne County Airport), Series 2012-D, AMT, 5.00% 2028 | 12,000 | 13,182 | ||||||
| Other securities | 170,682 | |||||||
| 183,864 | ||||||||
| New Jersey 3.96% | ||||||||
| Econ. Dev. Auth., School Facs. Construction Rev. Ref. Bonds, Series 2013-I, (SIFMA Municipal Swap Index + 1.60%) 2.54% 20282 | 13,500 | 13,382 | ||||||
| Econ. Dev. Auth., Special Fac. Rev. Bonds (Continental Airlines, Inc. Project), Series 1999, AMT, 5.125% 2023 | 3,500 | 3,794 | ||||||
| Econ. Dev. Auth., Special Fac. Rev. Bonds (Continental Airlines, Inc. Project), Series 1999, AMT, 5.25% 2029 | 16,300 | 17,735 | ||||||
| Econ. Dev. Auth., Special Fac. Rev. Bonds (Continental Airlines, Inc. Project), Series 2000-B, AMT, 5.625% 2030 | 3,750 | 4,248 | ||||||
| Econ. Dev. Auth., Special Fac. Rev. Bonds (Continental Airlines, Inc. Project), Series 2003, AMT, 5.50% 2033 | 3,500 | 3,873 | ||||||
| Econ. Dev. Auth., Special Fac. Rev. Ref. Bonds (Continental Airlines, Inc. Project), Series 2012, AMT, 5.75% 2027 | 4,500 | 4,971 | ||||||
| South Jersey Transportation Auth., Transportation System Rev. Bonds, Series 2014-A, 5.00% 2039 | 12,650 | 13,735 | ||||||
| Other securities | 195,522 | |||||||
| 257,260 | ||||||||
| New York 3.77% | ||||||||
| Liberty Dev. Corp., Liberty Rev. Ref. Bonds (Bank of America Tower at One Bryant Park Project), Series 2010, 6.375% 2049 | 13,360 | 14,082 | ||||||
| Metropolitan Transportation Auth., Transportation Rev. Bond Anticipation Notes, Series 2017-C-1D, 4.00% 2019 | 16,900 | 17,134 | ||||||
| Transportation Dev. Corp., Special Fac. Rev. Ref. Bonds (American Airlines, Inc. John F. Kennedy International Airport Project), Series 2016, AMT, 5.00% 2020 | 15,100 | 15,873 | ||||||
| Transportation Dev. Corp., Special Facs. Bonds (LaGuardia Airport Terminal B Redev. Project), Series 2016-A, AMT, 5.25% 2050 | 16,950 | 18,380 | ||||||
| Other securities | 179,482 | |||||||
| 244,951 | ||||||||
| Ohio 3.81% | ||||||||
| Buckeye Tobacco Settlement Fncg. Auth., Tobacco Settlement Asset-Backed Bonds, Convertible Capital Appreciation Bonds, Series 2007-A-3, 6.25% 20373 | 9,430 | 9,878 | ||||||
| Buckeye Tobacco Settlement Fncg. Auth., Tobacco Settlement Asset-Backed Bonds, Series 2007-A-2, 5.875% 2047 | 32,170 | 32,447 | ||||||
| Buckeye Tobacco Settlement Fncg. Auth., Tobacco Settlement Asset-Backed Bonds, Series 2007-A-2, 6.50% 2047 | 34,155 | 35,179 | ||||||
| Other securities | 169,601 | |||||||
| 247,105 | ||||||||
| American Funds Tax-Exempt Funds | 35 |
American High-Income Municipal Bond Fund
| Bonds, notes & other debt instruments (continued) | Principal amount (000) | Value (000) | ||||||
| Oklahoma 0.72% | ||||||||
| Trustees of the Tulsa Municipal Airport Trust, American Airlines Inc. Rev. Ref. Bonds, Series 2001-B, AMT, 5.50% 2035 | $ | 15,875 | $ | 17,012 | ||||
| Other securities | 29,428 | |||||||
| 46,440 | ||||||||
| Pennsylvania 5.51% | ||||||||
| Econ. Dev. Fncg. Auth., Private Activity Rev. Bonds (The Pennsylvania Rapid Bridge Replacement Project), Series 2015, AMT, 5.00% 2034 | 16,300 | 17,929 | ||||||
| County of Montgomery, Industrial Dev. Auth., Health Systems Rev. Bonds (Albert Einstein Healthcare Network Issue), Series 2015-A, 5.25% 2045 | 14,440 | 15,407 | ||||||
| City of Philadelphia, Hospitals and Higher Education Facs. Auth., Hospital Rev. Bonds (Temple University Health System Obligated Group), Series 2012-A, 5.625% 2042 | 12,320 | 13,316 | ||||||
| Other securities | 311,222 | |||||||
| 357,874 | ||||||||
| Puerto Rico 2.91% | ||||||||
| Highways and Transportation Auth., Transportation Rev. Ref. Bonds, Series 2007-N, Assured Guaranty insured, 5.25% 2036 | 11,350 | 13,160 | ||||||
| Industrial, Tourist, Educational, Medical and Environmental Control Facs. Fncg. Auth., Hospital Rev. and Rev. Ref. Bonds (Hospital Auxilio Mutuo Obligated Group Project), Series 2011-A, 6.00% 2033 | 15,130 | 15,754 | ||||||
| Other securities | 160,223 | |||||||
| 189,137 | ||||||||
| Texas 7.20% | ||||||||
| County of Harris, Cultural Education Facs. Fin. Corp., First Mortgage Rev. Bonds (Brazos Presbyterian Homes, Inc. Project), Series 2016, 5.00% 2048 | 12,830 | 13,551 | ||||||
| City of Houston, Airport System Special Facs. Rev. Bonds (Continental Airlines, Inc. Terminal Improvement Projects), Series 2011, AMT, 6.50% 2030 | 9,300 | 10,150 | ||||||
| City of Houston, Airport System Special Facs. Rev. Bonds (Continental Airlines, Inc. Terminal Improvement Projects), Series 2011, AMT, 6.625% 2038 | 3,000 | 3,280 | ||||||
| City of Houston, Airport System Special Facs. Rev. Bonds (United Airlines, Inc. Airport Improvement Projects), Series 2018-C, AMT, 5.00% 2028 | 20,000 | 22,378 | ||||||
| City of Houston, Airport System Special Facs. Rev. Ref. Bonds (United Airlines, Inc. Airport Improvement Projects), Series 2015-B-1, AMT, 5.00% 2030 | 3,000 | 3,258 | ||||||
| City of Houston, Airport System Special Facs. Rev. Ref. Bonds (United Airlines, Inc. Airport Improvement Projects), Series 2015-C, AMT, 5.00% 2020 | 8,485 | 8,928 | ||||||
| City of Houston, Airport System Special Facs. Rev. Ref. Bonds (United Airlines, Inc. Terminal E Project), Series 2014, AMT, 4.75% 2024 | 5,500 | 5,946 | ||||||
| City of Houston, Airport System Special Facs. Rev. Ref. Bonds (United Airlines, Inc. Terminal E Project), Series 2014, AMT, 5.00% 2029 | 6,745 | 7,304 | ||||||
| Turnpike Auth., Central Texas Turnpike System, Rev. Bonds, Series 2002-A, AMBAC insured, 0% 2028 | 21,800 | 15,836 | ||||||
| Other securities | 376,933 | |||||||
| 467,564 | ||||||||
| Utah 0.54% | ||||||||
| Hideout Local Dist. No. 1, Special Assessment Bonds, Series 2017, 6.75% 20371 | 27,800 | 27,833 | ||||||
| Other securities | 7,146 | |||||||
| 34,979 | ||||||||
| Virginia 1.97% | ||||||||
| City of Newport News, Industrial Dev. Auth., Health Systems Rev. Ref. Bonds (Custodial Receipts), Series 2015, 5.33% 20451 | 27,900 | 29,397 | ||||||
| Other securities | 98,585 | |||||||
| 127,982 | ||||||||
| Wisconsin 2.31% | ||||||||
| Housing and Econ. Dev. Auth., Home Ownership Rev. Bonds, Series 2016-A, AMT, 3.50% 2046 | 16,430 | 16,879 | ||||||
| Other securities | 132,833 | |||||||
| 149,712 | ||||||||
| 36 | American Funds Tax-Exempt Funds |
American High-Income Municipal Bond Fund
| Principal amount (000) | Value (000) | |||||||
| Other states & U.S. territories 23.34% | ||||||||
| Other securities | $ | 1,514,606 | ||||||
| Total bonds, notes & other debt instruments (cost: $5,922,796,000) | 6,057,856 | |||||||
| Short-term securities 5.97% | ||||||||
| State of Maryland, County of Montgomery, IAM Commercial Paper, Series 2009-B, 1.29% 8/7/2018 | $ | 5,000 | 5,000 | |||||
| State of Maryland, County of Montgomery, IAM Commercial Paper, Series 2009, 1.64% 8/2/2018 | 5,000 | 5,000 | ||||||
| State of Maryland, County of Montgomery, IAM Commercial Paper, Series 2009-A, 1.27% 10/3/2018 | 4,000 | 4,000 | ||||||
| State of Maryland, County of Montgomery, IAM Commercial Paper, Series 2009-B, 1.13% 8/9/2018 | 1,000 | 1,000 | ||||||
| State of Maryland, County of Montgomery, IAM Commercial Paper, Series 2010-B, 1.28% 10/10/2018 | 6,750 | 6,750 | ||||||
| State of Mississippi, Business Fin. Corp., Gulf Opportunity Zone Industrial Dev. Rev. Bonds (Chevron U.S.A. Inc. Project), Series 2007-A, 1.48% 20302 | 500 | 500 | ||||||
| State of Mississippi, Business Fin. Corp., Gulf Opportunity Zone Industrial Dev. Rev. Bonds (Chevron U.S.A. Inc. Project), Series 2009-F, 1.52% 20302 | 3,125 | 3,125 | ||||||
| State of Mississippi, Business Fin. Corp., Gulf Opportunity Zone Industrial Dev. Rev. Bonds (Chevron U.S.A. Inc. Project), Series 2010-K, 1.52% 20352 | 1,100 | 1,100 | ||||||
| State of Mississippi, Business Fin. Corp., Gulf Opportunity Zone Industrial Dev. Rev. Bonds (Chevron U.S.A. Inc. Project), Series 2010-L, 1.52% 20352 | 15,450 | 15,450 | ||||||
| State of Mississippi, Business Fin. Corp., Gulf Opportunity Zone Industrial Dev. Rev. Bonds (Chevron U.S.A. Inc. Project), Series 2011-E, 1.48% 20352 | 10,000 | 10,000 | ||||||
| State of New York, Metropolitan Transportation Auth., Transportation Rev. Bonds, Series 2017-C-2A, 4.00% 5/15/2019 | 32,000 | 32,635 | ||||||
| State of New York, New York City G.O. Bonds, Fiscal 2014, Series 2013-D-3, 1.50% 20382 | 21,945 | 21,945 | ||||||
| State of New York, New York City G.O. Bonds, Series 2006-H-1, 1.50% 20362 | 1,000 | 1,000 | ||||||
| State of New York, New York City G.O. Bonds, Series 2006-L-5, 1.49% 20352 | 3,000 | 3,000 | ||||||
| State of New York, New York City Transitional Fin. Auth., Future Tax Secured Bonds, Series 2010-G-5, 1.05% 20342 | 2,000 | 2,000 | ||||||
| State of New York, New York City Transitional Fin. Auth., Future Tax Secured Rev. Ref. Bonds, Fiscal 2003, Series 2002-A-2, 1.56% 20292 | 1,000 | 1,000 | ||||||
| State of New York, New York City Transitional Fin. Auth., Future Tax Secured Rev. Ref. Bonds, Series 2015-E-3, 1.50% 20452 | 4,000 | 4,000 | ||||||
| State of New York, New York City Transitional Fin. Auth., Future Tax Secured Rev. Ref. Bonds, Series 2016-E-4, 1.50% 20452 | 21,990 | 21,990 | ||||||
| State of New York, New York City Transitional Fin. Auth., Recovery Bonds, Fiscal 2003, Series 2002-1-C, 1.50% 20222 | 9,060 | 9,060 | ||||||
| State of Oregon, Full Faith and Credit Tax Anticipation Notes, Series 2017-A, 5.00% 9/28/2018 | 17,000 | 17,098 | ||||||
| State of Pennsylvania, Econ. Dev. Fncg. Auth., Solid Waste Disposal Rev. Bonds (Republic Services, Inc. Project), Series 2014, AMT, 1.85% 2044 (put 2018)4 | 17,000 | 17,000 | ||||||
| State of Texas, County of Jefferson, Port Arthur Navigation Dist., Pollution Control Rev. Ref. Bonds (Texaco Inc. Project), Series 1994, 1.48% 20242 | 17,100 | 17,100 | ||||||
| State of Texas, Tax and Rev. Anticipation Notes, Series 2017, 4.00% 8/30/2018 | 46,190 | 46,292 | ||||||
| Other securities | 141,568 | |||||||
| Total short-term securities (cost: $387,573,000) | 387,613 | |||||||
| Total investment securities 99.29% (cost: $6,310,369,000) | 6,445,469 | |||||||
| Other assets less liabilities 0.71% | 45,947 | |||||||
| Net assets 100.00% | $ | 6,491,416 | ||||||
This summary investment portfolio is designed to streamline the report and help investors better focus on the fund’s principal holdings. See the inside back cover for details on how to obtain a complete schedule of portfolio holdings.
| American Funds Tax-Exempt Funds | 37 |
American High-Income Municipal Bond Fund
“Other securities” includes all issues that are not disclosed separately in the summary investment portfolio. “Other securities” includes a security which was valued under fair value procedures adopted by authority of the board of trustees. The total value of the security which was valued under fair value procedures was $6,636,000, which represented .10% of the net assets of the fund.
Futures contracts
| Contracts | Type | Number of contracts | Expiration | Notional amount (000) | 5 | Value at 7/31/2018 (000) | 6 | Unrealized (depreciation) appreciation at 7/31/2018 (000) | ||||||||||
| 5 Year U.S. Treasury Note Futures | Long | 1,750 | October 2018 | $175,000 | $197,969 | $ | (373 | ) | ||||||||||
| 30 Year Ultra U.S. Treasury Bond Futures | Short | 350 | September 2018 | (35,000 | ) | (54,917 | ) | 270 | ||||||||||
| $ | (103 | ) | ||||||||||||||||
| 1 | Acquired in a transaction exempt from registration under Rule 144A of the Securities Act of 1933. May be resold in the U.S. in transactions exempt from registration, normally to qualified institutional buyers. The total value of all such securities, including those in “Other securities,” was $728,898,000, which represented 11.23% of the net assets of the fund. |
| 2 | Coupon rate may change periodically. For short-term securities, the date of the next scheduled coupon rate change is considered to be the maturity date. |
| 3 | Step bond; coupon rate may change at a later date. |
| 4 | For short-term securities, the mandatory put date is considered to be the maturity date. |
| 5 | Notional amount is calculated based on the number of contracts and notional contract size. |
| 6 | Value is calculated based on the notional amount and current market price. |
Key to abbreviations and symbol
Agcy. = Agency
AMT = Alternative Minimum Tax
Auth. = Authority
Dept. = Department
Dev. = Development
Dist. = District
Econ. = Economic
Fac. = Facility
Facs. = Facilities
Fin. = Finance
Fncg. = Financing
G.O. = General Obligation
LIBOR = London Interbank Offered Rate
LOC = Letter of Credit
Preref. = Prerefunded
Redev. = Redevelopment
Ref. = Refunding
Rev. = Revenue
SIFMA = Securities Industry and Financial Markets Association
USD/$ = U.S. dollars
See Notes to Financial Statements
| 38 | American Funds Tax-Exempt Funds |
The Tax-Exempt Fund of California
Summary investment portfolio July 31, 2018
| Bonds, notes & other debt instruments 95.08% | Principal amount (000) | Value (000) | ||||||
| California 94.02% | ||||||||
| State issuers 35.14% | ||||||||
| Trustees of the California State University, Systemwide Rev. Bonds, Series 2016-A, 4.00% 2034 | $ | 2,000 | $ | 2,120 | ||||
| Trustees of the California State University, Systemwide Rev. Bonds, Series 2016-A, 4.00% 2035 | 10,000 | 10,559 | ||||||
| Trustees of the California State University, Systemwide Rev. Bonds, Series 2016-A, 4.00% 2037 | 6,645 | 6,974 | ||||||
| Trustees of the California State University, Systemwide Rev. Bonds, Series 2016-B-2, 4.00% 2049 (put 2021) | 5,000 | 5,284 | ||||||
| Trustees of the California State University, Systemwide Rev. Ref. Bonds, Series 2012-A, 5.00% 2027 | 3,000 | 3,382 | ||||||
| Educational Facs. Auth., Rev. Ref. Bonds (Chapman University), Series 2011, 5.00% 2031 | 8,615 | 9,270 | ||||||
| Golden State Tobacco Securitization Corp., Enhanced Tobacco Settlement Asset-Backed Bonds, Series 2005-A, Assured Guaranty Municipal insured, 0% 2026 | 11,000 | 8,916 | ||||||
| Health Facs. Fncg. Auth., Rev. Bonds (Sutter Health), Series 2011-D, 5.25% 2031 | 2,000 | 2,207 | ||||||
| Health Facs. Fncg. Auth., Rev. Ref. Bonds (El Camino Hospital), Series 2015-A, 5.00% 2040 | 8,700 | 9,666 | ||||||
| Health Facs. Fncg. Auth., Rev. Ref. Bonds (Stanford Health Care), Series 2017-A, 5.00% 2034 | 12,000 | 14,145 | ||||||
| Health Facs. Fncg. Auth., Rev. Ref. Bonds (Stanford Hospital and Clinics), Series 2010-B, 5.25% 2031 (preref. 2020) | 8,000 | 8,679 | ||||||
| Health Facs. Fncg. Auth., Rev. Ref. Bonds (Sutter Health), Series 2008-A, 5.25% 2022 | 2,000 | 2,022 | ||||||
| Health Facs. Fncg. Auth., Rev. Ref. Bonds (Sutter Health), Series 2016-A, 5.00% 2033 | 1,000 | 1,150 | ||||||
| Health Facs. Fncg. Auth., Rev. Ref. Bonds (Sutter Health), Series 2016-A, 5.00% 2034 | 2,000 | 2,294 | ||||||
| Health Facs. Fncg. Auth., Rev. Ref. Bonds (Sutter Health), Series 2016-A, 5.00% 2035 | 2,000 | 2,285 | ||||||
| Health Facs. Fncg. Auth., Rev. Ref. Bonds (Sutter Health), Series 2016-B, 4.00% 2038 | 9,165 | 9,498 | ||||||
| Health Facs. Fncg. Auth., Rev. Ref. Bonds (Sutter Health), Series 2016-B, 5.00% 2035 | 1,000 | 1,150 | ||||||
| Imperial Irrigation Dist., Electric System Rev. Ref. Bonds, Series 2016-B-2, 5.00% 2041 | 6,975 | 7,960 | ||||||
| Infrastructure and Econ. Dev. Bank, Rev. Bonds (The Colburn School), Series 2015-B, (SIFMA Municipal Swap Index + 1.20%) 2.14% 2037 (put 2022)1 | 8,500 | 8,714 | ||||||
| Infrastructure and Econ. Dev. Bank, Rev. Ref. Bonds (J. Paul Getty Trust), Series 2013-A-2, (1-month USD-LIBOR x 0.70 + 0.50%) 1.95% 2047 (put 2019)1 | 10,000 | 10,016 | ||||||
| Municipal Fin. Auth., Solid Waste Disposal Rev. Bonds (Waste Management, Inc. Project), Series 2017-A, AMT, 2.00% 2044 (put 2020) | 7,000 | 6,978 | ||||||
| Northern California Gas Auth. No. 1, Gas Project Rev. Bonds, Series 2007-B, (3-month USD-LIBOR + 0.67%) 2.286% 20271 | 8,105 | 7,944 | ||||||
| Pollution Control Fncg. Auth., Water Furnishing Rev. Bonds (Poseidon Resources (Channelside) LP Desalination Project), Series 2012 Plant Bonds, AMT, 5.00% 20452 | 8,775 | 9,305 | ||||||
| Statewide Communities Dev. Auth., Rev. Bonds (Huntington Memorial Hospital), Series 2014, 5.00% 2044 | 8,500 | 9,309 | ||||||
| Statewide Communities Dev. Auth., Rev. Bonds (John Muir Health), Series 2016-A, 4.00% 2046 | 10,395 | 10,595 | ||||||
| Statewide Communities Dev. Auth., Rev. Bonds (Kaiser Permanente), Series 2012-A, 5.00% 2042 | 6,500 | 7,087 | ||||||
| Statewide Communities Dev. Auth., Rev. Bonds (Sutter Health), Series 2011-A, 5.25% 2024 (preref. 2020) | 1,000 | 1,075 | ||||||
| Statewide Communities Dev. Auth., Rev. Bonds (Sutter Health), Series 2011-A, 6.00% 2042 (preref. 2020) | 4,500 | 4,905 | ||||||
| Statewide Communities Dev. Auth., Student Housing Rev. Custodial Bonds, Series 2017, 4.305% 2032 | 8,300 | 8,857 | ||||||
| Regents of the University of California, Limited Project Rev. Bonds, Series 2016-K, 5.00% 2034 | 2,500 | 2,903 | ||||||
| Regents of the University of California, Limited Project Rev. Bonds, Series 2016-K, 5.00% 2035 | 7,500 | 8,670 | ||||||
| Regents of the University of California, Medical Center Pooled Rev. Bonds, Series 2016-L, 4.00% 2037 | 1,585 | 1,646 | ||||||
| Regents of the University of California, Medical Center Pooled Rev. Bonds, Series 2016-L, 4.00% 2038 | 1,000 | 1,035 | ||||||
| Regents of the University of California, Medical Center Pooled Rev. Ref. Bonds, Series 2007-C-2, National insured, (3-month USD-LIBOR + 0.67%) 2.239% 20371 | 5,100 | 4,732 | ||||||
| Regents of the University of California, Medical Center Pooled Rev. Ref. Bonds, Series 2007-C-2, National insured, (3-month USD-LIBOR + 0.74%) 2.309% 20431 | 8,000 | 7,165 | ||||||
| Dept. of Veterans Affairs, Veterans G.O. Rev. Ref. Bonds, Series 2016-CN, 3.50% 2045 | 8,850 | 9,131 | ||||||
| Other securities | 564,929 | |||||||
| 792,557 | ||||||||
| American Funds Tax-Exempt Funds | 39 |
The Tax-Exempt Fund of California
| Bonds, notes & other debt instruments (continued) | Principal amount (000) | Value (000) | ||||||
| California (continued) | ||||||||
| City, county & other issuers 58.88% | ||||||||
| Alameda Corridor Transportation Auth., Rev. Ref. Bonds, Series 2013-A, 5.00% 2025 | $ | 1,700 | $ | 1,944 | ||||
| Alameda Corridor Transportation Auth., Rev. Ref. Bonds, Series 2013-A, 5.00% 2026 | 6,375 | 7,275 | ||||||
| Alameda Corridor Transportation Auth., Rev. Ref. Bonds, Series 2016-B, 5.00% 2034 | 2,000 | 2,258 | ||||||
| Alameda Corridor Transportation Auth., Rev. Ref. Bonds, Series 2016-B, 5.00% 2036 | 1,000 | 1,123 | ||||||
| Alameda Corridor Transportation Auth., Rev. Ref. Bonds, Series 2016-B, 5.00% 2037 | 3,790 | 4,239 | ||||||
| Alameda Corridor Transportation Auth., Rev. Ref. Bonds, Series 2016-B, Assured Guaranty Municipal insured, 4.00% 2035 | 2,500 | 2,606 | ||||||
| Alameda Corridor Transportation Auth., Rev. Ref. Bonds, Series 2016-B, Assured Guaranty Municipal insured, 4.00% 2037 | 2,000 | 2,070 | ||||||
| Alameda Corridor Transportation Auth., Rev. Ref. Bonds, Series 2016-B, Assured Guaranty Municipal insured, 5.00% 2036 | 1,500 | 1,695 | ||||||
| Baldwin Park Unified School Dist., G.O. Rev. Ref. Bonds, Series 2016, Assured Guaranty Municipal insured, 4.00% 2031 | 6,420 | 6,869 | ||||||
| Assn. of Bay Area Governments, Fin. Auth. for Nonprofit Corps., Rev. Ref. Bonds (Eskaton Properties Inc. Obligated Group), Series 2013, 5.00% 2035 | 7,350 | 7,977 | ||||||
| Bay Area Toll Auth., San Francisco Bay Area Toll Bridge Rev. Bonds, Series 2006-C-1, (SIFMA Municipal Swap Index + 0.90%) 1.84% 2045 (put 2023)1 | 2,000 | 2,036 | ||||||
| Bay Area Toll Auth., San Francisco Bay Area Toll Bridge Rev. Bonds, Series 2008-B-1, (SIFMA Municipal Swap Index + 1.10%) 2.04% 2045 (put 2024)1 | 7,900 | 8,128 | ||||||
| Bay Area Toll Auth., San Francisco Bay Area Toll Bridge Rev. Bonds, Series 2014-G, (SIFMA Municipal Swap Index + 0.60%) 1.54% 2034 (put 2020)1 | 2,750 | 2,765 | ||||||
| Bay Area Toll Auth., San Francisco Bay Area Toll Bridge Rev. Bonds, Series 2014-H, (SIFMA Municipal Swap Index + 0.70%) 1.64% 2034 (put 2021)1 | 4,000 | 4,047 | ||||||
| Bay Area Toll Auth., San Francisco Bay Area Toll Bridge Rev. Bonds, Series 2017-B, 2.85% 2047 (put 2025) | 1,000 | 1,034 | ||||||
| Bay Area Toll Auth., San Francisco Bay Area Toll Bridge Rev. Bonds, Series 2017-D, (3-month USD-LIBOR x 0.70 + 0.55%) 2.186% 2045 (put 2021)1 | 4,000 | 4,034 | ||||||
| Bay Area Toll Auth., San Francisco Bay Area Toll Bridge Rev. Bonds, Series 2017-F-1, 5.00% 2056 | 5,000 | 5,640 | ||||||
| Bay Area Toll Auth., San Francisco Bay Area Toll Bridge Rev. Ref. Bonds, Series 2009-F-1, 5.125% 2039 (preref. 2019) | 2,000 | 2,052 | ||||||
| Bay Area Toll Auth., San Francisco Bay Area Toll Bridge Rev. Ref. Bonds, Series 2009-F-1, 5.625% 2044 (preref. 2019) | 1,670 | 1,719 | ||||||
| Bay Area Toll Auth., San Francisco Bay Area Toll Bridge Rev. Ref. Bonds, Series 2014-C, 1.875% 2047 (put 2019) | 1,250 | 1,252 | ||||||
| Bay Area Toll Auth., San Francisco Bay Area Toll Bridge Rev. Ref. Bonds, Series 2014-F-1, 5.00% 2054 | 5,000 | 5,520 | ||||||
| Bay Area Toll Auth., San Francisco Bay Area Toll Bridge Rev. Ref. Bonds, Series 2017-S-7, 5.00% 2028 | 4,500 | 5,552 | ||||||
| Chabot-Las Positas Community College Dist., G.O. Rev. Ref. Bonds, Series 2016, 4.00% 2034 | 9,940 | 10,533 | ||||||
| Coachella Valley Unified School Dist., G.O. Bonds, 2005 Election, Series 2016-E, Assured Guaranty Municipal insured, 4.00% 2045 | 6,555 | 6,763 | ||||||
| Foothill/Eastern Transportation Corridor Agcy., Toll Road Rev. Ref. Bonds, Series 2013-A, 6.00% 2053 | 7,500 | 8,669 | ||||||
| Foothill/Eastern Transportation Corridor Agcy., Toll Road Rev. Ref. Bonds, Series 2014-A, 6.00% 2049 | 5,800 | 6,717 | ||||||
| City of Los Angeles, Dept. of Airports, Los Angeles International Airport Rev. Bonds, Series 2016-B, AMT, 5.00% 2029 | 1,450 | 1,667 | ||||||
| City of Los Angeles, Dept. of Airports, Los Angeles International Airport Rev. Bonds, Series 2016-B, AMT, 5.00% 2031 | 2,395 | 2,727 | ||||||
| City of Los Angeles, Dept. of Airports, Los Angeles International Airport Rev. Bonds, Series 2016-B, AMT, 5.00% 2033 | 500 | 566 | ||||||
| City of Los Angeles, Dept. of Airports, Los Angeles International Airport Rev. Bonds, Series 2016-B, AMT, 5.00% 2036 | 1,000 | 1,122 | ||||||
| City of Los Angeles, Dept. of Airports, Los Angeles International Airport Rev. Bonds, Series 2017-A, AMT, 5.00% 2030 | 1,000 | 1,161 | ||||||
| City of Los Angeles, Dept. of Airports, Los Angeles International Airport Rev. Bonds, Series 2017-A, AMT, 5.00% 2032 | 1,000 | 1,150 | ||||||
| City of Los Angeles, Dept. of Airports, Los Angeles International Airport Rev. Bonds, Series 2017-A, AMT, 5.00% 2033 | 1,000 | 1,145 | ||||||
| City of Los Angeles, Dept. of Airports, Los Angeles International Airport Rev. Bonds, Series 2017-A, AMT, 5.00% 2034 | 1,250 | 1,427 | ||||||
| 40 | American Funds Tax-Exempt Funds |
The Tax-Exempt Fund of California
| Principal amount (000) | Value (000) | |||||||
| City of Los Angeles, Dept. of Airports, Los Angeles International Airport Rev. Bonds, Series 2017-A, AMT, 5.00% 2035 | $ | 1,000 | $ | 1,138 | ||||
| City of Los Angeles, Dept. of Airports, Los Angeles International Airport Rev. Bonds, Series 2017-A, AMT, 5.00% 2036 | 1,400 | 1,588 | ||||||
| City of Los Angeles, Dept. of Airports, Los Angeles International Airport Rev. Bonds, Series 2017-A, AMT, 5.00% 2037 | 1,260 | 1,425 | ||||||
| City of Los Angeles, Dept. of Airports, Los Angeles International Airport Rev. Bonds, Series 2018-A, AMT, 5.00% 2033 | 1,255 | 1,455 | ||||||
| City of Los Angeles, Dept. of Airports, Los Angeles International Airport Rev. Bonds, Series 2018-A, AMT, 5.00% 2036 | 1,345 | 1,543 | ||||||
| City of Los Angeles, Dept. of Airports, Los Angeles International Airport Rev. Bonds, Series 2018-A, AMT, 5.00% 2037 | 1,450 | 1,659 | ||||||
| City of Los Angeles, Dept. of Airports, Los Angeles International Airport Rev. Bonds, Series 2018-A, AMT, 5.00% 2044 | 1,230 | 1,397 | ||||||
| City of Los Angeles, Dept. of Airports, Los Angeles International Airport Rev. Bonds, Series 2018-B, AMT, 5.00% 2032 | 5,000 | 5,861 | ||||||
| Port of Oakland, Rev. Ref. Bonds, Series 2017-D, AMT, 5.00% 2023 | 6,000 | 6,799 | ||||||
| Oxnard Unified School Dist., G.O. Rev. Ref. Bonds, Series 2017-A, BAM insured, 5.00% 2045 | 6,770 | 7,745 | ||||||
| Palomar Pomerado Health, G.O. Bonds, 2004 Election, Series 2009-A, Assured Guaranty insured, 0% 2029 | 9,350 | 6,433 | ||||||
| Pasadena Unified School Dist., G.O. Bonds, 2008 Election, Series 2016, 4.00% 2032 | 5,000 | 5,342 | ||||||
| Pasadena Unified School Dist., G.O. Bonds, 2008 Election, Series 2016, 4.00% 2034 | 5,040 | 5,344 | ||||||
| Pasadena Unified School Dist., G.O. Bonds, 2008 Election, Series 2016, 4.00% 2035 | 15,940 | 16,833 | ||||||
| Pasadena Unified School Dist., G.O. Bonds, 2008 Election, Series 2016, 4.00% 2036 | 2,250 | 2,365 | ||||||
| Pollution Control Fncg. Auth., Rev. Bonds (San Jose Water Company Project), Series 2016, AMT, 4.75% 2046 | 11,475 | 12,349 | ||||||
| Poway Unified School Dist., School Facs. Improvement Dist. No. 2007-1, G.O. Bonds, 2008 Election, Series 2011-B, 0% 2035 | 12,850 | 6,845 | ||||||
| County of Sacramento, Sanitation Dist. Fncg. Auth., Rev. Ref. Bonds (Sacramento Regional County Sanitation Dist.), Series 2007-B, FGIC-National insured, (3-month USD-LIBOR + 0.53%) 2.071% 20351 | 13,500 | 13,111 | ||||||
| City of San Buenaventura, Rev. Bonds (Community Memorial Health System), Series 2011, 7.50% 2041 | 10,825 | 12,055 | ||||||
| City and County of San Francisco, Public Utilities Commission, Wastewater Rev. Green Bonds, Series 2016-A, 4.00% 2037 | 6,575 | 6,905 | ||||||
| City of San Jose, Airport Rev. Ref. Bonds, Series 2011-A-1, AMT, 5.50% 2030 | 8,000 | 8,659 | ||||||
| Southwestern Community College Dist., G.O. Bonds, 2016 Election, Series 2017-A, 4.00% 2047 | 13,500 | 13,985 | ||||||
| Stockton Unified School Dist., G.O. Rev. Ref. Bonds, Series 2016, 5.00% 2031 | 7,800 | 9,022 | ||||||
| Tobacco Securitization Auth. of Southern California, Tobacco Settlement Asset-Backed Rev. Ref. Bonds (San Diego County Tobacco Asset Securitization Corp.), Series 2006-A, 5.125% 2046 | 7,800 | 7,842 | ||||||
| Victor Valley Union High School Dist., G.O. Rev. Ref. Bonds, Series 2016-A, BAM insured, 4.00% 2032 | 7,500 | 7,937 | ||||||
| City of Whittier, Health Fac. Rev. Bonds (PIH Health), Series 2014, 5.00% 2044 | 10,000 | 10,834 | ||||||
| Other securities | 1,026,105 | |||||||
| 1,328,058 | ||||||||
| Puerto Rico 0.59% | ||||||||
| Industrial, Tourist, Educational, Medical and Environmental Control Facs. Fncg. Auth., Hospital Rev. and Rev. Ref. Bonds (Hospital Auxilio Mutuo Obligated Group Project), Series 2011-A, 6.00% 2033 | 7,900 | 8,226 | ||||||
| Other securities | 5,014 | |||||||
| 13,240 | ||||||||
| Other U.S. territories 0.47% | ||||||||
| Other securities | 10,641 | |||||||
| Total bonds, notes & other debt instruments (cost: $2,098,829,000) | 2,144,496 | |||||||
| American Funds Tax-Exempt Funds | 41 |
The Tax-Exempt Fund of California
| Short-term securities 4.84% | Principal amount (000) | Value (000) | ||||||
| IAM Commercial Paper, Series 2018-A-1, 1.25% 9/12/2018 | $ | 1,000 | $ | 1,000 | ||||
| IAM Commercial Paper, Series 2018-A-6, 1.05% 8/3/2018 | 12,975 | 12,975 | ||||||
| IAM Commercial Paper, Series 2018-A-6, 1.37% 9/4/2018 | 1,050 | 1,050 | ||||||
| IAM Commercial Paper, Series 2018-A-8, 1.35% 9/5/2018 | 10,000 | 10,000 | ||||||
| County of Los Angeles, Lease Rev. Bonds, Series 2018-B, 1.20% 8/7/2018 | 6,000 | 6,000 | ||||||
| County of Los Angeles, Tax and Rev. Anticipation Notes, Series 2018, 4.00% 6/28/2019 | 8,000 | 8,183 | ||||||
| Pollution Control Fncg. Auth., Environmental Impact Rev. Bonds (Air Products and Chemicals, Inc. Project), Series 1997-B, 1.35% 20421 | 10,025 | 10,025 | ||||||
| Pollution Control Fncg. Auth., Pollution Control Rev. Ref. Bonds (Pacific Gas and Electric Co.), Series 1996-C, JPMorgan Chase LOC, 1.40% 20261 | 15,800 | 15,800 | ||||||
| University of California, IAM Commercial Paper, Series 2018, 1.63% 8/7/2018 | 7,000 | 7,000 | ||||||
| University of California, IAM Commercial Paper, Series 2018-A, 1.22% 8/20/2018 | 13,000 | 13,000 | ||||||
| Other securities | 24,045 | |||||||
| Total short-term securities (cost: $109,066,000) | 109,078 | |||||||
| Total investment securities 99.92% (cost: $2,207,895,000) | 2,253,574 | |||||||
| Other assets less liabilities 0.08% | 1,788 | |||||||
| Net assets 100.00% | $ | 2,255,362 | ||||||
This summary investment portfolio is designed to streamline the report and help investors better focus on the fund’s principal holdings. See the inside back cover for details on how to obtain a complete schedule of portfolio holdings.
“Other securities” includes all issues that are not disclosed separately in the summary investment portfolio.
| 1 | Coupon rate may change periodically. For short-term securities, the date of the next scheduled coupon rate change is considered to be the maturity date. |
| 2 | Acquired in a transaction exempt from registration under Rule 144A of the Securities Act of 1933. May be resold in the U.S. in transactions exempt from registration, normally to qualified institutional buyers. The total value of all such securities, including those in “Other securities,” was $69,328,000, which represented 3.07% of the net assets of the fund. |
Key to abbreviations and symbol
Agcy. = Agency
AMT = Alternative Minimum Tax
Auth. = Authority
Dept. = Department
Dev. = Development
Dist. = District
Econ. = Economic
Fac. = Facility
Facs. = Facilities
Fin. = Finance
Fncg. = Financing
G.O. = General Obligation
LIBOR = London Interbank Offered Rate
LOC = Letter of Credit
Preref. = Prerefunded
Redev. = Redevelopment
Ref. = Refunding
Rev. = Revenue
SIFMA = Securities Industry and Financial Markets Association
USD/$ = U.S. dollars
See Notes to Financial Statements
| 42 | American Funds Tax-Exempt Funds |
American Funds Tax-Exempt Fund of New York
Summary investment portfolio July 31, 2018
| Bonds, notes & other debt instruments 91.90% | Principal amount (000) | Value (000) | ||||||
| New York 89.61% | ||||||||
| State issuers 45.64% | ||||||||
| Brooklyn Arena Local Dev. Corp., Pilot Rev. Ref. Bonds (Brooklyn Events Center LLC), Series 2016-A, Assured Guaranty Municipal insured, 4.00% 2034 | $ | 240 | $ | 250 | ||||
| Brooklyn Arena Local Dev. Corp., Pilot Rev. Ref. Bonds (Brooklyn Events Center LLC), Series 2016-A, Assured Guaranty Municipal insured, 5.00% 2030 | 500 | 560 | ||||||
| Brooklyn Arena Local Dev. Corp., Pilot Rev. Ref. Bonds (Brooklyn Events Center LLC), Series 2016-A, Assured Guaranty Municipal insured, 5.00% 2042 | 1,500 | 1,628 | ||||||
| Dormitory Auth., Income Tax Rev. Bonds, Series 2017-B, 5.00% 2042 | 1,130 | 1,288 | ||||||
| Dormitory Auth., Montefiore Obligated Group Bonds, Series 2018-A, 5.00% 2031 | 145 | 166 | ||||||
| Dormitory Auth., New School Rev. Bonds, Series 2010, 5.25% 2021 (preref. 2020) | 500 | 533 | ||||||
| Dormitory Auth., New School Rev. Bonds, Series 2010, 5.50% 2040 (preref. 2020) | 500 | 536 | ||||||
| Dormitory Auth., New School Rev. Bonds, Series 2015-A, 5.00% 2032 | 1,000 | 1,124 | ||||||
| Dormitory Auth., New School Rev. Bonds, Series 2016-A, 5.00% 2035 | 500 | 564 | ||||||
| Dormitory Auth., New York School Dist. Rev. Bonds, Series 2017-A, 5.00% 2025 | 1,000 | 1,169 | ||||||
| Dormitory Auth., New York University Rev. Bonds, Series 2018-A, 5.00% 2032 | 500 | 595 | ||||||
| Dormitory Auth., North Shore-Long Island Jewish Obligated Group Rev. Bonds, Series 2011-A, 5.00% 2032 (preref. 2021) | 1,500 | 1,632 | ||||||
| Dormitory Auth., Orange Regional Medical Center Obligated Group Rev. Bonds, Series 2015, 5.00% 20401 | 1,000 | 1,085 | ||||||
| Dormitory Auth., School Dist. Rev. Bond Fncg. Program Rev. Bonds, Series 2018-A, 5.00% 2032 | 1,000 | 1,152 | ||||||
| Dormitory Auth., Skidmore College Rev. Bonds, Series 2011-A, 5.50% 2041 | 1,110 | 1,213 | ||||||
| Dormitory Auth., State Sales Tax Rev. Bonds, Series 2017-B, 5.00% 2033 | 1,000 | 1,162 | ||||||
| Environmental Facs. Corp., Rev. Green Bonds (Revolving Funds), Series 2016-B, 4.00% 2036 | 1,950 | 2,051 | ||||||
| Liberty Dev. Corp., Liberty Rev. Bonds (Goldman Sachs Headquarters Issue), Series 2005, 5.25% 2035 | 1,000 | 1,232 | ||||||
| Liberty Dev. Corp., Liberty Rev. Ref. Bonds (3 World Trade Center Project), Series 2014, Class 2, 5.15% 20341 | 1,250 | 1,373 | ||||||
| Liberty Dev. Corp., Liberty Rev. Ref. Bonds (4 World Trade Center Project), Series 2011, 5.00% 2031 | 1,500 | 1,634 | ||||||
| Liberty Dev. Corp., Liberty Rev. Ref. Bonds (Bank of America Tower at One Bryant Park Project), Series 2010, 6.375% 2049 | 1,500 | 1,581 | ||||||
| Long Island Power Auth., Electric System General Rev. Bonds, Series 2008-A, 6.00% 2033 (preref. 2019) | 1,000 | 1,034 | ||||||
| Long Island Power Auth., Electric System General Rev. Bonds, Series 2011-A, 5.00% 2038 (preref. 2021) | 500 | 544 | ||||||
| Long Island Power Auth., Electric System General Rev. Bonds, Series 2014-A, 5.00% 2044 | 740 | 822 | ||||||
| Long Island Power Auth., Electric System General Rev. Bonds, Series 2014-C, (1-month USD-LIBOR x 0.70 + 0.65%) 2.114% 2033 (put 2018)2 | 1,000 | 1,000 | ||||||
| Long Island Power Auth., Electric System General Rev. Bonds, Series 2015-B, 5.00% 2035 | 1,215 | 1,365 | ||||||
| Long Island Power Auth., Electric System General Rev. Bonds, Series 2015-B, 5.00% 2038 | 750 | 836 | ||||||
| Long Island Power Auth., Electric System General Rev. Bonds, Series 2015-C, (1-month USD-LIBOR x 0.70 + 0.88%) 2.344% 2033 (put 2018)2 | 300 | 300 | ||||||
| Long Island Power Auth., Electric System General Rev. Bonds, Series 2017, 5.00% 2035 | 1,000 | 1,147 | ||||||
| Long Island Power Auth., Electric System General Rev. Bonds, Series 2017, 5.00% 2047 | 1,500 | 1,695 | ||||||
| Metropolitan Transportation Auth., Dedicated Tax Fund Rev. Ref. Bonds, Series 2002-B-3D, (SIFMA Municipal Swap Index + 1.00%) 1.94% 20202 | 2,000 | 2,034 | ||||||
| Metropolitan Transportation Auth., Transportation Rev. Bonds, Series 2012-E, 5.00% 2031 (preref. 2022) | 1,000 | 1,131 | ||||||
| Metropolitan Transportation Auth., Transportation Rev. Bonds, Series 2014-D-1, 5.00% 2039 | 250 | 279 | ||||||
| Metropolitan Transportation Auth., Transportation Rev. Bonds, Series 2015-A-2, (SIFMA Municipal Swap Index + 0.58%) 1.52% 2039 (put 2020)2 | 500 | 501 | ||||||
| Metropolitan Transportation Auth., Transportation Rev. Bonds, Series 2015-C-1, 5.00% 2035 | 1,750 | 1,971 | ||||||
| Metropolitan Transportation Auth., Transportation Rev. Bonds, Series 2015-C-1, 5.25% 2030 | 280 | 327 | ||||||
| Metropolitan Transportation Auth., Transportation Rev. Green Bonds, Series 2017-A-1, 5.25% 2057 | 750 | 852 | ||||||
| Metropolitan Transportation Auth., Transportation Rev. Ref. Bonds, Series 2002-D-2A, Assured Guaranty Municipal insured, (1-month USD-LIBOR x 0.69 + 0.68%) 2.123% 2032 (put 2021)2 | 600 | 605 | ||||||
| Metropolitan Transportation Auth., Transportation Rev. Ref. Green Bonds, Series 2017-C-1, 4.00% 2034 | 1,000 | 1,055 | ||||||
| Metropolitan Transportation Auth., Transportation Rev. Ref. Green Bonds, Series 2017-C-1, 5.00% 2028 | 750 | 890 | ||||||
| American Funds Tax-Exempt Funds | 43 |
American Funds Tax-Exempt Fund of New York
| Bonds, notes & other debt instruments (continued) | Principal amount (000) | Value (000) | ||||||
| New York (continued) | ||||||||
| State issuers (continued) | ||||||||
| Mortgage Agcy., Homeowner Mortgage Rev. Bonds, Series 178, 3.50% 2043 | $ | 360 | $ | 370 | ||||
| Mortgage Agcy., Homeowner Mortgage Rev. Bonds, Series 191, AMT, 3.50% 2034 | 445 | 453 | ||||||
| Mortgage Agcy., Homeowner Mortgage Rev. Bonds, Series 194, AMT, 3.50% 2035 | 550 | 563 | ||||||
| Mortgage Agcy., Homeowner Mortgage Rev. Bonds, Series 195, 4.00% 2046 | 1,710 | 1,786 | ||||||
| Mortgage Agcy., Homeowner Mortgage Rev. Bonds, Series 197, 3.50% 2044 | 835 | 862 | ||||||
| Mortgage Agcy., Homeowner Mortgage Rev. Bonds, Series 200, 3.50% 2045 | 295 | 304 | ||||||
| Mortgage Agcy., Homeowner Mortgage Rev. Bonds, Series 203, 3.50% 2047 | 1,000 | 1,033 | ||||||
| Mortgage Agcy., Homeowner Mortgage Rev. Bonds, Series 206, AMT, 4.00% 2037 | 675 | 708 | ||||||
| Mortgage Agcy., Homeowner Mortgage Rev. Bonds, Series 208, 4.00% 2048 | 600 | 633 | ||||||
| Mortgage Agcy., Homeowner Mortgage Rev. Bonds, Series 46, 5.00% 2029 | 35 | 36 | ||||||
| Mortgage Agcy., Homeowner Mortgage Rev. Bonds, Series 48, 2.625% 2041 | 435 | 438 | ||||||
| Mortgage Agcy., Homeowner Mortgage Rev. Bonds, Series 52, AMT, 3.50% 2030 | 895 | 918 | ||||||
| Mortgage Agcy., Homeowner Mortgage Rev. Bonds, Series 54, 4.00% 2047 | 1,715 | 1,801 | ||||||
| Mortgage Agcy., Homeowner Mortgage Rev. Ref. Bonds, Series 45, 4.50% 2029 | 125 | 128 | ||||||
| Port Auth., Consolidated Bonds, Series 166, 5.00% 2031 | 1,000 | 1,071 | ||||||
| Port Auth., Consolidated Bonds, Series 205, 5.00% 2047 | 1,000 | 1,146 | ||||||
| Port Auth., Consolidated Rev. Ref. Bonds, Series 167, AMT, 5.00% 2025 | 1,000 | 1,070 | ||||||
| Port Auth., Consolidated Rev. Ref. Bonds, Series 172, AMT, 5.00% 2034 | 500 | 542 | ||||||
| Port Auth., Consolidated Rev. Ref. Bonds, Series 186, AMT, 5.00% 2044 | 500 | 551 | ||||||
| Power Auth., Rev. Ref. Bonds, Series 2011-A, 5.00% 2038 | 1,500 | 1,640 | ||||||
| Transportation Dev. Corp., Special Fac. Rev. Ref. Bonds (American Airlines, Inc. John F. Kennedy International Airport Project), Series 2016, AMT, 5.00% 2020 | 1,000 | 1,051 | ||||||
| Transportation Dev. Corp., Special Fac. Rev. Ref. Bonds (American Airlines, Inc. John F. Kennedy International Airport Project), Series 2016, AMT, 5.00% 2026 | 500 | 527 | ||||||
| Transportation Dev. Corp., Special Fac. Rev. Ref. Bonds (American Airlines, Inc. John F. Kennedy International Airport Project), Series 2016, AMT, 5.00% 2031 | 2,500 | 2,619 | ||||||
| Transportation Dev. Corp., Special Facs. Rev. Bonds (Delta Air Lines, Inc. LaGuardia Airport Terminals C & D Redev. Project), Series 2018, AMT 5.00% 2030 | 1,500 | 1,702 | ||||||
| Triborough Bridge and Tunnel Auth., General Rev. Bonds (MTA Bridges and Tunnels), Series 2018-A, 5.00% 2046 | 1,000 | 1,153 | ||||||
| Urban Dev. Corp., State Personal Income Tax Rev. Bonds (General Purpose), Series 2014-A, 5.00% 2027 | 1,500 | 1,707 | ||||||
| Urban Dev. Corp., State Personal Income Tax Rev. Bonds (General Purpose), Series 2016-A, 5.00% 2026 | 1,500 | 1,772 | ||||||
| Urban Dev. Corp., State Personal Income Tax Rev. Bonds (General Purpose), Series 2016-A, 5.00% 2032 | 1,000 | 1,147 | ||||||
| Urban Dev. Corp., State Personal Income Tax Rev. Bonds (State Facs. and Equipment), Series 2009-B-1, 5.25% 2038 (preref. 2019) | 1,000 | 1,024 | ||||||
| Utility Debt Securitization Auth., Restructuring Bonds, Series 2017, 5.00% 2040 | 1,250 | 1,454 | ||||||
| Other securities | 37,736 | |||||||
| 108,861 | ||||||||
| City, county & other issuers 43.97% | ||||||||
| Buffalo and Erie County Industrial Land Dev. Corp., Obligated Group Rev. Bonds (Catholic Health System, Inc. Project), Series 2015, 5.00% 2023 | 1,600 | 1,799 | ||||||
| Buffalo and Erie County Industrial Land Dev. Corp., Obligated Group Rev. Bonds (Catholic Health System, Inc. Project), Series 2015, 5.00% 2040 | 1,050 | 1,131 | ||||||
| Buffalo and Erie County Industrial Land Dev. Corp., Obligated Group Rev. Bonds (Catholic Health System, Inc. Project), Series 2015, 5.25% 2035 | 500 | 550 | ||||||
| Buffalo and Erie County Industrial Land Dev. Corp., Rev. Bonds (Buffalo State College Foundation Housing Corp. Project), Series 2011-A, 5.375% 2041 | 1,400 | 1,515 | ||||||
| Build NYC Resource Corp., Rev. Bonds (Bronx Charter School for Excellence Project), Series 2013-A, 4.00% 2019 | 485 | 491 | ||||||
| Build NYC Resource Corp., Rev. Bonds (Bronx Charter School for Excellence Project), Series 2013-A, 4.00% 2021 | 525 | 542 | ||||||
| Build NYC Resource Corp., Rev. Bonds (Bronx Charter School for Excellence Project), Series 2013-A, 4.00% 2022 | 545 | 564 | ||||||
| Build NYC Resource Corp., Rev. Bonds (Bronx Charter School for Excellence Project), Series 2013-A, 5.50% 2043 | 1,000 | 1,026 | ||||||
| Village of Dobbs Ferry, Local Dev. Corp., Rev. Bonds (Mercy College Project), Series 2014, 5.00% 2039 | 1,625 | 1,819 | ||||||
| Hudson Yards Infrastructure Corp., Rev. Bonds, Fiscal 2017, Series 2017-A, 5.00% 2033 | 1,000 | 1,155 | ||||||
| 44 | American Funds Tax-Exempt Funds |
American Funds Tax-Exempt Fund of New York
| Principal amount (000) | Value (000) | |||||||
| Hudson Yards Infrastructure Corp., Rev. Bonds, Fiscal 2017, Series 2017-A, 5.00% 2035 | $ | 1,000 | $ | 1,148 | ||||
| Hudson Yards Infrastructure Corp., Rev. Bonds, Series 2011-A, 5.75% 2047 | 435 | 474 | ||||||
| Hudson Yards Infrastructure Corp., Rev. Bonds, Series 2011-A, 5.75% 2047 (preref. 2021) | 565 | 622 | ||||||
| Hudson Yards Infrastructure Corp., Rev. Bonds, Series 2012-A, 5.25% 2047 | 955 | 1,026 | ||||||
| Hudson Yards Infrastructure Corp., Rev. Bonds, Series 2012-A, 5.25% 2047 (preref. 2021) | 45 | 49 | ||||||
| County of Nassau, G.O. Bonds, Series 2014-A, 5.00% 2028 | 1,250 | 1,405 | ||||||
| County of Nassau, G.O. Bonds, Series 2016-B, 5.00% 2025 | 1,000 | 1,159 | ||||||
| County of Nassau, G.O. General Improvement Bonds, Series 2016-B, 5.00% 2023 | 750 | 850 | ||||||
| County of Nassau, G.O. General Improvement Rev. Ref. Bonds, Series 2016-A, 5.00% 2027 | 500 | 577 | ||||||
| County of Nassau, G.O. General Improvement Rev. Ref. Bonds, Series 2016-A, 5.00% 2030 | 1,795 | 2,041 | ||||||
| New York City G.O. Bonds, Fiscal 2017, Series 2016-A-1, 5.00% 2034 | 1,000 | 1,145 | ||||||
| New York City G.O. Bonds, Fiscal 2018, Series 2017-C, 5.00% 2031 | 1,000 | 1,179 | ||||||
| New York City G.O. Bonds, Fiscal 2018, Series 2017-C, 5.00% 2032 | 1,720 | 2,016 | ||||||
| New York City G.O. Bonds, Series 2015-A, 5.00% 2026 | 1,000 | 1,168 | ||||||
| New York City G.O. Bonds, Series 2015-C, 5.00% 2033 | 1,000 | 1,136 | ||||||
| New York City G.O. Bonds, Series 2016-C, 5.00% 2031 | 1,000 | 1,149 | ||||||
| New York City G.O. Bonds, Series 2017-A, 5.00% 2027 | 1,500 | 1,791 | ||||||
| New York City G.O. Bonds, Series 2018-E-1, 5.00% 2037 | 500 | 578 | ||||||
| New York City G.O. Bonds, Series 2018-F-1, 5.00% 2037 | 1,000 | 1,157 | ||||||
| New York City Housing Dev. Corp., Multi Family Housing Rev. Bonds (8 Spruce Street), Series 2014-E, 3.50% 2048 | 1,670 | 1,668 | ||||||
| New York City Housing Dev. Corp., Multi Family Housing Rev. Bonds (Sustainable Neighborhood Bonds), Series 2015-H, 2.95% 2045 (put 2026) | 750 | 756 | ||||||
| New York City Housing Dev. Corp., Multi Family Housing Rev. Bonds (Sustainable Neighborhood Bonds), Series 2017-A-1-A, 3.80% 2037 | 885 | 893 | ||||||
| New York City Housing Dev. Corp., Multi Family Housing Rev. Bonds (Sustainable Neighborhood Bonds), Series 2017-C-1, 3.45% 2037 | 1,000 | 999 | ||||||
| New York City Housing Dev. Corp., Multi Family Housing Rev. Bonds (Sustainable Neighborhood Bonds), Series 2017-C-2, 1.70% 2021 | 400 | 397 | ||||||
| New York City Housing Dev. Corp., Multi Family Housing Rev. Bonds (Sustainable Neighborhood Bonds), Series 2017-G-2-A, 2.00% 2057 (put 2021) | 750 | 749 | ||||||
| New York City Municipal Water Fin. Auth., Water and Sewer System Second General Resolution Rev. Bonds, Fiscal 2017, Series 2017-DD, 5.00% 2047 | 1,055 | 1,196 | ||||||
| New York City Municipal Water Fin. Auth., Water and Sewer System Second General Resolution Rev. Bonds, Fiscal 2017, Series 2017-EE, 5.00% 2033 | 750 | 869 | ||||||
| New York City Municipal Water Fin. Auth., Water and Sewer System Second General Resolution Rev. Bonds, Fiscal 2018, Series 2018-BB-1, 5.00% 2046 | 1,250 | 1,420 | ||||||
| New York City Municipal Water Fin. Auth., Water and Sewer System Second General Resolution Rev. Bonds, Fiscal 2018, Series 2018-EE, 5.00% 2040 | 1,000 | 1,149 | ||||||
| New York City Municipal Water Fin. Auth., Water and Sewer System Second General Resolution Rev. Bonds, Series 2011-EE, 5.375% 2043 | 1,000 | 1,081 | ||||||
| New York City Municipal Water Fin. Auth., Water and Sewer System Second General Resolution Rev. Bonds, Series 2014-EE, 5.00% 2045 | 500 | 559 | ||||||
| New York City Municipal Water Fin. Auth., Water and Sewer System Second General Resolution Rev. Bonds, Series 2015-HH, 5.00% 2039 | 500 | 560 | ||||||
| New York City Municipal Water Fin. Auth., Water and Sewer System Second General Resolution Rev. Ref. Bonds, Series 2017-EE, 5.00% 2036 | 750 | 861 | ||||||
| New York City Transitional Fin. Auth., Building Aid Rev. Bonds, Fiscal 2019, Series S-1, 5.00% 2043 | 1,000 | 1,148 | ||||||
| New York City Transitional Fin. Auth., Future Tax Secured Bonds, Fiscal 2011, Series 2011-C, 5.25% 2025 | 700 | 754 | ||||||
| New York City Transitional Fin. Auth., Future Tax Secured Bonds, Fiscal 2011, Series 2011-C, 5.25% 2025 (preref. 2020) | 300 | 323 | ||||||
| New York City Transitional Fin. Auth., Future Tax Secured Bonds, Fiscal 2017, Series 2017-C, 5.00% 2032 | 1,000 | 1,162 | ||||||
| New York City Transitional Fin. Auth., Future Tax Secured Bonds, Fiscal 2018, Series A-3, 4.00% 2042 | 1,080 | 1,117 | ||||||
| New York City Transitional Fin. Auth., Future Tax Secured Bonds, Fiscal 2019, Series 2018-A-1, 5.00% 2036 | 1,500 | 1,744 | ||||||
| New York City Transitional Fin. Auth., Future Tax Secured Bonds, Series 2017-E-1, 5.00% 2043 | 1,000 | 1,133 | ||||||
| New York City Transitional Fin. Auth., Future Tax Secured Bonds, Series 2017-F-1, 5.00% 2039 | 750 | 855 | ||||||
| American Funds Tax-Exempt Funds | 45 |
American Funds Tax-Exempt Fund of New York
| Bonds, notes & other debt instruments (continued) | Principal amount (000) | Value (000) | ||||||
| New York (continued) | ||||||||
| City, county & other issuers (continued) | ||||||||
| New York City Transitional Fin. Auth., Future Tax Secured Bonds, Series 2017-F-1, 5.00% 2042 | $ | 1,965 | $ | 2,235 | ||||
| New York City Transitional Fin. Auth., Future Tax Secured Bonds, Series 2018-C-3, 4.00% 2045 | 1,000 | 1,034 | ||||||
| New York City Transitional Fin. Auth., Future Tax Secured Rev. Ref. Bonds, Fiscal 2010, Series D, 5.00% 2023 | 1,000 | 1,056 | ||||||
| New York City Transitional Fin. Auth., Future Tax Secured Rev. Ref. Bonds, Series 2015-C, 5.00% 2026 | 1,000 | 1,173 | ||||||
| County of Onondaga, Resource Recovery Agcy., Rev. Ref. Bonds, Series 2015-A, AMT, Assured Guaranty Municipal insured, 5.00% 2030 | 1,750 | 1,929 | ||||||
| Town of Southold, Local Dev. Corp., Rev. Bonds (Peconic Landing at Southold, Inc. Project), Series 2015, 5.00% 2045 | 1,500 | 1,563 | ||||||
| County of Suffolk, Econ. Dev. Corp., Rev. Ref. Bonds (Peconic Landing at Southold, Inc. Project), Series 2010, 5.875% 2030 | 1,000 | 1,074 | ||||||
| County of Westchester, Health Care Corp., Rev. Bonds, Series 2010-B, 6.00% 2030 | 130 | 140 | ||||||
| County of Westchester, Health Care Corp., Rev. Bonds, Series 2010-B, 6.00% 2030 (preref. 2020) | 870 | 952 | ||||||
| County of Westchester, Health Care Corp., Rev. Bonds, Series 2011-A, 5.00% 2021 | 100 | 108 | ||||||
| County of Westchester, Local Dev. Corp., Rev. Bonds (Westchester Medical Center Obligated Group Project), Series 2016, 5.00% 2034 | 1,150 | 1,250 | ||||||
| County of Westchester, Local Dev. Corp., Rev. Bonds (Westchester Medical Center Obligated Group Project), Series 2016, 5.00% 2046 | 1,000 | 1,072 | ||||||
| Other securities | 38,617 | |||||||
| 104,858 | ||||||||
| Other U.S. Territories 2.29% | ||||||||
| Other securities | 5,451 | |||||||
| Total bonds, notes & other debt instruments (cost: $215,880,000) | 219,170 | |||||||
| Short-term securities 8.05% | ||||||||
| Dormitory Auth., IAM Commercial Paper, Series 2002-C, 1.60% 8/2/2018 | 4,000 | 4,000 | ||||||
| Dormitory Auth., University of Rochester Rev. Bonds, Series 2003-A, JPMorgan Chase LOC, 1.50% 20312 | 1,270 | 1,270 | ||||||
| Metropolitan Transportation Auth., Transportation Rev. Bond Anticipation Notes, Series 2018-A-1, 4.00% 8/15/2019 | 1,500 | 1,535 | ||||||
| New York City G.O. Bonds, Fiscal 2014, Series 2013-D-3, 1.50% 20382 | 900 | 900 | ||||||
| New York City Housing Dev. Corp., Multi Family Mortgage Rev. Bonds (Bruckner by the Bridge), Series 2008-A, 1.46% 20482 | 3,000 | 3,000 | ||||||
| New York City Municipal Water Fin. Auth., Water and Sewer System Second General Resolution Rev. Bonds, Fiscal 2014, Series 2013-AA-2, 1.50% 20502 | 2,175 | 2,175 | ||||||
| New York City Municipal Water Fin. Auth., Water and Sewer System Second General Resolution Rev. Bonds, Fiscal 2016, Series 2015-AA-1, 1.49% 20482 | 1,000 | 1,000 | ||||||
| New York City Transitional Fin. Auth., Future Tax Secured Rev. Ref. Bonds, Series 2015-E-3, 1.50% 20452 | 400 | 400 | ||||||
| New York City Transitional Fin. Auth., Future Tax Secured Rev. Ref. Bonds, Series 2016-E-4, 1.50% 20452 | 400 | 400 | ||||||
| Triborough Bridge and Tunnel Auth., General Rev. Bonds (MTA Bridges and Tunnels), Series 2003-B-1, 1.49% 20332 | 1,500 | 1,500 | ||||||
| Triborough Bridge and Tunnel Auth., General Rev. Bonds (MTA Bridges and Tunnels), Series 2005-B-2, 1.42% 20322 | 1,000 | 1,000 | ||||||
| Other securities | 2,020 | |||||||
| Total short-term securities (cost: $19,200,000) | 19,200 | |||||||
| Total investment securities 99.95% (cost: $235,080,000) | 238,370 | |||||||
| Other assets less liabilities 0.05% | 131 | |||||||
| Net assets 100.00% | $ | 238,501 | ||||||
| 46 | American Funds Tax-Exempt Funds |
American Funds Tax-Exempt Fund of New York
This summary investment portfolio is designed to streamline the report and help investors better focus on the fund’s principal holdings. See the inside back cover for details on how to obtain a complete schedule of portfolio holdings.
“Other securities” includes all issues that are not disclosed separately in the summary investment portfolio.
| 1 | Acquired in a transaction exempt from registration under Rule 144A of the Securities Act of 1933. May be resold in the U.S. in transactions exempt from registration, normally to qualified institutional buyers. The total value of all such securities, including those in “Other securities,” was $7,920,000, which represented 3.32% of the net assets of the fund. |
| 2 | Coupon rate may change periodically. For short-term securities, the date of the next scheduled coupon rate change is considered to be the maturity date. |
Key to abbreviations and symbol
Agcy. = Agency
AMT = Alternative Minimum Tax
Auth. = Authority
Dept. = Department
Dev. = Development
Dist. = District
Econ. = Economic
Fac. = Facility
Facs. = Facilities
Fin. = Finance
Fncg. = Financing
G.O. = General Obligation
LIBOR = London Interbank Offered Rate
LOC = Letter of Credit
Preref. = Prerefunded
Redev. = Redevelopment
Ref. = Refunding
Rev. = Revenue
SIFMA = Securities Industry and Financial Markets Association
USD/$ = U.S. dollars
| American Funds Tax-Exempt Funds | 47 |
Statements of assets and liabilities
at July 31, 2018
| American Funds Short-Term Tax-Exempt Bond Fund | Limited Term Tax-Exempt Bond Fund of America | |||||||
| Assets: | ||||||||
| Investment securities in unaffiliated issuers, at value | $ | 979,803 | $ | 3,928,884 | ||||
| Cash | 124 | 3,968 | ||||||
| Cash pledged for futures contracts | 134 | 418 | ||||||
| Receivables for: | ||||||||
| Sales of investments | 50 | 37,440 | ||||||
| Sales of fund’s shares | 1,412 | 5,338 | ||||||
| Interest | 7,624 | 34,563 | ||||||
| Variation margin on futures contracts | 4 | 5 | ||||||
| Other | 10 | 37 | ||||||
| 989,161 | 4,010,653 | |||||||
| Liabilities: | ||||||||
| Payables for: | ||||||||
| Purchases of investments | 9,395 | 37,719 | ||||||
| Repurchases of fund’s shares | 1,083 | 5,446 | ||||||
| Dividends on fund’s shares | 44 | 499 | ||||||
| Investment advisory services | 298 | 770 | ||||||
| Services provided by related parties | 81 | 714 | ||||||
| Trustees’ deferred compensation | 33 | 142 | ||||||
| Variation margin on futures contracts | — | — | ||||||
| Other | 40 | 52 | ||||||
| 10,974 | 45,342 | |||||||
| Net assets at July 31, 2018 | $ | 978,187 | $ | 3,965,311 | ||||
| Net assets consist of: | ||||||||
| Capital paid in on shares of beneficial interest | $ | 986,260 | $ | 3,953,115 | ||||
| Undistributed net investment income | 40 | 328 | ||||||
| Accumulated net realized loss | (3,334 | ) | (365 | ) | ||||
| Net unrealized (depreciation) appreciation | (4,779 | ) | 12,233 | |||||
| Net assets at July 31, 2018 | $ | 978,187 | $ | 3,965,311 | ||||
| Investment securities in unaffiliated issuers, at cost | $ | 984,481 | $ | 3,916,741 | ||||
See Notes to Financial Statements
| 48 | American Funds Tax-Exempt Funds |
(dollars in thousands)
| The Tax-Exempt Bond Fund of America | American High-Income Municipal Bond Fund | The Tax-Exempt Fund of California | American Funds Tax-Exempt Fund of New York | |||||||||||
| $ | 19,016,682 | $ | 6,445,469 | $ | 2,253,574 | $ | 238,370 | |||||||
| 1,173 | 726 | 238 | 456 | |||||||||||
| 1,847 | 415 | — | — | |||||||||||
| 60,768 | 20,142 | — | 667 | |||||||||||
| 28,124 | 9,958 | 3,846 | 23 | |||||||||||
| 183,193 | 63,457 | 27,611 | 2,294 | |||||||||||
| 55 | 14 | — | — | |||||||||||
| 284 | 112 | 9 | 4 | |||||||||||
| 19,292,126 | 6,540,293 | 2,285,278 | 241,814 | |||||||||||
| 225,185 | 34,998 | 24,391 | 2,907 | |||||||||||
| 28,598 | 9,249 | 3,606 | 138 | |||||||||||
| 2,530 | 1,521 | 677 | 110 | |||||||||||
| 3,344 | 1,531 | 557 | 67 | |||||||||||
| 2,837 | 1,181 | 466 | 40 | |||||||||||
| 662 | 122 | 140 | 1 | |||||||||||
| 813 | 219 | — | — | |||||||||||
| 95 | 56 | 79 | 50 | |||||||||||
| 264,064 | 48,877 | 29,916 | 3,313 | |||||||||||
| $ | 19,028,062 | $ | 6,491,416 | $ | 2,255,362 | $ | 238,501 | |||||||
| $ | 18,771,212 | $ | 6,371,114 | $ | 2,208,312 | $ | 235,219 | |||||||
| 9,749 | 11,973 | 1,779 | 116 | |||||||||||
| (10,333 | ) | (26,668 | ) | (408 | ) | (124 | ) | |||||||
| 257,434 | 134,997 | 45,679 | 3,290 | |||||||||||
| $ | 19,028,062 | $ | 6,491,416 | $ | 2,255,362 | $ | 238,501 | |||||||
| $ | 18,761,117 | $ | 6,310,369 | $ | 2,207,895 | $ | 235,080 | |||||||
| American Funds Tax-Exempt Funds | 49 |
Statements of assets and liabilities
at July 31, 2018
| American
Funds Short-Term Tax-Exempt Bond Fund | Limited
Term Tax-Exempt Bond Fund of America | |||||||||
| Shares
of beneficial interest issued and outstanding (no stated par value) — unlimited shares authorized | ||||||||||
| Class A: | Net assets | $ | 751,913 | $ | 3,056,914 | |||||
| Shares outstanding | 74,909 | 196,925 | ||||||||
| Net asset value per share | $ | 10.04 | $ | 15.52 | ||||||
| Class C: | Net assets | $ | 20,365 | |||||||
| Shares outstanding | Not applicable | 1,312 | ||||||||
| Net asset value per share | $ | 15.52 | ||||||||
| Class T: | Net assets | $ | 10 | $ | 10 | |||||
| Shares outstanding | 1 | 1 | ||||||||
| Net asset value per share | $ | 10.04 | $ | 15.52 | ||||||
| Class F-1: | Net assets | $ | 6,945 | $ | 63,639 | |||||
| Shares outstanding | 692 | 4,099 | ||||||||
| Net asset value per share | $ | 10.04 | $ | 15.52 | ||||||
| Class F-2: | Net assets | $ | 52,597 | $ | 352,839 | |||||
| Shares outstanding | 5,240 | 22,730 | ||||||||
| Net asset value per share | $ | 10.04 | $ | 15.52 | ||||||
| Class F-3: | Net assets | $ | 45,080 | $ | 187,627 | |||||
| Shares outstanding | 4,491 | 12,087 | ||||||||
| Net asset value per share | $ | 10.04 | $ | 15.52 | ||||||
| Class R-6: | Net assets | $ | 121,642 | $ | 283,917 | |||||
| Shares outstanding | 12,118 | 18,290 | ||||||||
| Net asset value per share | $ | 10.04 | $ | 15.52 | ||||||
See Notes to Financial Statements
| 50 | American Funds Tax-Exempt Funds |
(dollars and shares in thousands, except per-share amounts)
| The Tax-Exempt Bond Fund of America | American High-Income Municipal Bond Fund | The Tax-Exempt Fund of California | American Funds Tax-Exempt Fund of New York | |||||||||||
| $ | 10,102,265 | $ | 4,062,292 | $ | 1,677,805 | $ | 182,791 | |||||||
| 788,687 | 257,355 | 96,262 | 17,229 | |||||||||||
| $ | 12.81 | $ | 15.78 | $ | 17.43 | $ | 10.61 | |||||||
| $ | 431,386 | $ | 226,538 | $ | 71,335 | $ | 11,713 | |||||||
| 33,678 | 14,352 | 4,093 | 1,104 | |||||||||||
| $ | 12.81 | $ | 15.78 | $ | 17.43 | $ | 10.61 | |||||||
| $ | 10 | $ | 10 | $ | 10 | $ | 10 | |||||||
| 1 | 1 | 1 | 1 | |||||||||||
| $ | 12.81 | $ | 15.78 | $ | 17.43 | $ | 10.61 | |||||||
| $ | 369,587 | $ | 207,544 | $ | 74,888 | $ | 2,019 | |||||||
| 28,854 | 13,148 | 4,296 | 190 | |||||||||||
| $ | 12.81 | $ | 15.78 | $ | 17.43 | $ | 10.61 | |||||||
| $ | 2,177,192 | $ | 798,512 | $ | 257,416 | $ | 15,833 | |||||||
| 169,974 | 50,587 | 14,769 | 1,492 | |||||||||||
| $ | 12.81 | $ | 15.78 | $ | 17.43 | $ | 10.61 | |||||||
| $ | 5,397,368 | $ | 646,018 | $ | 173,908 | $ | 26,135 | |||||||
| 421,374 | 40,927 | 9,978 | 2,463 | |||||||||||
| $ | 12.81 | $ | 15.78 | $ | 17.43 | $ | 10.61 | |||||||
| $ | 550,254 | $ | 550,502 | |||||||||||
| 42,959 | 34,876 | Not applicable | Not applicable | |||||||||||
| $ | 12.81 | $ | 15.78 | |||||||||||
| American Funds Tax-Exempt Funds | 51 |
Statements of operations
for the year ended July 31,
2018
| American Funds Short-Term Tax-Exempt Bond Fund | Limited Term Tax-Exempt Bond Fund of America | |||||||
| Investment income: | ||||||||
| Income: | ||||||||
| Interest | $ | 18,935 | $ | 103,344 | ||||
| Fees and expenses*: | ||||||||
| Investment advisory services | 3,548 | 9,138 | ||||||
| Distribution services | 1,150 | 9,649 | ||||||
| Transfer agent services | 326 | 1,588 | ||||||
| Administrative services | 194 | 764 | ||||||
| Reports to shareholders | 28 | 109 | ||||||
| Registration statement and prospectus | 158 | 330 | ||||||
| Trustees’ compensation | 10 | 45 | ||||||
| Auditing and legal | 51 | 65 | ||||||
| Custodian | 4 | 12 | ||||||
| Federal, state and local taxes | — | † | 196 | |||||
| Other | 17 | 27 | ||||||
| Total fees and expenses | 5,486 | 21,923 | ||||||
| Less waivers/reimbursement of fees and expenses: | ||||||||
| Investment advisory services waivers | — | — | ||||||
| Miscellaneous fee reimbursement | — | — | ||||||
| Total waivers/reimbursement of fees and expenses | — | — | ||||||
| Total fees and expenses after waivers/reimbursement | 5,486 | 21,923 | ||||||
| Net investment income | 13,449 | 81,421 | ||||||
| Net realized (loss) gain and unrealized (depreciation) appreciation: | ||||||||
| Net realized (loss) gain on: | ||||||||
| Investments in unaffiliated issuers | (1,290 | ) | 50 | |||||
| Futures contracts | — | 77 | ||||||
| (1,290 | ) | 127 | ||||||
| Net unrealized (depreciation) appreciation on: | ||||||||
| Investments in unaffiliated issuers | (9,928 | ) | (65,092 | ) | ||||
| Futures contracts | (101 | ) | 90 | |||||
| (10,029 | ) | (65,002 | ) | |||||
| Net realized (loss) gain and unrealized (depreciation) appreciation | (11,319 | ) | (64,875 | ) | ||||
| Net increase in net assets resulting from operations | $ | 2,130 | $ | 16,546 | ||||
| * | Additional information related to class-specific fees and expenses is included in the Notes to Financial Statements. |
| † | Amount less than one thousand. |
See Notes to Financial Statements
| 52 | American Funds Tax-Exempt Funds |
(dollars in thousands)
| The Tax-Exempt Bond Fund of America | American High-Income Municipal Bond Fund | The Tax-Exempt Fund of California | American Funds Tax-Exempt Fund of New York | |||||||||||
| $ | 578,491 | $ | 266,356 | $ | 77,256 | $ | 7,354 | |||||||
| 35,922 | 17,182 | 6,453 | 756 | |||||||||||
| 30,693 | 14,323 | 5,146 | 574 | |||||||||||
| 6,404 | 3,039 | 721 | 79 | |||||||||||
| 4,429 | 1,474 | 433 | 43 | |||||||||||
| 441 | 162 | 60 | 7 | |||||||||||
| 1,298 | 487 | 110 | 89 | |||||||||||
| 188 | 63 | 30 | 2 | |||||||||||
| 117 | 75 | 95 | 62 | |||||||||||
| 41 | 15 | 6 | — | † | ||||||||||
| 1,227 | 1,915 | 349 | 61 | |||||||||||
| 108 | 83 | 21 | 11 | |||||||||||
| 80,868 | 38,818 | 13,424 | 1,684 | |||||||||||
| 49 | 5 | — | — | |||||||||||
| — | — | — | 90 | |||||||||||
| 49 | 5 | — | 90 | |||||||||||
| 80,819 | 38,813 | 13,424 | 1,594 | |||||||||||
| 497,672 | 227,543 | 63,832 | 5,760 | |||||||||||
| 24,829 | 48,693 | 7,138 | 132 | |||||||||||
| (3,792 | ) | (131 | ) | — | — | |||||||||
| 21,037 | 48,562 | 7,138 | 132 | |||||||||||
| (264,737 | ) | (37,519 | ) | (32,836 | ) | (4,196 | ) | |||||||
| 1,869 | (103 | ) | — | — | ||||||||||
| (262,868 | ) | (37,622 | ) | (32,836 | ) | (4,196 | ) | |||||||
| (241,831 | ) | 10,940 | (25,698 | ) | (4,064 | ) | ||||||||
| $ | 255,841 | $ | 238,483 | $ | 38,134 | $ | 1,696 | |||||||
| American Funds Tax-Exempt Funds | 53 |
Statements of changes in net assets
| American Funds Short-Term Tax-Exempt Bond Fund | Limited Term Tax-Exempt Bond Fund of America | The Tax-Exempt Bond Fund of America |
||||||||||||||||||||||
| Year ended July 31 | Year ended July 31 | Year ended July 31 | ||||||||||||||||||||||
| 2018 | 2017 | 2018 | 2017 | 2018 | 2017 | |||||||||||||||||||
| Operations: | ||||||||||||||||||||||||
| Net investment income | $ | 13,449 | $ | 10,022 | $ | 81,421 | $ | 78,699 | $ | 497,672 | $ | 436,115 | ||||||||||||
| Net realized (loss) gain | (1,290 | ) | (558 | ) | 127 | (294 | ) | 21,037 | (11,218 | ) | ||||||||||||||
| Net unrealized depreciation | (10,029 | ) | (3,763 | ) | (65,002 | ) | (66,254 | ) | (262,868 | ) | (434,509 | ) | ||||||||||||
| Net increase (decrease) in net assets resulting from operations | 2,130 | 5,701 | 16,546 | 12,151 | 255,841 | (9,612 | ) | |||||||||||||||||
| Dividends paid or accrued to shareholders from net investment income | (13,421 | ) | (9,997 | ) | (81,415 | ) | (78,498 | ) | (496,829 | ) | (432,228 | ) | ||||||||||||
| Net capital share transactions | (9,712 | ) | 222,373 | 167,187 | 179,550 | 4,798,328 | 1,095,007 | |||||||||||||||||
| Total (decrease) increase in net assets | (21,003 | ) | 218,077 | 102,318 | 113,203 | 4,557,340 | 653,167 | |||||||||||||||||
| Net assets: | ||||||||||||||||||||||||
| Beginning of year | 999,190 | 781,113 | 3,862,993 | 3,749,790 | 14,470,722 | 13,817,555 | ||||||||||||||||||
| End of year | $ | 978,187 | $ | 999,190 | $ | 3,965,311 | $ | 3,862,993 | $ | 19,028,062 | $ | 14,470,722 | ||||||||||||
| Undistributed net investment income | $ | 40 | $ | 70 | $ | 328 | $ | 308 | $ | 9,749 | $ | 11,972 | ||||||||||||
See Notes to Financial Statements
| 54 | American Funds Tax-Exempt Funds |
| American High-Income Municipal Bond Fund | The Tax-Exempt Fund of California | American Funds Tax-Exempt Fund of New York |
||||||||||||||||||||
| Year ended July 31 | Year ended July 31 | Year ended July 31 | ||||||||||||||||||||
| 2018 | 2017 | 2018 | 2017 | 2018 | 2017 | |||||||||||||||||
| $ | 227,543 | $ | 198,585 | $ | 63,832 | $ | 62,351 | $ | 5,760 | $ | 5,206 | |||||||||||
| 48,562 | 29,859 | 7,138 | 165 | 132 | (257 | ) | ||||||||||||||||
| (37,622 | ) | (188,457 | ) | (32,836 | ) | (71,163 | ) | (4,196 | ) | (6,080 | ) | |||||||||||
| 238,483 | 39,987 | 38,134 | (8,647 | ) | 1,696 | (1,131 | ) | |||||||||||||||
| (224,199 | ) | (193,595 | ) | (63,679 | ) | (61,637 | ) | (5,766 | ) | (5,169 | ) | |||||||||||
| 963,626 | 574,599 | 157,339 | 122,984 | 31,122 | 8,850 | |||||||||||||||||
| 977,910 | 420,991 | 131,794 | 52,700 | 27,052 | 2,550 | |||||||||||||||||
| 5,513,506 | 5,092,515 | 2,123,568 | 2,070,868 | 211,449 | 208,899 | |||||||||||||||||
| $ | 6,491,416 | $ | 5,513,506 | $ | 2,255,362 | $ | 2,123,568 | $ | 238,501 | $ | 211,449 | |||||||||||
| $ | 11,973 | $ | 12,036 | $ | 1,779 | $ | 1,795 | $ | 116 | $ | 79 | |||||||||||
| American Funds Tax-Exempt Funds | 55 |
Notes to financial statements
1. Organization
American Funds Short-Term Tax-Exempt Bond Fund, Limited Term Tax-Exempt Bond Fund of America, The Tax-Exempt Bond Fund of America, American High-Income Municipal Bond Fund, The Tax-Exempt Fund of California, which is presently the only series of The American Funds Tax-Exempt Series II, and American Funds Tax-Exempt Fund of New York (each a “fund” or collectively, the “funds”), are registered under the Investment Company Act of 1940 as open-end, diversified management investment companies.
Each fund’s investment objectives are as follows:
American Funds Short-Term Tax-Exempt Bond Fund — Seeks to provide current income exempt from regular federal income tax, consistent with the maturity and quality standards described in the prospectus, and to preserve capital.
Limited Term Tax-Exempt Bond Fund of America — Seeks to provide current income exempt from regular federal income tax, consistent with the maturity and quality standards described in the prospectus, and to preserve capital.
The Tax-Exempt Bond Fund of America — Seeks to provide a high level of current income exempt from federal income tax, consistent with the preservation of capital.
American High-Income Municipal Bond Fund — Seeks to provide a high level of current income exempt from regular federal income tax.
The Tax-Exempt Fund of California — Seeks to provide a high level of current income exempt from regular federal and California state income taxes. Its secondary objective is preservation of capital.
American Funds Tax-Exempt Fund of New York — Seeks to provide a high level of current income exempt from regular federal, New York state and New York City income taxes. Its secondary objective is preservation of capital.
American Funds Short-Term Tax-Exempt Bond Fund has six share classes consisting of five retail share classes (Classes A and T, as well as three F share classes, F-1, F-2 and F-3) and one share class that is only available to the American Funds Portfolio Series (Class R-6). Limited Term Tax-Exempt Bond Fund of America, The Tax-Exempt Bond Fund of America and American High-Income Municipal Bond Fund each have seven share classes consisting of six retail share classes (Classes A, C and T, as well as three F share classes, F-1, F-2 and F-3) and one share class that is only available to the American Funds Portfolio Series (Class R-6). The Tax-Exempt Fund of California and American Funds Tax-Exempt Fund of New York each have six retail share classes (Classes A, C and T, as well as three F share classes, F-1, F-2 and F-3). Some share classes are only available to limited categories of investors. The funds’ share classes are described further in the following table:
| Share class | Initial sales charge | Contingent deferred sales charge upon redemption |
Conversion feature | |||
| Class A | Up to 2.50% for American Funds Short-Term Tax-Exempt Bond Fund and Limited Term Tax-Exempt Bond Fund of America; up to 3.75% for all other funds | None (except 1% for certain redemptions within 18 months of purchase without an initial sales charge) | None | |||
| Class C* | None | 1% for redemptions within one year of purchase | Class C converts to Class F-1 after 10 years | |||
| Class T† | Up to 2.50% | None | None | |||
| Classes F-1, F-2 and F-3 | None | None | None | |||
| Class R-6 | None | None | None |
| * | Class C shares are not available for purchase in Limited Term Tax-Exempt Bond Fund of America. |
| † | Class T shares are not available for purchase. |
Holders of all share classes of each fund have equal pro rata rights to the assets, dividends and liquidation proceeds of each fund held. Each share class of each fund has identical voting rights, except for the exclusive right to vote on matters affecting only its class. Share classes have different fees and expenses (“class-specific fees and expenses”), primarily due to different arrangements for distribution, transfer agent and administrative services. Differences in class-specific fees and expenses will result in differences in net investment income and, therefore, the payment of different per-share dividends by each share class of each fund.
| 56 | American Funds Tax-Exempt Funds |
2. Significant accounting policies
Each fund is an investment company that applies the accounting and reporting guidance issued in Topic 946 by the U.S. Financial Accounting Standards Board. Each fund’s financial statements have been prepared to comply with U.S. generally accepted accounting principles (“U.S. GAAP”). These principles require the funds’ investment adviser to make estimates and assumptions that affect reported amounts and disclosures. Actual results could differ from those estimates. Subsequent events, if any, have been evaluated through the date of issuance in the preparation of the financial statements. The funds follow the significant accounting policies described in this section, as well as the valuation policies described in the next section on valuation.
Security transactions and related investment income — Security transactions are recorded by the funds as of the date the trades are executed with brokers. Realized gains and losses from security transactions are determined based on the specific identified cost of the securities. In the event a security is purchased with a delayed payment date, the funds will segregate liquid assets sufficient to meet their payment obligations. Interest income is recognized on an accrual basis. Market discounts, premiums and original issue discounts on fixed-income securities are amortized daily over the expected life of the security.
Class allocations — Income, fees and expenses (other than class-specific fees and expenses) are allocated daily among the various share classes of each fund based on the relative value of their settled shares. Realized and unrealized gains and losses are allocated daily among the various share classes of each fund based on their relative net assets. Class-specific fees and expenses, such as distribution, transfer agent and administrative services, are charged directly to the respective share class of each fund.
Dividends and distributions to shareholders — Dividends to shareholders are declared daily after the determination of each fund’s net investment income and are paid to shareholders monthly. Distributions to shareholders are recorded on each fund’s ex-dividend date.
3. Valuation
Capital Research and Management Company (“CRMC”), the funds’ investment adviser, values each fund’s investments at fair value as defined by U.S. GAAP. The net asset value of each share class of each fund is generally determined as of approximately 4:00 p.m. New York time each day the New York Stock Exchange is open.
Methods and inputs — The funds’ investment adviser uses the following methods and inputs to establish the fair value of each fund’s assets and liabilities. Use of particular methods and inputs may vary over time based on availability and relevance as market and economic conditions evolve.
Fixed-income securities, including short-term securities, are generally valued at prices obtained from one or more pricing vendors. Vendors value such securities based on one or more of the following inputs: benchmark yields, transactions, bids, offers, quotations from dealers and trading systems, new issues, spreads and other relationships observed in the markets among comparable securities; and proprietary pricing models such as yield measures calculated using factors such as cash flows, financial or collateral performance and other reference data. For certain distressed securities, valuations may include cash flows or liquidation values using a net present value calculation based on inputs that include, but are not limited to, financial statements and debt contracts.
When the funds’ investment adviser deems it appropriate to do so (such as when vendor prices are unavailable or not deemed to be representative), fixed-income securities will be valued in good faith at the mean quoted bid and ask prices that are reasonably and timely available (or bid prices, if ask prices are not available) or at prices for securities of comparable maturity, quality and type. Some securities may be valued based on their effective maturity or average life, which may be shorter than the stated maturity.
Exchange-traded futures are generally valued at the official settlement price of, or the last reported sale price on, the exchange or market on which such instruments are traded, as of the close of business on the day the futures are being valued or, lacking any sales, at the last available bid price. Prices for each future are taken from the exchange or market on which the security trades.
Securities and other assets for which representative market quotations are not readily available or are considered unreliable by the funds’ investment adviser are fair valued as determined in good faith under fair valuation guidelines adopted by authority of each fund’s board of trustees as further described. The investment adviser follows fair valuation guidelines, consistent with U.S. Securities and Exchange Commission rules and guidance, to consider relevant principles and factors when making fair value determinations. The investment adviser considers relevant indications of value that are reasonably and timely available to it in determining the fair value to be assigned to a particular security, such as the type and cost of the security; contractual or legal restrictions on resale of the security; relevant financial or business developments of the issuer; actively traded similar or related securities; conversion or exchange rights on the security; related corporate actions; significant events occurring after the close of trading in the security; and changes in overall market conditions. In
| American Funds Tax-Exempt Funds | 57 |
addition, the closing prices of equity securities that trade in markets outside U.S. time zones may be adjusted to reflect significant events that occur after the close of local trading but before the net asset value of each share class of the fund is determined. Fair valuations and valuations of investments that are not actively trading involve judgment and may differ materially from valuations that would have been used had greater market activity occurred.
Processes and structure — Each fund’s board of trustees has delegated authority to the funds’ investment adviser to make fair value determinations, subject to board oversight. The investment adviser has established a Joint Fair Valuation Committee (the “Fair Valuation Committee”) to administer, implement and oversee the fair valuation process, and to make fair value decisions. The Fair Valuation Committee regularly reviews its own fair value decisions, as well as decisions made under its standing instructions to the investment adviser’s valuation teams. The Fair Valuation Committee reviews changes in fair value measurements from period to period and may, as deemed appropriate, update the fair valuation guidelines to better reflect the results of back testing and address new or evolving issues. The Fair Valuation Committee reports any changes to the fair valuation guidelines to the boards of trustees. Each fund’s board and audit committee also regularly review reports that describe fair value determinations and methods.
The funds’ investment adviser has also established a Fixed-Income Pricing Review Group to administer and oversee the fixed-income valuation process, including the use of fixed-income pricing vendors. This group regularly reviews pricing vendor information and market data. Pricing decisions, processes and controls over security valuation are also subject to additional internal reviews, including an annual control self-evaluation program facilitated by the investment adviser’s compliance group.
Classifications — The funds’ investment adviser classifies each fund’s assets and liabilities into three levels based on the inputs used to value the assets or liabilities. Level 1 values are based on quoted prices in active markets for identical securities. Level 2 values are based on significant observable market inputs, such as quoted prices for similar securities and quoted prices in inactive markets. Certain securities trading outside the U.S. may transfer between Level 1 and Level 2 due to valuation adjustments resulting from significant market movements following the close of local trading. Level 3 values are based on significant unobservable inputs that reflect the investment adviser’s determination of assumptions that market participants might reasonably use in valuing the securities. The valuation levels are not necessarily an indication of the risk or liquidity associated with the underlying investment. For example, U.S. government securities are reflected as Level 2 because the inputs used to determine fair value may not always be quoted prices in an active market. The following tables present the funds’ valuation levels as of July 31, 2018 (dollars in thousands):
American Funds Short-Term Tax-Exempt Bond Fund
| Investment securities | ||||||||||||||||
| Level 1 | Level 2 | Level 3 | Total | |||||||||||||
| Assets: | ||||||||||||||||
| Bonds, notes & other debt instruments: | ||||||||||||||||
| Texas | $ | — | $ | 101,755 | $ | — | $ | 101,755 | ||||||||
| Illinois | — | 100,450 | — | 100,450 | ||||||||||||
| New York | — | 81,563 | — | 81,563 | ||||||||||||
| California | — | 60,060 | — | 60,060 | ||||||||||||
| Wisconsin | — | 41,701 | — | 41,701 | ||||||||||||
| Pennsylvania | — | 31,589 | — | 31,589 | ||||||||||||
| Florida | — | 30,290 | — | 30,290 | ||||||||||||
| Washington | — | 30,035 | — | 30,035 | ||||||||||||
| New Jersey | — | 28,662 | — | 28,662 | ||||||||||||
| Massachusetts | — | 28,476 | — | 28,476 | ||||||||||||
| Other | — | 343,672 | — | 343,672 | ||||||||||||
| Short-term securities | — | 101,550 | — | 101,550 | ||||||||||||
| Total | $ | — | $ | 979,803 | $ | — | $ | 979,803 | ||||||||
| Other investments* | ||||||||||||||||
| Level 1 | Level 2 | Level 3 | Total | |||||||||||||
| Liabilities: | ||||||||||||||||
| Unrealized depreciation on futures contracts | $ | (101 | ) | $ | — | $ | — | $ | (101 | ) | ||||||
| 58 | American Funds Tax-Exempt Funds |
Limited Term Tax-Exempt Bond Fund of America
| Investment securities | ||||||||||||||||
| Level 1 | Level 2 | Level 3 | Total | |||||||||||||
| Assets: | ||||||||||||||||
| Bonds, notes & other debt instruments: | ||||||||||||||||
| Illinois | $ | — | $ | 513,642 | $ | — | $ | 513,642 | ||||||||
| Texas | — | 369,379 | — | 369,379 | ||||||||||||
| California | — | 308,753 | — | 308,753 | ||||||||||||
| New York | — | 289,548 | — | 289,548 | ||||||||||||
| Pennsylvania | — | 209,659 | — | 209,659 | ||||||||||||
| Florida | — | 194,741 | — | 194,741 | ||||||||||||
| Michigan | — | 150,644 | — | 150,644 | ||||||||||||
| New Jersey | — | 132,360 | — | 132,360 | ||||||||||||
| Wisconsin | — | 121,863 | — | 121,863 | ||||||||||||
| Massachusetts | — | 109,981 | — | 109,981 | ||||||||||||
| Other | — | 1,257,805 | — | 1,257,805 | ||||||||||||
| Short-term securities | — | 270,509 | — | 270,509 | ||||||||||||
| Total | $ | — | $ | 3,928,884 | $ | — | $ | 3,928,884 | ||||||||
| Other investments* | ||||||||||||||||
| Level 1 | Level 2 | Level 3 | Total | |||||||||||||
| Assets: | ||||||||||||||||
| Unrealized appreciation on futures contracts | $ | 90 | $ | — | $ | — | $ | 90 | ||||||||
The Tax-Exempt Bond Fund of America
| Investment securities | ||||||||||||||||
| Level 1 | Level 2 | Level 3 | Total | |||||||||||||
| Assets: | ||||||||||||||||
| Bonds, notes & other debt instruments: | ||||||||||||||||
| Illinois | $ | — | $ | 2,517,518 | $ | — | $ | 2,517,518 | ||||||||
| Texas | — | 1,877,572 | — | 1,877,572 | ||||||||||||
| California | — | 1,417,266 | — | 1,417,266 | ||||||||||||
| New York | — | 1,351,830 | — | 1,351,830 | ||||||||||||
| Florida | — | 1,227,942 | 6,551 | 1,234,493 | ||||||||||||
| Pennsylvania | — | 798,191 | — | 798,191 | ||||||||||||
| Michigan | — | 679,053 | — | 679,053 | ||||||||||||
| Washington | — | 542,077 | — | 542,077 | ||||||||||||
| Virginia | — | 531,897 | — | 531,897 | ||||||||||||
| Ohio | — | 452,616 | — | 452,616 | ||||||||||||
| Other | — | 6,452,500 | — | 6,452,500 | ||||||||||||
| Short-term securities | — | 1,161,669 | — | 1,161,669 | ||||||||||||
| Total | $ | — | $ | 19,010,131 | $ | 6,551 | $ | 19,016,682 | ||||||||
| Other investments* | ||||||||||||||||
| Level 1 | Level 2 | Level 3 | Total | |||||||||||||
| Assets: | ||||||||||||||||
| Unrealized appreciation on futures contracts | $ | 1,942 | $ | — | $ | — | $ | 1,942 | ||||||||
| Liabilities: | ||||||||||||||||
| Unrealized depreciation on futures contracts | (73 | ) | — | — | (73 | ) | ||||||||||
| Total | $ | 1,869 | $ | — | $ | — | $ | 1,869 | ||||||||
See end of tables for footnote.
| American Funds Tax-Exempt Funds | 59 |
American High-Income Municipal Bond Fund
| Investment securities | ||||||||||||||||
| Level 1 | Level 2 | Level 3 | Total | |||||||||||||
| Assets: | ||||||||||||||||
| Bonds, notes & other debt instruments: | ||||||||||||||||
| Illinois | $ | — | $ | 951,635 | $ | — | $ | 951,635 | ||||||||
| Texas | — | 467,564 | — | 467,564 | ||||||||||||
| California | — | 368,186 | — | 368,186 | ||||||||||||
| Florida | — | 357,580 | 6,636 | 364,216 | ||||||||||||
| Pennsylvania | — | 357,874 | — | 357,874 | ||||||||||||
| Colorado | — | 316,863 | — | 316,863 | ||||||||||||
| New Jersey | — | 257,260 | — | 257,260 | ||||||||||||
| Ohio | — | 247,105 | — | 247,105 | ||||||||||||
| New York | — | 244,951 | — | 244,951 | ||||||||||||
| Puerto Rico | — | 189,137 | — | 189,137 | ||||||||||||
| Other | — | 2,293,065 | — | 2,293,065 | ||||||||||||
| Short-term securities | — | 387,613 | — | 387,613 | ||||||||||||
| Total | $ | — | $ | 6,438,833 | $ | 6,636 | $ | 6,445,469 | ||||||||
| Other investments* | ||||||||||||||||
| Level 1 | Level 2 | Level 3 | Total | |||||||||||||
| Assets: | ||||||||||||||||
| Unrealized appreciation on futures contracts | $ | 270 | $ | — | $ | — | $ | 270 | ||||||||
| Liabilities: | ||||||||||||||||
| Unrealized depreciation on futures contracts | (373 | ) | — | — | (373 | ) | ||||||||||
| Total | $ | (103 | ) | $ | — | $ | — | $ | (103 | ) | ||||||
| * | Futures contracts are not included in the investment portfolio. |
The Tax-Exempt Fund of California
At July 31, 2018, all of the fund’s investment securities were classified as Level 2.
American Funds Tax-Exempt Fund of New York
At July 31, 2018, all of the fund’s investment securities were classified as Level 2.
4. Risk factors
Investing in each fund may involve certain risks including, but not limited to, those described below.
Market conditions — The prices of, and the income generated by, the securities held by the funds may decline — sometimes rapidly or unpredictably — due to various factors, including events or conditions affecting the general economy or particular industries; overall market changes; local, regional or global political, social or economic instability; governmental or governmental agency responses to economic conditions; and currency exchange rate, interest rate and commodity price fluctuations.
Issuer risks — The prices of, and the income generated by, securities held by the funds may decline in response to various factors directly related to the issuers of such securities, including reduced demand for an issuer’s goods or services, poor management performance and strategic initiatives such as mergers, acquisitions or dispositions and the market response to any such initiatives.
Investing in municipal securities — The yield and/or value of the funds’ investments in municipal securities may be adversely affected by events tied to the municipal securities markets, which can be very volatile and significantly impacted by unfavorable legislative or political developments and negative changes in the financial conditions of municipal securities issuers and the economy. To the extent the funds invest in obligations of a municipal issuer, the volatility, credit quality and performance of the funds may be adversely impacted by local political and economic conditions of the issuer. For example, a credit rating downgrade, bond default or bankruptcy involving an issuer within a particular state or territory could affect the market values and marketability of many or all municipal obligations of that state or territory. Income from municipal securities held by the funds could also be declared taxable because of changes in tax laws or interpretations by taxing authorities or as a result of noncompliant conduct of a municipal issuer. Additionally, the relative amount of publicly available information about municipal securities is generally less than that for corporate securities.
| 60 | American Funds Tax-Exempt Funds |
Investing in debt instruments — The prices of, and the income generated by, bonds and other debt securities held by the funds may be affected by changing interest rates and by changes in the effective maturities and credit ratings of these securities.
Rising interest rates will generally cause the prices of bonds and other debt securities to fall. Falling interest rates may cause an issuer to redeem, call or refinance a debt security before its stated maturity, which may result in the funds having to reinvest the proceeds in lower yielding securities. Longer maturity debt securities generally have greater sensitivity to changes in interest rates and may be subject to greater price fluctuations than shorter maturity debt securities.
Bonds and other debt securities are also subject to credit risk, which is the possibility that the credit strength of an issuer will weaken and/or an issuer of a debt security will fail to make timely payments of principal or interest and the security will go into default. Lower quality debt securities generally have higher rates of interest and may be subject to greater price fluctuations than higher quality debt securities. Credit risk is gauged, in part, by the credit ratings of the debt securities in which the funds invest. However, ratings are only the opinions of the rating agencies issuing them and are not guarantees as to credit quality or an evaluation of market risk. The funds’ investment adviser relies on its own credit analysts to research issuers and issues in seeking to mitigate various credit and default risks.
Liquidity risk — Certain fund holdings may be deemed to be less liquid or illiquid because they cannot be readily sold or converted to cash without significantly impacting the value of the holdings. Liquidity risk may result from the lack of an active market for a holding, legal or contractual restrictions on resale, or the reduced number and capacity of market participants to make a market in such holding. Market prices for less liquid or illiquid holdings may be volatile, and reduced liquidity may have an adverse impact on the market price of such holdings. Additionally, the sale of less liquid or illiquid holdings may involve substantial delays (including delays in settlement) and additional costs and the fund may be unable to sell such holdings when necessary to meet its liquidity needs.
Credit and liquidity support — Changes in the credit quality of banks and financial institutions providing credit and liquidity support features with respect to securities held by the funds could cause the values of these securities to decline.
Investing in lower rated debt instruments — Lower rated bonds and other lower rated debt securities generally have higher rates of interest and involve greater risk of default or price declines due to changes in the issuer’s creditworthiness than those of higher quality debt securities. The market prices of these securities may fluctuate more than the prices of higher quality debt securities and may decline significantly in periods of general economic difficulty. These risks may be increased with respect to investments in junk bonds.
Investing in similar municipal bonds — Investing significantly in municipal obligations of multiple issuers in the same state or backed by revenues of similar types of projects or industries may make the funds more susceptible to certain economic, political or regulatory occurrences. As a result, the potential for fluctuations in the funds’ share price may increase.
Risks of investing in municipal bonds of issuers within the state of California — Because The Tax-Exempt Fund of California invests primarily in securities of issuers within the state of California, the fund is more susceptible to factors adversely affecting issuers of California securities than a comparable municipal bond mutual fund that does not concentrate its investments in a single state. For example, in the past, California voters have passed amendments to the state’s constitution and other measures that limit the taxing and spending authority of California governmental entities, and future voter initiatives may adversely affect California municipal bonds.
Risks of investing in municipal bonds of issuers within the state of New York — Because American Funds Tax-Exempt Fund of New York invests primarily in securities of issuers within the state of New York, the fund is more susceptible to factors adversely affecting issuers of New York securities than a comparable municipal bond mutual fund that does not concentrate its investments in a single state. For example, such factors may include political policy changes, tax base erosion, state constitutional limits on tax increases, budget deficits and other financial or economic difficulties, and changes in the credit ratings assigned to New York’s municipal issuers. New York’s economy and finances may be especially vulnerable to changes in the performance of the financial services sector, which historically has been volatile.
Management — The investment adviser to the funds actively manages the funds’ investments. Consequently, the funds are subject to the risk that the methods and analyses employed by the investment adviser in this process may not produce the desired results. This could cause the funds to lose value or its investment results to lag relevant benchmarks or other funds with similar objectives.
| American Funds Tax-Exempt Funds | 61 |
5. Certain investment techniques
Futures contracts — American Funds Short-Term Tax Exempt Bond Fund, Limited Term Tax-Exempt Bond Fund of America, The Tax-Exempt Bond Fund of America and American High-Income Municipal Bond Fund have entered into futures contracts, which provide for the future sale by one party and purchase by another party of a specified amount of a specific financial instrument for a specified price, date, time and place designated at the time the contract is made. Futures contracts are used to strategically manage the fund’s interest rate sensitivity by increasing or decreasing the duration of the fund or a portion of the fund’s portfolio.
Upon entering into futures contracts, and to maintain the fund’s open positions in futures contracts, each fund is required to deposit with a futures broker, or FCM, in a segregated account in the name of the FCM an amount of cash, U.S. government securities or other liquid securities, known as initial margin. The margin required for a particular futures contract is set by the exchange on which the contract is traded to serve as collateral, and may be significantly modified from time to time by the exchange during the term of the contract. Securities deposited as initial margin, if any, are disclosed in the investment portfolio and cash deposited as initial margin, if any, is reflected as restricted cash pledged for futures contracts in the fund’s statement of assets and liabilities.
On a daily basis, each fund pays or receives variation margin based on the increase or decrease in the value of the futures contracts and records variation margin on futures contracts in the statement of assets and liabilities. In addition, each fund segregates liquid assets equivalent to each fund’s outstanding obligations under the contract in excess of the initial margin and variation margin, if any. Futures contracts may involve a risk of loss in excess of the variation margin shown on each fund’s statement of assets and liabilities. Each fund records realized gains or losses at the time the futures contract is closed or expires. Net realized gains or losses and net unrealized appreciation or depreciation from futures contracts are recorded in each fund’s statement of operations. The average month-end notional amount of futures contracts while held by American Funds Short-Term Tax Exempt Bond Fund, Limited Term Tax-Exempt Bond Fund of America, The Tax-Exempt Bond Fund of America and American High-Income Municipal Bond Fund was $49,000,000, $64,300,000, $587,629,000 and $97,917,000, respectively.
The following tables present the financial statement impacts resulting from the funds’ use of futures contracts as of, or for the year ended, July 31, 2018 (dollars in thousands):
American Funds Short-Term Tax-Exempt Bond Fund
| Assets | Liabilities | |||||||||||||
| Contracts | Risk type | Location on statement of assets and liabilities | Value | Location on statement of assets and liabilities | Value | |||||||||
| Futures | Interest | Unrealized appreciation* | $ | — | Unrealized depreciation* | $ | 101 | |||||||
| Net realized gain | Net unrealized depreciation | |||||||||||||
| Contracts | Risk type | Location on statement of operations | Value | Location on statement of operations | Value | |||||||||
| Futures | Interest | Net realized gain on futures contracts | $ | — | Net unrealized depreciation on futures contracts | $ | (101 | ) | ||||||
Limited Term Tax-Exempt Bond Fund of America
| Assets | Liabilities | |||||||||||||
| Contracts | Risk type | Location on statement of assets and liabilities | Value | Location on statement of assets and liabilities | Value | |||||||||
| Futures | Interest | Unrealized appreciation* | $ | 90 | Unrealized depreciation* | $ | — | |||||||
| Net realized gain | Net unrealized appreciation | |||||||||||||
| Contracts | Risk type | Location on statement of operations | Value | Location on statement of operations | Value | |||||||||
| Futures | Interest | Net realized gain on futures contracts | $ | 77 | Net unrealized appreciation on futures contracts | $ | 90 | |||||||
| 62 | American Funds Tax-Exempt Funds |
The Tax-Exempt Bond Fund of America
| Assets | Liabilities | |||||||||||||
| Contracts | Risk type | Location on statement of assets and liabilities | Value | Location on statement of assets and liabilities | Value | |||||||||
| Futures | Interest | Unrealized appreciation* | $ | 1,942 | Unrealized depreciation* | $ | 73 | |||||||
| Net realized loss | Net unrealized appreciation | |||||||||||||
| Contracts | Risk type | Location on statement of operations | Value | Location on statement of operations | Value | |||||||||
| Futures | Interest | Net realized loss on futures contracts | $ | (3,792 | ) | Net unrealized appreciation on futures contracts | $ | 1,869 | ||||||
American High-Income Municipal Bond Fund
| Assets | Liabilities | |||||||||||||
| Contracts | Risk type | Location on statement of assets and liabilities | Value | Location on statement of assets and liabilities | Value | |||||||||
| Futures | Interest | Unrealized appreciation* | $ | 270 | Unrealized depreciation* | $ | 373 | |||||||
| Net realized loss | Net unrealized depreciation | |||||||||||||
| Contracts | Risk type | Location on statement of operations | Value | Location on statement of operations | Value | |||||||||
| Futures | Interest | Net realized loss on futures contracts | $ | (131 | ) | Net unrealized depreciation on futures contracts | $ | (103 | ) | |||||
| * | Includes cumulative appreciation/depreciation on futures contracts as reported in the applicable table following the fund’s investment portfolio. Only current day’s variation margin is reported within the statement of assets and liabilities. |
Collateral — American Funds Short-Term Tax Exempt Bond Fund, Limited Term Tax-Exempt Bond Fund of America, The Tax-Exempt Bond Fund of America and American High-Income Municipal Bond Fund participate in a collateral program due to each fund’s use of future delivery contracts that calls for each fund to either receive or pledge highly liquid assets, such as cash or U.S. Treasury bills, as collateral based on the net gain or loss on unsettled contracts by certain counterparties. The purpose of the collateral is to cover potential losses that could occur in the event that either party cannot meet its contractual obligation. Non-cash collateral pledged by each fund, if any, is disclosed in each fund’s investment portfolio, and cash collateral pledged by each fund, if any, is held in a segregated account with each fund’s custodian, which is reflected as pledged cash in each fund’s statement of assets and liabilities.
6. Taxation and distributions
Federal income taxation — Each fund complies with the requirements under Subchapter M of the Internal Revenue Code applicable to mutual funds and intends to distribute substantially all of its net tax-exempt income and net capital gains each year. Generally, income earned by each fund is exempt from federal income taxes; however, each fund may earn taxable income from certain investments. The funds are not subject to income taxes to the extent such taxable income and net capital gains are distributed. To the extent the funds recognize taxable income, the funds may pay tax on such income in lieu of making distributions; amounts paid are included within federal, state and local taxes on the funds’ statements of operations.
As of and during the period ended July 31, 2018, none of the funds had a liability for any unrecognized tax benefits. Each fund recognizes interest and penalties, if any, related to unrecognized tax benefits as income tax expense in their respective statements of operations. During the period, none of the funds incurred any significant interest or penalties.
Each fund’s tax returns are not subject to examination by federal, state and, if applicable, non-U.S. tax authorities after the expiration of each jurisdiction’s statute of limitations, which is generally three years after the date of filing but can be extended in certain jurisdictions.
Distributions — Distributions paid to shareholders are based on each fund’s net investment income and net realized gains determined on a tax basis, which may differ from net investment income and net realized gains for financial reporting purposes. These differences are due primarily to different treatment for items such as short-term capital gains and losses; capital losses related to sales of certain securities
| American Funds Tax-Exempt Funds | 63 |
within 30 days of purchase; deferred expenses; cost of investments sold; net capital losses; amortization of premiums and discounts and income on certain investments. The fiscal year in which amounts are distributed may differ from the year in which the net investment income and net realized gains are recorded by the funds for financial reporting purposes.
Under the Regulated Investment Company Modernization Act of 2010 (the “Act”), net capital losses recognized after July 31, 2011, (August 31, 2011, for The Tax-Exempt Bond Fund of America and The Tax-Exempt Fund of California) may be carried forward indefinitely, and their character is retained as short-term and/or long-term losses. Previously, net capital losses were carried forward for eight years and treated as short-term losses. As a transition rule, the Act requires that post-enactment net capital losses be used before pre-enactment net capital losses.
Additional tax basis disclosures for each fund as of July 31, 2018, were as follows (dollars in thousands):
| American Funds Short-Term Tax-Exempt Bond Fund |
Limited Term Tax-Exempt Bond Fund of America |
The Tax-Exempt Bond Fund of America |
American High-Income Municipal Bond Fund |
The Tax-Exempt Fund of California |
American Funds Tax-Exempt Fund of New York |
|||||||||||||||||||
| Undistributed tax-exempt income | $ | 66 | $ | 571 | $ | 3,310 | $ | 3,556 | $ | 868 | $ | 127 | ||||||||||||
| Post-October capital loss deferral* | — | — | (6,970 | ) | — | (408 | ) | — | ||||||||||||||||
| Capital loss carryforward†: | ||||||||||||||||||||||||
| No expiration | (3,334 | ) | (249 | ) | — | — | — | (79 | ) | |||||||||||||||
| Expiring 2019 | — | — | — | (24,408 | ) | — | — | |||||||||||||||||
| (3,334 | ) | (249 | ) | — | (24,408 | ) | — | (79 | ) | |||||||||||||||
| Capital loss carryforward utilized | — | 368 | 16,769 | 40,880 | 6,765 | 178 | ||||||||||||||||||
| Capital loss carryforward expired | — | — | 5,830 | 8,913 | 23,580 | — | ||||||||||||||||||
| Gross unrealized appreciation on investments | 1,551 | 36,974 | 397,238 | 207,404 | 67,388 | 5,014 | ||||||||||||||||||
| Gross unrealized depreciation on investments | (6,278 | ) | (24,459 | ) | (131,333 | ) | (59,306 | ) | (19,981 | ) | (1,668 | ) | ||||||||||||
| Net unrealized (depreciation) appreciation on investments | (4,727 | ) | 12,515 | 265,905 | 148,098 | 47,407 | 3,346 | |||||||||||||||||
| Cost of investments | 984,429 | 3,916,459 | 18,752,646 | 6,297,268 | 2,206,167 | 235,024 | ||||||||||||||||||
| Reclassification to (from) undistributed net investment income from (to) accumulated net realized loss | (55 | ) | (127 | ) | (1,830 | ) | (387 | ) | (113 | ) | (1 | ) | ||||||||||||
| Reclassification to (from) undistributed net investment income from (to) capital paid in on shares of beneficial interest | (3 | ) | 141 | (1,236 | ) | (3,020 | ) | (56 | ) | 44 | ||||||||||||||
| Reclassification to (from) capital paid in on shares of beneficial interest from (to) accumulated net realized loss | — | — | (5,830 | ) | (8,913 | ) | (23,580 | ) | — | |||||||||||||||
| * | This deferral is considered incurred in the subsequent year. |
| † | Capital loss carryforwards will be used to offset any capital gains realized by the funds in future years. The funds will not make distributions from capital gains while a capital loss carryforward remains. |
Tax-exempt income distributions paid or accrued from each fund were characterized for tax purposes as follows (dollars in thousands):
American Funds Short-Term Tax-Exempt Bond Fund
| Share class | Year ended July 31, 2018 |
Year ended July 31, 2017 |
||||||
| Class A | $ | 10,014 | $ | 8,379 | ||||
| Class T1 | — | 2 | — | 2 | ||||
| Class F-1 | 93 | 110 | ||||||
| Class F-2 | 711 | 836 | ||||||
| Class F-33 | 716 | 209 | ||||||
| Class R-64 | 1,887 | 463 | ||||||
| Total | $ | 13,421 | $ | 9,997 | ||||
| 64 | American Funds Tax-Exempt Funds |
| Limited Term Tax-Exempt Bond Fund of America | ||||||||
| Share class | Year ended July 31, 2018 |
Year ended July 31, 2017 |
||||||
| Class A | $ | 61,392 | $ | 61,657 | ||||
| Class B5 | 1 | |||||||
| Class C | 288 | 367 | ||||||
| Class T1 | — | 2 | — | 2 | ||||
| Class F-1 | 1,510 | 1,696 | ||||||
| Class F-2 | 7,833 | 7,195 | ||||||
| Class F-33 | 3,549 | 738 | ||||||
| Class R-6 | 6,843 | 6,844 | ||||||
| Total | $ | 81,415 | $ | 78,498 | ||||
| The Tax-Exempt Bond Fund of America | ||||||||
| Share class | Year ended July 31, 2018 | Year ended July 31, 2017 | ||||||
| Class A | $ | 290,885 | $ | 293,044 | ||||
| Class B5 | 28 | |||||||
| Class C | 9,684 | 11,413 | ||||||
| Class T1 | — | 2 | — | 2 | ||||
| Class F-1 | 12,057 | 14,529 | ||||||
| Class F-2 | 61,316 | 93,190 | ||||||
| Class F-33 | 108,231 | 6,591 | ||||||
| Class R-6 | 14,656 | 13,433 | ||||||
| Total | $ | 496,829 | $ | 432,228 | ||||
| American High-Income Municipal Bond Fund | ||||||||
| Share class | Year ended July 31, 2018 | Year ended July 31, 2017 | ||||||
| Class A | $ | 141,994 | $ | 131,221 | ||||
| Class B5 | 15 | |||||||
| Class C | 6,687 | 7,065 | ||||||
| Class T1 | — | 2 | — | 2 | ||||
| Class F-1 | 7,964 | 8,811 | ||||||
| Class F-2 | 26,981 | 29,151 | ||||||
| Class F-33 | 22,072 | 4,691 | ||||||
| Class R-6 | 18,501 | 12,641 | ||||||
| Total | $ | 224,199 | $ | 193,595 | ||||
| The Tax-Exempt Fund of California | ||||||||
| Share class | Year ended July 31, 2018 | Year ended July 31, 2017 | ||||||
| Class A | $ | 48,366 | $ | 49,273 | ||||
| Class B5 | 2 | |||||||
| Class C | 1,638 | 2,020 | ||||||
| Class T1 | — | 2 | — | 2 | ||||
| Class F-1 | 2,065 | 2,227 | ||||||
| Class F-2 | 6,945 | 7,241 | ||||||
| Class F-33 | 4,665 | 874 | ||||||
| Total | $ | 63,679 | $ | 61,637 | ||||
See end of tables for footnotes.
| American Funds Tax-Exempt Funds | 65 |
American Funds Tax-Exempt Fund of New York
| Share class | Year ended July 31, 2018 | Year ended July 31, 2017 | ||||||
| Class A | $ | 4,525 | $ | 4,093 | ||||
| Class B5 | — | 2 | ||||||
| Class C | 209 | 233 | ||||||
| Class T1 | — | 2 | — | 2 | ||||
| Class F-1 | 68 | 57 | ||||||
| Class F-2 | 374 | 626 | ||||||
| Class F-33 | 590 | 160 | ||||||
| Total | $ | 5,766 | $ | 5,169 | ||||
| 1 | Class T shares began investment operations on April 7, 2017. |
| 2 | Amount less than one thousand. |
| 3 | Class F-3 shares began investment operations on January 27, 2017. |
| 4 | Class R-6 shares began investment operations on March 17, 2017. |
| 5 | Class B shares were fully liquidated on May 5, 2017. |
7. Fees and transactions with related parties
CRMC, the funds’ investment adviser, is the parent company of American Funds Distributors,® Inc. (“AFD”), the principal underwriter of the funds’ shares, and American Funds Service Company® (“AFS”), the funds’ transfer agent. CRMC, AFD and AFS are considered related parties to each fund.
Investment advisory services — Each fund has an investment advisory and service agreement with CRMC that provides for monthly fees accrued daily. These fees are based on annual rates that generally decrease as average net asset levels increase. The agreement for each fund, except American Funds Short-Term Tax-Exempt Bond Fund, also provides for monthly fees accrued daily based on a series of decreasing rates on each fund’s monthly gross income.
The range of rates, net asset levels, gross income levels and annualized rates of average net assets for each fund are as follows:
| Rates | Net asset level (in billions) | Rates | Monthly gross income | For the year ended | ||||||||||||||||||||||||||||||||
| Fund | Beginning with | Ending with | Up to | In excess of | Beginning with | Ending with | Up to | In excess of | July 31, 2018 | |||||||||||||||||||||||||||
| American Funds Short-Term Tax-Exempt Bond Fund | .390 | % | .290 | % | $ | .20 | $ | 1.2 | .358 | % | ||||||||||||||||||||||||||
| Limited Term Tax-Exempt Bond Fund of America | .300 | .150 | .06 | 1.0 | 3.00 | % | 2.50 | % | $ | 3,333,333 | $ | 3,333,333 | .229 | |||||||||||||||||||||||
| The Tax-Exempt Bond Fund of America | .300 | .110 | .06 | 15.0 | 3.00 | 2.00 | 3,333,333 | 8,333,333 | .213 | |||||||||||||||||||||||||||
| American High-Income Municipal Bond Fund | .300 | .140 | .06 | 6.0 | 3.00 | 2.50 | 3,333,333 | 3,333,333 | .284 | |||||||||||||||||||||||||||
| The Tax-Exempt Fund of California | .300 | .180 | .06 | 1.0 | 3.00 | 2.50 | 3,333,333 | 3,333,333 | .293 | |||||||||||||||||||||||||||
| American Funds Tax-Exempt Fund of New York | .300 | .180 | .06 | 1.0 | 3.00 | 2.50 | 3,333,333 | 3,333,333 | .330 | |||||||||||||||||||||||||||
Investment advisory services waivers — On March 5, 2018, the board of trustees approved an amended investment advisory and service agreement effective May 1, 2018, decreasing the annual rates to 0.115% and 0.110% on average daily net assets in excess of $15 billion and $21 billion, respectively, for The Tax-Exempt Bond Fund of America and to 0.140% on average daily net assets in excess of $6 billion for American High-Income Municipal Bond Fund. CRMC voluntarily reduced investment advisory services fees to the approved rates on both funds in advance of the effective date. For the year ended July 31, 2018, total investment advisory services fees waived by CRMC were $49,000 for The Tax- Exempt Bond Fund of America and $5,000 for the American High-Income Municipal Bond Fund. The amounts waived had no impact on either fund’s annualized rate of average net assets.
| 66 | American Funds Tax-Exempt Funds |
Class-specific fees and expenses — Expenses that are specific to individual share classes are accrued directly to the respective share class of each fund. The principal class-specific fees and expenses are described below:
Distribution services — Each fund has plans of distribution for all share classes, except Class F-2, F-3 and R-6 shares, if applicable. Under the plans, each fund’s board of trustees approves certain categories of expenses that are used to finance activities primarily intended to sell fund shares and service existing accounts. The plans provide for payments based on an annualized percentage of average daily net assets. In some cases, the boards of trustees have limited the amounts that may be paid to less than the maximum allowed by the plans. All share classes with a plan may use the allotted percentage of average daily net assets to pay service fees, or to compensate AFD for paying service fees, to firms that have entered into agreements with AFD to provide certain shareholder services. The remaining amounts available to be paid under each plan are paid to dealers to compensate them for their sales activities.
| American Funds Short-Term Tax-Exempt Bond Fund | Limited Term Tax-Exempt Bond Fund of America | The Tax-Exempt Bond Fund of America |
|||||||||||||||||||||||
| Share class | Currently approved limits |
Plan limits | Currently approved limits |
Plan limits | Currently approved limits |
Plan limits | |||||||||||||||||||
| Class A | 0.15 | % | 0.15 | % | 0.30 | % | 0.30 | % | 0.25 | % | 0.25 | % | |||||||||||||
| Class C | Not applicable | Not applicable | 1.00 | 1.00 | 1.00 | 1.00 | |||||||||||||||||||
| Classes T and F-1 | 0.25 | 0.50 | 0.25 | 0.50 | 0.25 | 0.50 | |||||||||||||||||||
| American High-Income Municipal Bond Fund | The Tax-Exempt Fund of California | American Funds Tax-Exempt Fund of New York |
|||||||||||||||||||||||
| Share class | Currently approved limits |
Plan limits | Currently approved limits |
Plan limits | Currently approved limits |
Plan limits | |||||||||||||||||||
| Class A | 0.30 | % | 0.30 | % | 0.25 | % | 0.25 | % | 0.25 | % | 0.30 | % | |||||||||||||
| Class C | 1.00 | 1.00 | 1.00 | 1.00 | 1.00 | 1.00 | |||||||||||||||||||
| Classes T and F-1 | 0.25 | 0.50 | 0.25 | 0.50 | 0.25 | 0.50 | |||||||||||||||||||
For Class A shares, distribution-related expenses include the reimbursement of dealer and wholesaler commissions paid by AFD for certain shares sold without a sales charge. This share class of each fund reimburses AFD for amounts billed within the prior 15 months but only to the extent that the overall annual expense limit is not exceeded. As of July 31, 2018, unreimbursed expenses subject to reimbursement for Class A shares of each fund were as follows (dollars in thousands):
| Fund | Class A | |||
| American Funds Short-Term Tax-Exempt Bond Fund | $ | 1,206 | ||
| Limited-Term Tax-Exempt Bond Fund of America | 120 | |||
| The Tax-Exempt Bond Fund of America | 8,137 | |||
| American High-Income Municipal Bond Fund | — | |||
| The Tax-Exempt Fund of California | 1,591 | |||
| American Funds Tax-Exempt Fund of New York | 76 | |||
Transfer agent services — Each fund has a shareholder services agreement with AFS under which each fund compensates AFS for providing transfer agent services to each of the funds’ share classes. These services include recordkeeping, shareholder communications and transaction processing. In addition, each fund reimburses AFS for amounts paid to third parties for performing transfer agent services on behalf of its respective fund shareholders.
Administrative services — Each fund has an administrative services agreement with CRMC under which each fund compensates CRMC for providing administrative services to each of the funds’ Class A, C, T, F and R shares. Administrative services are provided by CRMC to help assist third parties providing non-distribution services to fund shareholders. These services include providing in depth information on each fund and market developments that impact each fund’s investments. Administrative services also include, but are not limited to, coordinating, monitoring and overseeing third parties that provide services to each fund’s shareholders. The agreement between each fund and the investment adviser provides each fund the ability to charge an administrative services fee of 0.05% of average daily net assets for all share classes. Currently Class A shares of each fund pay an annual fee of 0.01% of average daily net assets (which could be increased as noted above) and Class C, T, F and R shares of each fund pay an annual fee of 0.05% of their respective average daily net assets.
| American Funds Tax-Exempt Funds | 67 |
Miscellaneous fee reimbursement — CRMC is currently reimbursing a portion of miscellaneous fees and expenses for American Funds Tax-Exempt Fund of New York. Miscellaneous expenses exclude investment advisory services and distribution services fees. For the year ended July 31, 2018, total expenses reimbursed by CRMC were $90,000.
For the year ended July 31, 2018, class-specific expenses under the agreements for each fund were as follows (dollars in thousands):
American Funds Short-Term Tax-Exempt Bond Fund
| Share class | Distribution services | Transfer agent services | Administrative services | ||||||
| Class A | $1,129 | $259 | $75 | ||||||
| Class T | — | — | * | — | * | ||||
| Class F-1 | 21 | 10 | 4 | ||||||
| Class F-2 | Not applicable | 56 | 26 | ||||||
| Class F-3 | Not applicable | 1 | 25 | ||||||
| Class R-6 | Not applicable | — | * | 64 | |||||
| Total class-specific expenses | $1,150 | $326 | $194 | ||||||
Limited Term Tax-Exempt Bond Fund of America
| Share class | Distribution services | Transfer agent services | Administrative services | ||||||
| Class A | $9,223 | $1,082 | $307 | ||||||
| Class C | 230 | 8 | 12 | ||||||
| Class T | — | — | * | — | * | ||||
| Class F-1 | 196 | 91 | 39 | ||||||
| Class F-2 | Not applicable | 403 | 180 | ||||||
| Class F-3 | Not applicable | 4 | 77 | ||||||
| Class R-6 | Not applicable | — | * | 149 | |||||
| Total class-specific expenses | $9,649 | $1,588 | $764 | ||||||
The Tax-Exempt Bond Fund of America
| Share class | Distribution services | Transfer agent services | Administrative services | ||||||
| Class A | $25,045 | $3,464 | $1,002 | ||||||
| Class C | 4,577 | 161 | 229 | ||||||
| Class T | — | — | * | — | * | ||||
| Class F-1 | 1,071 | 498 | 216 | ||||||
| Class F-2 | Not applicable | 2,187 | 1,008 | ||||||
| Class F-3 | Not applicable | 94 | 1,741 | ||||||
| Class R-6 | Not applicable | — | * | 233 | |||||
| Total class-specific expenses | $30,693 | $6,404 | $4,429 | ||||||
American High-Income Municipal Bond Fund
| Distribution | Transfer agent | Administrative | |||||||
| Share class | services | services | services | ||||||
| Class A | $11,478 | $1,889 | $388 | ||||||
| Class C | 2,292 | 114 | 114 | ||||||
| Class T | — | — | * | — | * | ||||
| Class F-1 | 553 | 257 | 111 | ||||||
| Class F-2 | Not applicable | 758 | 350 | ||||||
| Class F-3 | Not applicable | 21 | 278 | ||||||
| Class R-6 | Not applicable | — | * | 233 | |||||
| Total class-specific expenses | $14,323 | $3,039 | $1,474 | ||||||
The Tax-Exempt Fund of California
| Distribution | Transfer agent | Administrative | |||||||
| Share class | services | services | services | ||||||
| Class A | $4,180 | $371 | $167 | ||||||
| Class C | 779 | 18 | 39 | ||||||
| Class T | — | — | * | — | * | ||||
| Class F-1 | 187 | 81 | 37 | ||||||
| Class F-2 | Not applicable | 250 | 115 | ||||||
| Class F-3 | Not applicable | 1 | 75 | ||||||
| Total class-specific expenses | $5,146 | $721 | $433 | ||||||
American Funds Tax-Exempt Fund of New York
| Distribution | Transfer agent | Administrative | |||||||
| Share class | services | services | services | ||||||
| Class A | $448 | $58 | $18 | ||||||
| Class C | 120 | 4 | 6 | ||||||
| Class T | — | — | * | — | * | ||||
| Class F-1 | 6 | 3 | 1 | ||||||
| Class F-2 | Not applicable | 14 | 7 | ||||||
| Class F-3 | Not applicable | — | * | 11 | |||||
| Total class-specific expenses | $574 | $79 | $43 | ||||||
| * | Amount less than one thousand. |
| 68 | American Funds Tax-Exempt Funds |
Trustees’ deferred compensation — Trustees who are unaffiliated with CRMC may elect to defer the cash payment of part or all of their compensation. These deferred amounts, which remain as liabilities of each fund, are treated as if invested in shares of the funds or other American Funds. These amounts represent general, unsecured liabilities of each fund and vary according to the total returns of the selected funds. Trustees’ compensation in the funds’ statements of operations reflects the current fees (either paid in cash or deferred) and a net increase in the value of the following deferred amounts (dollars in thousands):
| Fund | Current fees | Increase in value of deferred amounts | Total trustees’ compensation |
|||||||
| American Funds Short-Term Tax-Exempt Bond Fund | $ | 7 | $ | 3 | $ | 10 | ||||
| Limited Term Tax-Exempt Bond Fund of America | 32 | 13 | 45 | |||||||
| The Tax-Exempt Bond Fund of America | 117 | 71 | 188 | |||||||
| American High-Income Municipal Bond Fund | 53 | 10 | 63 | |||||||
| The Tax-Exempt Fund of California | 17 | 13 | 30 | |||||||
| American Funds Tax-Exempt Fund of New York | 2 | — | * | 2 | ||||||
| * | Amount less than one thousand. |
Affiliated officers and trustees — Officers and certain trustees of the funds are or may be considered to be affiliated with CRMC, AFD and AFS. No affiliated officers or trustees received any compensation directly from the funds.
Security transactions with related funds — Each fund may purchase from, or sell securities to, other CRMC-managed funds (or funds managed by certain affiliates of CRMC) under procedures adopted by each fund’s board of trustees. The funds involved in such transactions are considered related by virtue of having a common investment adviser (or affiliated investment advisers), common trustees and/or common officers. When such transactions occur, each transaction is executed at the current market price of the security and no brokerage commissions or fees are paid in accordance with Rule 17a-7 of the 1940 Act. During the year ended July 31, 2018, the funds engaged in such purchase and sale transactions with related funds as follows (dollars in thousands):
| Fund | Purchases | Sales | ||||||
| American Funds Short-Term Tax-Exempt Bond Fund | $ | 7,511 | $ | 20,844 | ||||
| Limited Term Tax-Exempt Bond Fund of America | 6,081 | 14,951 | ||||||
| The Tax-Exempt Bond Fund of America | 61,099 | 5,426 | ||||||
| American High-Income Municipal Bond Fund | 34,577 | 14,131 | ||||||
| The Tax-Exempt Fund of California | 10,480 | — | ||||||
| American Funds Tax-Exempt Fund of New York | 921 | — | ||||||
Interfund lending — Pursuant to an exemptive order issued by the SEC, the funds, along with other CRMC-managed funds (or funds managed by certain affiliates of CRMC), may participate in an interfund lending program. The program provides an alternate credit facility that permits the funds to lend or borrow cash for temporary purposes directly to or from one another, subject to the conditions of the exemptive order. The funds did not lend or borrow cash through the interfund lending program at any time during the year ended July 31, 2018.
8. Committed line of credit
American High-Income Municipal Bond Fund participates with other funds managed by CRMC (or funds managed by certain affiliates of CRMC) in a $1.5 billion credit facility (the “line of credit”) to be utilized for temporary purposes to support shareholder redemptions. The fund has agreed to pay commitment fees on its pro-rata portion of the line of credit, which are reflected in other expenses in the fund’s statement of operations. The fund did not borrow on this line of credit at any time during the year ended July 31, 2018.
| American Funds Tax-Exempt Funds | 69 |
9. Capital share transactions
Capital share transactions in the funds were as follows (dollars and shares in thousands):
American Funds Short-Term Tax-Exempt Bond Fund
| Reinvestments of | Net increase | |||||||||||||||||||||||||||||||
| Sales1 | dividends | Repurchases1 | (decrease) | |||||||||||||||||||||||||||||
| Share class | Amount | Shares | Amount | Shares | Amount | Shares | Amount | Shares | ||||||||||||||||||||||||
| Year ended July 31, 2018 | ||||||||||||||||||||||||||||||||
| Class A | $ | 278,215 | 27,610 | $ | 9,626 | 957 | $ | (266,056 | ) | (26,429 | ) | $ | 21,785 | 2,138 | ||||||||||||||||||
| Class T | — | — | — | — | — | — | — | — | ||||||||||||||||||||||||
| Class F-1 | 2,640 | 262 | 92 | 9 | (5,104 | ) | (507 | ) | (2,372 | ) | (236 | ) | ||||||||||||||||||||
| Class F-2 | 32,700 | 3,244 | 702 | 70 | (26,794 | ) | (2,661 | ) | 6,608 | 653 | ||||||||||||||||||||||
| Class F-3 | 47,782 | 4,729 | 533 | 53 | (80,218 | ) | (7,922 | ) | (31,903 | ) | (3,140 | ) | ||||||||||||||||||||
| Class R-6 | 16,157 | 1,599 | 1,887 | 187 | (21,874 | ) | (2,174 | ) | (3,830 | ) | (388 | ) | ||||||||||||||||||||
| Total net increase (decrease) | $ | 377,494 | 37,444 | $ | 12,840 | 1,276 | $ | (400,046 | ) | (39,693 | ) | $ | (9,712 | ) | (973 | ) | ||||||||||||||||
| Year ended July 31, 2017 | ||||||||||||||||||||||||||||||||
| Class A | $ | 353,021 | 34,954 | $ | 7,958 | 786 | $ | (305,749 | ) | (30,279 | ) | $ | 55,230 | 5,461 | ||||||||||||||||||
| Class T2 | 10 | 1 | — | — | — | — | 10 | 1 | ||||||||||||||||||||||||
| Class F-1 | 4,274 | 423 | 109 | 11 | (8,002 | ) | (792 | ) | (3,619 | ) | (358 | ) | ||||||||||||||||||||
| Class F-2 | 67,272 | 6,658 | 696 | 69 | (100,908 | ) | (9,989 | ) | (32,940 | ) | (3,262 | ) | ||||||||||||||||||||
| Class F-33 | 88,654 | 8,765 | 107 | 11 | (11,612 | ) | (1,145 | ) | 77,149 | 7,631 | ||||||||||||||||||||||
| Class R-64 | 128,242 | 12,674 | 463 | 45 | (2,162 | ) | (213 | ) | 126,543 | 12,506 | ||||||||||||||||||||||
| Total net increase (decrease) | $ | 641,473 | 63,475 | $ | 9,333 | 922 | $ | (428,433 | ) | (42,418 | ) | $ | 222,373 | 21,979 | ||||||||||||||||||
Limited Term Tax-Exempt Bond Fund of America
| Reinvestments of | Net increase | |||||||||||||||||||||||||||||||
| Sales1 | dividends | Repurchases1 | (decrease) | |||||||||||||||||||||||||||||
| Share class | Amount | Shares | Amount | Shares | Amount | Shares | Amount | Shares | ||||||||||||||||||||||||
| Year ended July 31, 2018 | ||||||||||||||||||||||||||||||||
| Class A | $ | 707,137 | 45,220 | $ | 58,703 | 3,763 | $ | (696,821 | ) | (44,622 | ) | $ | 69,019 | 4,361 | ||||||||||||||||||
| Class C | 4,357 | 279 | 280 | 18 | (9,044 | ) | (579 | ) | (4,407 | ) | (282 | ) | ||||||||||||||||||||
| Class T | — | — | — | — | — | — | — | — | ||||||||||||||||||||||||
| Class F-1 | 28,021 | 1,791 | 1,451 | 92 | (47,647 | ) | (3,055 | ) | (18,175 | ) | (1,172 | ) | ||||||||||||||||||||
| Class F-2 | 247,425 | 15,810 | 6,716 | 431 | (203,930 | ) | (13,081 | ) | 50,211 | 3,160 | ||||||||||||||||||||||
| Class F-3 | 121,425 | 7,770 | 2,877 | 185 | (46,337 | ) | (2,972 | ) | 77,965 | 4,983 | ||||||||||||||||||||||
| Class R-6 | 38,084 | 2,428 | 6,843 | 439 | (52,353 | ) | (3,359 | ) | (7,426 | ) | (492 | ) | ||||||||||||||||||||
| Total net increase (decrease) | $ | 1,146,449 | 73,298 | $ | 76,870 | 4,928 | $ | (1,056,132 | ) | (67,668 | ) | $ | 167,187 | 10,558 | ||||||||||||||||||
| Year ended July 31, 2017 | ||||||||||||||||||||||||||||||||
| Class A | $ | 819,485 | 52,126 | $ | 58,446 | 3,716 | $ | (841,769 | ) | (53,692 | ) | $ | 36,162 | 2,150 | ||||||||||||||||||
| Class B5 | 12 | 1 | 1 | — | 6 | (285 | ) | (18 | ) | (272 | ) | (17 | ) | |||||||||||||||||||
| Class C | 9,630 | 614 | 356 | 22 | (14,774 | ) | (941 | ) | (4,788 | ) | (305 | ) | ||||||||||||||||||||
| Class T2 | 10 | 1 | — | — | — | — | 10 | 1 | ||||||||||||||||||||||||
| Class F-1 | 33,107 | 2,108 | 1,634 | 104 | (39,802 | ) | (2,536 | ) | (5,061 | ) | (324 | ) | ||||||||||||||||||||
| Class F-2 | 303,074 | 19,263 | 6,395 | 407 | (285,439 | ) | (18,211 | ) | 24,030 | 1,459 | ||||||||||||||||||||||
| Class F-33 | 119,294 | 7,604 | 564 | 36 | (8,432 | ) | (536 | ) | 111,426 | 7,104 | ||||||||||||||||||||||
| Class R-6 | 57,602 | 3,639 | 6,843 | 435 | (46,402 | ) | (2,970 | ) | 18,043 | 1,104 | ||||||||||||||||||||||
| Total net increase (decrease) | $ | 1,342,214 | 85,356 | $ | 74,239 | 4,720 | $ | (1,236,903 | ) | (78,904 | ) | $ | 179,550 | 11,172 | ||||||||||||||||||
| 70 | American Funds Tax-Exempt Funds |
The Tax-Exempt Bond Fund of America
| Reinvestments of | Net increase | |||||||||||||||||||||||||||||||
| Sales1 | dividends | Repurchases1 | (decrease) | |||||||||||||||||||||||||||||
| Share class | Amount | Shares | Amount | Shares | Amount | Shares | Amount | Shares | ||||||||||||||||||||||||
| Year ended July 31, 2018 | ||||||||||||||||||||||||||||||||
| Class A | $ | 1,681,309 | 130,015 | $ | 272,626 | 21,145 | $ | (1,405,277 | ) | (108,925 | ) | $ | 548,658 | 42,235 | ||||||||||||||||||
| Class C | 80,078 | 6,193 | 9,249 | 717 | (125,594 | ) | (9,732 | ) | (36,267 | ) | (2,822 | ) | ||||||||||||||||||||
| Class T | — | — | — | — | — | — | — | — | ||||||||||||||||||||||||
| Class F-1 | 104,060 | 8,060 | 11,599 | 899 | (201,331 | ) | (15,621 | ) | (85,672 | ) | (6,662 | ) | ||||||||||||||||||||
| Class F-2 | 993,761 | 77,009 | 58,043 | 4,502 | (756,576 | ) | (58,582 | ) | 295,228 | 22,929 | ||||||||||||||||||||||
| Class F-3 | 4,363,042 | 337,721 | 106,056 | 8,255 | (569,494 | ) | (44,325 | ) | 3,899,604 | 301,651 | ||||||||||||||||||||||
| Class R-6 | 183,540 | 14,204 | 14,656 | 1,138 | (21,419 | ) | (1,668 | ) | 176,777 | 13,674 | ||||||||||||||||||||||
| Total net increase (decrease) | $ | 7,405,790 | 573,202 | $ | 472,229 | 36,656 | $ | (3,079,691 | ) | (238,853 | ) | $ | 4,798,328 | 371,005 | ||||||||||||||||||
| Year ended July 31, 2017 | ||||||||||||||||||||||||||||||||
| Class A | $ | 1,801,266 | 138,682 | $ | 272,050 | 21,023 | $ | (1,585,561 | ) | (123,176 | ) | $ | 487,755 | 36,529 | ||||||||||||||||||
| Class B5 | 13 | 1 | 26 | 2 | (3,153 | ) | (243 | ) | (3,114 | ) | (240 | ) | ||||||||||||||||||||
| Class C | 109,851 | 8,427 | 10,867 | 840 | (146,591 | ) | (11,359 | ) | (25,873 | ) | (2,092 | ) | ||||||||||||||||||||
| Class T2 | 10 | 1 | — | — | — | — | 10 | 1 | ||||||||||||||||||||||||
| Class F-1 | 150,827 | 11,683 | 14,001 | 1,082 | (204,796 | ) | (15,883 | ) | (39,968 | ) | (3,118 | ) | ||||||||||||||||||||
| Class F-2 | 1,352,620 | 104,710 | 88,843 | 6,868 | (2,321,994 | ) | (179,479 | ) | (880,531 | ) | (67,901 | ) | ||||||||||||||||||||
| Class F-33 | 1,572,043 | 121,144 | 6,300 | 486 | (24,708 | ) | (1,907 | ) | 1,553,635 | 119,723 | ||||||||||||||||||||||
| Class R-6 | 130,180 | 10,032 | 13,380 | 1,034 | (140,467 | ) | (10,934 | ) | 3,093 | 132 | ||||||||||||||||||||||
| Total net increase (decrease) | $ | 5,116,810 | 394,680 | $ | 405,467 | 31,335 | $ | (4,427,270 | ) | (342,981 | ) | $ | 1,095,007 | 83,034 | ||||||||||||||||||
American High-Income Municipal Bond Fund
| Reinvestments of | Net increase | |||||||||||||||||||||||||||||||
| Sales1 | dividends | Repurchases1 | (decrease) | |||||||||||||||||||||||||||||
| Share class | Amount | Shares | Amount | Shares | Amount | Shares | Amount | Shares | ||||||||||||||||||||||||
| Year ended July 31, 2018 | ||||||||||||||||||||||||||||||||
| Class A | $ | 782,611 | 49,463 | $ | 133,367 | 8,440 | $ | (508,503 | ) | (32,164 | ) | $ | 407,475 | 25,739 | ||||||||||||||||||
| Class C | 47,927 | 3,029 | 6,316 | 400 | (57,636 | ) | (3,644 | ) | (3,393 | ) | (215 | ) | ||||||||||||||||||||
| Class T | — | — | — | — | — | — | — | — | ||||||||||||||||||||||||
| Class F-1 | 78,860 | 4,990 | 7,756 | 490 | (113,570 | ) | (7,178 | ) | (26,954 | ) | (1,698 | ) | ||||||||||||||||||||
| Class F-2 | 441,075 | 27,866 | 24,137 | 1,528 | (272,343 | ) | (17,228 | ) | 192,869 | 12,166 | ||||||||||||||||||||||
| Class F-3 | 288,409 | 18,214 | 19,098 | 1,209 | (83,527 | ) | (5,278 | ) | 223,980 | 14,145 | ||||||||||||||||||||||
| Class R-6 | 172,242 | 10,880 | 18,502 | 1,171 | (21,095 | ) | (1,341 | ) | 169,649 | 10,710 | ||||||||||||||||||||||
| Total net increase (decrease) | $ | 1,811,124 | 114,442 | $ | 209,176 | 13,238 | $ | (1,056,674 | ) | (66,833 | ) | $ | 963,626 | 60,847 | ||||||||||||||||||
| Year ended July 31, 2017 | ||||||||||||||||||||||||||||||||
| Class A | $ | 815,139 | 52,111 | $ | 121,598 | 7,783 | $ | (703,450 | ) | (45,320 | ) | $ | 233,287 | 14,574 | ||||||||||||||||||
| Class B5 | 40 | 3 | 14 | 1 | (1,280 | ) | (82 | ) | (1,226 | ) | (78 | ) | ||||||||||||||||||||
| Class C | 52,474 | 3,341 | 6,638 | 425 | (68,253 | ) | (4,390 | ) | (9,141 | ) | (624 | ) | ||||||||||||||||||||
| Class T2 | 10 | 1 | — | — | — | — | 10 | 1 | ||||||||||||||||||||||||
| Class F-1 | 93,087 | 5,955 | 8,578 | 549 | (140,908 | ) | (9,031 | ) | (39,243 | ) | (2,527 | ) | ||||||||||||||||||||
| Class F-2 | 466,323 | 29,942 | 25,815 | 1,653 | (634,923 | ) | (40,962 | ) | (142,785 | ) | (9,367 | ) | ||||||||||||||||||||
| Class F-33 | 429,111 | 27,652 | 3,948 | 252 | (17,526 | ) | (1,122 | ) | 415,533 | 26,782 | ||||||||||||||||||||||
| Class R-6 | 105,522 | 6,754 | 12,642 | 810 | — | — | 118,164 | 7,564 | ||||||||||||||||||||||||
| Total net increase (decrease) | $ | 1,961,706 | 125,759 | $ | 179,233 | 11,473 | $ | (1,566,340 | ) | (100,907 | ) | $ | 574,599 | 36,325 | ||||||||||||||||||
See end of tables for footnotes.
| American Funds Tax-Exempt Funds | 71 |
The Tax-Exempt Fund of California
| Reinvestments of | Net increase | |||||||||||||||||||||||||||||||
| Sales1 | dividends | Repurchases1 | (decrease) | |||||||||||||||||||||||||||||
| Share class | Amount | Shares | Amount | Shares | Amount | Shares | Amount | Shares | ||||||||||||||||||||||||
| Year ended July 31, 2018 | ||||||||||||||||||||||||||||||||
| Class A | $ | 259,065 | 14,726 | $ | 43,350 | 2,472 | $ | (246,151 | ) | (14,019 | ) | $ | 56,264 | 3,179 | ||||||||||||||||||
| Class C | 14,343 | 815 | 1,554 | 89 | (26,591 | ) | (1,515 | ) | (10,694 | ) | (611 | ) | ||||||||||||||||||||
| Class T | — | — | — | — | — | — | — | — | ||||||||||||||||||||||||
| Class F-1 | 27,505 | 1,567 | 1,914 | 109 | (29,310 | ) | (1,670 | ) | 109 | 6 | ||||||||||||||||||||||
| Class F-2 | 112,357 | 6,393 | 6,168 | 352 | (58,335 | ) | (3,326 | ) | 60,190 | 3,419 | ||||||||||||||||||||||
| Class F-3 | 67,902 | 3,867 | 3,891 | 222 | (20,323 | ) | (1,158 | ) | 51,470 | 2,931 | ||||||||||||||||||||||
| Total net increase (decrease) | $ | 481,172 | 27,368 | $ | 56,877 | 3,244 | $ | (380,710 | ) | (21,688 | ) | $ | 157,339 | 8,924 | ||||||||||||||||||
| Year ended July 31, 2017 | ||||||||||||||||||||||||||||||||
| Class A | $ | 287,913 | 16,331 | $ | 43,825 | 2,495 | $ | (311,489 | ) | (17,845 | ) | $ | 20,249 | 981 | ||||||||||||||||||
| Class B5 | 10 | 1 | 2 | — | 6 | (265 | ) | (15 | ) | (253 | ) | (14 | ) | |||||||||||||||||||
| Class C | 23,294 | 1,313 | 1,914 | 109 | (35,926 | ) | (2,050 | ) | (10,718 | ) | (628 | ) | ||||||||||||||||||||
| Class T2 | 10 | 1 | — | — | — | — | 10 | 1 | ||||||||||||||||||||||||
| Class F-1 | 24,944 | 1,415 | 2,083 | 119 | (31,372 | ) | (1,788 | ) | (4,345 | ) | (254 | ) | ||||||||||||||||||||
| Class F-2 | 181,621 | 10,368 | 6,173 | 352 | (192,817 | ) | (11,070 | ) | (5,023 | ) | (350 | ) | ||||||||||||||||||||
| Class F-33 | 124,040 | 7,103 | 689 | 39 | (1,665 | ) | (95 | ) | 123,064 | 7,047 | ||||||||||||||||||||||
| Total net increase (decrease) | $ | 641,832 | 36,532 | $ | 54,686 | 3,114 | $ | (573,534 | ) | (32,863 | ) | $ | 122,984 | 6,783 | ||||||||||||||||||
American Funds Tax-Exempt Fund of New York
| Reinvestments of | Net increase | |||||||||||||||||||||||||||||||
| Sales1 | dividends | Repurchases1 | (decrease) | |||||||||||||||||||||||||||||
| Share class | Amount | Shares | Amount | Shares | Amount | Shares | Amount | Shares | ||||||||||||||||||||||||
| Year ended July 31, 2018 | ||||||||||||||||||||||||||||||||
| Class A | $ | 38,634 | 3,605 | $ | 3,569 | 334 | $ | (25,328 | ) | (2,369 | ) | $ | 16,875 | 1,570 | ||||||||||||||||||
| Class C | 2,347 | 219 | 196 | 19 | (3,139 | ) | (293 | ) | (596 | ) | (55 | ) | ||||||||||||||||||||
| Class T | — | — | — | — | — | — | — | — | ||||||||||||||||||||||||
| Class F-1 | 1,142 | 106 | 57 | 5 | (1,670 | ) | (157 | ) | (471 | ) | (46 | ) | ||||||||||||||||||||
| Class F-2 | 9,234 | 861 | 358 | 33 | (4,652 | ) | (435 | ) | 4,940 | 459 | ||||||||||||||||||||||
| Class F-3 | 12,329 | 1,152 | 433 | 40 | (2,388 | ) | (225 | ) | 10,374 | 967 | ||||||||||||||||||||||
| Total net increase (decrease) | $ | 63,686 | 5,943 | $ | 4,613 | 431 | $ | (37,177 | ) | (3,479 | ) | $ | 31,122 | 2,895 | ||||||||||||||||||
| Year ended July 31, 2017 | ||||||||||||||||||||||||||||||||
| Class A | $ | 45,146 | 4,195 | $ | 3,108 | 289 | $ | (35,915 | ) | (3,349 | ) | $ | 12,339 | 1,135 | ||||||||||||||||||
| Class B5 | 11 | 1 | — | 6 | — | 6 | (27 | ) | (3 | ) | (16 | ) | (2 | ) | ||||||||||||||||||
| Class C | 2,541 | 234 | 218 | 20 | (3,764 | ) | (353 | ) | (1,005 | ) | (99 | ) | ||||||||||||||||||||
| Class T2 | 10 | 1 | — | — | — | — | 10 | 1 | ||||||||||||||||||||||||
| Class F-1 | 1,134 | 105 | 42 | 4 | (708 | ) | (66 | ) | 468 | 43 | ||||||||||||||||||||||
| Class F-2 | 7,639 | 709 | 500 | 47 | (26,967 | ) | (2,540 | ) | (18,828 | ) | (1,784 | ) | ||||||||||||||||||||
| Class F-33 | 18,851 | 1,771 | 119 | 11 | (3,088 | ) | (286 | ) | 15,882 | 1,496 | ||||||||||||||||||||||
| Total net increase (decrease) | $ | 75,332 | 7,016 | $ | 3,987 | 371 | $ | (70,469 | ) | (6,597 | ) | $ | 8,850 | 790 | ||||||||||||||||||
| 1 | Includes exchanges between share classes of the fund. |
| 2 | Class T shares began investment operations on April 7, 2017. |
| 3 | Class F-3 shares began investment operations on January 27, 2017. |
| 4 | Class R-6 shares began investment operations on March 17, 2017. |
| 5 | Class B shares were fully liquidated on May 5, 2017. |
| 6 | Amount less than one thousand. |
| 72 | American Funds Tax-Exempt Funds |
10. Investment transactions
Each fund made purchases and sales of investment securities, excluding short-term securities and U.S. government obligations, if any, during the year ended July 31, 2018, as follows (dollars in thousands):
| Fund | Purchases | Sales | ||||||
| American Funds Short-Term Tax-Exempt Bond Fund | $ | 323,456 | $ | 308,844 | ||||
| Limited Term Tax-Exempt Bond Fund of America | 1,238,270 | 1,060,137 | ||||||
| The Tax-Exempt Bond Fund of America | 7,232,339 | 2,765,268 | ||||||
| American High-Income Municipal Bond Fund | 2,240,256 | 1,367,512 | ||||||
| The Tax-Exempt Fund of California | 443,510 | 291,211 | ||||||
| American Funds Tax-Exempt Fund of New York | 71,494 | 45,132 | ||||||
11. Ownership concentration
At July 31, 2018, CRMC held aggregate ownership of 14% of the outstanding shares of American Funds Tax-Exempt Fund of New York. The ownership represents the seed money invested in the fund when it began operations on November 1, 2010. In addition, American Funds Tax-Exempt Preservation Portfolio held 12% of the outstanding shares of American Funds Short-Term Tax-Exempt Bond Fund. CRMC is the investment adviser to all of the funds.
| American Funds Tax-Exempt Funds | 73 |
Financial highlights
American Funds Short-Term Tax-Exempt Bond Fund
| Income from investment operations1 | ||||||||||||||||||||||||||||||||||||||||
| Period ended | Net asset value, beginning of period | Net investment income | Net (losses) gains on securities (both realized and unrealized) | Total from investment operations | Dividends (from net investment income) | Net asset value, end of period | Total return2 | Net assets, end of period (in millions) | Ratio of expenses to average net assets | Ratio of net income to average net assets | ||||||||||||||||||||||||||||||
| Class A: | ||||||||||||||||||||||||||||||||||||||||
| 7/31/2018 | $ | 10.15 | $ | .13 | $ | (.11 | ) | $ | .02 | $ | (.13 | ) | $ | 10.04 | .24 | % | $ | 752 | .58 | % | 1.33 | % | ||||||||||||||||||
| 7/31/2017 | 10.22 | .12 | (.07 | ) | .05 | (.12 | ) | 10.15 | .46 | 739 | .59 | 1.15 | ||||||||||||||||||||||||||||
| 7/31/2016 | 10.17 | .10 | .05 | .15 | (.10 | ) | 10.22 | 1.51 | 688 | .59 | 1.02 | |||||||||||||||||||||||||||||
| 7/31/2015 | 10.25 | .11 | (.08 | ) | .03 | (.11 | ) | 10.17 | .26 | 653 | .58 | 1.04 | ||||||||||||||||||||||||||||
| 7/31/2014 | 10.21 | .11 | .04 | .15 | (.11 | ) | 10.25 | 1.43 | 737 | .58 | 1.04 | |||||||||||||||||||||||||||||
| Class T: | ||||||||||||||||||||||||||||||||||||||||
| 7/31/2018 | 10.15 | .15 | (.11 | ) | .04 | (.15 | ) | 10.04 | .36 | 3 | — | 4 | .47 | 3 | 1.44 | 3 | ||||||||||||||||||||||||
| 7/31/20175,6 | 10.11 | .04 | .04 | .08 | (.04 | ) | 10.15 | .82 | 3,7 | — | 4 | .15 | 3,7 | .42 | 3,7 | |||||||||||||||||||||||||
| Class F-1: | ||||||||||||||||||||||||||||||||||||||||
| 7/31/2018 | 10.15 | .11 | (.11 | ) | — | 8 | (.11 | ) | 10.04 | .02 | 7 | .80 | 1.10 | |||||||||||||||||||||||||||
| 7/31/2017 | 10.22 | .09 | (.07 | ) | .02 | (.09 | ) | 10.15 | .23 | 9 | .82 | .92 | ||||||||||||||||||||||||||||
| 7/31/2016 | 10.17 | .08 | .05 | .13 | (.08 | ) | 10.22 | 1.29 | 13 | .81 | .80 | |||||||||||||||||||||||||||||
| 7/31/2015 | 10.25 | .08 | (.08 | ) | — | 8 | (.08 | ) | 10.17 | .05 | 9 | .80 | .83 | |||||||||||||||||||||||||||
| 7/31/2014 | 10.21 | .08 | .04 | .12 | (.08 | ) | 10.25 | 1.19 | 14 | .82 | .80 | |||||||||||||||||||||||||||||
| Class F-2: | ||||||||||||||||||||||||||||||||||||||||
| 7/31/2018 | 10.15 | .14 | (.11 | ) | .03 | (.14 | ) | 10.04 | .28 | 52 | .54 | 1.37 | ||||||||||||||||||||||||||||
| 7/31/2017 | 10.22 | .12 | (.07 | ) | .05 | (.12 | ) | 10.15 | .49 | 47 | .57 | 1.17 | ||||||||||||||||||||||||||||
| 7/31/2016 | 10.17 | .11 | .05 | .16 | (.11 | ) | 10.22 | 1.55 | 80 | .56 | 1.06 | |||||||||||||||||||||||||||||
| 7/31/2015 | 10.25 | .11 | (.08 | ) | .03 | (.11 | ) | 10.17 | .29 | 64 | .55 | 1.08 | ||||||||||||||||||||||||||||
| 7/31/2014 | 10.21 | .11 | .04 | .15 | (.11 | ) | 10.25 | 1.47 | 46 | .54 | 1.07 | |||||||||||||||||||||||||||||
| 74 | American Funds Tax-Exempt Funds |
| Income from investment operations1 | ||||||||||||||||||||||||||||||||||||||||
| Period ended | Net asset value, beginning of period | Net investment income | Net (losses) gains on securities (both realized and unrealized) | Total from investment operations | Dividends (from net investment income) | Net asset value, end of period | Total return2 | Net assets, end of period (in millions) | Ratio of expenses to average net assets | Ratio of net income to average net assets | ||||||||||||||||||||||||||||||
| Class F-3: | ||||||||||||||||||||||||||||||||||||||||
| 7/31/2018 | $ | 10.15 | $ | .15 | $ | (.11 | ) | $ | .04 | $ | (.15 | ) | $ | 10.04 | .38 | % | $ | 45 | .44 | % | 1.45 | % | ||||||||||||||||||
| 7/31/20175,9 | 10.07 | .07 | .08 | .15 | (.07 | ) | 10.15 | 1.49 | 7 | 77 | .47 | 10 | 1.35 | 10 | ||||||||||||||||||||||||||
| Class R-6: | ||||||||||||||||||||||||||||||||||||||||
| 7/31/2018 | 10.15 | .15 | (.11 | ) | .04 | (.15 | ) | 10.04 | .38 | 122 | .44 | 1.48 | ||||||||||||||||||||||||||||
| 7/31/20175,11 | 10.09 | .05 | .06 | .11 | (.05 | ) | 10.15 | 1.20 | 7 | 127 | .17 | 7 | .51 | 7 | ||||||||||||||||||||||||||
| Year ended July 31 | ||||||||||
| 2018 | 2017 | 2016 | 2015 | 2014 | ||||||
| Portfolio turnover rate for all share classes | 34% | 26% | 21% | 38% | 20% | |||||
| 1 | Based on average shares outstanding. |
| 2 | Total returns exclude any applicable sales charges, including contingent deferred sales charges. |
| 3 | All or a significant portion of assets in this class consisted of seed capital invested by CRMC and/or its affiliates. Fees for distribution services are not charged or accrued on these seed capital assets. If such fees were paid by the fund on seed capital assets, fund expenses would have been higher and net income and total return would have been lower. |
| 4 | Amount less than $1 million. |
| 5 | Based on operations for a period that is less than a full year. |
| 6 | Class T shares began investment operations on April 7, 2017. |
| 7 | Not annualized. |
| 8 | Amount less than $.01. |
| 9 | Class F-3 shares began investment operations on January 27, 2017. |
| 10 | Annualized. |
| 11 | Class R-6 shares began investment operations on March 17, 2017. |
See Notes to Financial Statements
| American Funds Tax-Exempt Funds | 75 |
Financial highlights (continued)
Limited Term Tax-Exempt Bond Fund of America
| Income (loss) from investment operations1 | ||||||||||||||||||||||||||||||||||||||||
| Period ended | Net asset value, beginning of period | Net investment income | Net (losses) gains on securities (both realized and unrealized) | Total from investment operations | Dividends (from net investment income) | Net asset value, end of period | Total return2 | Net assets, end of period (in millions) | Ratio of expenses to average net assets | Ratio of net income to average net assets | ||||||||||||||||||||||||||||||
| Class A: | ||||||||||||||||||||||||||||||||||||||||
| 7/31/2018 | $ | 15.77 | $ | .31 | $ | (.25 | ) | $ | .06 | $ | (.31 | ) | $ | 15.52 | .40 | % | $ | 3,057 | .59 | % | 2.00 | % | ||||||||||||||||||
| 7/31/2017 | 16.04 | .32 | (.27 | ) | .05 | (.32 | ) | 15.77 | .34 | 3,038 | .59 | 2.04 | ||||||||||||||||||||||||||||
| 7/31/2016 | 15.92 | .35 | .12 | .47 | (.35 | ) | 16.04 | 2.97 | 3,055 | .59 | 2.17 | |||||||||||||||||||||||||||||
| 7/31/2015 | 16.10 | .38 | (.18 | ) | .20 | (.38 | ) | 15.92 | 1.23 | 2,670 | .57 | 2.36 | ||||||||||||||||||||||||||||
| 7/31/2014 | 15.94 | .40 | .16 | .56 | (.40 | ) | 16.10 | 3.56 | 2,615 | .60 | 2.51 | |||||||||||||||||||||||||||||
| Class C: | ||||||||||||||||||||||||||||||||||||||||
| 7/31/2018 | 15.77 | .20 | (.25 | ) | (.05 | ) | (.20 | ) | 15.52 | (.34 | ) | 20 | 1.34 | 1.26 | ||||||||||||||||||||||||||
| 7/31/2017 | 16.04 | .20 | (.27 | ) | (.07 | ) | (.20 | ) | 15.77 | (.40 | ) | 25 | 1.33 | 1.30 | ||||||||||||||||||||||||||
| 7/31/2016 | 15.92 | .23 | .12 | .35 | (.23 | ) | 16.04 | 2.20 | 30 | 1.33 | 1.43 | |||||||||||||||||||||||||||||
| 7/31/2015 | 16.10 | .26 | (.18 | ) | .08 | (.26 | ) | 15.92 | .47 | 30 | 1.33 | 1.60 | ||||||||||||||||||||||||||||
| 7/31/2014 | 15.94 | .28 | .16 | .44 | (.28 | ) | 16.10 | 2.80 | 38 | 1.34 | 1.78 | |||||||||||||||||||||||||||||
| Class T: | ||||||||||||||||||||||||||||||||||||||||
| 7/31/2018 | 15.77 | .36 | (.25 | ) | .11 | (.36 | ) | 15.52 | .68 | 3 | — | 4 | .33 | 3 | 2.26 | 3 | ||||||||||||||||||||||||
| 7/31/20175,6 | 15.68 | .12 | .09 | .21 | (.12 | ) | 15.77 | 1.32 | 3,7 | — | 4 | .10 | 3,7 | .74 | 3,7 | |||||||||||||||||||||||||
| Class F-1: | ||||||||||||||||||||||||||||||||||||||||
| 7/31/2018 | 15.77 | .30 | (.25 | ) | .05 | (.30 | ) | 15.52 | .33 | 64 | .66 | 1.93 | ||||||||||||||||||||||||||||
| 7/31/2017 | 16.04 | .31 | (.27 | ) | .04 | (.31 | ) | 15.77 | .26 | 83 | .67 | 1.96 | ||||||||||||||||||||||||||||
| 7/31/2016 | 15.92 | .33 | .12 | .45 | (.33 | ) | 16.04 | 2.88 | 90 | .67 | 2.09 | |||||||||||||||||||||||||||||
| 7/31/2015 | 16.10 | .36 | (.18 | ) | .18 | (.36 | ) | 15.92 | 1.13 | 84 | .67 | 2.27 | ||||||||||||||||||||||||||||
| 7/31/2014 | 15.94 | .39 | .16 | .55 | (.39 | ) | 16.10 | 3.49 | 105 | .67 | 2.45 | |||||||||||||||||||||||||||||
| 76 | American Funds Tax-Exempt Funds |
| Income (loss) from investment operations1 | ||||||||||||||||||||||||||||||||||||||||
| Period ended | Net asset value, beginning of period | Net investment income | Net (losses) gains on securities (both realized and unrealized) | Total from investment operations | Dividends (from net investment income) | Net asset value, end of period | Total return2 | Net assets, end of period (in millions) | Ratio of expenses to average net assets | Ratio of net income to average net assets | ||||||||||||||||||||||||||||||
| Class F-2: | ||||||||||||||||||||||||||||||||||||||||
| 7/31/2018 | $ | 15.77 | $ | .34 | $ | (.25 | ) | $ | .09 | $ | (.34 | ) | $ | 15.52 | .58 | % | $ | 353 | .41 | % | 2.18 | % | ||||||||||||||||||
| 7/31/2017 | 16.04 | .35 | (.27 | ) | .08 | (.35 | ) | 15.77 | .51 | 309 | .42 | 2.22 | ||||||||||||||||||||||||||||
| 7/31/2016 | 15.92 | .38 | .12 | .50 | (.38 | ) | 16.04 | 3.15 | 291 | .41 | 2.34 | |||||||||||||||||||||||||||||
| 7/31/2015 | 16.10 | .40 | (.18 | ) | .22 | (.40 | ) | 15.92 | 1.39 | 208 | .41 | 2.52 | ||||||||||||||||||||||||||||
| 7/31/2014 | 15.94 | .43 | .16 | .59 | (.43 | ) | 16.10 | 3.75 | 183 | .42 | 2.69 | |||||||||||||||||||||||||||||
| Class F-3: | ||||||||||||||||||||||||||||||||||||||||
| 7/31/2018 | 15.77 | .36 | (.25 | ) | .11 | (.36 | ) | 15.52 | .70 | 187 | .30 | 2.29 | ||||||||||||||||||||||||||||
| 7/31/20175,8 | 15.59 | .19 | .18 | .37 | (.19 | ) | 15.77 | 2.37 | 7 | 112 | .30 | 9 | 2.36 | 9 | ||||||||||||||||||||||||||
| Class R-6: | ||||||||||||||||||||||||||||||||||||||||
| 7/31/2018 | 15.77 | .36 | (.25 | ) | .11 | (.36 | ) | 15.52 | .70 | 284 | .30 | 2.29 | ||||||||||||||||||||||||||||
| 7/31/2017 | 16.04 | .37 | (.27 | ) | .10 | (.37 | ) | 15.77 | .63 | 296 | .30 | 2.33 | ||||||||||||||||||||||||||||
| 7/31/2016 | 15.92 | .39 | .12 | .51 | (.39 | ) | 16.04 | 3.26 | 284 | .30 | 2.45 | |||||||||||||||||||||||||||||
| 7/31/2015 | 16.10 | .42 | (.18 | ) | .24 | (.42 | ) | 15.92 | 1.50 | 190 | .31 | 2.62 | ||||||||||||||||||||||||||||
| 7/31/2014 | 15.94 | .45 | .16 | .61 | (.45 | ) | 16.10 | 3.86 | 133 | .31 | 2.80 | |||||||||||||||||||||||||||||
| Year ended July 31 | ||||||||||
| 2018 | 2017 | 2016 | 2015 | 2014 | ||||||
| Portfolio turnover rate for all share classes | 28% | 27% | 16% | 19% | 9% | |||||
| 1 | Based on average shares outstanding. |
| 2 | Total returns exclude any applicable sales charges, including contingent deferred sales charges. |
| 3 | All or a significant portion of assets in this class consisted of seed capital invested by CRMC and/or its affiliates. Fees for distribution services are not charged or accrued on these seed capital assets. If such fees were paid by the fund on seed capital assets, fund expenses would have been higher and net income and total return would have been lower. |
| 4 | Amount less than $1 million. |
| 5 | Based on operations for a period that is less than a full year. |
| 6 | Class T shares began investment operations on April 7, 2017. |
| 7 | Not annualized. |
| 8 | Class F-3 shares began investment operations on January 27, 2017. |
| 9 | Annualized. |
See Notes to Financial Statements
| American Funds Tax-Exempt Funds | 77 |
Financial highlights (continued)
The Tax-Exempt Bond Fund of America
| Income (loss) from investment operations1 | ||||||||||||||||||||||||||||||||||||||||
| Period ended | Net asset value, beginning of period | Net investment income | Net (losses) gains on securities (both realized and unrealized) | Total from investment operations | Dividends (from net investment income) | Net asset value, end of period | Total return2 | Net assets, end of period (in millions) | Ratio of expenses to average net assets | Ratio of net income to average net assets | ||||||||||||||||||||||||||||||
| Class A: | ||||||||||||||||||||||||||||||||||||||||
| 7/31/2018 | $ | 12.98 | $ | .38 | $ | (.17 | ) | $ | .21 | $ | (.38 | ) | $ | 12.81 | 1.60 | % | $ | 10,102 | .53 | % | 2.91 | % | ||||||||||||||||||
| 7/31/2017 | 13.40 | .40 | (.42 | ) | (.02 | ) | (.40 | ) | 12.98 | (.09 | ) | 9,692 | .53 | 3.12 | ||||||||||||||||||||||||||
| 7/31/2016 | 12.96 | .41 | .44 | .85 | (.41 | ) | 13.40 | 6.69 | 9,510 | .54 | 3.15 | |||||||||||||||||||||||||||||
| 7/31/2015 | 12.92 | .42 | .04 | .46 | (.42 | ) | 12.96 | 3.62 | 7,385 | .54 | 3.28 | |||||||||||||||||||||||||||||
| 7/31/2014 | 12.44 | .45 | .48 | .93 | (.45 | ) | 12.92 | 7.60 | 6,772 | .56 | 3.57 | |||||||||||||||||||||||||||||
| Class C: | ||||||||||||||||||||||||||||||||||||||||
| 7/31/2018 | 12.98 | .27 | (.17 | ) | .10 | (.27 | ) | 12.81 | .80 | 432 | 1.32 | 2.12 | ||||||||||||||||||||||||||||
| 7/31/2017 | 13.40 | .30 | (.42 | ) | (.12 | ) | (.30 | ) | 12.98 | (.88 | ) | 474 | 1.32 | 2.33 | ||||||||||||||||||||||||||
| 7/31/2016 | 12.96 | .31 | .44 | .75 | (.31 | ) | 13.40 | 5.85 | 517 | 1.33 | 2.35 | |||||||||||||||||||||||||||||
| 7/31/2015 | 12.92 | .32 | .04 | .36 | (.32 | ) | 12.96 | 2.80 | 349 | 1.33 | 2.50 | |||||||||||||||||||||||||||||
| 7/31/2014 | 12.44 | .35 | .48 | .83 | (.35 | ) | 12.92 | 6.75 | 325 | 1.35 | 2.79 | |||||||||||||||||||||||||||||
| Class T: | ||||||||||||||||||||||||||||||||||||||||
| 7/31/2018 | 12.98 | .40 | (.17 | ) | .23 | (.40 | ) | 12.81 | 1.83 | 3 | — | 4 | .32 | 3 | 3.12 | 3 | ||||||||||||||||||||||||
| 7/31/20175,6 | 12.85 | .14 | .13 | .27 | (.14 | ) | 12.98 | 2.07 | 3,7 | — | 4 | .10 | 3,7 | 1.06 | 3,7 | |||||||||||||||||||||||||
| Class F-1: | ||||||||||||||||||||||||||||||||||||||||
| 7/31/2018 | 12.98 | .36 | (.17 | ) | .19 | (.36 | ) | 12.81 | 1.48 | 370 | .65 | 2.80 | ||||||||||||||||||||||||||||
| 7/31/2017 | 13.40 | .39 | (.43 | ) | (.04 | ) | (.38 | ) | 12.98 | (.22 | ) | 461 | .66 | 2.99 | ||||||||||||||||||||||||||
| 7/31/2016 | 12.96 | .39 | .44 | .83 | (.39 | ) | 13.40 | 6.53 | 518 | .67 | 3.04 | |||||||||||||||||||||||||||||
| 7/31/2015 | 12.92 | .41 | .04 | .45 | (.41 | ) | 12.96 | 3.49 | 1,474 | .67 | 3.16 | |||||||||||||||||||||||||||||
| 7/31/2014 | 12.44 | .43 | .48 | .91 | (.43 | ) | 12.92 | 7.46 | 1,389 | .68 | 3.46 | |||||||||||||||||||||||||||||
| 78 | American Funds Tax-Exempt Funds |
| Income (loss) from investment operations1 | ||||||||||||||||||||||||||||||||||||||||
| Period ended | Net asset value, beginning of period | Net investment income | Net (losses) gains on securities (both realized and unrealized) | Total from investment operations | Dividends (from net investment income) | Net asset value, end of period | Total return2 | Net assets, end of period (in millions) | Ratio of expenses to average net assets | Ratio of net income to average net assets | ||||||||||||||||||||||||||||||
| Class F-2: | ||||||||||||||||||||||||||||||||||||||||
| 7/31/2018 | $ | 12.98 | $ | .39 | $ | (.17 | ) | $ | .22 | $ | (.39 | ) | $ | 12.81 | 1.74 | % | $ | 2,177 | .39 | % | 3.05 | % | ||||||||||||||||||
| 7/31/2017 | 13.40 | .42 | (.42 | ) | — | 8 | (.42 | ) | 12.98 | .03 | 1,909 | .41 | 3.24 | |||||||||||||||||||||||||||
| 7/31/2016 | 12.96 | .43 | .44 | .87 | (.43 | ) | 13.40 | 6.84 | 2,879 | .40 | 3.26 | |||||||||||||||||||||||||||||
| 7/31/2015 | 12.92 | .44 | .04 | .48 | (.44 | ) | 12.96 | 3.76 | 990 | .41 | 3.42 | |||||||||||||||||||||||||||||
| 7/31/2014 | 12.44 | .46 | .48 | .94 | (.46 | ) | 12.92 | 7.74 | 662 | .42 | 3.70 | |||||||||||||||||||||||||||||
| Class F-3: | ||||||||||||||||||||||||||||||||||||||||
| 7/31/2018 | 12.98 | .41 | (.17 | ) | .24 | (.41 | ) | 12.81 | 1.84 | 5,397 | .28 | 3.11 | ||||||||||||||||||||||||||||
| 7/31/20175,9 | 12.75 | .22 | .23 | .45 | (.22 | ) | 12.98 | 3.54 | 7 | 1,555 | .29 | 10 | 3.34 | 10 | ||||||||||||||||||||||||||
| Class R-6: | ||||||||||||||||||||||||||||||||||||||||
| 7/31/2018 | 12.98 | .41 | (.17 | ) | .24 | (.41 | ) | 12.81 | 1.85 | 550 | .28 | 3.15 | ||||||||||||||||||||||||||||
| 7/31/2017 | 13.40 | .44 | (.43 | ) | .01 | (.43 | ) | 12.98 | .15 | 380 | .29 | 3.36 | ||||||||||||||||||||||||||||
| 7/31/2016 | 12.96 | .44 | .44 | .88 | (.44 | ) | 13.40 | 6.95 | 391 | .29 | 3.39 | |||||||||||||||||||||||||||||
| 7/31/2015 | 12.92 | .46 | .04 | .50 | (.46 | ) | 12.96 | 3.86 | 270 | .30 | 3.52 | |||||||||||||||||||||||||||||
| 7/31/2014 | 12.44 | .48 | .48 | .96 | (.48 | ) | 12.92 | 7.86 | 165 | .31 | 3.81 | |||||||||||||||||||||||||||||
| Year ended July 31 | ||||||||||
| 2018 | 2017 | 2016 | 2015 | 2014 | ||||||
| Portfolio turnover rate for all share classes | 17% | 20% | 13% | 14% | 10% | |||||
| 1 | Based on average shares outstanding. |
| 2 | Total returns exclude any applicable sales charges, including contingent deferred sales charges. |
| 3 | All or a significant portion of assets in this class consisted of seed capital invested by CRMC and/or its affiliates. Fees for distribution services are not charged or accrued on these seed capital assets. If such fees were paid by the fund on seed capital assets, fund expenses would have been higher and net income and total return would have been lower. |
| 4 | Amount less than $1 million. |
| 5 | Based on operations for a period that is less than a full year. |
| 6 | Class T shares began investment operations on April 7, 2017. |
| 7 | Not annualized. |
| 8 | Amount less than $.01. |
| 9 | Class F-3 shares began investment operations on January 27, 2017. |
| 10 | Annualized. |
See Notes to Financial Statements
| American Funds Tax-Exempt Funds | 79 |
Financial highlights (continued)
American High-Income Municipal Bond Fund
| Income (loss) from investment operations1 | ||||||||||||||||||||||||||||||||||||||||
| Period ended | Net asset value, beginning of period | Net investment income | Net gains (losses) on securities (both realized and unrealized) | Total from investment operations | Dividends (from net investment income) | Net asset value, end of period | Total return2 | Net assets, end of period (in millions) | Ratio of expenses to average net assets | Ratio of net income to average net assets | ||||||||||||||||||||||||||||||
| Class A: | ||||||||||||||||||||||||||||||||||||||||
| 7/31/2018 | $ | 15.73 | $ | .59 | $ | .04 | $ | .63 | $ | (.58 | ) | $ | 15.78 | 4.05 | % | $ | 4,062 | .68 | % | 3.72 | % | |||||||||||||||||||
| 7/31/2017 | 16.21 | .60 | (.49 | ) | .11 | (.59 | ) | 15.73 | .76 | 3,645 | .67 | 3.86 | ||||||||||||||||||||||||||||
| 7/31/2016 | 15.40 | .63 | .79 | 1.42 | (.61 | ) | 16.21 | 9.45 | 3,519 | .67 | 4.02 | |||||||||||||||||||||||||||||
| 7/31/2015 | 15.22 | .64 | .17 | .81 | (.63 | ) | 15.40 | 5.34 | 2,700 | .68 | 4.13 | |||||||||||||||||||||||||||||
| 7/31/2014 | 14.48 | .68 | .73 | 1.41 | (.67 | ) | 15.22 | 9.99 | 2,357 | .68 | 4.59 | |||||||||||||||||||||||||||||
| Class C: | ||||||||||||||||||||||||||||||||||||||||
| 7/31/2018 | 15.73 | .47 | .04 | .51 | (.46 | ) | 15.78 | 3.29 | 227 | 1.43 | 2.97 | |||||||||||||||||||||||||||||
| 7/31/2017 | 16.21 | .48 | (.49 | ) | (.01 | ) | (.47 | ) | 15.73 | .00 | 229 | 1.43 | 3.10 | |||||||||||||||||||||||||||
| 7/31/2016 | 15.40 | .52 | .79 | 1.31 | (.50 | ) | 16.21 | 8.62 | 247 | 1.43 | 3.26 | |||||||||||||||||||||||||||||
| 7/31/2015 | 15.22 | .52 | .17 | .69 | (.51 | ) | 15.40 | 4.55 | 182 | 1.44 | 3.37 | |||||||||||||||||||||||||||||
| 7/31/2014 | 14.48 | .56 | .73 | 1.29 | (.55 | ) | 15.22 | 9.12 | 161 | 1.48 | 3.80 | |||||||||||||||||||||||||||||
| Class T: | ||||||||||||||||||||||||||||||||||||||||
| 7/31/2018 | 15.73 | .63 | .04 | .67 | (.62 | ) | 15.78 | 4.34 | 3 | — | 4 | .43 | 3 | 3.98 | 3 | |||||||||||||||||||||||||
| 7/31/20175,6 | 15.50 | .20 | .23 | .43 | (.20 | ) | 15.73 | 2.77 | 3,7 | — | 4 | .12 | 3,7 | 1.28 | 3,7 | |||||||||||||||||||||||||
| Class F-1: | ||||||||||||||||||||||||||||||||||||||||
| 7/31/2018 | 15.73 | .58 | .04 | .62 | (.57 | ) | 15.78 | 3.99 | 208 | .75 | 3.65 | |||||||||||||||||||||||||||||
| 7/31/2017 | 16.21 | .59 | (.49 | ) | .10 | (.58 | ) | 15.73 | .68 | 234 | .75 | 3.77 | ||||||||||||||||||||||||||||
| 7/31/2016 | 15.40 | .62 | .79 | 1.41 | (.60 | ) | 16.21 | 9.37 | 282 | .74 | 3.95 | |||||||||||||||||||||||||||||
| 7/31/2015 | 15.22 | .62 | .17 | .79 | (.61 | ) | 15.40 | 5.27 | 207 | .75 | 4.06 | |||||||||||||||||||||||||||||
| 7/31/2014 | 14.48 | .66 | .73 | 1.39 | (.65 | ) | 15.22 | 9.87 | 178 | .79 | 4.49 | |||||||||||||||||||||||||||||
| 80 | American Funds Tax-Exempt Funds |
| Income (loss) from investment operations1 | ||||||||||||||||||||||||||||||||||||||||
| Period ended | Net asset value, beginning of period | Net investment income | Net gains (losses) on securities (both realized and unrealized) | Total from investment operations | Dividends (from net investment income) | Net asset value, end of period | Total return2 | Net assets, end of period (in millions) | Ratio of expenses to average net assets | Ratio of net income to average net assets | ||||||||||||||||||||||||||||||
| Class F-2: | ||||||||||||||||||||||||||||||||||||||||
| 7/31/2018 | $ | 15.73 | $ | .62 | $ | .04 | $ | .66 | $ | (.61 | ) | $ | 15.78 | 4.26 | % | $ | 798 | .49 | % | 3.91 | % | |||||||||||||||||||
| 7/31/2017 | 16.21 | .63 | (.49 | ) | .14 | (.62 | ) | 15.73 | .93 | 605 | .50 | 4.05 | ||||||||||||||||||||||||||||
| 7/31/2016 | 15.40 | .66 | .79 | 1.45 | (.64 | ) | 16.21 | 9.65 | 775 | .48 | 4.18 | |||||||||||||||||||||||||||||
| 7/31/2015 | 15.22 | .66 | .17 | .83 | (.65 | ) | 15.40 | 5.53 | 321 | .49 | 4.32 | |||||||||||||||||||||||||||||
| 7/31/2014 | 14.48 | .70 | .73 | 1.43 | (.69 | ) | 15.22 | 10.15 | 223 | .53 | 4.71 | |||||||||||||||||||||||||||||
| Class F-3: | ||||||||||||||||||||||||||||||||||||||||
| 7/31/2018 | 15.73 | .64 | .04 | .68 | (.63 | ) | 15.78 | 4.37 | 646 | .38 | 4.02 | |||||||||||||||||||||||||||||
| 7/31/20175,8 | 15.30 | .32 | .43 | .75 | (.32 | ) | 15.73 | 4.96 | 7 | 421 | .37 | 9 | 4.04 | 9 | ||||||||||||||||||||||||||
| Class R-6: | ||||||||||||||||||||||||||||||||||||||||
| 7/31/2018 | 15.73 | .64 | .04 | .68 | (.63 | ) | 15.78 | 4.37 | 550 | .38 | 4.02 | |||||||||||||||||||||||||||||
| 7/31/2017 | 16.21 | .64 | (.49 | ) | .15 | (.63 | ) | 15.73 | 1.05 | 380 | .38 | 4.16 | ||||||||||||||||||||||||||||
| 7/31/2016 | 15.40 | .68 | .79 | 1.47 | (.66 | ) | 16.21 | 9.76 | 269 | .38 | 4.31 | |||||||||||||||||||||||||||||
| 7/31/2015 | 15.22 | .68 | .17 | .85 | (.67 | ) | 15.40 | 5.64 | 188 | .39 | 4.42 | |||||||||||||||||||||||||||||
| 7/31/2014 | 14.48 | .72 | .73 | 1.45 | (.71 | ) | 15.22 | 10.27 | 108 | .42 | 4.82 | |||||||||||||||||||||||||||||
| Year ended July 31 | ||||||||||
| 2018 | 2017 | 2016 | 2015 | 2014 | ||||||
| Portfolio turnover rate for all share classes | 24% | 30% | 21% | 23% | 24% | |||||
| 1 | Based on average shares outstanding. |
| 2 | Total returns exclude any applicable sales charges, including contingent deferred sales charges. |
| 3 | All or a significant portion of assets in this class consisted of seed capital invested by CRMC and/or its affiliates. Fees for distribution services are not charged or accrued on these seed capital assets. If such fees were paid by the fund on seed capital assets, fund expenses would have been higher and net income and total return would have been lower. |
| 4 | Amount less than $1 million. |
| 5 | Based on operations for a period that is less than a full year. |
| 6 | Class T shares began investment operations on April 7, 2017. |
| 7 | Not annualized. |
| 8 | Class F-3 shares began investment operations on January 27, 2017. |
| 9 | Annualized. |
See Notes to Financial Statements
| American Funds Tax-Exempt Funds | 81 |
Financial highlights (continued)
The Tax-Exempt Fund of California
| Income (loss) from investment operations1 | ||||||||||||||||||||||||||||||||||||||||
| Period ended | Net asset value, beginning of period | Net investment income | Net (losses) gains on securities (both realized and unrealized) | Total from investment operations | Dividends (from net investment income) | Net asset value, end of period | Total return2 | Net assets, end of period (in millions) | Ratio of expenses to average net assets | Ratio of net income to average net assets | ||||||||||||||||||||||||||||||
| Class A: | ||||||||||||||||||||||||||||||||||||||||
| 7/31/2018 | $ | 17.63 | $ | .51 | $ | (.20 | ) | $ | .31 | $ | (.51 | ) | $ | 17.43 | 1.77 | % | $ | 1,678 | .61 | % | 2.90 | % | ||||||||||||||||||
| 7/31/2017 | 18.21 | .54 | (.59 | ) | (.05 | ) | (.53 | ) | 17.63 | (.22 | ) | 1,641 | .60 | 3.05 | ||||||||||||||||||||||||||
| 7/31/2016 | 17.62 | .57 | .58 | 1.15 | (.56 | ) | 18.21 | 6.65 | 1,678 | .60 | 3.17 | |||||||||||||||||||||||||||||
| 7/31/2015 | 17.52 | .60 | .09 | .69 | (.59 | ) | 17.62 | 3.98 | 1,386 | .62 | 3.38 | |||||||||||||||||||||||||||||
| 7/31/2014 | 16.72 | .63 | .80 | 1.43 | (.63 | ) | 17.52 | 8.72 | 1,265 | .63 | 3.72 | |||||||||||||||||||||||||||||
| Class C: | ||||||||||||||||||||||||||||||||||||||||
| 7/31/2018 | 17.63 | .37 | (.20 | ) | .17 | (.37 | ) | 17.43 | .97 | 71 | 1.40 | 2.11 | ||||||||||||||||||||||||||||
| 7/31/2017 | 18.21 | .40 | (.59 | ) | (.19 | ) | (.39 | ) | 17.63 | (1.00 | ) | 83 | 1.39 | 2.26 | ||||||||||||||||||||||||||
| 7/31/2016 | 17.62 | .43 | .58 | 1.01 | (.42 | ) | 18.21 | 5.82 | 97 | 1.39 | 2.38 | |||||||||||||||||||||||||||||
| 7/31/2015 | 17.52 | .46 | .09 | .55 | (.45 | ) | 17.62 | 3.16 | 78 | 1.40 | 2.59 | |||||||||||||||||||||||||||||
| 7/31/2014 | 16.72 | .50 | .80 | 1.30 | (.50 | ) | 17.52 | 7.87 | 76 | 1.42 | 2.94 | |||||||||||||||||||||||||||||
| Class T: | ||||||||||||||||||||||||||||||||||||||||
| 7/31/2018 | 17.63 | .54 | (.20 | ) | .34 | (.54 | ) | 17.43 | 1.98 | 3 | — | 4 | .40 | 3 | 3.10 | 3 | ||||||||||||||||||||||||
| 7/31/20175,6 | 17.42 | .18 | .21 | .39 | (.18 | ) | 17.63 | 2.24 | 3,7 | — | 4 | .12 | 3,7 | 1.02 | 3,7 | |||||||||||||||||||||||||
| Class F-1: | ||||||||||||||||||||||||||||||||||||||||
| 7/31/2018 | 17.63 | .49 | (.20 | ) | .29 | (.49 | ) | 17.43 | 1.64 | 75 | .73 | 2.77 | ||||||||||||||||||||||||||||
| 7/31/2017 | 18.21 | .51 | (.58 | ) | (.07 | ) | (.51 | ) | 17.63 | (.35 | ) | 76 | .73 | 2.93 | ||||||||||||||||||||||||||
| 7/31/2016 | 17.62 | .55 | .58 | 1.13 | (.54 | ) | 18.21 | 6.52 | 83 | .73 | 3.04 | |||||||||||||||||||||||||||||
| 7/31/2015 | 17.52 | .58 | .09 | .67 | (.57 | ) | 17.62 | 3.85 | 63 | .74 | 3.26 | |||||||||||||||||||||||||||||
| 7/31/2014 | 16.72 | .61 | .80 | 1.41 | (.61 | ) | 17.52 | 8.59 | 65 | .76 | 3.60 | |||||||||||||||||||||||||||||
| 82 | American Funds Tax-Exempt Funds |
| Income (loss) from investment operations1 | ||||||||||||||||||||||||||||||||||||||||
| Period ended | Net asset value, beginning of period | Net investment income | Net (losses) gains on securities (both realized and unrealized) | Total from investment operations | Dividends (from net investment income) | Net asset value, end of period | Total return2 | Net assets, end of period (in millions) | Ratio of expenses to average net assets | Ratio of net income to average net assets | ||||||||||||||||||||||||||||||
| Class F-2: | ||||||||||||||||||||||||||||||||||||||||
| 7/31/2018 | $ | 17.63 | $ | .53 | $ | (.20 | ) | $ | .33 | $ | (.53 | ) | $ | 17.43 | 1.89 | % | $ | 257 | .48 | % | 3.03 | % | ||||||||||||||||||
| 7/31/2017 | 18.21 | .56 | (.59 | ) | (.03 | ) | (.55 | ) | 17.63 | (.09 | ) | 200 | .48 | 3.18 | ||||||||||||||||||||||||||
| 7/31/2016 | 17.62 | .60 | .58 | 1.18 | (.59 | ) | 18.21 | 6.79 | 213 | .48 | 3.29 | |||||||||||||||||||||||||||||
| 7/31/2015 | 17.52 | .62 | .09 | .71 | (.61 | ) | 17.62 | 4.10 | 134 | .49 | 3.51 | |||||||||||||||||||||||||||||
| 7/31/2014 | 16.72 | .65 | .80 | 1.45 | (.65 | ) | 17.52 | 8.85 | 110 | .51 | 3.84 | |||||||||||||||||||||||||||||
| Class F-3: | ||||||||||||||||||||||||||||||||||||||||
| 7/31/2018 | 17.63 | .55 | (.20 | ) | .35 | (.55 | ) | 17.43 | 2.01 | 174 | .37 | 3.13 | ||||||||||||||||||||||||||||
| 7/31/20175,8 | 17.27 | .29 | .36 | .65 | (.29 | ) | 17.63 | 3.79 | 7 | 124 | .38 | 9 | 3.25 | 9 | ||||||||||||||||||||||||||
| Year ended July 31 | ||||||||||
| 2018 | 2017 | 2016 | 2015 | 2014 | ||||||
| Portfolio turnover rate for all share classes | 14% | 21% | 11% | 17% | 8% | |||||
| 1 | Based on average shares outstanding. |
| 2 | Total returns exclude any applicable sales charges, including contingent deferred sales charges. |
| 3 | All or a significant portion of assets in this class consisted of seed capital invested by CRMC and/or its affiliates. Fees for distribution services are not charged or accrued on these seed capital assets. If such fees were paid by the fund on seed capital assets, fund expenses would have been higher and net income and total return would have been lower. |
| 4 | Amount less than $1 million. |
| 5 | Based on operations for a period that is less than a full year. |
| 6 | Class T shares began investment operations on April 7, 2017. |
| 7 | Not annualized. |
| 8 | Class F-3 shares began investment operations on January 27, 2017. |
| 9 | Annualized. |
See Notes to Financial Statements
| American Funds Tax-Exempt Funds | 83 |
Financial highlights (continued)
American Funds Tax-Exempt Fund of New York
| Income (loss) from investment operations1 | ||||||||||||||||||||||||||||||||||||||||||||
| Period ended | Net asset value, beginning of year | Net investment income | Net (losses) gains on securities (both realized and unrealized) | Total from investment operations | Dividends (from net investment income) | Net asset value, end of period | Total return2,3 | Net assets, end of period (in millions) | Ratio of expenses to average net assets before reimbursements | Ratio of expenses to average net assets after reimbursements3 | Ratio of net income to average net assets3 | |||||||||||||||||||||||||||||||||
| Class A: | ||||||||||||||||||||||||||||||||||||||||||||
| 7/31/2018 | $ | 10.80 | $ | .27 | $ | (.19 | ) | $ | .08 | $ | (.27 | ) | $ | 10.61 | .75 | %4 | $ | 183 | .72 | %4 | .69 | %4 | 2.52 | %4 | ||||||||||||||||||||
| 7/31/2017 | 11.12 | .27 | (.32 | ) | (.05 | ) | (.27 | ) | 10.80 | (.39 | )4 | 169 | .74 | 4 | .69 | 4 | 2.55 | 4 | ||||||||||||||||||||||||||
| 7/31/2016 | 10.66 | .28 | .45 | .73 | (.27 | ) | 11.12 | 6.95 | 4 | 161 | .72 | 4 | .69 | 4 | 2.54 | 4 | ||||||||||||||||||||||||||||
| 7/31/2015 | 10.58 | .32 | .07 | .39 | (.31 | ) | 10.66 | 3.65 | 4 | 124 | .72 | 4 | .67 | 4 | 2.91 | 4 | ||||||||||||||||||||||||||||
| 7/31/2014 | 10.21 | .31 | .37 | .68 | (.31 | ) | 10.58 | 6.83 | 4 | 102 | .73 | 4 | .63 | 4 | 3.07 | 4 | ||||||||||||||||||||||||||||
| Class C: | ||||||||||||||||||||||||||||||||||||||||||||
| 7/31/2018 | 10.80 | .19 | (.19 | ) | — | 5 | (.19 | ) | 10.61 | (.04 | ) | 12 | 1.52 | 1.48 | 1.73 | |||||||||||||||||||||||||||||
| 7/31/2017 | 11.12 | .19 | (.32 | ) | (.13 | ) | (.19 | ) | 10.80 | (1.17 | ) | 12 | 1.52 | 1.48 | 1.76 | |||||||||||||||||||||||||||||
| 7/31/2016 | 10.66 | .20 | .45 | .65 | (.19 | ) | 11.12 | 6.11 | 14 | 1.51 | 1.48 | 1.75 | ||||||||||||||||||||||||||||||||
| 7/31/2015 | 10.58 | .23 | .07 | .30 | (.22 | ) | 10.66 | 2.79 | 10 | 1.56 | 1.50 | 2.07 | ||||||||||||||||||||||||||||||||
| 7/31/2014 | 10.21 | .22 | .37 | .59 | (.22 | ) | 10.58 | 5.89 | 8 | 1.60 | 1.51 | 2.19 | ||||||||||||||||||||||||||||||||
| Class T: | ||||||||||||||||||||||||||||||||||||||||||||
| 7/31/2018 | 10.80 | .29 | (.19 | ) | .10 | (.29 | ) | 10.61 | .98 | 4 | — | 6 | .52 | 4 | .48 | 4 | 2.73 | 4 | ||||||||||||||||||||||||||
| 7/31/20177,8 | 10.68 | .09 | .13 | .22 | (.10 | ) | 10.80 | 2.02 | 4,9 | — | 6 | .19 | 4,9 | .15 | 4,9 | .87 | 4,9 | |||||||||||||||||||||||||||
| Class F-1: | ||||||||||||||||||||||||||||||||||||||||||||
| 7/31/2018 | 10.80 | .26 | (.19 | ) | .07 | (.26 | ) | 10.61 | .69 | 4 | 2 | .79 | 4 | .75 | 4 | 2.45 | 4 | |||||||||||||||||||||||||||
| 7/31/2017 | 11.12 | .27 | (.32 | ) | (.05 | ) | (.27 | ) | 10.80 | (.38 | )4 | 3 | .73 | 4 | .68 | 4 | 2.56 | 4 | ||||||||||||||||||||||||||
| 7/31/2016 | 10.66 | .29 | .45 | .74 | (.28 | ) | 11.12 | 7.02 | 4 | 2 | .65 | 4 | .62 | 4 | 2.61 | 4 | ||||||||||||||||||||||||||||
| 7/31/2015 | 10.58 | .31 | .07 | .38 | (.30 | ) | 10.66 | 3.58 | 4 | 2 | .80 | 4 | .74 | 4 | 2.83 | 4 | ||||||||||||||||||||||||||||
| 7/31/2014 | 10.21 | .31 | .37 | .68 | (.31 | ) | 10.58 | 6.77 | 4 | 1 | .77 | 4 | .68 | 4 | 3.03 | 4 | ||||||||||||||||||||||||||||
| 84 | American Funds Tax-Exempt Funds |
| Income (loss) from investment operations1 | ||||||||||||||||||||||||||||||||||||||||||||||||||||
| Period ended | Net asset value, beginning of year | Net investment income | Net (losses) gains on securities (both realized and unrealized) | Total from investment operations | Dividends (from net investment income) | Net asset value, end of period | Total return2,3 | Net assets, end of period (in millions) | Ratio of expenses to average net assets before reimbursements | Ratio of expenses to average net assets after reimbursements3 | Ratio of net income to average net assets3 | |||||||||||||||||||||||||||||||||||||||||
| Class F-2: | ||||||||||||||||||||||||||||||||||||||||||||||||||||
| 7/31/2018 | $ | 10.80 | $ | .29 | $ | (.19 | ) | $ | .10 | $ | (.29 | ) | $ | 10.61 | .89 | % | $ | 16 | .59 | % | .54 | % | 2.67 | % | ||||||||||||||||||||||||||||
| 7/31/2017 | 11.12 | .29 | (.32 | ) | (.03 | ) | (.29 | ) | 10.80 | (.26 | ) | 11 | .58 | .56 | 2.68 | |||||||||||||||||||||||||||||||||||||
| 7/31/2016 | 10.66 | .30 | .45 | .75 | (.29 | ) | 11.12 | 7.10 | 31 | .58 | .55 | 2.68 | ||||||||||||||||||||||||||||||||||||||||
| 7/31/2015 | 10.58 | .33 | .07 | .40 | (.32 | ) | 10.66 | 3.77 | 20 | .61 | .56 | 3.02 | ||||||||||||||||||||||||||||||||||||||||
| 7/31/2014 | 10.21 | .32 | .37 | .69 | (.32 | ) | 10.58 | 6.89 | 16 | .66 | .57 | 3.13 | ||||||||||||||||||||||||||||||||||||||||
| Class F-3: | ||||||||||||||||||||||||||||||||||||||||||||||||||||
| 7/31/2018 | 10.80 | .30 | (.19 | ) | .11 | (.30 | ) | 10.61 | 1.00 | 26 | .48 | .44 | 2.78 | |||||||||||||||||||||||||||||||||||||||
| 7/31/20177,10 | 10.58 | .15 | .22 | .37 | (.15 | ) | 10.80 | 3.54 | 9 | 16 | .58 | 11 | .45 | 11 | 2.79 | 11 | ||||||||||||||||||||||||||||||||||||
| Year ended July 31 | ||||||||||
| 2018 | 2017 | 2016 | 2015 | 2014 | ||||||
| Portfolio turnover rate for all share classes | 21% | 27% | 14% | 42% | 25% | |||||
| 1 | Based on average shares outstanding. |
| 2 | Total returns exclude any applicable sales charges, including contingent deferred sales charges. |
| 3 | This column reflects the impact, if any, of certain reimbursements from CRMC. During the periods shown, CRMC reimbursed a portion of miscellaneous fees and expenses. |
| 4 | All or a significant portion of assets in this class consisted of seed capital invested by CRMC and/or its affiliates. Fees for distribution services are not charged or accrued on these seed capital assets. If such fees were paid by the fund on seed capital assets, fund expenses would have been higher and net income and total return would have been lower. |
| 5 | Amount less than $.01. |
| 6 | Amount less than $1 million. |
| 7 | Based on operations for a period that is less than a full year. |
| 8 | Class T shares began investment operations on April 7, 2017. |
| 9 | Not annualized. |
| 10 | Class F-3 shares began investment operations on January 27, 2017. |
| 11 | Annualized. |
See Notes to Financial Statements
| American Funds Tax-Exempt Funds | 85 |
Report of Independent Registered Public Accounting Firm
To the Board of Trustees and Shareholders of American Funds Short-Term Tax-Exempt Bond Fund, Limited Term Tax-Exempt Bond Fund of America, The Tax-Exempt Bond Fund of America, American High-Income Municipal Bond Fund, The Tax-Exempt Fund of California and American Funds Tax-Exempt Fund of New York
Opinions on the Financial Statements
We have audited the accompanying statements of assets and liabilities, including the summary investment portfolios, of American Funds Short-Term Tax-Exempt Bond Fund, Limited Term Tax-Exempt Bond Fund of America, The Tax-Exempt Bond Fund of America, American High-Income Municipal Bond Fund, The Tax-Exempt Fund of California and American Funds Tax-Exempt Fund of New York (the “Funds”) as of July 31, 2018, the related statements of operations for the year ended July 31, 2018, the statements of changes in net assets for each of the two years in the period ended July 31, 2018, including the related notes, and the financial highlights for each of the periods indicated therein (collectively referred to as the “financial statements”). In our opinion, the financial statements present fairly, in all material respects, the financial position of each of the Funds as of July 31, 2018, the results of each of their operations for the year then ended, the changes in each of their net assets for each of the two years in the period ended July 31, 2018 and each of the financial highlights for each of the periods indicated therein in conformity with accounting principles generally accepted in the United States of America.
Basis for Opinions
These financial statements are the responsibility of the Funds’ management. Our responsibility is to express an opinion on the Funds’ financial statements based on our audits. We are a public accounting firm registered with the Public Company Accounting Oversight Board (United States) (“PCAOB”) and are required to be independent with respect to the Funds in accordance with the U.S. federal securities laws and the applicable rules and regulations of the Securities and Exchange Commission and the PCAOB.
We conducted our audits of these financial statements in accordance with the standards of the PCAOB. Those standards require that we plan and perform the audit to obtain reasonable assurance about whether the financial statements are free of material misstatement, whether due to error or fraud.
Our audits included performing procedures to assess the risks of material misstatement of the financial statements, whether due to error or fraud, and performing procedures that respond to those risks. Such procedures included examining, on a test basis, evidence regarding the amounts and disclosures in the financial statements. Our audits also included evaluating the accounting principles used and significant estimates made by management, as well as evaluating the overall presentation of the financial statements. Our procedures included confirmation of securities owned as of July 31, 2018 by correspondence with the custodians and brokers. We believe that our audits provide a reasonable basis for our opinions.
PricewaterhouseCoopers LLP
Los Angeles, California
September 13, 2018
We have served as the auditor of one or more investment companies in The Capital Group Companies Investment Company Complex since 1934.
| 86 | American Funds Tax-Exempt Funds |
| Expense example | unaudited |
As a fund shareholder, you incur two types of costs: (1) transaction costs, such as initial sales charges on purchase payments and contingent deferred sales charges on redemptions (loads), and (2) ongoing costs, including management fees, distribution and service (12b-1) fees, and other expenses. This example is intended to help you understand your ongoing costs (in dollars) of investing in the fund so you can compare these costs with the ongoing costs of investing in other mutual funds. The example is based on an investment of $1,000 invested at the beginning of the period and held for the entire six-month period (February 1, 2018, through July 31, 2018).
Actual expenses:
The first line of each share class in the table on the following pages provides information about actual account values and actual expenses. You may use the information in this line, together with the amount you invested, to estimate the expenses that you paid over the period. Simply divide your account value by $1,000 (for example, an $8,600 account value divided by $1,000 = 8.6), then multiply the result by the number in the first line under the heading titled “Expenses paid during period” to estimate the expenses you paid on your account during this period.
Hypothetical example for comparison purposes:
The second line of each share class in the table on the following pages provides information about hypothetical account values and hypothetical expenses based on the actual expense ratio for the share class and an assumed rate of return of 5.00% per year before expenses, which is not the actual return of the share class. The hypothetical account values and expenses may not be used to estimate the actual ending account balance or expenses you paid for the period. You may use this information to compare the ongoing costs of investing in the fund and other funds. To do so, compare this 5.00% hypothetical example with the 5.00% hypothetical examples that appear in the shareholder reports of the other funds.
Notes:
Class F-1, F-2 and F-3 shareholders may be subject to fees charged by financial intermediaries, typically ranging from 0.75% to 1.50% of assets annually depending on services offered. You can estimate the impact of these fees by adding the amount of the fees to the total estimated expenses you paid on your account during the period as calculated above. In addition, your ending account value would be lower by the amount of these fees.
Note that the expenses shown in the table on the following pages are meant to highlight your ongoing costs only and do not reflect any transactional costs, such as sales charges (loads). Therefore, the second line of each share class in the table is useful in comparing ongoing costs only and will not help you determine the relative total costs of owning different funds. In addition, if these transactional costs were included, your costs would have been higher.
| American Funds Tax-Exempt Funds | 87 |
American Funds Short-Term Tax-Exempt Bond Fund
| Beginning account value 2/1/2018 | Ending account value 7/31/2018 | Expenses paid during period* | Annualized expense ratio | |||||||||||||
| Class A - actual return | $ | 1,000.00 | $ | 1,004.94 | $ | 2.93 | .59 | % | ||||||||
| Class A - assumed 5% return | 1,000.00 | 1,021.87 | 2.96 | .59 | ||||||||||||
| Class T - actual return | 1,000.00 | 1,005.54 | 2.39 | .48 | ||||||||||||
| Class T - assumed 5% return | 1,000.00 | 1,022.41 | 2.41 | .48 | ||||||||||||
| Class F-1 - actual return | 1,000.00 | 1,003.84 | 3.97 | .80 | ||||||||||||
| Class F-1 - assumed 5% return | 1,000.00 | 1,020.83 | 4.01 | .80 | ||||||||||||
| Class F-2 - actual return | 1,000.00 | 1,005.13 | 2.68 | .54 | ||||||||||||
| Class F-2 - assumed 5% return | 1,000.00 | 1,022.12 | 2.71 | .54 | ||||||||||||
| Class F-3 - actual return | 1,000.00 | 1,005.67 | 2.19 | .44 | ||||||||||||
| Class F-3 - assumed 5% return | 1,000.00 | 1,022.61 | 2.21 | .44 | ||||||||||||
| Class R-6 - actual return | 1,000.00 | 1,005.60 | 2.19 | .44 | ||||||||||||
| Class R-6 - assumed 5% return | 1,000.00 | 1,022.61 | 2.21 | .44 | ||||||||||||
Limited Term Tax-Exempt Bond Fund of America
| Beginning account value 2/1/2018 | Ending account value 7/31/2018 | Expenses paid during period* | Annualized expense ratio | |||||||||||||
| Class A - actual return | $ | 1,000.00 | $ | 1,006.15 | $ | 2.93 | .59 | % | ||||||||
| Class A - assumed 5% return | 1,000.00 | 1,021.87 | 2.96 | .59 | ||||||||||||
| Class C - actual return | 1,000.00 | 1,002.50 | 6.60 | 1.33 | ||||||||||||
| Class C - assumed 5% return | 1,000.00 | 1,018.20 | 6.66 | 1.33 | ||||||||||||
| Class T - actual return | 1,000.00 | 1,007.56 | 1.59 | .32 | ||||||||||||
| Class T - assumed 5% return | 1,000.00 | 1,023.21 | 1.61 | .32 | ||||||||||||
| Class F-1 - actual return | 1,000.00 | 1,005.85 | 3.28 | .66 | ||||||||||||
| Class F-1 - assumed 5% return | 1,000.00 | 1,021.52 | 3.31 | .66 | ||||||||||||
| Class F-2 - actual return | 1,000.00 | 1,007.09 | 2.04 | .41 | ||||||||||||
| Class F-2 - assumed 5% return | 1,000.00 | 1,022.76 | 2.06 | .41 | ||||||||||||
| Class F-3 - actual return | 1,000.00 | 1,007.64 | 1.49 | .30 | ||||||||||||
| Class F-3 - assumed 5% return | 1,000.00 | 1,023.31 | 1.51 | .30 | ||||||||||||
| Class R-6 - actual return | 1,000.00 | 1,007.64 | 1.44 | .29 | ||||||||||||
| Class R-6 - assumed 5% return | 1,000.00 | 1,023.36 | 1.45 | .29 | ||||||||||||
The Tax-Exempt Bond Fund of America
| Beginning account value 2/1/2018 | Ending account value 7/31/2018 | Expenses paid during period* | Annualized expense ratio | |||||||||||||
| Class A - actual return | $ | 1,000.00 | $ | 1,009.39 | $ | 2.59 | .52 | % | ||||||||
| Class A - assumed 5% return | 1,000.00 | 1,022.22 | 2.61 | .52 | ||||||||||||
| Class C - actual return | 1,000.00 | 1,005.42 | 6.51 | 1.31 | ||||||||||||
| Class C - assumed 5% return | 1,000.00 | 1,018.30 | 6.56 | 1.31 | ||||||||||||
| Class T - actual return | 1,000.00 | 1,010.50 | 1.55 | .31 | ||||||||||||
| Class T - assumed 5% return | 1,000.00 | 1,023.26 | 1.56 | .31 | ||||||||||||
| Class F-1 - actual return | 1,000.00 | 1,008.83 | 3.14 | .63 | ||||||||||||
| Class F-1 - assumed 5% return | 1,000.00 | 1,021.67 | 3.16 | .63 | ||||||||||||
| Class F-2 - actual return | 1,000.00 | 1,010.07 | 1.89 | .38 | ||||||||||||
| Class F-2 - assumed 5% return | 1,000.00 | 1,022.91 | 1.91 | .38 | ||||||||||||
| Class F-3 - actual return | 1,000.00 | 1,010.59 | 1.35 | .27 | ||||||||||||
| Class F-3 - assumed 5% return | 1,000.00 | 1,023.46 | 1.35 | .27 | ||||||||||||
| Class R-6 - actual return | 1,000.00 | 1,010.59 | 1.35 | .27 | ||||||||||||
| Class R-6 - assumed 5% return | 1,000.00 | 1,023.46 | 1.35 | .27 | ||||||||||||
| 88 | American Funds Tax-Exempt Funds |
American High-Income Municipal Bond Fund
| Beginning account value 2/1/2018 | Ending account value 7/31/2018 | Expenses paid during period* | Annualized expense ratio | |||||||||||||
| Class A - actual return | $ | 1,000.00 | $ | 1,018.14 | $ | 3.30 | .66 | % | ||||||||
| Class A - assumed 5% return | 1,000.00 | 1,021.52 | 3.31 | .66 | ||||||||||||
| Class C - actual return | 1,000.00 | 1,014.42 | 6.94 | 1.39 | ||||||||||||
| Class C - assumed 5% return | 1,000.00 | 1,017.90 | 6.95 | 1.39 | ||||||||||||
| Class T - actual return | 1,000.00 | 1,019.51 | 2.00 | .40 | ||||||||||||
| Class T - assumed 5% return | 1,000.00 | 1,022.81 | 2.01 | .40 | ||||||||||||
| Class F-1 - actual return | 1,000.00 | 1,017.87 | 3.55 | .71 | ||||||||||||
| Class F-1 - assumed 5% return | 1,000.00 | 1,021.27 | 3.56 | .71 | ||||||||||||
| Class F-2 - actual return | 1,000.00 | 1,019.15 | 2.25 | .45 | ||||||||||||
| Class F-2 - assumed 5% return | 1,000.00 | 1,022.56 | 2.26 | .45 | ||||||||||||
| Class F-3 - actual return | 1,000.00 | 1,019.69 | 1.75 | .35 | ||||||||||||
| Class F-3 - assumed 5% return | 1,000.00 | 1,023.06 | 1.76 | .35 | ||||||||||||
| Class R-6 - actual return | 1,000.00 | 1,019.69 | 1.75 | .35 | ||||||||||||
| Class R-6 - assumed 5% return | 1,000.00 | 1,023.06 | 1.76 | .35 | ||||||||||||
The Tax-Exempt Fund of California
| Beginning account value 2/1/2018 | Ending account value 7/31/2018 | Expenses paid during period* | Annualized expense ratio | |||||||||||||
| Class A - actual return | $ | 1,000.00 | $ | 1,009.74 | $ | 2.94 | .59 | % | ||||||||
| Class A - assumed 5% return | 1,000.00 | 1,021.87 | 2.96 | .59 | ||||||||||||
| Class C - actual return | 1,000.00 | 1,005.80 | 6.86 | 1.38 | ||||||||||||
| Class C - assumed 5% return | 1,000.00 | 1,017.95 | 6.90 | 1.38 | ||||||||||||
| Class T - actual return | 1,000.00 | 1,010.75 | 1.94 | .39 | ||||||||||||
| Class T - assumed 5% return | 1,000.00 | 1,022.86 | 1.96 | .39 | ||||||||||||
| Class F-1 - actual return | 1,000.00 | 1,009.13 | 3.54 | .71 | ||||||||||||
| Class F-1 - assumed 5% return | 1,000.00 | 1,021.27 | 3.56 | .71 | ||||||||||||
| Class F-2 - actual return | 1,000.00 | 1,010.38 | 2.29 | .46 | ||||||||||||
| Class F-2 - assumed 5% return | 1,000.00 | 1,022.51 | 2.31 | .46 | ||||||||||||
| Class F-3 - actual return | 1,000.00 | 1,010.89 | 1.79 | .36 | ||||||||||||
| Class F-3 - assumed 5% return | 1,000.00 | 1,023.01 | 1.81 | .36 | ||||||||||||
American Funds Tax-Exempt Fund of New York
| Beginning account value 2/1/2018 | Ending account value 7/31/2018 | Expenses paid during period* | Annualized expense ratio | |||||||||||||
| Class A - actual return | $ | 1,000.00 | $ | 1,006.29 | $ | 3.08 | .62 | % | ||||||||
| Class A - assumed 5% return | 1,000.00 | 1,021.72 | 3.11 | .62 | ||||||||||||
| Class C - actual return | 1,000.00 | 1,002.35 | 7.00 | 1.41 | ||||||||||||
| Class C - assumed 5% return | 1,000.00 | 1,017.80 | 7.05 | 1.41 | ||||||||||||
| Class T - actual return | 1,000.00 | 1,007.37 | 2.09 | .42 | ||||||||||||
| Class T - assumed 5% return | 1,000.00 | 1,022.71 | 2.11 | .42 | ||||||||||||
| Class F-1 - actual return | 1,000.00 | 1,005.97 | 3.43 | .69 | ||||||||||||
| Class F-1 - assumed 5% return | 1,000.00 | 1,021.37 | 3.46 | .69 | ||||||||||||
| Class F-2 - actual return | 1,000.00 | 1,006.98 | 2.34 | .47 | ||||||||||||
| Class F-2 - assumed 5% return | 1,000.00 | 1,022.46 | 2.36 | .47 | ||||||||||||
| Class F-3 - actual return | 1,000.00 | 1,007.49 | 1.84 | .37 | ||||||||||||
| Class F-3 - assumed 5% return | 1,000.00 | 1,022.96 | 1.86 | .37 | ||||||||||||
| * | The “expenses paid during period” are equal to the “annualized expense ratio,” multiplied by the average account value over the period, multiplied by the number of days in the period, and divided by 365 (to reflect the one-half year period). |
| American Funds Tax-Exempt Funds | 89 |
Tax information |
unaudited |
We are required to advise you of the federal tax status of certain distributions received by shareholders during the fiscal year. The funds hereby designate the following amounts for the funds’ fiscal year ended July 31, 2018:
| Fund | Exempt interest dividends | |||
| American Funds Short-Term Tax-Exempt Bond Fund | 100 | % | ||
| Limited Term Tax-Exempt Bond Fund of America | 100 | |||
| The Tax-Exempt Bond Fund of America | 100 | |||
| American High-Income Municipal Bond Fund | 100 | |||
| The Tax-Exempt Fund of California | 100 | |||
| American Funds Tax-Exempt Fund of New York | 100 | |||
Individual shareholders should refer to their Form 1099 or other tax information, which will be mailed in January 2019, to determine the calendar year amounts to be included on their 2018 tax returns. Shareholders should consult their tax advisors.
| 90 | American Funds Tax-Exempt Funds |
Approval of Investment Advisory and Service Agreement
American Funds Short-Term Tax-Exempt Bond Fund, Limited Term Tax-Exempt Bond Fund of America, The Tax-Exempt Bond Fund of America, American High-Income Municipal Bond Fund, The Tax-Exempt Fund of California, American Funds Tax-Exempt Fund of New York
The boards of American Funds Short-Term Tax-Exempt Bond Fund, Limited Term Tax-Exempt Bond Fund of America, The Tax-Exempt Bond Fund of America, American High-Income Municipal Bond Fund, The Tax-Exempt Fund of California and American Funds Tax-Exempt Fund of New York (the “board”) have approved each fund’s Investment Advisory and Service Agreement (the “agreement”) with Capital Research and Management Company (“CRMC”) for an additional one-year term through April 30, 2019. The agreement for The Tax-Exempt Bond Fund of America was amended to add additional advisory fee breakpoints if and when the fund’s net assets exceed $15 billion and $21 billion, and the agreement for American High-Income Municipal Bond Fund was amended to add an additional advisory fee breakpoint if and when the fund’s net assets exceed $6 billion. The board approved the agreement following the recommendation of each fund’s Contracts Committee (the “committee”), which is composed of each fund’s independent board members. The board and the committee determined in the exercise of their business judgment that each fund’s advisory fee structure was fair and reasonable in relation to the services provided, and that approving the agreement was in the best interests of each fund and its shareholders.
In reaching this decision, the board and the committee took into account information furnished to them throughout the year and otherwise provided to them, as well as information prepared specifically in connection with their review of the agreements, and were advised by their independent counsel. They considered the following factors, among others, but did not identify any single issue or particular piece of information that, in isolation, was the controlling factor, and each board and committee member did not necessarily attribute the same weight to each factor.
1. Nature, extent and quality of services
The board and the committee considered the depth and quality of CRMC’s investment management process, including its global research capabilities; the experience, capability and integrity of its senior management and other personnel; the low turnover rates of its key personnel; the overall financial strength and stability of CRMC and the Capital Group organization; the resources and systems CRMC devotes to investment management, compliance, trading, portfolio accounting and other services; and the ongoing evolution of CRMC’s organizational structure designed to maintain and strengthen these qualities. The board and the committee also considered the nature, extent and quality of administrative, compliance and shareholder services provided by CRMC to the funds under each fund’s agreement and other agreements, as well as the benefits to each fund’s shareholders from investing in a fund that is part of a large family of funds. The board and the committee concluded that the nature, extent and quality of the services provided by CRMC have benefited and should continue to benefit each fund and its shareholders.
| American Funds Tax-Exempt Funds | 91 |
Approval of Investment Advisory and Service Agreement (continued)
2. Investment results
The board and the committee considered the investment results of each fund in light of its objective. They compared each fund’s investment results with those of other relevant funds (including funds that currently form the basis of the Lipper index for the category in which the fund is included), and data such as relevant market and fund indexes, over various periods through October 31, 2017. This report, including the letter to shareholders and related disclosures, contains certain information about each fund’s investment results.
American Funds Short-Term Tax-Exempt Bond Fund seeks to provide current income that is exempt from regular federal income tax, consistent with the maturity and quality standards described in the prospectus, and to preserve capital. The board and the committee reviewed the fund’s investment results measured against the Lipper Short Municipal Debt Funds Average and the Bloomberg Barclays Municipal Short 1–5 Years Index. They noted the fund’s relatively short history and conversion from a municipal money market fund when reviewing the results for the one-year, three-year, five-year and lifetime periods. They noted that the investment results of the fund were mixed compared to the results of these indexes.
Limited Term Tax-Exempt Bond Fund of America seeks to provide current income that is exempt from regular federal income tax, consistent with the maturity and quality standards described in the prospectus, and to preserve capital. The board and the committee reviewed the fund’s investment results measured against the Lipper Short-Intermediate Municipal Debt Funds Average and the Bloomberg Barclays Municipal Short-Intermediate 1–10 Years Index. They reviewed the results for the one-year, three-year, five-year, 10-year, 15-year, 20-year and lifetime periods, placing greater emphasis on longer term periods. They noted that the investment results of the fund were mixed compared to the results of these indexes.
The Tax-Exempt Bond Fund of America seeks to provide a high level of current income exempt from federal income tax, consistent with the preservation of capital. The board and the committee reviewed the fund’s investment results measured against the Lipper General & Insured Municipal Debt Funds Average and the Bloomberg Barclays Municipal Bond Index. They reviewed the results for the one-year, three-year, five-year, 10-year, 15-year, 20-year and lifetime periods, placing greater emphasis on longer term periods. They noted that the investment results of the fund were mixed compared to the results of these indexes, though higher for the lifetime period.
American High-Income Municipal Bond Fund seeks to provide a high level of current income exempt from regular federal income tax. The board and the committee reviewed the fund’s investment results measured against the Lipper High Yield Municipal Debt Funds Average, the Bloomberg Barclays Municipal Bond Index and the Bloomberg Barclays High Yield Municipal Bond Index. They reviewed the results for the one-year, three-year, five-year, 10-year, 15-year, 20-year and lifetime periods, placing greater emphasis on longer term periods. They noted that the investment results of the fund generally compared favorably to the results of these indexes.
| 92 | American Funds Tax-Exempt Funds |
The Tax-Exempt Fund of California seeks to provide a high level of current income exempt from regular federal and California income taxes, with a secondary objective of preservation of capital. The board and the committee reviewed the fund’s investment results measured against the Lipper California Municipal Debt Funds Average and the Bloomberg Barclays California Municipal Index. They reviewed the results for the one-year, three-year, five-year, 10-year, 15-year, 20-year and lifetime periods, placing greater emphasis on longer term periods. They noted that the investment results of the fund were mixed compared to the results of these indexes, though higher for the lifetime period.
American Funds Tax-Exempt Fund of New York seeks to provide a high level of current income exempt from regular federal, New York state and New York City income taxes, with a secondary objective of preservation of capital. The board and the committee reviewed the fund’s investment results measured against the Lipper New York Municipal Debt Funds Average and the Bloomberg Barclays New York Municipal Index. They noted the fund’s relatively short history and reviewed the results for the one-year, three-year, five-year and lifetime periods. They noted that the investment results of the fund were mixed compared to the results of these indexes, though higher for the lifetime period.
The board and the committee concluded that each fund’s investment results have been satisfactory for renewal of the agreement, and that CRMC’s record in managing the funds indicated that its continued management should benefit the funds and their shareholders.
3. Advisory fees and total expenses
The board and the committee compared the advisory fees and total expense levels of each fund to those of other relevant funds. They observed that each fund’s advisory fees and expenses generally compared favorably to those of other similar funds included in their respective categories (with the exception of American Funds Short-Term Tax-Exempt Bond Fund’s advisory fees, which were in line with those of other similar funds included in its respective category, while expenses generally compared favorably to those of other funds in the category). The board and the committee also considered the breakpoint discounts in each fund’s advisory fee structure that reduce the level of fees charged by CRMC to the fund as fund assets increase, as well as CRMC’s agreement to additional breakpoints in the advisory fee schedule for TEBF and an additional breakpoint in the advisory fee schedule for AHIM. In addition, they reviewed information regarding the effective advisory fees charged to non-mutual fund clients by CRMC and its affiliates. They noted that, to the extent there were differences between the advisory fees paid by each fund and the advisory fees paid by those clients, the differences appropriately reflected the investment, operational, regulatory and market differences between advising the fund and the other clients. The board and the committee concluded that each fund’s cost structure was fair and reasonable in relation to the services provided, and that each fund’s shareholders receive reasonable value in return for the advisory fees and other amounts paid to CRMC by the funds.
| American Funds Tax-Exempt Funds | 93 |
Approval of Investment Advisory and Service Agreement (continued)
4. Ancillary benefits
The board and the committee considered a variety of other benefits that CRMC and its affiliates receive as a result of CRMC’s relationship with each fund and other American Funds, including fees for administrative services provided to certain share classes; fees paid to CRMC’s affiliated transfer agent; sales charges and distribution fees received and retained by the fund’s principal underwriter, an affiliate of CRMC; and possible ancillary benefits to CRMC and its institutional management affiliates in managing other investment vehicles. The board and the committee reviewed CRMC’s portfolio trading practices, noting the benefits CRMC receives from the research obtained with commissions from portfolio transactions made on behalf of the fund. The board and the committee took these ancillary benefits into account in evaluating the reasonableness of the advisory fees and other amounts paid to CRMC by each fund.
5. Adviser financial information
The board and the committee reviewed information regarding CRMC’s costs of providing services to the American Funds, including personnel, systems and resources of investment, compliance, trading, accounting and other administrative operations. They considered CRMC’s costs and related cost allocation methodology as well as its willingness to invest in technology, infrastructure and staff to maintain and expand services and capabilities, respond to industry and regulatory developments, and attract and retain qualified personnel. They noted information regarding the compensation structure for CRMC’s investment professionals. The board and the committee also compared CRMC’s profitability and compensation data to the reported results and data of several large, publicly held investment management companies. The board and the committee noted the competitiveness and cyclicality of both the mutual fund industry and the capital markets, and the importance in that environment of CRMC’s long-term profitability for maintaining its independence, company culture and management continuity. They further considered the breakpoint discounts in each fund’s advisory fee structure and CRMC’s sharing of any economies of scale, or efficiencies, through breakpoints and other fee reductions and costs voluntarily absorbed. The board and the committee concluded that each fund’s advisory fee structure reflected a reasonable sharing of benefits between CRMC and each fund’s shareholders.
| 94 | American Funds Tax-Exempt Funds |
Boards of trustees and other officers
Independent trustees1
| Name and year of birth | Year first elected a trustee of the fund2 |
Principal occupation(s) during past five years | Number of portfolios in fund complex overseen by trustee |
Other directorships3 held by trustee | |||||
| William H. Baribault, 1945 | STEX | 2010 | CEO and President, Richard Nixon Foundation; Chairman of the Board and CEO, Oakwood Enterprises (private investment and consulting) | 81 | General Finance Corporation | ||||
| LTEX | 2010 | ||||||||
| TEBF | 2010 | ||||||||
| AHIM | 2010 | ||||||||
| TEFCA | 2010 | ||||||||
| TEFNY | 2010 | ||||||||
| James G. Ellis, 1947 | STEX | 2009 | Dean and Professor of Marketing, Marshall School of Business, University of Southern California | 81 | Mercury General Corporation | ||||
| LTEX | 2006 | ||||||||
| TEBF | 2006 | ||||||||
| AHIM | 2006 | ||||||||
| TEFCA | 2006 | ||||||||
| TEFNY | 2010 | ||||||||
| Nariman Farvardin, PhD, 1956 | STEX | 2018 | President, Stevens Institute of Technology | 78 | None | ||||
| LTEX | 2018 | ||||||||
| TEBF | 2018 | ||||||||
| AHIM | 2018 | ||||||||
| TEFCA | 2018 | ||||||||
| TEFNY | 2018 | ||||||||
| Leonard R. Fuller, 1946 | STEX | 1995 | Private investor; former President and CEO, Fuller Consulting (financial management consulting) | 81 | None | ||||
| LTEX | 1994 | ||||||||
| TEBF | 1994 | ||||||||
| AHIM | 1994 | ||||||||
| TEFCA | 1994 | ||||||||
| TEFNY | 2010 | ||||||||
| Mary Davis Holt, 1950 | STEX | Principal, Mary Davis Holt Enterprises, LLC (leadership development consulting); former Partner, Flynn Heath Holt Leadership, LLC (leadership consulting); former COO, Time Life Inc. (1993–2003) | 78 | None | |||||
| 2015–2016; 2017 | |||||||||
| LTEX | |||||||||
| 2015–2016; 2017 | |||||||||
| TEBF | |||||||||
| 2015–2016; 2017 | |||||||||
| AHIM | |||||||||
| 2015–2016; 2017 | |||||||||
| TEFCA | |||||||||
| 2015–2016; 2017 | |||||||||
| TEFNY | |||||||||
| 2015–2016; 2017 | |||||||||
| R. Clark Hooper, 1946 Chairman of the Boards (Independent and Non- Executive) |
STEX | 2005 | Private investor | 81 | None | ||||
| LTEX | 2005 | ||||||||
| TEBF | 2005 | ||||||||
| AHIM | 2005 | ||||||||
| TEFCA | 2005 | ||||||||
| TEFNY | 2010 | ||||||||
| Merit E. Janow, 1958 | STEX | 2010 | Dean and Professor, Columbia University, School of International and Public Affairs | 80 | MasterCard Incorporated; Trimble Inc. | ||||
| LTEX | 2010 | ||||||||
| TEBF | 2010 | ||||||||
| AHIM | 2010 | ||||||||
| TEFCA | 2010 | ||||||||
| TEFNY | 2010 | ||||||||
See page 98 for footnotes.
| American Funds Tax-Exempt Funds | 95 |
Independent trustees1 (continued)
| Name and year of birth | Year first elected a trustee of the fund2 |
Principal occupation(s) during past five years | Number of portfolios in fund complex overseen by trustee |
Other directorships3 held by trustee | |||||
| Laurel B. Mitchell, PhD, 1955 | STEX | 2009 | Chair, California Jump$tart Coalition for Personal Financial Literacy; part-time faculty, Pomona College; Professor Emerita, University of Redlands; former Distinguished Professor of Accounting, University of Redlands; former Director, Accounting Program, University of Redlands |
77 | None | ||||
| LTEX | 2010 | ||||||||
| TEBF | 2010 | ||||||||
| AHIM | 2010 | ||||||||
| TEFCA | 2009 | ||||||||
| TEFNY | 2010 | ||||||||
| Frank M. Sanchez, 1943 | STEX | 1999 | Principal, The Sanchez Family Corporation dba McDonald’s Restaurants (McDonald’s licensee) | 77 | None | ||||
| LTEX | 1999 | ||||||||
| TEBF | 1999 | ||||||||
| AHIM | 1999 | ||||||||
| TEFCA | 1999 | ||||||||
| TEFNY | 2010 | ||||||||
| Margaret Spellings, 1957 | STEX | 2009 | President, The University of North Carolina; former President, George W. Bush Foundation; former President and CEO, Margaret Spellings & Company (public policy and strategic consulting); former President, U.S. Chamber Foundation and Senior Advisor to the President and CEO, U.S. Chamber of Commerce |
82 | None | ||||
| LTEX | 2010 | ||||||||
| TEBF | 2010 | ||||||||
| AHIM | 2010 | ||||||||
| TEFCA | 2010 | ||||||||
| TEFNY | 2010 | ||||||||
| Alexandra Trower, 1964 | AHIM | 2018 | Executive Vice President, Global Communications and Corporate Officer, The Estée Lauder Companies | 68 | None | ||||
| TEFNY | 2018 | ||||||||
Interested trustees4,5
| Name,
year of birth and position with fund |
Year
first elected a trustee or officer of the fund2 |
Principal
occupation(s) during past five years and positions held with affiliated entities or the principal underwriter of the fund |
Number
of portfolios in fund complex overseen by trustee |
Other
directorships3 held by trustee | |||||
| Karl J. Zeile, 1966 President and Trustee: TEBF Senior Vice President and Trustee: LTEX, AHIM, TEFCA, TEFNY Trustee: STEX |
STEX | 2011 | Partner – Capital Fixed Income Investors, Capital
Research and Management Company; Director, The Capital Group Companies, Inc. |
7 | None | ||||
| LTEX | 2004 | ||||||||
| TEBF | 2009 | ||||||||
| AHIM | 2008 | ||||||||
| TEFCA | 2009 | ||||||||
| TEFNY | 2010 | ||||||||
| Michael C. Gitlin, 1970 | STEX | 2015 | Partner – Capital Fixed Income Investors, Capital Research and Management Company; Director, The Capital Group Companies, Inc.;6 served as Head of Fixed Income at a large investment management firm prior to joining Capital Research and Management Company in 2015 | 19 | None | ||||
| LTEX | 2015 | ||||||||
| TEBF | 2015 | ||||||||
| AHIM | 2015 | ||||||||
| TEFCA | 2015 | ||||||||
| TEFNY | 2015 | ||||||||
The funds’ statement of additional information includes further details about fund trustees and is available without charge upon request by calling American Funds Service Company at (800) 421-4225 or by visiting the American Funds website at americanfunds.com. The address for all trustees and officers of the funds is 333 South Hope Street, Los Angeles, CA 90071, Attention: Secretary.
| STEX | American Funds Short-Term Tax-Exempt Bond Fund |
| LTEX | Limited Term Tax-Exempt Bond Fund of America |
| TEBF | The Tax-Exempt Bond Fund of America |
| AHIM | American High-Income Municipal Bond Fund |
| TEFCA | The Tax-Exempt Fund of California |
| TEFNY | American Funds Tax-Exempt Fund of New York |
| 96 | American Funds Tax-Exempt Funds |
Other officers5
| Name, year of birth and position with fund |
Year
first elected an officer of the fund2 |
Principal occupation(s)
during past five years and positions held with affiliated entities or the principal underwriter of the fund | |||
| Neil L. Langberg, 1953 President: STEX, LTEX, TEFCA Senior Vice President: TEBF, AHIM |
STEX | 1989 | Partner — Capital Fixed Income Investors, Capital Research and Management Company | ||
| LTEX | 1993 | ||||
| TEBF | 1985 | ||||
| AHIM | 1994 | ||||
| TEFCA | 1986 | ||||
| Chad M. Rach, 1972 President: AHIM Senior Vice President: TEBF |
AHIM | 2015 | Partner — Capital Fixed Income Investors, Capital Research and Management Company | ||
| TEBF | 2016 | ||||
| Jerome H. Solomon, 1963 President: TEFNY Senior Vice President: AHIM |
TEFNY | 2011 | Partner — Capital Fixed Income Investors, Capital Research and Management Company | ||
| AHIM | 2017 | ||||
| Kristine M. Nishiyama, 1970 Executive Vice President |
STEX | 2003 | Senior Vice President and Senior Counsel — Fund Business Management Group, Capital Research and Management Company; Senior Vice President and General Counsel, Capital Bank and Trust Company6 | ||
| LTEX | 2003 | ||||
| TEBF | 2003 | ||||
| AHIM | 2003 | ||||
| TEFCA | 2003 | ||||
| TEFNY | 2010 | ||||
| Aaron M. Applebaum, 1979 Vice President |
STEX | 2016 | Partner — Capital Fixed Income Investors, Capital Research and Management Company | ||
| LTEX | 2016 | ||||
| Steven I. Koszalka, 1964 Secretary |
STEX | 2010 | Vice President — Fund Business Management Group, Capital Research and Management Company | ||
| LTEX | 2010 | ||||
| TEBF | 2010 | ||||
| AHIM | 2010 | ||||
| TEFCA | 2010 | ||||
| TEFNY | 2010 | ||||
| Brian C. Janssen, 1972 Treasurer |
STEX | 2015 | Vice President — Investment Operations, Capital Research and Management Company | ||
| LTEX | 2015 | ||||
| TEBF | 2012 | ||||
| AHIM | 2015 | ||||
| TEFCA | 2012 | ||||
| TEFNY | 2012 | ||||
| Jane Y. Chung, 1974 Assistant Secretary |
STEX | 2014 | Associate — Fund Business Management Group, Capital Research and Management Company | ||
| LTEX | 2014 | ||||
| TEBF | 2014 | ||||
| AHIM | 2014 | ||||
| TEFCA | 2014 | ||||
| TEFNY | 2014 | ||||
| Dori Laskin, 1951 Assistant Treasurer |
STEX | 2010 | Vice President — Investment Operations, Capital Research and Management Company | ||
| LTEX | 2010 | ||||
| TEBF | 2010 | ||||
| AHIM | 2010 | ||||
| TEFCA | 2010 | ||||
| TEFNY | 2010 | ||||
| Gregory F. Niland, 1971 Assistant Treasurer |
STEX | 2015 | Vice President — Investment Operations, Capital Research and Management Company | ||
| LTEX | 2015 | ||||
| TEBF | 2015 | ||||
| AHIM | 2015 | ||||
| TEFCA | 2015 | ||||
| TEFNY | 2015 | ||||
See page 98 for footnotes.
| American Funds Tax-Exempt Funds | 97 |
| 1 | The term independent trustee refers to a trustee who is not an “interested person” of the funds within the meaning of the Investment Company Act of 1940. |
| 2 | Includes service as a director/trustee or officer of the fund’s predecessor, The Tax-Exempt Bond Fund of America, Inc. or American High-Income Municipal Bond Fund, Inc., each a Maryland corporation, or Limited Term Tax-Exempt Bond Fund of America or The Tax-Exempt Fund of California, each a Massachusetts business trust. Trustees and officers of the funds serve until their resignation, removal or retirement. |
| 3 | This includes all directorships/trusteeships (other than those in the American Funds or other funds managed by Capital Research and Management Company or its affiliates) that are held by each trustee as a trustee or director of a public company or a registered investment company. |
| 4 | The term interested trustee refers to a trustee who is an “interested person” within the meaning of the Investment Company Act of 1940, on the basis of their current or former affiliation with the funds’ investment adviser, Capital Research and Management Company, or affiliated entities (including the funds’ principal underwriter). |
| 5 | All of the trustees and/or officers listed are officers and/or directors/trustees of one or more of the other funds for which Capital Research and Management Company serves as investment adviser. |
| 6 | Company affiliated with Capital Research and Management Company. |
| 98 | American Funds Tax-Exempt Funds |
This page was intentionally left blank.
| American Funds Tax-Exempt Funds | 99 |
Offices of the funds and of the investment adviser
Capital Research and Management Company
333 South Hope Street
Los Angeles, CA 90071-1406
6455 Irvine Center Drive
Irvine, CA 92618-4518
Transfer agent for shareholder accounts
American Funds Service Company
(Write to the address near you.)
P.O. Box 6007
Indianapolis, IN 46206-6007
P.O. Box 2280
Norfolk, VA 23501-2280
Counsel
Morgan, Lewis & Bockius LLP
300 South Grand Avenue, 22nd floor
Los Angeles, CA 90071-3132
Custodians of assets
Bank of New York Mellon
One Wall Street
New York, NY 10286
JPMorgan Chase Bank
270 Park Avenue
New York, NY 10017-2070
Independent registered public accounting firm
PricewaterhouseCoopers LLP
601 South Figueroa Street
Los Angeles, CA 90017-3874
Principal underwriter
American Funds Distributors, Inc.
333 South Hope Street
Los Angeles, CA 90071-1406
| 100 | American Funds Tax-Exempt Funds |
Investors should carefully consider investment objectives, risks, charges and expenses. This and other important information is contained in the funds’ prospectus and summary prospectus, which can be obtained from your financial professional and should be read carefully before investing. You may also call American Funds Service Company (AFS) at (800) 421-4225 or visit the American Funds website at americanfunds.com. Fund shares offered through American Funds Distributors, Inc.
“American Funds Proxy Voting Procedures and Principles” — which describes how we vote proxies relating to portfolio securities — is available on the American Funds website or upon request by calling AFS. Each fund files its proxy voting record with the U.S. Securities and Exchange Commission (SEC) for the 12 months ended June 30 by August 31. The proxy voting record is available free of charge on the SEC website at sec.gov and on the American Funds website.
Complete July 31, 2018, portfolios of American Funds Short-Term Tax-Exempt Bond Fund, Limited Term Tax-Exempt Bond Fund of America, The Tax-Exempt Bond Fund of America, American High-Income Municipal Bond Fund, The Tax-Exempt Fund of California and American Funds Tax-Exempt Fund of New York’s investments are available free of charge by calling AFS or visiting the SEC website (where they are part of Form N-CSR).
Each fund files a complete list of its portfolio holdings with the SEC for the first and third quarters of each fiscal year on Form N-Q. This filing is available free of charge on the SEC website. You may also review or, for a fee, copy this filing at the SEC’s Public Reference Room in Washington, D.C. Additional information regarding the operation of the Public Reference Room may be obtained by calling the SEC’s Office of Investor Education and Advocacy at (800) SEC-0330. Additionally, the list of portfolio holdings is available by calling AFS.
This report is for the information of shareholders of American Funds Short-Term Tax-Exempt Bond Fund, Limited Term Tax-Exempt Bond Fund of America, The Tax-Exempt Bond Fund of America, American High-Income Municipal Bond Fund, The Tax-Exempt Fund of California and American Funds Tax-Exempt Fund of New York, but it also may be used as sales literature when preceded or accompanied by the current prospectus or summary prospectus, which gives details about charges, expenses, investment objectives and operating policies of the funds. If used as sales material after September 30, 2018, this report must be accompanied by an American Funds statistical update for the most recently completed calendar quarter.
Bloomberg® is a trademark of Bloomberg Finance L.P. (collectively with its affiliates, “Bloomberg”). Barclays® is a trademark of Barclays Bank Plc (collectively with its affiliates, “Barclays”), used under license. Neither Bloomberg nor Barclays approves or endorses this material, guarantees the accuracy or completeness of any information herein and, to the maximum extent allowed by law, neither shall have any liability or responsibility for injury or damages arising in connection therewith.
The Capital Advantage®
Since 1931, American Funds® by Capital Group has helped investors pursue long-term investment success. Our consistent approach — in combination with The Capital SystemSM — has resulted in a superior long-term track record.
| Aligned with investor success | |
| We base our decisions on a long-term perspective, which we believe aligns our goals with the interests of our clients. Our portfolio managers average 27 years of investment experience, including 22 years at our company, reflecting a career commitment to our long-term approach.1 | |
| The Capital System | |
| The Capital System combines individual accountability with teamwork. Funds using The Capital System are divided into portions that are managed independently by investment professionals with diverse backgrounds, ages and investment approaches. An extensive global research effort is the backbone of our system. | |
| American Funds’ superior long-term track record | |
| Equity funds have beaten their Lipper peer indexes in 92% of 10-year periods and 99% of 20-year periods. Fixed income funds have beaten their Lipper indexes in 77% of 10-year periods and 80% of 20-year periods.2 Fund management fees have been among the lowest in the industry.3 |
| 1 | Portfolio manager experience as of December 31, 2017. | |
| 2 | Based on Class F-2 share results for rolling periods through December 31, 2017. Periods covered are the shorter of the fund’s lifetime or since the comparable Lipper index inception date (except Capital Income Builder and SMALLCAP World Fund, for which the Lipper average was used). Expenses differ for each share class, so results will vary. Class F-2 shares were first offered on August 1, 2008. Class F-2 share results prior to the date of first sale are hypothetical based on Class A share results without a sales charge, adjusted for typical estimated expenses. Results for certain funds with an inception date after August 1, 2008, also include hypothetical returns because those funds’ Class F-2 shares sold after the funds’ date of first offering. Please see americanfunds.com for more information on specific expense adjustments and the actual dates of first sale. | |
| 3 | On average, our management fees were in the lowest quintile 71% of the time, based on the 20-year period ended December 31, 2017, versus comparable Lipper categories, excluding funds of funds. |

ITEM 2 – Code of Ethics
The Registrant has adopted a Code of Ethics that applies to its Principal Executive Officer and Principal Financial Officer. The Registrant undertakes to provide to any person without charge, upon request, a copy of the Code of Ethics. Such request can be made by calling 800/421-4225 or to the Secretary of the Registrant, 333 South Hope Street, Los Angeles, California 90071.
ITEM 3 – Audit Committee Financial Expert
The Registrant’s board has determined that Laurel B. Mitchell, a member of the Registrant’s audit committee, is an “audit committee financial expert” and "independent," as such terms are defined in this Item. This designation will not increase the designee’s duties, obligations or liability as compared to his or her duties, obligations and liability as a member of the audit committee and of the board, nor will it reduce the responsibility of the other audit committee members. There may be other individuals who, through education or experience, would qualify as "audit committee financial experts" if the board had designated them as such. Most importantly, the board believes each member of the audit committee contributes significantly to the effective oversight of the Registrant’s financial statements and condition.
| ITEM 4 – Principal Accountant Fees and Services | STEX | |
| Registrant: | ||
| a) Audit Fees: | ||
| 2017 | $63,000 | |
| 2018 | $42,000 | |
| b) Audit-Related Fees: | ||
| 2017 | None | |
| 2018 | None | |
| c) Tax Fees: | ||
| 2017 | $7,000 | |
| 2018 | $7,000 | |
| The tax fees consist of professional services relating to the preparation of the Registrant’s tax returns. | ||
| d) All Other Fees: | ||
| 2017 | None | |
| 2018 | None | |
| Adviser and affiliates (includes only fees for non-audit services billed to the adviser and affiliates for engagements that relate directly to the operations and financial reporting of the Registrant and were subject to the pre-approval policies described below): | ||
| a) Audit Fees: | ||
| Not Applicable | ||
| b) Audit-Related Fees: | ||
| 2017 | None | |
| 2018 | None | |
| The audit-related fees consist of assurance and related services relating to the examination of the Registrant’s transfer agent, principal underwriter and investment adviser conducted in accordance with Statement on Standards for Attestation Engagements Number 16 issued by the American Institute of Certified Public Accountants. | ||
| c) Tax Fees: | ||
| 2017 | None | |
| 2018 | None | |
| The tax fees consist of consulting services relating to the Registrant’s investments. | ||
| d) All Other Fees: | ||
| 2017 | None | |
| 2018 | None | |
| The other fees consist of subscription services related to an accounting research tool. | ||
| All audit and permissible non-audit services that the Registrant’s audit committee considers compatible with maintaining the independent registered public accounting firm’s independence are required to be pre-approved by the committee. The pre-approval requirement will extend to all non-audit services provided to the Registrant, the investment adviser, and any entity controlling, controlled by, or under common control with the investment adviser that provides ongoing services to the Registrant, if the engagement relates directly to the operations and financial reporting of the Registrant. The committee will not delegate its responsibility to pre-approve these services to the investment adviser. The committee may delegate to one or more committee members the authority to review and pre-approve audit and permissible non-audit services. Actions taken under any such delegation will be reported to the full committee at its next meeting. The pre-approval requirement is waived with respect to non-audit services if certain conditions are met. The pre-approval requirement was not waived for any of the non-audit services listed above provided to the Registrant, adviser and affiliates. | ||
| Aggregate non-audit fees paid to the Registrant’s auditors, including fees for all services billed to the Registrant, adviser and affiliates that provide ongoing services to the Registrant, were $63,000 for fiscal year 2017 and $42,000 for fiscal year 2018. The non-audit services represented by these amounts were brought to the attention of the committee and considered to be compatible with maintaining the auditors’ independence. | ||
ITEM 5 – Audit Committee of Listed Registrants
Not applicable to this Registrant, insofar as the Registrant is not a listed issuer as defined in Rule 10A-3 under the Securities Exchange Act of 1934.
ITEM 6 – Schedule of Investments

| Bonds, notes & other debt instruments 89.79% Alabama 2.21% | Principal amount (000) | Value (000) |
| 21st Century Auth., Tobacco Settlement Rev. Ref. Bonds, Series 2012-A, 5.00% 2019 | $3,600 | $3,694 |
| Black Belt Energy Gas Dist., Gas Supply Rev. Bonds, Series 2016-A, 4.00% 2046 (put 2021) | 7,500 | 7,826 |
| Federal Aid Highway Fin. Auth., Federal Highway Grant Anticipation Bonds, Series 2012, 5.00% 2018 | 3,315 | 3,324 |
| County of Jefferson, Limited Obligation Rev. Ref. Bonds, Series 2017, 5.00% 2019 | 1,875 | 1,948 |
| County of Jefferson, Limited Obligation Rev. Ref. Bonds, Series 2017, 5.00% 2022 | 1,000 | 1,111 |
| County of Jefferson, Limited Obligation Rev. Ref. Bonds, Series 2017, 5.00% 2023 | 1,500 | 1,692 |
| City of Mobile, Industrial Dev. Board, Pollution Control Rev. Bonds (Alabama Power Company Barry Plant Project), Series 2008, 1.625% 2034 (put 2018) | 2,000 | 2,000 |
| 21,595 | ||
| Alaska 0.10% | ||
| Housing Fin. Corp., General Mortgage Rev. Bonds, Series 2016-A, 3.50% 2046 | 890 | 918 |
| Housing Fin. Corp., Home Mortgage Rev. Ref. Bonds, Series 2012-A, 4.00% 2040 | 55 | 55 |
| 973 | ||
| Arizona 0.59% | ||
| County of Coconino, Pollution Control Corp., Pollution Control Rev. Ref. Bonds, Series 2017-A, AMT, 1.80% 2032 | 1,000 | 994 |
| County of Maricopa, Industrial Dev. Auth., Rev. Bonds (Banner Health), Series 2017-B, 5.00% 2048 (put 2022) | 2,000 | 2,231 |
| McAllister Academic Village LLC, Rev. Ref. Bonds (Arizona State University Hassayampa Academic Village Project), Series 2016, 5.00% 2022 | 400 | 444 |
| City of Phoenix, Civic Improvement Corp., Wastewater System Rev. Ref. Bonds, Series 2016, 5.00% 2019 | 1,000 | 1,032 |
| School Facs. Board, Certs. of Part., Series 2015-A, 5.00% 2021 | 1,000 | 1,093 |
| 5,794 | ||
| California 6.14% | ||
| Bay Area Toll Auth., San Francisco Bay Area Toll Bridge Rev. Bonds, Series 2006-C-1, (SIFMA Municipal Swap Index + 0.90%) 1.84% 2045 (put 2023)1 | 6,600 | 6,720 |
| Bay Area Toll Auth., San Francisco Bay Area Toll Bridge Rev. Bonds, Series 2007-E-3, (SIFMA Municipal Swap Index + 0.70%) 1.64% 2047 (put 2019)1 | 3,000 | 3,010 |
| Bay Area Toll Auth., San Francisco Bay Area Toll Bridge Rev. Bonds, Series 2008-A-1, (SIFMA Municipal Swap Index + 0.90%) 1.84% 2045 (put 2023)1 | 1,250 | 1,273 |
| Bay Area Toll Auth., San Francisco Bay Area Toll Bridge Rev. Bonds, Series 2014-G, (SIFMA Municipal Swap Index + 0.60%) 1.54% 2034 (put 2020)1 | 2,000 | 2,011 |
| Bay Area Toll Auth., San Francisco Bay Area Toll Bridge Rev. Bonds, Series 2017-D, (3-month USD-LIBOR x 0.70 + 0.55%) 2.186% 2045 (put 2021)1 | 500 | 504 |
| Trustees of the California State University, Systemwide Rev. Bonds, Series 2016-B-3, 4.00% 2051 (put 2023) | 1,500 | 1,636 |
| City of Chino, Public Fncg. Auth., Local Agcy. Rev. Ref. Bonds, Series 2015-A, Assured Guaranty Municipal insured, 2.50% 2018 | 1,495 | 1,496 |
| Various Purpose G.O. Bonds, Series 2013-D, (SIFMA Municipal Swap Index + 0.29%) 1.23% 2028 (put 2020)1 | 2,200 | 2,201 |
| Various Purpose G.O. Bonds, Series 2016-B, (1-month USD-LIBOR x 0.70 + 0.76%) 2.224% 2031 (put 2021)1 | 1,500 | 1,519 |
| Golden State Tobacco Securitization Corp., Enhanced Tobacco Settlement Asset-Backed Bonds, Series 2013-A, 5.00% 2019 | 2,000 | 2,059 |
| Health Facs. Fncg. Auth., Rev. Green Bonds (Kaiser Permanente), Series 2017-C, 5.00% 2031 (put 2022) | 2,000 | 2,252 |
| Health Facs. Fncg. Auth., Rev. Ref. Bonds (St. Joseph Health System), Series 2013-D, 5.00% 2043 (put 2020) | 1,500 | 1,606 |
| Infrastructure and Econ. Dev. Bank, Rev. Ref. Bonds (J. Paul Getty Trust), Series 2011-A-4, (3-month USD-LIBOR x 0.70 + 0.37%) 2.006% 2038 (put 2020)1 | 1,500 | 1,506 |
| Bonds, notes & other debt instruments California (continued) | Principal amount (000) | Value (000) |
| Infrastructure and Econ. Dev. Bank, Rev. Ref. Bonds (J. Paul Getty Trust), Series 2013-A-2, (1-month USD-LIBOR x 0.70 + 0.50%) 1.95% 2047 (put 2019)1 | $3,500 | $3,506 |
| Infrastructure and Econ. Dev. Bank, Rev. Ref. Bonds (Pacific Gas and Electric Company), Series 2008-F, 1.75% 2026 (put 2022) | 6,070 | 5,766 |
| City of Lancaster, Successor Agcy. to the Redev. Agcy., Redev. Project Area Nos. 5 and 6 (School Dist. Pass-Throughs), Tax Allocation Rev. Ref. Bonds, Taxable Series 2016-B-2, Assured Guaranty Municipal insured, 3.00% 2019 | 435 | 438 |
| City of Los Angeles, Dept. of Airports, Los Angeles International Airport, Rev. Bonds, Series 2016-B, AMT, 5.00% 2022 | 2,000 | 2,212 |
| City of Los Angeles, Dept. of Airports, Los Angeles International Airport, Rev. Bonds, Series 2016-B, AMT, 5.00% 2023 | 2,500 | 2,817 |
| City of Los Angeles, Multi Family Housing Rev. Bonds (Jordan Downs Phase 1B Apartments), Series 2018-A-2, 2.08% 2022 (put 2021) | 450 | 451 |
| City of Oakland, Successor Agcy. to the Redev. Agcy., Tax Allocation Rev. Ref. Bonds (Central Dist. Redev. Project), Series 2013, 5.00% 2018 | 1,085 | 1,088 |
| City of Oakland, Successor Agcy. to the Redev. Agcy., Tax Allocation Rev. Ref. Bonds (Central Dist. Redev. Project), Series 2013, 5.00% 2019 | 1,000 | 1,037 |
| Port of Oakland, Rev. Ref. Bonds, Series 2017-D, AMT, 5.00% 2022 | 2,000 | 2,232 |
| City of Riverside, Rev. Ref. Water Bonds, Series 2011-A, (SIFMA Municipal Swap Index + 0.15%) 1.57% 2035 (put 2020)1 | 2,400 | 2,400 |
| City of San Jose, Airport Rev. Ref. Bonds, Series 2017-A, AMT, 5.00% 2021 | 1,295 | 1,393 |
| City of San Jose, Airport Rev. Ref. Bonds, Series 2017-A, AMT, 5.00% 2022 | 1,000 | 1,098 |
| County of Santa Cruz, Successor Agcy. to the Redev. Agcy., Tax Allocation Rev. Ref. Bonds, Series 2014, BAM insured, 5.00% 2018 | 300 | 301 |
| Statewide Communities Dev. Auth., Pollution Control Rev. Ref. Bonds (Southern California Edison Company), Series 2006-D, 2.625% 2033 (put 2023) | 2,000 | 2,015 |
| Statewide Communities Dev. Auth., Rev. Bonds (Hebrew Home for Aged Disabled), Series 2016, 3.50% 2021 | 3,350 | 3,417 |
| Temecula Valley Unified School Dist., Fncg. Auth. 2015 Special Tax Rev. Bonds, Series 2015, BAM insured, 5.00% 2019 | 375 | 387 |
| Dept. of Veterans Affairs, Home Purchase Rev. Bonds, Series 2016-B, 3.50% 2045 | 1,325 | 1,369 |
| Dept. of Veterans Affairs, Veterans G.O. Rev. Ref. Bonds, Series 2015-CM, AMT, 2.45% 2031 | 340 | 340 |
| 60,060 | ||
| Colorado 1.24% | ||
| City and County of Denver, Airport System Rev. Bonds, Series 2013-A, AMT, 5.00% 2020 | 1,000 | 1,070 |
| City and County of Denver, Dept. of Aviation (Denver International Airport), Rev. Bonds, Series 2016-B, (1-month USD-LIBOR x 0.70 + 0.86%) 2.324% 2031 (put 2019)1 | 1,810 | 1,816 |
| E-470 Public Highway Auth., Rev. Bonds, Series 2017-A, (1-month USD-LIBOR x 0.67 + 0.90%) 2.282% 2039 (put 2019)1 | 2,300 | 2,307 |
| Health Facs. Auth., Hospital Rev. Bonds (Adventist Health System/Sunbelt Obligated Group), Series 2016-C, 5.00% 2036 (put 2023) | 2,000 | 2,267 |
| Housing and Fin. Auth., Single Family Mortgage Bonds, Series 2017-C, Class I, 4.00% 2048 | 1,950 | 2,049 |
| Housing and Fin. Auth., Single Family Mortgage Bonds, Series 2018-B-1, Class I, 4.00% 2048 | 1,500 | 1,583 |
| Housing and Fin. Auth., Single Family Mortgage Bonds, Series 2018-C, Class I, 4.25% 2048 | 960 | 1,026 |
| 12,118 | ||
| Connecticut 1.91% | ||
| Health and Educational Facs. Auth., Rev. Bonds (Ascension Health Senior Credit Group), Series 1999-B, 1.65% 2029 (put 2019) | 1,410 | 1,409 |
| Health and Educational Facs. Auth., Rev. Bonds (Quinnipiac University Issue), Series 2016-M, 5.00% 2022 | 750 | 826 |
| Health and Educational Facs. Auth., Rev. Bonds (Yale University Issue), Series 2014-A, 1.30% 2048 (put 2020) | 3,000 | 2,986 |
| Housing Fin. Auth., Housing Mortgage Fin. Program Rev. Ref. Bonds, Series 2014-D-1, 4.00% 2044 | 1,715 | 1,770 |
| Housing Fin. Auth., Housing Mortgage Fin. Program Bonds, Series 2014-C-1, 4.00% 2044 | 640 | 665 |
| Housing Fin. Auth., Housing Mortgage Fin. Program Bonds, Series 2016-A-1, 4.00% 2045 | 1,120 | 1,168 |
| Housing Fin. Auth., Housing Mortgage Fin. Program Bonds, Series 2016-E-1, 3.50% 2046 | 1,120 | 1,156 |
| Bonds, notes & other debt instruments Connecticut (continued) | Principal amount (000) | Value (000) |
| Housing Fin. Auth., Housing Mortgage Fin. Program Bonds, Series 2017-C-1, 4.00% 2047 | $1,910 | $2,006 |
| Housing Fin. Auth., Housing Mortgage Fin. Program Bonds, Series 2017-D, 4.00% 2047 | 690 | 726 |
| Housing Fin. Auth., Housing Mortgage Fin. Program Rev. Ref. Bonds, Series 2012-F-2, AMT, 2.75% 2035 | 375 | 378 |
| Housing Fin. Auth., Housing Mortgage Fin. Program Rev. Ref. Bonds, Series 2015-A, 3.50% 2044 | 2,460 | 2,525 |
| Housing Fin. Auth., Housing Mortgage Fin. Program Rev. Ref. Bonds, Series 2015-C-1, 3.50% 2045 | 1,545 | 1,589 |
| Special Tax Obligation Bonds, Transportation Infrastructure Purposes, Series 2008-A, 5.00% 2027 (preref. 2018) | 1,500 | 1,514 |
| 18,718 | ||
| District of Columbia 0.05% | ||
| Water and Sewer Auth., Public Utility Rev. Bonds, Series 2016-A, 5.00% 2019 | 500 | 520 |
| Florida 3.10% | ||
| County of Broward, Airport System Rev. Bonds, Series 2017, AMT, 5.00% 2020 | 1,000 | 1,066 |
| County of Broward, Airport System Rev. Bonds, Series 2017, AMT, 5.00% 2023 | 1,100 | 1,243 |
| County of Broward, Airport System Rev. Ref. Bonds, Series 2015-A, AMT, 5.00% 2021 | 1,000 | 1,089 |
| City of Cape Coral, Utility Improvement Rev. Ref. Assessment Bonds (Various Areas), Series 2017, Assured Guaranty Municipal insured, 1.40% 2018 | 495 | 495 |
| City of Cape Coral, Utility Improvement Rev. Ref. Assessment Bonds (Various Areas), Series 2017, Assured Guaranty Municipal insured, 1.65% 2019 | 1,135 | 1,134 |
| Citizens Property Insurance Corp., Coastal Account Secured Bonds, Series 2011-A-1, 5.00% 2019 | 1,660 | 1,707 |
| Citizens Property Insurance Corp., Personal Lines Account/Commercial Lines Account Senior Secured Bonds, Series 2012-A-1, 5.00% 2019 | 7,450 | 7,660 |
| Housing Fin. Corp., Homeowner Mortgage Rev. Bonds (Special Program), Series 2015-A, 3.50% 2046 | 705 | 723 |
| Housing Fin. Corp., Homeowner Mortgage Rev. Bonds, Series 2011-C, 4.50% 2030 | 290 | 297 |
| Housing Fin. Corp., Homeowner Mortgage Rev. Bonds, Series 2017-1, 4.00% 2048 | 1,960 | 2,070 |
| Housing Fin. Corp., Homeowner Mortgage Rev. Ref. Bonds, Series 2011-1, AMT, 5.00% 2041 | 240 | 247 |
| Housing Fin. Corp., Multi Family Mortgage Rev. Bonds (Lake Mangonia Apartments), Series 2018-B, 1.75% 2019 | 850 | 852 |
| JEA, Electric System Rev. Bonds, Series 2012-B, 5.00% 2026 (preref. 2021) | 4,650 | 5,093 |
| JEA, Water and Sewer System Rev. Bonds, Series 2017-A, 5.00% 2021 | 1,240 | 1,363 |
| City of Lakeland, Energy System Rev. Ref. Bonds, Series 2016, 5.00% 2019 | 900 | 934 |
| County of Miami-Dade, Expressway Auth., Toll System Rev. Ref. Bonds, Series 2013-A, 5.00% 2019 | 1,000 | 1,031 |
| County of Miami-Dade, Expressway Auth., Toll System Rev. Ref. Bonds, Series 2013-A, 5.00% 2020 | 1,000 | 1,061 |
| County of Orange, Health Facs. Auth., Hospital Rev. Ref. Bonds (Orlando Health Obligated Group), Series 2006-B, 5.25% 2029 (preref. 2018) | 820 | 829 |
| South Florida Water Management Dist., Certs. of Part., Series 2015, 5.00% 2022 | 1,250 | 1,396 |
| 30,290 | ||
| Georgia 1.63% | ||
| City of Atlanta, Dev. Auth., Student Housing Facs. Rev. Ref. Bonds (Piedmont/Ellis, LLC University Commons Project), Series 2013, 5.00% 2018 (escrowed to maturity) | 1,000 | 1,003 |
| City of Atlanta, Dev. Auth., Student Housing Facs. Rev. Ref. Bonds (Piedmont/Ellis, LLC University Commons Project), Series 2013, 5.00% 2019 (escrowed to maturity) | 760 | 787 |
| City of Atlanta, Water and Wastewater Rev. Ref. Bonds, Series 2013-B, 5.00% 2019 | 2,000 | 2,085 |
| County of Burke, Dev. Auth., Pollution Control Rev. Bonds (Georgia Power Company Plant Vogtle Project), Series 2012, 1.85% 2049 (put 2019) | 1,200 | 1,199 |
| County of Clark, Hospital Auth., Rev. Anticipation Certs. (Piedmont Healthcare, Inc. Project), Series 2016-A, 5.00% 2019 | 600 | 619 |
| County of Floyd, Dev. Auth., Pollution Control Rev. Bonds (Georgia Power Company Plant Hammond Project), Series 2010, 2.35% 2022 (put 2020) | 4,000 | 4,023 |
| County of Fulton, Dev. Auth., Rev. Bonds (Piedmont Healthcare, Inc. Project), Series 2016-A, 5.00% 2019 | 525 | 541 |
| Housing and Fin. Auth., Single Family Mortgage Bonds, Series 2014-A-1, 4.00% 2044 | 520 | 540 |
| Housing and Fin. Auth., Single Family Mortgage Bonds, Series 2016-A-1, 3.50% 2046 | 550 | 567 |
| Bonds, notes & other debt instruments Georgia (continued) | Principal amount (000) | Value (000) |
| Road and Tollway Auth., Federal Highway Grant Anticipation Rev. Bonds, Series 2009-A, 5.00% 2019 | $2,500 | $2,572 |
| Road and Tollway Auth., Federal Highway Grant Anticipation Rev. Ref. Bonds, Series 2017-B, 5.00% 2020 | 1,870 | 1,982 |
| 15,918 | ||
| Hawaii 0.72% | ||
| City and County of Honolulu, G.O. Bonds (Honolulu Rail Transit Project), Series 2017-H, (SIFMA Municipal Swap Index + 0.31%) 1.25% 2024 (put 2020)1 | 3,000 | 3,000 |
| City and County of Honolulu, G.O. Bonds (Honolulu Rail Transit Project), Series 2017-H, (SIFMA Municipal Swap Index + 0.32%) 1.26% 2025 (put 2020)1 | 2,000 | 2,000 |
| City and County of Honolulu, G.O. Bonds, Series 2012-B, 5.00% 2018 | 1,000 | 1,009 |
| Dept. of Transportation, Airports Division, Lease Rev. Certs. of Part., Series 2013, AMT, 5.00% 2019 | 1,000 | 1,033 |
| 7,042 | ||
| Illinois 10.27% | ||
| Build Illinois Bonds, Sales Tax Rev. Bonds, Series 2013, 5.00% 2020 | 6,300 | 6,617 |
| Build Illinois Bonds, Sales Tax Rev. Ref. Bonds, Series 2016-D, 4.00% 2021 | 3,000 | 3,134 |
| City of Chicago, O’Hare International Airport, General Airport Rev. Ref. Bonds, Series 2013-A, AMT, 4.00% 2019 | 1,925 | 1,945 |
| City of Chicago, O’Hare International Airport, Passenger Fac. Charge Rev. Ref. Bonds, Series 2012-B, AMT, 4.00% 2020 | 2,000 | 2,060 |
| City of Chicago, Transit Auth., Sales Tax Receipts Rev. Bonds, Series 2011, 5.00% 2021 | 3,000 | 3,250 |
| City of Chicago, Wastewater Transmission Rev. Ref. Bonds, Series 2017-B, 5.00% 2021 | 1,500 | 1,601 |
| City of Chicago, Wastewater Transmission Rev. Ref. Bonds, Series 2017-B, 5.00% 2022 | 1,000 | 1,090 |
| City of Chicago, Water Rev. Bonds, Series 2004, 5.00% 2023 | 2,750 | 3,093 |
| City of Chicago, Water Rev. Ref. Bonds, Series 2012, 4.00% 2022 | 2,800 | 2,972 |
| County of Cook, G.O. Rev. Ref. Bonds, Series 2016-A, 5.00% 2021 | 500 | 544 |
| County of Cook, G.O. Rev. Ref. Bonds, Series 2016-A, 5.00% 2022 | 500 | 555 |
| Educational Facs. Auth., Rev. Bonds (University of Chicago), Series 1998-B, 1.65% 2025 (put 2019) | 10,390 | 10,390 |
| Fin. Auth., National Rural Utilities Cooperative Fin. Corp., Guaranteed Solid Waste Disposal Rev. Bonds (Prairie Power, Inc. Project), Series 2008-A, 1.75% 2042 (put 2020) | 3,415 | 3,387 |
| Fin. Auth., Rev. Bonds (Advocate Health Care Network), Series 2014, 5.00% 2019 | 550 | 568 |
| Fin. Auth., Rev. Bonds (Clean Water Initiative Revolving Fund), Series 2013, 5.00% 2019 | 2,000 | 2,064 |
| Fin. Auth., Rev. Bonds (Clean Water Initiative Revolving Fund), Series 2017, 5.00% 2023 | 1,000 | 1,124 |
| Fin. Auth., Rev. Bonds (Clean Water Initiative Revolving Fund), Series 2017, 5.00% 2029 | 2,500 | 2,916 |
| Fin. Auth., Rev. Bonds (Northwestern Memorial Healthcare), Series 2017-B, 5.00% 2057 (put 2022) | 2,000 | 2,237 |
| Fin. Auth., Rev. Bonds (Rush University Medical Center Obligated Group), Series 2009-C, 6.375% 2029 (preref. 2019) | 1,000 | 1,036 |
| Fin. Auth., Rev. Bonds (Rush University Medical Center Obligated Group), Series 2015-A, 5.00% 2019 | 1,000 | 1,041 |
| Fin. Auth., Rev. Bonds (Silver Cross Hospital and Medical Centers), Series 2009, 7.00% 2044 (preref. 2019) | 2,055 | 2,169 |
| Fin. Auth., Rev. Ref. Bonds (Advocate Health Care Network), Series 2008-A-1, 5.00% 2030 (put 2020) | 2,500 | 2,612 |
| Fin. Auth., Rev. Ref. Bonds (Advocate Health Care Network), Series 2008-A-3, 5.00% 2030 (put 2019) | 2,000 | 2,049 |
| Fin. Auth., Rev. Ref. Bonds (DePaul University), Series 2013, 5.00% 2018 | 500 | 503 |
| Fin. Auth., Rev. Ref. Bonds (OSF Healthcare System), Series 2015-A, 5.00% 2020 | 2,410 | 2,571 |
| City of Granite, Solid Waste Disposal Rev. Bonds (Waste Management, Inc. Project), Series 2002-A, AMT, 2.25% 2027 (put 2019) | 4,000 | 4,001 |
| Housing Dev. Auth., Multi Family Housing Rev. Notes (Marshall Field Garden Apartment Homes), Series 2015, (SIFMA Municipal Swap Index + 1.00%) 1.94% 2050 (put 2025)1 | 5,525 | 5,474 |
| Board of Trustees of the Illinois State University, Auxiliary Facs. System Rev. Bonds, Series 2016, Assured Guaranty Municipal insured, 5.00% 2021 | 2,155 | 2,288 |
| Metropolitan Pier and Exposition Auth., McCormick Place Expansion Project Rev. Bonds, Series 2002-A, Assured Guaranty Municipal insured, 5.50% 2023 | 3,620 | 4,023 |
| Railsplitter Tobacco Settlement Auth., Tobacco Settlement Rev. Bonds, Series 2010, 5.50% 2023 (preref. 2021) | 1,090 | 1,201 |
| Regional Transportation Auth., G.O. Rev. Ref. Bonds, Series 2017-A, 5.00% 2023 | 5,000 | 5,602 |
| Regional Transportation Auth., G.O. Rev. Ref. Bonds, Series 2017-A, 5.00% 2028 | 2,000 | 2,318 |
| Bonds, notes & other debt instruments Illinois (continued) | Principal amount (000) | Value (000) |
| Sales Tax Securitization Corp., Sales Tax Rev. Ref. Bonds, Series 2017-A, 5.00% 2022 | $2,000 | $2,178 |
| Southwestern Illinois Dev. Auth., Health Fac. Rev. Bonds (Memorial Group, Inc.), Series 2013, 7.25% 2036 (preref. 2023) | 2,500 | 3,132 |
| Toll Highway Auth., Toll Highway Rev. Bonds, Series 2014-A, 5.00% 2019 | 1,500 | 1,566 |
| Toll Highway Auth., Toll Highway Rev. Ref. Bonds, Series 2013-B, 5.00% 2018 | 1,750 | 1,770 |
| Board of Trustees of the University of Illinois, Auxiliary Facs. System Rev. Ref. Bonds, Series 2013-A, 5.00% 2021 | 1,945 | 2,079 |
| Board of Trustees of the University of Illinois, Rev. Ref. Certs. of Part., Series 2016-A, 3.00% 2018 | 1,000 | 1,001 |
| Board of Trustees of the University of Illinois, Rev. Ref. Certs. of Part., Series 2016-A, 4.00% 2019 | 1,015 | 1,038 |
| Village of Volo, Special Service Areas Nos. 3 and 6 (Symphony Meadows/Lancaster Falls Projects), Special Tax Rev. Ref. Bonds, Series 2016, Assured Guaranty Municipal insured, 3.00% 2019 | 299 | 301 |
| United City of Yorkville, Special Service Area Nos. 2005-108 and 2005-109, Special Tax Rev. Ref. Bonds, Series 2016, Assured Guaranty Municipal insured, 3.00% 2020 | 932 | 950 |
| 100,450 | ||
| Indiana 1.88% | ||
| Dev. Fin. Auth., Solid Waste Disposal Rev. Bonds (Waste Management, Inc. Project), Series 2001, AMT, 1.75% 2031 (put 2018) | 500 | 500 |
| Fin. Auth., Hospital Rev. Ref. Bonds (Indiana University Health Obligated Group), Series 2016-A, 5.00% 2019 | 1,100 | 1,149 |
| Fin. Auth., Hospital Rev. Ref. Bonds (Indiana University Health Obligated Group), Series 2016-A, 5.00% 2022 | 2,500 | 2,809 |
| Fin. Auth., Hospital Rev. Ref. Bonds (Parkview Health), Series 2017-A, 5.00% 2023 | 1,335 | 1,522 |
| Health and Educational Facs. Fncg. Auth., Rev. Bonds (Ascension Health Senior Credit Group), Series 2001-A-2, 4.00% 2036 (put 2019) | 1,500 | 1,519 |
| Hobart Building Corp., First Mortgage Bonds, Series 2006, National insured, 6.50% 2029 (preref. 2020) | 6,000 | 6,421 |
| City of Whiting, Environmental Facs. Rev. Bonds (BP Products North America Inc. Project), Series 2008, 1.85% 2044 (put 2019) | 1,000 | 997 |
| City of Whiting, Environmental Facs. Rev. Bonds (BP Products North America Inc. Project), Series 2014, AMT, (SIFMA Municipal Swap Index +75%) 1.69% 2044 (put 2019)1 | 2,400 | 2,405 |
| City of Whiting, Environmental Facs. Rev. Bonds (BP Products North America Inc. Project), Series 2015, AMT, 5.00% 2045 (put 2022) | 1,000 | 1,107 |
| 18,429 | ||
| Iowa 0.12% | ||
| Fin. Auth., Single Family Mortgage Bonds, Series 2015-A, AMT, 3.50% 2040 | 570 | 583 |
| Fin. Auth., Single Family Mortgage Bonds, Series 2017-A, 4.00% 2047 | 560 | 589 |
| 1,172 | ||
| Kansas 0.92% | ||
| Dept. of Transportation, Highway Rev. Bonds, Series 2004-C-3, (1-month USD-LIBOR x 0.70 + 0.40%) 1.865% 20231 | 5,000 | 5,014 |
| Dept. of Transportation, Highway Rev. Bonds, Series 2004-C-4, (1-month USD-LIBOR x 0.70 + 0.50%) 1.964% 20241 | 4,000 | 4,012 |
| 9,026 | ||
| Kentucky 0.72% | ||
| Property and Buildings Commission, Rev. Ref. Bonds (Project No. 90), Series 2008, 5.375% 2023 (preref. 2018) | 2,000 | 2,020 |
| Property and Buildings Commission, Rev. Ref. Bonds (Project No. 112), Series 2016-B, 5.00% 2022 | 4,500 | 4,991 |
| 7,011 |
| Bonds, notes & other debt instruments Louisiana 0.63% | Principal amount (000) | Value (000) |
| Aviation Board, General Airport Rev. Ref. Bonds, Series 2017-D-2, AMT, 5.00% 2021 | $400 | $428 |
| Aviation Board, General Airport Rev. Ref. Bonds, Series 2017-D-2, AMT, 5.00% 2023 | 500 | 555 |
| Citizens Property Insurance Corp., Assessment Rev. Ref. Bonds, Assured Guaranty Municipal insured, Series 2015, 5.00% 2021 | 1,500 | 1,627 |
| Local Government Environmental Facs. and Community Dev. Auth., Rev. Ref. Bonds, Series 2017, BAM insured, 5.00% 2024 | 1,000 | 1,142 |
| Tobacco Settlement Fncg. Corp., Tobacco Settlement Asset-Backed Rev. Ref. Bonds, Series 2013-A, 5.00% 2021 | 2,250 | 2,421 |
| 6,173 | ||
| Maine 0.60% | ||
| Housing Auth., Mortgage Purchase Bonds, Series 2016-B-1, 3.50% 2046 | 770 | 793 |
| Housing Auth., Mortgage Purchase Rev. Ref. Bonds, Series 2013-B, 4.00% 2043 | 715 | 739 |
| Housing Auth., Mortgage Purchase Rev. Ref. Bonds, Series 2014-A-1, AMT, 3.25% 2043 | 465 | 473 |
| Housing Auth., Mortgage Purchase Rev. Ref. Bonds, Series 2015-E-1, AMT, 3.50% 2035 | 3,750 | 3,852 |
| 5,857 | ||
| Maryland 1.33% | ||
| County of Baltimore, Consolidated Public Improvement Bonds, Series 2018, 4.00% 2019 | 2,000 | 2,033 |
| Community Dev. Administration, Dept. of Housing and Community Dev., Residential Rev. Bonds, Series 2014-B, AMT, 3.25% 2044 | 3,125 | 3,182 |
| G.O. Bonds, State and Local Facs. Loan of 2009, First Series C, 4.50% 2018 (preref. 2019) | 1,000 | 1,000 |
| County of Montgomery, G.O. Consolidated Public Improvement Bonds, Series 2011-A, 5.00% 2024 (preref. 2019) | 900 | 929 |
| County of Montgomery, Housing Opportunities Commission, Single Family Housing Rev. Bonds, Series 2017-A, 4.00% 2048 | 940 | 986 |
| University System, Auxiliary Fac. and Tuition Rev. Ref. Bonds, Series 2017-B, 5.00% 2021 | 4,500 | 4,878 |
| 13,008 | ||
| Massachusetts 2.91% | ||
| Dev. Fin. Agcy., Rev. Bonds (Partners HealthCare System Issue), Series 2012-L, 5.00% 2031 (preref. 2021) | 2,000 | 2,180 |
| Dev. Fin. Agcy., Rev. Bonds (Partners HealthCare System Issue), Series 2017-S, 5.00% 2021 | 3,000 | 3,265 |
| Educational Fncg. Auth., Education Loan Rev. Bonds, Series 2016-J, AMT, 5.00% 2024 | 3,000 | 3,389 |
| Educational Fncg. Auth., Education Loan Rev. Bonds, Series 2017-A, AMT, 4.00% 2021 | 1,000 | 1,049 |
| Educational Fncg. Auth., Education Loan Rev. Bonds, Series 2018-B, AMT, 5.00% 2024 | 2,145 | 2,423 |
| Educational Fncg. Auth., Education Loan Rev. Bonds, Series 2014-I, AMT, 5.00% 2021 | 3,000 | 3,200 |
| G.O. Bonds, Consolidated Loan, Series 2014-D-2, 1.70% 2043 (put 2022) | 1,500 | 1,475 |
| Housing Fin. Agcy., Single Family Housing Rev. Bonds, Series 167, 4.00% 2043 | 790 | 819 |
| Housing Fin. Agcy., Single Family Housing Rev. Bonds, Series 169, 4.00% 2044 | 505 | 523 |
| Housing Fin. Agcy., Single Family Housing Rev. Bonds, Series 172, 4.00% 2045 | 1,000 | 1,041 |
| Housing Fin. Agcy., Single Family Housing Rev. Bonds, Series 181, 4.00% 2044 | 785 | 819 |
| Housing Fin. Agcy., Single Family Housing Rev. Bonds, Series 183, 3.50% 2046 | 805 | 828 |
| Housing Fin. Agcy., Single Family Housing Rev. Ref. Bonds, Series 160, AMT, 3.75% 2034 | 300 | 306 |
| Housing Fin. Agcy., Single Family Housing Rev. Ref. Bonds, Series 162, 2.75% 2041 | 235 | 237 |
| Housing Fin. Agcy., Single Family Housing Rev. Ref. Bonds, Series 165, 2.65% 2041 | 810 | 815 |
| Housing Fin. Agcy., Single Family Housing Rev. Ref. Bonds, Series 171, 4.00% 2044 | 570 | 592 |
| Housing Fin. Agcy., Single Family Housing Rev. Ref. Bonds, Series 177, AMT, 4.00% 2039 | 3,125 | 3,252 |
| Housing Fin. Agcy., Single Family Housing Rev. Ref. Bonds, Series 188, AMT, 4.00% 2043 | 815 | 856 |
| Port Auth., Rev. Bonds, Series 2017-A, AMT, 5.00% 2019 | 1,365 | 1,407 |
| 28,476 |
| Bonds, notes & other debt instruments Michigan 2.70% | Principal amount (000) | Value (000) |
| Building Auth., Rev. Ref. Bonds (Facs. Program), Series 2015-I, 5.00% 2021 | $1,400 | $1,516 |
| Fin. Auth., Local Government Loan Program Rev. Bonds (Detroit Water and Sewerage Dept., Sewage Disposal System Rev. and Rev. Ref. Local Project Bonds), Series
2014-C-3, Assured Guaranty Municipal insured, 5.00% 2023 | 2,500 | 2,816 |
| Fin. Auth., Local Government Loan Program Rev. Bonds (Detroit Water and Sewerage Dept., Water Supply System Rev. Ref. Local Project), Series 2014-C-7, National insured, 5.00% 2019 | 575 | 591 |
| Fin. Auth., Local Government Loan Program Rev. Bonds (Detroit Water and Sewerage Dept., Water Supply System Rev. Ref. Local Project), Series 2014-D-1, Assured Guaranty Municipal insured, 5.00% 2020 | 500 | 528 |
| Fin. Auth., Rev. Bonds (Clean Water Initiative Revolving Fund), Series 2012, 5.00% 2018 | 1,000 | 1,006 |
| Fin. Auth., Student Loan Rev. Ref. Bonds, Series 25-A, AMT, 5.00% 2018 | 725 | 731 |
| County of Genesee, Water Supply System G.O. Limited Tax Rev. Ref. Bonds, Series 2014, BAM insured, 4.00% 2018 | 420 | 423 |
| Hospital Fin. Auth., Hospital Rev. Ref. Bonds (Trinity Health Credit Group), Series 2008-C, 5.00% 2019 | 825 | 861 |
| Hospital Fin. Auth., Hospital Rev. Ref. Bonds (Trinity Health Credit Group), Series 2008-C, 5.00% 2020 | 750 | 805 |
| Housing Dev. Auth., Single Family Mortgage Rev. Bonds, Series 2014, 4.00% 2044 | 745 | 775 |
| Housing Dev. Auth., Single Family Mortgage Rev. Bonds, Series 2016-B, 3.50% 2047 | 1,230 | 1,266 |
| Housing Dev. Auth., Single Family Mortgage Rev. Bonds, Series 2017-B, 3.50% 2048 | 3,555 | 3,680 |
| Housing Dev. Auth., Single Family Mortgage Rev. Bonds, Series 2018-A, 4.00% 2048 | 2,700 | 2,856 |
| Livonia Public Schools School Dist., School Building and Site G.O. Bonds, Series 2016, Assured Guaranty Municipal insured, 5.00% 2019 | 240 | 246 |
| Livonia Public Schools School Dist., School Building and Site G.O. Bonds, Series 2016, Assured Guaranty Municipal insured, 5.00% 2020 | 275 | 290 |
| Livonia Public Schools School Dist., School Building and Site G.O. Bonds, Series 2016, Assured Guaranty Municipal insured, 5.00% 2021 | 465 | 500 |
| City of Royal Oak, Hospital Fin. Auth., Hospital Rev. Ref. Bonds (William Beaumont Hospital Obligated Group), Series 2014-D, 5.00% 2019 | 500 | 518 |
| City of Royal Oak, Hospital Fin. Auth., Hospital Rev. Ref. Bonds (William Beaumont Hospital Obligated Group), Series 2014-D, 5.00% 2020 | 500 | 532 |
| Strategic Fund, Limited Obligation Rev. Ref. Bonds (Detroit Edison Co. Exempt Facs. Project), Series 1995-CC, 1.45% 2030 (put 2021) | 2,600 | 2,509 |
| County of Wayne, Airport Auth., Airport Rev. Ref. Bonds (Detroit Metropolitan Wayne County Airport), Series 2010-A, AMT, 5.00% 2018 | 1,900 | 1,922 |
| County of Wayne, Airport Auth., Airport Rev. Ref. Bonds (Detroit Metropolitan Wayne County Airport), Series 2011-A, AMT, Assured Guaranty Municipal insured, 4.00% 2020 | 1,690 | 1,769 |
| County of Wayne, Airport Auth., Airport Rev. Ref. Bonds (Detroit Metropolitan Wayne County Airport), Series 2015-G, 5.00% 2020 | 250 | 269 |
| 26,409 | ||
| Minnesota 1.52% | ||
| Housing Fin. Agcy., Homeownership Fin. Bonds (Mortgage-Backed Securities Program), Series 2011-G, 4.25% 2035 | 280 | 287 |
| Housing Fin. Agcy., Residential Housing Fin. Bonds, Series 2012-D, 4.00% 2040 | 435 | 446 |
| Housing Fin. Agcy., Residential Housing Fin. Bonds, Series 2013-A, AMT, 3.00% 2031 | 510 | 516 |
| Housing Fin. Agcy., Residential Housing Fin. Bonds, Series 2014-A, 4.00% 2038 | 805 | 838 |
| Housing Fin. Agcy., Residential Housing Fin. Bonds, Series 2014-C, AMT, 4.00% 2045 | 6,420 | 6,697 |
| Housing Fin. Agcy., Residential Housing Fin. Bonds, Series 2015-A, AMT, 4.00% 2041 | 655 | 680 |
| Housing Fin. Agcy., Residential Housing Fin. Bonds, Series 2015-E, AMT, 3.50% 2046 | 695 | 714 |
| Housing Fin. Agcy., Residential Housing Fin. Bonds, Series 2016-E, 4.00% 2047 | 210 | 219 |
| Housing Fin. Agcy., Residential Housing Fin. Bonds, Series 2017-E, 4.00% 2048 | 975 | 1,028 |
| City of Maplewood, Multi Family Housing Rev. Ref. Bonds (Maple Pond Apartments Project), Series 2018-A, 2.20% 2021 (put 2020)2 | 1,120 | 1,124 |
| Bonds, notes & other debt instruments Minnesota (continued) | Principal amount (000) | Value (000) |
| City of Minneapolis, Multi Family Rev. Bonds (Albright Townhomes Project), Series 2018, 2.00% 2021 (put 2019) | $1,250 | $1,252 |
| City of St. Paul, Housing and Redev. Auth., Multi Family Housing Rev. Bonds (Millberry Apartments Project), Series 2018-A, 2.20% 2021 (put 2020) | 1,100 | 1,105 |
| 14,906 | ||
| Mississippi 0.10% | ||
| Dev. Bank, Special Obligation Rev. Ref. Bonds (Harrison County Highway Ref. Project), Series 2013-A, 5.00% 2019 | 850 | 862 |
| Home Corp., Single Family Mortgage Rev. Bonds, Series 2009-A-2, 5.00% 2039 | 95 | 97 |
| 959 | ||
| Missouri 0.87% | ||
| Housing Dev. Commission, Single Family Mortgage Rev. Bonds (First Place Homeownership Loan Program), Series 2017-B, 3.25% 20473 | 1,387 | 1,391 |
| Housing Dev. Commission, Single Family Mortgage Rev. Bonds (Special Homeownership Loan Program), Series 2009-C, 4.90% 2036 | 125 | 127 |
| Housing Dev. Commission, Single Family Mortgage Rev. Bonds (Special Homeownership Loan Program), Series 2009-D, 4.80% 2040 | 180 | 182 |
| Housing Dev. Commission, Single Family Mortgage Rev. Bonds (Special Homeownership Loan Program), Series 2009-E-4, 4.25% 2030 | 250 | 257 |
| Housing Dev. Commission, Single Family Mortgage Rev. Bonds (Special Homeownership Loan Program), Series 2014-A, 4.00% 2041 | 735 | 765 |
| Housing Dev. Commission, Single Family Mortgage Rev. Bonds (Special Homeownership Loan Program), Series 2014-B, 4.00% 2040 | 895 | 932 |
| Housing Dev. Commission, Single Family Mortgage Rev. Bonds (Special Homeownership Loan Program), Series 2015-B-1, AMT, 4.00% 2045 | 3,520 | 3,678 |
| Metropolitan St. Louis Sewer Dist., Wastewater System Improvement and Rev. Ref. Bonds, Series 2017-A, 4.00% 2020 | 1,130 | 1,176 |
| 8,508 | ||
| Montana 0.18% | ||
| Board of Housing, Single Family Homeownership Bonds, Series 2012-A-2, AMT, 4.00% 2038 | 1,030 | 1,065 |
| Board of Housing, Single Family Mortgage Bonds, Series 2015-B-2, AMT, 3.50% 2042 | 695 | 713 |
| 1,778 | ||
| Nebraska 1.43% | ||
| Central Plains Energy Project, Gas Supply Rev. Ref. Bonds, Series 2014, 5.00% 2039 (put 2019) | 6,700 | 6,981 |
| Investment Fin. Auth., Single Family Housing Rev. Bonds, Series 2013-E, 3.00% 2043 | 945 | 955 |
| Investment Fin. Auth., Single Family Housing Rev. Bonds, Series 2014-A, 3.00% 2044 | 920 | 926 |
| Investment Fin. Auth., Single Family Housing Rev. Bonds, Series 2014-A, 4.00% 2044 | 575 | 599 |
| Investment Fin. Auth., Single Family Housing Rev. Bonds, Series 2015-C, 3.50% 2045 | 1,865 | 1,916 |
| Investment Fin. Auth., Single Family Housing Rev. Bonds, Series 2016-C, 3.50% 2046 | 455 | 469 |
| Investment Fin. Auth., Single Family Housing Rev. Bonds, Series 2018-A, 4.00% 2048 | 1,100 | 1,163 |
| Board of Regents of the University of Nebraska, University of Nebraska-Lincoln Student Fees and Facs. Rev. Bonds, Series 2009-A, 5.00% 2022 (preref. 2019) | 1,000 | 1,015 |
| 14,024 | ||
| Nevada 1.53% | ||
| County of Clark, Airport System Rev. Ref. Bonds, Series 2017-A-1, AMT, 4.00% 2019 | 2,500 | 2,551 |
| County of Clark, Jet Aviation Fuel Tax Rev. Ref. Bonds, Series 2013-A, AMT, 5.00% 2019 | 3,020 | 3,107 |
| County of Clark, Las Vegas-McCarran International Airport, Passenger Fac. Charge Rev. Bonds, Series 2015-C, 5.00% 2021 | 1,170 | 1,273 |
| County of Clark, Pollution Control Rev. Ref. Bonds (Southern California Edison Company), Series 2010, 1.875% 2031 (put 2020) | 5,500 | 5,470 |
| Bonds, notes & other debt instruments Nevada (continued) | Principal amount (000) | Value (000) |
| City of North Las Vegas, Special Improvement Dist. No. 60 (Aliante), Local Improvement Rev. Ref. Bonds, Series 2016, 2.25% 2021 | $1,260 | $1,257 |
| County of Washoe, Gas Facs. Rev. Ref. Bonds (Sierra Pacific Power Company Projects), Series 2016-A, AMT, 1.50% 2031 (put 2019) | 1,255 | 1,251 |
| 14,909 | ||
| New Jersey 2.93% | ||
| Econ. Dev. Auth., School Facs. Construction Rev. Ref. Bonds, Series 2014-PP, 5.00% 2019 | 4,000 | 4,109 |
| Educational Facs. Auth., Rev. and Rev. Ref. Bonds (Ramapo College of New Jersey Issue), Series 2017-A, Assured Guaranty Municipal insured, 4.00% 2020 | 1,185 | 1,236 |
| Educational Facs. Auth., Rev. and Rev. Ref. Bonds (Ramapo College of New Jersey Issue), Series 2017-A, Assured Guaranty Municipal insured, 5.00% 2022 | 1,000 | 1,107 |
| Educational Facs. Auth., Rev. and Rev. Ref. Bonds (Ramapo College of New Jersey Issue), Series 2017-A, Assured Guaranty Municipal insured, 5.00% 2023 | 850 | 958 |
| Health Care Facs. Fncg. Auth., Rev. Ref. Bonds (Hackensack Meridian Health Obligated Group Issue), Series 2017-A, 5.00% 2023 | 2,425 | 2,747 |
| Higher Education Student Assistance Auth., Student Loan Rev. Bonds, Series 2012-1-A, AMT, 5.00% 2018 | 2,000 | 2,022 |
| Higher Education Student Assistance Auth., Student Loan Rev. Bonds, Series 2016-1-A, AMT, 5.00% 2020 | 750 | 799 |
| Higher Education Student Assistance Auth., Student Loan Rev. Ref. Bonds, Series 2014-1-A1, AMT, 5.00% 2018 | 2,250 | 2,275 |
| Housing and Mortgage Fin. Agcy., Single Family Housing Rev. Bonds, Series 2018-A, 4.50% 2048 | 5,000 | 5,367 |
| Tobacco Settlement Fncg. Corp., Tobacco Settlement Bonds, Series 2018-A, 5.00% 2021 | 2,000 | 2,154 |
| Tobacco Settlement Fncg. Corp., Tobacco Settlement Bonds, Series 2018-A, 5.00% 2023 | 2,500 | 2,793 |
| Transit Corp., Grant Anticipation Notes (Federal Transit Administration Section 5307 Urbanized Area Formula Funds), Series 2014-A, 5.00% 2018 | 2,000 | 2,008 |
| Transportation Trust Fund Auth., Federal Highway Reimbursement Rev. Ref. Bonds, Series 2018-A, 5.00% 2022 | 1,000 | 1,087 |
| 28,662 | ||
| New Mexico 0.92% | ||
| City of Farmington, Pollution Control Rev. Ref. Bonds (Southern California Edison Company Four Corners Project), Series 2005-A, 1.875% 2029 (put 2020) | 2,000 | 1,989 |
| City of Farmington, Pollution Control Rev. Ref. Bonds (Southern California Edison Company Four Corners Project), Series 2005-B, 1.875% 2029 (put 2020) | 2,250 | 2,238 |
| City of Farmington, Pollution Control Rev. Ref. Bonds (Southern California Edison Company Four Corners Project), Series 2011, 1.875% 2029 (put 2020) | 2,000 | 1,989 |
| Mortgage Fin. Auth., Single Family Mortgage Program Bonds, Series 2009-D, Class I, 5.35% 2040 | 255 | 260 |
| Mortgage Fin. Auth., Single Family Mortgage Program Bonds, Series 2012-A, Class I, 4.25% 2043 | 540 | 556 |
| Mortgage Fin. Auth., Single Family Mortgage Program Bonds, Series 2016-A-2, Class I, AMT, 3.50% 2046 | 945 | 972 |
| Mortgage Fin. Auth., Single Family Mortgage Program Bonds, Series 2017-B-2, Class I, AMT, 3.75% 2048 | 885 | 922 |
| New Mexico Educational Assistance Foundation, Educational Loan Bonds, Series 2010-1, Class A-2, (3-month USD-LIBOR + 0.65%) 2.950% 20281,3 | 20 | 20 |
| 8,946 | ||
| New York 8.34% | ||
| Dormitory Auth., New York University Rev. Bonds, Series 2009-A, 5.00% 2039 (preref. 2019) | 2,250 | 2,322 |
| Dormitory Auth., School Dist. Rev. Bond Fncg. Program Rev. Bonds, Series 2016-A, 5.00% 2022 | 2,000 | 2,238 |
| Dormitory Auth., School Dist. Rev. Bond Fncg. Program Rev. Bonds, Series 2017-F, 5.00% 2023 | 3,500 | 3,989 |
| Dormitory Auth., State Personal Income Tax Rev. Bonds (General Purpose), Series 2014-A, 5.00% 2020 | 2,000 | 2,104 |
| Dormitory Auth., State Personal Income Tax Rev. Bonds (General Purpose), Series 2017-B, 5.00% 2023 | 5,000 | 5,647 |
| Housing Fin. Agcy., Affordable Housing Rev. Green Bonds, Series 2017-H, 1.65% 2021 | 1,650 | 1,632 |
| Metropolitan Transportation Auth., Dedicated Tax Fund Rev. Ref. Bonds, Series 2008-A-2B, (SIFMA Municipal Swap Index + 0.58%) 1.52% 2031 (put 2019)1 | 2,500 | 2,507 |
| Bonds, notes & other debt instruments New York (continued) | Principal amount (000) | Value (000) |
| Metropolitan Transportation Auth., Dedicated Tax Fund Rev. Ref. Bonds, Series 2008-B-3C, (SIFMA Municipal Swap Index + 0.45%) 1.39% 2034 (put 2019)1 | $2,000 | $2,004 |
| Metropolitan Transportation Auth., Transportation Rev. Bond Anticipation Notes, Series 2017-C-1A, 4.00% 2019 | 1,000 | 1,014 |
| Metropolitan Transportation Auth., Transportation Rev. Bonds, Series 2014-A-1, 4.00% 2019 | 750 | 773 |
| Metropolitan Transportation Auth., Transportation Rev. Bonds, Series 2014-C, 5.00% 2020 | 2,000 | 2,149 |
| Metropolitan Transportation Auth., Transportation Rev. Bonds, Series 2014-D-2, (SIFMA Municipal Swap Index + 0.45%) 1.39% 2044 (put 2022)1 | 4,000 | 3,998 |
| Metropolitan Transportation Auth., Transportation Rev. Bonds, Series 2015-A-2, (SIFMA Municipal Swap Index + 0.58%) 1.52% 2039 (put 2020)1 | 6,250 | 6,258 |
| Metropolitan Transportation Auth., Transportation Rev. Ref. Bonds, Series 2002-D-2A, Assured Guaranty Municipal insured, (1-month USD-LIBOR x 0.69 + 0.68%) 2.123% 2032 (put 2021)1 | 4,000 | 4,033 |
| Mortgage Agcy., Homeowner Mortgage Rev. Bonds, Series 178, 3.50% 2043 | 1,330 | 1,366 |
| Mortgage Agcy., Homeowner Mortgage Rev. Bonds, Series 191, AMT, 3.50% 2034 | 2,185 | 2,226 |
| Mortgage Agcy., Homeowner Mortgage Rev. Bonds, Series 195, 4.00% 2046 | 2,605 | 2,720 |
| Mortgage Agcy., Homeowner Mortgage Rev. Bonds, Series 197, 3.50% 2044 | 905 | 935 |
| Mortgage Agcy., Homeowner Mortgage Rev. Bonds, Series 200, 3.50% 2045 | 590 | 609 |
| Mortgage Agcy., Homeowner Mortgage Rev. Bonds, Series 203, 3.50% 2047 | 2,450 | 2,531 |
| Mortgage Agcy., Homeowner Mortgage Rev. Bonds, Series 52, AMT, 3.50% 2030 | 1,910 | 1,960 |
| New York City G.O. Bonds, Series 2012-I, 5.00% 2018 | 1,000 | 1,000 |
| New York City G.O. Bonds, Series 2014-A, 5.00% 2020 | 1,500 | 1,599 |
| New York City Housing Dev. Corp., Multi Family Housing Rev. Bonds (Sustainable Neighborhood Bonds), Series 2017-C-2, 1.70% 2021 | 5,250 | 5,206 |
| New York City Housing Dev. Corp., Multi Family Housing Rev. Bonds (Sustainable Neighborhood Bonds), Series 2017-G-2-A, 2.00% 2057 (put 2021) | 3,000 | 2,995 |
| New York City Housing Dev. Corp., Multi Family Housing Rev. Bonds (Sustainable Neighborhood Bonds), Series 2018-C-2-A, 2.35% 2022 | 2,500 | 2,506 |
| Port Auth., Consolidated Rev. Ref. Bonds, Series 185, AMT, 5.00% 2020 | 2,000 | 2,128 |
| Port Auth., Consolidated Rev. Ref. Bonds, Series 186, AMT, 5.00% 2021 | 2,000 | 2,182 |
| County of Suffolk, Rev. Ref. Bonds, Series 2017-B, Assured Guaranty Municipal insured, 4.00% 2021 | 2,500 | 2,661 |
| Thruway Auth., General Rev. Junior Indebtedness Obligations, Series 2013-A, 5.00% 2019 | 4,700 | 4,823 |
| Transportation Dev. Corp., Special Fac. Rev. Ref. Bonds (Terminal One Group Association, LP Project), Series 2015, AMT, 5.00% 2020 | 1,500 | 1,566 |
| Transportation Dev. Corp., Special Fac. Rev. Ref. Bonds (Terminal One Group Association, LP Project), Series 2015, AMT, 5.00% 2021 | 750 | 798 |
| Transportation Dev. Corp., Special Fac. Rev. Ref. Bonds (Terminal One Group Association, LP Project), Series 2015, AMT, 5.00% 2022 | 1,000 | 1,084 |
| 81,563 | ||
| North Carolina 0.85% | ||
| Housing Fin. Agcy., Home Ownership Rev. Ref. Bonds, Series 37-A, AMT, 3.50% 2039 | 1,435 | 1,473 |
| Housing Fin. Agcy., Home Ownership Rev. Ref. Bonds, Series 38-B, 4.00% 2047 | 3,355 | 3,531 |
| University of North Carolina at Chapel Hill, General Rev. Bonds, Series 2012-B, (1-month USD-LIBOR x 0.67 + 0.40%) 1.802% 2041 (put 2022)1 | 3,300 | 3,324 |
| 8,328 | ||
| North Dakota 0.99% | ||
| Housing Fin. Agcy., Homeownership Rev. Bonds (Home Mortgage Fin. Program), Series 2016-D, 3.50% 2046 | 1,595 | 1,647 |
| Housing Fin. Agcy., Housing Fin. Program Bonds (Home Mortgage Fin. Program), Series 2012-A, 3.75% 2042 | 1,380 | 1,420 |
| Housing Fin. Agcy., Housing Fin. Program Bonds (Home Mortgage Fin. Program), Series 2014-A, 4.00% 2034 | 305 | 317 |
| Bonds, notes & other debt instruments North Dakota (continued) | Principal amount (000) | Value (000) |
| Housing Fin. Agcy., Housing Fin. Program Bonds (Home Mortgage Fin. Program), Series 2015-A, 4.00% 2038 | $410 | $426 |
| Housing Fin. Agcy., Housing Fin. Program Bonds (Home Mortgage Fin. Program), Series 2015-B, 4.00% 2036 | 335 | 349 |
| Housing Fin. Agcy., Housing Fin. Program Bonds (Home Mortgage Fin. Program), Series 2016-B, AMT, 4.00% 2047 | 4,005 | 4,183 |
| Housing Fin. Agcy., Housing Fin. Program Bonds (Home Mortgage Fin. Program), Series 2017-D, 4.00% 2048 | 1,270 | 1,339 |
| 9,681 | ||
| Ohio 1.79% | ||
| Akron, Bath and Copley Joint Township Hospital Dist., Hospital Facs. Rev. Bonds (Akron General Health System), Series 2012, 5.00% 2031 (preref. 2022) | 1,000 | 1,094 |
| Higher Education G.O. Rev. Ref. Bonds, Series 2017-C, 5.00% 2026 | 1,000 | 1,191 |
| Housing Fin. Agcy., Residential Mortgage Rev. Bonds (Mortgage-Backed Securities Program), Series 2016-D, 4.00% 2047 | 1,200 | 1,256 |
| Housing Fin. Agcy., Residential Mortgage Rev. Bonds (Mortgage-Backed Securities Program), Series 2016-K, 3.50% 2046 | 1,350 | 1,393 |
| Housing Fin. Agcy., Residential Mortgage Rev. Bonds (Mortgage-Backed Securities Program), Series 2017-D, 4.00% 2048 | 1,900 | 2,002 |
| Housing Fin. Agcy., Residential Mortgage Rev. Bonds, AMT, Series 2017-B, 4.50% 2047 | 620 | 660 |
| Housing Fin. Agcy., Single Family Mortgage Rev. Bonds, Series 2010-1, 5.00% 2028 | 280 | 286 |
| Housing Fin. Agcy., Single Family Mortgage Rev. Bonds, Series 2011-1, 4.80% 2028 | 150 | 155 |
| Kent State University, Rev. General Receipts Bonds, Series 2016, 4.00% 2022 | 1,000 | 1,070 |
| Major New State Infrastructure Project Rev. Bonds, Series 2012-1, 4.00% 2018 | 1,750 | 1,767 |
| Major New State Infrastructure Project, Rev. Bonds, Series 2016-1, 5.00% 2023 | 1,000 | 1,147 |
| Water Dev. Auth., Solid Waste Disposal Rev. Bonds (Waste Management Inc. Project), Series 2002, AMT, 1.70% 2022 (put 2018) | 2,500 | 2,500 |
| Water Dev. Auth., Water Pollution Control Loan Fund Rev. Notes, Series 2017-B, (SIFMA Municipal Swap Index + 0.22%) 1.16% 20201 | 3,000 | 3,000 |
| 17,521 | ||
| Oklahoma 0.13% | ||
| Municipal Power Auth., Power Supply System Rev. Ref. Bonds, Series 2005-A, (SIFMA Municipal Swap Index + 0.80%) 1.74% 2023 (put 2018)1 | 1,280 | 1,280 |
| Oregon 1.11% | ||
| Facs. Auth., Rev. Ref. Bonds (Providence Health & Services), Series 2013-C, (SIFMA Municipal Swap Index + 1.00%) 1.94% 2022 (put 2018)1 | 3,000 | 3,002 |
| G.O. Bonds (Veteran’s Welfare Bonds Series 94), Series 2014-H, 4.00% 2044 | 1,900 | 1,961 |
| G.O. Bonds (Veteran’s Welfare Bonds Series 99B), Series 2017-Q, 3.50% 2047 | 2,185 | 2,263 |
| Housing and Community Services Dept., Mortgage Rev. Bonds (Single Family Mortgage Program), Series 2017-A, 4.00% 2047 | 2,325 | 2,450 |
| Port of Portland, Portland International Airport Rev. Bonds, Series 24-B, AMT, 5.00% 2021 | 1,090 | 1,181 |
| 10,857 | ||
| Pennsylvania 3.23% | ||
| East Hempfield Township, Industrial Dev. Auth., Rev. Ref. Bonds (Willow Valley Communities Project), Series 2016, 4.00% 2019 | 450 | 464 |
| East Hempfield Township, Industrial Dev. Auth., Rev. Ref. Bonds (Willow Valley Communities Project), Series 2016, 4.00% 2020 | 500 | 523 |
| Econ. Dev. Fncg. Auth., Unemployment Compensation Rev. Bonds, Series 2012-B, 5.00% 2021 | 715 | 722 |
| Econ. Dev. Fncg. Auth., UPMC Rev. Bonds, Series 2017-A, 4.00% 2018 | 4,780 | 4,816 |
| Housing Fin. Agcy., Single Family Mortgage Rev. Bonds, Series 2015-117-A, AMT, 3.50% 2040 | 1,335 | 1,370 |
| Bonds, notes & other debt instruments Pennsylvania (continued) | Principal amount (000) | Value (000) |
| Housing Fin. Agcy., Single Family Mortgage Rev. Bonds, Series 2015-118-A, AMT, 3.50% 2040 | $5,490 | $5,621 |
| Housing Fin. Agcy., Single Family Mortgage Rev. Bonds, Series 2016-119, 3.50% 2041 | 670 | 689 |
| Housing Fin. Agcy., Single Family Mortgage Rev. Bonds, Series 2016-120, 3.50% 2046 | 780 | 802 |
| Housing Fin. Agcy., Single Family Mortgage Rev. Bonds, Series 2017-122, 4.00% 2046 | 2,815 | 2,949 |
| Housing Fin. Agcy., Single Family Mortgage Rev. Bonds, Series 2017-123-A, AMT, 4.00% 2039 | 1,500 | 1,564 |
| County of Montour, Geisinger Auth. Health System Rev. Bonds (Geisinger Health System), Series 2014-B, (1-month USD-LIBOR x 0.67 + 1.07%) 2.457% 2028 (put 2024)1 | 3,000 | 3,059 |
| City of Philadelphia, Airport Rev. and Rev. Ref. Bonds, Series 2017-A, 5.00% 2019 | 1,200 | 1,237 |
| City of Philadelphia, Water and Wastewater Rev. Bonds, Series 2017-A, 5.00% 2019 | 1,000 | 1,039 |
| Philadelphia School Dist., G.O. Bonds, Series 2016-F, 5.00% 2020 | 500 | 531 |
| Philadelphia School Dist., G.O. Bonds, Series 2016-F, 5.00% 2021 | 500 | 541 |
| Philadelphia School Dist., G.O. Bonds, Series 2016-F, 5.00% 2022 | 500 | 550 |
| City of Pittsburgh, Urban Redev. Auth., Rev. Bonds (Crawford Square Apartments Project), Series 2018, 2.25% 2020 (put 2020) | 825 | 827 |
| Turnpike Commission, Turnpike Rev. Bonds, Series 2014-B-1, (SIFMA Municipal Swap Index + 0.98%) 1.92% 20211 | 1,100 | 1,117 |
| Turnpike Commission, Turnpike Rev. Bonds, Series 2015-A-2, (SIFMA Municipal Swap Index + 0.80%) 1.74% 2045 (put 2018)1 | 1,000 | 1,001 |
| Turnpike Commission, Turnpike Rev. Bonds, Series 2016, 5.00% 2021 | 2,000 | 2,167 |
| 31,589 | ||
| Rhode Island 1.29% | ||
| Commerce Corp., Grant Anticipation Rev. Ref. Bonds (Dept. of Transportation), Series 2016-A, 5.00% 2020 | 1,990 | 2,111 |
| Commerce Corp., Grant Anticipation Rev. Ref. Bonds (Dept. of Transportation), Series 2016-A, 5.00% 2021 | 1,280 | 1,389 |
| Housing and Mortgage Fin. Corp., Homeownership Opportunity Bonds, Series 66-A-1, 4.00% 2033 | 2,225 | 2,308 |
| Housing and Mortgage Fin. Corp., Homeownership Opportunity Bonds, Series 68-C, AMT, 3.50% 2039 | 945 | 970 |
| Student Loan Auth., Student Loan Program Rev. Bonds, Series 2016-A, AMT, 5.00% 2018 | 300 | 303 |
| Student Loan Auth., Student Loan Program Rev. Bonds, Series 2017-A, AMT, 5.00% 2019 | 250 | 260 |
| Student Loan Auth., Student Loan Program Rev. Bonds, Series 2017-A, AMT, 5.00% 2020 | 200 | 212 |
| Student Loan Auth., Student Loan Program Rev. Bonds, Series 2017-A, AMT, 5.00% 2021 | 510 | 551 |
| Student Loan Auth., Student Loan Program Rev. Bonds, Series 2017-A, AMT, 5.00% 2022 | 1,300 | 1,424 |
| Student Loan Auth., Student Loan Program Rev. Bonds, Series 2017-A, AMT, 5.00% 2023 | 650 | 723 |
| Student Loan Auth., Student Loan Program Rev. Bonds, Series 2017-A, AMT, 5.00% 2024 | 2,100 | 2,346 |
| 12,597 | ||
| South Carolina 1.25% | ||
| Housing Fin. and Dev. Auth., Mortgage Rev. Bonds, Series 2017-A, 4.00% 2047 | 1,035 | 1,083 |
| Housing Fin. and Dev. Auth., Mortgage Rev. Bonds, Series 2017-B, 4.00% 2047 | 315 | 331 |
| Housing Fin. and Dev. Auth., Mortgage Rev. Bonds, Series 2018-A, 4.50% 2048 | 1,590 | 1,718 |
| Housing Fin. and Dev. Auth., Mortgage Rev. Ref. Bonds, Series 2016-A, 4.00% 2036 | 135 | 141 |
| County of Lexington, Health Services Dist., Inc., Hospital Rev. Ref. Bonds, Series 2017, 5.00% 2019 | 250 | 260 |
| County of Lexington, Health Services Dist., Inc., Hospital Rev. Ref. Bonds, Series 2017, 5.00% 2020 | 250 | 265 |
| Public Service Auth., Rev. Obligations (Santee Cooper), Series 2012-A, 4.00% 2020 | 2,945 | 3,072 |
| Public Service Auth., Rev. Obligations (Santee Cooper), Series 2015-C, 5.00% 2021 | 1,500 | 1,631 |
| Public Service Auth., Rev. Ref. Obligations (Santee Cooper), Series 2015-A, 5.00% 2022 | 3,395 | 3,746 |
| 12,247 | ||
| South Dakota 0.60% | ||
| Housing Dev. Auth., Homeownership Mortgage Bonds, Series 2013-A, AMT, 3.00% 2030 | 445 | 450 |
| Housing Dev. Auth., Homeownership Mortgage Bonds, Series 2013-E, AMT, 4.00% 2044 | 230 | 238 |
| Housing Dev. Auth., Homeownership Mortgage Bonds, Series 2014-E, 4.00% 2044 | 845 | 880 |
| Housing Dev. Auth., Homeownership Mortgage Bonds, Series 2015-D, 4.00% 2045 | 925 | 968 |
| Bonds, notes & other debt instruments South Dakota (continued) | Principal amount (000) | Value (000) |
| Housing Dev. Auth., Homeownership Mortgage Bonds, Series 2016-D, 3.50% 2046 | $2,600 | $2,683 |
| Housing Dev. Auth., Homeownership Mortgage Rev. Ref. Bonds, Series 2012-A, AMT, 4.50% 2031 | 645 | 672 |
| 5,891 | ||
| Tennessee 1.68% | ||
| Housing Dev. Agcy., Homeownership Program Bonds, Series 2012-1-C, 4.50% 2037 | 530 | 551 |
| Housing Dev. Agcy., Homeownership Program Bonds, Series 2012-2-C, 4.00% 2038 | 370 | 381 |
| Housing Dev. Agcy., Homeownership Program Rev. Ref. Bonds, Series 2011-1-A, AMT, 4.50% 2031 | 885 | 921 |
| Housing Dev. Agcy., Homeownership Program Rev. Ref. Bonds, Series 2012-1-A, AMT, 4.50% 2038 | 435 | 452 |
| Housing Dev. Agcy., Residential Fin. Program Bonds, Series 2013-1-C, 3.00% 2038 | 880 | 893 |
| Housing Dev. Agcy., Residential Fin. Program Bonds, Series 2013-2-A, AMT, 4.00% 2043 | 880 | 911 |
| Housing Dev. Agcy., Residential Fin. Program Bonds, Series 2014-1-A, AMT, 4.00% 2039 | 1,275 | 1,321 |
| Housing Dev. Agcy., Residential Fin. Program Bonds, Series 2014-2-A, AMT, 4.00% 2045 | 1,025 | 1,066 |
| Housing Dev. Agcy., Residential Fin. Program Bonds, Series 2014-2-C, 4.00% 2045 | 775 | 808 |
| Housing Dev. Agcy., Residential Fin. Program Bonds, Series 2015-2-A, 4.00% 2046 | 370 | 387 |
| Housing Dev. Agcy., Residential Fin. Program Bonds, Series 2016-1-B, 3.50% 2047 | 805 | 830 |
| Housing Dev. Agcy., Residential Fin. Program Bonds, Series 2017-1, 4.00% 2042 | 1,405 | 1,478 |
| Housing Dev. Agcy., Residential Fin. Program Bonds, Series 2017-B-2, 4.00% 2042 | 2,505 | 2,637 |
| Metropolitan Government of Nashville and Davidson County, Health and Educational Facs. Board, Collateralized Multi Family Housing Rev. Bonds (Trevecca Towers II
Project), Series 2018, 2.00% 2022 (put 2021) | 2,300 | 2,302 |
| County of Shelby, Health, Educational and Housing Fac. Board, Rev. Bonds (Methodist Le Bonheur Healthcare), Series 2017-A, 5.00% 2022 | 1,330 | 1,469 |
| 16,407 | ||
| Texas 10.40% | ||
| Beaumont Independent School Dist., Unlimited Tax Rev. Ref. Bonds, Series 2016, 5.00% 2020 | 1,280 | 1,345 |
| Clear Creek Independent School Dist., Unlimited Tax School Building Bonds, Series 2013-B, 3.00% 2032 (put 2019) | 5,000 | 5,066 |
| Cypress-Fairbanks Independent School Dist., Unlimited Tax School Building Bonds, Series 2017-A-3, 3.00% 2043 (put 2020) | 2,500 | 2,553 |
| Cypress-Fairbanks Independent School Dist., Unlimited Tax School Building Bonds, Series 2014-B-3, 1.40% 2040 (put 2020) | 750 | 742 |
| Cypress-Fairbanks Independent School Dist., Unlimited Tax School Building Bonds, Series 2017-A-2, 2.50% 2036 (put 2019) | 4,000 | 4,033 |
| City of Dallas, Waterworks and Sewer System Rev. Ref. Bonds, Series 2008, 5.00% 2027 (preref. 2018) | 2,000 | 2,012 |
| City of Dallas, Waterworks and Sewer System Rev. Ref. Bonds, Series 2016-A, 5.00% 2028 | 1,240 | 1,456 |
| Cities of Dallas and Fort Worth, Dallas/Fort Worth International Airport, Joint Rev. Ref. Bonds, Series 2013-E, AMT, 5.00% 2019 | 2,000 | 2,082 |
| Cities of Dallas and Fort Worth, Dallas/Fort Worth International Airport, Joint Rev. Ref. Bonds, Series 2013-F, 5.00% 2018 | 1,000 | 1,009 |
| Cities of Dallas and Fort Worth, Dallas/Fort Worth International Airport, Joint Rev. Ref. Bonds, Series 2013-F, 5.00% 2019 | 500 | 521 |
| City of Denton, Utility System Rev. Bonds, Series 2017, 5.00% 2020 | 1,000 | 1,072 |
| City of Denton, Utility System Rev. Bonds, Series 2017, 5.00% 2022 | 1,000 | 1,119 |
| Denton Independent School Dist., Unlimited Tax Rev. Ref. Bonds, Series 2015, 5.00% 2026 | 1,865 | 2,151 |
| Fort Bend Independent School Dist., Unlimited Tax School Building Bonds, Series 2015-B, 1.35% 2040 (put 2019) | 2,000 | 1,992 |
| County of Harris, Cultural Education, Facs. Fin. Corp., Thermal Utility Rev. Ref. Bonds (Teco Project), Series 2017, 5.00% 2019 | 350 | 365 |
| County of Harris, Cultural Education, Facs. Fin. Corp., Thermal Utility Rev. Ref. Bonds (Teco Project), Series 2017, 5.00% 2020 | 1,150 | 1,233 |
| County of Harris, Health Facs. Dev. Corp., Hospital Rev. Ref. Bonds (Memorial Hermann Healthcare System), Series 2014-B, (SIFMA Municipal Swap Index + 0.58%) 1.52% 2042 (put 2019)1 | 2,000 | 2,005 |
| Bonds, notes & other debt instruments Texas (continued) | Principal amount (000) | Value (000) |
| County of Harris, Toll Road Rev. Bonds, Series 2012-B, (SIFMA Municipal Swap Index + 0.70%) 1.64% 2021 (put 2018)1 | $2,500 | $2,500 |
| Dept. of Housing and Community Affairs, Single Family Mortgage Rev. Bonds, Series 2017-A, 2.835% 20473 | 2,229 | 2,151 |
| Dept. of Housing and Community Affairs, Multi Family Housing Rev. Bonds (Springs Apartments), Series 2018, 2.23% 2021 (put 2020)2 | 1,650 | 1,655 |
| City of Houston, Combined Utility System Rev. Ref. Bonds, Series 2014-C, 5.00% 2020 | 1,000 | 1,057 |
| City of Houston, Combined Utility System Rev. Ref. Bonds, Series 2018-C, (1-month USD-LIBOR x 0.70 + 0.36%) 1.811% 2034 (put 2021)1 | 5,650 | 5,655 |
| City of Houston, Combined Utility System, Rev. and Rev. Ref. Bonds, Series 2009-A, Assured Guaranty insured, 5.25% 2033 (preref. 2019) | 1,805 | 1,857 |
| City of Houston, Public Improvement Rev. Ref. Bonds, Series 2017-A, 5.00% 2020 | 2,850 | 2,996 |
| Houston Independent School Dist., Limited Tax Schoolhouse Bonds, Series 2014-A-1B, 2.20% 2039 (put 2020)2 | 1,735 | 1,746 |
| Love Field Airport Modernization Corp., General Airport Rev. Bonds, Series 2017, AMT, 5.00% 2021 | 500 | 545 |
| North Central Texas Health Facs. Dev. Corp., Hospital Rev. Ref. Bonds (Children’s Medical Center of Dallas Project), Series 2012, 5.00% 2018 | 1,000 | 1,001 |
| North Texas Tollway Auth., System Rev. Ref. Bonds, Series 2011-A, (SIFMA Municipal Swap Index + 0.80%) 1.74% 2050 (put 2019)1 | 4,095 | 4,095 |
| North Texas Tollway Auth., System Rev. Ref. Bonds, Series 2012-C, 1.95% 2038 (put 2019) | 2,380 | 2,380 |
| North Texas Tollway Auth., System Rev. Ref. Bonds, Series 2017-A, 5.00% 2019 | 4,500 | 4,567 |
| Northside Independent School Dist., Unlimited Tax School Building Bonds, Series 2017, 1.45% 2047 (put 2020) | 3,800 | 3,773 |
| Panhandle Regional Housing Fin. Corp., Multi Family Housing Rev. Bonds (Canyons at 45 West Apartments), Series 2018, 2.00% 2021 (put 2020)2 | 1,500 | 1,504 |
| Public Fin. Auth., Texas Southern University, Rev. Fncg. System Bonds, Series 2016, BAM insured, 4.00% 2019 | 890 | 906 |
| City of San Antonio, Electric and Gas Systems Rev. Ref. Bonds, Series 2009-A, 5.25% 2024 (preref. 2019) | 1,100 | 1,121 |
| City of San Antonio, Electric and Gas Systems Rev. Ref. Bonds, Series 2012-C, 2.00% 2027 (put 2018) | 1,625 | 1,627 |
| City of San Antonio, Electric and Gas Systems Rev. Ref. Bonds, Series 2015-A, 2.25% 2033 (put 2019) | 9,000 | 9,065 |
| City of San Antonio, Electric and Gas Systems Rev. Ref. Bonds, Series 2015-B, 2.00% 2033 (put 2021) | 3,040 | 3,023 |
| County of Tarrant, Cultural Education Facs. Fin. Corp., Hospital Rev. Bonds (Baylor Scott & White Health Project), Series 2016-A, 5.00% 2019 | 1,000 | 1,044 |
| County of Tarrant, Cultural Education Facs. Fin. Corp., Hospital Rev. Bonds (Baylor Scott & White Health Project), Series 2016-A, 5.00% 2020 | 750 | 801 |
| Board of Regents of the Texas State University System, Rev. Fncg. System Rev. and Rev. Ref. Bonds, Series 2017-A, 5.00% 2022 | 1,800 | 1,991 |
| Transportation Commission, Central Texas Turnpike System Rev. Ref. Bonds, Series 2015-A, 5.00% 2042 (put 2020) | 2,000 | 2,102 |
| Transportation Commission, G.O. Mobility Fund Bonds, Series 2014-B, (SIFMA Municipal Swap Index + 0.38%) 1.32% 2041 (put 2018)1 | 6,500 | 6,501 |
| Board of Regents of the University of North Texas System, Rev. Fncg. System Rev. Ref. and Improvement Bonds, Series 2017-A, 5.00% 2022 | 1,000 | 1,109 |
| Board of Regents of the University of North Texas System, Rev. Fncg. System Rev. Ref. and Improvement Bonds, Series 2017-A, 5.00% 2023 | 1,000 | 1,133 |
| Board of Regents of The University of Texas System, Rev. Fncg. System Rev. Ref. Bonds, Series 2016-I, 5.00% 2019 | 1,750 | 1,812 |
| Water Dev. Board, State Water Implementation Rev. Fund, Rev. Bonds (Master Trust), Series 2018-A, 5.00% 2023 | 1,120 | 1,282 |
| 101,755 |
| Bonds, notes & other debt instruments Vermont 0.09% | Principal amount (000) | Value (000) |
| Educational and Health Buildings Fncg. Agcy., Rev. Bonds (The University of Vermont Medical Center Project), Series 2016-A, 4.00% 2020 | $750 | $786 |
| Student Assistance Corp., Education Loan Rev. Bonds, Series 2012-B, AMT, (3-month USD-LIBOR + 1.50%) 3.843% 20221,3 | 36 | 37 |
| 823 | ||
| Virginia 0.88% | ||
| Commonwealth Transportation Board, Federal Transportation Grant Anticipation Rev. and Rev. Ref. Notes, Series 2017, 5.00% 2023 | 3,000 | 3,426 |
| Commonwealth Transportation Board, Federal Transportation Grant Anticipation Rev. Notes, Series 2013-A, 5.00% 2020 | 3,000 | 3,162 |
| County of Fairfax, Industrial Dev. Auth., Health Care Rev. Ref. Bonds (Inova Health System Project), Series 2009-A, 5.00% 2019 (escrowed to maturity) | 1,000 | 1,028 |
| County of Wise, Industrial Dev. Auth., Solid Waste and Sewage Disposal Rev. Bonds (Virginia Electric and Power Co. Project), Series 2009-A, 2.15% 2040 (put 2020) | 1,000 | 1,001 |
| 8,617 | ||
| Washington 3.07% | ||
| Econ. Dev. Fin. Auth., Solid Waste Disposal Rev. Bonds (Waste Management, Inc. Project), Series 2008, 2.125% 20204 | 5,000 | 5,002 |
| Energy Northwest, Electric Rev. Ref. Bonds (Project No. 3), Series 2015-C, 5.00% 2026 | 500 | 583 |
| Federal Highway Grant Anticipation Rev. Bonds (SR 520 Corridor Program), Series 2012-F, 5.00% 2018 | 2,000 | 2,006 |
| Federal Highway Grant Anticipation Rev. Bonds (SR 520 Corridor Program), Series 2014-C, 5.00% 2018 | 3,250 | 3,259 |
| Various Purpose G.O. Bonds, Series 2011-B, 5.25% 2036 (preref. 2021) | 2,030 | 2,205 |
| Various Purpose G.O. Rev. Ref. Bonds, Series 2018-R-C, 5.00% 2021 | 5,000 | 5,472 |
| County of Grant, Public Utility Dist. No. 2, Electric System Rev. Ref. Bonds, Series 2017-N, 2.00% 2044 (put 2020) | 1,500 | 1,501 |
| Health Care Facs. Auth., Rev. Bonds (Providence Health & Services), Series 2012-B, 4.00% 2042 (put 2021) | 250 | 266 |
| Health Care Facs. Auth., Rev. Ref. Bonds (PeaceHealth), Series 2014-A, 5.00% 2019 | 500 | 521 |
| Health Care Facs. Auth., Rev. Ref. Bonds (Providence Health & Services), Series 2012-A, 5.00% 2018 | 500 | 503 |
| Health Care Facs. Auth., Rev. Ref. Bonds (Providence Health & Services), Series 2012-B, 5.00% 2042 (put 2021) | 2,550 | 2,787 |
| Housing Fin. Commission, Homeownership Program Bonds, Series 2010-A, 4.70% 2028 | 150 | 153 |
| Housing Fin. Commission, Single Family Program Bonds, Series 2014-1-N, 3.00% 2037 | 875 | 887 |
| Housing Fin. Commission, Single Family Program Bonds, Series 2014-2A-R, AMT, 3.50% 2044 | 1,610 | 1,647 |
| Housing Fin. Commission, Single Family Program Bonds, Series 2017-1-N, 4.00% 2047 | 905 | 948 |
| Housing Fin. Commission, Single Family Program Rev. Ref. Bonds, Series 2013-1-N, 3.00% 2043 | 240 | 242 |
| City of Seattle, Municipal Light and Power Improvement and Rev. Ref. Bonds, Series 2015-B-1, (SIFMA Municipal Swap Index + 0.68%) 1.62% 2045 (put 2018)1 | 1,000 | 1,001 |
| Port of Seattle, Rev. Ref. Bonds, Series 2015-B, 5.00% 2020 | 1,000 | 1,052 |
| 30,035 | ||
| West Virginia 0.39% | ||
| County of Mason, Pollution Control Rev. Bonds (Appalachian Power Company Project), Series 2014-L, 1.625% 2022 (put 2018) | 1,250 | 1,250 |
| County of Monongalia, Building Commission, Ref. and Improvement Rev. Bonds (Monongalia Health System Obligated Group), Series 2015, 5.00% 2020 | 1,135 | 1,201 |
| West Virginia University, Improvement Rev. Bonds (West Virginia University Projects), Series 2014-C, (SIFMA Municipal Swap Index + 0.53%) 1.47% 2041 (put 2019)1 | 1,375 | 1,375 |
| 3,826 |
| Bonds, notes & other debt instruments Wisconsin 4.26% | Principal amount (000) | Value (000) |
| G.O. Bonds, Series 2013-A, 5.00% 2025 (preref. 2022) | $5,000 | $5,554 |
| G.O. Bonds, Series 2015-A, 5.00% 2031 (preref. 2023) | 5,000 | 5,686 |
| Health and Educational Facs. Auth., Health Facs. Rev. Bonds (SSM Health Care), Series 2018-B, 5.00% 2038 (put 2023) | 2,700 | 2,972 |
| Health and Educational Facs. Auth., Rev. Bonds (Ascension Health Senior Credit Group), Series 2013-B-1, 1.375% 2038 (put 2019) | 2,150 | 2,137 |
| Health and Educational Facs. Auth., Rev. Bonds (Ascension Health Senior Credit Group), Series 2013-B-2, 4.00% 2043 (put 2019) | 6,000 | 6,109 |
| Health and Educational Facs. Auth., Rev. Bonds (Ascension Health Senior Credit Group), Series 2013-B-3, 5.00% 2043 (put 2020) | 4,500 | 4,753 |
| Health and Educational Facs. Auth., Rev. Bonds (St. John’s Communities, Inc.), Series 2009-A, 7.625% 2039 (preref. 2019) | 2,000 | 2,133 |
| Health and Educational Facs. Auth., Rev. Bonds (UnityPoint Health), Series 2014-A, 5.00% 2018 | 435 | 440 |
| Housing and Econ. Dev. Auth., Home Ownership Rev. Bonds, Series 2015-A, AMT, 4.00% 2045 | 2,705 | 2,792 |
| Housing and Econ. Dev. Auth., Home Ownership Rev. Bonds, Series 2016-A, AMT, 3.50% 2046 | 5,415 | 5,563 |
| Housing and Econ. Dev. Auth., Home Ownership Rev. Bonds, Series 2017-C, 4.00% 2048 | 1,185 | 1,246 |
| Housing and Econ. Dev. Auth., Home Ownership Rev. Bonds, Series 2018-B, 4.00% 2048 | 800 | 843 |
| Public Fin. Auth., Solid Waste Disposal Rev. Ref. Bonds (Waste Management, Inc. Project), Series 2016-A-4, AMT, 2.00% 2033 (put 2021) | 1,500 | 1,473 |
| 41,701 | ||
| Wyoming 0.19% | ||
| Community Dev. Auth., Housing Rev. Bonds, Series 2015-3, 3.00% 2044 | 330 | 335 |
| Community Dev. Auth., Housing Rev. Bonds, Series 2015-6, 4.00% 2045 | 1,415 | 1,469 |
| 1,804 | ||
| Total bonds, notes & other debt instruments (cost: $882,948,000) | 878,253 | |
| Short-term securities 10.38% | ||
| State of Arizona, City of Phoenix, Industrial Dev. Auth., Health Care Facs. Rev. Bonds (Mayo Clinic), Series 2014-A, 1.38% 20521 | 7,000 | 7,000 |
| State of California, Statewide Communities Dev. Auth., Commercial Paper, Series 2008-B, 1.80% 8/14/2018 | 2,000 | 2,000 |
| State of Connecticut, Health and Educational Facs. Auth., Rev. Bonds (Yale University Issue), Series 2018-S-2, 1.25% 8/1/2018 | 1,000 | 1,000 |
| State of Florida, Health Facs. Auth., Health Facs. Rev. Bonds, Series 2008-A, 1.14% 8/16/2018 | 2,000 | 2,000 |
| State of Idaho, Health Facs. Auth., Hospital Rev. Bonds (CHE Trinity Health Credit Group), Series 2013-ID, 1.375% 2048 (put 2018) | 1,000 | 1,000 |
| State of Illinois, Fin. Auth., Demand Rev. Bonds (University of Chicago Medical Center), Series 2009-E-1, JPMorgan Chase LOC, 1.45% 20431 | 1,000 | 1,000 |
| State of Illinois, Fin. Auth., Demand Rev. Bonds (University of Chicago Medical Center), Series 2010-A, 1.47% 20441 | 2,000 | 2,000 |
| State of Maryland, Health and Higher Educational Facs. Auth., Rev. Bonds, Series 2018-B, 1.30% 10/3/2018 | 1,500 | 1,500 |
| State of Maryland, County of Montgomery, IAM Commercial Paper, Series 2009, 1.64% 8/2/2018 | 5,000 | 5,000 |
| State of Maryland, County of Montgomery, IAM Commercial Paper, Series 2009-B, 1.13% 8/9/2018 | 2,000 | 2,000 |
| State of Maryland, County of Montgomery, Rev. Bonds (Trinity Health Credit Group), Series 2013, 1.40% 2041 (put 2018) | 1,000 | 1,000 |
| State of Michigan, Board of Trustees of Michigan State University, IAM Commercial Paper, Series F, 1.95% 6/20/2018 | 3,000 | 3,000 |
| State of Michigan, Strategic Fund, Demand Limited Obligation Rev. Bonds (Air Products and Chemicals, Inc. Project), Series 2007, 1.45% 20421 | 18,980 | 18,980 |
| State of Minnesota, City of Saint Paul, Housing and Redev. Auth., Health Care System Demand Rev. Bonds (Allina Health System), Series 2009-B-1, JPMorgan Chase LOC, 1.51% 20351 | 2,350 | 2,350 |
| State of Mississippi, Business Fin. Corp., Gulf Opportunity Zone Industrial Dev. Rev. Bonds (Chevron U.S.A. Inc. Project), Series 2009-G, 1.45% 20301 | 1,825 | 1,825 |
| Short-term securities | Principal amount (000) | Value (000) |
| State of Mississippi, Business Fin. Corp., Gulf Opportunity Zone Industrial Dev. Rev. Bonds (Chevron U.S.A. Inc. Project), Series 2014-B, 1.52% 20351 | $2,100 | $2,100 |
| State of Missouri, Health and Educational Facs. Auth., Demand Educational Facs. Rev. Bonds (Washington University), Series 2000-B, 1.49% 20401 | 5,000 | 5,000 |
| State of New York, Metropolitan Transportation Auth., Transportation Rev. Bonds, Series 2017-C-2A, 4.00% 5/15/2019 | 7,300 | 7,445 |
| State of New York, New York City G.O. Bonds, Fiscal 2014, Series 2013-D-3, 1.50% 20381 | 1,000 | 1,000 |
| State of New York, New York City G.O. Bonds, Series 2006-L-5, 1.49% 20351 | 1,000 | 1,000 |
| State of New York, New York City Municipal Water Fin. Auth., Water and Sewer System Second General Resolution Rev. Bonds, Fiscal 2016, Series 2015-AA-1, 1.49% 20481 | 1,000 | 1,000 |
| State of New York, New York City Transitional Fin. Auth., Future Tax Secured Bonds, Series 2010-G-5, 1.05% 20341 | 1,500 | 1,500 |
| State of New York, New York City Transitional Fin. Auth., Future Tax Secured Rev. Ref. Bonds, Series 2015-E-3, 1.50% 20451 | 1,000 | 1,000 |
| State of New York, New York City Transitional Fin. Auth., Future Tax Secured Rev. Ref. Bonds, Series 2016-E-4, 1.50% 20451 | 3,500 | 3,500 |
| State of New York, New York City Transitional Fin. Auth., Recovery Bonds, Fiscal 2003, Series 2002-1-C, 1.50% 20221 | 2,880 | 2,880 |
| State of Pennsylvania, Econ. Dev. Fncg. Auth., Solid Waste Disposal Rev. Bonds (Waste Management, Inc. Project), Series 2013, AMT, 1.80% 2045 (put 2018)1,5 | 1,200 | 1,200 |
| State of Texas, City of Houston, Tax and Rev. Anticipation Notes, Series 2018, 4.00% 6/28/2019 | 4,000 | 4,089 |
| State of Texas, Tax and Rev. Anticipation Notes, Series 2017, 4.00% 8/30/2018 | 12,000 | 12,026 |
| State of Washington, Central Puget Sound Regional Transit Auth., Sales Tax Improvement Green Bonds, Series 2015-S-2B, (SIFMA Municipal Swap Index + 0.45%) 1.39% 2045 (put 2023)1 | 6,150 | 6,155 |
| Total short-term securities (cost: $101,533,000) | 101,550 | |
| Total investment securities 100.17% (cost: $984,481,000) | 979,803 | |
| Other assets less liabilities (0.17%) | (1,616) | |
| Net assets 100.00% | $978,187 |
| Contracts | Type | Number of contracts | Expiration | Notional amount6 (000) | Value at 7/31/20187 (000) | Unrealized depreciation at 7/31/2018 (000) |
| 2 Year U.S. Treasury Note Futures | Long | 280 | October 2018 | $56,000 | $59,185 | $(101) |
| 1 | Coupon rate may change periodically. For short-term securities, the date of the next scheduled coupon rate change is considered to be the maturity date. |
| 2 | Step bond; coupon rate may change at a later date. |
| 3 | Principal payments may be made periodically. Therefore, the effective maturity date may be earlier than the stated maturity date. |
| 4 | Acquired in a transaction exempt from registration under Rule 144A of the Securities Act of 1933. May be resold in the U.S. in transactions exempt from registration, normally to qualified institutional buyers. The total value of all such securities was $5,002,000, which represented .51% of the net assets of the fund. |
| 5 | For short-term securities, the mandatory put date is considered to be the maturity date. |
| 6 | Notional amount is calculated based on the number of contracts and notional contract size. |
| 7 | Value is calculated based on the notional amount and current market price. |
| Key to abbreviations and symbol | |
| Agcy. = Agency | Fncg. = Financing |
| AMT = Alternative Minimum Tax | G.O. = General Obligation |
| Auth. = Authority | LIBOR = London Interbank Offered Rate |
| Certs. of Part. = Certificates of Participation | LOC = Letter of Credit |
| Dept. = Department | Preref. = Prerefunded |
| Dev. = Development | Redev. = Redevelopment |
| Dist. = District | Ref. = Refunding |
| Econ. = Economic | Rev. = Revenue |
| Fac. = Facility | SIFMA = Securities Industry and Financial Markets Association |
| Facs. = Facilities | USD/$ = U.S. dollars |
| Fin. = Finance |
| MFGEFPX-039-0918O-S66137 | American Funds Short-Term Tax-Exempt Bond Fund — Page 18 of 18 |
Report of Independent Registered Public Accounting Firm
To the Board of Trustees and Shareholders of American Funds Short-Term Tax-Exempt Bond Fund, Limited Term Tax-Exempt Bond Fund of America, The Tax-Exempt Bond Fund of America, American High-Income Municipal Bond Fund, The Tax-Exempt Fund of California and American Funds Tax-Exempt Fund of New York
Opinions on the Financial Statements
We have audited the accompanying statements of assets and liabilities, including the summary investment portfolios, of American Funds Short-Term Tax-Exempt Bond Fund, Limited Term Tax-Exempt Bond Fund of America, The Tax-Exempt Bond Fund of America, American High-Income Municipal Bond Fund, The Tax-Exempt Fund of California and American Funds Tax-Exempt Fund of New York (the "Funds") as of July 31, 2018, the related statements of operations for the year ended July 31, 2018, the statements of changes in net assets for each of the two years in the period ended July 31, 2018, including the related notes, and the financial highlights for each of the periods indicated therein (included in Item 1 of this Form N-CSR) and the investment portfolios (included in Item 6 of this Form N-CSR) as of July 31, 2018 (collectively referred to as the “financial statements”). In our opinion, the financial statements present fairly, in all material respects, the financial position of each of the Funds as of July 31, 2018, the results of each of their operations for the year then ended, the changes in each of their net assets for each of the two years in the period ended July 31, 2018 and each of the financial highlights for each of the periods indicated therein in conformity with accounting principles generally accepted in the United States of America.
Basis for Opinions
These financial statements are the responsibility of the Funds’ management. Our responsibility is to express an opinion on the Funds’ financial statements based on our audits. We are a public accounting firm registered with the Public Company Accounting Oversight Board (United States) (“PCAOB”) and are required to be independent with respect to the Funds in accordance with the U.S. federal securities laws and the applicable rules and regulations of the Securities and Exchange Commission and the PCAOB.
We conducted our audits of these financial statements in accordance with the standards of the PCAOB. Those standards require that we plan and perform the audit to obtain reasonable assurance about whether the financial statements are free of material misstatement, whether due to error or fraud.
Our audits included performing procedures to assess the risks of material misstatement of the financial statements, whether due to error or fraud, and performing procedures that respond to those risks. Such procedures included examining, on a test basis, evidence regarding the amounts and disclosures in the financial statements. Our audits also included evaluating the accounting principles used and significant estimates made by management, as well as evaluating the overall presentation of the financial statements. Our procedures included confirmation of securities owned as of July 31, 2018 by correspondence with the custodians and brokers. We believe that our audits provide a reasonable basis for our opinions.
PricewaterhouseCoopers LLP
Los Angeles, CA
September 13, 2018
We have served as the auditor of one or more investment companies in The Capital Group Companies Investment Company Complex since 1934.
ITEM 7 – Disclosure of Proxy Voting Policies and Procedures for Closed-End Management Investment Companies
Not applicable to this Registrant, insofar as the Registrant is not a closed-end management investment company.
ITEM 8 – Portfolio Managers of Closed-End Management Investment Companies
Not applicable to this Registrant, insofar as the Registrant is not a closed-end management investment company.
ITEM 9 – Purchases of Equity Securities by Closed-End Management Investment Company and Affiliated Purchasers
Not applicable to this Registrant, insofar as the Registrant is not a closed-end management investment company.
ITEM 10 – Submission of Matters to a Vote of Security Holders
There have been no material changes to the procedures by which shareholders may recommend nominees to the Registrant’s board of trustees since the Registrant last submitted a proxy statement to its shareholders. The procedures are as follows. The Registrant has a nominating and governance committee comprised solely of persons who are not considered ‘‘interested persons’’ of the Registrant within the meaning of the Investment Company Act of 1940, as amended. The committee periodically reviews such issues as the board’s composition, responsibilities, committees, compensation and other relevant issues, and recommends any appropriate changes to the full board of trustees. While the committee normally is able to identify from its own resources an ample number of qualified candidates, it will consider shareholder suggestions of persons to be considered as nominees to fill future vacancies on the board. Such suggestions must be sent in writing to the nominating and governance committee of the Registrant, c/o the Registrant’s Secretary, and must be accompanied by complete biographical and occupational data on the prospective nominee, along with a written consent of the prospective nominee for consideration of his or her name by the nominating and governance committee.
ITEM 11 – Controls and Procedures
| (a) | The Registrant’s Principal Executive Officer and Principal Financial Officer have concluded, based on their evaluation of the Registrant’s disclosure controls and procedures (as such term is defined in Rule 30a-3 under the Investment Company Act of 1940), that such controls and procedures are adequate and reasonably designed to achieve the purposes described in paragraph (c) of such rule. |
| (b) | Effective May 28, 2018, the American Funds Short-Term Tax-Exempt Bond Fund’s investment adviser implemented a new fixed income order management, trading, and compliance system. In connection with introducing this new system, additional automated and manual controls were implemented and some existing controls were modified. None of these changes were in response to any identified deficiency or weakness in the American Funds Short-Term Tax-Exempt Bond Fund’s internal control over financial reporting. |
ITEM 12 – Exhibits
| (a)(1) | The Code of Ethics that is the subject of the disclosure required by Item 2 is attached as an exhibit hereto. |
| (a)(2) | The certifications required by Rule 30a-2 of the Investment Company Act of 1940 and Sections 302 and 906 of the Sarbanes-Oxley Act of 2002 are attached as exhibits hereto. |
SIGNATURES
Pursuant to the requirements of the Securities Exchange Act of 1934 and the Investment Company Act of 1940, the Registrant has duly caused this report to be signed on its behalf by the undersigned, thereunto duly authorized.
| AMERICAN FUNDS SHORT-TERM TAX-EXEMPT BOND FUND | |
| By /s/ Kristine M. Nishiyama | |
|
Kristine M. Nishiyama, Executive Vice President and Principal Executive Officer | |
| Date: September 28, 2018 |
Pursuant to the requirements of the Securities Exchange Act of 1934 and the Investment Company Act of 1940, this report has been signed below by the following persons on behalf of the Registrant and in the capacities and on the dates indicated.
| By /s/ Kristine M. Nishiyama |
|
Kristine M. Nishiyama, Executive Vice President and Principal Executive Officer |
| Date: September 28, 2018 |
| By /s/ Brian C. Janssen |
|
Brian C. Janssen, Treasurer and Principal Financial Officer |
| Date: September 28, 2018 |
Code of Ethics
The following Code of Ethics is in effect for the Registrant:
| The Fund has adopted the following standards in accordance with the requirements of Form N-CSR adopted by the Securities and Exchange Commission pursuant to Section 406 of the Sarbanes-Oxley Act of 2002 for the purpose of deterring wrongdoing and promoting: 1) honest and ethical conduct, including handling of actual or apparent conflicts of interest between personal and professional relationships; 2) full, fair, accurate, timely and understandable disclosure in reports and documents that a fund files with or submits to the Commission and in other public communications made by the fund; 3) compliance with applicable governmental laws, rules and regulations; 4) the prompt internal reporting of violations of the Code to an appropriate person or persons identified in the Code; and 5) accountability for adherence to the Code. These provisions shall apply to the principal executive officer or chief executive officer and treasurer (“Covered Officers”) of the Fund. | |||
| (1) | It is the responsibility of Covered Officers to foster, by their words and actions, a corporate culture that encourages honest and ethical conduct, including the ethical resolution of, and appropriate disclosure of conflicts of interest. Covered Officers should work to assure a working environment that is characterized by respect for law and compliance with applicable rules and regulations. | ||
| (2) | Each Covered Officer must act in an honest and ethical manner while conducting the affairs of the Fund, including the ethical handling of actual or apparent conflicts of interest between personal and professional relationships. Duties of Covered Officers include: | ||
| • | Acting with integrity; | ||
| • | Adhering to a high standard of business ethics; and | ||
| • | Not using personal influence or personal relationships to improperly influence investment decisions or financial reporting whereby the Covered Officer would benefit personally to the detriment of the Fund; | ||
| (3) | Each Covered Officer should act to promote full, fair, accurate, timely and understandable disclosure in reports and documents that the Fund files with or submits to, the Securities and Exchange Commission and in other public communications made by the Fund. | ||
| • | Covered Officers should familiarize themselves with disclosure requirements applicable to the Fund and disclosure controls and procedures in place to meet these requirements; and | ||
| • | Covered Officers must not knowingly misrepresent, or cause others to misrepresent facts about the Fund to others, including the Fund’s auditors, independent trustees, governmental regulators and self-regulatory organizations. | ||
| (4) | Any existing or potential violations of this Code of Ethics should be reported to The Capital Group Companies’ Personal Investing Committee. The Personal Investing Committee is authorized to investigate any such violations and report their findings to the Chairman of the Audit Committee of the Fund. The Chairman of the Audit Committee may report violations of the Code of Ethics to the Board or other appropriate entity including the Audit Committee, if he or she believes such a reporting is appropriate. The Personal Investing Committee may also determine the appropriate sanction for any violations of this Code of Ethics, including removal from office, provided that removal from office shall only be carried out with the approval of the Board. | ||
| (5) | Application of this Code of Ethics is the responsibility of the Personal Investing Committee, which shall report periodically to the Chairman of the Audit Committee of the Fund. | ||
| (6) | Material amendments to these provisions must be ratified by a majority vote of the Board. As required by applicable rules, substantive amendments to the Code of Ethics must be filed or appropriately disclosed. | ||
|
American Funds Short-Term Tax-Exempt Bond Fund 333 South Hope Street Los Angeles, California 90071 (213) 486-9200 |
CERTIFICATION
I, Kristine M. Nishiyama, certify that:
| 1. | I have reviewed this report on Form N-CSR of American Funds Short-Term Tax-Exempt Bond Fund; |
| 2. | Based on my knowledge, this report does not contain any untrue statement of a material fact or omit to state a material fact necessary to make the statements made, in light of the circumstances under which such statements were made, not misleading with respect to the period covered by this report; |
| 3. | Based on my knowledge, the financial statements, and other financial information included in this report, fairly present in all material respects the financial condition, results of operations, changes in net assets, and cash flows (if the financial statements are required to include a statement of cash flows) of the registrant as of, and for, the periods presented in this report; |
| 4. | The registrant's other certifying officer(s) and I are responsible for establishing and maintaining disclosure controls and procedures (as defined in rule 30a-3(c) under the Investment Company Act of 1940) and internal controls over financial reporting (as defined in Rule 30a-3(d) under the Investment Company Act of 1940) for the registrant and have: |
| a) Designed such disclosure controls and procedures, or caused such disclosure controls and procedures to be designed under our supervision, to ensure that material information relating to the registrant, including its consolidated subsidiaries, is made known to us by others within those entities, particularly during the period in which this report is being prepared; | |
| b) Designed such internal control over financial reporting, or caused such internal control over financial reporting to be designed under our supervision, to provide reasonable assurance regarding the reliability of financial reporting and the preparation of financial statements for external purposes in accordance with generally accepted accounting principles; | |
| c) Evaluated the effectiveness of the registrant's disclosure controls and procedures and presented in this report our conclusions about the effectiveness of the disclosure controls and procedures, as of a date within 90 days prior to the filing date of this report based on such evaluation; and | |
| d) Disclosed in this report any change in the registrant’s internal control over financial reporting that occurred during the registrant’s second fiscal quarter of the period covered by this report that has materially affected, or is reasonably likely to materially affect, the registrant’s internal control over financial reporting; and | |
| 5. | The registrant's other certifying officer(s) and I have disclosed to the registrant's auditors and the audit committee of the registrant's Board of Trustees (or persons performing the equivalent functions): |
| a) All significant deficiencies and material weaknesses in the design or operation of internal control over financial reporting which are reasonably likely to adversely affect the registrant’s ability to record, process, summarize, and report financial information; and | |
| b) Any fraud, whether or not material, that involves management or other employees who have a significant role in the registrant's internal control over financial reporting. |
Date: September 28, 2018
/s/ Kristine M. Nishiyama
Kristine M. Nishiyama, Executive Vice President and
Principal Executive Officer
American Funds Short-Term Tax-Exempt Bond Fund
|
American Funds Short-Term Tax-Exempt Bond Fund 333 South Hope Street Los Angeles, California 90071 (213) 486-9200 |
CERTIFICATION
I, Brian C. Janssen, certify that:
| 1. | I have reviewed this report on Form N-CSR of American Funds Short-Term Tax-Exempt Bond Fund; |
| 2. | Based on my knowledge, this report does not contain any untrue statement of a material fact or omit to state a material fact necessary to make the statements made, in light of the circumstances under which such statements were made, not misleading with respect to the period covered by this report; |
| 3. | Based on my knowledge, the financial statements, and other financial information included in this report, fairly present in all material respects the financial condition, results of operations, changes in net assets, and cash flows (if the financial statements are required to include a statement of cash flows) of the registrant as of, and for, the periods presented in this report; |
| 4. | The registrant's other certifying officer(s) and I are responsible for establishing and maintaining disclosure controls and procedures (as defined in rule 30a-3(c) under the Investment Company Act of 1940) and internal controls over financial reporting (as defined in Rule 30a-3(d) under the Investment Company Act of 1940) for the registrant and have: |
| a) Designed such disclosure controls and procedures, or caused such disclosure controls and procedures to be designed under our supervision, to ensure that material information relating to the registrant, including its consolidated subsidiaries, is made known to us by others within those entities, particularly during the period in which this report is being prepared; | |
| b) Designed such internal control over financial reporting, or caused such internal control over financial reporting to be designed under our supervision, to provide reasonable assurance regarding the reliability of financial reporting and the preparation of financial statements for external purposes in accordance with generally accepted accounting principles; | |
| c) Evaluated the effectiveness of the registrant's disclosure controls and procedures and presented in this report our conclusions about the effectiveness of the disclosure controls and procedures, as of a date within 90 days prior to the filing date of this report based on such evaluation; and | |
| d) Disclosed in this report any change in the registrant’s internal control over financial reporting that occurred during the registrant’s second fiscal quarter of the period covered by this report that has materially affected, or is reasonably likely to materially affect, the registrant’s internal control over financial reporting; and | |
| 5. | The registrant's other certifying officer(s) and I have disclosed to the registrant's auditors and the audit committee of the registrant's Board of Trustees (or persons performing the equivalent functions): |
| a) All significant deficiencies and material weaknesses in the design or operation of internal control over financial reporting which are reasonably likely to adversely affect the registrant’s ability to record, process, summarize, and report financial information; and | |
| b) Any fraud, whether or not material, that involves management or other employees who have a significant role in the registrant's internal control over financial reporting. |
Date: September 28, 2018
/s/ Brian C. Janssen
Brian C. Janssen, Treasurer and
Principal Financial Officer
American Funds Short-Term Tax-Exempt Bond Fund
|
American Funds Short-Term Tax-Exempt Bond Fund 333 South Hope Street Los Angeles, California 90071 (213) 486-9200 |
CERTIFICATION PURSUANT TO 18 U.S.C. SECTION 1350,
AS ADOPTED PURSUANT TO
SECTION 906 OF THE SARBANES-OXLEY ACT OF 2002
KRISTINE M. NISHIYAMA, Executive Vice President and Principal Executive Officer, and BRIAN C. JANSSEN, Treasurer and Principal Financial Officer of American Funds Short-Term Tax-Exempt Bond Fund (the "Registrant"), each certify to the best of his knowledge that:
| 1) | The Registrant's periodic report on Form N-CSR for the period ended July 31, 2018 (the "Form N-CSR") fully complies with the requirements of Section 13(a) or 15(d) of the Securities Exchange Act of 1934, as amended; and |
| 2) | The information contained in the Form N-CSR fairly presents, in all material respects, the financial condition and results of operations of the Registrant. |
| Principal Executive Officer | Principal Financial Officer |
| AMERICAN FUNDS SHORT-TERM TAX-EXEMPT BOND FUND | AMERICAN FUNDS SHORT-TERM TAX-EXEMPT BOND FUND |
| /s/ Kristine M. Nishiyama | /s/ Brian C. Janssen |
| Kristine M. Nishiyama, Executive Vice President | Brian C. Janssen, Treasurer |
| Date: September 28, 2018 | Date: September 28, 2018 |
A signed original of this written statement required by Section 906 of the Sarbanes-Oxley Act of 2002 has been provided to AMERICAN FUNDS SHORT-TERM TAX-EXEMPT BOND FUND and will be retained by AMERICAN FUNDS SHORT-TERM TAX-EXEMPT BOND FUND and furnished to the Securities and Exchange Commission (the "Commission") or its staff upon request.
This certification is being furnished to the Commission solely pursuant to 18 U.S.C. Section 1350 and is not being filed as part of the Form N-CSR filed with the Commission.
Create E-mail Alert Related Categories
SEC FilingsRelated Entities
The Capital Group CompaniesSign up for StreetInsider Free!
Receive full access to all new and archived articles, unlimited portfolio tracking, e-mail alerts, custom newswires and RSS feeds - and more!
