

Form N-CSR AMERICAN FUNDS GLOBAL For: Oct 31
 Tweet
Tweet Share
ShareUNITED STATES
SECURITIES AND EXCHANGE COMMISSION
Washington, D.C. 20549
FORM N-CSR
Certified Shareholder Report of
Registered Management Investment Companies
Investment Company Act File Number: 811-22496
American Funds Global Balanced Fund
(Exact Name of Registrant as Specified in Charter)
6455 Irvine Center Drive
Irvine, California 92618
(Address of Principal Executive Offices)
Registrant's telephone number, including area code: (213) 486-9200
Date of fiscal year end: October 31
Date of reporting period: October 31, 2018
Laurie D. Neat
American Funds Global Balanced Fund
333 South Hope Street
Los Angeles, California 90071
(Name and Address of Agent for Service)
ITEM 1 – Reports to Stockholders
|
American Funds
Annual report |

A balanced fund
with global scope.
Beginning January 1, 2021, as permitted by regulations adopted by the Securities and Exchange Commission, we intend to no longer mail paper copies of the fund’s shareholder reports, unless specifically requested from American Funds or your financial intermediary, such as a broker-dealer or bank. Instead, the reports will be made available on the American Funds website (americanfunds.com); you will be notified by mail and provided with a website link to access the report each time a report is posted. If you have already elected to receive shareholder reports electronically, you will not be affected by this change and do not need to take any action. If you prefer to receive shareholder reports and other communications electronically, you may update your mailing preferences with your financial intermediary, or enroll in e-delivery at americanfunds.com (for accounts held directly with the fund).
You may elect to receive paper copies of all future reports free of charge. If you invest through a financial intermediary, you may contact your financial intermediary to request that you continue to receive paper copies of your shareholder reports. If you invest directly with the fund, you may inform American Funds that you wish to continue receiving paper copies of your shareholder reports by contacting us at (800) 421-4225. Your election to receive reports in paper will apply to all funds held with American Funds or through your financial intermediary.
American Funds Global Balanced Fund seeks the balanced accomplishment of three objectives: long-term growth of capital, conservation of principal and current income.
This fund is one of more than 40 offered by Capital Group, home of American Funds, one of the nation’s largest mutual fund families. For more than 85 years, Capital Group has invested with a long-term focus based on thorough research and attention to risk.
Fund results shown in this report, unless otherwise indicated, are for Class A shares at net asset value. If a sales charge (maximum 5.75%) had been deducted, the results would have been lower. Results are for past periods and are not predictive of results for future periods. Current and future results may be lower or higher than those shown. Share prices and returns will vary, so investors may lose money. Investing for short periods makes losses more likely. For current information and month-end results, visit americanfunds.com.
Here are the average annual total returns on a $1,000 investment with all distributions reinvested for periods ended September 30, 2018 (the most recent calendar quarter-end):
| Class A shares | 1 year | 5 years | Lifetime (since 2/1/11) | |||||||
| Reflecting 5.75% maximum sales charge | -3.27% | 3.93% | 5.28% |
For other share class results, visit americanfunds.com and americanfundsretirement.com.
The total annual fund operating expense ratio is 0.84% for Class A shares as of the prospectus dated January 1, 2019 (unaudited).
Investment results assume all distributions are reinvested and reflect applicable fees and expenses.
The fund’s 30-day yield for Class A shares as of November 30, 2018, reflecting the 5.75% maximum sales charge and calculated in accordance with the U.S. Securities and Exchange Commission formula, was 2.32%.
The return of principal for bond funds and for funds with significant underlying bond holdings is not guaranteed. Fund shares are subject to the same interest rate, inflation and credit risks associated with the underlying bond holdings. Investing outside the U.S. may be subject to additional risks, such as currency fluctuations, periods of illiquidity and price volatility. These risks may be heightened in connection with investments in developing countries. Refer to the fund prospectus and the Risk Factors section of this report for more information on these and other risks associated with investing in the fund.
Investments are not FDIC-insured, nor are they deposits of or guaranteed by a bank or any other entity, so they may lose value.
| Contents | |
| 1 | Letter to investors |
| 4 | The value of a $10,000 investment |
| 5 | Summary investment portfolio |
| 12 | Financial statements |
| 34 | Board of trustees and other officers |
Global stocks declined slightly during American Funds Global Balanced Fund’s most recent fiscal year. A dramatic selloff in October, the final month of the fund’s fiscal year, came amid a sharp rise in U.S. Treasury yields, intensified U.S.-China trade tensions and signs of slowing growth outside the U.S.
The U.S. equity market outperformed the rest of the world during the fiscal year, fueled by strong corporate profits and economic expansion. This is not unique to the latest year: Over the past five years, Standard & Poor’s 500 Composite Index has seen a cumulative return of 71.11%, while the MSCI ACWI (All Country World Index) ex USA has returned 8.44%. In Europe and emerging markets, stocks came under pressure from rising U.S. interest rates, a resurgent dollar, trade conflict and slowing growth in China. Global bond returns were negative as yields climbed in the U.S. and parts of Europe, driven by monetary tightening by the U.S. Federal Reserve, and political instability and currency weakness in the euro area. The MSCI ACWI, which measures global equity markets, fell 0.52%, while the Bloomberg Barclays Global Aggregate Index, which measures investment-grade bonds (rated BBB–/Baa3 and above),1 lost 2.05%.
For the 12 months ended October 31, 2018, American Funds Global Balanced Fund fell 2.85%. The fund’s peer group, represented by the Lipper Flexible Portfolio Funds Index, fell 0.62%. The 60%/40% MSCI ACWI/Bloomberg Barclays Global Aggregate Index, which blends the stock and bond indexes at 60% and 40%, respectively, fell 1.01%. Over its lifetime, the Global Balanced Fund has returned an annualized 5.36%, outpacing the 60%/40% blend’s 4.75% lifetime return. The fund made four dividend distributions during the past year, totaling 68 cents a share.
Results at a glance
Returns for periods ended October 31, 2018, with all distributions reinvested.
| Cumulative total returns | Average annual total returns | |||||||||||
| 1 year | 5 years | Lifetime (since 2/1/11) | ||||||||||
| American Funds Global Balanced Fund (Class A shares) | -2.85 | % | 3.43 | % | 5.36 | % | ||||||
| MSCI ACWI (All Country World Index)2 | -0.52 | 6.15 | 6.86 | |||||||||
| Bloomberg Barclays Global Aggregate Index3 | -2.05 | 0.33 | 1.27 | |||||||||
| 60%/40% MSCI ACWI/Bloomberg Barclays Global Aggregate Index2,3,4 | -1.01 | 3.91 | 4.75 | |||||||||
| Lipper Flexible Portfolio Funds Index5 | -0.62 | 4.67 | 5.77 | |||||||||
The market indexes are unmanaged and, therefore, have no expenses. Investors cannot invest directly in an index.
| 1 | Bond ratings, which typically range from AAA/Aaa (highest) to D (lowest), are assigned by credit rating agencies such as Standard & Poor’s, Moody’s and/or Fitch, as an indication of an issuer’s creditworthiness. |
| 2 | Source: MSCI. MSCI ACWI results reflect dividends net of withholding taxes. The index is a free float-adjusted market capitalization-weighted index that is designed to measure results of more than 40 developed and emerging equity markets. |
| 3 | Source: Bloomberg Index Services Ltd. |
| 4 | The 60%/40% MSCI ACWI/Bloomberg Barclays Global Aggregate Index blends the MSCI ACWI with the Bloomberg Barclays Global Aggregate Index by weighting their total returns at 60% and 40%, respectively. Results assume the blend is rebalanced monthly. |
| 5 | Source: Thompson Reuters Lipper. Lipper indexes track the largest mutual funds (no more than 30), represented by one share class per fund, in the corresponding Lipper category. |
| American Funds Global Balanced Fund | 1 |
Market review
U.S. stocks reached record highs in September, but the sharp drop in October left them with only small gains for the fiscal year. Meanwhile, stock markets in other advanced economies struggled as last year’s synchronized economic expansion lost steam. Many emerging markets stocks and currencies declined sharply, buffeted by a stronger U.S. dollar, rising interest rates, China’s economic slowdown and weaker renminbi, and idiosyncratic political and economic developments in Turkey, Argentina and elsewhere. Despite these challenges, we see opportunities to invest in quality emerging markets companies following the recent market turmoil.
Health care led all sectors, boosted by rising profits at major drug manufacturers in the U.S. and Europe. More stable, higher yielding sectors, including consumer staples and communication services, lagged. Rising rates hurt real estate stocks.
In the U.S., tax cuts and increased government spending drove stronger-than-expected economic growth. GDP grew 4.2% in the second quarter of 2018, the highest quarterly rate since 2014. The unemployment rate fell to its lowest level since 1969. Wage growth picked up modestly, as did inflation. The Fed lifted the benchmark interest rate four times for a total increase of 1.0 percentage point. The Fed has indicated that future interest rate decisions will depend on incoming economic data. Should the economy falter and inflation not accelerate, short-term interest rates would be unlikely to increase significantly in 2019.
European equities fell, hurt by delays in reaching a separation agreement between the U.K. and the European Union, as well as conflict between the populist Italian government and other EU member states. The European Central Bank began to phase out its asset-purchase program, but vowed to keep key rates unchanged until at least the end of summer 2019. Core inflation was muted.
In bond markets, U.S. Treasury yields rose in response to stronger economic growth and clarity over Fed policy, while yields in Japan, the U.K. and Germany were little-changed. Emerging market bonds also fell. U.S. investment-grade corporate bonds underperformed high-yield bonds. Most major currencies fell against the U.S. dollar, a headwind for the fund given its significant exposure to investments outside the U.S.
Portfolio review
The fund did not do as well as the unmanaged 60%/40% MSCI ACWI/ Bloomberg Barclays Global Aggregate Index blend over the full fiscal year. This largely reflected our emphasis on equity holdings in Europe and emerging markets, as well as our high exposure to stocks with attractive dividend yields. The U.S. equity market and growth stocks with low dividend yields both did well; the fund was disadvantaged by its lower holdings in these areas. Nevertheless, we continue to find more attractively valued equity investments in Europe than in the U.S. We also believe that more stable, high-dividend-paying companies are likely to hold up better in weak markets, while providing consistent income.
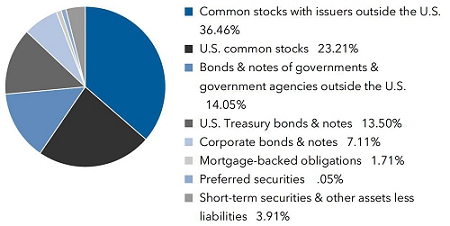
American Funds Global Balanced Fund strives for the balanced accomplishment of three objectives: long-term growth of capital, conservation of principal and current income. The increase in interest rates over the past year has improved current income in the bond portfolio. We also believe that the fund’s defensive tilt will support conservation of principal if markets remain unsettled. Our asset allocation remained well balanced, with 60% of assets in equities, 36% in bonds and 4% in cash and equivalents (includes short-term securities, accrued income and other assets less liabilities) as of October 31.
Over the fiscal year, stock selection in the materials, consumer discretionary and health care sectors boosted portfolio returns, while positions in financials and industrials lagged, as did holdings among the less-cyclical utilities and consumer staples sectors. In particular, tobacco companies in the fund were hurt by concerns about nicotine regulation in the U.S., as well as competition from vaping and heat-not-burn products.
The fund was hurt by modest holdings in the information technology sector. Within the sector, Chinese internet companies hurt fund returns. On the other hand, Netflix, benefiting from strong subscriber growth for most of the year, was a major positive contributor to the portfolio’s results. Within the financials sector, investments in European banks weighed on fund returns.
Among the 10 largest equity holdings, seven rose in price over the period. Microsoft and Netflix advanced amid a rally
| 2 | American Funds Global Balanced Fund |
in technology stocks. In the health care sector, Novartis and Abbott rose, while AbbVie lost its gain for the year in the October selloff. Royal Dutch Shell and TOTAL rose on higher oil prices. In the tobacco sector, Altria rose and Imperial Brands and Philip Morris both declined.
Within the fixed income portfolio, exposure to emerging market debt hurt results as this sector came under pressure for many of the same reasons that hurt emerging markets equities. Limited allocation to the euro was positive, as the currency declined against the dollar.
The road ahead
Political and trade risks may well be headwinds for global economic growth in the year ahead, both inside and outside the U.S. Rising interest rates, inflation and recent weakness in the housing and automotive markets suggest the U.S. may be approaching a cyclical peak, despite still-strong GDP growth and rising employment. The midterm elections left the U.S. Congress divided, making further fiscal stimulus via tax cuts unlikely. Meanwhile, the outlook for U.S. corporate profit growth is becoming more uncertain at a time when corporate debt is elevated.
The U.S. trade dispute with China could disrupt economic activity in both countries, particularly if the U.S. imposes significant additional tariffs on Chinese imports, as the administration has threatened. China has already seen a slowdown in growth but has taken initial efforts to stimulate its economy, with more stimulus likely if its domestic economy is pressured by further U.S. action.
In Europe, the U.K.’s future relationship with the European Union remains uncertain amid contentious negotiations and conflict within the U.K. government. In Italy, a new populist government has proposed a budget with increased spending at odds with EU budget guidelines. Ultimately, we expect this dispute to be resolved without jeopardizing the eurozone but with twists and turns along the way. German Chancellor Angela Merkel, a stabilizing influence in Europe, announced that she would step down as leader of her party but remain atop the government until 2021, although it is possible that a successor will take office sooner. In Latin America, new leaders in Mexico and Brazil may change the trajectory of economic policy, with some concern about the direction in Mexico and optimism about Brazil.
While there is reason for caution in the global outlook, there are broad themes that offer opportunity. Our equity investments, particularly in health care and technology, gain us exposure to innovations with significant growth potential. We also have a positive view of the long-term opportunity for growth in developing countries, which can benefit multinationals in the developed world as well as local companies.
Within fixed income, we continue to see pockets of opportunities in emerging markets, such as Mexico and Poland, where selling in response to higher U.S. rates belies underlying strengths. The fund also has invested in U.S. Treasury Inflation-Protected Securities, given the possibility of accelerating inflation. We are being cautious on corporate credit in light of rich valuations and, in some cases, declining fundamentals.
We welcome new shareholders to the fund and we thank you for your trust. We look forward to reporting to you again in six months.
Cordially,

Eric S. Richter
Vice Chairman
December 12, 2018
For current information about the fund, visit americanfunds.com.
| American Funds Global Balanced Fund | 3 |
The value of a $10,000 investment
How a $10,000 investment has grown (for the period February 1, 2011, to October 31, 2018, with distributions reinvested)
Fund results shown are for Class A shares and reflect deduction of the maximum sales charge of 5.75% on the $10,000 investment.1 Thus, the net amount invested was $9,425. Results are for past periods and are not predictive of results for future periods. Current and future results may be lower or higher than those shown. Share prices and returns will vary, so investors may lose money. For current information and month-end results, visit americanfunds.com.

| 1 | As outlined in the prospectus, the sales charge is reduced for accounts (and aggregated investments) of $25,000 or more and is eliminated for purchases of $1 million or more. There is no sales charge on dividends or capital gain distributions that are reinvested in additional shares. |
| 2 | The market indexes are unmanaged and, therefore, have no expenses. Investors cannot invest directly in an index. |
| 3 | Results reflect dividends net of withholding taxes. |
| 4 | Source: MSCI. |
| 5 | Results of the Lipper Flexible Portfolio Funds Index do not reflect any sales charges. |
| 6 | Computed from data supplied by the U.S. Department of Labor, Bureau of Labor Statistics. |
| 7 | Source: Bloomberg Index Services Ltd. |
The results shown are before taxes on fund distributions and sale of fund shares.
Average annual total returns based on a $1,000 investment (for periods ended October 31, 2018)*
| 1 year | 5 years | Lifetime (since 2/1/11) | ||||
| Class A shares | -8.44% | 2.22% | 4.55% |
| * | Assumes reinvestment of all distributions and payment of the maximum 5.75% sales charge. |
| Investment results assume all distributions are reinvested and reflect applicable fees and expenses. | |
| 4 | American Funds Global Balanced Fund |
Summary investment portfolio October 31, 2018
| Investment mix by security type | Percent of net assets |
| Five largest sectors in common stock holdings | Percent of net assets | |||
| Health care | 8.81 | % | ||
| Energy | 7.93 | |||
| Consumer staples | 7.20 | |||
| Financials | 7.09 | |||
| Communication services | 6.27 | |||
| Currency diversification | Percent of net assets |
| Equity securities | Bonds & notes | Forward currency contracts | Short-term securities & other assets less liabilities | Total | ||||||||||||||||
| U.S. dollars | 25.90 | % | 22.34 | % | .57 | % | 3.91 | % | 52.72 | % | ||||||||||
| Euros | 7.32 | 3.47 | (.04 | ) | — | 10.75 | ||||||||||||||
| British pounds | 8.23 | .67 | .01 | — | 8.91 | |||||||||||||||
| Japanese yen | 4.21 | 2.76 | 1.78 | — | 8.75 | |||||||||||||||
| Hong Kong dollars | 4.65 | — | — | — | 4.65 | |||||||||||||||
| Swiss francs | 3.54 | — | — | — | 3.54 | |||||||||||||||
| Candian dollar | 2.00 | .29 | (.19 | ) | — | 2.10 | ||||||||||||||
| South Korean won | 1.24 | .43 | (.25 | ) | — | 1.42 | ||||||||||||||
| Mexican peso | — | 1.30 | — | — | 1.30 | |||||||||||||||
| Indian rupee | .82 | .57 | (.47 | ) | — | .92 | ||||||||||||||
| Other currencies | 1.81 | 4.54 | (1.41 | ) | — | 4.94 | ||||||||||||||
| Total | 100.00 | % | ||||||||||||||||||
| Common stocks 59.67% | Shares | Value (000) | ||||||
| Health care 8.81% | ||||||||
| Novartis AG | 2,604,950 | $ | 228,229 | |||||
| Abbott Laboratories | 3,182,879 | 219,428 | ||||||
| AbbVie Inc. | 2,661,800 | 207,221 | ||||||
| Gilead Sciences, Inc. | 2,262,300 | 154,244 | ||||||
| Amgen Inc. | 616,246 | 118,806 | ||||||
| Daiichi Sankyo Co., Ltd. | 2,862,000 | 109,422 | ||||||
| Thermo Fisher Scientific Inc. | 436,000 | 101,871 | ||||||
| Stryker Corp. | 560,150 | 90,868 | ||||||
| Other securities | 219,216 | |||||||
| 1,449,305 | ||||||||
| American Funds Global Balanced Fund | 5 |
| Common stocks (continued) | Shares | Value (000) | ||||||
| Energy 7.93% | ||||||||
| Royal Dutch Shell PLC, Class B | 7,799,400 | $ | 255,710 | |||||
| Royal Dutch Shell PLC, Class A (GBP denominated) | 2,710,056 | 86,617 | ||||||
| TOTAL SA | 3,486,474 | 205,188 | ||||||
| BP PLC | 17,491,351 | 126,834 | ||||||
| Exxon Mobil Corp. | 1,391,000 | 110,835 | ||||||
| Enbridge Inc. (CAD denominated) | 2,354,402 | 73,362 | ||||||
| Enbridge Inc. (CAD denominated)1 | 758,336 | 23,630 | ||||||
| Canadian Natural Resources, Ltd. (CAD denominated) | 3,428,000 | 94,055 | ||||||
| Other securities | 328,513 | |||||||
| 1,304,744 | ||||||||
| Consumer staples 7.20% | ||||||||
| Imperial Brands PLC | 6,347,600 | 215,251 | ||||||
| Altria Group, Inc. | 2,849,795 | 185,351 | ||||||
| Philip Morris International Inc. | 2,064,218 | 181,796 | ||||||
| British American Tobacco PLC | 3,376,000 | 146,436 | ||||||
| British American Tobacco PLC (ADR) | 454,516 | 19,726 | ||||||
| Pernod Ricard SA | 683,753 | 104,396 | ||||||
| Walgreens Boots Alliance, Inc. | 1,245,200 | 99,330 | ||||||
| Nestlé SA | 1,158,291 | 97,894 | ||||||
| Other securities | 135,063 | |||||||
| 1,185,243 | ||||||||
| Financials 7.09% | ||||||||
| Zurich Insurance Group AG | 579,125 | 180,094 | ||||||
| HDFC Bank Ltd. | 3,701,520 | 95,698 | ||||||
| JPMorgan Chase & Co. | 771,800 | 84,142 | ||||||
| Other securities | 807,566 | |||||||
| 1,167,500 | ||||||||
| Communication services 6.27% | ||||||||
| Netflix, Inc.2 | 664,750 | 200,608 | ||||||
| Verizon Communications Inc. | 2,631,000 | 150,204 | ||||||
| Tencent Holdings Ltd. | 3,992,800 | 135,946 | ||||||
| Other securities | 544,572 | |||||||
| 1,031,330 | ||||||||
| Information technology 5.69% | ||||||||
| Microsoft Corp. | 2,389,000 | 255,169 | ||||||
| Broadcom Inc. | 803,700 | 179,619 | ||||||
| Intel Corp. | 3,229,500 | 151,399 | ||||||
| Taiwan Semiconductor Manufacturing Co., Ltd. | 11,975,000 | 90,558 | ||||||
| Other securities | 259,226 | |||||||
| 935,971 | ||||||||
| Industrials 3.51% | ||||||||
| General Dynamics Corp. | 700,300 | 120,858 | ||||||
| SMC Corp. | 329,900 | 105,693 | ||||||
| Other securities | 352,029 | |||||||
| 578,580 | ||||||||
| Utilities 3.48% | ||||||||
| Engie SA | 8,273,677 | 110,346 | ||||||
| Engie SA, bonus shares3 | 2,245,759 | 29,951 | ||||||
| China Gas Holdings Ltd. | 35,160,946 | 111,196 | ||||||
| Other securities | 321,486 | |||||||
| 572,979 | ||||||||
| Consumer discretionary 3.20% | ||||||||
| Alibaba Group Holding Ltd. (ADR)2 | 904,500 | 128,692 | ||||||
| Other securities | 397,473 | |||||||
| 526,165 | ||||||||
| 6 | American Funds Global Balanced Fund |
| Shares | Value (000) | |||||||
| Materials 2.31% | ||||||||
| Rio Tinto PLC | 3,533,200 | $ | 171,771 | |||||
| Vale SA, ordinary nominative (ADR) | 7,610,697 | 114,922 | ||||||
| Other securities | 93,015 | |||||||
| 379,708 | ||||||||
| Real estate 0.86% | ||||||||
| Other securities | 142,352 | |||||||
| Miscellaneous 3.32% | ||||||||
| Other common stocks in initial period of acquisition | 546,187 | |||||||
| Total common stocks (cost: $9,145,712,000) | 9,820,064 | |||||||
| Preferred securities 0.05% | ||||||||
| Financials 0.05% | ||||||||
| Other securities | 8,091 | |||||||
| Total preferred securities (cost: $6,859,000) | 8,091 | |||||||
| Bonds, notes & other debt instruments 36.37% | Principal amount (000) | |||||||
| Bonds & notes of governments & government agencies outside the U.S. 14.05% | ||||||||
| Japan, Series 346, 0.10% 2027 | ¥ | 12,820,000 | 114,169 | |||||
| Japan 0.10%–2.30% 2021–20484 | 36,670,498 | 340,521 | ||||||
| Poland (Republic of) 1.50%–5.75% 2020–2027 | PLN | 649,151 | 181,414 | |||||
| Poland (Republic of) 3.25%–4.00% 2024–2026 | $ | 10,410 | 10,085 | |||||
| United Mexican States, Series M, 5.75% 2026 | MXN | 2,038,400 | 84,027 | |||||
| United Mexican States 4.15%–4.35% 2027–2047 | $ | 8,070 | 7,207 | |||||
| United Mexican States 6.50%–10.00% 2020–2042 | MXN | 2,719,200 | 129,128 | |||||
| Other securities | 1,445,925 | |||||||
| Total bonds & notes of governments & government agencies outside the U.S. | 2,312,476 | |||||||
| U.S. Treasury bonds & notes 13.50% | ||||||||
| U.S. Treasury 11.62% | ||||||||
| U.S. Treasury 1.75% 2022 | $ | 176,135 | 168,801 | |||||
| U.S. Treasury 1.875% 2022 | 170,147 | 163,341 | ||||||
| U.S. Treasury 2.50% 2023 | 142,006 | 139,222 | ||||||
| U.S. Treasury 2.625% 2023 | 106,970 | 105,470 | ||||||
| U.S. Treasury 2.75% 2023 | 289,925 | 287,197 | ||||||
| U.S. Treasury 2.75% 2028 | 160,950 | 155,756 | ||||||
| U.S. Treasury 2.875% 2028 | 93,250 | 91,108 | ||||||
| U.S. Treasury 1.13%–3.00% 2019–20485 | 833,999 | 800,914 | ||||||
| 1,911,809 | ||||||||
| U.S. Treasury inflation-protected securities 1.88% | ||||||||
| U.S. Treasury Inflation-Protected Security 0.125% 20244 | 111,445 | 106,206 | ||||||
| U.S. Treasury Inflation-Protected Securities 0.14%–2.38% 2022–20444 | 212,061 | 203,458 | ||||||
| 309,664 | ||||||||
| Total U.S. Treasury bonds & notes | 2,221,473 | |||||||
| Corporate bonds & notes 7.11% | ||||||||
| Financials 1.65% | ||||||||
| Banco Nacional de Comercio Exterior SNC 3.80% 2026 (UST Yield Curve Rate T Note Constant Maturity 5 year + 3.00% on 8/11/2021)1,6 | 1,550 | 1,493 | ||||||
| Other securities | 270,578 | |||||||
| 272,071 | ||||||||
| Health care 1.18% | ||||||||
| Abbott Laboratories 3.75% 2026 | 2,266 | 2,235 | ||||||
| AbbVie Inc. 2.50%–4.50% 2020–2035 | 12,787 | 12,246 | ||||||
| Other securities | 180,383 | |||||||
| 194,864 | ||||||||
| American Funds Global Balanced Fund | 7 |
| Bonds, notes & other debt instruments (continued) | Principal amount (000) | Value (000) | ||||||
| Corporate bonds & notes (continued) | ||||||||
| Consumer staples 0.88% | ||||||||
| Altria Group, Inc. 2.63%–4.75% 2020–2021 | $ | 3,200 | $ | 3,232 | ||||
| British American Tobacco PLC 2.30%–4.39% 2020–20371 | 54,670 | 52,770 | ||||||
| Philip Morris International Inc. 2.00%–4.25% 2020–2044 | 7,710 | 7,342 | ||||||
| Reynolds American Inc. 4.00%–4.45% 2022–2025 | 4,860 | 4,847 | ||||||
| Other securities | 77,254 | |||||||
| 145,445 | ||||||||
| Energy 0.87% | ||||||||
| Petróleos Mexicanos 6.35%–6.88% 2026–20481 | 17,105 | 15,916 | ||||||
| Other securities | 126,463 | |||||||
| 142,379 | ||||||||
| Information technology 0.16% | ||||||||
| Microsoft Corp. 2.40%–3.30% 2026–2027 | 13,168 | 12,174 | ||||||
| Other securities | 14,255 | |||||||
| 26,429 | ||||||||
| Other 2.37% | ||||||||
| Other securities | 389,091 | |||||||
| Total corporate bonds & notes | 1,170,279 | |||||||
| Mortgage-backed obligations 1.71% | ||||||||
| Other 1.71% | ||||||||
| Other securities | 281,534 | |||||||
| Total mortgage-backed obligations | 281,534 | |||||||
| Total bonds, notes & other debt instruments (cost: $6,240,145,000) | 5,985,762 | |||||||
| Short-term securities 4.05% | ||||||||
| Bank of Montreal 2.17%–2.24% due 11/21/2018–11/27/2018 | 90,000 | 89,857 | ||||||
| Other securities | 576,420 | |||||||
| Total short-term securities (cost: $666,279,000) | 666,277 | |||||||
| Total investment securities 100.14% (cost: $16,058,995,000) | 16,480,194 | |||||||
| Other assets less liabilities (0.14)% | (22,856 | ) | ||||||
| Net assets 100.00% | $ | 16,457,338 | ||||||
This summary investment portfolio is designed to streamline the report and help investors better focus on the fund’s principal holdings. See the inside back cover for details on how to obtain a complete schedule of portfolio holdings.
As permitted by U.S. Securities and Exchange Commission regulations, “Miscellaneous” securities include holdings in their first year of acquisition that have not previously been publicly disclosed.
“Other securities” includes all issues that are not disclosed separately in the summary investment portfolio.
Futures contracts
| Contracts | Type | Number of contracts | Expiration | Notional amount (000) | 7 | Value
at 10/31/2018 (000) | 8 | Unrealized appreciation (depreciation) at 10/31/2018 (000) | ||||||||||
| 5 Year U.S. Treasury Note Futures | Long | 326 | January 2019 | $ | 32,600 | $ | 36,637 | $ | 47 | |||||||||
| 10 Year U.S. Treasury Note Futures | Long | 206 | December 2018 | 20,600 | 24,398 | — | 9 | |||||||||||
| 10 Year Ultra U.S. Treasury Note Futures | Long | 105 | December 2018 | 10,500 | 13,136 | (87 | ) | |||||||||||
| $ | (40 | ) | ||||||||||||||||
| 8 | American Funds Global Balanced Fund |
Forward currency contracts
| Contract amount | Unrealized appreciation (depreciation) | |||||||||
| Purchases (000) | Sales (000) | Counterparty | Settlement date | at 10/31/2018 (000) | ||||||
| USD27,958 | EUR24,080 | Morgan Stanley | 11/2/2018 | $ | 680 | |||||
| USD15,058 | PLN55,470 | Citibank | 11/2/2018 | 602 | ||||||
| EUR24,080 | USD27,259 | Bank of America, N.A. | 11/2/2018 | 20 | ||||||
| PLN55,470 | USD14,475 | Goldman Sachs | 11/2/2018 | (18 | ) | |||||
| USD20,506 | CAD26,290 | JPMorgan Chase | 11/5/2018 | 534 | ||||||
| JPY1,703,962 | EUR12,980 | Goldman Sachs | 11/5/2018 | 399 | ||||||
| USD20,199 | ILS73,625 | Morgan Stanley | 11/5/2018 | 397 | ||||||
| JPY3,465,158 | USD30,548 | Goldman Sachs | 11/5/2018 | 173 | ||||||
| EUR12,980 | JPY1,684,021 | Bank of America, N.A. | 11/5/2018 | (222 | ) | |||||
| CAD26,290 | USD20,284 | JPMorgan Chase | 11/5/2018 | (312 | ) | |||||
| USD11,167 | INR817,000 | Goldman Sachs | 11/6/2018 | 127 | ||||||
| INR577,100 | USD7,743 | Goldman Sachs | 11/6/2018 | 56 | ||||||
| USD3,575 | INR262,500 | JPMorgan Chase | 11/6/2018 | 27 | ||||||
| INR502,400 | USD6,803 | Citibank | 11/6/2018 | (14 | ) | |||||
| USD64,530 | GBP49,000 | Bank of America, N.A. | 11/7/2018 | 1,880 | ||||||
| JPY3,588,346 | EUR27,000 | Citibank | 11/7/2018 | 1,219 | ||||||
| USD8,292 | CAD10,700 | Citibank | 11/7/2018 | 163 | ||||||
| USD5,617 | KRW6,239,800 | Goldman Sachs | 11/8/2018 | 141 | ||||||
| BRL14,840 | USD4,025 | Goldman Sachs | 11/8/2018 | (42 | ) | |||||
| USD3,679 | BRL14,840 | Citibank | 11/8/2018 | (305 | ) | |||||
| USD30,716 | CLP20,564,500 | JPMorgan Chase | 11/9/2018 | 1,167 | ||||||
| USD28,238 | EUR24,500 | Goldman Sachs | 11/9/2018 | 468 | ||||||
| CLP170,000 | USD249 | Citibank | 11/9/2018 | (5 | ) | |||||
| CLP20,394,500 | USD30,080 | Goldman Sachs | 11/9/2018 | (775 | ) | |||||
| JPY6,068,379 | USD53,381 | JPMorgan Chase | 11/15/2018 | 458 | ||||||
| USD16,506 | CAD21,125 | Citibank | 11/15/2018 | 454 | ||||||
| USD12,302 | THB396,000 | Citibank | 11/15/2018 | 352 | ||||||
| USD7,028 | CAD9,000 | Goldman Sachs | 11/15/2018 | 189 | ||||||
| JPY5,467,800 | USD48,423 | Morgan Stanley | 11/15/2018 | 87 | ||||||
| EUR19,599 | USD22,787 | Citibank | 11/15/2018 | (562 | ) | |||||
| USD29,680 | PLN111,600 | Goldman Sachs | 11/16/2018 | 587 | ||||||
| USD13,281 | GBP10,100 | Morgan Stanley | 11/16/2018 | 363 | ||||||
| EUR25,813 | PLN111,600 | Goldman Sachs | 11/16/2018 | 180 | ||||||
| USD13,973 | KRW15,800,000 | JPMorgan Chase | 11/16/2018 | 102 | ||||||
| USD14,744 | MYR61,400 | JPMorgan Chase | 11/16/2018 | 77 | ||||||
| USD17,244 | INR1,273,738 | Morgan Stanley | 11/16/2018 | 53 | ||||||
| PLN11,900 | USD3,137 | JPMorgan Chase | 11/16/2018 | (35 | ) | |||||
| USD16,399 | INR1,224,700 | Goldman Sachs | 11/16/2018 | (130 | ) | |||||
| USD11,113 | BRL42,000 | JPMorgan Chase | 11/16/2018 | (153 | ) | |||||
| INR1,943,200 | USD26,423 | JPMorgan Chase | 11/16/2018 | (197 | ) | |||||
| JPY5,092,100 | USD45,515 | JPMorgan Chase | 11/16/2018 | (334 | ) | |||||
| NOK111,700 | USD13,629 | Citibank | 11/16/2018 | (369 | ) | |||||
| EUR22,273 | USD25,734 | Goldman Sachs | 11/16/2018 | (475 | ) | |||||
| GBP39,045 | USD51,343 | Morgan Stanley | 11/16/2018 | (1,401 | ) | |||||
| USD7,412 | CLP5,087,500 | JPMorgan Chase | 11/19/2018 | 101 | ||||||
| USD7,403 | CLP5,087,500 | Citibank | 11/19/2018 | 92 | ||||||
| USD20,601 | INR1,539,700 | Citibank | 11/19/2018 | (172 | ) | |||||
| EUR9,410 | USD10,876 | Citibank | 11/19/2018 | (201 | ) | |||||
| EUR9,410 | USD10,876 | Bank of America, N.A. | 11/19/2018 | (202 | ) | |||||
| EUR9,270 | USD10,719 | Bank of New York Mellon | 11/19/2018 | (203 | ) | |||||
| CLP10,175,000 | USD15,162 | Citibank | 11/19/2018 | (540 | ) | |||||
| EUR7,203 | PLN31,150 | Citibank | 11/20/2018 | 50 | ||||||
| JPY2,500,000 | USD22,216 | Bank of America, N.A. | 11/20/2018 | (28 | ) | |||||
| USD21,479 | AUD30,400 | Morgan Stanley | 11/20/2018 | (54 | ) | |||||
| JPY760,071 | USD6,815 | Morgan Stanley | 11/20/2018 | (69 | ) | |||||
| GBP5,070 | USD6,696 | Goldman Sachs | 11/20/2018 | (210 | ) | |||||
| NOK76,376 | USD9,380 | Goldman Sachs | 11/20/2018 | (312 | ) | |||||
| USD2,285 | BRL8,500 | Goldman Sachs | 11/21/2018 | 6 | ||||||
| TRY24,700 | USD3,774 | Citibank | 11/26/2018 | 572 | ||||||
| USD10,954 | COP34,192,000 | Goldman Sachs | 11/26/2018 | 347 | ||||||
| USD4,486 | MXN86,150 | Bank of New York Mellon | 11/26/2018 | 263 | ||||||
| JPY1,528,105 | EUR11,850 | Bank of America, N.A. | 11/26/2018 | 119 | ||||||
| American Funds Global Balanced Fund | 9 |
Forward currency contracts (continued)
| Contract amount | Unrealized appreciation (depreciation) | |||||||||
| Purchases (000) | Sales (000) | Counterparty | Settlement date | at 10/31/2018 (000) | ||||||
| USD12,116 | MYR50,500 | JPMorgan Chase | 11/26/2018 | $ | 55 | |||||
| USD4,284 | TRY24,700 | Morgan Stanley | 11/26/2018 | (62 | ) | |||||
| EUR4,845 | USD5,570 | Morgan Stanley | 11/26/2018 | (70 | ) | |||||
| JPY2,954,700 | USD26,350 | Goldman Sachs | 11/26/2018 | (115 | ) | |||||
| MXN86,150 | USD4,391 | Bank of America, N.A. | 11/26/2018 | (169 | ) | |||||
| GBP11,000 | USD14,363 | Bank of America, N.A. | 11/26/2018 | (287 | ) | |||||
| USD44,506 | EUR38,610 | Goldman Sachs | 11/28/2018 | 676 | ||||||
| USD13,792 | THB449,500 | Citibank | 11/28/2018 | 223 | ||||||
| USD16,934 | BRL57,000 | Citibank | 11/29/2018 | 1,662 | ||||||
| USD3,835 | BRL12,950 | Citibank | 11/29/2018 | 366 | ||||||
| USD5,290 | INR390,400 | Citibank | 11/29/2018 | 30 | ||||||
| EUR7,000 | USD7,997 | Citibank | 11/29/2018 | (50 | ) | |||||
| GBP5,700 | USD7,407 | Citibank | 11/29/2018 | (112 | ) | |||||
| EUR18,836 | USD21,673 | Goldman Sachs | 11/29/2018 | (289 | ) | |||||
| USD22,524 | INR1,657,300 | JPMorgan Chase | 11/30/2018 | 195 | ||||||
| USD15,009 | ZAR220,600 | Citibank | 11/30/2018 | 112 | ||||||
| INR22,000 | USD299 | JPMorgan Chase | 11/30/2018 | (2 | ) | |||||
| JPY1,663,975 | EUR13,100 | Goldman Sachs | 11/30/2018 | (94 | ) | |||||
| USD14,484 | PLN55,470 | Goldman Sachs | 12/3/2018 | 17 | ||||||
| USD27,324 | EUR24,080 | Bank of America, N.A. | 12/3/2018 | (25 | ) | |||||
| BRL15,700 | USD4,251 | Goldman Sachs | 12/3/2018 | (46 | ) | |||||
| USD3,794 | BRL15,700 | Bank of America, N.A. | 12/3/2018 | (411 | ) | |||||
| USD14,724 | INR1,090,000 | Citibank | 12/4/2018 | 46 | ||||||
| USD7,187 | INR529,000 | Citibank | 12/6/2018 | 65 | ||||||
| USD21,771 | KRW24,600,000 | Morgan Stanley | 1/17/2019 | 122 | ||||||
| TRY25,800 | USD3,797 | Citibank | 1/24/2019 | 585 | ||||||
| USD4,317 | TRY25,800 | Morgan Stanley | 1/24/2019 | (66 | ) | |||||
| USD16,380 | BRL55,250 | Citibank | 2/25/2019 | 1,681 | ||||||
| USD27,494 | BRL92,500 | JPMorgan Chase | 3/15/2019 | 2,919 | ||||||
| BRL28,800 | USD7,182 | Citibank | 3/15/2019 | 469 | ||||||
| USD4,244 | BRL14,800 | JPMorgan Chase | 3/15/2019 | 312 | ||||||
| BRL26,600 | USD6,774 | JPMorgan Chase | 3/15/2019 | 293 | ||||||
| BRL51,400 | USD13,458 | JPMorgan Chase | 3/15/2019 | 197 | ||||||
| BRL500 | USD125 | Bank of America, N.A. | 3/15/2019 | 8 | ||||||
| $ | 13,400 | |||||||||
The following footnotes apply to either the individual securities noted or one or more of the securities aggregated and listed as a single line item.
| 1 | Acquired in a transaction exempt from registration under Rule 144A or Section 4(2) of the Securities Act of 1933. May be resold in the U.S. in transactions exempt from registration, normally to qualified institutional buyers. The total value of all such securities, including those in “Other securities,” was $923,573,000, which represented 5.61% of the net assets of the fund. |
| 2 | Security did not produce income during the last 12 months. |
| 3 | Valued under fair value procedures adopted by authority of the board of trustees. The total value of the security was $29,951,000, which represented .18% of the net assets of the fund. |
| 4 | Index-linked bond whose principal amount moves with a government price index. |
| 5 | All or a portion of this security was pledged as collateral. The total value of pledged collateral was $1,151,000, which represented .01% of the net assets of the fund. |
| 6 | Step bond; coupon rate may change at a later date. |
| 7 | Notional amount is calculated based on the number of contracts and notional contract size. |
| 8 | Value is calculated based on the notional amount and current market price. |
| 9 | Amount less than one thousand. |
| 10 | American Funds Global Balanced Fund |
Key to abbreviations and symbols
ADR = American Depositary Receipts
AUD = Australian dollars
BRL = Brazilian reais
CAD = Canadian dollars
CLP = Chilean pesos
COP = Colombian pesos
EUR = Euros
GBP = British pounds
ILS = Israeli shekels
INR = Indian rupees
JPY/¥ = Japanese yen
KRW = South Korean won
MXN = Mexican pesos
MYR = Malaysian ringgits
NOK = Norwegian kroner
PLN = Polish zloty
THB = Thai baht
TRY = Turkish lira
USD/$ = U.S. dollars
ZAR = South African rand
See notes to financial statements
| American Funds Global Balanced Fund | 11 |
| Financial statements | |
| Statement of assets and liabilities at October 31, 2018 |
(dollars in thousands) |
| Assets: | ||||||||
| Investment securities in unaffiliated issuers, at value (cost: $16,058,995) | $ | 16,480,194 | ||||||
| Cash | 5,685 | |||||||
| Cash denominated in currencies other than U.S. dollars (cost: $4,777) | 4,776 | |||||||
| Unrealized appreciation on open forward currency contracts | 22,538 | |||||||
| Receivables for: | ||||||||
| Sales of investments | $ | 221,540 | ||||||
| Sales of fund’s shares | 14,092 | |||||||
| Dividends and interest | 73,997 | |||||||
| Other | 44 | 309,673 | ||||||
| 16,822,866 | ||||||||
| Liabilities: | ||||||||
| Unrealized depreciation on open forward currency contracts | 9,138 | |||||||
| Payables for: | ||||||||
| Purchases of investments | 334,282 | |||||||
| Repurchases of fund’s shares | 8,885 | |||||||
| Investment advisory services | 6,321 | |||||||
| Services provided by related parties | 2,937 | |||||||
| Trustees’ deferred compensation | 1,610 | |||||||
| Variation margin on futures contracts | 191 | |||||||
| Other | 2,164 | 356,390 | ||||||
| Net assets at October 31, 2018 | $ | 16,457,338 | ||||||
| Net assets consist of: | ||||||||
| Capital paid in on shares of beneficial interest | $ | 16,019,338 | ||||||
| Total distributable earnings | 438,000 | |||||||
| Net assets at October 31, 2018 | $ | 16,457,338 |
(dollars and shares in thousands, except per-share amounts)
Shares of beneficial interest issued and outstanding (no stated par value) —
unlimited shares authorized (540,435 total shares outstanding)
| Net assets | Shares outstanding | Net asset value per share | ||||||||||
| Class A | $ | 5,090,984 | 167,229 | $ | 30.44 | |||||||
| Class C | 606,042 | 19,963 | 30.36 | |||||||||
| Class T | 10 | — | * | 30.43 | ||||||||
| Class F-1 | 157,962 | 5,187 | 30.45 | |||||||||
| Class F-2 | 1,601,929 | 52,598 | 30.46 | |||||||||
| Class F-3 | 421,027 | 13,831 | 30.44 | |||||||||
| Class 529-A | 253,493 | 8,332 | 30.42 | |||||||||
| Class 529-C | 74,840 | 2,469 | 30.31 | |||||||||
| Class 529-E | 13,878 | 457 | 30.39 | |||||||||
| Class 529-T | 10 | — | * | 30.43 | ||||||||
| Class 529-F-1 | 31,700 | 1,042 | 30.44 | |||||||||
| Class R-1 | 4,821 | 159 | 30.38 | |||||||||
| Class R-2 | 43,733 | 1,442 | 30.33 | |||||||||
| Class R-2E | 1,746 | 58 | 30.37 | |||||||||
| Class R-3 | 57,192 | 1,882 | 30.39 | |||||||||
| Class R-4 | 41,887 | 1,376 | 30.44 | |||||||||
| Class R-5E | 1,699 | 56 | 30.43 | |||||||||
| Class R-5 | 22,412 | 735 | 30.48 | |||||||||
| Class R-6 | 8,031,973 | 263,619 | 30.47 | |||||||||
| * | Amount less than one thousand. |
See notes to financial statements
| 12 | American Funds Global Balanced Fund |
| Statement of operations | |
| for the year ended October 31, 2018 | (dollars in thousands) |
| Investment income: | ||||||||
| Income: | ||||||||
| Dividends (net of non-U.S. taxes of $19,473) | $ | 305,821 | ||||||
| Interest (net of non-U.S. taxes of $1,313) | 178,499 | $ | 484,320 | |||||
| Fees and expenses*: | ||||||||
| Investment advisory services | 71,808 | |||||||
| Distribution services | 24,070 | |||||||
| Transfer agent services | 7,844 | |||||||
| Administrative services | 5,944 | |||||||
| Reports to shareholders | 360 | |||||||
| Registration statement and prospectus | 884 | |||||||
| Trustees’ compensation | 525 | |||||||
| Auditing and legal | 66 | |||||||
| Custodian | 1,351 | |||||||
| Other | 394 | 113,246 | ||||||
| Net investment income | 371,074 | |||||||
| Net realized loss and unrealized depreciation: | ||||||||
| Net realized (loss) gain on: | ||||||||
| Investments in unaffiliated issuers (net of non-U.S. taxes of $42) | (16,746 | ) | ||||||
| Futures contracts | (143 | ) | ||||||
| Forward currency contracts | (15,778 | ) | ||||||
| Currency transactions | 7,902 | (24,765 | ) | |||||
| Net unrealized (depreciation) appreciation on: | ||||||||
| Investments in unaffiliated issuers | (888,190 | ) | ||||||
| Futures contracts | (40 | ) | ||||||
| Forward currency contracts | 15,611 | |||||||
| Currency translations | (1,011 | ) | (873,630 | ) | ||||
| Net realized loss and unrealized depreciation | (898,395 | ) | ||||||
| Net decrease in net assets resulting from operations | $ | (527,321 | ) |
| * | Additional information related to class-specific fees and expenses is included in the notes to financial statements. |
Statements of changes in net assets
(dollars in thousands)
| Year ended October 31 | ||||||||
| 2018 | 2017 | |||||||
| Operations: | ||||||||
| Net investment income | $ | 371,074 | $ | 248,439 | ||||
| Net realized (loss) gain | (24,765 | ) | 211,995 | |||||
| Net unrealized (depreciation) appreciation | (873,630 | ) | 884,743 | |||||
| Net (decrease) increase in net assets resulting from operations | (527,321 | ) | 1,345,177 | |||||
| Distributions paid to shareholders | (583,632 | ) | (232,123 | ) | ||||
| Net capital share transactions | 3,322,971 | 2,628,352 | ||||||
| Total increase in net assets | 2,212,018 | 3,741,406 | ||||||
| Net assets: | ||||||||
| Beginning of year | 14,245,320 | 10,503,914 | ||||||
| End of year | $ | 16,457,338 | $ | 14,245,320 | ||||
See notes to financial statements
| American Funds Global Balanced Fund | 13 |
Notes to financial statements
1. Organization
American Funds Global Balanced Fund (the “fund”) is registered under the Investment Company Act of 1940 as an open-end, diversified management investment company. The fund seeks the balanced accomplishment of three objectives: long-term growth of capital, conservation of principal and current income.
The fund has 19 share classes consisting of six retail share classes (Classes A, C, T, F-1, F-2 and F-3), five 529 college savings plan share classes (Classes 529-A, 529-C, 529-E, 529-T and 529-F-1) and eight retirement plan share classes (Classes R-1, R-2, R-2E, R-3, R-4, R-5E, R-5 and R-6). The 529 college savings plan share classes can be used to save for college education. The retirement plan share classes are generally offered only through eligible employer-sponsored retirement plans. The fund’s share classes are described further in the following table:
| Share class | Initial sales charge | Contingent deferred sales charge upon redemption |
Conversion feature | ||||
| Classes A and 529-A | Up to 5.75% | None (except 1% for certain redemptions within 18 months of purchase without an initial sales charge) | None | ||||
| Class C | None | 1% for redemptions within one year of purchase | Class C converts to Class F-1 after 10 years | ||||
| Class 529-C | None | 1% for redemptions within one year of purchase | Class 529-C converts to Class 529-A after 10 years* | ||||
| Class 529-E | None | None | None | ||||
| Classes T and 529-T† | Up to 2.50% | None | None | ||||
| Classes F-1, F-2, F-3 and 529-F-1 | None | None | None | ||||
| Classes R-1, R-2, R-2E, R-3, R-4, R-5E, R-5 and R-6 | None | None | None |
| * | Effective December 1, 2017. |
| † | Class T and 529-T shares are not available for purchase. |
Holders of all share classes have equal pro rata rights to the assets, dividends and liquidation proceeds of the fund. Each share class has identical voting rights, except for the exclusive right to vote on matters affecting only its class. Share classes have different fees and expenses (“class-specific fees and expenses”), primarily due to different arrangements for distribution, transfer agent and administrative services. Differences in class-specific fees and expenses will result in differences in net investment income and, therefore, the payment of different per-share dividends by each share class.
2. Significant accounting policies
The fund is an investment company that applies the accounting and reporting guidance issued in Topic 946 by the U.S. Financial Accounting Standards Board. The fund’s financial statements have been prepared to comply with U.S. generally accepted accounting principles (“U.S. GAAP”). These principles require the fund’s investment adviser to make estimates and assumptions that affect reported amounts and disclosures. Actual results could differ from those estimates. Subsequent events, if any, have been evaluated through the date of issuance in the preparation of the financial statements. The fund follows the significant accounting policies described in this section, as well as the valuation policies described in the next section on valuation.
Security transactions and related investment income — Security transactions are recorded by the fund as of the date the trades are executed with brokers. Realized gains and losses from security transactions are determined based on the specific identified cost of the securities. In the event a security is purchased with a delayed payment date, the fund will segregate liquid assets sufficient to meet its payment obligations. Dividend income is recognized on the ex-dividend date and interest income is recognized on an accrual basis. Market discounts, premiums and original issue discounts on fixed-income securities are amortized daily over the expected life of the security.
Class allocations — Income, fees and expenses (other than class-specific fees and expenses) and realized and unrealized gains and losses are allocated daily among the various share classes based on their relative net assets. Class-specific fees and expenses, such as distribution, transfer agent and administrative services, are charged directly to the respective share class.
Distributions paid to shareholders — Income dividends and capital gain distributions are recorded on the ex-dividend date.
| 14 | American Funds Global Balanced Fund |
Currency translation — Assets and liabilities, including investment securities, denominated in currencies other than U.S. dollars are translated into U.S. dollars at the exchange rates supplied by one or more pricing vendors on the valuation date. Purchases and sales of investment securities and income and expenses are translated into U.S. dollars at the exchange rates on the dates of such transactions. The effects of changes in exchange rates on investment securities are included with the net realized gain or loss and net unrealized appreciation or depreciation on investments in the fund’s statement of operations. The realized gain or loss and unrealized appreciation or depreciation resulting from all other transactions denominated in currencies other than U.S. dollars are disclosed separately.
3. Valuation
Capital Research and Management Company (“CRMC”), the fund’s investment adviser, values the fund’s investments at fair value as defined by U.S. GAAP. The net asset value of each share class of the fund is generally determined as of approximately 4:00 p.m. New York time each day the New York Stock Exchange is open.
Methods and inputs — The fund’s investment adviser uses the following methods and inputs to establish the fair value of the fund’s assets and liabilities. Use of particular methods and inputs may vary over time based on availability and relevance as market and economic conditions evolve.
Equity securities are generally valued at the official closing price of, or the last reported sale price on, the exchange or market on which such securities are traded, as of the close of business on the day the securities are being valued or, lacking any sales, at the last available bid price. Prices for each security are taken from the principal exchange or market on which the security trades.
Fixed-income securities, including short-term securities, are generally valued at prices obtained from one or more pricing vendors. Vendors value such securities based on one or more of the inputs described in the following table. The table provides examples of inputs that are commonly relevant for valuing particular classes of fixed-income securities in which the fund is authorized to invest. However, these classifications are not exclusive, and any of the inputs may be used to value any other class of fixed-income security.
| Fixed-income class | Examples of standard inputs |
| All | Benchmark yields, transactions, bids, offers, quotations from dealers and trading systems, new issues, spreads and other relationships observed in the markets among comparable securities; and proprietary pricing models such as yield measures calculated using factors such as cash flows, financial or collateral performance and other reference data (collectively referred to as “standard inputs”) |
| Corporate bonds & notes; convertible securities | Standard inputs and underlying equity of the issuer |
| Bonds & notes of governments & government agencies | Standard inputs and interest rate volatilities |
| Mortgage-backed; asset-backed obligations | Standard inputs and cash flows, prepayment information, default rates, delinquency and loss assumptions, collateral characteristics, credit enhancements and specific deal information |
| Municipal securities | Standard inputs and, for certain distressed securities, cash flows or liquidation values using a net present value calculation based on inputs that include, but are not limited to, financial statements and debt contracts |
When the fund’s investment adviser deems it appropriate to do so (such as when vendor prices are unavailable or deemed to be not representative), fixed-income securities will be valued in good faith at the mean quoted bid and ask prices that are reasonably and timely available (or bid prices, if ask prices are not available) or at prices for securities of comparable maturity, quality and type.
Securities with both fixed-income and equity characteristics, or equity securities traded principally among fixed-income dealers, are generally valued in the manner described for either equity or fixed-income securities, depending on which method is deemed most appropriate by the fund’s investment adviser. Exchange-traded futures are generally valued at the official settlement price of, or the last reported sale price on, the exchange or market on which such instruments are traded, as of the close of business on the day the futures are being valued or, lacking any sales, at the last available bid price. Prices for each future are taken from the exchange or market on which the security trades. Forward currency contracts are valued at the mean of representative quoted bid and ask prices, generally based on prices supplied by one or more pricing vendors.
Securities and other assets for which representative market quotations are not readily available or are considered unreliable by the fund’s investment adviser are fair valued as determined in good faith under fair valuation guidelines adopted by authority of the fund’s board of trustees as further described. The investment adviser follows fair valuation guidelines, consistent with U.S. Securities and Exchange
| American Funds Global Balanced Fund | 15 |
Commission rules and guidance, to consider relevant principles and factors when making fair value determinations. The investment adviser considers relevant indications of value that are reasonably and timely available to it in determining the fair value to be assigned to a particular security, such as the type and cost of the security; contractual or legal restrictions on resale of the security; relevant financial or business developments of the issuer; actively traded similar or related securities; conversion or exchange rights on the security; related corporate actions; significant events occurring after the close of trading in the security; and changes in overall market conditions. In addition, the closing prices of equity securities that trade in markets outside U.S. time zones may be adjusted to reflect significant events that occur after the close of local trading but before the net asset value of each share class of the fund is determined. Fair valuations and valuations of investments that are not actively trading involve judgment and may differ materially from valuations that would have been used had greater market activity occurred.
Processes and structure — The fund’s board of trustees has delegated authority to the fund’s investment adviser to make fair value determinations, subject to board oversight. The investment adviser has established a Joint Fair Valuation Committee (the “Fair Valuation Committee”) to administer, implement and oversee the fair valuation process, and to make fair value decisions. The Fair Valuation Committee regularly reviews its own fair value decisions, as well as decisions made under its standing instructions to the investment adviser’s valuation teams. The Fair Valuation Committee reviews changes in fair value measurements from period to period and may, as deemed appropriate, update the fair valuation guidelines to better reflect the results of back testing and address new or evolving issues. The Fair Valuation Committee reports any changes to the fair valuation guidelines to the board of trustees. The fund’s board and audit committee also regularly review reports that describe fair value determinations and methods.
The fund’s investment adviser has also established a Fixed-Income Pricing Review Group to administer and oversee the fixed-income valuation process, including the use of fixed-income pricing vendors. This group regularly reviews pricing vendor information and market data. Pricing decisions, processes and controls over security valuation are also subject to additional internal reviews, including an annual control self-evaluation program facilitated by the investment adviser’s compliance group.
Classifications — The fund’s investment adviser classifies the fund’s assets and liabilities into three levels based on the inputs used to value the assets or liabilities. Level 1 values are based on quoted prices in active markets for identical securities. Level 2 values are based on significant observable market inputs, such as quoted prices for similar securities and quoted prices in inactive markets. Certain securities trading outside the U.S. may transfer between Level 1 and Level 2 due to valuation adjustments resulting from significant market movements following the close of local trading. Level 3 values are based on significant unobservable inputs that reflect the investment adviser’s determination of assumptions that market participants might reasonably use in valuing the securities. The valuation levels are not necessarily an indication of the risk or liquidity associated with the underlying investment. For example, U.S. government securities are reflected as Level 2 because the inputs used to determine fair value may not always be quoted prices in an active market. The following tables present the fund’s valuation levels as of October 31, 2018 (dollars in thousands):
| Investment securities | ||||||||||||||||
| Level 1 | Level 2 | Level 3 | Total | |||||||||||||
| Assets: | ||||||||||||||||
| Common stocks: | ||||||||||||||||
| Health care | $ | 1,449,305 | $ | — | $ | — | $ | 1,449,305 | ||||||||
| Energy | 1,304,744 | — | — | 1,304,744 | ||||||||||||
| Consumer staples | 1,185,243 | — | — | 1,185,243 | ||||||||||||
| Financials | 1,167,500 | — | — | 1,167,500 | ||||||||||||
| Communication services | 1,031,330 | — | — | 1,031,330 | ||||||||||||
| Information technology | 935,971 | — | — | 935,971 | ||||||||||||
| Industrials | 578,580 | — | — | 578,580 | ||||||||||||
| Utilities | 543,028 | 29,951 | — | 572,979 | ||||||||||||
| Consumer discretionary | 526,165 | — | — | 526,165 | ||||||||||||
| Materials | 379,708 | — | — | 379,708 | ||||||||||||
| Real estate | 142,352 | — | — | 142,352 | ||||||||||||
| Miscellaneous | 546,187 | — | — | 546,187 | ||||||||||||
| Preferred securities | 8,091 | — | — | 8,091 | ||||||||||||
| Bonds, notes & other debt instruments: | ||||||||||||||||
| Bonds & notes of governments & government agencies outside the U.S. | — | 2,312,476 | — | 2,312,476 | ||||||||||||
| U.S. Treasury bonds & notes | — | 2,221,473 | — | 2,221,473 | ||||||||||||
| Corporate bonds & notes | — | 1,170,279 | — | 1,170,279 | ||||||||||||
| Mortgage-backed obligations | — | 281,534 | — | 281,534 | ||||||||||||
| Short-term securities | — | 666,277 | — | 666,277 | ||||||||||||
| Total | $ | 9,798,204 | $ | 6,681,990 | $ | — | $ | 16,480,194 | ||||||||
| 16 | American Funds Global Balanced Fund |
| Other investments* | ||||||||||||||||
| Level 1 | Level 2 | Level 3 | Total | |||||||||||||
| Assets: | ||||||||||||||||
| Unrealized appreciation on futures contracts | $ | 47 | $ | — | $ | — | $ | 47 | ||||||||
| Unrealized appreciation on open forward currency contracts | — | 22,538 | — | 22,538 | ||||||||||||
| Liabilities: | ||||||||||||||||
| Unrealized depreciation on futures contracts | (87 | ) | — | — | (87 | ) | ||||||||||
| Unrealized depreciation on open forward currency contracts | — | (9,138 | ) | — | (9,138 | ) | ||||||||||
| Total | $ | (40 | ) | $ | 13,400 | $ | — | $ | 13,360 | |||||||
| * | Futures contracts and forward currency contracts are not included in the investment portfolio. |
4. Risk factors
Investing in the fund may involve certain risks including, but not limited to, those described below.
Market conditions — The prices of, and the income generated by, the common stocks, bonds and other securities held by the fund may decline – sometimes rapidly or unpredictably – due to various factors, including events or conditions affecting the general economy or particular industries; overall market changes; local, regional or global political, social or economic instability; governmental, governmental agency or central bank responses to economic conditions; and currency exchange rate, interest rate and commodity price fluctuations.
Issuer risks — The prices of, and the income generated by, securities held by the fund may decline in response to various factors directly related to the issuers of such securities, including reduced demand for an issuer’s goods or services, poor management performance, major litigation against the issuer, changes in government regulations affecting the issuer or its competitive environment and strategic initiatives such as mergers, acquisitions or dispositions and the market response to any such initiatives.
Investing in growth-oriented stocks — Growth-oriented common stocks and other equity-type securities (such as preferred stocks, convertible preferred stocks and convertible bonds) may involve larger price swings and greater potential for loss than other types of investments.
Investing in income-oriented stocks — The value of the fund’s securities and income provided by the fund may be reduced by changes in the dividend policies of, and the capital resources available for dividend payments at, the companies in which the fund invests.
Investing outside the U.S. — Securities of issuers domiciled outside the U.S., or with significant operations or revenues outside the U.S., may lose value because of adverse political, social, economic or market developments (including social instability, regional conflicts, terrorism and war) in the countries or regions in which the issuers operate or generate revenue. These securities may also lose value due to changes in foreign currency exchange rates against the U.S. dollar and/or currencies of other countries. Issuers of these securities may be more susceptible to actions of foreign governments, such as nationalization, currency blockage or the imposition of price controls or punitive taxes, each of which could adversely impact the value of these securities. Securities markets in certain countries may be more volatile and/or less liquid than those in the U.S. Investments outside the U.S. may also be subject to different accounting practices and different regulatory, legal and reporting standards and practices, and may be more difficult to value, than those in the U.S. In addition, the value of investments outside the U.S. may be reduced by foreign taxes, including foreign withholding taxes on interest and dividends. Further, there may be increased risks of delayed settlement of securities purchased or sold by the fund. The risks of investing outside the U.S. may be heightened in connection with investments in emerging markets.
Investing in emerging markets — Investing in emerging markets may involve risks in addition to and greater than those generally associated with investing in the securities markets of developed countries. For instance, emerging market countries may have less developed legal and accounting systems than those in developed countries. The governments of these countries may be less stable and more likely to impose capital controls, nationalize a company or industry, place restrictions on foreign ownership and on withdrawing sale proceeds of securities from the country, and/or impose punitive taxes that could adversely affect the prices of securities. In addition, the economies of these countries may be dependent on relatively few industries that are more susceptible to local and global changes. Securities markets in these countries can also be relatively small and have substantially lower trading volumes. As a result, securities issued in these countries may be more volatile and less liquid, and may be more difficult to value, than securities issued in countries with more developed economies and/or markets. Less certainty with respect to security valuations may lead to additional challenges and risks in calculating the fund’s net asset value. Additionally, emerging markets are more likely to experience problems with the clearing and settling of trades and the holding of securities by banks, agents and depositories that are less established than those in developed countries.
| American Funds Global Balanced Fund | 17 |
Investing in debt instruments — The prices of, and the income generated by, bonds and other debt securities held by the fund may be affected by changing interest rates and by changes in the effective maturities and credit ratings of these securities.
Rising interest rates will generally cause the prices of bonds and other debt securities to fall. A general rise in interest rates may cause investors to sell debt securities on a large scale, which could also adversely affect the price and liquidity of debt securities and could also result in increased redemptions from the fund. Falling interest rates may cause an issuer to redeem, call or refinance a debt security before its stated maturity, which may result in the fund failing to recoup the full amount of its initial investment and having to reinvest the proceeds in lower yielding securities. Longer maturity debt securities generally have greater sensitivity to changes in interest rates and may be subject to greater price fluctuations than shorter maturity debt securities.
Bonds and other debt securities are also subject to credit risk, which is the possibility that the credit strength of an issuer or guarantor will weaken or be perceived to be weaker, and/or an issuer of a debt security will fail to make timely payments of principal or interest and the security will go into default. A downgrade or default affecting any of the fund’s securities could cause the value of the fund’s shares to decrease. Lower quality debt securities generally have higher rates of interest and may be subject to greater price fluctuations than higher quality debt securities. Credit risk is gauged, in part, by the credit ratings of the debt securities in which the fund invests. However, ratings are only the opinions of the rating agencies issuing them and are not guarantees as to credit quality or an evaluation of market risk. The fund’s investment adviser relies on its own credit analysts to research issuers and issues in seeking to assess credit and default risks.
Investing in mortgage-related and other asset-backed securities — Mortgage-related securities, such as mortgage-backed securities, and other asset-backed securities, include debt obligations that represent interests in pools of mortgages or other income-bearing assets, such as consumer loans or receivables. Such securities often involve risks that are different from or more acute than the risks associated with investing in other types of debt securities. Mortgage-backed and other asset-backed securities are subject to changes in the payment patterns of borrowers of the underlying debt, potentially increasing the volatility of the securities and the fund’s net asset value. When interest rates fall, borrowers are more likely to refinance or prepay their debt before its stated maturity. This may result in the fund having to reinvest the proceeds in lower yielding securities, effectively reducing the fund’s income. Conversely, if interest rates rise and borrowers repay their debt more slowly than expected, the time in which the mortgage-backed and other asset-backed securities are paid off could be extended, reducing the fund’s cash available for reinvestment in higher yielding securities. Mortgage-backed securities are also subject to the risk that underlying borrowers will be unable to meet their obligations and the value of property that secures the mortgages may decline in value and be insufficient, upon foreclosure, to repay the associated loans. Investments in asset-backed securities are subject to similar risks.
Liquidity risk — Certain fund holdings may be or become difficult or impossible to sell, particularly during times of market turmoil. Illiquidity may result from the lack of an active market for a holding, legal or contractual restrictions on resale, or the reduced number and capacity of market participants to make a market in such holding. Market prices for less liquid or illiquid holdings may be volatile, and reduced liquidity may have an adverse impact on the market price of such holdings. Additionally, the sale of less liquid or illiquid holdings may involve substantial delays (including delays in settlement) and additional costs and the fund may be unable to sell such holdings when necessary to meet its liquidity needs or may be forced to sell at a loss.
Management — The investment adviser to the fund actively manages the fund’s investments. Consequently, the fund is subject to the risk that the methods and analyses, including models, tools and data, employed by the investment adviser in this process may be flawed or incorrect and may not produce the desired results. This could cause the fund to lose value or its investment results to lag relevant benchmarks or other funds with similar objectives.
5. Certain investment techniques
Index-linked bonds — The fund has invested in index-linked bonds, which are fixed-income securities whose principal value is periodically adjusted to a government price index. Over the life of an index-linked bond, interest is paid on the adjusted principal value. Increases or decreases in the principal value of index-linked bonds are recorded as interest income in the fund’s statement of operations.
Mortgage dollar rolls — The fund has entered into mortgage dollar roll transactions in which the fund sells a mortgage-backed security to a counterparty and simultaneously enters into an agreement with the same counterparty to buy back a similar security on a specific future date at a predetermined price. Mortgage dollar rolls are accounted for as purchase and sale transactions. Portfolio turnover rates excluding and including mortgage dollar rolls are presented at the end of the fund’s financial highlights table.
Futures contracts — The fund has entered into futures contracts, which provide for the future sale by one party and purchase by another party of a specified amount of a specific financial instrument for a specified price, date, time and place designated at the time the contract
| 18 | American Funds Global Balanced Fund |
is made. Futures contracts are used to strategically manage the fund’s interest rate sensitivity by increasing or decreasing the duration of the fund or a portion of the fund’s portfolio.
Upon entering into futures contracts, and to maintain the fund’s open positions in futures contracts, the fund is required to deposit with a futures broker, or FCM, in a segregated account in the name of the FCM an amount of cash, U.S. government securities or other liquid securities, known as initial margin. The margin required for a particular futures contract is set by the exchange on which the contract is traded to serve as collateral, and may be significantly modified from time to time by the exchange during the term of the contract. Securities deposited as initial margin, if any, are disclosed in the investment portfolio and cash deposited as initial margin, if any, is reflected as restricted cash pledged for futures contracts in the fund’s statement of assets and liabilities.
On a daily basis, the fund pays or receives variation margin based on the increase or decrease in the value of the futures contracts and records variation margin on futures contracts in the statement of assets and liabilities. In addition, the fund segregates liquid assets equivalent to the fund’s outstanding obligations under the contract in excess of the initial margin and variation margin, if any. Futures contracts may involve a risk of loss in excess of the variation margin shown on the fund’s statement of assets and liabilities. The fund records realized gains or losses at the time the futures contract is closed or expires. Net realized gains or losses and net unrealized appreciation or depreciation from futures contracts are recorded in the fund’s statement of operations. The average month-end notional amount of futures contracts while held was $63,700,000.
Forward currency contracts — The fund has entered into forward currency contracts, which represent agreements to exchange currencies on specific future dates at predetermined rates. The fund’s investment adviser uses forward currency contracts to manage the fund’s exposure to changes in exchange rates. Upon entering into these contracts, risks may arise from the potential inability of counterparties to meet the terms of their contracts and from possible movements in exchange rates.
On a daily basis, the fund’s investment adviser values forward currency contracts and records unrealized appreciation or depreciation for open forward currency contracts in the fund’s statement of assets and liabilities. Realized gains or losses are recorded at the time the forward currency contract is closed or offset by another contract with the same broker for the same settlement date and currency.
Closed forward currency contracts that have not reached their settlement date are included in the respective receivables or payables for closed forward currency contracts in the fund’s statement of assets and liabilities. Net realized gains or losses from closed forward currency contracts and net unrealized appreciation or depreciation from open forward currency contracts are recorded in the fund’s statement of operations. The average month-end notional amount of open forward currency contracts while held was $1,230,309,000.
The following tables present the financial statement impacts resulting from the fund’s use of futures contracts and forward currency contracts as of, or for the year ended, October 31, 2018 (dollars in thousands):
| Assets | Liabilities | |||||||||||||
| Contracts | Risk type | Location on statement of assets and liabilities | Value | Location on statement of assets and liabilities | Value | |||||||||
| Futures | Interest | Unrealized appreciation* | $ | 47 | Unrealized depreciation* | $ | 87 | |||||||
| Forward currency | Currency | Unrealized appreciation on open forward currency contracts | 22,538 | Unrealized depreciation on open forward currency contracts | 9,138 | |||||||||
| $ | 22,585 | $ | 9,225 | |||||||||||
| Net realized loss | Net unrealized (depreciation) appreciation | |||||||||||||
| Contracts | Risk type | Location on statement of operations | Value | Location on statement of operations | Value | |||||||||
| Futures | Interest | Net realized loss on futures contracts | $ | (143 | ) | Net unrealized depreciation on futures contracts | $ | (40 | ) | |||||
| Forward currency | Currency | Net realized loss on forward currency contracts | (15,778 | ) | Net unrealized appreciation on forward currency contracts | 15,611 | ||||||||
| $ | (15,921 | ) | $ | 15,571 | ||||||||||
| * | Includes cumulative appreciation/depreciation on futures contracts as reported in the applicable table following the fund’s investment portfolio. Only current day’s variation margin is reported within the statement of assets and liabilities. |
Collateral — The fund participates in a collateral program that calls for the fund to either receive or pledge highly liquid assets, such as cash or U.S. government securities, as collateral due to its use of futures contracts, forward currency contracts and future delivery
| American Funds Global Balanced Fund | 19 |
contracts. For futures contracts, the program calls for the fund to pledge collateral for initial and variation margin by contract. For forward currency contracts, the program calls for the fund to either receive or pledge collateral based on the net gain or loss on unsettled forward currency contracts by counterparty. For future delivery contracts, the program calls for the fund to either receive or pledge collateral based on the net gain or loss on unsettled contracts by certain counterparties. The purpose of the collateral is to cover potential losses that could occur in the event that either party cannot meet its contractual obligation. Non-cash collateral pledged by the fund, if any, is disclosed in the fund’s investment portfolio, and cash collateral pledged by the fund, if any, is held in a segregated account with the fund’s custodian, which is reflected as pledged cash in the fund’s statement of assets and liabilities.
Rights of offset — The fund has entered into enforceable master netting agreements with certain counterparties for forward currency contracts, where on any date amounts payable by each party to the other (in the same currency with respect to the same transaction) may be closed or offset by each party’s payment obligation. If an early termination date occurs under these agreements following an event of default or termination event, all obligations of each party to its counterparty are settled net through a single payment in a single currency (“close-out netting”). For financial reporting purposes, the fund does not offset financial assets and financial liabilities that are subject to these master netting arrangements in the statement of assets and liabilities.
The following table presents the fund’s forward currency contracts by counterparty that are subject to master netting agreements but that are not offset in the fund’s statement of assets and liabilities. The net amount column shows the impact of offsetting on the fund’s statement of assets and liabilities as of October 31, 2018, if close-out netting was exercised (dollars in thousands):
| Gross amounts recognized in the | Gross amounts not offset in the statement of assets and liabilities and subject to a master netting agreement | |||||||||||||||||||
| Counterparty | statement of assets and liabilities | Available to offset | Non-cash collateral* | Cash collateral | Net amount | |||||||||||||||
| Assets: | ||||||||||||||||||||
| Bank of America, N.A. | $ | 2,026 | $ | (1,343 | ) | $ | (683 | ) | $ | — | $ | — | ||||||||
| Bank of New York Mellon | 263 | (203 | ) | — | — | 60 | ||||||||||||||
| Citibank | 8,743 | (2,330 | ) | — | (5,605 | ) | 808 | |||||||||||||
| Goldman Sachs | 3,365 | (2,506 | ) | — | (760 | ) | 99 | |||||||||||||
| JPMorgan Chase | 6,438 | (1,033 | ) | (5,263 | ) | — | 142 | |||||||||||||
| Morgan Stanley | 1,703 | (1,703 | ) | — | — | — | ||||||||||||||
| Total | $ | 22,538 | $ | (9,118 | ) | $ | (5,946 | ) | $ | (6,365 | ) | $ | 1,109 | |||||||
| Liabilities: | ||||||||||||||||||||
| Bank of America, N.A. | $ | 1,343 | $ | (1,343 | ) | $ | — | $ | — | $ | — | |||||||||
| Bank of New York Mellon | 203 | (203 | ) | — | — | — | ||||||||||||||
| Citibank | 2,330 | (2,330 | ) | — | — | — | ||||||||||||||
| Goldman Sachs | 2,506 | (2,506 | ) | — | — | — | ||||||||||||||
| JPMorgan Chase | 1,033 | (1,033 | ) | — | — | — | ||||||||||||||
| Morgan Stanley | 1,723 | (1,703 | ) | — | — | 20 | ||||||||||||||
| Total | $ | 9,138 | $ | (9,118 | ) | $ | — | $ | — | $ | 20 | |||||||||
| * | Non-cash collateral is shown on a settlement basis. |
6. Taxation and distributions
Federal income taxation — The fund complies with the requirements under Subchapter M of the Internal Revenue Code applicable to mutual funds and intends to distribute substantially all of its net taxable income and net capital gains each year. The fund is not subject to income taxes to the extent such distributions are made. Therefore, no federal income tax provision is required.
As of and during the period ended October 31, 2018, the fund did not have a liability for any unrecognized tax benefits. The fund recognizes interest and penalties, if any, related to unrecognized tax benefits as income tax expense in the statement of operations. During the period, the fund did not incur any significant interest or penalties.
The fund’s tax returns are not subject to examination by federal, state and, if applicable, non-U.S. tax authorities after the expiration of each jurisdiction’s statute of limitations, which is generally three years after the date of filing but can be extended in certain jurisdictions.
Non-U.S. taxation — Dividend and interest income are recorded net of non-U.S. taxes paid. The fund may file withholding tax reclaims in certain jurisdictions to recover a portion of amounts previously withheld. As a result of rulings from European courts, the fund filed for additional reclaims related to prior years. These reclaims are recorded when the amount is known and there are no significant
| 20 | American Funds Global Balanced Fund |
uncertainties on collectability. Gains realized by the fund on the sale of securities in certain countries, if any, may be subject to non-U.S. taxes. If applicable, the fund records an estimated deferred tax liability based on unrealized gains to provide for potential non-U.S. taxes payable upon the sale of these securities.
Distributions — Distributions paid to shareholders are based on net investment income and net realized gains determined on a tax basis, which may differ from net investment income and net realized gains for financial reporting purposes. These differences are due primarily to different treatment for items such as currency gains and losses; short-term capital gains and losses; capital losses related to sales of certain securities within 30 days of purchase; unrealized appreciation of certain investments in securities outside the U.S.; deferred expenses; cost of investments sold; net capital losses; non-U.S. taxes on capital gains; amortization of premiums and discounts and income on certain investments. The fiscal year in which amounts are distributed may differ from the year in which the net investment income and net realized gains are recorded by the fund for financial reporting purposes.
During the year ended October 31, 2018, the fund reclassified $9,000 from total distributable earnings to capital paid in on shares of beneficial interest to align financial reporting with tax reporting.
As of October 31, 2018, the tax basis components of distributable earnings, unrealized appreciation (depreciation) and cost of investments were as follows (dollars in thousands):
| Undistributed ordinary income | $ | 27,490 | ||
| Capital loss carryforward* | (757 | ) | ||
| Gross unrealized appreciation on investments | 1,483,057 | |||
| Gross unrealized depreciation on investments | (1,069,705 | ) | ||
| Net unrealized appreciation on investments | 413,352 | |||
| Cost of investments | 16,080,203 |
| * | The capital loss carryforward will be used to offset any capital gains realized by the fund in future years. The fund will not make distributions from capital gains while a capital loss carryforward remains. |
Distributions paid were characterized for tax purposes as follows (dollars in thousands):
| Year ended October 31, 2018 | Year ended October 31, 2017 | |||||||||||||||||||||||
| Share class | Ordinary income | Long-term capital gains | Total distributions paid | Ordinary income | Long-term capital gains | Total distributions paid | ||||||||||||||||||
| Class A | $ | 112,853 | $ | 75,443 | $ | 188,296 | $ | 84,907 | $ | — | $ | 84,907 | ||||||||||||
| Class B1 | 3 | — | 3 | |||||||||||||||||||||
| Class C | 8,859 | 9,458 | 18,317 | 6,363 | — | 6,363 | ||||||||||||||||||
| Class T2 | — | 3 | — | 3 | — | 3 | — | 3 | — | — | 3 | |||||||||||||
| Class F-1 | 3,734 | 2,647 | 6,381 | 3,005 | — | 3,005 | ||||||||||||||||||
| Class F-2 | 34,172 | 17,744 | 51,916 | 17,982 | — | 17,982 | ||||||||||||||||||
| Class F-34 | 9,021 | 4,384 | 13,405 | 2,383 | — | 2,383 | ||||||||||||||||||
| Class 529-A | 5,527 | 3,761 | 9,288 | 3,898 | — | 3,898 | ||||||||||||||||||
| Class 529-B1 | 1 | — | 1 | |||||||||||||||||||||
| Class 529-C | 1,020 | 1,172 | 2,192 | 803 | — | 803 | ||||||||||||||||||
| Class 529-E | 273 | 211 | 484 | 200 | — | 200 | ||||||||||||||||||
| Class 529-T2 | — | 3 | — | 3 | — | 3 | — | 3 | — | — | 3 | |||||||||||||
| Class 529-F-1 | 649 | 347 | 996 | 374 | — | 374 | ||||||||||||||||||
| Class R-1 | 66 | 71 | 137 | 62 | — | 62 | ||||||||||||||||||
| Class R-2 | 671 | 710 | 1,381 | 479 | — | 479 | ||||||||||||||||||
| Class R-2E | 23 | 11 | 34 | 7 | — | 7 | ||||||||||||||||||
| Class R-3 | 1,020 | 804 | 1,824 | 792 | — | 792 | ||||||||||||||||||
| Class R-4 | 896 | 572 | 1,468 | 585 | — | 585 | ||||||||||||||||||
| Class R-5E | 10 | — | 3 | 10 | — | 3 | — | — | 3 | |||||||||||||||
| Class R-5 | 547 | 329 | 876 | 329 | — | 329 | ||||||||||||||||||
| Class R-6 | 186,548 | 100,079 | 286,627 | 109,950 | — | 109,950 | ||||||||||||||||||
| Total | $ | 365,889 | $ | 217,743 | $ | 583,632 | $ | 232,123 | $ | — | $ | 232,123 | ||||||||||||
| 1 | Class B and 529-B shares were fully liquidated on May 5, 2017. |
| 2 | Class T and 529-T shares began investment operations on April 7, 2017. |
| 3 | Amount less than one thousand. |
| 4 | Class F-3 shares began investment operations on January 27, 2017. |
| American Funds Global Balanced Fund | 21 |
7. Fees and transactions with related parties
CRMC, the fund’s investment adviser, is the parent company of American Funds Distributors,® Inc. (“AFD”), the principal underwriter of the fund’s shares, and American Funds Service Company® (“AFS”), the fund’s transfer agent. CRMC, AFD and AFS are considered related parties to the fund.
Investment advisory services — The fund has an investment advisory and service agreement with CRMC that provides for monthly fees accrued daily. These fees are based on a series of decreasing annual rates beginning with 0.660% on the first $500 million of average daily net assets and decreasing to 0.417% on such assets in excess of $17 billion. For the year ended October 31, 2018, the investment advisory services fee was $71,808,000, which was equivalent to an annualized rate of 0.444% of average daily net assets.
Class-specific fees and expenses — Expenses that are specific to individual share classes are accrued directly to the respective share class. The principal class-specific fees and expenses are further described below:
Distribution services — The fund has plans of distribution for all share classes, except Class F-2, F-3, R-5E, R-5 and R-6 shares. Under the plans, the board of trustees approves certain categories of expenses that are used to finance activities primarily intended to sell fund shares and service existing accounts. The plans provide for payments, based on an annualized percentage of average daily net assets, ranging from 0.30% to 1.00% as noted in this section. In some cases, the board of trustees has limited the amounts that may be paid to less than the maximum allowed by the plans. All share classes with a plan may use up to 0.25% of average daily net assets to pay service fees, or to compensate AFD for paying service fees, to firms that have entered into agreements with AFD to provide certain shareholder services. The remaining amounts available to be paid under each plan are paid to dealers to compensate them for their sales activities.
| Share class | Currently approved limits | Plan limits | ||||||
| Class A | 0.30 | % | 0.30 | % | ||||
| Class 529-A | 0.30 | 0.50 | ||||||
| Classes C, 529-C and R-1 | 1.00 | 1.00 | ||||||
| Class R-2 | 0.75 | 1.00 | ||||||
| Class R-2E | 0.60 | 0.85 | ||||||
| Classes 529-E and R-3 | 0.50 | 0.75 | ||||||
| Classes T, F-1, 529-T, 529-F-1 and R-4 | 0.25 | 0.50 | ||||||
For Class A and 529-A shares, distribution-related expenses include the reimbursement of dealer and wholesaler commissions paid by AFD for certain shares sold without a sales charge. These share classes reimburse AFD for amounts billed within the prior 15 months but only to the extent that the overall annual expense limits are not exceeded. As of October 31, 2018, there were no unreimbursed expenses subject to reimbursement for Class A or 529-A shares.
Transfer agent services — The fund has a shareholder services agreement with AFS under which the fund compensates AFS for providing transfer agent services to each of the fund’s share classes. These services include recordkeeping, shareholder communications and transaction processing. In addition, the fund reimburses AFS for amounts paid to third parties for performing transfer agent services on behalf of fund shareholders.
Administrative services — The fund has an administrative services agreement with CRMC under which the fund compensates CRMC for providing administrative services to Class A, C, T, F, 529 and R shares. Administrative services are provided by CRMC to help assist third parties providing non-distribution services to fund shareholders. These services include providing in depth information on the fund and market developments that impact fund investments. Administrative services also include, but are not limited to, coordinating, monitoring and overseeing third parties that provide services to fund shareholders. The agreement between the fund and the investment adviser provides the fund the ability to charge an administrative services fee of 0.05% of average daily net assets for all share classes. Currently Class A shares pay an annual fee of 0.01% of average daily net assets (which could be increased as noted above) and Class C, T, F, 529 and R shares pay an annual fee of 0.05% of their respective average daily net assets.
529 plan services — Each 529 share class is subject to service fees to compensate the Virginia College Savings Plan (“Virginia529”) for its oversight and administration of the CollegeAmerica 529 college savings plan. The fee is based on the combined net assets invested in Class 529 and ABLE shares of the American Funds. Class ABLE shares are offered on other American Funds by Virginia529 through ABLEAmerica, a tax-advantaged savings program for individuals with disabilities. The quarterly fee is based on a series of decreasing annual rates beginning with 0.10% on the first $20 billion of the combined net assets invested in the American Funds and decreasing to 0.03% on such assets in excess of $100 billion. The fee for any given calendar quarter is accrued and calculated on the basis of the average net assets of Class 529 and ABLE shares of the American Funds for the last month of the prior
| 22 | American Funds Global Balanced Fund |
calendar quarter. The fee is included in other expenses in the fund’s statement of operations. Virginia529 is not considered a related party to the fund.
For the year ended October 31, 2018, class-specific expenses under the agreements were as follows (dollars in thousands):
| Share class | Distribution services | Transfer agent services | Administrative services | 529 plan services | ||||||||||||
| Class A | $14,746 | $4,876 | $535 | Not applicable | ||||||||||||
| Class C | 6,561 | 603 | 328 | Not applicable | ||||||||||||
| Class T | — | — | * | — | * | Not applicable | ||||||||||
| Class F-1 | 459 | 223 | 92 | Not applicable | ||||||||||||
| Class F-2 | Not applicable | 1,496 | 719 | Not applicable | ||||||||||||
| Class F-3 | Not applicable | 23 | 183 | Not applicable | ||||||||||||
| Class 529-A | 612 | 214 | 133 | $175 | ||||||||||||
| Class 529-C | 809 | 67 | 41 | 54 | ||||||||||||
| Class 529-E | 73 | 6 | 7 | 10 | ||||||||||||
| Class 529-T | — | — | * | — | * | — | * | |||||||||
| Class 529-F-1 | — | 22 | 14 | 18 | ||||||||||||
| Class R-1 | 49 | 5 | 3 | Not applicable | ||||||||||||
| Class R-2 | 364 | 166 | 24 | Not applicable | ||||||||||||
| Class R-2E | 8 | 3 | 1 | Not applicable | ||||||||||||
| Class R-3 | 284 | 82 | 28 | Not applicable | ||||||||||||
| Class R-4 | 105 | 42 | 21 | Not applicable | ||||||||||||
| Class R-5E | Not applicable | 1 | — | * | Not applicable | |||||||||||
| Class R-5 | Not applicable | 12 | 11 | Not applicable | ||||||||||||
| Class R-6 | Not applicable | 3 | 3,804 | Not applicable | ||||||||||||
| Total class-specific expenses | $24,070 | $7,844 | $5,944 | $257 | ||||||||||||
| * | Amount less than one thousand. |
Trustees’ deferred compensation — Trustees who are unaffiliated with CRMC may elect to defer the cash payment of part or all of their compensation. These deferred amounts, which remain as liabilities of the fund, are treated as if invested in shares of the fund or other American Funds. These amounts represent general, unsecured liabilities of the fund and vary according to the total returns of the selected funds. Trustees’ compensation of $525,000 in the fund’s statement of operations reflects $406,000 in current fees (either paid in cash or deferred) and a net increase of $119,000 in the value of the deferred amounts.
Affiliated officers and trustees — Officers and certain trustees of the fund are or may be considered to be affiliated with CRMC, AFD and AFS. No affiliated officers or trustees received any compensation directly from the fund.
Security transactions with related funds — The fund may purchase from, or sell securities to, other funds managed by CRMC (or funds managed by certain affiliates of CRMC) under procedures adopted by the fund’s board of trustees. The funds involved in such transactions are considered related by virtue of having a common investment adviser (or affiliated investment advisers), common trustees and/or common officers. When such transactions occur, each transaction is executed at the current market price of the security and no brokerage commissions or fees are paid in accordance with Rule 17a-7 of the 1940 Act.
Interfund lending — Pursuant to an exemptive order issued by the SEC, the fund, along with other CRMC-managed funds (or funds managed by certain affiliates of CRMC), may participate in an interfund lending program. The program provides an alternate credit facility that permits the funds to lend or borrow cash for temporary purposes directly to or from one another, subject to the conditions of the exemptive order. The fund did not lend or borrow cash through the interfund lending program at any time during the year ended October 31, 2018.
| American Funds Global Balanced Fund | 23 |
8. Capital share transactions
Capital share transactions in the fund were as follows (dollars and shares in thousands):
| Sales1 | Reinvestments of distributions | Repurchases1 | Net increase (decrease) | |||||||||||||||||||||||||||||
| Share class | Amount | Shares | Amount | Shares | Amount | Shares | Amount | Shares | ||||||||||||||||||||||||
| Year ended October 31, 2018 | ||||||||||||||||||||||||||||||||
| Class A | $ | 936,001 | 28,755 | $ | 186,073 | 5,771 | $ | (733,013 | ) | (22,717 | ) | $ | 389,061 | 11,809 | ||||||||||||||||||
| Class C | 131,419 | 4,048 | 18,147 | 564 | (138,463 | ) | (4,294 | ) | 11,103 | 318 | ||||||||||||||||||||||
| Class T | — | — | — | — | — | — | — | — | ||||||||||||||||||||||||
| Class F-1 | 81,742 | 2,510 | 6,330 | 196 | (85,962 | ) | (2,664 | ) | 2,110 | 42 | ||||||||||||||||||||||
| Class F-2 | 896,499 | 27,684 | 49,026 | 1,521 | (354,949 | ) | (11,025 | ) | 590,576 | 18,180 | ||||||||||||||||||||||
| Class F-3 | 233,447 | 7,202 | 11,606 | 360 | (67,003 | ) | (2,081 | ) | 178,050 | 5,481 | ||||||||||||||||||||||
| Class 529-A | 67,190 | 2,064 | 9,285 | 288 | (46,689 | ) | (1,446 | ) | 29,786 | 906 | ||||||||||||||||||||||
| Class 529-C | 18,085 | 560 | 2,192 | 68 | (27,008 | ) | (834 | ) | (6,731 | ) | (206 | ) | ||||||||||||||||||||
| Class 529-E | 3,273 | 101 | 483 | 15 | (2,932 | ) | (91 | ) | 824 | 25 | ||||||||||||||||||||||
| Class 529-T | — | — | — | 2 | — | 2 | — | — | — | 2 | — | 2 | ||||||||||||||||||||
| Class 529-F-1 | 15,643 | 484 | 996 | 31 | (4,571 | ) | (140 | ) | 12,068 | 375 | ||||||||||||||||||||||
| Class R-1 | 1,606 | 50 | 136 | 4 | (1,788 | ) | (55 | ) | (46 | ) | (1 | ) | ||||||||||||||||||||
| Class R-2 | 14,894 | 459 | 1,379 | 43 | (17,303 | ) | (538 | ) | (1,030 | ) | (36 | ) | ||||||||||||||||||||
| Class R-2E | 1,349 | 42 | 34 | 1 | (285 | ) | (9 | ) | 1,098 | 34 | ||||||||||||||||||||||
| Class R-3 | 18,898 | 585 | 1,814 | 56 | (14,209 | ) | (438 | ) | 6,503 | 203 | ||||||||||||||||||||||
| Class R-4 | 17,542 | 540 | 1,468 | 46 | (10,301 | ) | (318 | ) | 8,709 | 268 | ||||||||||||||||||||||
| Class R-5E | 2,003 | 62 | 9 | — | 2 | (234 | ) | (6 | ) | 1,778 | 56 | |||||||||||||||||||||
| Class R-5 | 8,344 | 256 | 869 | 27 | (5,548 | ) | (171 | ) | 3,665 | 112 | ||||||||||||||||||||||
| Class R-6 | 1,886,664 | 57,974 | 286,624 | 8,889 | (77,841 | ) | (2,419 | ) | 2,095,447 | 64,444 | ||||||||||||||||||||||
| Total net increase (decrease) | $ | 4,334,599 | 133,376 | $ | 576,471 | 17,880 | $ | (1,588,099 | ) | (49,246 | ) | $ | 3,322,971 | 102,010 | ||||||||||||||||||
| Year ended October 31, 2017 | ||||||||||||||||||||||||||||||||
| Class A | $ | 781,724 | 25,156 | $ | 83,553 | 2,704 | $ | (797,785 | ) | (25,972 | ) | $ | 67,492 | 1,888 | ||||||||||||||||||
| Class B3 | 13 | 1 | 3 | — | 2 | (1,880 | ) | (63 | ) | (1,864 | ) | (62 | ) | |||||||||||||||||||
| Class C | 113,695 | 3,676 | 6,277 | 203 | (154,821 | ) | (5,041 | ) | (34,849 | ) | (1,162 | ) | ||||||||||||||||||||
| Class T4 | 10 | — | 2 | — | — | — | — | 10 | — | 2 | ||||||||||||||||||||||
| Class F-1 | 48,863 | 1,579 | 2,967 | 96 | (91,205 | ) | (2,963 | ) | (39,375 | ) | (1,288 | ) | ||||||||||||||||||||
| Class F-2 | 686,045 | 22,127 | 16,662 | 537 | (364,089 | ) | (11,775 | ) | 338,618 | 10,889 | ||||||||||||||||||||||
| Class F-35 | 274,259 | 8,753 | 1,768 | 55 | (14,638 | ) | (458 | ) | 261,389 | 8,350 | ||||||||||||||||||||||
| Class 529-A | 42,842 | 1,379 | 3,898 | 126 | (32,747 | ) | (1,058 | ) | 13,993 | 447 | ||||||||||||||||||||||
| Class 529-B3 | 2 | — | 2 | — | 2 | — | 2 | (273 | ) | (9 | ) | (271 | ) | (9 | ) | |||||||||||||||||
| Class 529-C | 15,143 | 490 | 803 | 26 | (14,671 | ) | (479 | ) | 1,275 | 37 | ||||||||||||||||||||||
| Class 529-E | 2,720 | 87 | 200 | 7 | (2,436 | ) | (78 | ) | 484 | 16 | ||||||||||||||||||||||
| Class 529-T4 | 10 | — | 2 | — | 2 | — | 2 | — | — | 10 | — | 2 | ||||||||||||||||||||
| Class 529-F-1 | 5,822 | 187 | 373 | 12 | (3,069 | ) | (100 | ) | 3,126 | 99 | ||||||||||||||||||||||
| Class R-1 | 1,093 | 36 | 62 | 2 | (3,433 | ) | (112 | ) | (2,278 | ) | (74 | ) | ||||||||||||||||||||
| Class R-2 | 14,670 | 476 | 477 | 16 | (15,589 | ) | (510 | ) | (442 | ) | (18 | ) | ||||||||||||||||||||
| Class R-2E | 528 | 18 | 7 | — | 2 | (89 | ) | (3 | ) | 446 | 15 | |||||||||||||||||||||
| Class R-3 | 17,273 | 561 | 788 | 25 | (18,622 | ) | (603 | ) | (561 | ) | (17 | ) | ||||||||||||||||||||
| Class R-4 | 16,344 | 533 | 585 | 18 | (11,122 | ) | (359 | ) | 5,807 | 192 | ||||||||||||||||||||||
| Class R-5E | — | — | — | — | — | — | — | — | ||||||||||||||||||||||||
| Class R-5 | 13,702 | 449 | 325 | 11 | (3,340 | ) | (109 | ) | 10,687 | 351 | ||||||||||||||||||||||
| Class R-6 | 1,961,762 | 63,253 | 109,942 | 3,542 | (67,049 | ) | (2,138 | ) | 2,004,655 | 64,657 | ||||||||||||||||||||||
| Total net increase (decrease) | $ | 3,996,520 | 128,761 | $ | 228,690 | 7,380 | $ | (1,596,858 | ) | (51,830 | ) | $ | 2,628,352 | 84,311 | ||||||||||||||||||
| 1 | Includes exchanges between share classes of the fund. |
| 2 | Amount less than one thousand. |
| 3 | Class B and 529-B shares were fully liquidated on May 5, 2017. |
| 4 | Class T and 529-T shares began investment operations on April 7, 2017. |
| 5 | Class F-3 shares began investment operations on January 27, 2017. |
| 24 | American Funds Global Balanced Fund |
9. Investment transactions
The fund made purchases and sales of investment securities, excluding short-term securities and U.S. government obligations, if any, of $10,582,442,000 and $8,124,595,000, respectively, during the year ended October 31, 2018.
10. Ownership concentration
At October 31, 2018, the fund had one shareholder, American Funds Moderate Growth and Income Portfolio, with aggregate ownership of the fund’s outstanding shares of 12%. CRMC is the investment adviser to American Funds Moderate Growth and Income Portfolio.
| American Funds Global Balanced Fund | 25 |
Financial highlights
| (Loss) income from investment operations1 | Dividends and distributions | |||||||||||||||||||||||||||||||||||||||||||||||||||
| Period ended | Net asset value, beginning of period | Net investment income2 | Net (losses) gains on securities (both realized and unrealized) | Total from investment operations | Dividends (from net investment income) | Distributions (from capital gains) | Total dividends and distributions | Net asset value, end of period | Total return3,4 | Net assets, end of period (in millions) | Ratio of expenses to average net assets before reimburse- ments | Ratio of expenses to average net assets after reimburse- ments4 | Ratio of net income to average net assets2,4 | |||||||||||||||||||||||||||||||||||||||
| Class A: | ||||||||||||||||||||||||||||||||||||||||||||||||||||
| 10/31/2018 | $ | 32.48 | $ | .70 | $ | (1.58 | ) | $ | (.88 | ) | $ | (.68 | ) | $ | (.48 | ) | $ | (1.16 | ) | $ | 30.44 | (2.85 | )% | $ | 5,091 | .84 | % | .84 | % | 2.15 | % | |||||||||||||||||||||
| 10/31/2017 | 29.66 | .60 | 2.78 | 3.38 | (.56 | ) | — | (.56 | ) | 32.48 | 11.51 | 5,049 | .85 | .85 | 1.95 | |||||||||||||||||||||||||||||||||||||
| 10/31/2016 | 29.66 | .59 | .50 | 1.09 | (.54 | ) | (.55 | ) | (1.09 | ) | 29.66 | 3.78 | 4,554 | .85 | .85 | 2.02 | ||||||||||||||||||||||||||||||||||||
| 10/31/2015 | 31.49 | .52 | (1.27 | ) | (.75 | ) | (.36 | ) | (.72 | ) | (1.08 | ) | 29.66 | (2.42 | ) | 4,550 | .85 | .85 | 1.72 | |||||||||||||||||||||||||||||||||
| 10/31/2014 | 30.22 | .68 | 1.68 | 2.36 | (.57 | ) | (.52 | ) | (1.09 | ) | 31.49 | 7.91 | 4,430 | .89 | .89 | 2.20 | ||||||||||||||||||||||||||||||||||||
| Class C: | ||||||||||||||||||||||||||||||||||||||||||||||||||||
| 10/31/2018 | 32.39 | .45 | (1.56 | ) | (1.11 | ) | (.44 | ) | (.48 | ) | (.92 | ) | 30.36 | (3.58 | ) | 606 | 1.61 | 1.61 | 1.39 | |||||||||||||||||||||||||||||||||
| 10/31/2017 | 29.58 | .36 | 2.77 | 3.13 | (.32 | ) | — | (.32 | ) | 32.39 | 10.64 | 636 | 1.63 | 1.63 | 1.17 | |||||||||||||||||||||||||||||||||||||
| 10/31/2016 | 29.58 | .35 | .50 | .85 | (.30 | ) | (.55 | ) | (.85 | ) | 29.58 | 2.97 | 616 | 1.65 | 1.65 | 1.21 | ||||||||||||||||||||||||||||||||||||
| 10/31/2015 | 31.42 | .28 | (1.28 | ) | (1.00 | ) | (.12 | ) | (.72 | ) | (.84 | ) | 29.58 | (3.23 | ) | 616 | 1.65 | 1.65 | .93 | |||||||||||||||||||||||||||||||||
| 10/31/2014 | 30.16 | .43 | 1.68 | 2.11 | (.33 | ) | (.52 | ) | (.85 | ) | 31.42 | 7.10 | 568 | 1.69 | 1.69 | 1.39 | ||||||||||||||||||||||||||||||||||||
| Class T: | ||||||||||||||||||||||||||||||||||||||||||||||||||||
| 10/31/2018 | 32.48 | .76 | (1.57 | ) | (.81 | ) | (.76 | ) | (.48 | ) | (1.24 | ) | 30.43 | (2.67 | )5 | — | 6 | .62 | 5 | .62 | 5 | 2.34 | 5 | |||||||||||||||||||||||||||||
| 10/31/20177,8 | 30.58 | .38 | 1.86 | 2.24 | (.34 | ) | — | (.34 | ) | 32.48 | 7.36 | 5,9 | — | 6 | .62 | 5,10 | .62 | 5,10 | 2.12 | 5,10 | ||||||||||||||||||||||||||||||||
| Class F-1: | ||||||||||||||||||||||||||||||||||||||||||||||||||||
| 10/31/2018 | 32.49 | .69 | (1.58 | ) | (.89 | ) | (.67 | ) | (.48 | ) | (1.15 | ) | 30.45 | (2.90 | ) | 158 | .89 | .89 | 2.12 | |||||||||||||||||||||||||||||||||
| 10/31/2017 | 29.66 | .59 | 2.78 | 3.37 | (.54 | ) | — | (.54 | ) | 32.49 | 11.43 | 167 | .90 | .90 | 1.90 | |||||||||||||||||||||||||||||||||||||
| 10/31/2016 | 29.66 | .57 | .50 | 1.07 | (.52 | ) | (.55 | ) | (1.07 | ) | 29.66 | 3.76 | 191 | .91 | .91 | 1.96 | ||||||||||||||||||||||||||||||||||||
| 10/31/2015 | 31.50 | .50 | (1.28 | ) | (.78 | ) | (.34 | ) | (.72 | ) | (1.06 | ) | 29.66 | (2.51 | ) | 183 | .91 | .91 | 1.66 | |||||||||||||||||||||||||||||||||
| 10/31/2014 | 30.22 | .71 | 1.64 | 2.35 | (.55 | ) | (.52 | ) | (1.07 | ) | 31.50 | 7.87 | 184 | .94 | .94 | 2.27 | ||||||||||||||||||||||||||||||||||||
| Class F-2: | ||||||||||||||||||||||||||||||||||||||||||||||||||||
| 10/31/2018 | 32.50 | .77 | (1.57 | ) | (.80 | ) | (.76 | ) | (.48 | ) | (1.24 | ) | 30.46 | (2.63 | ) | 1,602 | .62 | .62 | 2.38 | |||||||||||||||||||||||||||||||||
| 10/31/2017 | 29.68 | .67 | 2.78 | 3.45 | (.63 | ) | — | (.63 | ) | 32.50 | 11.75 | 1,119 | .64 | .64 | 2.16 | |||||||||||||||||||||||||||||||||||||
| 10/31/2016 | 29.67 | .65 | .51 | 1.16 | (.60 | ) | (.55 | ) | (1.15 | ) | 29.68 | 4.03 | 698 | .65 | .65 | 2.21 | ||||||||||||||||||||||||||||||||||||
| 10/31/2015 | 31.51 | .59 | (1.29 | ) | (.70 | ) | (.42 | ) | (.72 | ) | (1.14 | ) | 29.67 | (2.24 | ) | 532 | .65 | .65 | 1.94 | |||||||||||||||||||||||||||||||||
| 10/31/2014 | 30.24 | .71 | 1.71 | 2.42 | (.63 | ) | (.52 | ) | (1.15 | ) | 31.51 | 8.16 | 427 | .68 | .68 | 2.28 | ||||||||||||||||||||||||||||||||||||
| Class F-3: | ||||||||||||||||||||||||||||||||||||||||||||||||||||
| 10/31/2018 | 32.48 | .80 | (1.57 | ) | (.77 | ) | (.79 | ) | (.48 | ) | (1.27 | ) | 30.44 | (2.54 | ) | 421 | .52 | .52 | 2.48 | |||||||||||||||||||||||||||||||||
| 10/31/20177,11 | 30.03 | .52 | 2.40 | 2.92 | (.47 | ) | — | (.47 | ) | 32.48 | 9.78 | 9 | 271 | .53 | 10 | .53 | 10 | 2.14 | 10 | |||||||||||||||||||||||||||||||||
| Class 529-A: | ||||||||||||||||||||||||||||||||||||||||||||||||||||
| 10/31/2018 | 32.47 | .68 | (1.58 | ) | (.90 | ) | (.67 | ) | (.48 | ) | (1.15 | ) | 30.42 | (2.93 | ) | 253 | .89 | .89 | 2.11 | |||||||||||||||||||||||||||||||||
| 10/31/2017 | 29.64 | .59 | 2.79 | 3.38 | (.55 | ) | — | (.55 | ) | 32.47 | 11.50 | 241 | .90 | .90 | 1.90 | |||||||||||||||||||||||||||||||||||||
| 10/31/2016 | 29.64 | .57 | .49 | 1.06 | (.51 | ) | (.55 | ) | (1.06 | ) | 29.64 | 3.70 | 207 | .93 | .93 | 1.94 | ||||||||||||||||||||||||||||||||||||
| 10/31/2015 | 31.48 | .50 | (1.28 | ) | (.78 | ) | (.34 | ) | (.72 | ) | (1.06 | ) | 29.64 | (2.53 | ) | 199 | .93 | .93 | 1.65 | |||||||||||||||||||||||||||||||||
| 10/31/2014 | 30.21 | .66 | 1.68 | 2.34 | (.55 | ) | (.52 | ) | (1.07 | ) | 31.48 | 7.87 | 196 | .96 | .96 | 2.14 | ||||||||||||||||||||||||||||||||||||
| 26 | American Funds Global Balanced Fund |
| (Loss) income from investment operations1 | Dividends and distributions | |||||||||||||||||||||||||||||||||||||||||||||||||||
| Period ended | Net asset value, beginning of period | Net investment income2 | Net (losses) gains on securities (both realized and unrealized) | Total from investment operations | Dividends (from net investment income) | Distributions (from capital gains) | Total dividends and distributions | Net asset value, end of period | Total return3,4 | Net assets, end of period (in millions) | Ratio of expenses to average net assets before reimburse- ments | Ratio of expenses to average net assets after reimburse- ments4 | Ratio of net income to average net assets2,4 | |||||||||||||||||||||||||||||||||||||||
| Class 529-C: | ||||||||||||||||||||||||||||||||||||||||||||||||||||
| 10/31/2018 | $ | 32.34 | $ | .43 | $ | (1.57 | ) | $ | (1.14 | ) | $ | (.41 | ) | $ | (.48 | ) | $ | (.89 | ) | $ | 30.31 | (3.66 | )% | $ | 75 | 1.66 | % | 1.66 | % | 1.33 | % | |||||||||||||||||||||
| 10/31/2017 | 29.53 | .34 | 2.78 | 3.12 | (.31 | ) | — | (.31 | ) | 32.34 | 10.61 | 87 | 1.69 | 1.69 | 1.11 | |||||||||||||||||||||||||||||||||||||
| 10/31/2016 | 29.53 | .33 | .51 | .84 | (.29 | ) | (.55 | ) | (.84 | ) | 29.53 | 2.91 | 78 | 1.72 | 1.72 | 1.15 | ||||||||||||||||||||||||||||||||||||
| 10/31/2015 | 31.37 | .26 | (1.28 | ) | (1.02 | ) | (.10 | ) | (.72 | ) | (.82 | ) | 29.53 | (3.30 | ) | 77 | 1.73 | 1.73 | .85 | |||||||||||||||||||||||||||||||||
| 10/31/2014 | 30.12 | .41 | 1.67 | 2.08 | (.31 | ) | (.52 | ) | (.83 | ) | 31.37 | 6.99 | 73 | 1.76 | 1.76 | 1.33 | ||||||||||||||||||||||||||||||||||||
| Class 529-E: | ||||||||||||||||||||||||||||||||||||||||||||||||||||
| 10/31/2018 | 32.43 | .61 | (1.57 | ) | (.96 | ) | (.60 | ) | (.48 | ) | (1.08 | ) | 30.39 | (3.13 | ) | 14 | 1.12 | 1.12 | 1.88 | |||||||||||||||||||||||||||||||||
| 10/31/2017 | 29.61 | .52 | 2.78 | 3.30 | (.48 | ) | — | (.48 | ) | 32.43 | 11.19 | 14 | 1.13 | 1.13 | 1.67 | |||||||||||||||||||||||||||||||||||||
| 10/31/2016 | 29.61 | .50 | .50 | 1.00 | (.45 | ) | (.55 | ) | (1.00 | ) | 29.61 | 3.51 | 12 | 1.16 | 1.16 | 1.71 | ||||||||||||||||||||||||||||||||||||
| 10/31/2015 | 31.45 | .42 | (1.28 | ) | (.86 | ) | (.26 | ) | (.72 | ) | (.98 | ) | 29.61 | (2.77 | ) | 12 | 1.18 | 1.18 | 1.40 | |||||||||||||||||||||||||||||||||
| 10/31/2014 | 30.18 | .59 | 1.67 | 2.26 | (.47 | ) | (.52 | ) | (.99 | ) | 31.45 | 7.57 | 11 | 1.21 | 1.21 | 1.90 | ||||||||||||||||||||||||||||||||||||
| Class 529-T: | ||||||||||||||||||||||||||||||||||||||||||||||||||||
| 10/31/2018 | 32.48 | .75 | (1.57 | ) | (.82 | ) | (.75 | ) | (.48 | ) | (1.23 | ) | 30.43 | (2.71 | )5 | — | 6 | .65 | 5 | .65 | 5 | 2.31 | 5 | |||||||||||||||||||||||||||||
| 10/31/20177,8 | 30.58 | .37 | 1.86 | 2.23 | (.33 | ) | — | (.33 | ) | 32.48 | 7.33 | 5,9 | — | 6 | .68 | 5,10 | .68 | 5,10 | 2.06 | 5,10 | ||||||||||||||||||||||||||||||||
| Class 529-F-1: | ||||||||||||||||||||||||||||||||||||||||||||||||||||
| 10/31/2018 | 32.48 | .75 | (1.56 | ) | (.81 | ) | (.75 | ) | (.48 | ) | (1.23 | ) | 30.44 | (2.67 | ) | 32 | .66 | .66 | 2.33 | |||||||||||||||||||||||||||||||||
| 10/31/2017 | 29.66 | .65 | 2.78 | 3.43 | (.61 | ) | — | (.61 | ) | 32.48 | 11.69 | 22 | .69 | .69 | 2.11 | |||||||||||||||||||||||||||||||||||||
| 10/31/2016 | 29.65 | .63 | .51 | 1.14 | (.58 | ) | (.55 | ) | (1.13 | ) | 29.66 | 3.95 | 17 | .72 | .72 | 2.15 | ||||||||||||||||||||||||||||||||||||
| 10/31/2015 | 31.50 | .56 | (1.29 | ) | (.73 | ) | (.40 | ) | (.72 | ) | (1.12 | ) | 29.65 | (2.34 | ) | 14 | .72 | .72 | 1.86 | |||||||||||||||||||||||||||||||||
| 10/31/2014 | 30.23 | .72 | 1.68 | 2.40 | (.61 | ) | (.52 | ) | (1.13 | ) | 31.50 | 8.08 | 12 | .76 | .76 | 2.33 | ||||||||||||||||||||||||||||||||||||
| Class R-1: | ||||||||||||||||||||||||||||||||||||||||||||||||||||
| 10/31/2018 | 32.42 | .44 | (1.57 | ) | (1.13 | ) | (.43 | ) | (.48 | ) | (.91 | ) | 30.38 | (3.62 | ) | 5 | 1.62 | 1.62 | 1.37 | |||||||||||||||||||||||||||||||||
| 10/31/2017 | 29.59 | .37 | 2.77 | 3.14 | (.31 | ) | — | (.31 | ) | 32.42 | 10.68 | 5 | 1.63 | 1.63 | 1.19 | |||||||||||||||||||||||||||||||||||||
| 10/31/2016 | 29.59 | .38 | .50 | .88 | (.33 | ) | (.55 | ) | (.88 | ) | 29.59 | 3.04 | 7 | 1.58 | 1.58 | 1.30 | ||||||||||||||||||||||||||||||||||||
| 10/31/2015 | 31.43 | .31 | (1.28 | ) | (.97 | ) | (.15 | ) | (.72 | ) | (.87 | ) | 29.59 | (3.12 | )5 | 8 | 1.54 | 5 | 1.54 | 5 | 1.04 | 5 | ||||||||||||||||||||||||||||||
| 10/31/2014 | 30.17 | .52 | 1.66 | 2.18 | (.40 | ) | (.52 | ) | (.92 | ) | 31.43 | 7.35 | 5 | 8 | 1.44 | 5 | 1.44 | 5 | 1.69 | 5 | ||||||||||||||||||||||||||||||||
| Class R-2: | ||||||||||||||||||||||||||||||||||||||||||||||||||||
| 10/31/2018 | 32.37 | .45 | (1.57 | ) | (1.12 | ) | (.44 | ) | (.48 | ) | (.92 | ) | 30.33 | (3.57 | ) | 44 | 1.60 | 1.60 | 1.39 | |||||||||||||||||||||||||||||||||
| 10/31/2017 | 29.55 | .37 | 2.78 | 3.15 | (.33 | ) | — | (.33 | ) | 32.37 | 10.68 | 48 | 1.60 | 1.60 | 1.20 | |||||||||||||||||||||||||||||||||||||
| 10/31/2016 | 29.56 | .36 | .49 | .85 | (.31 | ) | (.55 | ) | (.86 | ) | 29.55 | 2.97 | 44 | 1.64 | 1.64 | 1.22 | ||||||||||||||||||||||||||||||||||||
| 10/31/2015 | 31.40 | .29 | (1.28 | ) | (.99 | ) | (.13 | ) | (.72 | ) | (.85 | ) | 29.56 | (3.19 | ) | 41 | 1.62 | 1.62 | .96 | |||||||||||||||||||||||||||||||||
| 10/31/2014 | 30.15 | .43 | 1.67 | 2.10 | (.33 | ) | (.52 | ) | (.85 | ) | 31.40 | 7.06 | 36 | 1.69 | 1.69 | 1.40 | ||||||||||||||||||||||||||||||||||||
| Class R-2E: | ||||||||||||||||||||||||||||||||||||||||||||||||||||
| 10/31/2018 | 32.44 | .56 | (1.59 | ) | (1.03 | ) | (.56 | ) | (.48 | ) | (1.04 | ) | 30.37 | (3.34 | ) | 2 | 1.31 | 1.31 | 1.75 | |||||||||||||||||||||||||||||||||
| 10/31/2017 | 29.64 | .46 | 2.78 | 3.24 | (.44 | ) | — | (.44 | ) | 32.44 | 11.01 | 1 | 1.33 | 1.33 | 1.48 | |||||||||||||||||||||||||||||||||||||
| 10/31/2016 | 29.63 | .41 | .58 | .99 | (.43 | ) | (.55 | ) | (.98 | ) | 29.64 | 3.45 | — | 6 | 1.35 | 1.32 | 1.42 | |||||||||||||||||||||||||||||||||||
| 10/31/2015 | 31.48 | .51 | (1.28 | ) | (.77 | ) | (.36 | ) | (.72 | ) | (1.08 | ) | 29.63 | (2.48 | )5 | — | 6 | .90 | 5 | .90 | 5 | 1.69 | 5 | |||||||||||||||||||||||||||||
| 10/31/20147,12 | 31.95 | .06 | (.39 | ) | (.33 | ) | (.14 | ) | — | (.14 | ) | 31.48 | (1.04 | )5,9 | — | 6 | .13 | 5,9 | .13 | 5,9 | .20 | 5,9 | ||||||||||||||||||||||||||||||
See end of table for footnotes.
| American Funds Global Balanced Fund | 27 |
Financial highlights (continued)
| (Loss) income from investment operations1 | Dividends and distributions | |||||||||||||||||||||||||||||||||||||||||||||||||||
| Period ended | Net asset value, beginning of period | Net investment income2 | Net (losses) gains on securities (both realized and unrealized) | Total from investment operations | Dividends (from net investment income) | Distributions (from capital gains) | Total dividends and distributions | Net asset value, end of period | Total return3,4 | Net assets, end of period (in millions) | Ratio of expenses to average net assets before reimburse- ments | Ratio of expenses to average net assets after reimburse- ments4 | Ratio of net income to average net assets2,4 | |||||||||||||||||||||||||||||||||||||||
| Class R-3: | ||||||||||||||||||||||||||||||||||||||||||||||||||||
| 10/31/2018 | $ | 32.43 | $ | .59 | $ | (1.57 | ) | $ | (.98 | ) | $ | (.58 | ) | $ | (.48 | ) | $ | (1.06 | ) | $ | 30.39 | (3.16 | )% | $ | 57 | 1.16 | % | 1.16 | % | 1.83 | % | |||||||||||||||||||||
| 10/31/2017 | 29.61 | .51 | 2.78 | 3.29 | (.47 | ) | — | (.47 | ) | 32.43 | 11.18 | 54 | 1.16 | 1.16 | 1.65 | |||||||||||||||||||||||||||||||||||||
| 10/31/2016 | 29.61 | .49 | .50 | .99 | (.44 | ) | (.55 | ) | (.99 | ) | 29.61 | 3.45 | 50 | 1.20 | 1.20 | 1.68 | ||||||||||||||||||||||||||||||||||||
| 10/31/2015 | 31.45 | .42 | (1.27 | ) | (.85 | ) | (.27 | ) | (.72 | ) | (.99 | ) | 29.61 | (2.75 | ) | 45 | 1.18 | 1.18 | 1.40 | |||||||||||||||||||||||||||||||||
| 10/31/2014 | 30.19 | .58 | 1.67 | 2.25 | (.47 | ) | (.52 | ) | (.99 | ) | 31.45 | 7.57 | 36 | 1.22 | 1.22 | 1.87 | ||||||||||||||||||||||||||||||||||||
| Class R-4: | ||||||||||||||||||||||||||||||||||||||||||||||||||||
| 10/31/2018 | 32.48 | .69 | (1.57 | ) | (.88 | ) | (.68 | ) | (.48 | ) | (1.16 | ) | 30.44 | (2.87 | ) | 42 | .86 | .86 | 2.14 | |||||||||||||||||||||||||||||||||
| 10/31/2017 | 29.66 | .60 | 2.78 | 3.38 | (.56 | ) | — | (.56 | ) | 32.48 | 11.49 | 36 | .87 | .87 | 1.94 | |||||||||||||||||||||||||||||||||||||
| 10/31/2016 | 29.66 | .57 | .51 | 1.08 | (.53 | ) | (.55 | ) | (1.08 | ) | 29.66 | 3.74 | 27 | .90 | .90 | 1.96 | ||||||||||||||||||||||||||||||||||||
| 10/31/2015 | 31.50 | .52 | (1.29 | ) | (.77 | ) | (.35 | ) | (.72 | ) | (1.07 | ) | 29.66 | (2.47 | ) | 25 | .88 | .88 | 1.71 | |||||||||||||||||||||||||||||||||
| 10/31/2014 | 30.23 | .67 | 1.68 | 2.35 | (.56 | ) | (.52 | ) | (1.08 | ) | 31.50 | 7.92 | 22 | .91 | .91 | 2.16 | ||||||||||||||||||||||||||||||||||||
| Class R-5E: | ||||||||||||||||||||||||||||||||||||||||||||||||||||
| 10/31/2018 | 32.48 | .73 | (1.54 | ) | (.81 | ) | (.76 | ) | (.48 | ) | (1.24 | ) | 30.43 | (2.66 | ) | 1 | .65 | .65 | 2.31 | |||||||||||||||||||||||||||||||||
| 10/31/2017 | 29.64 | .69 | 2.79 | 3.48 | (.64 | ) | — | (.64 | ) | 32.48 | 11.86 | — | 6 | .75 | .57 | 2.23 | ||||||||||||||||||||||||||||||||||||
| 10/31/20167,13 | 29.46 | .59 | .72 | 1.31 | (.58 | ) | (.55 | ) | (1.13 | ) | 29.64 | 4.58 | 9 | — | 6 | .75 | 10 | .75 | 10 | 2.13 | 10 | |||||||||||||||||||||||||||||||
| Class R-5: | ||||||||||||||||||||||||||||||||||||||||||||||||||||
| 10/31/2018 | 32.53 | .79 | (1.59 | ) | (.80 | ) | (.77 | ) | (.48 | ) | (1.25 | ) | 30.48 | (2.61 | ) | 22 | .57 | .57 | 2.43 | |||||||||||||||||||||||||||||||||
| 10/31/2017 | 29.70 | .69 | 2.79 | 3.48 | (.65 | ) | — | (.65 | ) | 32.53 | 11.84 | 20 | .58 | .58 | 2.22 | |||||||||||||||||||||||||||||||||||||
| 10/31/2016 | 29.70 | .67 | .49 | 1.16 | (.61 | ) | (.55 | ) | (1.16 | ) | 29.70 | 4.04 | 8 | .60 | .60 | 2.28 | ||||||||||||||||||||||||||||||||||||
| 10/31/2015 | 31.54 | .60 | (1.28 | ) | (.68 | ) | (.44 | ) | (.72 | ) | (1.16 | ) | 29.70 | (2.19 | ) | 6 | .60 | .60 | 1.97 | |||||||||||||||||||||||||||||||||
| 10/31/2014 | 30.25 | .89 | 1.56 | 2.45 | (.64 | ) | (.52 | ) | (1.16 | ) | 31.54 | 8.23 | 5 | .62 | .62 | 2.87 | ||||||||||||||||||||||||||||||||||||
| Class R-6: | ||||||||||||||||||||||||||||||||||||||||||||||||||||
| 10/31/2018 | 32.51 | .80 | (1.57 | ) | (.77 | ) | (.79 | ) | (.48 | ) | (1.27 | ) | 30.47 | (2.53 | ) | 8,032 | .52 | .52 | 2.48 | |||||||||||||||||||||||||||||||||
| 10/31/2017 | 29.68 | .70 | 2.79 | 3.49 | (.66 | ) | — | (.66 | ) | 32.51 | 11.90 | 6,475 | .53 | .53 | 2.27 | |||||||||||||||||||||||||||||||||||||
| 10/31/2016 | 29.68 | .68 | .50 | 1.18 | (.63 | ) | (.55 | ) | (1.18 | ) | 29.68 | 4.10 | 3,993 | .54 | .54 | 2.33 | ||||||||||||||||||||||||||||||||||||
| 10/31/2015 | 31.52 | .65 | (1.32 | ) | (.67 | ) | (.45 | ) | (.72 | ) | (1.17 | ) | 29.68 | (2.14 | ) | 2,893 | .54 | .54 | 2.16 | |||||||||||||||||||||||||||||||||
| 10/31/2014 | 30.25 | .75 | 1.71 | 2.46 | (.67 | ) | (.52 | ) | (1.19 | ) | 31.52 | 8.27 | 199 | .57 | .57 | 2.42 | ||||||||||||||||||||||||||||||||||||
| Year ended October 31 | ||||||||||||||||||||
| Portfolio turnover rate for all share classes14 | 2018 | 2017 | 2016 | 2015 | 2014 | |||||||||||||||
| Excluding mortgage dollar roll transactions | 45% | 37% | 39% | 46% | Not available | |||||||||||||||
| Including mortgage dollar roll transactions | 59% | 44% | 59% | 85% | 74% | |||||||||||||||
| 1 | Based on average shares outstanding. |
| 2 | For the year ended October 31, 2014, this column reflects the impact of a corporate action event that resulted in a one-time increase to net investment income. If the corporate action event had not occurred, the Class A net investment income per share and ratio of net income to average net assets would have been lower by $.17 and .54 percentage points, respectively. The impact to the other share classes would have been similar. |
| 3 | Total returns exclude any applicable sales charges, including contingent deferred sales charges. |
| 4 | This column reflects the impact, if any, of certain reimbursements from CRMC. During some of the periods shown, CRMC paid a portion of the fund’s transfer agent fees for certain retirement plan share classes. |
| 5 | All or a significant portion of assets in this class consisted of seed capital invested by CRMC and/or its affiliates. Fees for distribution services are not charged or accrued on these seed capital assets. If such fees were paid by the fund on seed capital assets, fund expenses would have been higher and net income and total return would have been lower. |
| 6 | Amount less than $1 million. |
| 7 | Based on operations for a period that is less than a full year. |
| 8 | Class T and 529-T shares began investment operations on April 7, 2017. |
| 9 | Not annualized. |
| 10 | Annualized. |
| 11 | Class F-3 shares began investment operations on January 27, 2017. |
| 12 | Class R-2E shares began investment operations on August 29, 2014. |
| 13 | Class R-5E shares began investment operations on November 20, 2015. |
| 14 | Refer to Note 5 for more information on mortgage dollar rolls. |
See notes to financial statements
| 28 | American Funds Global Balanced Fund |
Report of Independent Registered Public Accounting Firm
To the Shareholders and Board of Trustees of American Funds Global Balanced Fund:
Opinion on the Financial Statements and Financial Highlights
We have audited the accompanying statement of assets and liabilities of American Funds Global Balanced Fund (the “Fund”), including the summary investment portfolio, as of October 31, 2018, the related statement of operations for the year then ended, the statements of changes in net assets for each of the two years in the period then ended, the financial highlights for each of the five years in the period then ended, and the related notes. In our opinion, the financial statements and financial highlights present fairly, in all material respects, the financial position of the Fund as of October 31, 2018, and the results of its operations for the year then ended, the changes in its net assets for each of the two years in the period then ended, and the financial highlights for each of the five years in the period then ended, in conformity with accounting principles generally accepted in the United States of America.
Basis for Opinion
These financial statements and financial highlights are the responsibility of the Fund’s management. Our responsibility is to express an opinion on the Fund’s financial statements and financial highlights based on our audits. We are a public accounting firm registered with the Public Company Accounting Oversight Board (United States) (PCAOB) and are required to be independent with respect to the Fund in accordance with the U.S. federal securities laws and the applicable rules and regulations of the Securities and Exchange Commission and the PCAOB.
We conducted our audits in accordance with the standards of the PCAOB. Those standards require that we plan and perform the audit to obtain reasonable assurance about whether the financial statements and financial highlights are free of material misstatement, whether due to error or fraud. The Fund is not required to have, nor were we engaged to perform, an audit of its internal control over financial reporting. As part of our audits we are required to obtain an understanding of internal control over financial reporting but not for the purpose of expressing an opinion on the effectiveness of the Fund’s internal control over financial reporting. Accordingly, we express no such opinion.
Our audits included performing procedures to assess the risks of material misstatement of the financial statements and financial highlights, whether due to error or fraud, and performing procedures that respond to those risks. Such procedures included examining, on a test basis, evidence regarding the amounts and disclosures in the financial statements and financial highlights. Our audits also included evaluating the accounting principles used and significant estimates made by management, as well as evaluating the overall presentation of the financial statements and financial highlights. Our procedures included confirmation of securities owned as of October 31, 2018, by correspondence with the custodian and brokers; when replies were not received from brokers, we performed other auditing procedures. We believe that our audits provide a reasonable basis for our opinion.
Deloitte & Touche LLP
Costa Mesa, California
December 12, 2018
We have served as the auditor of one or more American Funds investment companies since 1956.
| American Funds Global Balanced Fund | 29 |
| Expense example | unaudited |
As a fund shareholder, you incur two types of costs: (1) transaction costs, such as initial sales charges on purchase payments and contingent deferred sales charges on redemptions (loads), and (2) ongoing costs, including management fees, distribution and service (12b-1) fees, and other expenses. This example is intended to help you understand your ongoing costs (in dollars) of investing in the fund so you can compare these costs with the ongoing costs of investing in other mutual funds. The example is based on an investment of $1,000 invested at the beginning of the period and held for the entire six-month period (May 1, 2018, through October 31, 2018).
Actual expenses:
The first line of each share class in the table on the following page provides information about actual account values and actual expenses. You may use the information in this line, together with the amount you invested, to estimate the expenses that you paid over the period. Simply divide your account value by $1,000 (for example, an $8,600 account value divided by $1,000 = 8.6), then multiply the result by the number in the first line under the heading titled “Expenses paid during period” to estimate the expenses you paid on your account during this period.
Hypothetical example for comparison purposes:
The second line of each share class in the table on the following page provides information about hypothetical account values and hypothetical expenses based on the actual expense ratio for the share class and an assumed rate of return of 5.00% per year before expenses, which is not the actual return of the share class. The hypothetical account values and expenses may not be used to estimate the actual ending account balance or expenses you paid for the period. You may use this information to compare the ongoing costs of investing in the fund and other funds. To do so, compare this 5.00% hypothetical example with the 5.00% hypothetical examples that appear in the shareholder reports of the other funds.
Notes:
Retirement plan participants may be subject to certain fees charged by the plan sponsor, and Class F-1, F-2, F-3 and 529-F-1 shareholders may be subject to fees charged by financial intermediaries, typically ranging from 0.75% to 1.50% of assets annually depending on services offered. You can estimate the impact of these fees by adding the amount of the fees to the total estimated expenses you paid on your account during the period as calculated above. In addition, your ending account value would be lower by the amount of these fees.
Note that the expenses shown in the table on the following page are meant to highlight your ongoing costs only and do not reflect any transactional costs, such as sales charges (loads). Therefore, the second line of each share class in the table is useful in comparing ongoing costs only and will not help you determine the relative total costs of owning different funds. In addition, if these transactional costs were included, your costs would have been higher.
| 30 | American Funds Global Balanced Fund |
| Beginning account value 5/1/2018 | Ending account value 10/31/2018 | Expenses paid during period* | Annualized expense ratio | |||||||||||||
| Class A – actual return | $ | 1,000.00 | $ | 946.96 | $ | 4.12 | .84 | % | ||||||||
| Class A – assumed 5% return | 1,000.00 | 1,020.97 | 4.28 | .84 | ||||||||||||
| Class C – actual return | 1,000.00 | 943.50 | 7.84 | 1.60 | ||||||||||||
| Class C – assumed 5% return | 1,000.00 | 1,017.14 | 8.13 | 1.60 | ||||||||||||
| Class T – actual return | 1,000.00 | 947.71 | 2.99 | .61 | ||||||||||||
| Class T – assumed 5% return | 1,000.00 | 1,022.13 | 3.11 | .61 | ||||||||||||
| Class F-1 – actual return | 1,000.00 | 946.66 | 4.37 | .89 | ||||||||||||
| Class F-1 – assumed 5% return | 1,000.00 | 1,020.72 | 4.53 | .89 | ||||||||||||
| Class F-2 – actual return | 1,000.00 | 948.13 | 3.04 | .62 | ||||||||||||
| Class F-2 – assumed 5% return | 1,000.00 | 1,022.08 | 3.16 | .62 | ||||||||||||
| Class F-3 – actual return | 1,000.00 | 948.51 | 2.55 | .52 | ||||||||||||
| Class F-3 – assumed 5% return | 1,000.00 | 1,022.58 | 2.65 | .52 | ||||||||||||
| Class 529-A – actual return | 1,000.00 | 946.73 | 4.32 | .88 | ||||||||||||
| Class 529-A – assumed 5% return | 1,000.00 | 1,020.77 | 4.48 | .88 | ||||||||||||
| Class 529-C – actual return | 1,000.00 | 943.16 | 8.08 | 1.65 | ||||||||||||
| Class 529-C – assumed 5% return | 1,000.00 | 1,016.89 | 8.39 | 1.65 | ||||||||||||
| Class 529-E – actual return | 1,000.00 | 945.62 | 5.44 | 1.11 | ||||||||||||
| Class 529-E – assumed 5% return | 1,000.00 | 1,019.61 | 5.65 | 1.11 | ||||||||||||
| Class 529-T – actual return | 1,000.00 | 947.86 | 3.19 | .65 | ||||||||||||
| Class 529-T – assumed 5% return | 1,000.00 | 1,021.93 | 3.31 | .65 | ||||||||||||
| Class 529-F-1 – actual return | 1,000.00 | 947.90 | 3.19 | .65 | ||||||||||||
| Class 529-F-1 – assumed 5% return | 1,000.00 | 1,021.93 | 3.31 | .65 | ||||||||||||
| Class R-1 – actual return | 1,000.00 | 943.30 | 7.89 | 1.61 | ||||||||||||
| Class R-1 – assumed 5% return | 1,000.00 | 1,017.09 | 8.19 | 1.61 | ||||||||||||
| Class R-2 – actual return | 1,000.00 | 943.57 | 7.79 | 1.59 | ||||||||||||
| Class R-2 – assumed 5% return | 1,000.00 | 1,017.19 | 8.08 | 1.59 | ||||||||||||
| Class R-2E – actual return | 1,000.00 | 944.66 | 6.37 | 1.30 | ||||||||||||
| Class R-2E – assumed 5% return | 1,000.00 | 1,018.65 | 6.61 | 1.30 | ||||||||||||
| Class R-3 – actual return | 1,000.00 | 945.77 | 5.64 | 1.15 | ||||||||||||
| Class R-3 – assumed 5% return | 1,000.00 | 1,019.41 | 5.85 | 1.15 | ||||||||||||
| Class R-4 – actual return | 1,000.00 | 946.93 | 4.22 | .86 | ||||||||||||
| Class R-4 – assumed 5% return | 1,000.00 | 1,020.87 | 4.38 | .86 | ||||||||||||
| Class R-5E – actual return | 1,000.00 | 947.96 | 3.19 | .65 | ||||||||||||
| Class R-5E – assumed 5% return | 1,000.00 | 1,021.93 | 3.31 | .65 | ||||||||||||
| Class R-5 – actual return | 1,000.00 | 948.08 | 2.75 | .56 | ||||||||||||
| Class R-5 – assumed 5% return | 1,000.00 | 1,022.38 | 2.85 | .56 | ||||||||||||
| Class R-6 – actual return | 1,000.00 | 948.59 | 2.50 | .51 | ||||||||||||
| Class R-6 – assumed 5% return | 1,000.00 | 1,022.63 | 2.60 | .51 | ||||||||||||
| * | The “expenses paid during period” are equal to the “annualized expense ratio,” multiplied by the average account value over the period, multiplied by the number of days in the period, and divided by 365 (to reflect the one-half year period). |
| American Funds Global Balanced Fund | 31 |
| Tax information | unaudited |
We are required to advise you of the federal tax status of certain distributions received by shareholders during the fiscal year. The fund hereby designates the following amounts for the fund’s fiscal year ended October 31, 2018:
| Foreign taxes | $0.04 per share | |||
| Foreign source income | $0.65 per share | |||
| Long-term capital gains | $217,434,000 | |||
| Qualified dividend income | $343,773,000 | |||
| Corporate dividends received deduction | $84,334,000 | |||
| U.S. government income that may be exempt from state taxation | $40,896,000 |
Individual shareholders should refer to their Form 1099 or other tax information, which will be mailed in January 2019, to determine the calendar year amounts to be included on their 2018 tax returns. Shareholders should consult their tax advisors.
| 32 | American Funds Global Balanced Fund |
This page was intentionally left blank.
| American Funds Global Balanced Fund | 33 |
Board of trustees and other officers
Independent trustees1
| Name and year of birth | Year first elected a trustee of the fund2 |
Principal occupation(s) during past five years | Number of portfolios in fund complex overseen by trustee |
Other directorships3 held by trustee | ||||
| Louise H. Bryson, 1944 | 2010 | Chair Emerita of the Board of Trustees, J. Paul Getty Trust; former President, Distribution, Lifetime Entertainment Network (retired 2008); former Executive Vice President and General Manager, Lifetime Movie Network (retired 2008) | 7 | None | ||||
| Mary Anne Dolan, 1947 | 2010 | Founder and President, MAD Ink (communications company); former Editor-in-Chief, The Los Angeles Herald Examiner (retired 1989) | 10 | None | ||||
| James G. Ellis, 1947 | 2010 | Dean and Professor of Marketing, Marshall School of Business, University of Southern California | 81 | Mercury General Corporation | ||||
| Leonard R. Fuller, 1946 | 2010 | Private investor; former President and CEO, Fuller Consulting (financial management consulting) | 81 | None | ||||
| Pablo R. González Guajardo, 1967 | 2015 | CEO, Kimberly-Clark de México, S.A.B. de C.V. | 7 | América Móvil, S.A.B. de C.V.; Grupo Lala, S.A.B. de C.V.; Grupo Sanborns, S.A.B. de C.V.; Kimberly-Clark de México, S.A.B. de C.V. | ||||
| William D. Jones, 1955 Chairman of the Board (Independent and Non-Executive) |
2010 | Real estate developer/owner, President and CEO, CityLink Investment Corporation (acquires, develops and manages real estate ventures in urban communities) and City Scene Management Company (provides commercial asset management services) | 8 | Sempra Energy | ||||
| John C. Mazziotta, MD, PhD, 1949 | 2011 | Physician; Professor of Neurology, University of California, Los Angeles; Vice Chancellor, UCLA Health Sciences; CEO, UCLA Health System; former Dean, David Geffen School of Medicine at UCLA; former Chair, Department of Neurology, UCLA; former Associate Director, Semel Institute, UCLA; former Director, Brain Mapping Center, UCLA | 4 | None | ||||
| William R. McLaughlin, 1956 | 2015 | President and CEO, The Orvis Company | 4 | None |
William H. Kling and Bailey Morris-Eck, trustees of the fund since 2010, have retired from the board. Leonard R. Fuller, a trustee of the fund since 2010, will retire from the board on December 31, 2018. The trustees thank Mr. Fuller, Mr. Kling and Ms. Morris-Eck for their dedication and service to the fund and its shareholders.
Interested trustee4,5
| Name, year of birth and position with fund |
Year first elected a trustee or officer of the fund2 |
Principal occupation(s) during past five years and positions held with affiliated entities or the principal underwriter of the fund |
Number of portfolios in fund complex overseen by trustee |
Other directorships3 held by trustee | ||||
| Eric S. Richter, 1960 President |
2010 | Partner — Capital Research Global Investors, Capital Research and Management Company | 1 | None |
The fund’s statement of additional information includes further details about fund trustees and is available without charge upon request by calling American Funds Service Company at (800) 421-4225 or by visiting the American Funds website at americanfunds.com. The address for all trustees and officers of the fund is 333 South Hope Street, Los Angeles, CA 90071, Attention: Secretary.
| 34 | American Funds Global Balanced Fund |
Other officers5
| Name, year of birth and position with fund |
Year first elected an officer of the fund2 |
Principal occupation(s) during past five years and positions
held with affiliated entities or the principal underwriter of the fund | ||
| Herbert Y. Poon, 1973 Executive Vice President |
2012 | Senior Vice President and Senior Counsel — Fund Business Management Group, Capital Research and Management Company | ||
| David M. Riley, 1967 Senior Vice President |
2010 | Partner — Capital Research Global Investors, Capital Research and Management Company; Director, The Capital Group Companies, Inc.6 | ||
| Mark A. Brett, 1958 Vice President |
2010 | Partner — Capital Fixed Income Investors, Capital Bank and Trust Company;6 Partner — Capital Fixed Income Investors, Capital International Limited;6 Senior Vice President, Capital International Limited;6 Senior Vice President, Capital International Sàrl;6 Director, Capital Strategy Research, Inc.6 | ||
| Laurie D. Neat, 1971 Secretary |
2016 | Vice President — Fund Business Management Group, Capital Research and Management Company; Vice President, Capital Guardian Trust Company;6 Vice President and Trust Officer, Capital Bank and Trust Company;6 Vice President, Capital International, Inc.6 | ||
| Brian D. Bullard, 1969 Treasurer |
2015 | Senior Vice President — Investment Operations, Capital Research and Management Company | ||
| Dori Laskin, 1951 Assistant Treasurer |
2010 | Vice President — Investment Operations, Capital Research and Management Company | ||
| Hong T. Le, 1978 Assistant Treasurer |
2016 | Assistant Vice President — Investment Operations, Capital Research and Management Company; Assistant Vice President, Capital Bank and Trust Company6 |
| 1 | The term independent trustee refers to a trustee who is not an “interested person” of the fund within the meaning of the Investment Company Act of 1940. |
| 2 | Trustees and officers of the fund serve until their resignation, removal or retirement. |
| 3 | This includes all directorships/trusteeships (other than those in the American Funds or other funds managed by Capital Research and Management Company or its affiliates) that are held by each trustee as a trustee or director of a public company or a registered investment company. |
| 4 | The term interested trustee refers to a trustee who is an “interested person” within the meaning of the Investment Company Act of 1940, on the basis of their affiliation with the fund’s investment adviser, Capital Research and Management Company, or affiliated entities (including the fund’s principal underwriter). |
| 5 | All of the trustees and/or officers listed are officers and/or directors/trustees of one or more of the other funds for which Capital Research and Management Company serves as investment adviser. |
| 6 | Company affiliated with Capital Research and Management Company. |
| American Funds Global Balanced Fund | 35 |
Board of trustees and other officers (continued)
Results of special meeting of shareholders
held November 28, 2018
Shares outstanding (all classes) on August 31, 2018 (record date):
534,319,769
Total shares voting on November 28, 2018:
504,370,418 (94.4% of shares outstanding)
The Proposal: To elect board members:
| Votes for | Percent of shares voting for | Votes withheld | Percent of shares withheld | |||||||||||||
| Louise H. Bryson | 495,672,945 | 98.3 | % | 8,697,472 | 1.7 | % | ||||||||||
| Mary Anne Dolan | 495,816,948 | 98.3 | 8,553,470 | 1.7 | ||||||||||||
| James G. Ellis | 494,906,194 | 98.1 | 9,464,223 | 1.9 | ||||||||||||
| Pablo R. González Guajardo | 437,028,677 | 86.6 | 67,341,741 | 13.4 | ||||||||||||
| William D. Jones | 496,170,246 | 98.4 | 8,200,172 | 1.6 | ||||||||||||
| John C. Mazziotta | 495,559,157 | 98.3 | 8,811,261 | 1.7 | ||||||||||||
| William R. McLaughlin | 496,350,144 | 98.4 | 8,020,274 | 1.6 | ||||||||||||
| William L. Robbins | 495,702,896 | 98.3 | 8,667,522 | 1.7 | ||||||||||||
| Kenneth M. Simril | 496,213,359 | 98.4 | 8,157,059 | 1.6 | ||||||||||||
| James R. Terrile | 495,993,630 | 98.3 | 8,376,788 | 1.7 | ||||||||||||
| Kathy J. Williams | 496,882,085 | 98.5 | 7,488,332 | 1.5 | ||||||||||||
| 36 | American Funds Global Balanced Fund |
Office of the fund
6455 Irvine Center Drive
Irvine, CA 92618-4518
Investment adviser
Capital Research and Management Company
333 South Hope Street
Los Angeles, CA 90071-1406
6455 Irvine Center Drive
Irvine, CA 92618-4518
Transfer agent for shareholder accounts
American Funds Service Company
(Write to the address near you.)
P.O. Box 6007
Indianapolis, IN 46206-6007
P.O. Box 2280
Norfolk, VA 23501-2280
Custodian of assets
Bank of New York Mellon
One Wall Street
New York, NY 10286
Counsel
O’Melveny & Myers LLP
400 South Hope Street
Los Angeles, CA 90071-2899
Independent registered public accounting firm
Deloitte & Touche LLP
695 Town Center Drive
Suite 1200
Costa Mesa, CA 92626-7188
Principal underwriter
American Funds Distributors, Inc.
333 South Hope Street
Los Angeles, CA 90071-1406
Investors should carefully consider investment objectives, risks, charges and expenses. This and other important information is contained in the fund prospectus and summary prospectus, which can be obtained from your financial professional and should be read carefully before investing. You may also call American Funds Service Company (AFS) at (800) 421-4225 or visit the American Funds website at americanfunds.com. Fund shares offered through American Funds Distributors, Inc.
“American Funds Proxy Voting Procedures and Principles” — which describes how we vote proxies relating to portfolio securities — is available on the American Funds website or upon request by calling AFS. The fund files its proxy voting record with the U.S. Securities and Exchange Commission (SEC) for the 12 months ended June 30 by August 31. The proxy voting record is available free of charge on the SEC website at sec.gov and on the American Funds website.
A complete October 31, 2018, portfolio of American Funds Global Balanced Fund’s investments is available free of charge by calling AFS or visiting the SEC website (where it is part of Form N-CSR).
American Funds Global Balanced Fund files a complete list of its portfolio holdings with the SEC for the first and third quarters of each fiscal year on Form N-Q. This filing is available free of charge on the SEC website. Additionally, the list of portfolio holdings is available by calling AFS.
This report is for the information of shareholders of American Funds Global Balanced Fund, but it also may be used as sales literature when preceded or accompanied by the current prospectus or summary prospectus, which gives details about charges, expenses, investment objectives and operating policies of the fund. If used as sales material after December 31, 2018, this report must be accompanied by an American Funds statistical update for the most recently completed calendar quarter.
MSCI has not approved, reviewed or produced this report, makes no express or implied warranties or representations and is not liable whatsoever for any data in the report. You may not redistribute the MSCI data or use it as a basis for other indices or investment products.
Bloomberg® is a trademark of Bloomberg Finance L.P. (collectively with its affiliates, “Bloomberg”). Barclays® is a trademark of Barclays Bank Plc (collectively with its affiliates, “Barclays”), used under license. Neither Bloomberg nor Barclays approves or endorses this material, guarantees the accuracy or completeness of any information herein and, to the maximum extent allowed by law, neither shall have any liability or responsibility for injury or damages arising in connection therewith.
The Capital Advantage®
Since 1931, American Funds by Capital Group has helped investors pursue long-term investment success. Our consistent approach — in combination with The Capital SystemSM — has resulted in a superior long-term track record.
Aligned with investor success
We base our decisions on a long-term perspective, which we believe aligns our goals with the interests of our clients. Our portfolio managers average 27 years of investment experience, including 22 years at our company, reflecting a career commitment to our long-term approach.1
The Capital System
The Capital System combines individual accountability with teamwork. Funds using The Capital System are divided into portions that are managed independently by investment professionals with diverse backgrounds, ages and investment approaches. An extensive global research effort is the backbone of our system.
American Funds’ superior long-term track record
Equity funds have beaten their Lipper peer indexes in 92% of 10-year periods and 99% of 20-year periods. Fixed income funds have beaten their Lipper indexes in 77% of 10-year periods and 80% of 20-year periods.2 Fund management fees have been among the lowest in the industry.3
| 1 | Portfolio manager experience as of December 31, 2017. |
| 2 | Based on Class F-2 share results for rolling periods through December 31, 2017. Periods covered are the shorter of the fund’s lifetime or since the comparable Lipper index inception date (except Capital Income Builder and SMALLCAP World Fund, for which the Lipper average was used). Expenses differ for each share class, so results will vary. Class F-2 shares were first offered on August 1, 2008. Class F-2 share results prior to the date of first sale are hypothetical based on Class A share results without a sales charge, adjusted for typical estimated expenses. Results for certain funds with an inception date after August 1, 2008, also include hypothetical returns because those funds’ Class F-2 shares sold after the funds’ date of first offering. Please see americanfunds.com for more information on specific expense adjustments and the actual dates of first sale. |
| 3 | On average, our management fees were in the lowest quintile 71% of the time, based on the 20-year period ended December 31, 2017, versus comparable Lipper categories, excluding funds of funds. |
All Capital Group trademarks referenced are registered trademarks owned by The Capital Group Companies, Inc. or an affiliated company. All other company and product names mentioned are the trademarks or registered trademarks of their respective companies.

ITEM 2 – Code of Ethics
The Registrant has adopted a Code of Ethics that applies to its Principal Executive Officer and Principal Financial Officer. The Registrant undertakes to provide to any person without charge, upon request, a copy of the Code of Ethics. Such request can be made by calling 800/421-4225 or to the Secretary of the Registrant, 6455 Irvine Center Drive, Irvine, California 92618.
ITEM 3 – Audit Committee Financial Expert
The Registrant’s board has determined that James G. Ellis, a member of the Registrant’s audit committee, is an “audit committee financial expert” and "independent," as such terms are defined in this Item. This designation will not increase the designee’s duties, obligations or liability as compared to his or her duties, obligations and liability as a member of the audit committee and of the board, nor will it reduce the responsibility of the other audit committee members. There may be other individuals who, through education or experience, would qualify as "audit committee financial experts" if the board had designated them as such. Most importantly, the board believes each member of the audit committee contributes significantly to the effective oversight of the Registrant’s financial statements and condition.
ITEM 4 – Principal Accountant Fees and Services
| Registrant: | |
| a) Audit Fees: | |
| 2017 | $94,000 | ||
| 2018 | $4,000 | ||
| b) Audit-Related Fees: | |||
| 2017 | $3,000 | ||
| 2018 | $4,000 | ||
| c) Tax Fees: | |||
| 2017 | $11,000 | ||
| 2018 | $11,000 | ||
| The tax fees consist of professional services relating to the preparation of the Registrant’s tax returns. | |||
| d) All Other Fees: | |||
| 2017 | None | ||
| 2018 | None | ||
| Adviser and affiliates (includes only fees for non-audit services billed to the adviser and affiliates for engagements that relate directly to the operations and financial reporting of the Registrant and were subject to the pre-approval policies described below): | |||
| a) Audit Fees: | |||
| Not Applicable | |||
| b) Audit-Related Fees: | |||
| 2017 | $1,194,000 | ||
| 2018 | $1,325,000 | ||
| The audit-related fees consist of assurance and related services relating to the examination of the Registrant’s transfer agent, principal underwriter and investment adviser conducted in accordance with Statement on Standards for Attestation Engagements Number 16 issued by the American Institute of Certified Public Accountants. | |||
| c) Tax Fees: | |||
| 2017 | None | ||
| 2018 | None | ||
| The tax fees consist of consulting services relating to the Registrant’s investments. | |||
| d) All Other Fees: | |||
| 2017 | None | ||
| 2018 | $80,000 | ||
| The other fees consist of subscription services related to an accounting research tool. | |||
| All audit and permissible non-audit services that the Registrant’s audit committee considers compatible with maintaining the independent registered public accounting firm’s independence are required to be pre-approved by the committee. The pre-approval requirement will extend to all non-audit services provided to the Registrant, the investment adviser, and any entity controlling, controlled by, or under common control with the investment adviser that provides ongoing services to the Registrant, if the engagement relates directly to the operations and financial reporting of the Registrant. The committee will not delegate its responsibility to pre-approve these services to the investment adviser. The committee may delegate to one or more committee members the authority to review and pre-approve audit and permissible non-audit services. Actions taken under any such delegation will be reported to the full committee at its next meeting. The pre-approval requirement is waived with respect to non-audit services if certain conditions are met. The pre-approval requirement was not waived for any of the non-audit services listed above provided to the Registrant, adviser and affiliates. | |||
| Aggregate non-audit fees paid to the Registrant’s auditors, including fees for all services billed to the Registrant, adviser and affiliates that provide ongoing services to the Registrant, were $1,396,000 for fiscal year 2017 and $1,420,000 for fiscal year 2018. The non-audit services represented by these amounts were brought to the attention of the committee and considered to be compatible with maintaining the auditors’ independence. | |||
ITEM 5 – Audit Committee of Listed Registrants
Not applicable to this Registrant, insofar as the Registrant is not a listed issuer as defined in Rule 10A-3 under the Securities Exchange Act of 1934.
ITEM 6 – Schedule of Investments

| Common stocks 59.67% Health care 8.81% | Shares | Value (000) |
| Novartis AG | 2,604,950 | $228,229 |
| Abbott Laboratories | 3,182,879 | 219,428 |
| AbbVie Inc. | 2,661,800 | 207,221 |
| Gilead Sciences, Inc. | 2,262,300 | 154,244 |
| Amgen Inc. | 616,246 | 118,806 |
| Daiichi Sankyo Co., Ltd. | 2,862,000 | 109,422 |
| Thermo Fisher Scientific Inc. | 436,000 | 101,871 |
| Stryker Corp. | 560,150 | 90,868 |
| UnitedHealth Group Inc. | 260,000 | 67,951 |
| Johnson & Johnson | 470,000 | 65,795 |
| Teva Pharmaceutical Industries Ltd. (ADR) | 1,478,500 | 29,541 |
| Hologic, Inc.1 | 667,100 | 26,010 |
| GlaxoSmithKline PLC | 1,181,100 | 22,814 |
| Grifols, SA, Class A, non-registered shares | 235,172 | 6,710 |
| Grifols, SA, Class B, nonvoting preferred, non-registered shares | 19,228 | 395 |
| 1,449,305 | ||
| Energy 7.93% | ||
| Royal Dutch Shell PLC, Class B | 7,799,400 | 255,710 |
| Royal Dutch Shell PLC, Class A (GBP denominated) | 2,710,056 | 86,617 |
| TOTAL SA | 3,486,474 | 205,188 |
| BP PLC | 17,491,351 | 126,834 |
| Exxon Mobil Corp. | 1,391,000 | 110,835 |
| Enbridge Inc. (CAD denominated) | 2,354,402 | 73,362 |
| Enbridge Inc. (CAD denominated)2 | 758,336 | 23,630 |
| Canadian Natural Resources, Ltd. (CAD denominated) | 3,428,000 | 94,055 |
| Noble Energy, Inc. | 2,630,000 | 65,355 |
| Halliburton Co. | 1,500,000 | 52,020 |
| Eni SpA | 2,800,000 | 49,810 |
| TransCanada Corp. | 1,121,535 | 42,290 |
| Schlumberger Ltd. | 762,000 | 39,098 |
| ONEOK, Inc. | 583,800 | 38,297 |
| Golar LNG Ltd. | 702,200 | 18,805 |
| Kinder Morgan, Inc. | 774,663 | 13,185 |
| Chesapeake Energy Corp.1 | 2,750,000 | 9,653 |
| 1,304,744 | ||
| Consumer staples 7.20% | ||
| Imperial Brands PLC | 6,347,600 | 215,251 |
| Altria Group, Inc. | 2,849,795 | 185,351 |
| Philip Morris International Inc. | 2,064,218 | 181,796 |
| British American Tobacco PLC | 3,376,000 | 146,436 |
| British American Tobacco PLC (ADR) | 454,516 | 19,726 |
| Pernod Ricard SA | 683,753 | 104,396 |
| Walgreens Boots Alliance, Inc. | 1,245,200 | 99,330 |
| Nestlé SA | 1,158,291 | 97,894 |
| Meiji Holdings Co., Ltd. | 762,500 | 50,682 |
| Common stocks Consumer staples (continued) | Shares | Value (000) |
| Kirin Holdings Co., Ltd. | 1,904,500 | $45,547 |
| Coca-Cola Co. | 700,000 | 33,516 |
| Thai Beverage PCL | 11,785,200 | 5,318 |
| 1,185,243 | ||
| Financials 7.09% | ||
| Zurich Insurance Group AG | 579,125 | 180,094 |
| HDFC Bank Ltd. | 3,701,520 | 95,698 |
| JPMorgan Chase & Co. | 771,800 | 84,142 |
| Prudential PLC | 4,084,495 | 81,993 |
| UBS Group AG | 5,469,627 | 76,520 |
| Insurance Australia Group Ltd. | 13,396,787 | 64,796 |
| BNP Paribas SA | 982,800 | 51,350 |
| Banca Mediolanum SpA | 8,425,275 | 48,907 |
| Royal Bank of Canada | 670,000 | 48,818 |
| Société Générale | 1,315,000 | 48,377 |
| Barclays PLC | 17,436,861 | 38,446 |
| Sampo Oyj, Class A | 815,000 | 37,534 |
| China Construction Bank Corp., Class H | 47,227,000 | 37,459 |
| HSBC Holdings PLC (HKD denominated) | 4,132,324 | 33,936 |
| Itaúsa - Investimentos Itaú SA, preferred nominative | 10,930,617 | 33,013 |
| Bankia, SA | 9,328,000 | 29,361 |
| ABN AMRO Group NV, depository receipts | 1,167,000 | 28,683 |
| AIA Group Ltd. | 3,775,200 | 28,572 |
| Lloyds Banking Group PLC | 38,308,000 | 28,018 |
| CME Group Inc., Class A | 137,000 | 25,104 |
| KB Financial Group Inc. | 575,000 | 23,917 |
| Principal Financial Group, Inc. | 488,500 | 22,994 |
| Bank of China Ltd., Class H | 32,695,000 | 13,925 |
| Intesa Sanpaolo SpA | 1,614,000 | 3,570 |
| Hana Financial Group Inc. | 44,400 | 1,492 |
| DBS Group Holdings Ltd | 46,095 | 781 |
| 1,167,500 | ||
| Communication services 6.27% | ||
| Netflix, Inc.1 | 664,750 | 200,608 |
| Alphabet Inc., Class C1 | 75,506 | 81,303 |
| Alphabet Inc., Class A1 | 71,575 | 78,058 |
| Verizon Communications Inc. | 2,631,000 | 150,204 |
| Tencent Holdings Ltd. | 3,992,800 | 135,946 |
| Nippon Telegraph and Telephone Corp. | 1,797,000 | 75,648 |
| Yandex NV, Class A1 | 2,360,086 | 71,109 |
| SoftBank Group Corp. | 875,000 | 70,164 |
| LG Uplus Corp. | 3,653,158 | 51,774 |
| BCE Inc. (CAD denominated) | 1,205,000 | 46,637 |
| BT Group PLC | 14,445,200 | 44,415 |
| ITV PLC | 13,375,000 | 25,464 |
| 1,031,330 | ||
| Information technology 5.69% | ||
| Microsoft Corp. | 2,389,000 | 255,169 |
| Broadcom Inc. | 803,700 | 179,619 |
| Intel Corp. | 3,229,500 | 151,399 |
| Taiwan Semiconductor Manufacturing Co., Ltd. | 11,975,000 | 90,558 |
| Accenture PLC, Class A | 295,000 | 46,498 |
| Common stocks Information technology (continued) | Shares | Value (000) |
| Tokyo Electron Ltd. | 329,500 | $45,803 |
| QUALCOMM Inc. | 700,000 | 44,023 |
| Western Union Co. | 2,200,000 | 39,688 |
| Samsung Electronics Co., Ltd. | 954,500 | 35,515 |
| ASML Holding NV | 156,200 | 26,701 |
| Xiaomi Corp., Class B1 | 13,519,600 | 20,998 |
| 935,971 | ||
| Industrials 3.51% | ||
| General Dynamics Corp. | 700,300 | 120,858 |
| SMC Corp. | 329,900 | 105,693 |
| Boeing Co. | 200,000 | 70,972 |
| Komatsu Ltd. | 2,375,800 | 61,998 |
| Union Pacific Corp. | 276,000 | 40,357 |
| Aena SME, SA, non-registered shares | 240,483 | 38,447 |
| Adani Ports & Special Economic Zone Ltd. | 7,610,000 | 32,814 |
| Eiffage SA | 308,000 | 30,148 |
| ASSA ABLOY AB, Class B | 1,108,000 | 22,097 |
| Airbus SE, non-registered shares | 148,000 | 16,379 |
| Alliance Global Group, Inc.1 | 68,303,500 | 14,502 |
| United Technologies Corp. | 104,300 | 12,955 |
| BAE Systems PLC | 1,410,800 | 9,482 |
| General Electric Co. | 186,000 | 1,878 |
| 578,580 | ||
| Utilities 3.48% | ||
| Engie SA | 8,273,677 | 110,346 |
| Engie SA, bonus shares3 | 2,245,759 | 29,951 |
| China Gas Holdings Ltd. | 35,160,946 | 111,196 |
| Iberdrola, SA, non-registered shares | 9,991,955 | 70,802 |
| National Grid PLC | 5,245,340 | 55,594 |
| SUEZ | 3,178,000 | 46,020 |
| China Resources Gas Group Ltd. | 10,932,000 | 41,821 |
| SSE PLC | 2,426,046 | 35,398 |
| ENN Energy Holdings Ltd. | 3,381,000 | 28,736 |
| Red Eléctrica de Corporación, SA | 1,181,800 | 24,496 |
| Exelon Corp. | 425,000 | 18,619 |
| 572,979 | ||
| Consumer discretionary 3.20% | ||
| Alibaba Group Holding Ltd. (ADR)1 | 904,500 | 128,692 |
| Hyundai Motor Co. | 828,975 | 77,474 |
| Amazon.com, Inc.1 | 36,325 | 58,048 |
| LVMH Moët Hennessy-Louis Vuitton SE | 178,000 | 54,193 |
| Midea Group Co., Ltd., Class A | 9,835,000 | 52,234 |
| Galaxy Entertainment Group Ltd. | 9,648,000 | 52,165 |
| Samsonite International SA | 12,990,000 | 37,271 |
| Kering SA | 77,333 | 34,476 |
| Ctrip.com International, Ltd. (ADR)1 | 345,000 | 11,482 |
| Hyundai Mobis Co., Ltd. | 66,425 | 11,075 |
| Compass Group PLC | 399,000 | 7,854 |
| NIKE, Inc., Class B | 16,000 | 1,201 |
| 526,165 |
| Common stocks Materials 2.31% | Shares | Value (000) |
| Rio Tinto PLC | 3,533,200 | $171,771 |
| Vale SA, ordinary nominative (ADR) | 7,610,697 | 114,922 |
| Taiyo Nippon Sanso Corp. | 2,841,100 | 45,751 |
| Asahi Kasei Corp. | 3,483,000 | 41,888 |
| Akzo Nobel NV | 63,900 | 5,376 |
| 379,708 | ||
| Real estate 0.86% | ||
| Sun Hung Kai Properties Ltd. | 3,800,000 | 49,378 |
| Link Real Estate Investment Trust REIT | 4,181,600 | 37,060 |
| American Campus Communities, Inc. REIT | 762,000 | 30,107 |
| Crown Castle International Corp. REIT | 188,000 | 20,443 |
| CK Asset Holdings Ltd. | 826,500 | 5,364 |
| 142,352 | ||
| Miscellaneous 3.32% | ||
| Other common stocks in initial period of acquisition | 546,187 | |
| Total common stocks (cost: $9,145,712,000) | 9,820,064 | |
| Preferred securities 0.05% Financials 0.05% | ||
| Fannie Mae, Series S, 8.25% noncumulative1 | 528,625 | 3,161 |
| Fannie Mae, Series T, 8.25% noncumulative1 | 167,000 | 994 |
| Fannie Mae, Series R, 7.625% noncumulative1 | 104,000 | 524 |
| Federal Home Loan Mortgage Corp., Series Z, 8.375% noncumulative1 | 570,650 | 3,412 |
| Total preferred securities (cost: $6,859,000) | 8,091 | |
| Bonds, notes & other debt instruments 36.37% Bonds & notes of governments & government agencies outside the U.S. 14.05% | Principal amount (000) | |
| Abu Dhabi (Emirate of) 2.50% 20222 | $11,100 | 10,660 |
| Abu Dhabi (Emirate of) 3.125% 20272 | 7,100 | 6,608 |
| Australia (Commonwealth of), Series 128, 5.75% 2022 | A$28,350 | 22,689 |
| Australia (Commonwealth of), Series 133, 5.50% 2023 | 20,000 | 16,162 |
| Bank of Thailand 1.49% 2019 | THB70,500 | 2,121 |
| Bank of Thailand 1.50% 2019 | 374,500 | 11,290 |
| Belgium (Kingdom of), Series 77, 1.00% 2026 | €13,190 | 15,506 |
| Belgium (Kingdom of), Series 71, 3.75% 2045 | 2,100 | 3,460 |
| Brazil (Federative Republic of) 0% 2021 | BRL165,000 | 35,767 |
| Brazil (Federative Republic of) 10.00% 2025 | 60,319 | 16,445 |
| Canada 1.00% 2022 | C$13,000 | 9,371 |
| Canada 2.25% 2025 | 43,800 | 32,846 |
| Chile (Banco Central de) 4.00% 2023 | CLP13,375,000 | 18,998 |
| Chile (Banco Central de) 4.50% 2026 | 7,170,000 | 10,309 |
| Chile (Republic of) 3.86% 2047 | $2,100 | 1,899 |
| Colombia (Republic of) 3.875% 2027 | 480 | 458 |
| Colombia (Republic of) 4.50% 2029 | 1,135 | 1,121 |
| Colombia (Republic of), Series B, 6.25% 2025 | COP33,620,000 | 10,157 |
| Czech Republic 0.45% 2023 | CZK188,000 | 7,682 |
| Egypt (Arab Republic of) 5.75% 2020 | $3,600 | 3,633 |
| European Financial Stability Facility 0.40% 2025 | €13,200 | 14,944 |
| European Investment Bank 2.25% 2022 | $19,076 | 18,542 |
| Bonds, notes & other debt instruments Bonds & notes of governments & government agencies outside the U.S. (continued) | Principal amount (000) | Value (000) |
| French Republic O.A.T. 1.00% 2025 | €12,530 | $14,859 |
| French Republic O.A.T. 0.75% 2028 | 13,000 | 14,724 |
| French Republic O.A.T. 3.25% 2045 | 6,700 | 10,458 |
| French Republic O.A.T. 2.00% 2048 | 4,000 | 4,933 |
| Germany (Federal Republic of) 1.75% 2024 | 12,690 | 15,833 |
| Germany (Federal Republic of) 0.50% 2027 | 26,900 | 31,093 |
| Germany (Federal Republic of) 0.50% 2028 | 41,610 | 47,885 |
| Germany (Federal Republic of) 2.50% 2046 | 10,220 | 15,835 |
| Germany (Federal Republic of) 1.25% 2048 | 21,750 | 26,089 |
| Greece (Hellenic Republic of) 3.50% 2023 | 3,100 | 3,542 |
| Greece (Hellenic Republic of) 3.375% 2025 | 5,300 | 5,829 |
| Greece (Hellenic Republic of) 3.75% 2028 | 1,300 | 1,421 |
| Greece (Hellenic Republic of) 3.90% 2033 | 7,100 | 7,315 |
| Greece (Hellenic Republic of) 4.00% 2037 | 7,400 | 7,301 |
| Greece (Hellenic Republic of) 4.20% 2042 | 7,400 | 7,291 |
| Honduras (Republic of) 8.75% 2020 | $4,935 | 5,332 |
| India (Republic of) 7.28% 2019 | INR285,100 | 3,856 |
| India (Republic of) 7.80% 2021 | 1,101,800 | 14,957 |
| India (Republic of) 7.68% 2023 | 467,000 | 6,288 |
| India (Republic of) 7.35% 2024 | 100,000 | 1,323 |
| India (Republic of) 6.97% 2026 | 3,189,000 | 40,986 |
| India (Republic of) 7.59% 2026 | 492,100 | 6,547 |
| India (Republic of) 6.79% 2027 | 347,000 | 4,371 |
| India (Republic of) 7.59% 2029 | 280,000 | 3,676 |
| Indonesia (Republic of) 4.875% 2021 | $9,100 | 9,309 |
| Indonesia (Republic of) 4.875% 20212 | 1,500 | 1,534 |
| Indonesia (Republic of) 3.75% 2022 | 4,895 | 4,811 |
| Indonesia (Republic of) 3.375% 2023 | 640 | 613 |
| Indonesia (Republic of) 4.75% 2026 | 4,800 | 4,754 |
| Ireland (Republic of) 3.90% 2023 | €11,430 | 15,155 |
| Ireland (Republic of) 0.90% 2028 | 21,880 | 24,664 |
| Israel (State of) 2.00% 2027 | ILS41,410 | 11,031 |
| Israel (State of) 5.50% 2042 | 61,800 | 22,998 |
| Italy (Republic of) 1.35% 2022 | €13,200 | 14,541 |
| Italy (Republic of) 1.45% 2022 | 10,700 | 11,747 |
| Italy (Republic of) 0.95% 2023 | 27,400 | 29,142 |
| Italy (Republic of) 0.95% 2023 | 5,500 | 5,852 |
| Italy (Republic of) 4.50% 2024 | 5,100 | 6,252 |
| Italy (Republic of) 1.45% 2025 | 8,060 | 8,312 |
| Italy (Republic of) 2.05% 2027 | 7,330 | 7,568 |
| Japan, Series 128, 0.10% 2021 | ¥1,566,600 | 13,968 |
| Japan, Series 315, 1.20% 2021 | 3,045,000 | 27,931 |
| Japan, Series 134, 0.10% 2022 | 4,005,000 | 35,797 |
| Japan, Series 17, 0.10% 20234 | 245,340 | 2,245 |
| Japan, Series 19, 0.10% 20244 | 1,473,140 | 13,532 |
| Japan, Series 18, 0.10% 20244 | 705,160 | 6,459 |
| Japan, Series 337, 0.30% 2024 | 3,719,800 | 33,668 |
| Japan, Series 20, 0.10% 20254 | 662,205 | 6,084 |
| Japan, Series 340, 0.40% 2025 | 2,790,000 | 25,449 |
| Japan, Series 344, 0.10% 2026 | 2,310,000 | 20,600 |
| Japan, Series 21, 0.10% 20264 | 1,313,403 | 12,106 |
| Japan, Series 346, 0.10% 2027 | 12,820,000 | 114,169 |
| Japan, Series 145, 1.70% 2033 | 4,540,000 | 47,850 |
| Japan, Series 150, 1.40% 2034 | 660,000 | 6,708 |
| Japan, Series 21, 2.30% 2035 | 1,360,000 | 15,572 |
| Bonds, notes & other debt instruments Bonds & notes of governments & government agencies outside the U.S. (continued) | Principal amount (000) | Value (000) |
| Japan, Series 161, 0.60% 2037 | ¥800,000 | $7,105 |
| Japan, Series 36, 2.00% 2042 | 200,000 | 2,246 |
| Japan, Series 42, 1.70% 2044 | 437,000 | 4,677 |
| Japan, Series 53, 0.60% 2046 | 1,311,500 | 10,919 |
| Japan, Series 57, 0.80% 2047 | 2,896,350 | 25,298 |
| Japan, Series 59, 0.70% 2048 | 2,630,000 | 22,307 |
| Kenya (Republic of) 5.875% 2019 | $1,400 | 1,411 |
| KfW 2.125% 2022 | 9,743 | 9,444 |
| Kuwait (State of) 2.75% 20222 | 7,300 | 7,108 |
| Lithuania (Republic of) 7.375% 2020 | 2,900 | 3,053 |
| Lithuania (Republic of) 6.625% 20222 | 1,000 | 1,093 |
| Maharashtra (State of) 8.12% 2025 | INR269,020 | 3,578 |
| Malaysia (Federation of), Series 0314, 4.048% 2021 | MYR13,400 | 3,237 |
| Malaysia (Federation of), Series 0111, 4.16% 2021 | 60,700 | 14,694 |
| Malaysia (Federation of), Series 0215, 3.795% 2022 | 16,000 | 3,824 |
| Malaysia (Federation of), Series 0115, 3.955% 2025 | 98,300 | 23,316 |
| Malaysia (Federation of), Series 0316, 3.90% 2026 | 40,200 | 9,466 |
| Malaysia (Federation of), Series 0311, 4.392% 2026 | 27,400 | 6,632 |
| Malaysia (Federation of), Series 0310, 4.498% 2030 | 49,650 | 11,873 |
| Malaysia (Federation of), Series 0411, 4.232% 2031 | 13,300 | 3,097 |
| Morocco (Kingdom of) 4.25% 2022 | $5,700 | 5,684 |
| Morocco (Kingdom of) 4.25% 20222 | 500 | 499 |
| Morocco (Kingdom of) 5.50% 2042 | 3,500 | 3,570 |
| National Highways Authority of India 7.17% 2021 | INR480,000 | 6,248 |
| National Highways Authority of India 7.27% 2022 | 100,000 | 1,291 |
| Norway (Kingdom of) 3.75% 2021 | NKr37,000 | 4,665 |
| Pakistan (Islamic Republic of) 6.75% 2019 | $3,700 | 3,720 |
| Panama (Republic of) 4.50% 20475 | 9,000 | 8,451 |
| Peru (Republic of) 6.15% 2032 | PEN69,700 | 20,648 |
| Peru (Republic of) 5.625% 2050 | $375 | 420 |
| Poland (Republic of) 4.00% 2024 | 1,805 | 1,826 |
| Poland (Republic of) 3.25% 2026 | 8,605 | 8,259 |
| Poland (Republic of), Series 0420, 1.50% 2020 | PLN6,000 | 1,565 |
| Poland (Republic of), Series 1020, 5.25% 2020 | 118,050 | 32,989 |
| Poland (Republic of), Series 0421, 2.00% 2021 | 24,900 | 6,537 |
| Poland (Republic of), Series 1021, 5.75% 2021 | 271,550 | 78,790 |
| Poland (Republic of), Series 1023, 4.00% 2023 | 89,600 | 25,026 |
| Poland (Republic of), Series 0725, 3.25% 2025 | 109,100 | 29,071 |
| Poland (Republic of), Series 0727, 2.50% 2027 | 29,951 | 7,436 |
| Portuguese Republic 2.875% 2025 | €16,750 | 20,913 |
| Qatar (State of) 5.25% 2020 | $1,300 | 1,331 |
| Qatar (State of) 4.50% 20222 | 1,000 | 1,026 |
| Qatar (State of) 3.875% 20232 | 690 | 693 |
| Qatar (State of) 4.50% 20282 | 20,940 | 21,411 |
| Qatar (State of) 5.103% 20482 | 1,345 | 1,369 |
| Quebec (Province of) 2.375% 2022 | 4,142 | 4,034 |
| Romania 2.30% 2020 | RON23,250 | 5,462 |
| Romania 3.25% 2021 | 24,000 | 5,705 |
| Romania 4.00% 2021 | 24,960 | 5,989 |
| Romania 3.40% 2022 | 19,000 | 4,440 |
| Romania 2.875% 2029 | €8,450 | 9,440 |
| Romania 3.875% 2035 | 4,210 | 4,743 |
| Romania 3.375% 2038 | 7,295 | 7,563 |
| Romania 5.125% 20482 | $11,900 | 11,052 |
| Russian Federation 7.00% 2023 | RUB1,015,870 | 14,720 |
| Bonds, notes & other debt instruments Bonds & notes of governments & government agencies outside the U.S. (continued) | Principal amount (000) | Value (000) |
| Russian Federation 7.00% 2023 | RUB190,900 | $2,790 |
| Saskatchewan (Province of) 3.05% 2028 | C$8,000 | 6,020 |
| Saudi Arabia (Kingdom of) 2.375% 20212 | $1,650 | 1,579 |
| Saudi Arabia (Kingdom of) 2.894% 20222 | 3,800 | 3,674 |
| Saudi Arabia (Kingdom of) 3.628% 20272 | 3,800 | 3,638 |
| Saudi Arabia (Kingdom of) 3.625% 20282 | 8,235 | 7,747 |
| Saudi Arabia (Kingdom of) 4.50% 20302 | 7,505 | 7,412 |
| Saudi Arabia (Kingdom of) 5.00% 2049 | 3,000 | 2,887 |
| South Africa (Republic of) 5.50% 2020 | 3,700 | 3,744 |
| South Africa (Republic of) 8.75% 2044 | ZAR249,750 | 14,626 |
| South Africa (Republic of), Series R-2023, 7.75% 2023 | 59,300 | 3,891 |
| South Africa (Republic of), Series R-214, 6.50% 2041 | 363,250 | 16,588 |
| South Korea (Republic of), Series 2203, 1.875% 2022 | KRW7,870,000 | 6,882 |
| South Korea (Republic of), Series 2209, 2.00% 2022 | 44,300,000 | 38,846 |
| South Korea (Republic of), Series 2303, 2.375% 2023 | 3,200,000 | 2,848 |
| South Korea (Republic of), Series 2712, 2.375% 2027 | 24,800,000 | 21,994 |
| Spain (Kingdom of) 1.45% 2027 | €37,805 | 42,929 |
| Spain (Kingdom of) 1.50% 2027 | 20,000 | 22,904 |
| Spain (Kingdom of) 2.90% 2046 | 4,150 | 4,988 |
| Spain (Kingdom of) 2.70% 2048 | 16,800 | 19,184 |
| Sri Lanka (Republic of) 6.25% 2020 | $3,700 | 3,584 |
| Sweden (Kingdom of) 1.125% 20192 | 6,800 | 6,691 |
| Thailand (Kingdom of) 1.875% 2022 | THB684,900 | 20,375 |
| Thailand (Kingdom of) 3.85% 2025 | 283,400 | 9,226 |
| Thailand (Kingdom of) 2.125% 2026 | 849,050 | 24,477 |
| Turkey (Republic of) 7.00% 2020 | $3,600 | 3,630 |
| Turkey (Republic of) 7.10% 2023 | TRY104,600 | 12,210 |
| Turkey (Republic of) 7.25% 2023 | $3,605 | 3,584 |
| United Kingdom 4.75% 2020 | £25 | 34 |
| United Kingdom 1.75% 2022 | 11,200 | 14,770 |
| United Kingdom 2.75% 2024 | 5,310 | 7,424 |
| United Kingdom 1.25% 2027 | 11,750 | 14,910 |
| United Kingdom 4.25% 2027 | 11,340 | 18,155 |
| United Kingdom 3.25% 2044 | 12,800 | 20,837 |
| United Kingdom 3.50% 2045 | 4,400 | 7,497 |
| United Kingdom 1.50% 2047 | 6,960 | 8,181 |
| United Mexican States 4.15% 2027 | $3,820 | 3,642 |
| United Mexican States 4.35% 2047 | 4,250 | 3,565 |
| United Mexican States, Series M, 8.00% 2020 | MXN146,000 | 7,127 |
| United Mexican States, Series M, 6.50% 2021 | 1,123,500 | 52,625 |
| United Mexican States, Series M, 6.50% 2022 | 890,800 | 40,985 |
| United Mexican States, Series M20, 10.00% 2024 | 362,200 | 18,910 |
| United Mexican States, Series M, 5.75% 2026 | 2,038,400 | 84,027 |
| United Mexican States, Series M30, 10.00% 2036 | 96,000 | 5,163 |
| United Mexican States, Series M, 7.75% 2042 | 100,700 | 4,318 |
| Uruguay (Oriental Republic of) 9.875% 2022 | UYU47,470 | 1,430 |
| Uruguay (Oriental Republic of) 8.50% 2028 | 229,512 | 6,131 |
| 2,312,476 | ||
| U.S. Treasury bonds & notes 13.50% U.S. Treasury 11.62% | ||
| U.S. Treasury 1.625% 2019 | $4,000 | 3,971 |
| U.S. Treasury 1.625% 2019 | 150 | 149 |
| U.S. Treasury 1.75% 2019 | 16,900 | 16,759 |
| U.S. Treasury 1.125% 2020 | 5,200 | 5,079 |
| Bonds, notes & other debt instruments U.S. Treasury bonds & notes (continued) U.S. Treasury (continued) | Principal amount (000) | Value (000) |
| U.S. Treasury 2.00% 2021 | $77,625 | $76,154 |
| U.S. Treasury 2.00% 2021 | 13,150 | 12,822 |
| U.S. Treasury 2.125% 2021 | 49,555 | 48,446 |
| U.S. Treasury 2.125% 2021 | 12,700 | 12,445 |
| U.S. Treasury 2.625% 2021 | 62,900 | 62,458 |
| U.S. Treasury 1.75% 2022 | 176,135 | 168,801 |
| U.S. Treasury 1.875% 2022 | 170,147 | 163,341 |
| U.S. Treasury 2.25% 2023 | 60,880 | 58,713 |
| U.S. Treasury 2.375% 2023 | 46,350 | 45,245 |
| U.S. Treasury 2.50% 2023 | 142,006 | 139,222 |
| U.S. Treasury 2.625% 2023 | 106,970 | 105,470 |
| U.S. Treasury 2.625% 2023 | 20,120 | 19,810 |
| U.S. Treasury 2.75% 2023 | 289,925 | 287,197 |
| U.S. Treasury 2.75% 2023 | 12,934 | 12,811 |
| U.S. Treasury 2.00% 2024 | 35,000 | 33,209 |
| U.S. Treasury 2.125% 2024 | 37,600 | 35,749 |
| U.S. Treasury 2.25% 2024 | 9,100 | 8,703 |
| U.S. Treasury 2.50% 2024 | 18,750 | 18,255 |
| U.S. Treasury 2.125% 2025 | 20,240 | 19,113 |
| U.S. Treasury 2.75% 2025 | 62,610 | 61,412 |
| U.S. Treasury 2.00% 2026 | 15,700 | 14,456 |
| U.S. Treasury 2.25% 2027 | 47,200 | 43,917 |
| U.S. Treasury 2.25% 2027 | 28,960 | 27,114 |
| U.S. Treasury 2.375% 2027 | 48,600 | 45,874 |
| U.S. Treasury 2.75% 2028 | 160,950 | 155,756 |
| U.S. Treasury 2.875% 2028 | 93,250 | 91,108 |
| U.S. Treasury 2.875% 2028 | 27,500 | 26,886 |
| U.S. Treasury 2.75% 20476 | 34,250 | 30,174 |
| U.S. Treasury 3.00% 20486 | 43,300 | 40,134 |
| U.S. Treasury 3.00% 2048 | 22,725 | 21,056 |
| 1,911,809 | ||
| U.S. Treasury inflation-protected securities 1.88% | ||
| U.S. Treasury Inflation-Protected Security 0.125% 20224 | 3,673 | 3,564 |
| U.S. Treasury Inflation-Protected Security 0.125% 20244 | 111,445 | 106,206 |
| U.S. Treasury Inflation-Protected Security 0.625% 20244 | 38,924 | 38,114 |
| U.S. Treasury Inflation-Protected Security 0.25% 20254 | 44,125 | 41,953 |
| U.S. Treasury Inflation-Protected Security 2.375% 20254 | 2,742 | 2,956 |
| U.S. Treasury Inflation-Protected Security 0.625% 20264 | 22,709 | 21,961 |
| U.S. Treasury Inflation-Protected Security 0.375% 20274 | 59,915 | 56,426 |
| U.S. Treasury Inflation-Protected Security 0.375% 20274 | 25,944 | 24,429 |
| U.S. Treasury Inflation-Protected Security 0.50% 20284 | 2,453 | 2,319 |
| U.S. Treasury Inflation-Protected Security 1.375% 20444 | 11,576 | 11,736 |
| 309,664 | ||
| Total U.S. Treasury bonds & notes | 2,221,473 | |
| Corporate bonds & notes 7.11% Financials 1.65% | ||
| ACE INA Holdings Inc. 2.875% 2022 | 645 | 630 |
| ACE INA Holdings Inc. 3.35% 2026 | 645 | 621 |
| ACE INA Holdings Inc. 4.35% 2045 | 665 | 658 |
| Allianz SE, 4.75% (undated) (3-month EUR-EURIBOR + 3.60% on 10/24/2023)7 | €9,000 | 11,388 |
| Aviva PLC, subordinated 6.125% 2043 (5 year EURO Mid Swap + 5.13% on 7/5/2023)7 | 2,500 | 3,264 |
| Bonds, notes & other debt instruments Corporate bonds & notes (continued) Financials (continued) | Principal amount (000) | Value (000) |
| AXA SA, junior subordinated 5.453% (undated)7 | £5,625 | $7,444 |
| Banco Bilbao Vizcaya Argentaria SA 3.50% 2024 (5 year EURO Mid Swap + 2.55% on 4/11/2019)7 | €5,800 | 6,641 |
| Banco de Crédito del Perú 5.375% 20202 | $125 | 129 |
| Banco del Estado de Chile 2.668% 20212 | 2,250 | 2,194 |
| Banco Nacional de Comercio Exterior SNC 3.80% 2026 (UST Yield Curve Rate T Note Constant Maturity 5 year + 3.00% on 8/11/2021)2,7 | 1,550 | 1,493 |
| Bank of America Corp. 3.55% 2024 (3-month USD-LIBOR + 0.78% on 3/5/2023)7 | 2,100 | 2,062 |
| Bank of America Corp. 3.50% 2026 | 2,000 | 1,905 |
| Bank of America Corp. 3.419% 2028 (3-month USD-LIBOR + 1.04% on 12/20/2027)7 | 3,402 | 3,141 |
| Barclays Bank PLC 6.00% 2021 | €1,400 | 1,752 |
| Barclays Bank PLC 10.00% 2021 | £3,700 | 5,573 |
| Barclays Bank PLC 6.625% 2022 | €725 | 950 |
| Berkshire Hathaway Inc. 3.00% 2022 | $1,775 | 1,756 |
| CaixaBank, SA 5.00% 2023 (5 year EURO Mid Swap + 3.95% on 11/14/2018)7 | €2,800 | 3,176 |
| Citigroup Inc. 3.20% 2026 | $6,329 | 5,806 |
| Crédit Agricole SA 4.375% 20252 | 3,350 | 3,238 |
| Credit Suisse Group AG 3.00% 2021 | 3,450 | 3,398 |
| Goldman Sachs Group, Inc. 2.55% 2019 | 670 | 666 |
| Goldman Sachs Group, Inc. 2.875% 2021 | 4,000 | 3,943 |
| Goldman Sachs Group, Inc. 5.25% 2021 | 900 | 936 |
| Goldman Sachs Group, Inc. 2.905% 2023 (3-month USD-LIBOR + 0.99% on 7/24/2022)7 | 6,000 | 5,776 |
| Goldman Sachs Group, Inc. 3.20% 2023 | 3,150 | 3,062 |
| Goldman Sachs Group, Inc. 3.50% 2025 | 10,205 | 9,778 |
| Goldman Sachs Group, Inc. 3.75% 2026 | 1,000 | 961 |
| Goldman Sachs Group, Inc. 4.75% 2045 | 2,835 | 2,765 |
| Groupe BPCE SA 5.70% 20232 | 7,625 | 7,907 |
| Groupe BPCE SA 2.75% 2026 (5 year EURO Mid Swap + 1.83% on 7/8/2021)7 | €5,400 | 6,390 |
| HSBC Holdings PLC 4.125% 20202 | $560 | 568 |
| HSBC Holdings PLC 2.95% 2021 | 570 | 561 |
| HSBC Holdings PLC 4.00% 2022 | 1,400 | 1,413 |
| HSBC Holdings PLC 3.033% 2023 (3-month USD-LIBOR + 0.923% on 11/12/2022)7 | 4,670 | 4,493 |
| HSBC Holdings PLC 3.375% 2024 (5 year EURO Mid Swap + 1.95% on 1/10/2019)7 | €3,450 | 3,932 |
| HSBC Holdings PLC 3.90% 2026 | $3,365 | 3,237 |
| HSBC Holdings PLC 4.292% 2026 (3-month USD-LIBOR + 1.348% on 9/12/2025)7 | 6,025 | 5,949 |
| Intesa Sanpaolo SpA 6.625% 2023 | €6,500 | 8,219 |
| Intesa Sanpaolo SpA 5.017% 20242 | $42,625 | 37,626 |
| JPMorgan Chase & Co. 2.55% 2021 | 11,921 | 11,687 |
| JPMorgan Chase & Co. 3.25% 2022 | 1,850 | 1,826 |
| JPMorgan Chase & Co. 2.70% 2023 | 4,225 | 4,041 |
| Lloyds Banking Group PLC 6.50% 2020 | €4,940 | 6,074 |
| Lloyds Banking Group PLC 7.625 % 2025 | £1,225 | 1,972 |
| Morgan Stanley 3.125% 2026 | $3,175 | 2,916 |
| Morgan Stanley 3.875% 2026 | 2,705 | 2,623 |
| NN Group NV 4.625% 2044 (3-month EUR-LIBOR + 3.95% on 4/8/2024)7 | €2,000 | 2,439 |
| NN Group NV 4.50% (undated) (3-month EUR-LIBOR + 4.00% on 1/15/2026)7 | 3,000 | 3,503 |
| PNC Financial Services Group, Inc. 2.854% 20227 | $2,000 | 1,936 |
| Rabobank Nederland 3.875% 2023 | €2,400 | 3,065 |
| Rabobank Nederland 4.625% 2023 | $3,750 | 3,786 |
| Rabobank Nederland 2.50% 2026 (5 year EURO Mid Swap + 1.40% on 5/26/2021)7 | €5,450 | 6,434 |
| Skandinaviska Enskilda Banken AB 2.80% 2022 | $12,500 | 12,147 |
| Turkiye Garanti Bankasi AS 5.875% 2023 | 5,438 | 5,071 |
| Turkiye Garanti Bankasi AS 6.125% 20277 | 13,200 | 11,014 |
| UniCredit SpA 3.75% 20222 | 5,000 | 4,728 |
| Bonds, notes & other debt instruments Corporate bonds & notes (continued) Financials (continued) | Principal amount (000) | Value (000) |
| UniCredit SpA 4.625% 20272 | $7,250 | $6,445 |
| Wells Fargo & Co. 3.584% 2028 (3-month USD-LIBOR + 1.31% on 5/15/2027)7 | 5,210 | 4,963 |
| 272,071 | ||
| Health care 1.18% | ||
| Abbott Laboratories 3.75% 2026 | 2,266 | 2,235 |
| AbbVie Inc. 2.50% 2020 | 7,400 | 7,306 |
| AbbVie Inc. 3.20% 2026 | 4,852 | 4,448 |
| AbbVie Inc. 4.50% 2035 | 535 | 492 |
| Aetna Inc. 2.80% 2023 | 395 | 377 |
| Allergan PLC 3.00% 2020 | 1,870 | 1,862 |
| Allergan PLC 3.80% 2025 | 17,003 | 16,408 |
| Allergan PLC 4.75% 2045 | 214 | 201 |
| Amgen Inc. 1.85% 2021 | 770 | 737 |
| AstraZeneca PLC 3.50% 2023 | 4,500 | 4,433 |
| Baxalta Inc. 4.00% 2025 | 777 | 758 |
| Bayer US Finance II LLC 3.875% 20232 | 2,582 | 2,546 |
| Bayer US Finance II LLC 4.375% 20282 | 419 | 407 |
| Becton, Dickinson and Co. 2.675% 2019 | 4,356 | 4,328 |
| Becton, Dickinson and Co. 2.894% 2022 | 2,545 | 2,460 |
| Becton, Dickinson and Co. 3.734% 2024 | 1,178 | 1,143 |
| Becton, Dickinson and Co. 3.70% 2027 | 2,895 | 2,724 |
| Cigna Corp. 3.40% 20212 | 1,480 | 1,470 |
| Cigna Corp. 4.125% 20252 | 3,250 | 3,218 |
| Cigna Corp. 4.375% 20282 | 3,570 | 3,493 |
| CVS Health Corp. 3.125% 2020 | 1,600 | 1,596 |
| CVS Health Corp. 3.35% 2021 | 845 | 842 |
| CVS Health Corp. 3.70% 2023 | 1,155 | 1,142 |
| CVS Health Corp. 4.10% 2025 | 1,090 | 1,079 |
| CVS Health Corp. 4.30% 2028 | 4,450 | 4,349 |
| CVS Health Corp. 4.78% 2038 | 2,275 | 2,186 |
| CVS Health Corp. 5.05% 2048 | 6,840 | 6,693 |
| EMD Finance LLC 2.40% 20202 | 5,000 | 4,930 |
| EMD Finance LLC 3.25% 20252 | 8,648 | 8,203 |
| Medtronic, Inc. 3.50% 2025 | 8,000 | 7,839 |
| Roche Holdings, Inc. 3.35% 20242 | 17,400 | 17,178 |
| Shire PLC 2.40% 2021 | 5,857 | 5,633 |
| Shire PLC 2.875% 2023 | 2,486 | 2,344 |
| Shire PLC 3.20% 2026 | 905 | 822 |
| Teva Pharmaceutical Finance Co. BV 3.15% 2026 | 69,622 | 56,816 |
| Teva Pharmaceutical Finance Co. BV 4.10% 2046 | 7,700 | 5,292 |
| Valeant Pharmaceuticals International, Inc. 6.125% 20252 | 7,454 | 6,874 |
| 194,864 | ||
| Consumer staples 0.88% | ||
| Altria Group, Inc. 2.625% 2020 | 1,700 | 1,689 |
| Altria Group, Inc. 4.75% 2021 | 1,500 | 1,543 |
| Anheuser-Busch InBev NV 3.30% 2023 | 1,315 | 1,283 |
| Anheuser-Busch InBev NV 3.50% 2024 | 2,540 | 2,475 |
| Anheuser-Busch InBev NV 4.00% 2028 | 2,800 | 2,691 |
| British American Tobacco PLC 2.297% 20202 | 33,000 | 32,306 |
| British American Tobacco PLC 2.764% 20222 | 15,270 | 14,630 |
| British American Tobacco PLC 3.557% 20272 | 4,460 | 4,097 |
| British American Tobacco PLC 4.39% 20372 | 1,940 | 1,737 |
| Bonds, notes & other debt instruments Corporate bonds & notes (continued) Consumer staples (continued) | Principal amount (000) | Value (000) |
| Conagra Brands, Inc. 4.30% 2024 | $4,674 | $4,687 |
| General Mills, Inc. 3.20% 2021 | 815 | 810 |
| JBS ESAL LLC 6.25% 2023 | 5,835 | 5,755 |
| JBS SA 7.25% 2024 | 6,155 | 6,236 |
| Keurig Dr. Pepper Inc. 4.597% 20282 | 4,975 | 4,913 |
| Keurig Dr. Pepper Inc. 5.085% 20482 | 2,625 | 2,523 |
| Philip Morris International Inc. 2.00% 2020 | 2,330 | 2,296 |
| Philip Morris International Inc. 2.625% 2022 | 2,680 | 2,610 |
| Philip Morris International Inc. 4.25% 2044 | 2,700 | 2,436 |
| Reynolds American Inc. 4.00% 2022 | 670 | 672 |
| Reynolds American Inc. 4.45% 2025 | 4,190 | 4,175 |
| Wal-Mart Stores, Inc. 3.40% 2023 | 46,000 | 45,881 |
| 145,445 | ||
| Utilities 0.87% | ||
| Abu Dhabi National Energy Co. PJSC (TAQA) 3.625% 20232 | 4,800 | 4,694 |
| Berkshire Hathaway Energy Co. 3.50% 2025 | 4,200 | 4,124 |
| CMS Energy Corp. 3.60% 2025 | 4,850 | 4,696 |
| Colbun SA 3.95% 20272 | 6,330 | 5,832 |
| DTE Energy Co. 3.30% 2022 | 17,460 | 17,201 |
| DTE Energy Co. 3.70% 2023 | 13,990 | 13,905 |
| Dubai Electricity & Water Authority 7.375% 2020 | 750 | 803 |
| Duke Energy Carolinas, Inc. 3.05% 2023 | 8,535 | 8,384 |
| Duke Energy Corp. 3.75% 2024 | 3,950 | 3,919 |
| Duke Energy Corp. 2.65% 2026 | 4,700 | 4,213 |
| Duke Energy Progress, LLC 3.70% 2028 | 2,400 | 2,362 |
| Enel Finance International SA 2.75% 20232 | 10,800 | 9,957 |
| Enel Finance International SA 3.625% 20272 | 6,375 | 5,546 |
| Enel Finance International SA 3.50% 20282 | 3,800 | 3,200 |
| Enersis Américas SA 4.00% 2026 | 4,690 | 4,401 |
| Exelon Corp. 3.497% 20227 | 1,350 | 1,318 |
| Exelon Corp. 3.40% 2026 | 4,390 | 4,136 |
| FirstEnergy Corp. 3.90% 2027 | 5,935 | 5,679 |
| FirstEnergy Corp. 3.50% 20282 | 1,390 | 1,302 |
| FirstEnergy Corp. 4.85% 2047 | 1,085 | 1,062 |
| Niagara Mohawk Power Corp. 3.508% 20242 | 2,380 | 2,350 |
| Pacific Gas and Electric Co. 3.85% 2023 | 1,710 | 1,671 |
| Pacific Gas and Electric Co. 2.95% 2026 | 1,035 | 920 |
| Pacific Gas and Electric Co. 3.30% 2027 | 7,250 | 6,526 |
| Pacific Gas and Electric Co. 3.30% 2027 | 2,375 | 2,119 |
| Pacific Gas and Electric Co. 4.65% 20282 | 1,049 | 1,034 |
| Pacific Gas and Electric Co. 6.35% 2038 | 2,533 | 2,762 |
| Pacific Gas and Electric Co. 3.95% 2047 | 2,920 | 2,366 |
| Sierra Pacific Power Co., General and Refunding Mortgage Notes, Series T, 3.375% 2023 | 2,004 | 1,990 |
| State Grid Overseas Investment Ltd. 3.50% 20272 | 15,000 | 14,076 |
| 142,548 | ||
| Energy 0.87% | ||
| Chevron Corp. 1.961% 2020 | 5,175 | 5,103 |
| Chevron Corp. 2.498% 2022 | 9,180 | 8,933 |
| Enbridge Energy Partners, LP 5.875% 2025 | 1,845 | 2,011 |
| Enbridge Energy Partners, LP 7.375% 2045 | 5,035 | 6,269 |
| Enbridge Inc. 4.25% 2026 | 2,685 | 2,643 |
| Enbridge Inc. 3.70% 2027 | 2,083 | 1,961 |
| Bonds, notes & other debt instruments Corporate bonds & notes (continued) Energy (continued) | Principal amount (000) | Value (000) |
| Energy Transfer Partners, LP 4.00% 2027 | $3,067 | $2,840 |
| Energy Transfer Partners, LP 4.20% 2027 | 610 | 577 |
| Energy Transfer Partners, LP 6.00% 2048 | 565 | 559 |
| Halliburton Co. 3.80% 2025 | 1,410 | 1,374 |
| Kinder Morgan Energy Partners, LP 3.50% 2021 | 850 | 847 |
| Kinder Morgan Energy Partners, LP 5.00% 2043 | 1,980 | 1,829 |
| Kinder Morgan, Inc. 4.30% 2025 | 20,905 | 20,824 |
| Kinder Morgan, Inc. 4.30% 2028 | 5,275 | 5,109 |
| Kinder Morgan, Inc. 5.55% 2045 | 6,894 | 6,989 |
| Petróleos Mexicanos 6.875% 2026 | 6,715 | 6,705 |
| Petróleos Mexicanos 6.50% 2027 | 3,975 | 3,862 |
| Petróleos Mexicanos 6.35% 20482 | 6,415 | 5,349 |
| Schlumberger BV 4.00% 20252 | 3,080 | 3,051 |
| Statoil ASA 3.25% 2024 | 4,100 | 4,024 |
| Statoil ASA 3.70% 2024 | 1,475 | 1,484 |
| TransCanada Corp. 7.125% 2019 | 125 | 126 |
| TransCanada Corp. 5.875% 2076 (3-month USD-LIBOR + 4.64% on 8/15/2026)7 | 18,000 | 17,764 |
| Transocean Inc. 5.80% 20227 | 5,100 | 4,972 |
| Transportadora de Gas Peru SA 4.25% 20282,5 | 1,700 | 1,655 |
| Tullow Oil PLC 6.25% 2022 | 5,000 | 4,996 |
| Williams Partners LP 4.30% 2024 | 2,000 | 2,002 |
| Williams Partners LP 3.90% 2025 | 945 | 917 |
| Williams Partners LP 4.00% 2025 | 18,185 | 17,604 |
| 142,379 | ||
| Consumer discretionary 0.63% | ||
| Amazon.com, Inc. 3.30% 2021 | 47,700 | 47,798 |
| Amazon.com, Inc. 2.80% 2024 | 7,345 | 7,015 |
| Amazon.com, Inc. 3.15% 2027 | 4,265 | 4,025 |
| DaimlerChrysler North America Holding Corp. 2.00% 20212 | 10,275 | 9,888 |
| DaimlerChrysler North America Holding Corp. 2.20% 2021 | 2,700 | 2,578 |
| DaimlerChrysler North America Holding Corp. 3.00% 20212 | 10,500 | 10,370 |
| Ford Motor Credit Co. 3.20% 2021 | 4,000 | 3,906 |
| Ford Motor Credit Co. 3.339% 2022 | 800 | 765 |
| Hyundai Capital America 2.55% 20202 | 5,750 | 5,647 |
| Hyundai Capital America 3.25% 20222 | 2,732 | 2,637 |
| Hyundai Capital Services Inc. 2.625% 20202 | 2,185 | 2,133 |
| Hyundai Capital Services Inc. 3.75% 20232 | 5,400 | 5,276 |
| McDonald’s Corp. 3.35% 2023 | 2,335 | 2,298 |
| 104,336 | ||
| Communication services 0.54% | ||
| AT&T Inc. 4.25% 2027 | 2,130 | 2,069 |
| AT&T Inc. 4.10% 20282 | 5,457 | 5,203 |
| CCO Holdings LLC and CCO Holdings Capital Corp. 5.75% 20262 | 10,050 | 9,975 |
| CenturyLink, Inc. 7.50% 2024 | 3,685 | 3,879 |
| CenturyLink, Inc., Series T, 5.80% 2022 | 4,907 | 4,913 |
| Comcast Corp. 3.95% 2025 | 2,375 | 2,371 |
| Comcast Corp. 4.15% 2028 | 4,695 | 4,662 |
| Deutsche Telekom International Finance BV 1.95% 20212 | 1,625 | 1,549 |
| Deutsche Telekom International Finance BV 2.82% 20222 | 4,625 | 4,501 |
| Deutsche Telekom International Finance BV 3.60% 20272 | 6,025 | 5,632 |
| Deutsche Telekom International Finance BV 9.25% 2032 | 1,510 | 2,155 |
| France Télécom 5.375% 2050 | £2,000 | 3,463 |
| Bonds, notes & other debt instruments Corporate bonds & notes (continued) Communication services (continued) | Principal amount (000) | Value (000) |
| News America Inc. 3.00% 2022 | $20,000 | $19,511 |
| Sprint Corp. 11.50% 2021 | 925 | 1,089 |
| Thomson Reuters Corp. 4.30% 2023 | 1,950 | 1,969 |
| Time Warner Inc. 4.75% 2021 | 1,300 | 1,335 |
| T-Mobile US, Inc. 6.375% 2025 | 2,500 | 2,584 |
| T-Mobile US, Inc. 6.50% 2026 | 11,275 | 11,923 |
| Verizon Communications Inc. 4.272% 2036 | 241 | 222 |
| 89,005 | ||
| Information technology 0.16% | ||
| Apple Inc. 2.50% 2022 | 2,970 | 2,895 |
| Apple Inc. 3.35% 2027 | 2,650 | 2,556 |
| Microsoft Corp. 2.40% 2026 | 10,568 | 9,650 |
| Microsoft Corp. 3.30% 2027 | 2,600 | 2,524 |
| Oracle Corp. 2.65% 2026 | 5,224 | 4,783 |
| Oracle Corp. 3.25% 2027 | 4,246 | 4,021 |
| 26,429 | ||
| Real estate 0.15% | ||
| American Campus Communities, Inc. 3.35% 2020 | 145 | 145 |
| American Campus Communities, Inc. 3.75% 2023 | 3,040 | 2,997 |
| American Campus Communities, Inc. 4.125% 2024 | 3,730 | 3,696 |
| Corporate Office Properties LP 3.60% 2023 | 240 | 232 |
| Essex Portfolio LP 3.50% 2025 | 5,120 | 4,920 |
| Essex Portfolio LP 3.375% 2026 | 1,545 | 1,454 |
| Kimco Realty Corp. 3.40% 2022 | 355 | 349 |
| Kimco Realty Corp. 2.70% 2024 | 1,585 | 1,473 |
| Scentre Group 3.75% 20272 | 790 | 751 |
| WEA Finance LLC 2.70% 20192 | 1,070 | 1,067 |
| WEA Finance LLC 3.25% 20202 | 3,405 | 3,390 |
| WEA Finance LLC 3.75% 20242 | 2,070 | 2,028 |
| Westfield Corp. Ltd. 3.15% 20222 | 1,510 | 1,479 |
| 23,981 | ||
| Materials 0.09% | ||
| First Quantum Minerals Ltd. 7.25% 20222 | 15,550 | 14,850 |
| Industrials 0.09% | ||
| Autoridad del Canal de Panama 4.95% 20352,5 | 1,300 | 1,333 |
| Autoridad del Canal de Panama 4.95% 20355 | 1,025 | 1,051 |
| ENA Norte Trust 4.95% 20282,5 | 799 | 796 |
| GE Capital European Funding 5.375% 2020 | €1,500 | 1,808 |
| Lima Metro Line Finance Ltd. 5.875% 20342,5 | $2,938 | 2,971 |
| Red de Carreteras de Occidente 9.00% 20285 | MXN18,470 | 855 |
| Union Pacific Corp. 4.50% 2048 | $645 | 627 |
| United Technologies Corp. 4.125% 2028 | 5,000 | 4,930 |
| 14,371 | ||
| Total corporate bonds & notes | 1,170,279 |
| Bonds, notes & other debt instruments Mortgage-backed obligations 1.71% Federal agency mortgage-backed obligations 0.87% | Principal amount (000) | Value (000) |
| Fannie Mae 6.00% 20375 | $122 | $133 |
| Fannie Mae 4.00% 20415 | 151 | 152 |
| Fannie Mae 4.00% 20415 | 119 | 120 |
| Fannie Mae 4.00% 20415 | 98 | 99 |
| Fannie Mae 4.00% 20415 | 31 | 31 |
| Fannie Mae 3.50% 20485,8 | 38,500 | 37,482 |
| Fannie Mae 4.00% 20485,8 | 68,560 | 68,479 |
| Fannie Mae 4.50% 20485,8 | 31,600 | 32,309 |
| Government National Mortgage Assn. 4.00% 20455 | 3,030 | 3,075 |
| 141,880 | ||
| Other mortgage-backed securities 0.83% | ||
| Korea Housing Finance Corp. 2.50% 20202,5 | 3,600 | 3,531 |
| Korea Housing Finance Corp. 2.00% 20212,5 | 5,900 | 5,633 |
| Nykredit Realkredit AS, Series 01E, 1.50% 20375 | DKr222,613 | 33,932 |
| Nykredit Realkredit AS, Series 01E, 2.00% 20375 | 74,606 | 11,782 |
| Nykredit Realkredit AS, Series 01E, 1.50% 20405 | 551,667 | 82,936 |
| 137,814 | ||
| Commercial mortgage-backed securities 0.01% | ||
| Core Industrial Trust, Series 2015-CALW, Class A, 3.04% 20342,5 | $1,859 | 1,840 |
| Total mortgage-backed obligations | 281,534 | |
| Total bonds, notes & other debt instruments (cost: $6,240,145,000) | 5,985,762 | |
| Short-term securities 4.05% | ||
| Apple Inc. 2.20% due 11/2/20182 | 20,000 | 19,998 |
| Argentinian Treasury Bills (6.40)%–1.13% due 2/28/2019–4/30/2019 | ARS234,519 | 6,808 |
| Bank of Montreal 2.17%–2.24% due 11/21/2018–11/27/2018 | 90,000 | 89,857 |
| BASF SE 2.33% due 12/13/20182 | 50,000 | 49,862 |
| CAFCO, LLC 2.25% due 11/27/20182 | 25,000 | 24,957 |
| CHARTA, LLC 2.25% due 12/3/20182 | 22,600 | 22,552 |
| Egyptian Treasury Bills 16.58% due 3/19/2019 | EGP220,000 | 11,476 |
| Fairway Finance Corp. 2.14% due 11/20/20182 | $25,000 | 24,968 |
| Federal Home Loan Bank 2.18%–2.21% due 11/7/2018–12/27/2018 | 30,000 | 29,943 |
| KfW 2.17% due 11/8/20182 | 31,800 | 31,784 |
| Liberty Street Funding Corp. 2.25% due 11/15/20182 | 40,100 | 40,062 |
| L’Oréal USA, Inc. 2.25% due 11/7/20182 | 40,000 | 39,983 |
| MUFG Bank, Ltd., New York Branch 2.19% due 11/6/2018 | 20,000 | 19,993 |
| Nigerian Treasury Bills 10.44%–11.25% due 11/29/2018–12/6/2018 | NGN3,400,000 | 9,261 |
| Novartis Finance Corp. 2.27% due 12/10/20182 | 38,000 | 37,904 |
| Paccar Financial Corp. 2.27% due 11/29/2018 | 23,500 | 23,457 |
| Province of Alberta 2.20% due 11/1/20182 | 35,000 | 34,998 |
| Starbird Funding Corp. 2.16% due 11/13/20182 | 25,000 | 24,979 |
| Sumitomo Mitsui Banking Corp. 2.24% due 12/17/20182 | 40,000 | 39,879 |
| Thailand Treasury Bills 1.36% due 12/6/2018 | THB90,000 | 2,712 |
| Toronto-Dominion Bank 2.30% due 12/18/20182 | $50,000 | 49,846 |
| Toyota Industries Commercial Finance, Inc. 2.16% due 11/1/20182 | 31,000 | 30,998 |
| Total short-term securities (cost: $666,279,000) | 666,277 | |
| Total investment securities 100.14% (cost: $16,058,995,000) | 16,480,194 | |
| Other assets less liabilities (0.14)% | (22,856) | |
| Net assets 100.00% | $16,457,338 |
| Contracts | Type | Number of contracts | Expiration | Notional amount9 (000) | Value at 10/31/201810 (000) | Unrealized appreciation (depreciation) at 10/31/2018 (000) |
| 5 Year U.S. Treasury Note Futures | Long | 326 | January 2019 | $32,600 | $36,637 | $47 |
| 10 Year U.S. Treasury Note Futures | Long | 206 | December 2018 | 20,600 | 24,398 | —11 |
| 10 Year Ultra U.S. Treasury Note Futures | Long | 105 | December 2018 | 10,500 | 13,136 | (87) |
| $(40) |
| Contract amount | Counterparty | Settlement date | Unrealized appreciation (depreciation) at 10/31/2018 (000) | |
| Purchases (000) | Sales (000) | |||
| USD27,958 | EUR24,080 | Morgan Stanley | 11/2/2018 | $680 |
| USD15,058 | PLN55,470 | Citibank | 11/2/2018 | 602 |
| EUR24,080 | USD27,259 | Bank of America, N.A. | 11/2/2018 | 20 |
| PLN55,470 | USD14,475 | Goldman Sachs | 11/2/2018 | (18) |
| USD20,506 | CAD26,290 | JPMorgan Chase | 11/5/2018 | 534 |
| JPY1,703,962 | EUR12,980 | Goldman Sachs | 11/5/2018 | 399 |
| USD20,199 | ILS73,625 | Morgan Stanley | 11/5/2018 | 397 |
| JPY3,465,158 | USD30,548 | Goldman Sachs | 11/5/2018 | 173 |
| EUR12,980 | JPY1,684,021 | Bank of America, N.A. | 11/5/2018 | (222) |
| CAD26,290 | USD20,284 | JPMorgan Chase | 11/5/2018 | (312) |
| USD11,167 | INR817,000 | Goldman Sachs | 11/6/2018 | 127 |
| INR577,100 | USD7,743 | Goldman Sachs | 11/6/2018 | 56 |
| USD3,575 | INR262,500 | JPMorgan Chase | 11/6/2018 | 27 |
| INR502,400 | USD6,803 | Citibank | 11/6/2018 | (14) |
| USD64,530 | GBP49,000 | Bank of America, N.A. | 11/7/2018 | 1,880 |
| JPY3,588,346 | EUR27,000 | Citibank | 11/7/2018 | 1,219 |
| USD8,292 | CAD10,700 | Citibank | 11/7/2018 | 163 |
| USD5,617 | KRW6,239,800 | Goldman Sachs | 11/8/2018 | 141 |
| BRL14,840 | USD4,025 | Goldman Sachs | 11/8/2018 | (42) |
| USD3,679 | BRL14,840 | Citibank | 11/8/2018 | (305) |
| USD30,716 | CLP20,564,500 | JPMorgan Chase | 11/9/2018 | 1,167 |
| USD28,238 | EUR24,500 | Goldman Sachs | 11/9/2018 | 468 |
| CLP170,000 | USD249 | Citibank | 11/9/2018 | (5) |
| CLP20,394,500 | USD30,080 | Goldman Sachs | 11/9/2018 | (775) |
| JPY6,068,379 | USD53,381 | JPMorgan Chase | 11/15/2018 | 458 |
| USD16,506 | CAD21,125 | Citibank | 11/15/2018 | 454 |
| USD12,302 | THB396,000 | Citibank | 11/15/2018 | 352 |
| USD7,028 | CAD9,000 | Goldman Sachs | 11/15/2018 | 189 |
| JPY5,467,800 | USD48,423 | Morgan Stanley | 11/15/2018 | 87 |
| EUR19,599 | USD22,787 | Citibank | 11/15/2018 | (562) |
| USD29,680 | PLN111,600 | Goldman Sachs | 11/16/2018 | 587 |
| USD13,281 | GBP10,100 | Morgan Stanley | 11/16/2018 | 363 |
| EUR25,813 | PLN111,600 | Goldman Sachs | 11/16/2018 | 180 |
| USD13,973 | KRW15,800,000 | JPMorgan Chase | 11/16/2018 | 102 |
| Contract amount | Counterparty | Settlement date | Unrealized appreciation (depreciation) at 10/31/2018 (000) | |
| Purchases (000) | Sales (000) | |||
| USD14,744 | MYR61,400 | JPMorgan Chase | 11/16/2018 | $77 |
| USD17,244 | INR1,273,738 | Morgan Stanley | 11/16/2018 | 53 |
| PLN11,900 | USD3,137 | JPMorgan Chase | 11/16/2018 | (35) |
| USD16,399 | INR1,224,700 | Goldman Sachs | 11/16/2018 | (130) |
| USD11,113 | BRL42,000 | JPMorgan Chase | 11/16/2018 | (153) |
| INR1,943,200 | USD26,423 | JPMorgan Chase | 11/16/2018 | (197) |
| JPY5,092,100 | USD45,515 | JPMorgan Chase | 11/16/2018 | (334) |
| NOK111,700 | USD13,629 | Citibank | 11/16/2018 | (369) |
| EUR22,273 | USD25,734 | Goldman Sachs | 11/16/2018 | (475) |
| GBP39,045 | USD51,343 | Morgan Stanley | 11/16/2018 | (1,401) |
| USD7,412 | CLP5,087,500 | JPMorgan Chase | 11/19/2018 | 101 |
| USD7,403 | CLP5,087,500 | Citibank | 11/19/2018 | 92 |
| USD20,601 | INR1,539,700 | Citibank | 11/19/2018 | (172) |
| EUR9,410 | USD10,876 | Citibank | 11/19/2018 | (201) |
| EUR9,410 | USD10,876 | Bank of America, N.A. | 11/19/2018 | (202) |
| EUR9,270 | USD10,719 | Bank of New York Mellon | 11/19/2018 | (203) |
| CLP10,175,000 | USD15,162 | Citibank | 11/19/2018 | (540) |
| EUR7,203 | PLN31,150 | Citibank | 11/20/2018 | 50 |
| JPY2,500,000 | USD22,216 | Bank of America, N.A. | 11/20/2018 | (28) |
| USD21,479 | AUD30,400 | Morgan Stanley | 11/20/2018 | (54) |
| JPY760,071 | USD6,815 | Morgan Stanley | 11/20/2018 | (69) |
| GBP5,070 | USD6,696 | Goldman Sachs | 11/20/2018 | (210) |
| NOK76,376 | USD9,380 | Goldman Sachs | 11/20/2018 | (312) |
| USD2,285 | BRL8,500 | Goldman Sachs | 11/21/2018 | 6 |
| TRY24,700 | USD3,774 | Citibank | 11/26/2018 | 572 |
| USD10,954 | COP34,192,000 | Goldman Sachs | 11/26/2018 | 347 |
| USD4,486 | MXN86,150 | Bank of New York Mellon | 11/26/2018 | 263 |
| JPY1,528,105 | EUR11,850 | Bank of America, N.A. | 11/26/2018 | 119 |
| USD12,116 | MYR50,500 | JPMorgan Chase | 11/26/2018 | 55 |
| USD4,284 | TRY24,700 | Morgan Stanley | 11/26/2018 | (62) |
| EUR4,845 | USD5,570 | Morgan Stanley | 11/26/2018 | (70) |
| JPY2,954,700 | USD26,350 | Goldman Sachs | 11/26/2018 | (115) |
| MXN86,150 | USD4,391 | Bank of America, N.A. | 11/26/2018 | (169) |
| GBP11,000 | USD14,363 | Bank of America, N.A. | 11/26/2018 | (287) |
| USD44,506 | EUR38,610 | Goldman Sachs | 11/28/2018 | 676 |
| USD13,792 | THB449,500 | Citibank | 11/28/2018 | 223 |
| USD16,934 | BRL57,000 | Citibank | 11/29/2018 | 1,662 |
| USD3,835 | BRL12,950 | Citibank | 11/29/2018 | 366 |
| USD5,290 | INR390,400 | Citibank | 11/29/2018 | 30 |
| EUR7,000 | USD7,997 | Citibank | 11/29/2018 | (50) |
| GBP5,700 | USD7,407 | Citibank | 11/29/2018 | (112) |
| EUR18,836 | USD21,673 | Goldman Sachs | 11/29/2018 | (289) |
| USD22,524 | INR1,657,300 | JPMorgan Chase | 11/30/2018 | 195 |
| USD15,009 | ZAR220,600 | Citibank | 11/30/2018 | 112 |
| INR22,000 | USD299 | JPMorgan Chase | 11/30/2018 | (2) |
| JPY1,663,975 | EUR13,100 | Goldman Sachs | 11/30/2018 | (94) |
| USD14,484 | PLN55,470 | Goldman Sachs | 12/3/2018 | 17 |
| USD27,324 | EUR24,080 | Bank of America, N.A. | 12/3/2018 | (25) |
| BRL15,700 | USD4,251 | Goldman Sachs | 12/3/2018 | (46) |
| USD3,794 | BRL15,700 | Bank of America, N.A. | 12/3/2018 | (411) |
| USD14,724 | INR1,090,000 | Citibank | 12/4/2018 | 46 |
| USD7,187 | INR529,000 | Citibank | 12/6/2018 | 65 |
| Contract amount | Counterparty | Settlement date | Unrealized appreciation (depreciation) at 10/31/2018 (000) | |
| Purchases (000) | Sales (000) | |||
| USD21,771 | KRW24,600,000 | Morgan Stanley | 1/17/2019 | $122 |
| TRY25,800 | USD3,797 | Citibank | 1/24/2019 | 585 |
| USD4,317 | TRY25,800 | Morgan Stanley | 1/24/2019 | (66) |
| USD16,380 | BRL55,250 | Citibank | 2/25/2019 | 1,681 |
| USD27,494 | BRL92,500 | JPMorgan Chase | 3/15/2019 | 2,919 |
| BRL28,800 | USD7,182 | Citibank | 3/15/2019 | 469 |
| USD4,244 | BRL14,800 | JPMorgan Chase | 3/15/2019 | 312 |
| BRL26,600 | USD6,774 | JPMorgan Chase | 3/15/2019 | 293 |
| BRL51,400 | USD13,458 | JPMorgan Chase | 3/15/2019 | 197 |
| BRL500 | USD125 | Bank of America, N.A. | 3/15/2019 | 8 |
| $13,400 | ||||
| 1 | Security did not produce income during the last 12 months. |
| 2 | Acquired in a transaction exempt from registration under Rule 144A or Section 4(2) of the Securities Act of 1933. May be resold in the U.S. in transactions exempt from registration, normally to qualified institutional buyers. The total value of all such securities was $923,573,000, which represented 5.61% of the net assets of the fund. |
| 3 | Valued under fair value procedures adopted by authority of the board of trustees. The total value of the security was $29,951,000, which represented .18% of the net assets of the fund. |
| 4 | Index-linked bond whose principal amount moves with a government price index. |
| 5 | Principal payments may be made periodically. Therefore, the effective maturity date may be earlier than the stated maturity date. |
| 6 | All or a portion of this security was pledged as collateral. The total value of pledged collateral was $1,151,000, which represented .01% of the net assets of the fund. |
| 7 | Step bond; coupon rate may change at a later date. |
| 8 | Purchased on a TBA basis. |
| 9 | Notional amount is calculated based on the number of contracts and notional contract size. |
| 10 | Value is calculated based on the notional amount and current market price. |
| 11 | Amount less than one thousand. |
| Key to abbreviations and symbols | |
| ADR = American Depositary Receipts | KRW = South Korean won |
| ARS = Argentine pesos | LIBOR = London Interbank Offered Rate |
| AUD/A$ = Australian dollars | MXN = Mexican pesos |
| BRL = Brazilian reais | MYR = Malaysian ringgits |
| CAD/C$ = Canadian dollars | NGN = Nigerian naira |
| CLP = Chilean pesos | NOK/NKr = Norwegian kroner |
| COP = Colombian pesos | PEN = Peruvian nuevos soles |
| CZK = Czech korunas | PLN = Polish zloty |
| DKr = Danish kroner | RON = Romanian leu |
| EGP = Egyptian pounds | RUB = Russian rubles |
| EUR/€ = Euros | TBA = To-be-announced |
| EURIBOR = Euro Interbank Offered Rate | THB = Thai baht |
| GBP/£ = British pounds | TRY = Turkish lira |
| HKD = Hong Kong dollars | USD/$ = U.S. dollars |
| ILS = Israeli shekels | UYU = Uruguayan pesos |
| INR = Indian rupees | ZAR = South African rand |
| JPY/¥ = Japanese yen |
| MFGEFPX-037-1218O-S66023 | American Funds Global Balanced Fund — Page 18 of 18 |
REPORT OF INDEPENDENT REGISTERED PUBLIC ACCOUNTING FIRM ON INVESTMENT PORTFOLIO
To the Shareholders and Board of Trustees of American Funds Global Balanced Fund:
Opinion on the Investment Portfolio
We have audited the accompanying investment portfolio of American Funds Global Balanced Fund (the “Fund”), as of October 31, 2018, and the related notes (“investment portfolio”) (included in Item 6 of this Form N-CSR). In our opinion, the investment portfolio presents fairly, in all material respects, the investments in securities of the Fund as of October 31, 2018, in conformity with accounting principles generally accepted in the United States of America.
Basis for Opinion
The investment portfolio is the responsibility of the Fund’s management. Our responsibility is to express an opinion on the investment portfolio based on our audit. We are a public accounting firm registered with the Public Company Accounting Oversight Board (United States) (PCAOB) and are required to be independent with respect to the Fund in accordance with the U.S. federal securities laws and the applicable rules and regulations of the Securities and Exchange Commission and the PCAOB.
We conducted our audit in accordance with the standards of the PCAOB. Those standards require that we plan and perform the audit to obtain reasonable assurance about whether the investment portfolio is free of material misstatement, whether due to error or fraud. The Fund is not required to have, nor were we engaged to perform, an audit of its internal control over financial reporting. As part of our audit we are required to obtain an understanding of internal control over financial reporting but not for the purpose of expressing an opinion on the effectiveness of the Fund's internal control over financial reporting. Accordingly, we express no such opinion.
Our audit included performing procedures to assess the risks of material misstatement of the investment portfolio, whether due to error or fraud, and performing procedures that respond to those risks. Such procedures included examining, on a test basis, evidence regarding the amounts and disclosures in the investment portfolio. Our audit also included evaluating the accounting principles used and significant estimates made by management, as well as evaluating the overall presentation of the investment portfolio. We believe that our audit provides a reasonable basis for our opinion.

Costa Mesa, California
December 12, 2018
We have served as the auditor of one or more American Funds investment companies since 1956.
ITEM 7 – Disclosure of Proxy Voting Policies and Procedures for Closed-End Management Investment Companies
Not applicable to this Registrant, insofar as the Registrant is not a closed-end management investment company.
ITEM 8 – Portfolio Managers of Closed-End Management Investment Companies
Not applicable to this Registrant, insofar as the Registrant is not a closed-end management investment company.
ITEM 9 – Purchases of Equity Securities by Closed-End Management Investment Company and Affiliated Purchasers
Not applicable to this Registrant, insofar as the Registrant is not a closed-end management investment company.
ITEM 10 – Submission of Matters to a Vote of Security Holders
There have been no material changes to the procedures by which shareholders may recommend nominees to the Registrant’s board of trustees since the Registrant last submitted a proxy statement to its shareholders. The procedures are as follows. The Registrant has a nominating and governance committee comprised solely of persons who are not considered ‘‘interested persons’’ of the Registrant within the meaning of the Investment Company Act of 1940, as amended. The committee periodically reviews such issues as the board’s composition, responsibilities, committees, compensation and other relevant issues, and recommends any appropriate changes to the full board of trustees. While the committee normally is able to identify from its own resources an ample number of qualified candidates, it will consider shareholder suggestions of persons to be considered as nominees to fill future vacancies on the board. Such suggestions must be sent in writing to the nominating and governance committee of the Registrant, c/o the Registrant’s Secretary, and must be accompanied by complete biographical and occupational data on the prospective nominee, along with a written consent of the prospective nominee for consideration of his or her name by the nominating and governance committee.
ITEM 11 – Controls and Procedures
| (a) | The Registrant’s Principal Executive Officer and Principal Financial Officer have concluded, based on their evaluation of the Registrant’s disclosure controls and procedures (as such term is defined in Rule 30a-3 under the Investment Company Act of 1940), that such controls and procedures are adequate and reasonably designed to achieve the purposes described in paragraph (c) of such rule. |
| (b) | Effective May 28, 2018, the American Funds Global Balanced Fund’s investment adviser implemented a new fixed income order management, trading, and compliance system. In connection with introducing this new system, additional automated and manual controls were implemented and some existing controls were modified. None of these changes were in response to any identified deficiency or weakness in the American Funds Global Balanced Fund’s internal control over financial reporting. |
ITEM 12 – Exhibits
| (a)(1) | The Code of Ethics that is the subject of the disclosure required by Item 2 is attached as an exhibit hereto. |
| (a)(2) | The certifications required by Rule 30a-2 of the Investment Company Act of 1940 and Sections 302 and 906 of the Sarbanes-Oxley Act of 2002 are attached as exhibits hereto. |
SIGNATURES
Pursuant to the requirements of the Securities Exchange Act of 1934 and the Investment Company Act of 1940, the Registrant has duly caused this report to be signed on its behalf by the undersigned, thereunto duly authorized.
| AMERICAN FUNDS GLOBAL BALANCED FUND | |
| By /s/ Herbert Y. Poon | |
|
Herbert Y. Poon, Executive Vice President and Principal Executive Officer | |
| Date: December 31, 2018 |
Pursuant to the requirements of the Securities Exchange Act of 1934 and the Investment Company Act of 1940, this report has been signed below by the following persons on behalf of the Registrant and in the capacities and on the dates indicated.
| By/s/ Herbert Y. Poon |
|
Herbert Y. Poon, Executive Vice President and Principal Executive Officer |
| Date: December 31, 2018 |
| By /s/ Brian D. Bullard |
|
Brian D. Bullard, Treasurer and Principal Financial Officer |
| Date: December 31, 2018 |
Code of Ethics
The following Code of Ethics is in effect for the Registrant:
| The Fund has adopted the following standards in accordance with the requirements of Form N-CSR adopted by the Securities and Exchange Commission pursuant to Section 406 of the Sarbanes-Oxley Act of 2002 for the purpose of deterring wrongdoing and promoting: 1) honest and ethical conduct, including handling of actual or apparent conflicts of interest between personal and professional relationships; 2) full, fair, accurate, timely and understandable disclosure in reports and documents that a fund files with or submits to the Commission and in other public communications made by the fund; 3) compliance with applicable governmental laws, rules and regulations; 4) the prompt internal reporting of violations of the Code to an appropriate person or persons identified in the Code; and 5) accountability for adherence to the Code. These provisions shall apply to the principal executive officer or chief executive officer and treasurer (“Covered Officers”) of the Fund. | |||
| (1) | It is the responsibility of Covered Officers to foster, by their words and actions, a corporate culture that encourages honest and ethical conduct, including the ethical resolution of, and appropriate disclosure of conflicts of interest. Covered Officers should work to assure a working environment that is characterized by respect for law and compliance with applicable rules and regulations. | ||
| (2) | Each Covered Officer must act in an honest and ethical manner while conducting the affairs of the Fund, including the ethical handling of actual or apparent conflicts of interest between personal and professional relationships. Duties of Covered Officers include: | ||
| • | Acting with integrity; | ||
| • | Adhering to a high standard of business ethics; and | ||
| • | Not using personal influence or personal relationships to improperly influence investment decisions or financial reporting whereby the Covered Officer would benefit personally to the detriment of the Fund; | ||
| (3) | Each Covered Officer should act to promote full, fair, accurate, timely and understandable disclosure in reports and documents that the Fund files with or submits to, the Securities and Exchange Commission and in other public communications made by the Fund. | ||
| • | Covered Officers should familiarize themselves with disclosure requirements applicable to the Fund and disclosure controls and procedures in place to meet these requirements; and | ||
| • | Covered Officers must not knowingly misrepresent, or cause others to misrepresent facts about the Fund to others, including the Fund’s auditors, independent trustees, governmental regulators and self-regulatory organizations. | ||
| (4) | Any existing or potential violations of this Code of Ethics should be reported to The Capital Group Companies’ Personal Investing Committee. The Personal Investing Committee is authorized to investigate any such violations and report their findings to the Chairman of the Audit Committee of the Fund. The Chairman of the Audit Committee may report violations of the Code of Ethics to the Board or other appropriate entity including the Audit Committee, if he or she believes such a reporting is appropriate. The Personal Investing Committee may also determine the appropriate sanction for any violations of this Code of Ethics, including removal from office, provided that removal from office shall only be carried out with the approval of the Board. | ||
| (5) | Application of this Code of Ethics is the responsibility of the Personal Investing Committee, which shall report periodically to the Chairman of the Audit Committee of the Fund. | ||
| (6) | Material amendments to these provisions must be ratified by a majority vote of the Board. As required by applicable rules, substantive amendments to the Code of Ethics must be filed or appropriately disclosed. | ||
|
American Funds Global Balanced Fund 6455 Irvine Center Drive Irvine, California 92618 (213) 486-9200 |
CERTIFICATION
I, Herbert Y. Poon, certify that:
| 1. | I have reviewed this report on Form N-CSR of American Funds Global Balanced Fund; |
| 2. | Based on my knowledge, this report does not contain any untrue statement of a material fact or omit to state a material fact necessary to make the statements made, in light of the circumstances under which such statements were made, not misleading with respect to the period covered by this report; |
| 3. | Based on my knowledge, the financial statements, and other financial information included in this report, fairly present in all material respects the financial condition, results of operations, changes in net assets, and cash flows (if the financial statements are required to include a statement of cash flows) of the registrant as of, and for, the periods presented in this report; |
| 4. | The registrant's other certifying officer(s) and I are responsible for establishing and maintaining disclosure controls and procedures (as defined in rule 30a-3(c) under the Investment Company Act of 1940) and internal controls over financial reporting (as defined in Rule 30a-3(d) under the Investment Company Act of 1940) for the registrant and have: |
| a) Designed such disclosure controls and procedures, or caused such disclosure controls and procedures to be designed under our supervision, to ensure that material information relating to the registrant, including its consolidated subsidiaries, is made known to us by others within those entities, particularly during the period in which this report is being prepared; | |
| b) Designed such internal control over financial reporting, or caused such internal control over financial reporting to be designed under our supervision, to provide reasonable assurance regarding the reliability of financial reporting and the preparation of financial statements for external purposes in accordance with generally accepted accounting principles; | |
| c) Evaluated the effectiveness of the registrant's disclosure controls and procedures and presented in this report our conclusions about the effectiveness of the disclosure controls and procedures, as of a date within 90 days prior to the filing date of this report based on such evaluation; and | |
| d) Disclosed in this report any change in the registrant’s internal control over financial reporting that occurred during the registrant’s second fiscal quarter of the period covered by this report that has materially affected, or is reasonably likely to materially affect, the registrant’s internal control over financial reporting; and | |
| 5. | The registrant's other certifying officer(s) and I have disclosed to the registrant's auditors and the audit committee of the registrant's Board of Trustees (or persons performing the equivalent functions): |
| a) All significant deficiencies and material weaknesses in the design or operation of internal control over financial reporting which are reasonably likely to adversely affect the registrant’s ability to record, process, summarize, and report financial information; and | |
| b) Any fraud, whether or not material, that involves management or other employees who have a significant role in the registrant's internal control over financial reporting. |
Date: December 31, 2018
/s/ Herbert Y. Poon
Herbert Y. Poon, Executive Vice President and
Principal Executive Officer
American Funds Global Balanced Fund
|
American Funds Global Balanced Fund 6455 Irvine Center Drive Irvine, California 92618 (213) 486-9200 |
CERTIFICATION
I, Brian D. Bullard, certify that:
| 1. | I have reviewed this report on Form N-CSR of American Funds Global Balanced Fund; |
| 2. | Based on my knowledge, this report does not contain any untrue statement of a material fact or omit to state a material fact necessary to make the statements made, in light of the circumstances under which such statements were made, not misleading with respect to the period covered by this report; |
| 3. | Based on my knowledge, the financial statements, and other financial information included in this report, fairly present in all material respects the financial condition, results of operations, changes in net assets, and cash flows (if the financial statements are required to include a statement of cash flows) of the registrant as of, and for, the periods presented in this report; |
| 4. | The registrant's other certifying officer(s) and I are responsible for establishing and maintaining disclosure controls and procedures (as defined in rule 30a-3(c) under the Investment Company Act of 1940) and internal controls over financial reporting (as defined in Rule 30a-3(d) under the Investment Company Act of 1940) for the registrant and have: |
| a) Designed such disclosure controls and procedures, or caused such disclosure controls and procedures to be designed under our supervision, to ensure that material information relating to the registrant, including its consolidated subsidiaries, is made known to us by others within those entities, particularly during the period in which this report is being prepared; | |
| b) Designed such internal control over financial reporting, or caused such internal control over financial reporting to be designed under our supervision, to provide reasonable assurance regarding the reliability of financial reporting and the preparation of financial statements for external purposes in accordance with generally accepted accounting principles; | |
| c) Evaluated the effectiveness of the registrant's disclosure controls and procedures and presented in this report our conclusions about the effectiveness of the disclosure controls and procedures, as of a date within 90 days prior to the filing date of this report based on such evaluation; and | |
| d) Disclosed in this report any change in the registrant’s internal control over financial reporting that occurred during the registrant’s second fiscal quarter of the period covered by this report that has materially affected, or is reasonably likely to materially affect, the registrant’s internal control over financial reporting; and | |
| 5. | The registrant's other certifying officer(s) and I have disclosed to the registrant's auditors and the audit committee of the registrant's Board of Trustees (or persons performing the equivalent functions): |
| a) All significant deficiencies and material weaknesses in the design or operation of internal control over financial reporting which are reasonably likely to adversely affect the registrant’s ability to record, process, summarize, and report financial information; and | |
| b) Any fraud, whether or not material, that involves management or other employees who have a significant role in the registrant's internal control over financial reporting. |
Date: December 31, 2018
/s/ Brian D. Bullard
Brian D. Bullard, Treasurer and
Principal Financial Officer
American Funds Global Balanced Fund
|
American Funds Global Balanced Fund 6455 Irvine Center Drive Irvine, California 92618 (213) 486-9200 |
CERTIFICATION PURSUANT TO 18 U.S.C. SECTION 1350,
AS ADOPTED PURSUANT TO
SECTION 906 OF THE SARBANES-OXLEY ACT OF 2002
HERBERT Y. POON, Executive Vice President and Principal Executive Officer, and BRIAN D. BULLARD, Treasurer and Principal Financial Officer of American Funds Global Balanced Fund (the "Registrant"), each certify to the best of his knowledge that:
| 1) | The Registrant's periodic report on Form N-CSR for the period ended October 31, 2018 (the "Form N-CSR") fully complies with the requirements of Section 13(a) or 15(d) of the Securities Exchange Act of 1934, as amended; and |
| 2) | The information contained in the Form N-CSR fairly presents, in all material respects, the financial condition and results of operations of the Registrant. |
| Principal Executive Officer | Principal Financial Officer |
| AMERICAN FUNDS GLOBAL BALANCED FUND | AMERICAN FUNDS GLOBAL BALANCED FUND |
| /s/ Herbert Y. Poon | /s/ Brian D. Bullard |
| Herbert Y. Poon, Executive Vice President | Brian D. Bullard, Treasurer |
| Date: December 31, 2018 | Date: December 31, 2018 |
A signed original of this written statement required by Section 906 of the Sarbanes-Oxley Act of 2002 has been provided to AMERICAN FUNDS GLOBAL BALANCED FUND and will be retained by AMERICAN FUNDS GLOBAL BALANCED FUND and furnished to the Securities and Exchange Commission (the "Commission") or its staff upon request.
This certification is being furnished to the Commission solely pursuant to 18 U.S.C. Section 1350 and is not being filed as part of the Form N-CSR filed with the Commission.
Create E-mail Alert Related Categories
SEC FilingsRelated Entities
The Capital Group CompaniesSign up for StreetInsider Free!
Receive full access to all new and archived articles, unlimited portfolio tracking, e-mail alerts, custom newswires and RSS feeds - and more!
