

Form 8-K/A Chicken Soup for the For: Apr 05
 Tweet
Tweet Share
Share
UNITED STATES
SECURITIES AND EXCHANGE COMMISSION
WASHINGTON, D.C. 20549
FORM 8-K/A
(AMENDMENT NO. 1)
CURRENT REPORT
PURSUANT TO SECTION 13 OR 15(d) OF THE
SECURITIES EXCHANGE ACT OF 1934
Date of Report (Date of earliest event reported): April 5, 2021
| Chicken Soup for the Soul Entertainment Inc. |
| (Exact Name of Registrant as Specified in Charter) |
| Delaware | 001-38125 | 81- 2560811 | ||
|
(State or Other Jurisdiction of Incorporation) |
(Commission File Number) |
(IRS Employer Identification No.) |
| 132 E. Putnam Avenue, Floor 2W, Cos Cob, CT | 06807 | |
| (Address of Principal Executive Offices) | (Zip Code) |
Registrant’s telephone number, including area code: (855) 398-0443
| N/A |
| (Former Name or Former Address, if Changed Since Last Report) |
Check the appropriate box below if the Form 8-K filing is intended to simultaneously satisfy the filing obligation of the Registrant under any of the following provisions (see General Instruction A.2. below):
| ¨ | Written communications pursuant to Rule 425 under the Securities Act (17 CFR 230.425) |
| ¨ | Soliciting material pursuant to Rule 14a-12 under the Exchange Act (17 CFR 240.14a-12) |
| ¨ | Pre-commencement communications pursuant to Rule 14d-2(b) under the Exchange Act (17 CFR 240.14d-2(b)) |
| ¨ | Pre-commencement communications pursuant to Rule 13e-4(c) under the Exchange Act (17 CFR 240.13e 4(c)) |
Indicate by check mark whether the registrant is an emerging growth company as defined in Rule 405 of the Securities Act of 1933 (§230.405 of this chapter) or Rule 12b-2 of the Securities Exchange Act of 1934 (§240.12b-2 of this chapter).
Emerging growth company x
If an emerging growth company, indicate by check mark if the registrant has elected not to use the extended transition period for complying with any new or revised financial accounting standards provided pursuant to Section 13(a) of the Exchange Act. ¨
Securities registered pursuant to Section 12(b) of the Act:
| Title of each class | Ticker symbol(s) | Name of each exchange on which registered | ||
| Class A Common Stock, $0.0001 par value per share | CSSE | The Nasdaq Stock Market LLC | ||
| 9.75% Series A Cumulative Redeemable Perpetual Preferred Stock, $0.0001 par value per share | CSSEP | The Nasdaq Stock Market LLC | ||
| 9.50% Notes due 2025 | CSSEN | The Nasdaq Stock Market LLC |
| Item 7.01. | Regulation FD Disclosure. |
Attached as Exhibit 99.1 to this Current Report on Form 8-K is an updated investor presentation that Chicken Soup for the Soul Entertainment Inc. (the “Company”) plans to use for public relations and other purposes. The presentation updates in its entirety the investor presentation filed by the Company under cover of Form 8-K on April 5, 2021.
The information furnished under this Item 7.01, including the exhibit related thereto, shall not be deemed “filed” for purposes of Section 18 of the Securities Exchange Act of 1934, as amended, nor shall it be deemed incorporated by reference in any disclosure document of the Company, except as shall be expressly set forth by specific reference in such document.
| Item 9.01. | Financial Statements and Exhibits. |
(d) Exhibits:
| Exhibit No. | Description | |
| 99.1 | Investor Presentation. |
SIGNATURE
Pursuant to the requirements of the Securities Exchange Act of 1934, the registrant has duly caused this report to be signed on its behalf by the undersigned hereunto duly authorized.
| Dated: | April 6, 2021 | CHICKEN SOUP FOR THE SOUL ENTERTAINMENT INC. |
| By: | /s/ William J. Rouhana, Jr. | |
| Name: William J. Rouhana, Jr. | ||
| Title: Chief Executive Officer |
Exhibit 99.1

INVESTOR PRESENTATION APRIL 2021

2 Forward - looking Statements This presentation (the “Presentation”) relates to Chicken Soup for the Soul Entertainment, Inc . (“CSS Entertainment”, “CSSE”, or the “Company ”) . This presentation contains various information and projections regarding the Company’s business, including its operations through Crackle Plus, a company wholly owned by CSSE, and Landmark Studio Group a majority owned subsidiary of CSSE . There are risks involved in the joint ventures and the Company’s business generally, including those discussed in the Company’s Annual Report on Form 10 - K for the year ended December 31 , 2020 , and the Company’s other filings that have been made and will be made with the SEC . Financial information for the year ended December 31 , 2020 is derived from our Annual Report on Form 10 - K as filed with the SEC on March 31 , 2021 . This Presentation includes “forward - looking statements” and projections . CSS Entertainment’s actual results may differ from its expectations, estimates and projections and, consequently, you should not rely on these forward looking statements or projections as predictions of future events . Words such as “expect,” “estimate,” “project,” “budget,” “forecast,” “anticipate,” “intend,” “plan,” “may,” “will,” “could,” “should,” “believes,” “predicts,” “potential,” “continue,” and similar expressions are intended to identify such forward - looking statements . These forward - looking statements and projections include, without limitation, estimates and projections of future performance, which are based on numerous assumptions about sales, margins, competitive factors, industry performance and other factors which cannot be predicted . Such assumptions involve a number of known and unknown risks, uncertainties, and other factors, many of which are outside of the Company’s control, including, among other things : our core strategy ; operating income and margin ; seasonality ; liquidity, including cash flows from operations, available funds and access to financing sources ; free cash flows ; revenues ; net income ; profitability ; stock price volatility ; future regulatory changes ; pricing changes ; the ability of the company’s content offerings to achieve market acceptance, the company’s success in retaining or recruiting officers, key employees, or directors ; the ability to protect intellectual property, the ability to complete strategic acquisitions, the ability to manage growth and integrate acquired operations ; the ability to pay dividends, regulatory or operational risks, and general market conditions impacting demand for the Company’s services . For a more complete description of these and other risks and uncertainties, please refer to the Company’s 10 - K filed with the SEC on March 31 , 2021 . Should one or more of these material risks occur or should the underlying assumptions change or prove incorrect, the actual results of operations are likely to vary from the projections and the variations may be material and adverse . The forward - looking statements and projections herein should not be regarded as a representation or prediction that CSS Entertainment will achieve or is likely to achieve any particular results . CSS Entertainment cautions readers not to place undue reliance upon any forward - looking statements and projections, which speak only as of the date made . CSS Entertainment does not undertake or accept any obligation or undertaking to release publicly any updates or revisions to any forward - looking statements to reflect any change in its expectations or any change in events, conditions or circumstances on which any such statement is based . All registered or unregistered service marks, trademarks and trade names referred to in this Presentation are the property of their respective owners, and CSS Entertainment’s use herein does not imply an affiliation with, or endorsement by, the owners of these service marks, trademarks or trade names .

COMPANY OVERVIEW

4 What is TV Today? TOTAL UNIVERSE 120M TV HOUSEHOLDS (U.S.) CORD “Converters” 1 THE FALSE PROMISE OF vMVPDS 2 Once promising consumers skinny bundles at an affordable price, this is no longer the case 52% of cord cutters don’t miss anything about Cable/Satellite 52% of cord cutters don’t miss anything about Cable/Satellite 2 Americans are willing to subscribe to 3.6 services THE PROLIFERATION OF SVODS 3 SVOD subscribers’ greatest frustrations: 87% it’s all becoming too expensive 4 67% toggling between services 4 45% “not being able to find content” 4 SUBSCRIPTION FATIGUE 4 45M cord cutters in 2020 1 ~45M cord “converters” in 2020 1 55M in 2022 1 ~55M in 2022 1 Americans are willing to subscribe to 3.6 services 3 A Fragmented, Expensive, and Confusing Experience for the Consumer (1) eMarketer, July 2018 (2) eMarketer , April 2019 (3) Wall Street Journal, November 2019 (4) Forbes, October 2019
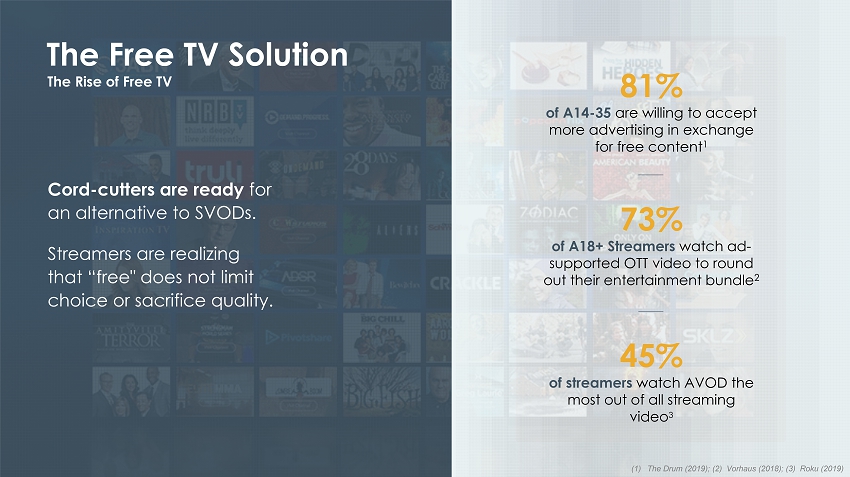
5 Cord - cutters are ready for an alternative to SVODs. Streamers are realizing that “free" does not limit choice or sacrifice quality. The Free TV Solution The Rise of Free TV 81% of A14 - 35 are willing to accept more advertising in exchange for free content 1 45% of streamers watch AVOD the most out of all streaming video 3 73% of A18+ Streamers watch ad - supported OTT video to round out their entertainment bundle 2 (1) The Drum (2019); (2) Vorhaus (2018); (3) Roku (2019)
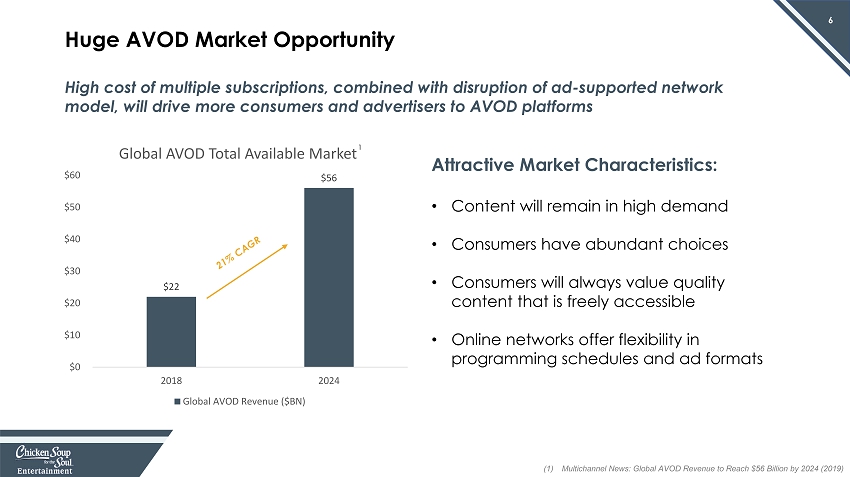
6 High cost of multiple subscriptions, combined with disruption of ad - supported network model, will drive more consumers and advertisers to AVOD platforms Huge AVOD Market Opportunity $22 $56 $0 $10 $20 $30 $40 $50 $60 2018 2024 Global AVOD Total Available Market Global AVOD Revenue ($BN) Attractive Market Characteristics: • Content will remain in high demand • Consumers have abundant choices • Consumers will always value quality content that is freely accessible • Online networks offer flexibility in programming schedules and ad formats (1) Multichannel News: Global AVOD Revenue to Reach $56 Billion by 2024 (2019) 1

7 Chicken Soup for the Soul Entertainment Investment Highlights Significant market opportunity in streaming VOD CSSE operates leading AVOD networks Cost - effective content distribution and production engine Solid balance sheet with Sony Pictures as prominent investor AN EARLY AVOD LEADER Self - sustaining, high growth business model
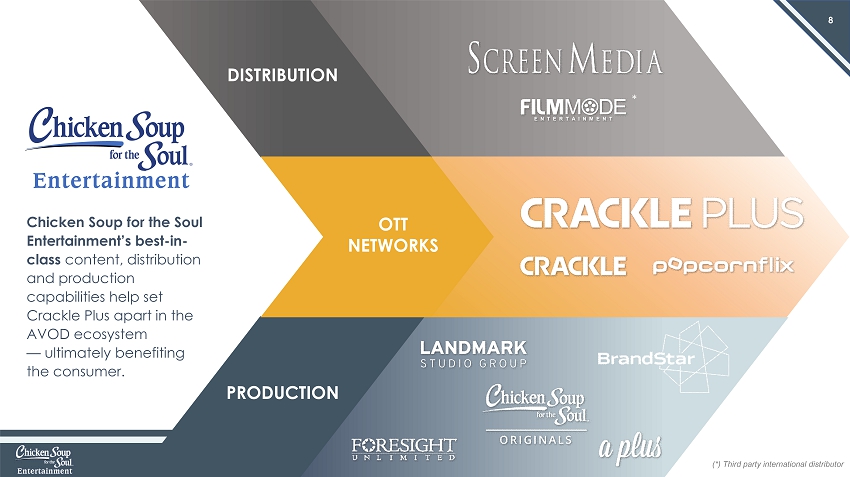
8 DISTRIBUTION OTT NETWORKS PRODUCTION Chicken Soup for the Soul Entertainment’s best - in - class content, distribution and production capabilities help set Crackle Plus apart in the AVOD ecosystem — ultimately benefiting the consumer. (*) Third party international distributor *

9 Self - Sustaining AVOD Network Model ADD AVOD NETWORKS EXPLOIT CONTENT UNIFIED AD PLATFORM ENGAGE PARTNERSHIPS BUILD VALUABLE LIBRARY ACQUIRE AND RETAIN VIEWERS

10 Crackle Plus: Leading Family of AVOD Networks 7 ad - supported video - on - demand networks including Crackle & Popcornflix Top - 5 Network on the industry leading Roku Platform Available on all major streaming platforms and smart TVs including 500,000 Marriott hotel room screens through LG 1 (1) Internal company data (2) Needham (Laura Martin) 12/3/19 : Raising Roku PT to $200. Buy on Dips (3) Rankings based on Roku TV app platform Top Ad - Supported Channels 2,3 1. 2. 3. 4. 5. Crackle received Cynopsis Model D Award as the Best Ad - Supported Video Service

11 Strong Competitive Position 6% 6% 4% 4% 3% 3% 2% 2% 1% 1% 1% 1% 1% 1% 1% 1% 1% 0% 1% 2% 3% 4% 5% 6% 7% Use of Ad - Based OTT Video Services (2018 - 2019) 1 (1) Parks Report: 360 Deep Dive - Ad - Supported OTT : Viewers and Use % of Survey Respondents Indicating Use of Specified OTT Service Over the Past 30 Days

12 We Reach TV’s Lost Generation 33 A18-34 Comp A25-34 Comp 48% 38% 7% 14% 9% 9% vs. MEDIAN AGE 58 Broadcast Crackle Plus Broadcast Ad - Supported Cable 54 Ad - Supported Cable A Higher Concentration of Younger Viewers (1) Nielson Digital Ad Ratings (2020) 1

13 Cost - Effective Distribution & Production Engine With Critical Mass of Content • Original production budgets are a major challenge across VOD industry • Our cost - effective, scalable distribution and production gives us a competitive edge • Innovative production partnerships provide access to proven creative talent • Crackle Plus benefits from valuable library with 80K hours of owned and licensed programming including popular Sony TV and film content % of ad impressions of Originals and Exclusives 2Q20 1 Q20 4Q19 3Q19

14 Case Study: Going From Broke • #1 title on the Crackle Network • 262M + minutes streamed as of 11/13/20 • 16.8M + streams to date • De - risked and cost - effective production model • Production cost 100% paid for by sponsors in advance of production • Ad revenue is 5x+ marketing costs • Greenlit for a second season • 11 award nominations and eight award wins including People’s Voice Winner for Reality Series for Webby Awards
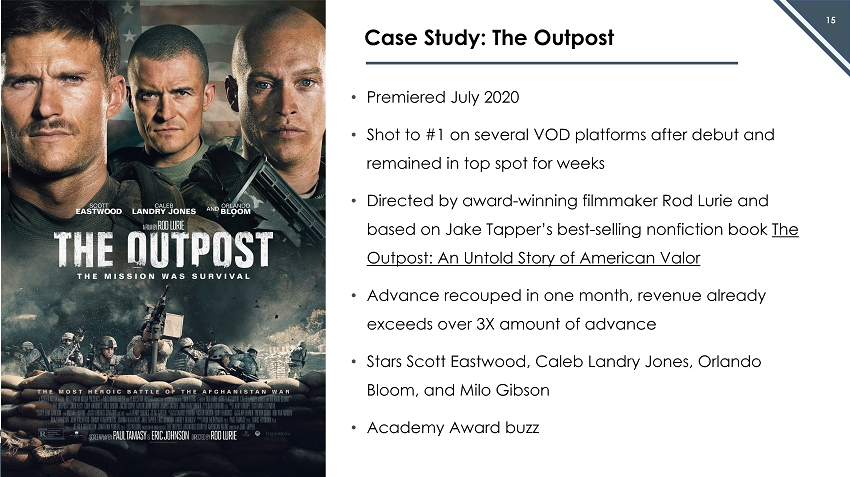
15 Case Study: The Outpost • Premiered July 2020 • Shot to #1 on several VOD platforms after debut and remained in top spot for weeks • Directed by award - winning filmmaker Rod Lurie and based on Jake Tapper’s best - selling nonfiction book The Outpost: An Untold Story of American Valor • Advance recouped in one month, revenue already exceeds over 3X amount of advance • Stars Scott Eastwood, Caleb Landry Jones, Orlando Bloom, and Milo Gibson • Academy Award buzz
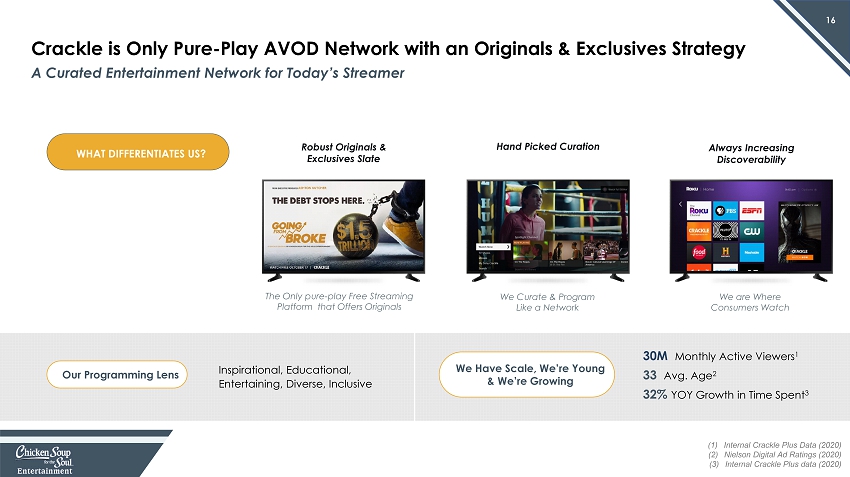
16 Crackle is Only Pure - Play AVOD Network with an Originals & Exclusives Strategy WHAT DIFFERENTIATES US? 30 M Monthly Active Viewers 1 33 Avg. Age 2 32% YOY Growth in Time Spent 3 We Curate & Program Like a Network The Only pure - play Free Streaming Platform that Offers Originals We are Where Consumers Watch Hand Picked Curation Robust Originals & Exclusives Slate Always Increasing Discoverability Our Programming Lens Inspirational, Educational, Entertaining, Diverse, Inclusive We Have Scale, We’re Young & We’re Growing A Curated Entertainment Network for Today’s Streamer (1) Internal Crackle Plus Data (2020) (2) Nielson Digital Ad Ratings (2020) (3) Internal Crackle Plus data (2020)

17 Our team hand - selects top - tier series and movies from Sony and all of the biggest Hollywood studios We’re the only Free TV service with original long - form programming and first - run movies direct from the theater Aggregation: Premium Licensed Content Curation: Originals & Exclusives & Our Programming Strategy: Aggregation with Curation Originals, Exclusives, and Top - Tier Licensed Content

18 Crackle Originals & Exclusives: Programming Calendar Grand Isle Thriller Feature The Sonata Thriller Feature The Clearing Zombie Feature (Original) Today’s Homeowner DIY Series Corporate Animals Comedy Feature Robert the Bruce Drama Feature Elliot the Littlest Reindeer Holiday Feature A Reindeer’s Journey Family Feature Cleanin ’ Up the Town Documentary Feature (Original Movie) Blood and Money Drama Feature Exit Plan Thriller Feature August September October November December July January February Black Water Abyss Thriller Cagefighter Feature Film Spides Sci - fi Thriller

19 Diverse and Targeted Ad Sales Strategy DIRECT SALES PROGRAMMATIC LOCAL RESELLERS Direct to brand across all of our AVOD networks with data driven consumer targeting capabilities OTT has been an enhancement for the local resellers, and we provide these operators with local geo targeted ad supply Offer advertisers access to premium long form video in real time across our network We’re data driven, with results Multiple ad sales channels drive supply and demand optionality 51% 38% 11% Percent of ad sales 1 (1) Percent of ad sales from July 2019 – May 2020

20 New Ad Experiences: The “ Jumbotron ” and “ FreeView ” • As soon as a viewer enters the Crackle app, the content auto plays (with sound) on the welcome screen • When a viewer starts a title, they’ll see a co - branded slate prompting them to watch ONE :30s ad in order to receive NO ADS the rest of the title . If they choose to not engage, they will receive a regular ad load • Guaranteed User Engagement • Proven Brand Recall via custom brand study 1 THE “FREEVIEW” VIEWER EXPERIENCE THE ADVERTISER EXPERIENCE THE “JUMBOTRON” VIEWER EXPERIENCE THE ADVERTISER EXPERIENCE • Client will be featured in the most premium placement (tile #1) on Crackle in the “Spotlight Channel” • Additional content can be featured in a custom channel I nnovative ways to improve viewers’ ad experience and increase engagement at the same time (1) TrueX Proprietary Research, 2020

21 Growth Path in 2021 – New Distribution Expanding the Crackle & Popcornflix experience on VOD and linear platforms Launching New VOD and Linear Streaming Services IN DISCUSSIONS with a Number of Additional Platforms Crackle Original Going From Broke
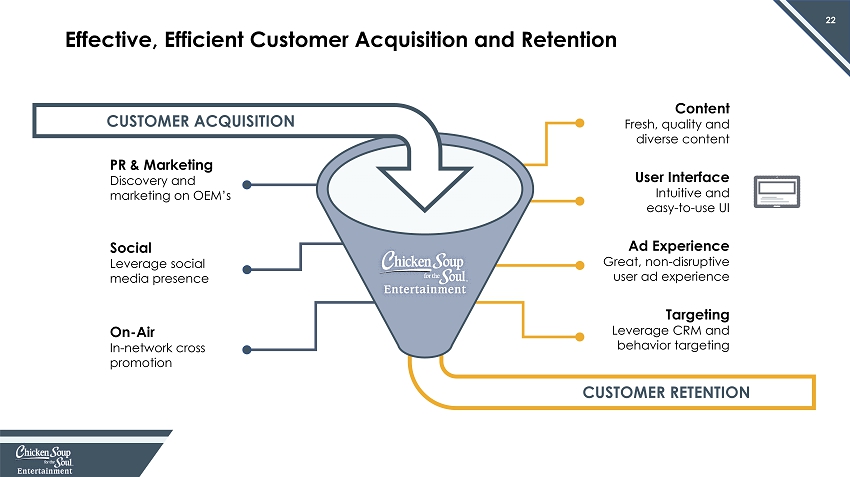
22 Effective, Efficient Customer Acquisition and Retention PR & Marketing Discovery and marketing on OEM’s Social Leverage social media presence On - Air In - network cross promotion Content Fresh, quality and diverse content User Interface Intuitive and easy - to - use UI Ad Experience Great, non - disruptive user ad experience Targeting Leverage CRM and behavior targeting CUSTOMER ACQUISITION CUSTOMER RETENTION

23 Strategy to Drive Long - Term Free Cash Flow Growth ADD AVOD NETWORKS EXPLOIT CONTENT UNIFIED AD PLATFORM ENGAGE PARTNERSHIPS BUILD VALUABLE LIBRARY Building a Next - generation Broadcast Network • Produce low - cost originals • Acquire exclusive content • Expand production partnerships • Execute library acquisitions • Integrate ad platform • Grow sales force • Increase eCPMs across networks • Acquire networks • Develop thematic networks • Grow and retain viewers Content Audience Advertising

24 Why We Are Positioned to Win Healthy balance sheet Large and growing content library includes extensive Sony content Cost - effective distribution & production engine Comprehensive, integrated ad platform Leadership position in AVOD with Crackle Plus Rapidly growing and fragmented VOD market with consolidation opportunity

FINANCIAL SUMMARY

26 Operating Results $1.5 $8.1 $10.9 $27.8 $55.3 $68.2 2015 2016 2017 2018 2019 2020 $ in millions Revenue $0.0 $3.8 $4.0 $10.0 $6.0 $11.8 2015 2016 2017 2018 2019 2020 Adjusted EBITDA (1) See our Annual Report on Form 10 - k filed March 31, 2021 (2) (2) See slide 29 for details regarding Adjusted EBITDA and reconciliation for comparable GAAP measures (1)

27 Full Year 2020 Results $ in millions $56.6 $68.2 Revenue Adjusted EBITDA 2019 $6.0 $11.8 2020 2019 2020 (1) See our Annual Report on Form 10 - k filed March 31, 2021 (2) (2) See slide 29 for details regarding Adjusted EBITDA and reconciliation for comparable GAAP measures (1)

28 $156.3 $91.2 $33.6 $65.1 Balance Sheet Total Assets Solid balance sheet as of 12/31/20 Total Equity (1) See Form 10 - K for the year ended December 31,2020 (1) $ in millions Debt Total Liabilities (incl. Debt)

29 Our consolidated financial statements are prepared in accordance with generally accepted accounting principles in the United Sta tes (“U.S. GAAP”). We use a non - GAAP financial measure to evaluate our results of operations and as a supplemental indicator of our operating performance. The non - GAAP financial measure that we use is Adjusted EBITDA. Adjusted EBITDA (as defined below) is considered a non - GAAP financial measure as defined by Regulation G promulgated by the SEC under the Securities Act of 1933, as amended. Due to the significance of non - cash, non - recurring, and acquisition related expenses recognized for the year ended December 31, 2020, and the likelihood of material non - cash, nonrecurring, and acquisition related expenses to occur in future periods, we believe that this non - GAAP financial measure enhances the understanding of our historical and curren t financial results as well as provides investors with measures used by management for the planning and forecasting of future periods, as well as for measuring performance for compensation of executives and other members of management. Further, we believe that Adjusted EBITDA enables our board of directors and management to analyze and evaluate financial and strategic pl anning decisions that will directly affect operating decisions and investments. We believe this measure is an important indicator of our operational strength and performance of our busines s b ecause it provides a link between operational performance and operating income. It is also a primary measure used by management in evaluating companies as potential acquisition target s. We believe the presentation of this measure is relevant and useful for investors because it allows investors to view performance in a manner similar to the method used by management. We be lieve it helps improve investors’ ability to understand our operating performance and makes it easier to compare our results with other companies that have different capital structures or tax rates. In addition, we believe this measure is also among the primary measures used externally by our investors, analysts and peers in our industry for purposes of valuation and compa rin g our operating performance to other companies in our industry. The presentation of Adjusted EBITDA should not be construed as an inference that our future results will be unaffected by unu sua l, infrequent or non - recurring items or by non - cash items. This non - GAAP financial measure should be considered in addition to, rather than as a substitute for, our actual operating results in cluded in our condensed consolidated financial statements. We define Adjusted EBITDA as consolidated operating income (loss) adjusted to exclude interest, taxes, depreciation, amortiza tio n, acquisition - related costs, consulting fees related to acquisitions, dividend payments, non - cash share - based compensation expense, and adjustments for other unusual and infrequent in nature identified charges. Adjusted EBITDA is not an earnings measure recognized by US GAAP and does not have a standardized meaning prescribed by GAAP; accordingly, Adjusted EBI TDA may not be comparable to similar measures presented by other companies. We believe Adjusted EBITDA to be a meaningful indicator of our performance that provides useful in formation to investors regarding our financial condition and results of operations. The most comparable GAAP measure is operating income. Adjusted EBITDA has important limitations as an analytical tool, and you should not consider it in isolation or as a substitu te for analysis of our results as reported under GAAP. Some of these limitations are: • Adjusted EBITDA does not reflect our cash expenditures or future requirements for capital expenditures or contractual commitm ent s; • Adjusted EBITDA does not reflect changes in, or cash requirements for, our working capital needs; • Adjusted EBITDA does not reflect the effects of preferred dividend payments, or the cash requirements necessary to fund; • Although amortization and depreciation are non - cash charges, the assets being depreciated will often have to be replaced in the future, and Adjusted EBITDA does not reflect any future cash requirements for such replacements; • Adjusted EBITDA does not reflect the impact of stock - based compensation upon our results of operations; • Adjusted EBITDA does not reflect the significant interest expense, or the cash requirements necessary to service interest or pri ncipal payments on our debt; • Adjusted EBITDA does not reflect our income tax (benefit) expense or the cash requirements to pay our income taxes; • Adjusted EBITDA does not reflect the impact of acquisition related expenses; and the cash requirements necessary; • Adjusted EBITDA does not reflect the impact of other non - recurring, infrequent in nature and unusual expenses; and • Other companies in our industry may calculate Adjusted EBITDA differently than we do, limiting its usefulness as a comparativ e m easure. Non - GAAP Financial Measures

30 Year Ended December 31, Year Ended December 31, 2020 2019 General: Net loss available to common stockholders, as reported $ (44,552,353) $ (34,976,816) Preferred dividends 4,142,376 3,304,947 Provision for income taxes & other taxes 411,600 1,045,205 Interest expense 2,222,106 811,017 Share - based compensation expense (1) 1,131,515 1,061,926 All other nonrecurring costs 1,789,569 276,400 Film Library: Film library and program rights amortization, included in cost of revenue (non - cash) (2) 23,563,772 10,683,227 Reserve for bad debt & video returns 3,385,584 2,669,699 Crackle Plus - Related: Acquisition - related costs and other one - time consulting fees (3) 98,926 3,968,227 Amortization 17,317,247 13,293,279 Transitional Expenses (4) 4,353,345 3,505,855 Adjusted EBITDA $ 11,751,579 $ 5,953,528 Non - GAAP Financial Measures Continued (1) Represents expense related to common stock equivalents issued to certain employees and officers under the Long - Term Incentive Pl an, as well as common stock grants issued to employees and non - employee directors . ( 2) Represents amortization of our film library, which include cash and non - cash amortization of our initial film library investm ents, participation costs and theatrical release costs as well as amortization for our acquired program rights. ( 3 ) Represents aggregate transaction - related costs, including legal fees, accounting fees, investment advisory fees and various cons ulting fees. (4) Represents transitional related expenses primarily associated with the Crackle Plus business combination and our Company stra teg ic shift related to our production business. Costs include primarily non - recurring payroll and related expenses and redundant non - recurring technology costs.
THANK YOU
Serious News for Serious Traders! Try StreetInsider.com Premium Free!
You May Also Be Interested In
- ADOCIA Announces Full Year 2023 Financial Results and Provides a Corporate and Financial Update
- Centurion Identifies High Quality Gold Target-Casa Berardi West Project; Acquires Additional Claims
- Interim Report for Q1 2024
Create E-mail Alert Related Categories
SEC FilingsSign up for StreetInsider Free!
Receive full access to all new and archived articles, unlimited portfolio tracking, e-mail alerts, custom newswires and RSS feeds - and more!
