

Form 8-K WELLTOWER INC. For: Jan 24
 Tweet
Tweet Share
Share

Exhibit 99.1 Business Update January 24, 2022

Forward Looking Statements and Risk Factors This document contains “forward-looking statements” as defined in the Private Securities Litigation Reform Act of 1995. When Welltower uses words such as “may,” “will,” “intend,” “should,” “believe,” “expect,” “anticipate,” “project,” “pro forma,” “estimate” or similar expressions that do not relate solely to historical matters, Welltower is making forward-looking statements. Forward-looking statements, including statements related to Funds From Operations guidance, are not guarantees of future performance and involve risks and uncertainties that may cause Welltower’s actual results to differ materially from Welltower’s expectations discussed in the forward-looking statements. This may be a result of various factors, including, but not limited to: the successful completion of the transactions; the duration and scope of the COVID-19 pandemic; the impact of the COVID-19 pandemic on occupancy rates and on the operations of Welltower and its operators/tenants; actions governments take in response to the COVID-19 pandemic, including the introduction of public health measures and other regulations affecting Welltower’s properties and the operations of Welltower and its operators/tenants; uncertainty regarding the implementation and impact of the CARES Act and future stimulus or other COVID-19 relief legislation; the effects of health and safety measures adopted by Welltower and its operators/tenants related to the COVID-19 pandemic; increased operational costs as a result of health and safety measures related to COVID-19; the impact of the COVID-19 pandemic on the business and financial condition of operators/tenants and their ability to make payments to Welltower; disruptions to Welltower's property acquisition and disposition activity due to economic uncertainty caused by COVID-19; general economic uncertainty in key markets as a result of the COVID-19 pandemic and a worsening of global economic conditions or low levels of economic growth; the status of capital markets, including availability and cost of capital; issues facing the health care industry, including compliance with, and changes to, regulations and payment policies, responding to government investigations and punitive settlements and operators’/tenants’ difficulty in cost effectively obtaining and maintaining adequate liability and other insurance; changes in financing terms; competition within the health care and seniors housing industries; negative developments in the operating results or financial condition of operators/tenants, including, but not limited to, their ability to pay rent and repay loans; Welltower’s ability to transition or sell properties with profitable results; the failure to make new investments or acquisitions as and when anticipated; natural disasters and other acts of God affecting Welltower’s properties; Welltower’s ability to re-lease space at similar rates as vacancies occur; Welltower’s ability to timely reinvest sale proceeds at similar rates to assets sold; operator/tenant or joint venture partner bankruptcies or insolvencies; the cooperation of joint venture partners; government regulations affecting Medicare and Medicaid reimbursement rates and operational requirements; liability or contract claims by or against operators/tenants; unanticipated difficulties and/or expenditures relating to future investments or acquisitions; environmental laws affecting Welltower’s properties; changes in rules or practices governing Welltower’s financial reporting; the movement of U.S. and foreign currency exchange rates; Welltower’s ability to maintain Welltower’s qualification as a REIT; key management personnel recruitment and retention; and other risks described in Welltower’s reports filed from time to time with the SEC. Finally, Welltower undertakes no obligation to update or revise publicly any forward-looking statements, whether because of new information, future events or otherwise, or to update the reasons why actual results could differ from those projected in any forward-looking statements. 2

Recent Highlights (1) Expect 4Q21 net income attributable to common stockholders below previously issued guidance range of $0.20 - $0.25 per diluted share • Delayed timing of asset dispositions resulted in lower than expected gain on sale during the period; dispositions expected to be completed in 1Q22 as opposed to 4Q21 Per previous business update issued January 11, 2022 (1) Continue to anticipate 4Q2021 normalized funds from operations (FFO) of $0.78 - $0.83 per diluted share • Experienced a sudden late-quarter increase in COVID-related testing and PPE expenses and an extraordinary rise in labor costs resulting from the surge in COVID-19 cases • Outsized fourth quarter expense growth offset, in part, by approximately $12 million received in 4Q2021 from the HHS Provider Relief Fund which was not previously contemplated in guidance • Fourth quarter average occupancy growth modestly exceeded guidance of 140bps • Completed $1.4 billion in pro rata gross investments(2) during the quarter at an expected unlevered IRR in the high single digit range Observations on Recent Global Surge in COVID-19 • Trailing two-week resident case counts have recently increased, though few hospitalizations have been reported due to high vaccination rates and efficacy of vaccines • Nearly all residents and staff are vaccinated with the majority of residents having received a booster • COVID-related expenses, including testing and the procurement of PPE, began to increase later in the fourth quarter as communities prepared for the anticipated surge in COVID-19 • While the utilization of contract and third-party agency labor showed signs of stabilization earlier in the fourth quarter, the latest surge in global COVID-19 cases has resulted in a material increase in the reliance on agency staff Continued Momentum in Seniors Housing Occupancy Growth in 4Q2021 (3) • SHO portfolio spot occupancy increased approximately 70bps during the fourth quarter to 77.7% ; average occupancy growth modestly exceeded guidance of 140bps • Prior to the COVID-19 pandemic, average sequential occupancy growth has historically been flat between the third and fourth quarters owing to headwinds including the holiday season, weather related challenges, and seasonal flu • Seniors Housing (SH) demand remained resilient in the US which reported a spot occupancy gain of approximately 90bps during the fourth quarter • Canada reported a second consecutive quarter of spot occupancy gains, rising 30bps during the fourth quarter • The UK reported a 150bps spot occupancy gain excluding the impact of the previously announced transition of 45 properties from Sunrise UK to Care UK and Signature Senior Lifestyle effective December 1, 2021. • Inclusive of the impact of the 45 transition properties, UK spot occupancy declined 20bps and total portfolio occupancy increased approximately 65bps • Move-in activity and lead generation remained ahead of pre-COVID levels in 4Q2021 The Outlook for SHO Portfolio Remains Favorable • Pricing power remains healthy as reflected by strong renewal rate increases in January. Operators remain encouraged by outlook for rate growth which is expected to mitigate potential expense pressures • Post-COVID operating margins expected to inflect meaningfully higher following normalization of cost environment • Strong revenue growth continues to be expected in 2022, driven by accelerating pricing power and continued occupancy growth in the seniors housing business 1. See Supplemental Financial Measures at the end of this presentation for reconciliations and Welltower Earnings Release dated November 4, 2021 2. Excluding development funding 3 3. Spot occupancy represents approximate month end occupancy at our share for 546 properties in operation as of December 31, 2020, including unconsolidated properties but excluding acquisitions, executed dispositions, development conversions, one property closed for redevelopment, and excludes the impact of the previously announced transition of 45 properties from Sunrise UK to Care UK and Signature Senior Lifestyle effective December 1, 2021

Recent Highlights | Investment and Balance Sheet Update Per previous business update issued January 11, 2022 Investment Activity (1) • During the fourth quarter, closed on $1.4 billion in pro rata investments , the majority of which closed late in the quarter, at an expected initial yield of 5%; expected unlevered IRR in the high single digit range • Includes approximately $900 million related to previously announced $1.3 billion in definitive agreements; remainder expected to close in 1Q2022 • Capital deployment remains granular with 13 transactions encompassing 46 properties across Seniors Housing Operating, Seniors Housing Triple-Net and Outpatient Medical operating segments with median transaction value of $68 million (1) • Since October 2020, closed or entered into definitive agreements to acquire $6.1 billon of pro rata investments at an expected initial yield of 6.1% and an expected year-3 yield of approximately 8.2% • In addition to previously announced definitive agreements, WELL’s near-term capital deployment pipeline remains robust, in excess of $1.0 billion ▪ Acquisition opportunity set continues to expand with many owners of SH communities seeking exits as nearly two years of COVID-19 related challenges have been further exacerbated by recent labor market pressure and the global surge in COVID-19 cases Balance Sheet and Corporate Activity • Significant capacity for future capital deployment has been created via unsettled forward sale ATM proceeds and expected disposition proceeds • In November 2021, issued $500 million in 2.75% senior unsecured notes due January 2032, matching WELL’s lowest-ever coupon on a 10-year note • No material unsecured debt maturities until 2024 • WELL continues to invest in resources and talent across numerous functional areas including investments, development, and data analytics to support unprecedented capital deployment opportunities 4 1. Excludes development funding

Seniors Housing Update 5

(1) SHO Portfolio | Occupancy Trends Per previous business update issued January 11, 2022 Occupancy gains have continued through 4Q2021 +50 +0 Total Portfolio US +10 +40 +30 78% +20 78% +100 +80 +80 77% +70 77% +80 76% +60 76% +90 +120 75% 75% +50 +70 74% +50 -80bps 74% +90 +10 73% +50 -60bps 73% 72% 72% 71% 71% 70% Jan Feb Mar Apr May Jun Jul Aug Sep Oct Nov Dec Jan Feb Mar Apr May Jun Jul Aug Sep Oct Nov Dec +110 UK Canada 81% 66% +40 +10 -110bps +120 65% 80% 64% +110 -90 79% +20 +10 -200bps +30 63% +30 +0 +80 -40 +50 -10 62% 78% +0 +0 +10 +90 61% -50 77% 60% 76% 59% 58% 75% Jan Feb Mar Apr May Jun Jul Aug Sep Oct Nov Dec Jan Feb Mar Apr May Jun Jul Aug Sep Oct Nov Dec 1. Spot occupancy represents approximate month end occupancy at our share for 546 properties in operation as of December 31, 2020, including unconsolidated properties but excluding acquisitions, executed dispositions, development conversions, one property closed for redevelopment, and excludes the impact of the previously announced transition of 45 properties from Sunrise UK to Care UK and Signature Senior Lifestyle effective December 1, 2021. Approximate month end spot occupancy is as follows: Total: Jan – 73.5%; Feb – 72.8%; Mar – 72.9%; Apr – 73.5%; May – 73.9% ; Jun – 74.8%; Jul – 75.4%; Aug – 76.1%; Sep – 76.9%; Oct – 77.2%; Nov – 77.6%; Dec – 77.7% US: Jan – 71.6%; Feb – 71.0%; Mar – 71.5%; Apr – 72.4%; May – 73.1%; Jun – 74.3%; Jul – 75.1%; Aug – 76.0%; Sep – 76.9%; Oct – 77.2%; Nov – 77.7%; Dec – 77.8% UK: Jan – 62.3%; Feb – 60.3%; Mar – 59.8%; Apr – 60.7%; May – 60.8% ; Jun – 61.7%; Jul – 61.9%; Aug – 63.1%; Sep – 64.3%; Oct – 64.4%; Nov – 6 64.7%; Dec – 65.8% CA: Jan – 79.9%; Feb – 78.8%; Mar – 77.9%; Apr – 77.5%; May – 77.3%; Jun – 77.3%; Jul – 77.3%; Aug – 77.7%; Sep – 78.0%; Oct – 78.0%; Nov – 78.1%; Dec – 78.3%

(1) SHO Portfolio | Move Ins & Move Outs Per previous business update issued January 11, 2022 Move Ins as % 2019 Move Ins Move Outs as % 2019 Move Outs 120% 120% 112% 111% 106% 104% 102% 101% 99% 99% 99% 100% 100% 95% 94% 90% 90% 90% 89% 88% 87% 87% 86% 84% 81% 80% 80% 74% 67% Recent move in trends remain favorable Move outs remain tempered relative to pre-COVID levels 60% 60% 54% relative to pre-COVID levels 40% 40% 20% 20% 0% 0% 7 1. Move ins and move outs presented at Welltower pro rata share. December move ins and move outs are preliminary
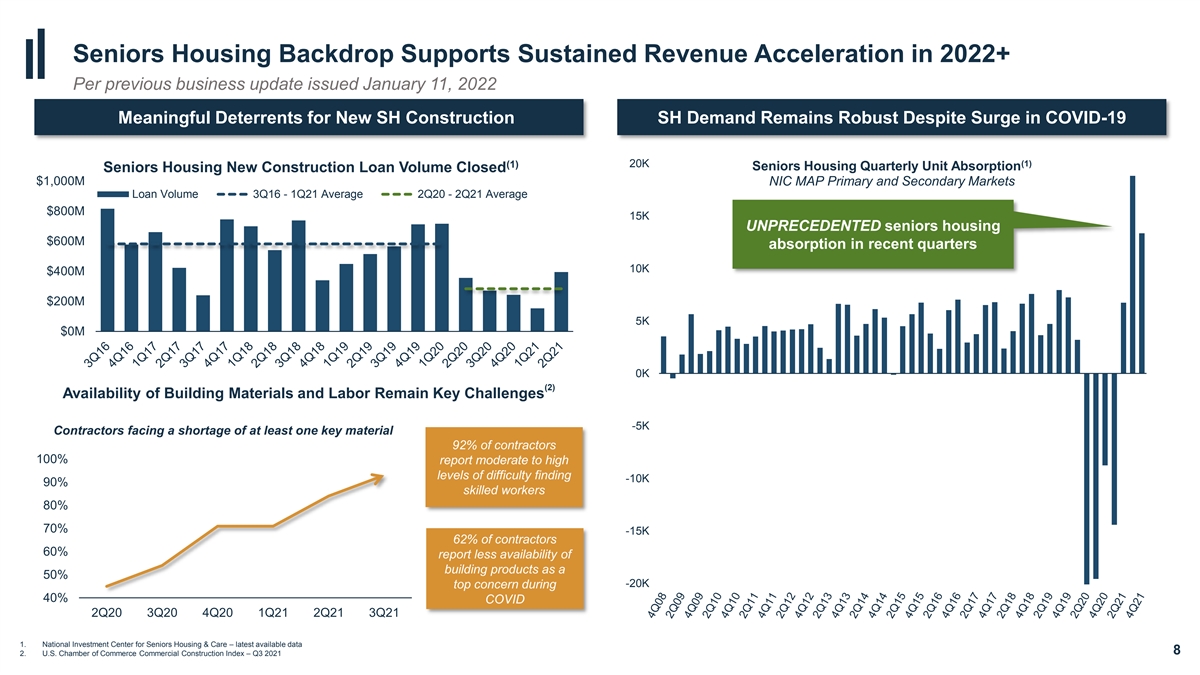
Seniors Housing Backdrop Supports Sustained Revenue Acceleration in 2022+ Per previous business update issued January 11, 2022 Meaningful Deterrents for New SH Construction SH Demand Remains Robust Despite Surge in COVID-19 (1) (1) 20K Seniors Housing Quarterly Unit Absorption Seniors Housing New Construction Loan Volume Closed $1,000M NIC MAP Primary and Secondary Markets Loan Volume 3Q16 - 1Q21 Average 2Q20 - 2Q21 Average $800M 15K UNPRECEDENTED seniors housing $600M absorption in recent quarters 10K $400M $200M 5K $0M 0K (2) Availability of Building Materials and Labor Remain Key Challenges -5K Contractors facing a shortage of at least one key material 92% of contractors 100% report moderate to high levels of difficulty finding -10K 90% skilled workers 80% 70% -15K 62% of contractors 60% report less availability of building products as a 50% -20K top concern during 40% COVID 2Q20 3Q20 4Q20 1Q21 2Q21 3Q21 1. National Investment Center for Seniors Housing & Care – latest available data 8 2. U.S. Chamber of Commerce Commercial Construction Index – Q3 2021

SHO Portfolio | Historical REVPOR Growth vs. Inflation Per previous business update issued January 11, 2022 (1) WELL Pre-COVID REVPOR Growth Exceeded Inflation by an Average of 2% Annually 5% 4% 3% 2% 1% 0% -1% REVPOR decline driven by mix shift; WELL SHO Same Store RevPOR Growth rate growth remained positive for CPI YOY Index individual SH segments RevPOR Growth Average 1Q15 to 1Q20 -2% 9 1. Represents quarterly year-over-year Same Store REVPOR growth percentage. See each quarters respective Supplemental Information Report for a discussion of such supplemental reporting measure as well as the applicable reconciliations

Significant Wealth Accumulation Allows for Greater SH Affordability Per previous business update issued January 11, 2022 Backdrop to drive rate growth remains favorable (3) Home Price Appreciation | 1987 - Present S&P500 | 1981 – Present (1) S&P/Case-Shiller U.S. National Home Price Index 5,000 +12.3% compounded annual return over past 40 years 300 4,000 250 A home purchased in 1987 is …Is now worth (4) worth over 4x more today ~$1 Million 200 3,000 150 2,000 A $10,000 investment 100 made in 1981… 1,000 50 (2) ~80% of seniors 75+ are homeowners 0 0 Seniors Housing is NOT INCOME DEPENDENT; generally funded through ASSET SALES and PERSONAL WEALTH 1. Source: U.S. Census Bureau 2. Source: U.S. Census Bureau, Current Population Survey/Housing Vacancy Survey 3. Source: Bloomberg as of 12/31/2021 10 4. Assumes reinvestment of dividends and annual compounding

(1) Balanced lease structure and WALT mitigates impact of inflationary pressures Per previous business update issued January 11, 2022 Shorter duration leases in SHO portfolio allow for more frequent mark-to-market of rents SHO SH Triple-Net LT/PAC MOB Health System Hospital Li Ofte her Science 16% 9% 7% 24% 3% 3x increase in SHO 33% 3Q 2011 3Q 2021 39% 13% (2) exposure over past 10 years (3) NOI NOI 5% 23% 28% (4) Approximately 2.8 year weighted average lease term 1. WALT: Weighted Average Lease Term 2. Represents annualized NOI as reported in 3Q 2011. See 3Q 2011 Supplemental Information Report for further information 3. Represents in place NOI. See Supplemental Financial Measures at the end of this presentation for further information and reconciliation 4. Assumes 50% of SHO resident agreements reset on January 1 and 50% reset on the anniversary date (6 months). Weighted Average Lease Term/Maturity per 3Q2021 supplemental disclosure: SH NNN = 9 years, LT/PAC = 9 years, Outpatient Medical = 6 years; Health System = 12 years and based upon segment level 3Q2021 11 rental income
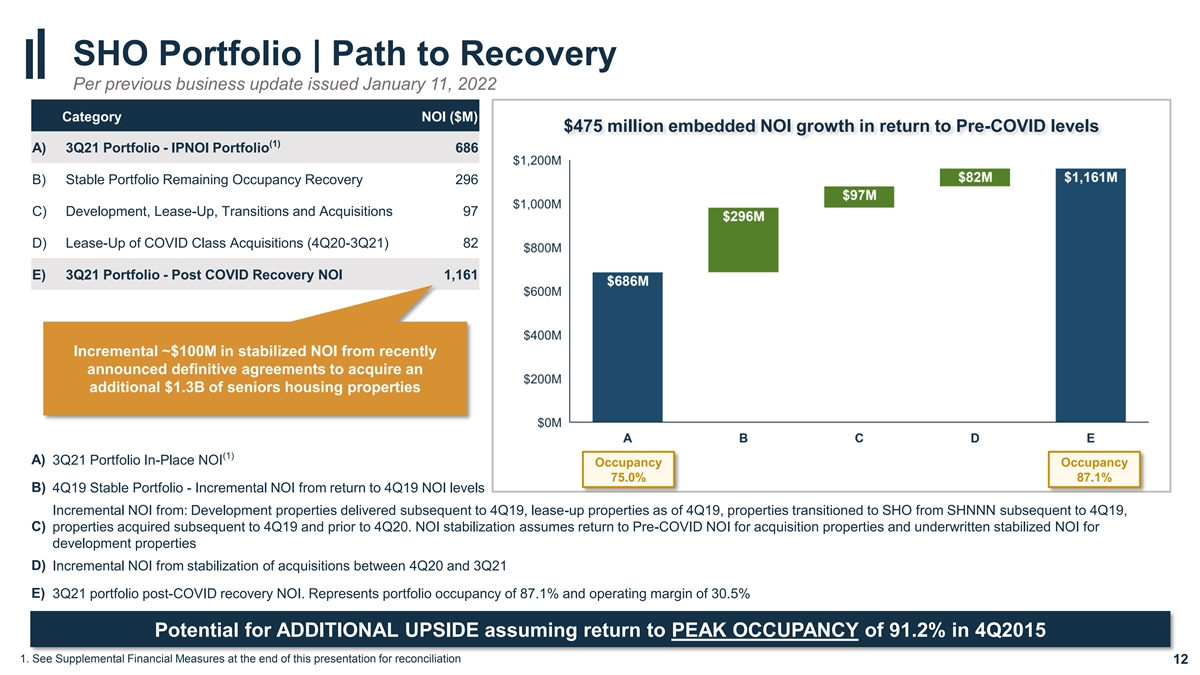
SHO Portfolio | Path to Recovery Per previous business update issued January 11, 2022 Category NOI ($M) $475 million embedded NOI growth in return to Pre-COVID levels (1) A) 3Q21 Portfolio - IPNOI Portfolio 686 B) Stable Portfolio Remaining Occupancy Recovery 296 C) Development, Lease-Up, Transitions and Acquisitions 97 D) Lease-Up of COVID Class Acquisitions (4Q20-3Q21) 82 E) 3Q21 Portfolio - Post COVID Recovery NOI 1,161 Incremental ~$100M in stabilized NOI from recently announced definitive agreements to acquire an additional $1.3B of seniors housing properties (1) A) 3Q21 Portfolio In-Place NOI Occupancy Occupancy 75.0% 87.1% B) 4Q19 Stable Portfolio - Incremental NOI from return to 4Q19 NOI levels Incremental NOI from: Development properties delivered subsequent to 4Q19, lease-up properties as of 4Q19, properties transitioned to SHO from SHNNN subsequent to 4Q19, C) properties acquired subsequent to 4Q19 and prior to 4Q20. NOI stabilization assumes return to Pre-COVID NOI for acquisition properties and underwritten stabilized NOI for development properties D) Incremental NOI from stabilization of acquisitions between 4Q20 and 3Q21 E) 3Q21 portfolio post-COVID recovery NOI. Represents portfolio occupancy of 87.1% and operating margin of 30.5% Potential for ADDITIONAL UPSIDE assuming return to PEAK OCCUPANCY of 91.2% in 4Q2015 1. See Supplemental Financial Measures at the end of this presentation for reconciliation 12

Capital Deployment Update 13

Capital Deployment Since 4Q20 Per previous business update issued January 11, 2022 (1) Capital Deployment Volume ✓ Initial yield of 6.1%; Year 3 yield of approximately 8.2% ✓ Low last dollar exposure and innovative structure offer downside protection GROSS (1) INVESTMENTS $6.1B✓ Expected to generate high single digit to mid-teens unlevered IRRs to WELL Granular & Off-Market Transactions ✓ Predictive analytics and exclusive operator relationships used to execute off-market investments (1) Total Transactions ✓ Maximizing risk-adjusted return to WELL through creative investments across the capital stack 56 OM and SH Properties Acquired✓ Debt investments offer equity upside in form of warrants and/or bargain purchase options 246 ✓ Seniors housing acquisitions executed at an average investment of $21.2 million per property Seniors Housing Units Acquired 26K Significant Discount to Replacement Cost ✓ Investments made at significant discount to replacement cost offer enhanced downside protection Avg. Last Dollar Basis US transactions $179K / unit ✓ Limited recent market transactions priced above replacement cost serves to further curtail new supply Avg. Last Dollar Basis UK transactions £40K / unit StoryPoint Fort Wayne | Fort Wayne, IN Oakmont Ivy Park at Otay Ranch | Chula Vista, CA HarborChase of Vero Beach | Vero Beach, FL 14 1. 1. Includes pro rata gross investments across acquisitions and loans since October 2020 and definitive agreements WELL has entered

Notable Investments Per previous business update issued January 11, 2022 (1) Transaction Segment Properties Investment Commentary • Portfolio comprised of eight rental and six entrance fee communities located in attractive markets across the US Watermark SHO 14 $580M • Price represents a 40% discount to estimated replacement cost • Anticipated unlevered IRR in high single-digit range Opportunistic • Newly-developed communities in fast-growing micro markets in the Midwest with densification opportunities Investments New Perspective SHO 3 $119M • New Perspective to assume operations under strongly aligned RIDEA 3.0 contract Executed at • Anticipated unlevered IRR in high single-digit range Significant • Acquisition of 85 properties at a significant discount to estimated replacement cost, operated by Atria Senior Living Discounts to Atria SHO 85 $1.6B • Anticipated unlevered IRR in low-to mid- teens range Estimated • Portfolio of seniors housing communities across the Southeast under a new triple net lease with HRA, a regional Replacement HRA SHNNN 8 $132M seniors housing operator/developer Cost • Anticipated unlevered IRR of 10%+ • Portfolio of seniors housing communities across the Midwest. Operations transitioned to Pathway Senior Living and Pathway + SHO 22 + 7 $150M Frontier Management, regional seniors housing operators Frontier • Anticipated unlevered IRR in low-double digit range • Acquisition of five recently developed Class A communities across the Mid-Atlantic and Southeastern US New WELL NNN/ SHO 5 + pipeline $172M • Best-in-class operator and developer will be retained to manage the properties Relationship • Agreed to strategic long-term exclusive development agreement • Class A portfolio of 100% private pay communities in highly attractive markets Existing WELL SHO 9 $475M • Existing Welltower operator to assume operations (2) Relationship • Anticipated unlevered IRR in high single-digit range • Formed strategic joint venture including the acquisition of seven Class A medical office buildings and properties Newly Aspect Health MOB 7 + pipeline $98M under construction Established and • Ten-year exclusivity agreement on future development opportunities in NYC metro area Growing • SHO: Expanded relationship with StoryPoint through the acquisition of four purpose-built, Class A seniors housing Relationships communities, with an average age of 2 years, in the Midwest at historical development cost basis SHO & StoryPoint 14 + pipeline $390M • NNN: Acquisition of ten properties across the Midwest. All properties transitioned operators to StoryPoint Senior SHNNN Living • Anticipated unlevered IRRs in high single digit range • New long-term exclusive development agreement to build, own and operate Class A communities Oakmont SHO 1 + pipeline $35M • Expanded relationship through purchase of an AL/MC property in a highly-desirable sub-market in SoCaL • Anticipated unlevered IRR of approximately 10% 1. At pro rata ownership 15 2. Definitive agreement entered into subsequent to 3Q2021; expected to close in 1Q2022

Foundation for Long-Term Growth Established Per previous business update issued January 11, 2022 Opportunity to deploy in excess of $2.5 billion Annually | Economics Defined During Pandemic NEW and PROPRIETARY long-term relationships with best-in-class developers and operators with either exclusive rights or right of first offer 5 17 5 27 $25B+ Relationships Formed Newly Formed COVID Additional Relationships Total Newly Established Potential Capital Deployment Pre-COVID Relationships Growth Relationships Currently In Progress Opportunity Over Next Decade New relationships formed during depths of COVID- 19 pandemic to create visible and significant long- term capital deployment opportunities 16 Centralized Capital Allocation; Decentralized Execution

Welltower Overview 17

Welltower at a Glance S&P + % BBB Baa1 $52B 2.8 Enterprise (1) Dividend Yield 500 (1) Value 100,000+ ~22M sq. ft. Seniors Housing & Outpatient Facilities Wellness Housing Units World's largest health & wellness real estate platform 1. Bloomberg, as of 12/31/2021 18

Welltower at a Glance WELL Portfolio Composition Health System Seniors Housing Operating Outpatient 9% Medical 39% 24% 3Q 2021 (1) In-Place NOI 5% 23% Long-Term/ Seniors Housing Post-Acute Care Triple-Net 1. Based on In-Place NOI. See Supplemental Financial Measures at the end of this presentation for reconciliations. 19 19

Leadership Team SHANKH MITRA TIMOTHY G. MCHUGH JOHN F. BURKART Chief Executive Officer & Chief Financial Officer Chief Operating Officer Chief Investment Officer MATTHEW G. MCQUEEN AYESHA MENON JOSHUA T. FIEWEGER General Counsel & Senior Vice President Chief Accounting Officer Corporate Secretary Wellness Housing and Development 20

(1) WELL ESG Focus | Profit, Planet, People Building a Portfolio Serving our People and Good Governance for the Future our Communities is Good Business E S G • 80% Women and Minority Independent (1) Sustainability Goals & Achievements Gender parity across organization Director Leadership on the Board of Directors Targeting 10% reduction in • ESG Goals Incorporated into greenhouse gas (GHG) emissions, Management Compensation Plan (2) energy, and water use by 2025 • Separate Chairman & CEO roles First health care REIT to issue Lowest G&A Burden Amongst (3) Health Care REITs Green Bond (December 2019) 1.2% 1.0% 0.8% 0.6% 78% 0.4% 0.2% 0.0% Employee participation across 8 Employee Network Groups G&A as % of Enterprise Value 1. See Welltower 2020 Environmental, Social and Governance Report and Business Update dated June 7, 2021 for additional details and disclosures 2. See Welltower 2020 Environmental, Social and Governance Report for additional details and disclosures 21 3. Trailing twelve-month G&A as of September 30, 2021; Enterprise Value as of January 5, 2022

Secular Themes Powerful demographic tailwinds to drive multi-year period of internal and external growth 22
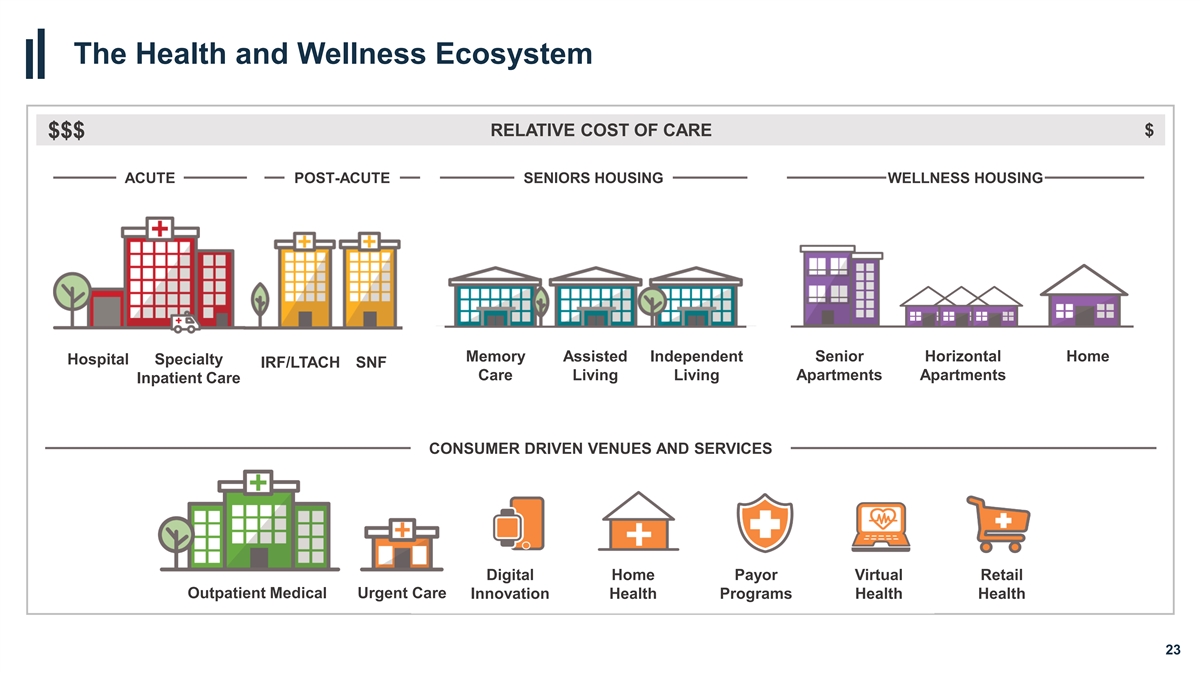
The Health and Wellness Ecosystem RELATIVE COST OF CARE $ $$$ ACUTE POST-ACUTE SENIORS HOUSING WELLNESS HOUSING Memory Assisted Independent Senior Horizontal Home Hospital Specialty IRF/LTACH SNF Care Living Living Apartments Apartments Inpatient Care CONSUMER DRIVEN VENUES AND SERVICES Digital Home Payor Virtual Retail Outpatient Medical Urgent Care Innovation Health Programs Health Health 23

Secular Theme | Addressing the Aging Population GLOBAL DEMOGRAPHIC SHIFT driving significant INTERNAL & EXTERNAL growth opportunities (2) (1) 80+ UK Population Growth 80+ U.S. Population Growth 5M 7% 25M 7% (3) 6% Population 80+ (M) 3.1% CAGR through end of decade 5% YoY Growth (%) 4M 23M 6% 4% 3% 3M 21M 2% 5% (3) 3.6% CAGR through end of decade 1% 19.7M 2M 0% 19M 4% 17M (2) 80+ Canada Population Growth 3% 15M 3M 7% 6% 13.2M (3) 3.8% CAGR through end of decade 2% 5% 13M 4% 2M 3% 1% 11M 2% 1% 1M 0% 9M 0% 1. United States Census Bureau: Projected Population by Single Year of Age, Sex, Race, Hispanic Origin and Nativity for the United States: 2018 to 2060 2. Organization for Economic Cooperation and Development. Data as of 2017 24 3. Measured from 2020 - 2029

Secular Theme | The Shift to Value-Based Care The AGING POPULATION outspends all other cohorts on HEALTH CARE (2) (1) US Health Care Spend Projections US Personal Health Care Per-Capita Spend by Age $20K 20% $35K Per Capita Health Spend %GDP 20% $32.9 $30K 19% $25K 4.1X $15K 19% $20K 18% $17.0 $15K 18% $10K $10K 17% $10.2 $8.0 $5K 17% $4.9 $3.7 $5K 16% $0K 0-18 19-44 U.S. 45-64 65-84 85+ Average 1. National Health Expenditure, CMS. Data as of 9/30/2015 25 2. Centers for Medicare & Medicaid Services, Office of the Actuary; U.S. Department of Commerce, Bureau of Economic Analysis

Secular Theme | The Shift to Value-Based Care The US spends the MOST PER CAPITA on health care, yet achieves significantly LOWER HEALTH OUTCOMES (1) (1) Health Care Spend vs. Life Expectancy Health Care Spend vs. Life Expectancy 100% 84 NOR 80% NETH SWIZ 82 FR AUS NZ SWE CAN 60% OECD Average UK 80 GER USA 40% 78 Projected to grow to 20% of GDP by 2028 20% 76 74 0% 4% 6% 8% 10% 12% 14% 16% 18% UK SWIZ NOR SWE FRA GER NETH AUS NZ CAN US Health Care Spend (% GDP) Social Care Spend Health Care Spend 26 1. Organization for Economic Cooperation and Development. Data as of 2017 Life Expectancy at Birth (years)

Secular Theme | Social Determinants of Health HEALTH and WELLNESS can be directly 80% of an individual’s health and wellness (1) impacted by where you LIVE and AGE is influenced by SOCIAL DETERMINANTS Socioeconomic factors Physical 10% Environment 20% Drivers of 40% Health Care Health Health 30% Behaviors Health & Exercise Safety Food Security Community Hygiene & Medical Care & Activity & Accessibility & Nutrition & Socialization Personal Care 27 1. 1. Artiga, S., & Hinton, E. (2019, May 29). Beyond Health Care: The Role of Social Determinants in Promoting Health and Health Equity

Drivers of Per Share Cash Flow Growth Post-COVID fundamental recovery sustained by strong demographic trends, SECULAR GROWTH shift to value-based health care, and social determinants of health TAILWINDS External growth strategy underpinned by value-oriented capital deployment ACCRETIVE CAPITAL philosophy and data-driven decisions in innovative structures DEPLOYMENT DIVERSIFIED PLATFORM Strongly aligned operating partners, positioned for significant growth OF OPERATORS STRONG INTERNAL Entrepreneurial – Passionate – Diverse – Aligned TALENT BASE Value-based investment philosophy and innovative structure of transactions offer RISK significant downside protection MITIGANTS Strong investment grade balance sheet and robust liquidity profile 28
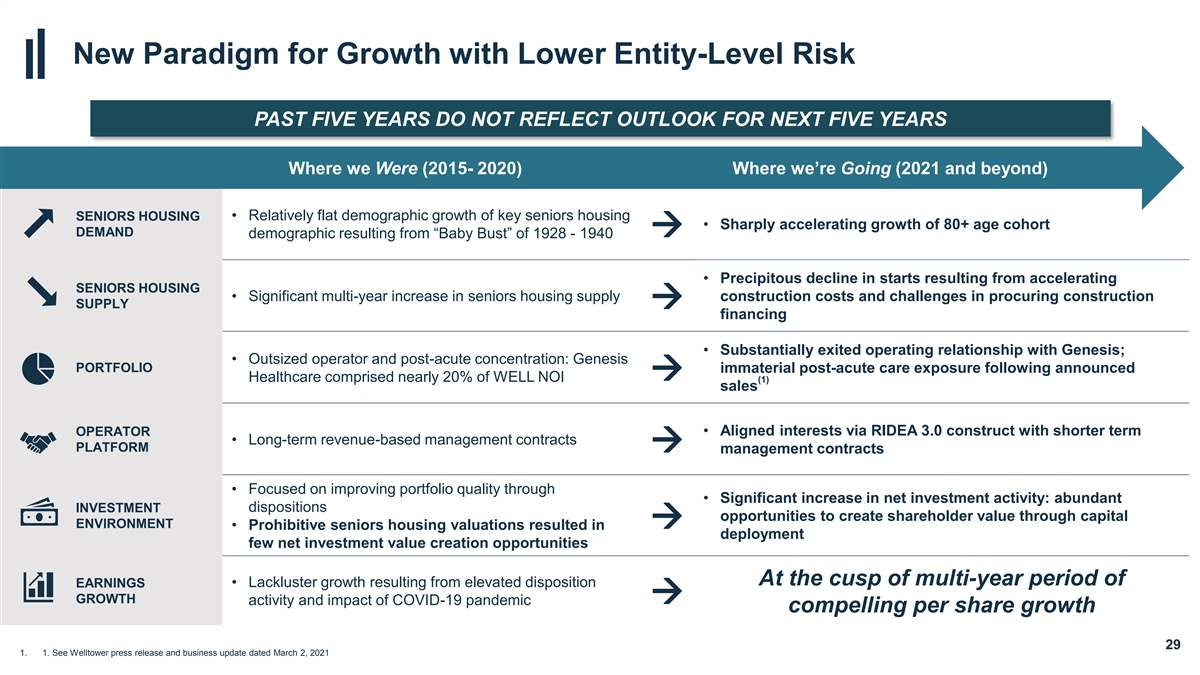
New Paradigm for Growth with Lower Entity-Level Risk PAST FIVE YEARS DO NOT REFLECT OUTLOOK FOR NEXT FIVE YEARS Where we Were (2015- 2020) Where we’re Going (2021 and beyond) • Relatively flat demographic growth of key seniors housing SENIORS HOUSING • Sharply accelerating growth of 80+ age cohort DEMAND → demographic resulting from “Baby Bust” of 1928 - 1940 • Precipitous decline in starts resulting from accelerating SENIORS HOUSING • Significant multi-year increase in seniors housing supply construction costs and challenges in procuring construction SUPPLY→ financing • Substantially exited operating relationship with Genesis; • Outsized operator and post-acute concentration: Genesis PORTFOLIO immaterial post-acute care exposure following announced → Healthcare comprised nearly 20% of WELL NOI (1) sales OPERATOR • Aligned interests via RIDEA 3.0 construct with shorter term • Long-term revenue-based management contracts PLATFORM→ management contracts • Focused on improving portfolio quality through • Significant increase in net investment activity: abundant INVESTMENT dispositions opportunities to create shareholder value through capital ENVIRONMENT→ • Prohibitive seniors housing valuations resulted in deployment few net investment value creation opportunities At the cusp of multi-year period of EARNINGS • Lackluster growth resulting from elevated disposition GROWTH→ activity and impact of COVID-19 pandemic compelling per share growth 29 1. 1. See Welltower press release and business update dated March 2, 2021

Secular Societal & Technological Trends | Impact on Real Estate Sectors Precedent for EXTENDED PERIOD OF MULTIPLE EXPANSION in Secular Growth Sectors THEME REAL ESTATE SECTOR IMPACT E-Commerce Industrial Digital Technology Data Centers Mobile Phone Usage & Wireless Technology Cellular Towers AGING OF THE POPULATION HEALTH CARE 30

Competitive Advantages to Drive Growth Through Cycles INDUSTRY-LEADING DATA ANALYTICS PLATFORM across all commercial real estate: predictive analytics and artificial intelligence platform driving micro-market capital allocation decisions Internal and external GROWTH OPPORTUNITES spanning the care continuum LARGEST PLATFORM OF SENIORS HOUSING OPERATORS across geographies, acuity levels and product types Competitive Advantages CENTRALIZED capital allocation; DECENTRALIZED execution Strong ALIGNMENT of interest with operating partners through RIDEA 3.0 construct Integration of ENVIRONMENTAL, SOCIAL, and GOVERNANCE initiatives across organization 31

Seniors Housing 32
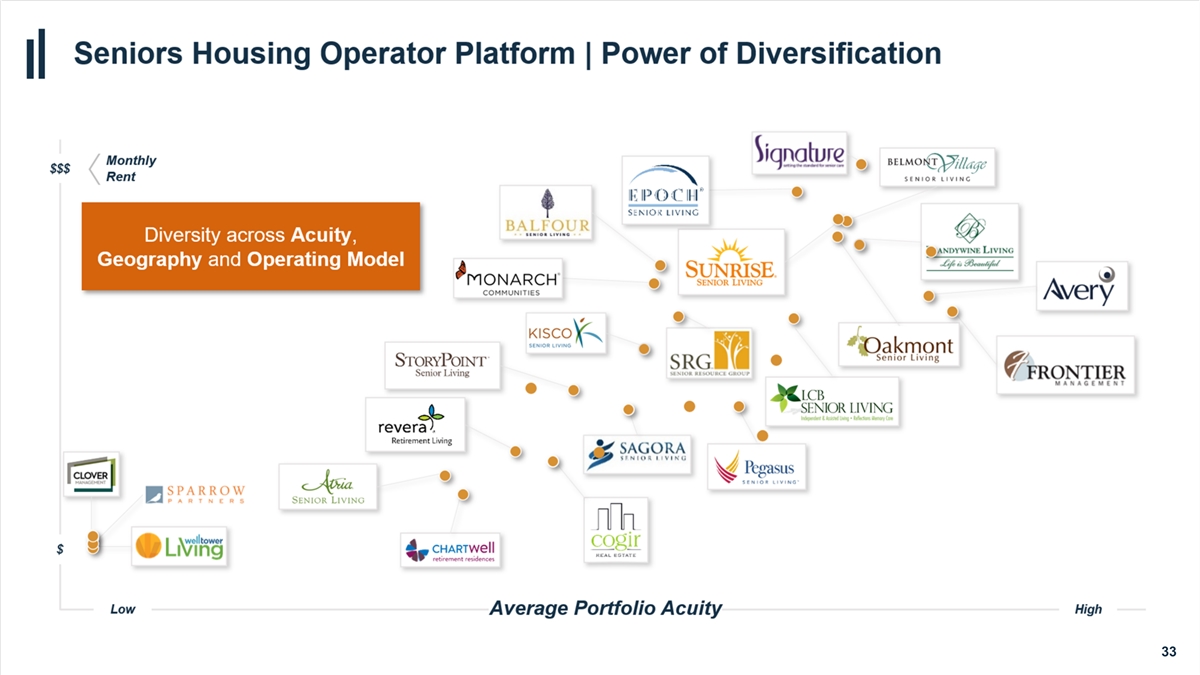
Seniors Housing Operator Platform | Power of Diversification Monthly $$$ Rent Diversity across Acuity, Geography and Operating Model $ Low High Average Portfolio Acuity 33 33
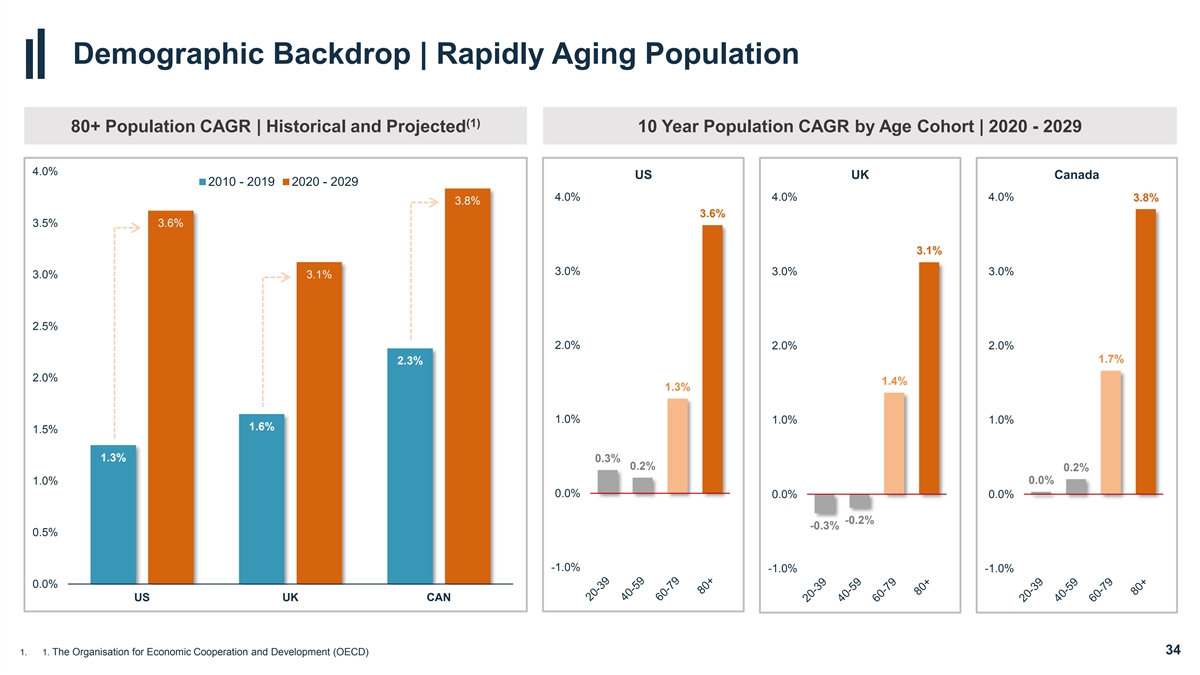
Demographic Backdrop | Rapidly Aging Population (1) 80+ Population CAGR | Historical and Projected 10 Year Population CAGR by Age Cohort | 2020 - 2029 4.0% US UK Canada 2010 - 2019 2020 - 2029 4.0% 4.0% 4.0% 3.8% 3.8% 3.6% 3.5% 3.6% 3.1% 3.0% 3.0% 3.0% 3.0% 3.1% 2.5% 2.0% 2.0% 2.0% 1.7% 2.3% 2.0% 1.4% 1.3% 1.0% 1.0% 1.0% 1.6% 1.5% 1.3% 0.3% 0.2% 0.2% 0.0% 1.0% 0.0% 0.0% 0.0% -0.2% -0.3% 0.5% -1.0% -1.0% -1.0% 0.0% US UK CAN 1. 1. The Organisation for Economic Cooperation and Development (OECD) 34

Seniors Housing Supply | Construction Remains Well Below Peak Levels (1) (1) Construction Starts Units Under Construction NIC Primary and Secondary Markets NIC Primary and Secondary Markets Construction Starts Construction Starts (% Inventory) Units Under Construction Contruction (% Inventory) 14K 5.0% 80K 8.0% 4.5% 50%+ decline in starts 70K 7.0% Further decline in units under 12K since 4Q17 peak construction expected following 4.0% sharp decline in starts 60K 6.0% 10K 3.5% 50K 5.0% 3.0% 8K 2.5% 40K 4.0% 6K 2.0% 30K 3.0% 1.5% 4K Recent construction starts 20K 2.0% at 2012/2013 levels 1.0% 2K 10K 1.0% 0.5% 0K 0.0% 0K 0.0% 35 1. Source: NIC MAP® Data Service

Seniors Housing Supply | Surging Construction Costs Per previous business update issued January 11, 2022 Material increase in cost of development for ALL RESIDENTIAL property types including SENIORS HOUSING Lumber Cement Copper 1,800 650 11,000 +58% since 2016 +263% since 2016 +76% since 2016 1,600 600 10,000 1,400 550 9,000 1,200 500 8,000 1,000 800 450 7,000 600 400 6,000 400 350 5,000 200 0 300 4,000 Aluminum Steel 3,500 2,500 +64% since 2016 +127% since 2016 3,000 2,000 2,500 1,500 2,000 1,000 1,500 500 1,000 0 WEAKER DEVELOPMENT ECONOMICS LEADING TO SHARP DECLINE IN SENIORS HOUSING SUPPLY 36 SOURCE: Factset, as of 1/5/2022

Post-COVID Recovery | Long-Term Secular Growth Opportunity Demographic-driven Demand Supply Deceleration Resilient Pricing Power (1) (2) (3) US 80+ Population Growth Seniors Housing Construction Starts WELL SHO Same Store RevPOR Growth 5.0% 5.0% Starts (% Inventory) 20M WELL’s pre-COVID pricing power remained strong despite accelerating supply and tight labor market conditions 19M 4.5% 4.0% 18M 4.0% 17M 3.5% 3.0% 16M 3.0% 15M 2.0% 14M 2.5% 13M 2.0% 12M 1.0% 1.5% 11M 1.0% 10M 0.0% Unique Opportunity to Generate Significant NOI Growth Over Multi-Year Period 1. The Organisation for Economic Cooperation and Development (OECD) 2. Source: NIC MAP® Data Service, Primary and Secondary markets 37 3. Represents quarterly year-over-year Same Store REVPOR growth percentage. See each quarters respective Supplemental Information Report for a discussion of such supplemental reporting measure as well as the applicable reconciliations

(1) SHO Portfolio | COVID-19 Impact Per previous business update issued January 11, 2022 COVID-19 Impact ~90% of seniors housing communities accepting new residents despite significant increase in resident case counts • Trailing two-week resident case counts have increased recently, though few hospitalizations have been reported due to high vaccination rates and efficacy of vaccines Trailing Two Week Resident Case Counts 1,400 • 59% of communities have zero reported resident COVID-19 cases on a trailing two-week basis • 89% of communities are accepting new residents; 1,200 admissions bans have been more temporary in nature relative to prior COVID waves 1,000 Operations Update 800 • Nearly all communities are requiring staff vaccinations 600 • Booster vaccines have been administered to a majority of residents 400 • Nearly all communities continue to allow visitors, in-person tours and communal dining while maintaining strict adherence to state, local, and/or 200 operator-imposed guidelines • Previous requirement to self-quarantine post 0 move in has been removed at most properties if new resident is fully vaccinated and tested negative for COVID-19 38 1. All data presented as of January 7, 2022 as reported by operators
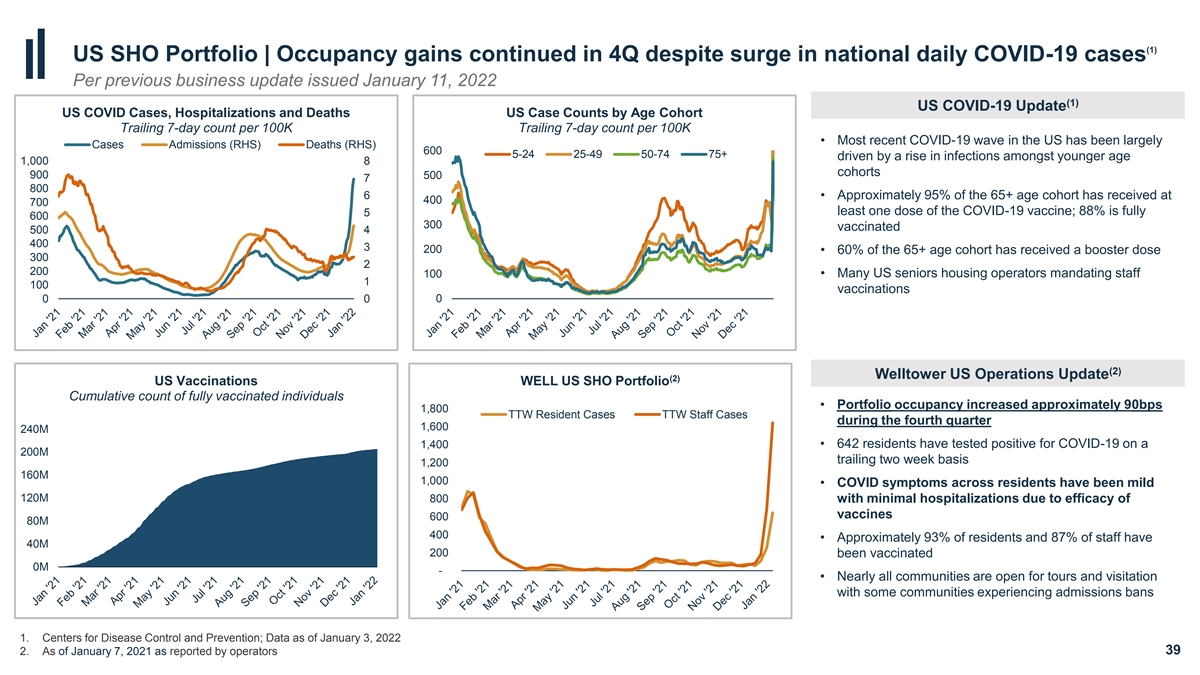
(1) US SHO Portfolio | Occupancy gains continued in 4Q despite surge in national daily COVID-19 cases Per previous business update issued January 11, 2022 (1) US COVID-19 Update US COVID Cases, Hospitalizations and Deaths US Case Counts by Age Cohort Trailing 7-day count per 100K Trailing 7-day count per 100K • Most recent COVID-19 wave in the US has been largely Cases Admissions (RHS) Deaths (RHS) 600 5-24 25-49 50-74 75+ driven by a rise in infections amongst younger age 1,000 8 cohorts 900 500 7 800 6 • Approximately 95% of the 65+ age cohort has received at 400 700 least one dose of the COVID-19 vaccine; 88% is fully 5 600 300 vaccinated 500 4 400 3 200 • 60% of the 65+ age cohort has received a booster dose 300 2 200 100 • Many US seniors housing operators mandating staff 1 100 vaccinations 0 0 0 (2) Welltower US Operations Update (2) US Vaccinations WELL US SHO Portfolio Cumulative count of fully vaccinated individuals • Portfolio occupancy increased approximately 90bps 1,800 TTW Resident Cases TTW Staff Cases during the fourth quarter 1,600 240M • 642 residents have tested positive for COVID-19 on a 1,400 200M trailing two week basis 1,200 160M 1,000 • COVID symptoms across residents have been mild 120M 800 with minimal hospitalizations due to efficacy of vaccines 600 80M 400 • Approximately 93% of residents and 87% of staff have 40M 200 been vaccinated 0M - • Nearly all communities are open for tours and visitation with some communities experiencing admissions bans 1. Centers for Disease Control and Prevention; Data as of January 3, 2022 2. As of January 7, 2021 as reported by operators 39

UK SHO Portfolio | Resident cases remain low despite surge in national COVID-19 cases Per previous business update issued January 11, 2022 (1,3) (2) (2) UK COVID-19 Update UK COVID Cases, Hospitalizations and Deaths England Case Counts by Age Cohort UK COVID Cases, Hospitalizations and Deaths England Case Counts by Age Cohort Trailing 7-day count per 100K Trailing 7-day count per 100K Trailing 7-day count per 100K Trailing 7-day count per 100K • Most recent COVID wave in UK largely driven by a rise in infections amongst younger age cohorts Cases Admissions (RHS) Deaths (RHS) 0-24 25-49 50-74 75+ Cases Admissions (RHS) Deaths (RHS) 0-24 25-49 50-74 75+ 1,600 50 1,600 50 2,000 2,000 • Overall hospitalizations and deaths across all age cohorts 45 45 1,400 1,400 1,800 1,800 40 remain meaningfully below prior COVID waves 40 1,600 1,600 1 1,2 ,20 00 0 35 35 1,400 1,400 1,000 • The UK has focused heavily on its booster program, with 1,000 30 30 1,200 1,200 over 60% of the population over the age of 12 having 800 25 800 25 1,000 1,000 20 20 received a booster 600 8 80 00 0 600 15 15 600 600 400 400 • Boosters have proven effective against Omicron, 10 10 400 400 200 200 5 reducing hospitalizations by 90% in those aged 65+ 5 200 200 (4) 0 0 0 0 0 0 three months post-shot • All UK healthcare workers have been vaccinated as of November 11, 2021, per government mandate Welltower UK Operations Update (5) UK Vaccinations UK Vaccinations WELL UK SHO Portfolio Cumulative count of fully vaccinated individuals Cumulative count of fully vaccinated individuals • Portfolio occupancy increased approximately 150bps 350 5 50 0M M TTW Resident Cases - TTW Staff Cases - (6) during the fourth quarter 4 45 5M M 300 40M • 78 reported resident COVID-19 cases on a trailing two week 40M 250 (5) 35M basis 35M 30M 30M 200 • COVID symptoms across residents have been mild with 25M 25M minimal hospitalizations and deaths 150 20M 20M 15M • Nearly all residents and 70% of the staff have received a 15M 100 (5) 10M booster 10M 50 5M 5M • Visitors to care homes are generally limited to 3 named 0M 0M - persons • Majority of communities are open for tours and visitation while admissions bans have been local and temporary 1. Public Health England. Data as of January 4, 2022 2. COVID Daily New Cases by Age only available for England; Data as of January 4, 2022 3. https://www.gov.uk/government/news/everyone-working-in-care-homes-to-be-fully-vaccinated-under-new-law-to-protect-residents 4. https://www.gov.uk/government/news/boosters-continue-to-provide-high-levels-of-protection-against-severe-disease-from-omicron-in-older-adults 5. Data presented as of January 7, 2022 as reported by operators 40 6. Excluding the impact of the previously announced transition of 45 properties from Sunrise UK to Care UK and Signature Senior Lifestyle effective December 1, 2021. UK spot occupancy declined 20bps after incorporating the impact of the 45 transition properties and total portfolio increased approximately 65bps

Canada SHO Portfolio | Occupancy gains continue despite elevated COVID-19 case counts Per previous business update issued January 11, 2022 (1) Canada COVID Cases, Hospitalizations and Deaths Canada COVID-19 Update Canada Case Counts by Age Cohort Trailing 7-Day Cases and Deaths per 100K; Trailing 7-day count per 100K Daily Hospitalized Individuals per 100K • The 70+ age cohort continues to represent a minority of new 800 0-19 20-39 40-59 60-79 COVID-19 cases in Canada, a trend which has persisted Cases Hospitalizations (RHS) Deaths (RHS) 700 since the outset of the pandemic 300 12 600 • 88% of the population 12 years of age or older is fully 250 10 500 vaccinated; 77% of the overall population is fully vaccinated 200 8 400 • COVID-related hospitalizations and deaths remain 150 6 300 meaningfully below prior waves 100 4 200 • Some provinces have imposed admissions bans for seniors 50 2 100 housing communities 0 0 0 • Most large seniors housing operators mandating staff vaccinations (2) Canada Vaccinations WELL CAN SHO Portfolio Welltower Canada Operations Update Cumulative count of fully vaccinated individuals 250 TTW Resident Cases TTW Staff Cases 35M • Portfolio occupancy increased approximately 30bps during the fourth quarter 30M 200 • 204 reported resident COVID-19 case on a trailing two week 25M (2) basis 150 20M • COVID symptoms across residents have been mild with few hospitalizations and no deaths 15M 100 • Approximately 95% of residents and 90% of staff have been 10M (2) 50 fully vaccinated 5M • Majority of communities are open for tours and visitation with 0M - some communities experiencing admissions bans 1. Public Health Agency of Canada; Data as of December 24, 2021 2. Data presented as of January 7, 2021 as reported by operators 41

(1) SHO Portfolio | Additional Community Details Per previous business update issued January 11, 2022 Nearly ALL COMMUNITIES across US, UK and Canada allowing VISITATION, IN-PERSON TOURS and COMMUNAL DINING Visitation Communal Dining % of communities % of communities 100% 100% 80% 80% 60% 60% 40% Dec-20 Jan-21 Feb-21 Mar-21 Apr-21 May-21 Jun-21 Jul-21 Aug-21 Sep-21 Oct-21 Nov-21 Dec-21 40% Indoor Visitation Outdoor Visitation Dec-20 Jan-21 Feb-21 Mar-21 Apr-21 May-21 Jun-21 Jul-21 Aug-21 Sep-21 Oct-21 Nov-21 Dec-21 In-Person Tours Activities 100% % of communities % of communities 100% 80% 80% 60% 60% 40% 40% Dec-20 Jan-21 Feb-21 Mar-21 Apr-21 May-21 Jun-21 Jul-21 Aug-21 Sep-21 Oct-21 Nov-21 Dec-21 Dec-20 Jan-21 Feb-21 Mar-21 Apr-21 May-21 Jun-21 Jul-21 Aug-21 Sep-21 Oct-21 Nov-21 Dec-21 1. As reported by operators 42

Balance Sheet 43
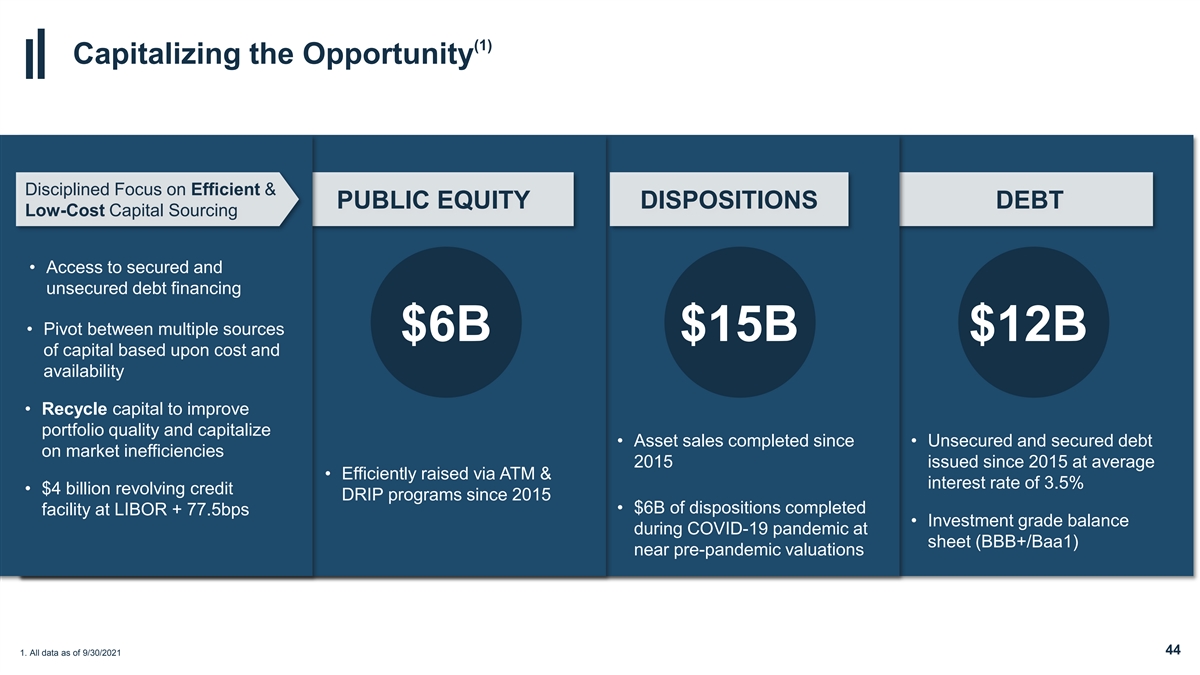
(1) Capitalizing the Opportunity Disciplined Focus on Efficient & PUBLIC EQUITY DISPOSITIONS DEBT Low-Cost Capital Sourcing • Access to secured and unsecured debt financing • Pivot between multiple sources $6B $15B $12B of capital based upon cost and availability • Recycle capital to improve portfolio quality and capitalize • Asset sales completed since • Unsecured and secured debt on market inefficiencies 2015 issued since 2015 at average • Efficiently raised via ATM & interest rate of 3.5% • $4 billion revolving credit DRIP programs since 2015 • $6B of dispositions completed facility at LIBOR + 77.5bps • Investment grade balance during COVID-19 pandemic at sheet (BBB+/Baa1) near pre-pandemic valuations 44 1. All data as of 9/30/2021

Balance Sheet Strength Organic De-Leveraging From Recovery in SH NOI Continued reduction in pro forma Net Debt/Adjusted EBITDA since 1Q2021 7.00x 6.97x 0.15x 6.95x Further 1.25x leverage reduction 6.90x to 5.37x assuming $475 million in embedded EBITDA recovery to 6.85x (6) pre-COVID occupancy levels 6.80x 0.08x 6.75x Credit Outlook Upgrade 0.06x 6.70x “An ongoing commitment to maintaining + 0.06x BBB healthy liquidity levels and a strong balance 6.65x sheet is expected to drive meaningful improvement to the key credit metrics.” 6.60x 6.62x “…We expect that continued recovery in 6.55x cash flows from the REIT’s senior housing operating business, combined with its 6.50x Baa1 conservative financial policies, will result in (1) (3) (4) (5) (2) 3Q21 As Reported 11/3/21 Transaction Definitive Agreement Settlement of Equity Proceeds from Assets Current Pro Forma continued improvement in leverage and Run Rate Pipeline Sold on Forward Basis Held for Sale Leverage other key credit metrics.” 1. Represents 3Q2021 Net Debt to Adjusted EBITDA as reported. See Supplemental Financial Measures at the end of this presentation 2. Includes pro forma adjustments to reflect acquisition and disposition activity in 3Q2021 and closed acquisition and disposition activity in 4Q2021 through November 3, 2021 as if all transactions occurred on July 1, 2021 3. Includes pro forma adjustment for $1.3 billion of definitive agreement acquisitions at 6.9% yield assuming capitalization of 65% equity (utilizing $862 million of $990 million unsettled equity as of November 3, 2021) and 35% debt as if the transaction occurred on July 1, 2021 4. Includes pro forma adjustment to reflect proceeds of $128 million from the settlement of shares issued through WELL’s at-the-market program on a forward basis not yet settled through November 3, 2021 2021 ($990 million less $862 million in proceeds related to shares settled for the pro forma definitive agreement acquisitions) 5. Includes pro forma adjustment to reflect proceeds of $283 million related to 3Q2021 assets held for sale as of September 30, 2021 not yet closed subsequent to quarter end as of November 3, 2021 45 6. See slide 12 for additional details on potential NOI upside
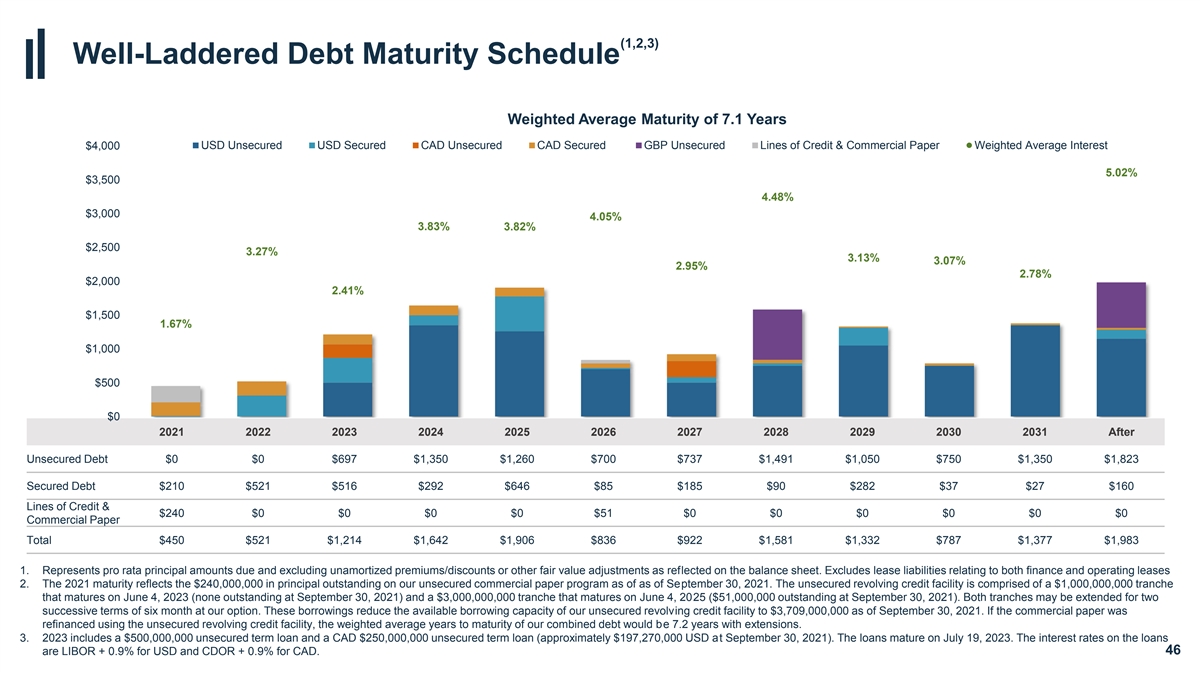
(1,2,3) Well-Laddered Debt Maturity Schedule Weighted Average Maturity of 7.1 Years USD Unsecured USD Secured CAD Unsecured CAD Secured GBP Unsecured Lines of Credit & Commercial Paper Weighted Average Interest $4,000 5.02% $3,500 4.48% $3,000 4.05% 3.83% 3.82% $2,500 3.27% 3.13% 3.07% 2.95% 2.78% $2,000 2.41% $1,500 1.67% $1,000 $500 $0 2021 2022 2023 2024 2025 2026 2027 2028 2029 2030 2031 After Unsecured Debt $0 $0 $697 $1,350 $1,260 $700 $737 $1,491 $1,050 $750 $1,350 $1,823 Secured Debt $210 $521 $516 $292 $646 $85 $185 $90 $282 $37 $27 $160 Lines of Credit & $240 $0 $0 $0 $0 $51 $0 $0 $0 $0 $0 $0 Commercial Paper Total $450 $521 $1,214 $1,642 $1,906 $836 $922 $1,581 $1,332 $787 $1,377 $1,983 1. Represents pro rata principal amounts due and excluding unamortized premiums/discounts or other fair value adjustments as reflected on the balance sheet. Excludes lease liabilities relating to both finance and operating leases 2. The 2021 maturity reflects the $240,000,000 in principal outstanding on our unsecured commercial paper program as of as of September 30, 2021. The unsecured revolving credit facility is comprised of a $1,000,000,000 tranche that matures on June 4, 2023 (none outstanding at September 30, 2021) and a $3,000,000,000 tranche that matures on June 4, 2025 ($51,000,000 outstanding at September 30, 2021). Both tranches may be extended for two successive terms of six month at our option. These borrowings reduce the available borrowing capacity of our unsecured revolving credit facility to $3,709,000,000 as of September 30, 2021. If the commercial paper was refinanced using the unsecured revolving credit facility, the weighted average years to maturity of our combined debt would be 7.2 years with extensions. 3. 2023 includes a $500,000,000 unsecured term loan and a CAD $250,000,000 unsecured term loan (approximately $197,270,000 USD at September 30, 2021). The loans mature on July 19, 2023. The interest rates on the loans are LIBOR + 0.9% for USD and CDOR + 0.9% for CAD. 46

Supplemental Financial Measures 47

Non-GAAP Financial Measures We believe that revenues, net income and net income attributable to common stockholders ( NICS ), as defined by U.S. generally accepted accounting principles ( U.S. GAAP ), are the most appropriate earnings measurements. However, we consider Funds from Operations (“FFO”), Normalized FFO, Net Operating Income ( NOI ), In-Place NOI ( IPNOI ), Same Store NOI ( SSNOI ), REVPOR and Same Store REVPOR ( SS REVPOR ), EBITDA and Adjusted EBITDA to be useful supplemental measures of our operating performance. Excluding EBITDA and Adjusted EBITDA these supplemental measures are disclosed on our pro rata ownership basis. Pro rata amounts are derived by reducing consolidated amounts for minority partners’ noncontrolling ownership interests and adding our minority ownership share of unconsolidated amounts. We do not control unconsolidated investments. While we consider pro rata disclosures useful, they may not accurately depict the legal and economic implications of our joint venture arrangements and should be used with caution. Our supplemental reporting measures and similarly entitled financial measures are widely used by investors, equity and debt analysts and rating agencies in the valuation, comparison, rating and investment recommendations of companies. Our management uses these financial measures to facilitate internal and external comparisons to historical operating results and in making operating decisions. Additionally, these measures are utilized by the Board of Directors to evaluate management. None of the supplemental reporting measures represent net income or cash flow provided from operating activities as determined in accordance with U.S. GAAP and should not be considered as alternative measures of profitability or liquidity. Finally, the supplemental reporting measures, as defined by us, may not be comparable to similarly entitled items reported by other real estate investment trusts or other companies. Multi-period amounts may not equal the sum of the individual quarterly amounts due to rounding. 48
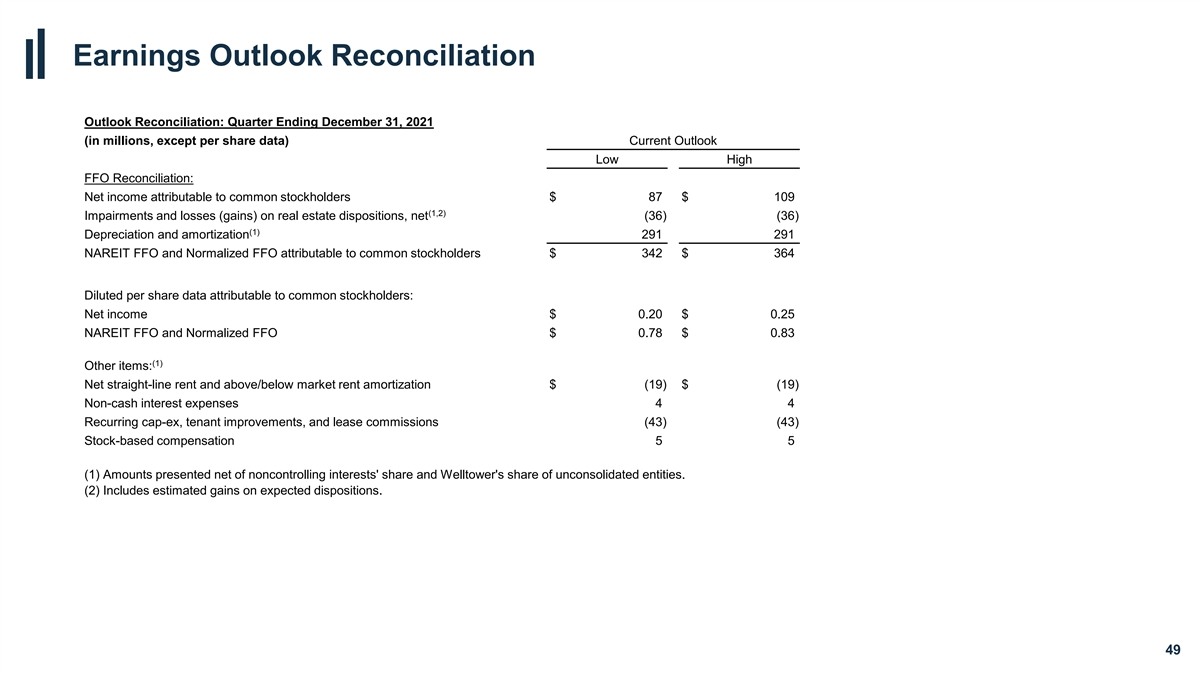
Earnings Outlook Reconciliation Outlook Reconciliation: Quarter Ending December 31, 2021 (in millions, except per share data) Current Outlook Low High FFO Reconciliation: Net income attributable to common stockholders $ 87 $ 109 (1,2) Impairments and losses (gains) on real estate dispositions, net (36) (36) (1) Depreciation and amortization 291 291 NAREIT FFO and Normalized FFO attributable to common stockholders $ 342 $ 364 Diluted per share data attributable to common stockholders: Net income $ 0.20 $ 0.25 NAREIT FFO and Normalized FFO $ 0.78 $ 0.83 (1) Other items: Net straight-line rent and above/below market rent amortization $ (19) $ (19) Non-cash interest expenses 4 4 Recurring cap-ex, tenant improvements, and lease commissions (43) (43) Stock-based compensation 5 5 (1) Amounts presented net of noncontrolling interests' share and Welltower's share of unconsolidated entities. (2) Includes estimated gains on expected dispositions. 49

NOI, IPNOI, SSNOI, REVPOR & SS REVPOR We define NOI as total revenues, including tenant reimbursements, less property operating expenses. Property operating expenses represent costs associated with managing, maintaining and servicing tenants for our properties. These expenses include, but are not limited to, property-related payroll and benefits, property management fees paid to operators, marketing, housekeeping, food service, maintenance, utilities, property taxes and insurance. General and administrative expenses represent costs unrelated to property operations and transaction costs. These expenses include, but are not limited to, payroll and benefits, professional services, office expenses and depreciation of corporate fixed assets. IPNOI represents NOI excluding interest income, other income and non-IPNOI and adjusted for timing of current quarter portfolio changes such as acquisitions, development conversions, segment transitions, dispositions and investments held for sale. SSNOI is used to evaluate the operating performance of our properties using a consistent population which controls for changes in the composition of our portfolio. As used herein, same store is generally defined as those revenue-generating properties in the portfolio for the relevant year-over-year reporting periods. Land parcels, loans and sub-leases as well as any properties acquired, developed/redeveloped (including major refurbishments where 20% or more of units are simultaneously taken out of commission for 30 days or more), sold or classified as held for sale during that period are excluded from the same store amounts. Properties undergoing operator and/or segment transitions (except Seniors Housing Triple-net to Seniors Housing Operating with the same operator) are also excluded from same store amounts. Normalizers include adjustments that in management’s opinion are appropriate in considering SSNOI, a supplemental, non-GAAP performance measure. None of these adjustments, which may increase or decrease SSNOI, are reflected in our financial statements prepared in accordance with U.S. GAAP. Significant normalizers (defined as any that individually exceed 0.50% of SSNOI growth per property type) are separately disclosed and explained in the relevant supplemental reporting package. REVPOR represents the average revenues generated per occupied room per month at our seniors housing operating properties. It is calculated as our pro rata version of total resident fees and services revenues from the income statement divided by average monthly occupied room days. SS REVPOR is used to evaluate the REVPOR performance of our properties under a consistent population which eliminates changes in the composition of our portfolio. It is based on the same pool of properties used for SSNOI and includes any revenue normalizations used for SSNOI. We use REVPOR and SS REVPOR to evaluate the revenue-generating capacity and profit potential of its seniors housing operating portfolio independent of fluctuating occupancy rates. They are also used in comparison against industry and competitor statistics, if known, to evaluate the quality of our seniors housing operating portfolio. We believe NOI, IPNOI, SSNOI, REVPOR and SS REVPOR provide investors relevant and useful information because they measure the operating performance of our properties at the property level on an unleveraged basis. We use these metrics to make decisions about resource allocations and to assess the property level performance of our properties. 50
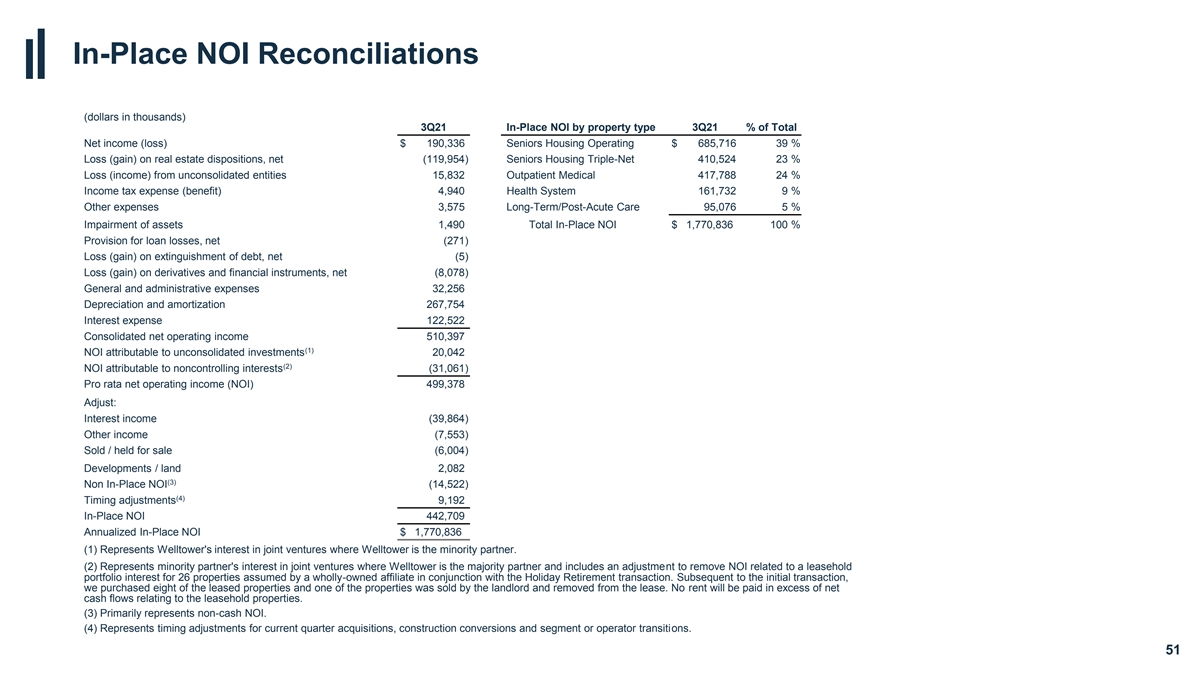
In-Place NOI Reconciliations (dollars in thousands) 3Q21 In-Place NOI by property type 3Q21 % of Total Net income (loss) $ 190,336 Seniors Housing Operating $ 685,716 39 % Loss (gain) on real estate dispositions, net (119,954) Seniors Housing Triple-Net 410,524 23 % Loss (income) from unconsolidated entities 15,832 Outpatient Medical 417,788 24 % Income tax expense (benefit) 4,940 Health System 161,732 9 % Other expenses 3,575 Long-Term/Post-Acute Care 95,076 5 % Impairment of assets 1,490 Total In-Place NOI $ 1,770,836 100 % Provision for loan losses, net (271) Loss (gain) on extinguishment of debt, net (5) Loss (gain) on derivatives and financial instruments, net (8,078) General and administrative expenses 32,256 Depreciation and amortization 267,754 Interest expense 122,522 Consolidated net operating income 510,397 (1) NOI attributable to unconsolidated investments 20,042 (2) NOI attributable to noncontrolling interests (31,061) Pro rata net operating income (NOI) 499,378 Adjust: Interest income (39,864) Other income (7,553) Sold / held for sale (6,004) Developments / land 2,082 (3) Non In-Place NOI (14,522) (4) Timing adjustments 9,192 In-Place NOI 442,709 Annualized In-Place NOI $ 1,770,836 (1) Represents Welltower's interest in joint ventures where Welltower is the minority partner. (2) Represents minority partner's interest in joint ventures where Welltower is the majority partner and includes an adjustment to remove NOI related to a leasehold portfolio interest for 26 properties assumed by a wholly-owned affiliate in conjunction with the Holiday Retirement transaction. Subsequent to the initial transaction, we purchased eight of the leased properties and one of the properties was sold by the landlord and removed from the lease. No rent will be paid in excess of net cash flows relating to the leasehold properties. (3) Primarily represents non-cash NOI. (4) Represents timing adjustments for current quarter acquisitions, construction conversions and segment or operator transitions. 51

EBITDA and Adjusted EBITDA We measure our credit strength both in terms of leverage ratios and coverage ratios. The leverage ratios indicate how much of our balance sheet capitalization is related to long-term debt, net of cash and Internal Revenue Code (“IRC”) Section 1031 deposits. We expect to maintain capitalization ratios and coverage ratios sufficient to maintain a capital structure consistent with our current profile. The ratios are based on EBITDA and Adjusted EBITDA. EBITDA is defined as earnings (net income per income statement) before interest expense, income taxes, depreciation and amortization. Adjusted EBITDA is defined as EBITDA excluding unconsolidated entities and including adjustments for stock-based compensation expense, provision for loan losses, gains/losses on extinguishment of debt, gains/losses/impairments on properties, gains/losses on derivatives and financial instruments, other expenses, additional other income and other impairment charges. We believe that EBITDA and Adjusted EBITDA, along with net income, are important supplemental measures because they provide additional information to assess and evaluate the performance of our operations. Our leverage ratios include net debt to Adjusted EBITDA. Net debt is defined as total long-term debt, excluding operating lease liabilities, less cash and cash equivalents and any IRC Section 1031 deposits. 52

Net Debt to Adjusted EBITDA Three Months (dollars in thousands) Ended Three Months Ended September 30, September 30, 2021 2021 (3,4) Net income $ 190,336 Long-term debt obligations $ 13,779,652 (5) Interest expense 122,522 Cash and cash equivalents (307,385) Income tax expense (benefit) 4,940 Net debt 13,472,267 Depreciation and amortization 267,754 Adjusted EBITDA 482,978 EBITDA 585,552 Adjusted EBITDA annualized $ 1,931,912 Loss (income) from unconsolidated entities 15,832 Net debt to Adjusted EBITDA ratio 6.97 x Stock-based compensation expense 4,535 Loss (gain) on extinguishment of debt, net (5) Loss (gain) on real estate dispositions, net (119,954) Impairment of assets 1,490 Provision for loan losses, net (271) Loss (gain) on derivatives and financial instruments, net (8,078) Other expenses 3,519 (1) Leasehold interest adjustment (640) (2) Casualty losses, net of recoveries 998 Adjusted EBITDA $ 482,978 (1) Represents $13,214,000 of revenues and $12,574,000 of property operating expenses associated with a leasehold portfolio interest relating to 26 properties assumed by a wholly-owned affiliate in conjunction with the Holiday Retirement transaction. Subsequent to the initial transaction, we purchased eight of the leased properties and one of the properties was sold by the landlord and removed from the lease. No rent will be paid in excess of net cash flow relating to the leasehold properties and therefore, the net impact has been excluded from Adjusted EBITDA. (2) Represents casualty losses net of any insurance recoveries. (3) Amounts include unamortized premiums/discounts and other fair value adjustments as reflected on the balance sheet (4) Includes unamortized premiums/discounts, other fair value adjustments and financing lease liabilities. Excludes operating lease liabilities related to ASC 842 adoption. (5) Inclusive of IRC Section 1031 deposits, if any. 53

Proforma Net Debt to Adjusted EBITDA (dollars in thousands) Three Months Ended Q4 Announced September 30, 2021 Three Months Ended September 30, 2021 Q3 Acquisitions and Acquisitions and Held-for-Sale September 30, 2021 (1) (2) (3) (4) (5) (6) (Actual) Dispositions Dispositions Definitive Agreements ATM Forward Sale Settlement Dispositions (Pro Forma) Adjusted EBITDA $ 482,978 $ 10,823 $ 1,113 $ 22,874 $ — $ (5,879) $ 511,909 Annualized Adjusted EBITDA $ 1,931,912 $ 43,292 $ 4,452 $ 91,496 $ — $ (23,516) $ 2,047,636 (7) Net Debt $ 13,472,267 $ — $ 33,858 $ 464,100 $ (128,100) $ (283,314) $ 13,558,811 Net Debt to Adjusted EBITDA 6.97 x 6.62 x (1) Please refer to calculation of Adjusted EBITDA for the three months ended September 30, 2021 on page the previous slide. (2) Pro forma adjustment to reflect acquisition and loan funding activity for the three months ended September 30, 2021 as well as disposition activity for same period as detailed on the Gross Investment Activity page of our Supplement Information report for 3Q21, as if the transactions occurred on July 1, 2021. Pro forma adjustments are based on estimates and assumptions and are preliminary in nature, and should not be assumed to be in indication of the results that would have been achieved had the transactions been completed as of the date indicated. (3) Pro forma adjustment to reflect acquisition and loan funding activity as well as disposition and loan payoff activity occurring since September 30, 2021, as if the transactions occurred on July 1, 2021. Pro forma adjustments are based on estimates and assumptions and are preliminary in nature, and should not be assumed to be in indication of the results that would have been achieved had the transactions been completed as of the date indicated. (4) Pro forma adjustment to reflect the definitive agreement acquisitions disclosed in our November 4, 2021 press release, as if the transactions occurred on July 1, 2021. Pro forma adjustments are based on estimates and assumptions and are preliminary in nature, and should not be assumed to be in indication of the results that would have been achieved had the transaction been completed as of the date indicated. Furthermore, transactions not yet closed are subject to customary closing conditions and there can be no assurances as to the timing of closing. (5) Proforma adjustment to reflect the expected net cash proceeds associated with the settlement of forward sales under our ATM program as if such forward sales were settled on July 1, 2021. (6) Pro forma adjustment to reflect the impact of the expected sale of properties classified as held-for-sale as of September 30, 2021, as if the transactions occurred on July 1, 2021. Pro forma adjustments are based on estimates and assumptions and are preliminary in nature, and should not be assumed to be in indication of the results that would have been achieved had the transactions been completed as of the date indicated. Furthermore, transactions not yet closed are subject to customary closing conditions and there can be no assurances as to the timing of closing. (7) Net debt includes unamortized premiums/discounts, other fair value adjustments and financing lease liabilities of $110,244,000 but excludes operating lease liabilities of $434,303,000, respectively. Furthermore, net debt includes IRC Section 1031 deposits, if any. 54

55
Serious News for Serious Traders! Try StreetInsider.com Premium Free!
You May Also Be Interested In
- WELL Health to Expand its Canadian Clinic Network with Acquisition from Shoppers Drug Mart Inc. of Medical Clinics operating as "The Health Clinic by Shoppers™"
- Grifols 2023 Annual Report on Form 20-F filed with the SEC
- Toronto Stock Exchange, Alithya Group Inc., The View From The C-Suite
Create E-mail Alert Related Categories
SEC FilingsSign up for StreetInsider Free!
Receive full access to all new and archived articles, unlimited portfolio tracking, e-mail alerts, custom newswires and RSS feeds - and more!
