

Form 8-K VIASAT INC For: May 25
 Tweet
Tweet Share
ShareExhibit 99.1

Viasat Releases Fourth Quarter and Fiscal Year 2021 Financial Results
CARLSBAD, Calif., May 25, 2021—Viasat Inc. (NASDAQ: VSAT), a global communications company, today announced its fourth quarter and fiscal year 2021 financial results in a letter to shareholders, which is now posted to the Investor Relations section of its website.
As previously announced, the Company will host a conference call and webcast today at 11:00 a.m. Pacific / 2:00 p.m. Eastern Time. To participate on the live conference call, please dial: (877) 640-9809 in the U.S. or (914) 495-8528 internationally and reference the conference ID 9039006. The live webcast will be available on Viasat’s investor relations website at: investors.viasat.com.
A replay of the conference call will be made available from 5:00 p.m. Eastern Time on Tuesday, May 25, until 5:00 p.m. Eastern Time on Wednesday, May 26. To access the replay, please dial: (855) 859-2056 in the U.S. and (404) 537-3406 internationally and enter the conference ID 9039006. The webcast will be archived and available on the Viasat investor relations website for approximately one month immediately following the conference call.
About Viasat
Viasat is a global communications company that believes everyone and everything in the world can be connected. For 35 years, Viasat has helped shape how consumers, businesses, governments and militaries around the world communicate. Today, the Company is developing the ultimate global communications network to power high-quality, secure, affordable, fast connections to impact people’s lives anywhere they are—on the ground, in the air or at sea. To learn more about Viasat, visit: www.viasat.com, go to Viasat’s Corporate Blog, or follow the Company on social media at: Facebook, Instagram, LinkedIn, Twitter or YouTube.
Copyright © 2021 Viasat, Inc. All rights reserved. Viasat, the Viasat logo and the Viasat signal are registered trademarks of Viasat, Inc. All other product or company names mentioned are used for identification purposes only and may be trademarks of their respective owners.
Viasat, Inc. Contacts
Chris Phillips, Corporate Communications and Public Relations, +1 (760) 476-2322, [email protected]
Paul Froelich/Peter Lopez, Investor Relations, +1 (760) 476-2633, [email protected]
# # #
Exhibit 99.2
Q4
FY21
Shareholder Letter
Fellow Shareholders,
Viasat delivered record results for fiscal year
2021 (FY2021), which was also capped by a strong fourth quarter. We began the fiscal year amid the onset of the COVID-19 pandemic, and despite the immense individual and business challenges this event posed, we executed well. We stabilized our
business by implementing rapid actions to adjust our go-to-market strategy and cost structure. We also preserved capital, which enabled us to progress on our ViaSat-3 program and continue our investments in innovation. As the fiscal year unfolded,
it highlighted the value of our diversified business model and the resilience of our great employees. Momentum increased throughout FY2021, resulting in very strong fourth quarter results that included record revenue, substantial growth in net
income*, record Adjusted EBITDA, and full fiscal year results that included a return to profitability and record Adjusted EBITDA and operating cash flow. We made significant progress preparing for the launch of the ViaSat-3 global constellation.
While the COVID-19 pandemic created schedule challenges, we recently reached a major milestone having completed payload integration for ViaSat-3 (Americas). Shipment of the payload to Boeing is imminent, and we continue to target an early calendar
year 2022 launch following final spacecraft integration and testing. Shortly after fiscal year-end, we closed on the RigNet and Euro Broadband Infrastructure Sàrl (EBI) acquisitions, both in preparation for greater global presence and
expansion into new vertical and geographical markets. During FY2021, our Satellite Services segment was led by strong growth in fixed broadband, which more than offset the impacts of dramatically reduced air travel on in-flight connectivity (IFC)
revenue. Despite COVID-19’s impact on global air traffic, airline partners continued taking steps to advance their future service offerings and we earned important new IFC contracts with Delta Air Lines and KLM Royal Dutch Airlines. Our
Government Systems segment remained steady throughout the fiscal year despite delays in product sales as government customers managed through the unique constraints they faced in a work-from-home environment. Our Commercial Networks segment
continued to improve earnings performance as we incurred lower ViaSat-3 related research & development (R&D) expenses year-over-year (YoY). In total, FY2021 revenue declined just slightly (2%) YoY, closing at $2.3 billion. Net income
increased to a $4 million profit from a loss in the prior fiscal year while Adjusted EBITDA increased 16% YoY to a record $531 million. Consolidated awards, driven by several large new contracts, hit a new record of $2.7 billion for FY2021 with a
strong book-to-bill of 1.2x, bringing our backlog to $2.3 billion, 23% higher over the prior fiscal year. As a reminder, our backlog excludes unawarded Indefinite Delivery Indefinite Quantity (IDIQ) contracts with a potential value of over $3.1
billion.
For the fourth quarter of FY2021 (Q4 FY2021), revenue was $596 million up 1% YoY, net income of $7 million increased three-fold YoY from a low base while Adjusted
EBITDA of $148 million was up 23% YoY. Government Systems segment revenue declined slightly YoY, as procurement frictions continued, though at a lesser pace. These impacts were partially offset by record service revenue for the quarter. Satellite
Services segment revenue increased, driven primarily by a continuation of strong demand in the U.S. for premium service plans in our fixed broadband business. This was partially offset on a YoY basis by the impact of COVID-19 on IFC revenue. As
vaccination efforts accelerated and passengers began to return to air travel, we saw modest sequential improvement in IFC revenue. Commercial Networks segment revenue declined in the quarter, primarily due to lower IFC terminal sales, which were
partially offset by strong ground antenna systems sales.
With fiscal year 2022 (FY2022) now underway, we are very optimistic about our prospects. Our diverse business is
positioned for a strong post-COVID recovery — particularly for IFC. Given our investments in innovation, market share gains, tuck-in acquisitions and overall execution, we are entering FY2022 in very strong position as we approach the launch of
ViaSat-3 Americas and the beginning of an exciting new phase of global growth.
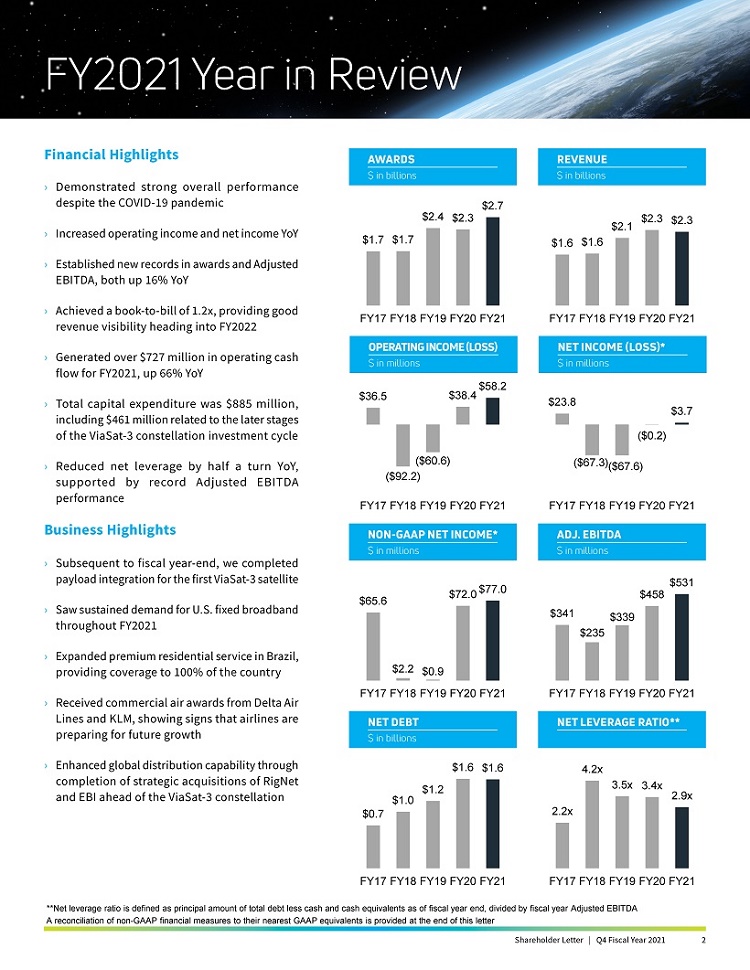
FY2021 Year in Review
Financial Highlights
› Demonstrated strong overall performance despite the COVID-19 pandemic
› Increased operating income and net income YoY
› Established new records in awards and
Adjusted EBITDA, both up 16% YoY
› Achieved a book-to-bill of 1.2x, providing good
revenue visibility heading into FY2022
› Generated over $727 million in operating cash flow for FY2021, up 66% YoY
› Total capital expenditure was $885 million, including $461 million related to the later stages of the ViaSat-3 constellation
investment cycle
› Reduced net leverage by half a turn YoY, supported by record Adjusted EBITDA performance
Business Highlights
› Subsequent to fiscal year-end, we completed
payload integration for the first ViaSat-3 satellite
› Saw sustained demand for U.S. fixed broadband throughout FY2021
› Expanded premium residential service in Brazil, providing coverage to 100% of the country
› Received commercial air awards from Delta Air Lines and KLM, showing signs that airlines are preparing for future growth
› Enhanced global distribution capability through completion of strategic acquisitions of RigNet and EBI ahead of the ViaSat-3 constellation
AWARDS
REVENUE
$ in
billions
$ in billions
OPERATING INCOME (LOSS) NET INCOME (LOSS)* $ in millions $ in millions
NON-GAAP NET INCOME* ADJ. EBITDA $ in millions $ in millions
NET DEBT
NET LEVERAGE RATIO**
$ in
billions
**Net leverage ratio is defined as principal amount of total debt less cash and cash equivalents as of fiscal year end, divided by fiscal year Adjusted EBITDA A
reconciliation of non-GAAP financial measures to their nearest GAAP equivalents is provided at the end of this letter
Shareholder
Letter | Q4 Fiscal Year 2021
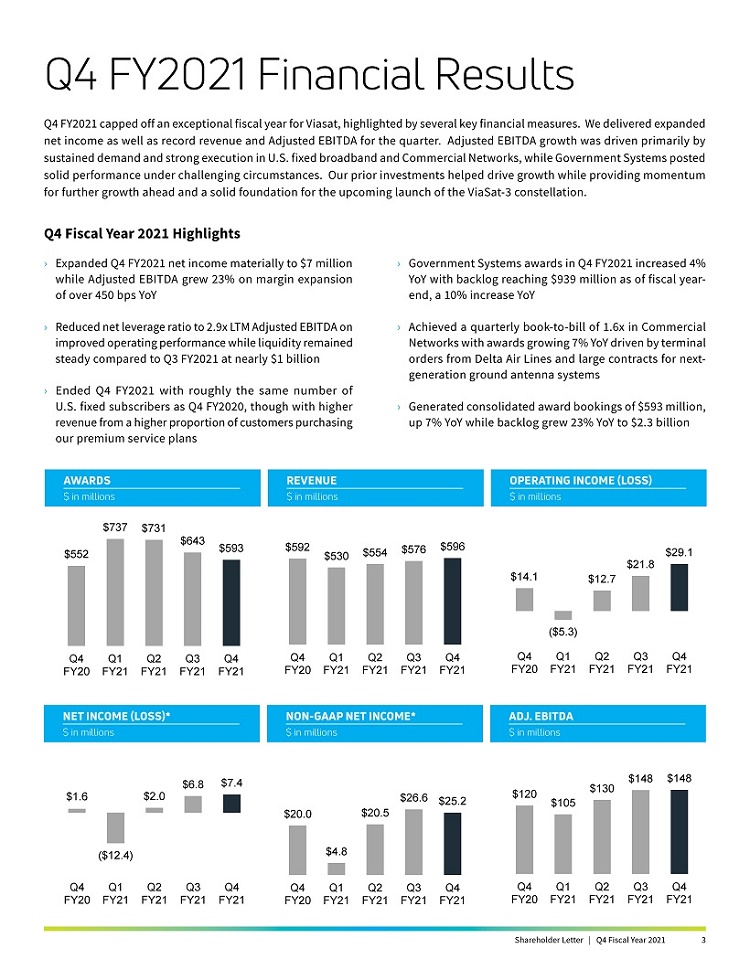
Q4 FY2021 Financial Results
Q4 FY2021 capped off an exceptional fiscal
year for Viasat, highlighted by several key financial measures. We delivered expanded net income as well as record revenue and Adjusted EBITDA for the quarter. Adjusted EBITDA growth was driven primarily by sustained demand and strong execution in
U.S. fixed broadband and Commercial Networks, while Government Systems posted solid performance under challenging circumstances. Our prior investments helped drive growth while providing momentum for further growth ahead and a solid foundation for
the upcoming launch of the ViaSat-3 constellation.
Q4 Fiscal Year 2021 Highlights
› Expanded Q4 FY2021 net income materially to $7 million while Adjusted EBITDA grew 23% on margin expansion of over 450 bps YoY
› Reduced net leverage ratio to 2.9x LTM Adjusted EBITDA on improved operating performance while liquidity remained steady compared to Q3 FY2021 at nearly $1 billion
› Ended Q4 FY2021 with roughly the same number of U.S. fixed subscribers as Q4 FY2020, though with higher revenue from a higher proportion of customers purchasing our premium service
plans
Government Systems awards in Q4 FY2021 increased 4% YoY with backlog reaching $939 million as of fiscal year- end, a 10% increase YoY
Achieved a quarterly book-to-bill of 1.6x in Commercial Networks with awards growing 7% YoY driven by terminal
orders from Delta Air Lines and large contracts for next- generation ground antenna systems
Generated consolidated award bookings of $593 million, up 7% YoY while
backlog grew 23% YoY to $2.3 billion
AWARDS
AWARDSREVENUE
OPERATING INCOME (LOSS)
$ in millions
$ in millions
$ in millions
AWARDSNET INCOME (LOSS)*
NON-GAAP NET INCOME*
ADJ. EBITDA
$ in millions
$ in
millions
$ in millions
Shareholder Letter | Q4
Fiscal Year 2021
AWARDS, REVENUE AND ADJ. EBITDA $ in millions
AWARDS, REVENUE AND ADJ.
EBITDA $ in millions
BACKLOG AND UNAWARDED IDIQ $ in millions
Government Systems
Segment Highlights
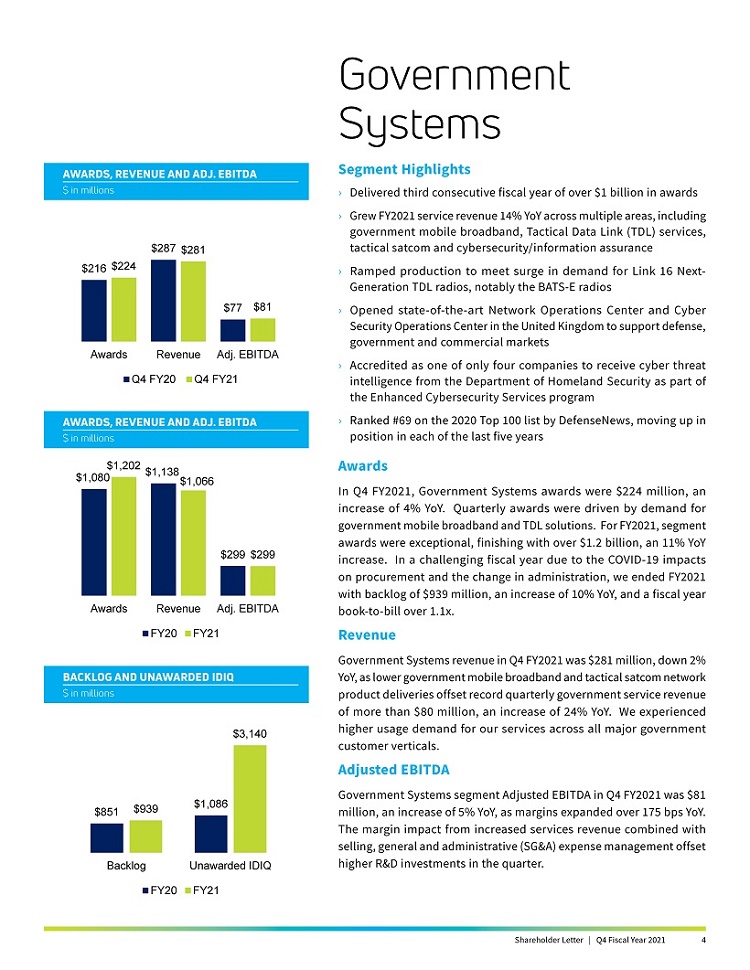
› Delivered third consecutive fiscal year of over $1 billion in awards
› Grew FY2021 service revenue 14% YoY across multiple areas, including government mobile broadband, Tactical Data Link (TDL) services, tactical satcom and cybersecurity/information
assurance
› Ramped production to meet surge in demand for Link 16 Next-Generation TDL radios, notably the BATS-E radios
› Opened state-of-the-art Network Operations
Center and Cyber Security Operations Center in the United Kingdom to support defense, government and commercial markets
› Accredited as one of only four companies to
receive cyber threat intelligence from the Department of Homeland Security as part of the Enhanced Cybersecurity Services program
› Ranked #69 on the 2020 Top 100 list
by DefenseNews, moving up in position in each of the last five years
Awards
In Q4 FY2021,
Government Systems awards were $224 million, an increase of 4% YoY. Quarterly awards were driven by demand for government mobile broadband and TDL solutions. For FY2021, segment awards were exceptional, finishing with over $1.2 billion, an
11% YoY increase. In a challenging fiscal year due to the COVID-19 impacts on procurement and the change in administration, we ended FY2021 with backlog of $939 million, an increase of 10% YoY, and a
fiscal year book-to-bill over 1.1x.
Revenue
Government Systems revenue in Q4 FY2021 was $281 million, down 2% YoY, as lower government mobile broadband and tactical satcom network product deliveries offset record quarterly
government service revenue of more than $80 million, an increase of 24% YoY. We experienced higher usage demand for our services across all major government customer verticals.
Adjusted EBITDA
Government Systems segment Adjusted EBITDA in Q4 FY2021 was $81 million, an increase of 5%
YoY, as margins expanded over 175 bps YoY. The margin impact from increased services revenue combined with selling, general and administrative (SG&A) expense management offset higher R&D investments in the quarter.
Shareholder Letter | Q4 Fiscal Year 2021
AWARDS, REVENUE AND ADJ. EBITDA $ in millions
AWARDS, REVENUE AND ADJ.
EBITDA $ in millions
U.S. Fixed Subscribers (End of Period)
Aircraft in Service*** (End of
Period)
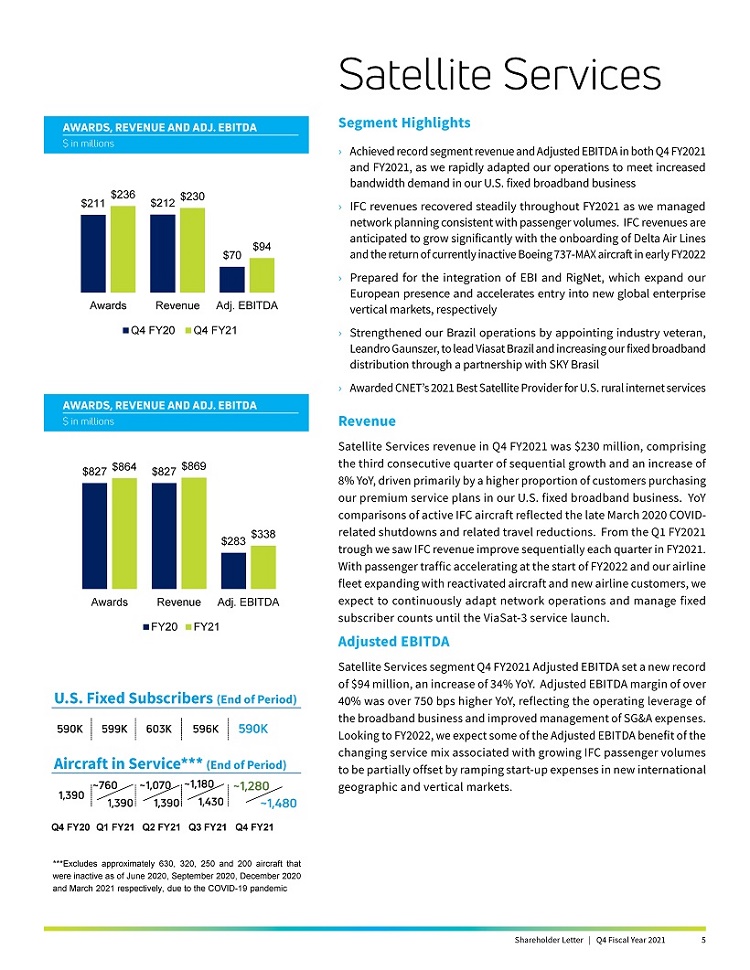
***Excludes approximately 630, 320, 250 and 200 aircraft that were inactive as of June 2020, September 2020, December 2020 and March 2021 respectively, due to the COVID-19 pandemic
Satellite Services
Segment Highlights
› Achieved record segment revenue and Adjusted EBITDA in both Q4 FY2021 and FY2021, as we rapidly adapted our operations to meet increased bandwidth demand in our U.S.
fixed broadband business
› IFC revenues recovered steadily throughout FY2021 as we managed network planning consistent with passenger volumes. IFC revenues are
anticipated to grow significantly with the onboarding of Delta Air Lines and the return of currently inactive Boeing 737-MAX aircraft in early FY2022
› Prepared for the integration of EBI and RigNet, which expand our European presence and accelerates entry into new global enterprise vertical markets, respectively
› Strengthened our Brazil operations by appointing industry veteran, Leandro Gaunszer, to lead Viasat Brazil and increasing our fixed broadband distribution through a partnership with
SKY Brasil
› Awarded CNET’s 2021 Best Satellite Provider for U.S. rural internet services
Revenue
Satellite Services revenue in Q4 FY2021 was $230 million, comprising the third
consecutive quarter of sequential growth and an increase of
8% YoY, driven primarily by a higher proportion of customers purchasing our premium service plans in our U.S.
fixed broadband business. YoY comparisons of active IFC aircraft reflected the late March 2020 COVID-related shutdowns and related travel reductions. From the Q1 FY2021 trough we saw IFC revenue improve sequentially each quarter in FY2021. With
passenger traffic accelerating at the start of FY2022 and our airline fleet expanding with reactivated aircraft and new airline customers, we expect to continuously adapt network operations and manage fixed subscriber counts until the ViaSat-3 service launch.
Adjusted EBITDA
Satellite Services
segment Q4 FY2021 Adjusted EBITDA set a new record of $94 million, an increase of 34% YoY. Adjusted EBITDA margin of over 40% was over 750 bps higher YoY, reflecting the operating leverage of the broadband business and improved management of
SG&A expenses. Looking to FY2022, we expect some of the Adjusted EBITDA benefit of the changing service mix associated with growing IFC passenger volumes to be partially offset by ramping start-up expenses
in new international geographic and vertical markets.
Shareholder Letter | Q4 Fiscal Year 2021
AWARDS, REVENUE AND ADJ. EBITDA $ in millions
$125 $133
$93 $85
($27) ($26) Awards Revenue Adj. EBITDA
Q4 FY20 Q4 FY21
AWARDS, REVENUE AND ADJ. EBITDA $ in millions
$637
$420 $345 $321
($125)($106)
Awards Revenue Adj. EBITDA
FY20 FY21
Commercial Networks
Segment Highlights
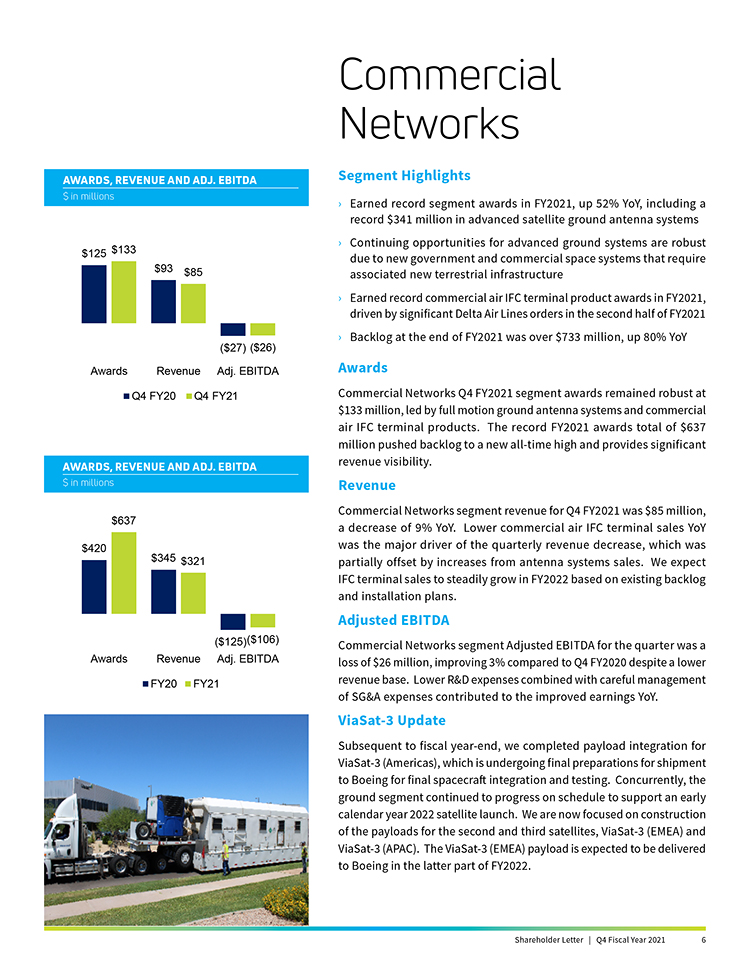
Earned record segment awards in FY2021, up 52% YoY, including a record $341 million in advanced
satellite ground antenna systems
Continuing opportunities for advanced ground systems are robust due to new government and commercial space systems that require associated
new terrestrial infrastructure
Earned record commercial air IFC terminal product awards in FY2021, driven by significant Delta Air Lines orders in the second half of FY2021
Backlog at the end of FY2021 was over $733 million, up 80% YoY
Awards
Commercial Networks Q4 FY2021 segment awards remained robust at $133 million, led by full motion ground antenna systems and commercial air IFC terminal products. The record FY2021 awards
total of $637 million pushed backlog to a new all-time high and provides significant revenue visibility.
Revenue
Commercial Networks segment revenue for Q4 FY2021 was $85 million, a decrease of 9% YoY. Lower commercial air IFC terminal sales YoY was the major driver of the quarterly revenue decrease,
which was partially offset by increases from antenna systems sales. We expect IFC terminal sales to steadily grow in FY2022 based on existing backlog and installation plans.
Adjusted EBITDA
Commercial Networks segment Adjusted EBITDA for the quarter was a loss of $26
million, improving 3% compared to Q4 FY2020 despite a lower revenue base. Lower R&D expenses combined with careful management of SG&A expenses contributed to the improved earnings YoY.
ViaSat-3 Update
Subsequent to fiscal year-end, we completed payload integration for ViaSat-3 (Americas), which is
undergoing final preparations for shipment to Boeing for final spacecraft integration and testing. Concurrently, the ground segment continued to progress on schedule to support an early calendar year 2022 satellite launch. We are now focused on
construction of the payloads for the second and third satellites, ViaSat-3 (EMEA) and ViaSat-3 (APAC). The ViaSat-3 (EMEA) payload is expected to be delivered to Boeing in the latter part of FY2022.
Shareholder Letter | Q4 Fiscal Year 2021 6
OPERATING CASH FLOW $ in millions
CAPITAL EXPENDITURE $ in millions
NET DEBT & NET LEVERAGE RATIO $ in millions (except net leverage)
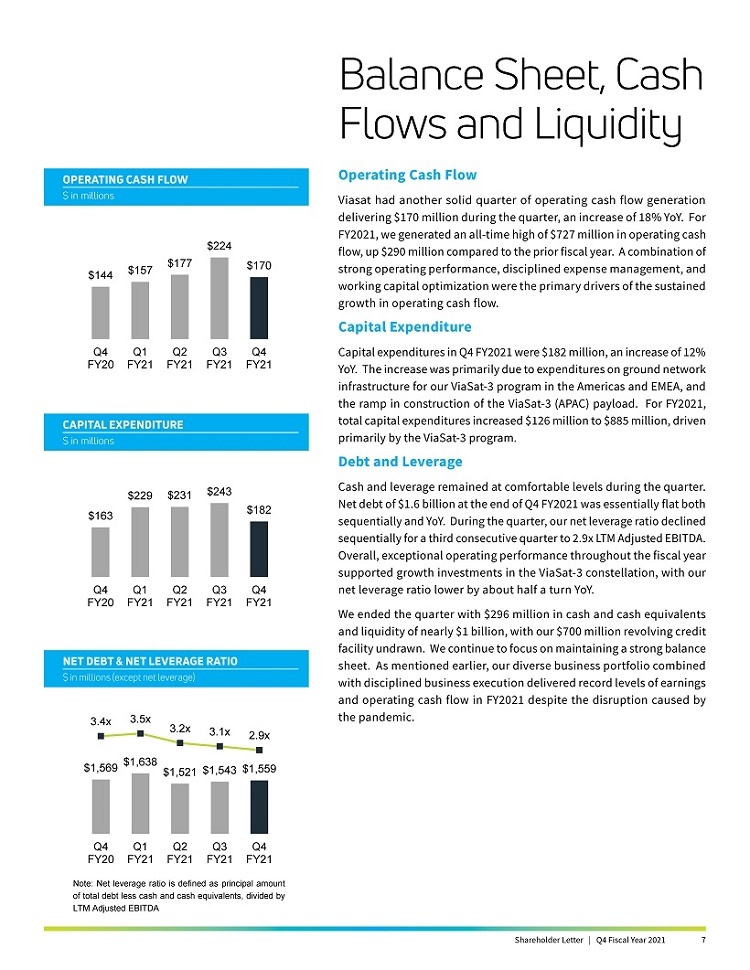
Note: Net leverage
ratio is defined as principal amount of total debt less cash and cash equivalents, divided by LTM Adjusted EBITDA
Balance Sheet, Cash Flows and Liquidity
Operating Cash Flow
Viasat had another solid quarter of operating cash flow generation delivering
$170 million during the quarter, an increase of 18% YoY. For FY2021, we generated an all-time high of $727 million in operating cash flow, up $290 million compared to the prior fiscal year. A
combination of strong operating performance, disciplined expense management, and working capital optimization were the primary drivers of the sustained growth in operating cash flow.
Capital Expenditure
Capital expenditures in Q4 FY2021 were $182 million, an increase of 12% YoY. The increase
was primarily due to expenditures on ground network infrastructure for our ViaSat-3 program in the Americas and EMEA, and the ramp in construction of the ViaSat-3 (APAC)
payload. For FY2021, total capital expenditures increased $126 million to $885 million, driven primarily by the ViaSat-3 program.
Debt and Leverage
Cash and leverage remained at comfortable levels during the quarter. Net debt of
$1.6 billion at the end of Q4 FY2021 was essentially flat both sequentially and YoY. During the quarter, our net leverage ratio declined sequentially for a third consecutive quarter to 2.9x LTM Adjusted EBITDA. Overall, exceptional operating
performance throughout the fiscal year supported growth investments in the ViaSat-3 constellation, with our net leverage ratio lower by about half a turn YoY.
We ended the quarter with $296 million in cash and cash equivalents and liquidity of nearly $1 billion, with our $700 million revolving credit facility undrawn. We continue to
focus on maintaining a strong balance sheet. As mentioned earlier, our diverse business portfolio combined with disciplined business execution delivered record levels of earnings and operating cash flow in FY2021 despite the disruption caused by the
pandemic.
Shareholder Letter | Q4 Fiscal Year 2021

FY2022 Priorities and Outlook
› We expect to continue to build
our operational and go-to-market foundations for the upcoming ViaSat-3 global constellation.
› Our Satellite Services segment outlook for FY2022 is robust, with greater contributions expected from IFC and enterprise markets. Although we expect continued revenue growth, margins
likely will be somewhat pressured by new market entry costs and, later in the fiscal year, infrastructure expenses associated with the ViaSat-3 (Americas) launch.
› IFC growth in FY2022 and beyond is expected to benefit from several factors including the recovery of air traffic volumes that had been depressed by
COVID-19, the return-to-flight of the Boeing 737-MAX and fleet growth with existing and
new customers including Delta and KLM.
› We anticipate modest revenue growth in our fixed broadband business in FY2022, driven by international market expansions in
Europe and Brazil, and moderating growth in the U.S. due to current capacity constraints.
› Government Systems segment revenue is expected to return to growth in
FY2022, driven by FY2021 awards of $1.2 billion and anticipated normalization of the acquisition process post COVID-19. Beyond FY2022, we anticipate substantial growth opportunities in recurring service
revenue as the ViaSat-3 global constellation enters service.
› For FY2022, the Commercial Networks segment is expected to
benefit from the backlog of IFC terminal sales and antenna system products, as well as a robust pipeline of new business opportunities.
› We expect leverage will slowly
increase throughout the fiscal year, reflecting ongoing capital investments in our second and third ViaSat-3 satellites.
As we close
FY2021, we reflect on the first year of our five-year plan to double revenue, more than double Adjusted EBITDA, and turn free cash flow positive 2 to 3 quarters after the launch of the second ViaSat-3 (EMEA)
satellite. Despite the adverse impacts from the COVID-19 pandemic on our performance this fiscal year, we made the operational and financial progress required to keep momentum on target. On behalf of everyone
at Viasat, we want to thank our employees, customers, shareholders and partners for their continued support, and we look forward to keeping you posted on our progress.
Sincerely,
Rick Baldridge
Mark Dankberg
Shareholder Letter | Q4 Fiscal Year 2021
Forward Looking Statements
This shareholder letter contains
forward-looking statements that are subject to the safe harbors created under the Securities Act of 1933 and the Securities Exchange Act of 1934. Forward-looking statements include, among others, statements that refer to the impact of the novel
coronavirus (COVID-19) pandemic on our business; expectations regarding an end to the pandemic and a lessening of its effects on our business, including expectations for increased airline passenger traffic and
in-flight connectivity (IFC) growth; projections of earnings, revenue, leverage, capital investments, costs or other financial items; anticipated growth and trends in our business or key markets, including
expectations for growth following launch of the ViaSat-3 constellation; the ability to capitalize on awards received and unawarded IDIQ contract vehicles; future economic conditions and performance, including
expectations for performance and results of operations in FY2022 and beyond; the development, customer acceptance and anticipated performance of technologies, products or services; international growth opportunities, including in Europe and Brazil;
satellite construction and launch activities, including expectations regarding payload delivery, integration, testing, completion and launch of our ViaSat-3 class satellites; the performance and anticipated
benefits of our ViaSat-2 and ViaSat-3 class satellites and any future satellite we may construct or acquire; the expected completion, capacity, service, coverage,
service speeds and other features of our satellites, and the timing, cost, economics and other benefits associated therewith; anticipated subscriber growth; plans, objectives and strategies for future operations; the number of IFC systems expected
to be installed under existing contracts with commercial airlines and expectations regarding return to service of currently inactive aircraft; and other characterizations of future events or circumstances, are forward-looking statements. Readers are
cautioned that these forward-looking statements are only predictions and are subject to risks, uncertainties and assumptions that are difficult to predict. Factors that could cause actual results to differ materially and adversely include: our
ability to realize the anticipated benefits of the ViaSat-2 and ViaSat-3 class satellites and any future satellite we may construct or acquire; unexpected expenses
related to our satellite projects; our ability to successfully implement our business plan for our broadband services on our anticipated timeline or at all; capacity constraints in our business in the lead-up
to the launch of services on our ViaSat-3 satellites; risks associated with the construction, launch and operation of satellites, including the effect of any anomaly, operational failure or degradation in
satellite performance; the impact of the COVID-19 pandemic on our business, suppliers, consumers, customers, and employees or the overall economy; our ability to realize the anticipated benefits of our
acquisitions or strategic partnering arrangements, including the RigNet and EBI acquisitions; our ability to successfully develop, introduce and sell new technologies, products and services; audits by the U.S. Government; changes in the global
business environment and economic conditions; delays in approving U.S. Government budgets and cuts in government defense expenditures; our reliance on U.S. Government contracts, and on a small number of contracts which account for a significant
percentage of our revenues; reduced demand for products and services as a result of continued constraints on capital spending by customers; changes in relationships with, or the financial condition of, key customers or suppliers; our reliance on a
limited number of third parties to manufacture and supply our products; increased competition; introduction of new technologies and other factors affecting the communications and defense industries generally; the effect of adverse regulatory changes
(including changes affecting spectrum availability or permitted uses) on our ability to sell or deploy our products and services; changes in the way others use spectrum; our inability to access additional spectrum, use spectrum for additional
purposes, and/or operate satellites at additional orbital locations; competing uses of the same spectrum or orbital locations that we utilize or seek to utilize; the effect of recent changes to U.S. tax laws; our level of indebtedness and ability to
comply with applicable debt covenants; our involvement in litigation, including intellectual property claims and litigation to protect our proprietary technology; and our dependence on a limited number of key employees. In addition, please refer to
the risk factors contained in our SEC filings available at www.sec.gov, including our most recent Annual Report on Form 10-K and Quarterly Reports on Form 10-Q. Readers
are cautioned not to place undue reliance on any forward-looking statements, which speak only as of the date on which they are made. We undertake no obligation to update or revise any forward-looking statements for any reason.
Use of Non-GAAP Financial Information
To supplement Viasat’s
consolidated financial statements presented in accordance with generally accepted accounting principles (GAAP), Viasat uses non-GAAP net income (loss) attributable to Viasat Inc. and Adjusted EBITDA, measures
Viasat believes are appropriate to enhance an overall understanding of Viasat’s past financial performance and prospects for the future. We believe the non-GAAP results provide useful information to both
management and investors by excluding specific expenses that we believe are not indicative of our core operating results. In addition, since we have historically reported non-GAAP results to the investment
community, we believe the inclusion of non-GAAP numbers provides consistency in our financial reporting and facilitates comparisons to the Company’s historical operating results. Further, these non-GAAP results are among the primary indicators that management uses as a basis for evaluating the operating performance of our segments, allocating resources to such segments, planning and forecasting in future
periods. The presentation of this additional information is not meant to be considered in isolation or as a substitute for measures of financial performance prepared in accordance with GAAP. A reconciliation of specific adjustments to GAAP results
is provided in the tables below.
Copyright © 2021 Viasat, Inc. All rights reserved. Viasat, the Viasat logo and the Viasat signal are registered trademarks of Viasat,
Inc. All other product or company names mentioned are used for identification purposes only and may be trademarks of their respective owners.
Shareholder
Letter | Q4 Fiscal Year 2021
Viasat Fourth Quarter Fiscal Year 2021 Results
| Financial Results |
||||||||||||
| (In millions, except per share data) |
Q4 FY21 | Q4 FY20 | Year-Over- Year Change |
FY21 | FY20 | Year-Over- Year Change | ||||||
|
Revenues |
$595.8 | $591.7 | 1% | $2,256.1 | $2,309.2 | (2)% | ||||||
|
Net income (loss)1 |
$7.4 | $1.6 | 364% | $3.7 | ($0.2) | * | ||||||
|
Non-GAAP net income1 |
$25.2 | $20.0 | 26% | $77.0 | $72.0 | 7% | ||||||
|
Adjusted EBITDA |
$148.1 | $120.3 | 23% | $530.7 | $457.6 | 16% | ||||||
|
Diluted per share net income (loss) 1 |
$0.11 | $0.03 | 267% | $0.06 | ($0.00) | * | ||||||
|
Non-GAAP diluted per share net income1 |
$0.36 | $0.32 | 13% | $1.15 | $1.14 | 1% | ||||||
|
Fully diluted weighted average shares2 |
69.8 | 63.1 | 11% | 67.0 | 61.6 | 9% | ||||||
|
New contract awards3 |
$593.0 | $551.6 | 7% | $2,703.9 | $2,327.1 | 16% | ||||||
|
Sales backlog4 |
$2,306.3 | $1,870.7 | 23% | $2,306.3 | $1,870.7 | 23% | ||||||
| Segment Results |
||||||||||||
| (In millions) | Q4 FY21 | Q4 FY20 | Year-Over- Year Change |
FY21 | FY20 | Year-Over- Year Change | ||||||
| Satellite Services |
||||||||||||
|
New contract awards3 |
$235.7 | $211.4 | 12% | $864.2 | $826.7 | 5% | ||||||
|
Revenues |
$230.3 | $212.4 | 8% | $868.9 | $826.6 | 5% | ||||||
|
Operating profit5 |
$14.8 | $0.4 | 3925% | $35.9 | $7.0 | 411% | ||||||
|
Adjusted EBITDA |
$93.7 | $70.1 | 34% | $337.8 | $283.0 | 19% | ||||||
|
Commercial Networks |
||||||||||||
|
New contract awards |
$133.3 | $124.6 | 7% | $637.3 | $419.9 | 52% | ||||||
|
Revenues |
$84.7 | $92.8 | (9)% | $320.9 | $344.6 | (7)% | ||||||
|
Operating loss5 |
($45.0) | ($43.3) | 4% | ($180.7) | ($186.9) | (3)% | ||||||
|
Adjusted EBITDA |
($26.1) | ($26.9) | (3)% | ($105.7) | ($124.5) | (15)% | ||||||
|
Government Systems |
||||||||||||
|
New contract awards |
$224.0 | $215.6 | 4% | $1,202.4 | $1,080.5 | 11% | ||||||
|
Revenues |
$280.8 | $286.6 | (2)% | $1,066.3 | $1,138.1 | (6)% | ||||||
|
Operating profit5 |
$60.6 | $58.7 | 3% | $208.6 | $225.9 | (8)% | ||||||
|
Adjusted EBITDA |
$80.6 | $77.1 | 5% | $298.6 | $299.0 | 0% | ||||||
| 1 | Attributable to Viasat, Inc. common stockholders. |
| 2 | As the twelve months ended March 31, 2020 resulted in a net loss, the weighted average number of shares used to calculate basic and diluted net loss per share is the same, as diluted shares would be anti-dilutive. However, as the non-GAAP financial information for the twelve months ended March 31, 2020 resulted in non-GAAP net income, 63.0 million, diluted weighted average number of shares were used instead to calculate non-GAAP diluted net income per share. |
| 3 | Awards exclude future revenue under recurring consumer commitment arrangements. |
| 4 | Amounts include certain backlog adjustments due to contract changes and amendments. Our backlog includes contracts with subscribers for fixed broadband services in our satellite services segment. Backlog does not include anticipated purchase orders and requests for the installation of in-flight connectivity systems or future recurring in-flight internet service revenues under our commercial in-flight internet agreements in our Commercial Networks and Satellite Services segments, respectively. |
| 5 | Before corporate and amortization of acquired intangible assets. |
| * | Percentage not meaningful. |

Shareholder Letter | Q4 Fiscal Year 2021 10
Viasat Fourth Quarter Fiscal Year 2021 Results (cont.)
Condensed Consolidated Statements of Operations
(Unaudited)
(In thousands, except per share data)
| Three months ended | Twelve months ended | |||||||||||||||
| March 31, 2021 | March 31, 2020 | March 31, 2021 | March 31, 2020 | |||||||||||||
| Revenues: | ||||||||||||||||
| Product revenues | $ | 271,322 | $ | 299,006 | $ | 1,044,450 | $ | 1,172,541 | ||||||||
| Service revenues | 324,460 | 292,715 | 1,211,657 | 1,136,697 | ||||||||||||
|
|
|
|
|
|
|
|
|
|
|
|
| |||||
| Total revenues | 595,782 | 591,721 | 2,256,107 | 2,309,238 | ||||||||||||
| Operating expenses: |
||||||||||||||||
| Cost of product revenues |
198,216 | 211,644 | 774,893 | 845,757 | ||||||||||||
| Cost of service revenues |
201,897 | 199,255 | 789,391 | 763,930 | ||||||||||||
| Selling, general and administrative |
133,432 | 134,557 | 512,316 | 523,085 | ||||||||||||
| Independent research and development |
31,822 | 30,482 | 115,792 | 130,434 | ||||||||||||
| Amortization of acquired intangible assets |
1,311 | 1,691 | 5,482 | 7,611 | ||||||||||||
|
|
|
|
|
|
|
|
|
|
|
|
| |||||
| Income from operations |
29,104 | 14,092 | 58,233 | 38,421 | ||||||||||||
| Interest expense, net |
(5,527 | ) | (8,520 | ) | (32,247 | ) | (36,993 | ) | ||||||||
|
|
|
|
|
|
|
|
|
|
|
|
| |||||
| Income before income taxes |
23,577 | 5,572 | 25,986 | 1,428 | ||||||||||||
| (Provision for) benefit from income taxes |
(8,868 | ) | (816 | ) | (9,441 | ) | 7,915 | |||||||||
| Equity in income of unconsolidated affiliate, net |
(232 | ) | 142 | 556 | 4,470 | |||||||||||
|
|
|
|
|
|
|
|
|
|
|
|
| |||||
| Net income |
14,477 | 4,898 | 17,101 | 13,813 | ||||||||||||
| Less: net income attributable to noncontrolling interests, net of tax |
7,120 | 3,312 | 13,410 | 14,025 | ||||||||||||
|
|
|
|
|
|
|
|
|
|
|
|
| |||||
| Net income (loss) attributable to Viasat Inc. |
$ | 7,357 | $ | 1,586 | $ | 3,691 | $ | (212 | ) | |||||||
|
|
|
|
|
|
|
|
|
|
|
|
| |||||
| Diluted net income (loss) per share attributable to Viasat Inc. common stockholders |
$ | 0.11 | $ | 0.03 | $ | 0.06 | $ | (0.00 | ) | |||||||
|
|
|
|
|
|
|
|
|
|
|
|
| |||||
| Diluted common equivalent shares (2) |
69,792 | 63,090 | 67,020 | 61,632 | ||||||||||||
| AN ITEMIZED RECONCILIATION BETWEEN NET INCOME (LOSS) ATTRIBUTABLE TO VIASAT INC. |
|
|||||||||||||||
| ON A GAAP BASIS AND NON-GAAP BASIS IS AS FOLLOWS: |
|
|||||||||||||||
| (In thousands, except per share data) |
Three months ended | Twelve months ended | ||||||||||||||
| March 31, 2021 | March 31, 2020 | March 31, 2021 | March 31, 2020 | |||||||||||||
| GAAP net income (loss) attributable to Viasat Inc. |
$ | 7,357 | $ | 1,586 | $ | 3,691 | $ | (212 | ) | |||||||
| Amortization of acquired intangible assets |
1,311 | 1,691 | 5,482 | 7,611 | ||||||||||||
| Stock-based compensation expense |
19,912 | 22,317 | 84,879 | 86,553 | ||||||||||||
| Acquisition related expenses |
1,452 | — | 3,328 | — | ||||||||||||
| Income tax effect (1) |
(4,844 | ) | (5,610 | ) | (20,379 | ) | (21,930 | ) | ||||||||
|
|
|
|
|
|
|
|
|
|
|
|
| |||||
| Non-GAAP net income attributable to Viasat Inc. |
$ | 25,188 | $ | 19,984 | $ | 77,001 | $ | 72,022 | ||||||||
|
|
|
|
|
|
|
|
|
|
|
|
| |||||
| Non-GAAP diluted net income per share attributable to Viasat Inc. common stockholders |
$ | 0.36 | $ | 0.32 | $ | 1.15 | $ | 1.14 | ||||||||
|
|
|
|
|
|
|
|
|
|
|
|
| |||||
| Diluted common equivalent shares (2) | 69,792 | 63,090 | 67,020 | 63,021 | ||||||||||||
| (1) | The income tax effect is calculated using the tax rate applicable for the non-GAAP adjustments. |
| (2) | As the twelve months ended March 31, 2020 resulted in a net loss, the weighted average number of shares used to calculate basic and diluted net loss per share is the same, as diluted shares would be anti-dilutive. However, as the non-GAAP financial information for the twelve months ended March 31, 2020 resulted in non-GAAP net income, diluted weighted average number of shares were used instead to calculate non-GAAP diluted net income per share. |
| AN ITEMIZED RECONCILIATION BETWEEN NET INCOME (LOSS) ATTRIBUTABLE TO VIASAT INC. AND ADJUSTED EBITDA IS AS FOLLOWS: |
| |||||||||||||||
| (In thousands) |
Three months ended | Twelve months ended | ||||||||||||||
| March 31, 2021 | March 31, 2020 | March 31, 2021 | March 31, 2020 | |||||||||||||
| GAAP net income (loss) attributable to Viasat Inc. |
$ | 7,357 | $ | 1,586 | $ | 3,691 | $ | (212 | ) | |||||||
| Provision for (benefit from) income taxes |
8,868 | 816 | 9,441 | (7,915 | ) | |||||||||||
| Interest expense, net |
5,527 | 8,520 | 32,247 | 36,993 | ||||||||||||
| Depreciation and amortization |
104,986 | 87,069 | 397,102 | 342,178 | ||||||||||||
| Stock-based compensation expense |
19,912 | 22,317 | 84,879 | 86,553 | ||||||||||||
| Acquisition related expenses |
1,452 | — | 3,328 | — | ||||||||||||
|
|
|
|
|
|
|
|
|
|
|
|
| |||||
| Adjusted EBITDA |
$ | 148,102 | $ | 120,308 | $ | 530,688 | $ | 457,597 | ||||||||
|
|
|
|
|
|
|
|
|
|
|
|
| |||||
Shareholder Letter | Q4 Fiscal Year 2021 11
Viasat Fourth Quarter Fiscal Year 2021 Results (cont.)
AN ITEMIZED RECONCILIATION BETWEEN SEGMENT OPERATING PROFIT (LOSS) BEFORE
CORPORATE AND AMORTIZATION OF ACQUIRED INTANGIBLE ASSETS AND ADJUSTED EBITDA IS AS FOLLOWS:
(In thousands)
| Three months ended March 31, 2021 | Three months ended March 31, 2020 | |||||||||||||||||||||||||||||||
| Satellite Services |
Commercial Networks |
Government Systems |
Total | Satellite Services |
Commercial Networks |
Government Systems |
Total | |||||||||||||||||||||||||
| Segment operating profit (loss) before corporate and amortization of acquired intangible assets |
$ | 14,770 | $ | (44,964 | ) | $ | 60,609 | $ | 30,415 | $ | 367 | $ | (43,318 | ) | $ | 58,734 | $ | 15,783 | ||||||||||||||
| Depreciation (3) |
63,101 | 9,416 | 16,409 | 88,926 | 54,915 | 6,419 | 10,449 | 71,783 | ||||||||||||||||||||||||
| Stock-based compensation expense |
6,303 | 6,830 | 6,779 | 19,912 | 6,737 | 8,013 | 7,567 | 22,317 | ||||||||||||||||||||||||
| Other amortization |
8,300 | 2,575 | 3,874 | 14,749 | 7,984 | 1,977 | 3,634 | 13,595 | ||||||||||||||||||||||||
| Acquisition related expenses |
1,452 | — | — | 1,452 | — | — | — | — | ||||||||||||||||||||||||
| Equity (loss) income of unconsolidated affiliate, net |
(232 | ) | — | — | (232 | ) | 142 | — | — | 142 | ||||||||||||||||||||||
| Noncontrolling interests |
— | — | (7,120 | ) | (7,120 | ) | — | — | (3,312 | ) | (3,312 | ) | ||||||||||||||||||||
|
|
|
|
|
|
|
|
|
|
|
|
|
|
|
|
|
|||||||||||||||||
| Adjusted EBITDA |
$ | 93,694 | $ | (26,143 | ) | $ | 80,551 | $ | 148,102 | $ | 70,145 | $ | (26,909 | ) | $ | 77,072 | $ | 120,308 | ||||||||||||||
|
|
|
|
|
|
|
|
|
|
|
|
|
|
|
|
|
|||||||||||||||||
| Twelve months ended March 31, 2021 | Twelve months ended March 31, 2020 | |||||||||||||||||||||||||||||||
| Satellite Services |
Commercial Networks |
Government Systems |
Total | Satellite Services |
Commercial Networks |
Government Systems |
Total | |||||||||||||||||||||||||
| Segment operating profit (loss) before corporate and amortization of acquired intangible assets |
$ | 35,853 | $ | (180,749 | ) | $ | 208,611 | $ | 63,715 | $ | 7,015 | $ | (186,877 | ) | $ | 225,894 | $ | 46,032 | ||||||||||||||
| Depreciation (3) |
240,128 | 34,618 | 56,115 | 330,861 | 213,616 | 24,489 | 41,628 | 279,733 | ||||||||||||||||||||||||
| Stock-based compensation expense |
25,848 | 29,761 | 29,270 | 84,879 | 26,260 | 30,309 | 29,984 | 86,553 | ||||||||||||||||||||||||
| Other amortization |
33,262 | 10,125 | 17,372 | 60,759 | 31,675 | 7,618 | 15,541 | 54,834 | ||||||||||||||||||||||||
| Acquisition related expenses |
2,117 | 565 | 646 | 3,328 | — | — | — | — | ||||||||||||||||||||||||
| Equity in income of unconsolidated affiliate, net |
556 | — | — | 556 | 4,470 | — | — | 4,470 | ||||||||||||||||||||||||
| Noncontrolling interests |
— | — | (13,410 | ) | (13,410 | ) | — | — | (14,025 | ) | (14,025 | ) | ||||||||||||||||||||
|
|
|
|
|
|
|
|
|
|
|
|
|
|
|
|
|
|||||||||||||||||
| Adjusted EBITDA |
$ | 337,764 | $ | (105,680 | ) | $ | 298,604 | $ | 530,688 | $ | 283,036 | $ | (124,461 | ) | $ | 299,022 | $ | 457,597 | ||||||||||||||
|
|
|
|
|
|
|
|
|
|
|
|
|
|
|
|
|
|||||||||||||||||
| (3) | Depreciation expenses not specifically recorded in a particular segment have been allocated based on other indirect allocable costs, which management believes is a reasonable method. |
Condensed Consolidated Balance Sheets
(Unaudited)
(In thousands)
| As of | As of | As of | As of | |||||||||||||||
| Assets | March 31, 2021 | March 31, 2020 | Liabilities and Equity | March 31, 2021 | March 31, 2020 | |||||||||||||
| Current assets: |
Current liabilities: | |||||||||||||||||
| Cash and cash equivalents |
$ | 295,949 | $ | 304,309 | Accounts payable | $ | 145,134 | $ | 183,601 | |||||||||
| Accounts receivable, net |
238,652 | 330,698 | Accrued and other liabilities | 532,831 | 391,190 | |||||||||||||
| Inventories |
336,672 | 294,416 | Current portion of long-term debt | 30,472 | 29,788 | |||||||||||||
|
|
|
|
|
|||||||||||||||
| Prepaid expenses and other current assets |
119,960 | 116,281 | Total current liabilities | 708,437 | 604,579 | |||||||||||||
|
|
|
|
|
|||||||||||||||
| Total current assets |
991,233 | 1,045,704 | ||||||||||||||||
| Senior notes | 1,683,264 | 1,285,497 | ||||||||||||||||
| Other long-term debt | 119,420 | 536,166 | ||||||||||||||||
| Non-current operating lease liabilities | 313,762 | 286,550 | ||||||||||||||||
| Property, equipment and satellites, net |
3,050,483 | 2,586,735 | Other liabilities | 137,350 | 120,934 | |||||||||||||
|
|
|
|
|
|||||||||||||||
| Operating lease right-of-use assets |
340,456 | 308,441 | Total liabilities | 2,962,233 | 2,833,726 | |||||||||||||
|
|
|
|
|
|||||||||||||||
| Other acquired intangible assets, net |
9,568 | 14,439 | Total Viasat Inc. stockholders’ equity | 2,351,469 | 2,027,787 | |||||||||||||
| Goodwill |
122,300 | 121,197 | Noncontrolling interest in subsidiary | 35,765 | 22,355 | |||||||||||||
|
|
|
|
|
|||||||||||||||
| Other assets |
835,427 | 807,352 | Total equity | 2,387,234 | 2,050,142 | |||||||||||||
|
|
|
|
|
|
|
|
|
|||||||||||
| Total assets |
$ | 5,349,467 | $ | 4,883,868 | Total liabilities and equity | $ | 5,349,467 | $ | 4,883,868 | |||||||||
|
|
|
|
|
|
|
|
|
|||||||||||
Shareholder Letter | Q4 Fiscal Year 2021 12
Viasat Financial Reconciliation Prior Periods
| AN ITEMIZED RECONCILIATION BETWEEN NET INCOME (LOSS) ATTRIBUTABLE TO VIASAT, INC. ON A GAAP BASIS AND NON-GAAP BASIS IS AS FOLLOWS: |
| |||||||||||
| (In thousands) |
Three months ended | |||||||||||
| December 31, 2020 | September 30, 2020 | June 30, 2020 | ||||||||||
| GAAP net income (loss) attributable to Viasat, Inc. |
$ | 6,760 | $ | 1,963 | $ | (12,389 | ) | |||||
| Amortization of acquired intangible assets |
1,313 | 1,300 | 1,558 | |||||||||
| Stock-based compensation expense |
21,639 | 22,386 | 20,942 | |||||||||
| Acquisition related expenses |
1,876 | — | — | |||||||||
| Income tax effect (1) |
(5,031 | ) | (5,183 | ) | (5,321 | ) | ||||||
|
|
|
|
|
|
|
|
|
| ||||
| Non-GAAP net income attributable to Viasat, Inc. |
$ | 26,557 | $ | 20,466 | $ | 4,790 | ||||||
|
|
|
|
|
|
|
|
|
| ||||
| Twelve months ended | ||||||||||||
| March 31, 2019 | March 31, 2018 | March 31, 2017 | ||||||||||
| GAAP net (loss) income attributable to Viasat, Inc. |
$ | (67,623 | ) | $ | (67,305 | ) | $ | 23,767 | ||||
| Amortization of acquired intangible assets |
9,655 | 12,231 | 10,788 | |||||||||
| Stock-based compensation expense |
79,599 | 68,545 | 55,775 | |||||||||
| Loss on extinguishment of debt |
— | 10,217 | — | |||||||||
| Acquisition related expenses |
— | — | 615 | |||||||||
| Income tax effect (1) |
(20,746 | ) | (21,508 | ) | (25,372 | ) | ||||||
|
|
|
|
|
|
|
|
|
| ||||
| Non-GAAP net income attributable to Viasat, Inc. |
$ | 885 | $ | 2,180 | 65,573 | |||||||
|
|
|
|
|
|
|
|
|
| ||||
| (1) | The income tax effect is calculated using the tax rate applicable for the non-GAAP adjustments. |
| AN ITEMIZED RECONCILIATION BETWEEN NET INCOME (LOSS) ATTRIBUTABLE TO VIASAT, INC. AND ADJUSTED EBITDA IS AS FOLLOWS:
|
| |||||||||||
| (In thousands) |
Three months ended | |||||||||||
| December 31, 2020 | September 30, 2020 | June 30, 2020 | ||||||||||
| GAAP net income (loss) attributable to Viasat, Inc. |
$ | 6,760 | $ | 1,963 | $ | (12,389 | ) | |||||
| Provision for (benefit from) income taxes |
7,008 | (687 | ) | (5,748 | ) | |||||||
| Interest expense, net |
7,766 | 9,662 | 9,292 | |||||||||
| Depreciation and amortization |
102,502 | 97,012 | 92,602 | |||||||||
| Stock-based compensation expense |
21,639 | 22,386 | 20,942 | |||||||||
| Acquisition related expenses |
1,876 | — | — | |||||||||
|
|
|
|
|
|
|
|
|
| ||||
| Adjusted EBITDA |
$ | 147,551 | $ | 130,336 | $ | 104,699 | ||||||
|
|
|
|
|
|
|
|
|
| ||||
| Twelve months ended | ||||||||||||
| March 31, 2019 | March 31, 2018 | March 31, 2017 | ||||||||||
| GAAP net (loss) income attributable to Viasat, Inc. |
$ | (67,623 | ) | $ | (67,305 | ) | $ | 23,767 | ||||
| (Benefit from) provision for income taxes |
(41,014 | ) | (35,217 | ) | 3,617 | |||||||
| Interest expense, net |
49,861 | 3,066 | 11,075 | |||||||||
| Depreciation and amortization |
318,613 | 255,652 | 245,922 | |||||||||
| Stock-based compensation expense |
79,599 | 68,545 | 55,775 | |||||||||
| Loss on extinguishment of debt |
— | 10,217 | — | |||||||||
| Acquisition related expenses |
— | — | 615 | |||||||||
|
|
|
|
|
|
|
|
|
| ||||
| Adjusted EBITDA |
$ | 339,436 | $ | 234,958 | $ | 340,771 | ||||||
|
|
|
|
|
|
|
|
|
| ||||
Shareholder Letter | Q4 Fiscal Year 2021 13
Serious News for Serious Traders! Try StreetInsider.com Premium Free!
You May Also Be Interested In
- Merck Announces First-Quarter 2024 Financial Results
- Strategic Education, Inc. Reports First Quarter 2024 Results
- SK Capital Has Completed the Sale of Foremark to Affiliates of CC Industries
Create E-mail Alert Related Categories
SEC FilingsSign up for StreetInsider Free!
Receive full access to all new and archived articles, unlimited portfolio tracking, e-mail alerts, custom newswires and RSS feeds - and more!
