

Form 8-K VEREIT, Inc. For: May 06
 Tweet
Tweet Share
ShareExhibit 99.1

FOR IMMEDIATE RELEASE
VEREIT® Announces First Quarter 2021 Operating Results
Phoenix, AZ, May 6, 2021 -- VEREIT, Inc. (NYSE: VER) (“VEREIT” or the “Company”) announced today its operating results for the three months ending March 31, 2021.
First Quarter 2021 Financial and Operating Highlights
•Net income of $120.7 million and net income per diluted share of $0.50
•Achieved $0.80 AFFO per diluted share
•Rent collection of 99%
•Compared to last quarter, Total debt - as reported decreased from $5.9 billion to $5.6 billion; Adjusted Principal Outstanding decreased from $6.1 billion to $5.8 billion; Net Debt decreased from $5.6 billion to $5.5 billion; and Net Debt to Normalized EBITDA decreased from 5.64x to 5.45x
•Redeemed $100.0 million of the Company’s 6.7% Series F preferred stock which leaves approximately $373.0 million outstanding
•S&P Global Ratings upgraded the Company’s corporate rating from ‘BBB-‘ to ‘BBB’ with the Rating Outlook remaining at ‘Stable,’ Moody’s upgraded the Company’s rating from ‘Baa3’ to ‘Baa2’ with the Rating Outlook remaining at ‘Stable’ and Fitch Ratings affirmed the Company’s rating of ‘BBB’ with the Rating Outlook remaining at ‘Stable’
•Subsequent to the end of the quarter, the Company signed a definitive merger agreement with Realty Income Corporation. Upon closing, the contemplated merger would create a combined company with an enterprise value of approximately $50 billion. The merger is expected to close in the fourth quarter of 2021, subject to customary closing conditions, including the approval of both VEREIT’s and Realty Income’s shareholders.
Year-To-Date Transaction Highlights as of April 30, 2021
•Acquisitions totaled $168.1 million with over $300.0 million under contract or letter of intent
•Office dispositions totaled $235.5 million reducing office exposure to 14.9%
•Strategic dispositions totaled $48.3 million
First Quarter 2021 Financial Results
Total Revenues
Total revenues for the quarter ended March 31, 2021 decreased $8.4 million to $290.8 million as compared to total revenues of $299.2 million for the same quarter in 2020.
Net Income and Net Income Attributable to Common Stockholders per Diluted Share
Net income for the quarter ended March 31, 2021 increased $33.8 million to a net income of $120.7 million as compared to net income of $86.9 million for the same quarter in 2020, and net income per diluted share increased $0.16 to a net income per diluted share of $0.50 for the quarter ended March 31, 2021, as compared to net income per diluted share of $0.34 for the same quarter in 2020.
Normalized EBITDA
Normalized EBITDA for the quarter ended March 31, 2021 decreased $6.0 million to $251.2 million as compared to Normalized EBITDA of $257.2 million for the same quarter in 2020.
1
Funds From Operations Attributable to Common Stockholders and Limited Partners (“FFO”) and FFO per Diluted Share
FFO for the quarter ended March 31, 2021 decreased $2.8 million to $179.0 million, as compared to $181.8 million for the same quarter in 2020, and FFO per diluted share decreased $0.06 to $0.78 for the quarter ended March 31, 2021, as compared to FFO per diluted share of $0.84 for the same quarter in 2020.
Adjusted FFO Attributable to Common Stockholders and Limited Partners (“AFFO”) and AFFO per Diluted Share
AFFO for the quarter ended March 31, 2021 increased $2.0 million to $183.0 million, as compared to $181.0 million for the same quarter in 2020, and AFFO per diluted share decreased $0.04 to $0.80 for the quarter ended March 31, 2021, as compared to $0.84 for the same quarter in 2020.
Balance Sheet and Liquidity
As of the end of the first quarter, the Company had corporate liquidity of approximately $1.8 billion, comprised of $318.6 million in cash and cash equivalents and $1.5 billion of availability under its credit facility. In addition, secured debt was reduced by $292.8 million.
Capital Market Activity
The Company redeemed $100.0 million of VEREIT’s 6.7% Series F preferred stock on January 15, 2021, which was previously announced on December 16, 2020. This leaves approximately $373.0 million outstanding.
Consolidated Financial Statistics
Financial Statistics as of the quarter ended March 31, 2021 are as follows: Net Debt to Normalized EBITDA of 5.45x, Fixed Charge Coverage Ratio of 3.8x, Unencumbered Asset Ratio of 86.0%, Net Debt to Gross Real Estate Investments of 37.8%, and Weighted Average Debt Term of 6.0 years.
Common Stock Dividend Information
On May 04, 2021, the Company’s Board of Directors declared a quarterly dividend of $0.462 per share for the second quarter of 2021. The dividend will be paid on July 15, 2021 to common stockholders of record as of June 30, 2021.
Real Estate Portfolio
As of March 31, 2021, the Company’s portfolio consisted of 3,855 properties with total portfolio occupancy of 98.0%, investment grade tenancy of 37.8% and a weighted-average remaining lease term of 8.4 years.
Real Estate Leasing Activity
During the first quarter, the Company entered into 61 new and renewal leases on approximately 1.4 million square feet, or 1.5% of the portfolio. Leasing activity included 0.3 million square feet of early renewals.
Acquisitions
During the quarter ended March 31, 2021, the Company invested in 54 properties for $138.4 million at an average cash cap rate of 7.1%.
Office Dispositions
During the quarter ended March 31, 2021, the Company disposed of 10 office properties for an aggregate sales price of $235.5 million. Of this amount, $225.6 million was used in the total weighted average cash cap rate calculation of 6.2%. The gain on first quarter office dispositions was $56.8 million.
Strategic Dispositions
During the quarter ended March 31, 2021, the Company disposed of 20 properties for an aggregate sales price of $35.7 million. Of this amount, $27.0 million was used in the total weighted average cash cap rate calculation of 5.0%. The gain on first quarter strategic dispositions was $19.4 million.
COVID-19 Company Update
As of April 22, 2021, VEREIT had received rent of approximately 99% for the first quarter of 2021, which is based on the terms of lease agreements in effect at January 1, 2021 and excludes tenants being accounted for on a cash basis. The property type breakdown for rent collection is as follows:
2
| Property Type | Q1 2021 | ||||
| Total Retail | 99% | ||||
| Casual Dining | 99% | ||||
| Quick Service | 96% | ||||
| Total Restaurant | 98% | ||||
| Total Office | 100% | ||||
| Total Industrial | 100% | ||||
As of April 22, 2021, we collected $9.8 million of deferred rent, representing approximately 100% of amounts due through March 31, 2021, or 54% of total executed deferrals. Further rent collection details can be found in our investor presentation made available today.
2021 Guidance Update
In light of the Company’s proposed merger with Realty Income announced on April 29, 2021, the Company will no longer provide guidance nor is it affirming past guidance.
Subsequent Events
Acquisitions
From April 1, 2021 through April 30, 2021, the Company acquired 19 properties for $29.7 million, bringing acquisitions year-to-date through April 30, 2021, to $168.1 million, with over $300.0 million under contract or letter of intent.
Office Dispositions
There were no office dispositions subsequent to the quarter end.
Strategic Dispositions
From April 1, 2021 through April 30, 2021, the Company disposed of nine properties for an aggregate sales price of $12.6 million, bringing strategic dispositions year-to-date through April 30, 2021, to approximately $48.3 million.
Audio Webcast and Call Details
In light of the Company’s proposed merger with Realty Income, the Company will no longer host its previously planned earnings call.
About the Company
VEREIT is a full-service real estate operating company which owns and manages one of the largest portfolios of single-tenant commercial properties in the U.S. The Company has total real estate investments of $14.5 billion including approximately 3,900 properties and 88.7 million square feet. VEREIT’s business model provides equity capital to creditworthy corporations in return for long-term leases on their properties. VEREIT is a publicly traded Maryland corporation listed on the New York Stock Exchange. VEREIT uses, and intends to continue to use, its Investor Relations website, which can be found at www.VEREIT.com, as a means of disclosing material nonpublic information and for complying with its disclosure obligations under Regulation FD. Additional information about VEREIT can be found through social media platforms such as Twitter and LinkedIn.
Media Contact
Parke Chapman
Rubenstein Associates
212.843.8489 | pchapman@rubenstein.com
Investor Contact
Bonni Rosen, Senior Vice President, Investor Relations
VEREIT
877.405.2653| BRosen@VEREIT.com
3
About the Data
Prior period shares and per share amounts have been updated to reflect the reverse stock split, which took effect on December 17, 2020.
Rent collection percentages disclosed are based on contractual rent and recoveries paid by tenants to cover estimated tax, insurance and common area maintenance expenses, including the Company's pro rata share of such amounts related to properties owned by unconsolidated joint ventures. Percentages are based on the terms of the lease agreements in effect at January 1, 2021 and exclude rent due and cash received for leases being accounted for on a cash basis as of January 1, 2021. This change better reflects normalized collections and has a very modest impact of approximately 1.0%. Percentages also exclude any tenants in bankruptcy prior to the pandemic.
In the second quarter of 2020, the Company updated its definition of Normalized EBITDA to include the impact of straight-line rent, in order to be consistent with peer companies. The Company recast the data presented for prior periods, including ratios impacted by the change.
Descriptions of FFO and AFFO, EBITDA and Normalized EBITDA, Principal Outstanding and Adjusted Principal Outstanding, Net Debt, Interest Expense, Excluding Non-Cash Amortization, Fixed Charge Coverage Ratio, Net Debt to Normalized EBITDA Annualized Ratio, Net Debt Leverage Ratio, and Unencumbered Asset Ratio are provided below. Refer to the subsequent tables for reconciliations of these non-GAAP financial measures to the most directly comparable GAAP financial measure and the calculations of these financial ratios.
Earnings Before Interest, Taxes, Depreciation and Amortization for Real Estate (“EBITDAre”) and Normalized EBITDA
Due to certain unique operating characteristics of real estate companies, as discussed below, the National Association of Real Estate Investment Trusts, Inc. (“Nareit”), an industry trade group, has promulgated a supplemental performance measure known as Earnings Before Interest, Taxes, Depreciation and Amortization for Real Estate. Nareit defines EBITDAre as net income or loss computed in accordance with GAAP, adjusted for interest expense, income tax expense (benefit), depreciation and amortization, impairment write-downs on real estate, gains or losses from disposition of property and our pro rata share of EBITDAre adjustments related to unconsolidated partnerships and joint ventures. We calculated EBITDAre in accordance with Nareit's definition described above.
In addition to EBITDAre, we use Normalized EBITDA as a non-GAAP supplemental performance measure to evaluate the operating performance of the Company. Normalized EBITDA, as defined by the Company, represents EBITDAre, modified to exclude non-routine items such as acquisition-related expenses, litigation and non-routine costs, net and gains or losses on sale of investment securities or mortgage notes receivable. We also exclude certain non-cash items such as impairments of goodwill, intangible and right of use assets, gains or losses on derivatives, gains or losses on the extinguishment or forgiveness of debt and amortization of intangibles, above-market lease assets and below-market lease liabilities. Management believes that excluding these costs from EBITDAre provides investors with supplemental performance information that is consistent with the performance models and analysis used by management, and provides investors a view of the performance of our portfolio over time. Therefore, EBITDAre and Normalized EBITDA should not be considered as an alternative to net income, as computed in accordance with GAAP. The Company uses Normalized EBITDA as one measure of its operating performance when formulating corporate goals and evaluating the effectiveness of the Company's strategies. EBITDAre and Normalized EBITDA may not be comparable to similarly titled measures of other companies.
Fixed Charge Coverage Ratio
Fixed Charge Coverage Ratio is the sum of (i) Interest Expense, excluding non-cash amortization, (ii) secured debt principal amortization on Adjusted Principal Outstanding and (iii) dividends attributable to preferred shares divided by Normalized EBITDA. Management believes that Fixed Charge Coverage Ratio is a useful supplemental measure of our ability to satisfy fixed financing obligations.
Funds from Operations (“FFO”) and Adjusted Funds from Operations (“AFFO”)
Due to certain unique operating characteristics of real estate companies, as discussed below, Nareit has promulgated a supplemental performance measure known as FFO, which we believe to be an appropriate supplemental performance measure to reflect the operating performance of a REIT. FFO is not equivalent to our net income or loss as determined under U.S. GAAP.
Nareit defines FFO as net income or loss computed in accordance with U.S. GAAP adjusted for gains or losses from disposition of property, depreciation and amortization of real estate assets, impairment write-downs on real estate, and our
4
pro rata share of FFO adjustments related to unconsolidated partnerships and joint ventures. We calculate FFO in accordance with Nareit’s definition described above.
In addition to FFO, we use AFFO as a non-GAAP supplemental financial performance measure to evaluate the operating performance of the Company. AFFO, as defined by the Company, excludes from FFO non-routine items such as acquisition-related expenses, litigation and non-routine costs, net and gains or losses on sale of investment securities or mortgage notes receivable. We also exclude certain non-cash items such as impairments of goodwill, intangible and right of use assets, straight-line rent, net direct financing lease adjustments, gains or losses on derivatives, gains or losses on the extinguishment or forgiveness of debt, equity-based compensation and amortization of intangible assets, deferred financing costs, premiums and discounts on debt and investments, above-market lease assets and below-market lease liabilities. Management believes that excluding these items from FFO provides investors with supplemental performance information that is consistent with the performance models and analysis used by management, and provides investors a view of the performance of our portfolio over time. AFFO allows for a comparison of the performance of our operations with other publicly-traded REITs, as AFFO, or an equivalent measure, is routinely reported by publicly-traded REITs, and we believe often used by analysts and investors for comparison purposes.
For all of these reasons, we believe FFO and AFFO, in addition to net income (loss), as defined by U.S. GAAP, are helpful supplemental performance measures and useful in understanding the various ways in which our management evaluates the performance of the Company over time. However, not all REITs calculate FFO and AFFO the same way, so comparisons with other REITs may not be meaningful. FFO and AFFO should not be considered as alternatives to net income (loss) and are not intended to be used as a liquidity measure indicative of cash flow available to fund our cash needs. Neither the SEC, Nareit, nor any other regulatory body has evaluated the acceptability of the exclusions used to adjust FFO in order to calculate AFFO and its use as a non-GAAP financial performance measure.
Gross Real Estate Investments
Gross Real Estate Investments represent total gross real estate and related assets of Operating Properties, equity investments in the Cole REITs, investment in direct financing leases, investment securities backed by real estate and mortgage notes receivable, and the Company's pro rata share of such amounts related to properties owned by Unconsolidated Joint Ventures, net of gross intangible lease liabilities. We believe that the presentation of Gross Real Estate Investments, which shows our total investments in real estate and related assets, in connection with Net Debt, provides useful information to investors to assess our overall financial flexibility, capital structure and leverage. Gross Real Estate Investments should not be considered as an alternative to the Company's real estate investments balance as determined in accordance with GAAP or any other GAAP financial measures and should only be considered together with, and as a supplement to, the Company's financial information prepared in accordance with GAAP.
Interest Expense, Excluding Non-Cash Amortization
Interest Expense, excluding non-cash amortization is a non-GAAP measure that represents interest expense incurred on the outstanding principal balance of our debt and the Company's pro rata share of the Unconsolidated Joint Ventures' outstanding principal balance. This measure excludes the amortization of deferred financing costs, premiums and discounts, which is included in interest expense in accordance with GAAP. We believe that the presentation of Interest Expense, excluding non-cash amortization, which shows the interest expense on our contractual debt obligations, provides useful information to investors to assess our overall solvency and financial flexibility. Interest Expense, excluding non-cash amortization should not be considered as an alternative to the Company's interest expense as determined in accordance with GAAP or any other GAAP financial measures and should only be considered together with and as a supplement to the Company's financial information prepared in accordance with GAAP.
Net Debt Leverage Ratio
Net Debt Leverage Ratio equals Net Debt divided by Gross Real Estate Investments. We believe that the presentation of Net Debt Leverage Ratio provides useful information to investors because our management reviews Net Debt Leverage Ratio as part of its management of our overall liquidity, financial flexibility, capital structure and leverage.
Net Debt, Principal Outstanding and Adjusted Principal Outstanding
Principal Outstanding is a non-GAAP measure that represents the Company's outstanding principal debt balance, excluding certain GAAP adjustments, such as premiums and discounts, financing and issuance costs, and related accumulated amortization. Adjusted Principal Outstanding includes the Company's pro rata share of the Unconsolidated Joint Ventures' outstanding principal debt balance. We believe that the presentation of Principal Outstanding and Adjusted Principal Outstanding, which show our contractual debt obligations, provides useful information to investors to assess our overall financial flexibility, capital structure and leverage. Principal Outstanding and Adjusted Principal Outstanding should not be considered as alternatives to the Company's consolidated debt balance as determined in accordance with GAAP or
5
any other GAAP financial measures and should only be considered together with, and as a supplement to, the Company's financial information prepared in accordance with GAAP.
Net Debt is a non-GAAP measure used to show the Company's Adjusted Principal Outstanding, less all cash and cash equivalents and the Company's pro rata share of the Unconsolidated Joint Ventures' cash and cash equivalents. We believe that the presentation of Net Debt provides useful information to investors because our management reviews Net Debt as part of its management of our overall liquidity, financial flexibility, capital structure and leverage.
Net Debt to Normalized EBITDA Annualized Ratio
Net Debt to Normalized EBITDA Annualized (“Net Debt to Normalized EBITDA”) equals Net Debt divided by the respective quarter Normalized EBITDA multiplied by four. We believe that the presentation of Net Debt to Normalized EBITDA Annualized provides useful information to investors because our management reviews Net Debt to Normalized EBITDA Annualized as part of its management of our overall liquidity, financial flexibility, capital structure and leverage.
Unencumbered Asset Ratio
Unencumbered Asset Ratio equals unencumbered Gross Real Estate Investments divided by Gross Real Estate Investments. Management believes that Unencumbered Asset Ratio is a useful supplemental measure of our overall liquidity and leverage.
Unconsolidated Joint Ventures
Unconsolidated Joint Ventures include the Company's investments in unconsolidated joint ventures formed to acquire and own real estate properties and exclude other investments in unconsolidated entities.
6
Forward-Looking Statements
Information set forth herein contains “forward-looking statements” which reflect the Company’s expectations and projections regarding future events and plans, the Company’s future financial condition, results of operations, liquidity and business, including leasing and occupancy, acquisitions, dispositions, rent receipts, rent relief requests, rent relief granted, the payment of future dividends, the impact of the coronavirus (COVID-19) on the Company’s business, and the pending merger (the “Merger”) with Realty Income Corporation. Generally, the words “anticipates,” “assumes,” “believes,” “continues,” “could,” “estimates,” “expects,” “goals,” “intends,” “may,” “plans,” “projects,” “seeks,” “should,” “targets,” “will,” variations of such words and similar expressions identify forward-looking statements. These forward-looking statements are based on information currently available and involve a number of known and unknown assumptions and risks, uncertainties and other factors, which are difficult to predict and beyond the Company’s control, that could cause actual events and plans or could cause the Company’s business, financial condition, liquidity and results of operations to differ materially from those expressed or implied in the forward-looking statements. Further, information regarding historical rent collections should not serve as an indication of future rent collections.
The following factors, among others, could cause actual results to differ materially from those set forth in the forward-looking statements: the Company’s ability to consummate the proposed Merger and the timing of the closing of the proposed Merger; the potential impact of the announcement of the proposed transactions or consummation of the proposed transactions on business relationships, including with tenants, clients, employees, customers and competitors; potential litigation associated with the Merger; costs, fees, expenses and charges related to the proposed transactions; risks as a result of the restrictions imposed by operating covenants contained in the Merger Agreement restricting the Company generally from issuing equity, incurring or pre-paying debt and limitations on the use of its revolving credit facility; the duration and extent of the impact of COVID-19 on our business and the businesses of our tenants (including their ability to timely make rental payments) and the economy generally; federal, state or local legislation or regulation that could impact the timely payment of rent by tenants in light of COVID-19; the Company’s ability to renew leases, lease vacant space or re-lease space as leases expire on favorable terms or at all; risks associated with tenant, geographic and industry concentrations with respect to the Company’s properties; risks accompanying the management of its industrial and office partnerships; the impact of impairment charges in respect of certain of the Company’s properties; unexpected costs or liabilities that may arise from potential dispositions, including related to limited partnership, tenant-in-common and Delaware statutory trust real estate programs and the Company’s management with respect to such programs; competition in the acquisition and disposition of properties and in the leasing of its properties including that the Company may be unable to acquire, dispose of, or lease properties on advantageous terms or at all; risks associated with bankruptcies or insolvencies of tenants, from tenant defaults generally or from the unpredictability of the business plans and financial condition of the Company’s tenants, which are heightened as a result of the COVID-19 pandemic; risks associated with the Company’s substantial indebtedness, including that such indebtedness may affect the Company’s ability to pay dividends and that the terms and restrictions within the agreements governing the Company’s indebtedness may restrict its borrowing and operating flexibility; the ability to retain or hire key personnel; and the continuation or deterioration of current market conditions. Additional factors that may affect future results are contained in the Company’s filings with the SEC, which are available at the SEC’s website at www.sec.gov. The Company disclaims any obligation to publicly update or revise any forward-looking statements, whether as a result of changes in underlying assumptions or factors, new information, future events or otherwise, except as required by law.
7
VEREIT, INC.
CONSOLIDATED BALANCE SHEETS
(In thousands, except for share and per share data) (Unaudited)
| March 31, 2021 | December 31, 2020 | |||||||||||||
| ASSETS | ||||||||||||||
| Real estate investments, at cost: | ||||||||||||||
| Land | $ | 2,698,232 | $ | 2,699,110 | ||||||||||
| Buildings, fixtures and improvements | 9,941,903 | 10,032,055 | ||||||||||||
| Intangible lease assets | 1,883,826 | 1,872,461 | ||||||||||||
| Total real estate investments, at cost | 14,523,961 | 14,603,626 | ||||||||||||
| Less: accumulated depreciation and amortization | 3,861,411 | 3,833,084 | ||||||||||||
| Total real estate investments, net | 10,662,550 | 10,770,542 | ||||||||||||
| Operating lease right-of-use assets | 191,443 | 195,518 | ||||||||||||
| Investment in unconsolidated entities | 80,513 | 81,639 | ||||||||||||
| Cash and cash equivalents | 318,561 | 523,539 | ||||||||||||
| Restricted cash | 12,704 | 13,842 | ||||||||||||
| Rent and tenant receivables and other assets, net | 368,926 | 366,620 | ||||||||||||
| Goodwill | 1,337,773 | 1,337,773 | ||||||||||||
| Real estate assets held for sale, net | 4,888 | 65,583 | ||||||||||||
| Total assets | $ | 12,977,358 | $ | 13,355,056 | ||||||||||
| LIABILITIES AND EQUITY | ||||||||||||||
| Mortgage notes payable, net | $ | 1,035,328 | $ | 1,328,835 | ||||||||||
| Corporate bonds, net | 4,586,252 | 4,584,230 | ||||||||||||
| Below-market lease liabilities, net | 117,121 | 120,938 | ||||||||||||
| Accounts payable and accrued expenses | 116,486 | 117,015 | ||||||||||||
| Derivative, deferred rent and other liabilities | 62,944 | 63,204 | ||||||||||||
| Distributions payable | 106,989 | 89,514 | ||||||||||||
| Operating lease liabilities | 202,024 | 209,104 | ||||||||||||
| Total liabilities | 6,227,144 | 6,512,840 | ||||||||||||
Series F preferred stock | 149 | 189 | ||||||||||||
Common stock | 2,291 | 2,289 | ||||||||||||
| Additional paid-in capital | 13,350,661 | 13,449,412 | ||||||||||||
| Accumulated other comprehensive income | 634 | 536 | ||||||||||||
| Accumulated deficit | (6,610,678) | (6,617,380) | ||||||||||||
| Total stockholders’ equity | 6,743,057 | 6,835,046 | ||||||||||||
| Non-controlling interests | 7,157 | 7,170 | ||||||||||||
| Total equity | 6,750,214 | 6,842,216 | ||||||||||||
Total liabilities and equity | $ | 12,977,358 | $ | 13,355,056 | ||||||||||
8
VEREIT, INC.
CONSOLIDATED STATEMENTS OF OPERATIONS
(In thousands, except for share and per share data) (Unaudited)
| Three Months Ended March 31, | ||||||||||||||
| 2021 | 2020 | |||||||||||||
| Revenues: | ||||||||||||||
| Rental | $ | 290,309 | $ | 298,586 | ||||||||||
| Fees from managed partnerships | 500 | 596 | ||||||||||||
| Total revenues | 290,809 | 299,182 | ||||||||||||
| Operating expenses: | ||||||||||||||
| Acquisition-related | 1,354 | 1,523 | ||||||||||||
| Litigation and non-routine costs, net | 68 | (8,564) | ||||||||||||
| Property operating | 30,605 | 30,490 | ||||||||||||
| General and administrative | 14,526 | 15,056 | ||||||||||||
| Depreciation and amortization | 108,075 | 124,080 | ||||||||||||
| Impairments | 31,849 | 8,380 | ||||||||||||
| Total operating expenses | 186,477 | 170,965 | ||||||||||||
| Other income (expense): | ||||||||||||||
| Interest expense | (60,736) | (64,696) | ||||||||||||
| Loss on extinguishment and forgiveness of debt, net | (2,132) | (1,280) | ||||||||||||
| Other income, net | 3,666 | 175 | ||||||||||||
| Equity in income of unconsolidated entities | 447 | 246 | ||||||||||||
| Gain on disposition of real estate and real estate assets held for sale, net | 76,074 | 25,249 | ||||||||||||
| Total other income (expenses), net | 17,319 | (40,306) | ||||||||||||
| Income before taxes | 121,651 | 87,911 | ||||||||||||
| Provision for income taxes | (928) | (1,048) | ||||||||||||
| Net income | 120,723 | 86,863 | ||||||||||||
| Net income attributable to non-controlling interests | (76) | (55) | ||||||||||||
| Net income attributable to the General Partner | $ | 120,647 | $ | 86,808 | ||||||||||
| Basic and diluted net income per share attributable to common stockholders | $ | 0.50 | $ | 0.34 | ||||||||||
Distributions declared per common share | $ | 0.46 | $ | 0.69 | ||||||||||
9
VEREIT, INC.
EBITDAre AND NORMALIZED EBITDA
(In thousands) (Unaudited)
| Three Months Ended | ||||||||||||||||||||
| March 31, 2021 | December 31, 2020 | March 31, 2020 | ||||||||||||||||||
| Net income (loss) | $ | 120,723 | $ | (37,866) | $ | 86,863 | ||||||||||||||
| Adjustments: | ||||||||||||||||||||
| Interest expense | 60,736 | 68,416 | 64,696 | |||||||||||||||||
| Depreciation and amortization | 108,075 | 108,138 | 124,080 | |||||||||||||||||
| Provision for income taxes | 928 | 1,358 | 1,048 | |||||||||||||||||
Proportionate share of adjustments for unconsolidated entities | 2,249 | 2,443 | 1,761 | |||||||||||||||||
| Gain on disposition of real estate assets, net | (76,074) | (18,965) | (25,249) | |||||||||||||||||
| Impairments of real estate | 31,849 | 24,852 | 8,380 | |||||||||||||||||
| EBITDAre | $ | 248,486 | $ | 148,376 | $ | 261,579 | ||||||||||||||
| Impairment of intangibles and right of use assets | — | 3,352 | — | |||||||||||||||||
| Acquisition-related expenses | 1,354 | 1,048 | 1,523 | |||||||||||||||||
| Litigation and non-routine costs, net | 68 | 10,925 | (8,564) | |||||||||||||||||
| (Gain) loss on investments | (695) | (313) | 541 | |||||||||||||||||
| Loss on derivative instruments, net | — | 85,392 | — | |||||||||||||||||
Amortization of above-market lease assets and deferred lease incentives, net of amortization of below-market lease liabilities | 1,547 | 1,428 | 748 | |||||||||||||||||
| Loss on extinguishment and forgiveness of debt, net | 2,132 | 67 | 1,280 | |||||||||||||||||
| Net direct financing lease adjustments | 366 | 379 | 365 | |||||||||||||||||
Other adjustments, net | (2,055) | (3,919) | (205) | |||||||||||||||||
Proportionate share of adjustments for unconsolidated entities | (32) | (46) | (36) | |||||||||||||||||
| Normalized EBITDA | $ | 251,171 | $ | 246,689 | $ | 257,231 | ||||||||||||||
| Normalized EBITDA annualized | $ | 1,004,684 | $ | 986,756 | $ | 1,028,924 | ||||||||||||||
10
VEREIT, INC.
FUNDS FROM OPERATIONS
(In thousands, except for share and per share data) (Unaudited)
| Three Months Ended March 31, | ||||||||||||||
| 2021 | 2020 | |||||||||||||
| Net income | $ | 120,723 | $ | 86,863 | ||||||||||
| Dividends on non-convertible preferred stock | (6,525) | (12,948) | ||||||||||||
| Gain on disposition of real estate assets, net | (76,074) | (25,249) | ||||||||||||
| Depreciation and amortization of real estate assets | 107,700 | 123,645 | ||||||||||||
| Impairment of real estate | 31,849 | 8,380 | ||||||||||||
Proportionate share of adjustments for unconsolidated entities | 1,315 | 1,131 | ||||||||||||
| FFO attributable to common stockholders and limited partners | $ | 178,988 | $ | 181,822 | ||||||||||
| Weighted-average shares outstanding - basic | 229,159,472 | 215,587,560 | ||||||||||||
| Effect of weighted-average Limited Partner OP Units and dilutive securities | 270,395 | 362,688 | ||||||||||||
| Weighted-average shares outstanding - diluted | 229,429,867 | 215,950,248 | ||||||||||||
| FFO attributable to common stockholders and limited partners per diluted share | $ | 0.78 | $ | 0.84 | ||||||||||
11
VEREIT, INC.
ADJUSTED FUNDS FROM OPERATIONS
(In thousands, except for share and per share data) (Unaudited)
| Three Months Ended March 31, | ||||||||||||||
| 2021 | 2020 | |||||||||||||
FFO attributable to common stockholders and limited partners | $ | 178,988 | $ | 181,822 | ||||||||||
| Acquisition-related expenses | 1,354 | 1,523 | ||||||||||||
| Litigation and non-routine costs, net | 68 | (8,564) | ||||||||||||
| (Gain) loss on investments | (695) | 541 | ||||||||||||
Amortization of premiums and discounts on debt and investments, net | 87 | (689) | ||||||||||||
Amortization of above-market lease assets and deferred lease incentives, net of amortization of below-market lease liabilities | 1,547 | 748 | ||||||||||||
| Net direct financing lease adjustments | 366 | 365 | ||||||||||||
| Amortization and write-off of deferred financing costs | 2,555 | 2,841 | ||||||||||||
| Loss on extinguishment and forgiveness of debt, net | 2,132 | 1,280 | ||||||||||||
| Straight-line rent | (4,219) | (2,054) | ||||||||||||
| Equity-based compensation | 2,669 | 2,602 | ||||||||||||
| Other adjustments, net | (1,661) | 228 | ||||||||||||
Proportionate share of adjustments for unconsolidated entities | (144) | 331 | ||||||||||||
| AFFO attributable to common stockholders and limited partners | $ | 183,047 | $ | 180,974 | ||||||||||
| Weighted-average shares outstanding - basic | 229,159,472 | 215,587,560 | ||||||||||||
| Effect of weighted-average Limited Partner OP Units and dilutive securities | 270,395 | 362,688 | ||||||||||||
| Weighted-average shares outstanding - diluted | 229,429,867 | 215,950,248 | ||||||||||||
| AFFO attributable to common stockholders and limited partners per diluted share | $ | 0.80 | $ | 0.84 | ||||||||||
12
VEREIT, INC.
FINANCIAL AND OPERATIONS STATISTICS AND RATIOS
(Dollars in thousands) (Unaudited)
| Three Months Ended | ||||||||
| March 31, 2021 | ||||||||
| Interest expense - as reported | $ | 60,736 | ||||||
| Adjustments: | ||||||||
| Amortization of deferred financing costs and other non-cash charges | (2,412) | |||||||
| Amortization of net premiums | (248) | |||||||
| Proportionate share of amounts for Unconsolidated Joint Ventures | 784 | |||||||
| Interest Expense, Excluding Non-Cash Amortization | $ | 58,860 | ||||||
| Three Months Ended | ||||||||
| March 31, 2021 | ||||||||
| Interest Expense, Excluding Non-Cash Amortization | $ | 58,860 | ||||||
| Secured debt principal amortization | 687 | |||||||
Dividends attributable to preferred shares | 6,525 | |||||||
| Total fixed charges | 66,072 | |||||||
| Normalized EBITDA | 251,171 | |||||||
| Fixed Charge Coverage Ratio | 3.80x | |||||||
| March 31, 2021 | December 31, 2020 | |||||||||||||
| Mortgage notes payable, net | $ | 1,035,328 | $ | 1,328,835 | ||||||||||
| Corporate bonds, net | 4,586,252 | 4,584,230 | ||||||||||||
| Total debt - as reported | 5,621,580 | 5,913,065 | ||||||||||||
| Deferred financing costs, net | 42,503 | 44,573 | ||||||||||||
| Net discounts (premiums) | 26,305 | 25,557 | ||||||||||||
| Principal Outstanding | 5,690,388 | 5,983,195 | ||||||||||||
| Proportionate share of amounts for Unconsolidated Joint Ventures | 106,516 | 106,516 | ||||||||||||
| Adjusted Principal Outstanding | $ | 5,796,904 | $ | 6,089,711 | ||||||||||
| Cash and cash equivalents | (318,561) | (523,539) | ||||||||||||
| Pro rata share of Unconsolidated Joint Ventures’ cash and cash equivalents | (1,587) | (1,619) | ||||||||||||
| Net Debt | $ | 5,476,756 | $ | 5,564,553 | ||||||||||
13
| March 31, 2021 | ||||||||
| Total real estate investments, at cost - as reported | $ | 14,523,961 | ||||||
| Adjustments: | ||||||||
| Investment in Cole REITs | 7,951 | |||||||
| Gross assets held for sale | 7,145 | |||||||
| Investment in direct financing leases, net | 6,181 | |||||||
| Gross below market leases | (225,657) | |||||||
| Proportionate share of amounts for Unconsolidated Joint Ventures | 165,646 | |||||||
| Gross Real Estate Investments | $ | 14,485,227 | ||||||
| March 31, 2021 | December 31, 2020 | |||||||||||||
| Net Debt | $ | 5,476,756 | $ | 5,564,553 | ||||||||||
| Normalized EBITDA Annualized | 1,004,684 | 986,756 | ||||||||||||
| Net Debt to Normalized EBITDA Annualized Ratio | 5.45x | 5.64x | ||||||||||||
| March 31, 2021 | ||||||||
| Net Debt | $ | 5,476,756 | ||||||
| Gross Real Estate Investments | 14,485,227 | |||||||
| Net Debt Leverage Ratio | 37.8 | % | ||||||
| Unencumbered Gross Real Estate Investments | $ | 12,455,130 | ||||||
| Gross Real Estate Investments | 14,485,227 | |||||||
| Unencumbered asset ratio | 86.0 | % | ||||||
14
Exhibit 99.2
 | ||||||||
| Q1 2021 SUPPLEMENTAL INFORMATION | ||||||||
| VEREIT Supplemental Information | |||||
| March 31, 2021 | |||||
| Section | Page |  | ||||||
| Company Overview | ||||||||
| Quarterly Financial Summary | ||||||||
| Financial and Operations Statistics and Ratios | ||||||||
| Key Balance Sheet Metrics and Capital Structure | ||||||||
| Balance Sheets | ||||||||
| Statements of Operations | ||||||||
| Funds From Operations (FFO) | ||||||||
| Adjusted Funds From Operations (AFFO) | ||||||||
| EBITDAre and Normalized EBITDA | ||||||||
| Net Operating Income |  | |||||||
| Same Store Contract Rental Revenue | ||||||||
| Debt and Preferred Equity Summary | ||||||||
| Credit Facility and Corporate Bond Covenants | ||||||||
| Acquisitions and Dispositions | ||||||||
| Diversification Statistics | ||||||||
| Top 10 Concentrations | ||||||||
| Tenants Comprising Over 1% of Annualized Rental Income | ||||||||
| Tenant Industry Diversification | ||||||||
| Property Geographic Diversification | ||||||||
| Lease Expirations |  | |||||||
| Lease Summary | ||||||||
| Property Type Diversification and Rent Coverage | ||||||||
| Unconsolidated Joint Venture Investment Summary | ||||||||
| Definitions | ||||||||
 | ||||||||
See the Definitions section for a description of the Company's non-GAAP and operating metrics.
VEREIT, Inc. | WWW.VEREIT.COM | 2
| ||||||||
| Q1 2021 SUPPLEMENTAL INFORMATION | ||||||||
| About the Data | ||
This data and other information described herein are as of and for the three months ended March 31, 2021, unless otherwise indicated. Certain balances have been reclassified to conform with the current period's presentations, including partnership fees earned from services provided to our unconsolidated joint ventures, which were previously included in other income, net. The Company effected a one-for-five reverse stock split of its common stock after markets closed on December 17, 2020, whereby every five shares of VEREIT's issued and outstanding shares of common stock, $0.01 par value per share, were converted into one share of common stock, $0.01 par value per share. Prior period shares and per share amounts have been updated to reflect the reverse stock split. Future performance may not be consistent with past performance and is subject to change and inherent risks and uncertainties. This information should be read in conjunction with the financial statements and the Management's Discussion and Analysis of Financial Condition and Results of Operations sections contained in VEREIT, Inc.'s (the "Company," "VEREIT," "us," "our" and "we") Annual Report on Form 10-K for the year ended December 31, 2020 and Quarterly Reports on Form 10-Q for the periods ended March 31, 2021, September 30, 2020, June 30, 2020, and March 31, 2020.
Our business was not materially impacted during the three months ended March 31, 2021 or during the year ended December 31, 2020 by the COVID-19 pandemic. During the three months ended March 31, 2021 our rent collection was 99% of rental revenue and as of April 22, 2021, we collected $9.8 million of deferred rent, representing approximately 100% of amounts due through March 31, 2021. The full extent of the future impact of the COVID-19 pandemic on our business, financial condition, liquidity and results of operations remains uncertain. The table below summarizes the impact of deferred rent, abatements and reductions to rental revenue as a result of the COVID-19 pandemic on certain non-GAAP measures (dollars in thousands).
| Three Months Ended | ||||||||||||||||||||||||||
| March 31, 2021 | December 31, 2020 | September 30, 2020 | June 30, 2020 | |||||||||||||||||||||||
Deferred rent included in FFO, AFFO, EBITDAre, Normalized EBITDA and Cash NOI (1) | $ | 60 | $ | 132 | $ | 4,250 | $ | 13,559 | ||||||||||||||||||
Abatements (2) | $ | 42 | $ | 607 | $ | 6,524 | $ | 11,184 | ||||||||||||||||||
| Reductions to rental revenue due to: | ||||||||||||||||||||||||||
Rent not probable of collection, net (3) | $ | 1,508 | $ | 5,479 | $ | 4,089 | $ | 3,810 | ||||||||||||||||||
| General allowance | 508 | 3,584 | 5,122 | 911 | ||||||||||||||||||||||
| Reductions to rental revenue - FFO, AFFO, and Cash NOI | $ | 2,016 | $ | 9,063 | $ | 9,211 | $ | 4,721 | ||||||||||||||||||
| Straight-line rent receivable reserves | (49) | (1,129) | 999 | 3,659 | ||||||||||||||||||||||
| Reductions to rental revenue - EBITDAre and Normalized EBITDA | $ | 1,967 | $ | 7,934 | $ | 10,210 | $ | 8,380 | ||||||||||||||||||
___________________________________
(1)Includes rental revenue related to deferral agreements executed through April 22, 2021, which qualify for the COVID-19 Lease Concessions Relief.
(2)Abatements were accounted for as lease modifications under ASC 842.
(3)Rental revenue will be recognized as cash is received.
In the second quarter of 2020, the Company updated its definition of Normalized EBITDA to include the impact of straight-line rent, in order to be consistent with peer companies. The Company recast the data presented for prior periods, including ratios impacted by the change.
Subsequent to the issuance of the Company’s consolidated financial statements for the year ended December 31, 2020, the Company identified an overstatement in amounts recorded to depreciation expense. As a result, the Company revised the accompanying consolidated balance sheet as of December 31, 2020 to reduce accumulated depreciation and amortization and accumulated deficit by $30.6 million. The Company determined that the correction is not material to the previously issued consolidated financial statements. As such, no adjustments were made to the consolidated balance sheets or statements of operations for the periods ended September 30, 2020, June 30, 2020 or March 31, 2020.
See the Definitions section for a description of the Company's non-GAAP and operating metrics.
VEREIT, Inc. | WWW.VEREIT.COM | 3
| ||||||||
| Q1 2021 SUPPLEMENTAL INFORMATION | ||||||||
| Forward-Looking Statements | ||
Information set forth herein contains “forward-looking statements” which reflect the Company's expectations and projections regarding future events and plans, the Company's future financial condition, results of operations, liquidity and business, including leasing and occupancy, acquisitions, dispositions, rent receipts, rent relief requests, rent relief granted, the payment of future dividends, the impact of the coronavirus (COVID-19) on the Company's business, and the pending merger (the “Merger”) with Realty Income Corporation. Generally, the words "anticipates," "assumes," "believes," "continues," "could," "estimates," "expects," "goals," "intends," "may," "plans," "projects," "seeks," "should," "targets," "will," variations of such words and similar expressions identify forward-looking statements. These forward-looking statements are based on information currently available and involve a number of known and unknown assumptions and risks, uncertainties and other factors, which are difficult to predict and beyond the Company's control, that could cause actual events and plans or could cause the Company's business, financial condition, liquidity and results of operations to differ materially from those expressed or implied in the forward-looking statements. Further, information regarding historical rent collections should not serve as an indication of future rent collections.
The following factors, among others, could cause actual results to differ materially from those set forth in the forward-looking statements: the Company's ability to consummate the proposed Merger and the timing of the closing of the proposed Merger; the potential impact of the announcement of the proposed transactions or consummation of the proposed transactions on business relationships, including with tenants, clients, employees, customers and competitors; potential litigation associated with the Merger; costs, fees, expenses and charges related to the proposed transactions; risks as a result of the restrictions imposed by operating covenants contained in the Merger Agreement restricting the Company generally from issuing equity, incurring or pre-paying debt and limitations on the use of its revolving credit facility; the duration and extent of the impact of COVID-19 on our business and the businesses of our tenants (including their ability to timely make rental payments) and the economy generally; federal, state, or local legislation or regulation that could impact the timely payment of rent by tenants in light of COVID-19; the Company's ability to renew leases, lease vacant space or re-lease space as leases expire on favorable terms or at all; risks associated with tenant, geographic and industry concentrations with respect to the Company's properties; risks accompanying the management of its industrial and office partnerships; the impact of impairment charges in respect of certain of the Company's properties; unexpected costs or liabilities that may arise from potential dispositions, including related to limited partnership, tenant-in-common and Delaware statutory trust real estate programs and the Company's management with respect to such programs; competition in the acquisition and disposition of properties and in the leasing of its properties including that the Company may be unable to acquire, dispose of, or lease properties on advantageous terms or at all; risks associated with bankruptcies or insolvencies of tenants, from tenant defaults generally or from the unpredictability of the business plans and financial condition of the Company's tenants, which are heightened as a result of the COVID-19 pandemic; risks associated with the Company's substantial indebtedness, including that such indebtedness may affect the Company's ability to pay dividends and that the terms and restrictions within the agreements governing the Company's indebtedness may restrict its borrowing and operating flexibility; the ability to retain or hire key personnel; and the continuation or deterioration of current market conditions. Additional factors that may affect future results are contained in the Company's filings with the SEC, which are available at the SEC’s website at www.sec.gov. The Company disclaims any obligation to publicly update or revise any forward-looking statements, whether as a result of changes in underlying assumptions or factors, new information, future events or otherwise, except as required by law.
See the Definitions section for a description of the Company's non-GAAP and operating metrics.
VEREIT, Inc. | WWW.VEREIT.COM | 4
| ||||||||
| Q1 2021 SUPPLEMENTAL INFORMATION | ||||||||
Company Overview (unaudited) | ||
VEREIT is a real estate company incorporated in Maryland on December 2, 2010, which has elected to be taxed as a real estate investment trust ("REIT") for U.S. federal income tax purposes.
VEREIT is a full-service real estate operating company which owns and manages one of the largest portfolios of single-tenant commercial properties in the U.S. VEREIT's business model provides equity capital to creditworthy corporations in return for long-term leases on their properties. The Company targets properties that are strategically located and essential to the business operations of the tenant, as well as retail properties that offer necessity- and value-oriented products or services. At March 31, 2021, approximately 37.8% of the Company's Annualized Rental Income was earned from Investment-Grade Tenants, Economic Occupancy Rate was 98.0% and the Weighted Average Remaining Lease Term was 8.4 years.
Tenants, Trademarks and Logos
VEREIT is not affiliated with, is not endorsed by, does not endorse and is not sponsored by or a sponsor of the products or services pictured or mentioned. The names, logos and all related product and service names, design marks and slogans are the trademarks or service marks of their respective companies.
See the Definitions section for a description of the Company's non-GAAP and operating metrics.
VEREIT, Inc. | WWW.VEREIT.COM | 5
| ||||||||
| Q1 2021 SUPPLEMENTAL INFORMATION | ||||||||
| Company Overview (cont.) | ||
| Senior Management | Board of Directors | |||||||
| Glenn J. Rufrano, Chief Executive Officer | Hugh R. Frater, Non-Executive Chairman | |||||||
| Michael J. Bartolotta, Executive Vice President and Chief Financial Officer | Priscilla Almodovar, Independent Director | |||||||
| Lauren Goldberg, Executive Vice President, General Counsel and Secretary | David B. Henry, Independent Director | |||||||
| Paul H. McDowell, Executive Vice President and Chief Operating Officer | Mary Hogan Preusse, Independent Director | |||||||
| Thomas W. Roberts, Executive Vice President and Chief Investment Officer | Richard J. Lieb, Independent Director | |||||||
| Gavin B. Brandon, Senior Vice President and Chief Accounting Officer | Eugene A. Pinover, Independent Director | |||||||
| Julie G. Richardson, Independent Director | ||||||||
| Susan E. Skerritt, Independent Director | ||||||||
| Glenn J. Rufrano, Chief Executive Officer and Director | ||||||||
Corporate Offices and Contact Information
| 2325 E. Camelback Road, 9th Floor | 19 West 44th Street, Suite 1401 | |||||||
| Phoenix, AZ 85016 | New York, NY 10036 | |||||||
| 800-606-3610 | 212-413-9100 | |||||||
| www.VEREIT.com | ||||||||
Trading Symbols: VER, VER PRF
Stock Exchange Listing: New York Stock Exchange
Transfer Agent
Computershare Trust Company, N.A.
462 South 4th Street, Suite 1600
Louisville, KY 40202
855-866- 0787
See the Definitions section for a description of the Company's non-GAAP and operating metrics.
VEREIT, Inc. | WWW.VEREIT.COM | 6
| ||||||||
| Q1 2021 SUPPLEMENTAL INFORMATION | ||||||||
Quarterly Financial Summary (unaudited, dollars in thousands, except share and per share amounts) | ||
The following table summarizes the Company's quarterly financial results and portfolio metrics.
| Three Months Ended | |||||||||||||||||||||||||||||
| Financial Results | March 31, 2021 | December 31, 2020 | September 30, 2020 | June 30, 2020 | March 31, 2020 | ||||||||||||||||||||||||
| Total revenues | $ | 290,809 | $ | 287,909 | $ | 295,278 | $ | 278,997 | $ | 299,182 | |||||||||||||||||||
| Net income (loss) | $ | 120,723 | $ | (37,866) | $ | 97,983 | $ | 54,239 | $ | 86,863 | |||||||||||||||||||
| Basic and diluted net income (loss) per share attributable to common stockholders and limited partners | $ | 0.50 | $ | (0.21) | $ | 0.40 | $ | 0.19 | $ | 0.34 | |||||||||||||||||||
| Normalized EBITDA | $ | 251,171 | $ | 246,689 | $ | 252,933 | $ | 238,479 | $ | 257,231 | |||||||||||||||||||
| FFO attributable to common stockholders and limited partners | $ | 178,988 | $ | 69,313 | $ | 171,233 | $ | 155,943 | $ | 181,822 | |||||||||||||||||||
FFO attributable to common stockholders and limited partners per diluted share | $ | 0.78 | $ | 0.31 | $ | 0.79 | $ | 0.72 | $ | 0.84 | |||||||||||||||||||
| AFFO attributable to common stockholders and limited partners | $ | 183,047 | $ | 169,798 | $ | 166,547 | $ | 161,083 | $ | 180,974 | |||||||||||||||||||
| AFFO attributable to common stockholders and limited partners per diluted share | $ | 0.80 | $ | 0.76 | $ | 0.77 | $ | 0.75 | $ | 0.84 | |||||||||||||||||||
| Dividends declared per common share | $ | 0.46 | $ | 0.39 | $ | 0.39 | $ | 0.39 | $ | 0.69 | |||||||||||||||||||
| Weighted-average shares outstanding - diluted | 229,429,867 | 222,511,425 | 217,027,675 | 215,910,613 | 215,950,248 | ||||||||||||||||||||||||
| Portfolio Metrics | |||||||||||||||||||||||||||||
| Operating Properties | 3,855 | 3,831 | 3,820 | 3,836 | 3,853 | ||||||||||||||||||||||||
| Rentable Square Feet (in thousands) | 88,747 | 89,493 | 88,869 | 88,947 | 89,539 | ||||||||||||||||||||||||
| Economic Occupancy Rate | 98.0 | % | 98.1 | % | 98.5 | % | 98.8 | % | 99.1 | % | |||||||||||||||||||
| Weighted Average Remaining Lease Term (years) | 8.4 | 8.4 | 8.4 | 8.5 | 8.3 | ||||||||||||||||||||||||
Investment-Grade Tenants (1) | 37.8 | % | 38.7 | % | 37.7 | % | 37.0 | % | 36.7 | % | |||||||||||||||||||
___________________________________
(1)The weighted-average credit rating of our investment-grade tenants was BBB+ as of March 31, 2021.
See the Definitions section for a description of the Company's non-GAAP and operating metrics.
VEREIT, Inc. | WWW.VEREIT.COM | 7
| ||||||||
| Q1 2021 SUPPLEMENTAL INFORMATION | ||||||||
Financial and Operations Statistics and Ratios (unaudited, dollars in thousands) | ||
| Three Months Ended | ||||||||||||||||||||||||||||||||
| March 31, 2021 | December 31, 2020 | September 30, 2020 | June 30, 2020 | March 31, 2020 | ||||||||||||||||||||||||||||
| Interest Coverage Ratio | ||||||||||||||||||||||||||||||||
Interest Expense, excluding non-cash amortization (1) | $ | 58,860 | $ | 63,153 | $ | 64,713 | $ | 63,636 | $ | 63,123 | ||||||||||||||||||||||
Normalized EBITDA (2) | 251,171 | 246,689 | 252,933 | 238,479 | 257,231 | |||||||||||||||||||||||||||
Interest Coverage Ratio | 4.27x | 3.91x | 3.91x | 3.75x | 4.08x | |||||||||||||||||||||||||||
| Fixed Charge Coverage Ratio | ||||||||||||||||||||||||||||||||
Interest Expense, excluding non-cash amortization (1) | $ | 58,860 | $ | 63,153 | $ | 64,713 | $ | 63,636 | $ | 63,123 | ||||||||||||||||||||||
| Secured debt principal amortization | 687 | 858 | 834 | 861 | 1,071 | |||||||||||||||||||||||||||
Dividends attributable to preferred shares | 6,525 | 7,923 | 10,771 | 12,948 | 12,948 | |||||||||||||||||||||||||||
Total fixed charges | 66,072 | 71,934 | 76,318 | 77,445 | 77,142 | |||||||||||||||||||||||||||
Normalized EBITDA (2) | 251,171 | 246,689 | 252,933 | 238,479 | 257,231 | |||||||||||||||||||||||||||
| Fixed Charge Coverage Ratio | 3.80x | 3.43x | 3.31x | 3.08x | 3.33x | |||||||||||||||||||||||||||
| March 31, 2021 | December 31, 2020 | September 30, 2020 | June 30, 2020 | March 31, 2020 | ||||||||||||||||||||||||||||
| Net Debt Ratios | ||||||||||||||||||||||||||||||||
Net Debt (3) | $ | 5,476,756 | $ | 5,564,553 | $ | 5,832,236 | $ | 5,804,109 | $ | 5,815,734 | ||||||||||||||||||||||
Normalized EBITDA annualized | 1,004,684 | 986,756 | 1,011,732 | 953,916 | 1,028,924 | |||||||||||||||||||||||||||
Net Debt to Normalized EBITDA annualized ratio | 5.45x | 5.64x | 5.76x | 6.08x | 5.65x | |||||||||||||||||||||||||||
Net Debt (3) | $ | 5,476,756 | $ | 5,564,553 | $ | 5,832,236 | $ | 5,804,109 | $ | 5,815,734 | ||||||||||||||||||||||
Gross Real Estate Investments (3) | 14,485,227 | 14,646,970 | 14,621,857 | 14,704,629 | 14,781,956 | |||||||||||||||||||||||||||
Net Debt Leverage Ratio | 37.8 | % | 38.0 | % | 39.9 | % | 39.5 | % | 39.3 | % | ||||||||||||||||||||||
| Unencumbered Assets/Real Estate Assets | ||||||||||||||||||||||||||||||||
| Unencumbered Gross Real Estate Investments | $ | 12,455,130 | $ | 11,968,277 | $ | 11,936,645 | $ | 11,933,717 | $ | 12,005,190 | ||||||||||||||||||||||
Gross Real Estate Investments (3) | 14,485,227 | 14,646,970 | 14,621,857 | 14,704,629 | 14,781,956 | |||||||||||||||||||||||||||
| Unencumbered Asset Ratio | 86.0 | % | 81.7 | % | 81.6 | % | 81.2 | % | 81.2 | % | ||||||||||||||||||||||
___________________________________
(1)Refer to the Statements of Operations section for interest expense calculated in accordance with GAAP and to the Definitions section for the required reconciliation to the most directly comparable GAAP financial measure.
(2)Refer to the Statements of Operations section for net income calculated in accordance with GAAP and to the EBITDAre and Normalized EBITDA section for the required reconciliation to the most directly comparable GAAP financial measure.
(3)Refer to the Balance Sheets section for total debt and real estate investments, at cost calculated in accordance with GAAP and to the Definitions section for the required reconciliation to the most directly comparable GAAP financial measure.
See the Definitions section for a description of the Company's non-GAAP and operating metrics.
VEREIT, Inc. | WWW.VEREIT.COM | 8
| ||||||||
| Q1 2021 SUPPLEMENTAL INFORMATION | ||||||||
Key Balance Sheet Metrics and Capital Structure (unaudited, dollars and shares in thousands, except per share amounts) | ||
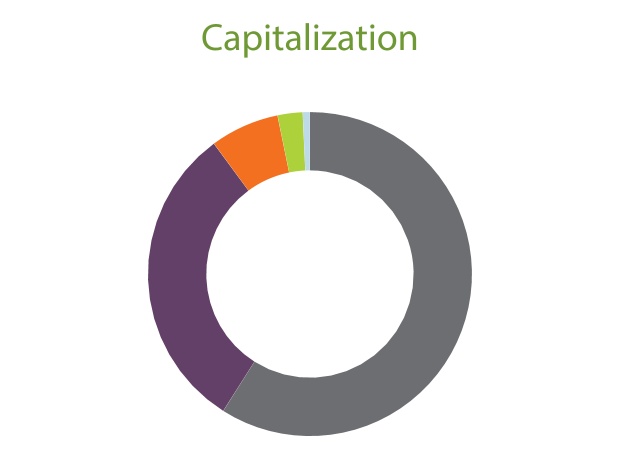
| Common equity | 59.0% | ||||||||||
| Corporate bonds | 30.9% | ||||||||||
| Mortgage notes payable | 6.9% | ||||||||||
| Preferred equity | 2.5% | ||||||||||
| Proportionate share of amounts for Unconsolidated Joint Ventures | 0.7% | ||||||||||
Fixed vs. Variable Rate Debt
| Fixed | 99.4 | % | |||
| Variable | 0.6 | % | |||
| VEREIT Capitalization Table | |||||||||||||||||
Wtd. Avg. Maturity (Years) | Rate (1) | March 31, 2021 | |||||||||||||||
| Diluted shares outstanding | 230,060 | ||||||||||||||||
| Stock price | $ | 38.62 | |||||||||||||||
| Implied Equity Market Capitalization | $ | 8,884,917 | |||||||||||||||
Series F Perpetual Preferred (2) | 6.70 | % | $ | 373,025 | |||||||||||||
| Mortgage notes payable | 2.3 | 4.87 | % | 1,040,389 | |||||||||||||
| Proportionate share of amounts for Unconsolidated Joint Ventures | 3.9 | 2.94 | % | 106,516 | |||||||||||||
Total secured debt | 2.4 | 4.69 | % | $ | 1,146,905 | ||||||||||||
| Corporate bonds due 2024 | 2.9 | 4.60 | % | 500,000 | |||||||||||||
| Corporate bonds due 2025 | 4.6 | 4.63 | % | 550,000 | |||||||||||||
| Corporate bonds due 2026 | 5.2 | 4.88 | % | 600,000 | |||||||||||||
| Corporate bonds due 2027 | 6.4 | 3.95 | % | 600,000 | |||||||||||||
| Corporate bonds due January 2028 | 6.8 | 3.40 | % | 600,000 | |||||||||||||
| Corporate bonds due June 2028 | 7.2 | 2.20 | % | 500,000 | |||||||||||||
| Corporate bonds due 2029 | 8.7 | 3.10 | % | 600,000 | |||||||||||||
| Corporate bonds due 2032 | 11.7 | 2.85 | % | 700,000 | |||||||||||||
Total unsecured debt | 6.9 | 3.68 | % | $ | 4,650,000 | ||||||||||||
| Total Adjusted Principal Outstanding | 6.0 | 3.88 | % | $ | 5,796,905 | ||||||||||||
| Total Capitalization | $ | 15,054,847 | |||||||||||||||
| Less: Cash and cash equivalents | 318,561 | ||||||||||||||||
| Less: Pro rata share of Unconsolidated Joint Ventures' cash and cash equivalents | 1,587 | ||||||||||||||||
| Enterprise Value | $ | 14,734,699 | |||||||||||||||
| Net Debt/Enterprise Value | 37.2 | % | |||||||||||||||
| Net Debt/Normalized EBITDA Annualized | 5.45x | ||||||||||||||||
Net Debt + Preferred (2)/Normalized EBITDA Annualized | 5.82x | ||||||||||||||||
| Fixed Charge Coverage Ratio | 3.80x | ||||||||||||||||
Liquidity (3) | $ | 1,816,008 | |||||||||||||||
___________________________________
(1)Weighted average interest rate for variable rate debt represents the interest rate in effect as of March 31, 2021.
(2)Balance represents 14.9 million shares of Series F Preferred Stock (and 14.9 million corresponding general partner Series F Preferred Units) and 49,766 limited partner Series F Preferred Units outstanding at March 31, 2021, multiplied by the liquidation preference of $25 per share.
(3)Liquidity represents cash and cash equivalents of $318.6 million and approximately $1.5 billion available capacity on our $1.5 billion revolving credit facility. Available capacity on our revolving credit facility is reduced by letters of credit outstanding of $2.6 million at March 31, 2021.
See the Definitions section for a description of the Company's non-GAAP and operating metrics.
VEREIT, Inc. | WWW.VEREIT.COM | 9
| ||||||||
| Q1 2021 SUPPLEMENTAL INFORMATION | ||||||||
Balance Sheets (unaudited, in thousands) | ||
| March 31, 2021 | December 31, 2020 | September 30, 2020 | June 30, 2020 | March 31, 2020 | ||||||||||||||||||||||||||||
| Assets | ||||||||||||||||||||||||||||||||
| Real estate investments, at cost: | ||||||||||||||||||||||||||||||||
| Land | $ | 2,698,232 | $ | 2,699,110 | $ | 2,691,122 | $ | 2,705,149 | $ | 2,715,625 | ||||||||||||||||||||||
| Buildings, fixtures and improvements | 9,941,903 | 10,032,055 | 10,046,076 | 10,117,636 | 10,135,933 | |||||||||||||||||||||||||||
| Intangible lease assets | 1,883,826 | 1,872,461 | 1,872,899 | 1,891,831 | 1,899,900 | |||||||||||||||||||||||||||
| Total real estate investments, at cost | 14,523,961 | 14,603,626 | 14,610,097 | 14,714,616 | 14,751,458 | |||||||||||||||||||||||||||
| Less: accumulated depreciation and amortization | 3,861,411 | 3,833,084 | 3,829,368 | 3,756,132 | 3,659,980 | |||||||||||||||||||||||||||
| Total real estate investments, net | 10,662,550 | 10,770,542 | 10,780,729 | 10,958,484 | 11,091,478 | |||||||||||||||||||||||||||
| Operating lease right-of-use assets | 191,443 | 195,518 | 205,346 | 208,037 | 211,187 | |||||||||||||||||||||||||||
| Investment in unconsolidated entities | 80,513 | 81,639 | 100,339 | 86,300 | 78,718 | |||||||||||||||||||||||||||
| Cash and cash equivalents | 318,561 | 523,539 | 207,321 | 278,883 | 600,945 | |||||||||||||||||||||||||||
| Restricted cash | 12,704 | 13,842 | 14,955 | 21,203 | 18,720 | |||||||||||||||||||||||||||
| Rent and tenant receivables and other assets, net | 368,926 | 366,620 | 391,239 | 382,409 | 345,103 | |||||||||||||||||||||||||||
| Goodwill | 1,337,773 | 1,337,773 | 1,337,773 | 1,337,773 | 1,337,773 | |||||||||||||||||||||||||||
| Real estate assets held for sale, net | 4,888 | 65,583 | 1,896 | 48,093 | 88,513 | |||||||||||||||||||||||||||
| Total assets | $ | 12,977,358 | $ | 13,355,056 | $ | 13,039,598 | $ | 13,321,182 | $ | 13,772,437 | ||||||||||||||||||||||
| Liabilities and Equity | ||||||||||||||||||||||||||||||||
| Mortgage notes payable, net | $ | 1,035,328 | $ | 1,328,835 | $ | 1,330,174 | $ | 1,393,652 | $ | 1,405,701 | ||||||||||||||||||||||
| Corporate bonds, net | 4,586,252 | 4,584,230 | 3,406,389 | 3,404,935 | 2,814,474 | |||||||||||||||||||||||||||
| Convertible debt, net | — | — | 252,077 | 270,152 | 319,120 | |||||||||||||||||||||||||||
| Credit facility, net | — | — | 896,630 | 896,314 | 1,767,306 | |||||||||||||||||||||||||||
| Below-market lease liabilities, net | 117,121 | 120,938 | 124,009 | 130,208 | 134,410 | |||||||||||||||||||||||||||
| Accounts payable and accrued expenses | 116,486 | 117,015 | 112,101 | 112,551 | 125,358 | |||||||||||||||||||||||||||
| Derivative, deferred rent and other liabilities | 62,944 | 63,204 | 162,952 | 161,538 | 146,893 | |||||||||||||||||||||||||||
| Distributions payable | 106,989 | 89,514 | 85,420 | 85,231 | 150,493 | |||||||||||||||||||||||||||
| Operating lease liabilities | 202,024 | 209,104 | 214,102 | 215,322 | 217,567 | |||||||||||||||||||||||||||
| Total liabilities | 6,227,144 | 6,512,840 | 6,583,854 | 6,669,903 | 7,081,322 | |||||||||||||||||||||||||||
Series F preferred stock | 149 | 189 | 189 | 309 | 309 | |||||||||||||||||||||||||||
Common stock | 2,291 | 2,289 | 2,183 | 2,156 | 2,156 | |||||||||||||||||||||||||||
| Additional paid-in capital | 13,350,661 | 13,449,412 | 13,057,408 | 13,264,911 | 13,261,069 | |||||||||||||||||||||||||||
| Accumulated other comprehensive income (loss) | 634 | 536 | (97,008) | (106,109) | (104,217) | |||||||||||||||||||||||||||
| Accumulated deficit | (6,610,678) | (6,617,380) | (6,514,171) | (6,517,303) | (6,475,568) | |||||||||||||||||||||||||||
| Total stockholders' equity | 6,743,057 | 6,835,046 | 6,448,601 | 6,643,964 | 6,683,749 | |||||||||||||||||||||||||||
| Non-controlling interests | 7,157 | 7,170 | 7,143 | 7,315 | 7,366 | |||||||||||||||||||||||||||
| Total equity | 6,750,214 | 6,842,216 | 6,455,744 | 6,651,279 | 6,691,115 | |||||||||||||||||||||||||||
Total liabilities and equity | $ | 12,977,358 | $ | 13,355,056 | $ | 13,039,598 | $ | 13,321,182 | $ | 13,772,437 | ||||||||||||||||||||||
See the Definitions section for a description of the Company's non-GAAP and operating metrics.
VEREIT, Inc. | WWW.VEREIT.COM | 10
| ||||||||
| Q1 2021 SUPPLEMENTAL INFORMATION | ||||||||
Statements of Operations (unaudited, in thousands, except per share data) | ||
| Three Months Ended | ||||||||||||||||||||||||||||||||
| March 31, 2021 | December 31, 2020 | September 30, 2020 | June 30, 2020 | March 31, 2020 | ||||||||||||||||||||||||||||
| Revenues: | ||||||||||||||||||||||||||||||||
| Rental | $ | 290,309 | $ | 287,431 | $ | 293,692 | $ | 278,576 | $ | 298,586 | ||||||||||||||||||||||
| Fees from managed partnerships | 500 | 478 | 1,586 | 421 | 596 | |||||||||||||||||||||||||||
| Total revenues | 290,809 | 287,909 | 295,278 | 278,997 | 299,182 | |||||||||||||||||||||||||||
| Operating expenses: | ||||||||||||||||||||||||||||||||
| Acquisition-related | 1,354 | 1,048 | 1,050 | 1,169 | 1,523 | |||||||||||||||||||||||||||
Litigation and non-routine costs, net | 68 | 10,925 | 105 | (118) | (8,564) | |||||||||||||||||||||||||||
| Property operating | 30,605 | 31,979 | 31,400 | 29,098 | 30,490 | |||||||||||||||||||||||||||
| General and administrative | 14,526 | 15,399 | 14,774 | 16,120 | 15,056 | |||||||||||||||||||||||||||
| Depreciation and amortization | 108,075 | 108,138 | 109,191 | 110,599 | 124,080 | |||||||||||||||||||||||||||
| Impairments | 31,849 | 28,204 | 16,397 | 12,094 | 8,380 | |||||||||||||||||||||||||||
| Total operating expenses | 186,477 | 195,693 | 172,917 | 168,962 | 170,965 | |||||||||||||||||||||||||||
| Other income (expense): | ||||||||||||||||||||||||||||||||
| Interest expense | (60,736) | (68,416) | (66,935) | (65,613) | (64,696) | |||||||||||||||||||||||||||
| (Loss) gain on extinguishment and forgiveness of debt, net | (2,132) | (67) | 61 | (200) | (1,280) | |||||||||||||||||||||||||||
Other income, net | 3,666 | 5,584 | 73 | 778 | 175 | |||||||||||||||||||||||||||
| Loss on derivative instruments, net | — | (85,392) | — | — | — | |||||||||||||||||||||||||||
| Equity in income and gain on disposition of unconsolidated entities | 447 | 1,133 | 663 | 1,497 | 246 | |||||||||||||||||||||||||||
Gain on disposition of real estate and held for sale assets, net | 76,074 | 18,434 | 42,814 | 8,795 | 25,249 | |||||||||||||||||||||||||||
| Total other income (expenses), net | 17,319 | (128,724) | (23,324) | (54,743) | (40,306) | |||||||||||||||||||||||||||
| Income (loss) before taxes | 121,651 | (36,508) | 99,037 | 55,292 | 87,911 | |||||||||||||||||||||||||||
Provision for income taxes | (928) | (1,358) | (1,054) | (1,053) | (1,048) | |||||||||||||||||||||||||||
| Net income (loss) | 120,723 | (37,866) | 97,983 | 54,239 | 86,863 | |||||||||||||||||||||||||||
| Net (income) loss attributable to non-controlling interests | (76) | 46 | (51) | (31) | (55) | |||||||||||||||||||||||||||
| Net income (loss) attributable to the General Partner | $ | 120,647 | $ | (37,820) | $ | 97,932 | $ | 54,208 | $ | 86,808 | ||||||||||||||||||||||
| Basic and diluted net income (loss) per share attributable to common stockholders and limited partners | $ | 0.50 | $ | (0.21) | $ | 0.40 | $ | 0.19 | $ | 0.34 | ||||||||||||||||||||||
See the Definitions section for a description of the Company's non-GAAP and operating metrics.
VEREIT, Inc. | WWW.VEREIT.COM | 11
| ||||||||
| Q1 2021 SUPPLEMENTAL INFORMATION | ||||||||
Funds From Operations (FFO) (unaudited, in thousands, except share and per share data) | ||
| Three Months Ended | ||||||||||||||||||||||||||||||||
| March 31, 2021 | December 31, 2020 | September 30, 2020 | June 30, 2020 | March 31, 2020 | ||||||||||||||||||||||||||||
| Net income (loss) | $ | 120,723 | $ | (37,866) | $ | 97,983 | $ | 54,239 | $ | 86,863 | ||||||||||||||||||||||
Dividends on Series F Preferred Stock | (6,525) | (7,923) | (10,771) | (12,948) | (12,948) | |||||||||||||||||||||||||||
Gain on disposition of real estate assets, net | (76,074) | (18,965) | (42,814) | (8,795) | (25,249) | |||||||||||||||||||||||||||
Depreciation and amortization of real estate assets | 107,700 | 107,758 | 108,803 | 110,207 | 123,645 | |||||||||||||||||||||||||||
Impairment of real estate | 31,849 | 24,852 | 16,397 | 12,094 | 8,380 | |||||||||||||||||||||||||||
Proportionate share of adjustments for unconsolidated entities | 1,315 | 1,457 | 1,635 | 1,146 | 1,131 | |||||||||||||||||||||||||||
| FFO attributable to common stockholders and limited partners | $ | 178,988 | $ | 69,313 | $ | 171,233 | $ | 155,943 | $ | 181,822 | ||||||||||||||||||||||
| Weighted-average shares outstanding - basic | 229,159,472 | 222,152,574 | 216,737,561 | 215,673,313 | 215,587,560 | |||||||||||||||||||||||||||
Effect of weighted-average Limited Partner OP Units and dilutive securities (1) | 270,395 | 358,851 | 290,114 | 237,300 | 362,688 | |||||||||||||||||||||||||||
Weighted-average shares outstanding - diluted (2) | 229,429,867 | 222,511,425 | 217,027,675 | 215,910,613 | 215,950,248 | |||||||||||||||||||||||||||
FFO attributable to common stockholders and limited partners per diluted share (3) | $ | 0.78 | $ | 0.31 | $ | 0.79 | $ | 0.72 | $ | 0.84 | ||||||||||||||||||||||
___________________________________
(1)Dilutive securities include unvested restricted stock units and stock options.
(2)Weighted-average shares for all periods presented exclude the effect of the Company's convertible debt which was fully repaid in cash as of December 31, 2020 and the underlying restricted stock units that would not have met the vesting criteria based on certain performance targets as of the end of the respective reporting period.
(3)Refer to the Statements of Operations section for basic and diluted net income (loss) per share attributable to common stockholders and limited partners.
See the Definitions section for a description of the Company's non-GAAP and operating metrics.
VEREIT, Inc. | WWW.VEREIT.COM | 12
| ||||||||
| Q1 2021 SUPPLEMENTAL INFORMATION | ||||||||
Adjusted Funds From Operations (AFFO) (unaudited, in thousands, except share and per share data) | ||
| Three Months Ended | ||||||||||||||||||||||||||||||||
| March 31, 2021 | December 31, 2020 | September 30, 2020 | June 30, 2020 | March 31, 2020 | ||||||||||||||||||||||||||||
FFO attributable to common stockholders and limited partners | $ | 178,988 | $ | 69,313 | $ | 171,233 | $ | 155,943 | $ | 181,822 | ||||||||||||||||||||||
Acquisition-related expenses | 1,354 | 1,048 | 1,050 | 1,169 | 1,523 | |||||||||||||||||||||||||||
Litigation and non-routine costs, net | 68 | 10,925 | 105 | (118) | (8,564) | |||||||||||||||||||||||||||
| Impairment of intangibles and right of use assets | — | 3,352 | — | — | — | |||||||||||||||||||||||||||
| (Gain) loss on investments | (695) | (313) | (76) | 142 | 541 | |||||||||||||||||||||||||||
Loss on derivative instruments, net | — | 85,392 | — | — | — | |||||||||||||||||||||||||||
Amortization of premiums and discounts on debt and investments, net | 87 | (193) | (201) | (362) | (689) | |||||||||||||||||||||||||||
Amortization of above-market lease assets and deferred lease incentives, net of amortization of below-market lease liabilities | 1,547 | 1,428 | 393 | 788 | 748 | |||||||||||||||||||||||||||
Net direct financing lease adjustments | 366 | 379 | 381 | 372 | 365 | |||||||||||||||||||||||||||
Amortization and write-off of deferred financing costs | 2,555 | 6,262 | 3,114 | 2,898 | 2,841 | |||||||||||||||||||||||||||
| Loss (gain) on extinguishment and forgiveness of debt, net | 2,132 | 67 | (61) | 200 | 1,280 | |||||||||||||||||||||||||||
Straight-line rent | (4,219) | (7,108) | (12,595) | (3,404) | (2,054) | |||||||||||||||||||||||||||
Equity-based compensation | 2,669 | 2,952 | 2,991 | 3,857 | 2,602 | |||||||||||||||||||||||||||
Other adjustments, net | (1,661) | (3,536) | 379 | 441 | 228 | |||||||||||||||||||||||||||
Proportionate share of adjustments for unconsolidated entities | (144) | (170) | (166) | (843) | 331 | |||||||||||||||||||||||||||
| AFFO attributable to common stockholders and limited partners | $ | 183,047 | $ | 169,798 | $ | 166,547 | $ | 161,083 | $ | 180,974 | ||||||||||||||||||||||
Weighted-average shares outstanding - basic | 229,159,472 | 222,152,574 | 216,737,561 | 215,673,313 | 215,587,560 | |||||||||||||||||||||||||||
Effect of weighted-average Limited Partner OP Units and dilutive securities (1) | 270,395 | 358,851 | 290,114 | 237,300 | 362,688 | |||||||||||||||||||||||||||
Weighted-average shares outstanding - diluted (2) | 229,429,867 | 222,511,425 | 217,027,675 | 215,910,613 | 215,950,248 | |||||||||||||||||||||||||||
AFFO attributable to common stockholders and limited partners per diluted share (3) | $ | 0.80 | $ | 0.76 | $ | 0.77 | $ | 0.75 | $ | 0.84 | ||||||||||||||||||||||
___________________________________
(1)Dilutive securities include unvested restricted stock units and stock options.
(2)Weighted-average shares for all periods presented exclude the effect of the Company's convertible debt which was fully repaid in cash as of December 31, 2020 and the underlying restricted stock units that would not have met the vesting criteria based on certain performance targets as of the end of the respective reporting period.
(3)Refer to the Statements of Operations section for basic and diluted net income (loss) per share attributable to common stockholders and limited partners.
See the Definitions section for a description of the Company's non-GAAP and operating metrics.
VEREIT, Inc. | WWW.VEREIT.COM | 13
| ||||||||
| Q1 2021 SUPPLEMENTAL INFORMATION | ||||||||
EBITDAre and Normalized EBITDA (unaudited, in thousands) | ||
| Three Months Ended | ||||||||||||||||||||||||||||||||
| March 31, 2021 | December 31, 2020 | September 30, 2020 | June 30, 2020 | March 31, 2020 | ||||||||||||||||||||||||||||
| Net income (loss) | $ | 120,723 | $ | (37,866) | $ | 97,983 | $ | 54,239 | $ | 86,863 | ||||||||||||||||||||||
Adjustments: | ||||||||||||||||||||||||||||||||
Interest expense | 60,736 | 68,416 | 66,935 | 65,613 | 64,696 | |||||||||||||||||||||||||||
Depreciation and amortization | 108,075 | 108,138 | 109,191 | 110,599 | 124,080 | |||||||||||||||||||||||||||
Provision for income taxes | 928 | 1,358 | 1,054 | 1,053 | 1,048 | |||||||||||||||||||||||||||
Proportionate share of adjustments for unconsolidated entities | 2,249 | 2,443 | 2,451 | 1,775 | 1,761 | |||||||||||||||||||||||||||
Gain on disposition of real estate assets, net | (76,074) | (18,965) | (42,814) | (8,795) | (25,249) | |||||||||||||||||||||||||||
Impairment of real estate | 31,849 | 24,852 | 16,397 | 12,094 | 8,380 | |||||||||||||||||||||||||||
EBITDAre | $ | 248,486 | $ | 148,376 | $ | 251,197 | $ | 236,578 | $ | 261,579 | ||||||||||||||||||||||
| Impairment of intangibles and right of use assets | — | 3,352 | — | — | — | |||||||||||||||||||||||||||
Acquisition-related expenses | 1,354 | 1,048 | 1,050 | 1,169 | 1,523 | |||||||||||||||||||||||||||
| Litigation and non-routine costs, net | 68 | 10,925 | 105 | (118) | (8,564) | |||||||||||||||||||||||||||
| (Gain) loss on investments | (695) | (313) | (76) | 142 | 541 | |||||||||||||||||||||||||||
Loss on derivative instruments, net | — | 85,392 | — | — | — | |||||||||||||||||||||||||||
Amortization of above-market lease assets and deferred lease incentives, net of amortization of below-market lease liabilities | 1,547 | 1,428 | 393 | 788 | 748 | |||||||||||||||||||||||||||
| Loss (gain) on extinguishment and forgiveness of debt, net | 2,132 | 67 | (61) | 200 | 1,280 | |||||||||||||||||||||||||||
Net direct financing lease adjustments | 366 | 379 | 381 | 372 | 365 | |||||||||||||||||||||||||||
Other adjustments, net | (2,055) | (3,919) | (8) | 54 | (205) | |||||||||||||||||||||||||||
Proportionate share of adjustments for unconsolidated entities | (32) | (46) | (48) | (706) | (36) | |||||||||||||||||||||||||||
| Normalized EBITDA | $ | 251,171 | $ | 246,689 | $ | 252,933 | $ | 238,479 | $ | 257,231 | ||||||||||||||||||||||
See the Definitions section for a description of the Company's non-GAAP and operating metrics.
VEREIT, Inc. | WWW.VEREIT.COM | 14
| ||||||||
| Q1 2021 SUPPLEMENTAL INFORMATION | ||||||||
Net Operating Income (unaudited, dollars in thousands) | ||
NOI and Cash NOI
| Three Months Ended | ||||||||||||||||||||||||||||||||
| March 31, 2021 | December 31, 2020 | September 30, 2020 | June 30, 2020 | March 31, 2020 | ||||||||||||||||||||||||||||
Rental revenue - as reported (1) | $ | 290,309 | $ | 287,431 | $ | 293,692 | $ | 278,576 | $ | 298,586 | ||||||||||||||||||||||
| Property operating expense - as reported | (30,605) | (31,979) | (31,400) | (29,098) | (30,490) | |||||||||||||||||||||||||||
| NOI | 259,704 | 255,452 | 262,292 | 249,478 | 268,096 | |||||||||||||||||||||||||||
| Adjustments: | ||||||||||||||||||||||||||||||||
Straight-line rent | (4,219) | (7,108) | (12,595) | (3,404) | (2,054) | |||||||||||||||||||||||||||
Amortization of above-market lease assets and deferred lease incentives, net of amortization of below-market lease liabilities | 1,547 | 1,428 | 393 | 788 | 748 | |||||||||||||||||||||||||||
| Net direct financing lease adjustments | 366 | 379 | 381 | 372 | 365 | |||||||||||||||||||||||||||
| Other non-cash adjustments | (18) | — | — | — | — | |||||||||||||||||||||||||||
| Proportionate share of amounts for Unconsolidated Joint Ventures | 2,507 | 2,799 | 2,876 | 2,475 | 2,404 | |||||||||||||||||||||||||||
| Cash NOI | $ | 259,887 | $ | 252,950 | $ | 253,347 | $ | 249,709 | $ | 269,559 | ||||||||||||||||||||||
___________________________________
(1)Rental revenue includes percentage rent of $1.7 million, $2.9 million, $1.0 million, $1.4 million and $1.4 million for the three months ended March 31, 2021, December 31, 2020, September 30, 2020, June 30, 2020, and March 31, 2020, respectively.
Normalized Cash NOI
| Three Months Ended | ||||||||
| March 31, 2021 | ||||||||
| Cash NOI | $ | 259,887 | ||||||
Adjustments for intra-quarter acquisitions and dispositions (1) | (1,164) | |||||||
| Normalized Cash NOI | $ | 258,723 | ||||||
___________________________________
(1)The adjustment eliminates Cash NOI for properties acquired during the three months ended March 31, 2021 and replaces Cash NOI for the partial period with an amount estimated to be equivalent to Cash NOI for the full period. The adjustment also eliminates Cash NOI for properties disposed of during the three months ended March 31, 2021.
See the Definitions section for a description of the Company's non-GAAP and operating metrics.
VEREIT, Inc. | WWW.VEREIT.COM | 15
| ||||||||
| Q1 2021 SUPPLEMENTAL INFORMATION | ||||||||
Same Store Contract Rental Revenue (unaudited, dollars in thousands) | ||
The Company reviews the stabilized operating results from properties that we refer to as "same store." In determining the same store property pool, we include Operating Properties and properties owned by unconsolidated joint ventures that were owned for the entirety of both the current and prior reporting periods, except for development or redevelopment properties. The following tables show the Company's same store portfolio statistics, which for the three months ended March 31, 2021 included 3,751(1) Operating Properties, with 85.2 million aggregate square feet, acquired prior to January 1, 2020 and owned through March 31, 2021 and the pro rata share of Contract Rental Revenue from properties owned by unconsolidated joint ventures.
| Three Months Ended March 31, | Increase/(Decrease) | |||||||||||||||||||||||||
| 2021 | 2020 | $ Change | % Change | |||||||||||||||||||||||
| Contract Rental Revenue | $ | 256,676 | $ | 259,326 | $ | (2,650) | (1.0) | % | ||||||||||||||||||
| Economic Occupancy Rate | 97.9 | % | 99.3 | % | N/A | (1.4) | % | |||||||||||||||||||
| Contract Rental Revenue | |||||||||||||||||||||||||||||||||||
| Number of | Three Months Ended March 31, | Increase/(Decrease) | |||||||||||||||||||||||||||||||||
| Properties | 2021 | 2020 | $ Change | % Change | |||||||||||||||||||||||||||||||
Retail | 2,033 | $ | 118,424 | $ | 118,439 | $ | (15) | — | % | ||||||||||||||||||||||||||
Restaurant | 1,504 | 51,546 | 53,919 | (2,373) | (4.4) | % | |||||||||||||||||||||||||||||
Industrial | 145 | 44,791 | 44,974 | (183) | (0.4) | % | |||||||||||||||||||||||||||||
| Office | 61 | 41,877 | 41,958 | (81) | (0.2) | % | |||||||||||||||||||||||||||||
Other (2) | 8 | 38 | 36 | 2 | 5.6 | % | |||||||||||||||||||||||||||||
| Total | 3,751 | $ | 256,676 | $ | 259,326 | $ | (2,650) | (1.0) | % | ||||||||||||||||||||||||||
___________________________________
(1)Development and expansion properties are included in the same store population if the placed in service date was prior to January 1, 2020.
(2)Other properties include billboards, land and parking lots.
See the Definitions section for a description of the Company's non-GAAP and operating metrics.
VEREIT, Inc. | WWW.VEREIT.COM | 16
| ||||||||
| Q1 2021 SUPPLEMENTAL INFORMATION | ||||||||
Adjusted Principal Outstanding and Preferred Equity Summary (unaudited, dollars in thousands) | ||
| Principal Payments Due | Total | 2021 | 2022 | 2023 | 2024 | 2025 | 2026 | 2027 | Thereafter | |||||||||||||||||||||||||||||||||||||||||||||||
| Mortgage notes payable | $ | 1,040,389 | $ | 48,985 | $ | 239,201 | $ | 124,217 | $ | 621,021 | $ | 1,078 | $ | 1,138 | $ | 1,202 | $ | 3,547 | ||||||||||||||||||||||||||||||||||||||
Corporate bonds | 4,650,000 | — | — | — | 500,000 | 550,000 | 600,000 | 600,000 | 2,400,000 | |||||||||||||||||||||||||||||||||||||||||||||||
| Proportionate share of amounts for Unconsolidated Joint Ventures | 106,516 | — | — | 20,510 | 53,850 | — | — | 32,156 | — | |||||||||||||||||||||||||||||||||||||||||||||||
Total Adjusted Principal Outstanding | $ | 5,796,905 | $ | 48,985 | $ | 239,201 | $ | 144,727 | $ | 1,174,871 | $ | 551,078 | $ | 601,138 | $ | 633,358 | $ | 2,403,547 | ||||||||||||||||||||||||||||||||||||||
| Debt Type | Percentage of Adjusted Principal Outstanding | Weighted-Average Interest Rate | Weighted-Average Years to Maturity | |||||||||||||||||
| Mortgage notes payable | 18.0 | % | 4.87 | % | 2.3 | |||||||||||||||
| Corporate bonds | 80.2 | % | 3.68 | % | 6.9 | |||||||||||||||
| Proportionate share of amounts for Unconsolidated Joint Ventures | 1.8 | % | 2.94 | % | 3.9 | |||||||||||||||
| Total | 100.0 | % | 3.88 | % | 6.0 | |||||||||||||||
| Debt Type | Percentage of Adjusted Principal Outstanding | Weighted-Average Interest Rate | Weighted-Average Years to Maturity | |||||||||||||||||
| Total unsecured debt | 80.2 | % | 3.68 | % | 6.9 | |||||||||||||||
Total secured debt | 19.8 | % | 4.69 | % | 2.4 | |||||||||||||||
Total | 100.0 | % | 3.88 | % | 6.0 | |||||||||||||||
| Total fixed-rate debt | 99.4 | % | 3.89 | % | 6.0 | |||||||||||||||
Total variable-rate debt | 0.6 | % | 2.52 | % | 1.2 | |||||||||||||||
| Total | 100.0 | % | 3.88 | % | 6.0 | |||||||||||||||
| Preferred Equity | Balance (1) | Dividend Rate | ||||||||||||
| Series F preferred stock | $ | 373,025 | 6.7 | % | ||||||||||
___________________________________
(1)Balance represents 14.9 million shares of Series F Preferred Stock (and 14.9 million corresponding general partner Series F Preferred Units) and 49,766 limited partner Series F Preferred Units outstanding at March 31, 2021, multiplied by the liquidation preference of $25 per share.
See the Definitions section for a description of the Company's non-GAAP and operating metrics.
VEREIT, Inc. | WWW.VEREIT.COM | 17
| ||||||||
| Q1 2021 SUPPLEMENTAL INFORMATION | ||||||||
Adjusted Principal Outstanding and Preferred Equity Summary (cont.) (unaudited, dollars in millions) | ||
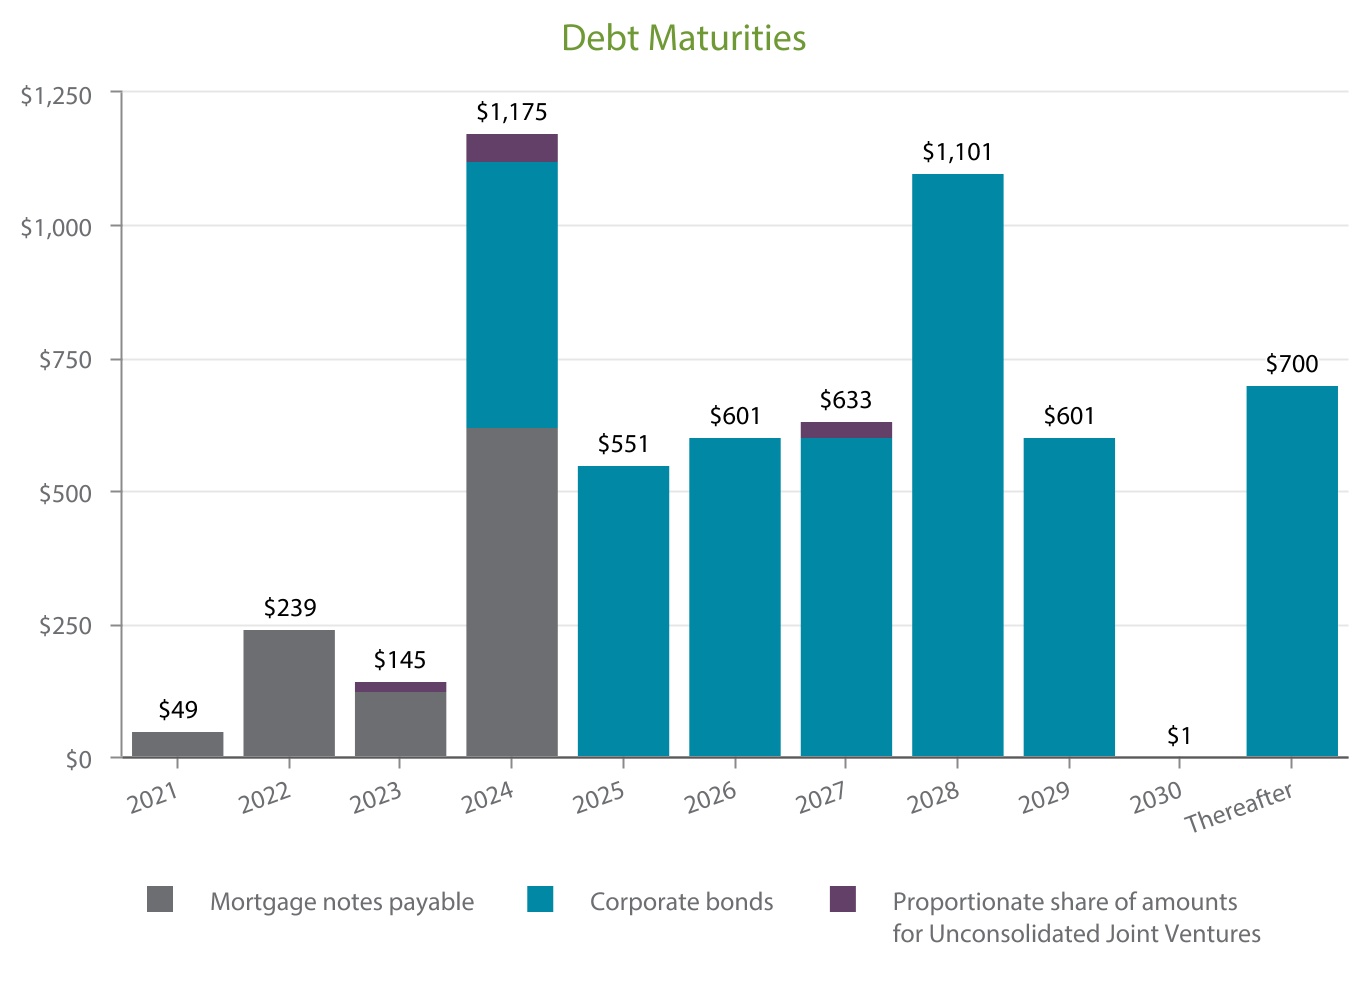
See the Definitions section for a description of the Company's non-GAAP and operating metrics.
VEREIT, Inc. | WWW.VEREIT.COM | 18
| ||||||||
| Q1 2021 SUPPLEMENTAL INFORMATION | ||||||||
Credit Facility and Corporate Bond Covenants (unaudited) | ||
The following is a summary of key financial covenants for the Company's unsecured credit facility and corporate bonds, as defined and calculated per the terms of the facility's credit agreement and the bonds' governing documents, respectively. These calculations, which are not based on GAAP measurements, are presented to investors to show that the Company is in compliance with the financial covenants and are not measures of our liquidity or performance. As of March 31, 2021, the Company believes it is in compliance with these covenants based on the covenant limits and calculations in place at that time.
| Unsecured Credit Facility Key Covenants | Required | March 31, 2021 | ||||||||||||
Ratio of total indebtedness to total asset value | ≤ 60% | 37.6% | ||||||||||||
Ratio of adjusted EBITDA to fixed charges | ≥ 1.5x | 3.30x | ||||||||||||
Ratio of secured indebtedness to total asset value | ≤ 45% | 5.7% | ||||||||||||
Ratio of unsecured indebtedness to unencumbered asset value | ≤ 60% | 38.6% | ||||||||||||
Ratio of unencumbered adjusted NOI to unsecured interest expense | ≥ 1.75x | 4.56x | ||||||||||||
| Corporate Bond Key Covenants | Required | March 31, 2021 | ||||||||||||
Limitation on incurrence of total debt | ≤ 65% | 37.6% | ||||||||||||
Limitation on incurrence of secured debt | ≤ 40% | 6.9% | ||||||||||||
Debt service coverage | ≥ 1.5x | 4.18x | ||||||||||||
Maintenance of total unencumbered assets | ≥ 150% | 280.7% | ||||||||||||
See the Definitions section for a description of the Company's non-GAAP and operating metrics.
VEREIT, Inc. | WWW.VEREIT.COM | 19
| ||||||||
| Q1 2021 SUPPLEMENTAL INFORMATION | ||||||||
Acquisitions and Dispositions (unaudited, square feet and dollars in thousands) | ||
Acquisitions
The following table summarizes the Company's acquisition activity during the three months ended March 31, 2021.
| Property Type | Number of Properties | Square Feet | Weighted Average Lease Term (Years) (1) | Weighted Average Cash Cap Rate | Purchase Price (2) | |||||||||||||||||||||||||||
| Retail | 37 | 309 | 16.2 | 7.4 | % | $ | 96,889 | |||||||||||||||||||||||||
| Industrial | 1 | 64 | 15.0 | 6.5 | % | 5,625 | ||||||||||||||||||||||||||
| Restaurant | 16 | 52 | 20.0 | 6.3 | % | 35,924 | ||||||||||||||||||||||||||
Total acquisitions | 54 | 425 | 17.1 | 7.1 | % | $ | 138,438 | |||||||||||||||||||||||||
Dispositions
The following table summarizes the Company's disposition activity and the related gains/losses during the three months ended March 31, 2021.
| Number of Properties | Square Feet | Weighted Average Lease Term (Years) (3) | Weighted Average Cash Cap Rate (4) | Sale Price | Gain (Loss) | |||||||||||||||||||||||||||||||||
Office (5) | 10 | 883 | 9.5 | 6.2 | % | $ | 235,500 | $ | 56,755 | |||||||||||||||||||||||||||||
| Industrial | 1 | 146 | 4.5 | 5.0 | % | 27,029 | 14,725 | |||||||||||||||||||||||||||||||
| Other restaurants | 2 | 9 | 3.8 | N/A | 4,375 | 1,228 | ||||||||||||||||||||||||||||||||
Vacant and other (6) | 17 | 133 | N/A | N/A | 4,248 | 3,439 | ||||||||||||||||||||||||||||||||
| Total dispositions | 30 | 1,171 | 8.9 | 6.1 | % | $ | 271,152 | $ | 76,147 | |||||||||||||||||||||||||||||
| Held for sale assets | (73) | |||||||||||||||||||||||||||||||||||||
| Total gain on disposition of real estate, net | $ | 76,074 | ||||||||||||||||||||||||||||||||||||
___________________________________
(1)Represents the remaining lease term from the date of acquisition.
(2)Excludes acquisition-related expenses capitalized.
(3)Represents the remaining lease term from the date of sale.
(4)Excludes certain Cash Cap Rates considered not meaningful due to factors such as physical and economic vacancy or short remaining lease terms. Of the $271.2 million of dispositions, $252.6 million was used in the total weighted average Cash Cap Rate calculation of 6.1%.
(5)The Cash Cap Rate for one office property is based on the five-year average base rent following the disposition date.
(6)Represents 13 restaurants, of which six were vacant and seven were relinquished to the ground lessor upon expiration or termination of the ground lease for no proceeds, and four vacant retail properties.
See the Definitions section for a description of the Company's non-GAAP and operating metrics.
VEREIT, Inc. | WWW.VEREIT.COM | 20
| ||||||||
| Q1 2021 SUPPLEMENTAL INFORMATION | ||||||||
Diversification Statistics: Real Estate Portfolio (unaudited, percentages based on portfolio Annualized Rental Income) | ||
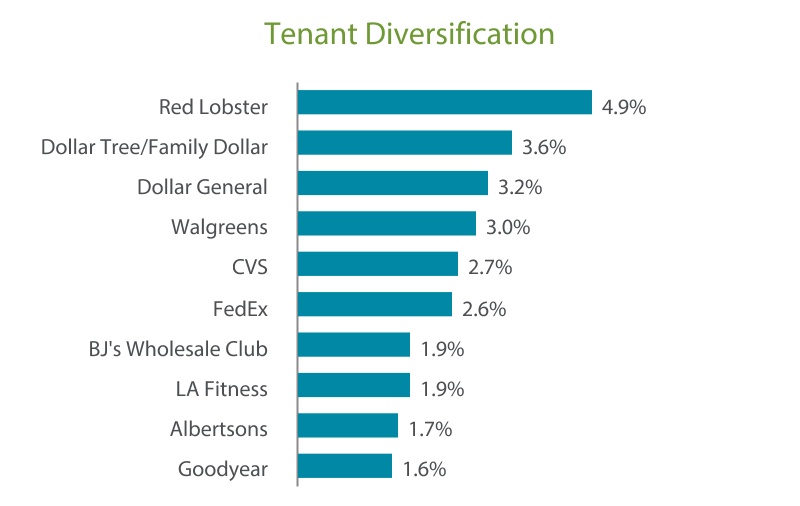
___________________________________________________
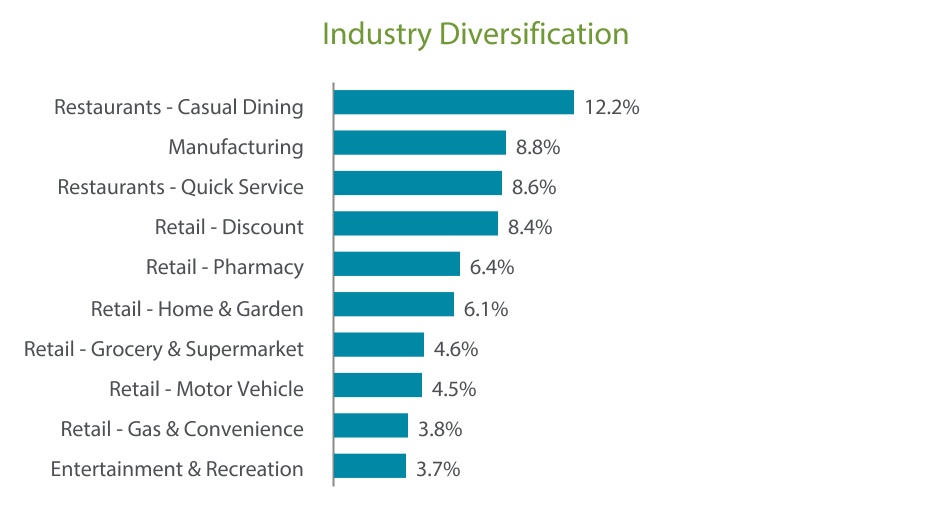
___________________________________________________
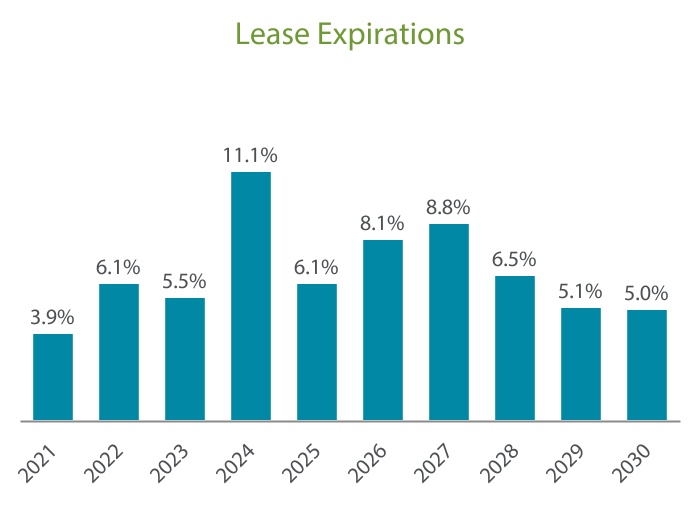
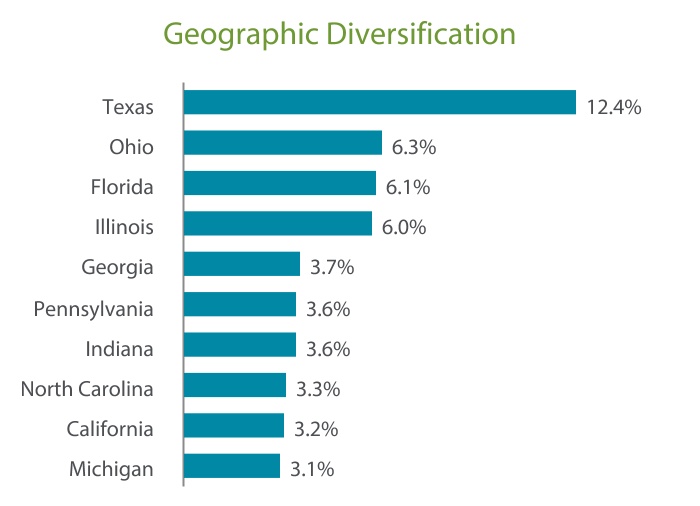
___________________________________________________
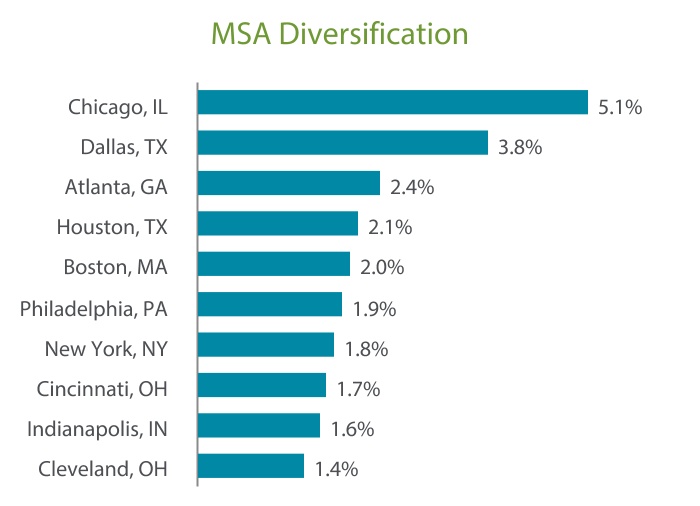
___________________________________________________
Statistics (square feet in thousands) | |||||||||||
| Operating Properties | 3,855 | ||||||||||
| Rentable Square Feet | 88,747 | ||||||||||
Economic Occupancy Rate | 98.0 | % | |||||||||
Weighted Average Remaining Lease Term | 8.4 | ||||||||||
| Investment-Grade Tenants | 37.8 | % | |||||||||
| Flat leases | 19.6 | % | |||||||||
| NNN leases | 64.4 | % | |||||||||
See the Definitions section for a description of the Company's non-GAAP and operating metrics.
VEREIT, Inc. | WWW.VEREIT.COM | 21
| ||||||||
| Q1 2021 SUPPLEMENTAL INFORMATION | ||||||||
Top 10 Concentrations: Real Estate Portfolio (unaudited, square feet and dollars in thousands) | ||
| Tenant Concentration | Number of Leases | Leased Square Feet | Square Feet as a % of Total Portfolio | Annualized Rental Income | Annualized Rental Income as a % of Total Portfolio | Investment Rating | ||||||||||||||||||||||||||||||||
| Red Lobster | 25 | 1,489 | 1.7 | % | $ | 52,351 | 4.9 | % | NR | |||||||||||||||||||||||||||||
| Dollar Tree/Family Dollar | 115 | 3,373 | 3.8 | % | 38,780 | 3.6 | % | BBB | ||||||||||||||||||||||||||||||
| Dollar General | 404 | 3,743 | 4.2 | % | 34,667 | 3.2 | % | BBB | ||||||||||||||||||||||||||||||
| Walgreens | 93 | 1,321 | 1.5 | % | 32,692 | 3.0 | % | BBB | ||||||||||||||||||||||||||||||
| CVS | 90 | 1,293 | 1.5 | % | 28,774 | 2.7 | % | BBB | ||||||||||||||||||||||||||||||
| FedEx | 41 | 2,595 | 2.9 | % | 27,630 | 2.6 | % | BBB | ||||||||||||||||||||||||||||||
| BJ's Wholesale Club | 3 | 2,223 | 2.5 | % | 20,800 | 1.9 | % | BB | ||||||||||||||||||||||||||||||
| LA Fitness | 24 | 1,049 | 1.2 | % | 20,467 | 1.9 | % | CCC+ | ||||||||||||||||||||||||||||||
| Albertsons | 26 | 1,536 | 1.7 | % | 18,628 | 1.7 | % | BB- | ||||||||||||||||||||||||||||||
| Goodyear | 5 | 4,728 | 5.3 | % | 17,421 | 1.6 | % | B+ | ||||||||||||||||||||||||||||||
| Total | 826 | 23,350 | 26.3 | % | $ | 292,210 | 27.1 | % | ||||||||||||||||||||||||||||||
| Tenant Industry Concentration | Number of Leases | Leased Square Feet | Square Feet as a % of Total Portfolio | Annualized Rental Income | Annualized Rental Income as a % of Total Portfolio | |||||||||||||||||||||||||||
| Restaurants - Casual Dining | 302 | 3,699 | 4.2 | % | $ | 130,746 | 12.2 | % | ||||||||||||||||||||||||
| Manufacturing | 52 | 16,662 | 18.8 | % | 94,308 | 8.8 | % | |||||||||||||||||||||||||
| Restaurants - Quick Service | 777 | 2,899 | 3.3 | % | 92,253 | 8.6 | % | |||||||||||||||||||||||||
| Retail - Discount | 549 | 9,018 | 10.2 | % | 90,357 | 8.4 | % | |||||||||||||||||||||||||
| Retail - Pharmacy | 198 | 3,014 | 3.4 | % | 68,338 | 6.4 | % | |||||||||||||||||||||||||
| Retail - Home & Garden | 110 | 8,846 | 10.0 | % | 65,137 | 6.1 | % | |||||||||||||||||||||||||
| Retail - Grocery & Supermarket | 69 | 4,300 | 4.8 | % | 49,697 | 4.6 | % | |||||||||||||||||||||||||
| Retail - Motor Vehicle | 182 | 6,143 | 6.9 | % | 48,945 | 4.5 | % | |||||||||||||||||||||||||
| Retail - Gas & Convenience | 158 | 824 | 0.9 | % | 40,398 | 3.8 | % | |||||||||||||||||||||||||
| Entertainment & Recreation | 37 | 1,675 | 1.9 | % | 39,488 | 3.7 | % | |||||||||||||||||||||||||
| Total | 2,434 | 57,080 | 64.4 | % | $ | 719,667 | 67.1 | % | ||||||||||||||||||||||||
| Geographic Concentration | Number of Properties | Rentable Square Feet | Square Feet as a % of Total Portfolio | Annualized Rental Income | Annualized Rental Income as a % of Total Portfolio | |||||||||||||||||||||||||||
| Texas | 540 | 10,266 | 11.6 | % | $ | 132,962 | 12.4 | % | ||||||||||||||||||||||||
| Ohio | 278 | 8,598 | 9.7 | % | 67,761 | 6.3 | % | |||||||||||||||||||||||||
| Florida | 251 | 4,427 | 5.0 | % | 65,956 | 6.1 | % | |||||||||||||||||||||||||
| Illinois | 153 | 4,672 | 5.3 | % | 64,572 | 6.0 | % | |||||||||||||||||||||||||
| Georgia | 163 | 3,414 | 3.8 | % | 39,986 | 3.7 | % | |||||||||||||||||||||||||
| Pennsylvania | 100 | 3,772 | 4.3 | % | 38,749 | 3.6 | % | |||||||||||||||||||||||||
| Indiana | 132 | 4,511 | 5.1 | % | 38,440 | 3.6 | % | |||||||||||||||||||||||||
| North Carolina | 148 | 3,265 | 3.7 | % | 35,180 | 3.3 | % | |||||||||||||||||||||||||
| California | 58 | 3,260 | 3.7 | % | 34,646 | 3.2 | % | |||||||||||||||||||||||||
| Michigan | 170 | 1,978 | 2.2 | % | 33,590 | 3.1 | % | |||||||||||||||||||||||||
| Total | 1,993 | 48,163 | 54.4 | % | $ | 551,842 | 51.3 | % | ||||||||||||||||||||||||
See the Definitions section for a description of the Company's non-GAAP and operating metrics.
VEREIT, Inc. | WWW.VEREIT.COM | 22
| ||||||||
| Q1 2021 SUPPLEMENTAL INFORMATION | ||||||||
Top 10 Concentrations: Real Estate Portfolio (unaudited, square feet and dollars in thousands) | ||
| Metropolitan Statistical Area (MSA) Concentration | Number of Properties | Rentable Square Feet | Square Feet as a % of Total Portfolio | Annualized Rental Income | Annualized Rental Income as a % of Total Portfolio | |||||||||||||||||||||||||||
| Chicago, IL | 97 | 3,984 | 4.5 | % | $ | 55,117 | 5.1 | % | ||||||||||||||||||||||||
| Dallas, TX | 107 | 3,411 | 3.8 | % | 41,346 | 3.8 | % | |||||||||||||||||||||||||
| Atlanta, GA | 72 | 2,467 | 2.8 | % | 25,409 | 2.4 | % | |||||||||||||||||||||||||
| Houston, TX | 84 | 2,102 | 2.4 | % | 22,346 | 2.1 | % | |||||||||||||||||||||||||
| Boston, MA | 20 | 1,505 | 1.7 | % | 21,158 | 2.0 | % | |||||||||||||||||||||||||
| Philadelphia, PA | 35 | 1,114 | 1.3 | % | 19,964 | 1.9 | % | |||||||||||||||||||||||||
| New York, NY | 23 | 1,082 | 1.2 | % | 19,782 | 1.8 | % | |||||||||||||||||||||||||
| Cincinnati, OH | 42 | 2,315 | 2.6 | % | 18,553 | 1.7 | % | |||||||||||||||||||||||||
| Indianapolis, IN | 42 | 1,733 | 2.0 | % | 17,306 | 1.6 | % | |||||||||||||||||||||||||
| Cleveland, OH | 59 | 1,107 | 1.2 | % | 14,538 | 1.4 | % | |||||||||||||||||||||||||
| Total | 581 | 20,820 | 23.5 | % | $ | 255,519 | 23.8 | % | ||||||||||||||||||||||||
See the Definitions section for a description of the Company's non-GAAP and operating metrics.
VEREIT, Inc. | WWW.VEREIT.COM | 23
| ||||||||
| Q1 2021 SUPPLEMENTAL INFORMATION | ||||||||
Tenants Comprising Over 1% of Annualized Rental Income (unaudited, square feet and dollars in thousands) | ||
| Tenant | Number of Leases | Leased Square Feet | Square Feet as a % of Total Portfolio | Annualized Rental Income | Annualized Rental Income as a % of Total Portfolio | Investment Rating | ||||||||||||||||||||||||||||||||
| Red Lobster | 25 | 1,489 | 1.7 | % | $ | 52,351 | 4.9 | % | NR | |||||||||||||||||||||||||||||
| Dollar Tree/Family Dollar | 115 | 3,373 | 3.8 | % | 38,780 | 3.6 | % | BBB | ||||||||||||||||||||||||||||||
| Dollar General | 404 | 3,743 | 4.2 | % | 34,667 | 3.2 | % | BBB | ||||||||||||||||||||||||||||||
| Walgreens | 93 | 1,321 | 1.5 | % | 32,692 | 3.0 | % | BBB | ||||||||||||||||||||||||||||||
| CVS | 90 | 1,293 | 1.5 | % | 28,774 | 2.7 | % | BBB | ||||||||||||||||||||||||||||||
| FedEx | 41 | 2,595 | 2.9 | % | 27,630 | 2.6 | % | BBB | ||||||||||||||||||||||||||||||
| BJ's Wholesale Club | 3 | 2,223 | 2.5 | % | 20,800 | 1.9 | % | BB | ||||||||||||||||||||||||||||||
| LA Fitness | 24 | 1,049 | 1.2 | % | 20,467 | 1.9 | % | CCC+ | ||||||||||||||||||||||||||||||
| Albertsons | 26 | 1,536 | 1.7 | % | 18,628 | 1.7 | % | BB- | ||||||||||||||||||||||||||||||
| Goodyear | 5 | 4,728 | 5.3 | % | 17,421 | 1.6 | % | B+ | ||||||||||||||||||||||||||||||
| Tractor Supply | 61 | 1,274 | 1.4 | % | 16,676 | 1.5 | % | BBB | ||||||||||||||||||||||||||||||
| At Home | 5 | 1,406 | 1.6 | % | 12,235 | 1.1 | % | B | ||||||||||||||||||||||||||||||
| Advance Auto Parts | 104 | 716 | 0.8 | % | 11,905 | 1.1 | % | BBB- | ||||||||||||||||||||||||||||||
| Home Depot | 9 | 1,751 | 2.0 | % | 11,836 | 1.1 | % | A | ||||||||||||||||||||||||||||||
| Lowe's | 14 | 1,751 | 2.0 | % | 11,442 | 1.1 | % | BBB+ | ||||||||||||||||||||||||||||||
| Merrill Lynch | 1 | 482 | 0.5 | % | 11,104 | 1.0 | % | A- | ||||||||||||||||||||||||||||||
| AON | 2 | 819 | 0.9 | % | 10,822 | 1.0 | % | A- | ||||||||||||||||||||||||||||||
| Total | 1,022 | 31,549 | 35.5 | % | $ | 378,230 | 35.0 | % | ||||||||||||||||||||||||||||||
See the Definitions section for a description of the Company's non-GAAP and operating metrics.
VEREIT, Inc. | WWW.VEREIT.COM | 24
| ||||||||
| Q1 2021 SUPPLEMENTAL INFORMATION | ||||||||
Diversification: Tenant Industry (unaudited, square feet and dollars in thousands) | ||
Industry | Number of Leases | Leased Square Feet | Leased Square Feet as a % of Total Portfolio | Annualized Rental Income | Annualized Rental Income as a % of Total Portfolio | |||||||||||||||||||||||||||
| Administration & Support Services | 3 | 425 | 0.5 | % | $ | 3,960 | 0.4 | % | ||||||||||||||||||||||||
| Agricultural | 2 | 137 | 0.1 | % | 1,245 | 0.1 | % | |||||||||||||||||||||||||
| Education | 5 | 219 | 0.2 | % | 2,179 | 0.2 | % | |||||||||||||||||||||||||
| Entertainment & Recreation | 37 | 1,675 | 1.9 | % | 39,488 | 3.7 | % | |||||||||||||||||||||||||
| Finance | 155 | 1,710 | 1.9 | % | 38,712 | 3.6 | % | |||||||||||||||||||||||||
| Government & Public Services | 11 | 589 | 0.7 | % | 9,552 | 0.9 | % | |||||||||||||||||||||||||
| Healthcare | 8 | 802 | 0.9 | % | 11,457 | 1.1 | % | |||||||||||||||||||||||||
| Information & Communication | 7 | 389 | 0.4 | % | 5,357 | 0.5 | % | |||||||||||||||||||||||||
| Insurance | 12 | 1,155 | 1.3 | % | 24,118 | 2.2 | % | |||||||||||||||||||||||||
| Logistics | 44 | 3,297 | 3.7 | % | 33,385 | 3.1 | % | |||||||||||||||||||||||||
| Manufacturing | 52 | 16,662 | 18.8 | % | 94,308 | 8.8 | % | |||||||||||||||||||||||||
| Mining & Natural Resources | 5 | 424 | 0.5 | % | 6,807 | 0.6 | % | |||||||||||||||||||||||||
| Other Services | 12 | 473 | 0.5 | % | 3,944 | 0.4 | % | |||||||||||||||||||||||||
| Professional Services | 45 | 2,881 | 3.2 | % | 37,770 | 3.5 | % | |||||||||||||||||||||||||
| Rental | 10 | 878 | 1.0 | % | 9,521 | 0.9 | % | |||||||||||||||||||||||||
| Restaurants - Casual Dining | 302 | 3,699 | 4.2 | % | 130,746 | 12.2 | % | |||||||||||||||||||||||||
| Restaurants - Quick Service | 777 | 2,899 | 3.3 | % | 92,253 | 8.6 | % | |||||||||||||||||||||||||
| Retail - Apparel & Jewelry | 15 | 1,380 | 1.6 | % | 16,537 | 1.5 | % | |||||||||||||||||||||||||
| Retail - Department Stores | 13 | 1,028 | 1.2 | % | 8,298 | 0.8 | % | |||||||||||||||||||||||||
| Retail - Discount | 549 | 9,018 | 10.2 | % | 90,357 | 8.4 | % | |||||||||||||||||||||||||
| Retail - Electronics & Appliances | 14 | 1,559 | 1.8 | % | 10,045 | 0.9 | % | |||||||||||||||||||||||||
| Retail - Gas & Convenience | 158 | 824 | 0.9 | % | 40,398 | 3.8 | % | |||||||||||||||||||||||||
| Retail - Grocery & Supermarket | 69 | 4,300 | 4.8 | % | 49,697 | 4.6 | % | |||||||||||||||||||||||||
| Retail - Hobby, Books & Music | 16 | 2,106 | 2.4 | % | 12,873 | 1.2 | % | |||||||||||||||||||||||||
| Retail - Home & Garden | 110 | 8,846 | 10.0 | % | 65,137 | 6.1 | % | |||||||||||||||||||||||||
| Retail - Home Furnishings | 50 | 2,631 | 3.0 | % | 29,457 | 2.7 | % | |||||||||||||||||||||||||
| Retail - Internet | 1 | 1,423 | 1.6 | % | 6,797 | 0.6 | % | |||||||||||||||||||||||||
| Retail - Medical Services | 68 | 548 | 0.6 | % | 12,132 | 1.1 | % | |||||||||||||||||||||||||
| Retail - Motor Vehicle | 182 | 6,143 | 6.9 | % | 48,945 | 4.5 | % | |||||||||||||||||||||||||
| Retail - Pet Supply | 15 | 578 | 0.6 | % | 10,686 | 1.0 | % | |||||||||||||||||||||||||
| Retail - Pharmacy | 198 | 3,014 | 3.4 | % | 68,338 | 6.4 | % | |||||||||||||||||||||||||
| Retail - Specialty (Other) | 22 | 538 | 0.6 | % | 5,966 | 0.6 | % | |||||||||||||||||||||||||
| Retail - Sporting Goods | 25 | 1,971 | 2.2 | % | 26,113 | 2.4 | % | |||||||||||||||||||||||||
| Retail - Warehouse Clubs | 5 | 2,466 | 2.8 | % | 22,989 | 2.1 | % | |||||||||||||||||||||||||
Other | 21 | 251 | 0.3 | % | 6,397 | 0.5 | % | |||||||||||||||||||||||||
Total | 3,018 | 86,938 | 98.0 | % | $ | 1,075,964 | 100.0 | % | ||||||||||||||||||||||||
See the Definitions section for a description of the Company's non-GAAP and operating metrics.
VEREIT, Inc. | WWW.VEREIT.COM | 25
| ||||||||
| Q1 2021 SUPPLEMENTAL INFORMATION | ||||||||
Diversification: Property Geographic (unaudited, square feet and dollars in thousands) | ||
Location | Number of Properties | Rentable Square Feet | Square Feet as a % of Total Portfolio | Annualized Rental Income | Annualized Rental Income as a % of Total Portfolio | |||||||||||||||||||||||||||
United States | ||||||||||||||||||||||||||||||||
| Alabama | 150 | 1,678 | 1.9 | % | $ | 26,879 | 2.5 | % | ||||||||||||||||||||||||
| Alaska | 3 | 25 | — | % | 806 | 0.1 | % | |||||||||||||||||||||||||
| Arizona | 76 | 1,460 | 1.6 | % | 23,631 | 2.2 | % | |||||||||||||||||||||||||
| Arkansas | 128 | 1,279 | 1.4 | % | 19,621 | 1.8 | % | |||||||||||||||||||||||||
| California | 58 | 3,260 | 3.7 | % | 34,646 | 3.2 | % | |||||||||||||||||||||||||
| Colorado | 42 | 1,548 | 1.7 | % | 23,449 | 2.2 | % | |||||||||||||||||||||||||
| Connecticut | 14 | 85 | 0.1 | % | 1,832 | 0.2 | % | |||||||||||||||||||||||||
| Delaware | 6 | 59 | 0.1 | % | 1,075 | 0.1 | % | |||||||||||||||||||||||||
| Florida | 251 | 4,427 | 5.0 | % | 65,956 | 6.1 | % | |||||||||||||||||||||||||
| Georgia | 163 | 3,414 | 3.8 | % | 39,986 | 3.7 | % | |||||||||||||||||||||||||
| Idaho | 17 | 143 | 0.2 | % | 3,381 | 0.3 | % | |||||||||||||||||||||||||
| Illinois | 153 | 4,672 | 5.3 | % | 64,572 | 6.0 | % | |||||||||||||||||||||||||
| Indiana | 132 | 4,511 | 5.1 | % | 38,440 | 3.6 | % | |||||||||||||||||||||||||
| Iowa | 46 | 1,067 | 1.2 | % | 12,391 | 1.2 | % | |||||||||||||||||||||||||
| Kansas | 41 | 2,207 | 2.5 | % | 10,659 | 1.0 | % | |||||||||||||||||||||||||
| Kentucky | 75 | 1,979 | 2.2 | % | 21,872 | 2.0 | % | |||||||||||||||||||||||||
| Louisiana | 90 | 2,771 | 3.1 | % | 28,180 | 2.6 | % | |||||||||||||||||||||||||
| Maine | 25 | 692 | 0.8 | % | 8,979 | 0.8 | % | |||||||||||||||||||||||||
| Maryland | 26 | 585 | 0.7 | % | 14,181 | 1.3 | % | |||||||||||||||||||||||||
| Massachusetts | 27 | 2,251 | 2.5 | % | 26,256 | 2.4 | % | |||||||||||||||||||||||||
| Michigan | 170 | 1,978 | 2.2 | % | 33,590 | 3.1 | % | |||||||||||||||||||||||||
| Minnesota | 53 | 1,084 | 1.2 | % | 13,662 | 1.3 | % | |||||||||||||||||||||||||
| Mississippi | 72 | 1,899 | 2.1 | % | 14,596 | 1.4 | % | |||||||||||||||||||||||||
| Missouri | 146 | 1,688 | 1.9 | % | 22,788 | 2.1 | % | |||||||||||||||||||||||||
| Montana | 9 | 115 | 0.1 | % | 2,024 | 0.2 | % | |||||||||||||||||||||||||
| Nebraska | 19 | 366 | 0.4 | % | 5,872 | 0.5 | % | |||||||||||||||||||||||||
| Nevada | 30 | 743 | 0.8 | % | 8,888 | 0.8 | % | |||||||||||||||||||||||||
| New Hampshire | 16 | 240 | 0.3 | % | 4,101 | 0.4 | % | |||||||||||||||||||||||||
| New Jersey | 29 | 1,601 | 1.8 | % | 30,305 | 2.8 | % | |||||||||||||||||||||||||
| New Mexico | 41 | 763 | 0.9 | % | 10,005 | 0.9 | % | |||||||||||||||||||||||||
| New York | 68 | 1,471 | 1.7 | % | 25,603 | 2.4 | % | |||||||||||||||||||||||||
| North Carolina | 148 | 3,265 | 3.7 | % | 35,180 | 3.3 | % | |||||||||||||||||||||||||
| North Dakota | 12 | 211 | 0.2 | % | 4,406 | 0.4 | % | |||||||||||||||||||||||||
| Ohio | 278 | 8,598 | 9.7 | % | 67,761 | 6.3 | % | |||||||||||||||||||||||||
| Oklahoma | 83 | 1,792 | 2.0 | % | 26,375 | 2.5 | % | |||||||||||||||||||||||||
| Oregon | 11 | 65 | 0.1 | % | 1,918 | 0.2 | % | |||||||||||||||||||||||||
| Pennsylvania | 100 | 3,772 | 4.3 | % | 38,749 | 3.6 | % | |||||||||||||||||||||||||
| Rhode Island | 4 | 141 | 0.2 | % | 1,957 | 0.2 | % | |||||||||||||||||||||||||
| South Carolina | 100 | 2,251 | 2.5 | % | 22,870 | 2.1 | % | |||||||||||||||||||||||||
| South Dakota | 10 | 169 | 0.2 | % | 2,072 | 0.2 | % | |||||||||||||||||||||||||
| Tennessee | 105 | 2,875 | 3.2 | % | 27,944 | 2.6 | % | |||||||||||||||||||||||||
| Texas | 540 | 10,266 | 11.6 | % | 132,962 | 12.4 | % | |||||||||||||||||||||||||
| Utah | 11 | 515 | 0.6 | % | 5,801 | 0.5 | % | |||||||||||||||||||||||||
| Vermont | 6 | 53 | 0.1 | % | 1,140 | 0.1 | % | |||||||||||||||||||||||||
| Virginia | 97 | 2,451 | 2.8 | % | 28,688 | 2.7 | % | |||||||||||||||||||||||||
| Washington | 26 | 607 | 0.7 | % | 10,475 | 1.0 | % | |||||||||||||||||||||||||
| West Virginia | 34 | 214 | 0.2 | % | 5,244 | 0.5 | % | |||||||||||||||||||||||||
See the Definitions section for a description of the Company's non-GAAP and operating metrics.
VEREIT, Inc. | WWW.VEREIT.COM | 26
| ||||||||
| Q1 2021 SUPPLEMENTAL INFORMATION | ||||||||
Diversification: Property Geographic (cont.) (unaudited, square feet and dollars in thousands) | ||
Location | Number of Properties | Rentable Square Feet | Square Feet as a % of Total Portfolio | Annualized Rental Income | Annualized Rental Income as a % of Total Portfolio | |||||||||||||||||||||||||||
| Wisconsin | 103 | 1,284 | 1.4 | % | 20,467 | 1.9 | % | |||||||||||||||||||||||||
| Wyoming | 8 | 69 | 0.1 | % | 1,375 | 0.1 | % | |||||||||||||||||||||||||
Territories | ||||||||||||||||||||||||||||||||
| Puerto Rico | 3 | 88 | 0.1 | % | 2,354 | 0.2 | % | |||||||||||||||||||||||||
Total | 3,855 | 88,747 | 100.0 | % | $ | 1,075,964 | 100.0 | % | ||||||||||||||||||||||||
Percentages based on Annualized Rental Income.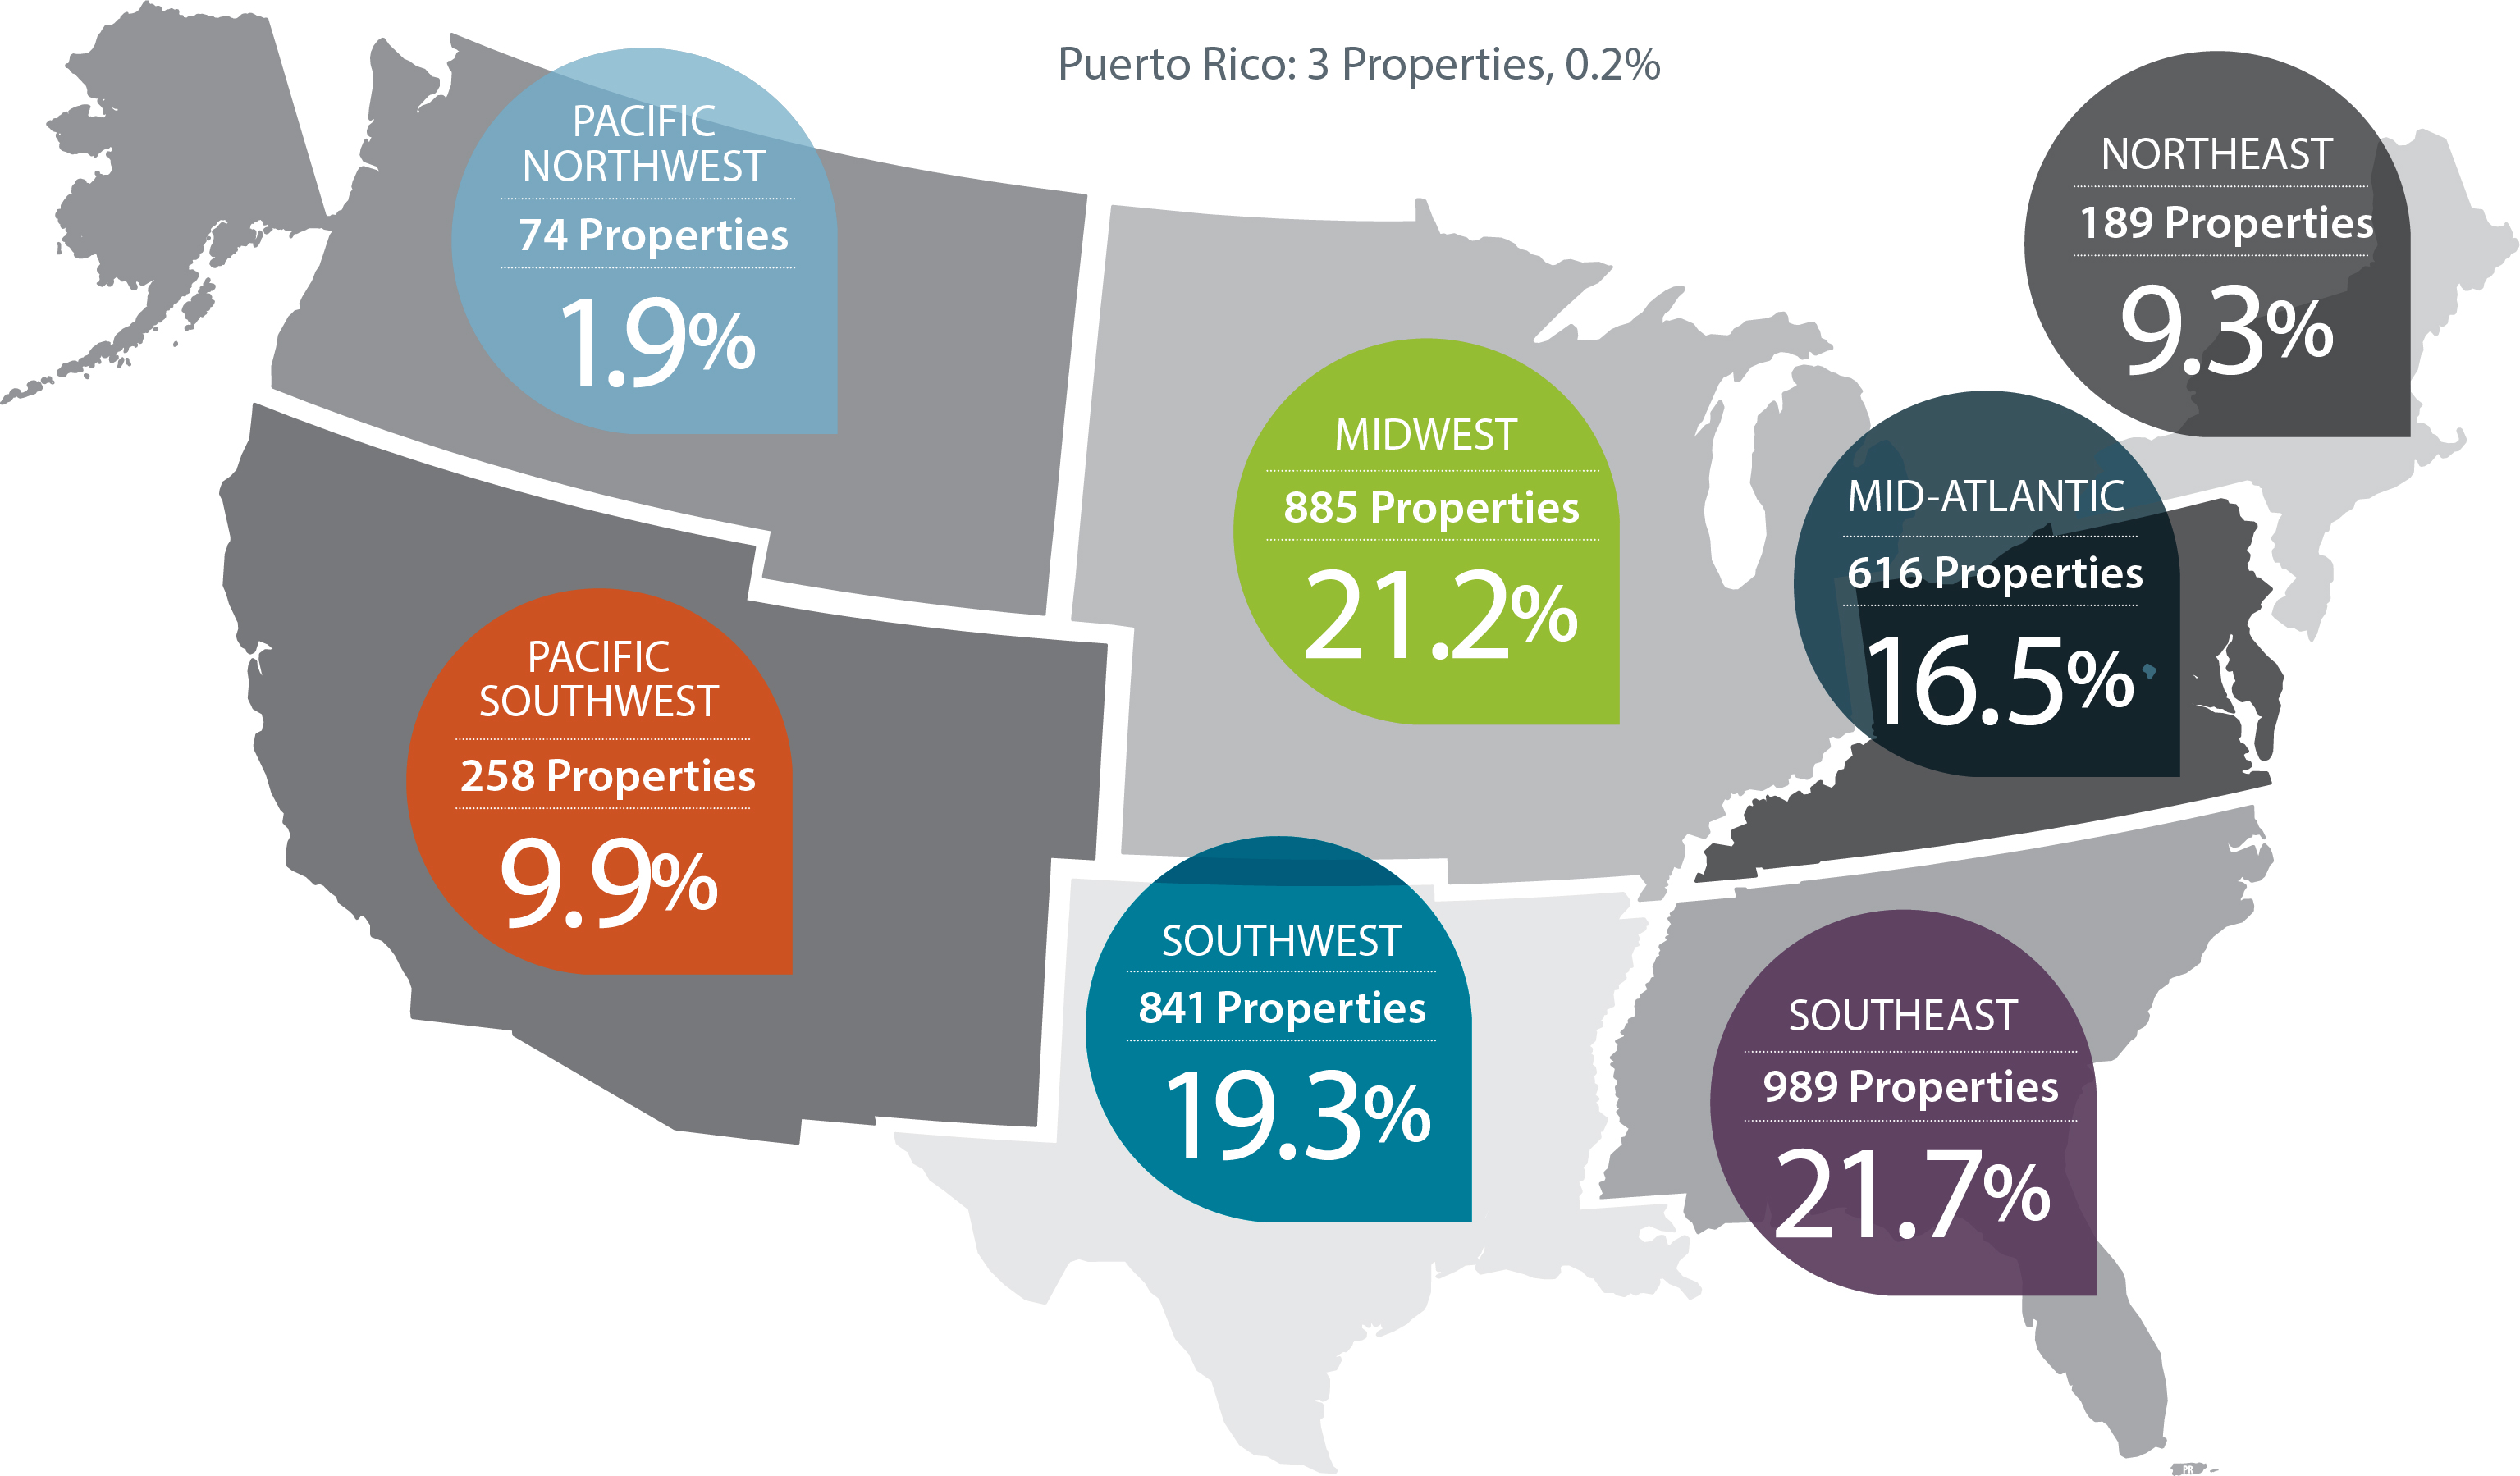
See the Definitions section for a description of the Company's non-GAAP and operating metrics.
VEREIT, Inc. | WWW.VEREIT.COM | 27
| ||||||||
| Q1 2021 SUPPLEMENTAL INFORMATION | ||||||||
Lease Expirations (unaudited, square feet and dollars in thousands) | ||
| Year of Expiration | Number of Leases Expiring | Leased Square Feet | Leased Square Feet as a % of Total Portfolio | Annualized Rental Income Expiring | Annualized Rental Income Expiring as a % of Total Portfolio | |||||||||||||||||||||||||||
| 2021 | 92 | 5,737 | 6.5 | % | $ | 41,709 | 3.9 | % | ||||||||||||||||||||||||
| 2022 | 218 | 7,368 | 8.3 | % | 65,276 | 6.1 | % | |||||||||||||||||||||||||
| 2023 | 269 | 4,474 | 5.0 | % | 58,945 | 5.5 | % | |||||||||||||||||||||||||
| 2024 | 247 | 9,868 | 11.1 | % | 119,498 | 11.1 | % | |||||||||||||||||||||||||
| 2025 | 305 | 5,039 | 5.7 | % | 66,071 | 6.1 | % | |||||||||||||||||||||||||
| 2026 | 257 | 9,070 | 10.2 | % | 86,895 | 8.1 | % | |||||||||||||||||||||||||
| 2027 | 334 | 6,814 | 7.7 | % | 94,365 | 8.8 | % | |||||||||||||||||||||||||
| 2028 | 328 | 5,828 | 6.6 | % | 69,908 | 6.5 | % | |||||||||||||||||||||||||
| 2029 | 154 | 5,800 | 6.5 | % | 55,317 | 5.1 | % | |||||||||||||||||||||||||
| 2030 | 104 | 4,729 | 5.3 | % | 53,412 | 5.0 | % | |||||||||||||||||||||||||
| Thereafter | 710 | 22,211 | 25.1 | % | 364,568 | 33.8 | % | |||||||||||||||||||||||||
Total | 3,018 | 86,938 | 98.0 | % | $ | 1,075,964 | 100.0 | % | ||||||||||||||||||||||||
See the Definitions section for a description of the Company's non-GAAP and operating metrics.
VEREIT, Inc. | WWW.VEREIT.COM | 28
| ||||||||
| Q1 2021 SUPPLEMENTAL INFORMATION | ||||||||
Lease Expirations (cont.) (unaudited, square feet and dollars in thousands) | ||
| Year of Expiration | Number of Leases Expiring | Leased Square Feet | Square Feet as a % of Total Portfolio | Annualized Rental Income Expiring | Annualized Rental Income Expiring as a % of Total Portfolio | |||||||||||||||||||||||||||
| 2021 | ||||||||||||||||||||||||||||||||
| Retail | 33 | 308 | 0.4 | % | $ | 5,296 | 0.5 | % | ||||||||||||||||||||||||
| Restaurant | 41 | 208 | 0.2 | % | 4,599 | 0.4 | % | |||||||||||||||||||||||||
| Industrial | 5 | 4,087 | 4.6 | % | 13,561 | 1.3 | % | |||||||||||||||||||||||||
| Office | 11 | 1,134 | 1.3 | % | 18,193 | 1.7 | % | |||||||||||||||||||||||||
Other (1) | 2 | — | — | % | 60 | — | % | |||||||||||||||||||||||||
| Total 2021 | 92 | 5,737 | 6.5 | % | $ | 41,709 | 3.9 | % | ||||||||||||||||||||||||
| 2022 | ||||||||||||||||||||||||||||||||
| Retail | 131 | 1,397 | 1.5 | % | $ | 22,386 | 2.1 | % | ||||||||||||||||||||||||
| Restaurant | 54 | 225 | 0.3 | % | 6,421 | 0.6 | % | |||||||||||||||||||||||||
| Industrial | 21 | 4,710 | 5.3 | % | 16,578 | 1.6 | % | |||||||||||||||||||||||||
| Office | 11 | 1,036 | 1.2 | % | 19,818 | 1.8 | % | |||||||||||||||||||||||||
Other (1) | 1 | — | — | % | 73 | — | % | |||||||||||||||||||||||||
| Total 2022 | 218 | 7,368 | 8.3 | % | $ | 65,276 | 6.1 | % | ||||||||||||||||||||||||
| 2023 | ||||||||||||||||||||||||||||||||
| Retail | 168 | 2,189 | 2.4 | % | $ | 28,837 | 2.7 | % | ||||||||||||||||||||||||
| Restaurant | 72 | 294 | 0.3 | % | 7,670 | 0.7 | % | |||||||||||||||||||||||||
| Industrial | 18 | 1,411 | 1.6 | % | 12,195 | 1.1 | % | |||||||||||||||||||||||||
| Office | 7 | 580 | 0.7 | % | 10,040 | 1.0 | % | |||||||||||||||||||||||||
Other (1) | 4 | — | — | % | 203 | — | % | |||||||||||||||||||||||||
| Total 2023 | 269 | 4,474 | 5.0 | % | $ | 58,945 | 5.5 | % | ||||||||||||||||||||||||
| 2024 | ||||||||||||||||||||||||||||||||
| Retail | 138 | 2,390 | 2.7 | % | $ | 34,476 | 3.2 | % | ||||||||||||||||||||||||
| Restaurant | 71 | 307 | 0.3 | % | 8,019 | 0.7 | % | |||||||||||||||||||||||||
| Industrial | 14 | 3,558 | 4.0 | % | 16,654 | 1.6 | % | |||||||||||||||||||||||||
| Office | 22 | 3,613 | 4.1 | % | 60,155 | 5.6 | % | |||||||||||||||||||||||||
Other (1) | 2 | — | — | % | 194 | — | % | |||||||||||||||||||||||||
| Total 2024 | 247 | 9,868 | 11.1 | % | $ | 119,498 | 11.1 | % | ||||||||||||||||||||||||
___________________________________
(1)Includes redevelopment property, billboards, land and parking lots.
See the Definitions section for a description of the Company's non-GAAP and operating metrics.
VEREIT, Inc. | WWW.VEREIT.COM | 29
| ||||||||
| Q1 2021 SUPPLEMENTAL INFORMATION | ||||||||
Lease Expirations (cont.) (unaudited, square feet and dollars in thousands) | ||
| Year of Expiration | Number of Leases Expiring | Leased Square Feet | Square Feet as a % of Total Portfolio | Annualized Rental Income Expiring | Annualized Rental Income Expiring as a % of Total Portfolio | |||||||||||||||||||||||||||
| 2025 | ||||||||||||||||||||||||||||||||
| Retail | 194 | 2,390 | 2.7 | % | $ | 32,580 | 3.0 | % | ||||||||||||||||||||||||
| Restaurant | 94 | 359 | 0.4 | % | 10,307 | 1.0 | % | |||||||||||||||||||||||||
| Industrial | 11 | 1,707 | 1.9 | % | 13,760 | 1.3 | % | |||||||||||||||||||||||||
| Office | 6 | 583 | 0.7 | % | 9,424 | 0.8 | % | |||||||||||||||||||||||||
| Total 2025 | 305 | 5,039 | 5.7 | % | $ | 66,071 | 6.1 | % | ||||||||||||||||||||||||
| 2026 | ||||||||||||||||||||||||||||||||
| Retail | 111 | 1,974 | 2.2 | % | $ | 25,128 | 2.4 | % | ||||||||||||||||||||||||
| Restaurant | 117 | 480 | 0.6 | % | 17,155 | 1.6 | % | |||||||||||||||||||||||||
| Industrial | 16 | 5,631 | 6.3 | % | 25,043 | 2.3 | % | |||||||||||||||||||||||||
| Office | 12 | 985 | 1.1 | % | 19,423 | 1.8 | % | |||||||||||||||||||||||||
Other (1) | 1 | — | — | % | 146 | — | % | |||||||||||||||||||||||||
| Total 2026 | 257 | 9,070 | 10.2 | % | $ | 86,895 | 8.1 | % | ||||||||||||||||||||||||
| 2027 | ||||||||||||||||||||||||||||||||
| Retail | 250 | 3,949 | 4.5 | % | $ | 52,094 | 4.8 | % | ||||||||||||||||||||||||
| Restaurant | 71 | 539 | 0.6 | % | 21,372 | 2.0 | % | |||||||||||||||||||||||||
| Industrial | 9 | 1,771 | 2.0 | % | 12,740 | 1.2 | % | |||||||||||||||||||||||||
| Office | 4 | 555 | 0.6 | % | 8,159 | 0.8 | % | |||||||||||||||||||||||||
| Total 2027 | 334 | 6,814 | 7.7 | % | $ | 94,365 | 8.8 | % | ||||||||||||||||||||||||
| 2028 | ||||||||||||||||||||||||||||||||
| Retail | 192 | 2,979 | 3.4 | % | $ | 38,322 | 3.6 | % | ||||||||||||||||||||||||
| Restaurant | 111 | 490 | 0.6 | % | 13,374 | 1.3 | % | |||||||||||||||||||||||||
| Industrial | 19 | 2,166 | 2.4 | % | 14,363 | 1.3 | % | |||||||||||||||||||||||||
| Office | 5 | 193 | 0.2 | % | 3,585 | 0.3 | % | |||||||||||||||||||||||||
Other (1) | 1 | — | — | % | 264 | — | % | |||||||||||||||||||||||||
| Total 2028 | 328 | 5,828 | 6.6 | % | $ | 69,908 | 6.5 | % | ||||||||||||||||||||||||
___________________________________
(1)Includes redevelopment property, billboards, land and parking lots.
See the Definitions section for a description of the Company's non-GAAP and operating metrics.
VEREIT, Inc. | WWW.VEREIT.COM | 30
| ||||||||
| Q1 2021 SUPPLEMENTAL INFORMATION | ||||||||
Lease Expirations (cont.) (unaudited, square feet and dollars in thousands) | ||
| Year of Expiration | Number of Leases Expiring | Leased Square Feet | Square Feet as a % of Total Portfolio | Annualized Rental Income Expiring | Annualized Rental Income Expiring as a % of Total Portfolio | |||||||||||||||||||||||||||
| 2029 | ||||||||||||||||||||||||||||||||
| Retail | 94 | 2,245 | 2.5 | % | $ | 27,910 | 2.6 | % | ||||||||||||||||||||||||
| Restaurant | 52 | 321 | 0.4 | % | 10,179 | 0.9 | % | |||||||||||||||||||||||||
| Industrial | 6 | 3,023 | 3.4 | % | 13,810 | 1.3 | % | |||||||||||||||||||||||||
| Office | 2 | 211 | 0.2 | % | 3,418 | 0.3 | % | |||||||||||||||||||||||||
| Total 2029 | 154 | 5,800 | 6.5 | % | $ | 55,317 | 5.1 | % | ||||||||||||||||||||||||
| 2030 | ||||||||||||||||||||||||||||||||
| Retail | 75 | 3,385 | 3.8 | % | $ | 44,035 | 4.1 | % | ||||||||||||||||||||||||
| Restaurant | 23 | 183 | 0.2 | % | 3,919 | 0.4 | % | |||||||||||||||||||||||||
| Industrial | 6 | 1,128 | 1.3 | % | 4,246 | 0.4 | % | |||||||||||||||||||||||||
| Office | — | 33 | — | % | 1,212 | 0.1 | % | |||||||||||||||||||||||||
| Total 2030 | 104 | 4,729 | 5.3 | % | $ | 53,412 | 5.0 | % | ||||||||||||||||||||||||
| Thereafter | ||||||||||||||||||||||||||||||||
| Retail | 346 | 10,469 | 11.8 | % | $ | 190,934 | 17.7 | % | ||||||||||||||||||||||||
| Restaurant | 341 | 3,118 | 3.6 | % | 117,519 | 10.9 | % | |||||||||||||||||||||||||
| Industrial | 17 | 8,162 | 9.2 | % | 49,481 | 4.6 | % | |||||||||||||||||||||||||
| Office | 3 | 462 | 0.5 | % | 6,419 | 0.6 | % | |||||||||||||||||||||||||
Other (1) | 3 | — | — | % | 215 | — | % | |||||||||||||||||||||||||
| Total Thereafter | 710 | 22,211 | 25.1 | % | $ | 364,568 | 33.8 | % | ||||||||||||||||||||||||
| Total Remaining Lease Expirations | 3,018 | 86,938 | 98.0 | % | $ | 1,075,964 | 100.0 | % | ||||||||||||||||||||||||
___________________________________
(1)Includes redevelopment property, billboards, land and parking lots.
See the Definitions section for a description of the Company's non-GAAP and operating metrics.
VEREIT, Inc. | WWW.VEREIT.COM | 31
| ||||||||
| Q1 2021 SUPPLEMENTAL INFORMATION | ||||||||
Lease Summary (unaudited) | ||
Rent Escalations
(square feet and dollars in thousands)
| Number of Leases | Leased Square Feet | Leased Square Feet as a % of Total Portfolio | Annualized Rental Income | Annualized Rental Income as a % of Total Portfolio | ||||||||||||||||||||||||||||
Fixed dollar or percent increase | 1,937 | 60,194 | 67.8 | % | $ | 752,580 | 69.9 | % | ||||||||||||||||||||||||
| CPI | 167 | 7,709 | 8.7 | % | 112,663 | 10.5 | % | |||||||||||||||||||||||||
| Flat | 914 | 19,035 | 21.5 | % | 210,721 | 19.6 | % | |||||||||||||||||||||||||
| Total | 3,018 | 86,938 | 98.0 | % | $ | 1,075,964 | 100.0 | % | ||||||||||||||||||||||||
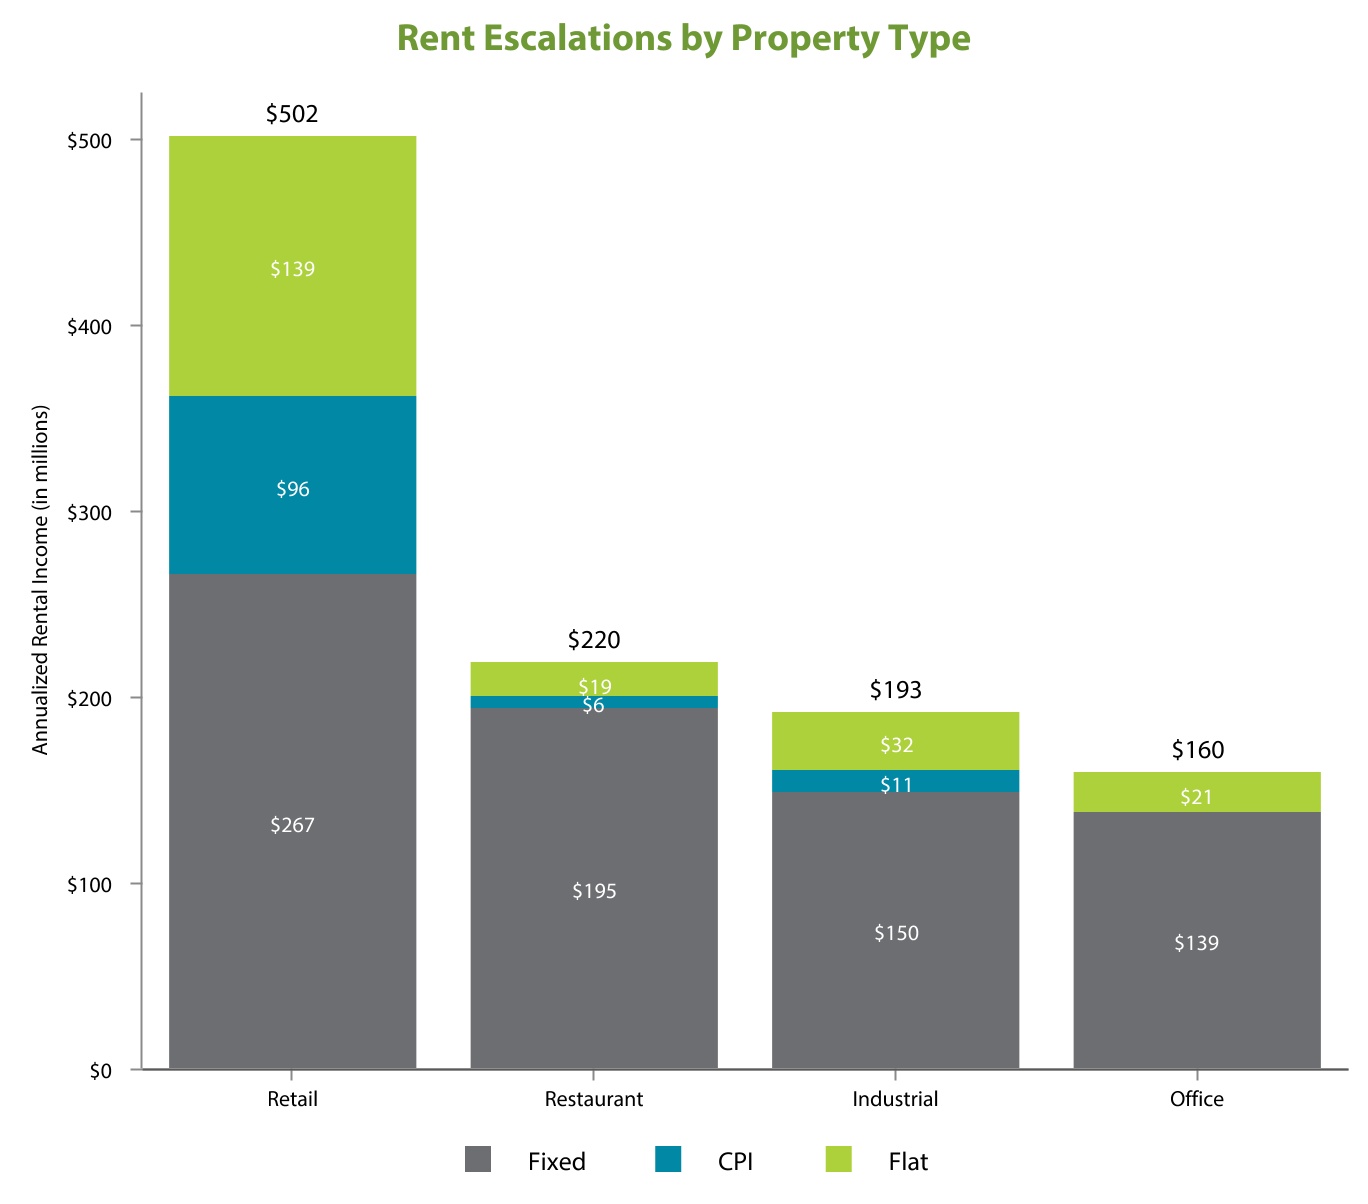
See the Definitions section for a description of the Company's non-GAAP and operating metrics.
VEREIT, Inc. | WWW.VEREIT.COM | 32
| ||||||||
| Q1 2021 SUPPLEMENTAL INFORMATION | ||||||||
Lease Summary (cont.) (unaudited) | ||
Tenant Expense Obligation
(square feet and dollars in thousands)
| Number of Leases | Leased Square Feet | Leased Square Feet as a % of Total Portfolio | Annualized Rental Income | Annualized Rental Income as a % of Total Portfolio | ||||||||||||||||||||||||||||
| NNN | 2,119 | 53,329 | 60.1 | % | $ | 693,288 | 64.4 | % | ||||||||||||||||||||||||
| NN | 881 | 32,649 | 36.8 | % | 362,600 | 33.7 | % | |||||||||||||||||||||||||
Other (1) | 18 | 960 | 1.1 | % | 20,076 | 1.9 | % | |||||||||||||||||||||||||
| Total | 3,018 | 86,938 | 98.0 | % | $ | 1,075,964 | 100.0 | % | ||||||||||||||||||||||||
___________________________________
(1)Includes gross, modified gross, and billboard leases.
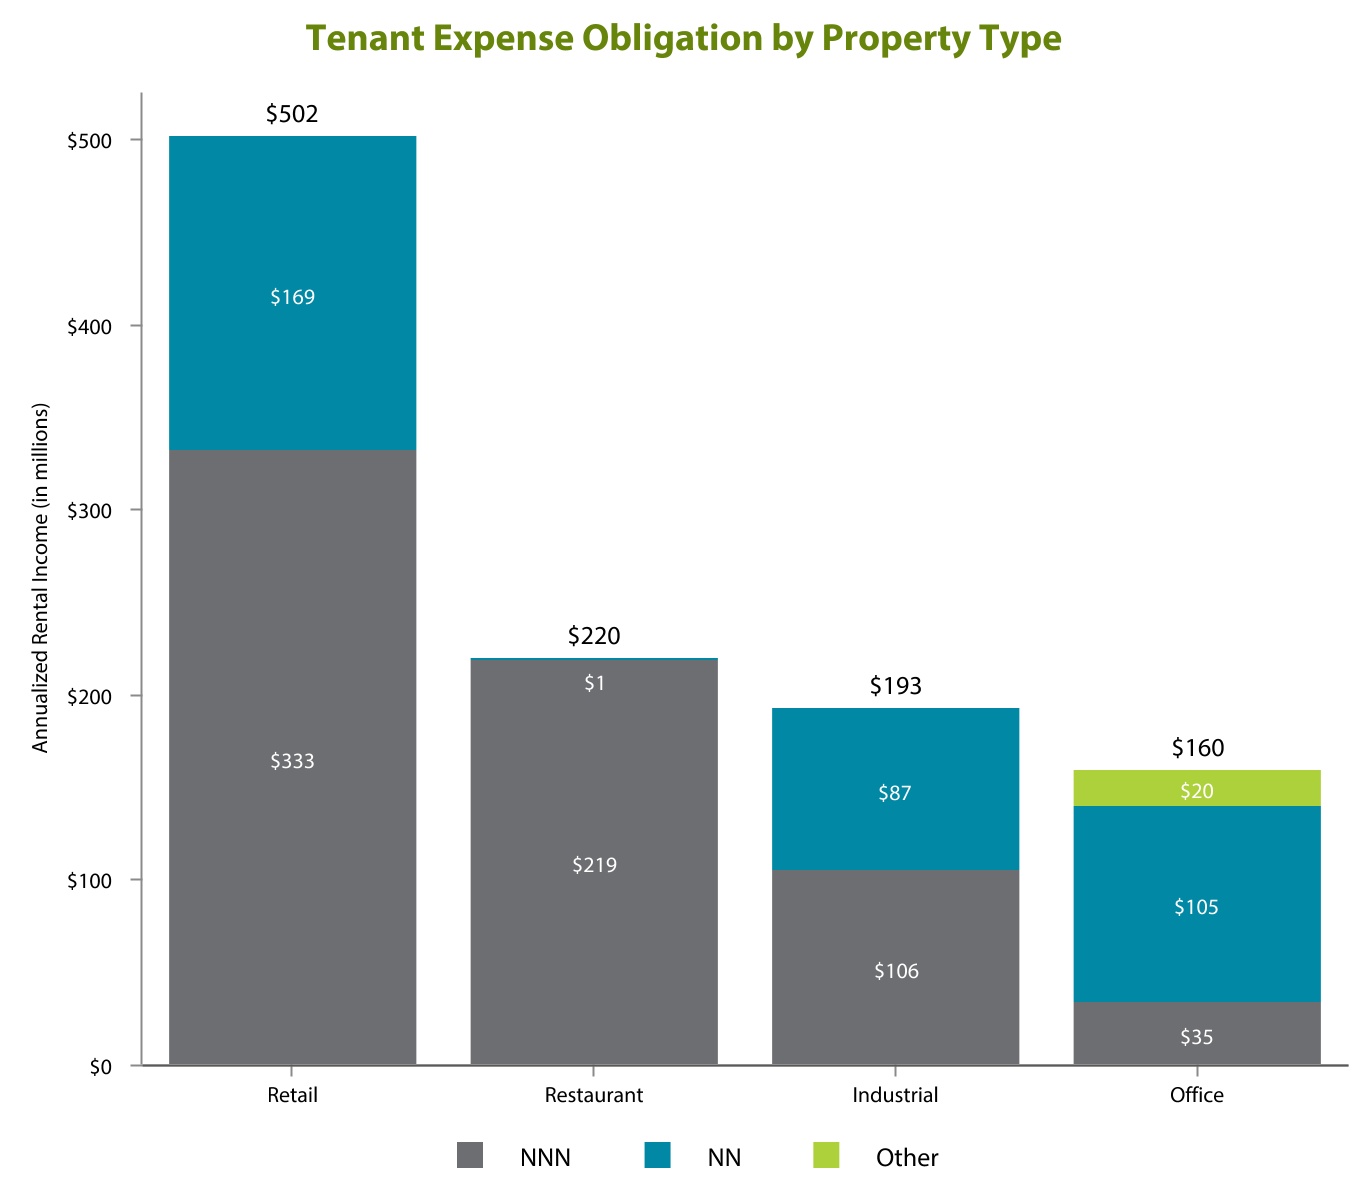
See the Definitions section for a description of the Company's non-GAAP and operating metrics.
VEREIT, Inc. | WWW.VEREIT.COM | 33
| ||||||||
| Q1 2021 SUPPLEMENTAL INFORMATION | ||||||||
Property Type Diversification and Rent Coverage (unaudited, square feet and dollars in thousands) | ||
Property Type Diversification
| Property Type | Number of Properties (1) | Rentable Square Feet | Square Feet as a % of Total Portfolio | Annualized Rental Income | Annualized Rental Income as a % of Total Portfolio | |||||||||||||||||||||||||||
Retail (1) | 2,106 | 34,465 | 38.8 | % | $ | 501,998 | 46.6 | % | ||||||||||||||||||||||||
Restaurant | 1,520 | 6,930 | 7.8 | % | 220,534 | 20.5 | % | |||||||||||||||||||||||||
Industrial | 158 | 37,396 | 42.2 | % | 192,431 | 17.9 | % | |||||||||||||||||||||||||
Office | 61 | 9,956 | 11.2 | % | 159,846 | 14.9 | % | |||||||||||||||||||||||||
Other (2) | 10 | — | — | % | 1,155 | 0.1 | % | |||||||||||||||||||||||||
Total | 3,855 | 88,747 | 100.0 | % | $ | 1,075,964 | 100.0 | % | ||||||||||||||||||||||||
___________________________________
(1) Includes seven anchored shopping centers, representing 1.5% of Annualized Rental Income.
(2) Includes redevelopment property, billboards, construction in progress, land and parking lots.
Rent Coverage
The following table shows weighted-average rent coverage for retail and restaurant properties calculated as our tenants' property level EBITDAR (earnings before interest, tax, depreciation, amortization and rent), prior to the deduction of any corporate overhead expenses, for the most recently provided trailing twelve-month period, divided by annualized March 2021 rent per the lease terms. (1) (2)
| Property Type | Number of Properties (3) | 2021 Rent Coverage | ||||||||||||
| Retail and Restaurant | 1,462 | 2.34x | ||||||||||||
__________________________________
(1)41.6% of tenant financial information analyzed reflects periods ended March 31, 2020 or prior.
(2)In certain cases, property level EBITDAR reflects a period of less than twelve months, annualized.
(3)Property level performance data was collected for 90.9% of retail and restaurant properties required to provide unit level financial information, representing 45.6% of retail and restaurant properties owned at March 31, 2021 (excluding vacant and dark properties; percentages based on property count).
See the Definitions section for a description of the Company's non-GAAP and operating metrics.
VEREIT, Inc. | WWW.VEREIT.COM | 34
| ||||||||
| Q1 2021 SUPPLEMENTAL INFORMATION | ||||||||
Diversification by Property Type: Retail (unaudited, percentages based on Annualized Rental Income of the retail properties) | ||
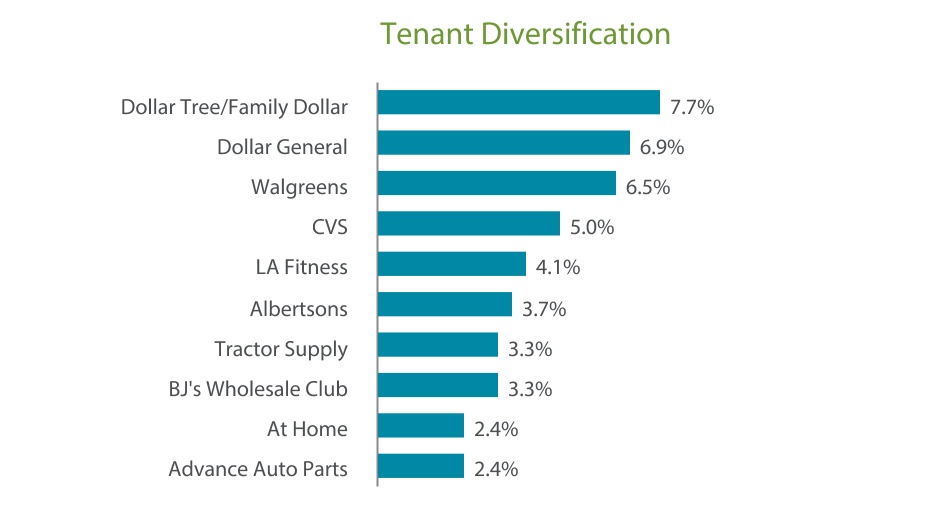 ____________________________________________________
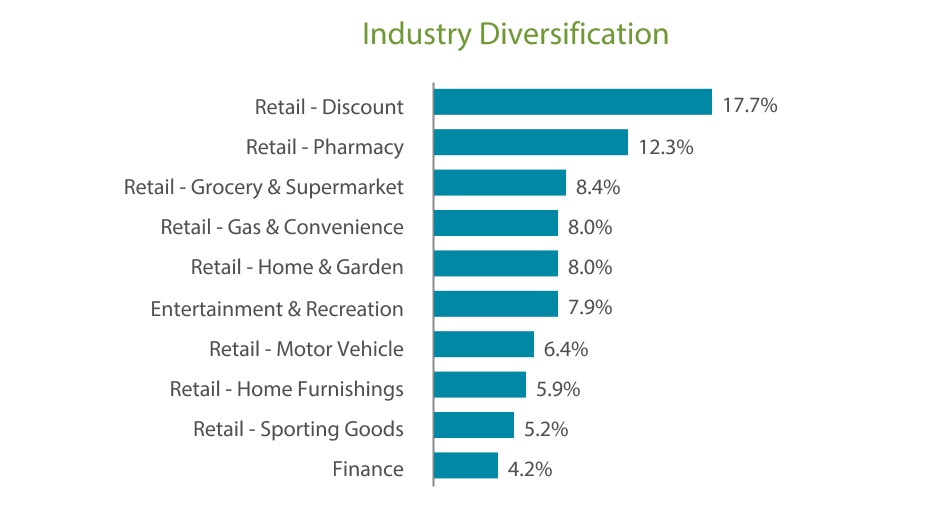 ______________________________________________________
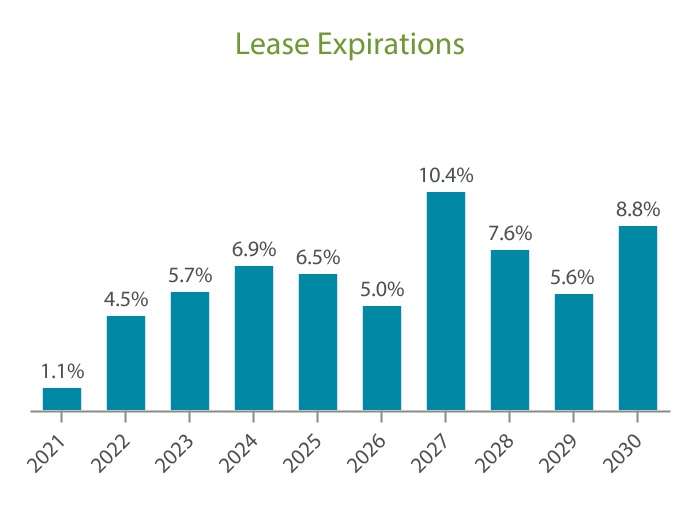
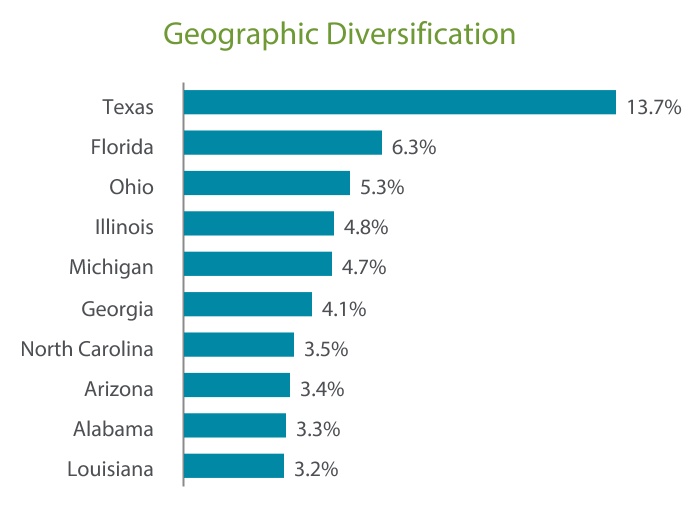 _________________________________________________
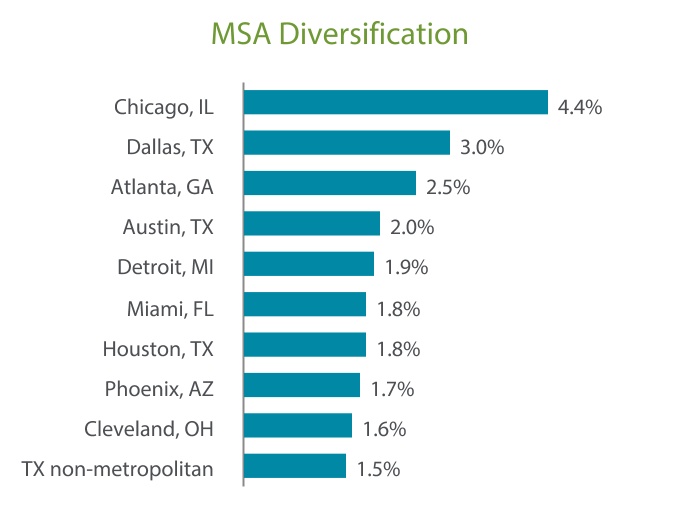 _________________________________________________
Statistics (square feet in thousands) | |||||||||||
| Operating Properties | 2,106 | ||||||||||
| Rentable Square Feet | 34,465 | ||||||||||
| Economic Occupancy Rate | 97.7 | % | |||||||||
| Weighted Average Remaining Lease Term | 8.8 | ||||||||||
| Investment-Grade Tenants | 48.4 | % | |||||||||
| Flat leases | 27.7 | % | |||||||||
| NNN leases | 66.4 | % | |||||||||
See the Definitions section for a description of the Company's non-GAAP and operating metrics.
VEREIT, Inc. | WWW.VEREIT.COM | 35
| ||||||||
| Q1 2021 SUPPLEMENTAL INFORMATION | ||||||||
Diversification by Property Type: Restaurants (unaudited, percentages based on Annualized Rental Income of the retail properties) | ||
Tenant Diversification
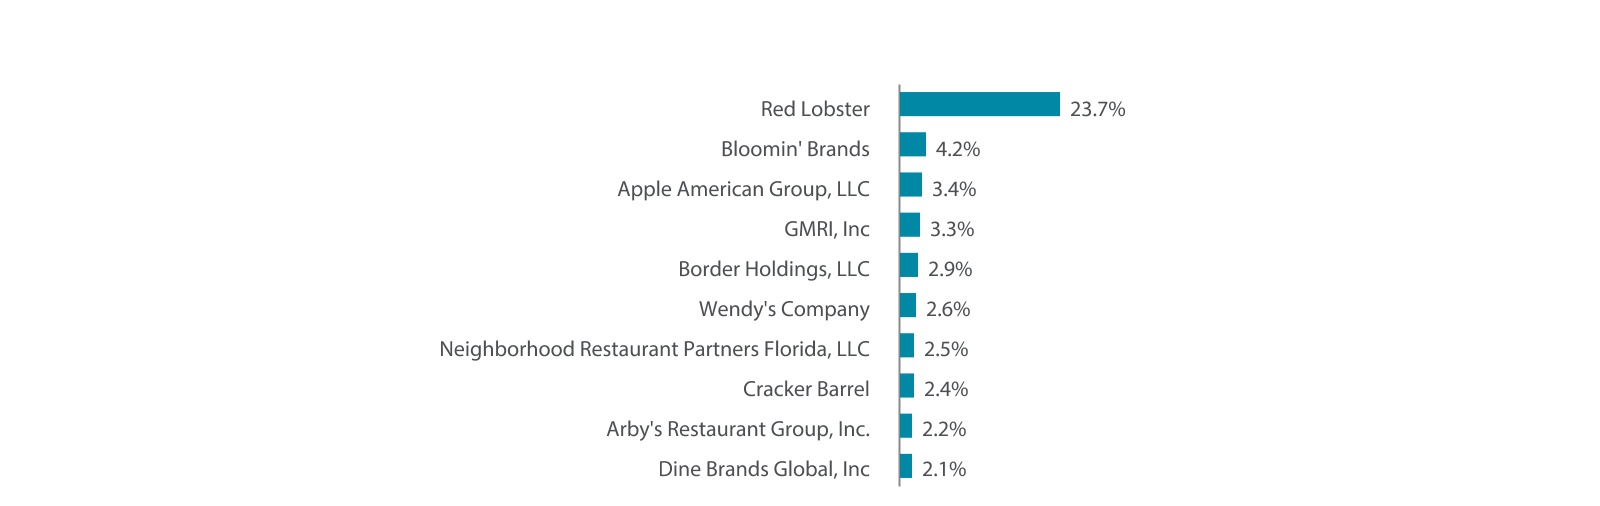
______________________________________________________
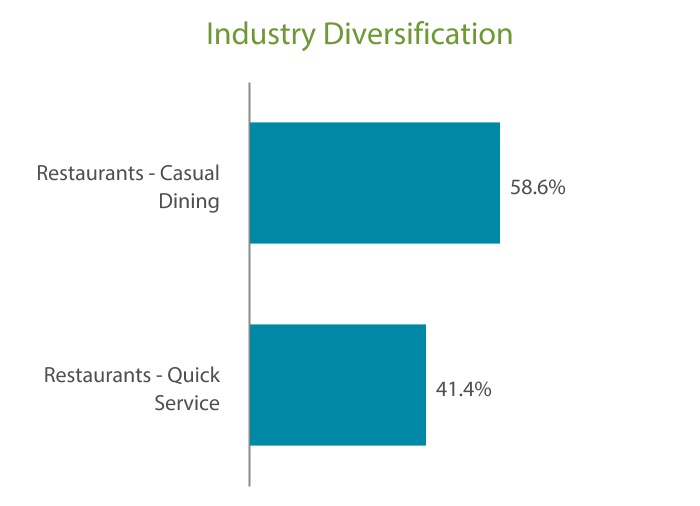 ______________________________________________________
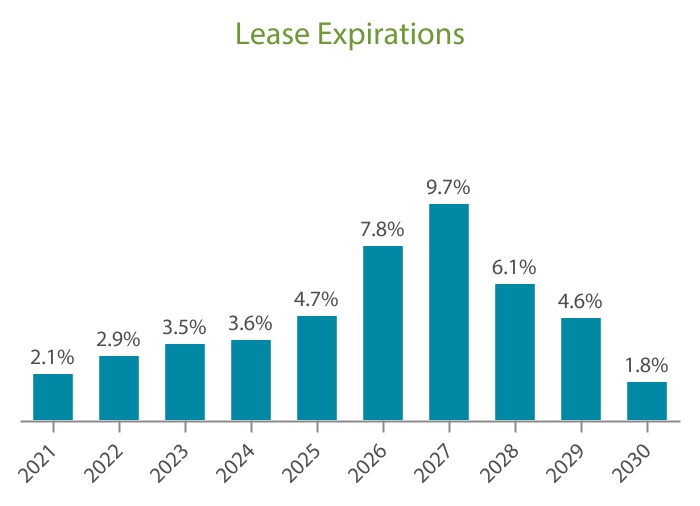
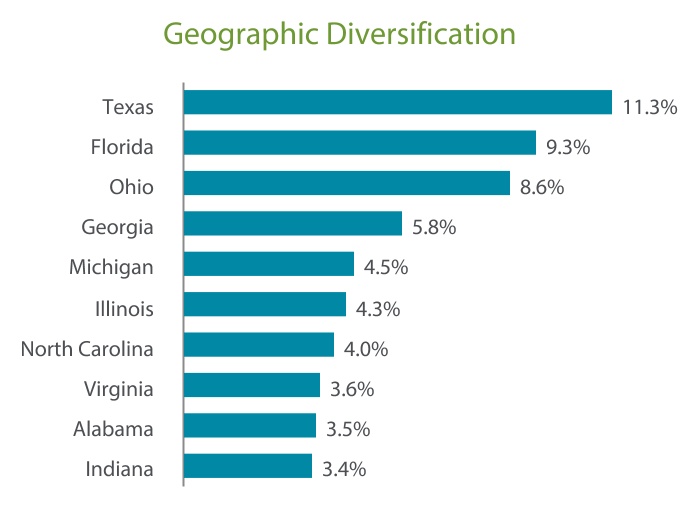
_________________________________________________
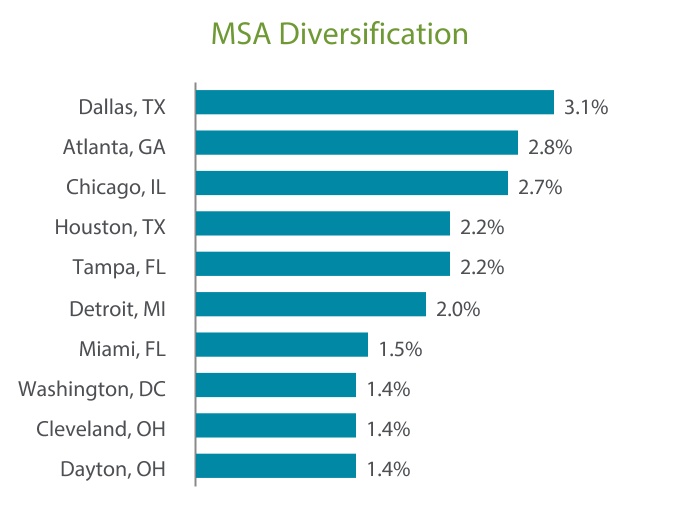 _________________________________________________
Statistics (square feet in thousands) | |||||||||||
| Operating Properties | 1,520 | ||||||||||
| Rentable Square Feet | 6,930 | ||||||||||
| Economic Occupancy Rate | 94.1 | % | |||||||||
| Weighted Average Remaining Lease Term | 11.6 | ||||||||||
| Investment-Grade Tenants | 3.5 | % | |||||||||
| Flat leases | 8.8 | % | |||||||||
| NNN leases | 99.3 | % | |||||||||
See the Definitions section for a description of the Company's non-GAAP and operating metrics.
VEREIT, Inc. | WWW.VEREIT.COM | 36
| ||||||||
| Q1 2021 SUPPLEMENTAL INFORMATION | ||||||||
Diversification by Property Type: Industrial (unaudited, percentages based on Annualized Rental Income of the retail properties) | ||
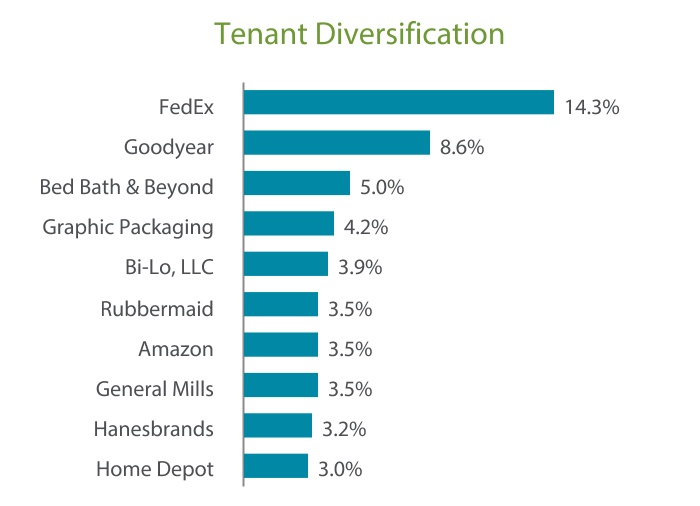 ____________________________________________________
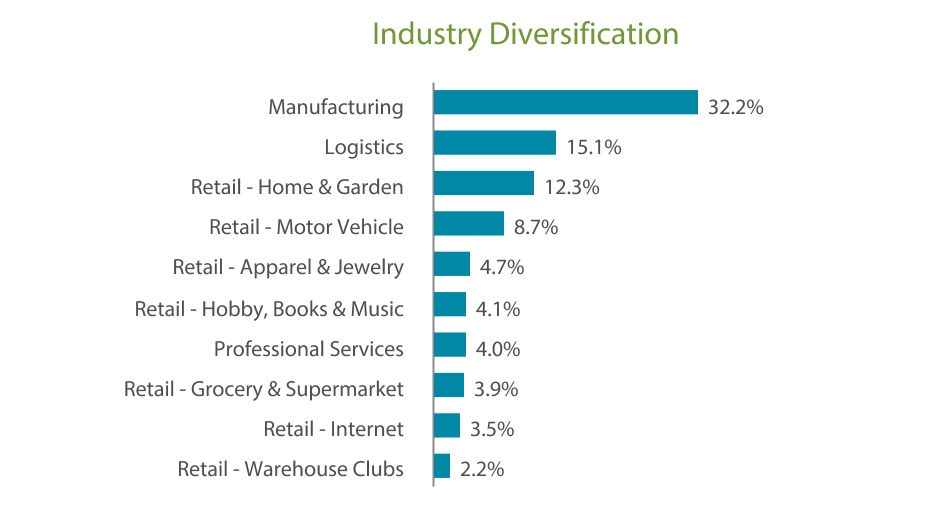 ______________________________________________________
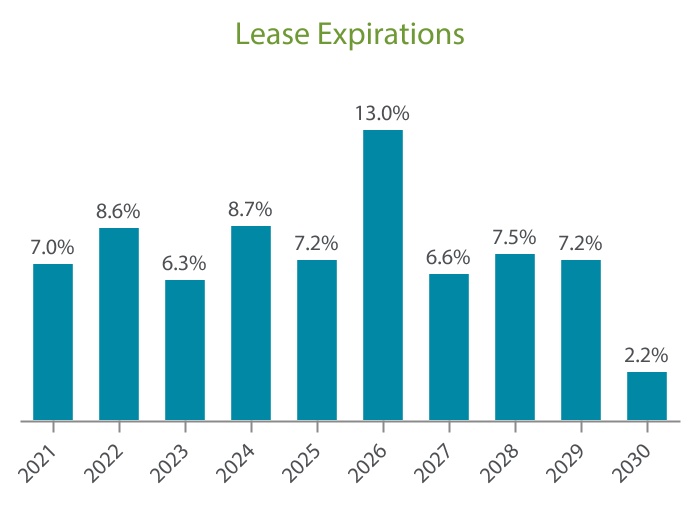
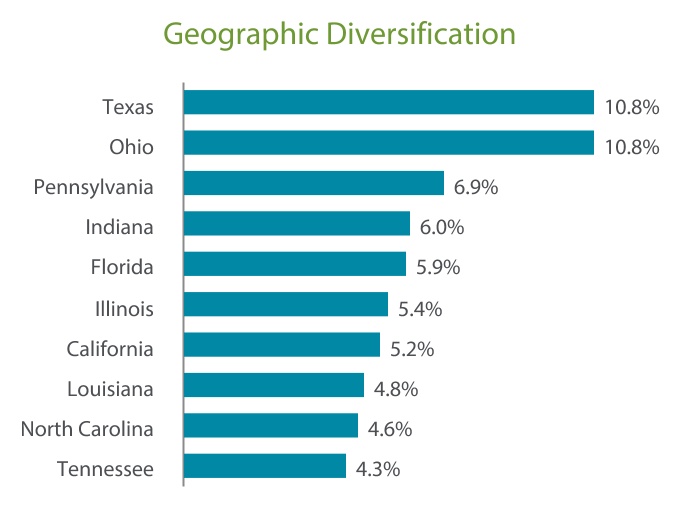 _________________________________________________
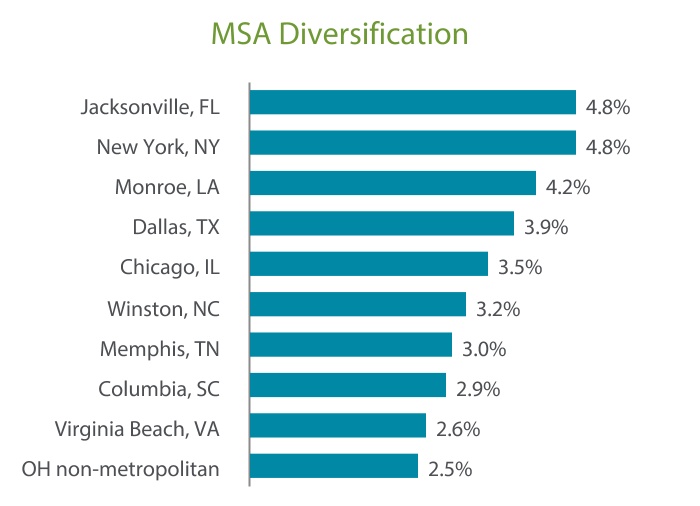 _________________________________________________
Statistics (square feet in thousands) | |||||||||||
| Operating Properties | 158 | ||||||||||
| Rentable Square Feet | 37,396 | ||||||||||
| Economic Occupancy Rate | 99.9 | % | |||||||||
| Weighted Average Remaining Lease Term | 7.1 | ||||||||||
| Investment-Grade Tenants | 36.5 | % | |||||||||
| Flat leases | 16.5 | % | |||||||||
| NNN leases | 54.7 | % | |||||||||
See the Definitions section for a description of the Company's non-GAAP and operating metrics.
VEREIT, Inc. | WWW.VEREIT.COM | 37
| ||||||||
| Q1 2021 SUPPLEMENTAL INFORMATION | ||||||||
Diversification by Property Type: Office (unaudited, percentages based on Annualized Rental Income of the retail properties) | ||
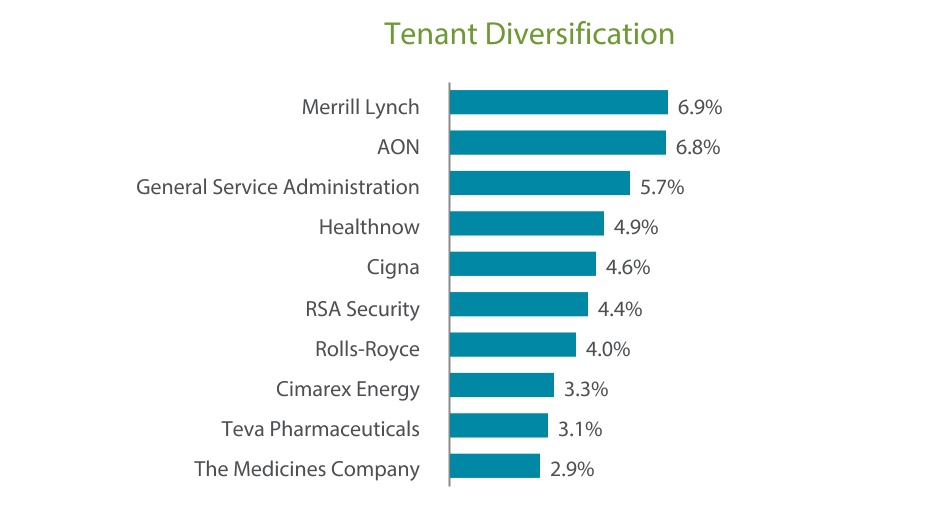 ____________________________________________________
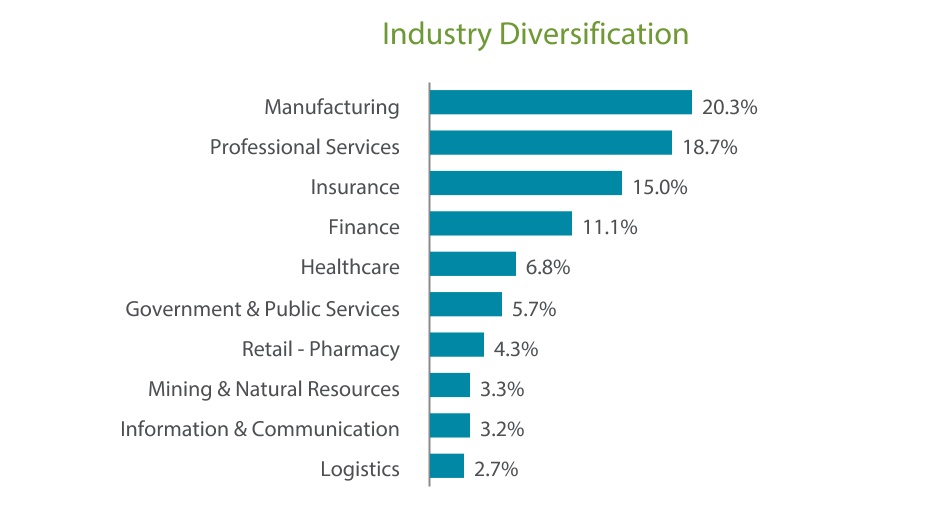 ______________________________________________________
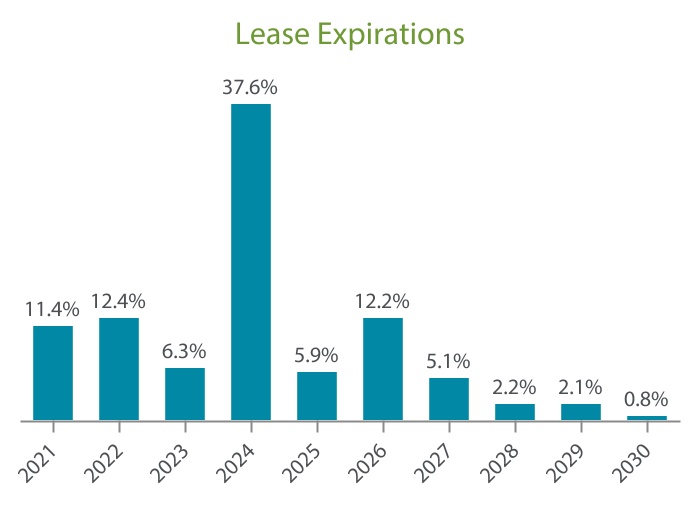
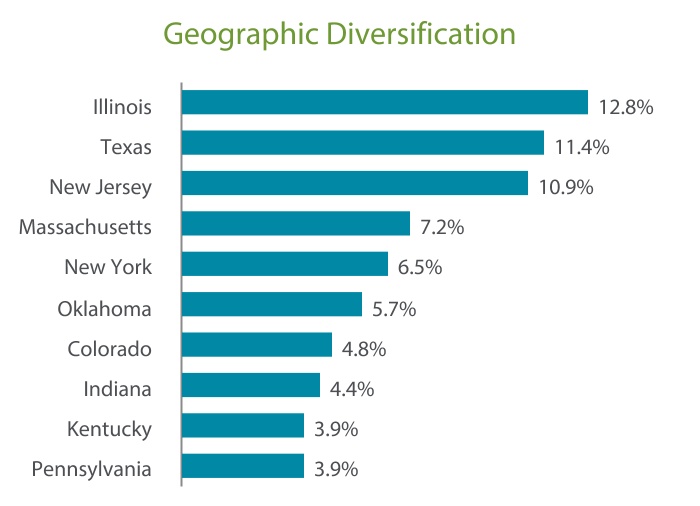 _________________________________________________
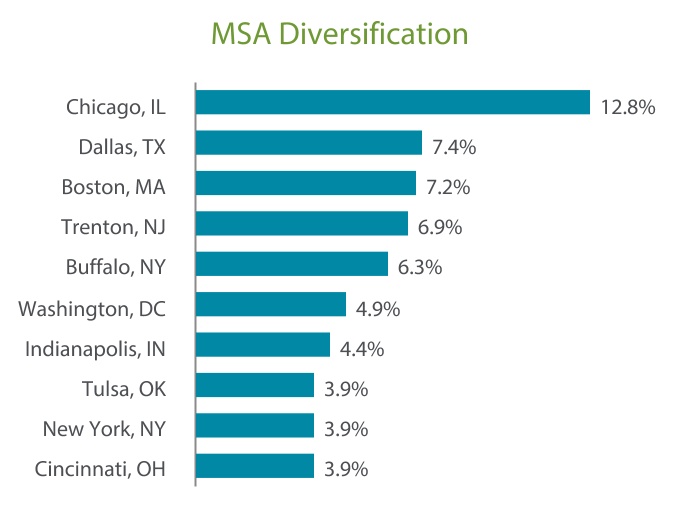 _________________________________________________
Statistics (square feet in thousands) | |||||||||||
| Operating Properties | 61 | ||||||||||
| Rentable Square Feet | 9,956 | ||||||||||
| Economic Occupancy Rate | 94.3 | % | |||||||||
| Weighted Average Remaining Lease Term | 3.8 | ||||||||||
| Investment-Grade Tenants | 53.5 | % | |||||||||
| Flat leases | 12.5 | % | |||||||||
| NNN leases | 22.0 | % | |||||||||
See the Definitions section for a description of the Company's non-GAAP and operating metrics.
VEREIT, Inc. | WWW.VEREIT.COM | 38
| ||||||||
| Q1 2021 SUPPLEMENTAL INFORMATION | ||||||||
Unconsolidated Joint Venture Investment Summary (unaudited, square feet and dollars in thousands) | ||
Unconsolidated Joint Venture Investments
The following table summarizes the Company's investments in Unconsolidated Joint Ventures as of March 31, 2021.
| Joint Venture | Legal Ownership Percentage (1) | Property Type | Number of Properties | Pro Rata Share of Gross Real Estate Investments | Pro Rata Share of Rentable Square Feet | Pro Rata Share of Annualized Rental Income | Pro Rata Share of Adjusted Principal Outstanding | |||||||||||||||||||||||||||||||||||||
| Industrial partnership | 20% | Industrial | 7 | $ | 131,787 | 1,409 | $ | 8,154 | $ | 86,006 | ||||||||||||||||||||||||||||||||||
| Office partnership | 20% | Office | 4 | 33,859 | 145 | 3,196 | 20,510 | |||||||||||||||||||||||||||||||||||||
| Total | $ | 165,646 | 1,554 | $ | 11,350 | $ | 106,516 | |||||||||||||||||||||||||||||||||||||
__________________________________
(1)Legal ownership percentage may, at times, not equal the Company's economic interest because of various provisions in the joint venture agreements regarding capital contributions, distributions of cash flow based on capital account balances, allocations of profits and losses and payments of preferred returns.
See the Definitions section for a description of the Company's non-GAAP and operating metrics.
VEREIT, Inc. | WWW.VEREIT.COM | 39
| ||||||||
| Q1 2021 SUPPLEMENTAL INFORMATION | ||||||||
Definitions (unaudited, in thousands, except share and per share data) | ||
Annualized Rental Income is rental revenue under our leases on Operating Properties on a straight-line basis, which includes the effect of rent escalations and any tenant concessions, such as free rent, and our pro rata share of such revenues from properties owned by Unconsolidated Joint Ventures. Annualized Rental Income excludes any adjustments to rental income due to changes in the collectability assessment, contingent rent, such as percentage rent, and operating expense reimbursements. Management uses Annualized Rental Income as a basis for tenant, industry and geographic concentrations and other metrics within the portfolio. Annualized Rental Income is not indicative of future performance.
Cash Cap Rate for real estate properties equals the estimated future 12-month Cash NOI, excluding any rent concessions or abatements, at acquisition or disposition divided by the purchase or sale price. For properties acquired or disposed of as a portfolio, the amount presented represents the portfolio cash cap rate. For development projects, Cash Cap Rate equals the estimated future 12-month NOI from the date rent commences divided by the total estimated investment. For certain properties, the Cash Cap Rate is equal to future 12-month Contract Rental Revenue, excluding any rent concessions or abatements, divided by the purchase price or sale price, as the majority of the Company's properties are subject to Triple Net Leases. For mezzanine positions, the acquisition Cash Cap Rate equals the annual interest rate or cumulative preferred return rate and the disposition Cash Cap Rate equals the annual interest or cumulative preferred return divided by gross proceeds.
Contract Rental Revenue includes minimum rent, percentage rent and other contingent consideration, and rental revenue from parking and storage space and the Company's pro rata share of such revenues from properties owned by Unconsolidated Joint Ventures. Contract Rental Revenue excludes GAAP adjustments, such as straight-line rent and amortization of above-market lease assets and below-market lease liabilities. Contract Rental Revenue includes such revenues from properties subject to a direct financing lease. The Company believes that Contract Rental Revenue is a useful non-GAAP supplemental measure to investors and analysts for assessing performance. However, Contract Rental Revenue should not be considered as an alternative to revenue, as computed in accordance with GAAP, or as an indicator of the Company's financial performance. Contract Rental Revenue may not be comparable to similarly titled measures of other companies.
The following table shows the calculation of Contract Rental Revenue for the three months ended March 31, 2021 and 2020 (dollar amounts in thousands):
| Three Months Ended March 31, | ||||||||||||||
| 2021 | 2020 | |||||||||||||
| Rental revenue - as reported | $ | 290,309 | $ | 298,586 | ||||||||||
| Adjustments: | ||||||||||||||
| Costs reimbursed related to CAM, property operating expenses and ground leases | (24,163) | (27,506) | ||||||||||||
| Straight-line rent | (4,219) | (2,055) | ||||||||||||
| Amortization of above-market lease assets and deferred lease incentives, net of amortization of below-market lease liabilities | 1,547 | 748 | ||||||||||||
| Net direct financing lease adjustments | 366 | 365 | ||||||||||||
| Other non-contract rental revenue | (564) | 69 | ||||||||||||
Proportionate share of amounts for Unconsolidated Joint Ventures | 2,611 | 2,480 | ||||||||||||
| Contract Rental Revenue | $ | 265,887 | $ | 272,687 | ||||||||||
VEREIT, Inc. | WWW.VEREIT.COM | 40
| ||||||||
| Q1 2021 SUPPLEMENTAL INFORMATION | ||||||||
Definitions (cont.) (unaudited, in thousands, except share and per share data) | ||
COVID-19 Lease Concessions Relief refers to eligible concessions where, in accordance with the question-and-answer document, Accounting for Lease Concessions Related to the Effects of the COVID-19 Pandemic, issued by the Financial Accounting Standards Board, the Company has elected to not apply the lease modification guidance in Accounting Standards Codification (“ASC”) Topic 842, Leases (“ASC 842”). Eligible concessions are changes to the lease agreement related to the effects of COVID-19 that provide a deferral of payments with no substantive changes to the consideration of the original contract. The Company accounts for eligible deferral concessions as if there were no changes made to the lease agreement and, accordingly, continues to recognize income and increases the lease receivable. Ineligible concessions are accounted for as a lease modification under ASC 842, which requires the Company to reevaluate the lease classification and remeasure and reallocate the consideration over the remaining lease term, and include any prepaid rent liabilities and accrued rent assets relating to the original lease as part of the lease payments for the modified lease.
CPI is a lease in which base rent is adjusted based on changes in a consumer price index.
Direct Financing Lease is a lease that requires specific treatment due to the significance of the lease payments from the inception of the lease compared to the fair value of the property, term of the lease, a transfer of ownership, or a bargain purchase option. These leases are recorded as a net asset on the balance sheet. The amount booked is calculated as the fair value of the remaining lease payments on the leases and the estimated fair value of any expected residual property value at the end of the lease term.
Double Net Lease ("NN") is a lease under which the tenant agrees to pay all operating expenses associated with the property (e.g., real estate taxes, insurance, maintenance), but excludes some or all major repairs (e.g., roof, structure, parking lot).
Earnings Before Interest, Taxes, Depreciation and Amortization for Real Estate ("EBITDAre") and Normalized EBITDA
Due to certain unique operating characteristics of real estate companies, as discussed below, the National Association of Real Estate Investment Trusts, Inc. ("Nareit"), an industry trade group, has promulgated a supplemental performance measure known as Earnings Before Interest, Taxes, Depreciation and Amortization for Real Estate. Nareit defines EBITDAre as net income or loss computed in accordance with GAAP, adjusted for interest expense, income tax expense (benefit), depreciation and amortization, impairment write-downs on real estate, gains or losses from disposition of property and our pro rata share of EBITDAre adjustments related to unconsolidated partnerships and joint ventures. We calculated EBITDAre in accordance with Nareit's definition described above.
In addition to EBITDAre, we use Normalized EBITDA as a non-GAAP supplemental performance measure to evaluate the operating performance of the Company. Normalized EBITDA, as defined by the Company, represents EBITDAre, modified to exclude non-routine items such as acquisition-related expenses, litigation and non-routine costs, net and gains or losses on sale of investment securities or mortgage notes receivable. We also exclude certain non-cash items such as impairments of goodwill, intangible and right of use assets, gains or losses on derivatives, gains or losses on the extinguishment or forgiveness of debt and amortization of intangibles, above-market lease assets and below-market lease liabilities. Management believes that excluding these costs from EBITDAre provides investors with supplemental performance information that is consistent with the performance models and analysis used by management, and provides investors a view of the performance of our portfolio over time. Therefore, EBITDAre and Normalized EBITDA should not be considered as an alternative to net income, as computed in accordance with GAAP. The Company uses Normalized EBITDA as one measure of its operating performance when formulating corporate goals and evaluating the effectiveness of the Company's strategies. EBITDAre and Normalized EBITDA may not be comparable to similarly titled measures of other companies.
Economic Occupancy Rate equals the sum of Leased Square Feet divided by Rentable Square Feet.
Enterprise Value equals the sum of the Implied Equity Market Capitalization, preferred stock and Net Debt.
VEREIT, Inc. | WWW.VEREIT.COM | 41
| ||||||||
| Q1 2021 SUPPLEMENTAL INFORMATION | ||||||||
Definitions (cont.) (unaudited, in thousands, except share and per share data) | ||
Fixed Charge Coverage Ratio is the sum of (i) Interest Expense, excluding non-cash amortization, (ii) secured debt principal amortization on Adjusted Principal Outstanding and (iii) dividends attributable to preferred shares divided by Normalized EBITDA. Management believes that Fixed Charge Coverage Ratio is a useful supplemental measure of our ability to satisfy fixed financing obligations.
Flat Lease is a lease that requires equal rent payments, with no increases, throughout the initial term of the lease agreement. A Flat Lease may include a period of free rent at the beginning or end of the lease.
Funds from Operations ("FFO") and Adjusted Funds from Operations ("AFFO")
Due to certain unique operating characteristics of real estate companies, as discussed below, Nareit has promulgated a supplemental performance measure known as FFO, which we believe to be an appropriate supplemental performance measure to reflect the operating performance of a REIT. FFO is not equivalent to our net income or loss as determined under GAAP.
Nareit defines FFO as net income or loss computed in accordance with GAAP adjusted for gains or losses from disposition of property, depreciation and amortization of real estate assets, impairment write-downs on real estate, and our pro rata share of FFO adjustments related to unconsolidated partnerships and joint ventures. We calculate FFO in accordance with Nareit's definition described above.
In addition to FFO, we use AFFO as a non-GAAP supplemental financial performance measure to evaluate the operating performance of the Company. AFFO, as defined by the Company, excludes from FFO non-routine items such as acquisition-related expenses, litigation and non-routine costs, net and gains or losses on sale of investment securities or mortgage notes receivable. We also exclude certain non-cash items such as impairments of goodwill, intangible and right of use assets, straight-line rent, net direct financing lease adjustments, gains or losses on derivatives, gains or losses on the extinguishment or forgiveness of debt, equity-based compensation and amortization of intangible assets, deferred financing costs, premiums and discounts on debt and investments, above-market lease assets and below-market lease liabilities. Management believes that excluding these items from FFO provides investors with supplemental performance information that is consistent with the performance models and analysis used by management, and provides investors a view of the performance of our portfolio over time. AFFO allows for a comparison of the performance of our operations with other publicly-traded REITs, as AFFO, or an equivalent measure, is routinely reported by publicly-traded REITs, and we believe often used by analysts and investors for comparison purposes.
For all of these reasons, we believe FFO and AFFO, in addition to net income (loss), as defined by GAAP, are helpful supplemental performance measures and useful in understanding the various ways in which our management evaluates the performance of the Company over time. However, not all REITs calculate FFO and AFFO the same way, so comparisons with other REITs may not be meaningful. FFO and AFFO should not be considered as alternatives to net income (loss) and are not intended to be used as a liquidity measure indicative of cash flow available to fund our cash needs. Neither the SEC, Nareit, nor any other regulatory body has evaluated the acceptability of the exclusions used to adjust FFO in order to calculate AFFO and its use as a non-GAAP financial performance measure.
GAAP is an abbreviation for generally accepted accounting principles in the United States.
Gross Lease is a lease under which the landlord is responsible for all expenses associated with the property (e.g., real estate taxes, insurance, maintenance and repairs).
Gross Real Estate Investments represent total gross real estate and related assets of Operating Properties, equity investments in the Cole REITs, investment in direct financing leases, investment securities backed by real estate and mortgage notes receivable, and the Company's pro rata share of such amounts related to properties owned by Unconsolidated Joint Ventures, net of gross intangible lease liabilities. We believe that the presentation of Gross Real Estate Investments, which shows our total investments in real estate and related assets, in connection with Net Debt, provides useful information to investors to assess our overall financial flexibility, capital structure and leverage. Gross Real Estate Investments should not be considered as an alternative to the Company's real estate investments balance as determined in accordance with GAAP or any other GAAP financial measures and should only be considered together with, and as a supplement to, the Company's financial information prepared in accordance with GAAP.
VEREIT, Inc. | WWW.VEREIT.COM | 42
| ||||||||
| Q1 2021 SUPPLEMENTAL INFORMATION | ||||||||
Definitions (cont.) (unaudited, in thousands, except share and per share data) | ||
The following table shows a reconciliation of Gross Real Estate Investments to the amounts presented in accordance with GAAP on the balance sheet for the periods presented (dollar amounts in thousands):
| March 31, 2021 | December 31, 2020 | September 30, 2020 | June 30, 2020 | March 31, 2020 | ||||||||||||||||||||||||||||
Total real estate investments, at cost - as reported | $ | 14,523,961 | $ | 14,603,626 | $ | 14,610,097 | $ | 14,714,616 | $ | 14,751,458 | ||||||||||||||||||||||
Adjustments: | ||||||||||||||||||||||||||||||||
Investment in Cole REITs | 7,951 | 7,255 | 6,943 | 6,867 | 7,009 | |||||||||||||||||||||||||||
Gross assets held for sale | 7,145 | 91,341 | 2,379 | 54,046 | 104,064 | |||||||||||||||||||||||||||
Investment in direct financing leases, net | 6,181 | 6,547 | 8,198 | 8,579 | 8,951 | |||||||||||||||||||||||||||
Mortgage notes receivable, net | — | — | 15,727 | 9,959 | — | |||||||||||||||||||||||||||
| Gross intangible lease liabilities | (225,657) | (227,442) | (227,165) | (236,324) | (236,378) | |||||||||||||||||||||||||||
Proportionate share of amounts for Unconsolidated Joint Ventures | 165,646 | 165,643 | 205,678 | 146,886 | 146,852 | |||||||||||||||||||||||||||
Gross Real Estate Investments | $ | 14,485,227 | $ | 14,646,970 | $ | 14,621,857 | $ | 14,704,629 | $ | 14,781,956 | ||||||||||||||||||||||
Implied Equity Market Capitalization equals shares of common stock outstanding, multiplied by the closing sale price of the Company's stock as reported on the New York Stock Exchange.
Industry is derived from the North American Industry Classification System, NAICS, which is a system used by federal statistical agencies to classify business establishments, for the purpose of collecting, analyzing, and publishing statistical data related to the U.S. business economy.
Interest Coverage Ratio equals Normalized EBITDA divided by Interest Expense, excluding non-cash amortization. Management believes that Interest Coverage Ratio is a useful supplemental measure of our ability to service our debt obligations.
Interest Expense, excluding non-cash amortization is a non-GAAP measure that represents interest expense incurred on the outstanding principal balance of our debt and the Company's pro rata share of the Unconsolidated Joint Ventures' outstanding principal balance. This measure excludes the amortization of deferred financing costs, premiums and discounts, which is included in interest expense in accordance with GAAP. We believe that the presentation of Interest Expense, excluding non-cash amortization, which shows the interest expense on our contractual debt obligations, provides useful information to investors to assess our overall solvency and financial flexibility. Interest Expense, excluding non-cash amortization should not be considered as an alternative to the Company's interest expense as determined in accordance with GAAP or any other GAAP financial measures and should only be considered together with and as a supplement to the Company's financial information prepared in accordance with GAAP.
The following table shows a reconciliation of Interest Expense, excluding non-cash amortization to interest expense presented in accordance with GAAP on the statements of operations for the periods presented (dollar amounts in thousands):
| Three Months Ended | ||||||||||||||||||||||||||||||||
| March 31, 2021 | December 31, 2020 | September 30, 2020 | June 30, 2020 | March 31, 2020 | ||||||||||||||||||||||||||||
| Interest expense - as reported | $ | 60,736 | $ | 68,416 | $ | 66,935 | $ | 65,613 | $ | 64,696 | ||||||||||||||||||||||
Adjustments: | ||||||||||||||||||||||||||||||||
Amortization of deferred financing costs and other non-cash charges | (2,412) | (6,189) | (3,212) | (2,995) | (2,924) | |||||||||||||||||||||||||||
Amortization of net premiums | (248) | 120 | 299 | 459 | 772 | |||||||||||||||||||||||||||
Proportionate share of amounts for Unconsolidated Joint Ventures | 784 | 806 | 691 | 559 | 579 | |||||||||||||||||||||||||||
Interest Expense, excluding non-cash amortization | $ | 58,860 | $ | 63,153 | $ | 64,713 | $ | 63,636 | $ | 63,123 | ||||||||||||||||||||||
VEREIT, Inc. | WWW.VEREIT.COM | 43
| ||||||||
| Q1 2021 SUPPLEMENTAL INFORMATION | ||||||||
Definitions (cont.) (unaudited, in thousands, except share and per share data) | ||
Investment-Grade Tenants are those with a Standard & Poor’s credit rating of BBB- or higher or a Moody’s credit rating of Baa3 or higher. The ratings may reflect those assigned by Standard & Poor’s or Moody’s to the lease guarantor or the parent company, as applicable.
Leased Square Feet is Rentable Square Feet leased (including month-to-month agreements).
Metropolitan Statistical Area (MSA) is a large metropolitan area represented by a large group of zip codes, as defined by Real Capital Analytics.
Modified Gross Lease is a lease under which the landlord is responsible for most expenses associated with the property (e.g., real estate taxes, insurance, maintenance and repairs), but passes through some operating expenses to the tenant.
Net Debt, Principal Outstanding and Adjusted Principal Outstanding
Principal Outstanding is a non-GAAP measure that represents the Company's outstanding principal debt balance, excluding certain GAAP adjustments, such as premiums and discounts, financing and issuance costs, and related accumulated amortization. Adjusted Principal Outstanding includes the Company's pro rata share of the Unconsolidated Joint Ventures' outstanding principal debt balance. We believe that the presentation of Principal Outstanding and Adjusted Principal Outstanding, which show our contractual debt obligations, provides useful information to investors to assess our overall financial flexibility, capital structure and leverage. Principal Outstanding and Adjusted Principal Outstanding should not be considered as alternatives to the Company's consolidated debt balance as determined in accordance with GAAP or any other GAAP financial measures and should only be considered together with, and as a supplement to, the Company's financial information prepared in accordance with GAAP.
Net Debt is a non-GAAP measure used to show the Company's Adjusted Principal Outstanding, less all cash and cash equivalents and the Company's pro rata share of the Unconsolidated Joint Ventures' cash and cash equivalents. We believe that the presentation of Net Debt provides useful information to investors because our management reviews Net Debt as part of its management of our overall liquidity, financial flexibility, capital structure and leverage.
The following table shows a reconciliation of Net Debt, Principal Outstanding and Adjusted Principal Outstanding to the amounts presented in accordance with GAAP on the balance sheet for the periods presented (dollar amounts in thousands):
| March 31, 2021 | December 31, 2020 | September 30, 2020 | June 30, 2020 | March 31, 2020 | ||||||||||||||||||||||||||||
| Mortgage notes payable, net | $ | 1,035,328 | $ | 1,328,835 | $ | 1,330,174 | $ | 1,393,652 | $ | 1,405,701 | ||||||||||||||||||||||
| Corporate bonds, net | 4,586,252 | 4,584,230 | 3,406,389 | 3,404,935 | 2,814,474 | |||||||||||||||||||||||||||
| Convertible debt, net | — | — | 252,077 | 270,152 | 319,120 | |||||||||||||||||||||||||||
| Credit facility, net | — | — | 896,630 | 896,314 | 1,767,306 | |||||||||||||||||||||||||||
| Total debt - as reported | 5,621,580 | 5,913,065 | 5,885,270 | 5,965,053 | 6,306,601 | |||||||||||||||||||||||||||
| Deferred financing costs, net | 42,503 | 44,573 | 39,204 | 41,152 | 37,896 | |||||||||||||||||||||||||||
| Net discounts | 26,305 | 25,557 | 12,343 | 11,860 | 6,389 | |||||||||||||||||||||||||||
| Principal Outstanding | 5,690,388 | 5,983,195 | 5,936,817 | 6,018,065 | 6,350,886 | |||||||||||||||||||||||||||
Proportionate share of amounts for Unconsolidated Joint Ventures | 106,516 | 106,516 | 106,516 | 68,360 | 68,360 | |||||||||||||||||||||||||||
| Adjusted Principal Outstanding | $ | 5,796,904 | $ | 6,089,711 | $ | 6,043,333 | $ | 6,086,425 | $ | 6,419,246 | ||||||||||||||||||||||
| Cash and cash equivalents | (318,561) | (523,539) | (207,321) | (278,883) | (600,945) | |||||||||||||||||||||||||||
Pro rata share of Unconsolidated Joint Ventures' cash and cash equivalents | (1,587) | (1,619) | (3,776) | (3,433) | (2,567) | |||||||||||||||||||||||||||
| Net Debt | $ | 5,476,756 | $ | 5,564,553 | $ | 5,832,236 | $ | 5,804,109 | $ | 5,815,734 | ||||||||||||||||||||||
Net Debt Leverage Ratio equals Net Debt divided by Gross Real Estate Investments. We believe that the presentation of Net Debt Leverage Ratio provides useful information to investors because our management reviews Net Debt Leverage Ratio as part of its management of our overall liquidity, financial flexibility, capital structure and leverage.
VEREIT, Inc. | WWW.VEREIT.COM | 44
| ||||||||
| Q1 2021 SUPPLEMENTAL INFORMATION | ||||||||
Definitions (cont.) (unaudited, in thousands, except share and per share data) | ||
Net Debt to Normalized EBITDA Annualized Ratio equals Net Debt divided by the respective quarter Normalized EBITDA multiplied by four. We believe that the presentation of Net Debt to Normalized EBITDA Annualized provides useful information to investors because our management reviews Net Debt to Normalized EBITDA Annualized as part of its management of our overall liquidity, financial flexibility, capital structure and leverage.
Net Operating Income ("NOI") and Cash NOI
NOI is a non-GAAP performance measure used to evaluate the operating performance of a real estate company. NOI represents total revenues less property operating expenses and excludes fee revenue earned for services to our unconsolidated real estate joint ventures, impairment, depreciation and amortization, general and administrative expenses, acquisition-related expenses, litigation and non-routine costs, net and restructuring expenses. Cash NOI excludes the impact of certain GAAP adjustments included in rental revenue, such as straight-line rent adjustments and amortization of above-market intangible lease assets and below-market lease intangible liabilities. Cash NOI includes the pro rata share of such amounts from properties owned by Unconsolidated Joint Ventures. It is management's view that NOI and Cash NOI provide investors relevant and useful information because it reflects only income and operating expense items that are incurred at the property level and presents them on an unleveraged basis. NOI and Cash NOI should not be considered as an alternative to operating income. Further, NOI and Cash NOI may not be comparable to similarly titled measures of other companies.
The following table shows the calculation of NOI and Cash NOI for the periods presented (dollar amounts in thousands):
| Three Months Ended | ||||||||||||||||||||||||||||||||
| March 31, 2021 | December 31, 2020 | September 30, 2020 | June 30, 2020 | March 31, 2020 | ||||||||||||||||||||||||||||
| Total revenues | $ | 290,809 | $ | 287,909 | $ | 295,278 | $ | 278,997 | $ | 299,182 | ||||||||||||||||||||||
| Less total operating expenses | (186,477) | (195,693) | (172,917) | (168,962) | (170,965) | |||||||||||||||||||||||||||
| Partnership fee revenue | (500) | (478) | (1,586) | (421) | (596) | |||||||||||||||||||||||||||
| Acquisition-related expenses | 1,354 | 1,048 | 1,050 | 1,169 | 1,523 | |||||||||||||||||||||||||||
| Litigation and non-routine costs, net | 68 | 10,925 | 105 | (118) | (8,564) | |||||||||||||||||||||||||||
| General and administrative | 14,526 | 15,399 | 14,774 | 16,120 | 15,056 | |||||||||||||||||||||||||||
| Depreciation and amortization | 108,075 | 108,138 | 109,191 | 110,599 | 124,080 | |||||||||||||||||||||||||||
| Impairment of real estate | 31,849 | 28,204 | 16,397 | 12,094 | 8,380 | |||||||||||||||||||||||||||
| NOI | 259,704 | 255,452 | 262,292 | 249,478 | 268,096 | |||||||||||||||||||||||||||
Straight-line rent | (4,219) | (7,108) | (12,595) | (3,404) | (2,054) | |||||||||||||||||||||||||||
Amortization of above-market lease assets and deferred lease incentives, net of amortization of below-market lease liabilities | 1,547 | 1,428 | 393 | 788 | 748 | |||||||||||||||||||||||||||
Net direct financing lease adjustments | 366 | 379 | 381 | 372 | 365 | |||||||||||||||||||||||||||
| Other non-cash adjustments | (18) | — | — | — | — | |||||||||||||||||||||||||||
Proportionate share of amounts for Unconsolidated Joint Ventures | 2,507 | 2,799 | 2,876 | 2,475 | 2,404 | |||||||||||||||||||||||||||
| Cash NOI | $ | 259,887 | $ | 252,950 | $ | 253,347 | $ | 249,709 | $ | 269,559 | ||||||||||||||||||||||
Normalized Cash NOI equals our Cash NOI for our most recently reported quarter and eliminates the Cash NOI for properties acquired or developments completed during the most recently reported quarter and replaces Cash NOI for the partial period with an amount estimated to be equivalent to Cash NOI for the full period. Additionally, Normalized Cash NOI eliminates the Cash NOI contributed by properties disposed of during the most recently reported period. It is management's view that Normalized Cash NOI provides investors relevant and useful information because it reflects only the Cash NOI of properties owned as of the most recent reporting period. Normalized Cash NOI should not be considered as an alternative to operating income.
Normalized EBITDA Annualized equals Normalized EBITDA, for the respective quarter, multiplied by four.
Operating Properties refers to all properties owned and consolidated by the Company as of the reporting date.
VEREIT, Inc. | WWW.VEREIT.COM | 45
| ||||||||
| Q1 2021 SUPPLEMENTAL INFORMATION | ||||||||
Definitions (cont.) (unaudited, in thousands, except share and per share data) | ||
Property Operating Expense includes reimbursable and non-reimbursable costs to operate a property, including real estate taxes, utilities, insurance, repairs, maintenance, legal, property management fees, etc.
Rentable Square Feet is leasable square feet of Operating Properties and the Company's pro rata share of leasable square feet of properties owned by Unconsolidated Joint Ventures. Rentable Square Feet at March 31, 2021, December 31, 2020, September 30, 2020, June 30, 2020, and March 31, 2020 excludes the square feet of one redevelopment property.
Triple Net Lease ("NNN") is a lease under which the tenant agrees to pay all expenses associated with the property (e.g., real estate taxes, insurance, maintenance and repairs).
Unconsolidated Joint Ventures include the Company's investments in unconsolidated joint ventures formed to acquire and own real estate properties and exclude other investments in unconsolidated entities.
Unencumbered Asset Ratio equals unencumbered Gross Real Estate Investments divided by Gross Real Estate Investments. Management believes that Unencumbered Asset Ratio is a useful supplemental measure of our overall liquidity and leverage.
Weighted Average Remaining Lease Term is the number of years remaining on each respective lease, weighted based on Annualized Rental Income.
VEREIT, Inc. | WWW.VEREIT.COM | 46
Serious News for Serious Traders! Try StreetInsider.com Premium Free!
You May Also Be Interested In
- Quorum Announces Q4 and Year End 2023 Results
- Bragar Eagel & Squire, P.C. Reminds Investors That Class Action Lawsuits Have Been Filed Against Checkpoint, Sonder, and Perion and Encourages Investors to Contact the Firm
- UnitedAg CONNECT Conference 2024: A Resounding Success
Create E-mail Alert Related Categories
SEC FilingsSign up for StreetInsider Free!
Receive full access to all new and archived articles, unlimited portfolio tracking, e-mail alerts, custom newswires and RSS feeds - and more!
