

Form 8-K VALERO ENERGY CORP/TX For: Jun 01
 Tweet
Tweet Share
Share

Exhibit 99.01 Advancing the Future of Energy Advancing the Future of Energy • With Capital Discipline, Innovation and Unmatched Execution W I T H C A P I TA L D I S C I P L I N E , I N N O V AT I O N A N D U N M AT C H E D E X E C U T I O N . R E L I A B L E A F F O R D A B L E S U S T A I N A B L E E N E R G Y Reliable, Affordable and Sustainable Energy I N V E S T O R P R E S E N T A T I O N | J U N E 2 0 2 2
Cautionary Statement This presentation contains forward-looking statements made by Valero Energy Corporation (“VLO” or “Valero”) within the meaning of federal securities laws. These statements discuss future expectations, contain projections of results of operations or of financial condition or state other forward-looking information. You can identify forward-looking statements by words such as ”plan,” “should,” “anticipate,” “believe,” “estimate,” “expect,” “could,” “continue,” “focused,” “opportunity,” “scheduled,” “may,” “targeting,” or other similar expressions that convey the uncertainty of future events or outcomes. Forward-looking statements in this presentation include, but are not limited to, those relating to our low-carbon projects, our 2025 and 2035 GHG emissions reduction/displacement targets, future capital expenditures, expected timing of completion of projects, the effect of projects on our financial performance, future low-carbon policies and demand for low-carbon fuels, future business plans and strategies, future safety and environmental performance, future operating and financial performance and 2022 guidance. These forward-looking statements are not guarantees of future performance and are subject to risks, uncertainties and other factors, some of which are beyond the control of Valero and are difficult to predict including, but not limited to, the effect, impact, potential duration or other implications of the Russia-Ukraine conflict, the COVID-19 pandemic and various events arising from or related to such events. These statements are often based upon various assumptions, many of which are based, in turn, upon further assumptions, including examination of historical operating trends made by the management of Valero. Although Valero believes that the assumptions were reasonable when made, because assumptions are inherently subject to significant uncertainties and contingencies, which are difficult or impossible to predict and are beyond its control, Valero cannot give assurance that it will achieve or accomplish its expectations, beliefs or intentions. When considering these forward- looking statements, you should keep in mind the risk factors and other cautionary statements contained in Valero’s filings with the Securities and Exchange Commission, including Valero’s annual report on Form 10-K, quarterly reports on Form 10-Q, and other reports available on Valero’s website at www.valero.com. These risks could cause the actual results of Valero to differ materially from those contained in any forward-looking statement. This presentation includes certain financial measures that are not defined under U.S. Generally Accepted Accounting Principles (GAAP) and are considered to be non-GAAP measures. Valero has defined these non-GAAP measures and believes they are useful to the external users of its financial statements, including industry analysts, investors, lenders, and rating agencies. Valero believes these measures are useful to assess its ongoing financial performance because, when reconciled to their most comparable U.S. GAAP measures, they provide improved comparability between periods after adjusting for certain items that Valero believes are not indicative of its core operating performance and that may obscure its underlying business results and trends. These non- GAAP measures should not be considered as alternatives to their most comparable U.S. GAAP measures nor should they be considered in isolation or as a substitute for an analysis of Valero’s results of operations as reported under U.S. GAAP. In addition, these non-GAAP measures may not be comparable to similarly titled measures used by other companies because Valero may define them differently, which diminishes their utility. Valero’s reconciliations of GAAP financial measures to non-GAAP financial measures are located at the end of this presentation. I N V E S T O R P R E S E N T A T I O N | J U N E 2 0 2 2 2 2

REFINING RENEWABLE DIESEL ETHANOL ND ND W O R L D ’ S L A R G E S T I N D E P E N D E N T W O R L D ’ S 2 L A R G E S T R E N E W A B L E D I E S E L W O R L D ’ S 2 L A R G E S T C O R N E T H A N O L R E F I N E R P R O D U C E R P R O D U C E R GROWTH PROJECTS FOCUSED ON COST CONTROL, OPTIMIZATION AND MARGIN EXPANSION ratable wholesale supply of million barrels per day advantaged refining and logistics lowest 1.2 million barrels per day or Renewable Refining of high-complexity assets well positioned for feedstock 15 3.2 cost Diesel over 50% of our light products refineries throughput capacity and product optimization producer EXECUTING A VIABLE PATH TO REDUCE AND DISPLACE GREENHOUSE GAS (GHG) EMISSIONS Ethanol Wholesale HIGH RETURN PROJECTS WITH PRODUCTS PLACED INTO HIGH GROWTH, LOW-CARBON MARKETS Midstream up to expanding to million low-carbon intensity renewable diesel reduction compatible with billion gallons gallons produced from recycled animal fats, used in GHG existing engines 700 1.2 80% 100% per year per year cooking oil and inedible corn oil emissions and infrastructure Best-in-class DIAMOND GREEN DIESEL CONTINUE TO DEVELOP ADDITIONAL LOW-CARBON GROWTH OPPORTUNITIES (DGD) producer of fuels and products that DEVELOPING ECONOMIC PROJECTS TO FURTHER REDUCE CARBON INTENSITY are essential to at least high-octane renewable existing logistics assets well ethanol billion gallons per year reduction in fuel with lower CO positioned to support export modern life 12 1.6 2 30% plants production capacity GHG emissions growth emissions REDUCING CARBON INTENSITY THROUGH ANNOUNCED CARBON SEQUESTRATION PROJECT See slides 23-24 for notes regarding this slide. I N V E S T O R P R E S E N T A T I O N | J U N E 2022 3

Advancing the Future of Energy with Capital Discipline, Innovation and Unmatched Execution Operations Earnings Growth Capital Discipline Steadfast in the Excellence execution of our Unmatched Execution with a Proven Growth Through Innovation Demonstrated Commitment to strategy, pursuing History of Operations Excellence Stockholders excellence in • Safe, reliable, environmentally • Growth projects focused on • Disciplined capital allocation with operations, responsible operations have driven operating cost control, market solid free cash flow and returns to investing for higher profitability and lower expansion and margin improvement stockholders across margin cycles earnings volatility through multiple • Leveraging our global liquid fuels • Delivered on our annual target commodity cycles growth platform to expand our long-term payout ratio of 40% to 50% every • The lowest cash operating cost competitive advantage with year under current management with lower among peer group while maintaining investments in economic low-carbon (since 2014) volatility and first quartile operating performance projects • 10% average annual Return on honoring our • Applying our liquid fuels • 25% after-tax IRR hurdle rate for Invested Capital since 2014 manufacturing expertise to optimize projects commitment our renewable diesel business to stockholder returns Comprehensive liquid fuels strategy driving economic growth projects and providing a viable path to reduce and displace Refinery GHG emissions by 100% by 2035 See slides 23-24 for notes regarding this slide. See slides 44-54 for non-GAAP disclosures. I N V E S T O R P R E S E N T A T I O N | J U N E 2 0 2 2 4 Peer group includes PSX, MPC, DINO, and PBF.

Comprehensive Roadmap to Further Reduce Emissions with Innovative Low-carbon Projects Consistent with Our Strategy GHG Emissions 2035 Target Reduction (Scope 1 & 2) On track to reduce and displace Refinery GHG 2.4 emissions by 32.3 32.3 4.2 Scope 1 & 2 63% through investments in 11.1 board-approved projects by 2025. Targeting to reduce and displace Refinery GHG 10.9 emissions by Scope 1 & 2 3.7 100% through board-approved 2011 2025 Target 2035 Target Refinery GHG Absolute GHG Emissions GHG Emissions GHG Emissions GHG Emissions Refinery GHG Emissions in Emissions Displaced by Displaced by Displaced by Reduced by Emissions in projects and carbon Baseline 2011 Reduction Ethanol Renewable Global Credits Carbon 2035 after sequestration projects (Scope 1 & 2) through Production Diesel for & Blending Sequestration Reductions & under development Efficiencies Production of Renewable Displacements Independently Independently by 2035. (Scope 1 & 2) Fuels (Scope 1 & 2) Verified Verified See slides 23-24 for notes regarding this slide. I N V E S T O R P R E S E N T A T I O N | J U N E 2 0 2 2 5 Million Metric Tons CO e 2 63% 100% Million Metric Tons CO e 2 100%

Expanding Our Long-term Competitive Advantage with Investments in Economic Low-carbon Transportation Fuels Visibility to Earnings Growth $1.2 to $1.7 billion in Annual EBITDA from Growth Projects in Execution $10,500 (expected completion / project cost) Refining Optimization and Increasing Renewables Expansion $8,892 MM Margin Improvement Renewable Diesel $1.2 - $1.7 bn production Estimated EBITDA Cumulative Range Estimated EBITDA Advancing Renewable Naphtha Average: $6,409 MM production $4,660 MM Developing 2021: $4,257 MM Sustainable Aviation Fuel (SAF) Developing 2009: $1,747 MM Renewable Hydrogen 2020: $778 MM − Other Refining Other $1.2 to $1.7 billion in Annual EBITDA Port Arthur DGD 2 DGD 3 EBITDA from Projects in Contribution from Growth Projects and Logistics Started up in 4Q21 4Q22 / $725 MM Coker Growth Projects Projects Execution Evaluating additional 2023 / $975 MM Carbon Sequestration Reinvesting capital with diversification into higher growth, higher return and opportunities lower carbon renewable fuels I N V E S T O R P R E S E N T A T I O N | J U N E 2 0 2 2 See slides 23-24 for notes regarding this slide. See slides 44-54 for non-GAAP disclosures. 6 Joint venture investments, including Diamond Green Diesel, reflect Valero’s ownership interest. Adjusted EBITDA Attributable to VLO Stockholders ($ in millions) 2012 – 2019 Range Projects in Execution Pro Forma EBITDA EBITDA ($ in millions)
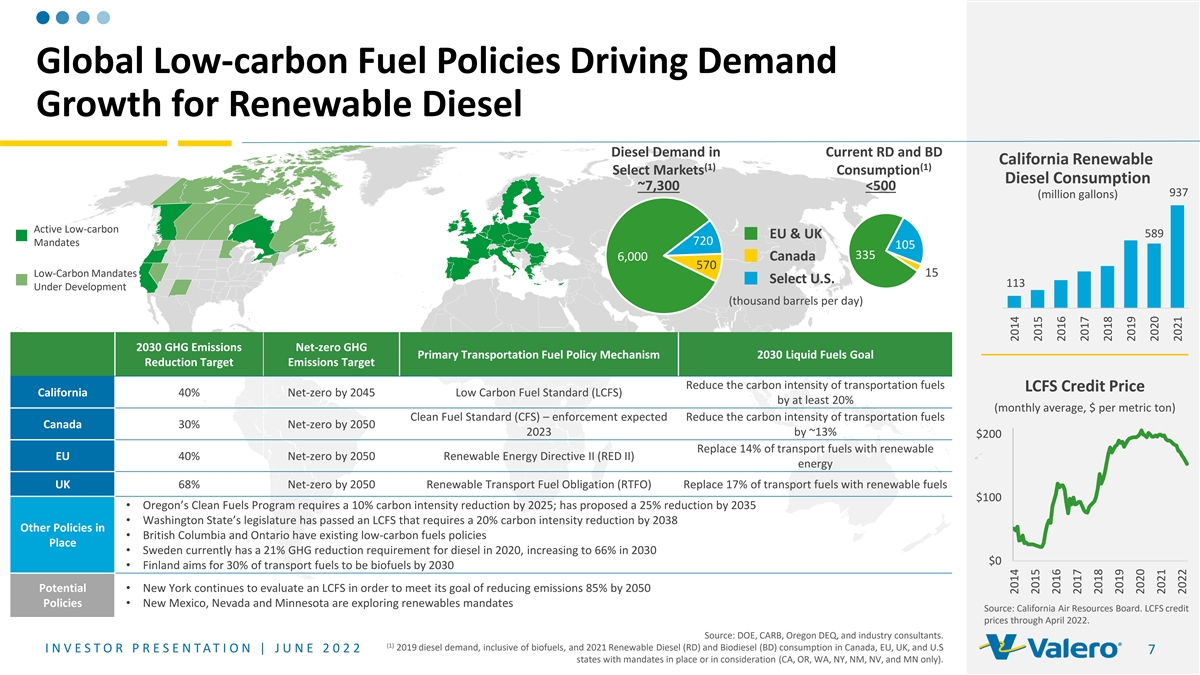
Global Low-carbon Fuel Policies Driving Demand Growth for Renewable Diesel Diesel Demand in Current RD and BD California Renewable (1) (1) Select Markets Consumption Diesel Consumption ~7,300 <500 937 (million gallons) Active Low-carbon 589 EU & UK 720 Mandates 105 335 6,000 Canada 570 15 Low-Carbon Mandates Select U.S. 113 Under Development (thousand barrels per day) 2030 GHG Emissions Net-zero GHG Primary Transportation Fuel Policy Mechanism 2030 Liquid Fuels Goal Reduction Target Emissions Target Reduce the carbon intensity of transportation fuels LCFS Credit Price California 40% Net-zero by 2045 Low Carbon Fuel Standard (LCFS) by at least 20% (monthly average, $ per metric ton) Clean Fuel Standard (CFS) – enforcement expected Reduce the carbon intensity of transportation fuels Canada 30% Net-zero by 2050 2023 by ~13% $200 Replace 14% of transport fuels with renewable EU 40% Net-zero by 2050 Renewable Energy Directive II (RED II) energy UK 68% Net-zero by 2050 Renewable Transport Fuel Obligation (RTFO) Replace 17% of transport fuels with renewable fuels $100 • Oregon’s Clean Fuels Program requires a 10% carbon intensity reduction by 2025; has proposed a 25% reduction by 2035 • Washington State’s legislature has passed an LCFS that requires a 20% carbon intensity reduction by 2038 Other Policies in • British Columbia and Ontario have existing low-carbon fuels policies Place • Sweden currently has a 21% GHG reduction requirement for diesel in 2020, increasing to 66% in 2030 $0 • Finland aims for 30% of transport fuels to be biofuels by 2030 Potential • New York continues to evaluate an LCFS in order to meet its goal of reducing emissions 85% by 2050 Policies• New Mexico, Nevada and Minnesota are exploring renewables mandates Source: California Air Resources Board. LCFS credit prices through April 2022. Source: DOE, CARB, Oregon DEQ, and industry consultants. (1) 2019 diesel demand, inclusive of biofuels, and 2021 Renewable Diesel (RD) and Biodiesel (BD) consumption in Canada, EU, UK, and U.S I N V E S T O R P R E S E N T A T I O N | J U N E 2 0 2 2 7 states with mandates in place or in consideration (CA, OR, WA, NY, NM, NV, and MN only). 2014 2014 2015 2015 2016 2016 2017 2017 2018 2018 2019 2019 2020 2020 2021 2021 2022
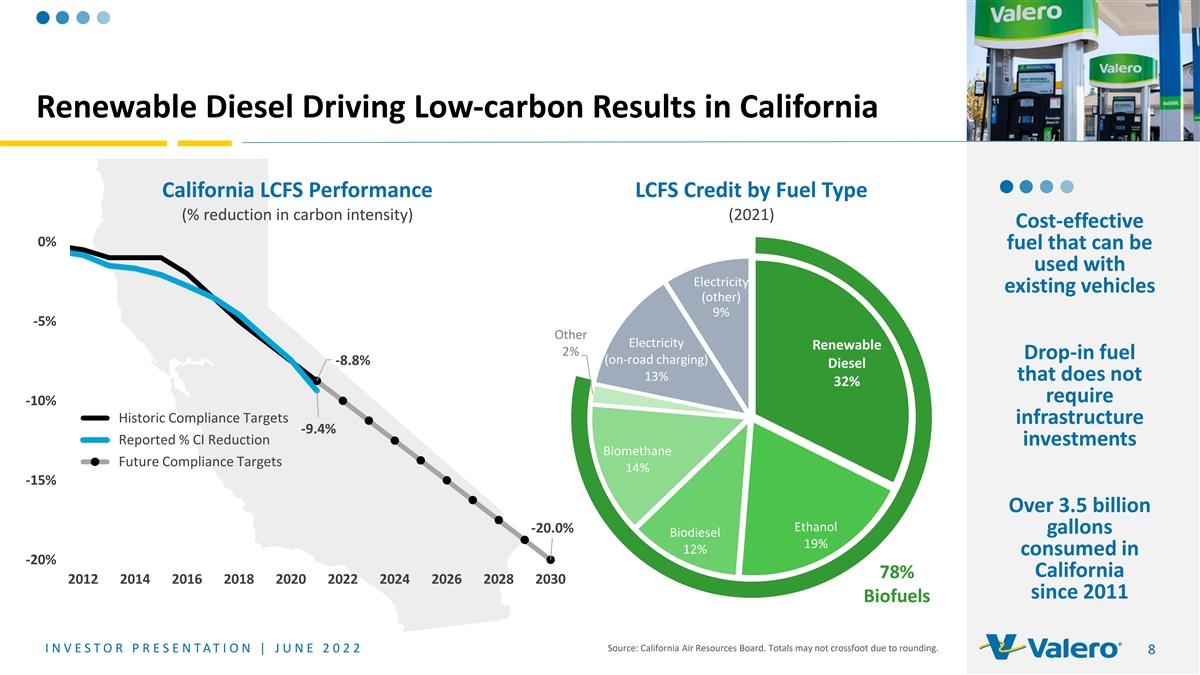
Renewable Diesel Driving Low-carbon Results in California California LCFS Performance LCFS Credit by Fuel Type (% reduction in carbon intensity) (2021) Cost-effective 0% fuel that can be used with Electricity existing vehicles (other) 9% -5% Other Electricity Renewable 2% Drop-in fuel (on-road charging) -8.8% Diesel 13% that does not 32% require -10% Historic Compliance Targets infrastructure -9.4% Reported % CI Reduction investments Biomethane Future Compliance Targets 14% -15% Over 3.5 billion Ethanol -20.0% gallons Biodiesel 19% 12% consumed in -20% California 78% 2012 2014 2016 2018 2020 2022 2024 2026 2028 2030 since 2011 Biofuels Source: California Air Resources Board. Totals may not crossfoot due to rounding. I N V E S T O R P R E S E N T A T I O N | J U N E 2 0 2 2 8
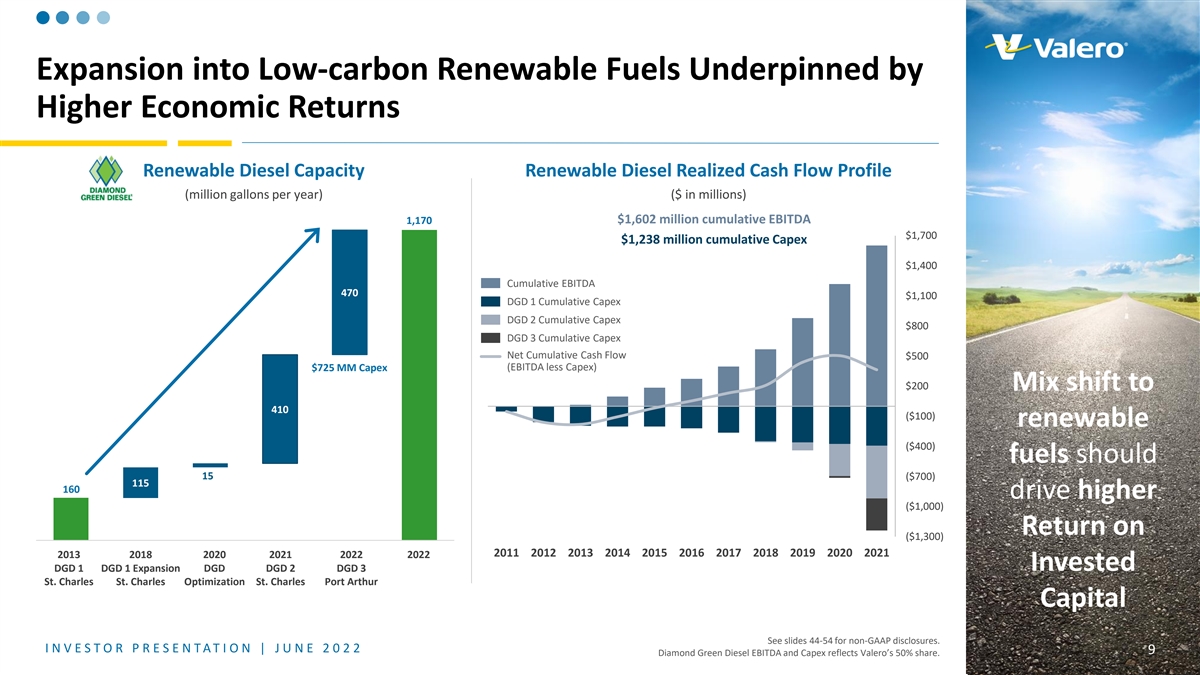
Expansion into Low-carbon Renewable Fuels Underpinned by Higher Economic Returns Renewable Diesel Capacity Renewable Diesel Realized Cash Flow Profile (million gallons per year) ($ in millions) 1,170 $1,602 million cumulative EBITDA $1,700 $1,238 million cumulative Capex $1,400 Cumulative EBITDA 470 $1,100 DGD 1 Cumulative Capex DGD 2 Cumulative Capex $800 DGD 3 Cumulative Capex Net Cumulative Cash Flow $500 $725 MM Capex (EBITDA less Capex) $200 Mix shift to 410 ($100) renewable ($400) fuels should 15 ($700) 115 160 drive higher ($1,000) Return on ($1,300) 2011 2012 2013 2014 2015 2016 2017 2018 2019 2020 2021 2013 2018 2020 2021 2022 20 2022 23 Invested DGD 1 DGD 1 Expansion DGD DGD 2 DGD 3 St. Charles St. Charles Optimization St. Charles Port Arthur Capital See slides 44-54 for non-GAAP disclosures. I N V E S T O R P R E S E N T A T I O N | J U N E 2 0 2 2 9 Diamond Green Diesel EBITDA and Capex reflects Valero’s 50% share.

RENEWABLE DIESEL A Vehicle Running on Renewable Diesel Emits A DROP-IN FUEL Fewer Emissions than an Electric Vehicle U.S. Light-Duty Vehicle Life Cycle Emissions U.S. Heavy-Duty Long-Haul Vehicle Life Cycle Emissions A single light-duty vehicle 2021 Southwest Research Institute Study 2021 Southwest Research Institute Study running on renewable diesel emits 10 tons less CO 2 Electricity / Fuel Emissions g CO /mile “Zero emissions” 2 Battery Electric Vehicle Tons CO 2 Embedded Emissions emissions than an electric vehicles are not Diesel Engine with Renewable Diesel 300 zero emissions 1,600 vehicle, an amount equal to 57% fewer emissions than 25% fewer planting 159 trees* 1,400 250 an EV after emissions 1,000,000 than an EV 1,200 A single heavy-duty long-haul miles traveled 200 vehicle running on renewable 1,000 diesel emits 833 tons less 150 800 CO emissions than an 2 600 100 electric vehicle, an amount 400 equal to planting 13,763 50 trees* 200 0 0 Battery Electric Vehicle Diesel Engine with Embedded 500,000 Miles 1,000,000 Miles Battery Electric Diesel Engine with Embedded 500,000 Miles 1,000,000 Miles Renewable Diesel Emissions Traveled Traveled Vehicle Renewable Diesel Emissions Traveled Traveled (waste oil - based) *Estimated based on EPA’s GHG (zero miles (waste oil based) (zero miles traveled) Equivalencies calculator for urban tree traveled) seedlings grown for ten years. I N V E S T O R P R E S E N T A T I O N | J U N E 2 0 2 2 10 See slides 23-24 for notes regarding this slide.
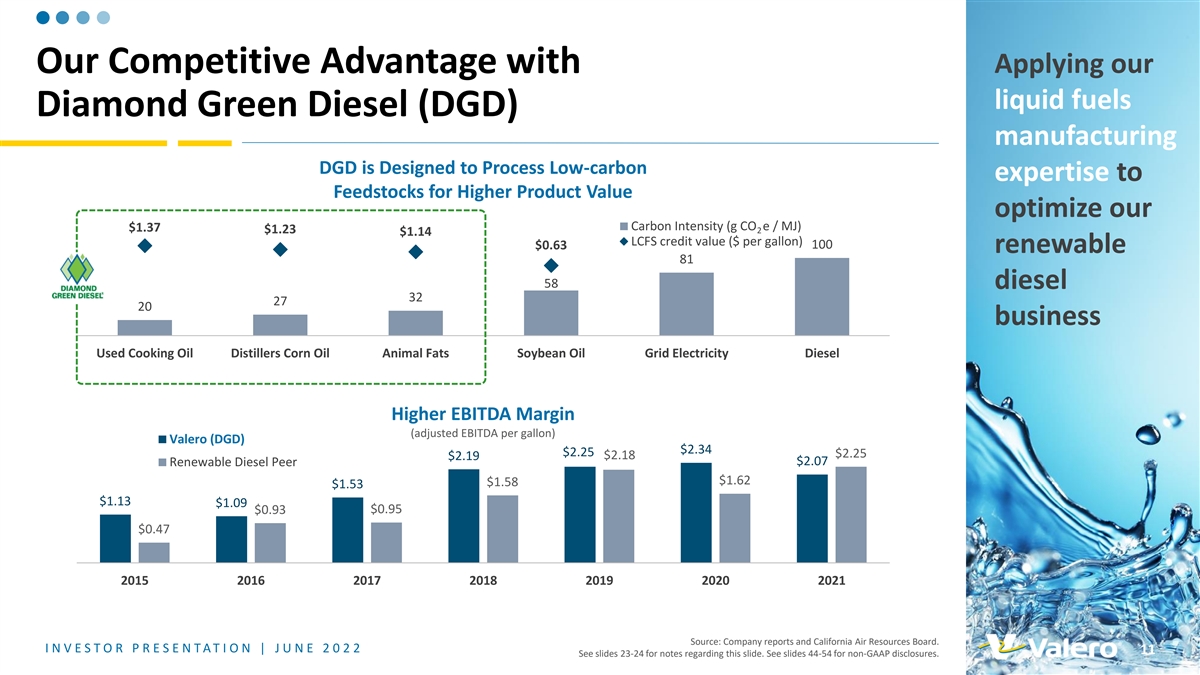
Applying our Our Competitive Advantage with liquid fuels Diamond Green Diesel (DGD) manufacturing DGD is Designed to Process Low-carbon expertise to Feedstocks for Higher Product Value optimize our Carbon Intensity (g CO e / MJ) $1.37 $1.23 2 $1.14 LCFS credit value ($ per gallon) 100 $0.63 renewable 81 58 diesel 32 27 20 business Used Cooking Oil Distillers Corn Oil Animal Fats Soybean Oil Grid Electricity Diesel Higher EBITDA Margin (adjusted EBITDA per gallon) Valero (DGD) $2.34 $2.25 $2.25 $2.19 $2.18 $2.07 Renewable Diesel Peer $1.62 $1.58 $1.53 $1.13 $1.09 $0.93 $0.95 $0.47 2015 2016 2017 2018 2019 2020 2021 Source: Company reports and California Air Resources Board. I N V E S T O R P R E S E N T A T I O N | J U N E 2 0 2 2 11 See slides 23-24 for notes regarding this slide. See slides 44-54 for non-GAAP disclosures.
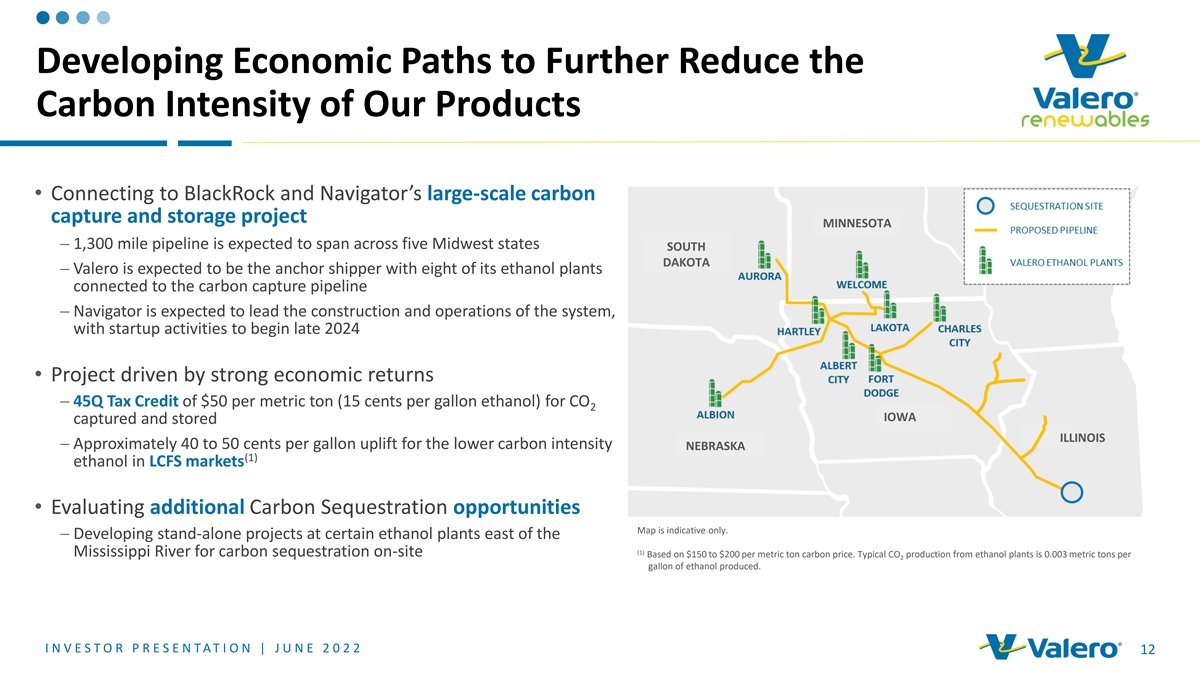
Developing Economic Paths to Further Reduce the Carbon Intensity of Our Products • Connecting to BlackRock and Navigator’s large-scale carbon capture and storage project MINNESOTA − 1,300 mile pipeline is expected to span across five Midwest states SOUTH DAKOTA − Valero is expected to be the anchor shipper with eight of its ethanol plants connected to the carbon capture pipeline − Navigator is expected to lead the construction and operations of the system, with startup activities to begin late 2024 • Project driven by strong economic returns − 45Q Tax Credit of $50 per metric ton (15 cents per gallon ethanol) for CO 2 IOWA captured and stored ILLINOIS − Approximately 40 to 50 cents per gallon uplift for the lower carbon intensity NEBRASKA (1) ethanol in LCFS markets • Evaluating additional Carbon Sequestration opportunities Map is indicative only. − Developing stand-alone projects at certain ethanol plants east of the (1) Mississippi River for carbon sequestration on-site Based on $150 to $200 per metric ton carbon price. Typical CO production from ethanol plants is 0.003 metric tons per 2 gallon of ethanol produced. I N V E S T O R P R E S E N T A T I O N | J U N E 2 0 2 2 12

SIZE, SCALE AND GLOBAL REACH LOWEST COST PRODUCER DISCIPLINED INVESTMENTS EXTENSIVE CONNECTIVITY AND GLOBAL OPTIMIZATION TOP QUARTILE OPERATIONS GROWTH WITH LOWER VOLATILITY PREMIER REFINING PORTFOLIO THAT IS RESILIENT EVEN IN A CARBON-CONSTRAINED SCENARIO Long-term, SIZE, SCALE AND GLOBAL REACH sustainable global operations support optimization of high complexity coastal system operational flexibility to ratable wholesale supply of competitive product exports with extensive connectivity to process a wide range of 1.2 million barrels per day or advantage inland and imported crudes feedstocks over 50% of our light products one of the largest light products importers into Mexico $2,119 Highest LOWEST COST PRODUCER WHILE ACHIEVING TOP QUARTILE OPERATIONS Free Cash Flow safety and reliability are imperative top quartile mechanical availability access to cheap natural gas and a deep pool within Peer for profitability minimizes unplanned downtime and costs of skilled labor in the U.S. Gulf Coast Group INVESTMENTS IN EFFICIENCY, MARKET EXPANSION AND HIGHER MARGIN CAPTURE Peer Range reducing cost and improving margin improving feedstock flexibility, cost and growing market share into higher netback Average Free Cash Flow capture crude quality markets 2012 – 2021 • Wilmington and Pembroke cogens • Diamond, Sunrise and Red River pipelines• Central Texas pipelines and terminals $0 • St. Charles and Port Arthur hydrocrackers• connectivity in Corpus Christi • Pasadena terminal • Port Arthur coker• Line 9 into Quebec• Expansion into Latin America with ($ in millions) • Houston and St. Charles alkylation units• Houston and Corpus Christi toppers investments in Mexico and Peru See slides 23-24 for notes regarding this slide. See slides 44-54 for non-GAAP disclosures. I N V E S T O R P R E S E N T A T I O N | J U N E 2 0 2 2 13 Peer group includes PSX, MPC, DINO, and PBF.

Investments in Safety and Reliability reliability have contributed to are Imperative for Profitability operations excellence In 2021, we delivered our best year ever on employee and process safety performance Personnel Safety Tier 1 Process Safety (three-year rolling averages) Valero Industry 0.19 0.90 0.79 0.50 0.05 0.21 2010 2011 2012 2013 2014 2015 2016 2017 2018 2019 2020 2021 2010 2011 2012 2013 2014 2015 2016 2017 2018 2019 2020 2021 Improvement Versus Industry Benchmarks Leads to Greater Margin Capture, Lower Operating Expenses and Better Efficiency st 1 Quartile 2018 nd 2 Quartile rd 3 Quartile 2008 th 4 Quartile Personnel Index Maintenance Index Non-Energy Cash Opex I N V E S T O R P R E S E N T A T I O N | J U N E 2 0 2 2 See slides 23-24 for notes regarding this slide. 14 Total Recordable Incidence Rate (TRIR) Process Safety Event Rate

Increased Refinery Availability Has Driven Valero to be the Lowest Cost Producer Improvement in Mechanical Availability Refining Cash Operating Expenses (1) Versus Industry Benchmarks Per Barrel of Throughput (excludes turnaround and D&A expenses) Peer Range $8.00 st 1 Quartile 2018 nd 2 Quartile 2008 rd 3 Quartile th 4 Quartile $3.00 2010 2012 2014 2016 2018 2020 1Q22 Mechanical Availability See slides 23-24 for notes regarding this slide. Peer group includes PSX, MPC, DINO, and PBF. I N V E S T O R P R E S E N T A T I O N | J U N E 2 0 2 2 15 (1) 2021 refining cash operating expenses per barrel of throughput include impacts from Winter Storm Uri.

Refining Business Generates Significant Cash to Support Growth and Stockholder Returns Sources and Uses of Cash – Cumulative: December 31, 2014 to March 31, 2022 ($ in billions) Sources of Cash Uses of Cash Reducing Leverage $4.0 $3.0 ($17.7) (0.6) $33.2 Sustaining capital ($10.6) (0.7) Growth capital ($5.9) Acquisitions ($1.2) (0.8) $2.0 ($18.0) Dividends ($9.7) Buybacks ($8.4) $3.7 $2.6 ($1.6) Cash and Cash Net Cash Provided by Other Financing Capital Investments Stockholder Returns Other Cash and Cash Equivalents Operating Activities Activities Attributable to Valero Equivalents December 31, 2014 March 31, 2022 I N V E S T O R P R E S E N T A T I O N | J U N E 2 0 2 2 See slides 44-54 for non-GAAP disclosures. 16 Totals may not crossfoot due to rounding. Thousands Debt Raised in 2020 September 2021 Debt Redemption December 2021 Debt Redemption and Refinancing February 2022 Debt Redemption and Refinancing

Disciplined Capital Management is a Constant in Our Strategy 1 Maintain a Strong Balance Sheet Maintain an investment grade credit rating Target 20% to 30% net debt-to-cap ratio 2 Non-discretionary Sustaining Capex Dividend • Target approximately $1.2 to $1.5 billion annually• Commitment to stockholders • Key to safe and reliable operations • Targeting a sustainable and growing dividend with a payout that is at the high end of our peer group 3 Discretionary Growth Capex Acquisitions Buybacks • 25% after-tax IRR hurdle rate for projects• Evaluate versus alternative uses of cash• Targeting an annual payout ratio between 40% and 50% of adjusted net cash • Refining projects focused on operating cost provided by operating activities control, market expansion and margin improvement• Stock buyback program consists of ratable and opportunistic purchases • Low-carbon fuels expansion I N V E S T O R P R E S E N T A T I O N | J U N E 2 0 2 2 See slides 23-24 for notes regarding this slide. 17

Demonstrated Discipline in Capital Allocation Estimated Capital Investments Attributable to Valero Annual Capital Investments Attributable to Valero ($ billion) $2.0 billion for 2022 $3.4 Sustaining Growth Steady investments $2.8 Sustaining Renewables $2.7 ~50% ~60% ~40% to maintain a safe $2.6 $2.6 Growth Other Growth and reliable $2.4 $1.8 $2.2 asset base and $0.7 $0.9 $2.0 $2.0 $1.4 $2.0 enhance the $1.5 $1.8 $1.0 margin $0.9 Total Capital Investments Growth Capital Investments $0.6 Attributable to Valero Attributable to Valero $0.9 capability of our $0.7 portfolio Sustaining Capex as a percentage of Depreciation and Amortization >100% $1.9 $1.7 $1.5 $1.5 $1.4 $1.4 $1.3 Approximately $1.2 $1.1 $1.1 Steady investments to 47% 50% of growth improve portfolio efficiency capex is allocated to renewables 2012 2013 2014 2015 2016 2017 2018 2019 2020 2021 2022E 2012 2021 Sustaining includes costs for turnarounds and catalysts and regulatory compliance. Growth includes joint-venture investments but excludes acquisitions. Sustaining and growth excludes 50% of DGD’s sustaining and growth capex attributable to the other joint venture member and those related to other variable interest entities. Renewables reflects DGD and ethanol. See slides 44-54 for non-GAAP disclosures. Totals may not crossfoot due to rounding. I N V E S T O R P R E S E N T A T I O N | J U N E 2 0 2 2 18

Delivering on Our Commitment of Cash Returns to Stockholders Annual Dividend Per Share and Weighted Average Stockholder Dividend Shares Outstanding (2) Returns Yield as a Percentage Relative to 2012 556 million S&P 500 1.6% Payout Ratio: Delivering cash shares 11% 30% 31% 54% 65% 63% 56% 47% 184% 50% 3.2% returns through 100% 99% 95% $3.7 Energy 3.0% 90% sustainable 408 million Utilities 3.0% 83% shares $3.1 80% dividend 77% ($ billion) 2.9% 74% 73% Real Estate 73% 73% $2.6 Buybacks $2.4 WASO Consumer 2.7% growth and Staples $2.3 Dividend/share Dividends $3.92 $3.92 $2.8 $1.7 2.1% Financial $3.60 $1.9 discretionary $1.8 $1.4 $0.8 $3.20 $1.6 Materials 1.9% $1.3 $0.2 $1.4 $2.80 buybacks 1.8% Industrial $2.40 $1.3 1.6% Health Care $0.9 $1.70 $0.6 $1.6 $1.6 $1.5 $1.4 $1.2 Technology 1.1% $1.1 $0.3 $1.05 $0.8 Consumer $0.85 $0.6 $0.5 1.0% $0.65 $0.4 Discretionary Communication (1) 0.9% 2012 2013 2014 2015 2016 2017 2018 2019 2020 2021 2012 2013 2014 2015 2016 2017 2018 2019 2020 2021 2022 Services Source: Bloomberg as of May 20, 2022. See slides 23-24 for notes regarding this slide. See slides 44-54 for non-GAAP disclosures. Totals may not crossfoot due to rounding. (1) 2022 Dividend per share annualized based on most recent quarterly dividend. (2) Dividend yield for sectors reflects the Index Yield of the respective SPDR exchange-traded fund (ETF). I N V E S T O R P R E S E N T A T I O N | J U N E 2 0 2 2 19

Demonstrated Lower Volatility in Earnings and Free Cash Flow Volatility S&P 500 Free Cash Flow Volatility and Return Profile Average Free Cash Flow 2012 – 2022 2012 – 2022 2012 – 2021 Valero has Peer Range 9% BEST demonstrated Financials lower 8% Valero $2,119 volatility in 8% 7% earnings and Communication Services Information 6% free cash flow Technology Industrials than other Peers 5% Consumer refiners, Consumer Discretionary 4% integrated energy Staples Materials Health companies and Energy Utilities Care 3% most S&P 500 Real Estate sectors 2% $0 0% Oil Majors WORST 1% 0% 100% 200% 300% 400% 500% 96% 87% 56% $ Millions % of Average Free Cash Free Cash Flow Volatility Adjusted EBITDA Market Cap Flow EPS Source: Bloomberg and company reports. Peer group includes PSX, MPC, DINO, and PBF. I N V E S T O R P R E S E N T A T I O N | J U N E 2 0 2 2 20 See slides 23-24 for notes regarding this slide. See slides 44-54 for non-GAAP disclosures. Average TTM Free Cash Flow as a % of Market Cap

Valero’s Positioning Relative to the S&P 500 Index Dividend Yield Compelling Dividend Yield Growth Value Balance Sheet VLO 3.2% (≥3% Dividend Yield) ($ billion) Premier Refining Company 2 Company 2 3.1% portfolio that is Competitive EBITDA Growth 34% resilient even in a (≥10% Consensus CAGR for carbon-constrained Company 3 2021A - 2023E) Company 3 3.0% scenario 3.2% Company 4 Company 4 3.0% High Stockholder Return Lowest cost producer Cash A/R Facility (≥10% 2014-2021 Average ROIC $2.5 $1.3 & Positive TSR since 2014) Company 5 Company 5 3.0% Growth through innovation in $7.3 billion Renewables Investment Grade in available (BBB- / Baa3) liquidity Committed to stockholder returns with an annual target payout ratio of Large Cap Credit Facilities (Market Cap 40% to 50% $3.6 ≥$10 billion) 6.3x Comprehensive roadmap to reduce S&P 500 emissions through Conse nsus EBIT DA Dividend Yield 202 2 EV / E BITDA Growth 2 021-2023 CAGR Multiple investments in Board (1) Consensus EBITDA Dividend EV / 2022E Valero Liquidity approved projects (As of March 31, 2022) CAGR Yield EBITDA 500 2021A - 2023E See slides 23-24 for notes regarding this slide. Source Bloomberg and company reports as of May 20, 2022. Totals may not crossfoot due to rounding. I N V E S T O R P R E S E N T A T I O N | J U N E 2 0 2 2 21 (1) Excludes $157 million of cash and cash equivalents related to the consolidated VIEs that is available for use only by the VIEs. th rd nd st 4 Quartile 3 Quartile 2 Quartile 1 Quartile

Appendix Contents Topic Slide Notes 23-24 VLO Guidance 25 Environmental, Social and Governance (ESG) 26-27 Strong Presence in Advantaged U.S. Gulf Coast and Mid-Continent 28 U.S. Natural Gas Cost Advantage 29 Crude Supply Advantage in the U.S. Gulf Coast and Mid-Continent 30 Global Optimization of Operations and Product Exports 31-33 Ratable Global Wholesale Supply and Growth in Mexico 34 Valero’s Logistics Assets 35 Ethanol 36 Projects in Execution Phase or Recently Completed 37-40 Refining Capacity and Nelson Complexity 41 Now vs. Then – A Shift in Valuation 42 Electric Vehicle (EV) Myth: Zero Emissions 43 Non-GAAP Disclosures 44-54 I N V E S T O R P R E S E N T A T I O N | J U N E 2 0 2 2 22

Notes Payout Ratio Payout Ratio is the sum of dividends and stock buybacks divided by adjusted net cash provided by operating activities. Adjusted net cash provided by operating activities excludes changes in working capital and 50% of DGD’s operating cash flow (excluding the change in its working capital) attributable to the other joint venture member. Light Products Light products is the combined volume of gasoline and distillate. Gasoline volume includes blendstocks and distillate volume includes ULSD, jet fuel, kerosene, and ULSK. Slides 4, 5, 26, and 27 Valero’s Sustainable Accounting Standards Board (SASB) Report aligns its performance data with the recommendations of the SASB framework in the Oil and Gas – Refining and Marketing industry standard. A copy of Valero’s SASB report, EEO-1 report and related disclosures, including further detail on our 2025 and 2035 scope 1 and 2 GHG emissions reduction targets and the independent verification we obtained can be on pages 106 through 108 in Valero’s Stewardship and Responsibility Report (SRR), which can be accessed on Valero’s investor relations website at Investorvalero.com. Slides 6 and 37 Amounts shown represent targeted EBITDA growth. Valero is unable to provide a reconciliation of such forward-looking targets because certain information needed to make a reasonable forward-looking estimate is difficult to estimate and dependent on future events, which are uncertain or outside of its control, including with respect to unknown financing terms, project timing and costs, and other potential variables. Accordingly, a reconciliation is not available without unreasonable effort. Slide 10 U.S. Light-Duty Vehicle (LDV) Life Cycle Emissions study conducted by Southwest Research Institute – “Life Cycle Analysis Report” (2021) based on simulations performed using the GREET life cycle analysis tool. LDV with 12 year life and 160,000 miles travel, renewable diesel emissions are based on 100% waste oil based renewable diesel blend, electricity based on 2019 EIA average mix, and no battery replacement for 300 mile range electric vehicle. Vehicle class mix of 30% sedans, 20% crossovers, and 50% pickup/SUV trucks. Embedded emissions captures the emissions involved in the manufacturing, assembly, and production of the vehicle as well as maintenance items over the lifetime of the vehicle i.e. battery, fluids, ADR (assembly, disposal, and recycling), and components. U.S. Heavy-Duty Long-Haul Vehicle (HDV) Life Cycle Emissions study conducted by Southwest Research Institute – “Life Cycle Analysis Report” (2021). Class 8 heavy-duty truck with a 1,000,000 mile (~15 years) lifetime, electric truck with a 500-mile battery range, electricity based on 2019 EIA average mix, one battery replacement, and diesel engine running on 100% waste oil based renewable diesel. Embedded emissions captures the emissions involved in the manufacturing, assembly, and production of the vehicle as well as maintenance items over the lifetime of the vehicle i.e. battery, fluids, ADR (assembly, disposal and recycling), and components. Slide 11 California LCFS credit values are for 2022, assuming $150 per metric ton carbon price. Renewable diesel peer reflects Neste Corporation. I N V E S T O R P R E S E N T A T I O N | J U N E 2 0 2 2 23
Notes Slides 13 and 20 Free cash flow is defined as net cash provided by operating activities less capital expenditures of VLO and DGD, deferred turnaround and catalyst cost expenditures, investments in joint ventures, and changes in current assets and liabilities. Average free cash flow reflects 2012 through the most recent annual filing. Average free cash flow for PBF reflects years 2013 to 2021 due to its December 2012 IPO. Volatility expressed as coefficient of variance, or the standard deviation divided by the mean, of the respective metric on a quarterly basis from the first quarter of 2012 through the first quarter of 2022. EBITDA is defined as net income (loss) plus income tax, net interest and depreciation and amortization. Refining peer group includes PSX, MPC, DINO, and PBF. Oil majors include XOM, CVX, COP and EOG. Slide 14 Industry Total Recordable Incidence Rate (TRIR) from U.S. Bureau of Labor Statistics. Tier 1 three-year rolling averages of refining process safety events per 200,000 work hours. Tier 1 defined within API Recommended Practice 754. Industry benchmarking and Valero’s performance statistics from Solomon Associates and Valero. Slide 15 Industry benchmarking and Valero’s performance statistics from Solomon Associates and Valero. Slide 17 Targeted net debt-to-cap ratio based on total debt reduced by balance sheet cash. Peer group includes PSX, MPC, DINO, and PBF. Payout ratio is the sum of dividends and stock buybacks divided by adjusted net cash provided by operating activities. Adjusted net cash provided by operating activities excludes changes in working capital and 50% of DGD’s operating cash flow (excluding the change in its working capital) attributable to the other joint venture member. Slide 21 TSR from December 31, 2014 through May 20, 2022 includes stock price appreciation and dividends paid. EV / EBITDA and CAGR based on consensus estimates. Slide 29 VLO Refining system used as a proxy for U.S. refining and compared to a European refinery with similar processing unit configuration. Platts Houston Ship Channel natural gas price quotes used for the U.S. and the ICE UK National Balancing Point quotes used for Europe. 2Q22 prices through May 16, 2022. VLO Refining natural gas consumption is ~900,000 MMBtu per day, of which 63% is operating expense and the balance is cost of goods sold. Slide 30 Ranges represent average quarterly minimums and maximums of each feedstock category as a % of total feedstock. Ranges for monthly averages are wider. Slide 32 VLO U.S. product exports reflect Valero’s actual U.S. gasoline and distillate export volumes. Distillate volume includes diesel, jet fuel and ULSK. Map shows destinations for products exported from Valero’s refineries in the U.S., Canada and the U.K. I N V E S T O R P R E S E N T A T I O N | J U N E 2 0 2 2 24

VLO Guidance (1) 2Q22 • Throughput (MBPD) – U.S. Gulf Coast 1,640 to 1,690 – U.S. Mid-Continent 395 to 415 – North Atlantic 445 to 465 – U.S. West Coast 225 to 245 • Refining cash operating expense per barrel of throughput $5.15 • Ethanol – Production (millions of gallons per day) 4.0 – Operating expense per gallon of production $0.48 • Cash opex $0.43 • Non-cash opex $0.05 • Depreciation and amortization expense ($MM) $630 • Net interest expense ($MM) $140 (1) Full Year 2022 • Renewable Diesel – Sales volume (million gallons) 750 – Operating expense per gallon of production $0.45 • Cash opex $0.30 • Non-cash opex $0.15 (2) • Payout ratio of adjusted net cash provided by operating activities 40 to 50% • General and administrative expense ($MM) $870 • Annual capital investments attributable to Valero ($MM) $2,000 – Sustaining 60% – Growth 40% (1) Unless otherwise stated, guidance as provided on the 1Q22 earnings call and is included here for informational purposes only. (2) Payout ratio is the sum of dividends and stock buybacks divided by adjusted net cash provided by operating activities. Adjusted net cash provided by operating activities excludes changes in working capital and 50% of DGD’s operating cash flow (excluding the change in its working capital) attributable to the other joint venture member. I N V E S T O R P R E S E N T A T I O N | J U N E 2 0 2 2 25

A Commitment to Environmental Stewardship, Beyond Regulations ENVIRONMENTAL E Upcoming ESG Reducing, Reusing, Recycling, and Repurposing Carbon Capture Disclosures Our Port Arthur refinery - ESG Report to include Flare-gas recovery systems Recycle approximately 18.5 SASB report, EEO-1, became the first industrial site result in more than 97% times the amount of fresh water and GHG emissions in the U.S. to host a large scale flaring-free operations consumed in refining operations verification – Summer carbon capture project, with 2022 Marine vapor Cogeneration units and more than 1 million metric tons recovery units route expanders can offset enough captured each year - 2022 TCFD Report gasoline back into electricity to power a city the with Scenario size of San Francisco the refinery pool Analysis (IEA Net Zero 2050) – Summer 2022 Renewable Diesel Diamond Green Diesel Ethanol reduces life Developing a carbon capture - Value chain analysis, reduces life cycle GHG processes recycled cycle GHG emissions project connected to eight of our including certain (1)(2) (2) emissions – Fall 2022 emissions up to 80% animal fats, used cooking by at least 30% Ethanol plants, providing an oil, and inedible corn oil economic path to further reduce - Political and lobbying to produce a low-carbon carbon intensity of our Ethanol activities, including a intensity renewable product by more than 40% climate-lobbying diesel analysis – Fall 2022 See slides 23-24 for notes regarding this slide. (1) I N V E S T O R P R E S E N T A T I O N | J U N E 2 0 2 2 100% used cooking oil feedstock results in a carbon intensity score of 20 under California’s LCFS program. 26 (2) Versus the comparable petroleum based fuel. Renewables Refining
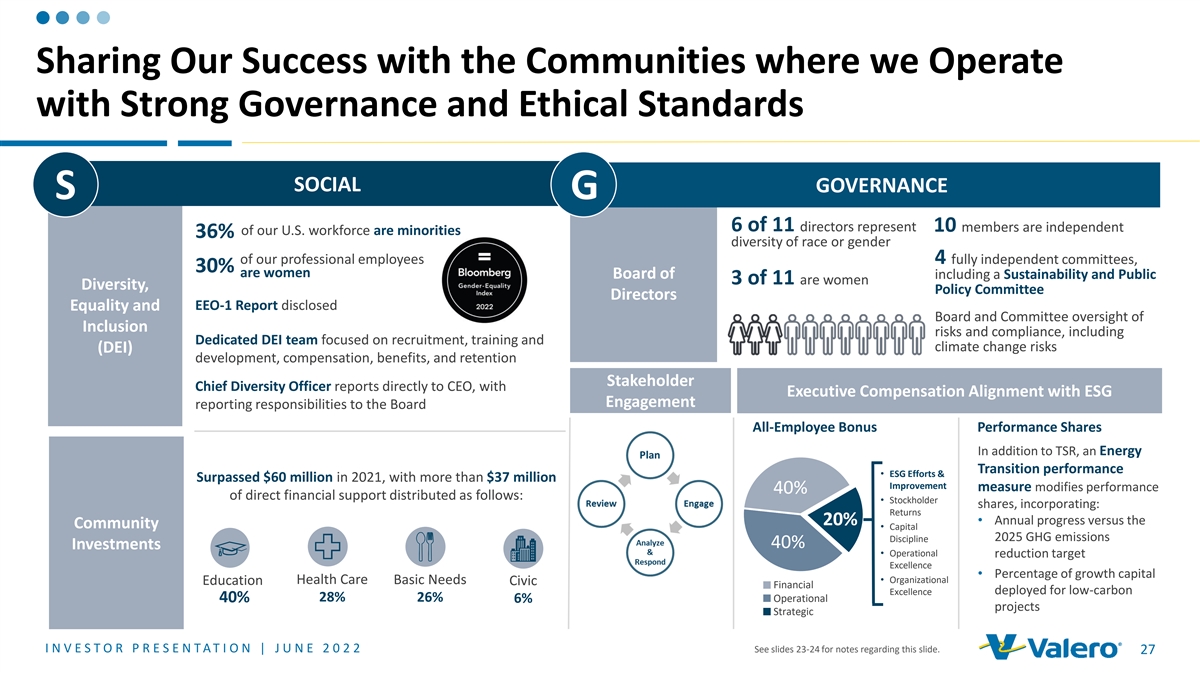
Sharing Our Success with the Communities where we Operate with Strong Governance and Ethical Standards SOCIAL GOVERNANCE S G 6 of 11 directors represent 10 members are independent of our U.S. workforce are minorities 36% diversity of race or gender of our professional employees 4 fully independent committees, 30% are women Board of including a Sustainability and Public 3 of 11 are women Diversity, Policy Committee Directors EEO-1 Report disclosed Equality and Board and Committee oversight of Inclusion risks and compliance, including Dedicated DEI team focused on recruitment, training and climate change risks (DEI) development, compensation, benefits, and retention Stakeholder Chief Diversity Officer reports directly to CEO, with Executive Compensation Alignment with ESG Engagement reporting responsibilities to the Board All-Employee Bonus Performance Shares In addition to TSR, an Energy Transition performance • ESG Efforts & Surpassed $60 million in 2021, with more than $37 million Improvement measure modifies performance 40% of direct financial support distributed as follows: • Stockholder shares, incorporating: Returns 20%• Annual progress versus the Community • Capital 2025 GHG emissions Discipline 40% Investments • Operational reduction target Excellence • Percentage of growth capital Health Care Basic Needs• Organizational Education Civic Financial Excellence deployed for low-carbon 28% 40% 26% 6% Operational projects Strategic I N V E S T O R P R E S E N T A T I O N | J U N E 2 0 2 2 See slides 23-24 for notes regarding this slide. 27

Strong Presence in Advantaged U.S. Gulf Coast and Mid-Continent 2.6 mmbpd Refining Capacity (mbpd, % of overall crude capacity) U.S. West Coast CANADA 230 UNITED 9% North Atlantic KINGDOM 440 IRELAND 17% 1,484 U.S. Gulf Coast 57% MONTREAL 461 17% U.S. Mid-Continent LONDON UNITED STATES (1) Gulf Coast Refining Capacity (mbpd, % of overall crude capacity) 1,484 LIMA PERU 57% 1,178 WHOLESALE MARKETING PRESENCE 41% BRANDED WHOLESALE PRESENCE 529 VALERO REFINERIES 27% 185 VALERO ETHANOL PLANTS SAN ANTONIO 19% 0 VALERO TERMINALS DIAMOND GREEN DIESEL VLO MPC PSX PBF DINO (existing & under construction) MEXICO PIPELINES (1) CDU capacity from EIA data and company PROPOSED CARBON SEQUESTRATION PIPELINE presentations. See slide 41 for Valero’s capacity and Nelson complexity by refinery. I N V E S T O R P R E S E N T A T I O N | J U N E 2 0 2 2 28 MEXICO CITY

U.S. Natural Gas Provides Operating Expense and Feedstock Cost Advantages 2Q22 Natural Gas Opex for 2Q21 Natural Gas Opex 1Q22 Natural Gas Opex ($ per barrel) ($ per barrel) U.S. versus European Refineries ($ per barrel) $10.02 $7.14 ~$9.00 per barrel Opex advantage ~$2.00 per barrel Opex advantage $2.69 ~$5.00 per barrel $1.34 Opex advantage $0.91 $80 $70 U.S. Europe U.S. Europe Natural Gas Prices $60 ($ per million Btu) $2.11 $50 Europe U.S. $40 $30 $20 U.S. Europe $10 $0 Apr 21 Jul 21 Oct 21 Jan 22 Apr 22 See slides 23-24 for notes regarding this slide. I N V E S T O R P R E S E N T A T I O N | J U N E 2 0 2 2 29

Crude Supply Advantage in the U.S. Gulf Coast and Mid-Continent Valero U.S. Gulf Coast Feedstock Ranges Local Crude Gathering (2012 through 1Q22) Cushing McKee 54% Diamond Pipeline Memphis Cushing-McKee Connection Collierville Childress Crude System Station Ardmore Hewitt Wasson To Nederland To St. James Wichita Falls 34% 34% Eagle Ford: Harvest Pipeline Colorado City Three Rivers EOG Pipeline Midland Permian: 23% Cactus Pipeline Gray Oak NuStar Local Crude Gathering McCamey Oakville Terminal 17% 17% Taking advantage of Permian crude with 8% investments in 6% Corpus Christi Corpus Christi Heavy Sour Medium / Light Sweet Residuals West and East Sour Cactus Cactus II Valero’s refineries have operational flexibility to Gray Oak process a wide range of feedstocks and access to a NuStar North Beach Crude Export Dock Blue lines and terminals represent EPIC deep pool of skilled labor in the U.S. Gulf Coast Valero ownership interest. Crude Export Tankage I N V E S T O R P R E S E N T A T I O N | J U N E 2 0 2 2 See slides 23-24 for notes regarding this slide. 30

Operational Flexibility and Refinery Optimization Provide Competitive Advantage 2012 – 2022 Refinery Product Yield Ranges (monthly averages) • Our operational flexibility and optimization to VLO Industry quickly shift light product yields as market 59% conditions signal move from “max gasoline” to 40% “max distillate” enables higher margin capture 38% 12% • Demand impacts from COVID-19 drove yields to 51% 11% swing between both extremes within a few months • VLO has demonstrated a wider range of yields for 27% 42% gasoline, kerosene, jet fuel, and diesel versus the 41% 4% industry 23% 2% VLO Industry VLO Industry VLO Industry Finished Gasoline Kerosene / Jet Diesel I N V E S T O R P R E S E N T A T I O N | J U N E 2 0 2 2 Source: Monthly industry refinery yields from EIA through February 2022. 31

Product shortages Competitive Global Light Products Supply in Latin America, Eastern Canada, Europe, and VLO U.S. Product Exports (thousand barrels per day) Africa expected to Gasoline Distillate drive U.S. export 310 demand growth 209 102 2012 2013 2014 2015 2016 2017 2018 2019 2020 2021 Latin America Refining Runs (million barrels per day, % of crude processing capacity) 6.6 7 6.4 100 % 6.3 6.0 6.0 5.9 5.6 6 90% 5.2 4.7 5 4.3 83% 4.1 4.0 80% 80% 80% 80% 79% 3.7 78% 4 72% 70% 3 66% 60% 60% 2 55% 55% 54% 50% 1 50% Distillate 0 40% Gasoline 2009 2010 2011 2012 2013 2014 2015 2016 2017 2018 2019 2020 2021 Source: Industry consultants. See slides 23-24 for notes regarding this slide. Totals may not crossfoot due to rounding. I N V E S T O R P R E S E N T A T I O N | J U N E 2 0 2 2 32
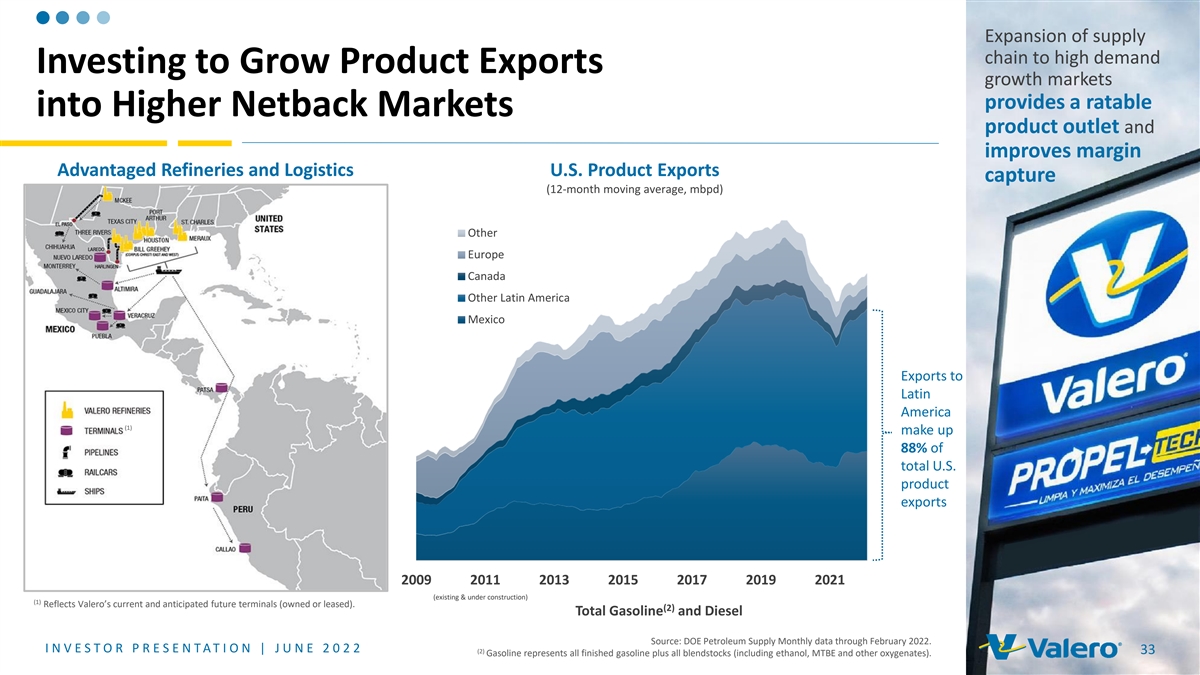
Expansion of supply chain to high demand Investing to Grow Product Exports growth markets provides a ratable into Higher Netback Markets product outlet and improves margin Advantaged Refineries and Logistics U.S. Product Exports capture (12-month moving average, mbpd) Other Europe Canada Other Latin America Mexico Exports to Latin America (1) make up 88% of total U.S. product exports 2009 2011 2013 2015 2017 2019 2021 (existing & under construction) (1) Reflects Valero’s current and anticipated future terminals (owned or leased). (2) Total Gasoline and Diesel Source: DOE Petroleum Supply Monthly data through February 2022. I N V E S T O R P R E S E N T A T I O N | J U N E 2 0 2 2 (2) 33 Gasoline represents all finished gasoline plus all blendstocks (including ethanol, MTBE and other oxygenates).
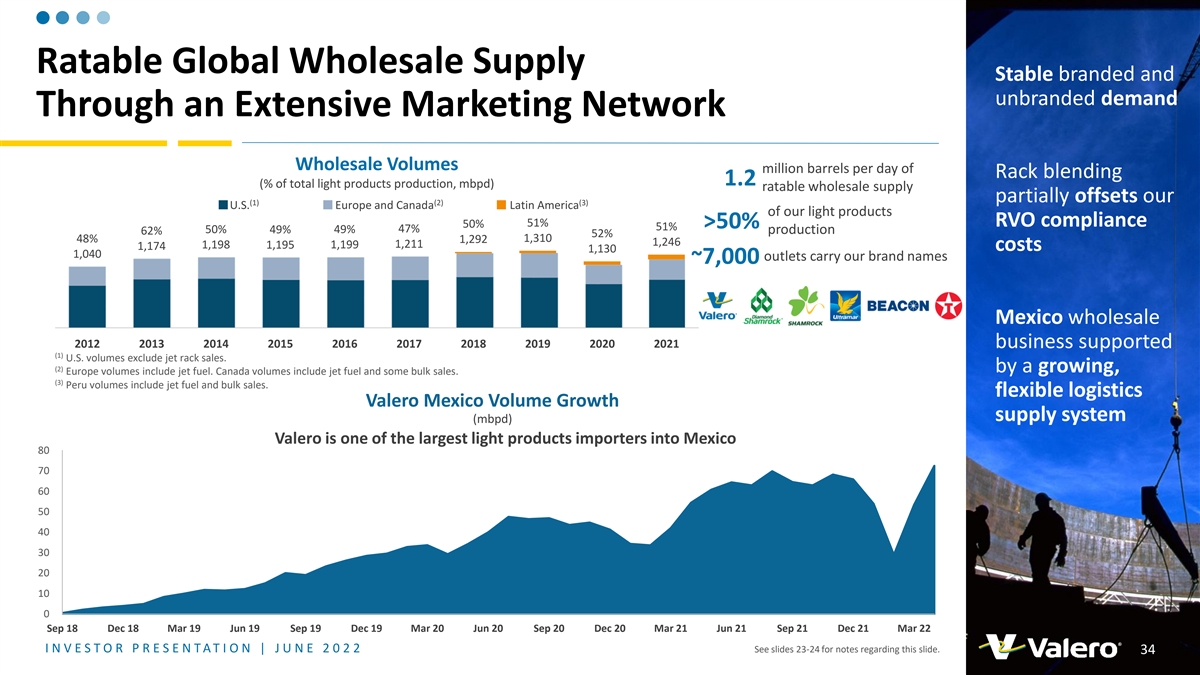
Ratable Global Wholesale Supply Stable branded and unbranded demand Through an Extensive Marketing Network Wholesale Volumes million barrels per day of Rack blending 1.2 (% of total light products production, mbpd) ratable wholesale supply partially offsets our (1) (2) (3) U.S. Europe and Canada Latin America of our light products 51% RVO compliance 50% >50% 51% 47% 50% 49% 49% production 62% 52% 48% 1,310 1,292 1,246 1,211 1,198 1,195 1,199 1,174 costs 1,130 1,040 outlets carry our brand names ~7,000 Mexico wholesale 2012 2013 2014 2015 2016 2017 2018 2019 2020 2021 business supported (1) U.S. volumes exclude jet rack sales. (2) by a growing, Europe volumes include jet fuel. Canada volumes include jet fuel and some bulk sales. (3) Peru volumes include jet fuel and bulk sales. flexible logistics Valero Mexico Volume Growth supply system (mbpd) Valero is one of the largest light products importers into Mexico 80 70 60 50 40 30 20 10 0 Sep 18 Dec 18 Mar 19 Jun 19 Sep 19 Dec 19 Mar 20 Jun 20 Sep 20 Dec 20 Mar 21 Jun 21 Sep 21 Dec 21 Mar 22 I N V E S T O R P R E S E N T A T I O N | J U N E 2 0 2 2 See slides 23-24 for notes regarding this slide. 34

(1) (1) (1) Pipelines Racks, Terminals and Storage Rail Marine Valero’s Logistics Assets • Over 3,000 miles of active • Over 130 million barrels of • Approximately 5,200 railcars• Over 50 docks pipelines active shell capacity for crude oil and products • Expected to serve long-term • Two Panamax class vessels • Central Texas Pipeline started needs of ethanol, asphalt, (joint venture) up in 2019 • Over 200 truck rack bays aromatics, and other products • Sunrise Pipeline expansion • Pasadena terminal completed started up in 2018 in 2020 (1) I N V E S T O R P R E S E N T A T I O N | J U N E 2 0 2 2 Includes assets that have other joint venture or minority interests. Does not include ethanol assets. 35

Operations Outlook • 12 plants with 1.6 billion gallons annual • Ethanol will remain a significant part of the Ethanol production capacity domestic fuel mix – Dry mill production process, where corn is • Efficiency standards will drive demand for ground into flour and mixed with water U.S. Fuel Ethanol Exports higher octane fuels, such as 95 RON, resulting before fermentation (mbpd) in incremental ethanol demand – Efficient plants with scale, located in the Rest of Industry Valero 112 • Global renewable fuel mandates should drive corn belt 104 96 91 88 25 export growth 82 – Operational best practices transferred from 25 76 20 19 24 21 refining 13 55 54 • Executing carbon sequestration projects 87– 45Q Tax Credit provides economic incentive 79 77 • Cost advantaged versus the industry 72 64 64 61 53 51 – LCFS provides higher value for the lower carbon intensity ethanol 2014 2015 2016 2017 2018 2019 2020 2021 2022 I N V E S T O R P R E S E N T A T I O N | J U N E 2 0 2 2 Source: U.S. Energy Information Agency (EIA) through February 2022, U.S. Census Bureau for March 2022. 36

Port Arthur Delayed Coker Unit Investing to Improve Margins and Light Product Yields Port Arthur Coker • $975 MM anticipated cost for 55 MBPD delayed Incremental Volumes (MBPD) coker and sulfur recovery unit, with expected Feeds startup in the first half of 2023 Crude 102 • Creates two independent CDU-VDU-coker trains, which should improve turnaround efficiency and Resid 21 reduce maintenance-related lost margin VGO (47) opportunity Products • Design enables full utilization of existing CDU capacity, reduces VGO purchases, and increases Naphtha 3 heavy sour crude and resid processing capability Gasoline 15 and light products yield Diesel 43 • Estimated $420 MM annual EBITDA contribution at 2018 average prices ($325 MM at mid-cycle prices) LPG 4 See slides 23-24 for notes regarding this slide. I N V E S T O R P R E S E N T A T I O N | J U N E 2 0 2 2 37

Houston Alkylation Unit Investing to Upgrade Product Value Houston and St. Charles Alkylation Units • Octane demand expected to grow due to Tier 3 sulfur regulations and CAFE standards • Abundant, low cost North American NGL supply provides advantage for Gulf Coast capacity additions • Both units upgrade low value isobutane and amylenes into high value alkylate – High octane, low vapor pressure component enables the blending of incremental butane and low octane naphtha 13 17 Capacity at Houston refinery Capacity at St. Charles refinery started up in 2019 started up in 2020 MBPD MBPD I N V E S T O R P R E S E N T A T I O N | J U N E 2 0 2 2 38

Investing to Improve Access to North American Crude and Lower Refinery Operating Cost Structure GROWTH PROJECTS FOCUSED ON OPTIMIZATION AND MARGIN CAPTURE Completed Diamond Pipeline project with 200 MBPD capacity connecting Improves crude oil supply Provides additional Mid-Continent Memphis to Cushing and flexibility, efficiency and crude access to our McKee, Diamond and Sunrise Pipelines Sunrise Pipeline 100 MBPD blend quality Ardmore and Memphis refineries undivided interest connecting Midland to Wichita Falls Diamond Pipeline Red River Pipeline 74 MBPD Provides additional Mid-Continent crude flexibility to the undivided interest connecting Ardmore refinery Ardmore to Cushing Navigator Glass Mountain Reversal and extension in service 2021 Pipeline Connection with 50 Provides Mid-Continent crude flexibility and security of supply to the MBPD capacity connecting McKee refinery McKee to Cushing Cogeneration Plants GROWTH PROJECTS FOCUSED ON COST CONTROL AND MARGIN EXPANSION Wilmington cogeneration Pembroke cogeneration unit Expect to reduce costs and unit started up in 2017 (£130 MM or $170 MM cost) improve supply reliability Wilmington Cogeneration Plant started up in 2021 for power and steam I N V E S T O R P R E S E N T A T I O N | J U N E 2 0 2 2 39

Investing to Supply Higher Demand Markets and Expand Product Export and Biofuels Blending Capabilities Central Texas pipelines and terminals to supply high-growth refined products market Extending • Started up in 2019 product (1) • Approximately 205 miles of pipe , 960,000 barrels of total storage capacity and a truck rack supply chain Pasadena refined products terminal joint venture in Central • Completed in 2020 Texas and • 5 MM barrels of storage capacity with butane the U.S. blending, two ship docks and a three-bay truck rack Gulf Coast Projects expected to improve product margins, reduce secondary costs, provide opportunity for third-party revenues, and increase capability for biofuels blending (1) Valero owns ~70 mile pipeline from Hearne to Williamson County and 40% Pasadena Terminal undivided interest in 135 mile pipeline from Houston to Hearne. I N V E S T O R P R E S E N T A T I O N | J U N E 2 0 2 2 40

Majority of refineries designated as VPP Star Sites by OSHA, recognizing Our Refining Capacity and Nelson exemplary occupational safety, Complexity process safety and health programs (1) Capacities (mbpd) Nelson Complexity Refinery Throughput Crude Index (2) Corpus Christi 370 290 14.4 Houston 255 205 8.0 Meraux 135 125 9.7 Port Arthur 395 335 12.7 St. Charles 340 215 17.4 Texas City 260 225 11.1 Three Rivers 100 89 13.2 (3) U.S. Gulf Coast 1,855 1,484 12.6 Ardmore 90 86 12.1 McKee 200 195 8.3 Memphis 195 180 7.9 (3) U.S. Mid-Continent 485 461 8.9 Pembroke 270 210 10.1 Quebec City 235 230 7.7 (3) North Atlantic 505 440 8.8 Benicia 170 145 16.1 Wilmington 135 85 15.8 (3) U.S. West Coast 305 230 16.0 (3) Total 3,150 2,615 11.6 (1) Capacities and Nelson complexity indices as of December 31, 2021. (2) Represents the combined capacities of two refineries—Corpus Christi East and Corpus Christi West. (3) Weighted average. I N V E S T O R P R E S E N T A T I O N | J U N E 2 0 2 2 41
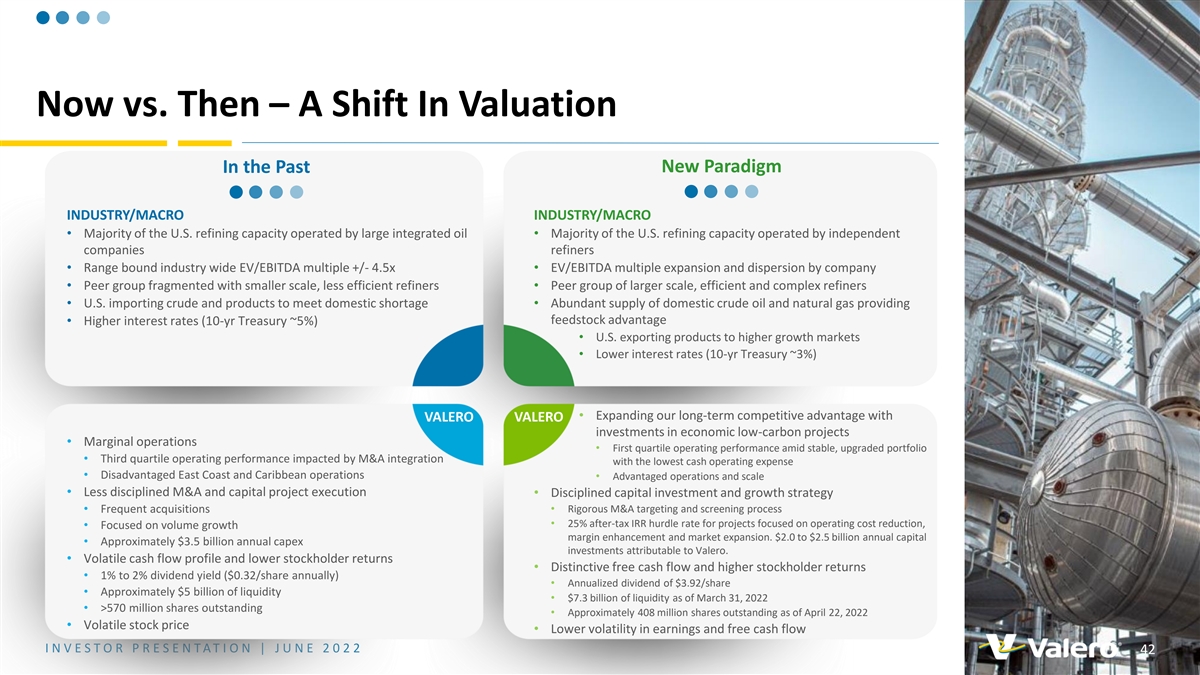
Now vs. Then – A Shift In Valuation In the Past New Paradigm INDUSTRY/MACRO INDUSTRY/MACRO • Majority of the U.S. refining capacity operated by large integrated oil • Majority of the U.S. refining capacity operated by independent companies refiners • Range bound industry wide EV/EBITDA multiple +/- 4.5x• EV/EBITDA multiple expansion and dispersion by company • Peer group fragmented with smaller scale, less efficient refiners• Peer group of larger scale, efficient and complex refiners • U.S. importing crude and products to meet domestic shortage• Abundant supply of domestic crude oil and natural gas providing feedstock advantage • Higher interest rates (10-yr Treasury ~5%) • U.S. exporting products to higher growth markets • Lower interest rates (10-yr Treasury ~3%) • Expanding our long-term competitive advantage with VALERO VALERO investments in economic low-carbon projects • Marginal operations • First quartile operating performance amid stable, upgraded portfolio • Third quartile operating performance impacted by M&A integration with the lowest cash operating expense • Disadvantaged East Coast and Caribbean operations • Advantaged operations and scale • Less disciplined M&A and capital project execution • Disciplined capital investment and growth strategy • Frequent acquisitions• Rigorous M&A targeting and screening process • 25% after-tax IRR hurdle rate for projects focused on operating cost reduction, • Focused on volume growth margin enhancement and market expansion. $2.0 to $2.5 billion annual capital • Approximately $3.5 billion annual capex investments attributable to Valero. • Volatile cash flow profile and lower stockholder returns • Distinctive free cash flow and higher stockholder returns • 1% to 2% dividend yield ($0.32/share annually) • Annualized dividend of $3.92/share • Approximately $5 billion of liquidity • $7.3 billion of liquidity as of March 31, 2022 • >570 million shares outstanding • Approximately 408 million shares outstanding as of April 22, 2022 • Volatile stock price • Lower volatility in earnings and free cash flow I N V E S T O R P R E S E N T A T I O N | J U N E 2 0 2 2 42
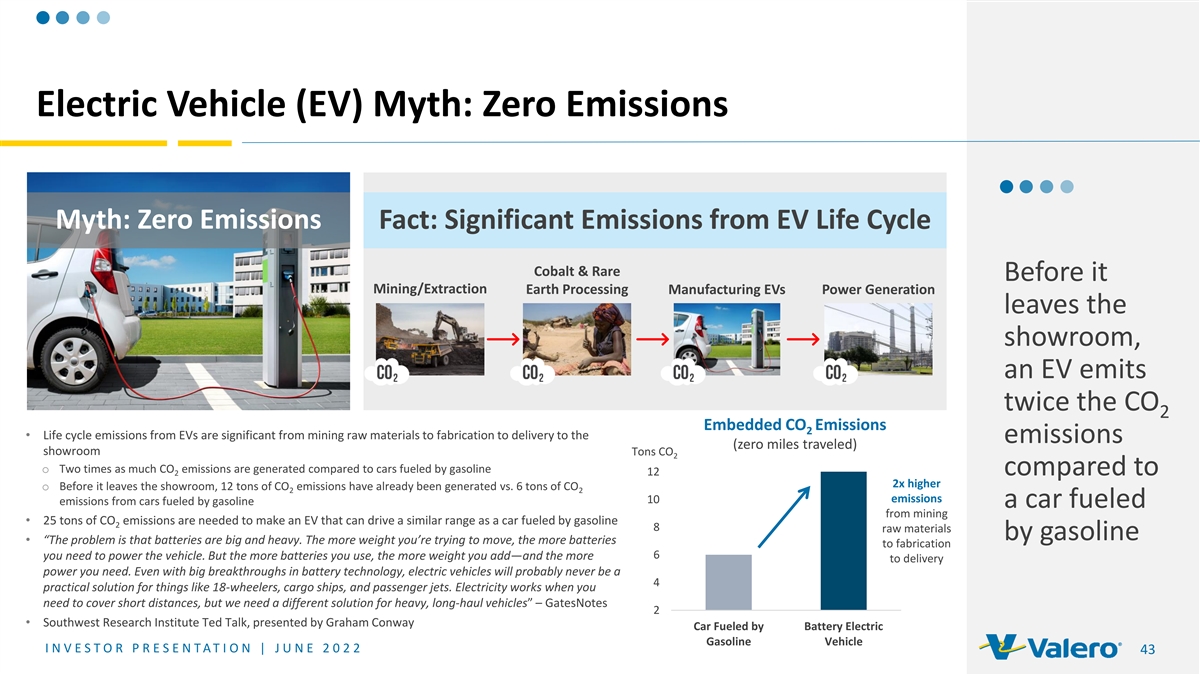
Electric Vehicle (EV) Myth: Zero Emissions Myth: Zero Emissions Fact: Significant Emissions from EV Life Cycle Cobalt & Rare Before it Mining/Extraction Earth Processing Manufacturing EVs Power Generation leaves the showroom, an EV emits twice the CO 2 Embedded CO Emissions 2 • Life cycle emissions from EVs are significant from mining raw materials to fabrication to delivery to the emissions (zero miles traveled) showroom Tons CO 2 o Two times as much CO emissions are generated compared to cars fueled by gasoline compared to 2 12 2x higher o Before it leaves the showroom, 12 tons of CO emissions have already been generated vs. 6 tons of CO 2 2 emissions 10 emissions from cars fueled by gasoline a car fueled from mining • 25 tons of CO emissions are needed to make an EV that can drive a similar range as a car fueled by gasoline 2 8 raw materials by gasoline • “The problem is that batteries are big and heavy. The more weight you’re trying to move, the more batteries to fabrication 6 you need to power the vehicle. But the more batteries you use, the more weight you add—and the more to delivery power you need. Even with big breakthroughs in battery technology, electric vehicles will probably never be a 4 practical solution for things like 18-wheelers, cargo ships, and passenger jets. Electricity works when you need to cover short distances, but we need a different solution for heavy, long-haul vehicles” – GatesNotes 2 • Southwest Research Institute Ted Talk, presented by Graham Conway Car Fueled by Battery Electric Gasoline Vehicle I N V E S T O R P R E S E N T A T I O N | J U N E 2 0 2 2 43
Non-GAAP Disclosures Return on Invested Capital (ROIC) VLO defines return on invested capital (ROIC) as adjusted net income (loss) attributable to VLO before adjusted net interest expense after-tax divided by average invested capital. VLO defines adjusted net income attributable to VLO as net income (loss) attributable to VLO stockholders adjusted to reflect the after-tax effect of special items that VLO believes are not indicative of its core operating performance and that may obscure VLO’s underlying business results and trends. VLO defines adjusted net interest expense as “interest and debt expense, net of capitalized interest” adjusted to exclude “interest and debt expense, net of capitalized interest” attributable to non-controlling interests. The income tax effect of adjusted net interest expense is estimated based on the U.S. statutory income tax rate for the respective annual period. Average invested capital is defined as the average of total invested capital for the current annual period and total invested capital for the prior annual period. VLO defines total invested capital as debt attributable to VLO plus VLO stockholders’ equity less cash and cash equivalents. Debt attributable to VLO is defined as the current portion of debt and finance lease obligations, plus “debt and finance lease obligations, less current portion”, less debt attributable to non-controlling interests. Debt attributable to VLO for the year ended December 31, 2014 includes an adjustment to reflect the retrospective adoption of ASU No. 2015-15 subtopic 835-30, which resulted in the reclassification of certain debt issuance costs from “deferred charges and other assets, net” to “debt and finance lease obligations, less current portion.” Adjusted EBITDA VLO defines EBITDA as net income (loss) before depreciation and amortization expense, “interest and debt expense, net of capitalized interest”, income tax expense (benefit), and income (loss) from discontinued operations. VLO defines adjusted EBITDA as EBITDA further adjusted to reflect the effect of special items that VLO believes are not indicative of its core operating performance and that may obscure VLO’s underlying business results and trends. VLO believes that the presentation of adjusted EBITDA provides useful information to investors to assess its ongoing financial performance because when reconciled to net income, it provides improved comparability between periods. The U.S. GAAP measures most directly comparable to adjusted EBITDA are net income and net cash provided by operating activities. Renewable Diesel Net Cumulative Cash Flow VLO defines renewable diesel net cumulative cash flow as DGD’s cumulative adjusted EBITDA attributable to VLO, less DGD’s cumulative capital expenditures attributable to VLO. VLO defines DGD’s adjusted EBITDA attributable to VLO as fifty percent (VLO’s ownership interest) of DGD’s operating income (loss) plus depreciation and amortization expense, and adjusted for 2017-2019 blender’s tax credit (BTC). VLO defines DGD’s capital expenditures attributable to VLO as fifty percent of DGD’s capital investments. Because DGD’s net cash flow is effectively attributable to each joint venture member, only 50 percent of DGD’s EBITDA and capital expenditures should be attributed to VLO’s renewable diesel cash flow. Therefore, renewable diesel cash flow has been adjusted for the portion of DGD’s EBITDA and capital expenditures attributable to VLO’s joint venture member’s ownership interest because VLO believes that it more accurately reflects cash flow generated by its renewable diesel segment. I N V E S T O R P R E S E N T A T I O N | J U N E 2 0 2 2 44

Non-GAAP Disclosures Renewable Diesel Adjusted EBITDA per Gallon Renewable diesel adjusted EBITDA is defined as DGD’s operating income adjusted to reflect the blender’s tax credit and excluding depreciation and amortization expense. Operating income is adjusted to reflect the blender’s tax credit in the proper period. The blender’s tax benefit recognized in 2019 is attributable to volumes blended during 2019 and 2018 and was recognized in December 2019 because the U.S legislation authorizing the credit was passed and signed into law in that month. The benefit recognized in 2018 is attributable to volumes blended during 2017 and was recognized in February 2018 because the U.S. legislation authorizing the credit was passed and signed into law in that month. VLO believes adjusting for these items provides improved comparability between periods. Renewable diesel EBITDA per gallon is renewable diesel adjusted EBITDA divided by DGD’s renewable diesel sales volume for the period. Sales volumes are calculated by multiplying sales volumes per day by the number of days in the applicable period. Free Cash Flow VLO defines free cash flow as net cash provided by operating activities less capital expenditures of VLO and DGD, deferred turnaround and catalyst cost expenditures, investments in joint ventures, and changes in current assets and liabilities. VLO believes that the presentation of free cash flow provides useful information to investors in assessing VLO’s ability to cover ongoing costs and VLO’s ability to generate cash returns to stockholders. The GAAP measures most directly comparable to free cash flow are net cash provided by operating activities and net cash used in investing activities. Adjusted Net Cash Provided by Operating Activities Defined as net cash provided by operating activities excluding the items noted below. VLO believes adjusted net cash provided by operating activities is an important measure of its ongoing financial performance to better assess its ability to generate cash to fund VLO’s investing and financing activities. The basis for VLO’s belief with respect to each excluded item is provided below. • Changes in current assets and current liabilities – Current assets net of current liabilities represents VLO’s operating liquidity. VLO believes that the change in its operating liquidity from period to period does not represent cash generated by VLO’s operations that is available to fund VLO’s investing and financing activities. • DGD’s adjusted net cash provided by operating activities attributable to the other joint venture member’s ownership interest in DGD – VLO is a 50/50 joint venture member in DGD and consolidates DGD’s financial statements; as a result, all of DGD’s net cash provided by operating activities (or operating cash flow) is included in VLO’s consolidated net cash provided by operating activities. DGD’s members use DGD’s operating cash flow (excluding changes in its current assets and current liabilities) to fund its capital investments rather than distribute all of that cash to themselves. Nevertheless, DGD’s operating cash flow is effectively attributable to each member and only 50 percent of DGD’s operating cash flow should be attributed to VLO’s net cash provided by operating activities. Therefore, net cash provided by operating activities has been adjusted for the portion of DGD’s operating cash flow attributable to the other joint venture member’s ownership interest because VLO believes that it more accurately reflects the operating cash flow available to VLO to fund VLO’s investing and financing activities. I N V E S T O R P R E S E N T A T I O N | J U N E 2 0 2 2 45
Non-GAAP Disclosures Capital Investments Attributable to Valero VLO defines capital investments attributable to Valero as all capital expenditures, deferred turnaround and catalyst cost expenditures, and investments in non-consolidated joint ventures presented in VLO’s consolidated statements of cash flows excluding the portion of DGD’s capital investments attributable to the other joint venture member and all of the capital expenditures of other VIEs. Capital investments attributable to Valero are allocated between sustaining capital expenditures attributable to Valero and growth capital investments attributable to Valero. DGD’s members use DGD’s operating cash flow (excluding changes in its current assets and current liabilities) to fund its capital investments rather than distribute all of that cash to themselves. Because DGD’s operating cash flow is effectively attributable to each member, only 50 percent of DGD’s capital investments should be attributed to VLO’s net share of capital investments. VLO also excludes the capital expenditures of other consolidated VIEs because VLO does not operate those VIEs. VLO believes that capital investments attributable to Valero is an important measure because it more accurately reflects capital investments of VLO. I N V E S T O R P R E S E N T A T I O N | J U N E 2 0 2 2 46
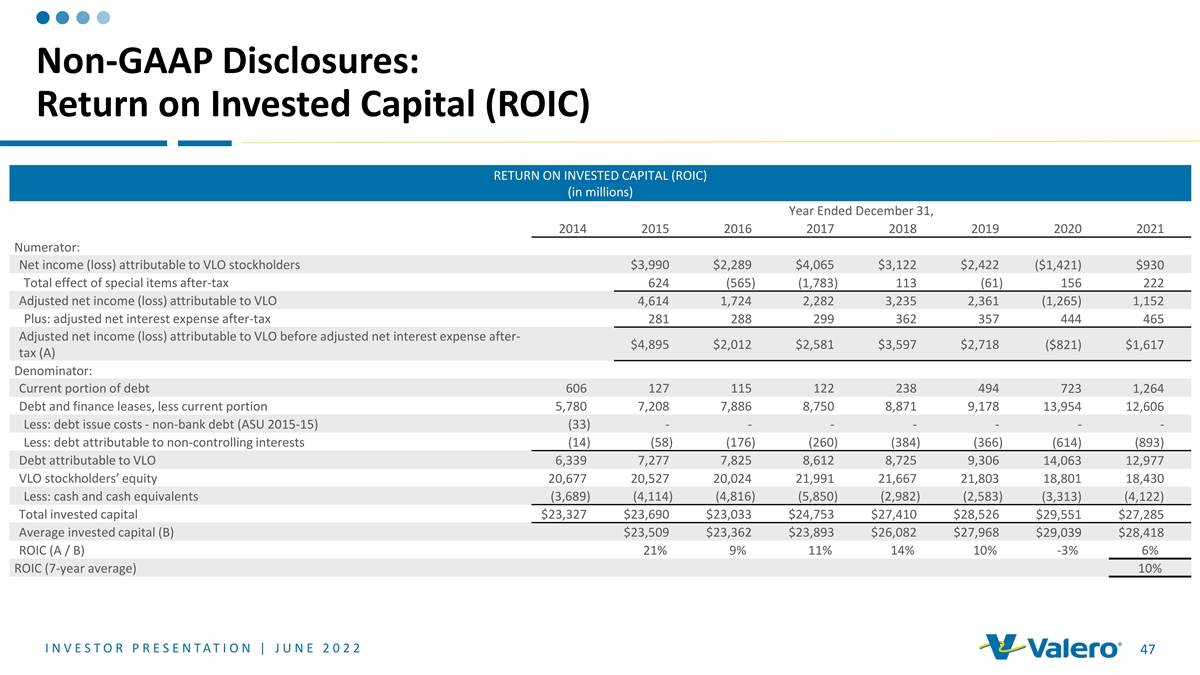
Non-GAAP Disclosures: Return on Invested Capital (ROIC) RETURN ON INVESTED CAPITAL (ROIC) (in millions) Year Ended December 31, 2014 2015 2016 2017 2018 2019 2020 2021 Numerator: Net income (loss) attributable to VLO stockholders $3,990 $2,289 $4,065 $3,122 $2,422 ($1,421) $930 Total effect of special items after-tax 624 (565) (1,783) 113 (61) 156 222 Adjusted net income (loss) attributable to VLO 4,614 1,724 2,282 3,235 2,361 (1,265) 1,152 Plus: adjusted net interest expense after-tax 281 288 299 362 357 444 465 Adjusted net income (loss) attributable to VLO before adjusted net interest expense after- $4,895 $2,012 $2,581 $3,597 $2,718 ($821) $1,617 tax (A) Denominator: Current portion of debt 606 127 115 122 238 494 723 1,264 Debt and finance leases, less current portion 5,780 7,208 7,886 8,750 8,871 9,178 13,954 12,606 Less: debt issue costs - non-bank debt (ASU 2015-15) (33) - - - - - - - Less: debt attributable to non-controlling interests (14) (58) (176) (260) (384) (366) (614) (893) Debt attributable to VLO 6,339 7,277 7,825 8,612 8,725 9,306 14,063 12,977 VLO stockholders’ equity 20,677 20,527 20,024 21,991 21,667 21,803 18,801 18,430 Less: cash and cash equivalents (3,689) (4,114) (4,816) (5,850) (2,982) (2,583) (3,313) (4,122) Total invested capital $23,327 $23,690 $23,033 $24,753 $27,410 $28,526 $29,551 $27,285 Average invested capital (B) $23,509 $23,362 $23,893 $26,082 $27,968 $29,039 $28,418 ROIC (A / B) 21% 9% 11% 14% 10% -3% 6% ROIC (7-year average) 10% I N V E S T O R P R E S E N T A T I O N | J U N E 2 0 2 2 47

Non-GAAP Disclosures: Adjusted EBITDA RECONCILIATION OF NET INCOME (LOSS) TO ADJUSTED EBITDA (in millions) Year Ended December 31, 2009 2012 2013 2014 2015 2016 2017 2018 2019 2020 2021 Net income (loss) ($1,982) $2,080 $2,728 $3,711 $4,101 $2,417 $4,156 $3,353 $2,784 ($1,107) $1,288 1,361 1,549 1,720 1,690 1,842 1,894 1,986 2,069 2,255 2,351 2,405 Plus: Depreciation and amortization expense Plus: Interest and debt expense, net of capitalized interest 416 314 365 397 433 446 468 470 454 563 603 (43) 1,626 1,254 1,777 1,870 765 (949) 879 702 (903) 255 Plus: Income tax expense (benefit) Less: Income (loss) from discontinued operations (1,709) (1,034) 6 (64) - - - - - - - EBITDA $1,461 $6,603 $6,061 $7,639 $8,246 $5,522 $5,661 $6,771 $6,195 $904 $4,551 Adjustments: Aruba (discontinued operations) 64 - - - - - - - - - - 222 86 - - - 56 - - - - 24 Asset impairment losses Blender's tax credits - - - - - - 170 (12) (158) - - Environmental reserve adjustments - - - - - - - 108 - - - Gain on disposition of retained interest in CST Brands, Inc. - - (325) - - - - - - - - LCM inventory valuation adjustment (gain) loss - - - - 790 (747) - - - (19) - - - - (233) - - - - - 224 - LIFO liquidation adjustment (gain) loss Loss on early redemption and retirement of debt - - - - - - - 38 22 - 193 Texas City Refinery fire expenses - - - - - - - 17 - - - Gain on sale of MVP interest - - - - - - - - - - (62) EBITDA attributable to noncontrolling interest - 3 (8) (108) (144) (171) (218) (283) (313) (331) (449) $1,747 $6,692 $5,728 $7,298 $8,892 $4,660 $5,613 $6,639 $5,746 $778 $4,257 Adjusted EBITDA attributable to VLO stockholders Total Adjusted EBITDA attributable to VLO stockholders, 2012-2019 $51,268 Number of Years, 2012-2019 8 Average Adjusted EBITDA attributable to VLO stockholders, 2012-2019 $6,409 I N V E S T O R P R E S E N T A T I O N | J U N E 2 0 2 2 48

Non-GAAP Disclosures: Renewable Diesel Net Cumulative Cash Flow RECONCILIATION OF DGD OPERATING INCOME AND TOTAL CAPITAL INVESTMENTS TO DGD’S NET CUMULATIVE CASH FLOW ATTRIBUTABLE TO VALERO (in millions) Year Ended December 31, 2011 2012 2013 2014 2015 2016 2017 2018 2019 2020 2021 DGD's cumulative adjusted EBITDA attributable to VLO: Operating income (loss) ($5) $24 $145 $157 $147 $57 $319 $728 $630 $709 Plus: depreciation and amortization expense - 9 18 20 28 29 29 51 45 58 EBITDA ($5) $33 $163 $177 $175 $86 $348 $779 $675 $767 Adjustments: BTC adjustments (2018-2019) - - - - - - 156 (156) - - BTC adjustments (2017-2018) - - - - - 160 (160) - - - DGD adjusted EBITDA (5) 33 163 177 175 246 344 623 675 767 Our ownership interest 50% 50% 50% 50% 50% 50% 50% 50% 50% 50% DGD's adjusted EBITDA attributable to VLO (3) 17 82 89 88 123 172 312 338 384 DGD's cumulative adjusted EBITDA attributable to VLO (A) ($3) $14 $96 $185 $273 $396 $568 $880 $1,218 $1,602 DGD’s cumulative capital investments attributable to VLO: Total DGD #1 Capital Investment 106 210 74 14 2 34 88 170 24 31 35 Total DGD #2 Capital Investment - - - - - - - 22 136 481 411 Total DGD #3 Capital Investment - - - - - - - - - 36 602 Total DGD Capital Investments 106 210 74 14 2 34 88 192 160 548 1,048 Our ownership interest 50% 50% 50% 50% 50% 50% 50% 50% 50% 50% 50% 53 105 37 7 1 17 44 96 80 274 DGD’s capital investments attributable to VLO 524 $53 $158 $195 $202 $203 $220 $264 $360 $440 $714 DGD’s cumulative capital investments attributable to VLO (B) $1,238 ($53) ($161) ($181) ($106) ($18) $53 $132 $208 $440 $504 DGD’s net cumulative cash flow attributable to VLO (A-B) $364 I N V E S T O R P R E S E N T A T I O N | J U N E 2 0 2 2 49
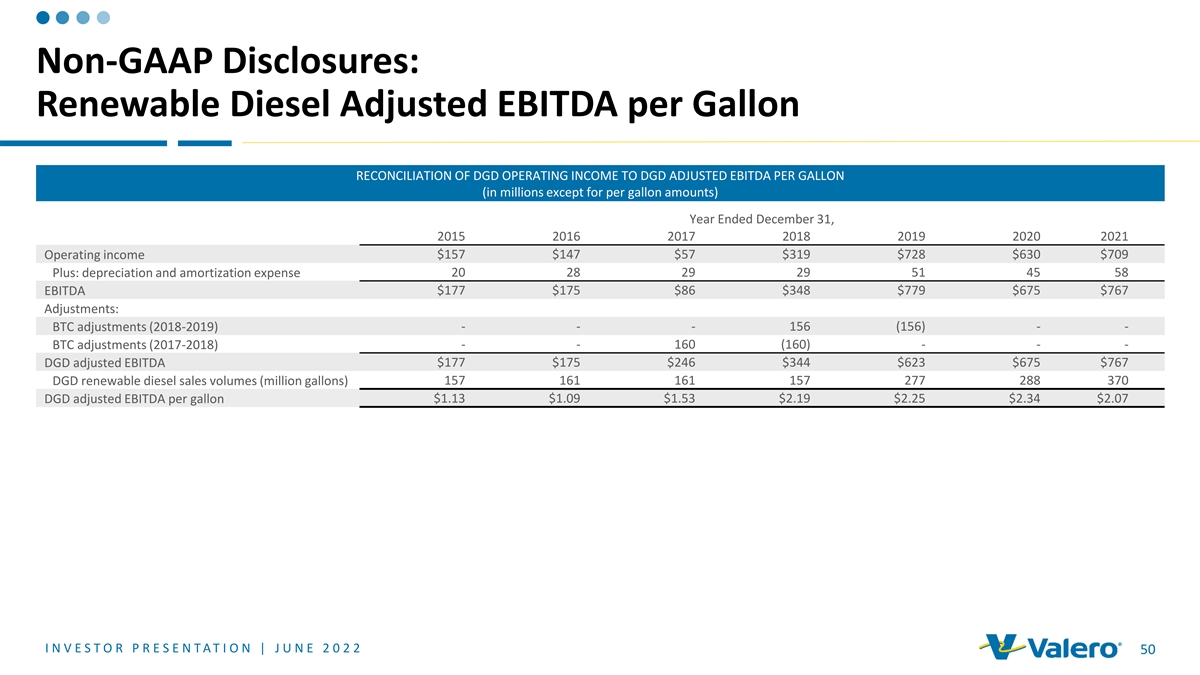
Non-GAAP Disclosures: Renewable Diesel Adjusted EBITDA per Gallon RECONCILIATION OF DGD OPERATING INCOME TO DGD ADJUSTED EBITDA PER GALLON (in millions except for per gallon amounts) Year Ended December 31, 2015 2016 2017 2018 2019 2020 2021 Operating income $157 $147 $57 $319 $728 $630 $709 20 28 29 29 51 45 58 Plus: depreciation and amortization expense EBITDA $177 $175 $86 $348 $779 $675 $767 Adjustments: BTC adjustments (2018-2019) - - - 156 (156) - - BTC adjustments (2017-2018) - - 160 (160) - - - $177 $175 $246 $344 $623 $675 $767 DGD adjusted EBITDA DGD renewable diesel sales volumes (million gallons) 157 161 161 157 277 288 370 $1.13 $1.09 $1.53 $2.19 $2.25 $2.34 $2.07 DGD adjusted EBITDA per gallon I N V E S T O R P R E S E N T A T I O N | J U N E 2 0 2 2 50
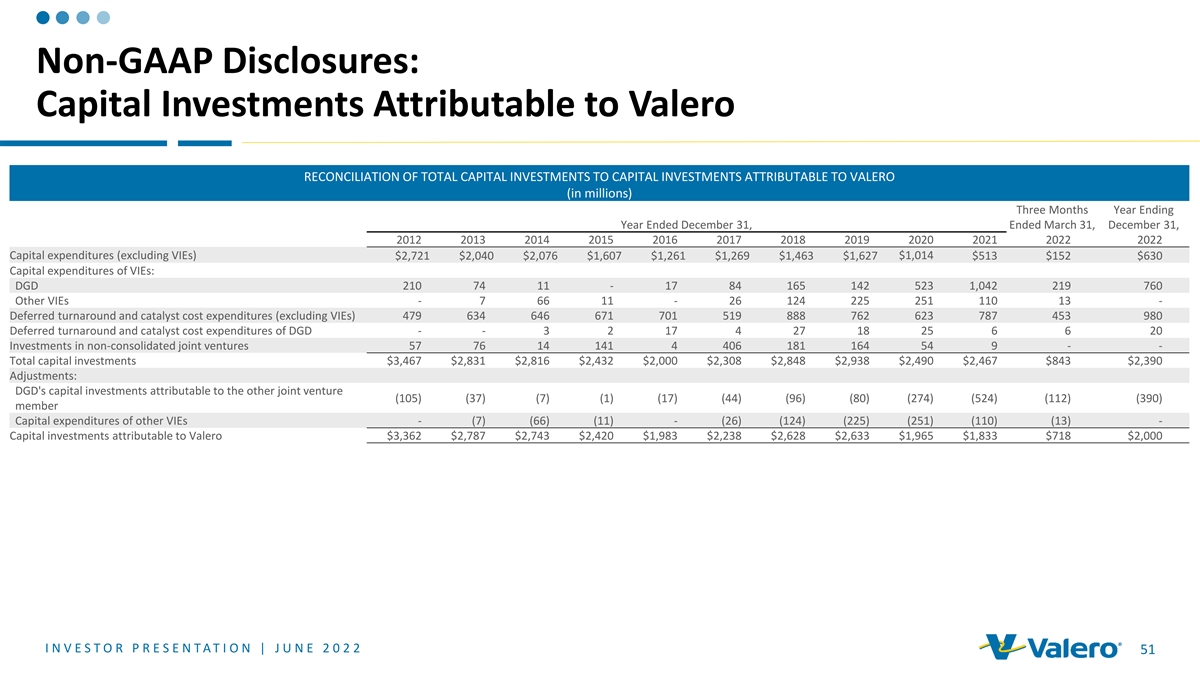
Non-GAAP Disclosures: Capital Investments Attributable to Valero RECONCILIATION OF TOTAL CAPITAL INVESTMENTS TO CAPITAL INVESTMENTS ATTRIBUTABLE TO VALERO (in millions) Three Months Year Ending Year Ended December 31, Ended March 31, December 31, 2012 2013 2014 2015 2016 2017 2018 2019 2020 2021 2022 2022 Capital expenditures (excluding VIEs) $1,014 $2,721 $2,040 $2,076 $1,607 $1,261 $1,269 $1,463 $1,627 $513 $152 $630 Capital expenditures of VIEs: DGD 210 74 11 - 17 84 165 142 523 1,042 219 760 Other VIEs - 7 66 11 - 26 124 225 251 110 13 - Deferred turnaround and catalyst cost expenditures (excluding VIEs) 479 634 646 671 701 519 888 762 623 787 453 980 Deferred turnaround and catalyst cost expenditures of DGD - - 3 2 17 4 27 18 25 6 6 20 Investments in non-consolidated joint ventures 57 76 14 141 4 406 181 164 54 9 - - Total capital investments $3,467 $2,831 $2,816 $2,432 $2,000 $2,308 $2,848 $2,938 $2,490 $2,467 $843 $2,390 Adjustments: DGD's capital investments attributable to the other joint venture (105) (37) (7) (1) (17) (44) (96) (80) (274) (524) (112) (390) member Capital expenditures of other VIEs - (7) (66) (11) - (26) (124) (225) (251) (110) (13) - Capital investments attributable to Valero $3,362 $2,787 $2,743 $2,420 $1,983 $2,238 $2,628 $2,633 $1,965 $1,833 $718 $2,000 I N V E S T O R P R E S E N T A T I O N | J U N E 2 0 2 2 51

Non-GAAP Disclosures: Sustaining Capex and Growth Capital Investments Attributable to Valero RECONCILIATION OF TOTAL SUSTAINING CAPITAL EXPENDITURES AND GROWTH CAPITAL INVESTMENTS TO SUSTAINING CAPITAL EXPENDITURES AND GROWTH CAPITAL INVESTMENTS ATTRIBUTABLE TO VALERO (in millions) Three Months Year Ending Year Ended December 31, Ended March 31, December 31, 2021 2022 2012 2013 2014 2015 2016 2017 2018 2019 2020 2022 Sustaining Capital Expenditures Attributable to Valero: Sustaining capital expenditures (excluding VIEs) $1,525 $1,413 $1,232 $1,459 $1,418 $1,300 $1,896 $1,693 $1,095 $1,085 $517 $1,260 Sustaining capital expenditures of VIEs: DGD 6 2 10 2 28 13 47 20 31 40 14 30 Other VIEs - - - - - - - - - 4 5 - Total sustaining capital expenditures $1,531 $1,415 $1,242 $1,461 $1,446 $1,313 $1,943 $1,713 $1,126 $1,129 $536 $1,290 Adjustments: DGD's sustaining capital expenditures attributable to the other joint (3) (1) (5) (1) (14) (7) (24) (10) (15) (20) (7) (15) venture member Sustaining capital expenditures of other VIEs - - - - - - - - - (4) (5) - Sustaining capital expenditures attributable to Valero $1,528 $1,414 $1,237 $1,460 $1,432 $1,306 $1,919 $1,703 $1,111 $1,105 $524 $1,275 Growth Capital Investments Attributable to Valero: Growth capital expenditures (excluding VIEs) $1,675 $1,261 $1,490 $819 $544 $488 $455 $696 $542 $215 $88 $350 Growth capital expenditures of VIEs: DGD 204 72 4 - 6 75 145 140 517 1,008 211 750 Other VIEs - 7 66 11 - 26 124 225 251 106 8 - Investments in non-consolidated joint ventures 57 76 14 141 4 406 181 164 54 9 - - Total growth capital investments $1,936 $1,416 $1,574 $971 $554 $995 $905 $1,225 $1,364 $1,338 $307 $1,100 Adjustments: DGD's growth capital expenditures attributable to the other joint (102) (36) (2) - (3) (37) (72) (70) (259) (504) (105) (375) venture member Growth capital expenditures of other VIEs - (7) (66) (11) - (26) (124) (225) (251) (106) (8) - Growth capital investments attributable to Valero $1,834 $1,373 $1,506 $960 $551 $932 $709 $930 $854 $728 $194 $725 Valero’s Growth Capital Attributable to Renewables: DGD’s growth capital expenditures attributable to Valero $375 Ethanol growth capital expenditures 10 Total Valero growth capital attributable to Renewables $385 I N V E S T O R P R E S E N T A T I O N | J U N E 2 0 2 2 52
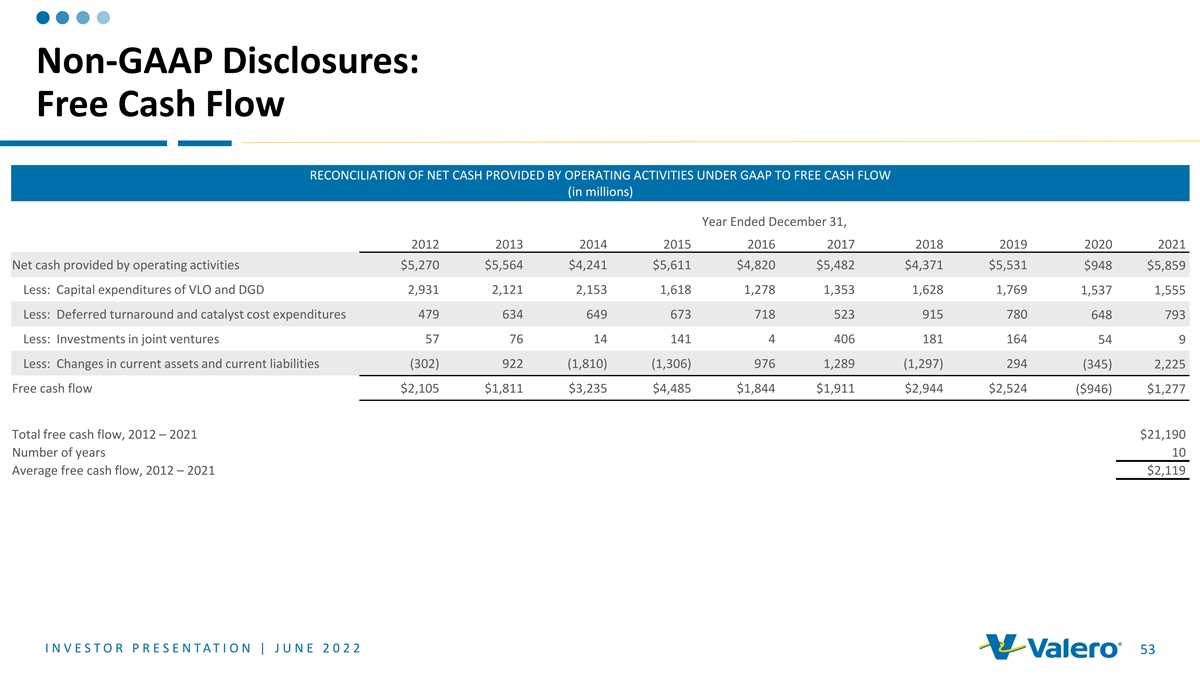
Non-GAAP Disclosures: Free Cash Flow RECONCILIATION OF NET CASH PROVIDED BY OPERATING ACTIVITIES UNDER GAAP TO FREE CASH FLOW (in millions) Year Ended December 31, 2012 2013 2014 2015 2016 2017 2018 2019 2020 2021 Net cash provided by operating activities $5,270 $5,564 $4,241 $5,611 $4,820 $5,482 $4,371 $5,531 $948 $5,859 Less: Capital expenditures of VLO and DGD 2,931 2,121 2,153 1,618 1,278 1,353 1,628 1,769 1,537 1,555 Less: Deferred turnaround and catalyst cost expenditures 479 634 649 673 718 523 915 780 648 793 Less: Investments in joint ventures 57 76 14 141 4 406 181 164 54 9 Less: Changes in current assets and current liabilities (302) 922 (1,810) (1,306) 976 1,289 (1,297) 294 (345) 2,225 Free cash flow $2,105 $1,811 $3,235 $4,485 $1,844 $1,911 $2,944 $2,524 ($946) $1,277 Total free cash flow, 2012 – 2021 $21,190 Number of years 10 Average free cash flow, 2012 – 2021 $2,119 I N V E S T O R P R E S E N T A T I O N | J U N E 2 0 2 2 53
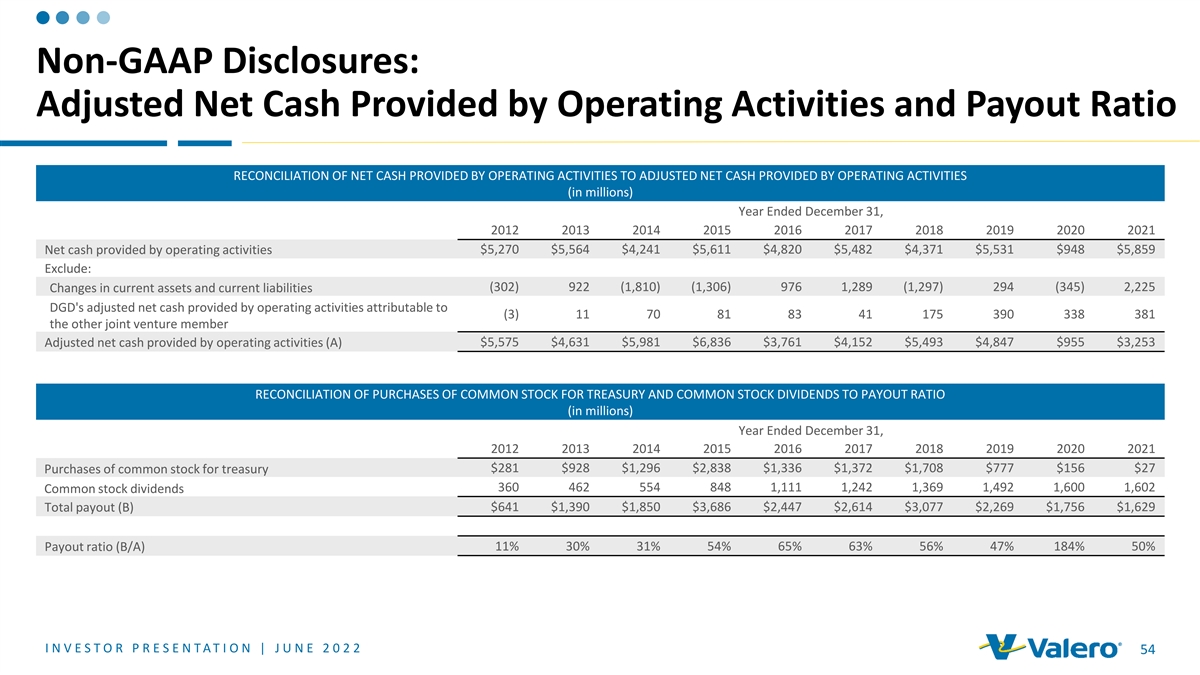
Non-GAAP Disclosures: Adjusted Net Cash Provided by Operating Activities and Payout Ratio RECONCILIATION OF NET CASH PROVIDED BY OPERATING ACTIVITIES TO ADJUSTED NET CASH PROVIDED BY OPERATING ACTIVITIES (in millions) Year Ended December 31, 2012 2013 2014 2015 2016 2017 2018 2019 2020 2021 Net cash provided by operating activities $5,270 $5,564 $4,241 $5,611 $4,820 $5,482 $4,371 $5,531 $948 $5,859 Exclude: (302) 922 (1,810) (1,306) 976 1,289 (1,297) 294 (345) 2,225 Changes in current assets and current liabilities DGD's adjusted net cash provided by operating activities attributable to (3) 11 70 81 83 41 175 390 338 381 the other joint venture member $5,575 $4,631 $5,981 $6,836 $3,761 $4,152 $5,493 $4,847 $955 $3,253 Adjusted net cash provided by operating activities (A) RECONCILIATION OF PURCHASES OF COMMON STOCK FOR TREASURY AND COMMON STOCK DIVIDENDS TO PAYOUT RATIO (in millions) Year Ended December 31, 2012 2013 2014 2015 2016 2017 2018 2019 2020 2021 $281 $928 $1,296 $2,838 $1,336 $1,372 $1,708 $777 $156 $27 Purchases of common stock for treasury 360 462 554 848 1,111 1,242 1,369 1,492 1,600 1,602 Common stock dividends Total payout (B) $641 $1,390 $1,850 $3,686 $2,447 $2,614 $3,077 $2,269 $1,756 $1,629 Payout ratio (B/A) 11% 30% 31% 54% 65% 63% 56% 47% 184% 50% I N V E S T O R P R E S E N T A T I O N | J U N E 2 0 2 2 54

Investor Relations Contacts Our products fuel modern life and make a better future Homer Bhullar Vice President, Investor Relations and Finance possible 210.345.1982 [email protected] Eric Herbort Senior Manager, Investor Relations 210.345.3331 [email protected] Gautam Srivastava Senior Manager, Investor Relations 210.345.3992 [email protected] I N V E S T O R P R E S E N T A T I O N | J U N E 2 0 2 2
Serious News for Serious Traders! Try StreetInsider.com Premium Free!
You May Also Be Interested In
- Valero Energy (VLO) PT Raised to $192 at Citi
- BriaCell Announces Oral and Poster Presentations at ASCO 2024
- Genco Shipping & Trading Limited Mails Letter to Shareholders
Create E-mail Alert Related Categories
SEC FilingsSign up for StreetInsider Free!
Receive full access to all new and archived articles, unlimited portfolio tracking, e-mail alerts, custom newswires and RSS feeds - and more!
