

Form 8-K TripAdvisor, Inc. For: May 06
 Tweet
Tweet Share
ShareExhibit 99.1

Tripadvisor Reports First Quarter 2021 Financial Results
NEEDHAM, MA, May 6, 2021 — Tripadvisor, Inc. (NASDAQ: TRIP) today announced financial results for the first quarter ended March 31, 2021.
“Q1 demonstrated consumers want to get back out there and travel,” said Chief Executive Officer Steve Kaufer. “Traffic and revenue trends improved as vaccination rates climbed, particularly in the U.S. market. While the recovery remains uneven globally, there is light ahead. We think leisure travel is poised for a potential inflection later this year as the recovery broadens.”
Kaufer continued, “We believe we are advantageously positioned for the rebound and beyond. We remain focused on serving customers, leveraging our competitive advantages, and building our business to deliver long-term, diverse growth.”
Chief Financial Officer Ernst Teunissen added, “In Q1, we continued to execute well on factors within our control. We maintained prudent cost discipline, we further fortified our balance sheet, and we leaned into strategic areas with growth potential. We believe we have positioned the business for enhanced operating leverage and long-term shareholder value creation.”
First Quarter 2021 Financial Results
|
|
|
Three months ended March 31, |
|
|
|
|
|
|||||
|
(In millions, except percentages and per share amounts) |
|
2021 |
|
|
2020 |
|
|
% Change |
|
|||
|
Total Revenue |
|
$ |
123 |
|
|
$ |
278 |
|
|
|
(56 |
)% |
|
Hotels, Media & Platform |
|
$ |
88 |
|
|
$ |
169 |
|
|
|
(48 |
)% |
|
Experiences & Dining |
|
$ |
28 |
|
|
$ |
83 |
|
|
|
(66 |
)% |
|
Other |
|
$ |
7 |
|
|
$ |
26 |
|
|
|
(73 |
)% |
|
|
|
|
|
|
|
|
|
|
|
|
|
|
|
GAAP Net Loss |
|
$ |
(80 |
) |
|
$ |
(16 |
) |
|
|
400 |
% |
|
|
|
|
|
|
|
|
|
|
|
|
|
|
|
Total Adjusted EBITDA (1) |
|
$ |
(26 |
) |
|
$ |
40 |
|
|
n.m. |
|
|
|
Hotels, Media & Platform |
|
$ |
(3 |
) |
|
$ |
53 |
|
|
n.m. |
|
|
|
Experiences & Dining |
|
$ |
(24 |
) |
|
$ |
(19 |
) |
|
|
26 |
% |
|
Other |
|
$ |
1 |
|
|
$ |
6 |
|
|
|
(83 |
)% |
|
|
|
|
|
|
|
|
|
|
|
|
|
|
|
Non-GAAP Net Income (Loss) (1) |
|
$ |
(53 |
) |
|
$ |
9 |
|
|
n.m. |
|
|
|
|
|
|
|
|
|
|
|
|
|
|
|
|
|
Diluted Earnings (Loss) per Share: |
|
|
|
|
|
|
|
|
|
|
|
|
|
GAAP |
|
$ |
(0.59 |
) |
|
$ |
(0.12 |
) |
|
|
392 |
% |
|
Non-GAAP (1) |
|
$ |
(0.39 |
) |
|
$ |
0.07 |
|
|
n.m. |
|
|
|
|
|
|
|
|
|
|
|
|
|
|
|
|
|
Cash flow used in operating activities |
|
$ |
(19 |
) |
|
$ |
(70 |
) |
|
|
(73 |
)% |
|
Free cash flow (1) |
|
$ |
(29 |
) |
|
$ |
(90 |
) |
|
|
(68 |
)% |
n.m. = not meaningful
|
(1) |
“Total Adjusted EBITDA”, “Non-GAAP Net Income (Loss)”, “Non-GAAP Diluted Earnings (Loss) per Share”, and “Free cash flow” are non-GAAP measures as defined by the U.S. Securities and Exchange Commission (the “SEC”). Please refer to “Non-GAAP Financial Measures” below for definitions and explanations of these non-GAAP financial measures, as well as tabular reconciliations to the most directly comparable GAAP financial measures. |
|
Consumer demand - January, February, and March 2021 monthly unique users on Tripadvisor-branded websites improved sequentially and were approximately 53%, 56%, and 58%, respectively, of 2019’s comparable period (pre-COVID-19 timeframe), driven by vaccine progress and leisure travel’s improving recovery, particularly in the U.S. We note that U.S. monthly unique users in March 2021 approached nearly 80% of 2019 levels while traffic outside the U.S. was approximately half of 2019 levels for the same period.
1
Revenue - Q1 2021 total revenue of $123 million declined 56% year-over-year and was approximately 33% of 2019’s comparable period (pre-COVID-19 timeframe), which is roughly in line with Q4 2020 performance. Monthly revenue performance improved sequentially throughout the quarter, driven primarily by improved leisure travel demand in the U.S. Improvements were partially offset by more muted recovery trends outside of the U.S., most notably Europe.
Cost performance – Total operating expenses were $207 million, down 32% year-over-year, decreasing in all categories as follows:
|
|
• |
Cost of revenue was $12 million, down 37% year-over-year, due to decreased direct costs from credit card payment and other revenue-related transaction costs in our Experiences & Dining segment in correlation with the reduction in revenue related to the COVID-19 pandemic, and to a lesser extent a decrease in personnel and overhead costs as a result of a reduction in headcount related to our cost-reduction measures across our business in 2020 in response to the COVID-19 pandemic. |
|
|
• |
Selling and marketing costs were $73 million, down 42% year-over-year, primarily due to a decrease in SEM and other online traffic acquisition costs across all our segments and businesses in response to the decline in consumer demand related to the COVID-19 pandemic and a reduction in headcount related to our cost-reduction measures across our business in 2020 in response to the COVID-19 pandemic. |
|
|
• |
Technology and content costs were $55 million, down 20% year-over-year, primarily due to a decrease in personnel and overhead costs as a result of a reduction in headcount driven by cost-reduction measures across our business in 2020 in response to the COVID-19 pandemic. |
|
|
• |
General and administrative costs were $38 million, down 25% year-over-year, primarily due to a reduction in headcount related to our cost-reduction measures across our business in 2020 in response to the COVID-19 pandemic, as well as, a decrease in bad debt expense, certain non-income related taxes, and other third-party professional service costs. |
Profitability - Our consolidated net loss of $80 million was slightly higher in Q1 2021 as compared to Q4 2020, driven by lower income tax benefits in Q1 2021. Our Q1 2021 adjusted EBITDA was negative $26 million, slightly better than Q4 2020 driven by a sequential increase in revenue. The Company continues to expect the majority of its fixed cost savings will persist in 2021 and, as such, the business is positioned for operating leverage as leisure travel demand and revenue improve.
Cash & Liquidity - As of March 31, 2021, Tripadvisor had $674 million of cash and cash equivalents, an increase of $256 million from December 31, 2020, with nearly $500 million in available borrowing capacity under our revolving credit facility.
In March 2021, we completed the sale of $345 million aggregate principal amount of 0.250% per annum convertible senior notes due 2026 (the “2026 Senior Notes”) in a private offering. The Company used a portion of the proceeds from the 2026 Senior Notes to enter into privately negotiated capped call transactions with certain of the initial purchasers of the 2026 Senior Notes and/or their respective affiliates and/or other financial institutions at a cost of approximately $35 million. The Company intends to use the remainder of the net proceeds from this offering for general corporate purposes, which may include partial repayment of our pre-existing debt.
CARES Act Relief
Based on our evaluation of the CARES Act, we qualify for certain employee retention payroll tax credits, the deferral of payroll and other tax payments in the future and certain income tax related provisions, some of which are effective retroactively. Most significantly, the CARES Act allowed us to carry back our U.S. federal net operating loss incurred in 2020, for which we expect to be refunded approximately $48 million during 2021, and benefit from the reduction of tax liabilities in future years.
First Quarter 2021 Revenue by Source
|
|
|
Three months ended March 31, |
|
|
|
|
|
|||||
|
(In millions, except percentages ) |
|
2021 |
|
|
2020 |
|
|
% Change |
|
|||
|
Hotels, Media & Platform |
|
|
|
|
|
|
|
|
|
|
|
|
|
TripAdvisor-branded hotels |
|
$ |
74 |
|
|
$ |
137 |
|
|
|
(46 |
)% |
|
TripAdvisor-branded display and platform |
|
|
14 |
|
|
|
32 |
|
|
|
(56 |
)% |
|
Experiences & Dining |
|
|
28 |
|
|
|
83 |
|
|
|
(66 |
)% |
|
Other |
|
|
7 |
|
|
|
26 |
|
|
|
(73 |
)% |
|
Total Revenue |
|
$ |
123 |
|
|
$ |
278 |
|
|
|
(56 |
)% |
2
Conference Call
Tripadvisor posted prepared remarks and supplemental financial information on the Investor Relations section of Tripadvisor’s website at http://ir.tripadvisor.com. Tripadvisor will host a conference call tomorrow, May 7, 2021, at 8:30 a.m., Eastern Time, to discuss the Company’s first quarter 2021 operating results, as well as forward-looking information about Tripadvisor’s business. Domestic callers may access the earnings conference call by dialing (877) 224-9081 (International callers, dial (224) 357-2223). Investors and other interested parties may also go to the Investor Relations section of Tripadvisor’s website at http://ir.tripadvisor.com for a live webcast of the conference call. Please access the website at least 15 minutes prior to the call to register, download, and install any necessary audio software. A replay of the conference call will be available on Tripadvisor’s website noted above or by phone (dial (855) 859-2056 and enter the passcode 4196145) until May 14, 2021 and the webcast will be accessible at http://ir.tripadvisor.com/events-and-presentations for at least twelve months following the conference call.
About Tripadvisor
Tripadvisor, the world's largest travel guidance platform*, helps hundreds of millions of people each month** become better travelers, from planning to booking to taking a trip. Travelers across the globe use the Tripadvisor site and app to discover where to stay, what to do and where to eat based on guidance from those who have been there before. With more than 887 million reviews and opinions of nearly 8 million businesses, travelers turn to Tripadvisor to find deals on accommodations, book experiences, reserve tables at delicious restaurants and discover great places nearby. As a travel guidance company available in 49 markets and 28 languages, Tripadvisor makes planning easy no matter the trip type.
The subsidiaries of Tripadvisor, Inc. (NASDAQ: TRIP), own and operate a portfolio of travel media brands and businesses, operating under various websites and apps, including the following websites: www.bokun.io, www.cruisecritic.com, www.flipkey.com, www.thefork.com (including www.lafourchette.com, www.eltenedor.com, www.bookatable.co.uk, and www.delinski.com), www.helloreco.com, www.holidaylettings.co.uk, www.housetrip.com, www.jetsetter.com, www.niumba.com, www.seatguru.com, www.singleplatform.com, www.vacationhomerentals.com, and www.viator.com.
* Source: SimilarWeb, unique users de-duplicated monthly, March 2021
** Source: Tripadvisor internal log files
3
Tripadvisor, Inc.
SELECTED FINANCIAL INFORMATION
Condensed Consolidated Statements of Operations
(in millions, except per share amounts)
(Unaudited)
|
|
|
Three Months Ended |
|
|||||
|
|
|
March 31, 2021 |
|
|
March 31, 2020 |
|
||
|
Revenue |
|
$ |
123 |
|
|
$ |
278 |
|
|
|
|
|
|
|
|
|
|
|
|
Costs and expenses: |
|
|
|
|
|
|
|
|
|
Cost of revenue |
|
|
12 |
|
|
|
19 |
|
|
Selling and marketing (1) |
|
|
73 |
|
|
|
125 |
|
|
Technology and content (1) |
|
|
55 |
|
|
|
69 |
|
|
General and administrative (1) |
|
|
38 |
|
|
|
51 |
|
|
Depreciation and amortization |
|
|
29 |
|
|
|
32 |
|
|
Restructuring and other related reorganization costs |
|
|
― |
|
|
|
9 |
|
|
Total costs and expenses |
|
|
207 |
|
|
|
305 |
|
|
Operating income (loss) |
|
|
(84 |
) |
|
|
(27 |
) |
|
Other income (expense): |
|
|
|
|
|
|
|
|
|
Interest expense |
|
|
(11 |
) |
|
|
(2 |
) |
|
Interest income |
|
|
― |
|
|
|
1 |
|
|
Other income (expense), net |
|
|
(1 |
) |
|
|
1 |
|
|
Total other income (expense), net |
|
|
(12 |
) |
|
|
― |
|
|
Income (loss) before income taxes |
|
|
(96 |
) |
|
|
(27 |
) |
|
(Provision) benefit for income taxes |
|
|
16 |
|
|
|
11 |
|
|
Net income (loss) |
|
$ |
(80 |
) |
|
$ |
(16 |
) |
|
|
|
|
|
|
|
|
|
|
|
Earnings (loss) per share attributable to common stockholders: |
|
|
|
|
|
|
|
|
|
Basic |
|
$ |
(0.59 |
) |
|
$ |
(0.12 |
) |
|
Diluted |
|
$ |
(0.59 |
) |
|
$ |
(0.12 |
) |
|
|
|
|
|
|
|
|
|
|
|
Weighted average common shares outstanding: |
|
|
|
|
|
|
|
|
|
Basic |
|
|
136 |
|
|
|
136 |
|
|
Diluted |
|
|
136 |
|
|
|
136 |
|
|
|
|
|
|
|
|
|
|
|
|
|
|
|
|
|
|
|
|
|
|
(1) Includes stock-based compensation expense as follows: |
|
|
|
|
|
|
|
|
|
Selling and marketing |
|
$ |
4 |
|
|
$ |
4 |
|
|
Technology and content |
|
$ |
12 |
|
|
$ |
11 |
|
|
General and administrative |
|
$ |
13 |
|
|
$ |
11 |
|
4
Tripadvisor, Inc.
Condensed Consolidated Balance Sheets
(in millions, except number of shares and per share amounts)
(Unaudited)
|
|
|
March 31, |
|
|
December 31, |
|
||
|
|
|
|
2021 |
|
|
|
2020 |
|
|
ASSETS |
|
|
|
|
|
|
|
|
|
Current assets: |
|
|
|
|
|
|
|
|
|
Cash and cash equivalents |
|
$ |
674 |
|
|
$ |
418 |
|
|
Accounts receivable and contract assets, net of allowance for credit losses of $34 and $33, respectively |
|
|
97 |
|
|
|
83 |
|
|
Income taxes receivable |
|
|
50 |
|
|
|
50 |
|
|
Prepaid expenses and other current assets |
|
|
24 |
|
|
|
22 |
|
|
Total current assets |
|
|
845 |
|
|
|
573 |
|
|
Property and equipment, net of accumulated depreciation of $398 and $386, respectively |
|
|
229 |
|
|
|
240 |
|
|
Operating lease right-of-use assets |
|
|
50 |
|
|
|
54 |
|
|
Intangible assets, net of accumulated amortization of $208 and $206, respectively |
|
|
80 |
|
|
|
86 |
|
|
Goodwill |
|
|
852 |
|
|
|
862 |
|
|
Non-marketable investments |
|
|
39 |
|
|
|
40 |
|
|
Deferred income taxes, net |
|
|
33 |
|
|
|
10 |
|
|
Other long-term assets, net of allowance for credit losses of $5 and $5, respectively |
|
|
104 |
|
|
|
104 |
|
|
TOTAL ASSETS |
|
$ |
2,232 |
|
|
$ |
1,969 |
|
|
|
|
|
|
|
|
|
|
|
|
LIABILITIES AND STOCKHOLDERS' EQUITY |
|
|
|
|
|
|
|
|
|
Current liabilities: |
|
|
|
|
|
|
|
|
|
Accounts payable |
|
$ |
13 |
|
|
$ |
18 |
|
|
Deferred merchant payables |
|
|
71 |
|
|
|
36 |
|
|
Deferred revenue |
|
|
38 |
|
|
|
28 |
|
|
Accrued expenses and other current liabilities |
|
|
155 |
|
|
|
160 |
|
|
Total current liabilities |
|
|
277 |
|
|
|
242 |
|
|
Long-term debt |
|
|
831 |
|
|
|
491 |
|
|
Finance lease obligation, net of current portion |
|
|
70 |
|
|
|
71 |
|
|
Operating lease liabilities, net of current portion |
|
|
41 |
|
|
|
46 |
|
|
Deferred income taxes, net |
|
|
2 |
|
|
|
10 |
|
|
Other long-term liabilities |
|
|
226 |
|
|
|
223 |
|
|
Total Liabilities |
|
|
1,447 |
|
|
|
1,083 |
|
|
|
|
|
|
|
|
|
|
|
|
Stockholders’ equity: |
|
|
|
|
|
|
|
|
|
Preferred stock, $0.001 par value |
|
|
― |
|
|
|
― |
|
|
Authorized shares: 100,000,000 |
|
|
|
|
|
|
|
|
|
Shares issued and outstanding: 0 and 0 |
|
|
|
|
|
|
|
|
|
Common stock, $0.001 par value |
|
|
― |
|
|
|
― |
|
|
Authorized shares: 1,600,000,000 |
|
|
|
|
|
|
|
|
|
Shares issued: 142,914,851 and 140,775,221, respectively |
|
|
|
|
|
|
|
|
|
Shares outstanding: 124,070,237 and 121,930,607, respectively |
|
|
|
|
|
|
|
|
|
Class B common stock, $0.001 par value |
|
|
― |
|
|
|
― |
|
|
Authorized shares: 400,000,000 |
|
|
|
|
|
|
|
|
|
Shares issued and outstanding: 12,799,999 and 12,799,999, respectively |
|
|
|
|
|
|
|
|
|
Additional paid-in capital |
|
|
1,244 |
|
|
|
1,253 |
|
|
Retained earnings |
|
|
309 |
|
|
|
389 |
|
|
Accumulated other comprehensive income (loss) |
|
|
(46 |
) |
|
|
(34 |
) |
|
Treasury stock-common stock, at cost, 18,844,614 and 18,844,614 shares, respectively |
|
|
(722 |
) |
|
|
(722 |
) |
|
Total Stockholders’ Equity |
|
|
785 |
|
|
|
886 |
|
|
TOTAL LIABILITIES AND STOCKHOLDERS' EQUITY |
|
$ |
2,232 |
|
|
$ |
1,969 |
|
5
Tripadvisor, Inc.
Condensed Consolidated Statements of Cash Flows
(in millions)
(Unaudited)
|
|
|
Three Months Ended |
|
|||||
|
|
|
March 31, 2021 |
|
|
March 31, 2020 |
|
||
|
Operating activities: |
|
|
|
|
|
|
|
|
|
Net income (loss) |
|
$ |
(80 |
) |
|
$ |
(16 |
) |
|
Adjustments to reconcile net income (loss) to net cash provided by (used in) operating activities: |
|
|
|
|
|
|
|
|
|
Depreciation and amortization |
|
|
29 |
|
|
|
32 |
|
|
Stock-based compensation expense |
|
|
29 |
|
|
|
26 |
|
|
Deferred income tax expense (benefit) |
|
|
(22 |
) |
|
|
9 |
|
|
Provision for expected credit losses |
|
|
2 |
|
|
|
5 |
|
|
Other, net |
|
|
4 |
|
|
|
(2 |
) |
|
Changes in operating assets and liabilities, net of effects from acquisitions and other investments |
|
|
19 |
|
|
|
(124 |
) |
|
Net cash provided by (used in) operating activities |
|
|
(19 |
) |
|
|
(70 |
) |
|
|
|
|
|
|
|
|
|
|
|
Investing activities: |
|
|
|
|
|
|
|
|
|
Capital expenditures, including internal-use software and website development |
|
|
(10 |
) |
|
|
(20 |
) |
|
Net cash provided by (used in) investing activities |
|
|
(10 |
) |
|
|
(20 |
) |
|
|
|
|
|
|
|
|
|
|
|
Financing activities: |
|
|
|
|
|
|
|
|
|
Repurchase of common stock |
|
|
― |
|
|
|
(115 |
) |
|
Proceeds from issuance of 2026 Senior Notes, net of financing costs |
|
|
340 |
|
|
|
― |
|
|
Purchase of capped calls in connection with 2026 Senior Notes |
|
|
(35 |
) |
|
|
― |
|
|
Proceeds from 2015 Credit Facility |
|
|
― |
|
|
|
700 |
|
|
Proceeds from exercise of stock options |
|
|
7 |
|
|
|
― |
|
|
Payment of withholding taxes on net share settlements of equity awards |
|
|
(23 |
) |
|
|
(14 |
) |
|
Payments of finance lease obligation and other financing activities, net |
|
|
(2 |
) |
|
|
(1 |
) |
|
Net cash provided by (used in) financing activities |
|
|
287 |
|
|
|
570 |
|
|
Effect of exchange rate changes on cash, cash equivalents and restricted cash |
|
|
(2 |
) |
|
|
(1 |
) |
|
Net increase in cash, cash equivalents and restricted cash |
|
|
256 |
|
|
|
479 |
|
|
Cash, cash equivalents and restricted cash at beginning of period |
|
|
418 |
|
|
|
319 |
|
|
Cash, cash equivalents and restricted cash at end of period |
|
$ |
674 |
|
|
$ |
798 |
|
6
Tripadvisor, Inc.
Segment Information
(in millions, except percentages)
(Unaudited)
|
|
|
Three Months Ended |
|
|
% Change |
|
||||||
|
|
|
March 31, 2021 |
|
|
March 31, 2020 |
|
|
2021 vs. 2020 |
|
|||
|
Revenue: |
|
|
|
|
|
|
|
|||||
|
Hotels, Media & Platform |
|
$ |
88 |
|
|
$ |
169 |
|
|
|
(48 |
)% |
|
Experiences & Dining |
|
|
28 |
|
|
|
83 |
|
|
|
(66 |
)% |
|
Other |
|
|
7 |
|
|
|
26 |
|
|
|
(73 |
)% |
|
Total revenue |
|
$ |
123 |
|
|
$ |
278 |
|
|
|
(56 |
)% |
|
Adjusted EBITDA: |
|
|
|
|
|
|
|
|
|
|
|
|
|
Hotels, Media & Platform |
|
$ |
(3 |
) |
|
$ |
53 |
|
|
n.m. |
|
|
|
Experiences & Dining |
|
|
(24 |
) |
|
|
(19 |
) |
|
|
26 |
% |
|
Other |
|
|
1 |
|
|
|
6 |
|
|
|
(83 |
)% |
|
Total Adjusted EBITDA (1) |
|
$ |
(26 |
) |
|
$ |
40 |
|
|
n.m. |
|
|
|
Adjusted EBITDA Margin: |
|
|
|
|
|
|
|
|
|
|
|
|
|
Hotels, Media & Platform |
|
|
(3 |
)% |
|
|
31 |
% |
|
|
|
|
|
Experiences & Dining |
|
|
(86 |
)% |
|
|
(23 |
)% |
|
|
|
|
|
Other |
|
|
14 |
% |
|
|
23 |
% |
|
|
|
|
|
Total Adjusted EBITDA Margin (1) |
|
|
(21 |
)% |
|
|
14 |
% |
|
|
|
|
|
|
|
|
|
|
|
|
|
|
|
|
|
|
|
Net Income (Loss) (2) |
|
$ |
(80 |
) |
|
$ |
(16 |
) |
|
|
|
|
|
Net Income (Loss) Margin |
|
|
(65 |
)% |
|
|
(6 |
)% |
|
|
|
|
n.m. = not meaningful
|
(1) |
Please refer to “Non-GAAP Financial Measures” below for definitions of these non-GAAP financial measures, as well as reconciliations to the most directly comparable GAAP measure. |
|
|
(2) |
This amount reflects our consolidated GAAP Net Income (Loss) for the periods presented. Tripadvisor does not calculate or report net income (loss) by segment. |
|
7
Non-GAAP Financial Measures
To supplement our unaudited condensed consolidated financial statements, which are prepared and presented in accordance with GAAP in our press release and related conference call, we also report certain non-GAAP financial measures. A “non-GAAP financial measure” refers to a numerical measure of a company’s historical or future financial performance, financial position, or cash flows that excludes (or includes) amounts that are included in (or excluded from) the most directly comparable measure calculated and presented in accordance with GAAP in such company’s financial statements. We may use the following non-GAAP measures: Adjusted EBITDA, Adjusted EBITDA margin, non-GAAP net income (loss), non-GAAP net income (loss) per diluted share, free cash flow, non-GAAP revenue before effects of foreign exchange, and Adjusted EBITDA before effects of foreign exchange, as well as other measures.
The presentation of these financial measures is not intended to be considered in isolation or as a substitute for, or superior to, financial information prepared and presented in accordance with GAAP and should not be considered measures of Tripadvisor’s liquidity. Investors are cautioned that there are material limitations associated with the use of non-GAAP financial measures as an analytical tool. In particular, many of the adjustments to our GAAP financial measures reflect the exclusion of certain items, as defined in our non-GAAP definitions below, which are recurring and will be reflected in our financial results for the foreseeable future. In addition, these measures may be different from non-GAAP financial measures used by other companies, even where similarly titled, limiting their usefulness for comparison purposes and therefore should not be used to compare Tripadvisor’s performance to that of other companies. We endeavor to compensate for the limitation of the non-GAAP financial measures presented by also providing the most directly comparable GAAP measures and descriptions of the reconciling items and adjustments to derive the non-GAAP financial measures.
We believe these non-GAAP financial measures provide investors and analysts with useful supplemental information about the financial performance of our business, enable comparison of financial results between periods where certain items may vary independent of business performance, and allow for greater transparency with respect to key measures used by management to operate and analyze our business over different periods of time.
We define our non-GAAP financial measures as below:
Tripadvisor defines “Adjusted EBITDA” as Net Income (Loss) plus: (1) provision (benefit) for income taxes; (2) other income (expense), net; (3) depreciation and amortization; (4) stock-based compensation and other stock-settled obligations; (5) goodwill, long-lived assets and intangible asset impairments; (6) legal reserves and settlements; (7) restructuring and other related reorganization costs; and (8) non-recurring expenses and income. These items are excluded from our Adjusted EBITDA measure because these items are noncash in nature, or because the amount is not driven by core operating results and renders comparisons with prior periods less meaningful. The Company believes that excluding these amounts better enables management and investors to compare financial results between periods as these costs may vary independent of business performance.
Tripadvisor defines “Adjusted EBITDA margin” as Adjusted EBITDA divided by revenue.
Adjusted EBITDA and Adjusted EBITDA margin are key operating performance measures used by our management and board of directors to understand and evaluate the financial performance of our business as a whole and our individual business segments, and on which internal budgets and forecasts are based and approved. In particular, the exclusion of certain expenses in calculating Adjusted EBITDA can provide a useful measure for period-to-period comparisons and better enables management and investors to compare financial results between periods as these costs may vary independent of core business performance. Accordingly, we believe that Adjusted EBITDA and Adjusted EBITDA margin provide useful information to investors and others in understanding and evaluating our operating results in the same manner as our management and Board of Directors and allows for another useful comparison of our performance with our historical results from prior periods.
Our use of Adjusted EBITDA has limitations as an analytical tool, and you should not consider it in isolation or as a substitute for analysis of our results reported in accordance with GAAP. Because of these limitations, you should consider Adjusted EBITDA alongside other financial performance measures, including net income (loss) and our other GAAP results.
Some of these limitations are:
|
|
• |
Adjusted EBITDA does not reflect our cash expenditures or future requirements for capital expenditures or contractual commitments; |
|
|
• |
Adjusted EBITDA does not reflect changes in, or cash requirements for, our working capital needs; |
|
|
• |
Adjusted EBITDA does not reflect the interest expense or cash requirements necessary to service interest or principal payments on our debt; |
8
|
|
• |
Adjusted EBITDA does not consider the potentially dilutive impact of stock-based compensation or other stock-settled obligations; |
|
|
• |
Although depreciation and amortization are non-cash charges, the assets being depreciated and amortized may have to be replaced in the future, and Adjusted EBITDA does not reflect cash capital expenditure requirements for such replacements or for new capital expenditure requirements; |
|
|
• |
Adjusted EBITDA does not reflect certain income and expenses not directly tied to the ongoing core operations of our business, such as legal reserves and settlements and restructuring and other related reorganization costs; |
|
|
• |
Adjusted EBITDA does not reflect tax payments that may represent a reduction in cash available to us; and |
|
|
• |
Other companies, including companies in our own industry, may calculate Adjusted EBITDA differently than we do, limiting its usefulness as a comparative measure. |
Tripadvisor defines “non-GAAP net income (loss)” as GAAP net income (loss) excluding, net of their related tax effects (which excludes the impact of significant one-time changes resulting from tax legislation or significant legislation that impacts tax, such as the CARES Act): (1) stock-based compensation expense and other stock-settled obligations; (2) amortization of intangible assets; (3) goodwill, intangible asset, and other long-lived asset impairments; (4) legal reserves and settlements; (5) restructuring and other related reorganization costs; and (6) certain gains, losses, and other non-recurring income or expenses that we do not believe are indicative of our ongoing operating results. We believe non-GAAP net income (loss) is an operating performance measure which provides investors and analysts with useful supplemental information about the financial performance of our business, as it incorporates our unaudited condensed consolidated statement of operations, taking into account depreciation, which management believes is an ongoing cost of doing business, but excluding the impact of certain expenses, infrequently occurring items and items not directly tied to the ongoing core operations of our businesses, and also enables comparison of financial results between periods where certain items may vary independent of business performance.
Tripadvisor defines “non-GAAP net income (loss) per diluted share”, or non-GAAP diluted EPS, as non-GAAP net income (loss) divided by GAAP diluted shares. We believe non-GAAP diluted EPS is useful to investors because it represents, on a per share basis, our unaudited condensed consolidated statement of operations, taking into account depreciation, which we believe is an ongoing cost of doing business, as well as other items which are not allocated to the operating businesses such as interest expense, interest income, income taxes and foreign exchange gains or losses, but excluding the effects of certain expenses not directly tied to the ongoing core operations of our businesses. Tripadvisor calculates non-GAAP diluted EPS using weighted average diluted shares determined under GAAP.
Non-GAAP net income (loss) and non-GAAP diluted EPS have some of the same limitations as Adjusted EBITDA. In addition, non-GAAP net income (loss) does not include all items that affect our GAAP net income (loss) and GAAP diluted EPS for the period. Therefore, we think it is important to evaluate these measures along with our unaudited condensed consolidated statements of operations.
Tripadvisor defines “free cash flow” as net cash provided by operating activities less capital expenditures, which are purchases of property and equipment, including capitalization of internal-use software development costs. We believe this financial measure can provide useful supplemental information to help investors better understand underlying trends in our business, as it represents the operating cash flow that our operating businesses generate, less capital expenditures but before taking into account other cash movements that are not directly tied to the ongoing core operations of our businesses, such as financing activities, foreign exchange or certain investing activities. Free cash flow has certain limitations in that it does not represent the total increase or decrease in the cash balance for the period, nor does it represent the residual cash flow for discretionary expenditures. Therefore, it is important to evaluate free cash flow along with the unaudited condensed consolidated statements of cash flows.
Tripadvisor calculates our foreign exchange effect of revenue, or “non-GAAP revenue before effects of foreign exchange” on a constant currency basis by excluding the estimated effects of foreign currency exchange on revenue by translating actual revenue for the current year three months ended using the prior period foreign currency exchange rates. We believe this is a useful measure that facilitates management's internal comparison to our historical performance because it excludes the effects of foreign currency volatility that is not indicative of our ongoing core operating results.
Tripadvisor calculates our foreign exchange effect of Adjusted EBITDA, or “Adjusted EBITDA before effects of foreign exchange,” on a constant currency basis, by excluding the estimated effects of foreign currency exchange by translating all amounts included in Adjusted EBITDA for the current year three months ended using the prior period foreign currency exchange rates. We believe this is a useful measure that facilitates management's internal comparison to our historical performance because it excludes the effects of foreign currency volatility that is not indicative of our ongoing core operating results.
9
Pursuant to the requirements of Regulation G, we present reconciliations of these non-GAAP financial measures to the most directly comparable GAAP measure below.
10
Tripadvisor, Inc.
RECONCILIATION OF GAAP TO NON-GAAP FINANCIAL MEASURES
(in millions, except per share amounts and percentages)
(Unaudited)
|
|
|
Three Months Ended |
|
|||||||||
|
|
|
March 31, 2021 |
|
|
December 31, 2020 |
|
|
March 31, 2020 |
|
|||
|
Reconciliation of GAAP Net Income (Loss) to Adjusted EBITDA (Non-GAAP): |
|
|
|
|
|
|
|
|
|
|
|
|
|
GAAP Net Income (Loss) |
|
$ |
(80 |
) |
|
$ |
(73 |
) |
|
$ |
(16 |
) |
|
Add: Provision (benefit) for income taxes |
|
|
(16 |
) |
|
|
(31 |
) |
|
|
(11 |
) |
|
Add: Other (income) expense, net |
|
|
12 |
|
|
|
12 |
|
|
|
― |
|
|
Add: Depreciation and amortization |
|
|
29 |
|
|
|
31 |
|
|
|
32 |
|
|
Add: Restructuring and other related reorganization costs |
|
|
― |
|
|
|
(1 |
) |
|
|
9 |
|
|
Add: Stock-based compensation expense |
|
|
29 |
|
|
|
29 |
|
|
|
26 |
|
|
Adjusted EBITDA (Non-GAAP) |
|
$ |
(26 |
) |
|
$ |
(33 |
) |
|
$ |
40 |
|
|
|
|
|
|
|
|
|
|
|
|
|
|
|
|
Revenue (GAAP) |
|
$ |
123 |
|
|
|
|
|
|
$ |
278 |
|
|
|
|
|
|
|
|
|
|
|
|
|
|
|
|
Net Income (loss) margin (GAAP) |
|
|
(65 |
)% |
|
|
|
|
|
|
(6 |
)% |
|
Adjusted EBITDA margin (Non-GAAP) (1) |
|
|
(21 |
)% |
|
|
|
|
|
|
14 |
% |
|
|
|
|
|
|
|
|
|
|
|
|
|
|
|
Reconciliation from GAAP Net Income (Loss) and GAAP Net Income (Loss) per diluted share to Non-GAAP net income (loss) and Non-GAAP net income (loss) per diluted share: |
|
|
|
|
|
|
|
|
|
|
|
|
|
GAAP Net Income (Loss) |
|
$ |
(80 |
) |
|
|
|
|
|
$ |
(16 |
) |
|
Add: Stock-based compensation expense |
|
|
29 |
|
|
|
|
|
|
|
26 |
|
|
Add: Restructuring and other reorganization costs |
|
|
― |
|
|
|
|
|
|
|
9 |
|
|
Add: Amortization of intangible assets |
|
|
6 |
|
|
|
|
|
|
|
7 |
|
|
Add: (Gain)/Loss on investment |
|
|
(1 |
) |
|
|
|
|
|
|
(1 |
) |
|
Subtract: Income tax effect of Non-GAAP adjustments (2) |
|
|
7 |
|
|
|
|
|
|
|
2 |
|
|
Subtract: Income tax impact related to CARES Act (3) |
|
|
― |
|
|
|
|
|
|
|
14 |
|
|
Non-GAAP net income (loss) |
|
$ |
(53 |
) |
|
|
|
|
|
$ |
9 |
|
|
|
|
|
|
|
|
|
|
|
|
|
|
|
|
GAAP diluted shares (4) |
|
|
136 |
|
|
|
|
|
|
|
138 |
|
|
|
|
|
|
|
|
|
|
|
|
|
|
|
|
GAAP Net Income (loss) per diluted share |
|
$ |
(0.59 |
) |
|
|
|
|
|
$ |
(0.12 |
) |
|
Non-GAAP net income (loss) per diluted share (5) |
|
$ |
(0.39 |
) |
|
|
|
|
|
$ |
0.07 |
|
|
|
|
|
|
|
|
|
|
|
|
|
|
|
|
Reconciliation of GAAP cash flows from operating activities to Free Cash Flow (Non-GAAP): |
|
|
|
|
|
|
|
|
|
|
|
|
|
Net cash provided by (used in) operating activities (GAAP) |
|
$ |
(19 |
) |
|
|
|
|
|
$ |
(70 |
) |
|
Subtract: Capital expenditures |
|
|
10 |
|
|
|
|
|
|
|
20 |
|
|
Free cash flow (Non-GAAP) |
|
$ |
(29 |
) |
|
|
|
|
|
$ |
(90 |
) |
|
(1) |
Tripadvisor defines “Adjusted EBITDA margin” as Adjusted EBITDA divided by revenue. |
|
(2) |
The non-GAAP adjustments described above are reported on a pre-tax basis. The income tax effect on non-GAAP adjustments was calculated based on the individual impact that these items had on our GAAP consolidated income tax expense (benefit) for the periods presented. |
|
(3) |
Represents a tax benefit of $14 million recorded in connection with the passage of the CARES Act, pertaining to the tax rate differential in tax years applicable to U.S. loss carryforwards that became eligible for carryback, recorded during the three months ended March 31, 2020. |
|
(4) |
Includes potential dilutive effect of common equivalent shares as if the Company had generated net income for the three months March 31, 2020; solely in order to calculate Non-GAAP net income diluted EPS for the three months ended March 31, 2020. |
|
(5) |
Tripadvisor defines “non-GAAP net income (loss) per diluted share” as non-GAAP net income (loss) divided by GAAP diluted shares. |
11
Safe Harbor Statement
Statements in this press release regarding management’s future expectations, beliefs, intentions, goals, strategies, plans or prospects, including, without limitation, statements relating to Tripadvisor’s future financial performance on both a GAAP and non-GAAP basis, and Tripadvisor’s prospects as a comprehensive destination for hotels, experiences, and restaurants, may constitute forward-looking statements within the meaning of the Private Securities Litigation Reform Act of 1995 and other federal securities laws. Forward-looking statements can be identified by terminology such as “anticipate,” “believe,” “could,” “estimate,” “expect,” “intend,” “is planned,” “may,” “should,” “will,” “look forward,” “would” or similar terms, variations of such terms or the negative of those terms. Investors are cautioned that statements in this press release, which are not strictly historical statements, including, without limitation, statements by our executive officers with respect to growth objectives, strategic investments, and statements regarding management’s plans, objectives and strategies, constitute forward-looking statements. Such forward-looking statements involve known and unknown risks, uncertainties and other factors including those risks, uncertainties and factors detailed in Tripadvisor’s filings with the SEC. As a result of such risks, uncertainties and factors, Tripadvisor’s actual results may differ materially from any future results, performance or achievements discussed in or implied by the forward-looking statements contained herein. Tripadvisor is providing the information in this press release as of this date and assumes no obligations to update the information included in this press release or revise any forward-looking statements, whether as a result of new information, future events or otherwise.
Contacts
Investors
(781) 800.7848
Media
(781) 800.5061
12
Exhibit 99.2

Q1 2021 Letter to Shareholders
This time last year, we were navigating our industry’s darkest days and the future was decidedly uncertain. Today, thanks to expanded availability of vaccinations throughout Q1 2021, the clouds have started to part and our business is in an improved position. The evidence is manifold:
|
|
● |
We saw rising consumer demand on our platform led by the U.S. market and driven by accelerated vaccination trends. We are optimistic that the U.S. can further improve and serve as a leading indicator for leisure travel recovery in international markets in the periods to come. |
|
|
● |
Two of our key offerings - our hotel metasearch auction and experiences - are showing encouraging recovery signs so far this year, particularly in the U.S. |
|
|
● |
We completed an opportunistic convertible debt capital raise in Q1. This further fortifies our solid balance sheet and potentially pre-funds the refinance of some of our higher-priced debt issued last summer amidst much greater uncertainty. |
|
|
● |
We are leveraging our competitive strengths in numerous areas - B2B, Display, Experiences, Dining, and our new direct-to-consumer subscription offering, Tripadvisor Plus. Through these diverse offerings we aim to capitalize on Tripadvisor’s unique, influential position and value proposition, drive more value for Tripadvisor customers, and enhance our platform’s long-term monetization potential. |
Our Q1 results reflect ongoing unevenness in leisure travel’s recovery path. Revenue of $123 million, a net loss of $80 million, and adjusted EBITDA of negative $26 million were slightly better than our expectations. Sequential monthly progress was U.S-driven, as vaccinations led consumers back to planning leisure travel. Europe lagged due to lockdowns, but demand picked up in April, and we are optimistic for broadened, international recovery as vaccination rates improve.
We believe we are advantageously positioned for the rebound and beyond. We will continue to focus on factors within our control - serving customers, leveraging competitive advantages, and laying the foundation for long-term, diverse growth.
***
Q1 2021 Business Update
Consumer demand environment, and revenue, improved throughout the quarter. The first quarter really had two distinct periods. The first month or so exhibited choppiness similar to what we saw in Q4 2020, with January as a percent of 2019 at lower levels than Q4 2020. However, demand and revenue trends improved as the quarter progressed.
Monthly unique users on Tripadvisor-branded websites improved sequentially during the quarter, as January, February, and March were approximately 53%, 56% and 58% of 2019’s comparable period, respectively. In our key markets of the U.S. and U.K., we have seen a close correlation between improved vaccination rates and rising travel intent, including searches for hotels, restaurants, and things to do.
Improvement throughout Q1 was driven almost entirely by the U.S., where the first phase of leisure travel recovery seems well underway. In March, U.S. monthly unique users approached 80% of 2019 levels, while traffic outside the U.S. was approximately half of 2019 levels. The CDC recently officially relaxed travel guidance for fully vaccinated people, which we see as an incremental positive for consumer willingness to travel. With more than 100 million U.S. citizens fully vaccinated, consumer confidence rising, and summer vacation months approaching, we believe there is more improvement to come. We also remain optimistic that a more powerful leisure travel recovery can take shape when vaccinations become more widespread internationally.
|
|
1 |

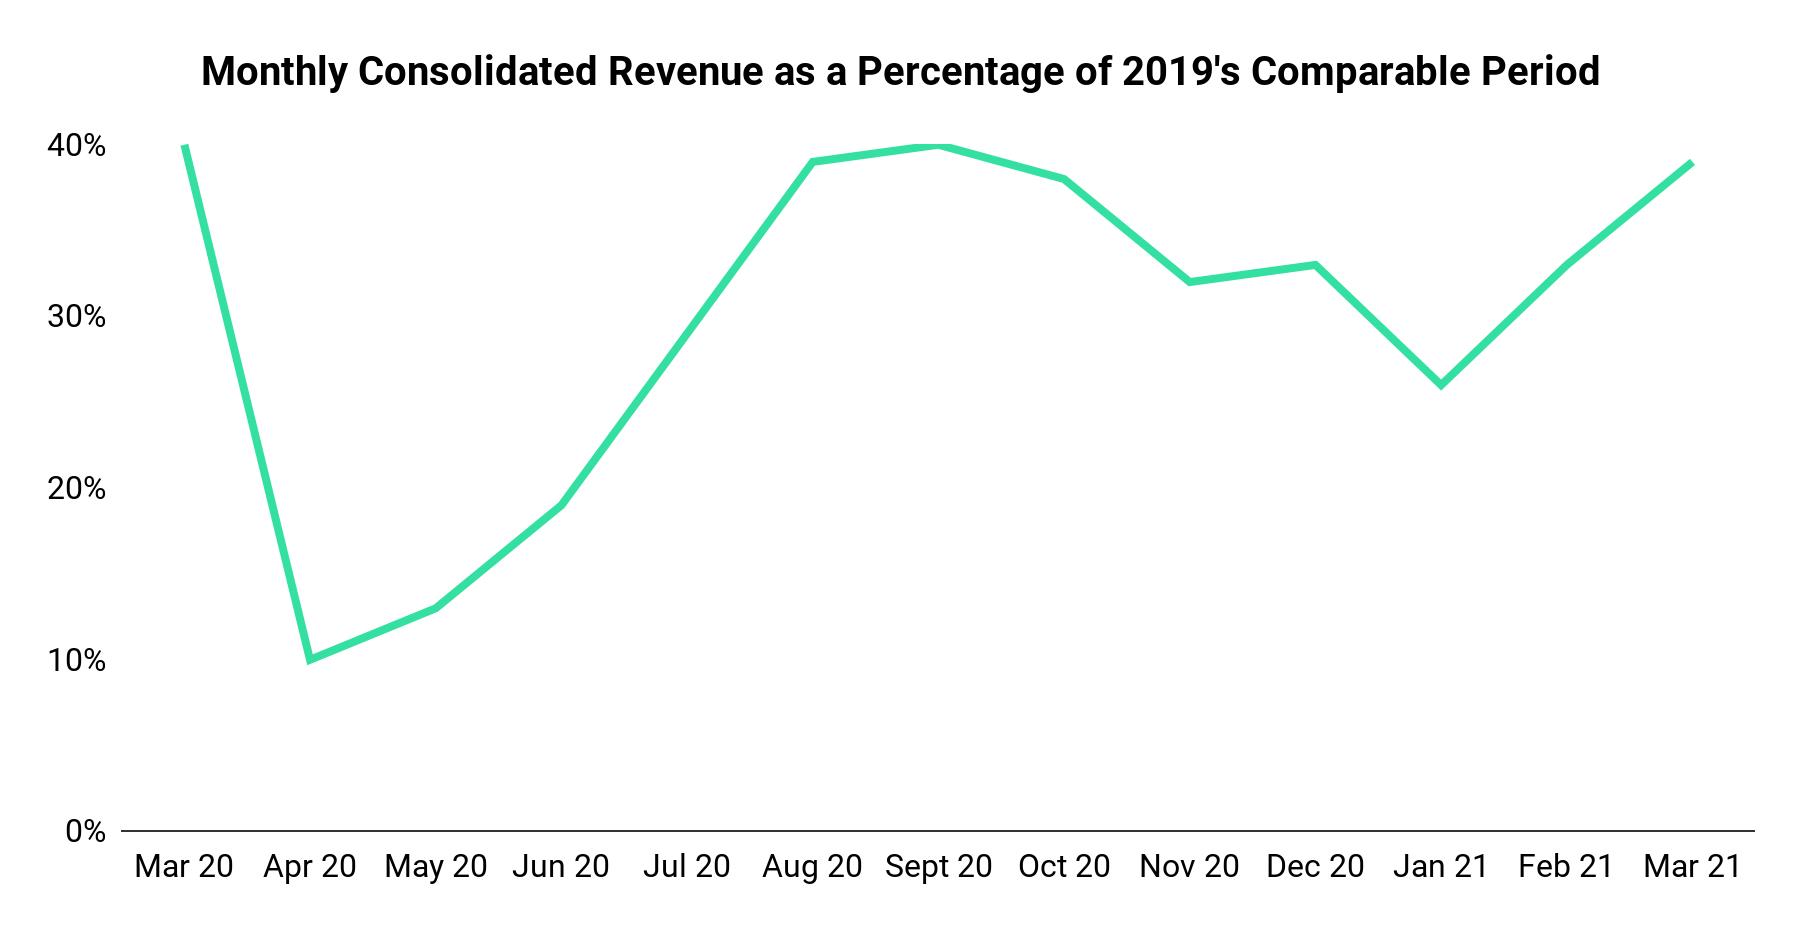
As leisure travel demand trends improved, so too did revenue performance. At $123 million, Q1 revenue was down 56% year-over-year and, at approximately 33% of 2019’s comparable period, was roughly in line with Q4 2020 performance. Similar to demand, the U.S. drove sequential revenue improvements during the quarter. March consolidated revenue was approximately 39% of 2019 levels, notably better than 26% in January and 33% in February.
As a percentage of 2019’s comparable period, March 2021 returned to levels last seen during last summer’s reopening period:
Some Q1 updates related to our diverse offerings:
|
|
● |
Our hotel auction is tracking in line with the overall demand environment. Traffic on hotel pages reached 80% of 2019 levels in the U.S. and approximately 50% outside the U.S. in March. U.S. auction revenue improved in the second half of Q1 and reached approximately 67% of 2019 levels in March, and nearly 80% in April. We have observed more muted trends internationally due to lockdowns, but the U.S. exemplifies rising consumer interest in hotel stays once vaccines arrive. Also, CPC prices in the U.S. recently approached 2019 levels, demonstrating ongoing partner bidding engagement as demand recovers. |
|
|
● |
B2B, which is primarily comprised of subscription-based revenue, remains a steady performer. This year, we are helping partners navigate what remains a fluid environment. We are excited to introduce more partners to our newer solutions, Spotlight, Menu Connect, and Reputation Pro, and we have been optimizing our Management Center and self-service tools to help partners leverage our platform to drive insights and value. |
|
|
● |
Our Display advertising offering has shown nice early signs that advertisers are coming back to impression-based advertising. Sales traction improved in the back half of Q1 and throughout April, with both travel-endemic clients, such as Destination Marketing Organizations that are looking to bring travelers back to their geographies, as well as a diverse set of advertisers spanning consumer packaged goods, auto, entertainment, finance, and spirits, who are looking to access our global audience and brand-safe platform. |
|
|
● |
In our Experiences offering, Q1 activity was largely limited to U.S. consumers making domestic bookings, and U.S. trends improved as the quarter progressed. In March, our U.S. point-of-sale reached 50% of 2019 levels, up from 30% levels in January and February. Also, as a destination, the U.S. exceeded 2019 levels in March. |
|
|
● |
Dining’s Q1 recovery was flat to Q4, as restaurants in most of the European countries in which TheFork operates were ordered to remain closed for in-restaurant dining. However, we saw in 2020 how resilient our restaurant offerings can be, as a few key markets achieved year-over-year growth during summer months and TheFork regained 2019 levels in September. We expect a similar pattern this year, with the added potential for a stronger recovery when vaccinations progress in Europe. |
|
|
2 |
We note that April’s revenue performance improved versus March. Visibility remains significantly challenged due to case spikes and lockdowns in major regions, but we currently expect that Q2 performance will exceed Q1. We also remain optimistic about the second half of 2021 as the number of people vaccinated increases, countries reopen, and the leisure travel recovery broadens.
Executing with cost discipline towards increased operating leverage. (Estimated cost savings levels referenced below do not consider depreciation, amortization, restructuring, and other related reorganization costs, or stock-based compensation.)
At $207 million, operating expenses were 32% lower than the same period a year ago. This was driven by two factors that we have outlined since the pandemic took hold last year. First, significantly reduced discretionary and workforce-related fixed expenses we enacted to align with our new reality. Second, significantly lower variable costs (such as performance-based marketing and the transaction-based cost of revenue) that move generally in line with travel demand.
During Q1, we maintained our rigorous cost controls in terms of workforce-related and discretionary fixed expense areas. Our ending headcount was 2,579, or 34% lower year-over-year. We continue to expect the majority of the 2020 fixed cost savings will persist in 2021.
Performance‐based marketing and the transaction‐based portion of cost of revenue remained significantly lower than pre-pandemic levels, reflecting the overall travel environment. These costs increased modestly compared to Q4 2020 driven by a typical, seasonal uplift as well as improved demand trends, and we continue to expect variable expenses will track generally in line with demand trends moving forward.
In terms of profitability, our Q1 consolidated net loss was $80 million. Q1 adjusted EBITDA of negative $26 million was better than Q4 2020, driven primarily by the sequential step-up in revenue, coupled with ongoing, disciplined, cost controls.
Further strengthened our liquidity position. Our Q1 ending cash and cash equivalents balance grew to $674 million, up $256 million from our ending balance on December 31, 2020. This increase was primarily driven by an opportunistic capital raise that we executed in late March, during which we sold $345 million of 0.250% convertible notes due 2026. We used a portion of the proceeds to enter into a hedge transaction that effectively increases the equity conversion strike to 100% above the $53.68 closing price at issuance, and we intend to use the balance for general corporate purposes, which may include repaying prior to maturity a portion of our 7.000% Senior Notes due 2025.
Our liquidity position reaches nearly $1.2 billion when considering that we remain essentially undrawn on our $500 million revolving credit facility.
Moving to cash flow, we note that we had a $19 million operating cash outflow in Q1, driven primarily by our net loss in the period, though significantly offset by changes in working capital. This outflow compares very favorably to the $70 million outflow experienced in Q1 2020 as the pandemic set in and consumers canceled their experiences and rentals bookings at historically high rates. Cancellation rates have moderated considerably since then. This positive swing is reflected in the $122 million year-over-year improvement in deferred merchant payables, which turned from an $86 million outflow to a $36 million inflow. We are pleased that travelers seem to be booking with increased confidence.
In sum, our solid liquidity position keeps the business adequately capitalized to navigate near-term uncertainty and numerous recovery scenarios.
Building Tripadvisor Plus. As outlined in our Q4 2020 and Full Year Shareholder Letter, we are in the initial phase of building our exciting direct-to-consumer subscription service, Tripadvisor Plus.
We are in phase one, our U.S. beta. When presented with the “no-brainer” moment of hotel savings equal to or greater than the $99 subscription fee, consumers have demonstrated they will sign up. In fact, in these early days, Plus subscribers are saving an average of more than $300 per booking. Once subscribed, travelers receive discounts on subsequent hotel bookings and bookable experiences available on Tripadvisor.
We are relentlessly striving towards our vision of the optimal experience for both supply partners and consumers. In Q1, we launched a hotel supplier-direct sales effort leveraging our existing hospitality services sales teams and have already contracted and brought live many properties in dozens of countries. We have been doing extensive testing related to how we merchandise Plus offers to drive conversion. We are also exploring a number of potential partnership opportunities across car rentals, digital services, and credit cards, among others, laying the groundwork to deliver more value for more consumers and partners through a broadened offering and wider distribution. We expect to move towards phase two, a full U.S. launch, within the next few months.
|
|
3 |
In short, we are making good early progress. We realize that building strong subscription businesses takes time, but we believe Tripadvisor is uniquely positioned to bring the consumer-direct subscription business model to a global travel audience. Near-term, our expectations for 2021 remain measured in acknowledgment of the fact we are early days and we launched during a pandemic. Over the long-term, we believe Plus can drive value for consumers, suppliers, and our business, monetizing Tripadvisor’s influence and creating long-term value for shareholders.
Outlook
(As a reminder, we endeavor to be as accurate as possible with our forward-looking commentary; however, a number of factors outside of our control can limit our visibility into future financial performance and can cause our results to vary materially from our current expectations.)
The pandemic continues to be a major headwind to the travel industry and to our business. We believe travel’s recovery path will be defined by rising consumer confidence and traveler safety, both of which are directly related to the speed of vaccine distribution. As such:
|
|
● |
We currently expect Q2 revenue and adjusted EBITDA to improve versus Q1, both in absolute terms, and as a percentage of 2019, despite impacts from Europe’s lagging recovery. |
|
|
● |
We also maintain our previously communicated view that leisure travel, and our business, could experience a more robust second‐half rebound. This would be driven by continued U.S. progress as well as a broader recovery that includes Europe and other international markets. |
|
|
● |
Lastly, we reiterate our commitment to operating a fundamentally leaner cost structure and continue to expect the majority of the 2020 fixed cost savings will persist in 2021. |
Conference Call and Webcast
Tripadvisor, Inc. management will host a conference call to discuss results as well as forward-looking information about Tripadvisor’s business tomorrow morning at 8:30 a.m. Eastern Time. Domestic callers may access the earnings conference call by dialing (877) 224-9081 (International callers, dial (224) 357-2223). Investors and other interested parties may also go to the Investor Relations section of Tripadvisor’s website at http://ir.tripadvisor.com for a live webcast of the conference call.
* * *
Tripadvisor, Inc.’s first quarter 2021 earnings press release and supplemental financials are available on the Investor Relations section of Tripadvisor, Inc.’s website at ir.tripadvisor.com. The earnings release is also included as Exhibit 99.1 to our Current Report on Form 8-K as furnished to the U.S. Securities Exchange Commission, or SEC, on May 6, 2021, which is available on the Investor Relations section of our website at ir.tripadvisor.com and the SEC’s website at www.sec.gov.
Forward-Looking Statements
These prepared remarks contain “forward-looking statements” within the meaning of Section 27A of the Securities Act of 1933, as amended, and Section 21E of the Securities Exchange Act of 1934, as amended. The following words, when used, are intended to identify forward-looking statements: “anticipate,” “believe,” “could,” “estimate,” “expect,” “intend,” “may,” “might,” “plan,” “project,” “target,” “should,” “will,” and similar expressions which do not relate solely to historical matters. We caution investors that any forward-looking statements in these prepared remarks, or which management may make orally or in writing from time to time, are based on management’s beliefs and on assumptions made by, and information currently available to, management. Such statements are subject to risks, uncertainties and assumptions and are not guarantees of future performance, which may be affected by known and unknown risks, trends, uncertainties and factors that are beyond our control. Some of the risks and uncertainties that may cause our actual results, performance or achievements to differ materially from those expressed or implied by forward-looking statements are more fully described in Part I. Item 1A. "Risk Factors" of our Annual Report on Form 10-K. Moreover, we operate in a rapidly changing environment. New risk factors emerge from time to time and it is not possible for management to predict all such risk factors, nor can we assess the impact of all such risk factors on our business or the extent to which any factor, or combination of factors, may cause actual results to differ materially from those contained in any forward-looking statements. We caution you that, while forward-looking statements reflect our good faith beliefs when we make them, they are not guarantees of future performance and are impacted by actual events when they occur after we make such statements. We expressly disclaim any responsibility to update our forward-looking statements, whether as a result of new information, future events or otherwise.
Investors should also refer to our quarterly reports on Form 10-Q for future periods and current reports on Form 8-K as we file them with the SEC and to other materials we may furnish to the public from time to time through current reports on Form 8-K or
|
|
4 |
otherwise, for a discussion of risks and uncertainties that may cause actual results, performance or achievements to differ materially from those expressed or implied by forward-looking statements.
Use of Non-GAAP Financial Measures
These prepared remarks may include references to non-GAAP measures, such as consolidated adjusted EBITDA (including forecasted adjusted EBITDA), free cash flow, and constant currency measurements, such as, non-GAAP revenue before effects of foreign exchange, and adjusted EBITDA before effects of foreign exchange, which are considered non-GAAP financial measures as they are not prepared in conformity with accounting principles generally accepted in the United States (“GAAP”). These non-GAAP financial measures are not prepared under a comprehensive set of accounting rules and, therefore, should only be reviewed alongside results reported under GAAP.
We encourage investors to review our earnings press release as it contains important information about our financial results, including tabular reconciliations to the most directly comparable GAAP financial measure, definitions, limitations and other related information about these non-GAAP financial measures. We have not reconciled consolidated adjusted EBITDA guidance to projected consolidated GAAP net income (loss) because we do not provide guidance on GAAP net income (loss) or the reconciling items between adjusted EBITDA and GAAP net income (loss), as a result of the uncertainty regarding, and the potential variability of, certain of these items. Accordingly, a reconciliation of the non-GAAP financial measure guidance to the corresponding GAAP measure is not available without unreasonable effort.
The earnings press release in addition to other supplemental financial information is available on the Investor Relations section of our website at http://ir.tripadvisor.com/. The earnings press release is also included as Exhibit 99.1 to our Current Report on Form 8-K as furnished to the SEC on May 6, 2021, which is available on the Investor Relations section of our website at http://ir.tripadvisor.com/ and the SEC’s website at www.sec.gov.
Key Business Metrics
We review a number of metrics, including unique visitors, hotel shoppers, and other metrics, to evaluate our business, measure our performance, identify trends affecting our business, formulate business plans and make strategic decisions. While these numbers are based on what we believe to be reasonable estimates for the applicable period of measurement, there are inherent challenges in measuring usage and user engagement across our large user base around the world. For example, a single user may have multiple member accounts or browse the internet on multiple browsers or devices, some users may restrict our ability to accurately identify them across visits, and we are not always able to capture user information on all of our platforms. As such, the calculations of our active users may not accurately reflect the actual number of people or organizations using our platform. Our metrics are also affected by applications that automatically contact our servers for regular updates with no discernible user action involved, and this activity can cause our system to count the users associated with such applications as active users on the day or days such contact occurs. As such, the calculation of some of the metrics presented may be affected as a result of this activity. We regularly review our process and may adjust how we calculate our internal metrics to improve their accuracy.
|
|
5 |
Serious News for Serious Traders! Try StreetInsider.com Premium Free!
You May Also Be Interested In
- TripAdvisor (TRIP) PT Raised to $28 at Citi
- Cumulus Announces Selected Preliminary Operating Results for First Quarter 2024
- Coway Awarded Its 18th Red Dot Design Award for BEREX Massage Bed
Create E-mail Alert Related Categories
SEC FilingsSign up for StreetInsider Free!
Receive full access to all new and archived articles, unlimited portfolio tracking, e-mail alerts, custom newswires and RSS feeds - and more!
