

Form 8-K Square, Inc. For: Aug 01
FREE Breaking News Alerts from StreetInsider.com!
StreetInsider.com Top Tickers, 4/19/2024
- Dow, S&P inch up as AmEx gains; Netflix slump drags down Nasdaq
- Sony/Apollo bid for Paramount could be worth as much as $29 billion - Source
- Netflix Q1 earnings top estimates on blowout subscriber growth
- Stocks off two-month low as fear of Middle East escalation eases
- Gold prices rally past $2,400 on reports of Israel strikes on Iran
- Tritium DCFC Limited (DCFC): Three Australian subsidiaries were determined to be insolvent or likely to become insolvent
- Hasbro (HAS) Announces Resignation of Cynthia Williams, President of Wizards of the Coast and Hasbro Gaming
- Frontier Communications (FYBR) says third party had gained unauthorized access to portions of its information technology environment
- Ibotta (IBTA) Prices 6.56M Share IPO at $88/sh
- Netflix (NFLX) Tops Q1 EPS by 77c, Offers Guidance
- Netflix, Tesla, Amex, P&G fall premarket; Paramount Global gains
- After-hours movers: Netflix, Intuitive Surgical, Nordstrom, KB Home
- Midday movers: Tesla, Blackstone, Las Vegas Sands fall; DR Horton rises
- After-hours movers: Alcoa rises; Equifax and Las Vegas Sands fall
- Midday movers: Travelers, JB Hunt fall; United Airlines rises
 Tweet
Tweet Share
ShareExhibit 99.1

Highlights

|

|

| ||
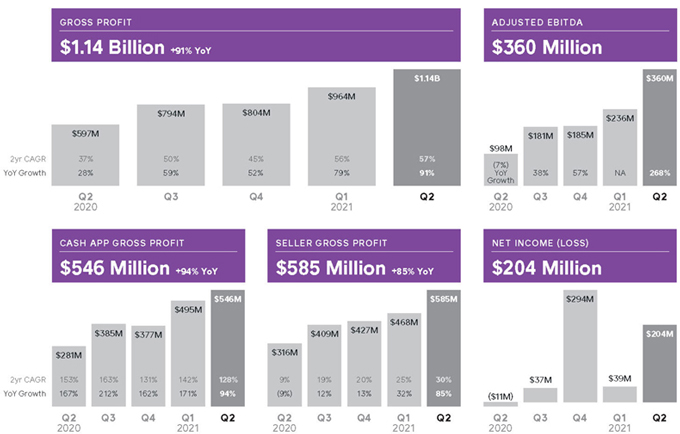
| In the second quarter of 2021, we generated gross profit of $1.14 billion, up 91% year over year. Cash App generated gross profit of $546 million, up 94% year over year. Our Seller ecosystem generated gross profit of $585 million, up 85% year over year. |
As customers find value across our ecosystem, they have adopted more products and brought a greater |
Software and integrated payments have been the fastest
growing |
SECOND QUARTER FINANCIAL METRICS
In the second quarter of 2021, total net revenue was $4.68 billion, up 143% year over year, and, excluding bitcoin revenue, total net revenue was $1.96 billion, up 87% year over year.
The following items affected net income (loss) per share during the respective periods. In the second quarter of 2020, we recognized a gain of $21 million related to observable price changes for non-marketable equity investments. In the fourth quarter of 2020, we recognized a gain of $274 million related to equity investments, driven primarily by a gain of $255 million as a result of the mark-to-market valuation of our investment in DoorDash. In the first quarter of 2021, we recognized a loss of $29 million related to the mark-to-market valuation of our investment in DoorDash as well as a $20 million bitcoin impairment. In the second quarter of 2021, we recognized a $77 million gain on our equity investments and a $45 million bitcoin impairment.
A reconciliation of non-GAAP financial measures used in this letter to their nearest GAAP equivalents is provided at the end of this letter.
The compound annual growth rate (CAGR) is the mean annual growth rate over a specified time period. Given the variability in year-over-year comparisons due to COVID-19, we believe using two-year CAGRs from 2019 to 2021 better reflects underlying growth trends.
|
|
SQUARE Q2 2021 2 |
ON THE COVER
Customers have brought more money into Cash App over time. As we have offered individuals the ability to instantly send bitcoin free, unlock unique Boosts, direct-deposit their paychecks, and more, customers have continued to find increased utility on the platform.
SELLER HIGHLIGHT
Lennox Street Grocer in Dublin, Ireland. Lennox Street Grocer uses Square Point of Sale, Square Reader, Square Stand, Square Terminal, and Square Online.
August 1, 2021
The compound annual growth rate (CAGR) is the mean annual growth rate over a specified time period. Given the variability in year-over-year comparisons due to COVID-19, we believe using two-year CAGRs from 2019 to 2021 better reflects underlying growth trends.

To Our Shareholders
We delivered strong growth at scale during the second quarter of 2021. Gross profit grew 91% year over year to $1.14 billion, which was 57% on a two-year compound annual growth rate (CAGR) basis. In our Seller ecosystem, gross profit was $585 million, up 85% year over year and 30% on a two-year CAGR basis. Our Cash App ecosystem delivered gross profit of $546 million, an increase of 94% year over year and 128% on a two-year CAGR basis. In April, we acquired a majority ownership stake in TIDAL, the global music and entertainment platform. We believe there is an opportunity to provide artists tools to participate in the economy and grow as entrepreneurs, and we are excited to continue integrating the TIDAL team into Square.
|
|
SQUARE Q2 2021 3 |
A transacting active Cash App customer has at least one financial transaction using any product or service within Cash App during the specified period. A transacting active customer for a specific Cash App product has at least one financial transaction using that product during the specified period and is referred to as an active.
Cash App’s network volume includes payments sent through peer-to-peer and Cash for Business.
CASH APP ECOSYSTEM
Strengthening the network
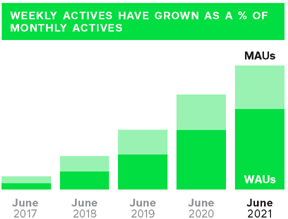
We remain focused on the health of our network, including attracting and retaining engaged customers. In June, Cash App reached 40 million monthly transacting active customers. With our marketing efforts, we are focused on attracting customers who could use more products and bring greater funds into our ecosystem. We believe customers have found increased utility across our ecosystem as nearly two-thirds of our monthly actives transacted each week on average in June. Peer-to-peer has continued to strengthen our network effects and we’ve seen growing engagement: In the second quarter, volume sent through Cash App’s network increased by nearly 4x compared to two years ago, driven by growth in existing customers and newer customers transacting more frequently.
To enhance the network effects of peer-to-peer, we have invested in a number of creative marketing campaigns and partnerships to reach new audiences. Over the last few months, we have teamed up with celebrities and organizations to empower individuals to participate in the economy. We partnered with Miley Cyrus to give away $1 million in stock of various companies, worked with Megan Thee Stallion to launch a series of financial education videos related to investing in stocks and cryptocurrency, and served as Red Bull Racing Honda’s official Financial Education Partner to give Formula One’s growing fan base more access to financial tools. We believe that these initiatives will help further establish Cash App as a culturally relevant brand.
Driving engagement
We believe everyone should be able to participate in the economy, and Cash App strives to help more individuals access and understand investing. Since its launch, our stock brokerage product has seen significant adoption: Nearly 4.5 million customers held a stock or ETF in the second quarter alone, an increase of more than 3x from a year ago. To help customers make more informed investment decisions, Cash App’s Investing tab shows key financial stats for stocks, such as revenue growth, gross profit, and valuation metrics. We have also launched Custom Orders, which allows customers to easily set specific buy and sell orders based on price, simplifying a traditionally complex process. Our ecosystem continues to be a differentiator as we find that customers who are trading stocks or holding them in their portfolio have engaged more with other products like Cash Card or bitcoin and have generated greater gross profit per customer.
We’ve seen strong growth in the number of weekly transacting active customers over time.

|
Last year we introduced the Cash By Cash App apparel line to offer customers the ability to showcase one of their favorite brands through custom-designed clothing and accessories. Cash App has built a community of more than 3 million followers across social channels who follow Cash App for its unique approach to financial services. |

Custom Orders allows customers to set specific prices at which to buy or sell stocks and bitcoin.
|
|
SQUARE Q2 2021 4 |
Customers can fund their Cash App accounts with inflows in a variety of ways: Peer-to-peer transfers, transactions on bitcoin or stocks, cash added from a debit card or bank account into a Cash App balance, paper money deposits, check deposits, and direct deposits including recurring paychecks or one-time deposits.
Gross profit per monthly transacting active customer is calculated based on Cash App annualized gross profit during a given quarter divided by the monthly transacting active customers for the last month of the quarter.
Increasing deposits into our ecosystem
A primary focus for Cash App is attracting greater inflows, or the amount of money our customers pull into Cash App. In June, Cash App released a redesigned interface to make it easier for customers to bring money into the ecosystem. Within the Banking tab, we improved discoverability by making account funding features like bank transfers, direct deposit, and recurring deposits more prominent and easy to understand. We intend to continue to invest in Cash App’s foundation by expanding our deposit and limit capabilities. As customers find value across our ecosystem, they have brought more money into Cash App: Inflows per monthly transacting active customer nearly doubled compared to two years ago, benefiting from recent increases in consumer spending. Growth in inflows has continued to be the primary driver of Cash App gross profit growth. In the second quarter, gross profit per monthly transacting active customer was $55, up 2.5x from two years ago.

|
Within the Banking tab, we have made the ability to add money to Cash App much more discoverable for customers, whether direct depositing their paycheck, adding money from their external bank account, or depositing a check. |
|
|
SQUARE Q2 2021 5 |
Square Banking includes Square Savings, Square Checking, and Square Loans.
Square, Inc. is a financial services company, not a bank. Banking services are provided by Square Financial Services, Inc., a Square subsidiary, or Sutton Bank, Members FDIC.
1. In a 2020 survey of 2,200 sellers conducted by Square, we found that the Square Debit Card was the first business debit card for more than 50% of those sellers.
A mid-market seller generates more than $500,000 in annualized GPV.
A larger seller generates more than $125,000 in annualized GPV.
Seller GPV (Gross Payment Volume) represents payment volume from our Seller ecosystem. Seller GPV is composed of the total dollar amount of all card payments processed by sellers using Square, net of refunds, and ACH transfers. It does not include GPV from our Cash App ecosystem.
SELLER ECOSYSTEM
Enhancing our ecosystem of products
In continuing our commitment to expand access to financial services, we launched Square Banking for our U.S. sellers, which includes Square Savings, Square Checking, and Square Loans (formerly known as Square Capital). Square Savings, powered by Square Financial Services, simplifies budgeting for sellers by allowing them to automatically set aside funds from daily sales into savings accounts. Square Checking provides sellers with an FDIC insured account that lets them access funds for business expenses using their Square Debit Card or for paying employees via Square Payroll. We believe that many sellers have had to rely on personal bank accounts, which create challenges when it comes to understanding the state of their business, accounting, and taxes.¹ With the newly launched account and routing numbers, sellers who also sell goods on other platforms, such as Amazon or Etsy, can direct all of their business finances to one consolidated home with Square. These critical banking tools work seamlessly with other Square solutions, giving sellers a unified look at their payments, account balances, and spending directly on their Square Dashboard or Point of Sale.
Growing upmarket
Mid-market sellers showed strong momentum in the second quarter as GPV from these sellers doubled since the same period in 2019, and represented more than one-third of total Seller GPV. We believe the breadth of our omnichannel software offerings is a primary reason that mid-market sellers join and stay with Square. These sellers use more products on average, and in the second quarter, software and integrated payments accounted for approximately 75% of mid-market seller gross profit. Our dynamic software is designed to support a range of sizes, verticals, and use cases: We offer in-person software such as Point of Sale and Square for Restaurants, online software such as Square Online and Invoices, and other software products that amplify the ecosystem’s value proposition and have improved retention, such as Loyalty. Our cohesive ecosystem allows for seamless integrations across online and offline channels, while allowing sellers to easily manage their employees and understand their customers and performance in one place. Software and integrated payments have been the fastest-growing products in the Seller ecosystem, delivering average annual gross profit growth of nearly 50% over the past four years, and have improved seller retention.

|
Square Savings brings more fair, accessible financial services to small business owners by removing the friction from setting aside funds, enabling sellers to effortlessly save a percentage of every Square sale they make. This account offers a 0.50% annual percentage yield, and has no minimum deposits, balance requirements, or account fees. These terms are subject to change. |
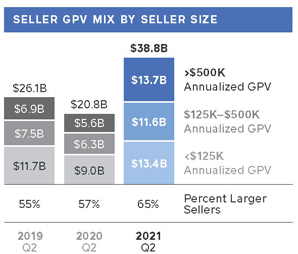
Note: We determine seller size based on annualized GPV during the applicable quarter. This only includes Seller GPV. Larger sellers are defined as greater than $125K in annualized GPV.
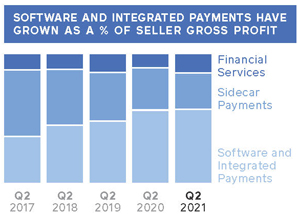
Software and integrated payments includes gross profit from in-person and online software that is monetized via embedded payments and/or monthly software subscription fees.
Sidecar payments includes gross profit from Square’s Point of Sale app where sellers only use payments without using any software features.
Financial Services includes gross profit from Square Banking and instant transfers.
|
|
SQUARE Q2 2021 6 |
In a survey of 500 Australian small businesses conducted by Square, we found that only one in four small businesses used funding accessed through a financial institution, while more than half had to rely on friends and family or personal finances.
Expanding globally
Our international strategy is focused on investing further into brand and product awareness while improving product parity in new and existing markets. We recently launched brand awareness campaigns in countries around the world with a focus on driving a broader understanding of our product capabilities. In the second quarter, we began offering loans to Square sellers in Australia, our first international market for Square Loans. During an important time of recovery, we believe widening access to credit will help our Australian sellers continue growing their businesses and creating new jobs. We also launched instant transfers in Canada, allowing sellers to transfer their funds to a bank account as soon as they’re received. In May, we entered Ireland with our most comprehensive new market launch yet, with ten software products and three hardware devices. Small businesses make up nearly all of Ireland’s total businesses, while the market’s payments and point-of-sale landscape has historically been dominated by traditional providers, presenting an opportunity for Square to stand out by offering innovative, omnichannel solutions.

In an effort to increase awareness of Square’s brand and value proposition, we recently launched brand marketing campaigns in Ireland and Japan.
SELLER HIGHLIGHT

We’re a relatively young business and so many banks wouldn’t even look at us. Those that would, would include hidden fees or take a long time to approve. With Square everything was incredibly transparent and really straightforward. Life is volatile at the moment, and the speed and ease of getting a Square Loan has enabled us to invest and grow our delivery service so we can operate no matter what COVID-19 restrictions are in place.”
Cameron
The Little Larder
Queensland, Australia
|
|
SQUARE Q2 2021 7 |
A reconciliation of non-GAAP metrics used in this letter to their nearest GAAP equivalents is provided at the end of this letter.
We deduct bitcoin revenue because our role is to facilitate customers’ access to bitcoin. When customers buy bitcoin through Cash App, we only apply a small margin to the market cost of bitcoin, which tends to be volatile and outside our control. Therefore, we believe bitcoin gross profit better reflects the economic benefits as well as our performance from these transactions.
Financial Discussion
REVENUE AND GROSS PROFIT
Total net revenue was $4.68 billion in the second quarter of 2021, up 143% year over year. Excluding bitcoin, total net revenue in the second quarter was $1.96 billion, up 87% year over year. Gross profit was $1.14 billion in the second quarter of 2021, up 91% year over year, and up 57% on a two-year CAGR basis.
Transaction-based revenue was $1.23 billion in the second quarter of 2021, up 80% year over year, and transaction-based gross profit was $543 million, up 85% year over year. We processed $42.8 billion in GPV in the second quarter of 2021, up 88% year over year. Transaction-based gross profit as a percentage of GPV was 1.27% in the second quarter of 2021, down 2 basis points year over year and down 5 basis points quarter over quarter.
Subscription and services-based revenue was $685 million in the second quarter of 2021, up 98% year over year, and subscription and services-based gross profit was $561 million, up 90% year over year. Growth in the quarter was driven by our Cash App and Seller ecosystems as well as the acquisition of TIDAL, which closed in the second quarter of 2021.
During the second quarter of 2021, we saw significant growth in bitcoin revenue year over year. While bitcoin revenue was $2.72 billion in the second quarter of 2021, up approximately 3x year over year, bitcoin gross profit was only $55 million, or approximately 2% of bitcoin revenue.

Note: Seller GPV and Cash App Business GPV are represented as a percent of total GPV. Cash App Business GPV is defined on page 9.
|
|
SQUARE Q2 2021 8 |
Cash App Business GPV is composed of the total dollar amount of Cash for Business and peer-to-peer payments sent from a credit card, and does not include GPV from our Seller ecosystem.
Bitcoin revenue is the total sale amount of bitcoin to customers. Bitcoin costs are the total amount of bitcoin that we purchase. We purchase bitcoin to facilitate customers’ access to bitcoin.
CASH APP ECOSYSTEM REVENUE AND GROSS PROFIT
Cash App delivered strong growth in the second quarter of 2021, generating $3.33 billion of revenue and $546 million of gross profit, which increased 177% and 94% year over year, respectively. On a two-year CAGR basis, revenue and gross profit for our Cash App ecosystem grew 258% and 128%, respectively. Excluding bitcoin, Cash App revenue was $606 million in the second quarter, up 87% year over year. We continued to drive acquisition of net-new transacting active Cash App customers and adoption of our broader ecosystem of products, as well as strong growth in customer inflows driven primarily by consumer spending.
Cash App Business GPV was $4.1 billion, up 107% year over year. Cash App generated $111 million of transaction-based revenue during the second quarter of 2021, up 107% year over year. Growth was driven by an increase in the number of business accounts and in the number of transactions.
Cash App generated $495 million of subscription and services-based revenue during the second quarter, up 83% year over year. Growth in the quarter was driven primarily by transaction fees from both Cash Card and Instant Deposit.
Cash App generated $2.72 billion of bitcoin revenue and $55 million of bitcoin gross profit during the second quarter of 2021, each up approximately 3x year over year. Bitcoin revenue and gross profit benefited from year-over-year increases in the price of bitcoin and bitcoin actives, and growth in customer demand. Compared to the first quarter of 2021, bitcoin revenue and gross profit decreased on a quarter-over-quarter basis, driven primarily by relative stability in the price of bitcoin, which affected trading activity compared to prior quarters. In future quarters, bitcoin revenue and gross profit may fluctuate as a result of changes in customer demand or the market price of bitcoin, particularly as we lap strong growth rates on a year-over-year basis in the second half of 2020.
|
|
SQUARE Q2 2021 9 |
We use gross profit retention to measure our ability to help our sellers grow over time.
Gross profit retention rate is calculated as the year-over-year gross profit growth of a quarterly seller cohort, averaged over the last four quarters (excluding gross profit from hardware, Square Gift Cards, Caviar, and Weebly prior to the acquisition). For example, retention for our 2019 cohort is the average annual gross profit growth from sellers onboarded in 2019. We do not include hardware or Square Gift Cards because they are typically non-recurring in nature, and we view hardware as an acquisition tool and not a profit center for our business. A seller cohort represents the new sellers onboarded to Square during a given period.
Card-not-present GPV includes our online channels and card-not-present manual key entry transactions.
SELLER ECOSYSTEM REVENUE AND GROSS PROFIT
In the second quarter of 2021, our Seller ecosystem generated $1.31 billion of revenue and $585 million of gross profit, up 81% and 85% on a year-over-year basis, respectively. On a two-year CAGR basis, revenue and gross profit for our Seller ecosystem grew 23% and 30%, respectively.
In the second quarter of 2021, Seller generated $1.12 billion of transaction-based revenue, up 78% year over year, and 21% on a two-year CAGR basis. We saw an improvement in card-present volumes behind regional reopenings, with particular strength in the U.S. driven in part by consumer spending and the impact of government disbursements. Even as in-person activity improved, online channels and international markets continued to deliver strong growth. We also saw improvements in retention as GPV from existing cohorts in aggregate came in above their 2019 levels in the second quarter, with particular strength from recently acquired cohorts, which index to larger and more omnichannel sellers. During the quarter, transaction-based gross profit for our Seller ecosystem was affected by a lower percentage of debit card transactions, a lower proportion of card-not-present volumes, and a decrease in average transaction size on a year-over-year basis. Although these factors decreased on a year-over-year basis, we recognize that these trends remained elevated relative to historical periods partly as a result of changes to consumer behaviors due to COVID-19 and government disbursements, which may not continue in future quarters.
During the second quarter of 2021, Seller GPV was up 86% year over year and 22% on a two-year CAGR basis. Looking at the components of Seller GPV, we observed the following trends during the second quarter of 2021.
| • | Products: Card-present GPV was up 128% year over year, and up 19% on a two-year CAGR basis. We saw a strong recovery in card-present volumes in the second quarter, driven primarily by regional reopenings and strong consumer spending. Card-not-present GPV was up 41% year over year and 28% on a two-year CAGR basis, driven primarily by growth from our online channels, including Square Online, Invoices, Virtual Terminal, and eCommerce API. |
| • | Geographies: Our largest U.S. metropolitan areas experienced a greater improvement in Seller GPV growth year over year compared to the rest of the U.S., primarily as a result of further regional reopenings. Our international markets achieved strong Seller GPV growth year over year during the second quarter despite periodic regional lockdowns affecting in-person activity. |
|
|
SQUARE Q2 2021 10 |
We began facilitating access to PPP loans in response to the COVID-19 pandemic, and PPP loans were not part of the ordinary course of operations for Square Loans prior to 2020. Future PPP loans or similar government programs will depend on government action and, at this time, we do not know to what extent these types of programs will continue, if at all.
Hardware is sold primarily as an acquisition tool, and generating positive gross margins from hardware sales is not the primary goal of the hardware business.
| Seller generated $151 million of subscription and services-based revenue during the second quarter of 2021, up 101% year over year, and up 30% on a two-year CAGR basis. |
| • | Square Loans: Square Loans (formerly Square Capital) achieved strong gross profit growth during the second quarter of 2021, facilitating approximately 105,000 loans totaling $778 million in originations. PPP loans totaled $151 million across more than 15,000 loans. Flex loans totaled $627 million across more than 89,000 loans. After pausing flex loan offers from early March to late July of 2020, we continued to expand loan offers during the second quarter behind improvements in underlying Seller GPV trends, nearing pre-pandemic quarterly origination levels for core flex loans. |
| • | Software subscriptions and Square Debit Card delivered strong growth during the quarter, outpacing overall Seller gross profit growth. |
Hardware revenue in the second quarter of 2021 was $44 million, up 126% year over year, generating a gross loss of $18 million, and up 40% on a two-year CAGR basis. Revenue growth was driven primarily by strong unit sales across our Square Register, Square Terminal, and third-party peripheral product offerings.
CORPORATE AND OTHER REVENUE AND GROSS PROFIT
Corporate and Other generated $39 million in revenue during the second quarter and $10 million in gross profit, and comprised areas outside our Seller and Cash App ecosystems.
|
|
SQUARE Q2 2021 11 |
We offer the peer-to-peer service free to our Cash App customers, and we consider it to be a marketing tool to encourage the use of Cash App.
Each quarter, we estimate transaction losses that may materialize in future periods related to that quarter’s volume. These estimates are typically based on predictive data science–based models, which historically have been close to future actual realized losses.
OPERATING EXPENSES
Operating expenses were $1.02 billion in the second quarter of 2021, up 64% year over year, and non-GAAP operating expenses were $787 million, up 57% year over year.
Product development expenses were $327 million on a GAAP basis and $205 million on a non-GAAP basis in the second quarter of 2021, up 57% and 65% year over year, respectively, driven primarily by headcount and personnel costs related to our engineering, data science, and design teams.
Sales and marketing expenses were $375 million on a GAAP basis and $359 million on a non-GAAP basis in the second quarter of 2021, up 58% and 57% year over year, respectively.
| • | Cash App marketing expenses were up 44% year over year, driven primarily by increases in peer-to-peer transactions and related transaction losses, Cash Card issuances, advertising, and referrals and incentives. |
| • | Other sales and marketing expenses, including advertising, personnel, and other costs, were up 82% year over year as we increased sales and marketing spend for our Seller ecosystem, including performance marketing, brand and awareness marketing, and sales headcount, as well as lapping the reduction in sales and marketing expenses in the second quarter of 2020 due to the onset of COVID-19. |
General and administrative expenses were $221 million on a GAAP basis and $175 million on a non-GAAP basis in the second quarter of 2021, up 62% and 57% year over year, respectively. The increase was due primarily to additions to customer support, finance, legal, and compliance personnel.
Transaction and loan loss expenses were $48 million in the second quarter of 2021, up 28% year over year, and up 19% on a two-year CAGR basis. Growth during the quarter was related primarily to strong year-over-year growth in Cash App. During the second quarter, we released provisions of $13 million for transaction losses related to our Seller business from the first quarter of 2021. Given the variability of potential outcomes related to the macro environment, actual realized losses may differ materially from our estimates for provisions.
|
|
SQUARE Q2 2021 12 |
The accounting rules for bitcoin will require us to recognize any decreases in market price below carrying value as an impairment charge, with no upward revisions recognized when the market price increases until the sale of that bitcoin. The bitcoin impairment loss is a GAAP expense. Non-GAAP operating expenses exclude bitcoin impairment losses.
In the fourth quarter of 2020 and first quarter of 2021, we invested $50 million and $170 million, respectively, in bitcoin. As an indefinite-lived intangible asset, bitcoin is subject to impairment losses if the fair value of bitcoin decreases below the carrying value during the assessed period. In the second quarter, we recognized a bitcoin impairment loss of $45 million on our bitcoin investment. As of June 30, 2021, the fair value of our investment in bitcoin was $281 million based on observable market prices, which is $127 million greater than the carrying value of the investment.
|
|
SQUARE Q2 2021 13 |
As of the end of the second quarter, we sold our entire investment in DoorDash for a cumulative gain of $321 million.
EARNINGS
In the second quarter of 2021, net income was $204 million. During the second quarter, we recognized a gain of $77 million driven primarily by the sale of our remaining investment in DoorDash. Net income was $173 million when excluding the $77 million gain on our equity investments and the $45 million loss related to the impairment of our bitcoin investment. Net income per share was $0.45 and $0.40 on a basic and diluted basis, respectively, in the second quarter of 2021, based on 455 million weighted-average basic shares and 523 million weighted-average diluted shares. Excluding the gains from our investments in DoorDash and losses from our investments in bitcoin, basic and diluted net income per share in the second quarter of 2021 was $0.39 and $0.34, respectively.
Adjusted EBITDA was $360 million in the second quarter of 2021, compared to $98 million in the second quarter of 2020. The increase in Adjusted EBITDA compared to the prior-year period was driven by gross profit growth across our Seller and Cash App ecosystems.
Adjusted Net Income Per Share (Adjusted EPS) was $0.66 on a diluted basis based on 523 million weighted-average diluted shares for the second quarter of 2021, representing a $0.48 improvement year over year.
The following items affected net income (loss) per share during the respective periods. In the second quarter of 2021, we recognized a gain of $77 million driven primarily by the sale of our remaining investment in DoorDash as well as a $45 million bitcoin impairment. In the first quarter of 2021, we recognized a loss of $29 million related to our investment in DoorDash as well as a $20 million bitcoin impairment. In the fourth quarter of 2020, we recognized a gain of $274 million related to equity investments, driven primarily by a gain of $255 million as a result of the mark-to-market valuation of our DoorDash investment. In the second quarter of 2020, we recognized a gain of $21 million related to observable price changes for non-marketable equity investments.
|
|
SQUARE Q2 2021 14 |
BALANCE SHEET/CASH FLOW
We ended the second quarter of 2021 with $7.1 billion in available liquidity, with $6.6 billion in cash, cash equivalents, restricted cash, and investments in marketable debt securities, as well as $500 million available to be withdrawn from our revolving credit facility.
In the second quarter of 2021, Adjusted EBITDA and the issuance of senior unsecured notes contributed positively to our cash balance. This was partly offset by cash outflows due primarily to the acquisition of TIDAL and payments for tax withholding related to vesting of restricted stock units. We had two transactions in the quarter, per below, that significantly affected our cash balance.
First, on May 20, 2021, we completed an offering of $2.0 billion in senior notes. This offering strengthens our balance sheet and supports the growth of our business and continued investment to drive long-term growth. The notes mature in 2026 and 2031, with coupons of 2.75% and 3.50%, respectively. The net proceeds from the offering were $1.97 billion, after deducting the net costs of certain offering expenses.
Second, in April 2021, we completed the acquisition of a significant majority ownership stake in TIDAL, a global music and entertainment platform, for an aggregate consideration of $302 million. The acquisition was partly funded with $164 million in cash (net of cash acquired).
|
|
SQUARE Q2 2021 15 |
July Trends and
Forward-Looking Commentary
We wanted to provide an update on the trends in our business during the month of July.
BUSINESS TRENDS
Seller ecosystem
| • | In July, we expect Seller to deliver strong gross profit growth year over year. Seller GPV is expected to be up more than 45% year over year in July, and the two-year CAGR is expected to be up 25%, compared to 22% growth in the second quarter on a two-year CAGR basis. GPV growth trends continued to vary by region, product, and vertical, depending primarily on differences in the timing and phases of reopenings. |
Cash App ecosystem
| • | In July, we expect Cash App to deliver positive gross profit growth year over year while lapping strong growth from the prior-year period, with strong gross profit growth on a two-year CAGR basis. |
| • | We achieved strong engagement across products in our Cash App ecosystem. Gross profit growth also benefited from customers pulling more funds into their Cash App accounts. |
Growth comparisons: Looking ahead to the remainder of 2021, we believe two-year compound annual growth rates from 2019 through 2021 will help reflect underlying trends in each ecosystem. In the third quarter of 2021, Cash App will lap strong gross profit growth of 212% year over year in the third quarter of 2020. On the other hand, in the third quarter of 2021, Seller will lap only 12% year-over-year gross profit growth in the third quarter of 2020 due to regional restrictions affecting in-person activity.
All growth comparisons for July 2021 are on a year-over-year basis, unless otherwise specified.
|
|
SQUARE Q2 2021 16 |
OPERATING EXPENSES
We believe our Cash App and Seller ecosystems are well-positioned to help our customers adapt in a very dynamic environment, based on trends we have observed during recent quarters. We intend to prioritize investments in our Cash App and Seller ecosystems that we believe will help drive attractive long-term returns.
For the third quarter of 2021, we expect non-GAAP product development, sales and marketing, and general and administrative expenses, in aggregate, to increase by approximately $150 million compared to the second quarter of 2021, on a dollar basis.
For the full year of 2021, we expect non-GAAP product development, sales and marketing, and general and administrative expenses, in aggregate, to increase by approximately $1.1 billion to $1.2 billion compared to the full year of 2020, representing growth of 55% year over year at the midpoint.
Transaction and loan losses: In the third quarter of 2021, we expect transaction and loan loss expense to increase by approximately $20 million compared to the second quarter of 2021. Given the variability of potential outcomes related to the growth of our business and the macro environment, actual realized losses may differ materially from our estimates for provisions, depending on a number of factors, including the length and severity of the impact from COVID-19.
Share-based compensation: We intend on continuing to invest in building out our teams, including attracting, hiring, and retaining talented employees. In the third quarter of 2021, we expect our share-based compensation expense to increase modestly quarter over quarter on a dollar basis. These share-based compensation expenses are not included in the aforementioned non-GAAP product development, sales and marketing, and general and administrative expenses.
We have not provided the forward-looking GAAP equivalents for certain forward-looking non-GAAP operating expenses or a GAAP reconciliation as a result of the uncertainty regarding, and the potential variability of, reconciling items such as share-based compensation expense. Accordingly, a reconciliation of these non-GAAP guidance metrics to their corresponding GAAP equivalents is not available without unreasonable effort. However, it is important to note that material changes to reconciling items could have a significant effect on future GAAP results. We have provided a reconciliation of other GAAP to non-GAAP metrics in tables at the end of this letter.
|
|
SQUARE Q2 2021 17 |
Earnings
Webcast
Square (NYSE: SQ) will host a conference call and earnings webcast at 5:00 a.m. Pacific time/8:00 a.m. Eastern time, August 2, to discuss these financial results. To register to participate in the conference call, or to listen to the live audio webcast, please visit the Events & Presentations section of Square’s Investor Relations website at investors.squareup.com. A replay will be available on the same website following the call.
We will release financial results for the third quarter of 2021 on November 4, 2021, after the market closes, and will also host a conference call and earnings webcast at 2:00 p.m. Pacific time/5:00 p.m. Eastern time on the same day to discuss those financial results.

|

|
|||
| Jack Dorsey |
Amrita Ahuja |
|||
| CEO | CFO | |||
|
|
SQUARE Q2 2021 18 |

|
|
SQUARE Q2 2021 19 |


|
As a business born during the pandemic, being nimble and aware of cash flow has always been important. Square Debit Card gives us the freedom to not only manage our cash flow, but be flexible in our daily operations. By having immediate access to our funds, we’re able to buy everything from chicken for our signature chicken sandwiches to paper goods, all while paying our vendors and employees.”
Warren Satchell Cofounder/Chief Operations Officer, Harlem Biscuit Co. New York, NY |

|
|
SQUARE Q2 2021 20 |
SAFE HARBOR STATEMENT
This letter contains forward-looking statements within the meaning of the Safe Harbor provisions of the Private Securities Litigation Reform Act of 1995. All statements other than statements of historical fact could be deemed forward-looking, including, but not limited to, statements regarding the future performance of Square, Inc. and its consolidated subsidiaries (the Company); the Company’s expected financial results, guidance, and general business outlook for future periods; expected impact of the COVID-19 pandemic and related responses of governments and private industry, including the impact of reduced restrictions on businesses and individuals and government stimulus and assistance programs, on the Company’s business, financial results, financial position, and liquidity; future profitability and growth in the Company’s businesses and products and the Company’s ability to drive such profitability and growth; the Company’s expectations regarding scale, economics, and the demand for or benefits from its products, product features, and services; the Company’s international plans; the Company’s expectations regarding its near-term and long-term strategic priorities; the ability of the Company’s products to attract and retain customers; trends in the Company’s markets and the continuation of such trends; the resiliency and growth of the Company’s Seller and Cash App ecosystems; the Company’s expectations regarding future expenses, including future transaction and loan losses and the Company’s estimated reserves for such losses; the Company’s bitcoin investments and strategy as well as the potential financial impact and volatility; and management’s statements related to business strategy, plans, investments, opportunities, and objectives for future operations. In some cases, forward-looking statements can be identified by terms such as “may,” “will,” “appears,” “should,” “expects,” “plans,” “anticipates,” “could,” “intends,” “target,” “projects,” “contemplates,” “believes,” “estimates,” “predicts,” “potential,” or “continue,” or the negative of these words or other similar terms or expressions that concern our expectations, strategy, plans, or intentions. Such statements are subject to a number of known and unknown risks, uncertainties, assumptions, and other factors that may cause the Company’s actual results, performance, or achievements to differ materially from results expressed or implied in this letter. Investors are cautioned not to place undue reliance on these statements, and reported results should not be considered as an indication of future performance.
Risks that contribute to the uncertain nature of the forward-looking statements include, among others, uncertainty around the COVID-19 pandemic and the related effects of government and other measures; an economic downturn in the United States and in other countries around the world; the Company’s ability to deal with the substantial and increasingly intense competition in its industry and to develop and deliver products and services to address the rapidly evolving market for payments and point-of-sale, financial, and marketing services; the Company’s ability to retain existing customers, attract new customers, and increase sales to all customers; the Company’s ability to ensure the interoperability of its technology with that of third parties; changes to the rules and practices of payment card networks and acquiring processors; the impact of acquisitions or divestitures, strategic investments, joint ventures, or entries into new businesses; the effect of extensive regulation and oversight related to the Company’s business in a variety of areas; the effect of management changes and business initiatives; the liabilities and loss potential associated with new products, product features, and services, including those launched in connection with the COVID-19 pandemic; adoption of the Company’s products and services in international markets; and changes in political, business, and economic conditions; as well as other risks listed or described from time to time in the Company’s filings with the Securities and Exchange Commission (the SEC), including the Company’s Quarterly Report on Form 10-Q for the fiscal quarter ended March 31, 2021, which is on file with the SEC and available on the Investor Relations page of the Company’s website. Additional information will also be set forth in the Company’s Quarterly Report on Form 10-Q for the fiscal quarter ended June 30, 2021. All forward-looking statements are based on information and estimates available to the Company at the time of this letter and are not guarantees of future performance. Except as required by law, the Company assumes no obligation to update any of the statements in this letter.
|
|
SQUARE Q2 2021 21 |
KEY OPERATING METRICS AND
NON-GAAP FINANCIAL MEASURES
To supplement our financial information presented in accordance with generally accepted accounting principles in the United States (GAAP), we consider certain operating and financial measures that are not prepared in accordance with GAAP, including Gross Payment Volume (GPV), Adjusted EBITDA, Adjusted EBITDA margin, Adjusted Net Income (Loss), Diluted Adjusted Net Income (Loss) Per Share (Adjusted EPS), and non-GAAP operating expenses as well as other measures defined in the shareholder letter such as measures excluding bitcoin revenue, bitcoin impairment loss, and measures excluding gains or losses on equity investments. We believe these metrics and measures are useful to facilitate period-to-period comparisons of our business and to facilitate comparisons of our performance to that of other payments solution providers.
We define GPV as the total dollar amount of all card payments processed by sellers using Square, net of refunds and ACH transfers. Additionally, GPV includes Cash App activity related to Cash for Business and to peer-to-peer payments sent from a credit card. Cash for Business includes peer-to-peer transactions received from business accounts using Cash App.
Adjusted EBITDA, Adjusted EBITDA margin, Adjusted Net Income (Loss), and Diluted Adjusted Net Income (Loss) Per Share (Adjusted EPS) are non-GAAP financial measures that represent our net income (loss) and net income (loss) per share, adjusted to eliminate the effect of share-based compensation expenses; amortization of intangible assets; gain or loss on revaluation of equity investments; bitcoin impairment loss; and the gain or loss on the disposal of property and equipment, as applicable. Prior to the adoption of ASU No. 2020-06 on January 1, 2021, we also adjusted to eliminate the effect of amortization of debt discount and issuance costs on our convertible senior notes, and the gain or loss on debt extinguishment related to the conversion of senior notes. Subsequent to the adoption, we adjusted to eliminate the effect of amortization of debt issuance costs on our convertible and unsecured senior notes. We also exclude certain costs associated with acquisitions and other activities that are not normal recurring operating expenses, including amounts paid to redeem acquirees’ unvested stock-based compensation awards, and legal, accounting, and due diligence costs, and we add back the impact of the acquired deferred revenue and deferred cost adjustment, which was written down to fair value in purchase accounting. Additionally, for purposes of calculating diluted Adjusted EPS, we add back cash interest expense on convertible senior notes, as if converted at the beginning of the period, if the impact is dilutive. In addition to the items above, Adjusted EBITDA is a non-GAAP financial measure that also excludes depreciation and amortization, interest income and expense, other income and expense, and provision or benefit from income taxes, as applicable. To calculate the diluted Adjusted EPS, we adjust the weighted-average number of shares of common stock outstanding for the dilutive effect of all potential shares of common stock. In periods when we recorded an Adjusted Net Loss, the diluted Adjusted EPS is the same as basic Adjusted EPS because the effects of potentially dilutive items were anti-dilutive given the Adjusted Net Loss position.
Non-GAAP operating expenses is a non-GAAP financial measure that represents operating expenses adjusted to remove the impact of share-based compensation, depreciation and amortization, bitcoin impairment loss, loss on disposal of property and equipment, and acquisition-related costs. Adjusted EBITDA margin is calculated as Adjusted EBITDA divided by gross profit.
We have included Adjusted EBITDA, Adjusted EPS, and non-GAAP operating expenses because they are key measures used by our management to evaluate our operating performance, generate future operating plans, and make strategic decisions, including those relating to operating expenses and the allocation of internal resources.
Accordingly, we believe that Adjusted EBITDA, Adjusted EPS, and non-GAAP operating expenses provide useful information to investors and others in understanding and evaluating our operating results in the same manner as our management and board of directors. In addition, they provide useful measures for period-to-period comparisons of our business, as they remove the effect of certain non-cash items and certain variable charges. We have included measures excluding bitcoin revenue because our role is to facilitate customers’ access to bitcoin. When customers buy bitcoin through Cash App, we only apply a small margin to the market cost of bitcoin, which tends to be volatile and outside our control. Therefore, we believe deducting bitcoin revenue better reflects the economic benefits as well as our performance from these transactions. We have included measures excluding gains or losses on equity investments as well as bitcoin impairment losses because we believe these measures are useful in understanding our operating results without regard to gains and losses due to non-operating market fluctuations of our investments.
Adjusted EBITDA, Adjusted EPS, and non-GAAP operating expenses, as well as other measures defined in the shareholder letter, such as measures excluding bitcoin revenue, bitcoin impairment loss, and measures excluding gains or losses on equity investments, have limitations as financial measures, and should be considered as supplemental in nature, and are not meant as substitutes for the related financial information prepared in accordance with GAAP.
We believe that the aforementioned metrics provide useful information about our operating results, enhance the overall understanding of our past performance and future prospects, and provide useful measures for period-to-period comparisons of our business, as they remove the effect of certain variable amounts. Our management uses these measures to evaluate our operating performance, generate future operating plans, and make strategic decisions, including those relating to operating expenses and the allocation of internal resources.
These non-GAAP financial measures should not be considered in isolation from, or as a substitute for, financial information prepared in accordance with GAAP. These non-GAAP financial measures are not based on any standardized methodology prescribed by GAAP and are not necessarily comparable to similarly titled measures presented by other companies.
|
|
SQUARE Q2 2021 22 |
Consolidated Statements
of Operations
UNAUDITED
In thousands, except per share data
| THREE MONTHS ENDED | SIX MONTHS ENDED | |||||||||||||||
| June 30, 2021 | June 30, 2020 | June 30, 2021 | June 30, 2020 | |||||||||||||
| Revenue: |
||||||||||||||||
| Transaction-based revenue |
$ | 1,227,472 | $ | 682,572 | $ | 2,187,205 | $ | 1,440,673 | ||||||||
| Subscription and services-based revenue |
685,178 | 346,275 | 1,242,859 | 642,510 | ||||||||||||
| Hardware revenue |
43,726 | 19,322 | 72,514 | 39,997 | ||||||||||||
| Bitcoin revenue |
2,724,296 | 875,456 | 6,235,364 | 1,181,554 | ||||||||||||
|
|
|
|
|
|
|
|
||||||||||
| Total net revenue |
4,680,672 | 1,923,625 | 9,737,942 | 3,304,734 | ||||||||||||
|
|
|
|
|
|
|
|
||||||||||
| Cost of revenue: |
||||||||||||||||
| Transaction-based costs |
684,839 | 389,136 | 1,211,618 | 855,602 | ||||||||||||
| Subscription and services-based costs |
123,725 | 51,365 | 214,098 | 93,273 | ||||||||||||
| Hardware costs |
61,403 | 28,320 | 101,885 | 63,128 | ||||||||||||
| Bitcoin costs |
2,669,641 | 858,041 | 6,105,776 | 1,157,467 | ||||||||||||
|
|
|
|
|
|
|
|
||||||||||
| Total cost of revenue |
3,539,608 | 1,326,862 | 7,633,377 | 2,169,470 | ||||||||||||
|
|
|
|
|
|
|
|
||||||||||
| Gross profit |
1,141,064 | 596,763 | 2,104,565 | 1,135,264 | ||||||||||||
|
|
|
|
|
|
|
|
||||||||||
| Operating expenses: |
||||||||||||||||
| Product development |
326,510 | 207,730 | 636,651 | 403,606 | ||||||||||||
| Sales and marketing |
375,101 | 238,096 | 724,561 | 432,631 | ||||||||||||
| General and administrative |
221,020 | 136,386 | 416,929 | 265,881 | ||||||||||||
| Transaction and loan losses |
48,173 | 37,603 | 68,568 | 146,486 | ||||||||||||
| Bitcoin impairment losses |
45,266 | — | 65,126 | — | ||||||||||||
|
|
|
|
|
|
|
|
||||||||||
| Total operating expenses |
1,016,070 | 619,815 | 1,911,835 | 1,248,604 | ||||||||||||
|
|
|
|
|
|
|
|
||||||||||
| Operating income (loss) |
124,994 | (23,052 | ) | 192,730 | (113,340 | ) | ||||||||||
|
|
|
|
|
|
|
|
||||||||||
| Interest expense, net |
6,464 | 14,769 | 6,717 | 23,975 | ||||||||||||
| Other (income), net |
(75,788 | ) | (25,591 | ) | (48,260 | ) | (19,729 | ) | ||||||||
|
|
|
|
|
|
|
|
||||||||||
| Income (loss) before income tax |
194,318 | (12,230 | ) | 234,273 | (117,586 | ) | ||||||||||
|
|
|
|
|
|
|
|
||||||||||
| Benefit for income taxes |
(9,360 | ) | (752 | ) | (8,413 | ) | (217 | ) | ||||||||
|
|
|
|
|
|
|
|
||||||||||
| Net income (loss) |
203,678 | (11,478 | ) | 242,686 | (117,369 | ) | ||||||||||
| Net income (loss) attributable to noncontrolling interests |
(343 | ) | — | (343 | ) | — | ||||||||||
|
|
|
|
|
|
|
|
||||||||||
| Net income (loss) attributable to common stockholders |
$ | 204,021 | $ | (11,478 | ) | $ | 243,029 | $ | (117,369 | ) | ||||||
|
|
|
|
|
|
|
|
||||||||||
| Net income (loss) per share attributable to common stockholders: |
||||||||||||||||
| Basic |
$ | 0.45 | $ | (0.03 | ) | $ | 0.53 | $ | (0.27 | ) | ||||||
|
|
|
|
|
|
|
|
||||||||||
| Diluted |
$ | 0.40 | $ | (0.03 | ) | $ | 0.48 | $ | (0.27 | ) | ||||||
|
|
|
|
|
|
|
|
||||||||||
| Weighted-average shares used to compute net income (loss) per share attributable to common stockholders |
||||||||||||||||
| Basic |
455,431 | 440,117 | 455,203 | 437,529 | ||||||||||||
|
|
|
|
|
|
|
|
||||||||||
| Diluted |
522,578 | 440,117 | 519,713 | 437,529 | ||||||||||||
|
|
|
|
|
|
|
|
||||||||||
|
|
SQUARE Q2 2021 23 |
Consolidated Balance Sheets
In thousands, except share and per share data
| June 30, 2021 | Dec 31, 2020 | |||||||
| (UNAUDITED) | (AUDITED) | |||||||
| Assets | ||||||||
| Current assets: |
||||||||
| Cash and cash equivalents |
$ | 4,581,234 | $ | 3,158,058 | ||||
| Investments in short-term debt securities |
1,014,903 | 695,112 | ||||||
| Settlements receivable |
1,155,757 | 1,024,895 | ||||||
| Customer funds |
2,847,477 | 2,037,832 | ||||||
| Loans held for sale |
807,402 | 462,665 | ||||||
| Other current assets |
593,462 | 383,067 | ||||||
|
|
|
|
||||||
| Total current assets |
11,000,235 | 7,761,629 | ||||||
|
|
|
|
||||||
| Property and equipment, net |
260,883 | 233,520 | ||||||
| Goodwill |
501,400 | 316,701 | ||||||
| Acquired intangible assets, net |
262,196 | 137,612 | ||||||
| Investments in long-term debt securities |
947,093 | 463,950 | ||||||
| Operating lease right-of-use assets |
461,277 | 456,888 | ||||||
| Other non-current assets |
382,604 | 499,250 | ||||||
|
|
|
|
||||||
| Total assets |
$ | 13,815,688 | $ | 9,869,550 | ||||
|
|
|
|
||||||
| Liabilities and Stockholders’ Equity | ||||||||
| Current liabilities: |
||||||||
| Customers payable |
$ | 3,993,164 | $ | 3,009,051 | ||||
| Settlements payable |
257,008 | 239,362 | ||||||
| Accrued expenses and other current liabilities |
515,813 | 360,850 | ||||||
| Operating lease liabilities, current |
57,102 | 52,747 | ||||||
| PPP Liquidity Facility advances |
823,683 | 464,094 | ||||||
|
|
|
|
||||||
| Total current liabilities |
5,646,770 | 4,126,104 | ||||||
|
|
|
|
||||||
| Long-term debt |
4,841,277 | 2,586,924 | ||||||
| Operating lease liabilities, non-current |
404,571 | 389,662 | ||||||
| Other non-current liabilities |
186,369 | 85,291 | ||||||
|
|
|
|
||||||
| Total liabilities |
11,078,987 | 7,187,981 | ||||||
| Stockholders’ equity: |
||||||||
| Preferred stock, $0.0000001 par value: 100,000,000 shares authorized at June 30, 2021 and December 31, 2020. None issued and outstanding at June 30, 2021 and December 31, 2020. |
— | — | ||||||
| Class A common stock, $0.0000001 par value: 1,000,000,000 shares authorized at June 30, 2021 and December 31, 2020; 395,321,647 and 390,187,079 issued and outstanding at June 30, 2021 and December 31, 2020, respectively. |
— | — | ||||||
| Class B common stock, $0.0000001 par value: 500,000,000 shares authorized at June 30, 2021 and December 31, 2020; 62,501,770 and 65,997,697 issued and outstanding at June 30, 2021 and December 31, 2020, respectively. |
— | — | ||||||
| Additional paid-in capital |
2,632,234 | 2,955,464 | ||||||
| Accumulated other comprehensive income |
7,838 | 23,328 | ||||||
| Retained earnings (accumulated deficit) |
48,780 | (297,223 | ) | |||||
|
|
|
|
||||||
| Total stockholders’ equity attributable to common stockholders |
2,688,852 | 2,681,569 | ||||||
| Noncontrolling interests |
47,849 | — | ||||||
|
|
|
|
||||||
| Total stockholders’ equity |
2,736,701 | 2,681,569 | ||||||
|
|
|
|
||||||
| Total liabilities and stockholders’ equity |
$ | 13,815,688 | $ | 9,869,550 | ||||
|
|
|
|
||||||
|
|
SQUARE Q2 2021 24 |
Consolidated Statements
of Cash Flows
UNAUDITED
In thousands
| SIX MONTHS ENDED | ||||||||
| June 30, 2021 | June 30, 2020 | |||||||
| Cash Flows from Operating Activities | ||||||||
| Net income (loss) |
$ | 242,686 | $ | (117,369 | ) | |||
| Adjustments to reconcile net income (loss) to net cash provided by (used in) operating activities: |
||||||||
| Depreciation and amortization |
57,595 | 41,117 | ||||||
| Non-cash interest and other |
11,324 | 32,769 | ||||||
| Loss on extinguishment of long-term debt |
— | 990 | ||||||
| Share-based compensation |
264,988 | 173,713 | ||||||
| Gain on revaluation of equity investment |
(47,843 | ) | (20,999 | ) | ||||
| Bitcoin impairment losses |
65,126 | — | ||||||
| Non-cash lease expense |
41,047 | 32,343 | ||||||
| Transaction and loan losses |
68,568 | 146,486 | ||||||
| Change in deferred income taxes |
(473 | ) | (1,024 | ) | ||||
| Changes in operating assets and liabilities: |
||||||||
| Settlements receivable |
(220,975 | ) | (339,886 | ) | ||||
| Customer funds |
(757,987 | ) | (953,387 | ) | ||||
| Purchase and originations of loans |
(1,664,016 | ) | (1,466,391 | ) | ||||
| Sales and principal payments of loans |
1,284,077 | 1,041,208 | ||||||
| Customers payable |
985,322 | 1,291,968 | ||||||
| Settlements payable |
17,646 | 83,297 | ||||||
| Other assets and liabilities |
(49,273 | ) | (96,668 | ) | ||||
|
|
|
|
||||||
| Net cash provided by (used in) operating activities |
297,812 | (151,833 | ) | |||||
|
|
|
|
||||||
| Cash Flows from Investing Activities | ||||||||
| Purchase of marketable debt securities |
(1,482,486 | ) | (724,862 | ) | ||||
| Proceeds from maturities of marketable debt securities |
296,082 | 267,686 | ||||||
| Proceeds from sale of marketable debt securities |
374,760 | 330,626 | ||||||
| Purchase of marketable debt securities from customer funds |
(387,463 | ) | (265,287 | ) | ||||
| Proceeds from maturities of marketable debt securities from customer funds |
334,200 | 142,000 | ||||||
| Proceeds from sale of marketable debt securities from customer funds |
— | 22,457 | ||||||
| Purchase of property and equipment |
(66,628 | ) | (56,561 | ) | ||||
| Purchase of bitcoin investments |
(170,000 | ) | — | |||||
| Purchase of other investments |
(45,425 | ) | — | |||||
| Proceeds from sale of equity investments |
378,225 | — | ||||||
| Business combinations, net of cash acquired |
(164,304 | ) | (18,354 | ) | ||||
|
|
|
|
||||||
| Net cash used in investing activities |
(933,039 | ) | (302,295 | ) | ||||
|
|
|
|
||||||
| Cash Flows from Financing Activities | ||||||||
| Proceeds from issuance of convertible senior notes, net |
— | 986,241 | ||||||
| Purchase of convertible senior note hedges |
— | (149,200 | ) | |||||
| Proceeds from issuance of warrants |
— | 99,500 | ||||||
| Proceeds from issuance of senior unsecured notes, net |
1,971,828 | — | ||||||
| Proceeds from PPP Liquidity Facility advances |
681,542 | 447,764 | ||||||
| Repayments from PPP Liquidity Facility advances |
(321,953 | ) | — | |||||
| Payments for tax withholding related to vesting of restricted stock units |
(292,225 | ) | (93,654 | ) | ||||
| Proceeds from the exercise of stock options and purchases under the |
72,155 | 78,085 | ||||||
| employee stock purchase plan, net |
||||||||
| Other financing activities |
— | (1,924 | ) | |||||
|
|
|
|
||||||
| Net cash provided by financing activities |
2,111,347 | 1,366,812 | ||||||
|
|
|
|
||||||
| Effect of foreign exchange rate on cash and cash equivalents |
(7,092 | ) | (5,182 | ) | ||||
|
|
|
|
||||||
| Net increase in cash, cash equivalents and restricted cash |
1,496,028 | 907,502 | ||||||
| Cash, cash equivalents and restricted cash, beginning of period |
3,201,863 | 1,098,706 | ||||||
|
|
|
|
||||||
| Cash, cash equivalents and restricted cash, end of period |
$ | 4,670,891 | $ | 2,006,208 | ||||
|
|
|
|
||||||
|
|
SQUARE Q2 2021 25 |
Operating Segment Disclosures
UNAUDITED
Information on the reportable segments revenue and segment operating
profit are as follows (in thousands):
| THREE MONTHS ENDED | SIX MONTHS ENDED | |||||||||||||||||||||||||||||||
| JUNE 30, 2021 | JUNE 30, 2021 | |||||||||||||||||||||||||||||||
| Cash App | Seller | Corporate and Other(i) |
Total | Cash App | Seller | Corporate and Other(i) |
Total | |||||||||||||||||||||||||
| Revenue |
||||||||||||||||||||||||||||||||
| Transaction-based revenue |
$ | 110,950 | $ | 1,116,522 | $ | — | $ | 1,227,472 | $ | 202,909 | $ | 1,984,296 | $ | — | $ | 2,187,205 | ||||||||||||||||
| Subscription and services-based revenue |
494,945 | 151,240 | 38,993 | 685,178 | 931,534 | 272,332 | 38,993 | 1,242,859 | ||||||||||||||||||||||||
| Hardware revenue |
— | 43,726 | — | 43,726 | — | 72,514 | — | 72,514 | ||||||||||||||||||||||||
| Bitcoin revenue |
2,724,296 | — | — | 2,724,296 | 6,235,364 | — | — | 6,235,364 | ||||||||||||||||||||||||
|
|
|
|
|
|
|
|
|
|
|
|
|
|
|
|
|
|
||||||||||||||||
| Segment revenue |
3,330,191 | 1,311,488 | 38,993 | 4,680,672 | 7,369,807 | 2,329,142 | 38,993 | 9,737,942 | ||||||||||||||||||||||||
|
|
|
|
|
|
|
|
|
|
|
|
|
|
|
|
|
|
||||||||||||||||
| Segment gross profit |
$ | 546,053 | $ | 585,137 | $ | 9,874 | $ | 1,141,064 | $ | 1,041,538 | $ | 1,053,153 | $ | 9,874 | $ | 2,104,565 | ||||||||||||||||
|
|
|
|
|
|
|
|
|
|
|
|
|
|
|
|
|
|
||||||||||||||||
| THREE MONTHS ENDED | SIX MONTHS ENDED | |||||||||||||||||||||||||||||||
| JUNE 30, 2020 | JUNE 30, 2020 | |||||||||||||||||||||||||||||||
| Cash App | Seller | Corporate and Other(i) |
Total | Cash App | Seller | Corporate and Other(i) |
Total | |||||||||||||||||||||||||
| Revenue |
||||||||||||||||||||||||||||||||
| Transaction-based revenue $ |
53,657 | $ | 628,915 | $ | — $ | 682,572 | $ | 81,476 | $ | 1,359,197 | $ | — | $ | 1,440,673 | ||||||||||||||||||
| Subscription and services-based revenue |
271,156 | 75,119 | — | 346,275 | 464,881 | 177,629 | — | 642,510 | ||||||||||||||||||||||||
| Hardware revenue |
— | 19,322 | — | 19,322 | — | 39,997 | — | 39,997 | ||||||||||||||||||||||||
| Bitcoin revenue |
875,456 | — | — | 875,456 | 1,181,554 | — | — | 1,181,554 | ||||||||||||||||||||||||
|
|
|
|
|
|
|
|
|
|
|
|
|
|
|
|
|
|
||||||||||||||||
| Segment revenue |
1,200,269 | 723,356 | — | 1,923,625 | 1,727,911 | 1,576,823 | — | 3,304,734 | ||||||||||||||||||||||||
|
|
|
|
|
|
|
|
|
|
|
|
|
|
|
|
|
|
||||||||||||||||
| Segment gross profit $ |
281,063 | $ | 315,700 | $ | — | $ | 596,763 | $ | 463,795 | $ | 671,469 | $ | — | $ | 1,135,264 | |||||||||||||||||
|
|
|
|
|
|
|
|
|
|
|
|
|
|
|
|
|
|
||||||||||||||||
A reconciliation of total segment gross profit to the Company’s income (loss)
before applicable income taxes is as follows (in thousands):
| THREE MONTHS ENDED | SIX MONTHS ENDED | |||||||||||||||
| June 30, 2021 | June 30, 2020 | June 30, 2021 | June 30, 2020 | |||||||||||||
| Total segment gross profit |
$ | 1,141,064 | $ | 596,763 | $ | 2,104,565 | $ | 1,135,264 | ||||||||
| Less: Product Development |
326,510 | 207,730 | 636,651 | 403,606 | ||||||||||||
| Less: Sales and Marketing |
375,101 | 238,096 | 724,561 | 432,631 | ||||||||||||
| Less: General and Administrative |
221,020 | 136,386 | 416,929 | 265,881 | ||||||||||||
| Less: Transaction and loan losses |
48,173 | 37,603 | 68,568 | 146,486 | ||||||||||||
| Less: Bitcoin impairment losses |
45,266 | — | 65,126 | — | ||||||||||||
| Less: Interest expense, net |
6,464 | 14,769 | 6,717 | 23,975 | ||||||||||||
| Less: Other (income), net |
(75,788 | ) | (25,591 | ) | (48,260 | ) | (19,729 | ) | ||||||||
|
|
|
|
|
|
|
|
||||||||||
| Income (loss) before applicable income taxes |
$ | 194,318 | $ | (12,230 | ) | $ | 234,273 | $ | (117,586 | ) | ||||||
|
|
|
|
|
|
|
|
||||||||||
(i) Corporate and other represents results related to products and services that are not assigned to a specific reportable segment. Comparable prior period amounts have not been disclosed as they were not material.
|
|
SQUARE Q2 2021 26 |
Key Operating Metrics and
Non-GAAP Financial Measures
UNAUDITED
In thousands, except GPV and per share data
| THREE MONTHS ENDED | SIX MONTHS ENDED | |||||||||||||||
| June 30, 2021 | June 30, 2020 | June 30, 2021 | June 30, 2020 | |||||||||||||
| Gross Payment Volume (GPV) (in millions) |
$ | 42,828 | $ | 22,801 | $ | 75,966 | $ | 48,544 | ||||||||
| Adjusted EBITDA (in thousands) |
$ | 359,820 | $ | 97,931 | $ | 569,069 | $ | 107,262 | ||||||||
| Adjusted Net Income Per Share: |
||||||||||||||||
| Basic |
$ | 0.76 | $ | 0.20 | $ | 1.23 | $ | 0.18 | ||||||||
| Diluted |
$ | 0.66 | $ | 0.18 | $ | 1.08 | $ | 0.17 | ||||||||
Adjusted EBITDA
UNAUDITED
In thousands
| THREE MONTHS ENDED | SIX MONTHS ENDED | |||||||||||||||
| June 30, 2021 | June 30, 2020 | June 30, 2021 | June 30, 2020 | |||||||||||||
| Net income (loss) attributable to common stockholders | $ | 204,021 | $ | (11,478 | ) | $ | 243,029 | $ | (117,369 | ) | ||||||
| Net income (loss) attributable to noncontrolling interests | (343 | ) | — | (343 | ) | — | ||||||||||
|
|
|
|
|
|
|
|
||||||||||
| Net income (loss) | 203,678 | (11,478 | ) | 242,686 | (117,369 | ) | ||||||||||
| Share-based compensation expense | 146,365 | 96,180 | 264,988 | 173,483 | ||||||||||||
| Depreciation and amortization | 28,394 | 21,056 | 57,595 | 41,117 | ||||||||||||
| Interest expense, net | 6,464 | 14,769 | 6,717 | 23,975 | ||||||||||||
| Other (income), net | (75,788 | ) | (25,591 | ) | (48,260 | ) | (19,729 | ) | ||||||||
| Bitcoin impairment losses | 45,266 | — | 65,126 | — | ||||||||||||
| Loss on disposal of property and equipment | 374 | 1,481 | 989 | 1,699 | ||||||||||||
| Acquisition related and other costs | 14,292 | 2,056 | 14,318 | 3,580 | ||||||||||||
| Acquired deferred revenue adjustment | 195 | 302 | 447 | 959 | ||||||||||||
| Acquired deferred costs adjustment | (60 | ) | (92 | ) | (124 | ) | (236 | ) | ||||||||
| Benefit for income taxes | (9,360 | ) | (752 | ) | (8,413 | ) | (217 | ) | ||||||||
|
|
|
|
|
|
|
|
||||||||||
| Adjusted EBITDA |
$ | 359,820 | $ | 97,931 | $ | 596,069 | $ | 107,262 | ||||||||
|
|
|
|
|
|
|
|
||||||||||
|
|
SQUARE Q2 2021 27 |
Adjusted Net Income
and Adjusted EPS
UNAUDITED
In thousands, except per share data
| THREE MONTHS ENDED | SIX MONTHS ENDED | |||||||||||||||
| June 30, 2021 | June 30, 2020 | June 30, 2021 | June 30, 2020 | |||||||||||||
| Net income (loss) attributable to common stockholders |
$ | 204,021 | $ | (11,478 | ) | $ | 243,029 | $ | (117,369 | ) | ||||||
| Net income (loss) attributable to noncontrolling interests |
(343 | ) | — | (343 | ) | — | ||||||||||
|
|
|
|
|
|
|
|
||||||||||
| Net income (loss) |
203,678 | (11,478 | ) | 242,686 | (117,369 | ) | ||||||||||
| Share-based compensation expense |
146,365 | 96,180 | 264,988 | 173,483 | ||||||||||||
| Amortization of intangible assets |
9,234 | 4,134 | 16,118 | 8,286 | ||||||||||||
| Amortization of debt issuance costs |
2,305 | 17,580 | 4,137 | 30,108 | ||||||||||||
| Gain on revaluation of equity investment |
(76,744 | ) | (20,998 | ) | (47,844 | ) | (20,998 | ) | ||||||||
| Bitcoin impairment losses |
45,266 | — | 65,126 | — | ||||||||||||
| Loss on extinguishment of long-term debt |
— | — | — | 990 | ||||||||||||
| Loss on disposal of property and equipment |
374 | 1,481 | 989 | 1,699 | ||||||||||||
| Acquisition related and other costs |
14,292 | 2,056 | 14,318 | 3,580 | ||||||||||||
| Acquired deferred revenue adjustment |
195 | 302 | 447 | 959 | ||||||||||||
| Acquired deferred costs adjustment |
(60 | ) | (92 | ) | (124 | ) | (236 | ) | ||||||||
|
|
|
|
|
|
|
|
||||||||||
| Adjusted Net Income - basic |
$ | 344,905 | $ | 89,165 | $ | 560,841 | $ | 80,502 | ||||||||
|
|
|
|
|
|
|
|
||||||||||
| Cash interest expense on convertible senior notes |
$ | 1,611 | $ | 1,565 | $ | 3,339 | $ | 2,938 | ||||||||
|
|
|
|
|
|
|
|
||||||||||
| Adjusted Net Income - diluted |
$ | 346,516 | $ | 90,730 | $ | 564,180 | $ | 83,440 | ||||||||
|
|
|
|
|
|
|
|
||||||||||
| Weighted-average shares used to compute |
||||||||||||||||
| Basic |
455,431 | 440,117 | 455,203 | 437,529 | ||||||||||||
|
|
|
|
|
|
|
|
||||||||||
| Diluted |
522,578 | 440,117 | 519,713 | 437,529 | ||||||||||||
|
|
|
|
|
|
|
|
||||||||||
| Net Income (Loss) Per Share attributable to common stockholders: |
||||||||||||||||
| Basic |
$ | 0.45 | $ | (0.03 | ) | $ | 0.53 | $ | (0.27 | ) | ||||||
|
|
|
|
|
|
|
|
||||||||||
| Diluted |
$ | 0.40 | $ | (0.03 | ) | $ | 0.48 | $ | (0.27 | ) | ||||||
|
|
|
|
|
|
|
|
||||||||||
| Weighted-average shares used to compute Adjusted |
||||||||||||||||
| Net Income Per Share |
||||||||||||||||
| Basic |
455,431 | 440,117 | 455,203 | 437,529 | ||||||||||||
|
|
|
|
|
|
|
|
||||||||||
| Diluted |
522,577 | 500,201 | 523,557 | 495,181 | ||||||||||||
|
|
|
|
|
|
|
|
||||||||||
| Adjusted Net Income Per Share |
||||||||||||||||
| Basic |
$ | 0.76 | $ | 0.20 | $ | 1.23 | $ | 0.18 | ||||||||
|
|
|
|
|
|
|
|
||||||||||
| Diluted |
$ | 0.66 | $ | 0.18 | $ | 1.08 | $ | 0.17 | ||||||||
|
|
|
|
|
|
|
|
||||||||||
|
|
SQUARE Q2 2021 28 |
Non-GAAP Operating Expenses
UNAUDITED
In thousands
| THREE MONTHS ENDED | SIX MONTHS ENDED | |||||||||||||||
| June 30, 2021 | June 30, 2020 | June 30, 2021 | June 30, 2020 | |||||||||||||
| Operating expenses |
$ | (1,016,070 | ) | $ | (619,815 | ) | $ | (1,911,835 | ) | $ | (1,248,604 | ) | ||||
| Share-based compensation |
146,253 | 96,085 | 264,777 | 173,312 | ||||||||||||
| Depreciation and amortization |
22,989 | 18,788 | 47,890 | 36,423 | ||||||||||||
| Bitcoin impairment losses |
45,266 | — | 65,126 | — | ||||||||||||
| Loss on disposal of property and equipment |
374 | 1,481 | 989 | 1,699 | ||||||||||||
| Acquisition-related and other costs |
14,292 | 2,056 | 14,318 | 3,580 | ||||||||||||
|
|
|
|
|
|
|
|
||||||||||
| Non-GAAP operating expenses |
$ | (786,896 | ) | $ | (501,405 | ) | $ | (1,518,735 | ) | $ | (1,033,590 | ) | ||||
|
|
|
|
|
|
|
|
||||||||||
| Product development |
$ | (326,510 | ) | $ | (207,730 | ) | $ | (636,651 | ) | $ | (403,606 | ) | ||||
| Share-based compensation |
106,161 | 69,565 | 193,056 | 126,965 | ||||||||||||
| Depreciation and amortization |
15,400 | 13,601 | 34,258 | 26,827 | ||||||||||||
| Loss on disposal of property and equipment |
6 | 147 | 345 | 305 | ||||||||||||
|
|
|
|
|
|
|
|
||||||||||
| Non-GAAP product development |
$ | (204,943 | ) | $ | (124,417 | ) | $ | (408,992 | ) | $ | (249,509 | ) | ||||
|
|
|
|
|
|
|
|
||||||||||
| Sales and marketing |
$ | (375,101 | ) | $ | (238,096 | ) | $ | (724,561 | ) | $ | (432,631 | ) | ||||
| Share-based compensation |
13,777 | 8,884 | 24,657 | 15,291 | ||||||||||||
| Depreciation and amortization |
2,450 | 1,033 | 3,723 | 1,997 | ||||||||||||
| Loss (gain) on disposal of property and equipment |
— | (59 | ) | — | 1 | |||||||||||
|
|
|
|
|
|
|
|
||||||||||
| Non-GAAP sales and marketing |
$ | (358,874 | ) | $ | (228,238 | ) | $ | (696,181 | ) | $ | (415,342 | ) | ||||
|
|
|
|
|
|
|
|
||||||||||
| General and administrative |
$ | (221,020 | ) | $ | (136,386 | ) | $ | (416,929 | ) | $ | (265,881 | ) | ||||
| Share-based compensation |
26,315 | 17,636 | 47,064 | 31,056 | ||||||||||||
| Depreciation and amortization |
5,139 | 4,154 | 9,909 | 7,599 | ||||||||||||
| Loss on disposal of property and equipment |
368 | 1,393 | 644 | 1,393 | ||||||||||||
| Acquisition-related and other costs |
14,292 | 2,056 | 14,318 | 3,580 | ||||||||||||
|
|
|
|
|
|
|
|
||||||||||
| Non-GAAP general and administrative |
$ | (174,906 | ) | $ | (111,147 | ) | $ | (344,994 | ) | $ | (222,253 | ) | ||||
|
|
|
|
|
|
|
|
||||||||||
Depreciation and
Amortization by Function
UNAUDITED
In thousands
| THREE MONTHS ENDED | SIX MONTHS ENDED | |||||||||||||||
| June 30, 2021 | June 30, 2020 | June 30, 2021 | June 30, 2020 | |||||||||||||
| Cost of revenue |
$ | 5,405 | $ | 2,268 | $ | 9,705 | $ | 4,694 | ||||||||
| Product Development |
15,400 | 13,601 | 34,258 | 26,827 | ||||||||||||
| Sales and Marketing |
2,450 | 1,033 | 3,723 | 1,997 | ||||||||||||
| General and Administrative |
5,139 | 4,154 | 9,909 | 7,599 | ||||||||||||
|
|
|
|
|
|
|
|
||||||||||
| Total depreciation and amortization |
$ | 28,394 | $ | 21,056 | $ | 57,595 | $ | 41,117 | ||||||||
|
|
|
|
|
|
|
|
||||||||||
|
|
SQUARE Q2 2021 29 |
Serious News for Serious Traders! Try StreetInsider.com Premium Free!
You May Also Be Interested In
- Block Inc. (SQ) PT Raised to $98 at Baird
- Medtronic: Americans Favor Quality Over Quantity in Pursuit of Longevity
- Pankaj Zanke Wins a 2024 Global Recognition Award
Create E-mail Alert Related Categories
SEC FilingsSign up for StreetInsider Free!
Receive full access to all new and archived articles, unlimited portfolio tracking, e-mail alerts, custom newswires and RSS feeds - and more!
