Form 8-K Simpson Manufacturing For: May 14

STRONG FOUNDATION. STRONGER FUTURE. Simpson Manufacturing Co., Inc. Investor Presentation May 2021 Exhibit 99.1

2 This presentation contains forward-looking statements within the meaning of the Private Securities Litigation Reform Act of 1995, Section 27A of the Securities Act of 1933, as amended, and Section 2 IE of the Securities Exchange Act of 1934, as amended. Forward-looking statements generally can be identified by words such as "anticipate," "believe," "estimate," "expect," "intend," "plan," "target," "continue," "predict," "project," "change," "result," "future," "will," "could," "can," "may," "likely," "potentially," or similar expressions that concern our strategy, plans, expectations or intentions. Forward-looking statements include, but are not limited to, statements about future financial and operating results, our plans, objectives, business outlook, priorities, expectations and intentions, expectations for sales growth, comparable sales, earnings and performance, stockholder value, capital expenditures, cash flows, the housing market, the home improvement industry, demand for services, share repurchases, our strategic initiatives, including the impact of these initiatives on our strategic and operational plans and financial results, and any statement of an assumption underlying any of the foregoing and other statements that are not historical facts. Although we believe that the expectations, opinions, projections and comments reflected in these forward-looking statements are reasonable, such statements involve risks and uncertainties and we can give no assurance that such statements will prove to be correct. Actual results may differ materially from those expressed or implied in such statements. Forward-looking statements are subject to inherent uncertainties, risk and other factors that are difficult to predict and could cause our actual results to vary in material respects from what we have expressed or implied by these forward-looking statements. Important factors that could cause our actual results and financial condition to differ materially from those expressed in our forward-looking statements include the impact of COVID-19 on our operations and supply chain, and the operations of our customers, suppliers and business partners and those discussed under Part I – Item 1A. Risk Factors and Item 7 Management's Discussion and Analysis of Financial Condition and Results of Operations in our most recent Annual Report on Form 10-K, Part II – Other Information – Item 1.A and subsequent filings with the SEC. We caution that you should not place undue reliance on these forward-looking statements, which speak only as of the date of this presentation. We undertake no obligation to publicly update any forward-looking statement, whether as a result of new information, future developments or otherwise. Readers are urged to carefully review and consider the various disclosures made in our reports filed with the SEC that advise of the risks and factors that may affect our business, results of operations and financial condition. Safe Harbor
3 Investment Highlights Industry leader with unique business model, strong brand recognition and trusted reputation Diversified product offerings and geographies mitigate exposure to cyclical U.S. housing market Leadership position in wood products with significant opportunities in all addressable markets Industry-leading gross profit and operating margins Strong balance sheet enables financial flexibility and stockholder returns 90% of free cash flow from operations returned to stockholders since 2017(1) (1) Time frame represents January 1, 2017 to March 31, 2021.

4 Simpson’s Brand and Culture At Simpson, we describe the unique culture of our organization as our “Secret Sauce.” To provide solutions that help people design and build safer, stronger structures. OUR MISSION OUR COMPANY VALUES 1. Relentless Customer Focus 2. Long-Range View 3. High-Quality Products 4. Be The Leader 5. Everybody Matters 6. Enable Growth 7. Risk-Taking Innovation 8. Give Back 9. Be Humble, Have Fun

5 $0.00 $20.00 $40.00 $60.00 $80.00 $100.00 $120.00 27-Year Trading History 5/25/1994 Initial public offering at $11.50 (or $2.875 adjusted for two stock splits in August 2002 & November 2004). 5/7/2021 SSD closes at all- time high of $118.46 3/24/2020 COVID-19 pandemic declared 8/19/2002 2 for 1 stock split 11/19/2004 2 for 1 stock split 1/1/2012 Founder Barclay Simpson appointed Chairman Emeritus, Tom Fitzmyers appointed Chairman, Karen Colonias appointed to President & CEO 10/30/2017 Announced 2020 Plan 7/29/2019 Updated certain 2020 Plan targets Compound annual growth rate of 14.8% as of May 7, 2021 since the 1994 IPO (1) Note: Stock chart depicts SSD trading history from May 25, 1994 through May 7, 2021.

6 • Innovation • Research & Testing • Technology • Technical & Field Support • Training • Product Availability Long-standing, successful relationships with: • Engineers • Code Officials • Builders • Contractors • Lumberyards • Home Centers • Pro Dealers Our Strong Business Model • Connector Market Leader • 98 of Top 100 Builders • Thousands of Stocking Dealers & Retailers • Millions of Specifications • Diverse Construction Market Segment Portfolio • 14,000 Standard and Custom Wood Products • 3,300 Standard and Custom Concrete Products We engineer, test and manufacture structural connectors, anchors, fasteners, software solutions and other products for new construction, repair and remodel, and do-it- yourself markets.
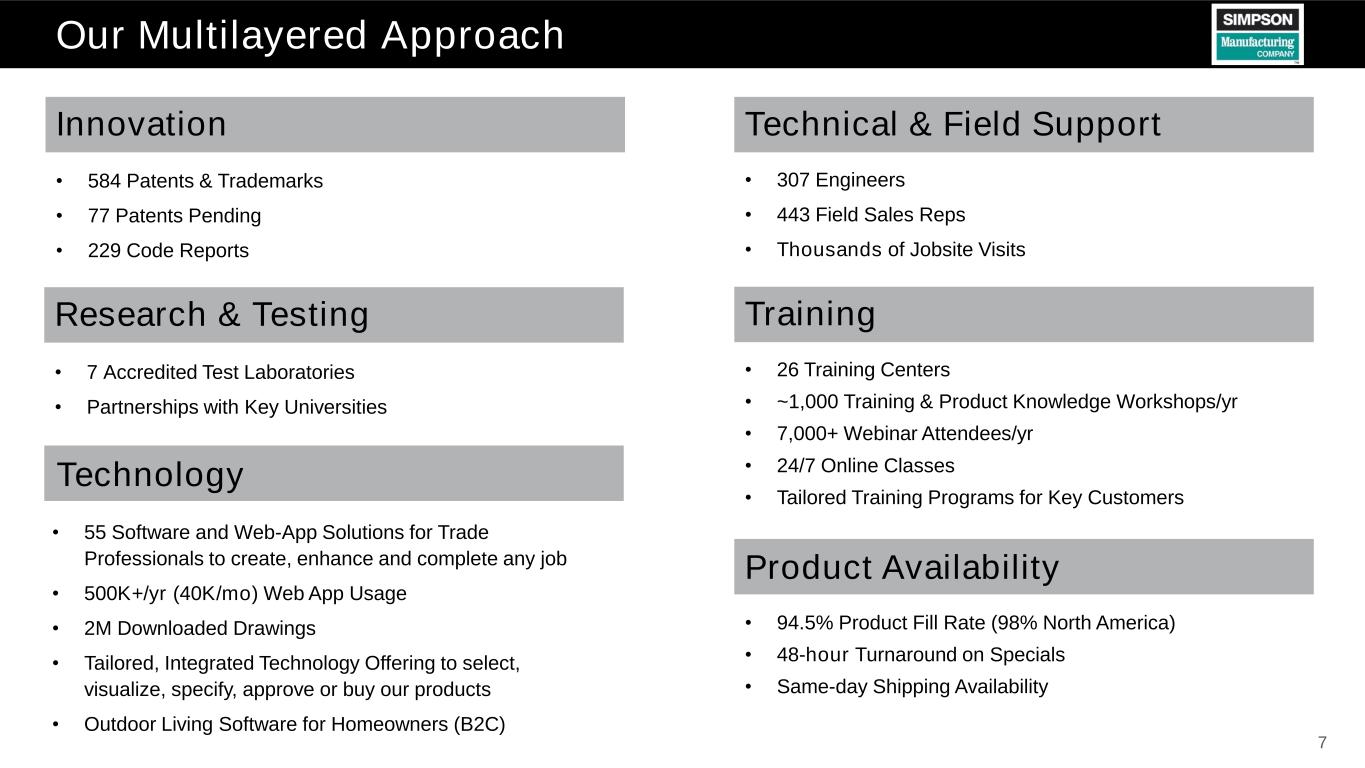
7 Our Multilayered Approach • 584 Patents & Trademarks • 77 Patents Pending • 229 Code Reports Innovation Research & Testing Technical & Field Support Product Availability Technology • 7 Accredited Test Laboratories • Partnerships with Key Universities • 307 Engineers • 443 Field Sales Reps • Thousands of Jobsite Visits • 94.5% Product Fill Rate (98% North America) • 48-hour Turnaround on Specials • Same-day Shipping Availability • 55 Software and Web-App Solutions for Trade Professionals to create, enhance and complete any job • 500K+/yr (40K/mo) Web App Usage • 2M Downloaded Drawings • Tailored, Integrated Technology Offering to select, visualize, specify, approve or buy our products • Outdoor Living Software for Homeowners (B2C) Training • 26 Training Centers • ~1,000 Training & Product Knowledge Workshops/yr • 7,000+ Webinar Attendees/yr • 24/7 Online Classes • Tailored Training Programs for Key Customers

8 Core Addressable Market(1) Wood Connectors & Truss Concrete Market Size $15.0 B Addressable Market $1.3 B (9%) SSD Share $185 M (14%) Market Size $5.8 B Addressable Market SSD Share $190 M (19%) Market Size/ Addressable Market $2.5 B SSD Share $891 M (36%) Fasteners $1 B (17%) (1) Note: Market share based on net sales as of the full year ended December 31, 2020. Market sizes based on internal estimates using information as of December 31, 2020. Includes North America, Europe and Pacific Rim. Many opportunities to expand into adjacencies and to create new markets

9 Commitment to Growth OEM R&R / DIY STRUCTURAL STEEL MASS TIMBER KEY GROWTH INITIATIVES FOCUSED ON: CONCRETE LEADER IN ENGINEERED LOAD-RATED CONSTRUCTION FASTENING SOLUTIONS LEADER IN CUSTOMER-FACING TECHNOLOGY

10 OEM RATIONALE KEY GOAL STRATEGY • >$90 M total addressable market primarily with fastening technologies • Potential to develop other engineered solutions • 2,500 existing Simpson products applicable for OEM needs • Our solutions make the industry more efficient • Aligned with the Simpson business model Increase our market share in OEMs. • Lead with fasteners: Market and sell existing product line • Leverage existing anchor product line • Engineer and launch value-added OEM-specific structural solutions • Leverage Simpson Strong-Tie engineering testing capabilities • Develop direct and distribution sales channels • Utilize external innovation opportunities

11 RATIONALE KEY GOAL STRATEGY • $500-$700 M total addressable market: decks, patios, porches, pergolas, gazebos, fencing and garage organization • Existing product line with potential for several extensions • Established channel/partners • Proven approach with Outdoor Accents • Aligned with the Simpson business model R&R / DIY Expand brand positioning: Be a known and trusted partner for R&R / DIY solutions. • Improve retail execution • Continue expanding product lines and increase in-store training • Enable consumers to customize, design and create bill-of-materials with software • Partner with home center brand advocates to maximize e-commerce sales • Utilize external innovation opportunities
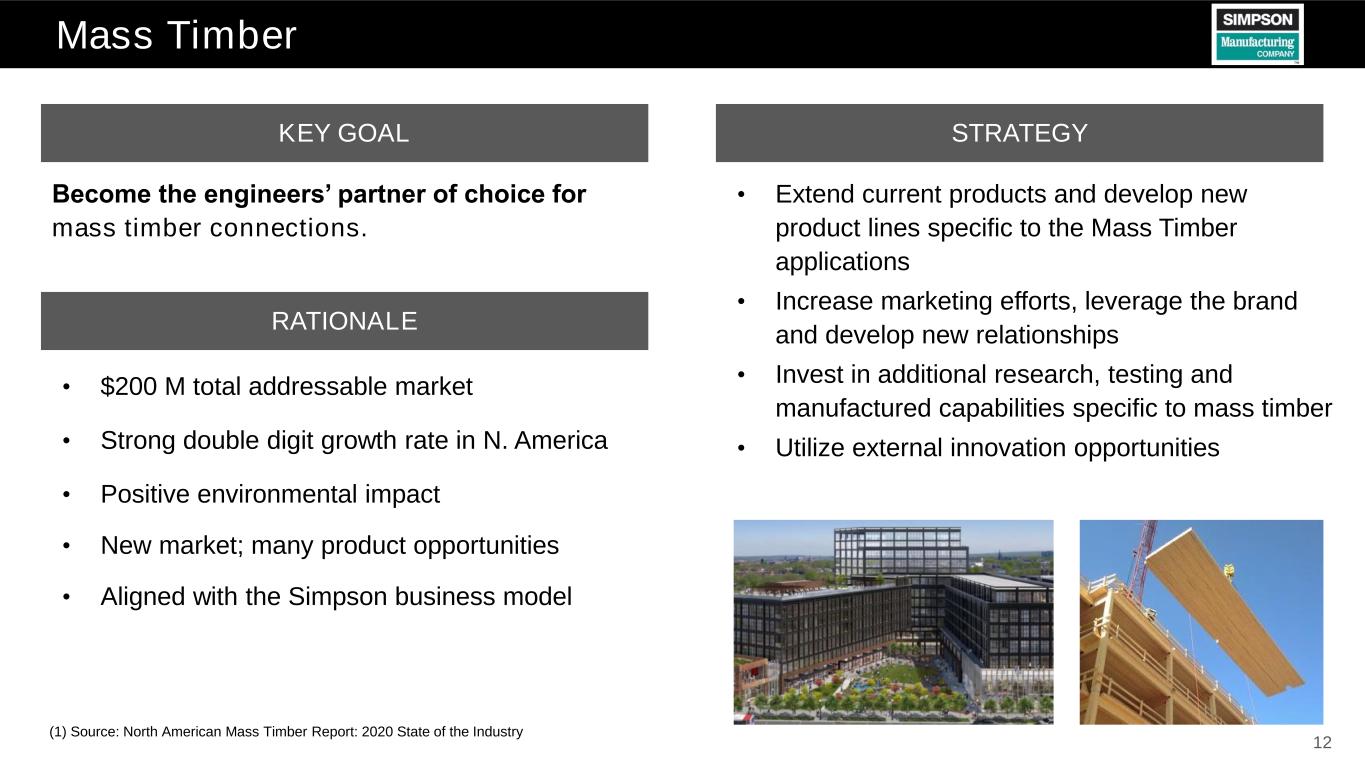
12 Mass Timber RATIONALE KEY GOAL STRATEGY • $200 M total addressable market • Strong double digit growth rate in N. America • Positive environmental impact • New market; many product opportunities • Aligned with the Simpson business model Become the engineers’ partner of choice for mass timber connections. • Extend current products and develop new product lines specific to the Mass Timber applications • Increase marketing efforts, leverage the brand and develop new relationships • Invest in additional research, testing and manufactured capabilities specific to mass timber • Utilize external innovation opportunities (1) Source: North American Mass Timber Report: 2020 State of the Industry
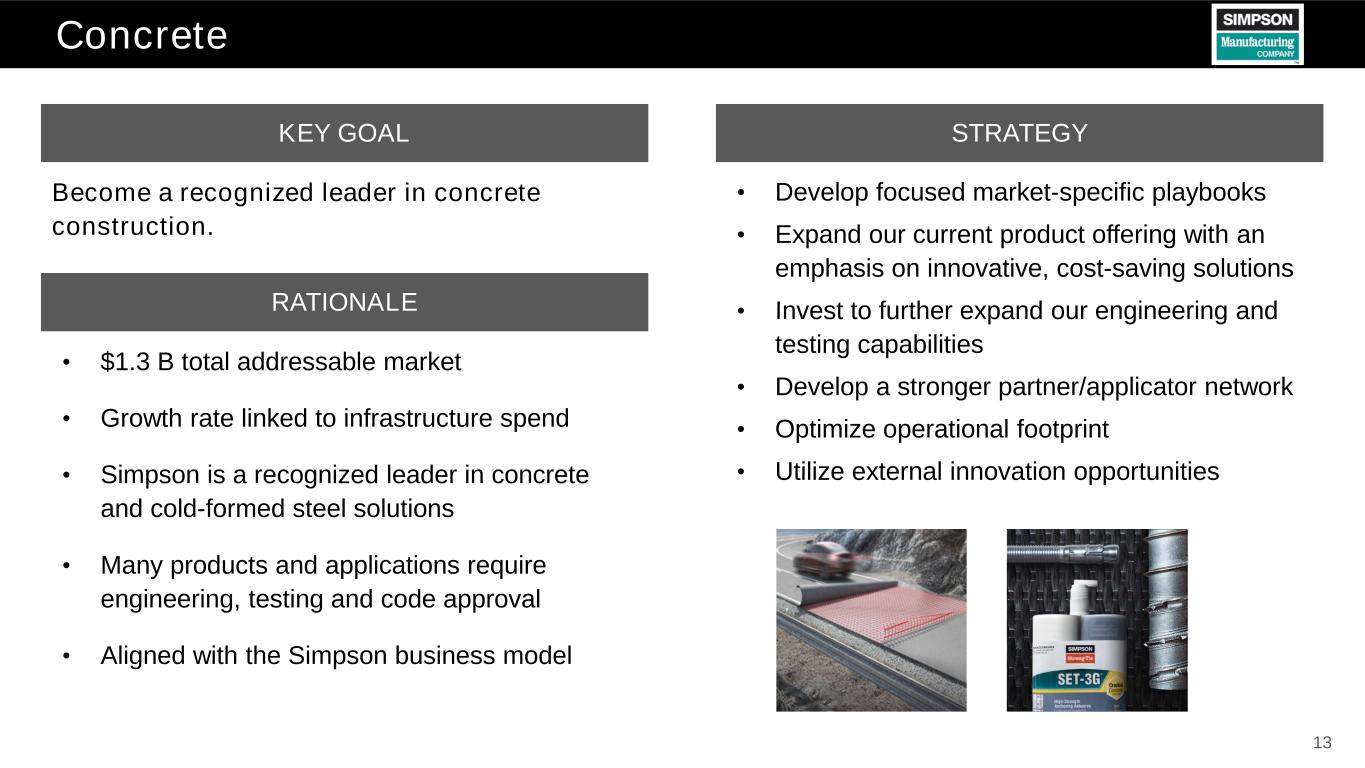
13 Concrete RATIONALE KEY GOAL STRATEGY • $1.3 B total addressable market • Growth rate linked to infrastructure spend • Simpson is a recognized leader in concrete and cold-formed steel solutions • Many products and applications require engineering, testing and code approval • Aligned with the Simpson business model Become a recognized leader in concrete construction. • Develop focused market-specific playbooks • Expand our current product offering with an emphasis on innovative, cost-saving solutions • Invest to further expand our engineering and testing capabilities • Develop a stronger partner/applicator network • Optimize operational footprint • Utilize external innovation opportunities

14 Structural Steel RATIONALE KEY GOAL STRATEGY • > $350 M total addressable market • Structural steel construction is roughly half of the construction spend in North America • Field welder shortage: addressed by bolted structural connections • Bolted connections can improve productivity by 25% vs. welding • Seismic and non-seismic applications • Aligned with the Simpson business model Convert traditional welded connections to bolted connections. • Develop the bolted connection market by engineering premium construction products • Specify and sell direct to fabricators, erectors, installers and steel building manufacturers • Launch design tools for inclusion in commonly used engineering software • Invest in engineering, testing and production capabilities • Utilize external innovation opportunities

15 Be the global market leader in engineered / load-rated construction fastening solutions. Construction Fasteners 5 STRATEGY • Develop critical mass by expanding our engineered fastener business for DIY/R&R, OEM and Mass Timber markets • Provide innovative products that are preferred by both end-users and specifiers • Develop industry-leading tools enabling specifications • Expand brand positioning: known/trusted partner • Optimize manufacturing and supply chain footprint • Utilize external innovation opportunities • ~$1 B total addressable market • Complementary to connector and lateral products • Established building and construction channels and customers • Ability to extend into new/OEM markets • Established manufacturing and supply chain • Market needs increased innovation • Aligned with the Simpson business model KEY GOAL RATIONALE

16 Customer-Facing Technology Solutions • 3D Deck Planner • 3D Pergola Planner • Floor, roof and wall design software • Accurate take-offs • EWP design software • e-commerce • Accurate take-offs • Options management Builders Lumberyards & Distributors Repair & Remodel & DIY Component / Truss Manufacturers • Web apps • Anchor Designer • CFS Designer • 3rd-party software plug-ins • Digital drawing library Engineers & Designers

17 North America $1,102 Europe $157 Asia/Pacific $9 Wood Construction $1,083 Concrete Construction $185 Strong Business Drives Stockholder Value Our 2020 Sales by Product… ($ USD Millions) and Across Operating Segments ($ USD Millions) $0.58 $1.04 $0.87 $1.05 $1.29 $1.38 $1.86 $1.94 $2.72 $2.98 $4.27 2010 2011 2012 2013 2014 2015 2016 2017 2018 2019 2020 EPS(1) $0.40 $0.50 $0.50 $0.50 $0.55 $0.62 $0.70 $0.81 $0.87 $0.91 $0.92 2010 2011 2012 2013 2014 2015 2016 2017 2018 2019 2020 Dividends Per Share(2) (1) The enactment of the Tax Cuts and Jobs Act in December 2017 resulted in a provisional net charge of $2.2 million in the fourth quarter of 2017, or an impact of $0.04 per fully diluted share. (2) Chart represents annual dividends declared. Part of the 2013 dividend was accelerated due to uncertainty of changes to tax code in 2013. The dividend paid in December 2012 is included in 2013.

18 Historical Net Sales Our investments in adjacent products and markets have helped mitigate our exposure to a cyclical U.S. housing market over time. 2006 2007 2008 2009 2010 2011 2012 2013 2014 2015 2016 2017 2018 2019 2020 0.0 0.2 0.4 0.6 0.8 1.0 1.2 1.4 1.6 1.8 2.0 $0 $100 $200 $300 $400 $500 $600 $700 $800 $900 $1,000 $1,100 $1,200 $1,300 H o u s in g S ta rts (M ) ($ M ) North America Net Sales Total Net Sales Gross Profit Income from Operations Housing Starts

19 19.9% 15.1% 13.2% 6.0% 14.1% 12.3% 9.4% 11.6% 13.3% 13.8% 16.5% 14.2% 16.0% 15.9% 19.9% 19.5% - 22.0% 13.7% 5.9% (7.3%) (2.7%) 3.7% 1.1% 3.8% 5.4% 7.8% 9.9% 12.0% 12.6% 11.5% 9.5% 9.6% (15.0%) (10.0%) (5.0%) 0.0% 5.0% 10.0% 15.0% 20.0% 25.0% 2006 2007 2008 2009 2010 2011 2012 2013 2014 2015 2016 2017 2018 2019 2020 2021E Simpson Historical Operating Income Margin Versus Proxy Peer Average(1) SSD Proxy Peer Average (1) (1) Proxy peer average includes: AAON, AMWD, APOG, AWI, EXP, ROCK, IIIN, DOOR, PATK, PGTI, NX, SUM, TREX, USCR and WMS. Operating Income Margin Outperformance

20 33.8% 24.7% 20.0% 18.4% 12.2% 11.3% 10.8% 10.1% 9.8% 9.1% 8.9% 7.4% 6.5% 6.2% -23.7% -24.6% ROIC(1) Within Top Quartile of Proxy Peers(2) (1) Return on Invested Capital (ROIC) reflects latest fiscal year reported. See appendix for ROIC definition. (2) Proxy peer average includes: AAON, AMWD, APOG, AWI, EXP, ROCK, IIIN, DOOR, PATK, PGTI, NX, SUM, TREX, USCR and WMS. (3) Source: Company filings as of March 18, 2021.
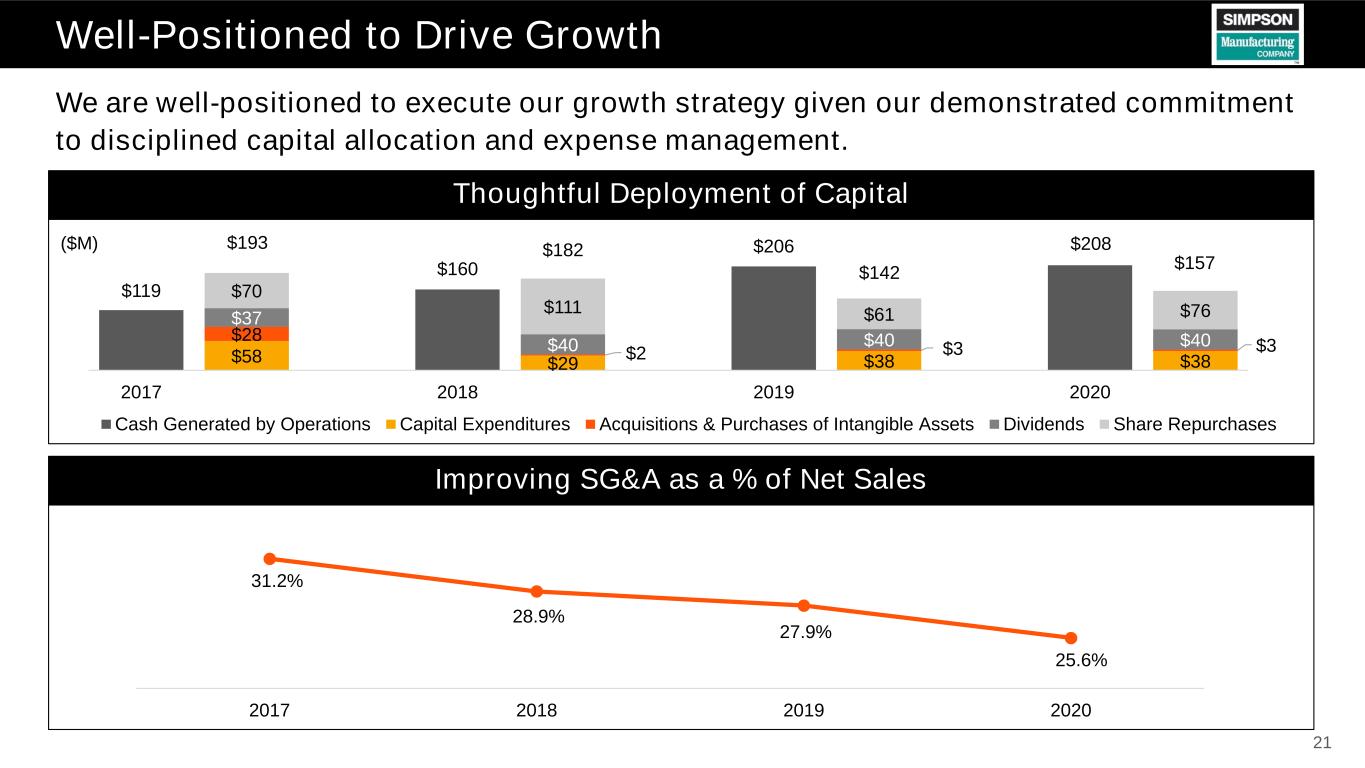
21 Well-Positioned to Drive Growth We are well-positioned to execute our growth strategy given our demonstrated commitment to disciplined capital allocation and expense management. Thoughtful Deployment of Capital $119 $160 $206 $208 $58 $29 $38 $38 $28 $2 $3 $3 $37 $40 $40 $40 $70 $111 $61 $76 2017 2018 2019 2020 Cash Generated by Operations Capital Expenditures Acquisitions & Purchases of Intangible Assets Dividends Share Repurchases ($M) $193 $182 $142 $157 Improving SG&A as a % of Net Sales 31.2% 28.9% 27.9% 25.6% 2017 2018 2019 2020
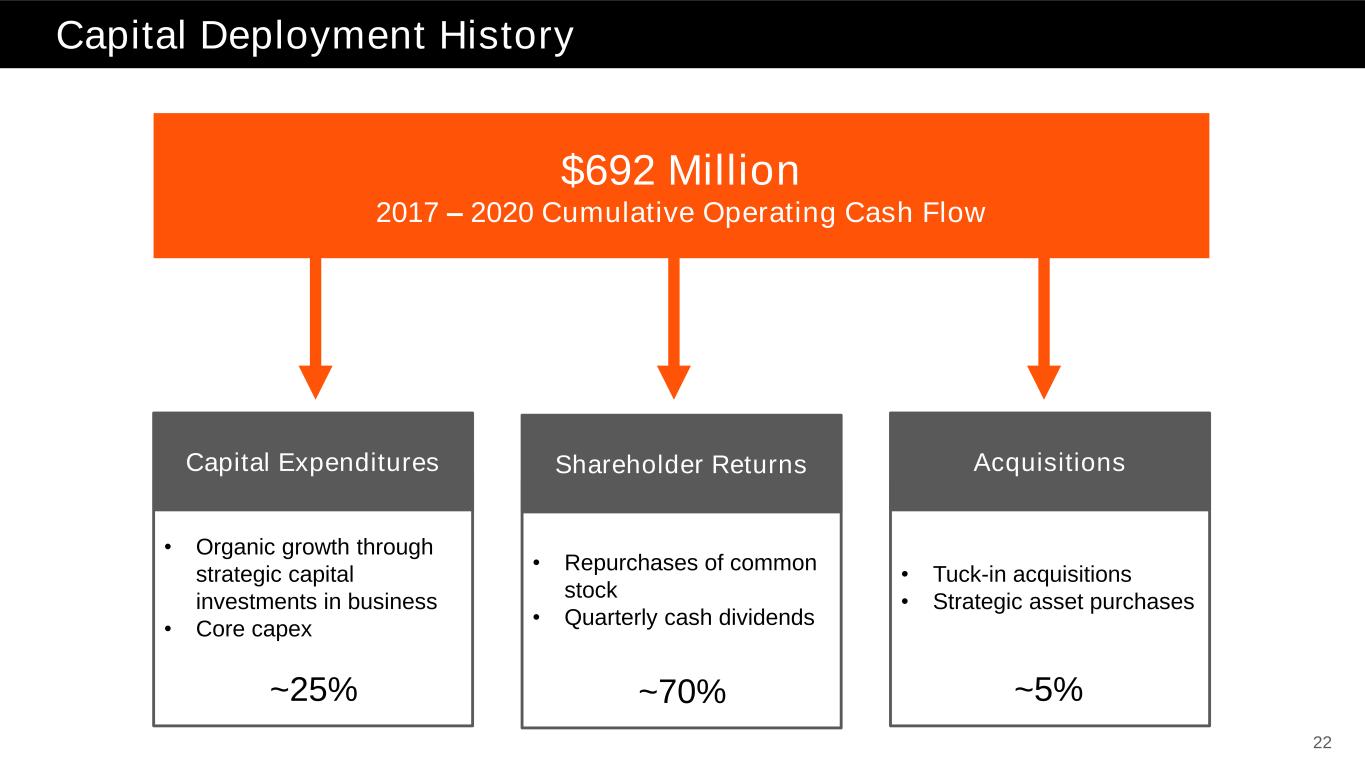
22 • Tuck-in acquisitions • Strategic asset purchases Acquisitions • Repurchases of common stock • Quarterly cash dividends Shareholder Returns • Organic growth through strategic capital investments in business • Core capex Capital Deployment History $692 Million 2017 – 2020 Cumulative Operating Cash Flow ~25% ~70% ~5% Capital Expenditures

23 Use of Cash Priorities Cash Flow From Operations Share Repurchases Investing in growth initiatives (engineering, people, testing, etc.) Maintenance CapEx Potential M&A Maintain quarterly cash dividends(1) Consistently and moderately raise dividends Opportunistic share repurchases Capital return threshold of 50% of free cash flow(2) Organic Growth / Acquisitions Dividends (1) On May 4, 2021, the Board of Directors declared a quarterly cash dividend of $0.25 per share of common stock, payable on July 22, 2021 to stockholders of record as of July 1, 2021. This $0.02 per share increase follows the prior increase from April 2019, as there was no dividend increase in 2020 as a result of the Company’s focus on cash preservation at the onset of the COVID-19 pandemic. (2) The Company defines free cash flow as cash flow from operations less capital expenditures.

24 Acquisition Strategy • Strengthen our business model by expanding our product lines and developing complete solutions for the markets in which we operate • Improve our market share in our growth initiatives • Improve our manufacturing capabilities and efficiencies to reduce lead-times and bring production closer to the end customer • Leverage venture capital expertise to help identify potential strategic acquisitions or investments including innovative technologies of interest in the building space • Provides real-time market access to the latest industry technology trends and innovation

25 Sustainability and Environmental and Social Responsibility “Our people are the most vital part of our business, and providing a safe, healthy, sustainable, and rewarding working environment is of fundamental importance.” – Karen Colonias • Issued 2019 ESG report in March 2020 (Inaugural Report) • Reported updated 2020 metrics in March 2021 • Established ESG task force • Hired ESG analyst • Engaged external ESG disclosure consultants and service providers • Continued effort to harmonize with SASB standards • Enhanced disclosure on Human Capital Management • Launching Diversity, Equity & Inclusion program • Renewed focus on employee health and safety At Simpson Strong-Tie, we operate in a safe and environmentally responsible manner to protect our employees, customers and communities while benefitting society, the economy and the environment. ENVIRONMENTAL PROTECTION, HEALTH & SAFETY MANAGEMENT POLICY SUSTAINABILITY EFFORTS TAKEN TO-DATE

26 5-Year Company Ambitions Strengthen our values-based culture Be the partner of choice Be an innovation leader in the markets we operate Continue above market growth rate relative to U.S. housing starts Continue expanding our operating income margin to remain within the top quartile of proxy peers Continue expanding ROIC within the top quartile of proxy peers 1 2 4 3 5 6
27 Appendix
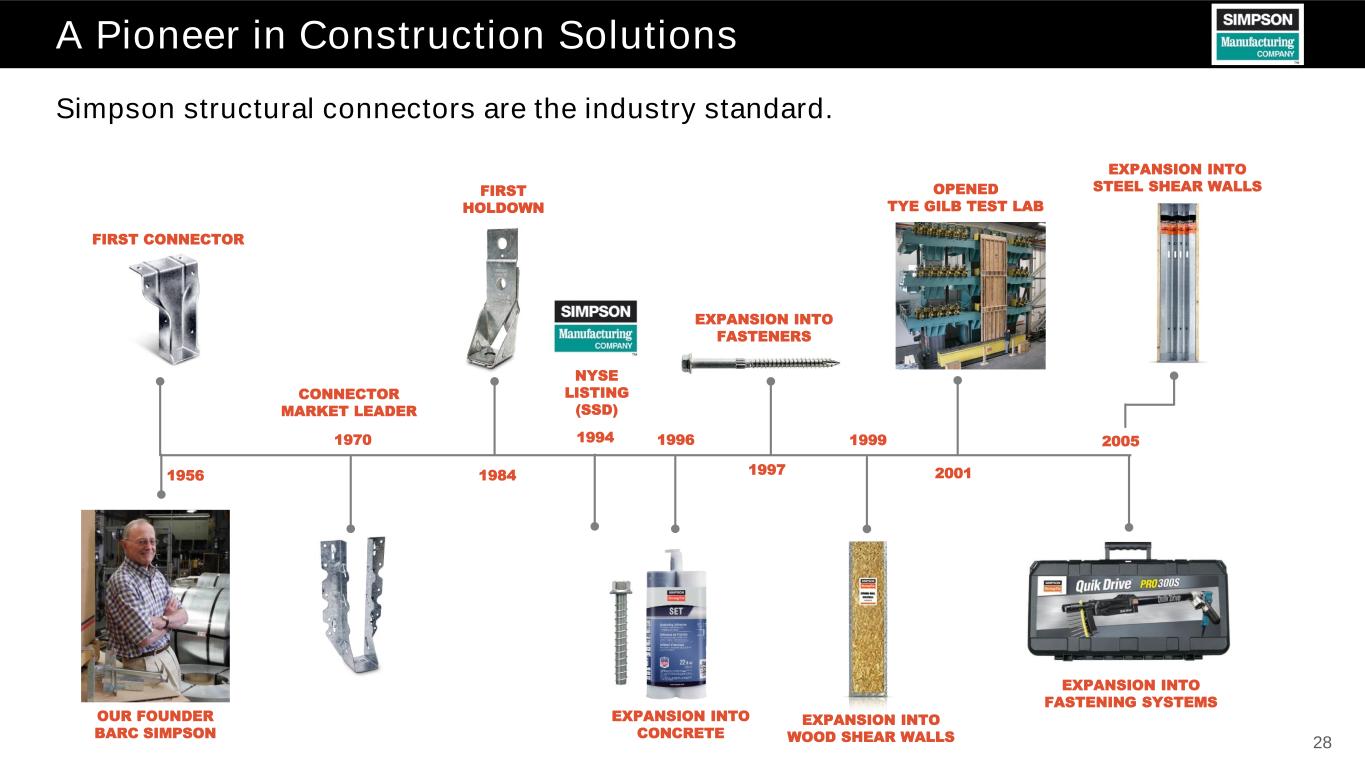
28 A Pioneer in Construction Solutions 1956 1970 1984 1996 1997 1999 2005 Simpson structural connectors are the industry standard. 1994 NYSE LISTING (SSD) OUR FOUNDER BARC SIMPSON EXPANSION INTO CONCRETE EXPANSION INTO FASTENERS FIRST CONNECTOR CONNECTOR MARKET LEADER EXPANSION INTO WOOD SHEAR WALLS EXPANSION INTO FASTENING SYSTEMS 2001 OPENED TYE GILB TEST LAB EXPANSION INTO STEEL SHEAR WALLSFIRST HOLDOWN

29 A Pioneer in Construction Solutions (Continued) 2011 2013 2016 20192012 2008 2009 20202017 EXPANSION INTO SS FASTENERS EXPANSION INTO ORDINARY MOMENT FRAMES FURTHER EXPANSION INTO CONCRETE REPAIR AND CFS EXPANSION INTO SPECIAL MOMENT FRAMES EXPANSION INTO FRP/CARBON FIBER SOLUTIONS AND TRUSS SOFTWARE EXPANSION INTO BUILDER & LBM SOFTWARE EXPANSION INTO STRUCTURAL STEEL EXPANSION INTO OUTDOOR DECORATIVE HARDWARE FURTHER EXPANSION INTO OUTDOOR LIVING SOFTWARE Simpson is an innovation leader in fasteners, concrete repair, moment frames, construction software and structural steel solutions.

30 Commitment to Innovation: State-of-the-Art Test Labs We are dedicated to research, testing, engineering and innovation through our state-of-the-art test labs, which provides us with a better understanding of how structures perform, advances our design technology and improves building safety. WOOD CONCRETE FASTENER
31 Return on Invested Capital (“ROIC”) Definition When referred to in this presentation, return on invested capital (“ROIC”) for a fiscal year is calculated based on (i) the net income of that year as presented in the Company’s consolidated statements of operations prepared pursuant to generally accepted accounting principles in the U.S. (“GAAP”), as divided by (ii) the average of the sum of total stockholders’ equity and total long-term interest bearing liabilities, (which for the Company are long-term capital lease obligations), at the beginning of and at the end of such year, as presented in the Company’s consolidated balance sheets prepared pursuant to GAAP for that applicable year. As such, the Company’s ROIC, a ratio or statistical measure, is calculated using exclusively GAAP financial measures.

STRONG FOUNDATION. STRONGER FUTURE.
Serious News for Serious Traders! Try StreetInsider.com Premium Free!
You May Also Be Interested In
- Simpson Manufacturing (SSD) PT Lowered to $208 at Baird
- NurExone Biologic Inc. Announces Strategic Expansion to US Financial Markets with Approval of OTCQB Listing Application and DTC Eligibility
- AITX Provides Sales Guidance for New Subsidiary RAD-R
Create E-mail Alert Related Categories
SEC FilingsSign up for StreetInsider Free!
Receive full access to all new and archived articles, unlimited portfolio tracking, e-mail alerts, custom newswires and RSS feeds - and more!


 Tweet
Tweet Share
Share