Form 8-K RR Donnelley & Sons Co For: Mar 16

INVESTOR PRESENTATION Fourth Quarter 2020 Exhibit 99.1
SAFE HARBOR & NON-GAAP This presentation contains “forward-looking statements” within the meaning of, and subject to the safe harbor created by, Section 21E of the Securities Exchange Act of 1934, as amended, with respect to the business, strategy and plans of R. R. Donnelley & Sons Company (the "Company") and its expectations relating to future financial condition and performance. Readers are cautioned not to place undue reliance on these forward-looking statements and any such forward-looking statements are qualified in their entirety by reference to the following cautionary statements. All forward-looking statements speak only as of the date of this presentation and are based on current expectations and involve a number of assumptions, risks and uncertainties that could cause the actual results to differ materially from such forward-looking statements. Words such as “believes”, “anticipates”, ”estimates”, “expects”, “intends”, “aims”, “potential”, “will”, “would”, “could”, “may”, “considered”, “likely”, and variations of these words and similar future or conditional expressions are intended to identify forward-looking statements but are not the exclusive means of identifying such statements. Such forward-looking statements are only predictions and involve known and unknown risks and uncertainties. The Company does not undertake to and specifically disclaims any obligation to publicly release the results of any revisions to these forward-looking statements that may be made to reflect future events or circumstances after the date of such statement or to reflect the occurrence of anticipated or unanticipated events. These factors include such risks and uncertainties detailed in the Company’s periodic public filings with the SEC, including but not limited to, those discussed under the “Risk Factors” section in the Company’s Form 10-K for the year ended December 31, 2020 and other filings with the SEC and in other investor communications from the Company from time to time. Use of Forward Looking Statements While the Company reports its results in accordance with generally accepted accounting principles in the United States ("GAAP"), this presentation contains non-GAAP financial measures, including non-GAAP adjusted income from operations, non-GAAP adjusted operating margin, non-GAAP adjusted diluted EPS, and gross and net leverage ratios. The Company believes that these non-GAAP measures, when presented in conjunction with comparable GAAP measures, provide useful information about its operating results and enhance the overall ability to assess the Company’s financial performance. Internally, the company uses this non-GAAP information as an indicator of business performance, and evaluates management’s effectiveness with specific reference to these indicators. These measures should be considered in addition to, not a substitute for, or superior to, measures of financial performance prepared in accordance with GAAP. A reconciliation of GAAP to non-GAAP financial measures can be found in the Appendix to this presentation. Non-GAAP Financial Information Note on Continuing Operations Beginning in the third quarter of 2020, the Company has reflected its Logistics business as discontinued operations for all periods presented. The Company's references to net sales, SG&A, income from operations, net income or loss, and per share amounts in this presentation are on a continuing operations basis without Logistics. All prior periods presented have been restated to conform to this presentation.
Dan Knotts President & CEO RRD Terry Peterson EVP, CFO RRD Johan Nystedt SVP, Finance RRD COMPANY REPRESENTATIVES

COMPANY OVERVIEW
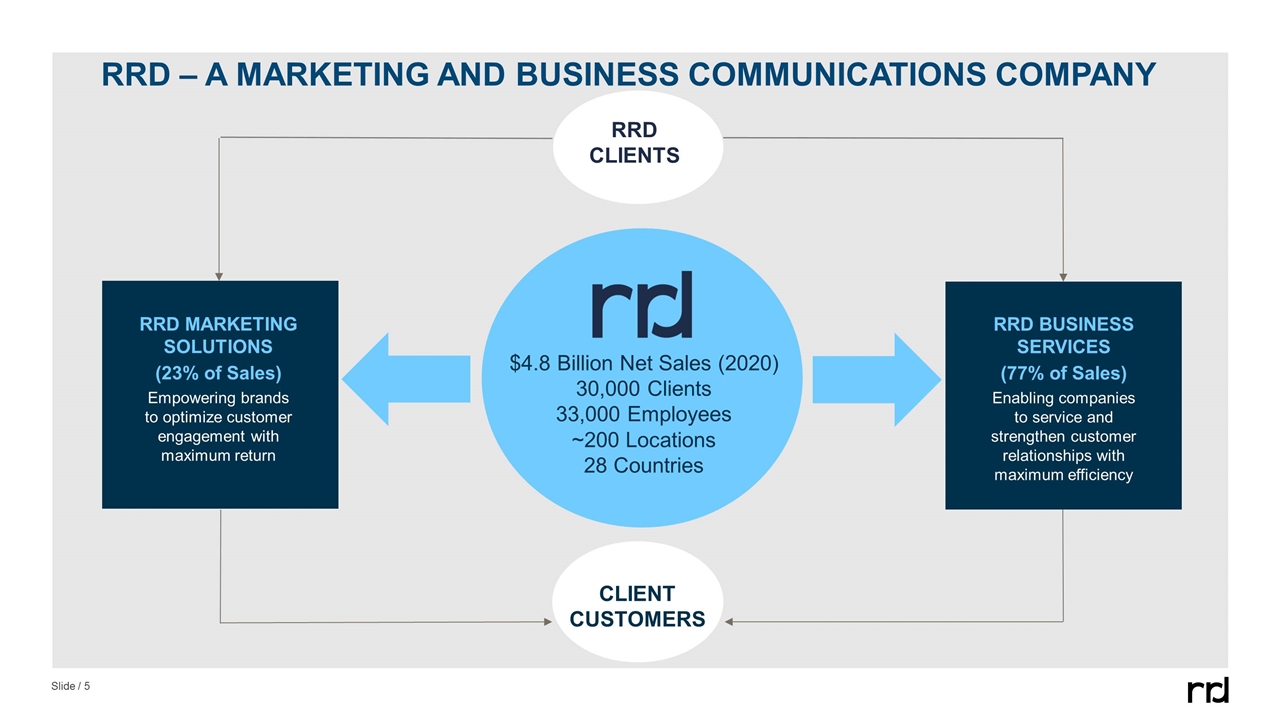
RRD MARKETING SOLUTIONS (23% of Sales) Empowering brands to optimize customer engagement with maximum return RRD CLIENTS RRD BUSINESS SERVICES (77% of Sales) Enabling companies to service and strengthen customer relationships with maximum efficiency $4.8 Billion Net Sales (2020) 30,000 Clients 33,000 Employees ~200 Locations 28 Countries RRD – A MARKETING AND BUSINESS COMMUNICATIONS COMPANY CLIENT CUSTOMERS
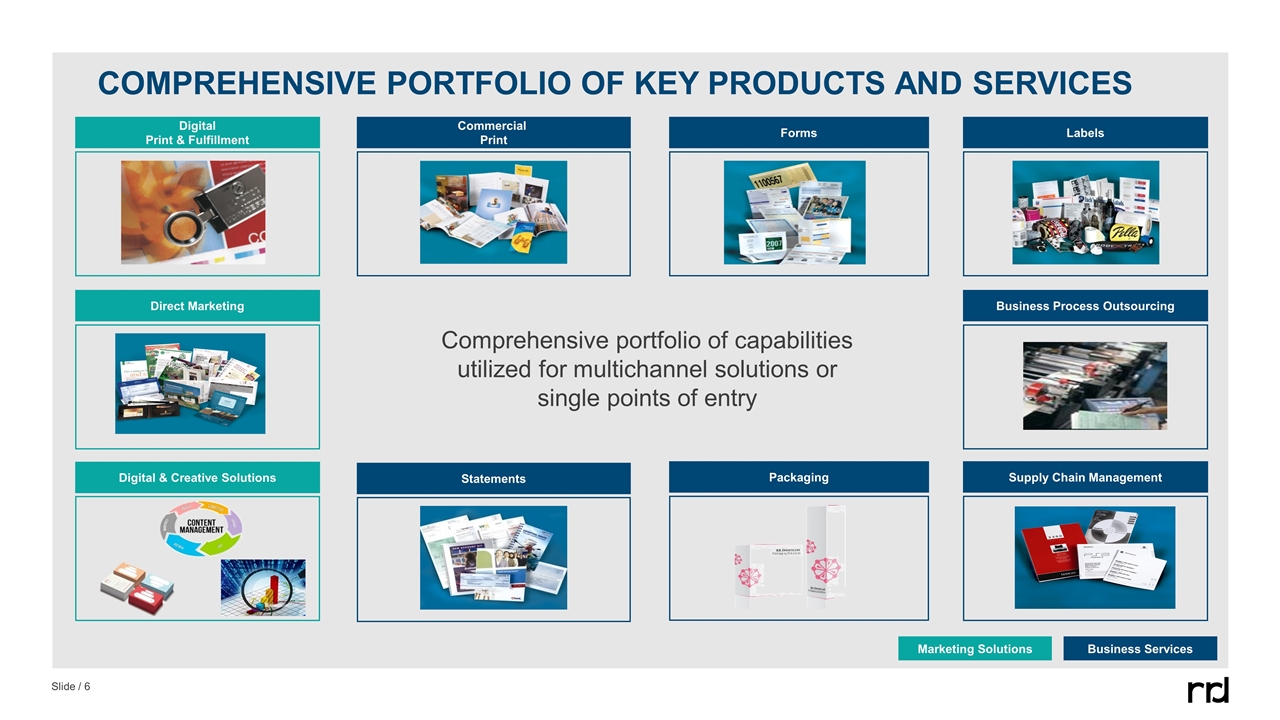
COMPREHENSIVE PORTFOLIO OF KEY PRODUCTS AND SERVICES Comprehensive portfolio of capabilities utilized for multichannel solutions or single points of entry Statements Commercial Print Forms Labels Packaging Digital Print & Fulfillment Direct Marketing Supply Chain Management Digital & Creative Solutions Business Process Outsourcing Marketing Solutions Business Services

COMPANY STRATEGY
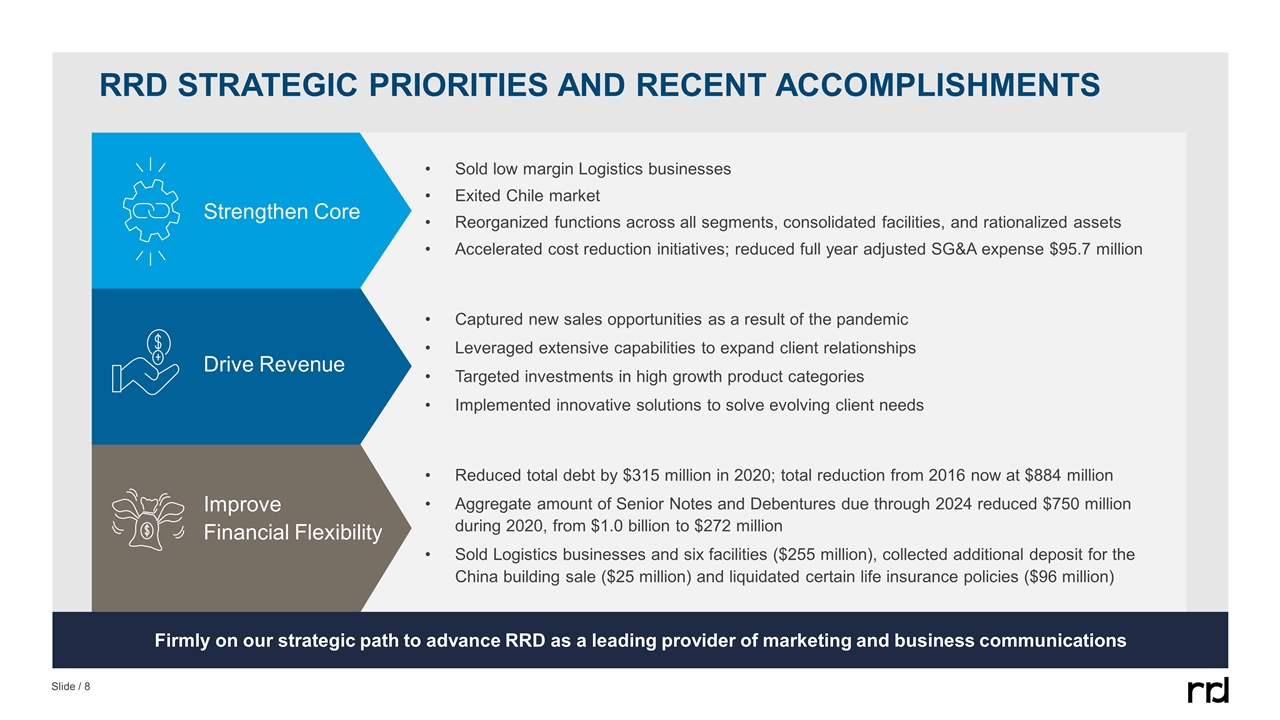
Improve Financial Flexibility Reduced total debt by $315 million in 2020; total reduction from 2016 now at $884 million Aggregate amount of Senior Notes and Debentures due through 2024 reduced $750 million during 2020, from $1.0 billion to $272 million Sold Logistics businesses and six facilities ($255 million), collected additional deposit for the China building sale ($25 million) and liquidated certain life insurance policies ($96 million) Firmly on our strategic path to advance RRD as a leading provider of marketing and business communications Drive Revenue Captured new sales opportunities as a result of the pandemic Leveraged extensive capabilities to expand client relationships Targeted investments in high growth product categories Implemented innovative solutions to solve evolving client needs Strengthen Core Sold low margin Logistics businesses Exited Chile market Reorganized functions across all segments, consolidated facilities, and rationalized assets Accelerated cost reduction initiatives; reduced full year adjusted SG&A expense $95.7 million RRD STRATEGIC PRIORITIEs and recent accomplishments
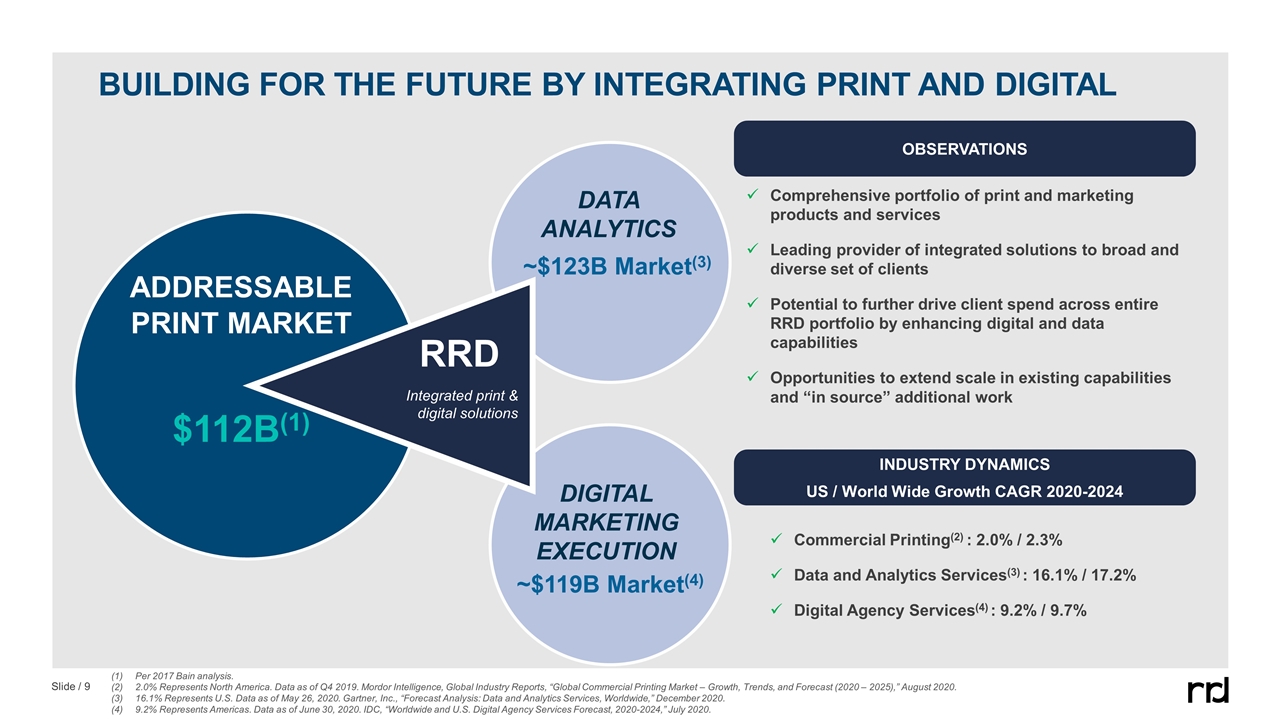
BUILDING FOR THE FUTURE BY INTEGRATING PRINT AND DIGITAL Comprehensive portfolio of print and marketing products and services Leading provider of integrated solutions to broad and diverse set of clients Potential to further drive client spend across entire RRD portfolio by enhancing digital and data capabilities Opportunities to extend scale in existing capabilities and “in source” additional work OBSERVATIONS RRD ADDRESSABLE PRINT MARKET $112B(1) DIGITAL MARKETING EXECUTION DATA ANALYTICS Integrated print & digital solutions INDUSTRY DYNAMICS US / World Wide Growth CAGR 2020-2024 Commercial Printing(2) : 2.0% / 2.3% Data and Analytics Services(3) : 16.1% / 17.2% Digital Agency Services(4) : 9.2% / 9.7% ~$123B Market(3) ~$119B Market(4) Per 2017 Bain analysis. 2.0% Represents North America. Data as of Q4 2019. Mordor Intelligence, Global Industry Reports, “Global Commercial Printing Market – Growth, Trends, and Forecast (2020 – 2025),” August 2020. 16.1% Represents U.S. Data as of May 26, 2020. Gartner, Inc., “Forecast Analysis: Data and Analytics Services, Worldwide,” December 2020. 9.2% Represents Americas. Data as of June 30, 2020. IDC, “Worldwide and U.S. Digital Agency Services Forecast, 2020-2024,” July 2020.
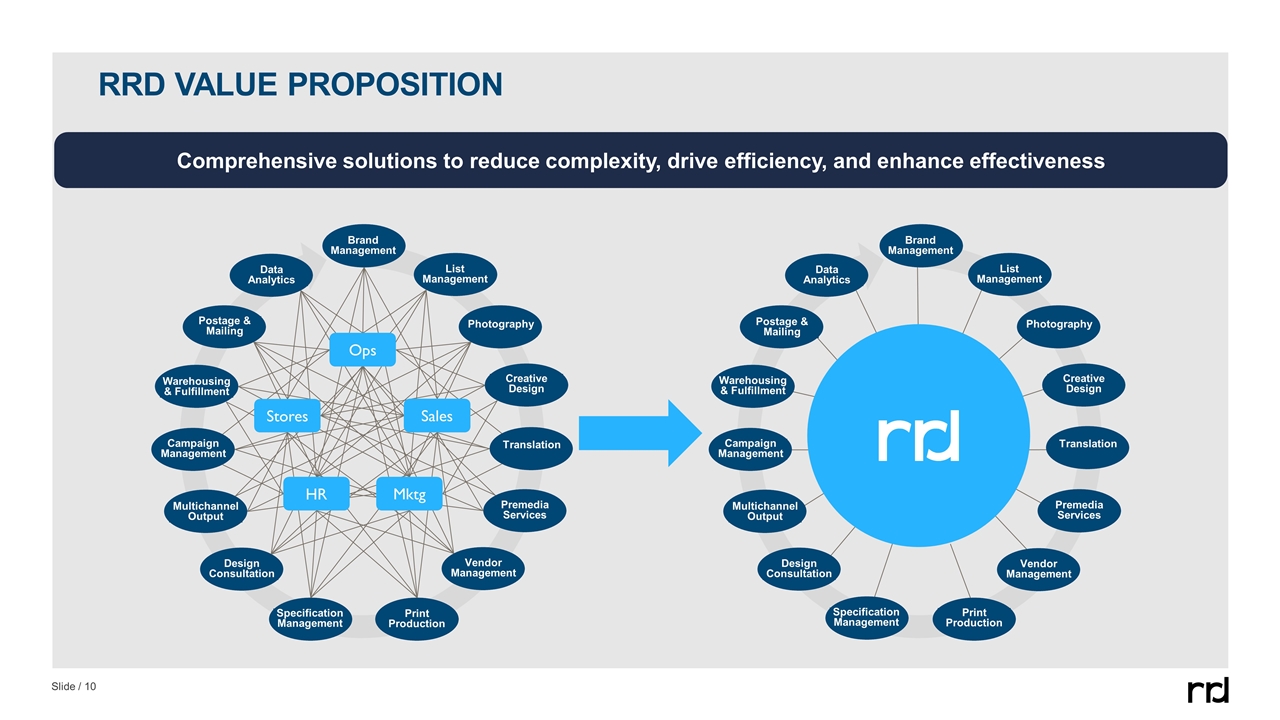
RRD VALUE PROPOSITION Data Analytics Postage & Mailing Warehousing & Fulfillment Campaign Management Multichannel Output Design Consultation Print Production Specification Management Vendor Management Premedia Services Translation Creative Design Photography List Management Brand Management Comprehensive solutions to reduce complexity, drive efficiency, and enhance effectiveness Data Analytics Postage & Mailing Warehousing & Fulfillment Campaign Management Multichannel Output Design Consultation Print Production Specification Management Vendor Management Premedia Services Translation Creative Design Photography List Management Brand Management Stores Ops Sales Mktg HR
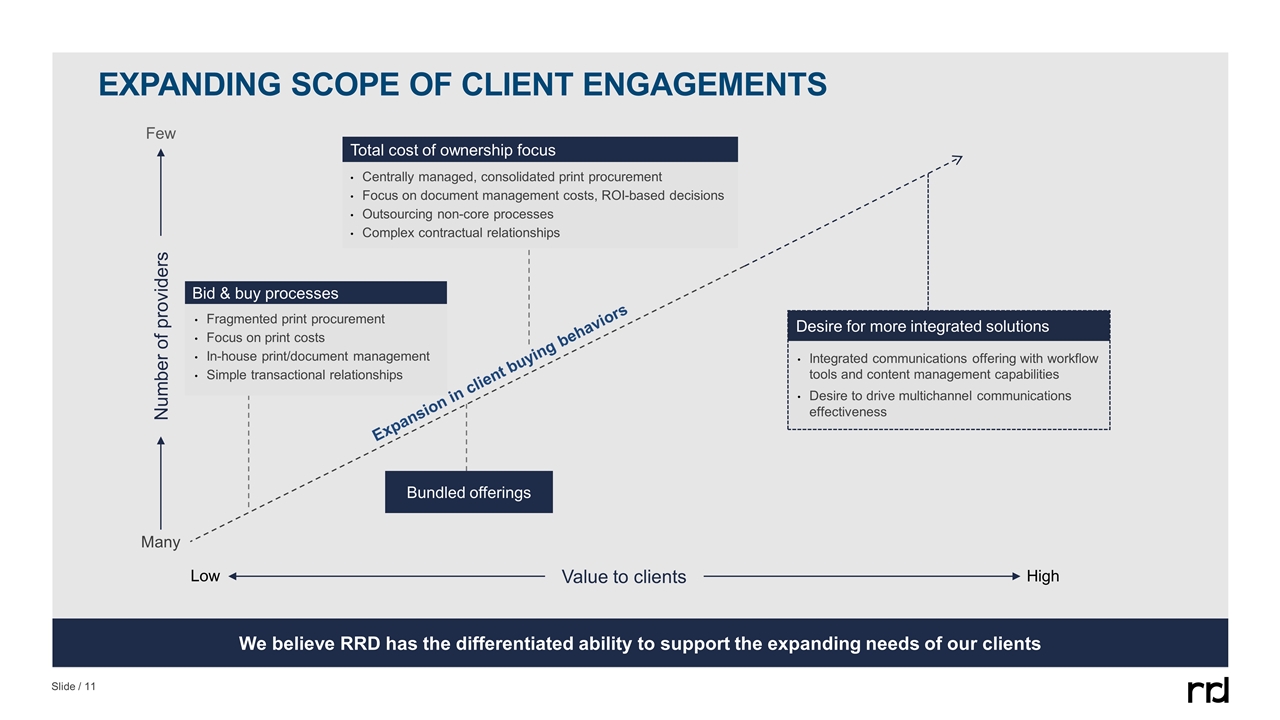
EXPANDING SCOPE OF CLIENT ENGAGEMENTS Value to clients Number of providers Few Many Low High Fragmented print procurement Focus on print costs In-house print/document management Simple transactional relationships Bid & buy processes Total cost of ownership focus Integrated communications offering with workflow tools and content management capabilities Desire to drive multichannel communications effectiveness Centrally managed, consolidated print procurement Focus on document management costs, ROI-based decisions Outsourcing non-core processes Complex contractual relationships Expansion in client buying behaviors Bundled offerings Desire for more integrated solutions We believe RRD has the differentiated ability to support the expanding needs of our clients
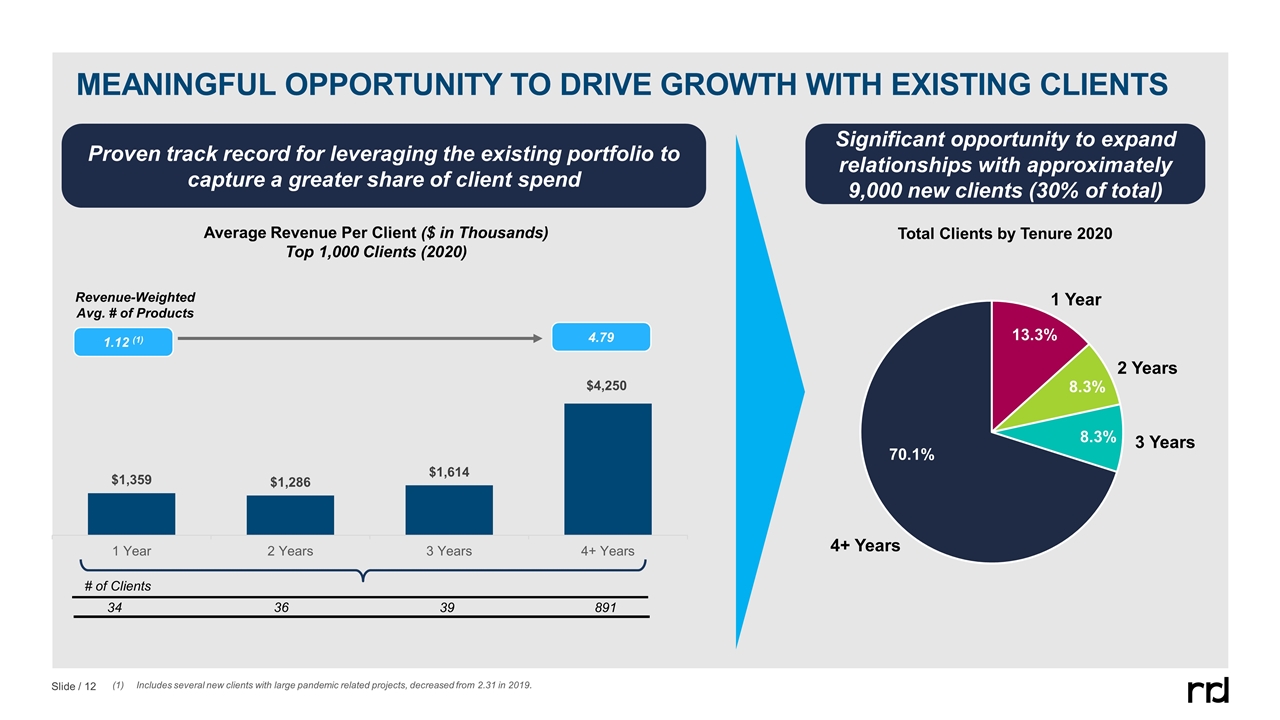
1.12 (1) 4.79 Revenue-Weighted Avg. # of Products MEANINGFUL OPPORTUNITY TO DRIVE GROWTH WITH EXISTING CLIENTS # of Clients 34 36 39 891 Includes several new clients with large pandemic related projects, decreased from 2.31 in 2019. Average Revenue Per Client ($ in Thousands) Top 1,000 Clients (2020) Proven track record for leveraging the existing portfolio to capture a greater share of client spend Significant opportunity to expand relationships with approximately 9,000 new clients (30% of total) 1 Year 2 Years 3 Years Total Clients by Tenure 2020 4+ Years
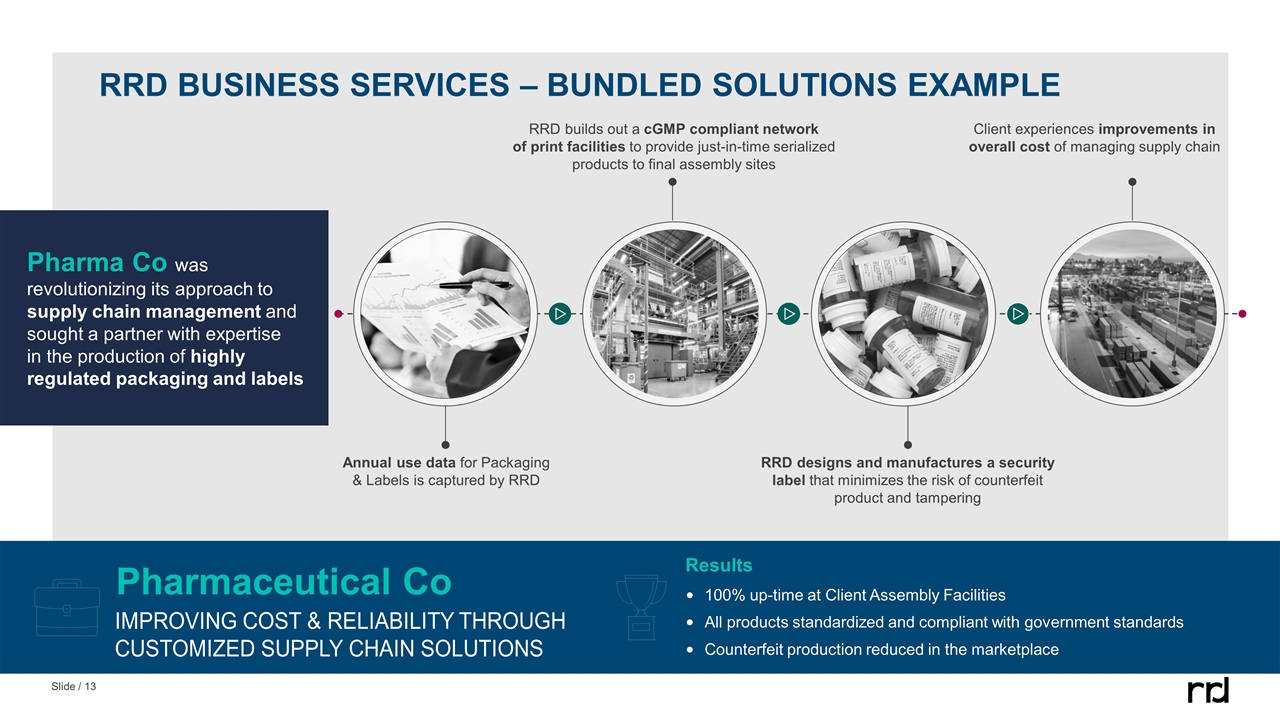
RRD BUSINESS SERVICES – BUNDLED SOLUTIONS EXAMPLE Pharma Co was revolutionizing its approach to supply chain management and sought a partner with expertise in the production of highly regulated packaging and labels Improving COST & RELIABILITY THROUGH customized SUPPLY CHAIN SOLUTIONS Pharmaceutical Co RRD builds out a cGMP compliant network of print facilities to provide just-in-time serialized products to final assembly sites Client experiences improvements in overall cost of managing supply chain Annual use data for Packaging & Labels is captured by RRD RRD designs and manufactures a security label that minimizes the risk of counterfeit product and tampering 100% up-time at Client Assembly Facilities All products standardized and compliant with government standards Counterfeit production reduced in the marketplace Results
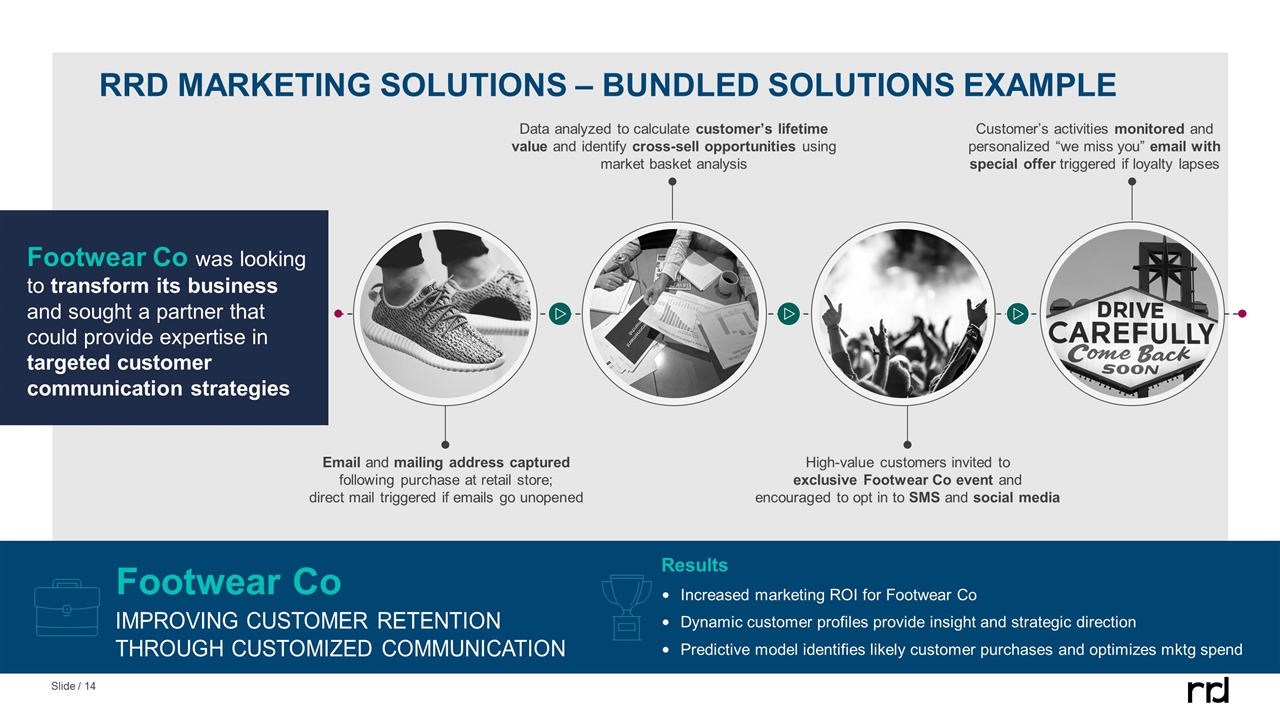
RRD MARKETING SOLUTIONS – BUNDLED SOLUTIONS EXAMPLE Footwear Co was looking to transform its business and sought a partner that could provide expertise in targeted customer communication strategies Improving customer retention Through customized communication Footwear Co Data analyzed to calculate customer’s lifetime value and identify cross-sell opportunities using market basket analysis Customer’s activities monitored and personalized “we miss you” email with special offer triggered if loyalty lapses Email and mailing address captured following purchase at retail store; direct mail triggered if emails go unopened High-value customers invited to exclusive Footwear Co event and encouraged to opt in to SMS and social media Increased marketing ROI for Footwear Co Dynamic customer profiles provide insight and strategic direction Predictive model identifies likely customer purchases and optimizes mktg spend Results
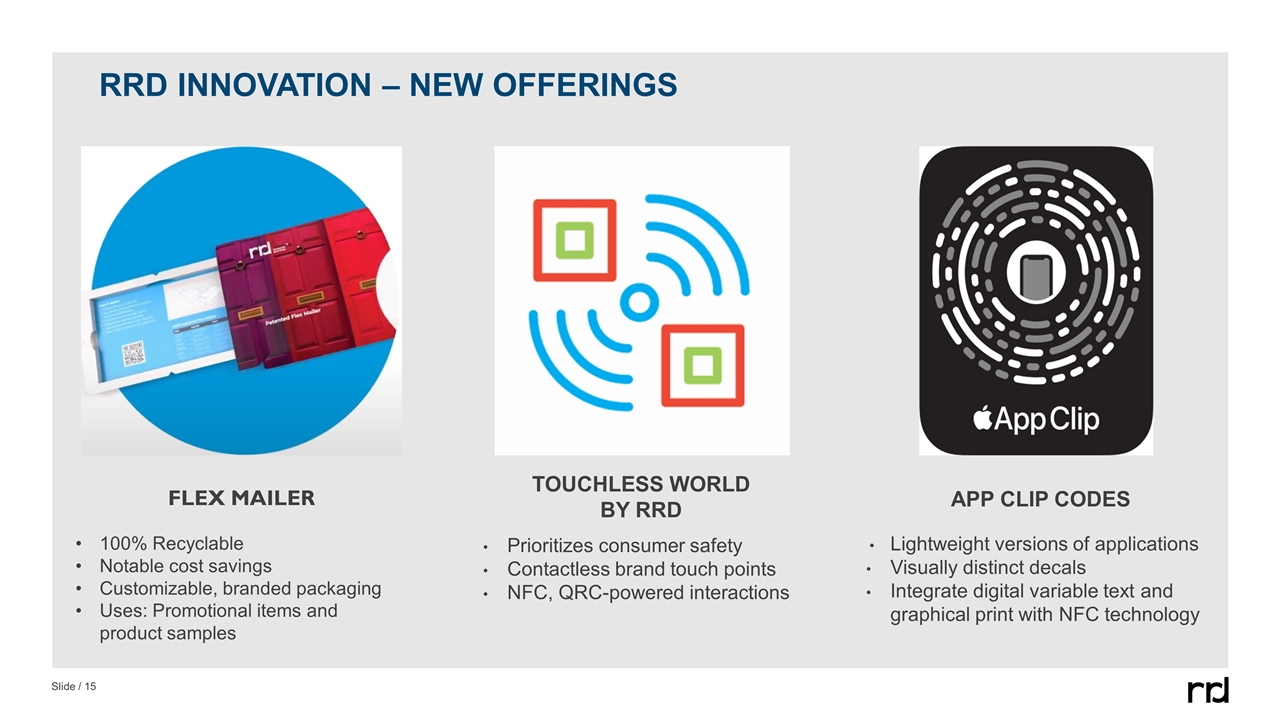
RRD INNOVATION – NEW OFFERINGS FLEX MAILER 100% Recyclable Notable cost savings Customizable, branded packaging Uses: Promotional items and product samples TOUCHLESS WORLD BY RRD Prioritizes consumer safety Contactless brand touch points NFC, QRC-powered interactions APP CLIP CODES Lightweight versions of applications Visually distinct decals Integrate digital variable text and graphical print with NFC technology

INDUSTRY DYNAMICS
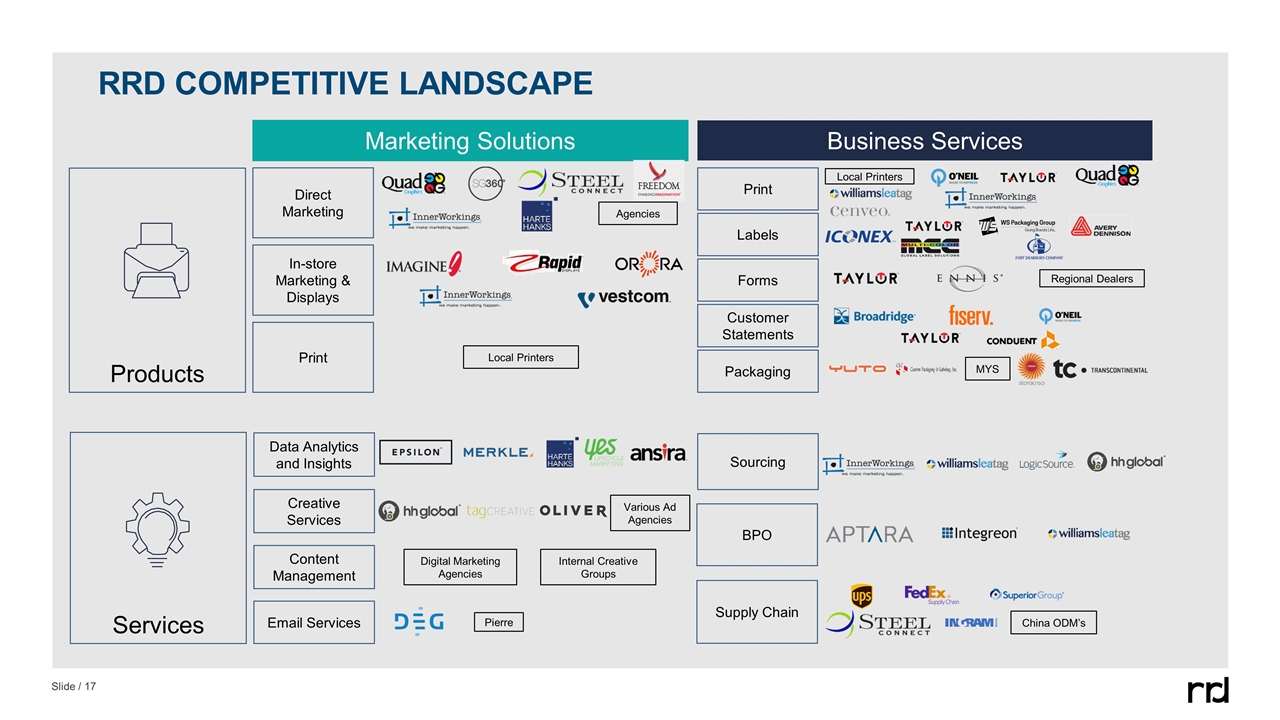
RRD COMPETITIVE LANDSCAPE Products Marketing Solutions Business Services Services Agencies Local Printers Direct Marketing In-store Marketing & Displays Print Print Labels Forms Customer Statements Packaging Local Printers Regional Dealers Sourcing BPO Supply Chain China ODM’s Data Analytics and Insights Creative Services Content Management Email Services Pierre Digital Marketing Agencies Internal Creative Groups Various Ad Agencies MYS

Key investment highlights
COMPREHENSIVE PORTFOLIO OF KEY PRODUCTS AND SERVICES › KEY INVESTMENT HIGHLIGHTS DISCIPLINED FINANCIAL STRATEGY › EXTENSIVE AND DIVERSE CLIENT BASE WITH LIMITED INDUSTRY CONCENTRATION › EXPERIENCED AND DIVERSE MANAGEMENT TEAM ›
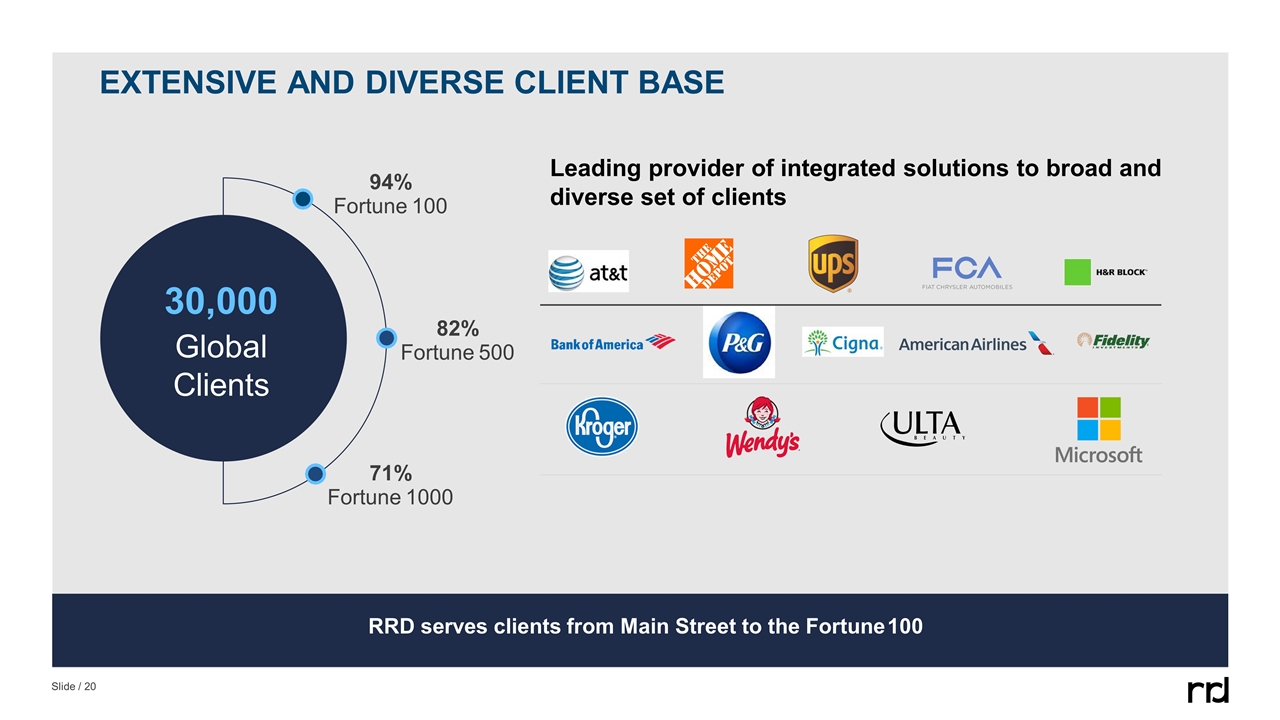
EXTENSIVE AND DIVERSE CLIENT BASE RRD serves clients from Main Street to the Fortune 100 30,000 Global Clients 94% Fortune 100 82% Fortune 500 71% Fortune 1000 Leading provider of integrated solutions to broad and diverse set of clients
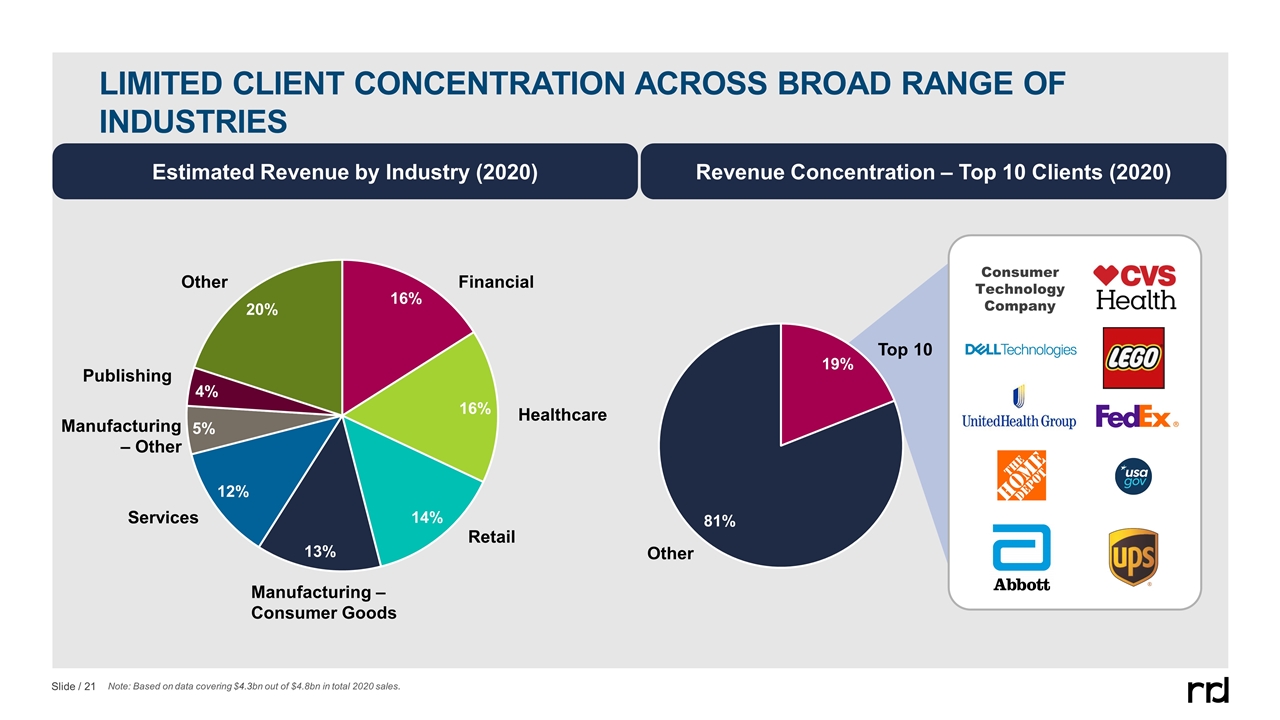
LIMITED CLIENT CONCENTRATION ACROSS BROAD RANGE OF INDUSTRIES Estimated Revenue by Industry (2020) Revenue Concentration – Top 10 Clients (2020) Financial Healthcare Retail Services Manufacturing – Consumer Goods Manufacturing – Other Publishing Other Top 10 Other Note: Based on data covering $4.3bn out of $4.8bn in total 2020 sales. Consumer Technology Company
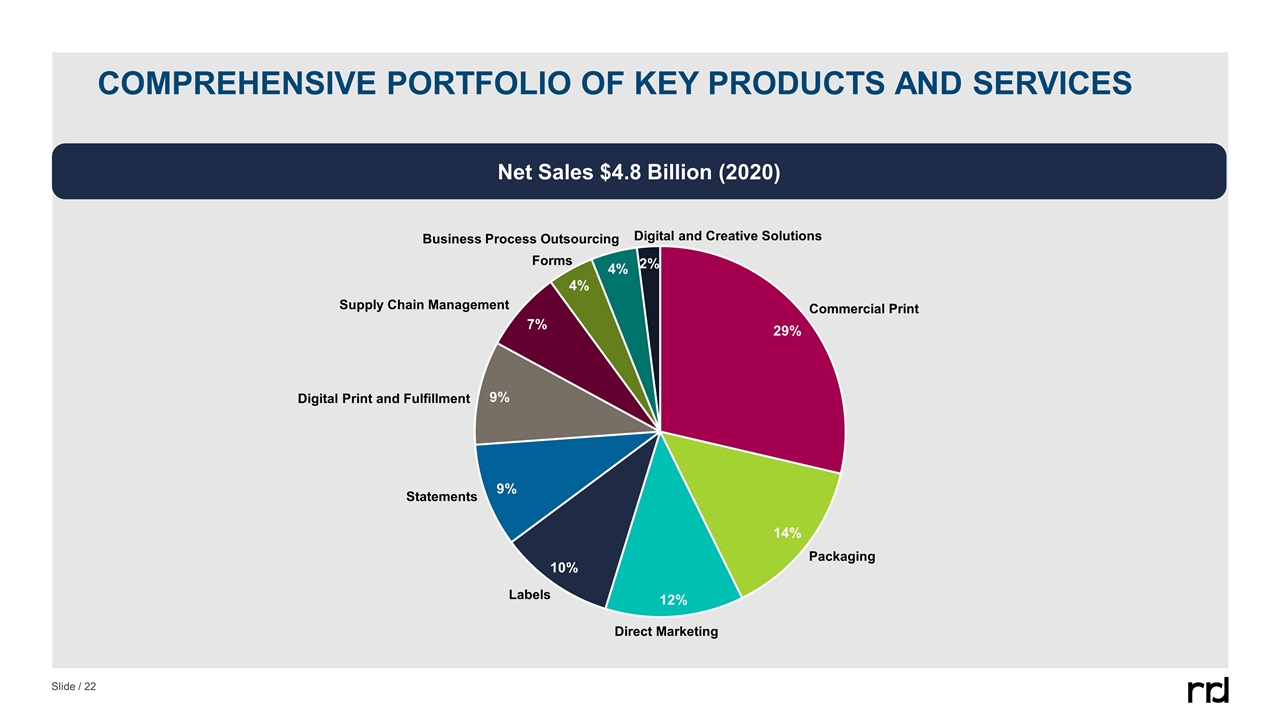
COMPREHENSIVE PORTFOLIO OF KEY PRODUCTS AND SERVICES Net Sales $4.8 Billion (2020) Business Process Outsourcing Forms Supply Chain Management Digital Print and Fulfillment Statements Labels Direct Marketing Packaging Commercial Print Digital and Creative Solutions
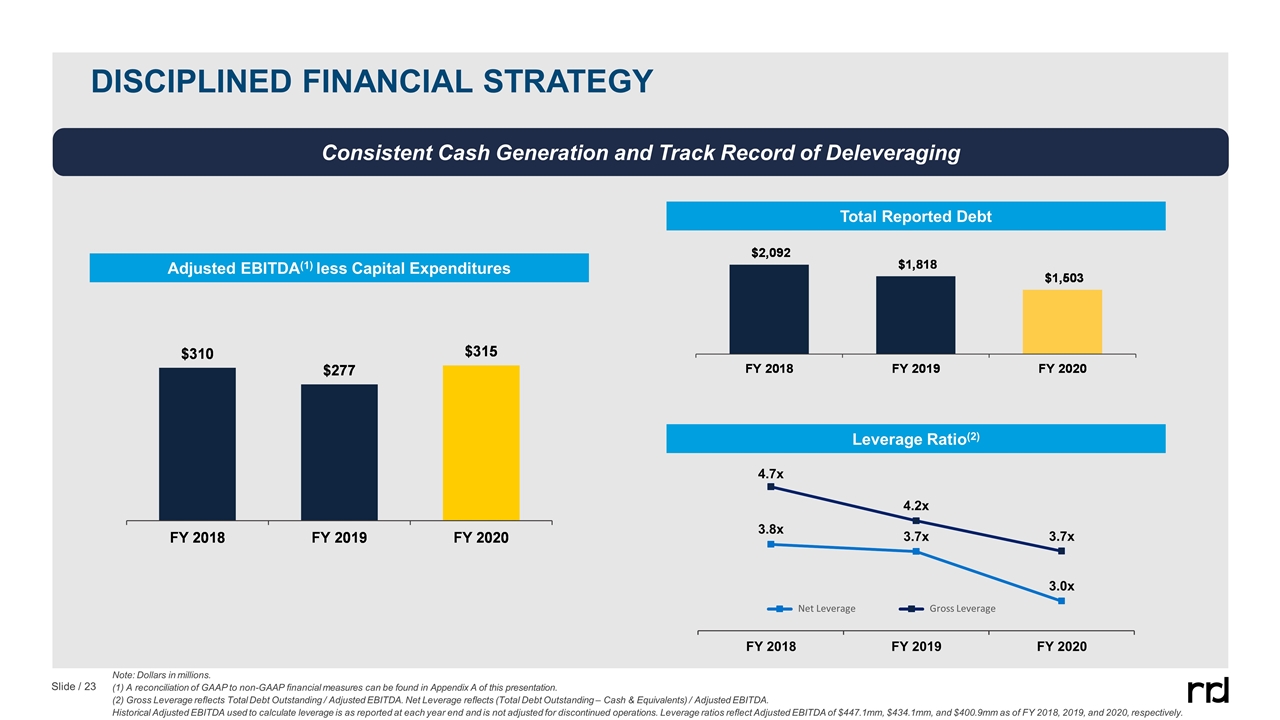
Adjusted EBITDA(1) less Capital Expenditures Note: Dollars in millions. (1) A reconciliation of GAAP to non-GAAP financial measures can be found in Appendix A of this presentation. (2) Gross Leverage reflects Total Debt Outstanding / Adjusted EBITDA. Net Leverage reflects (Total Debt Outstanding – Cash & Equivalents) / Adjusted EBITDA. Historical Adjusted EBITDA used to calculate leverage is as reported at each year end and is not adjusted for discontinued operations. Leverage ratios reflect Adjusted EBITDA of $447.1mm, $434.1mm, and $400.9mm as of FY 2018, 2019, and 2020, respectively. Disciplined Financial Strategy Consistent Cash Generation and Track Record of Deleveraging Total Reported Debt Leverage Ratio(2) 3.8x 3.7x 3.0x 4.7x 4.2x 3.7x FY 2018 FY 2019 FY 2020 Net Leverage Gross Leverage
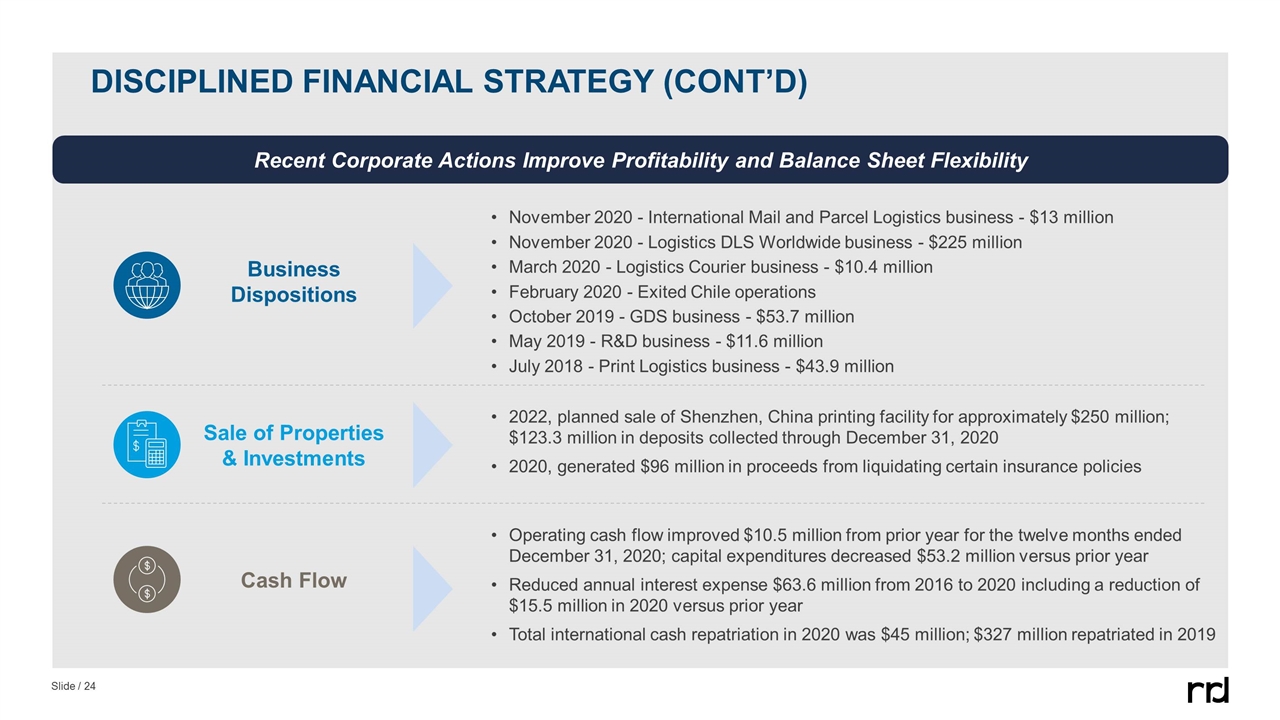
Disciplined Financial Strategy (Cont’d) 2022, planned sale of Shenzhen, China printing facility for approximately $250 million; $123.3 million in deposits collected through December 31, 2020 2020, generated $96 million in proceeds from liquidating certain insurance policies Sale of Properties & Investments Operating cash flow improved $10.5 million from prior year for the twelve months ended December 31, 2020; capital expenditures decreased $53.2 million versus prior year Reduced annual interest expense $63.6 million from 2016 to 2020 including a reduction of $15.5 million in 2020 versus prior year Total international cash repatriation in 2020 was $45 million; $327 million repatriated in 2019 Cash Flow November 2020 - International Mail and Parcel Logistics business - $13 million November 2020 - Logistics DLS Worldwide business - $225 million March 2020 - Logistics Courier business - $10.4 million February 2020 - Exited Chile operations October 2019 - GDS business - $53.7 million May 2019 - R&D business - $11.6 million July 2018 - Print Logistics business - $43.9 million Business Dispositions Recent Corporate Actions Improve Profitability and Balance Sheet Flexibility
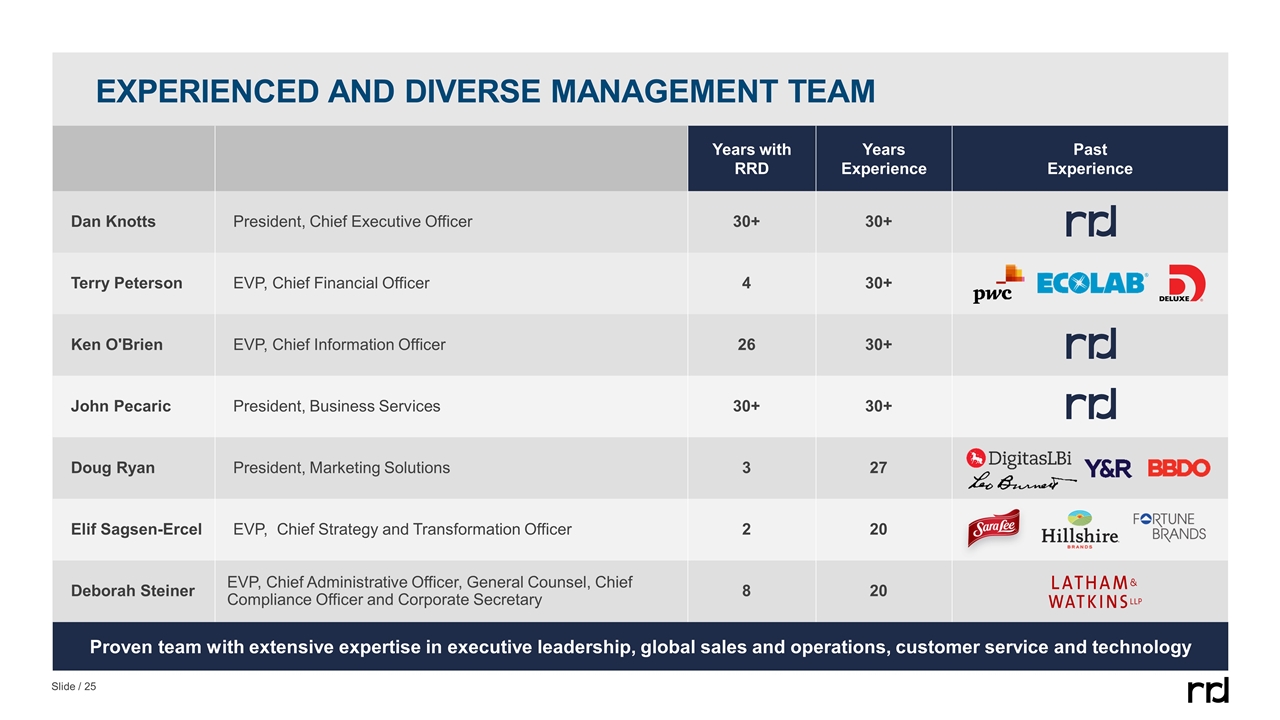
Years with RRD Years Experience Past Experience Dan Knotts President, Chief Executive Officer 30+ 30+ Terry Peterson EVP, Chief Financial Officer 4 30+ Ken O'Brien EVP, Chief Information Officer 26 30+ John Pecaric President, Business Services 30+ 30+ Doug Ryan President, Marketing Solutions 3 27 Elif Sagsen-Ercel EVP, Chief Strategy and Transformation Officer 2 20 Deborah Steiner EVP, Chief Administrative Officer, General Counsel, Chief Compliance Officer and Corporate Secretary 8 20 EXPERIENCED AND DIVERSE MANAGEMENT TEAM Proven team with extensive expertise in executive leadership, global sales and operations, customer service and technology

FINANCIAL OVERVIEW
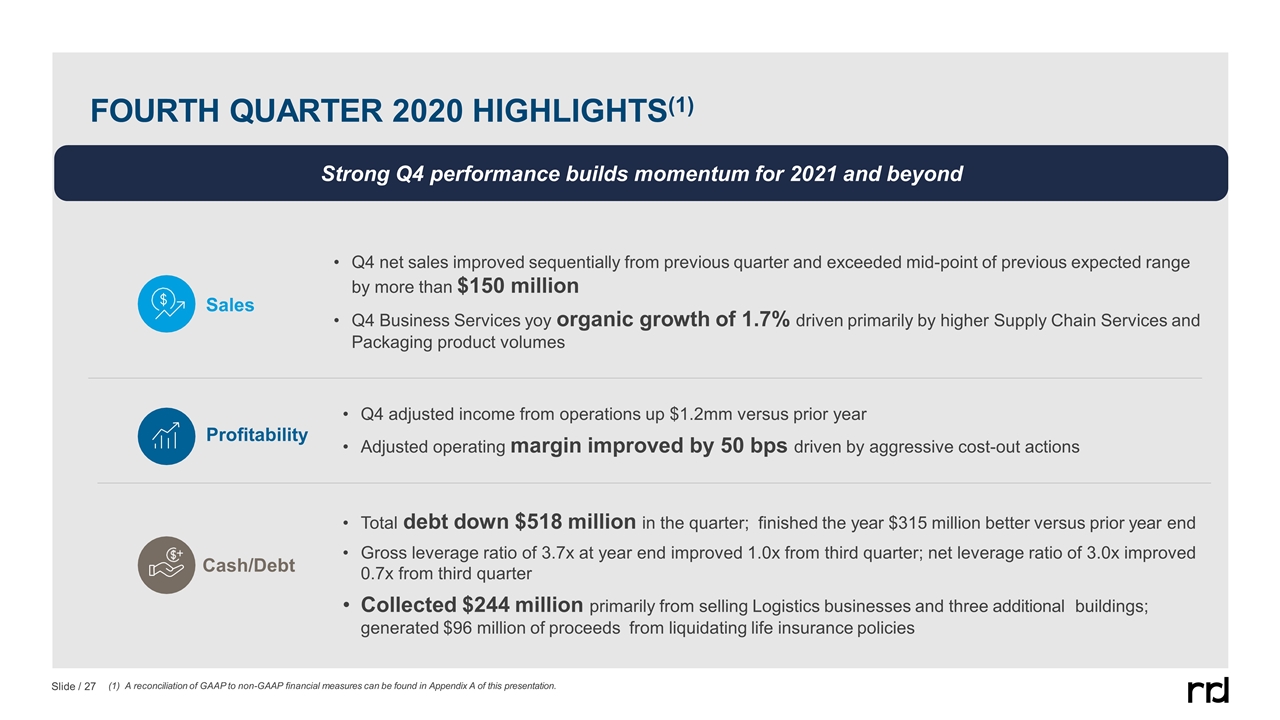
FOURTH QUARTER 2020 HIGHLIGHTS(1) Total debt down $518 million in the quarter; finished the year $315 million better versus prior year end Gross leverage ratio of 3.7x at year end improved 1.0x from third quarter; net leverage ratio of 3.0x improved 0.7x from third quarter Collected $244 million primarily from selling Logistics businesses and three additional buildings; generated $96 million of proceeds from liquidating life insurance policies Sales Profitability Cash/Debt Strong Q4 performance builds momentum for 2021 and beyond (1) A reconciliation of GAAP to non-GAAP financial measures can be found in Appendix A of this presentation. Q4 adjusted income from operations up $1.2mm versus prior year Adjusted operating margin improved by 50 bps driven by aggressive cost-out actions Q4 net sales improved sequentially from previous quarter and exceeded mid-point of previous expected range by more than $150 million Q4 Business Services yoy organic growth of 1.7% driven primarily by higher Supply Chain Services and Packaging product volumes
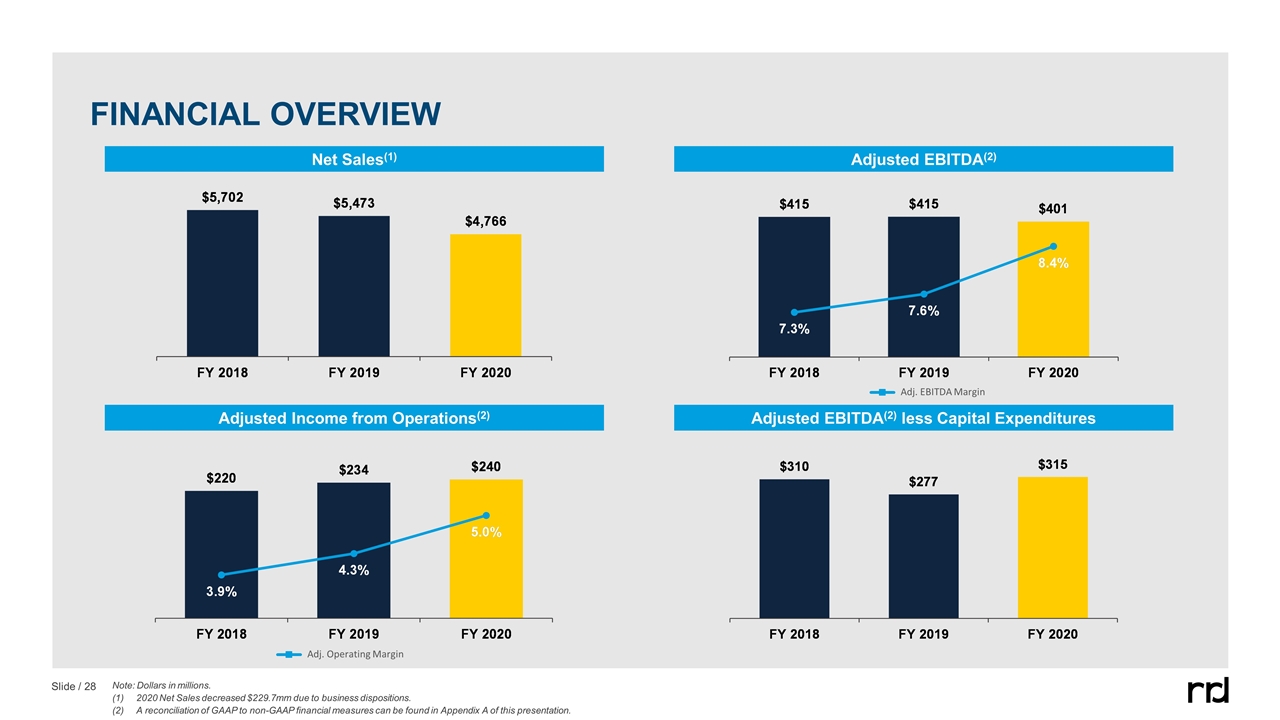
Adjusted EBITDA(2) less Capital Expenditures Note: Dollars in millions. 2020 Net Sales decreased $229.7mm due to business dispositions. A reconciliation of GAAP to non-GAAP financial measures can be found in Appendix A of this presentation. FINANCIAL Overview Adjusted EBITDA(2) Net Sales(1) Adjusted Income from Operations(2) Adj. EBITDA Margin Adj. Operating Margin
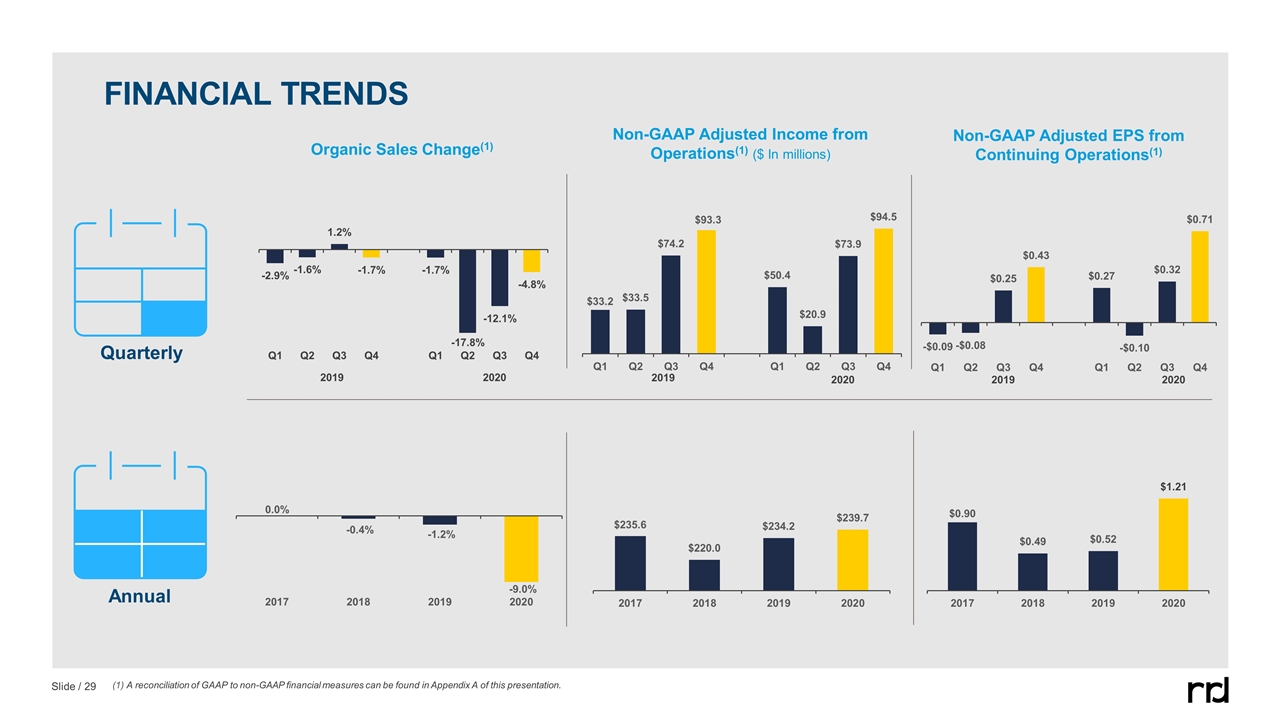
FINANCIAL TRENDS Annual Quarterly (1) A reconciliation of GAAP to non-GAAP financial measures can be found in Appendix A of this presentation. 2019 2020 2019 2020 2019 2020 Organic Sales Change(1) Non-GAAP Adjusted Income from Operations(1) ($ In millions) Non-GAAP Adjusted EPS from Continuing Operations(1)
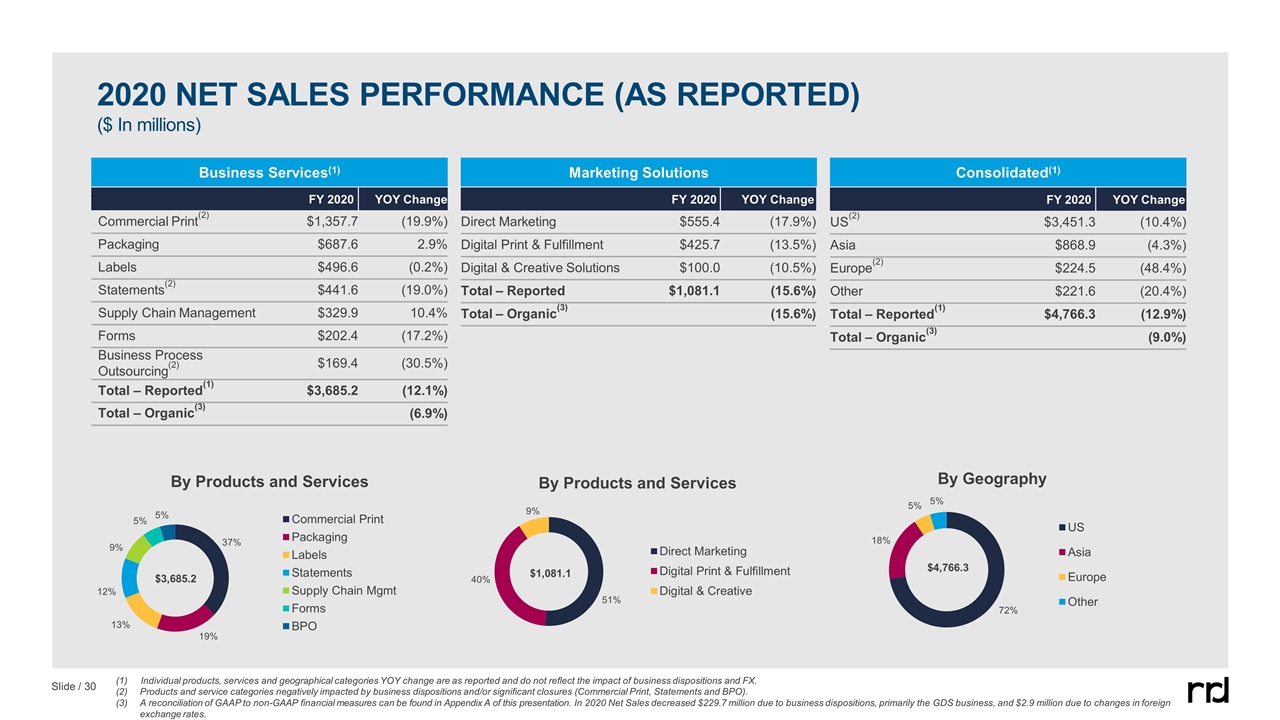
2020 NET SALES PERFORMANCE (AS REPORTED) ($ In millions) Business Services(1) Marketing Solutions Consolidated(1) ` FY 2020 YOY Change Commercial Print(2) $1,357.7 (19.9%) Packaging $687.6 2.9% Labels $496.6 (0.2%) Statements(2) $441.6 (19.0%) Supply Chain Management $329.9 10.4% Forms $202.4 (17.2%) Business Process Outsourcing(2) $169.4 (30.5%) Total – Reported(1) $3,685.2 (12.1%) Total – Organic(3) (6.9%) FY 2020 YOY Change Direct Marketing $555.4 (17.9%) Digital Print & Fulfillment $425.7 (13.5%) Digital & Creative Solutions $100.0 (10.5%) Total – Reported $1,081.1 (15.6%) Total – Organic(3) (15.6%) FY 2020 YOY Change US(2) $3,451.3 (10.4%) Asia $868.9 (4.3%) Europe(2) $224.5 (48.4%) Other $221.6 (20.4%) Total – Reported(1) $4,766.3 (12.9%) Total – Organic(3) (9.0%) By Products and Services By Products and Services By Geography $3,685.2 $1,081.1 $4,766.3 (1) Individual products, services and geographical categories YOY change are as reported and do not reflect the impact of business dispositions and FX. Products and service categories negatively impacted by business dispositions and/or significant closures (Commercial Print, Statements and BPO). A reconciliation of GAAP to non-GAAP financial measures can be found in Appendix A of this presentation. In 2020 Net Sales decreased $229.7 million due to business dispositions, primarily the GDS business, and $2.9 million due to changes in foreign exchange rates.
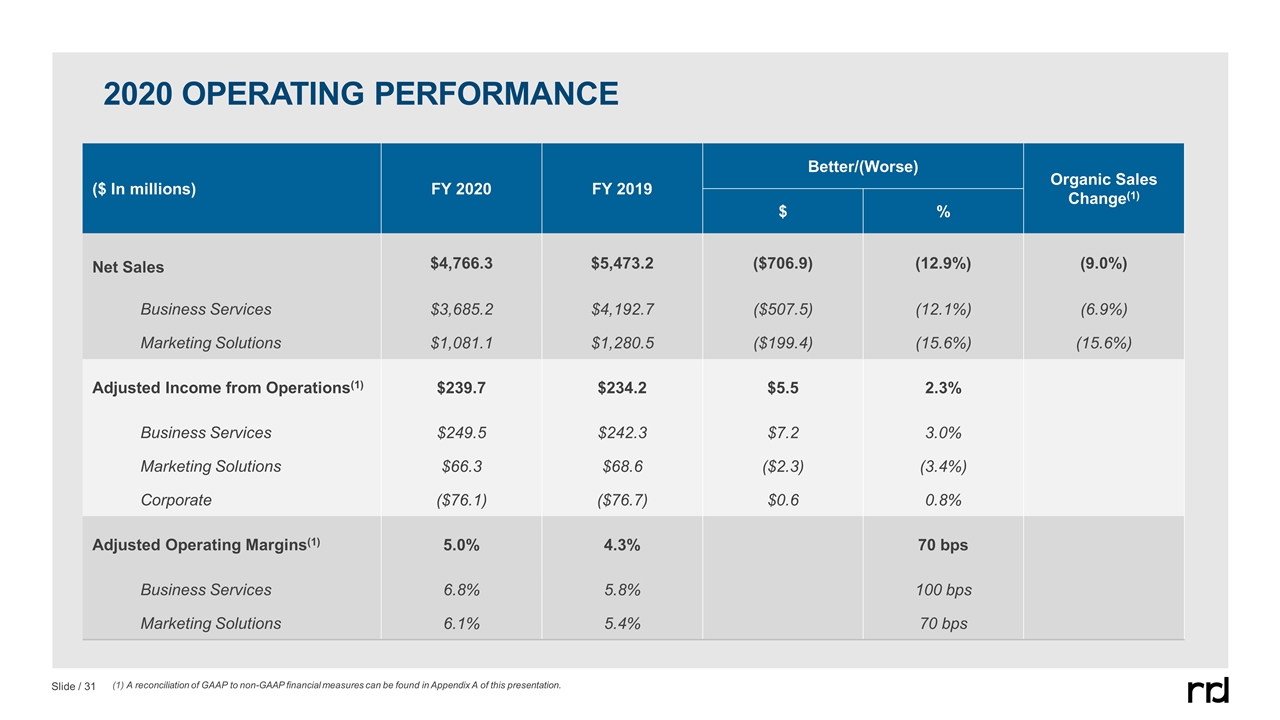
2020 OPERATING PERFORMANCE ($ In millions) FY 2020 FY 2019 Better/(Worse) Organic Sales Change(1) $ % Net Sales $4,766.3 $5,473.2 ($706.9) (12.9%) (9.0%) Business Services $3,685.2 $4,192.7 ($507.5) (12.1%) (6.9%) Marketing Solutions $1,081.1 $1,280.5 ($199.4) (15.6%) (15.6%) Adjusted Income from Operations(1) $239.7 $234.2 $5.5 2.3% Business Services $249.5 $242.3 $7.2 3.0% Marketing Solutions $66.3 $68.6 ($2.3) (3.4%) Corporate ($76.1) ($76.7) $0.6 0.8% Adjusted Operating Margins(1) 5.0% 4.3% 70 bps Business Services 6.8% 5.8% 100 bps Marketing Solutions 6.1% 5.4% 70 bps (1) A reconciliation of GAAP to non-GAAP financial measures can be found in Appendix A of this presentation.
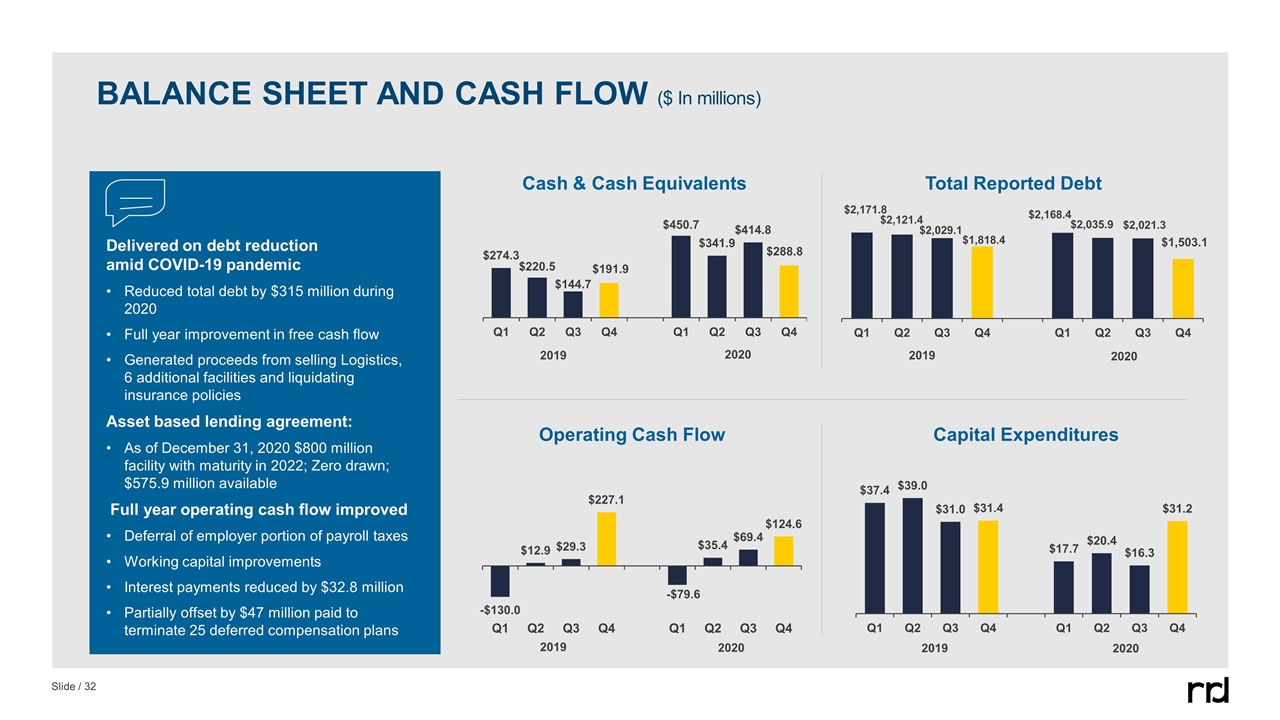
Total Reported Debt Capital Expenditures Operating Cash Flow Cash & Cash Equivalents Delivered on debt reduction amid COVID-19 pandemic Reduced total debt by $315 million during 2020 Full year improvement in free cash flow Generated proceeds from selling Logistics, 6 additional facilities and liquidating insurance policies Asset based lending agreement: As of December 31, 2020 $800 million facility with maturity in 2022; Zero drawn; $575.9 million available Full year operating cash flow improved Deferral of employer portion of payroll taxes Working capital improvements Interest payments reduced by $32.8 million Partially offset by $47 million paid to terminate 25 deferred compensation plans 2019 2019 2020 2020 2019 2019 BALANCE SHEET AND CASH FLOW ($ In millions)
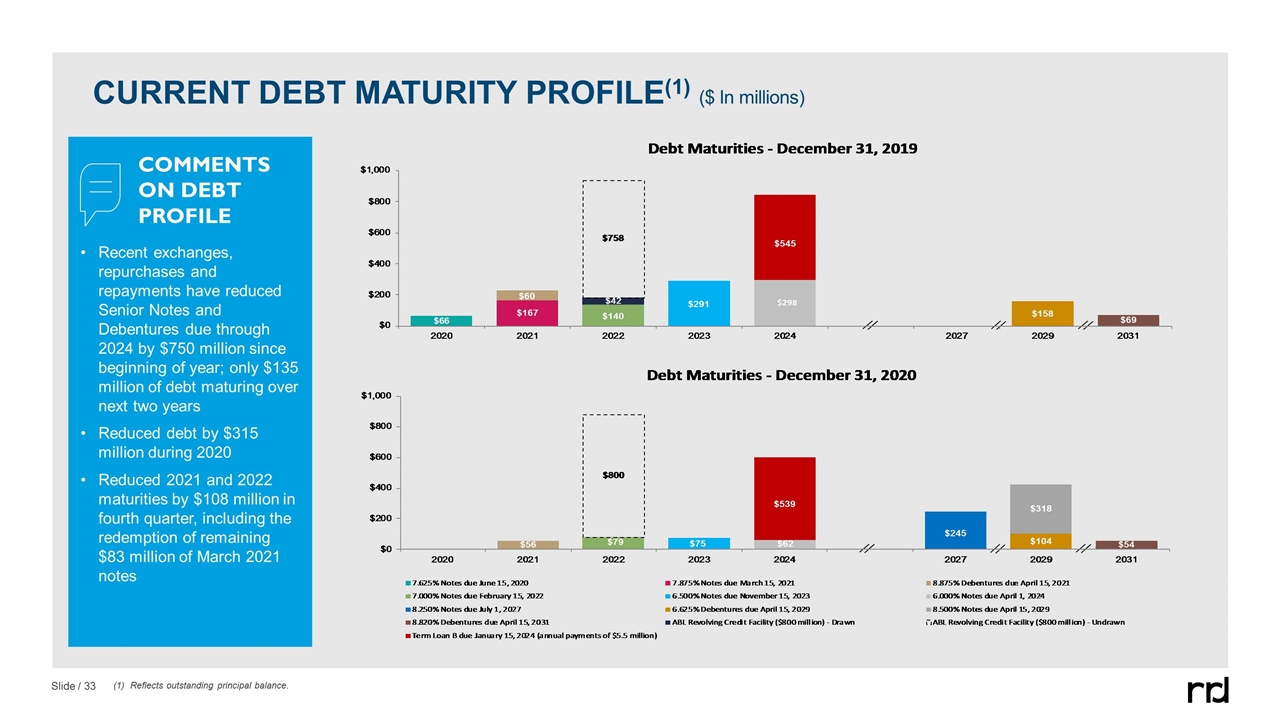
Recent exchanges, repurchases and repayments have reduced Senior Notes and Debentures due through 2024 by $750 million since beginning of year; only $135 million of debt maturing over next two years Reduced debt by $315 million during 2020 Reduced 2021 and 2022 maturities by $108 million in fourth quarter, including the redemption of remaining $83 million of March 2021 notes (1) Reflects outstanding principal balance. COMMENTS ON DEBT PROFILE CURRENT DEBT MATURITY PROFILE(1) ($ In millions)

Appendix A

ORGANIC SALES RECONCILIATION
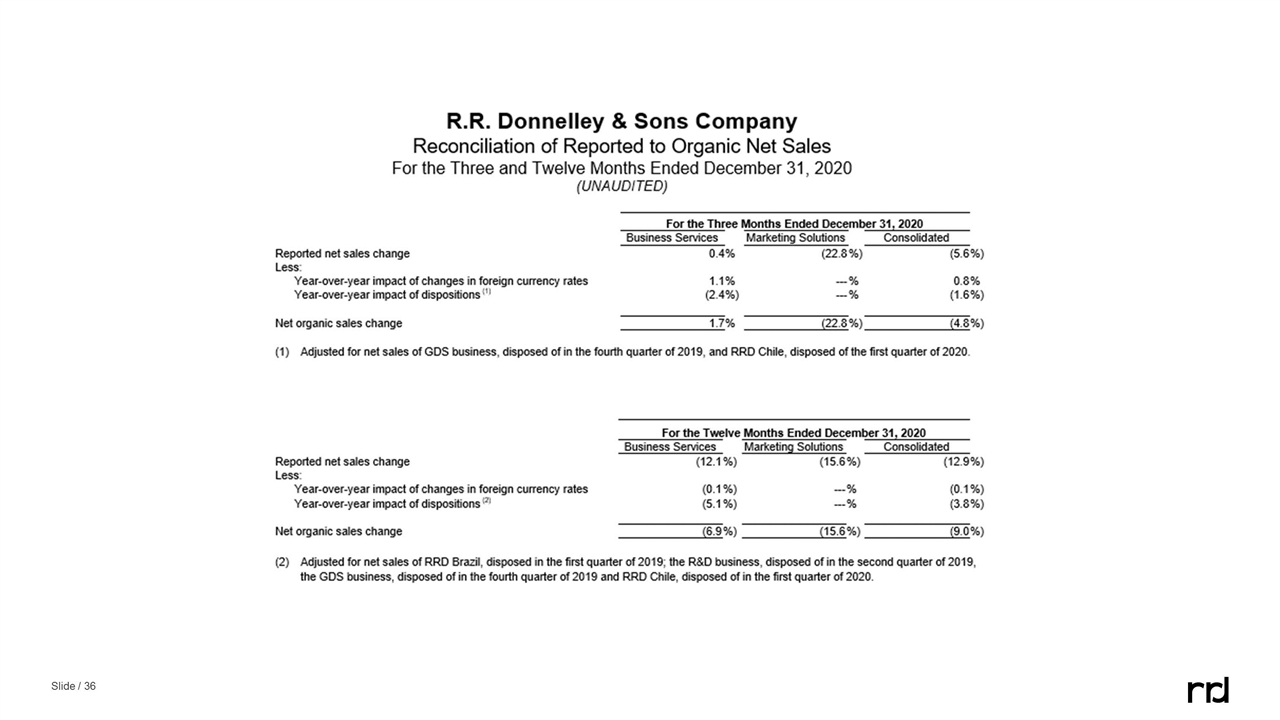
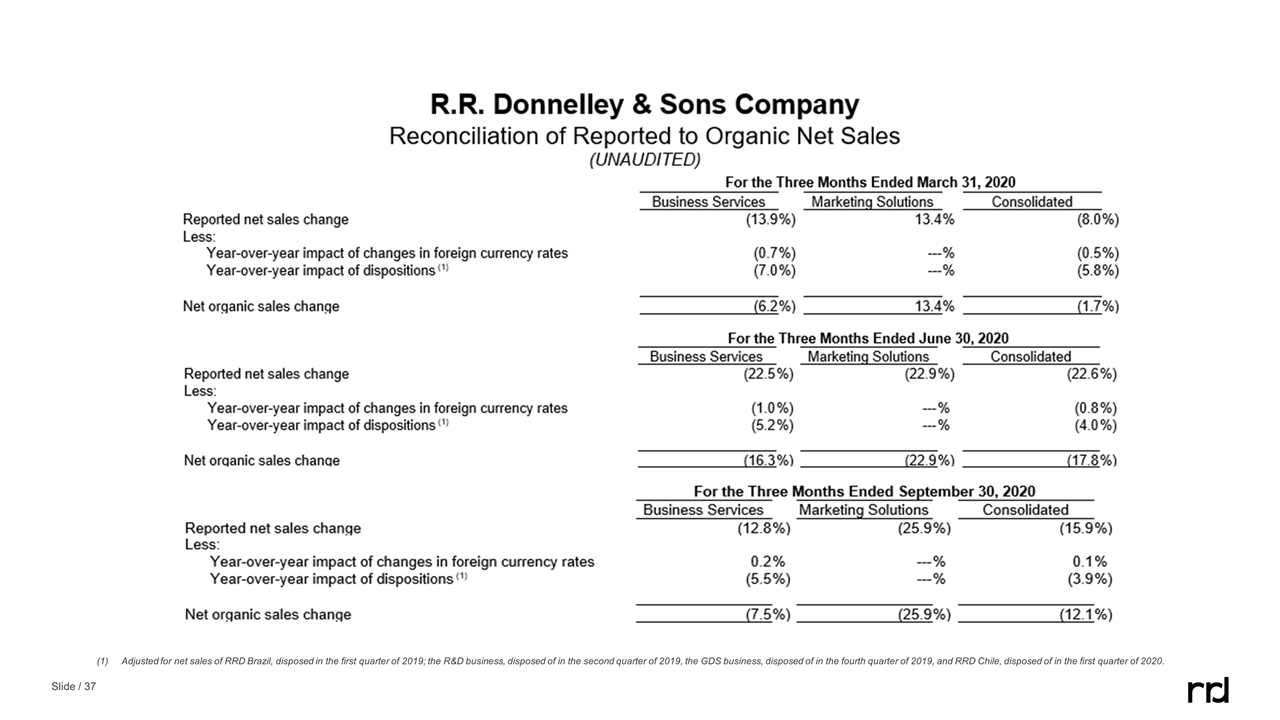
(1) Adjusted for net sales of RRD Brazil, disposed in the first quarter of 2019; the R&D business, disposed of in the second quarter of 2019, the GDS business, disposed of in the fourth quarter of 2019, and RRD Chile, disposed of in the first quarter of 2020.
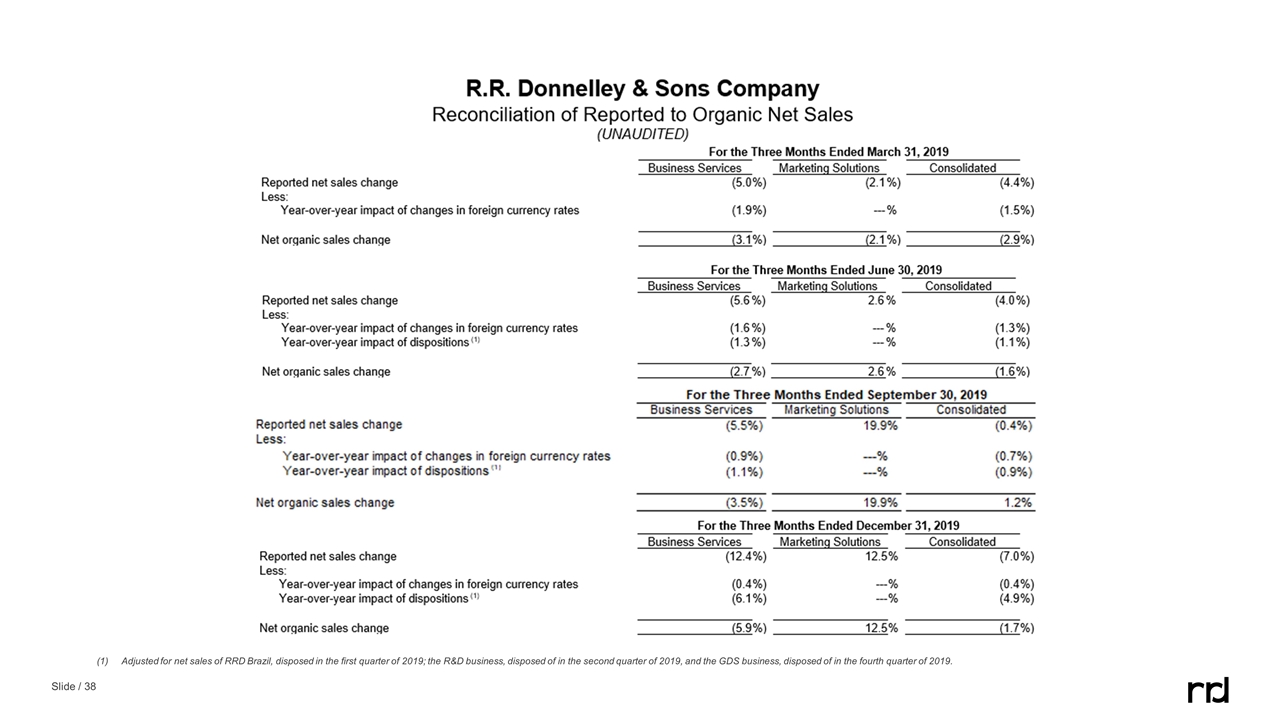
(1) Adjusted for net sales of RRD Brazil, disposed in the first quarter of 2019; the R&D business, disposed of in the second quarter of 2019, and the GDS business, disposed of in the fourth quarter of 2019.
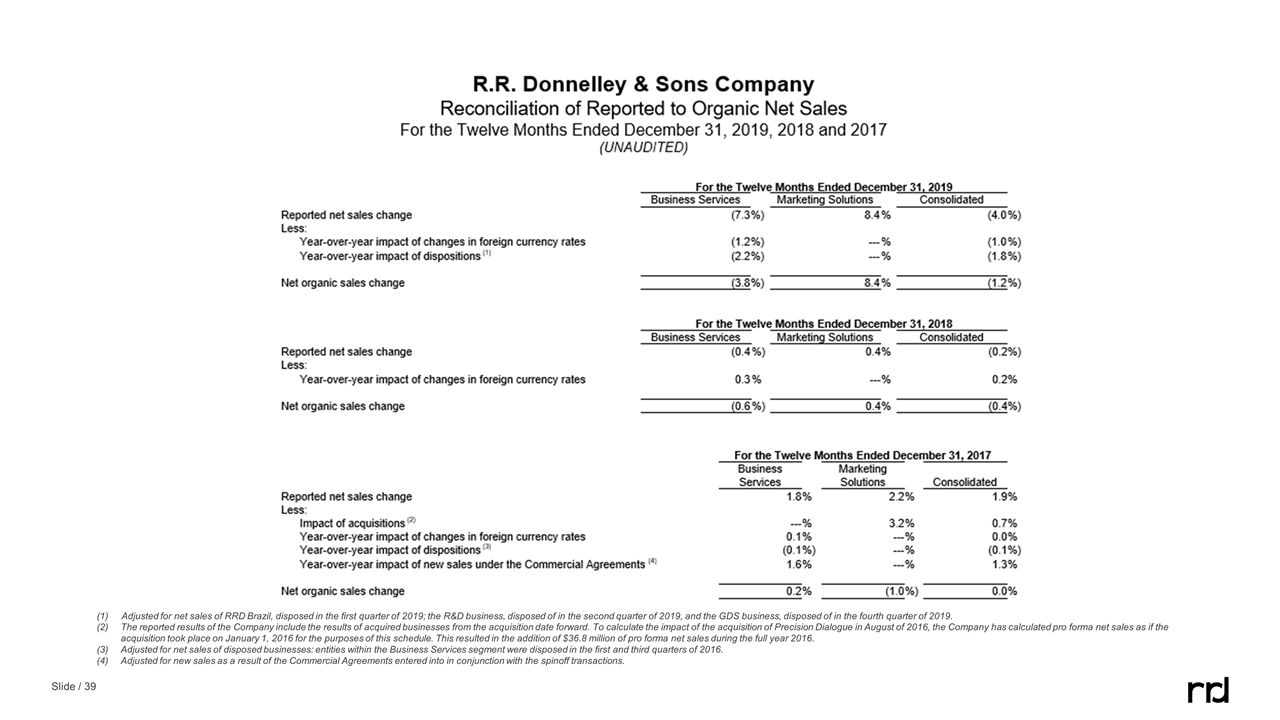
(1) Adjusted for net sales of RRD Brazil, disposed in the first quarter of 2019; the R&D business, disposed of in the second quarter of 2019, and the GDS business, disposed of in the fourth quarter of 2019. The reported results of the Company include the results of acquired businesses from the acquisition date forward. To calculate the impact of the acquisition of Precision Dialogue in August of 2016, the Company has calculated pro forma net sales as if the acquisition took place on January 1, 2016 for the purposes of this schedule. This resulted in the addition of $36.8 million of pro forma net sales during the full year 2016. Adjusted for net sales of disposed businesses: entities within the Business Services segment were disposed in the first and third quarters of 2016. Adjusted for new sales as a result of the Commercial Agreements entered into in conjunction with the spinoff transactions.

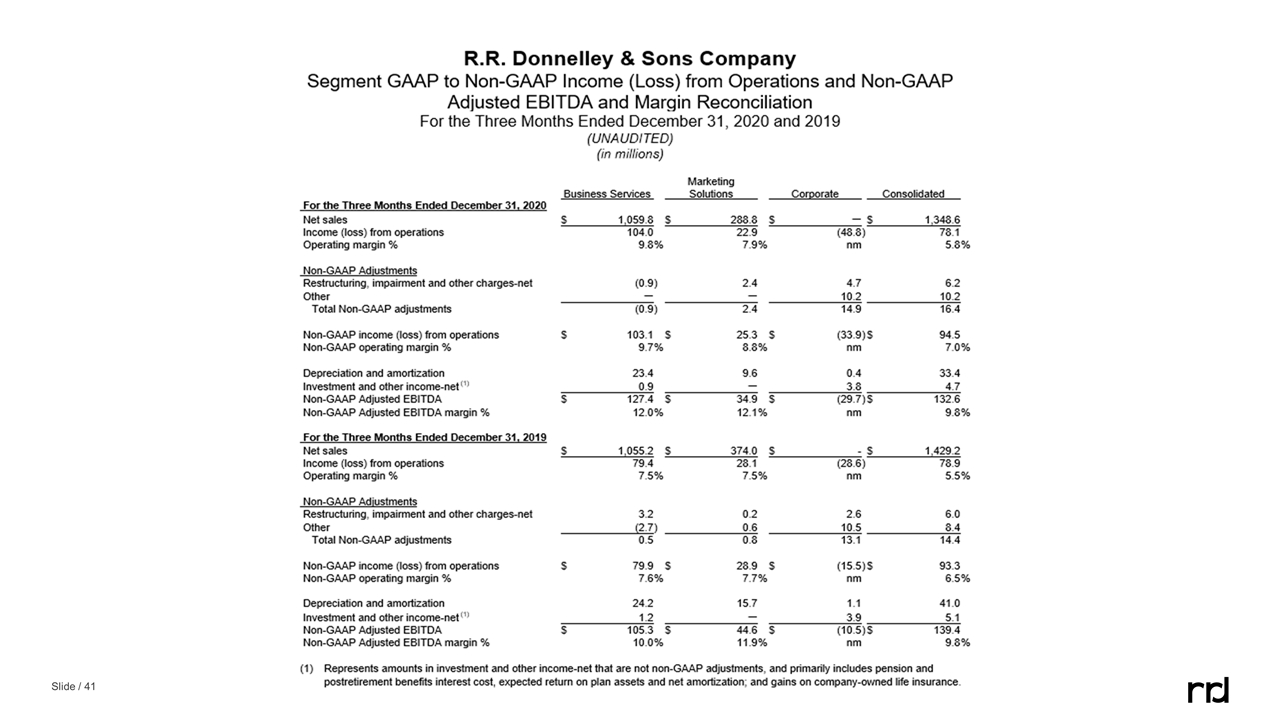
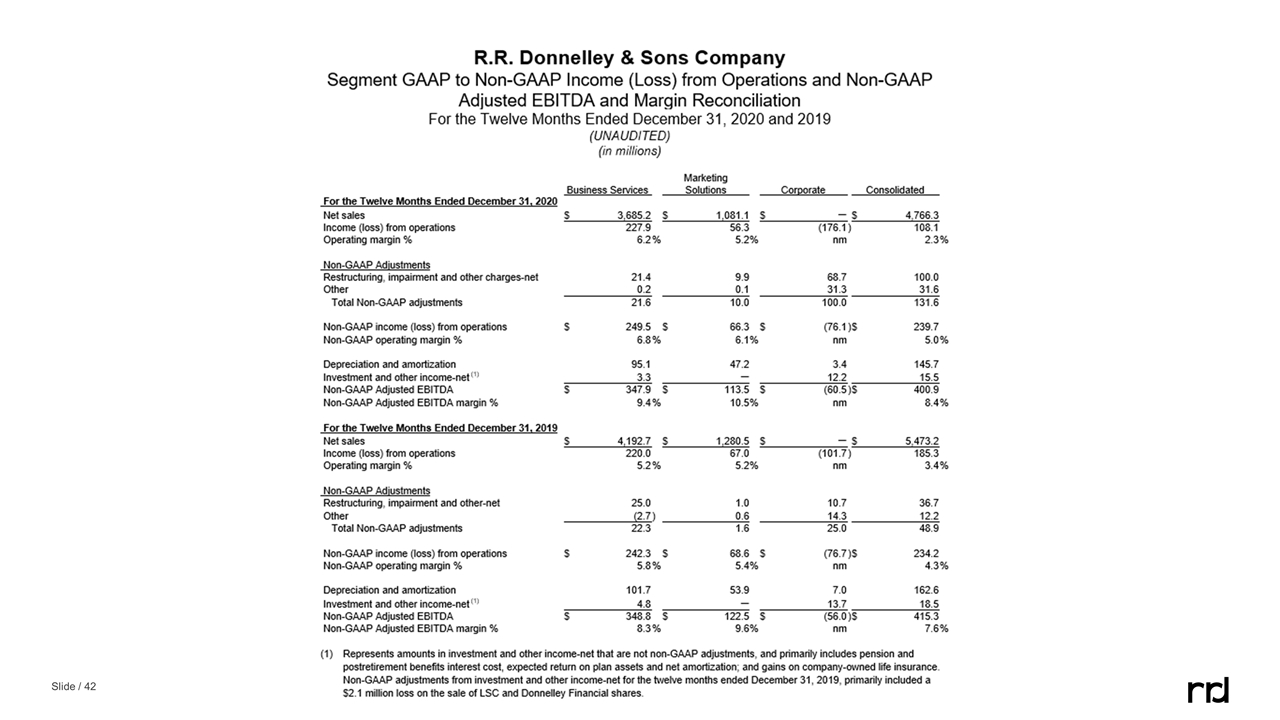
GAAP to Non-gaap ifo, ebitda and margin by segment

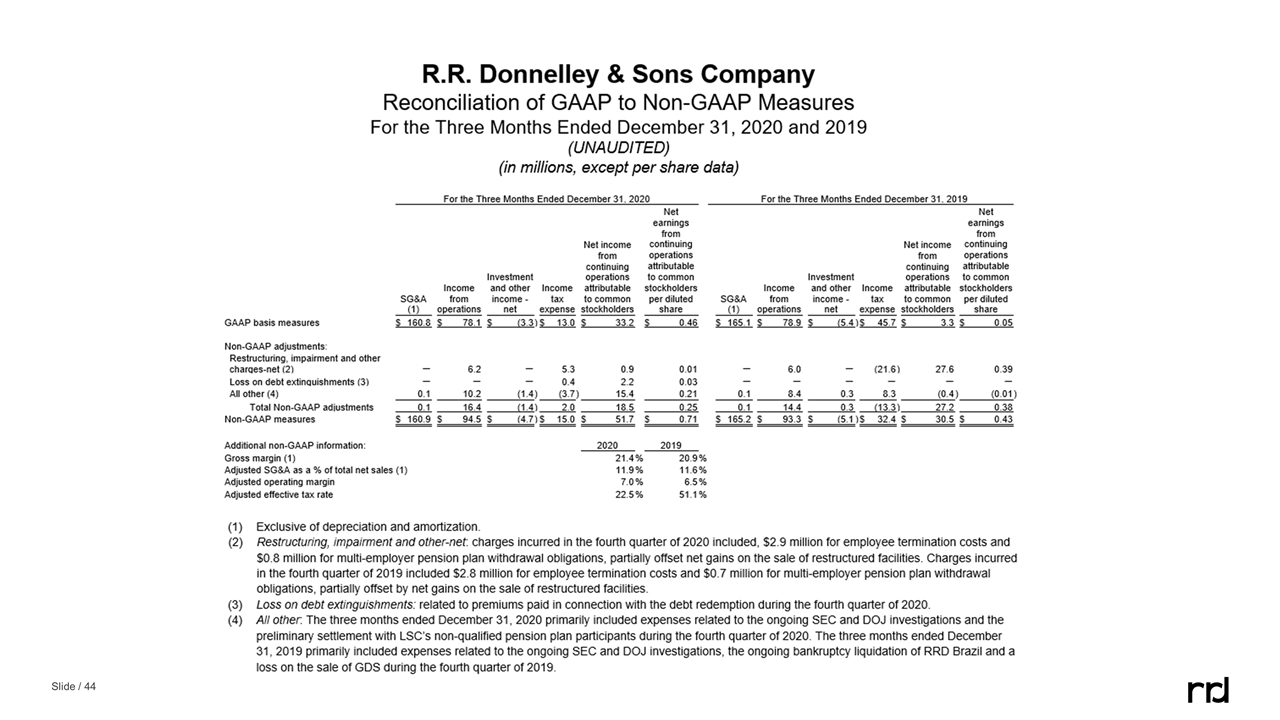
Reconciliation of gaap to non-gaap measures
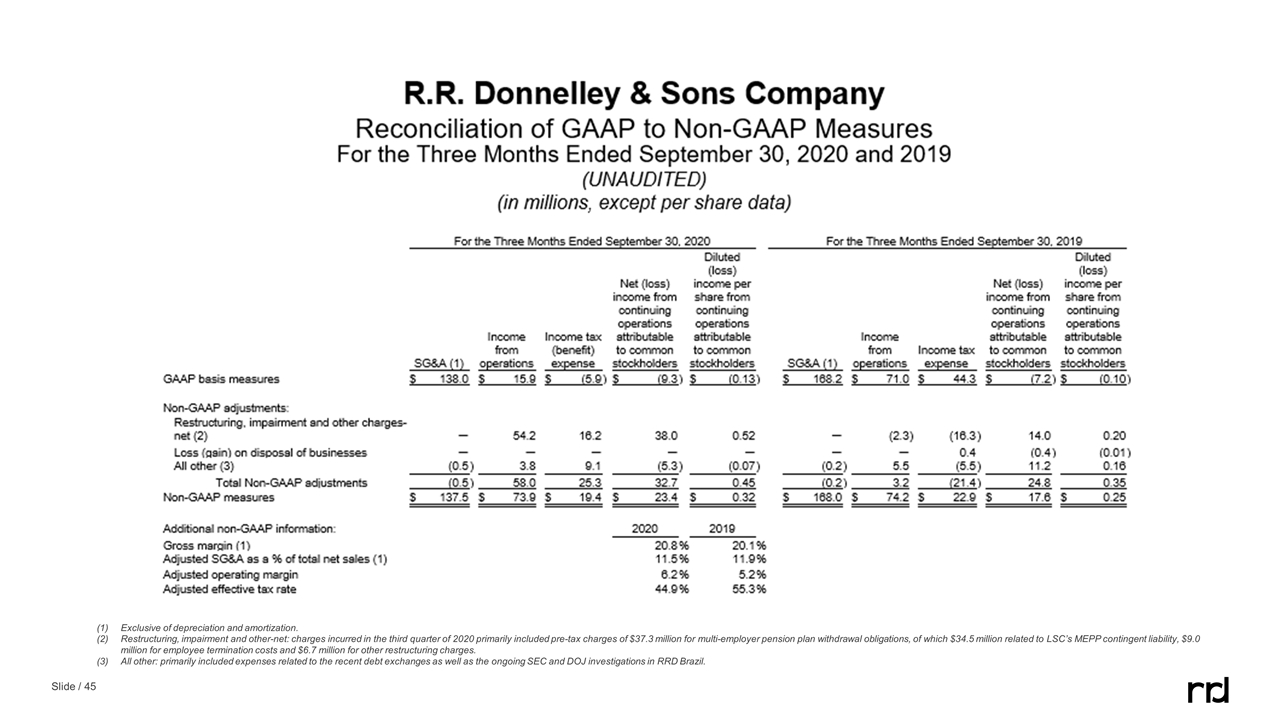
Exclusive of depreciation and amortization. Restructuring, impairment and other-net: charges incurred in the third quarter of 2020 primarily included pre-tax charges of $37.3 million for multi-employer pension plan withdrawal obligations, of which $34.5 million related to LSC’s MEPP contingent liability, $9.0 million for employee termination costs and $6.7 million for other restructuring charges. All other: primarily included expenses related to the recent debt exchanges as well as the ongoing SEC and DOJ investigations in RRD Brazil.
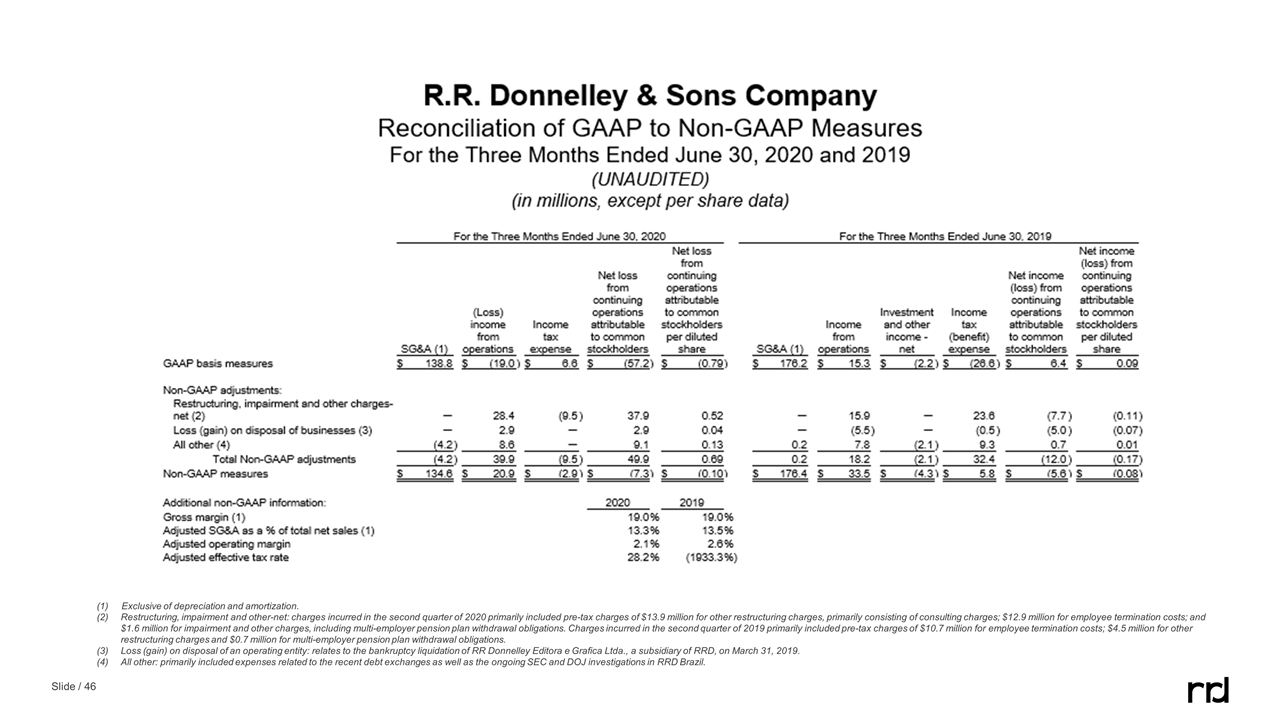
(1) Exclusive of depreciation and amortization. Restructuring, impairment and other-net: charges incurred in the second quarter of 2020 primarily included pre-tax charges of $13.9 million for other restructuring charges, primarily consisting of consulting charges; $12.9 million for employee termination costs; and $1.6 million for impairment and other charges, including multi-employer pension plan withdrawal obligations. Charges incurred in the second quarter of 2019 primarily included pre-tax charges of $10.7 million for employee termination costs; $4.5 million for other restructuring charges and $0.7 million for multi-employer pension plan withdrawal obligations. Loss (gain) on disposal of an operating entity: relates to the bankruptcy liquidation of RR Donnelley Editora e Grafica Ltda., a subsidiary of RRD, on March 31, 2019. All other: primarily included expenses related to the recent debt exchanges as well as the ongoing SEC and DOJ investigations in RRD Brazil.

(1) Exclusive of depreciation and amortization. Restructuring, impairment and other-net: charges incurred in the first quarter of 2020 primarily $4.1 million for other restructuring charges partially offset by net gains of $1.7 million on the sale of restructured facilities; $8.1 million for employee termination costs and $0.7 million for multi-employer pension plan withdrawal obligations. Charges incurred in the first quarter of 2019 included pre-tax charges of $8.2 million for other restructuring charges; $8.1 million for employee termination costs; and $0.8 million for impairment and other charges, including MEPP withdrawal obligations. Loss (gain) on disposal of an operating entity: relates to the bankruptcy liquidation of RR Donnelley Editora e Grafica Ltda., a subsidiary of RRD, on March 31, 2019. All other: primarily included expenses related to the recent debt exchanges as well as the ongoing SEC and DOJ investigations in RRD Brazil.
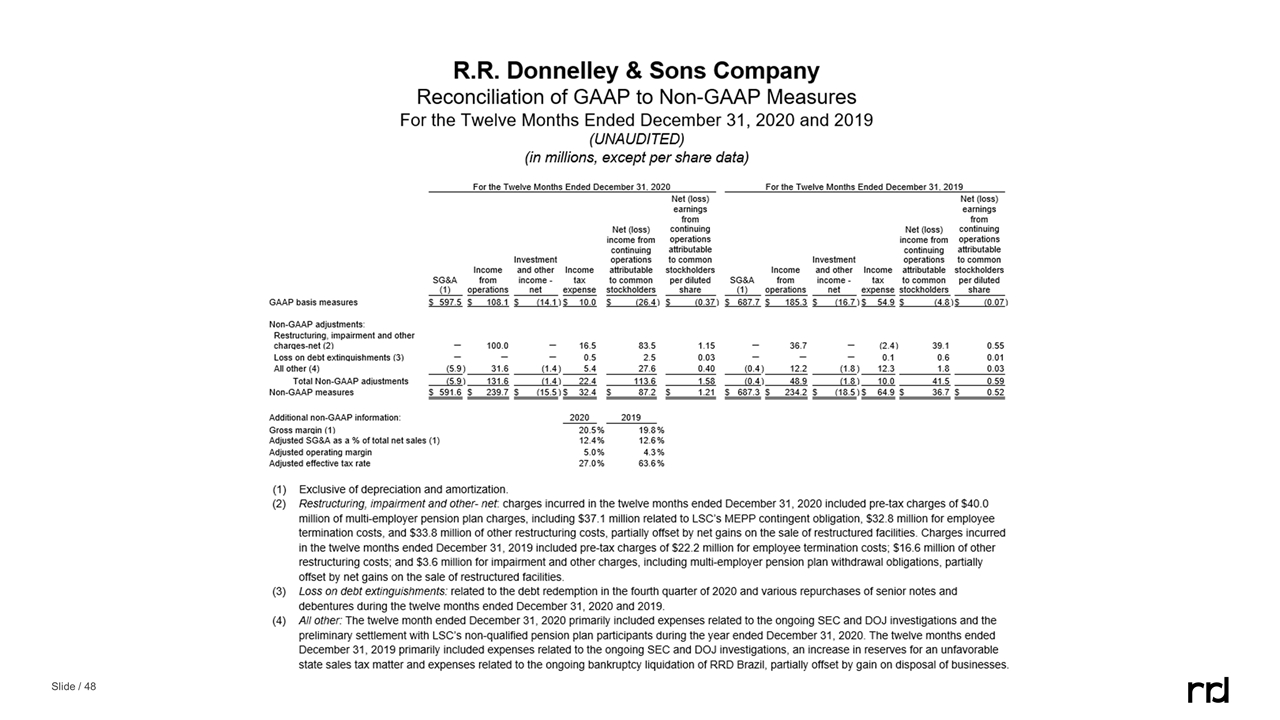
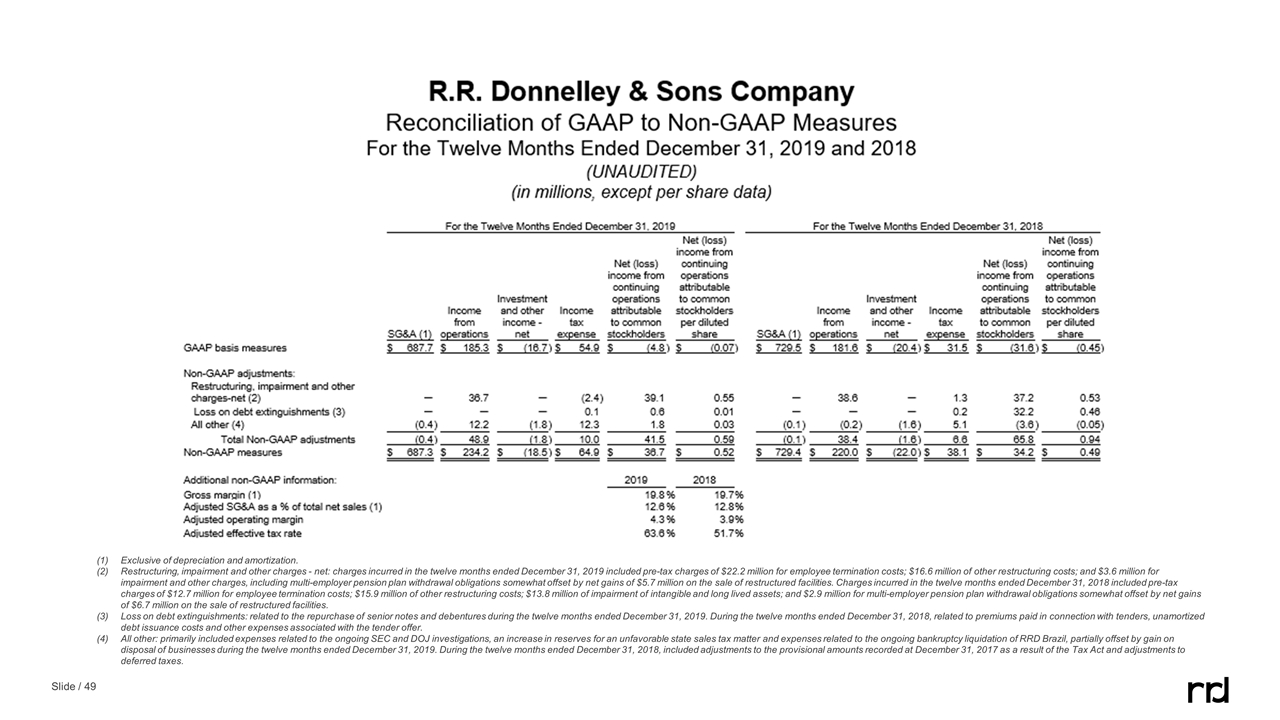
Exclusive of depreciation and amortization. Restructuring, impairment and other charges - net: charges incurred in the twelve months ended December 31, 2019 included pre-tax charges of $22.2 million for employee termination costs; $16.6 million of other restructuring costs; and $3.6 million for impairment and other charges, including multi-employer pension plan withdrawal obligations somewhat offset by net gains of $5.7 million on the sale of restructured facilities. Charges incurred in the twelve months ended December 31, 2018 included pre-tax charges of $12.7 million for employee termination costs; $15.9 million of other restructuring costs; $13.8 million of impairment of intangible and long lived assets; and $2.9 million for multi-employer pension plan withdrawal obligations somewhat offset by net gains of $6.7 million on the sale of restructured facilities. Loss on debt extinguishments: related to the repurchase of senior notes and debentures during the twelve months ended December 31, 2019. During the twelve months ended December 31, 2018, related to premiums paid in connection with tenders, unamortized debt issuance costs and other expenses associated with the tender offer. All other: primarily included expenses related to the ongoing SEC and DOJ investigations, an increase in reserves for an unfavorable state sales tax matter and expenses related to the ongoing bankruptcy liquidation of RRD Brazil, partially offset by gain on disposal of businesses during the twelve months ended December 31, 2019. During the twelve months ended December 31, 2018, included adjustments to the provisional amounts recorded at December 31, 2017 as a result of the Tax Act and adjustments to deferred taxes.
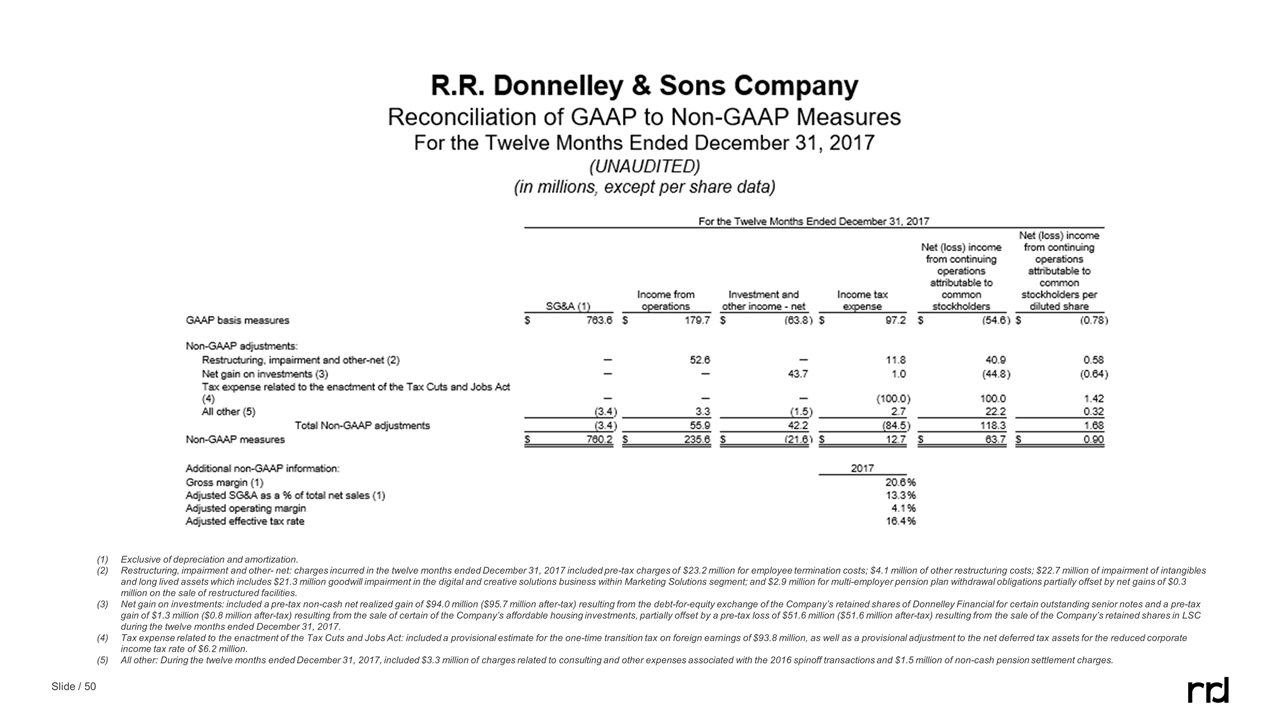
Exclusive of depreciation and amortization. Restructuring, impairment and other- net: charges incurred in the twelve months ended December 31, 2017 included pre-tax charges of $23.2 million for employee termination costs; $4.1 million of other restructuring costs; $22.7 million of impairment of intangibles and long lived assets which includes $21.3 million goodwill impairment in the digital and creative solutions business within Marketing Solutions segment; and $2.9 million for multi-employer pension plan withdrawal obligations partially offset by net gains of $0.3 million on the sale of restructured facilities. Net gain on investments: included a pre-tax non-cash net realized gain of $94.0 million ($95.7 million after-tax) resulting from the debt-for-equity exchange of the Company’s retained shares of Donnelley Financial for certain outstanding senior notes and a pre-tax gain of $1.3 million ($0.8 million after-tax) resulting from the sale of certain of the Company’s affordable housing investments, partially offset by a pre-tax loss of $51.6 million ($51.6 million after-tax) resulting from the sale of the Company’s retained shares in LSC during the twelve months ended December 31, 2017. Tax expense related to the enactment of the Tax Cuts and Jobs Act: included a provisional estimate for the one-time transition tax on foreign earnings of $93.8 million, as well as a provisional adjustment to the net deferred tax assets for the reduced corporate income tax rate of $6.2 million. All other: During the twelve months ended December 31, 2017, included $3.3 million of charges related to consulting and other expenses associated with the 2016 spinoff transactions and $1.5 million of non-cash pension settlement charges.
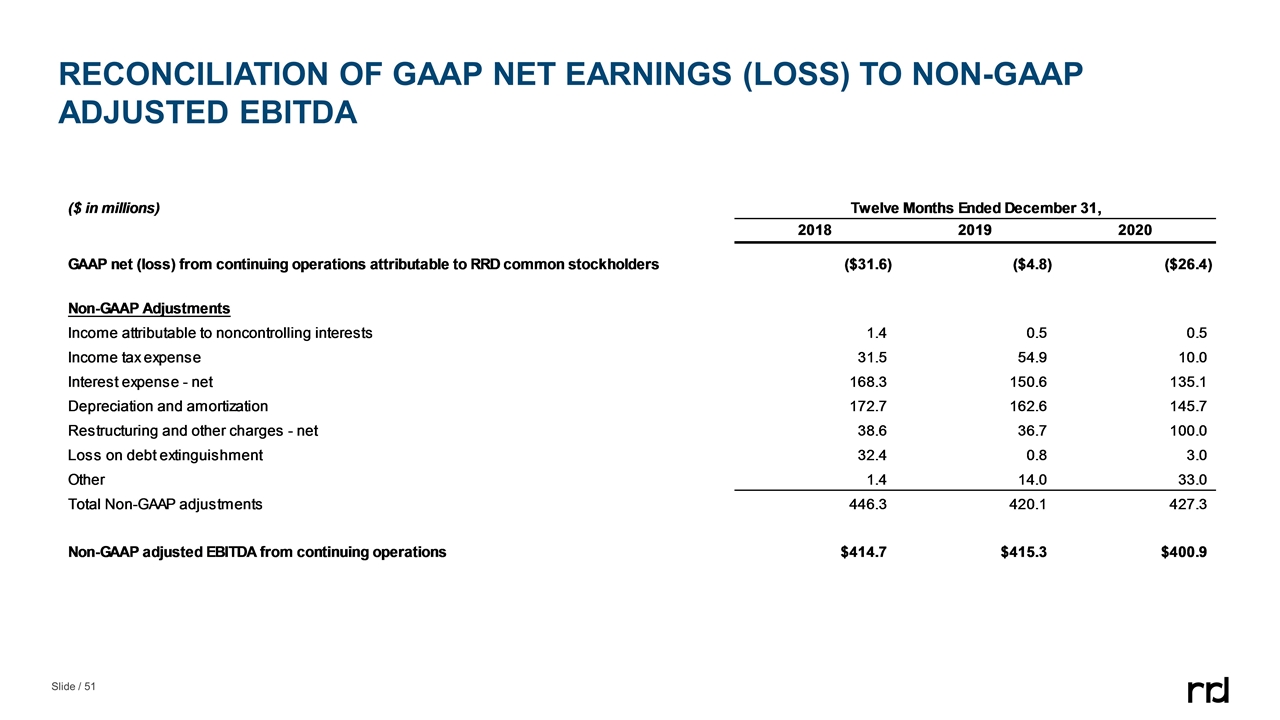
RECONCILIATION OF GAAP NET EARNINGS (LOSS) TO NON-GAAP ADJUSTED EBITDA
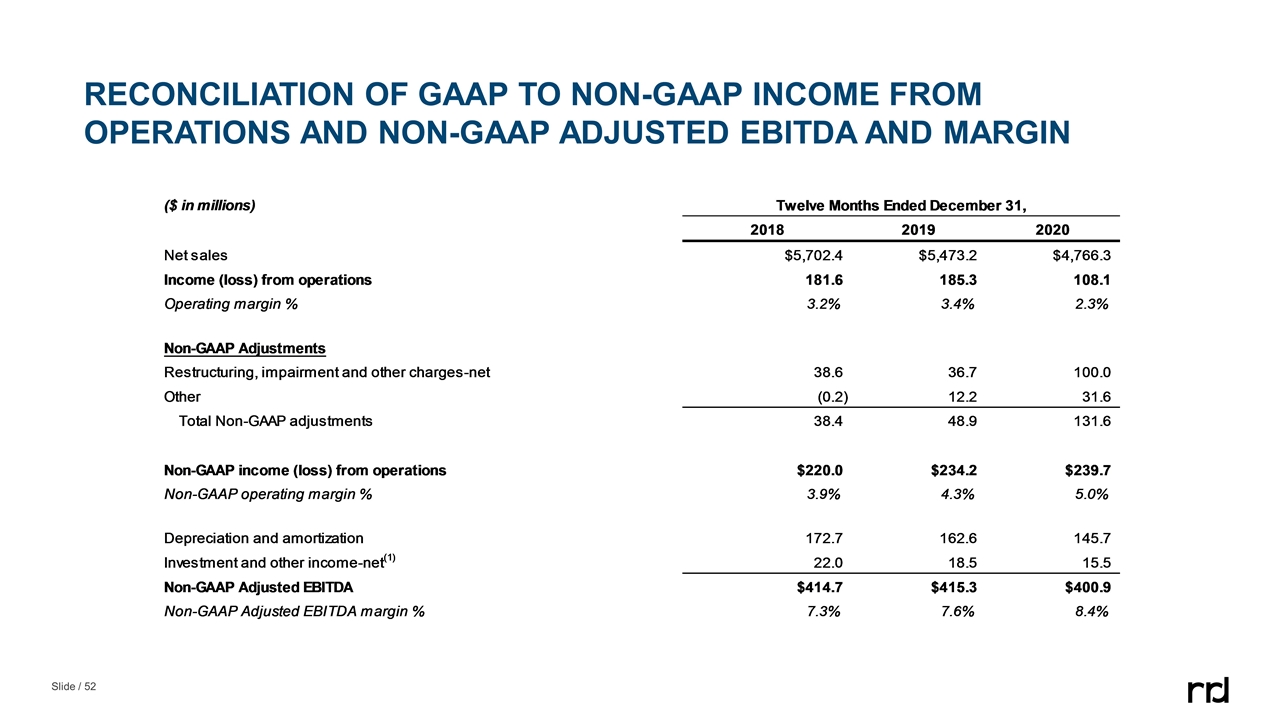
RECONCILIATION OF GAAP to non-GAAP income from operations and non-GAAP adjusted ebitda and margin

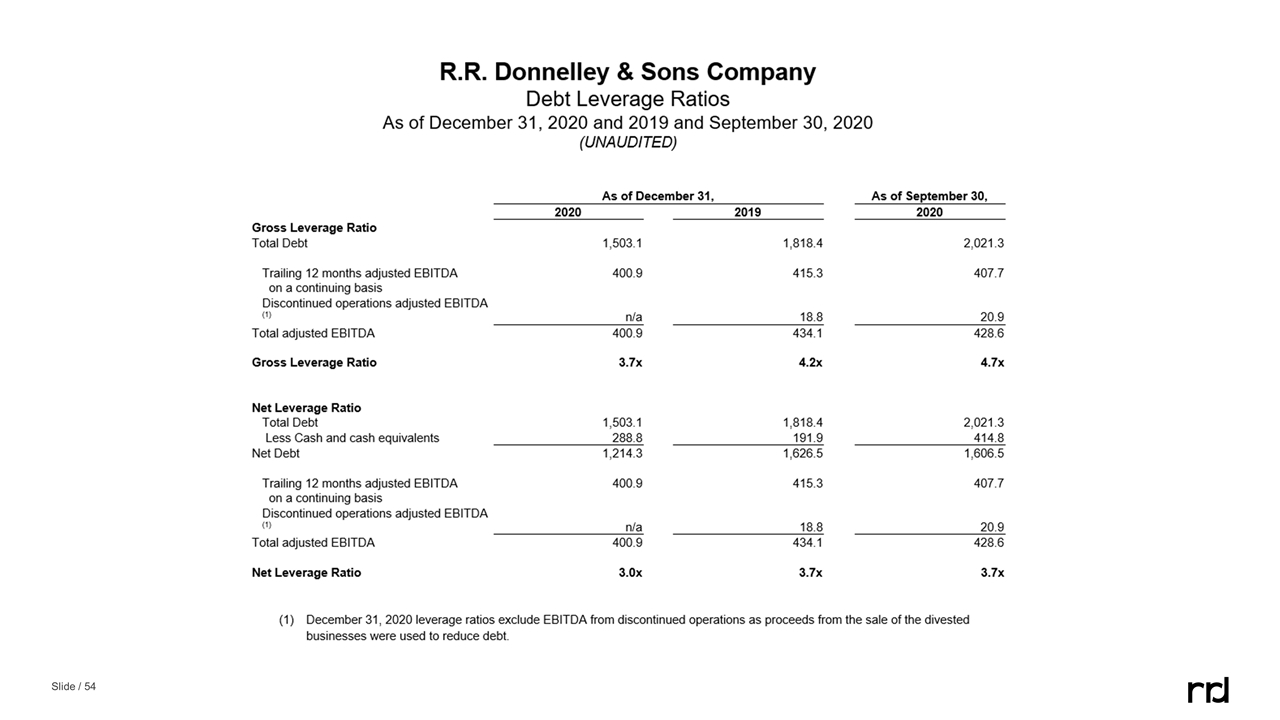
Debt leverage ratios
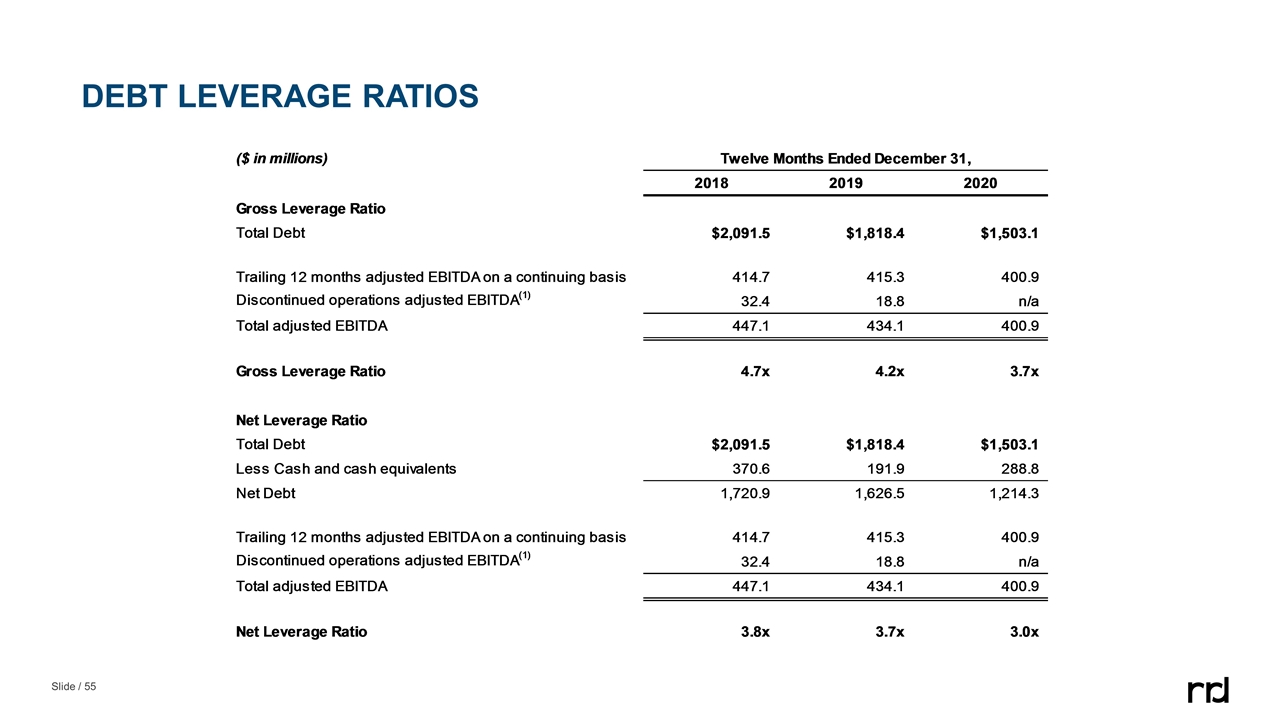
DEBT LEVERAGE RATIOS
Serious News for Serious Traders! Try StreetInsider.com Premium Free!
You May Also Be Interested In
- NV Gold Announces Secured Loan Terms
- StakingFarm to Strengthen Crypto Staking & Holding in Wake of Global Instability
- MonAsia & MayBe Sailing Announce the Launch of the "May It Bee" Event
Create E-mail Alert Related Categories
SEC FilingsSign up for StreetInsider Free!
Receive full access to all new and archived articles, unlimited portfolio tracking, e-mail alerts, custom newswires and RSS feeds - and more!


 Tweet
Tweet Share
Share