

Form 8-K RITE AID CORP For: Sep 23
 Tweet
Tweet Share
Share
Exhibit 99.1

Press Release: For Immediate Release
| INVESTORS: | MEDIA: |
| Trent Kruse | Bradley Ducey |
| (717) 975-3710 | (717) 975-5718 |
| [email protected] | [email protected] |
Rite Aid Corporation Reports Fiscal 2022 Second Quarter Results and Raises Full Year Adjusted EBITDA Guidance
| · | Revenues from Continuing Operations Increased 2.2 Percent to $6.11 Billion Compared to Prior Year Second Quarter Revenues from Continuing Operations of $5.98 Billion |
| · | Second Quarter Net Loss from Continuing Operations of $100.3 Million or $1.86 Per Share, Compared to the Prior Year Second Quarter Net Loss of $13.2 Million or $0.25 Per Share |
| · | Second Quarter Adjusted Net Loss from Continuing Operations of $22.0 Million or $0.41 Per Share, Compared to the Prior Year Second Quarter Adjusted Net Income of $13.5 Million or $0.25 Per Share |
| · | Second Quarter Adjusted EBITDA from Continuing Operations of $106.2 Million, Compared to the Prior Year Second Quarter Adjusted EBITDA of $151.6 Million |
| · | Company Entered into an Amendment to its Senior Secured Credit Agreement, which Extends the Company’s Debt Maturity Profile and Provides Improved Pricing on its “First-In, Last Out” Senior Secured Term Loan |
CAMP HILL, Pa. (September 23, 2021) - Rite Aid Corporation (NYSE: RAD) today reported operating results for its second fiscal quarter ended August 28, 2021.
For the second quarter, the company reported net loss from continuing operations of $100.3 million, or $1.86 loss per share, Adjusted net loss from continuing operations of $22.0 million, or $0.41 loss per share, and Adjusted EBITDA from continuing operations of $106.2 million, or 1.7 percent of revenues.
“We are pleased with our second quarter results, which show continued improvement in our underlying business as we delivered another quarter of revenue growth and Adjusted EBITDA that exceeded expectations,” said Heyward Donigan, president and chief executive officer, Rite Aid. “We also amended and extended our revolving credit facility, successfully extending the maturity out to August 2026 as we continue to enhance our financial flexibility to deliver on our RxEvolution strategy.”
“Our results were driven by the continued strong execution of our COVID-19 vaccine administration, improved profitability at Elixir and benefits from our work to revitalize our retail and digital experiences. Since launching our strategy last March, our organization is executing a clear plan to build top-line momentum with an intense focus on improving our profitability. We have transformed our business to be more relevant to our target growth consumer and more efficient in how we operate, while making investments necessary to drive the long-term health of our business. The progress on our RxEvolution strategy validates our belief that, as the trusted everyday care connector, Rite Aid will drive lower healthcare costs through better coordination, stronger engagement, and personalized services that help our customers achieve whole health for life.”
-More-
Rite Aid FY 2022 Q2 Press Release - page 2
Consolidated Second Quarter Summary
| (dollars in thousands) | Thirteen Week Period Ended | Twenty-six Week Period Ended | ||||||||||||||
| August 28, 2021 | August 29, 2020 | August 28, 2021 | August 29, 2020 | |||||||||||||
| Revenues from continuing operations | $ | 6,113,000 | $ | 5,981,970 | $ | 12,273,985 | $ | 12,009,346 | ||||||||
| Net loss from continuing operations | (100,301 | ) | (13,197 | ) | (113,358 | ) | (85,899 | ) | ||||||||
| Adjusted EBITDA from continuing operations | 106,160 | 151,603 | 245,037 | 258,995 | ||||||||||||
Revenues from continuing operations for the quarter were $6.11 billion compared to revenues from continuing operations of $5.98 billion in the prior year’s quarter. The 2.2 percent increase in revenues was driven by growth at the Retail Pharmacy Segment, partially offset by a decline at the Pharmacy Services Segment.
Net loss from continuing operations was $100.3 million, or $1.86 per share, compared to last year’s second quarter net loss from continuing operations of $13.2 million, or $0.25 per share. The increase in net loss is due primarily to a decrease in Adjusted EBITDA, higher litigation settlements, a higher loss on sale of assets resulting from the accelerated sale of our CMS receivable in the current year which provided increased liquidity, and a loss on debt modifications and retirements compared to a gain on debt modifications and retirements in the prior year second quarter. These items were partially offset by lower restructuring-related costs.
Retail Pharmacy Segment
| (dollars in thousands) | Thirteen Week Period Ended | Twenty-six Week Period Ended | ||||||||||||||
| August 28, 2021 | August 29, 2020 | August 28, 2021 | August 29, 2020 | |||||||||||||
| Revenues from continuing operations | $ | 4,277,218 | $ | 4,017,912 | $ | 8,628,900 | $ | 8,141,183 | ||||||||
| Adjusted EBITDA from continuing operations | 69,369 | 122,340 | 164,283 | 185,322 | ||||||||||||
Retail Pharmacy Segment revenues from continuing operations increased 6.5 percent over the prior year quarter, driven by an increase in same store sales and the inclusion of Bartell’s results this quarter. Same store sales from continuing operations for the second quarter increased 2.6 percent over the prior year period, consisting of a 5.0 percent increase in pharmacy sales and a 2.8 percent decrease in front-end sales. Front-end same store sales, excluding cigarettes and tobacco products, decreased 2.4 percent. On a 2-year stack basis, front-end same store sales, excluding cigarettes and tobacco products, increased 3.0 percent driven by increases in vitamins, color cosmetics and baby care resulting from the Company’s work to enhance the assortment in these categories. The number of prescriptions filled in same stores, adjusted to 30-day equivalents, increased 7.1 percent over the prior year period. In addition to the benefit from COVID-19 vaccinations, other acute prescriptions increased 1.5 percent and maintenance prescriptions increased 2.4 percent on a same store basis. Prescription sales from continuing operations accounted for 69.2 percent of total drugstore sales. Total store count at the end of the second quarter was 2,501.
Retail Pharmacy Segment Adjusted EBITDA from continuing operations was $69.4 million, or 1.6 percent of revenues, for the second quarter compared to last year’s second quarter Adjusted EBITDA from continuing operations of $122.3 million, or 3.0 percent of revenues. The decline in Adjusted EBITDA was due to an increase in SG&A expenses, partially offset by increased gross profit. SG&A expenses were negatively impacted by cycling the benefit from the prior year change to modernize our associate PTO plans, incremental costs from recently acquired Bartell stores and incremental payroll and marketing costs incurred to drive COVID-19 vaccines. Gross profit benefited from higher pharmacy same store sales, partially offset by pharmacy reimbursement rate pressures that were not fully offset by generic drug cost reductions and a decline in front end gross profit as we cycled the impact of the prior year’s COVID-19 buying surge.
-More-
Rite Aid FY 2022 Q2 Press Release - page 3
Pharmacy Services Segment
| (dollars in thousands) | Thirteen Week Period Ended | Twenty-six Week Period Ended | ||||||||||||||
| August 28, 2021 | August 29, 2020 | August 28, 2021 | August 29, 2020 | |||||||||||||
| Revenues from continuing operations | $ | 1,898,213 | $ | 2,038,378 | $ | 3,770,495 | $ | 4,015,624 | ||||||||
| Adjusted EBITDA from continuing operations | 36,791 | 29,263 | 80,754 | 73,673 | ||||||||||||
Pharmacy Services Segment revenues were $1.9 billion for the quarter, a decrease of 6.9 percent compared to the prior year quarter. The decrease in revenues was primarily the result of a decrease in membership in the PBM business and a decrease in Elixir Insurance membership.
Pharmacy Services Segment Adjusted EBITDA from continuing operations was $36.8 million, or 1.9 percent of revenues, for the second quarter compared to last year’s second quarter Adjusted EBITDA from continuing operations of $29.3 million, or 1.4 percent of revenues. Current year’s performance benefitted from increased gross profit resulting from improvements in the Company’s discount card business and good network management, partially offset by the impact from the loss in lives and cost pressures in the Elixir Insurance business. Prior year’s Adjusted EBITDA was negatively impacted by a reduction in gross profit related to a change in rebate aggregator at our MedTrak subsidiary.
Outlook for Fiscal 2022
As a result of the momentum in the second quarter, and an anticipated increase in demand for COVID-19 vaccines and testing versus prior expectations, Rite Aid Corporation is raising its fiscal 2022 Adjusted EBITDA guidance.
Total revenues are expected to be between $25.1 billion and $25.5 billion in fiscal 2022. Pharmacy Services Segment revenue is expected to be between $7.7 billion and $7.8 billion (net of any intercompany revenues to the Retail Pharmacy Segment).
Net loss is expected to be between $221 million and $197 million.
Adjusted EBITDA is expected to be between $460 million and $500 million.
Adjusted net loss per share is expected to be between $0.90 and $0.53.
Capital expenditures are expected to be approximately $300 million.
Conference Call Broadcast
Rite Aid will hold an analyst call at 8:30 a.m. Eastern Time today with remarks by Rite Aid's management team.
The call will be broadcast via the Internet at https://investors.riteaid.com. The telephone replay will be available beginning at 12:00 p.m. Eastern Time on Thursday, Sept. 23, 2021 and ending at 11:59 p.m. Eastern Time on Oct. 24, 2021. To access the replay of the call, telephone (800) 585-8367 or (416) 621-4642 and enter the seven-digit reservation number 5387890. The webcast replay of the call will also be available at https://investors.riteaid.com starting at 12 p.m. Eastern Time today. The playback will be available until the company’s next conference call.
-More-
Rite Aid FY 2022 Q2 Press Release - page 4
About Rite Aid Corporation
Rite Aid Corporation is on the front lines of delivering healthcare services and retail products to Americans 365 days a year. Our pharmacists are uniquely positioned to engage with customers and improve their health outcomes. We provide an array of whole being health products and services for the entire family through over 2,500 retail pharmacy locations across 17 states. Through Elixir, we provide pharmacy benefits and services to millions of members nationwide. For more information, www.riteaid.com.
Cautionary Statement Regarding Forward-Looking Statements
Statements in this release that are not historical, are forward-looking statements made pursuant to the safe harbor provisions of the Private Securities Litigation Reform Act of 1995. Such statements include, but are not limited to, statements regarding Rite Aid's outlook and guidance for fiscal 2022; the continued impact of the global coronavirus (COVID-19) pandemic on Rite Aid’s business; and any assumptions underlying any of the foregoing. Words such as "anticipate," "believe," "continue," "could," "estimate," "expect," "intend," "may," "plan," "predict," "project," "should," and "will" and variations of such words and similar expressions are intended to identify such forward-looking statements.
These forward-looking statements are not guarantees of future performance and involve risks, assumptions and uncertainties, including, but not limited to: risks related to the impact of the COVID-19 global pandemic, such as the scope and duration of the outbreak, and government responses thereto; the impact of COVID-19 on our workforce, operations, stores, expenses, and supply chain, and the operations or behaviors of our customers, suppliers and business partners; our ability to successfully implement our RxEvolution and other strategies; the impact of our high level of indebtedness, the ability to refinance such indebtedness on acceptable terms and our ability to satisfy our obligations and the other covenants contained in our debt agreements; outcome of pending or new litigation, including related to Opioids, “usual and customary” pricing or other matters; our ability to monetize the CMS receivable created in our Part D business; general competitive, economic, industry, market, political (including healthcare reform) and regulatory conditions (including changes to laws or regulations relating to labor or wages), civil unrest (including any resulting store closures, damage, or loss of inventory), as well as other factors that impact the markets in which we operate; the impact of private and public third-party payers continued reduction in prescription drug reimbursements and efforts to encourage mail order; our ability to manage expenses and our investments in working capital; our ability to achieve the benefits of our efforts to reduce the costs of our generic and other drugs; our ability to achieve cost savings and other benefits of our restructuring efforts within our anticipated timeframe, if at all; the outcome of our continuing efforts to monitor and comply with applicable laws, regulations, policies and procedures; and our ability to partner and have relationships with health plans and health systems.
These and other risks, assumptions and uncertainties are more fully described in Item 1A (Risk Factors) of our most recent Annual Report on Form 10-K and in other documents that we file or furnish with the Securities and Exchange Commission (the “SEC”), which you are encouraged to read. To the extent that COVID-19 adversely affects our business and financial results, it may also have the effect of heightening many of such risk factors.
Should one or more of these risks or uncertainties materialize, or should underlying assumptions prove incorrect, actual results may vary materially from those indicated or anticipated by such forward-looking statements. Accordingly, you are cautioned not to rely on these forward-looking statements, which speak only as of the date they are made.
-More-
Rite Aid FY 2022 Q2 Press Release - page 5
The degree to which COVID-19 may adversely affect Rite Aid’s results and operations, including its ability to achieve its outlook for fiscal 2022 guidance, will depend on numerous evolving factors and future developments, which are highly uncertain, including, but not limited to, the duration and spread of the COVID-19 outbreak, the actions to contain the virus or treat its impact, and how quickly and to what extent normal economic and operating conditions can resume. As a result, the impact on Rite Aid’s financial and operating results cannot be reasonably estimated with specificity at this time, but the impact could be material. Rite Aid expressly disclaims any current intention, and assumes no duty, to update publicly any forward-looking statement after the distribution of this release, whether as a result of new information, future events, changes in assumptions or otherwise.
All references to “Company” and “Rite Aid” as used throughout this release refer to Rite Aid Corporation and its affiliates.
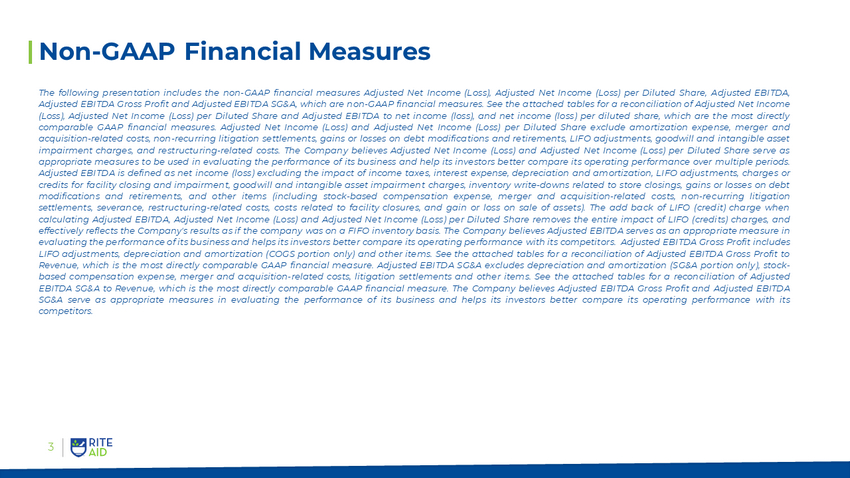
Reconciliation of Non-GAAP Financial Measures
Rite Aid separately reports financial results on the basis of Adjusted Net Income (Loss), Adjusted Net Income (Loss) per Diluted Share, Adjusted EBITDA, Adjusted EBITDA Gross Profit and Adjusted EBITDA SG&A, which are non-GAAP financial measures. See the attached tables for a reconciliation of Adjusted Net Income (Loss), Adjusted Net Income (Loss) per Diluted Share and Adjusted EBITDA to net income (loss), and net income (loss) per diluted share, which are the most directly comparable GAAP financial measures. Adjusted Net Income (Loss) and Adjusted Net Income (Loss) per Diluted Share exclude amortization expense, merger and acquisition-related costs, non-recurring litigation settlements, gains or losses on debt modifications and retirements, LIFO adjustments, goodwill and intangible asset impairment charges, and restructuring-related costs. Rite Aid believes Adjusted Net Income (Loss) and Adjusted Net Income (Loss) per Diluted Share serve as appropriate measures to be used in evaluating the performance of its business and help its investors better compare its operating performance over multiple periods.
Adjusted EBITDA is defined as net income (loss) excluding the impact of income taxes, interest expense, depreciation and amortization, LIFO adjustments, charges or credits for facility closing and impairment, goodwill and intangible asset impairment charges, inventory write-downs related to store closings, gains or losses on debt modifications and retirements, and other items (including stock-based compensation expense, merger and acquisition-related costs, non-recurring litigation settlements, severance, restructuring-related costs, costs related to facility closures, and gain or loss on sale of assets). The add back of LIFO (credit) charge when calculating Adjusted EBITDA, Adjusted Net Income (Loss) and Adjusted Net Income (Loss) per Diluted Share removes the entire impact of LIFO (credits) charges, and effectively reflects Rite Aid's results as if the company was on a FIFO inventory basis. Rite Aid believes Adjusted EBITDA serves as an appropriate measure in evaluating the performance of its business and helps its investors better compare its operating performance with its competitors.
Adjusted EBITDA Gross Profit includes LIFO adjustments, depreciation and amortization (COGS portion only) and other items. See the attached tables for a reconciliation of Adjusted EBITDA Gross Profit to Revenue, which is the most directly comparable GAAP financial measure. Adjusted EBITDA SG&A excludes depreciation and amortization (SG&A portion only), stock-based compensation expense, merger and acquisition-related costs, litigation settlements and other items. See the attached tables for a reconciliation of Adjusted EBITDA SG&A to Revenue, which is the most directly comparable GAAP financial measure. The Company believes Adjusted EBITDA Gross Profit and Adjusted EBITDA SG&A serve as appropriate measures in evaluating the performance of its business and helps its investors better compare its operating performance with its competitors.
###
| RITE AID CORPORATION AND SUBSIDIARIES | |||||
| CONSOLIDATED BALANCE SHEETS | |||||
| (Dollars in thousands) | |||||
| (unaudited) | |||||
| August 28, 2021 | February 27, 2021 | |||||||
| ASSETS | ||||||||
| Current assets: | ||||||||
| Cash and cash equivalents | $ | 146,564 | $ | 160,902 | ||||
| Accounts receivable, net | 1,662,445 | 1,462,441 | ||||||
| Inventories, net of LIFO reserve of $477,873 and $485,859 | 1,891,975 | 1,864,890 | ||||||
| Prepaid expenses and other current assets | 107,504 | 106,941 | ||||||
| Current assets held for sale | 24,294 | - | ||||||
| Total current assets | 3,832,782 | 3,595,174 | ||||||
| Property, plant and equipment, net | 1,024,091 | 1,080,499 | ||||||
| Operating lease right-of-use assets | 2,974,846 | 3,064,077 | ||||||
| Goodwill | 1,108,136 | 1,108,136 | ||||||
| Other intangibles, net | 315,833 | 340,519 | ||||||
| Deferred tax assets | 14,964 | 14,964 | ||||||
| Other assets | 92,938 | 132,035 | ||||||
| Total assets | $ | 9,363,590 | $ | 9,335,404 | ||||
| LIABILITIES AND STOCKHOLDERS' EQUITY | ||||||||
| Current liabilities: | ||||||||
| Current maturities of long-term debt and lease financing obligations | $ | 6,726 | $ | 6,409 | ||||
| Accounts payable | 1,523,582 | 1,437,421 | ||||||
| Accrued salaries, wages and other current liabilities | 741,436 | 642,364 | ||||||
| Current portion of operating lease liabilities | 519,402 | 516,752 | ||||||
| Total current liabilities | 2,791,146 | 2,602,946 | ||||||
| Long-term debt, less current maturities | 3,114,351 | 3,063,087 | ||||||
| Long-term operating lease liabilities | 2,728,390 | 2,829,293 | ||||||
| Lease financing obligations, less current maturities | 15,723 | 16,711 | ||||||
| Other noncurrent liabilities | 208,695 | 208,213 | ||||||
| Total liabilities | 8,858,305 | 8,720,250 | ||||||
| Commitments and contingencies | - | - | ||||||
| Stockholders' equity: | ||||||||
| Common stock | 55,732 | 55,143 | ||||||
| Additional paid-in capital | 5,899,795 | 5,897,168 | ||||||
| Accumulated deficit | (5,426,461 | ) | (5,313,103 | ) | ||||
| Accumulated other comprehensive loss | (23,781 | ) | (24,054 | ) | ||||
| Total stockholders' equity | 505,285 | 615,154 | ||||||
| Total liabilities and stockholders' equity | $ | 9,363,590 | $ | 9,335,404 | ||||
| RITE AID CORPORATION AND SUBSIDIARIES | |||||
| CONSOLIDATED STATEMENTS OF OPERATIONS | |||||
| (Dollars in thousands, except per share amounts) | |||||
| (unaudited) | |||||
| Thirteen weeks ended August 28, 2021 | Thirteen weeks ended August 29, 2020 | |||||||
| Revenues | $ | 6,113,000 | $ | 5,981,970 | ||||
| Costs and expenses: | ||||||||
| Cost of revenues | 4,867,076 | 4,821,625 | ||||||
| Selling, general and administrative expenses | 1,267,753 | 1,116,142 | ||||||
| Facility exit and impairment charges | 11,353 | 11,528 | ||||||
| Interest expense | 48,592 | 50,007 | ||||||
| Loss (gain) on debt modifications and retirements, net | 2,839 | (5,274 | ) | |||||
| Loss on sale of assets, net | 12,378 | 1,092 | ||||||
| 6,209,991 | 5,995,120 | |||||||
| Loss from continuing operations before income taxes | (96,991 | ) | (13,150 | ) | ||||
| Income tax expense | 3,310 | 47 | ||||||
| Net loss from continuing operations | (100,301 | ) | (13,197 | ) | ||||
| Net income from discontinued operations, net of tax | - | - | ||||||
| Net loss | $ | (100,301 | ) | $ | (13,197 | ) | ||
| Basic and diluted loss per share: | ||||||||
| Numerator for loss per share: | ||||||||
| Net loss from continuing operations attributable to common stockholders - basic and diluted | $ | (100,301 | ) | $ | (13,197 | ) | ||
| Net income from discontinued operations attributable to common stockholders - basic and diluted | - | - | ||||||
| Loss attributable to common stockholders - basic and diluted | $ | (100,301 | ) | $ | (13,197 | ) | ||
| Denominator: | ||||||||
| Basic and diluted weighted average shares | 53,989 | 53,573 | ||||||
| Basic and diluted loss per share | ||||||||
| Continuing operations | $ | (1.86 | ) | $ | (0.25 | ) | ||
| Discontinued operations | $ | - | $ | - | ||||
| Net basic and diluted loss per share | $ | (1.86 | ) | $ | (0.25 | ) | ||
RITE AID CORPORATION AND SUBSIDIARIES
CONSOLIDATED STATEMENTS OF OPERATIONS
(Dollars in thousands, except per share amounts)
(unaudited)
| Twenty-six weeks ended August 28, 2021 | Twenty-six weeks ended August 29, 2020 | |||||||
| Revenues | $ | 12,273,985 | $ | 12,009,346 | ||||
| Costs and expenses: | ||||||||
| Cost of revenues | 9,743,186 | 9,650,682 | ||||||
| Selling, general and administrative expenses | 2,513,115 | 2,313,289 | ||||||
| Facility exit and impairment charges | 20,184 | 15,281 | ||||||
| Intangible asset impairment charges | - | 29,852 | ||||||
| Interest expense | 97,713 | 100,554 | ||||||
| Loss (gain) on debt modifications and retirements, net | 3,235 | (5,274 | ) | |||||
| Loss (gain) on sale of assets, net | 5,820 | (1,168 | ) | |||||
| 12,383,253 | 12,103,216 | |||||||
| Loss from continuing operations before income taxes | (109,268 | ) | (93,870 | ) | ||||
| Income tax expense (benefit) | 4,090 | (7,971 | ) | |||||
| Net loss from continuing operations | (113,358 | ) | (85,899 | ) | ||||
| Net income from discontinued operations, net of tax | - | 9,161 | ||||||
| Net loss | $ | (113,358 | ) | $ | (76,738 | ) | ||
| Basic and diluted loss per share: | ||||||||
| Numerator for loss per share: | ||||||||
| Net loss from continuing operations attributable to common stockholders - basic and diluted | $ | (113,358 | ) | $ | (85,899 | ) | ||
| Net income from discontinued operations attributable to common stockholders - basic and diluted | - | 9,161 | ||||||
| Loss attributable to common stockholders - basic and diluted | $ | (113,358 | ) | $ | (76,738 | ) | ||
| Denominator: | ||||||||
| Basic and diluted weighted average shares | 53,920 | 53,528 | ||||||
| Basic and diluted loss per share | ||||||||
| Continuing operations | $ | (2.10 | ) | $ | (1.60 | ) | ||
| Discontinued operations | $ | - | $ | 0.17 | ||||
| Net basic and diluted loss per share | $ | (2.10 | ) | $ | (1.43 | ) | ||
RITE AID CORPORATION AND SUBSIDIARIES
CONSOLIDATED STATEMENTS OF CASH FLOWS
(Dollars in thousands)
(unaudited)
| Thirteen weeks ended August 28, 2021 | Thirteen weeks ended August 29, 2020 | |||||||
| OPERATING ACTIVITIES: | ||||||||
| Net loss | $ | (100,301 | ) | $ | (13,197 | ) | ||
| Net income from discontinued operations, net of tax | - | - | ||||||
| Net loss from continuing operations | $ | (100,301 | ) | $ | (13,197 | ) | ||
| Adjustments to reconcile to net cash provided by (used in) operating activities of continuing operations: | ||||||||
| Depreciation and amortization | 73,859 | 87,117 | ||||||
| Facility exit and impairment charges | 11,353 | 11,528 | ||||||
| LIFO credit | (3,993 | ) | (8,750 | ) | ||||
| Loss on sale of assets, net | 12,378 | 1,092 | ||||||
| Stock-based compensation expense | 5,792 | 3,936 | ||||||
| Loss (gain) on debt modifications and retirements, net | 2,839 | (5,274 | ) | |||||
| Changes in operating assets and liabilities: | ||||||||
| Accounts receivable | (63,368 | ) | (327,919 | ) | ||||
| Inventories | (31,014 | ) | (39,174 | ) | ||||
| Accounts payable | 40,797 | (11,372 | ) | |||||
| Operating lease right-of-use assets and operating lease liabilities | (6,400 | ) | (11,898 | ) | ||||
| Other assets | 17,207 | (19,664 | ) | |||||
| Other liabilities | 66,574 | (24,747 | ) | |||||
| Net cash provided by (used in) operating activities of continuing operations | 25,723 | (358,322 | ) | |||||
| INVESTING ACTIVITIES: | ||||||||
| Payments for property, plant and equipment | (46,192 | ) | (34,626 | ) | ||||
| Intangible assets acquired | (9,043 | ) | (11,857 | ) | ||||
| Proceeds from insured loss | 10,436 | 12,500 | ||||||
| Proceeds from dispositions of assets and investments | 2,228 | 3,155 | ||||||
| Proceeds from sale-leaseback transactions | 6,729 | 8,461 | ||||||
| Net cash used in investing activities of continuing operations | (35,842 | ) | (22,367 | ) | ||||
| FINANCING ACTIVITIES: | ||||||||
| Proceeds from issuance of long-term debt | 350,000 | 849,918 | ||||||
| Net proceeds from revolver | 211,000 | 408,000 | ||||||
| Principal payments on long-term debt | (451,047 | ) | (1,054,884 | ) | ||||
| Change in zero balance cash accounts | (52,801 | ) | (262 | ) | ||||
| Financing fees paid for early debt redemption | (831 | ) | (2,399 | ) | ||||
| Payments for taxes related to net share settlement of equity awards | (2,186 | ) | (2,002 | ) | ||||
| Deferred financing costs paid | (15,932 | ) | (13,268 | ) | ||||
| Net cash provided by financing activities of continuing operations | 38,203 | 185,103 | ||||||
| Cash flows from discontinued operations: | ||||||||
| Operating activities of discontinued operations | - | - | ||||||
| Investing activities of discontinued operations | - | - | ||||||
| Net cash provided by discontinued operations | - | - | ||||||
| Increase (decrease) in cash and cash equivalents | 28,084 | (195,586 | ) | |||||
| Cash and cash equivalents, beginning of period | 118,480 | 288,316 | ||||||
| Cash and cash equivalents, end of period | $ | 146,564 | $ | 92,730 | ||||
RITE AID CORPORATION AND SUBSIDIARIES
CONSOLIDATED STATEMENTS OF CASH FLOWS
(Dollars in thousands)
(unaudited)
| Twenty-six weeks ended August 28, 2021 | Twenty-six weeks ended August 29, 2020 | |||||||
| OPERATING ACTIVITIES: | ||||||||
| Net loss | $ | (113,358 | ) | $ | (76,738 | ) | ||
| Net income from discontinued operations, net of tax | - | 9,161 | ||||||
| Net loss from continuing operations | $ | (113,358 | ) | $ | (85,899 | ) | ||
| Adjustments to reconcile to net cash provided by (used in) operating activities of continuing operations: | ||||||||
| Depreciation and amortization | 149,718 | 166,220 | ||||||
| Facility exit and impairment charges | 20,184 | 15,281 | ||||||
| Intangible asset impairment charges | - | 29,852 | ||||||
| LIFO credit | (7,986 | ) | (20,816 | ) | ||||
| Loss (gain) on sale of assets, net | 5,820 | (1,168 | ) | |||||
| Stock-based compensation expense | 8,603 | 5,810 | ||||||
| Loss (gain) on debt modifications and retirements, net | 3,235 | (5,274 | ) | |||||
| Changes in operating assets and liabilities: | ||||||||
| Accounts receivable | (212,855 | ) | (636,555 | ) | ||||
| Inventories | (19,096 | ) | 4,473 | |||||
| Accounts payable | 91,324 | 1,948 | ||||||
| Operating lease right-of-use assets and operating lease liabilities | (12,309 | ) | (18,493 | ) | ||||
| Other assets | 25,185 | 79,513 | ||||||
| Other liabilities | 101,133 | (11,484 | ) | |||||
| Net cash provided by (used in) operating activities of continuing operations | 39,598 | (476,592 | ) | |||||
| INVESTING ACTIVITIES: | ||||||||
| Payments for property, plant and equipment | (105,356 | ) | (63,085 | ) | ||||
| Intangible assets acquired | (14,479 | ) | (22,572 | ) | ||||
| Proceeds from insured loss | 10,436 | 12,500 | ||||||
| Proceeds from dispositions of assets and investments | 4,676 | 5,910 | ||||||
| Proceeds from sale-leaseback transactions | 14,185 | 8,461 | ||||||
| Net cash used in investing activities of continuing operations | (90,538 | ) | (58,786 | ) | ||||
| FINANCING ACTIVITIES: | ||||||||
| Proceeds from issuance of long-term debt | 350,000 | 849,918 | ||||||
| Net proceeds from revolver | 250,000 | 650,000 | ||||||
| Principal payments on long-term debt | (542,988 | ) | (1,056,182 | ) | ||||
| Change in zero balance cash accounts | (844 | ) | (26,829 | ) | ||||
| Financing fees paid for early debt redemption | (833 | ) | (2,399 | ) | ||||
| Payments for taxes related to net share settlement of equity awards | (2,221 | ) | (2,101 | ) | ||||
| Deferred financing costs paid | (16,512 | ) | (14,600 | ) | ||||
| Net cash provided by financing activities of continuing operations | 36,602 | 397,807 | ||||||
| Cash flows from discontinued operations: | ||||||||
| Operating activities of discontinued operations | - | (82,189 | ) | |||||
| Investing activities of discontinued operations | - | 94,310 | ||||||
| Net cash provided by discontinued operations | - | 12,121 | ||||||
| Decrease in cash and cash equivalents | (14,338 | ) | (125,450 | ) | ||||
| Cash and cash equivalents, beginning of period | 160,902 | 218,180 | ||||||
| Cash and cash equivalents, end of period | $ | 146,564 | $ | 92,730 | ||||
| RITE AID CORPORATION AND SUBSIDIARIES |
| SUPPLEMENTAL SEGMENT OPERATING INFORMATION |
| (Dollars in thousands) |
| (unaudited) |
| Thirteen weeks ended August 28, 2021 | Thirteen weeks ended August 29, 2020 | |||||||
| Retail Pharmacy Segment | ||||||||
| Revenues from continuing operations (a) | $ | 4,277,218 | $ | 4,017,912 | ||||
| Cost of revenues from continuing operations (a) | 3,136,856 | 2,955,999 | ||||||
| Gross profit from continuing operations | 1,140,362 | 1,061,913 | ||||||
| LIFO credit from continuing operations | (3,993 | ) | (8,750 | ) | ||||
| FIFO gross profit from continuing operations | 1,136,369 | 1,053,163 | ||||||
| Adjusted EBITDA gross profit from continuing operations | 1,138,913 | 1,056,222 | ||||||
| Gross profit as a percentage of revenues - continuing operations | 26.66 | % | 26.43 | % | ||||
| LIFO credit as a percentage of revenues - continuing operations | -0.09 | % | -0.22 | % | ||||
| FIFO gross profit as a percentage of revenues - continuing operations | 26.57 | % | 26.21 | % | ||||
| Adjusted EBITDA gross profit as a percentage of revenues - continuing operations | 26.63 | % | 26.29 | % | ||||
| Selling, general and administrative expenses from continuing operations | 1,163,352 | 1,030,075 | ||||||
| Adjusted EBITDA selling, general and administrative expenses from continuing operations | 1,069,544 | 933,882 | ||||||
| Selling, general and administrative expenses as a percentage of | ||||||||
| revenues - continuing operations | 27.20 | % | 25.64 | % | ||||
| Adjusted EBITDA selling, general and administrative expenses as a percentage of | ||||||||
| revenues - continuing operations | 25.01 | % | 23.24 | % | ||||
| Cash interest expense | 45,599 | 46,767 | ||||||
| Non-cash interest expense | 2,993 | 3,240 | ||||||
| Total interest expense | 48,592 | 50,007 | ||||||
| Interest expense - continuing operations | 48,592 | 50,007 | ||||||
| Interest expense - discontinued operations | - | - | ||||||
| Adjusted EBITDA - continuing operations | 69,369 | 122,340 | ||||||
| Adjusted EBITDA as a percentage of revenues - continuing operations | 1.62 | % | 3.04 | % | ||||
| Pharmacy Services Segment | ||||||||
| Revenues (a) | $ | 1,898,213 | $ | 2,038,378 | ||||
| Cost of revenues (a) | 1,792,651 | 1,939,946 | ||||||
| Gross profit | 105,562 | 98,432 | ||||||
| Gross profit as a percentage of revenues | 5.56 | % | 4.83 | % | ||||
| Adjusted EBITDA | 36,791 | 29,263 | ||||||
| Adjusted EBITDA as a percentage of revenues | 1.94 | % | 1.44 | % | ||||
| (a) - Revenues and cost of revenues include $62,431 and $74,320 of inter-segment activity for the thirteen weeks ended August 28, 2021 and August 29, 2020, respectively, that is eliminated in consolidation. |
| RITE AID CORPORATION AND SUBSIDIARIES |
| SUPPLEMENTAL SEGMENT OPERATING INFORMATION |
| (Dollars in thousands) |
| (unaudited) |
| Twenty-six weeks ended August 28, 2021 | Twenty-six weeks ended August 29, 2020 | |||||||
| Retail Pharmacy Segment | ||||||||
| Revenues from continuing operations (a) | $ | 8,628,900 | $ | 8,141,183 | ||||
| Cost of revenues from continuing operations (a) | 6,318,604 | 5,997,734 | ||||||
| Gross profit from continuing operations | 2,310,296 | 2,143,449 | ||||||
| LIFO credit from continuing operations | (7,986 | ) | (20,816 | ) | ||||
| FIFO gross profit from continuing operations | 2,302,310 | 2,122,633 | ||||||
| Adjusted EBITDA gross profit from continuing operations | 2,307,251 | 2,154,649 | ||||||
| Gross profit as a percentage of revenues - continuing operations | 26.77 | % | 26.33 | % | ||||
| LIFO credit as a percentage of revenues - continuing operations | -0.09 | % | -0.26 | % | ||||
| FIFO gross profit as a percentage of revenues - continuing operations | 26.68 | % | 26.07 | % | ||||
| Adjusted EBITDA gross profit as a percentage of revenues - continuing operations | 26.74 | % | 26.47 | % | ||||
| Selling, general and administrative expenses from continuing operations | 2,319,391 | 2,139,051 | ||||||
| Adjusted EBITDA selling, general and administrative expenses from continuing operations | 2,142,968 | 1,969,327 | ||||||
| Selling, general and administrative expenses as a percentage of | ||||||||
| revenues - continuing operations | 26.88 | % | 26.27 | % | ||||
| Adjusted EBITDA selling, general and administrative expenses as a percentage of | ||||||||
| revenues - continuing operations | 24.83 | % | 24.19 | % | ||||
| Cash interest expense | 91,623 | 94,135 | ||||||
| Non-cash interest expense | 6,090 | 6,419 | ||||||
| Total interest expense | 97,713 | 100,554 | ||||||
| Interest expense - continuing operations | 97,713 | 100,554 | ||||||
| Interest expense - discontinued operations | - | - | ||||||
| Adjusted EBITDA - continuing operations | 164,283 | 185,322 | ||||||
| Adjusted EBITDA as a percentage of revenues - continuing operations | 1.90 | % | 2.28 | % | ||||
| Pharmacy Services Segment | ||||||||
| Revenues (a) | $ | 3,770,495 | $ | 4,015,624 | ||||
| Cost of revenues (a) | 3,549,992 | 3,800,409 | ||||||
| Gross profit | 220,503 | 215,215 | ||||||
| Gross profit as a percentage of revenues | 5.85 | % | 5.36 | % | ||||
| Adjusted EBITDA | 80,754 | 73,673 | ||||||
| Adjusted EBITDA as a percentage of revenues | 2.14 | % | 1.83 | % | ||||
| (a) - Revenues and cost of revenues include $125,410 and $147,461 of inter-segment activity for the twenty-six weeks ended August 28, 2021 and August 29, 2020, respectively, that is eliminated in consolidation. |
RITE AID CORPORATION AND SUBSIDIARIES
SUPPLEMENTAL INFORMATION
RECONCILIATION OF NET LOSS TO ADJUSTED EBITDA
(In thousands)
(unaudited)
| Thirteen weeks ended August 28, 2021 | Thirteen weeks ended August 29, 2020 | |||||||
| Reconciliation of net loss to adjusted EBITDA: | ||||||||
| Net loss - continuing operations | $ | (100,301 | ) | $ | (13,197 | ) | ||
| Adjustments: | ||||||||
| Interest expense | 48,592 | 50,007 | ||||||
| Income tax expense | 3,310 | 47 | ||||||
| Depreciation and amortization | 73,859 | 87,117 | ||||||
| LIFO credit | (3,993 | ) | (8,750 | ) | ||||
| Facility exit and impairment charges | 11,353 | 11,528 | ||||||
| Loss (gain) on debt modifications and retirements, net | 2,839 | (5,274 | ) | |||||
| Merger and Acquisition-related costs | 4,591 | - | ||||||
| Stock-based compensation expense | 5,792 | 3,936 | ||||||
| Restructuring-related costs | 9,584 | 23,186 | ||||||
| Inventory write-downs related to store closings | 798 | 1,058 | ||||||
| Litigation settlements | 34,212 | - | ||||||
| Loss on sale of assets, net | 12,378 | 1,092 | ||||||
| Other | 3,146 | 853 | ||||||
| Adjusted EBITDA - continuing operations | $ | 106,160 | $ | 151,603 | ||||
| Percent of revenues - continuing operations | 1.74 | % | 2.53 | % | ||||
RITE AID CORPORATION AND SUBSIDIARIES
SUPPLEMENTAL INFORMATION
RECONCILIATION OF NET LOSS TO ADJUSTED EBITDA
(In thousands)
(unaudited)
| Twenty-six weeks ended August 28, 2021 | Twenty-six weeks ended August 29, 2020 | |||||||
| Reconciliation of net loss to adjusted EBITDA: | ||||||||
| Net loss - continuing operations | $ | (113,358 | ) | $ | (85,899 | ) | ||
| Adjustments: | ||||||||
| Interest expense | 97,713 | 100,554 | ||||||
| Income tax expense (benefit) | 4,090 | (7,971 | ) | |||||
| Depreciation and amortization | 149,718 | 166,220 | ||||||
| LIFO credit | (7,986 | ) | (20,816 | ) | ||||
| Facility exit and impairment charges | 20,184 | 15,281 | ||||||
| Intangible asset impairment charges | - | 29,852 | ||||||
| Loss (gain) on debt modifications and retirements, net | 3,235 | (5,274 | ) | |||||
| Merger and Acquisition-related costs | 8,477 | - | ||||||
| Stock-based compensation expense | 8,603 | 5,810 | ||||||
| Restructuring-related costs | 15,516 | 58,921 | ||||||
| Inventory write-downs related to store closings | 1,270 | 1,892 | ||||||
| Litigation settlements | 48,212 | - | ||||||
| Loss (gain) on sale of assets, net | 5,820 | (1,168 | ) | |||||
| Other | 3,543 | 1,593 | ||||||
| Adjusted EBITDA - continuing operations | $ | 245,037 | $ | 258,995 | ||||
| Percent of revenues - continuing operations | 2.00 | % | 2.16 | % | ||||
RITE AID CORPORATION AND SUBSIDIARIES
SUPPLEMENTAL INFORMATION
ADJUSTED NET (LOSS) INCOME
(Dollars in thousands, except per share amounts)
(unaudited)
| Thirteen weeks ended August 28, 2021 | Thirteen weeks ended August 29, 2020 | |||||||
| Net loss from continuing operations | $ | (100,301 | ) | $ | (13,197 | ) | ||
| Add back - Income tax expense | 3,310 | 47 | ||||||
| Loss before income taxes - continuing operations | (96,991 | ) | (13,150 | ) | ||||
| Adjustments: | ||||||||
| Amortization expense | 19,953 | 22,695 | ||||||
| LIFO credit | (3,993 | ) | (8,750 | ) | ||||
| Loss (gain) on debt modifications and retirements, net | 2,839 | (5,274 | ) | |||||
| Merger and Acquisition-related costs | 4,591 | - | ||||||
| Restructuring-related costs | 9,584 | 23,186 | ||||||
| Litigation settlements | 34,212 | - | ||||||
| Adjusted (loss) income before income taxes - continuing operations | (29,805 | ) | 18,707 | |||||
| Adjusted income tax (benefit) expense (a) | (7,839 | ) | 5,171 | |||||
| Adjusted net (loss) income from continuing operations | $ | (21,966 | ) | $ | 13,536 | |||
| Adjusted net (loss) income per diluted share - continuing operations: | ||||||||
| Numerator for adjusted net (loss) income per diluted share: | ||||||||
| Adjusted net (loss) income from continuing operations | $ | (21,966 | ) | $ | 13,536 | |||
| Denominator: | ||||||||
| Basic weighted average shares | 53,989 | 53,573 | ||||||
| Outstanding options and restricted shares, net | - | 842 | ||||||
| Diluted weighted average shares | 53,989 | 54,415 | ||||||
| Net loss from continuing operations per diluted | ||||||||
| share - continuing operations | $ | (1.86 | ) | $ | (0.25 | ) | ||
| Adjusted net (loss) income per diluted share - continuing operations | $ | (0.41 | ) | $ | 0.25 | |||
(a) The fiscal year 2022 and 2021 annual effective tax rates, calculated using a federal rate plus a net state rate that excluded the impact of state NOL's, state credits and valuation allowance, was used for the thirteen weeks ended August 28, 2021 and August 29, 2020, respectively.
| RITE AID CORPORATION AND SUBSIDIARIES |
| SUPPLEMENTAL INFORMATION |
| ADJUSTED NET (LOSS) INCOME |
| (Dollars in thousands, except per share amounts) |
| (unaudited) |
| Twenty-six weeks ended August 28, 2021 | Twenty-six weeks ended August 29, 2020 | |||||||
| Net loss from continuing operations | $ | (113,358 | ) | $ | (85,899 | ) | ||
| Add back - Income tax expense (benefit) | 4,090 | (7,971 | ) | |||||
| Loss before income taxes - continuing operations | (109,268 | ) | (93,870 | ) | ||||
| Adjustments: | ||||||||
| Amortization expense | 40,413 | 47,115 | ||||||
| LIFO credit | (7,986 | ) | (20,816 | ) | ||||
| Intangible asset impairment charges | - | 29,852 | ||||||
| Loss (gain) on debt modifications and retirements, net | 3,235 | (5,274 | ) | |||||
| Merger and Acquisition-related costs | 8,477 | - | ||||||
| Restructuring-related costs | 15,516 | 58,921 | ||||||
| Litigation settlements | 48,212 | - | ||||||
| Adjusted (loss) income before income taxes - continuing operations | (1,401 | ) | 15,928 | |||||
| Adjusted income tax (benefit) expense (a) | (368 | ) | 4,402 | |||||
| Adjusted net (loss) income from continuing operations | $ | (1,033 | ) | $ | 11,526 | |||
| Adjusted net (loss) income per diluted share - continuing operations: | ||||||||
| Numerator for adjusted net (loss) income per diluted share: | ||||||||
| Adjusted net (loss) income from continuing operations | $ | (1,033 | ) | $ | 11,526 | |||
| Denominator: | ||||||||
| Basic weighted average shares | 53,920 | 53,528 | ||||||
| Outstanding options and restricted shares, net | - | 775 | ||||||
| Diluted weighted average shares | 53,920 | 54,303 | ||||||
| Net loss from continuing operations per diluted share - continuing operations | $ | (2.10 | ) | $ | (1.60 | ) | ||
| Adjusted net (loss) income per diluted share - continuing operations | $ | (0.02 | ) | $ | 0.21 | |||
| (a) The fiscal year 2022 and 2021 annual effective tax rates, calculated using a federal rate plus a net state rate that excluded the impact of state NOL's, state credits and valuation allowance, was used for the twenty-six weeks ended August 28, 2021 and August 29, 2020, respectively. |
| RITE AID CORPORATION AND SUBSIDIARIES |
| SUPPLEMENTAL INFORMATION |
| RECONCILIATION OF ADJUSTED EBITDA GROSS PROFIT AND RECONCILIATION OF ADJUSTED EBITDA SELLING, |
| GENERAL AND ADMINISTRATIVE EXPENSES- RETAIL PHARMACY SEGMENT |
| (In thousands) |
| (unaudited) |
| Thirteen weeks ended August 28, 2021 | Thirteen weeks ended August 29, 2020 | |||||||
| Reconciliation of adjusted EBITDA gross profit: | ||||||||
| Revenues | $ | 4,277,218 | $ | 4,017,912 | ||||
| Gross Profit | 1,140,362 | 1,061,913 | ||||||
| Addback: | ||||||||
| LIFO credit | (3,993 | ) | (8,750 | ) | ||||
| Depreciation and amortization (cost of goods sold portion only) | 1,950 | 2,167 | ||||||
| Other | 594 | 892 | ||||||
| Adjusted EBITDA gross profit - continuing operations | $ | 1,138,913 | $ | 1,056,222 | ||||
| Percent of revenues - continuing operations | 26.63 | % | 26.29 | % | ||||
| Reconciliation of adjusted EBITDA selling, general and administrative expenses: | ||||||||
| Revenues | $ | 4,277,218 | $ | 4,017,912 | ||||
| Selling, general and administrative expenses | 1,163,352 | 1,030,075 | ||||||
| Less: | ||||||||
| Depreciation and amortization (SG&A portion only) | 59,081 | 70,884 | ||||||
| Stock-based compensation expense | 5,695 | 3,631 | ||||||
| Merger and Acquisition-related costs | 4,591 | - | ||||||
| Restructuring-related costs | 2,584 | 20,441 | ||||||
| Litigation settlements | 18,448 | - | ||||||
| Other | 3,409 | 1,237 | ||||||
| Adjusted EBITDA selling, general and administrative expenses - continuing operations | $ | 1,069,544 | $ | 933,882 | ||||
| Percent of revenues - continuing operations | 25.01 | % | 23.24 | % | ||||
| Adjusted EBITDA - continuing operations | $ | 69,369 | $ | 122,340 | ||||
RITE AID CORPORATION AND SUBSIDIARIES
SUPPLEMENTAL INFORMATION
RECONCILIATION OF ADJUSTED EBITDA GROSS PROFIT AND RECONCILIATION OF ADJUSTED EBITDA SELLING,
GENERAL AND ADMINISTRATIVE EXPENSES- RETAIL PHARMACY SEGMENT
(In thousands)
(unaudited)
| Twenty-six weeks ended August 28, 2021 | Twenty-six weeks ended August 29, 2020 | |||||||
| Reconciliation of adjusted EBITDA gross profit: | ||||||||
| Revenues | $ | 8,628,900 | $ | 8,141,183 | ||||
| Gross Profit | 2,310,296 | 2,143,449 | ||||||
| Addback: | ||||||||
| LIFO credit | (7,986 | ) | (20,816 | ) | ||||
| Depreciation and amortization (cost of goods sold portion only) | 4,047 | 4,830 | ||||||
| Restructuring-related costs - SKU optimization charges | - | 25,763 | ||||||
| Other | 894 | 1,423 | ||||||
| Adjusted EBITDA gross profit - continuing operations | $ | 2,307,251 | $ | 2,154,649 | ||||
| Percent of revenues - continuing operations | 26.74 | % | 26.47 | % | ||||
| Reconciliation of adjusted EBITDA selling, general and administrative expenses: | ||||||||
| Revenues | $ | 8,628,900 | $ | 8,141,183 | ||||
| Selling, general and administrative expenses | 2,319,391 | 2,139,051 | ||||||
| Less: | ||||||||
| Depreciation and amortization (SG&A portion only) | 118,849 | 131,793 | ||||||
| Stock-based compensation expense | 8,466 | 5,356 | ||||||
| Merger and Acquisition-related costs | 8,477 | - | ||||||
| Restructuring-related costs | 4,205 | 30,387 | ||||||
| Litigation settlements | 32,448 | - | ||||||
| Other | 3,978 | 2,188 | ||||||
| Adjusted EBITDA selling, general and administrative expenses - continuing operations | $ | 2,142,968 | $ | 1,969,327 | ||||
| Percent of revenues - continuing operations | 24.83 | % | 24.19 | % | ||||
| Adjusted EBITDA - continuing operations | $ | 164,283 | $ | 185,322 | ||||
RITE AID CORPORATION AND SUBSIDIARIES
SUPPLEMENTAL INFORMATION
RECONCILIATION OF NET LOSS GUIDANCE TO ADJUSTED EBITDA GUIDANCE
YEAR ENDING FEBRUARY 26, 2022
(In thousands)
(unaudited)
| Guidance Range | ||||||||
| Low | High | |||||||
| Total Revenues | $ | 25,100,000 | $ | 25,500,000 | ||||
| PBM Revenues | $ | 7,700,000 | $ | 7,800,000 | ||||
| Gross Capital Expenditures | $ | 300,000 | $ | 300,000 | ||||
| Reconciliation of net loss to adjusted EBITDA: | ||||||||
| Net loss | $ | (221,000 | ) | $ | (197,000 | ) | ||
| Adjustments: | ||||||||
| Interest expense | 198,000 | 198,000 | ||||||
| Income tax expense | - | 3,000 | ||||||
| Depreciation and amortization | 300,000 | 300,000 | ||||||
| LIFO credit | (16,000 | ) | (16,000 | ) | ||||
| Facility exit and impairment charges | 87,700 | 97,700 | ||||||
| Loss on debt modifications and retirements, net | 3,200 | 3,200 | ||||||
| Merger and Acquisition-related costs | 11,000 | 11,000 | ||||||
| Restructuring-related costs | 30,000 | 30,000 | ||||||
| Litigation settlements | 48,200 | 48,200 | ||||||
| Gain on sale of assets, net | (6,100 | ) | (3,100 | ) | ||||
| Other | 25,000 | 25,000 | ||||||
| Adjusted EBITDA | $ | 460,000 | $ | 500,000 | ||||
RITE AID CORPORATION AND SUBSIDIARIES
SUPPLEMENTAL INFORMATION
RECONCILIATION OF NET LOSS GUIDANCE TO ADJUSTED NET LOSS GUIDANCE
YEAR ENDING FEBRUARY 26, 2022
(In thousands)
(unaudited)
| Guidance Range | ||||||||
| Low | High | |||||||
| Net loss | $ | (221,000 | ) | $ | (197,000 | ) | ||
| Add back - income tax expense | - | 3,000 | ||||||
| Loss before income taxes | (221,000 | ) | (194,000 | ) | ||||
| Adjustments: | ||||||||
| Amortization expense | 79,000 | 79,000 | ||||||
| LIFO credit | (16,000 | ) | (16,000 | ) | ||||
| Loss on debt modifications and retirements, net | 3,200 | 3,200 | ||||||
| Merger and Acquisition-related costs | 11,000 | 11,000 | ||||||
| Restructuring-related costs | 30,000 | 30,000 | ||||||
| Litigation settlements | 48,200 | 48,200 | ||||||
| Adjusted loss before adjusted income taxes | (65,600 | ) | (38,600 | ) | ||||
| Adjusted income tax benefit | (17,000 | ) | (10,000 | ) | ||||
| Adjusted net loss | $ | (48,600 | ) | $ | (28,600 | ) | ||
| Diluted adjusted net loss per share | $ | (0.90 | ) | $ | (0.53 | ) | ||
Exhibit 99.2

SECOND QUARTER FISCAL 2022 Earnings conference call Heyward Donigan Chief Executive Officer Jim Peters Chief Operating Officer Matt Schroeder Chief Financial Officer 9/23/21

Cautionary Statement Regarding Forward Looking Statements Statements in this presentation that are not historical, are forward - looking statements made pursuant to the safe harbor provisions of the Private Securities Litigation Reform Act of 1995 . Such statements include, but are not limited to, statements regarding Rite Aid Corporation’s (the “Company”) outlook and guidance for fiscal 2022 ; the continued impact of the global coronavirus (COVID - 19 ) pandemic on the Company’s business ; and any assumptions underlying any of the foregoing . Words such as "anticipate," "believe," "continue," "could," "estimate," "expect," "intend," "may," "plan," "predict," "project," "should," and "will" and variations of such words and similar expressions are intended to identify such forward - looking statements . These forward - looking statements are not guarantees of future performance and involve risks, assumptions and uncertainties, including, but not limited to : risks related to the impact of the COVID - 19 global pandemic, such as the scope and duration of the outbreak, government actions and restrictive measures implemented in response, and other impacts to the business, or on the Company’s ability to execute business continuity plans, as a result of the COVID - 19 pandemic ; the impact of COVID - 19 on the Company’s workforce, operations, stores, expenses, and supply chain, and the operations or behaviors of the Company’s customers, suppliers and business partners ; the Company’s ability to successfully implement the Company’s RxEvolution and other strategies ; the impact of the Company’s high level of indebtedness, the ability to refinance such indebtedness on acceptable terms and the Company’s ability to satisfy its obligations and the other covenants contained in the Company’s debt agreements ; outcome of pending or new litigation including related to Opioids, “usual and customary” pricing or other matters ; the Company’s ability to monetize the CMS receivable created in the Company’s Part D business ; general competitive, economic, industry, market, political (including healthcare reform) and regulatory conditions (including changes to laws or regulations relating to labor or wages), civil unrest (including any resulting store closures, damage, or loss of inventory), as well as other factors that impact the markets in which we operate ; the impact of private and public third - party payers continued reduction in prescription drug reimbursements and efforts to encourage mail order ; the Company’s ability to manage expenses and its investments in working capital ; the Company’s ability to achieve the benefits of the Company’s efforts to reduce the costs of its generic and other drugs ; the Company’s ability to achieve cost savings and other benefits of its organizational restructuring within its anticipated timeframe, if at all ; the outcome of the Company’s continuing efforts to monitor and comply with applicable laws, regulations, policies and procedures ; and the Company’s ability to partner and have relationships with health plans and health systems . These and other risks, assumptions and uncertainties are more fully described in Item 1 A (Risk Factors) of the Company’s most recent Annual Report on Form 10 - K and in other documents that it files or furnishes with the Securities and Exchange Commission (the “SEC”), which you are encouraged to read . To the extent that COVID - 19 adversely affects the Company’s business and financial results, it may also have the effect of heightening many of such risk factors . Should one or more of these risks or uncertainties materialize, or should underlying assumptions prove incorrect, actual results may vary materially from those indicated or anticipated by such forward - looking statements . Accordingly, you are cautioned not to rely on these forward - looking statements, which speak only as of the date they are made . The degree to which COVID - 19 may adversely affect the Company’s results and operations, including its ability to achieve its outlook for fiscal 2022 guidance, will depend on numerous evolving factors and future developments, which are highly uncertain, including, but not limited to, the duration and spread of the COVID - 19 outbreak, its severity, the actions to contain the virus or treat its impact, and how quickly and to what extent normal economic and operating conditions can resume . As a result, the impact on the Company’s financial and operating results cannot be reasonably estimated with specificity at this time, but the impact could be material . The Company expressly disclaims any current intention, and assumes no duty, to update publicly any forward - looking statement after the distribution of this presentation, whether as a result of new information, future events, changes in assumptions or otherwise . 2
Non - GAAP Financial Measures The following presentation includes the non - GAAP financial measures Adjusted Net Income (Loss), Adjusted Net Income (Loss) per Diluted Share, Adjusted EBITDA, Adjusted EBITDA Gross Profit and Adjusted EBITDA SG&A, which are non - GAAP financial measures . See the attached tables for a reconciliation of Adjusted Net Income (Loss), Adjusted Net Income (Loss) per Diluted Share and Adjusted EBITDA to net income (loss), and net income (loss) per diluted share, which are the most directly comparable GAAP financial measures . Adjusted Net Income (Loss) and Adjusted Net Income (Loss) per Diluted Share exclude amortization expense, merger and acquisition - related costs, non - recurring litigation settlements, gains or losses on debt modifications and retirements, LIFO adjustments, goodwill and intangible asset impairment charges, and restructuring - related costs . The Company believes Adjusted Net Income (Loss) and Adjusted Net Income (Loss) per Diluted Share serve as appropriate measures to be used in evaluating the performance of its business and help its investors better compare its operating performance over multiple periods . Adjusted EBITDA is defined as net income (loss) excluding the impact of income taxes, interest expense, depreciation and amortization, LIFO adjustments, charges or credits for facility closing and impairment, goodwill and intangible asset impairment charges, inventory write - downs related to store closings, gains or losses on debt modifications and retirements, and other items (including stock - based compensation expense, merger and acquisition - related costs, non - recurring litigation settlements, severance, restructuring - related costs, costs related to facility closures, and gain or loss on sale of assets) . The add back of LIFO (credit) charge when calculating Adjusted EBITDA, Adjusted Net Income (Loss) and Adjusted Net Income (Loss) per Diluted Share removes the entire impact of LIFO (credits) charges, and effectively reflects the Company's results as if the company was on a FIFO inventory basis . The Company believes Adjusted EBITDA serves as an appropriate measure in evaluating the performance of its business and helps its investors better compare its operating performance with its competitors . Adjusted EBITDA Gross Profit includes LIFO adjustments, depreciation and amortization (COGS portion only) and other items . See the attached tables for a reconciliation of Adjusted EBITDA Gross Profit to Revenue, which is the most directly comparable GAAP financial measure . Adjusted EBITDA SG&A excludes depreciation and amortization (SG&A portion only), stock - based compensation expense, merger and acquisition - related costs, litigation settlements and other items . See the attached tables for a reconciliation of Adjusted EBITDA SG&A to Revenue, which is the most directly comparable GAAP financial measure . The Company believes Adjusted EBITDA Gross Profit and Adjusted EBITDA SG&A serve as appropriate measures in evaluating the performance of its business and helps its investors better compare its operating performance with its competitors . 3

Q2 FY2022 FINANCIAL REVIEW

Q2 FY2022 at a Glance • 2.2% Increase in total revenues • $106M Adjusted EBITDA* • 6.5% Increase in retail segment revenues • 7.1% Increase in number of prescriptions filled (adjusted to 30 day equivalents) • 26% Increase in Elixir Adjusted EBITDA* • Administered approximately 2.5 million COVID - 19 vaccines 5 *Adjusted EBITDA reconciliation located in the Appendix

Key Second Quarter FY2022 Highlights Retail Pharmacy: • 6.5% total growth in retail revenues • Same store sales increased 2.6% • Administered over 700K COVID - 19 tests • Acute prescription count increased 1.5%, excluding benefit from COVID - 19 vaccines • Maintenance prescription count increased 2.4% on a same store basis • Completed the conversion of all Bartell stores and the distribution center Elixir: • 3.2M lives under management • Delivered $37M in Adjusted EBITDA • Specialty revenue up 8.2% • Filled 18% of scripts at a Rite Aid pharmacy Entered into an amendment to our Senior Secured Credit Agreement, which extended our debt maturity profile and improved pricing on our FILO term loan Ended the quarter with approximately $1.7 billion in liquidity 6

Continued Progress On Our Key Strategic Pillars • Appointed Lance Neil as Chief Operator Officer • Selecting a single rebate aggregation partner for health plan and PBM business to improve pricing • Integration between Rite Aid and Elixir back office functions nearly complete • Putting anchored limited networks in relevant markets and using our pharmacists to engage consumer in personalized health solutions powered by Rite Aid and Health Dialog • Completed over 124K Medication Therapy Management (MTM) claims a 58% increase versus last quarter • Customers booked almost 700K future vaccine appointments with the scheduling platform • Ancillary vaccines increased 140% per store per week since beginning of the quarter • Grew 30 day adjusted scripts 9.9% on a 2 - year stack • Maintenance scripts are up 7.1% on a 2 - year stack • Front end comps up 3.0% on a 2 - year stack • Front end strength in vitamins, color cosmetics and baby care. Up approximately 7% on a 2 - year stack • Over 2,100 store exterior refresh's have been completed • 183% revenue growth in marketplace and delivery business since last year • 34% increase in digital script refills 7 Establishing Elixir as a clearly differentiated market leader Unlocking the value of our pharmacists Renewing our retail and digital experience

8 New York State “Back to School” COVID - 19 Testing Program • No Cost testing for New York students K - 12 • Partnered with US Department of Health and Human Services (HHS) and BioReference Laboratories, Inc. • COVID - 19 testing at one of the 115 Rite Aid drive - thru NY locations • Support for testing has the potential to further expand and grow partnerships with additional school districts for the 2021 - 22 school year

9 COVID - 19 Update • Approximately 2.5M COVID - 19 Vaccines Administered in Second Quarter • 8M vaccinations total since we began administering late last year • Vaccinated nearly 3.5M individual customers and starting to see some of the new customers utilize Rite Aid pharmacy for prescriptions • COVID testing demand increased and conducted over 700K free PCR tests with average turnaround 2 days • Working closely with CDC and White House to administer third shot of Pfizer for individuals over 65 or with underlying health conditions • Preparing for increased vaccinations to support workplace mandates

FY 2022 Guidance at a Glance • $25.1B - $25.5B Total revenues • ($ 221M ) – ($ 197M ) Net loss • $ 460M - $ 500M Adjusted EBITDA • ($ 0.90) – ($ 0.53) Adjusted net loss • $300M Capital expenditures 10

11 11 APPENDIX
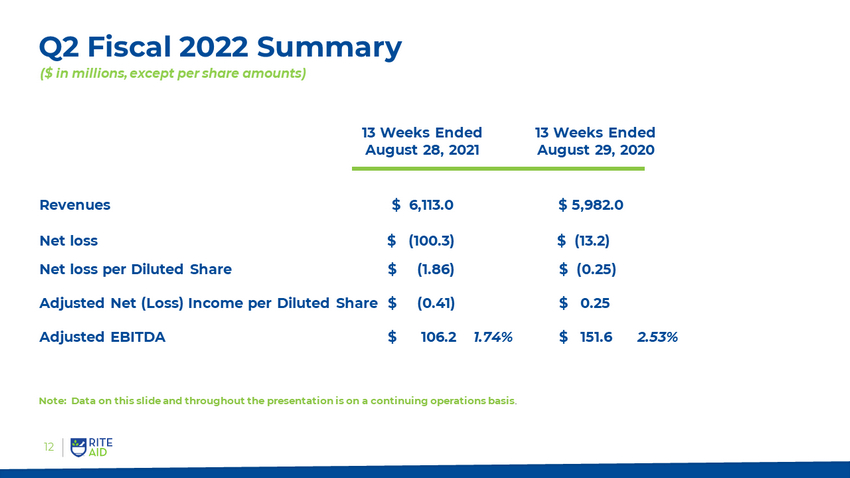
12 Q2 Fiscal 2022 Summary ($ in millions, except per share amounts) 13 Weeks Ended August 28, 2021 13 Weeks Ended August 29 , 2020 Revenues $ 6,113.0 $ 5,982.0 Net loss $ (100.3) $ (13.2) Net loss per Diluted Share $ (1.86) $ (0.25) Adjusted Net (Loss) Income per Diluted Share $ ( 0 .41) $ 0 .25 Adjusted EBITDA $ 106.2 1.74% $ 151.6 2.53% Note: Data on this slide and throughout the presentation is on a continuing operations basis .

13 13 Weeks Ended August 28, 2021 13 Weeks Ended August 29, 2020 Net loss $ (100,301) $ (13,197) Adjustments: • Interest expense 48,592 50,007 • Income tax expense 3,310 47 • Depreciation and amortization 73,859 87,117 • LIFO credit (3,993) (8,750) • Facility exit and impairment charges 11,353 11,528 • Loss (gain) on debt modifications and retirements, net 2,839 (5,274) • Merger and Acquisition - related costs 4,591 - • Stock - based compensation expense 5,792 3,936 • Restructuring - related costs 9,584 23,186 • Inventory write - downs related to store closings 798 1,058 • Litigation settlements 34,212 - • Loss on sale of assets, net 12,378 1,092 • Other 3,146 853 Adjusted EBITDA $ 106,160 $ 151,603 Percent of revenues 1.74% 2.53% Q2 - Fiscal 2022 Reconciliation of Net Loss to Adjusted EBITDA ($ in thousands)

14 13 Weeks Ended August 28, 2021 13 Weeks Ended August 29, 2020 Net loss $ (100,301) $ (13 ,197) Add back - Income tax expense 3,310 47 Loss before income taxes $ (96,991) $ (13,150) Adjustments: Amortization expense 19,953 22,695 LIFO credit (3,993) (8,750) Loss (gain) on debt modifications and retirements, net 2,839 (5,274) Merger and Acquisition - related costs 4,591 - Restructuring - related costs 9,584 23,186 Litigation settlements 34,212 - . Adjusted (loss) income before income taxes $ (29,805) $ 18,707 Adjusted income tax (benefit) expense (7,839) 5,171 Adjusted net (loss) income $ (21,966) $ 13,536 Net loss per diluted share $ (1.86) $ (0.25) Adjusted net (loss) income per diluted share $ (0.41) $ 0.25 Q2 - Fiscal 2022 Reconciliation of Net Loss to Adjusted Net (Loss) Income ($ in thousands, except per share amounts)

15 Revenues $ 4,277.2 $ 4,017.9 Adjusted EBITDA Gross Profit (1) $ 1,138.9 26.63% $ 1,056.2 26.29% Adjusted EBITDA SG&A (1) $ 1,069 .5 25.01% $ 933.9 23.24% Adjusted EBITDA $ 69.4 1.62% $ 122.3 3.04% Q2 - Fiscal 2022 Summary – Retail Pharmacy Segment ($ in millions) (1) Refer to slides 16 and 17 for the reconciliations of these non - GAAP measures to their applicable GAAP measures. 13 Weeks Ended August 28, 2021 13 Weeks Ended August 29, 2020
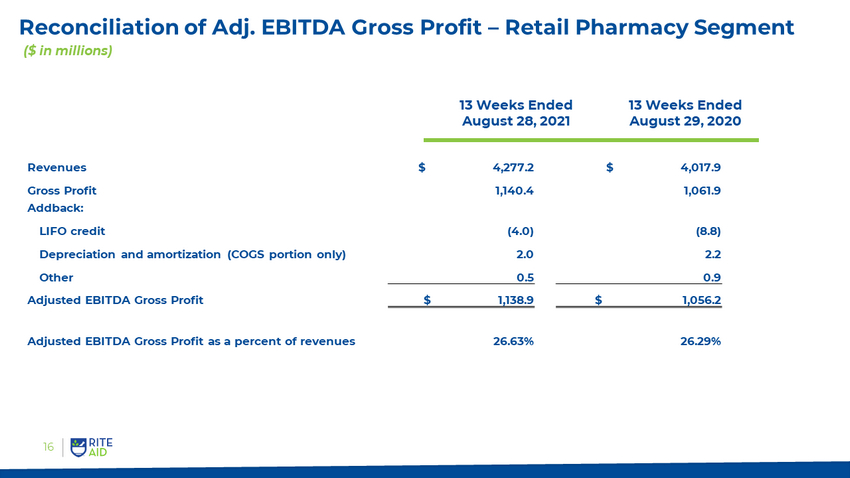
16 Reconciliation of Adj. EBITDA Gross Profit – Retail Pharmacy Segment ($ in millions) 13 Weeks Ended August 28, 2021 13 Weeks Ended August 29, 2020 Revenues $ 4,277.2 $ 4,017.9 Gross Profit 1,140.4 1,061.9 Addback: LIFO credit (4.0) (8.8) Depreciation and amortization (COGS portion only) 2.0 2.2 Other 0.5 0.9 Adjusted EBITDA Gross Profit $ 1,138.9 $ 1,056.2 Adjusted EBITDA Gross Profit as a percent of revenues 26.63% 26.29%

17 Reconciliation of Adj. EBITDA SG&A - Retail Pharmacy Segment ($ in millions) 13 Weeks Ended August 28, 2021 13 Weeks Ended August 29 , 2020 Revenues $ 4,277.2 $ 4,017.9 Selling, general and administrative expenses 1,163.4 1,030.1 Less: Depreciation and amortization (SG&A portion only) 59.1 70.9 Stock - based compensation expense 5.7 3.6 Merger and Acquisition - related costs 4.6 - Restructuring - related costs 2 .6 20.4 Litigation settlements 18.4 - Other 3.5 1.3 Adjusted EBITDA SG&A $ 1,069.5 $ 933.9 Adjusted EBITDA SG&A as a percent of revenues 25.01% 23.24%
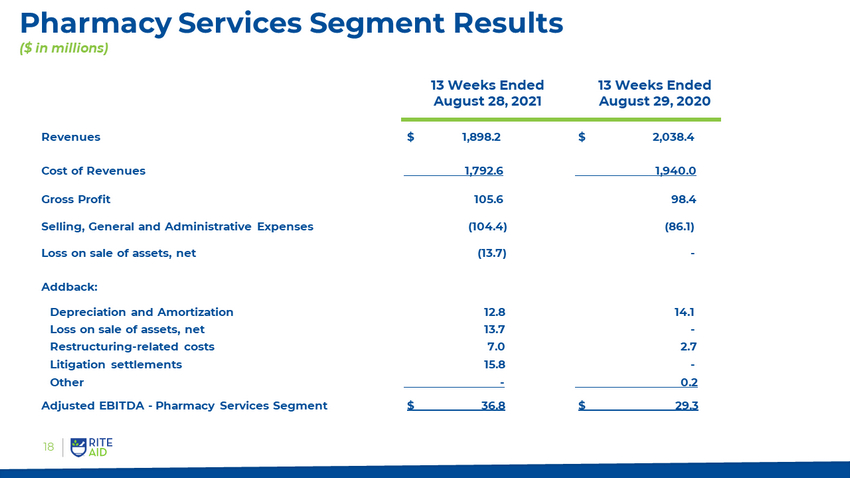
Revenues $ 1,898.2 $ 2,038.4 Cost of Revenues 1,792.6 1,940.0 Gross Profit 105 .6 98.4 Selling, General and Administrative Expenses (104.4) (86.1) Loss on sale of assets, net (13.7) - Addback: Depreciation and Amortization 12.8 14.1 Loss on sale of assets, net 13.7 - Restructuring - related costs 7.0 2.7 Litigation settlements 15.8 - Other - 0.2 Adjusted EBITDA - Pharmacy Services Segment $ 36.8 $ 29.3 13 Weeks Ended August 28, 2021 13 Weeks Ended August 29, 2020 18 Pharmacy Services Segment Results ($ in millions)
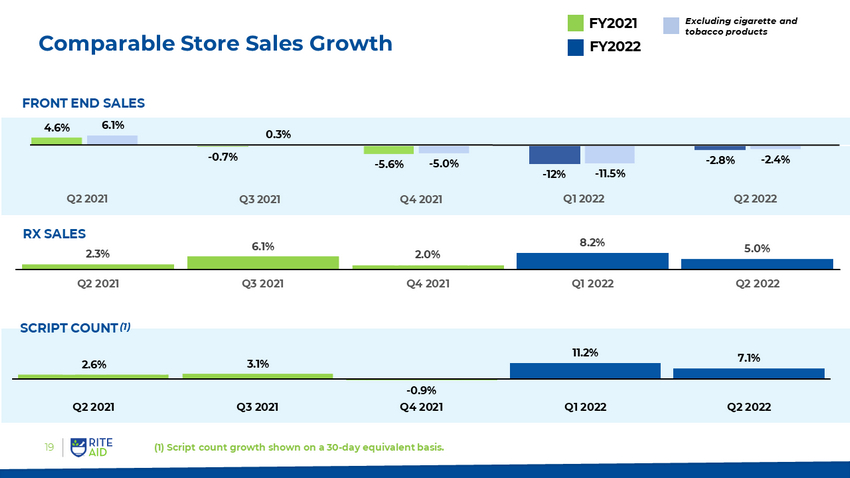
19 Comparable Store Sales Growth 2.6% 3.1% - 0.9% 11.2% 7.1% Q2 2021 Q3 2021 Q4 2021 Q1 2022 Q2 2022 SCRIPT COUNT (1) Q2 2021 Q3 2021 Q4 2021 2.3% 6.1% 2.0% 8.2% 5.0% Q2 2021 Q3 2021 Q4 2021 Q1 2022 Q2 2022 RX SALES 4.6% - 0.7% - 5.6% - 12% - 2.8% 6.1% 0.3% - 5.0% - 11.5% - 2.4% Q1 2022 FY2021 FY2022 Excluding cigarette and tobacco products (1) Script count growth shown on a 30 - day equivalent basis. FRONT END SALES Q2 2022
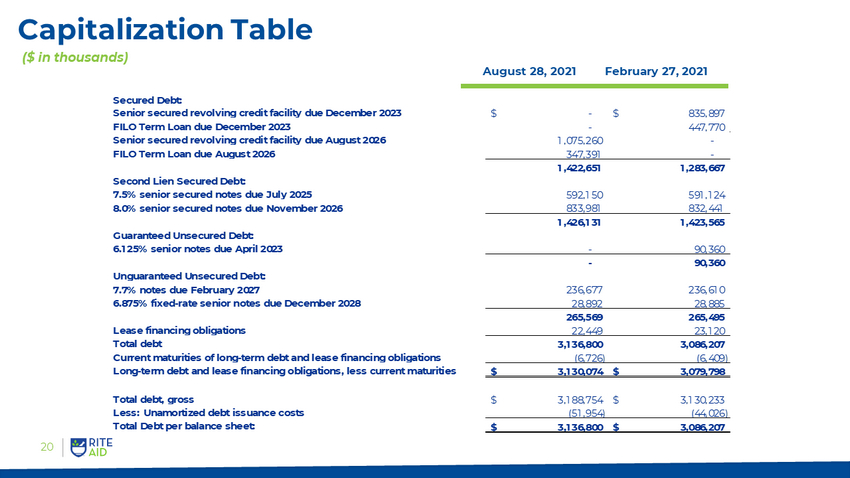
Capitalization Table 20 ($ in thousands) August 28, 2021 February 27, 2021 Secured Debt: Senior secured revolving credit facility due December 2023 -$ 835,897$ FILO Term Loan due December 2023 - 447,770 Senior secured revolving credit facility due August 2026 1,075,260 - FILO Term Loan due August 2026 347,391 - 1,422,651 1,283,667 Second Lien Secured Debt: 7.5% senior secured notes due July 2025 592,150 591,124 8.0% senior secured notes due November 2026 833,981 832,441 1,426,131 1,423,565 Guaranteed Unsecured Debt: 6.125% senior notes due April 2023 - 90,360 - 90,360 Unguaranteed Unsecured Debt: 7.7% notes due February 2027 236,677 236,610 6.875% fixed-rate senior notes due December 2028 28,892 28,885 265,569 265,495 Lease financing obligations 22,449 23,120 Total debt 3,136,800 3,086,207 Current maturities of long-term debt and lease financing obligations (6,726) (6,409) Long-term debt and lease financing obligations, less current maturities 3,130,074$ 3,079,798$ Total debt, gross 3,188,754$ 3,130,233$ Less: Unamortized debt issuance costs (51,954) (44,026) Total Debt per balance sheet: 3,136,800$ 3,086,207$
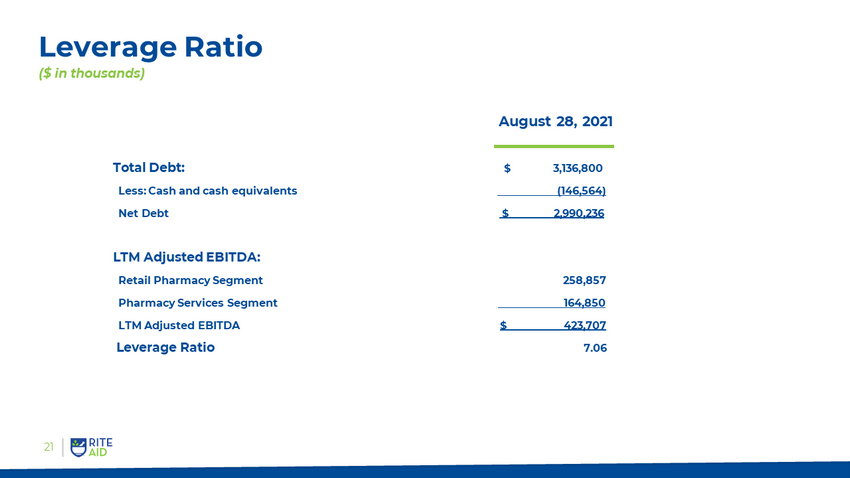
21 Leverage Ratio ($ in thousands) Total Debt: $ 3,136,800 Less: Cash and cash equivalents ( 146,564) Net Debt $ 2,990,236 LTM Adjusted EBITDA: Retail Pharmacy Segment 258,857 Pharmacy Services Segment 164,850 LTM Adjusted EBITDA $ 423,707 Leverage Ratio 7.06 August 28, 2021

22 FY 2022 Guidance ($ in thousands) Total Revenues $ 25,100,000 $ 25,500,000 PBM Revenues $ 7,700,000 $ 7,800,000 Gross Capital Expenditures $ 300,000 $ 300,000 Reconciliation of net loss to adjusted EBITDA: Net loss $ (221,000 ) $ (197,000 ) Adjustments: Interest expense 198,000 198,000 Income tax expense - 3,000 Depreciation and amortization 300,000 300,000 LIFO credit (16,000 ) (16,000 ) Facility exit and impairment charges 87,700 97,700 Loss on debt modifications and retirements, net 3,200 3,200 Merger and Acquisition - related costs 11,000 11,000 Restructuring - related costs 30,000 30,000 Litigation settlements 48,200 48,200 Gain on sale of assets, net (6,100) (3,100) Other 25,000 25,000 Adjusted EBITDA $ 460,000 $ 500,000 Guidance Range Low High

23 FY 2022 Guidance (cont.) ($ in thousands) Guidance Range Low High Net loss $ (221,000 ) $ (197,000 ) Add back - income tax expense - 3,000 Loss before income taxes (221,000 ) (194,000 ) Adjustments: Amortization expense 79,000 79,000 LIFO credit (16,000 ) (16,000 ) Loss on debt modifications and retirements, net 3,200 3,200 Merger and Acquisition - related costs 11,000 11,000 Restructuring - related costs 30,000 30,000 Litigation settlements 48,200 48,200 Adjusted loss before adjusted income taxes (65,600) (38,600) Adjusted income tax benefit (17,000) (10,000) Adjusted net loss $ (48,600) $ (28,600) Diluted adjusted net loss per share $ (0.90) $ (0.53)

Serious News for Serious Traders! Try StreetInsider.com Premium Free!
You May Also Be Interested In
- ACTS LAW Addresses Federal Correctional Institution in Dublin Controversy
- Splash Beverage Group Names Julius Ivancsits as Chief Financial Officer
- Arvinas Appoints Randy Teel, Ph.D., as Chief Business Officer
Create E-mail Alert Related Categories
SEC FilingsSign up for StreetInsider Free!
Receive full access to all new and archived articles, unlimited portfolio tracking, e-mail alerts, custom newswires and RSS feeds - and more!
