

Form 8-K Presidio Property Trust, For: May 11
 Tweet
Tweet Share
ShareExhibit 99.1

Presidio Property Trust, Inc.
Announces Earnings for the First Quarter Ended March 31, 2021
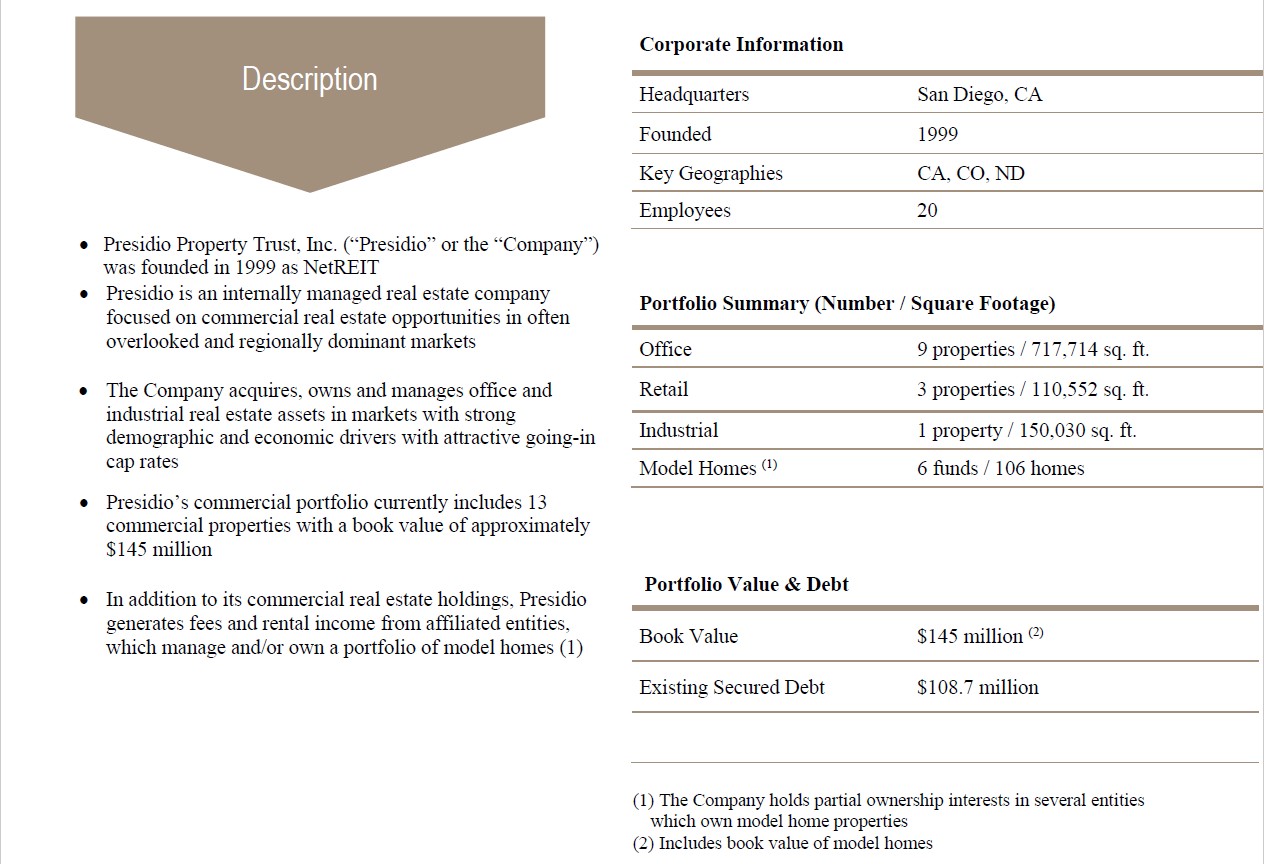
San Diego, California, May 11, 2021 – Presidio Property Trust, Inc. (Nasdaq: SQFT) (the “Company”), an internally‑managed, diversified REIT, with holdings in office, industrial, retail, and model home properties, today reported financial results for its first quarter ended March 31, 2021. All first quarter financial measures referenced herein are unaudited.
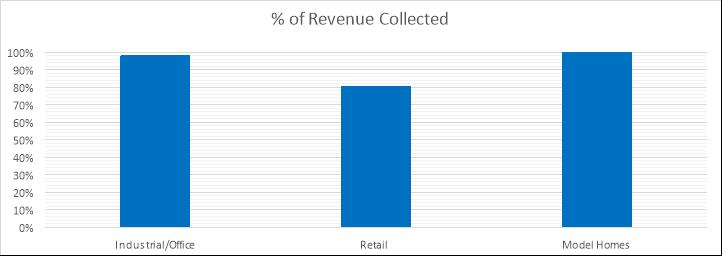
“We are pleased to report our first quarter earnings, continuing the strong rent collections that we saw throughout 2020,” said Jack Heilbron, the Company’s President and Chief Executive Officer. “The diversified nature of our portfolio, with especially strong office and model home collections, resulted in a company-wide collections rate of 96% of budget in the first quarter of 2021.”
“Fifteen office leases were inked in the first quarter of 2021, with 5 new tenants and 10 existing tenant renewals,” noted Gary Katz, the Company’s Senior Vice President of Asset Management. “As many local COVID-related restrictions have been relaxed, we believe that the optimism of an economic recovery will translate into more tenant renewals, and prospective tenants signing new leases.”
First Quarter Highlights
|
• |
Core FFO for the quarter was approximately $936,000, or $0.098 per fully diluted share |
|
|
|
||
|
• |
Collected 96% of first quarter contractual base rent |
|
|
|
||
|
• |
Executed a total of 15 new and renewal offices leases during the quarter, for monthly rental revenue of approximately $1.4 million |
First Quarter Ended March 31, 2021 Financial Results
Net loss attributable to the Company’s common stockholders for the three months ended March 31, 2021 was approximately $2.7 million, or $0.28 per basic and diluted share, compared to a net loss of $1.1 million, or $0.12 per basic and diluted share for the three months ended March 31, 2020. The increase in net loss attributable to the Company’s common stockholders was a result of:
|
• |
A decrease in revenues of approximately $1.3 million due to the sale of four properties since the first quarter of 2020; |
|
|
|
||
|
• |
An increase in loss on sale of real estate – During the three months ended March 31, 2021, the company recorded a loss of approximately $1.2 million on the sale of real estate, compared to an approximately $10,000 loss in the first quarter of 2020; partially offset by, |
|
|
|
||
|
• |
A corresponding decrease in rental operating costs of approximately $0.5 million due to the sale of four properties compared to the first quarter of 2020. |
FFO (non-GAAP) for the first quarter ended March 31, 2021 increased by approximately $156,000 to $935,725 from $779,689 for the three months ended March 31, 2020. A reconciliation of FFO to net loss, the most directly comparable GAAP financial measure, is attached to this press release. However, because FFO excludes depreciation and amortization as well as the changes in the value of the Company’s properties that result from use or market conditions, each of which have real economic effects and could materially impact the Company’s results from operations, the utility of FFO as a measure of the Company’s performance is limited.
First Quarter Ended March 31, 2021 Acquisitions and Dispositions
|
• |
Waterman Plaza was sold on January 28, 2021 for approximately $3.5 million and the Company recognized a loss of approximately $0.2 million. |
|
|
|
||
|
• |
Garden Gateway was sold on February 19, 2021 for approximately $11.2 million and the Company recognized a loss of approximately $1.4 million. |
|
|
|
||
|
• |
During the three months ended March 31, 2021, the Company disposed of 12 model homes for approximately $4.9 million and recognized a gain of approximately $0.4 million. |
During the three months ended March 31, 2021, the Company did not acquire any properties or model homes.
Dividends
On February 23, 2021, the board of directors of the Company declared a quarterly dividend of $0.101 per share of [Class A] common stock for the first quarter of 2021, payable on March 16, 2021 to stockholders of record as of March 9, 2021.
About Presidio Property Trust, Inc.
The Company is an internally managed, diversified REIT, with holdings in model home properties which are triple-net leased to homebuilders, office, industrial, and retail properties. In October 2017, we changed our name from “NetREIT, Inc.” to “Presidio Property Trust, Inc.” The Company acquires, owns and manages a geographically diversified portfolio of real estate assets including office, industrial, retail and model home residential properties leased to homebuilders located throughout the United States. As of March 31, 2021, the Company owned or had an equity interest in:
|
• |
106 Model Homes leased back on a triple-net basis to homebuilders that are owned by six affiliated limited partnerships and one wholly-owned corporation (“Model Home Properties”). |
|
|
|
||
|
• |
Nine office buildings and one industrial property (“Office/Industrial Properties”), which total approximately 867,744 rentable square feet; and |
|
|
|
||
|
• |
Three retail shopping centers (“Retail Properties”), which total approximately 110,552 rentable square feet. |
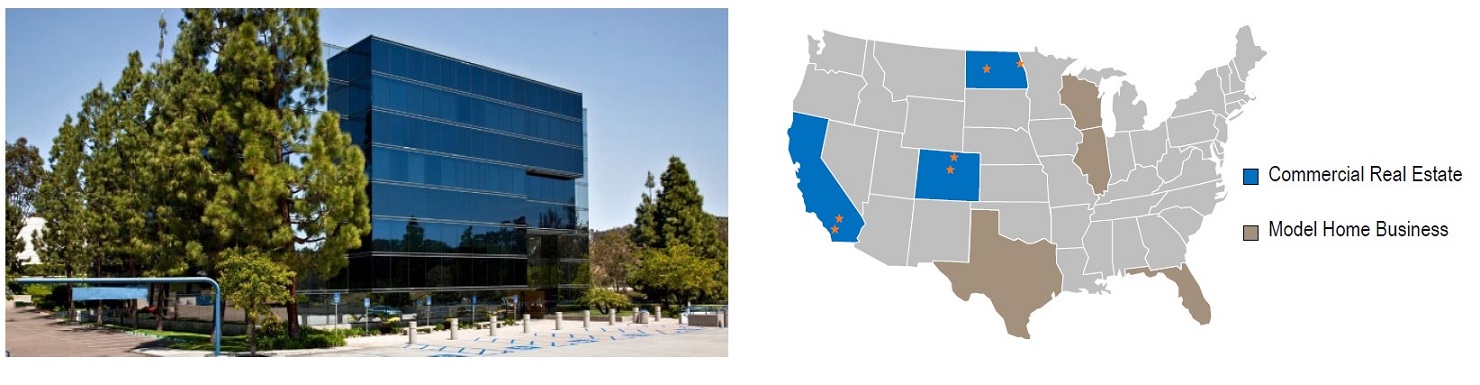
The Company’s model homes are leased on a triple-net basis to homebuilders located primarily in Texas and Florida. Our office, industrial and retail properties are located primarily in Colorado, with four properties located in North Dakota and two in Southern California. While geographical clustering of real estate enables us to reduce our operating costs through economies of scale by servicing a number of properties with less staff, it makes us susceptible to changing market conditions in these discrete geographic areas, including those that have developed as a result of COVID-19. We do not develop properties but acquire properties that are stabilized or that we anticipate will be stabilized within two or three years of acquisition. We consider a property to be stabilized once it has achieved an 80% occupancy rate for a full year as of January 1 of such year or has been operating for three years.
Most of our office and retail properties are leased to a variety of tenants ranging from small businesses to large public companies, many of which are not investment grade. We have in the past entered into, and intend in the future to enter into, purchase agreements for real estate having net leases that require the tenant to pay all of the operating expense (NNN leases) and/or pay increases in operating expenses over specific base years. Most of our office leases are for terms of 3 to 5 years with annual rental increases. Our model homes are typically leased back for 2 to 3 years to the home builder on a triple net lease. Under a triple net lease, the tenant is required to pay all operating, maintenance and insurance costs and real estate taxes with respect to the leased property.
We seek to diversify our portfolio by commercial real estate segments to reduce the adverse effect of a single under-performing segment, geographic market and/or tenant. We further supplement this at the tenant level through our credit review process, which varies by tenant class. For example, our commercial and industrial tenants tend to be corporations or individual owned businesses. In these cases, we typically obtain financial records, including financial statements and tax returns (depending on the circumstance), and run credit reports for any prospective tenant to support our decision to enter into a rental arrangement. We also typically obtain security deposits from these commercial tenants. Our model home commercial tenants are generally reputable homebuilders with established credit histories. These tenants are subjected to financial review and analysis prior to us entering into a sales-leaseback transaction. For more information on Presidio, please visit the Company website at http://www.presidiopt.com.
Definitions
Non-GAAP Financial Measures
Funds from Operations (“FFO”) – The Company evaluates performance based on Funds From Operations, which we refer to as FFO, as management believes that FFO represents the most accurate measure of activity and is the basis for distributions paid to equity holders. The Company defines FFO as net income or loss (computed in accordance with GAAP), excluding gains (or losses) from sales of property, hedge ineffectiveness, acquisition costs of newly acquired properties that are not capitalized and lease acquisition costs that are not capitalized plus depreciation and amortization, including amortization of acquired above and below market lease intangibles and impairment charges on properties or investments in non-consolidated REITs, and after adjustments to exclude equity in income or losses from, and, to include the proportionate share of FFO from, non-consolidated REITs.
However, because FFO excludes depreciation and amortization as well as the changes in the value of the Company’s properties that result from use or market conditions, each of which have real economic effects and could materially impact the Company’s results from operations, the utility of FFO as a measure of the Company’s performance is limited. In addition, other REITs may not calculate FFO in accordance with the NAREIT definition as the Company does, and, accordingly, the Company’s FFO may not be comparable to other REITs’ FFO. Accordingly, FFO should be considered only as a supplement to net income as a measure of the Company’s performance.
Core Funds from Operations (“Core FFO”) – We calculate Core FFO by using FFO as defined by NAREIT and adjusting for certain other non-core items. We also exclude from our Core FFO calculation acquisition costs, loss on early extinguishment of debt, changes in the fair value of the earn-out, changes in fair value of contingent consideration and the amortization of stock-based compensation.
We believe Core FFO provides a useful metric in comparing operations between reporting periods and in assessing the sustainability of our ongoing operating performance. Other equity REITs may calculate Core FFO differently or not at all, and, accordingly, the Company’s Core FFO may not be comparable to such other REITs’ Core FFO.
Same Store Net Operating Income (“Same Store NOI”) – Same Store NOI is calculated as the net operating income attributable to the properties continuously owned and operated for the entirety of the reporting periods presented. The Company’s definition of Same Store NOI excludes properties that were not stabilized during both of the applicable reporting periods. These exclusions may include, but are not limited to, acquisitions, dispositions and properties undergoing repositioning or significant renovations.
We believe Same Store NOI is an important measure of comparison because it allows for comparison of operating results of stabilized properties owned and operated for the entirety of both applicable periods and therefore eliminates variations caused by acquisitions, dispositions or repositioning during such periods. Other REITs may calculate Same Store NOI differently and our calculation should not be compared to that of other REITs.
Safe Harbor Disclosure
This press release contains statements that are “forward-looking statements” within the meaning of the Private Securities Litigation Reform Act of 1995, Section 27A of the Securities Act of 1933, as amended, and Section 21E of the Securities Exchange Act of 1934, as amended, and other federal securities laws. Forward looking statements are statements that are not historical, including statements regarding management’s intentions, beliefs, expectations, representations, plans or predictions of the future, and are typically identified by such words as “believe,” “expect,” “anticipate,” “intend,” “estimate,” “may,” “will,” “should” and “could.” Because such statements include risks, uncertainties and contingencies, actual results may differ materially from those expressed or implied by such forward looking statements. These forward-looking statements are based upon the Company’s present expectations, but these statements are not guaranteed to occur. Furthermore, the Company disclaims any obligation to publicly update or revise any forward-looking statement to reflect changes in underlying assumptions or factors, of new information, data or methods, future events or other changes. Investors should not place undue reliance upon forward-looking statements. For further discussion of the factors that could affect outcomes, please refer to the “Risk Factors” section of the Company’s Annual Report on Form 10-K filed with the SEC on March 30, 2021 and the Company’s Quarterly Report on Form 10-Q filed with the SEC on the date hereof, and in the Company’s other documents filed with the SEC, copies of which are available on the SEC’s website, www.sec.gov.
Contact Information
Presidio Property Trust, Inc.
Lowell Hartkorn, Investor Relations
+1-760-471-8536 x 1244
Presidio Property Trust, Inc. and Subsidiaries
Condensed Consolidated Balance Sheets
|
March 31, |
December 31, |
|||||||
|
2021 |
2020 |
|||||||
|
(Unaudited) |
||||||||
|
ASSETS |
||||||||
|
Real estate assets and lease intangibles: |
||||||||
|
Land |
$ | 17,851,741 | $ | 18,827,000 | ||||
|
Buildings and improvements |
109,787,999 | 115,409,423 | ||||||
|
Tenant improvements |
12,032,338 | 11,960,018 | ||||||
|
Lease intangibles |
4,110,139 | 4,110,139 | ||||||
|
Real estate assets and lease intangibles held for investment, cost |
143,782,217 | 150,306,580 | ||||||
|
Accumulated depreciation and amortization |
(27,477,471 |
) |
(26,551,789 |
) |
||||
|
Real estate assets and lease intangibles held for investment, net |
116,304,746 | 123,754,791 | ||||||
|
Real estate assets held for sale, net |
29,043,401 | 42,499,176 | ||||||
|
Real estate assets, net |
145,348,147 | 166,253,967 | ||||||
|
Cash, cash equivalents and restricted cash |
6,985,381 | 11,540,917 | ||||||
|
Deferred leasing costs, net |
1,538,917 | 1,927,951 | ||||||
|
Goodwill |
2,423,000 | 2,423,000 | ||||||
|
Other assets, net |
2,846,561 | 3,422,781 | ||||||
|
TOTAL ASSETS |
$ | 159,142,006 | $ | 185,568,616 | ||||
|
LIABILITIES AND EQUITY |
||||||||
|
Liabilities: |
||||||||
|
Mortgage notes payable, net |
$ | 90,899,959 | $ | 94,664,266 | ||||
|
Mortgage notes payable related to properties held for sale, net |
17,785,222 | 25,365,430 | ||||||
|
Mortgage notes payable, total net |
108,685,181 | 120,029,696 | ||||||
|
Note payable, net |
— | 7,500,086 | ||||||
|
Accounts payable and accrued liabilities |
3,881,486 | 5,126,199 | ||||||
|
Accrued real estate taxes |
1,525,006 | 2,548,686 | ||||||
|
Lease liability, net |
95,825 | 102,323 | ||||||
|
Below-market leases, net |
120,008 | 139,045 | ||||||
|
Total liabilities |
114,307,506 | 135,446,035 | ||||||
|
Commitments and contingencies (Note 9) |
||||||||
|
Equity: |
||||||||
|
Series A Common Stock, $0.01 par value, shares authorized: 100,000,000; 9,508,363 shares were both issued and outstanding at March 31, 2021 and December 31, 2020, respectively |
95,038 | 95,038 | ||||||
|
Additional paid-in capital |
156,463,146 | 156,463,146 | ||||||
|
Dividends and accumulated losses |
(125,334,982 |
) |
(121,674,505 |
) |
||||
|
Total stockholders' equity before noncontrolling interest |
31,223,202 | 34,883,679 | ||||||
|
Noncontrolling interest |
13,611,298 | 15,238,902 | ||||||
|
Total equity |
44,834,500 | 50,122,581 | ||||||
|
TOTAL LIABILITIES AND EQUITY |
$ | 159,142,006 | $ | 185,568,616 | ||||
Presidio Property Trust, Inc. and Subsidiaries
Condensed Consolidated Statements of Operations
(Unaudited)
|
For the Three Months Ended March 31, |
||||||||
|
2021 |
2020 |
|||||||
|
Revenues: |
||||||||
|
Rental income |
$ | 5,477,223 | $ | 6,785,685 | ||||
|
Fees and other income |
191,531 | 243,466 | ||||||
|
Total revenue |
5,668,754 | 7,029,151 | ||||||
|
Costs and expenses: |
||||||||
|
Rental operating costs |
1,838,923 | 2,381,092 | ||||||
|
General and administrative |
1,537,265 | 1,351,345 | ||||||
|
Depreciation and amortization |
1,428,934 | 1,574,526 | ||||||
|
Impairment of real estate assets |
300,000 | — | ||||||
|
Total costs and expenses |
5,105,122 | 5,306,963 | ||||||
|
Other income (expense): |
||||||||
|
Interest expense-mortgage notes |
(1,305,021 |
) |
(1,687,776 |
) |
||||
|
Interest expense - note payable |
(279,373 |
) |
(866,070 |
) |
||||
|
Interest and other income (expense), net |
(32,785 |
) |
(6,995 |
) |
||||
|
Loss on sales of real estate, net |
(1,161,328 |
) |
(9,835 |
) |
||||
|
Gain on extinguishment of government debt |
10,000 | — | ||||||
|
Income tax expense |
(50,199 |
) |
(83,631 |
) |
||||
|
Total other income (expense), net |
(2,818,706 |
) |
(2,654,307 |
) |
||||
|
Net loss |
(2,255,074 |
) |
(932,119 |
) |
||||
|
Less: Income attributable to noncontrolling interests |
(406,608 |
) |
(175,011 |
) |
||||
|
Net loss attributable to Presidio Property Trust, Inc. common stockholders |
$ | (2,661,682 |
) |
$ | (1,107,130 |
) |
||
|
Basic and diluted loss per common share |
$ | (0.28 |
) |
$ | (0.12 |
) |
||
|
Weighted average number of common shares outstanding - basic and diluted |
9,508,363 | 8,881,842 | ||||||
Presidio Property Trust, Inc. and Subsidiaries
Reconciliation of Net Income to FFO and Core FFO
(Unaudited)
|
For the Three Months Ended March 31, |
||||||||
|
2021 |
2020 |
|||||||
|
Net loss attributable to Presidio Property Trust, Inc. common stockholders |
$ | (2,661,682 | ) | $ | (1,107,130 | ) | ||
|
Adjustments: |
||||||||
|
Income attributable to noncontrolling interests |
406,608 | 175,011 | ||||||
|
Depreciation and amortization |
1,428,934 | 1,574,526 | ||||||
|
Amortization of above and below market leases, net |
(1,010 | ) | (29,924 | ) | ||||
|
Impairment of real estate assets |
300,000 | — | ||||||
|
Loss on sale of real estate assets, net |
1,161,328 | 9,835 | ||||||
|
FFO |
$ | 634,178 | $ | 622,318 | ||||
|
Restricted stock compensation |
301,547 | 157,371 | ||||||
|
Core FFO |
$ | 935,725 | $ | 779,689 | ||||
|
Core FFO / Wgt Avg Share |
$ | 0.098 | $ | 0.088 | ||||
Presidio Property Trust, Inc. and Subsidiaries
Same Store Net Operating Income - Commercial Properties
(Unaudited)
|
For the Three Months Ended March 31, |
Variance |
|||||||||||||||
|
2021 |
2020 |
% |
||||||||||||||
|
Rental revenues |
$ | 4,508,650 | $ | 4,746,854 | $ | (238,204 |
) |
(5.0 |
)% |
|||||||
|
Rental operating costs |
1,834,421 | 1,995,530 | (161,109 |
) |
(8.1 |
)% |
||||||||||
|
Same Store Net operating income |
$ | 2,674,229 | $ | 2,751,324 | $ | (77,095 |
) |
(2.8 |
)% |
|||||||
|
Operating Ratios: |
||||||||||||||||
|
Number of same properties |
13 | 13 | ||||||||||||||
|
Occupancy, end of period |
82.4 |
% |
86.4 |
% |
(4.0 |
)% |
||||||||||
|
Operating costs as a percentage of total revenues |
40.7 |
% |
42.0 |
% |
(1.3 |
)% |
||||||||||
Exhibit 99.2


SUPPLEMENTAL FINANCIAL INFORMATION
As of March 31, 2021
|
FORWARD-LOOKING STATEMENTS |
|

This presentation contains “forward-looking statements” within the meaning of the federal securities laws that involve risks and uncertainties, many of which are beyond our control. Our actual results could differ materially and adversely from those anticipated in such forward-looking statements as a result of certain factors, including those set forth in the Quarterly Report on Form 10-Q. Forward-looking statements relate to matters such as our industry, business strategy, goals and expectations concerning our market position, future operations, margins, profitability, capital expenditures, financial condition, liquidity, capital resources, cash flows, dividends, results of operations and other financial and operating information. When used in this presentation, the words “will,” “may,” “believe,” “anticipate,” “intend,” “estimate,” “expect,” “should,” “project,” “plan,” and similar expressions are intended to identify forward-looking statements, although not all forward-looking statements contain such identifying words.
The forward-looking statements contained in this presentation are based on historical performance and management’s current plans, estimates and expectations in light of information currently available to it and are subject to uncertainty and changes in circumstances. There can be no assurance that future developments affecting us will be those that we have anticipated. Actual results may differ materially from these expectations due to the factors, risks and uncertainties described in the Annual Report on Form 10-K, as filed March 30, 2021 (“Annual Report”) and the Company’s Quarterly Report on Form 10-Q filed with the SEC on the date hereof (“Quarterly Report”), changes in global, regional or local political, economic, business, competitive, market, regulatory and other factors described in the “Risk Factors” section of the Annual Report and the Quarterly Report, many of which are beyond our control. Should one or more of these risks or uncertainties materialize or should any of our assumptions prove to be incorrect, our actual results may vary in material respects from what we may have expressed or implied by these forward-looking statements. We caution that you should not place undue reliance on any of our forward-looking statements. Any forward-looking statement made by us in this presentation speaks only as of the date on which we make it. Factors or events that could cause our actual results to differ may emerge from time to time, and it is not possible for us to predict all of them. We undertake no obligation to publicly update any forward-looking statement, whether as a result of new information, future developments or otherwise, except as may be required by applicable securities laws.
|
COMPANY OVERVIEW |
|

|
COMMERCIAL PORTFOLIO |
|

|
Property Location ($ in 000s) |
Sq. Ft. |
Date |
Year |
Purchase |
Occupancy |
Percent |
Mortgage |
||||||||||||||||||
|
Office/Industrial Properties: |
|||||||||||||||||||||||||
|
Executive Office Park, Colorado Springs, CO (2) |
49,864 |
07/08 |
2000 | 10,126 | 97.7 |
% |
100.0 |
% |
2,968 | ||||||||||||||||
|
Genesis Plaza, San Diego, CA (3)(4) |
57,807 |
08/10 |
1989 | 10,000 | 74.7 |
% |
76.4 |
% |
6,249 | ||||||||||||||||
|
Dakota Center, Fargo, ND |
119,434 |
05/11 |
1982 | 9,575 | 72.3 |
% |
100.0 |
% |
9,844 | ||||||||||||||||
|
Grand Pacific Center, Bismarck, ND |
93,058 |
04/14 |
1976 | 5,350 | 68.8 |
% |
100.0 |
% |
3,709 | ||||||||||||||||
|
Arapahoe Service Center II, Centennial, CO |
79,023 |
12/14 |
2000 | 11,850 | 100.0 |
% |
100.0 |
% |
7,891 | ||||||||||||||||
|
West Fargo Industrial, West Fargo, ND |
150,030 |
08/15 |
1998/2005 |
7,900 | 85.6 |
% |
100.0 |
% |
4,234 | ||||||||||||||||
|
300 N.P., West Fargo, ND |
34,517 |
08/15 |
1922 | 3,850 | 69.9 |
% |
100.0 |
% |
2,263 | ||||||||||||||||
|
One Park Centre, Westminster, CO |
69,174 |
08/15 |
1983 | 9,150 | 84.8 |
% |
100.0 |
% |
6,358 | ||||||||||||||||
|
Highland Court, Centennial, CO (5) (6) |
93,536 |
08/15 |
1984 | 13,050 | 56.3 |
% |
84.5 |
% |
6,237 | ||||||||||||||||
|
Shea Center II, Highlands Ranch, CO |
121,301 |
12/15 |
2000 | 25,325 | 91.2 |
% |
100.0 |
% |
17,682 | ||||||||||||||||
|
Total Office/Industrial Properties |
867,744 | $ | 106,176 | 80.2 |
% |
$ | 67,435 | ||||||||||||||||||
|
Retail Properties: |
|||||||||||||||||||||||||
|
World Plaza, San Bernardino, CA (6) |
55,810 |
09/07 |
1974 | 7,650 | 100.0 |
% |
100.0 |
% |
5,777 | ||||||||||||||||
|
Union Town Center, Colorado Springs, CO |
44,042 |
12/14 |
2003 | 11,212 | 100.0 |
% |
100.0 |
% |
8,279 | ||||||||||||||||
|
Research Parkway, Colorado Springs, CO |
10,700 |
8/15 |
2003 | 2,850 | 100.0 |
% |
100.0 |
% |
1,747 | ||||||||||||||||
|
Total Retail Properties |
110.552 | $ | 21.712 | 100.0 |
% |
$ | 15,803 | ||||||||||||||||||
|
Total Commercial Properties |
978,296 | $ | 127,888 | 82.4 |
% |
$ | 83,238 | ||||||||||||||||||
|
(1) |
Prior to January 1, 2009, “Purchase Price” includes our acquisition related costs and expenses for the purchase of the property. After January 1, 2009, acquisition related costs and expenses were recognized as expense when incurred. |
|
(2) |
One of four buildings within this property was sold as of December 31, 2020. The remaining three building are held for sale as of March 31, 2021. |
|
(3) |
Approximately 9,224 square feet, or 16.0% of this property, is occupied by us as our corporate offices and related parties. |
|
(4) |
This property is owned by two tenants-in-common, each of which owns 57% and 43%, respectively, and we beneficially own an aggregate interest of 76.4%. |
|
(5) |
This property is owned by two tenants-in-common, of which we own approximately 60% and 52%, respectively, and we beneficially own an aggregate interest of 84.5%. |
|
(6) |
This property is classified as held for sale as of March 31, 2021. |
|
MODEL HOMES PORTFOLIO |
|

|
Region |
No. of |
Aggregate |
Approximate % |
Current |
Approximate % |
Purchase |
Current |
|||||||||||||||||||||
|
Southwest |
91 | 273,227 | 87.8 |
% |
$ | 2,635,404 | 84.8 |
% |
$ | 34,300,302 | $ | 22,770,938 | ||||||||||||||||
|
Southeast |
11 | 25,120 | 8.1 |
% |
292,140 | 9.4 |
% |
3,629,626 | 2,232,828 | |||||||||||||||||||
|
Midwest |
2 | 6,602 | 2.1 |
% |
99,276 | 3.2 |
% |
1,103,000 | 707,396 | |||||||||||||||||||
|
Northeast |
2 | 6,153 | 2.0 |
% |
80,844 | 2.6 |
% |
898,250 | 621,510 | |||||||||||||||||||
| Total | 106 | 311,102 | 100 |
% |
$ | 3,107,664 | 100 |
% |
$ | 39,931,178 | $ | 26,332,673 | ||||||||||||||||
|
CONSOLIDATED BALANCE SHEET |
|

|
March 31, |
December 31, |
|||||||
|
2021 |
2020 |
|||||||
|
(Unaudited) |
||||||||
|
ASSETS |
||||||||
|
Real estate assets and lease intangibles: |
||||||||
|
Land |
$ | 17,851,741 | $ | 18,827,000 | ||||
|
Buildings and improvements |
109,787,999 | 115,409,423 | ||||||
|
Tenant improvements |
12,032,338 | 11,960,018 | ||||||
|
Lease intangibles |
4,110,139 | 4,110,139 | ||||||
|
Real estate assets and lease intangibles held for investment, cost |
143,782,217 | 150,306,580 | ||||||
|
Accumulated depreciation and amortization |
(27,477,471 |
) |
(26,551,789 |
) |
||||
|
Real estate assets and lease intangibles held for investment, net |
116,304,746 | 123,754,791 | ||||||
|
Real estate assets held for sale, net |
29,043,401 | 42,499,176 | ||||||
|
Real estate assets, net |
145,348,147 | 166,253,967 | ||||||
|
Cash, cash equivalents and restricted cash |
6,985,381 | 11,540,917 | ||||||
|
Deferred leasing costs, net |
1,538,917 | 1,927,951 | ||||||
|
Goodwill |
2,423,000 | 2,423,000 | ||||||
|
Other assets, net |
2,846,561 | 3,422,781 | ||||||
|
TOTAL ASSETS |
$ | 159,142,006 | $ | 185,568,616 | ||||
|
LIABILITIES AND EQUITY |
||||||||
|
Liabilities: |
||||||||
|
Mortgage notes payable, net |
$ | 90,899,959 | $ | 94,664,266 | ||||
|
Mortgage notes payable related to properties held for sale, net |
17,785,222 | 25,365,430 | ||||||
|
Mortgage notes payable, total net |
108,685,181 | 120,029,696 | ||||||
|
Note payable, net |
— | 7,500,086 | ||||||
|
Accounts payable and accrued liabilities |
3,881,486 | 5,126,199 | ||||||
|
Accrued real estate taxes |
1,525,006 | 2,548,686 | ||||||
|
Lease liability, net |
95,825 | 102,323 | ||||||
|
Below-market leases, net |
120,008 | 139,045 | ||||||
|
Total liabilities |
114,307,506 | 135,446,035 | ||||||
|
Commitments and contingencies (Note 9) |
||||||||
|
Equity: |
||||||||
|
Series A Common Stock, $0.01 par value, shares authorized: 100,000,000; 9,508,363 shares were both issued and outstanding at March 31, 2021 and December 31, 2020, respectively |
95,038 | 95,038 | ||||||
|
Additional paid-in capital |
156,463,146 | 156,463,146 | ||||||
|
Dividends and accumulated losses |
(125,334,982 |
) |
(121,674,505 |
) |
||||
|
Total stockholders' equity before noncontrolling interest |
31,223,202 | 34,883,679 | ||||||
|
Noncontrolling interest |
13,611,298 | 15,238,902 | ||||||
|
Total equity |
44,834,500 | 50,122,581 | ||||||
|
TOTAL LIABILITIES AND EQUITY |
$ | 159,142,006 | $ | 185,568,616 | ||||
|
CONSOLIDATED STATEMENT OF OPERATIONS |
|

|
For the Three Months Ended March 31, |
||||||||
|
2021 |
2020 |
|||||||
|
Revenues: |
||||||||
|
Rental income |
$ | 5,477,223 | $ | 6,785,685 | ||||
|
Fees and other income |
191,531 | 243,466 | ||||||
|
Total revenue |
5,668,754 | 7,029,151 | ||||||
|
Costs and expenses: |
||||||||
|
Rental operating costs |
1,838,923 | 2,381,092 | ||||||
|
General and administrative |
1,537,265 | 1,351,345 | ||||||
|
Depreciation and amortization |
1,428,934 | 1,574,526 | ||||||
|
Impairment of real estate assets |
300,000 | — | ||||||
|
Total costs and expenses |
5,105,122 | 5,306,963 | ||||||
|
Other income (expense): |
||||||||
|
Interest expense-mortgage notes |
(1,305,021 |
) |
(1,687,776 |
) |
||||
|
Interest expense - note payable |
(279,373 |
) |
(866,070 |
) |
||||
|
Interest and other income (expense), net |
(32,785 |
) |
(6,995 |
) |
||||
|
Loss on sales of real estate, net |
(1,161,328 |
) |
(9,835 |
) |
||||
|
Gain on extinguishment of government debt |
10,000 | — | ||||||
|
Income tax expense |
(50,199 |
) |
(83,631 |
) |
||||
|
Total other income (expense), net |
(2,818,706 |
) |
(2,654,307 |
) |
||||
|
Net loss |
(2,255,074 |
) |
(932,119 |
) |
||||
|
Less: Income attributable to noncontrolling interests |
(406,608 |
) |
(175,011 |
) |
||||
|
Net loss attributable to Presidio Property Trust, Inc. common stockholders |
$ | (2,661,682 |
) |
$ | (1,107,130 |
) |
||
|
Basic and diluted loss per common share |
$ | (0.28 |
) |
$ | (0.12 |
) |
||
|
Weighted average number of common shares outstanding - basic and diluted |
9,508,363 | 8,881,842 | ||||||
|
CONSOLIDATED STATEMENT OF CASH FLOWS |
|

|
For the Three Months Ended March 31, |
||||||||
|
2021 |
2020 |
|||||||
|
Cash flows from operating activities: |
||||||||
|
Net loss |
$ | (2,255,074 |
) |
$ | (932,119 |
) |
||
|
Adjustments to reconcile net loss to net cash used in operating activities: |
||||||||
|
Depreciation and amortization |
1,428,934 | 1,574,526 | ||||||
|
Stock compensation |
301,547 | 157,371 | ||||||
|
Loss on sale of real estate assets, net |
1,161,328 | 9,835 | ||||||
|
Gain on extinguishment of government debt |
(10,000 | ) | — | |||||
|
Impairment of real estate assets |
300,000 | — | ||||||
|
Accretion of original issue discount |
— | 337,802 | ||||||
|
Amortization of financing costs |
261,779 | 363,183 | ||||||
|
Amortization of above-market leases |
18,027 | 12,671 | ||||||
|
Amortization of below-market leases |
(19,037 |
) |
(42,595 |
) |
||||
|
Straight-line rent adjustment |
(132,990 |
) |
(52,941 |
) |
||||
|
Changes in operating assets and liabilities: |
||||||||
|
Other assets |
481,459 | 1,947,145 | ||||||
|
Accounts payable and accrued liabilities |
(1,980,474 |
) |
(2,612,649 |
) |
||||
|
Accrued real estate taxes |
(1,023,680 |
) |
(1,236,304 |
) |
||||
|
Net cash used in operating activities |
(1,468,181 |
) |
(474,075 |
) |
||||
|
Cash flows from investing activities: |
||||||||
|
Real estate acquisitions |
— | (3,573,743 |
) |
|||||
|
Additions to buildings and tenant improvements |
(100,765 |
) |
(889,673 |
) |
||||
|
Additions to deferred leasing costs |
(37,585 |
) |
— | |||||
|
Proceeds from sales of real estate, net |
19,047,906 | 24,587,128 | ||||||
|
Net cash provided by investing activities |
18,909,556 | 20,123,712 | ||||||
|
Cash flows from financing activities: |
||||||||
|
Proceeds from mortgage notes payable, net of issuance costs |
6,013,700 | 4,347,502 | ||||||
|
Repayment of mortgage notes payable |
(17,231,730 |
) |
(19,803,831 |
) |
||||
|
Repayment of note payable |
(7,675,598 |
) |
(5,224,401 |
) |
||||
|
Payment of deferred offering costs |
(70,276 |
) |
(100,031 |
) |
||||
|
Contributions from noncontrolling interests, net of distributions paid |
(2,034,212 |
) |
(277,472 |
) |
||||
|
Dividends paid to stockholders |
(998,795 |
) |
— | |||||
|
Net cash used in financing activities |
(21,996,911 |
) |
(21,058,233 |
) |
||||
|
Net increase in cash equivalents and restricted cash |
(4,555,536 |
) |
(1,408,596 |
) |
||||
|
Cash, cash equivalents and restricted cash - beginning of period |
11,540,917 | 10,391,275 | ||||||
|
Cash, cash equivalents and restricted cash - end of period |
$ | 6,985,381 | $ | 8,982,679 | ||||
|
Supplemental disclosure of cash flow information: |
||||||||
|
Interest paid-mortgage notes payable |
$ | 1,239,193 | $ | 1,674,483 | ||||
|
Interest paid-notes payable |
$ | 103,861 | $ | 247,805 | ||||
|
Unpaid deferred financing costs |
$ | — | $ | 14,608 | ||||
|
EBITDA RECONCILIATION |
|

|
For the Three Months Ended March 31, |
||||||||
|
2021 |
2020 |
|||||||
|
Net loss attributable to Presidio Property Trust, Inc. common stockholders |
$ | (2,661,682 |
) |
$ | (1,107,130 |
) |
||
|
Adjustments: |
||||||||
|
Interest Expense |
1,584,394 | 2,553,846 | ||||||
|
Depreciation and Amortization |
1,427,924 | 1,544,602 | ||||||
|
Asset Impairments |
300,000 | — | ||||||
|
Net Loss on Sales of RE |
1,161,328 | 9,835 | ||||||
|
Gain Extinguishment of Government Debt |
(10,000 |
) |
— | |||||
|
Income Taxes |
50,199 | 83,631 | ||||||
|
EBITDAre |
$ | 1,852,163 | $ | 3,084,784 | ||||
|
FFO AND CORE FFO RECONCILIATION |
|

|
For the Three Months Ended March 31, |
||||||||
|
2021 |
2020 |
|||||||
|
Net loss attributable to Presidio Property Trust, Inc. common stockholders |
$ | (2,661,682 |
) |
$ | (1,107,103 |
) |
||
|
Adjustments: |
||||||||
|
Income attributable to noncontrolling interests |
406,608 | 175,011 | ||||||
|
Depreciation and amortization |
1,428,934 | 1,574,526 | ||||||
|
Amortization of above and below market leases, net |
(1,010 |
) |
(29,924 |
) |
||||
|
Impairment of real estate assets |
300,000 | — | ||||||
|
Loss on sale of real estate assets |
1,161,328 | 9,835 | ||||||
|
FFO |
$ | 634,178 | $ | 622,318 | ||||
|
Stock Based Compensation |
301,547 | 157,371 | ||||||
|
Core FFO |
$ | 935,725 | $ | 779,689 | ||||
| Core FFO / Wgt Avg Shares | $ | 0.098 | $ | 0.088 | ||||
|
SAME STORE ANALYSIS |
|

|
For the Three Months Ended March 31, |
Variance |
|||||||||||||||
|
2021 |
2020 |
% |
||||||||||||||
|
Rental revenues |
$ | 4,508,650 | $ | 4,746,854 | $ | (238,204 |
) |
(5.0 |
)% |
|||||||
|
Rental operating costs |
1,834,421 | 1,995,530 | (161,109 |
) |
(8.1 |
)% |
||||||||||
|
Same Store Net operating income |
$ | 2,674,229 | $ | 2,751,324 | $ | (77,095 |
) |
(2.8 |
)% |
|||||||
|
Operating Ratios: |
||||||||||||||||
|
Number of same properties |
13 | 13 | - | |||||||||||||
|
Occupancy, end of period |
82.4 |
% |
86.4 |
% |
(4.0 |
)% |
||||||||||
|
Operating costs as a percentage of total revenues |
40.7 |
% |
42.0 |
% |
(1.3 |
)% |
||||||||||
|
SEGMENT DATA |
|
DEFINITIONS – NON-GAAP MEASUREMENTS |
|

EBITDAre - EBITDAre is defined by NAREIT as earnings before interest, taxes, depreciation and amortization, gain or loss on disposal of depreciated assets, and impairment write-offs.
Funds from Operations (“FFO”) – The Company evaluates performance based on Funds From Operations, which we refer to as FFO, as management believes that FFO represents the most accurate measure of activity and is the basis for distributions paid to equity holders. The Company defines FFO, a non-GAAP measure, as net income or loss (computed in accordance with GAAP), excluding gains (or losses) from sales of property, hedge ineffectiveness, acquisition costs of newly acquired properties that are not capitalized and lease acquisition costs that are not capitalized plus depreciation and amortization, including amortization of acquired above and below market lease intangibles and impairment charges on properties or investments in non-consolidated REITs, and after adjustments to exclude equity in income or losses from, and, to include the proportionate share of FFO from, non-consolidated REITs.
However, because FFO excludes depreciation and amortization as well as the changes in the value of the Company’s properties that result from use or market conditions, each of which have real economic effects and could materially impact the Company’s results from operations, the utility of FFO as a measure of the Company’s performance is limited. In addition, other REITs may not calculate FFO in accordance with the NAREIT definition as the Company does, and, accordingly, the Company’s FFO may not be comparable to other REITs’ FFO. Accordingly, FFO should be considered only as a supplement to net income as a measure of the Company’s performance.
Core Funds from Operations (“Core FFO”) – We calculate Core FFO, a non-GAAP measure, by using FFO as defined by NAREIT and adjusting for certain other non-core items. We also exclude from our Core FFO calculation acquisition costs, loss on early extinguishment of debt, changes in the fair value of the earn-out, changes in fair value of contingent consideration and the amortization of stock-based compensation.
We believe Core FFO provides a useful metric in comparing operations between reporting periods and in assessing the sustainability of our ongoing operating performance. Other equity REITs may calculate Core FFO differently or not at all, and, accordingly, the Company’s Core FFO may not be comparable to such other REITs’ Core FFO.
Same Store Net Operating Income (“Same Store NOI”) – Same Store NOI, a non-GAAP measure, is calculated as the net operating income attributable to the properties continuously owned and operated for the entirety of the reporting periods presented. The Company’s definition of Same Store NOI excludes properties that were not stabilized during both of the applicable reporting periods. These exclusions may include, but are not limited to, acquisitions, dispositions and properties undergoing repositioning or significant renovations.
The Company evaluates the performance of its same-store property operating results based upon net operating income from continuing operations, which is a non-GAAP supplemental financial measure. The Company defines NOI as operating revenues (rental income, tenant reimbursements and other operating income) less property and related expenses (property operating expenses, real estate taxes, insurance and provision for bad debt) less interest expense. NOI excludes certain items that are not considered to be controllable in connection with the management of an asset such as non-property income and expenses, depreciation and amortization, asset management fees and corporate general and administrative expenses. The Company believes that net income is the GAAP measure that is most directly comparable to NOI; however, NOI should not be considered as an alternative to net income as the primary indicator of operating performance as it excludes the items described above.
We believe Same Store NOI, a non-GAAP measure, is an important measure of comparison because it allows for comparison of operating results of stabilized properties owned and operated for the entirety of both applicable periods and therefore eliminates variations caused by acquisitions, dispositions or repositioning during such periods. Other REITs may calculate Same Store NOI differently and our calculation should not be compared to that of other REITs.
Serious News for Serious Traders! Try StreetInsider.com Premium Free!
You May Also Be Interested In
- i3 Energy PLC Announces 2024 Capital Budget and Production Guidance
- Pre-Investor Call Presentation available to shareholders
- deepull unveils 1 hour, direct-from-blood multiplex PCR test for 95% of sepsis-causing pathogens at ESCMID 2024
Create E-mail Alert Related Categories
SEC FilingsSign up for StreetInsider Free!
Receive full access to all new and archived articles, unlimited portfolio tracking, e-mail alerts, custom newswires and RSS feeds - and more!
