

Form 8-K PennyMac Financial Servi For: Jun 17
 Tweet
Tweet Share
ShareExhibit 99.1
| INVESTOR DAY June 2021 |

| 2 This presentation contains information from PennyMac Financial Services, Inc.’s (“PFSI”) and PennyMac Mortgage Investment Trust’s (“PMT”) joint investor day held on June 17, 2021 (collectively, “PennyMac,” “our” or “we”) and contains forward-looking statements within the meaning of Section 21E of the Securities Exchange Act of 1934, as amended, regarding PFSI’s and PMT’s beliefs, estimates, projections and assumptions with respect to, among other things, financial results, operations, business plans and investment strategies, as well as industry and market conditions, all of which are subject to change. Words like “believe,” “expect,” “anticipate,” “promise,” “project,” “plan,” and other expressions or words of similar meanings, as well as future or conditional verbs such as “will,” “would,” “should,” “could,” or “may” are generally intended to identify forward-looking statements. Actual results and operations for any future period may vary materially from those projected herein and from past results discussed herein. These forward-looking statements include, but are not limited to, statements regarding the future impact of COVID-19 on our business and financial operations, loan originations and servicing, production, loan delinquencies and forbearances, servicing advances requirements and other business and financial expectations. Factors which could cause actual results to differ materially from historical results or those anticipated include, but are not limited to: our exposure to risks of loss and disruptions in operations resulting from adverse weather conditions, man-made or natural disasters, climate change and pandemics such as COVID-19; the continually changing federal, state and local laws and regulations applicable to the highly regulated industry in which we operate; lawsuits or governmental actions that may result from any noncompliance with the laws and regulations applicable to our businesses; the mortgage lending and servicing-related regulations promulgated by the Consumer Financial Protection Bureau and other regulatory bodies; our dependence on U.S. government-sponsored entities and changes in their current roles or their guarantees or guidelines; volatility in the debt or equity markets, the general economy or the real estate finance and real estate markets; changes in general business, economic, market, employment and domestic and international political conditions, or in consumer confidence and spending habits from those expected; the concentration of credit risk; the degree and nature of competition; the degree to which our hedging strategies may or may not protect against interest rate volatility; the effect of the accuracy of or changes in the estimates made about uncertainties, contingencies and asset and liability valuations when measuring and reporting upon our financial condition and results of operations; changes to government mortgage modification programs; licensing and operational regulatory requirements applicable to our business, to which bank competitors are not subject; foreclosure delays and changes in foreclosure practices; difficulties inherent in growing loan production volume; difficulties inherent in adjusting the size of our operations to reflect changes in business levels; purchase opportunities for mortgage servicing rights and our success in winning bids; our substantial amount of indebtedness; expected discontinuation of LIBOR; increases in loan delinquencies and defaults; maintaining sufficient capital and liquidity including compliance with financial covenants; unanticipated increases or volatility in financing and other costs, including changes in interest rates; our obligation to indemnify third-party purchasers or repurchase loans if loans that we originate, acquire, service or assist in the fulfillment of, fail to meet certain criteria or characteristics or under other circumstances; decreases in management and incentive fees; conflicts of interest in allocating our services and business opportunities between PFSI and PMT and their affiliates; limitations imposed on PMT’s ability to satisfy complex rules for it to qualify as a REIT for U.S. federal income tax purposes and qualify for an exclusion from the Investment Company Act of 1940 and the ability of certain of PMT’s subsidiaries to qualify as REITs or as taxable REIT subsidiaries for U.S. federal income tax purposes; the effect of public opinion on our reputation; our ability to effectively identify, manage, monitor and mitigate financial risks; our initiation or expansion of new business and investment activities or strategies; our ability to detect misconduct and fraud; our ability to maintain appropriate internal control over financial reporting; our ability to mitigate cybersecurity risks and cyber incidents; our ability to pay dividends; and our organizational structure and certain requirements in our charter documents. You should not place undue reliance on any forward-looking statement and should consider all of the uncertainties and risks described above, as well as those more fully discussed in reports and other documents filed by PFSI and PMT with the Securities and Exchange Commission from time to time. PFSI and PMT undertake no obligation to publicly update or revise any forward-looking statements or any other information contained herein, and the statements made in this presentation are current as of the date of this presentation. This presentation also contains financial information calculated other than in accordance with U.S. generally accepted accounting principles (“GAAP”), such as pretax income excluding valuation items that provide a meaningful perspective on PFSI’s business results since it utilizes this information to evaluate and manage the business. Non-GAAP disclosure has limitations as an analytical tool and should not be viewed as a substitute for financial information determined in accordance with GAAP. FORWARD-LOOKING STATEMENTS |
| 3 AGENDA 1. Overview – David Spector, Andy Chang 2. Mortgage Banking Overview – Doug Jones 3. Consumer Direct Lending – Scott Bridges 4. Broker Direct Lending – Kim Nichols 5. Correspondent Production – Abbie Tidmore 6. Mortgage Fulfillment – Jim Follette 7. Loan Servicing – Steve Bailey 8. PMT – Vandy Fartaj, Will Chang 9. Capital Management & Financial Outlook – Pam Marsh, Dan Perotti |

| OVERVIEW DAVID SPECTOR Chairman and Chief Executive Officer ANDY CHANG Senior Managing Director Chief Operating Officer |

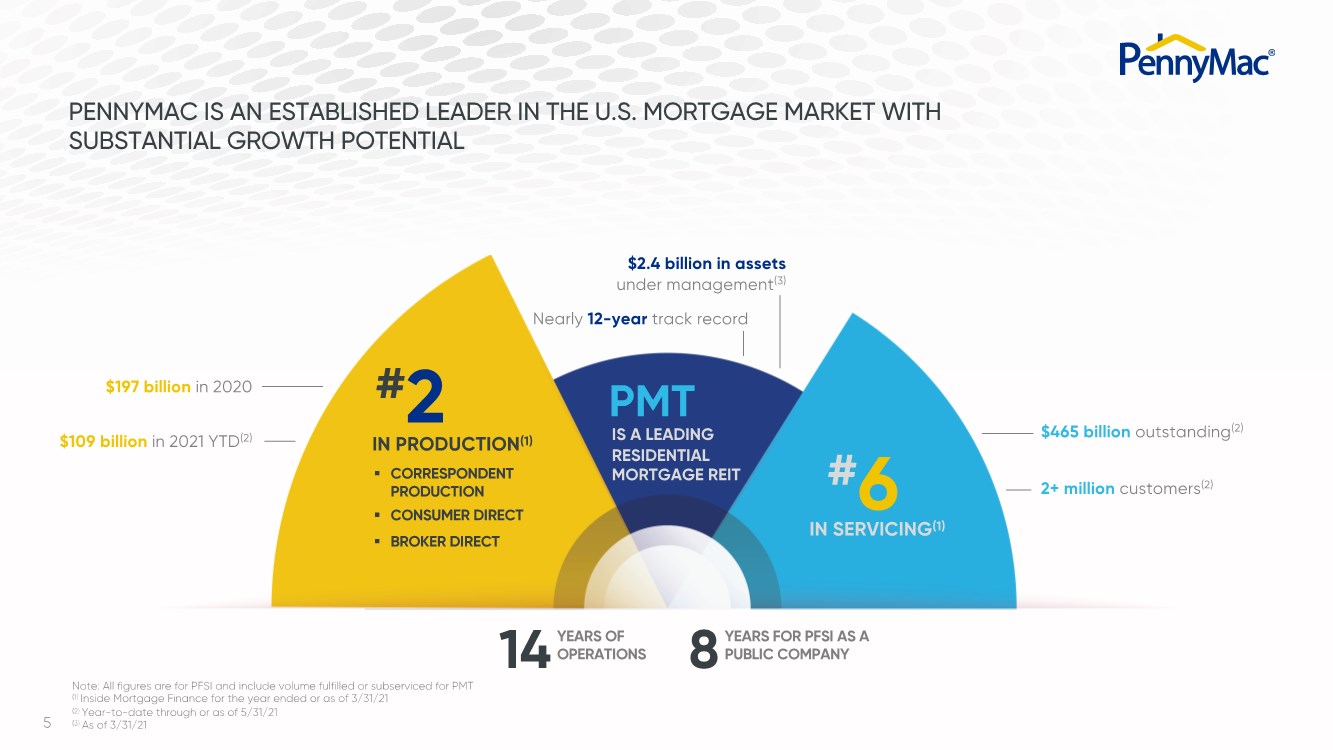
| 5 $197 billion in 2020 $465 billion outstanding(2) IN SERVICING(1) YEARS FOR PFSI AS A PUBLIC COMPANY 8 14 YEARS OF OPERATIONS PMT #2 § CORRESPONDENT PRODUCTION § CONSUMER DIRECT § BROKER DIRECT IN PRODUCTION(1) IS A LEADING RESIDENTIAL MORTGAGE REIT PENNYMAC IS AN ESTABLISHED LEADER IN THE U.S. MORTGAGE MARKET WITH SUBSTANTIAL GROWTH POTENTIAL #6 Note: All figures are for PFSI and include volume fulfilled or subserviced for PMT (1) Inside Mortgage Finance for the year ended or as of 3/31/21 (2) Year-to-date through or as of 5/31/21 (3) As of 3/31/21 $2.4 billion in assets under management(3) Nearly 12-year track record 2+ million customers(2) $109 billion in 2021 YTD(2) |
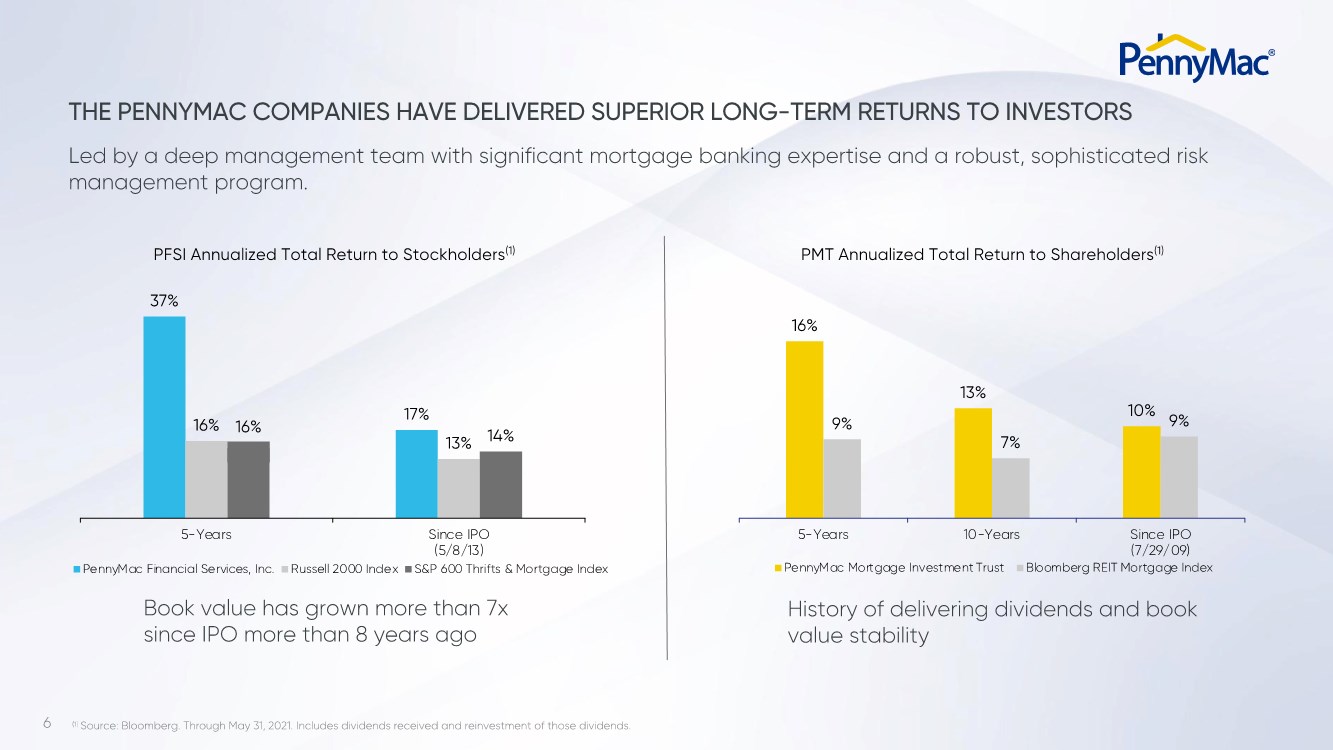
| 6 THE PENNYMAC COMPANIES HAVE DELIVERED SUPERIOR LONG-TERM RETURNS TO INVESTORS Led by a deep management team with significant mortgage banking expertise and a robust, sophisticated risk management program. PFSI Annualized Total Return to Stockholders(1) PMT Annualized Total Return to Shareholders(1) Book value has grown more than 7x since IPO more than 8 years ago History of delivering dividends and book value stability 37% 17% 16% 13% 16% 14% 5-Years Since IPO (5/8/13) PennyMac Financial Services, Inc. Russell 2000 Index S&P 600 Thrifts & Mortgage Index 16% 13% 10% 9% 7% 9% 5-Years 10-Years Since IPO (7/29/09) PennyMac Mortgage Investment Trust Bloomberg REIT Mortgage Index (1) Source: Bloomberg. Through May 31, 2021. Includes dividends received and reinvestment of those dividends. |
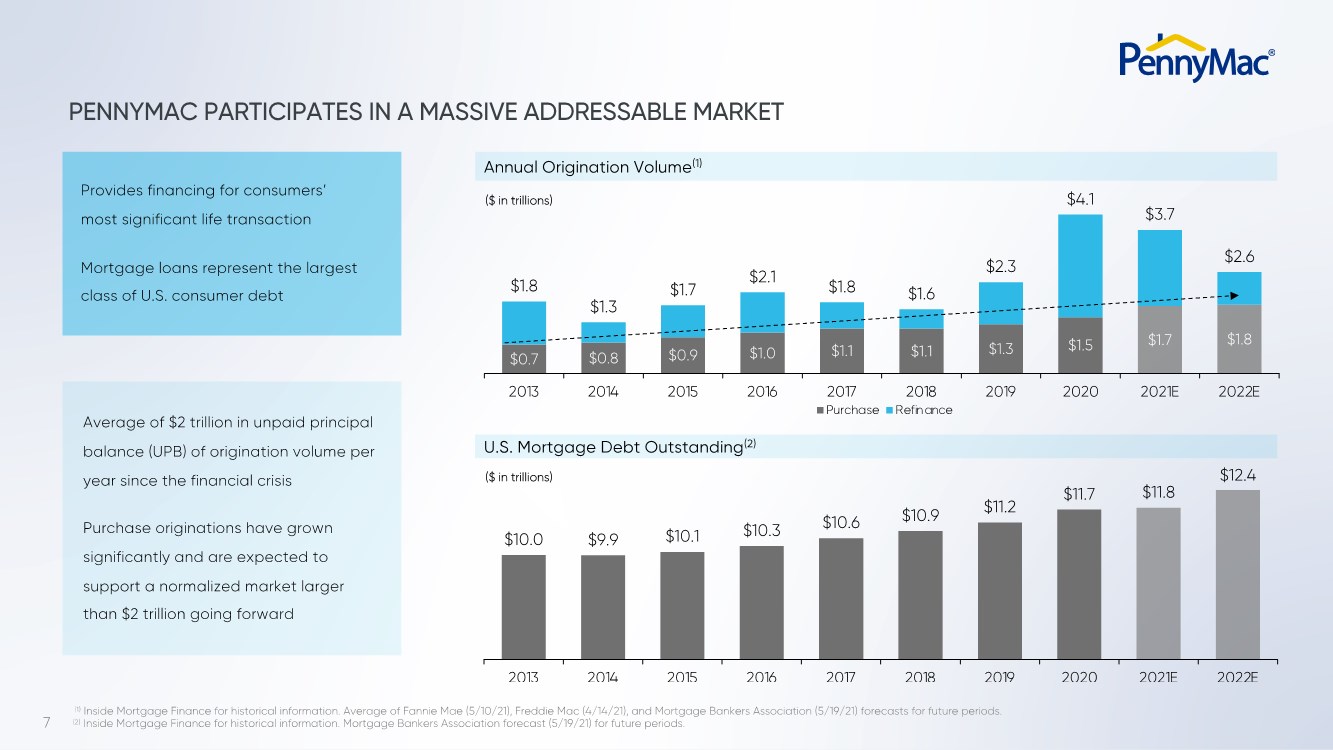
| 7 $0.7 $0.8 $0.9 $1.0 $1.1 $1.1 $1.3 $1.5 $1.7 $1.8 $1.8 $1.3 $1.7 $2.1 $1.8 $1.6 $2.3 $4.1 $3.7 $2.6 2013 2014 2015 2016 2017 2018 2019 2020 2021E 2022E Purchase Refinance $10.0 $9.9 $10.1 $10.3 $10.6 $10.9 $11.2 $11.7 $11.8 $12.4 2013 2014 2015 2016 2017 2018 2019 2020 2021E 2022E U.S. Mortgage Debt Outstanding(2) Annual Origination Volume(1) ($ in trillions) ($ in trillions) (1) Inside Mortgage Finance for historical information. Average of Fannie Mae (5/10/21), Freddie Mac (4/14/21), and Mortgage Bankers Association (5/19/21) forecasts for future periods. (2) Inside Mortgage Finance for historical information. Mortgage Bankers Association forecast (5/19/21) for future periods. Provides financing for consumers’ most significant life transaction Mortgage loans represent the largest class of U.S. consumer debt Average of $2 trillion in unpaid principal balance (UPB) of origination volume per year since the financial crisis Purchase originations have grown significantly and are expected to support a normalized market larger than $2 trillion going forward PENNYMAC PARTICIPATES IN A MASSIVE ADDRESSABLE MARKET |
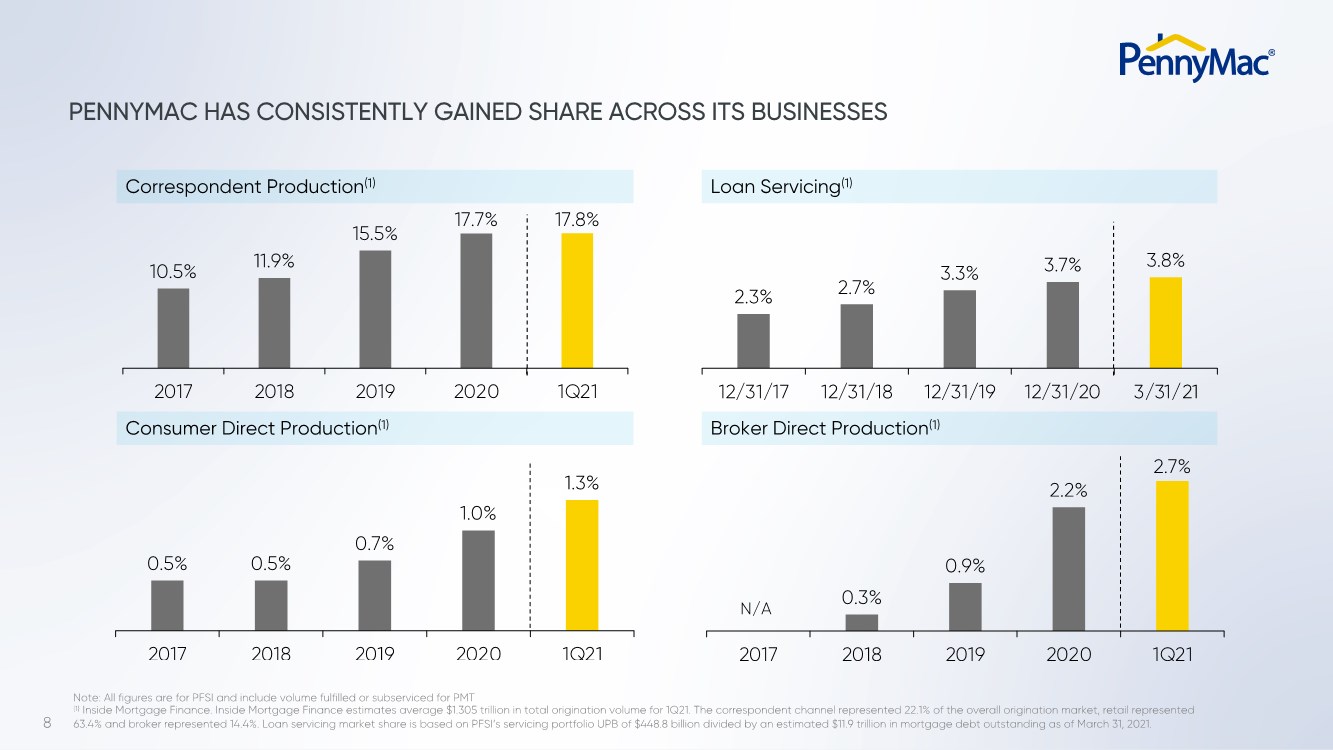
| 8 10.5% 11.9% 15.5% 17.7% 17.8% 2017 2018 2019 2020 1Q21 0.3% 0.9% 2.2% 2.7% 2017 2018 2019 2020 1Q21 PENNYMAC HAS CONSISTENTLY GAINED SHARE ACROSS ITS BUSINESSES Correspondent Production(1) Loan Servicing(1) Consumer Direct Production(1) Broker Direct Production(1) 0.5% 0.5% 0.7% 1.0% 1.3% 2017 2018 2019 2020 1Q21 2.3% 2.7% 3.3% 3.7% 3.8% 12/31/17 12/31/18 12/31/19 12/31/20 3/31/21 N/A Note: All figures are for PFSI and include volume fulfilled or subserviced for PMT (1) Inside Mortgage Finance. Inside Mortgage Finance estimates average $1.305 trillion in total origination volume for 1Q21. The correspondent channel represented 22.1% of the overall origination market, retail represented 63.4% and broker represented 14.4%. Loan servicing market share is based on PFSI’s servicing portfolio UPB of $448.8 billion divided by an estimated $11.9 trillion in mortgage debt outstanding as of March 31, 2021. |
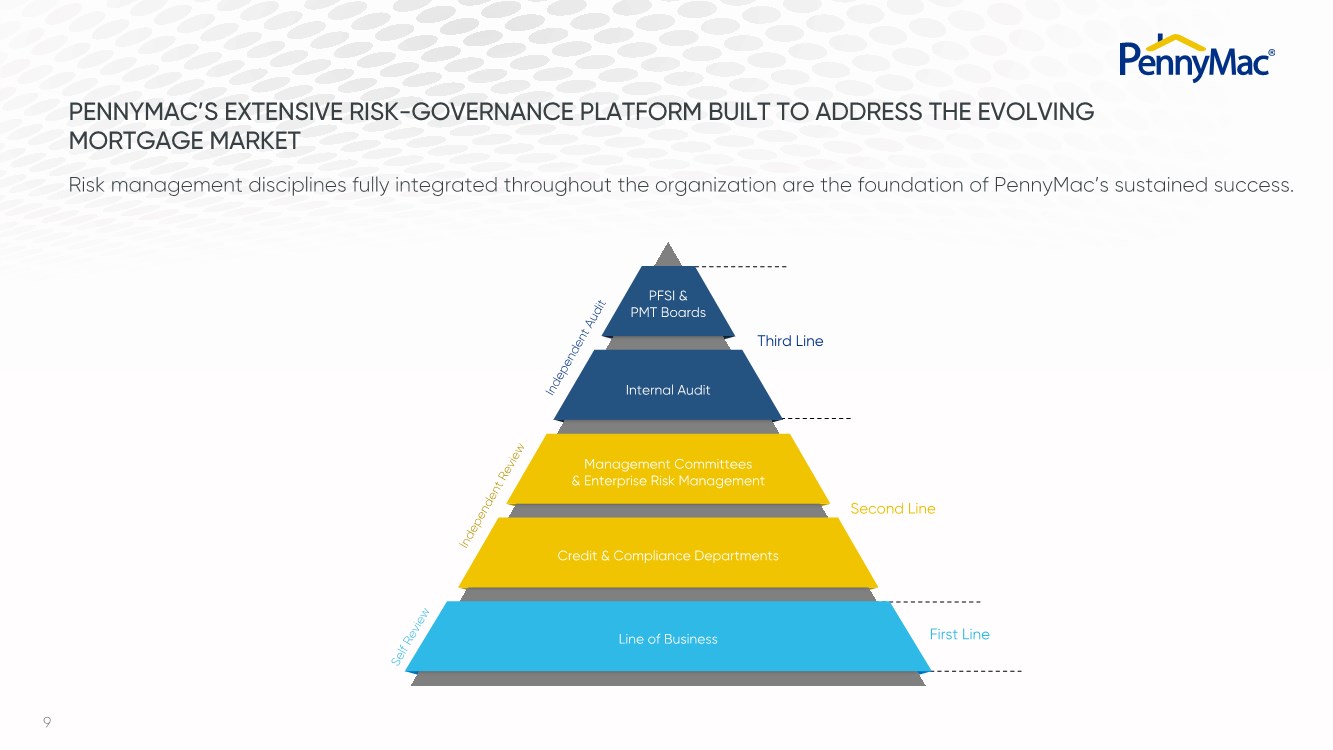
| 9 Second Line First Line Third Line Risk management disciplines fully integrated throughout the organization are the foundation of PennyMac’s sustained success. PENNYMAC’S EXTENSIVE RISK-GOVERNANCE PLATFORM BUILT TO ADDRESS THE EVOLVING MORTGAGE MARKET Internal Audit Management Committees & Enterprise Risk Management Credit & Compliance Departments Line of Business PFSI & PMT Boards Independent Review Self Review Independent Audit |
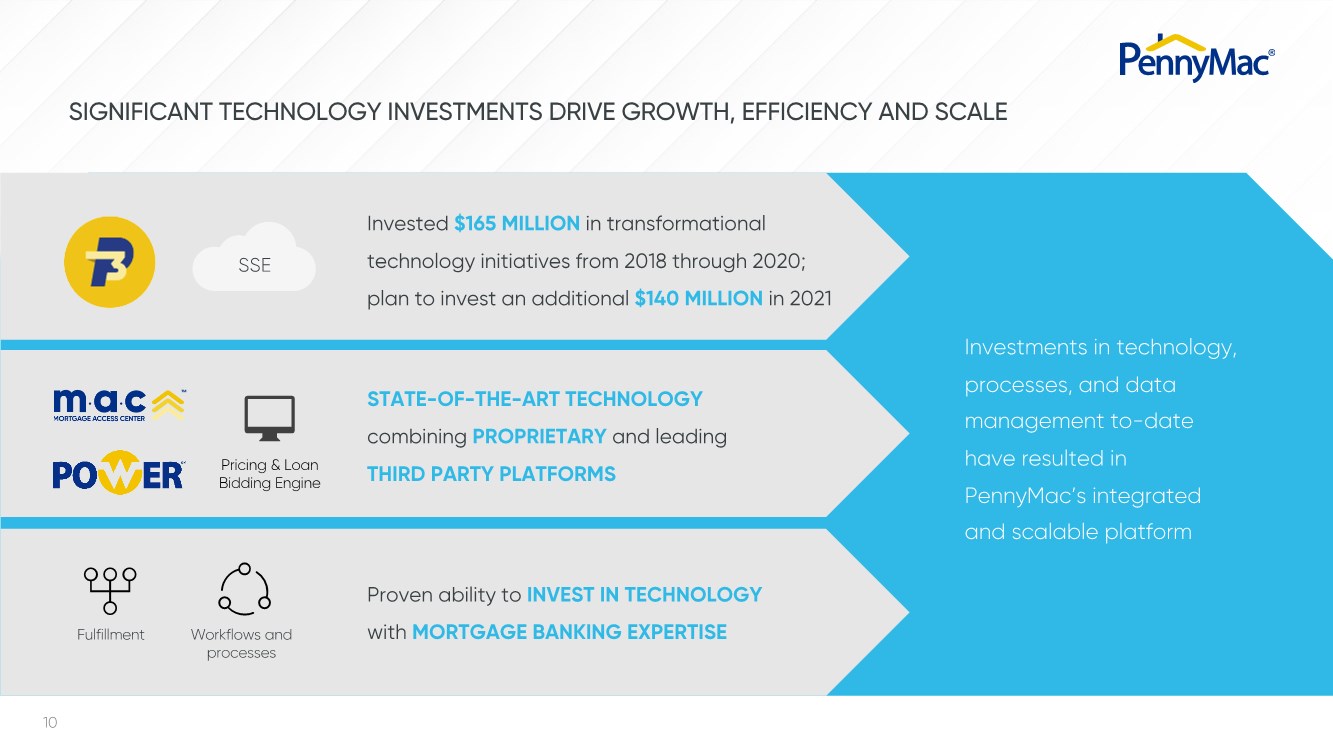
| 10 SIGNIFICANT TECHNOLOGY INVESTMENTS DRIVE GROWTH, EFFICIENCY AND SCALE Investments in technology, processes, and data management to-date have resulted in PennyMac’s integrated and scalable platform Invested $165 MILLION in transformational technology initiatives from 2018 through 2020; plan to invest an additional $140 MILLION in 2021 STATE-OF-THE-ART TECHNOLOGY combining PROPRIETARY and leading THIRD PARTY PLATFORMS Proven ability to INVEST IN TECHNOLOGY with MORTGAGE BANKING EXPERTISE Pricing & Loan Bidding Engine Workflows and processes Fulfillment SSE |
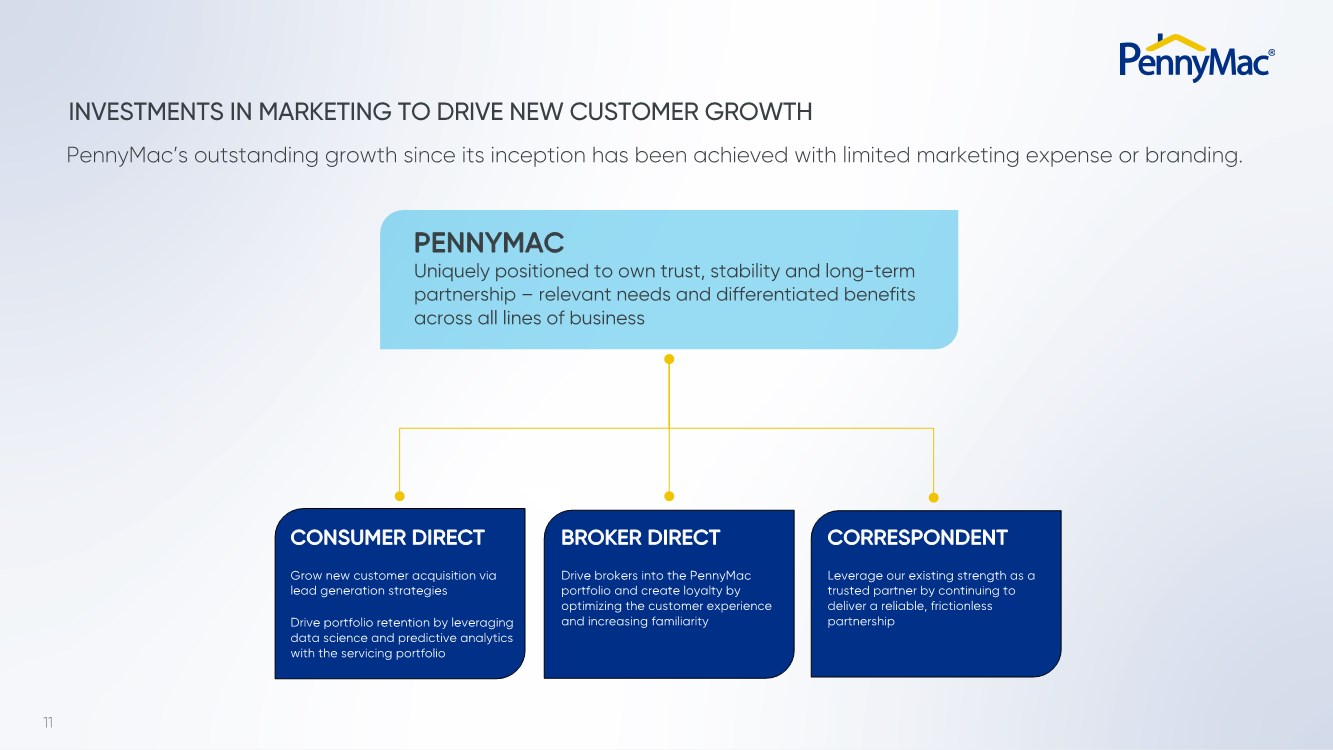
| 11 INVESTMENTS IN MARKETING TO DRIVE NEW CUSTOMER GROWTH PennyMac’s outstanding growth since its inception has been achieved with limited marketing expense or branding. CONSUMER DIRECT Grow new customer acquisition via lead generation strategies Drive portfolio retention by leveraging data science and predictive analytics with the servicing portfolio CORRESPONDENT Leverage our existing strength as a trusted partner by continuing to deliver a reliable, frictionless partnership BROKER DIRECT Drive brokers into the PennyMac portfolio and create loyalty by optimizing the customer experience and increasing familiarity PENNYMAC Uniquely positioned to own trust, stability and long-term partnership – relevant needs and differentiated benefits across all lines of business |
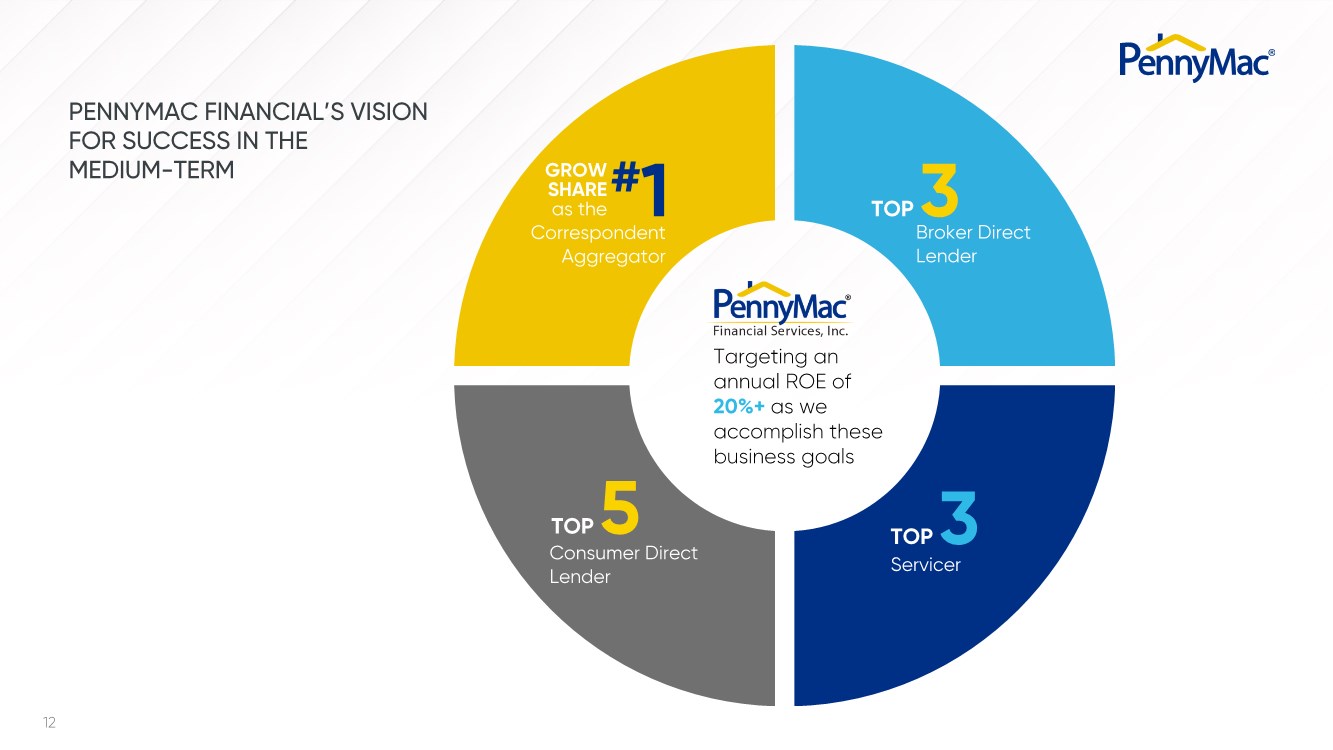
| 12 Targeting an annual ROE of 20%+ as we accomplish these business goals Consumer Direct Lender Broker Direct Lender Servicer TOP 5 TOP 3 TOP 3 PENNYMAC FINANCIAL’S VISION FOR SUCCESS IN THE MEDIUM-TERM Correspondent Aggregator #1 GROW SHARE as the |
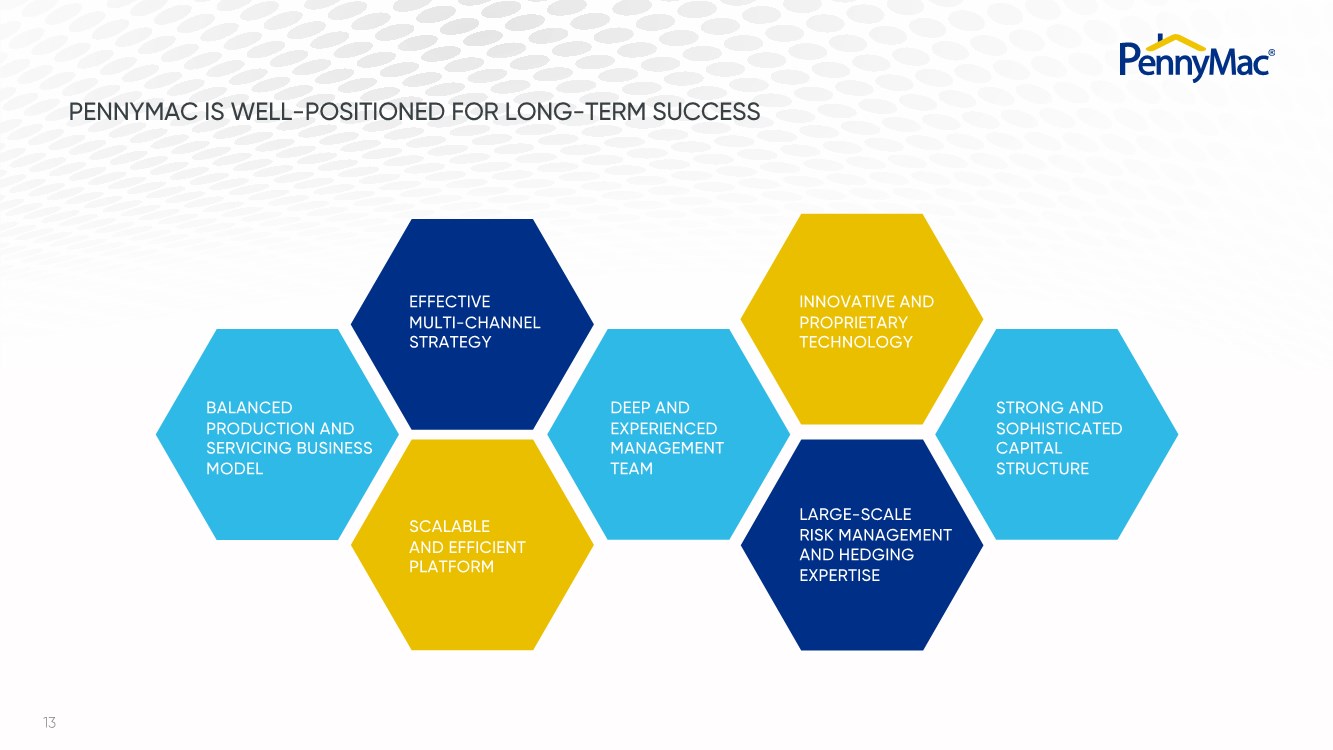
| 13 BALANCED PRODUCTION AND SERVICING BUSINESS MODEL EFFECTIVE MULTI-CHANNEL STRATEGY SCALABLE AND EFFICIENT PLATFORM INNOVATIVE AND PROPRIETARY TECHNOLOGY LARGE-SCALE RISK MANAGEMENT AND HEDGING EXPERTISE STRONG AND SOPHISTICATED CAPITAL STRUCTURE DEEP AND EXPERIENCED MANAGEMENT TEAM PENNYMAC IS WELL-POSITIONED FOR LONG-TERM SUCCESS |
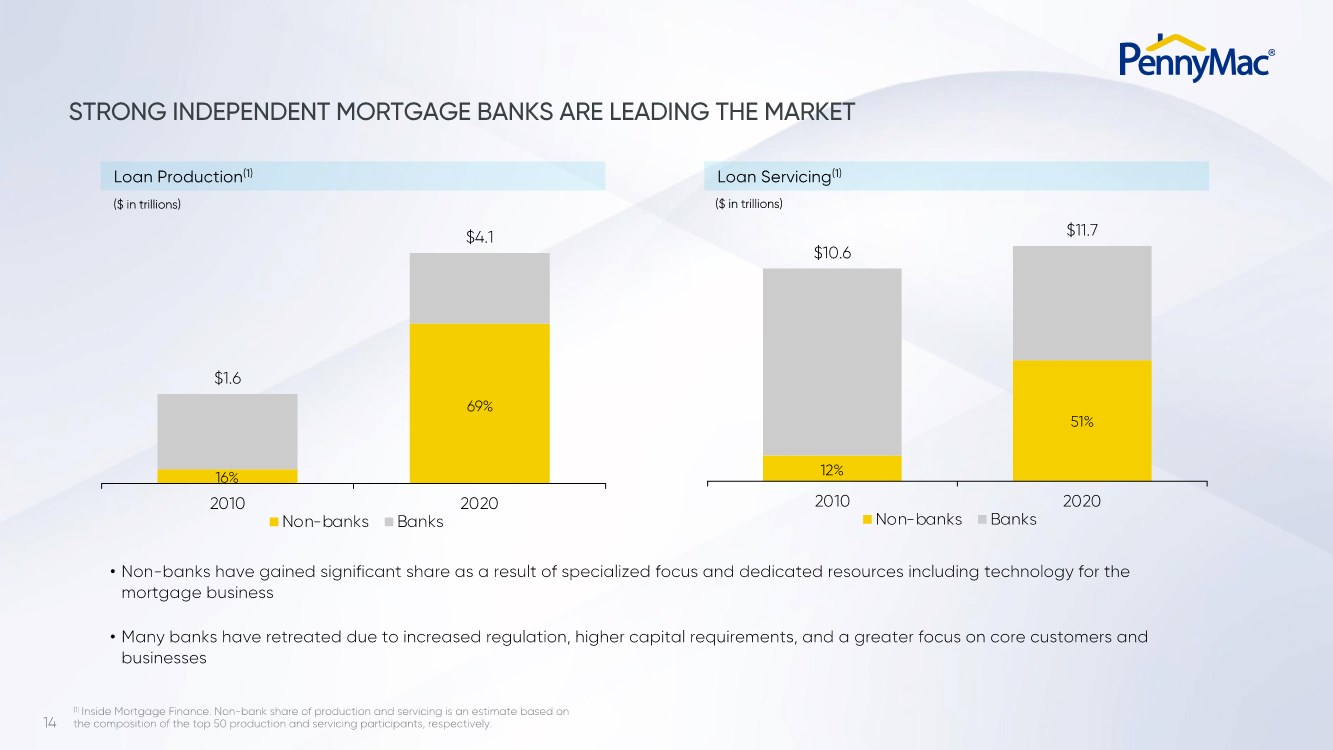
| 14 STRONG INDEPENDENT MORTGAGE BANKS ARE LEADING THE MARKET $10.6 $11.7 2010 2020 Non-banks Banks $1.6 $4.1 2010 2020 Non-banks Banks • Non-banks have gained significant share as a result of specialized focus and dedicated resources including technology for the mortgage business • Many banks have retreated due to increased regulation, higher capital requirements, and a greater focus on core customers and businesses 16% 69% 12% 51% Loan Production(1) ($ in trillions) Loan Servicing(1) ($ in trillions) (1) Inside Mortgage Finance. Non-bank share of production and servicing is an estimate based on the composition of the top 50 production and servicing participants, respectively. |
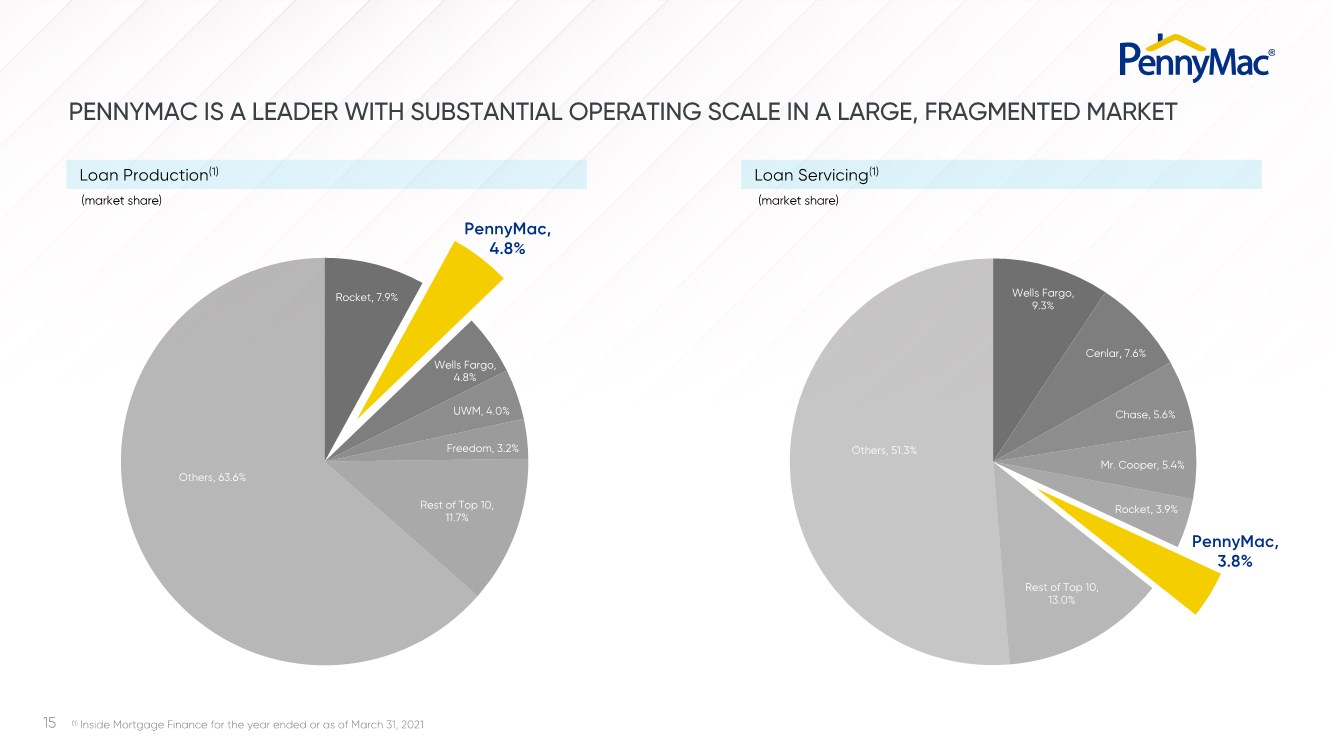
| 15 (market share) (market share) (1) Inside Mortgage Finance for the year ended or as of March 31, 2021 Loan Production(1) Loan Servicing(1) PENNYMAC IS A LEADER WITH SUBSTANTIAL OPERATING SCALE IN A LARGE, FRAGMENTED MARKET Others, 63.6% Wells Fargo, 4.8% PennyMac, 4.8% PennyMac, 3.8% Rocket, 7.9% UWM, 4.0% Freedom, 3.2% Rest of Top 10, 11.7% Others, 51.3% Wells Fargo, 9.3% Rocket, 3.9% Cenlar, 7.6% Chase, 5.6% Rest of Top 10, 13.0% Mr. Cooper, 5.4% |
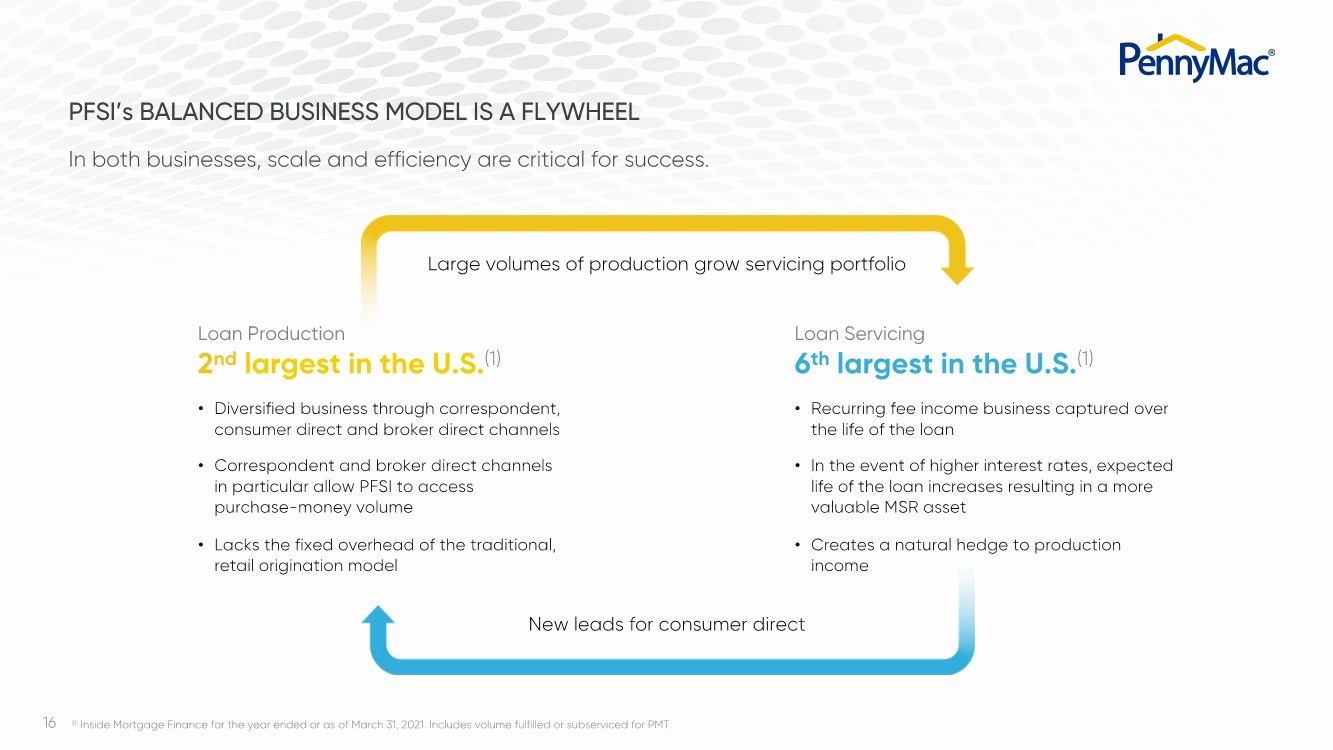
| 16 PFSI’s BALANCED BUSINESS MODEL IS A FLYWHEEL In both businesses, scale and efficiency are critical for success. • Diversified business through correspondent, consumer direct and broker direct channels • Correspondent and broker direct channels in particular allow PFSI to access purchase-money volume • Lacks the fixed overhead of the traditional, retail origination model • Recurring fee income business captured over the life of the loan • In the event of higher interest rates, expected life of the loan increases resulting in a more valuable MSR asset • Creates a natural hedge to production income New leads for consumer direct Large volumes of production grow servicing portfolio Loan Production 2nd largest in the U.S.(1) Loan Servicing 6th largest in the U.S.(1) (1) Inside Mortgage Finance for the year ended or as of March 31, 2021. Includes volume fulfilled or subserviced for PMT. |
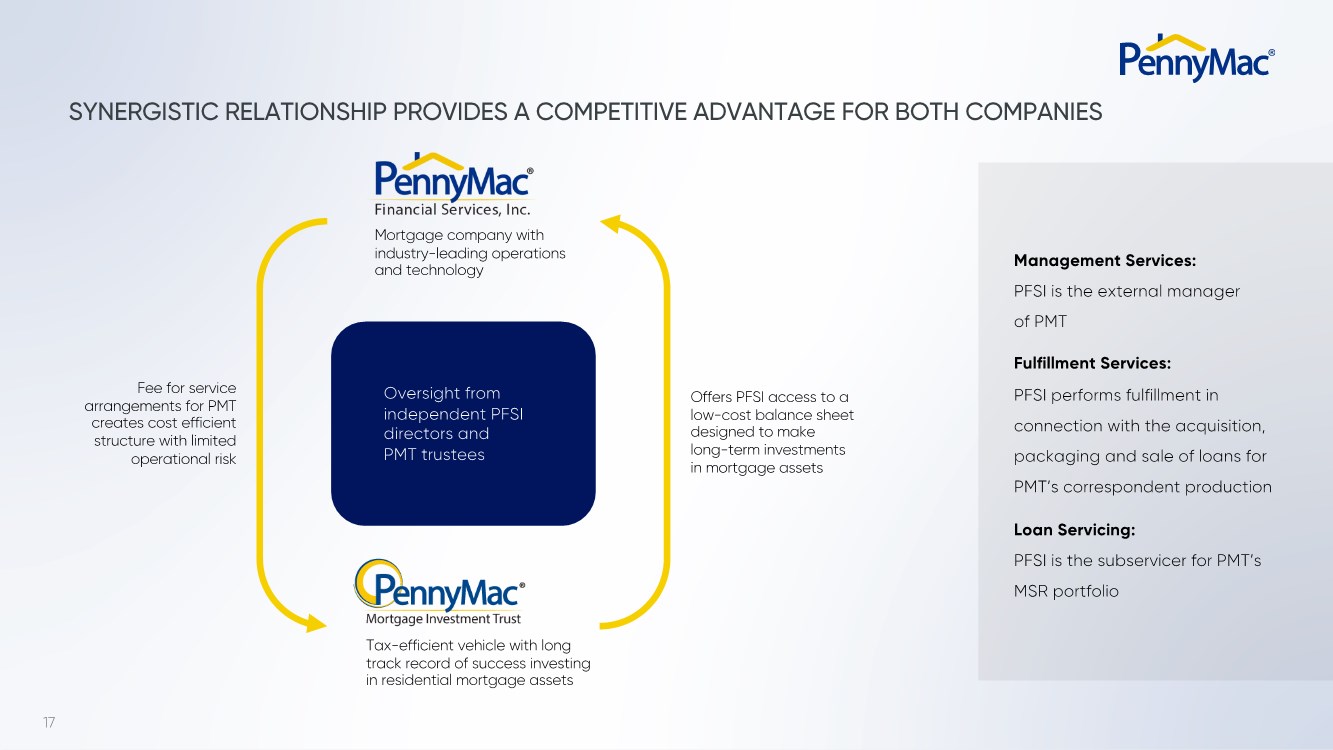
| 17 SYNERGISTIC RELATIONSHIP PROVIDES A COMPETITIVE ADVANTAGE FOR BOTH COMPANIES Oversight from independent PFSI directors and PMT trustees Mortgage company with industry-leading operations and technology Tax-efficient vehicle with long track record of success investing in residential mortgage assets Fee for service arrangements for PMT creates cost efficient structure with limited operational risk Management Services: PFSI is the external manager of PMT Fulfillment Services: PFSI performs fulfillment in connection with the acquisition, packaging and sale of loans for PMT’s correspondent production Loan Servicing: PFSI is the subservicer for PMT’s MSR portfolio Offers PFSI access to a low-cost balance sheet designed to make long-term investments in mortgage assets |
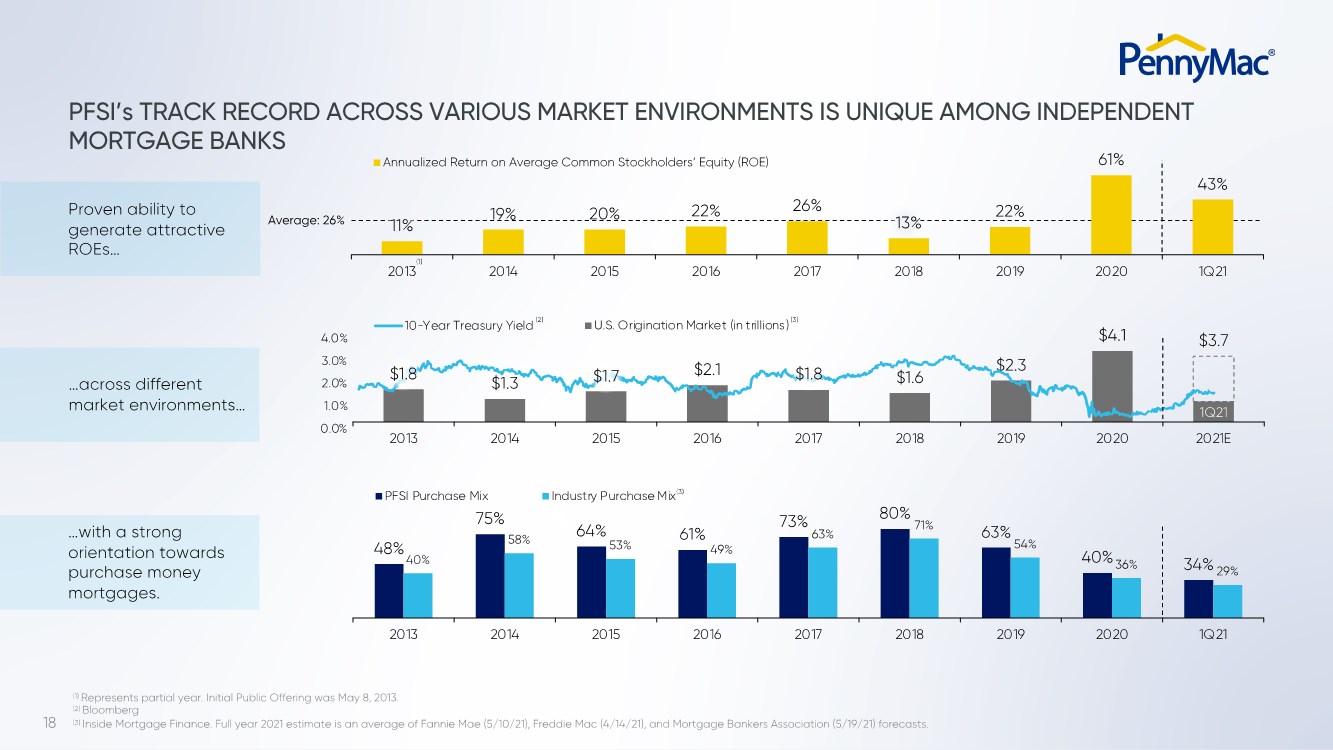
| 18 $1.3 $2.1 $1.6 $2.3 $4.1 $3.7 2013 2014 2015 2016 2017 2018 2019 2020 2021E U.S. Origination Market (in trillions) 0.0% 1.0% 2.0% 3.0% 4.0% 10-Year Treasury Yield 48% 75% 64% 61% 73% 80% 63% 40% 34% 40% 58% 53% 49% 63% 71% 54% 36% 29% 2013 2014 2015 2016 2017 2018 2019 2020 1Q21 PFSI Purchase Mix Industry Purchase Mix PFSI’s TRACK RECORD ACROSS VARIOUS MARKET ENVIRONMENTS IS UNIQUE AMONG INDEPENDENT MORTGAGE BANKS 11% 19% 20% 22% 26% 13% 22% 61% 43% 2013 2014 2015 2016 2017 2018 2019 2020 1Q21 Annualized Return on Average Common Stockholders’ Equity (ROE) Average: 26% (1) (3) Proven ability to generate attractive ROEs… …across different market environments… …with a strong orientation towards purchase money mortgages. (1) Represents partial year. Initial Public Offering was May 8, 2013. (2) Bloomberg (3) Inside Mortgage Finance. Full year 2021 estimate is an average of Fannie Mae (5/10/21), Freddie Mac (4/14/21), and Mortgage Bankers Association (5/19/21) forecasts. (2) (3) $1.8 $1.7 $1.8 1Q21 |
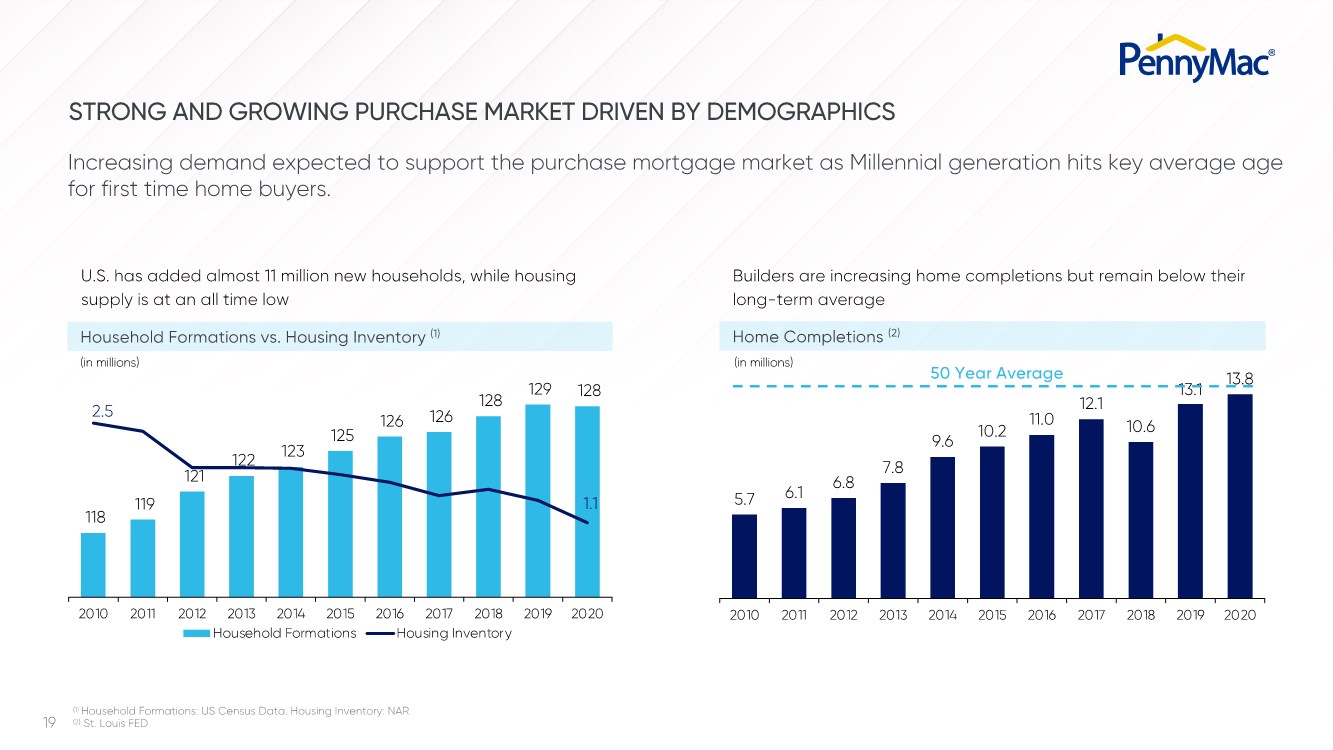
| 19 5.7 6.1 6.8 7.8 9.6 10.2 11.0 12.1 10.6 13.1 13.8 2010 2011 2012 2013 2014 2015 2016 2017 2018 2019 2020 Increasing demand expected to support the purchase mortgage market as Millennial generation hits key average age for first time home buyers. STRONG AND GROWING PURCHASE MARKET DRIVEN BY DEMOGRAPHICS 50 Year Average Builders are increasing home completions but remain below their long-term average U.S. has added almost 11 million new households, while housing supply is at an all time low 118 119 121 122 123 125 126 126 128 129 128 2.5 1.1 112 114 116 118 120 122 124 126 128 130 - 0.5 1.0 1.5 2.0 2.5 3.0 2010 2011 2012 2013 2014 2015 2016 2017 2018 2019 2020 Household Formations Housing Inventory (in millions) (in millions) (1) Household Formations: US Census Data. Housing Inventory: NAR (2) St. Louis FED Household Formations vs. Housing Inventory (1) Home Completions (2) |
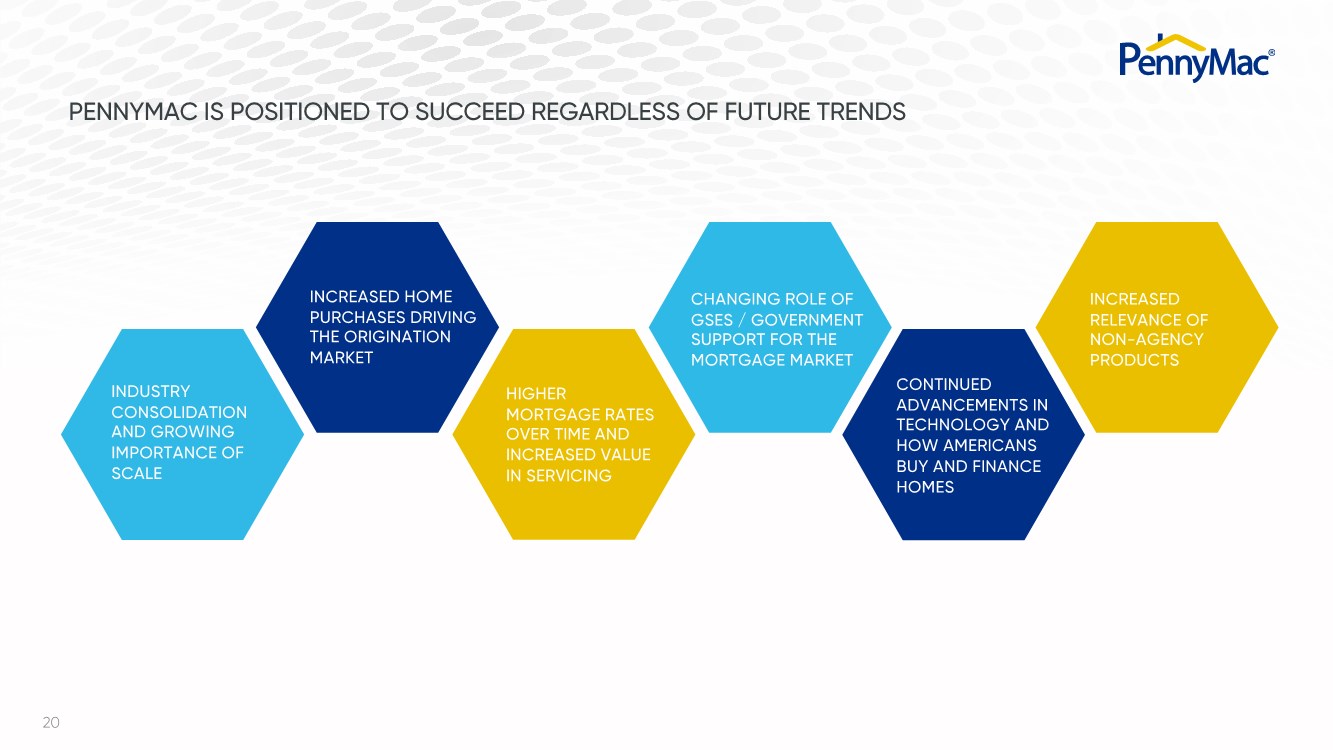
| 20 PENNYMAC IS POSITIONED TO SUCCEED REGARDLESS OF FUTURE TRENDS INDUSTRY CONSOLIDATION AND GROWING IMPORTANCE OF SCALE INCREASED HOME PURCHASES DRIVING THE ORIGINATION MARKET HIGHER MORTGAGE RATES OVER TIME AND INCREASED VALUE IN SERVICING INCREASED RELEVANCE OF NON-AGENCY PRODUCTS CONTINUED ADVANCEMENTS IN TECHNOLOGY AND HOW AMERICANS BUY AND FINANCE HOMES CHANGING ROLE OF GSES / GOVERNMENT SUPPORT FOR THE MORTGAGE MARKET |
| MORTGAGE BANKING OVERVIEW DOUG JONES President and Chief Mortgage Banking Officer |

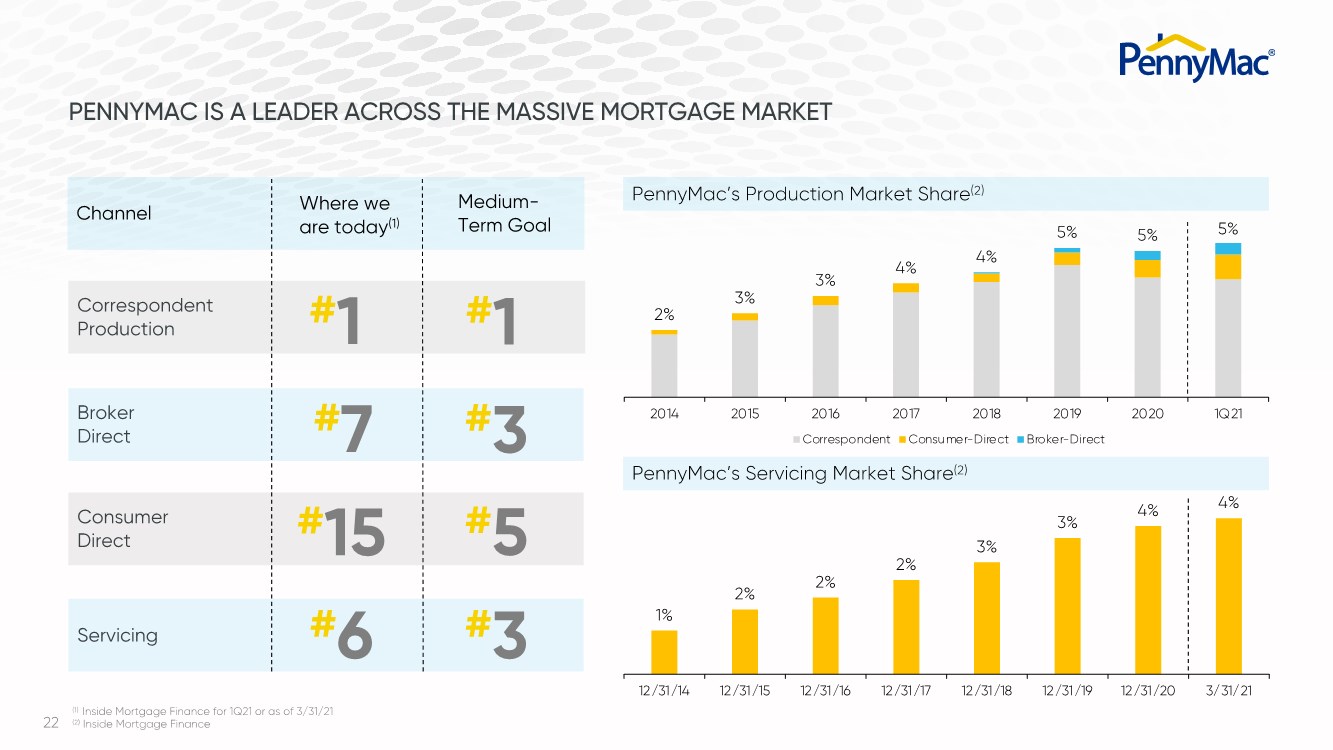
| 22 1% 2% 2% 2% 3% 3% 4% 4% 12/31/14 12/31/15 12/31/16 12/31/17 12/31/18 12/31/19 12/31/20 3/31/21 2% 3% 3% 4% 4% 5% 5% 5% 2014 2015 2016 2017 2018 2019 2020 1Q21 Correspondent Consumer-Direct Broker-Direct PENNYMAC IS A LEADER ACROSS THE MASSIVE MORTGAGE MARKET Channel Where we are today(1) Medium- Term Goal Correspondent Production Consumer Direct Broker Direct Servicing #1 #7 #3 #15 #5 #3 #6 (1) Inside Mortgage Finance for 1Q21 or as of 3/31/21 (2) Inside Mortgage Finance PennyMac’s Production Market Share(2) PennyMac’s Servicing Market Share(2) #1 |
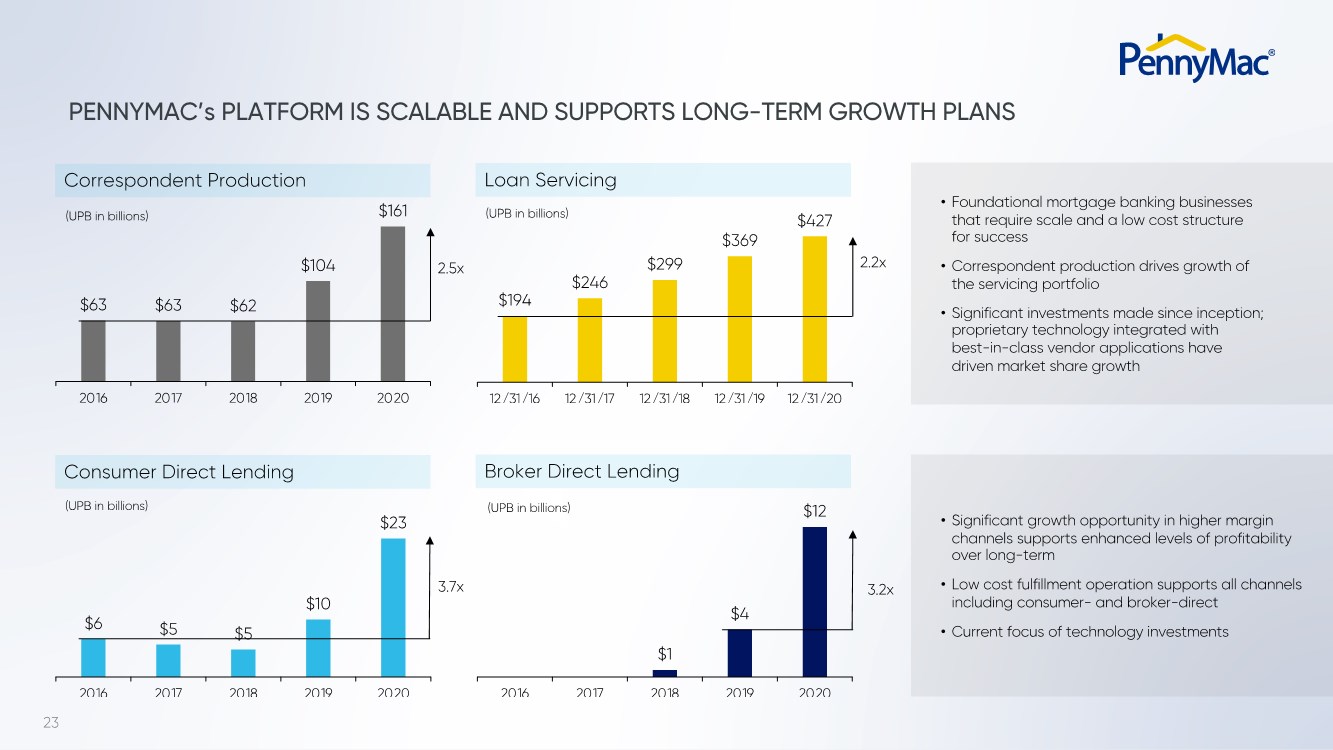
| 23 PENNYMAC’s PLATFORM IS SCALABLE AND SUPPORTS LONG-TERM GROWTH PLANS $1 $4 $12 2016 2017 2018 2019 2020 $63 $63 $62 $104 $161 2016 2017 2018 2019 2020 (UPB in billions) $194 $246 $299 $369 $427 12/31/16 12/31/17 12/31/18 12/31/19 12/31/20 $6 $5 $5 $10 $23 2016 2017 2018 2019 2020 (UPB in billions) (UPB in billions) (UPB in billions) 2.5x 2.2x 3.2x 3.7x • Significant growth opportunity in higher margin channels supports enhanced levels of profitability over long-term • Low cost fulfillment operation supports all channels including consumer- and broker-direct • Current focus of technology investments • Foundational mortgage banking businesses that require scale and a low cost structure for success • Correspondent production drives growth of the servicing portfolio • Significant investments made since inception; proprietary technology integrated with best-in-class vendor applications have driven market share growth Correspondent Production Loan Servicing Consumer Direct Lending Broker Direct Lending |
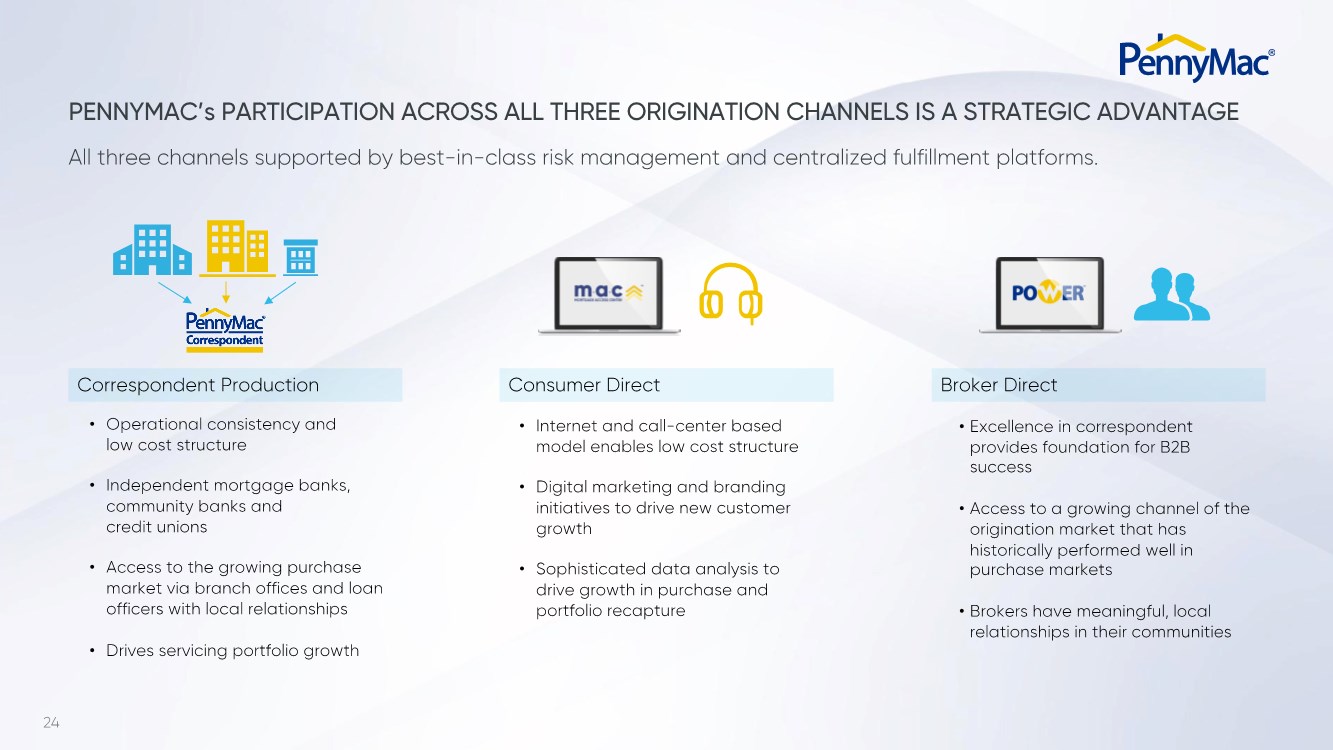
| 24 PENNYMAC’s PARTICIPATION ACROSS ALL THREE ORIGINATION CHANNELS IS A STRATEGIC ADVANTAGE • Operational consistency and low cost structure • Independent mortgage banks, community banks and credit unions • Access to the growing purchase market via branch offices and loan officers with local relationships • Drives servicing portfolio growth • Internet and call-center based model enables low cost structure • Digital marketing and branding initiatives to drive new customer growth • Sophisticated data analysis to drive growth in purchase and portfolio recapture • Excellence in correspondent provides foundation for B2B success • Access to a growing channel of the origination market that has historically performed well in purchase markets • Brokers have meaningful, local relationships in their communities All three channels supported by best-in-class risk management and centralized fulfillment platforms. Correspondent Production Consumer Direct Broker Direct |
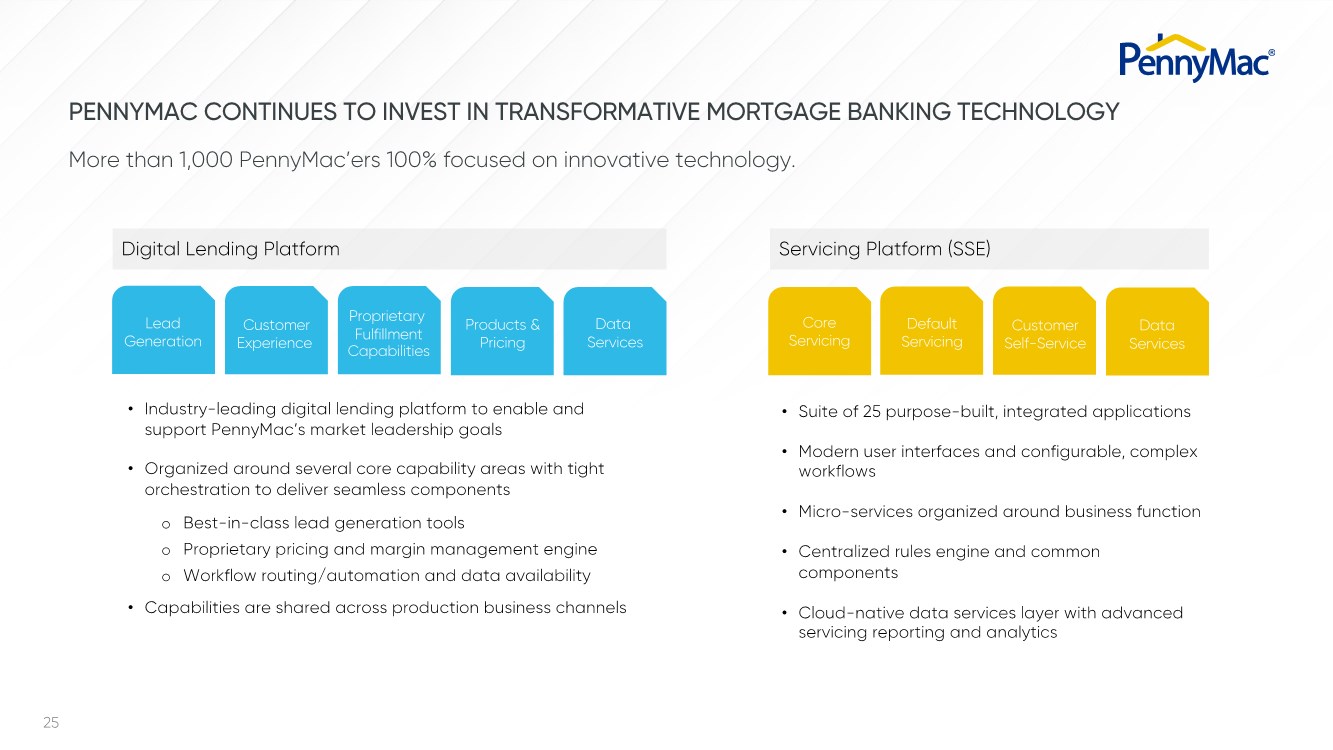
| 25 Proprietary Fulfillment Capabilities Servicing Platform (SSE) Digital Lending Platform PENNYMAC CONTINUES TO INVEST IN TRANSFORMATIVE MORTGAGE BANKING TECHNOLOGY Data Services Customer Self-Service Default Servicing Core Servicing • Suite of 25 purpose-built, integrated applications • Modern user interfaces and configurable, complex workflows • Micro-services organized around business function • Centralized rules engine and common components • Cloud-native data services layer with advanced servicing reporting and analytics Lead Generation Customer Experience Products & Pricing Data Services • Industry-leading digital lending platform to enable and support PennyMac’s market leadership goals • Organized around several core capability areas with tight orchestration to deliver seamless components o Best-in-class lead generation tools o Proprietary pricing and margin management engine o Workflow routing/automation and data availability • Capabilities are shared across production business channels More than 1,000 PennyMac’ers 100% focused on innovative technology. |
| CONSUMER DIRECT LENDING SCOTT BRIDGES Managing Director Consumer Direct Lending |

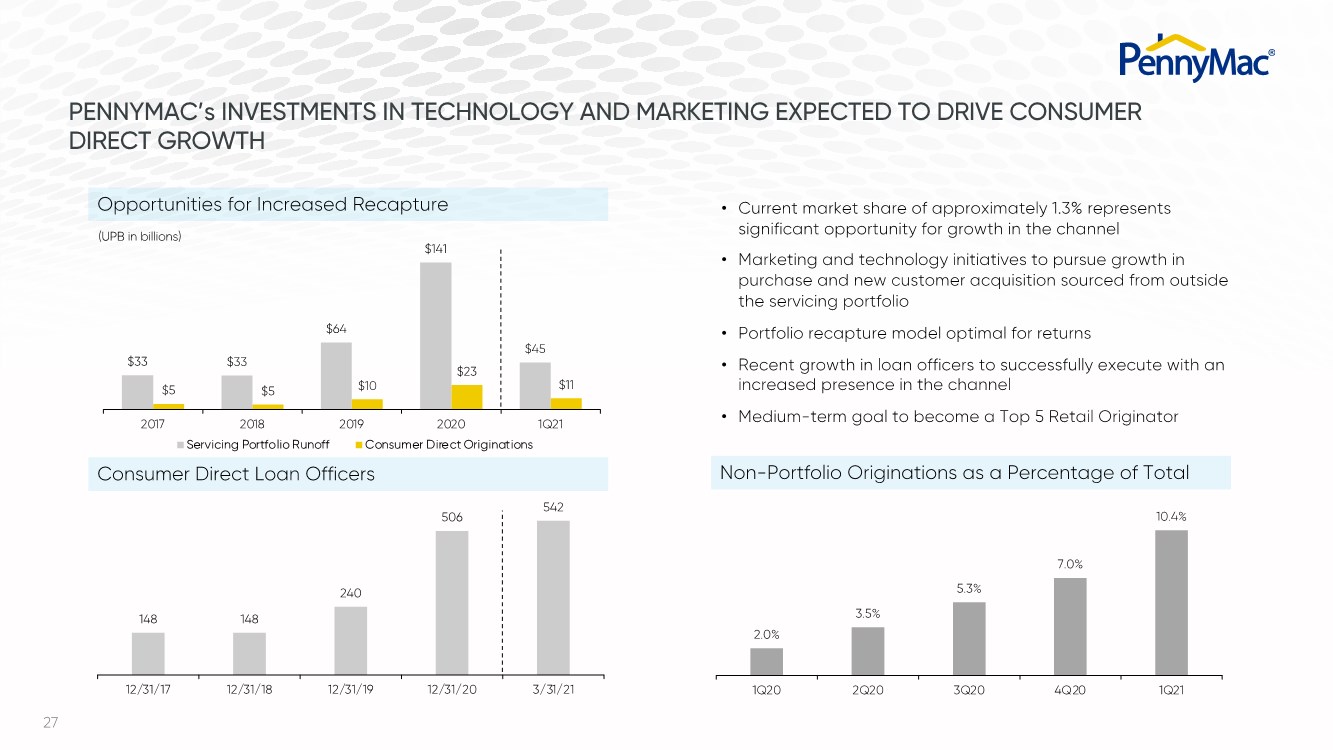
| 27 $33 $33 $64 $141 $45 $5 $5 $10 $23 $11 2017 2018 2019 2020 1Q21 Servicing Portfolio Runoff Consumer Direct Originations • Current market share of approximately 1.3% represents significant opportunity for growth in the channel • Marketing and technology initiatives to pursue growth in purchase and new customer acquisition sourced from outside the servicing portfolio • Portfolio recapture model optimal for returns • Recent growth in loan officers to successfully execute with an increased presence in the channel • Medium-term goal to become a Top 5 Retail Originator 148 148 240 506 542 12/31/17 12/31/18 12/31/19 12/31/20 3/31/21 2.0% 3.5% 5.3% 7.0% 10.4% 1Q20 2Q20 3Q20 4Q20 1Q21 Consumer Direct Loan Officers PENNYMAC’s INVESTMENTS IN TECHNOLOGY AND MARKETING EXPECTED TO DRIVE CONSUMER DIRECT GROWTH Non-Portfolio Originations as a Percentage of Total (UPB in billions) Opportunities for Increased Recapture |
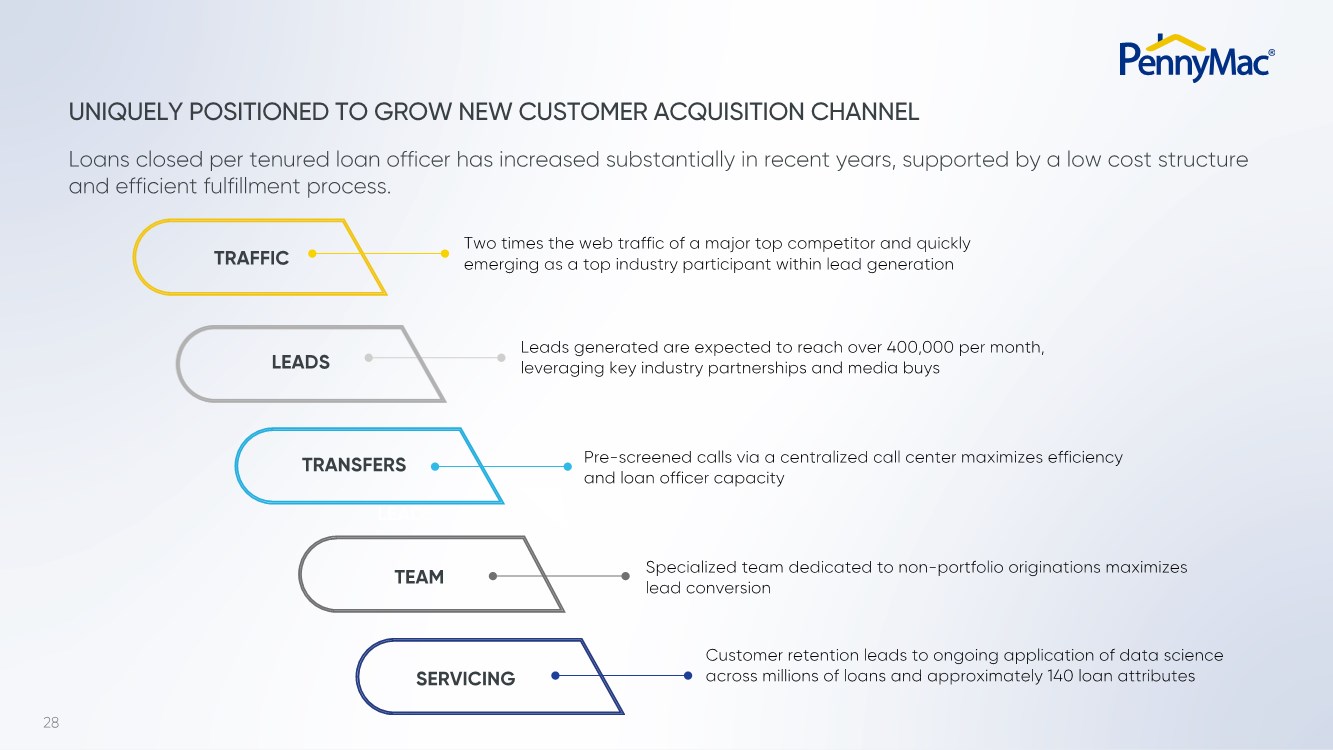
| 28 UNIQUELY POSITIONED TO GROW NEW CUSTOMER ACQUISITION CHANNEL Pre-screened calls via a centralized call center maximizes efficiency and loan officer capacity Specialized team dedicated to non-portfolio originations maximizes lead conversion Customer retention leads to ongoing application of data science across millions of loans and approximately 140 loan attributes TRAFFIC LEADS Two times the web traffic of a major top competitor and quickly emerging as a top industry participant within lead generation Leads generated are expected to reach over 400,000 per month, leveraging key industry partnerships and media buys Loans closed per tenured loan officer has increased substantially in recent years, supported by a low cost structure and efficient fulfillment process. SERVICING LEADS TRANSFERS TEAM |
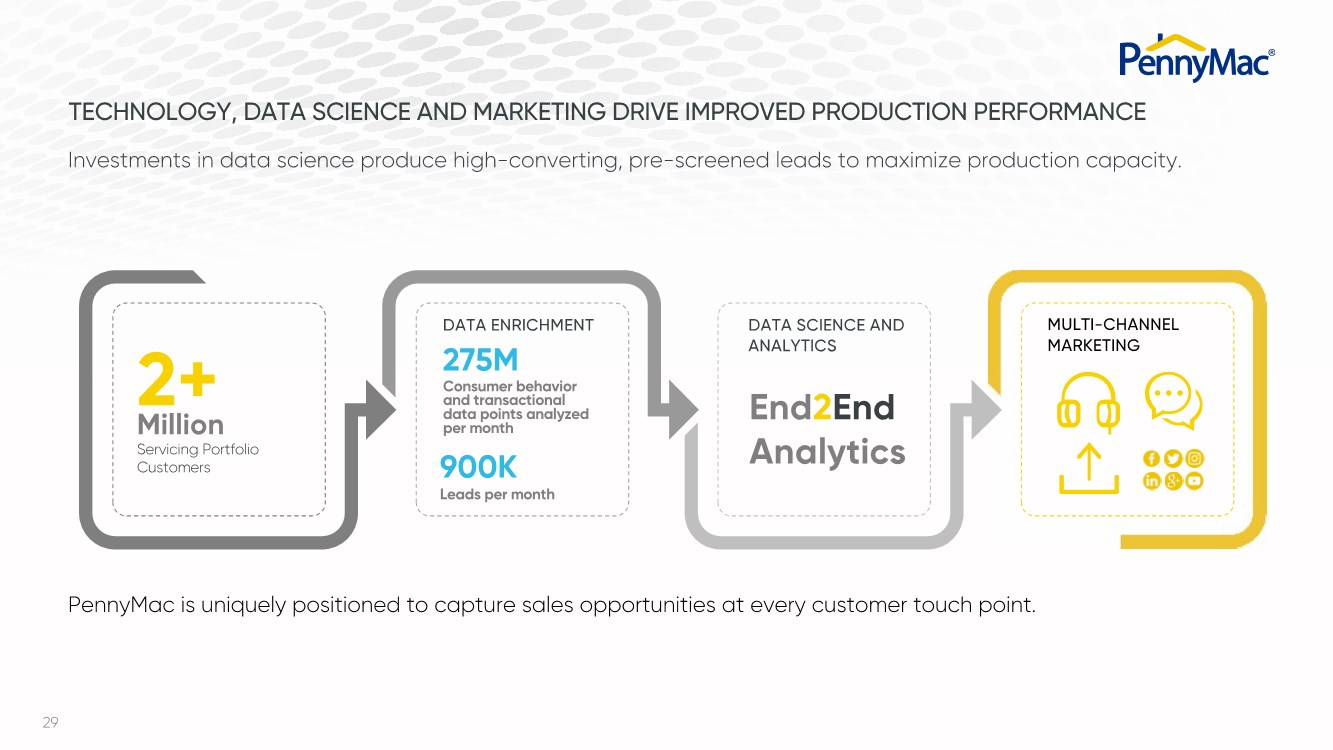
| 29 TECHNOLOGY, DATA SCIENCE AND MARKETING DRIVE IMPROVED PRODUCTION PERFORMANCE Servicing Portfolio Customers 275M DATA ENRICHMENT 900K DATA SCIENCE AND ANALYTICS End2End Analytics MULTI-CHANNEL MARKETING PennyMac is uniquely positioned to capture sales opportunities at every customer touch point. Investments in data science produce high-converting, pre-screened leads to maximize production capacity. 2+ Million Consumer behavior and transactional data points analyzed per month Leads per month |
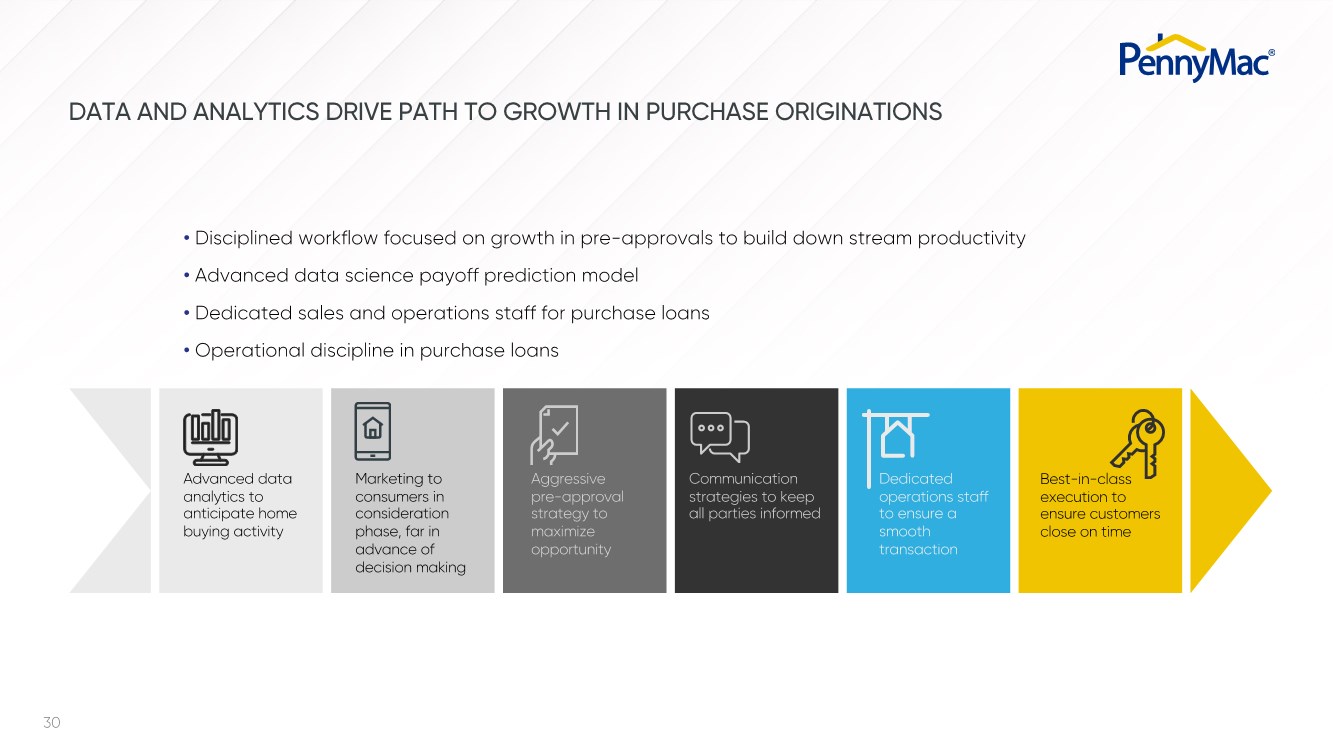
| 30 DATA AND ANALYTICS DRIVE PATH TO GROWTH IN PURCHASE ORIGINATIONS Advanced data analytics to anticipate home buying activity Marketing to consumers in consideration phase, far in advance of decision making Aggressive pre-approval strategy to maximize opportunity Communication strategies to keep all parties informed Dedicated operations staff to ensure a smooth transaction Best-in-class execution to ensure customers close on time • Disciplined workflow focused on growth in pre-approvals to build down stream productivity • Advanced data science payoff prediction model • Dedicated sales and operations staff for purchase loans • Operational discipline in purchase loans |
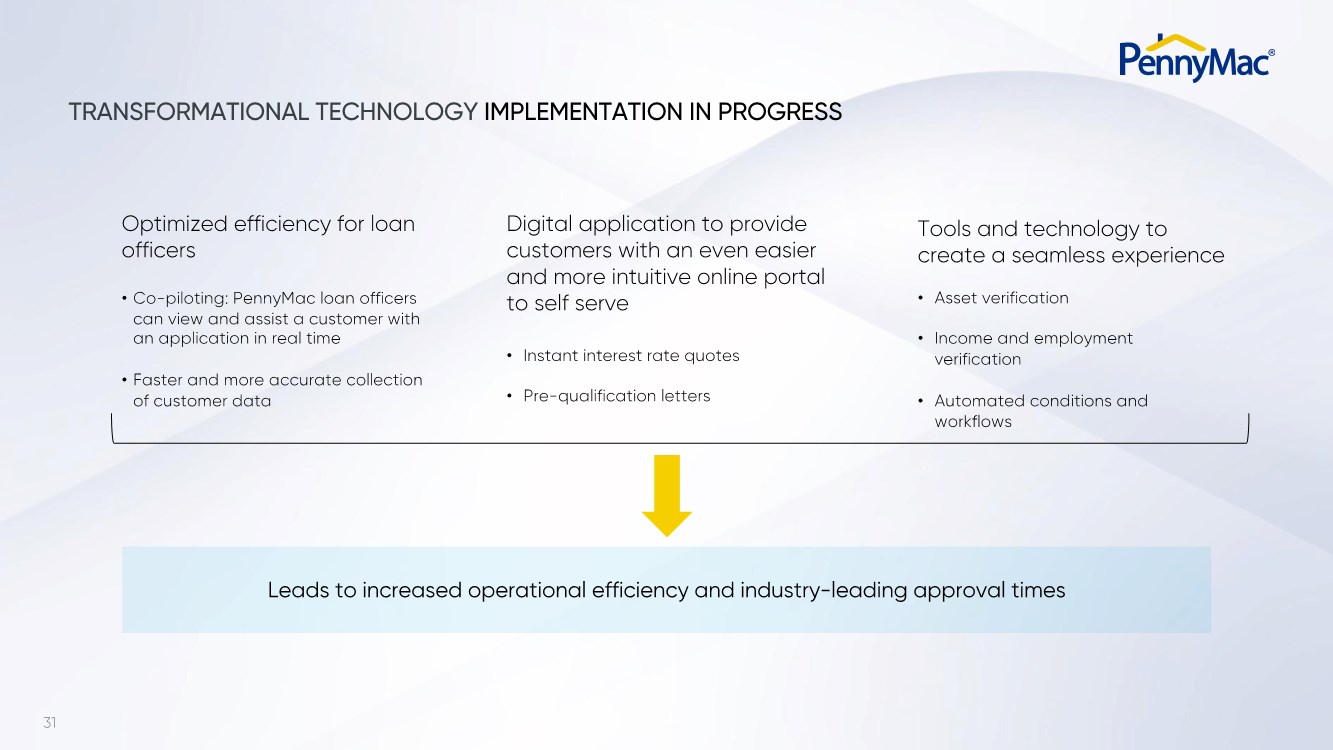
| 31 Leads to increased operational efficiency and industry-leading approval times TRANSFORMATIONAL TECHNOLOGY IMPLEMENTATION IN PROGRESS • Co-piloting: PennyMac loan officers can view and assist a customer with an application in real time • Faster and more accurate collection of customer data Optimized efficiency for loan officers • Instant interest rate quotes • Pre-qualification letters Digital application to provide customers with an even easier and more intuitive online portal to self serve • Asset verification • Income and employment verification • Automated conditions and workflows Tools and technology to create a seamless experience |
| 32 PATH TO BECOMING A TOP 5 RETAIL ORIGINATOR CONTINUE IMPLEMENTATION OF TECHNOLOGY SUPPORTED BY ROBUST DATA ANALYTICS FOCUS ON ENHANCING THE CUSTOMER EXPERIENCE EXECUTE BRAND STRATEGIES FOR RECAPTURE GROWTH BUILD A BEST-IN-CLASS MARKETING PLATFORM |

| BROKER DIRECT LENDING KIM NICHOLS Senior Managing Director Broker Direct Lending |

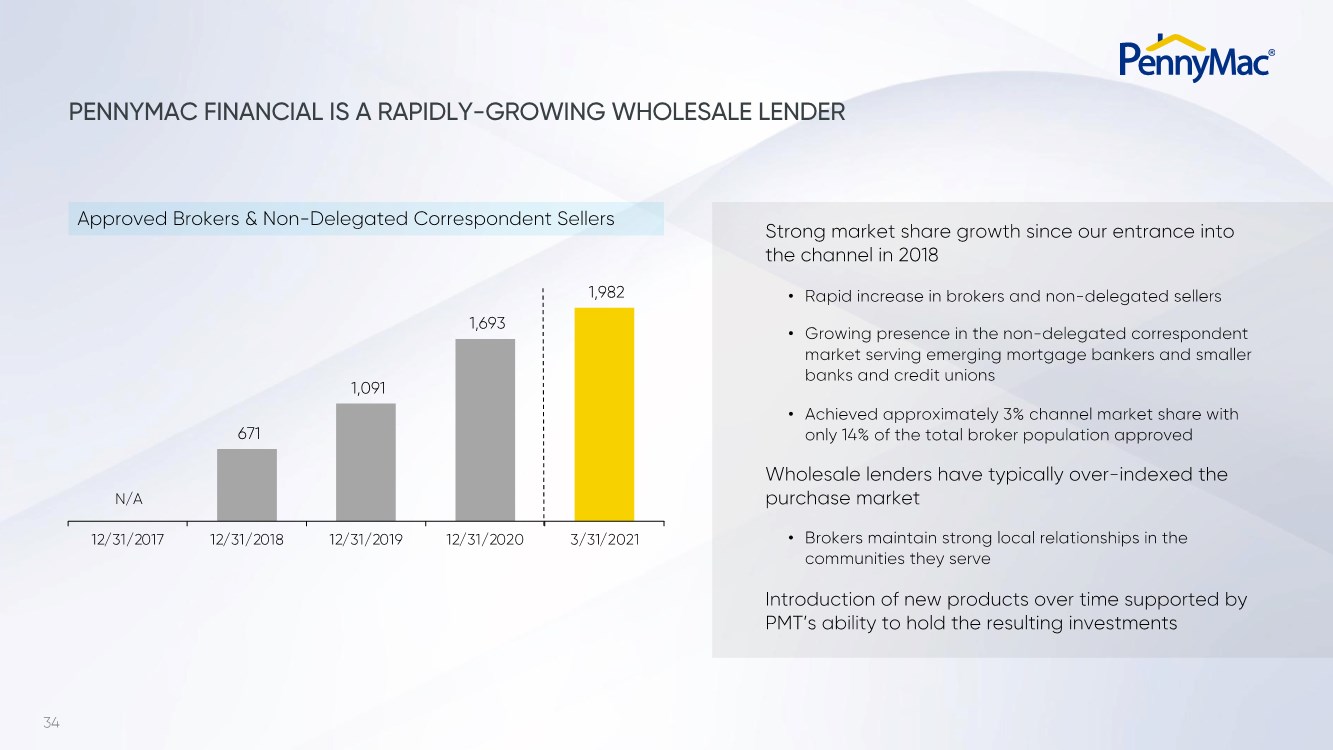
| 34 PENNYMAC FINANCIAL IS A RAPIDLY-GROWING WHOLESALE LENDER 671 1,091 1,693 1,982 12/31/2017 12/31/2018 12/31/2019 12/31/2020 3/31/2021 N/A Strong market share growth since our entrance into the channel in 2018 • Rapid increase in brokers and non-delegated sellers • Growing presence in the non-delegated correspondent market serving emerging mortgage bankers and smaller banks and credit unions • Achieved approximately 3% channel market share with only 14% of the total broker population approved Wholesale lenders have typically over-indexed the purchase market • Brokers maintain strong local relationships in the communities they serve Introduction of new products over time supported by PMT’s ability to hold the resulting investments Approved Brokers & Non-Delegated Correspondent Sellers |
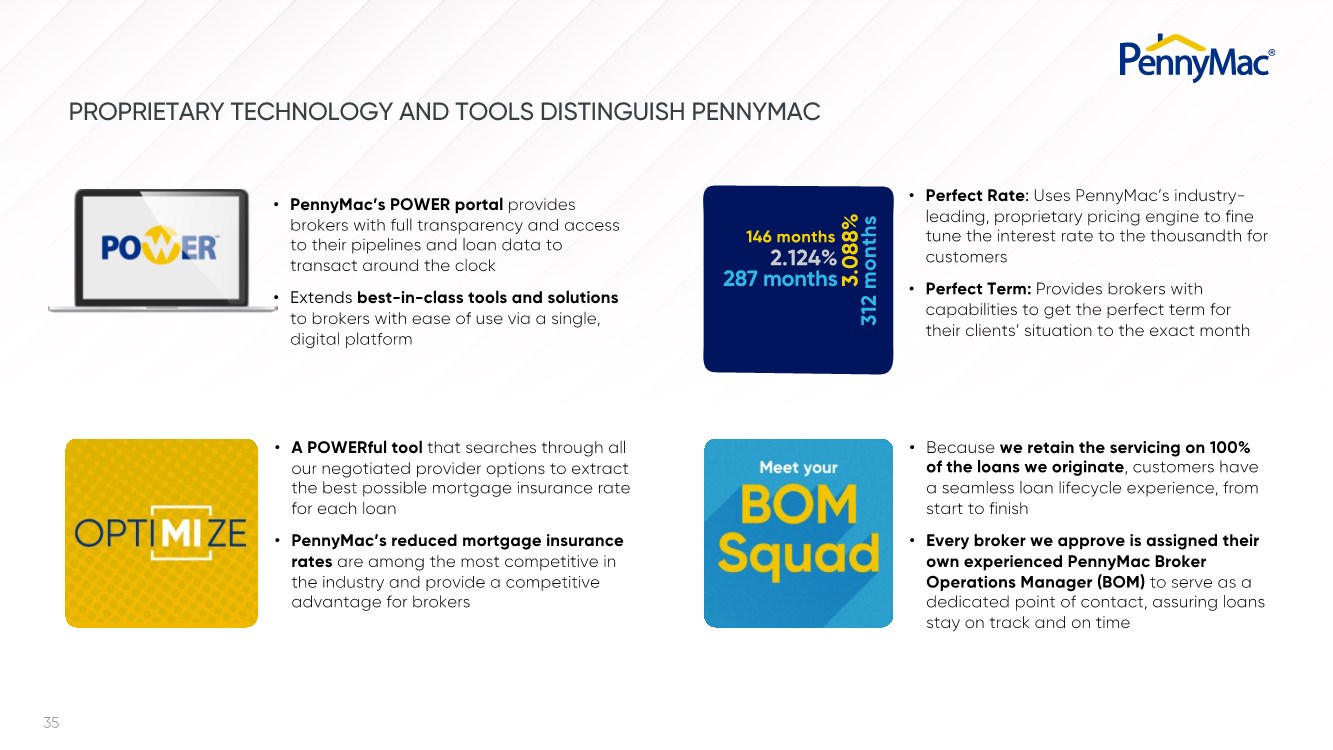
| 35 PROPRIETARY TECHNOLOGY AND TOOLS DISTINGUISH PENNYMAC • PennyMac’s POWER portal provides brokers with full transparency and access to their pipelines and loan data to transact around the clock • Extends best-in-class tools and solutions to brokers with ease of use via a single, digital platform • Perfect Rate: Uses PennyMac’s industry- leading, proprietary pricing engine to fine tune the interest rate to the thousandth for customers • Perfect Term: Provides brokers with capabilities to get the perfect term for their clients’ situation to the exact month • A POWERful tool that searches through all our negotiated provider options to extract the best possible mortgage insurance rate for each loan • PennyMac’s reduced mortgage insurance rates are among the most competitive in the industry and provide a competitive advantage for brokers • Because we retain the servicing on 100% of the loans we originate, customers have a seamless loan lifecycle experience, from start to finish • Every broker we approve is assigned their own experienced PennyMac Broker Operations Manager (BOM) to serve as a dedicated point of contact, assuring loans stay on track and on time 312 months 146 months 3.088% 287 months 2.124% |
| 36 TECHNOLOGY AND TOOLS SUPPORTED BY A GREAT TEAM OF ENGAGED PEOPLE Dedicated National Sales Team Who Serve as Trusted Partners Single Point of Operational Contact Trust and Consistency of Execution Culture of Partnership and Customer Focus Brokers Technology Trust Relationships As much as brokers need scale and automated technology to grow their businesses, they depend on the relationships they have built and the people they trust. |

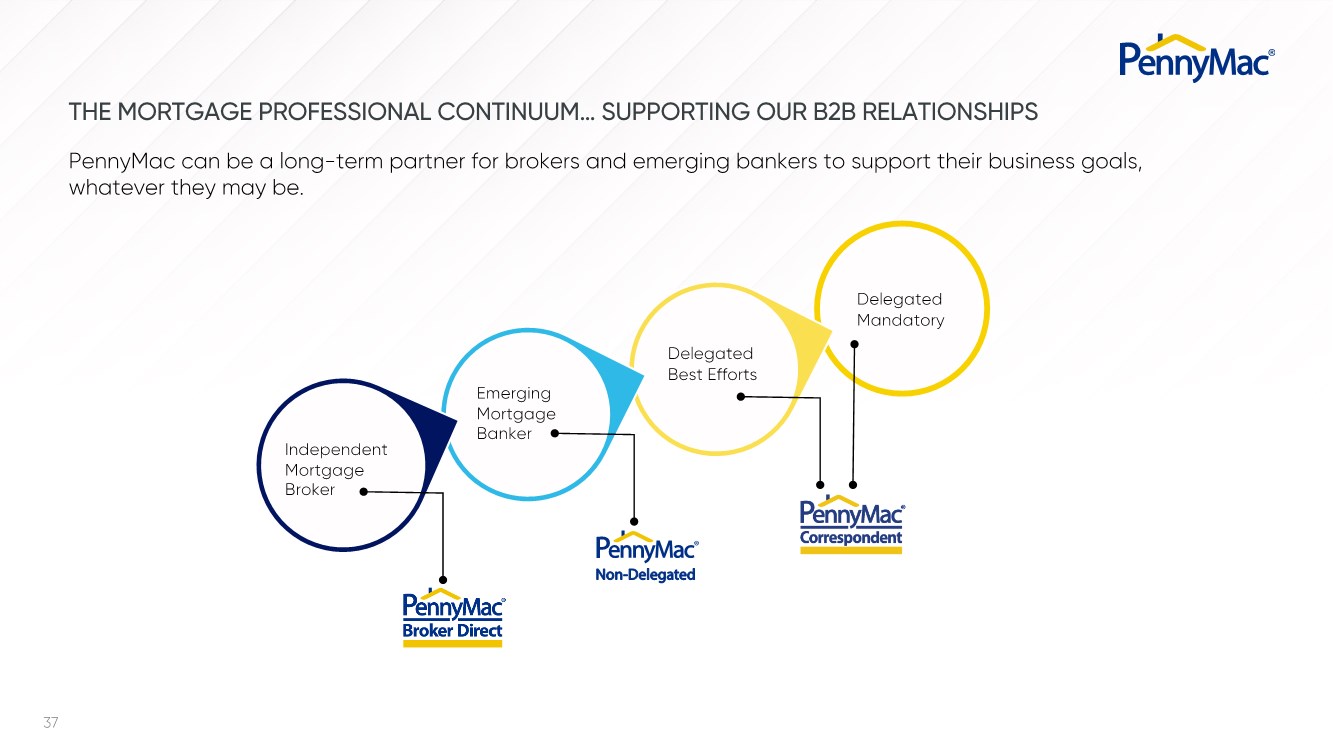
| 37 PennyMac can be a long-term partner for brokers and emerging bankers to support their business goals, whatever they may be. Non-Delegated Emerging Mortgage Banker Delegated Best Efforts Delegated Mandatory Independent Mortgage Broker THE MORTGAGE PROFESSIONAL CONTINUUM… SUPPORTING OUR B2B RELATIONSHIPS |
| 38 PATH TO BECOMING A TOP 3 WHOLESALE ORIGINATOR EXPAND NON-DELEGATED SERVICE OFFERING GROW OUR BASE OF BROKERS AND NON-DELEGATED SELLERS CONTINUE INVESTMENT IN TECHNOLOGY TO HELP BUSINESS PARTNERS GROW FOCUS ON THE CLIENT EXPERIENCE AND RELATIONSHIPS |

| CORRESPONDENT PRODUCTION ABBIE TIDMORE Senior Managing Director Correspondent Production |

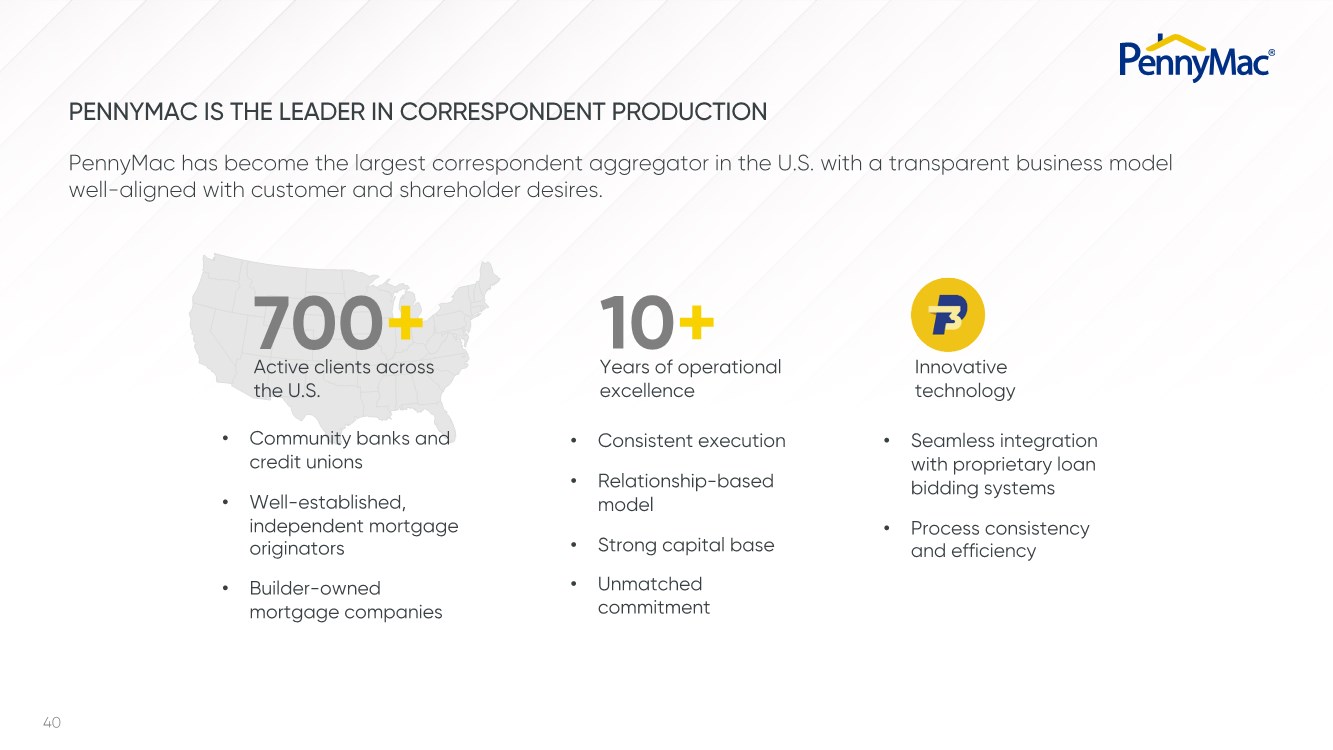
| 40 PennyMac has become the largest correspondent aggregator in the U.S. with a transparent business model well-aligned with customer and shareholder desires. • Consistent execution • Relationship-based model • Strong capital base • Unmatched commitment Innovative technology • Seamless integration with proprietary loan bidding systems • Process consistency and efficiency 10+ Years of operational excellence 700+ Active clients across the U.S. • Community banks and credit unions • Well-established, independent mortgage originators • Builder-owned mortgage companies PENNYMAC IS THE LEADER IN CORRESPONDENT PRODUCTION |
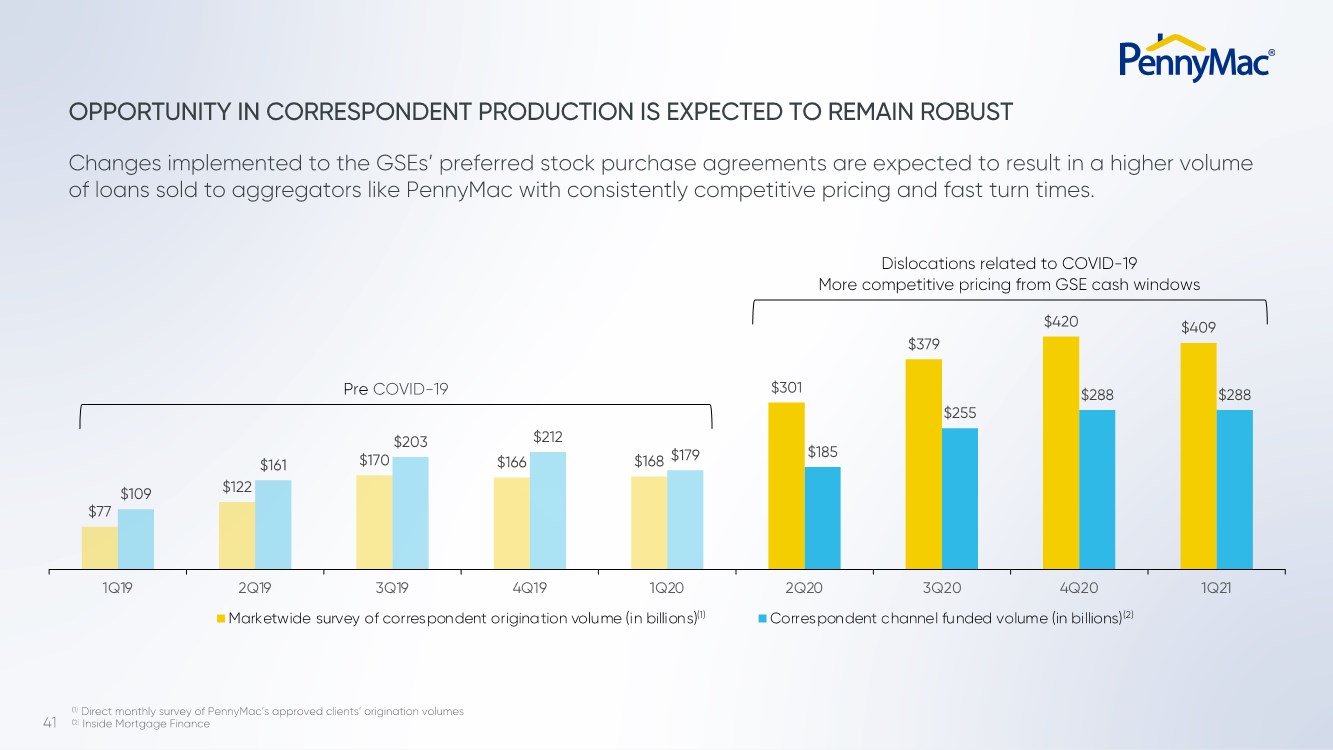
| 41 $77 $122 $170 $166 $168 $301 $379 $420 $409 $109 $161 $203 $212 $179 $185 $255 $288 $288 1Q19 2Q19 3Q19 4Q19 1Q20 2Q20 3Q20 4Q20 1Q21 Marketwide survey of correspondent origination volume (in billions) Correspondent channel funded volume (in billions) Changes implemented to the GSEs’ preferred stock purchase agreements are expected to result in a higher volume of loans sold to aggregators like PennyMac with consistently competitive pricing and fast turn times. (1) Direct monthly survey of PennyMac’s approved clients’ origination volumes (2) Inside Mortgage Finance OPPORTUNITY IN CORRESPONDENT PRODUCTION IS EXPECTED TO REMAIN ROBUST Dislocations related to COVID-19 More competitive pricing from GSE cash windows Pre COVID-19 (1) (2) |
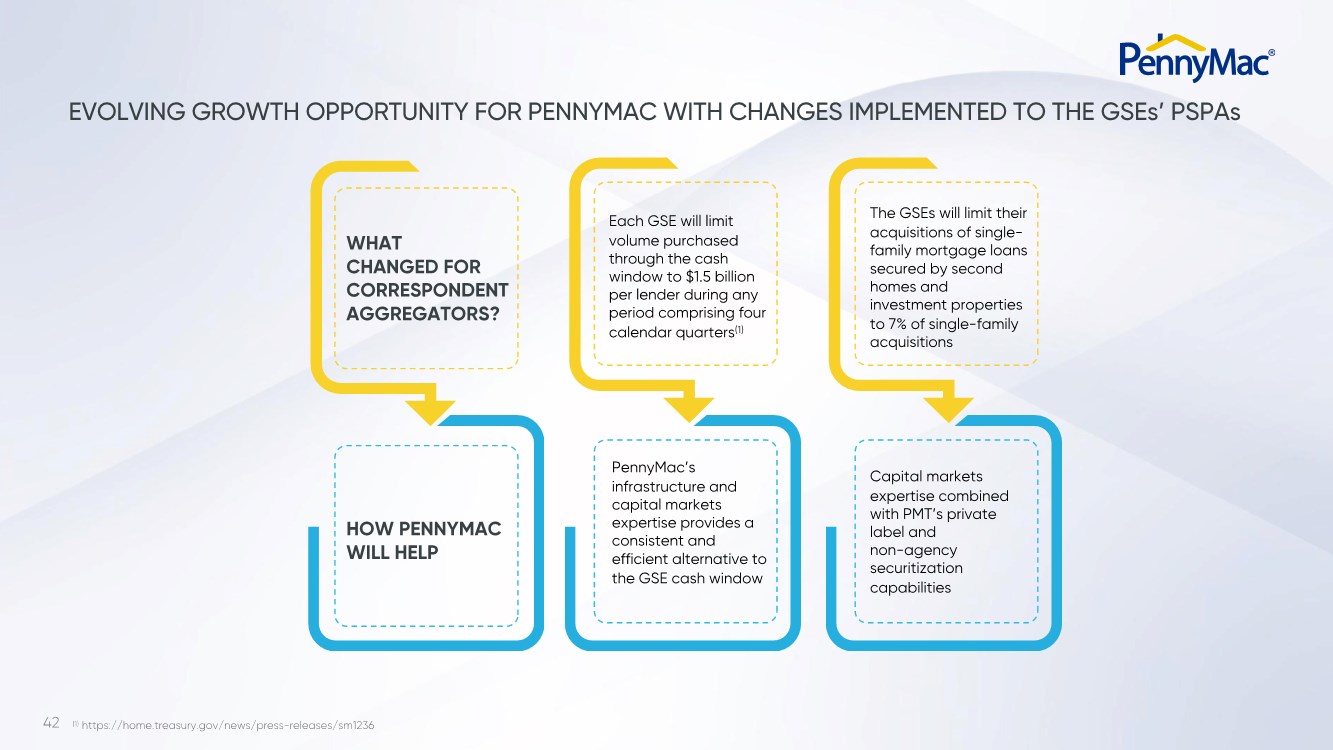
| 42 (1) https://home.treasury.gov/news/press-releases/sm1236 WHAT CHANGED FOR CORRESPONDENT AGGREGATORS? HOW PENNYMAC WILL HELP Each GSE will limit volume purchased through the cash window to $1.5 billion per lender during any period comprising four calendar quarters(1) PennyMac’s infrastructure and capital markets expertise provides a consistent and efficient alternative to the GSE cash window The GSEs will limit their acquisitions of single- family mortgage loans secured by second homes and investment properties to 7% of single-family acquisitions Capital markets expertise combined with PMT’s private label and non-agency securitization capabilities EVOLVING GROWTH OPPORTUNITY FOR PENNYMAC WITH CHANGES IMPLEMENTED TO THE GSEs’ PSPAs |
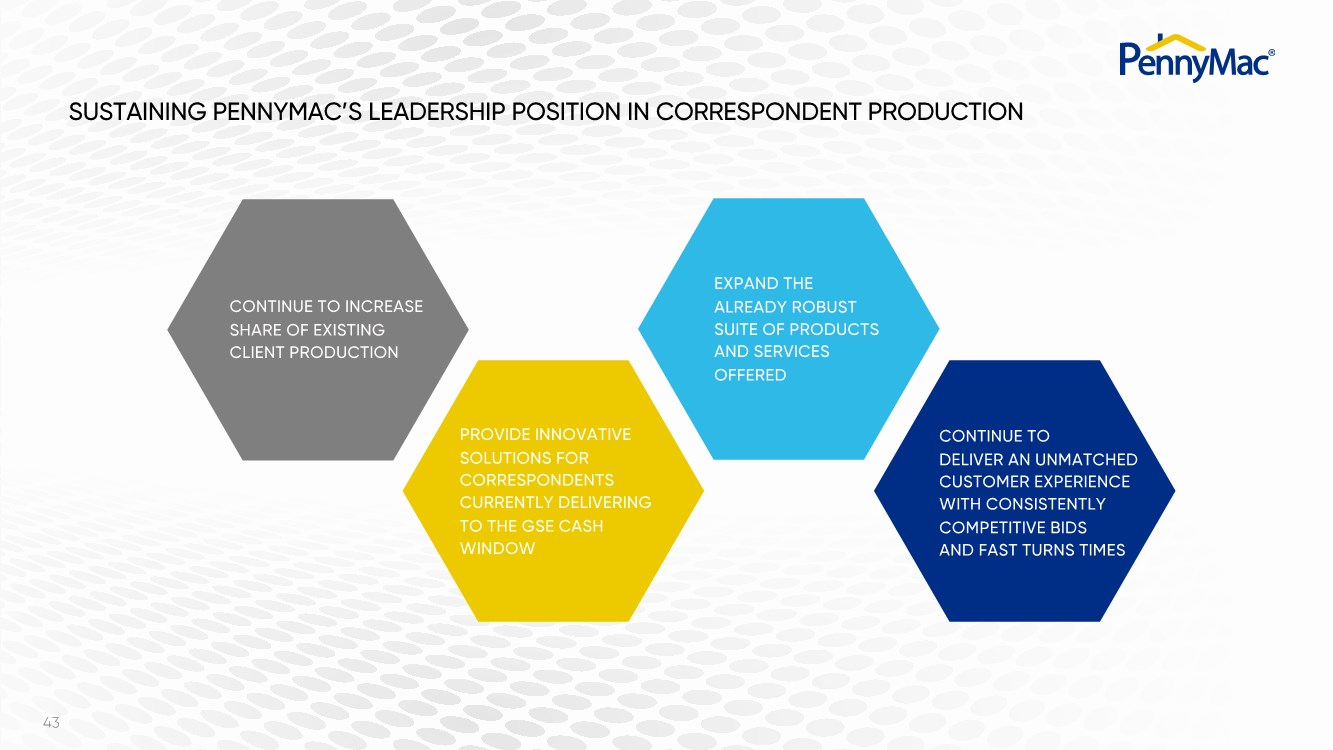
| 43 SUSTAINING PENNYMAC’S LEADERSHIP POSITION IN CORRESPONDENT PRODUCTION PROVIDE INNOVATIVE SOLUTIONS FOR CORRESPONDENTS CURRENTLY DELIVERING TO THE GSE CASH WINDOW CONTINUE TO INCREASE SHARE OF EXISTING CLIENT PRODUCTION CONTINUE TO DELIVER AN UNMATCHED CUSTOMER EXPERIENCE WITH CONSISTENTLY COMPETITIVE BIDS AND FAST TURNS TIMES EXPAND THE ALREADY ROBUST SUITE OF PRODUCTS AND SERVICES OFFERED |
| MORTGAGE FULFILLMENT JIM FOLLETTE Senior Managing Director Chief Mortgage Fulfillment Officer |

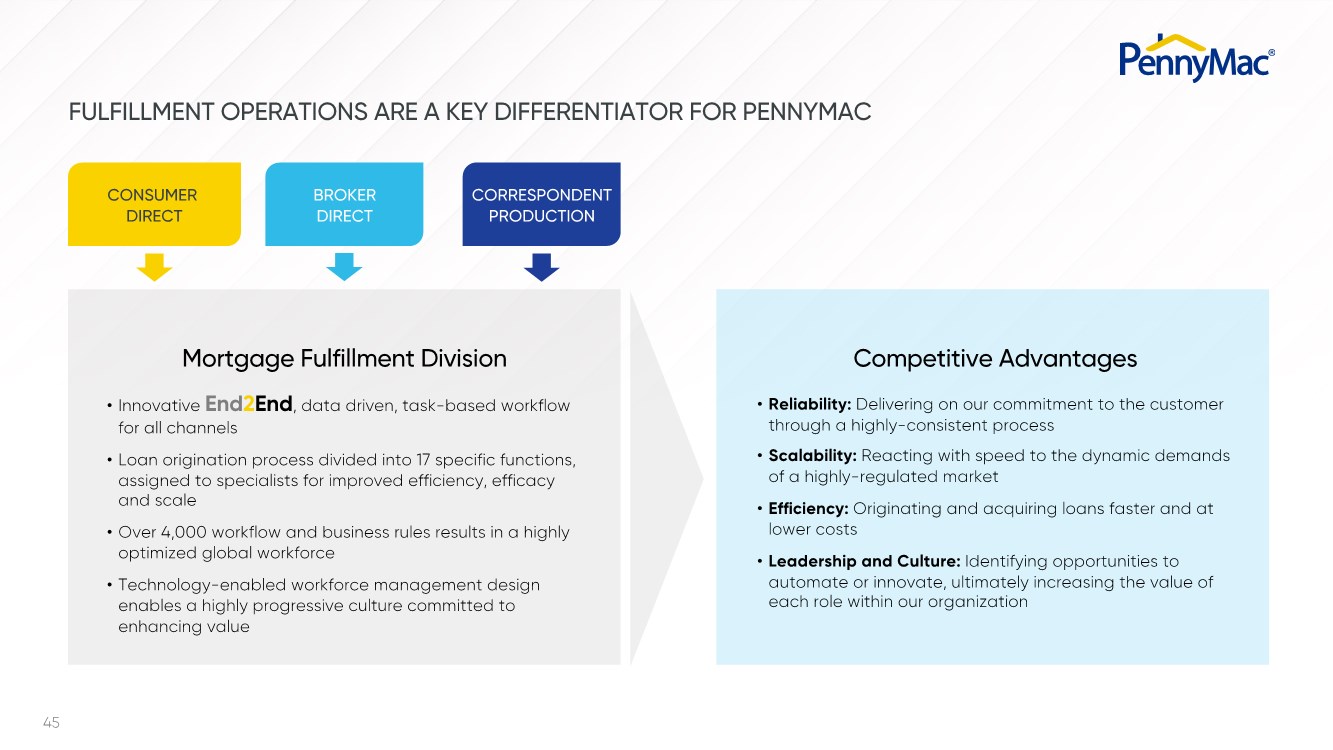
| 45 FULFILLMENT OPERATIONS ARE A KEY DIFFERENTIATOR FOR PENNYMAC CONSUMER DIRECT CORRESPONDENT PRODUCTION Mortgage Fulfillment Division • Innovative End2End, data driven, task-based workflow for all channels • Loan origination process divided into 17 specific functions, assigned to specialists for improved efficiency, efficacy and scale • Over 4,000 workflow and business rules results in a highly optimized global workforce • Technology-enabled workforce management design enables a highly progressive culture committed to enhancing value BROKER DIRECT Competitive Advantages • Reliability: Delivering on our commitment to the customer through a highly-consistent process • Scalability: Reacting with speed to the dynamic demands of a highly-regulated market • Efficiency: Originating and acquiring loans faster and at lower costs • Leadership and Culture: Identifying opportunities to automate or innovate, ultimately increasing the value of each role within our organization |
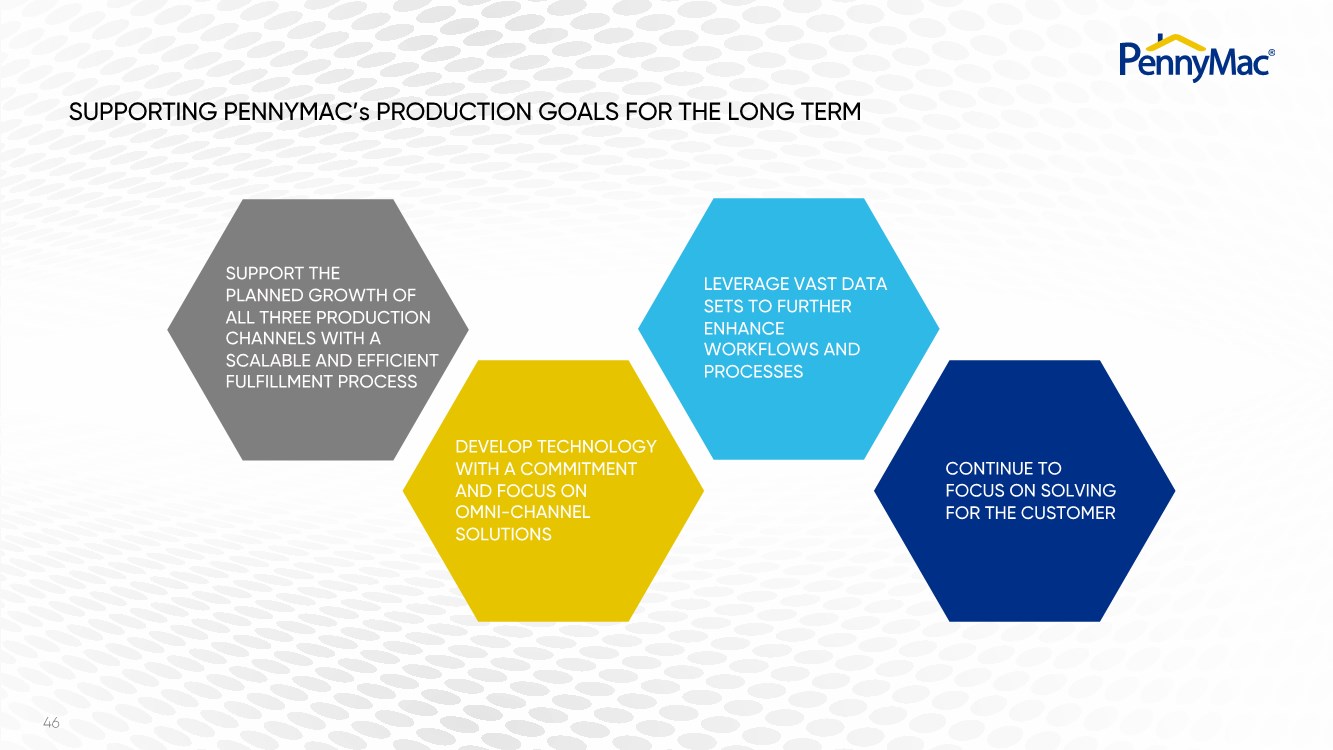
| 46 SUPPORTING PENNYMAC’s PRODUCTION GOALS FOR THE LONG TERM DEVELOP TECHNOLOGY WITH A COMMITMENT AND FOCUS ON OMNI-CHANNEL SOLUTIONS SUPPORT THE PLANNED GROWTH OF ALL THREE PRODUCTION CHANNELS WITH A SCALABLE AND EFFICIENT FULFILLMENT PROCESS CONTINUE TO FOCUS ON SOLVING FOR THE CUSTOMER LEVERAGE VAST DATA SETS TO FURTHER ENHANCE WORKFLOWS AND PROCESSES |
| LOAN SERVICING STEVE BAILEY Senior Managing Director Chief Servicing Officer |

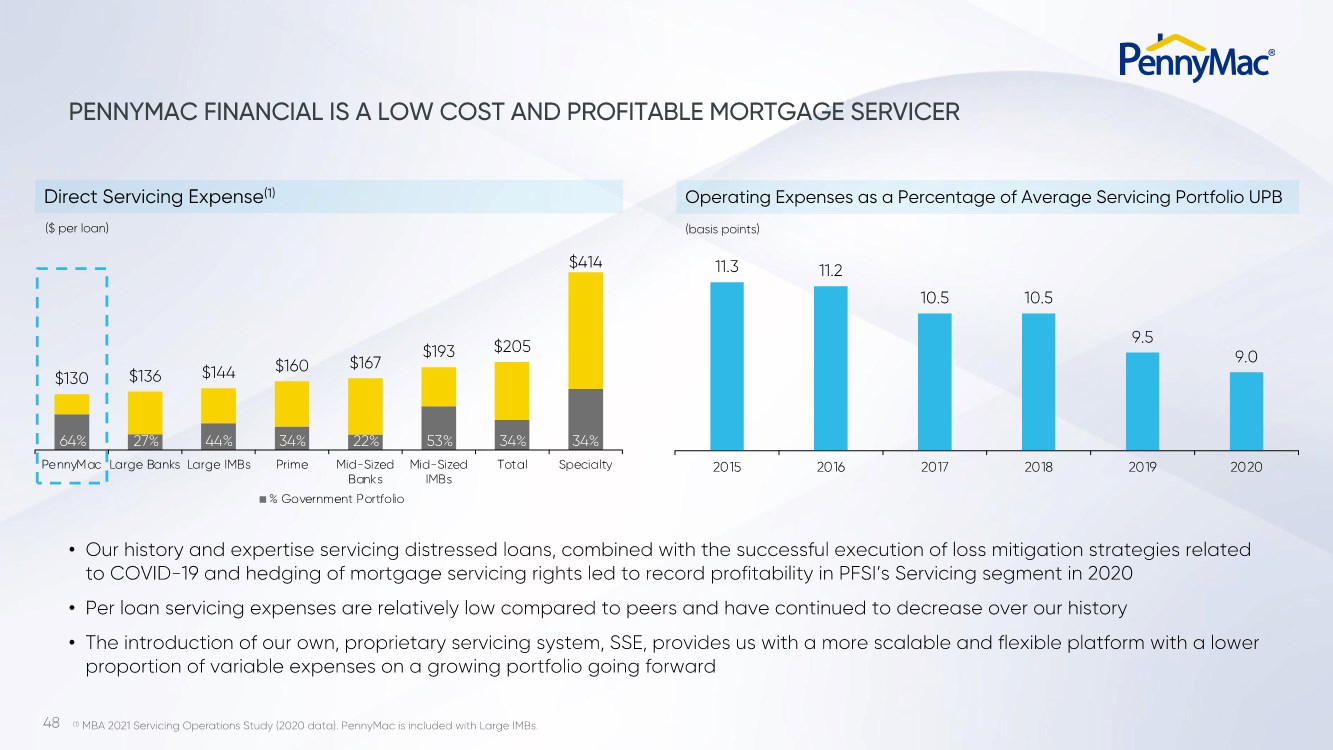
| 48 $130 $136 $144 $160 $167 $193 $205 $414 PennyMac Large Banks Large IMBs Prime Mid-Sized Banks Mid-Sized IMBs Total Specialty % Government Portfolio PENNYMAC FINANCIAL IS A LOW COST AND PROFITABLE MORTGAGE SERVICER ($ per loan) (basis points) (1) MBA 2021 Servicing Operations Study (2020 data). PennyMac is included with Large IMBs. • Our history and expertise servicing distressed loans, combined with the successful execution of loss mitigation strategies related to COVID-19 and hedging of mortgage servicing rights led to record profitability in PFSI’s Servicing segment in 2020 • Per loan servicing expenses are relatively low compared to peers and have continued to decrease over our history • The introduction of our own, proprietary servicing system, SSE, provides us with a more scalable and flexible platform with a lower proportion of variable expenses on a growing portfolio going forward 11.3 11.2 10.5 10.5 9.5 9.0 2015 2016 2017 2018 2019 2020 64% 27% 44% 34% 22% 53% 34% 34% Direct Servicing Expense(1) Operating Expenses as a Percentage of Average Servicing Portfolio UPB |
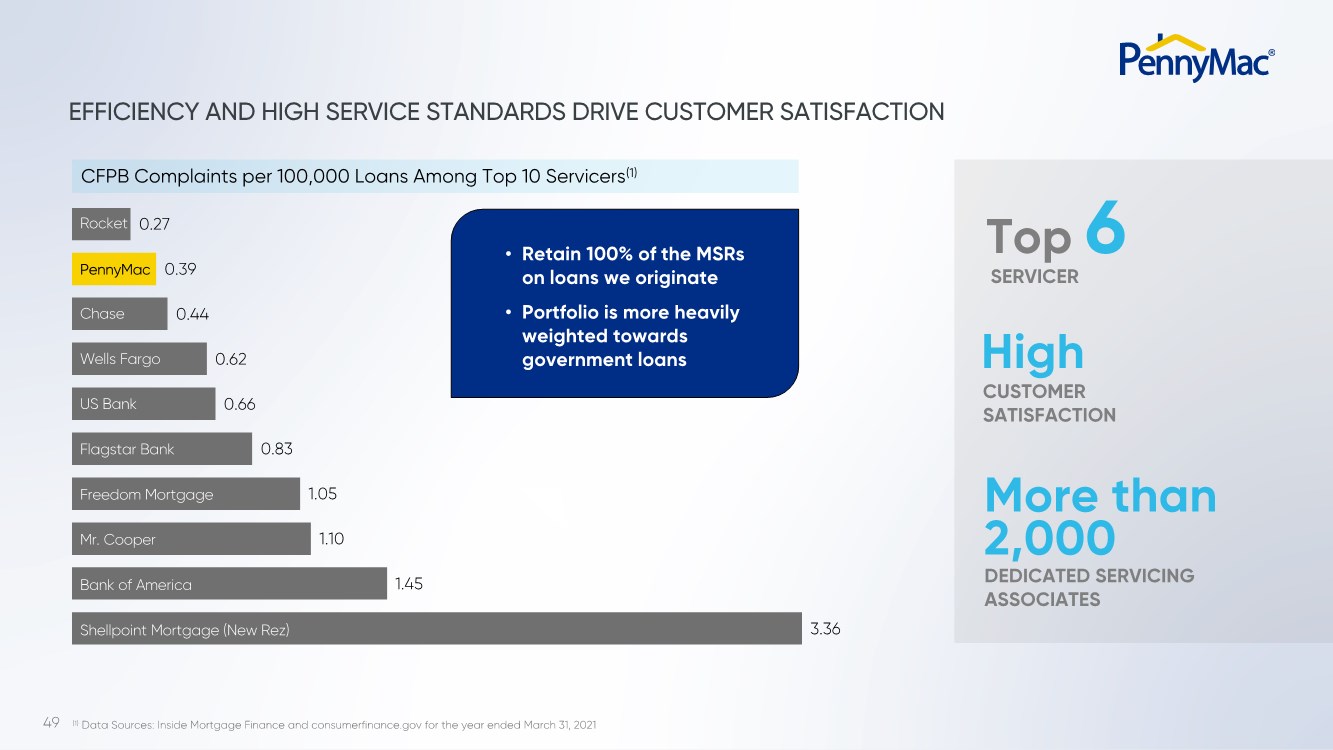
| 49 3.36 1.45 1.10 1.05 0.83 0.66 0.62 0.44 0.39 0.27 EFFICIENCY AND HIGH SERVICE STANDARDS DRIVE CUSTOMER SATISFACTION (1) Data Sources: Inside Mortgage Finance and consumerfinance.gov for the year ended March 31, 2021 Rocket Chase Wells Fargo US Bank Flagstar Bank Mr. Cooper Freedom Mortgage Bank of America Shellpoint Mortgage (New Rez) • Retain 100% of the MSRs on loans we originate • Portfolio is more heavily weighted towards government loans PennyMac CFPB Complaints per 100,000 Loans Among Top 10 Servicers(1) Top 6 SERVICER High CUSTOMER SATISFACTION More than 2,000 DEDICATED SERVICING ASSOCIATES |
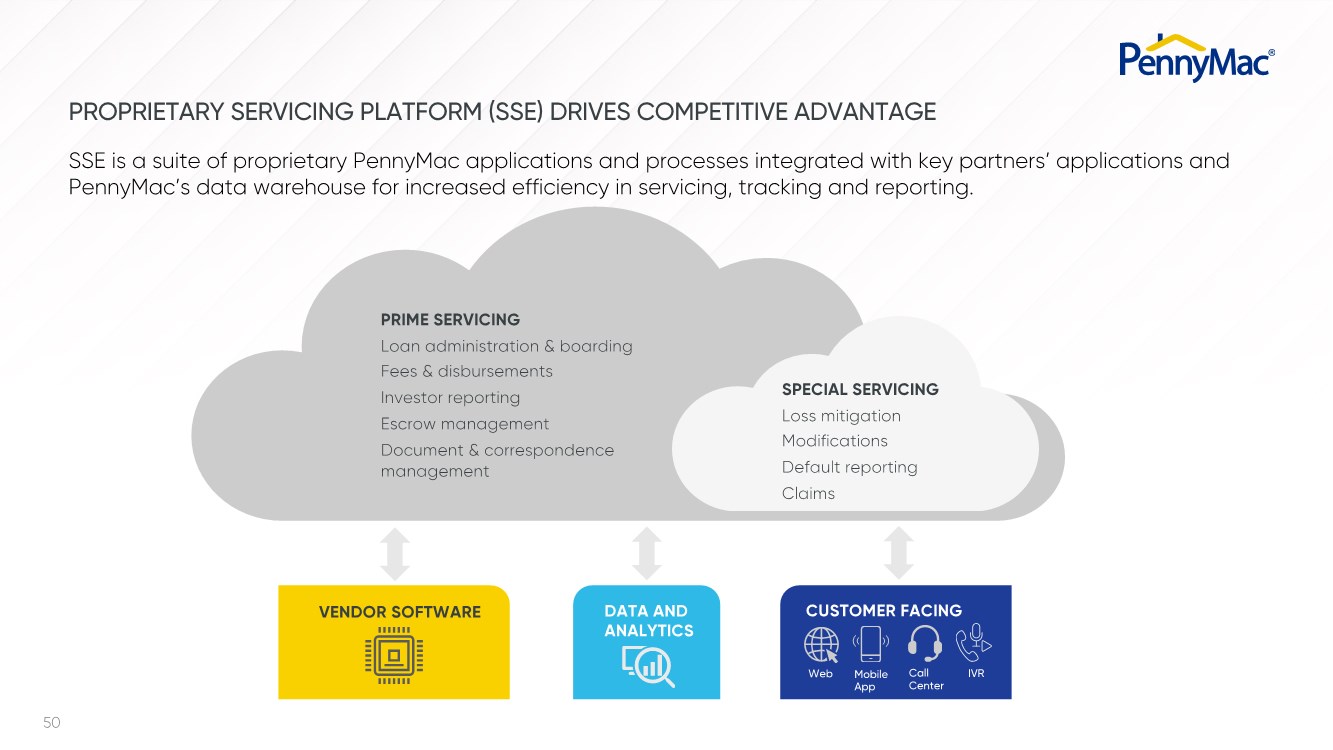
| 50 PROPRIETARY SERVICING PLATFORM (SSE) DRIVES COMPETITIVE ADVANTAGE SSE is a suite of proprietary PennyMac applications and processes integrated with key partners’ applications and PennyMac’s data warehouse for increased efficiency in servicing, tracking and reporting. PRIME SERVICING Loan administration & boarding Fees & disbursements Investor reporting Escrow management Document & correspondence management SPECIAL SERVICING Loss mitigation Modifications Default reporting Claims VENDOR SOFTWARE DATA AND ANALYTICS CUSTOMER FACING Web Mobile App Call Center IVR |
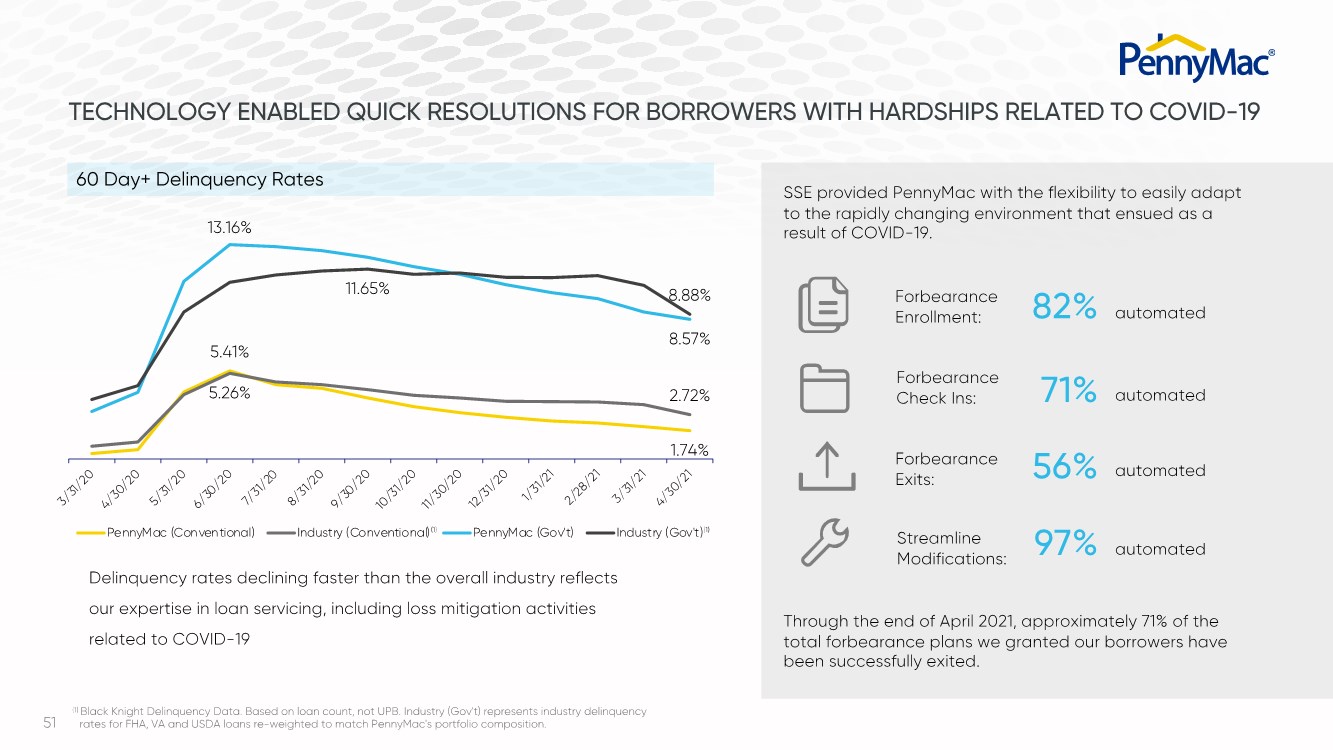
| 51 TECHNOLOGY ENABLED QUICK RESOLUTIONS FOR BORROWERS WITH HARDSHIPS RELATED TO COVID-19 Delinquency rates declining faster than the overall industry reflects our expertise in loan servicing, including loss mitigation activities related to COVID-19 Forbearance Enrollment: Forbearance Check Ins: Forbearance Exits: 82% 71% 56% automated automated automated Streamline Modifications: 97% automated SSE provided PennyMac with the flexibility to easily adapt to the rapidly changing environment that ensued as a result of COVID-19. Through the end of April 2021, approximately 71% of the total forbearance plans we granted our borrowers have been successfully exited. 60 Day+ Delinquency Rates (1) Black Knight Delinquency Data. Based on loan count, not UPB. Industry (Gov't) represents industry delinquency rates for FHA, VA and USDA loans re-weighted to match PennyMac's portfolio composition. 5.41% 1.74% 5.26% 2.72% 13.16% 8.57% 11.65% 8.88% 3/31/20 4/30/20 5/31/20 6/30/20 7/31/20 8/31/20 9/30/20 10/31/20 11/30/20 12/31/20 1/31/21 2/28/21 3/31/21 4/30/21 PennyMac (Con ven tional) Industry (Conventional) PennyMac (Gov't) Industry (Gov't)(1) (1) |
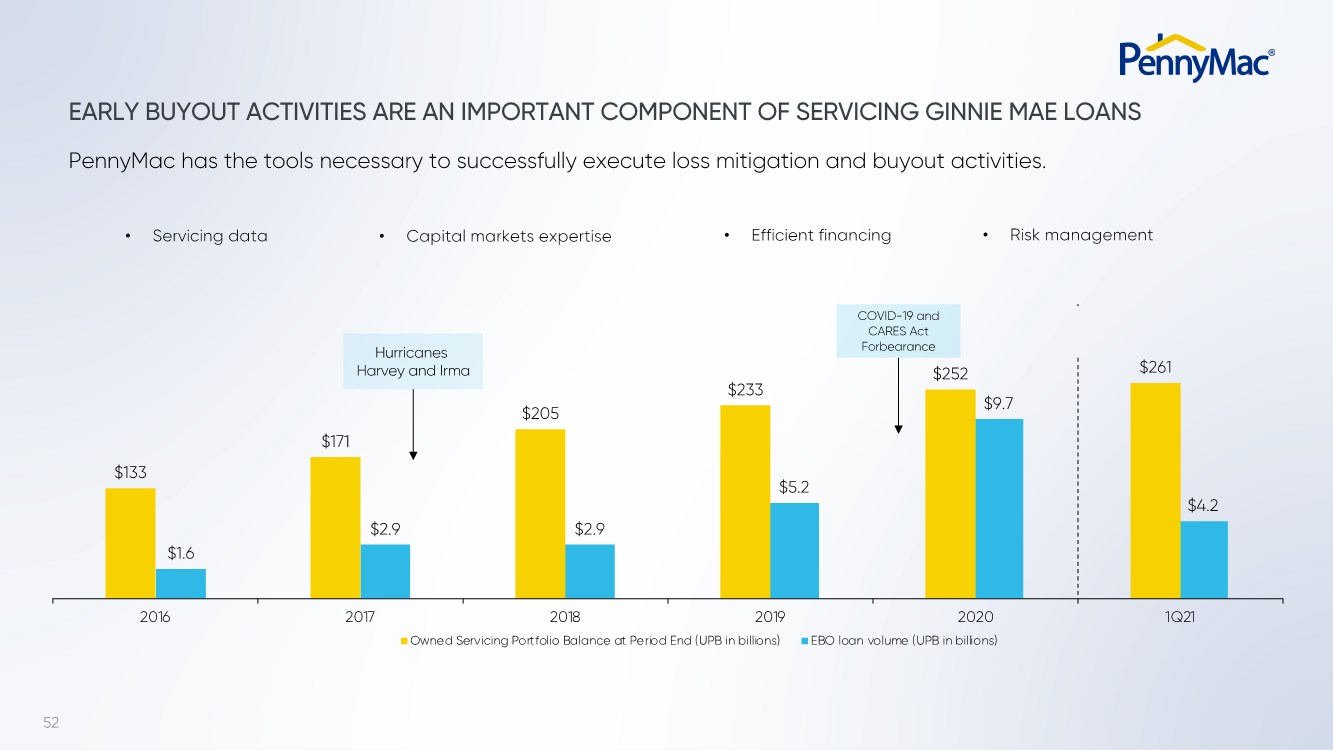
| 52 $1.6 $2.9 $2.9 $5.2 $9.7 $4.2 EBO loan volume (UPB in billions) $133 $171 $205 $233 $252 $261 2016 2017 2018 2019 2020 1Q21 Owned Servicing Portfolio Balance at Period End (UPB in billions) Hurricanes Harvey and Irma EARLY BUYOUT ACTIVITIES ARE AN IMPORTANT COMPONENT OF SERVICING GINNIE MAE LOANS • Servicing data • Capital markets expertise • Efficient financing • Risk management COVID-19 and CARES Act Forbearance PennyMac has the tools necessary to successfully execute loss mitigation and buyout activities. |
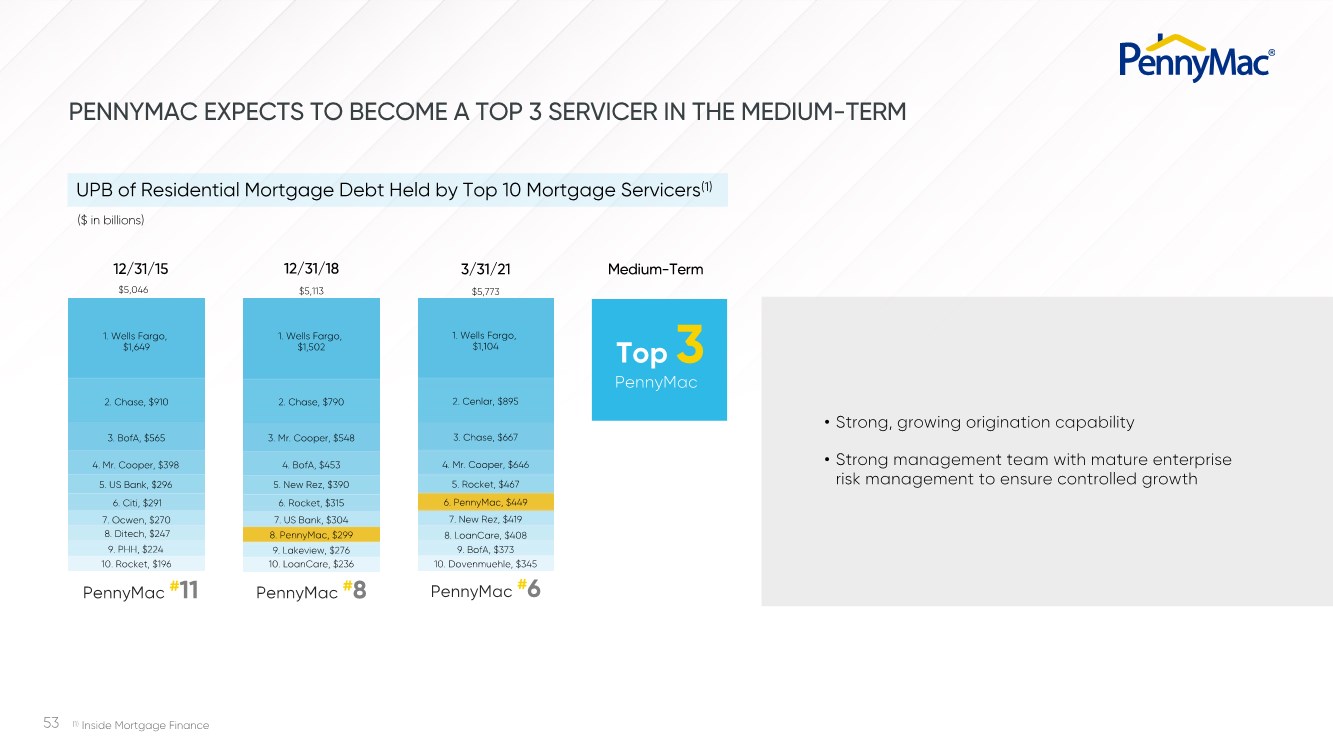
| 53 Top 3 UPB of Residential Mortgage Debt Held by Top 10 Mortgage Servicers(1) PENNYMAC EXPECTS TO BECOME A TOP 3 SERVICER IN THE MEDIUM-TERM • Strong, growing origination capability • Strong management team with mature enterprise risk management to ensure controlled growth 12/31/15 12/31/18 PennyMac PennyMac #11 (1) Inside Mortgage Finance ($ in billions) $5,113 Medium-Term PennyMac #8 1. Wells Fargo, $1,649 2. Chase, $910 3. BofA, $565 4. Mr. Cooper, $398 5. US Bank, $296 6. Citi, $291 7. Ocwen, $270 8. Ditech, $247 9. PHH, $224 10. Rocket, $196 $5,046 PennyMac #6 1. Wells Fargo, $1,502 2. Chase, $790 3. Mr. Cooper, $548 4. BofA, $453 5. New Rez, $390 6. Rocket, $315 7. US Bank, $304 9. Lakeview, $276 10. LoanCare, $236 8. PennyMac, $299 3/31/21 $5,773 1. Wells Fargo, $1,104 2. Cenlar, $895 3. Chase, $667 4. Mr. Cooper, $646 5. Rocket, $467 6. PennyMac, $449 7. New Rez, $419 9. BofA, $373 8. LoanCare, $408 10. Dovenmuehle, $345 |
| 54 LARGE SERVICING BUSINESS IS A KEY COMPONENT OF PENNYMAC’S BALANCED BUSINESS MODEL DRIVER OF LOW- COST, HIGH-QUALITY LEADS FOR OUR CONSUMER-DIRECT LENDING BUSINESS SUCCESSFUL EXECUTION OF LOSS MITIGATION ACTIVITIES KEEPS BORROWERS IN THEIR HOMES AND ENHANCES LIFETIME RELATIONSHIPS SERVES AS A NATURAL HEDGE TO PRODUCTION INCOME AS RATES RISE HIGH-QUALITY SERVICING PORTFOLIO REPRESENTS A GROWING STREAM OF RECURRING EARNINGS AND CASH FLOW |

| PMT VANDY FARTAJ Senior Managing Director Chief Investment Officer WILL CHANG Senior Managing Director Deputy Chief Investment Officer |

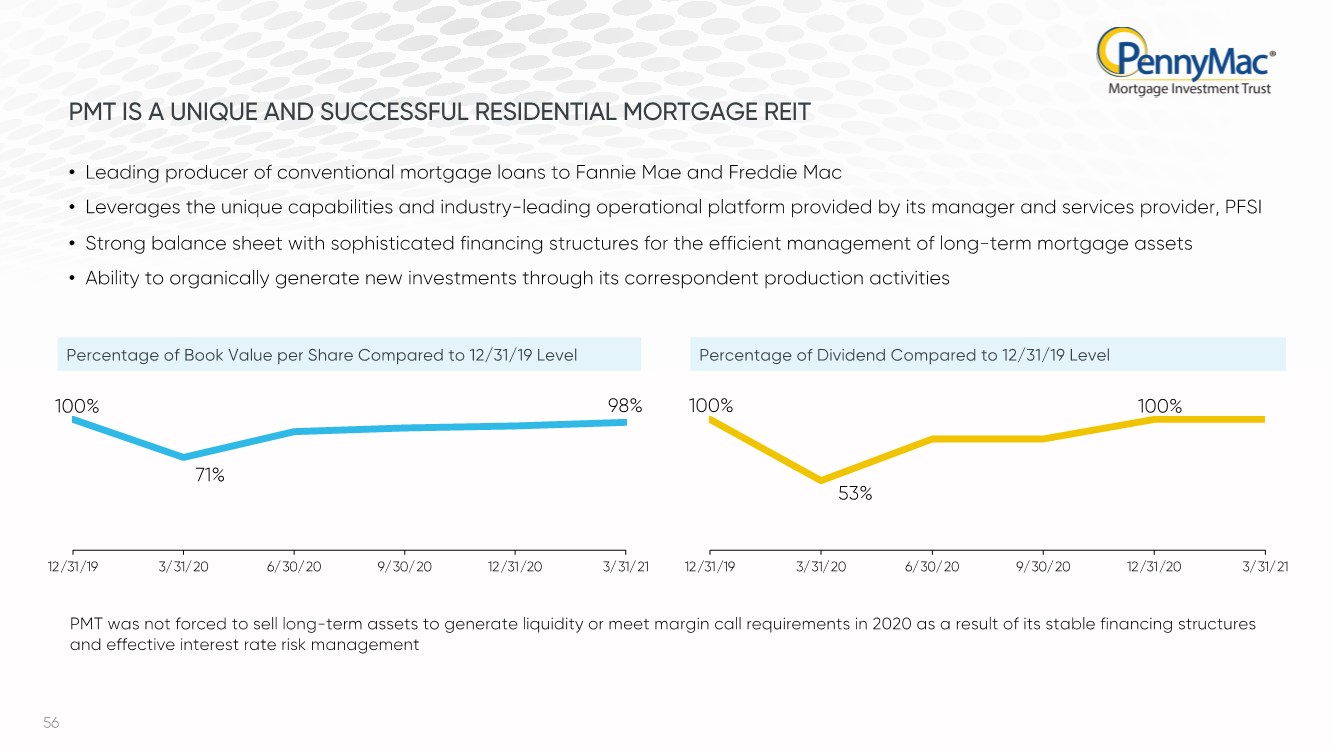
| 56 • Leading producer of conventional mortgage loans to Fannie Mae and Freddie Mac • Leverages the unique capabilities and industry-leading operational platform provided by its manager and services provider, PFSI • Strong balance sheet with sophisticated financing structures for the efficient management of long-term mortgage assets • Ability to organically generate new investments through its correspondent production activities 100% 53% 100% 12/31/19 3/31/20 6/30/20 9/30/20 12/31/20 3/31/21 100% 71% 98% 12/31/19 3/31/20 6/30/20 9/30/20 12/31/20 3/31/21 PMT was not forced to sell long-term assets to generate liquidity or meet margin call requirements in 2020 as a result of its stable financing structures and effective interest rate risk management PMT IS A UNIQUE AND SUCCESSFUL RESIDENTIAL MORTGAGE REIT Percentage of Book Value per Share Compared to 12/31/19 Level Percentage of Dividend Compared to 12/31/19 Level |
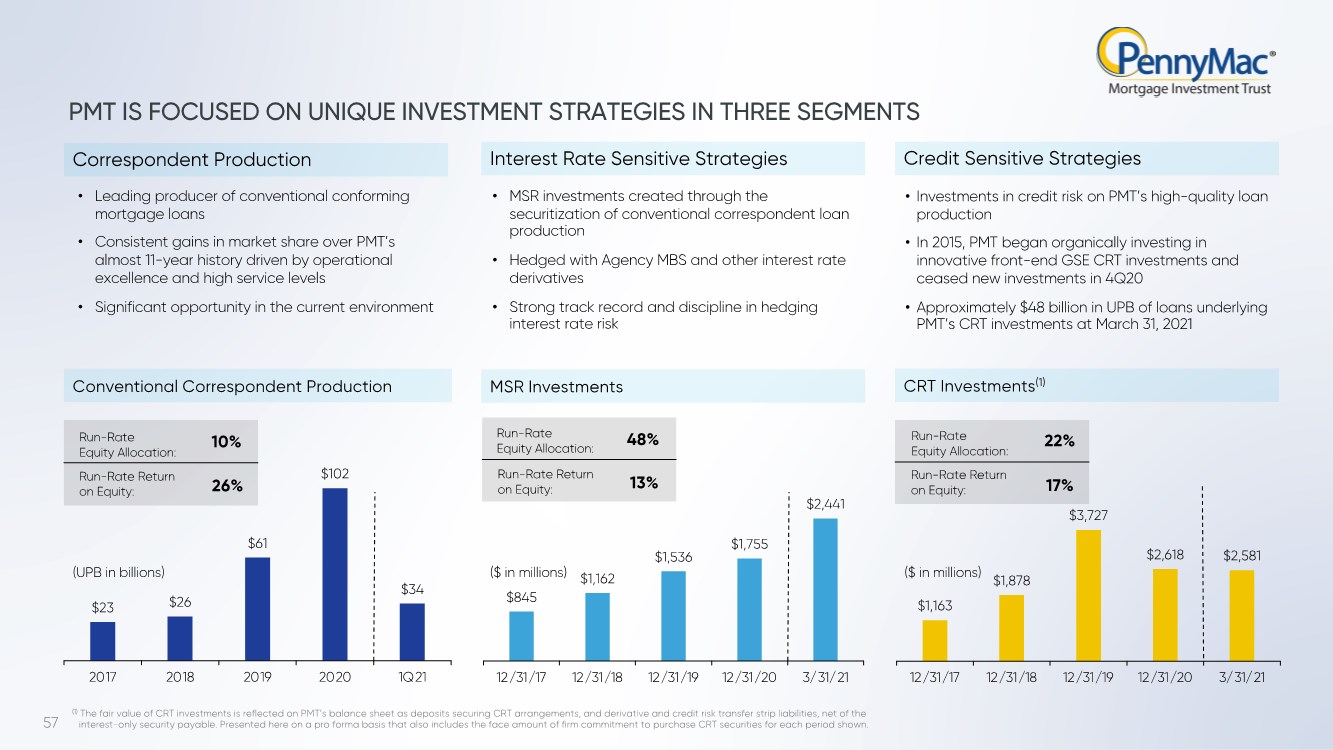
| 57 $1,163 $1,878 $3,727 $2,618 $2,581 12/31/17 12/31/18 12/31/19 12/31/20 3/31/21 Conventional Correspondent Production PMT IS FOCUSED ON UNIQUE INVESTMENT STRATEGIES IN THREE SEGMENTS $23 $26 $61 $102 $34 2017 2018 2019 2020 1Q21 • Leading producer of conventional conforming mortgage loans • Consistent gains in market share over PMT’s almost 11-year history driven by operational excellence and high service levels • Significant opportunity in the current environment • Investments in credit risk on PMT’s high-quality loan production • In 2015, PMT began organically investing in innovative front-end GSE CRT investments and ceased new investments in 4Q20 • Approximately $48 billion in UPB of loans underlying PMT’s CRT investments at March 31, 2021 • MSR investments created through the securitization of conventional correspondent loan production • Hedged with Agency MBS and other interest rate derivatives • Strong track record and discipline in hedging interest rate risk $845 $1,162 $1,536 $1,755 $2,441 12/31/17 12/31/18 12/31/19 12/31/20 3/31/21 Run-Rate Equity Allocation: Run-Rate Return on Equity: Run-Rate Equity Allocation: Run-Rate Return on Equity: Run-Rate Equity Allocation: Run-Rate Return on Equity: 10% 26% 48% 13% 22% 17% (1) The fair value of CRT investments is reflected on PMT’s balance sheet as deposits securing CRT arrangements, and derivative and credit risk transfer strip liabilities, net of the interest-only security payable. Presented here on a pro forma basis that also includes the face amount of firm commitment to purchase CRT securities for each period shown. Correspondent Production Interest Rate Sensitive Strategies Credit Sensitive Strategies (UPB in billions) MSR Investments ($ in millions) CRT Investments(1) ($ in millions) |
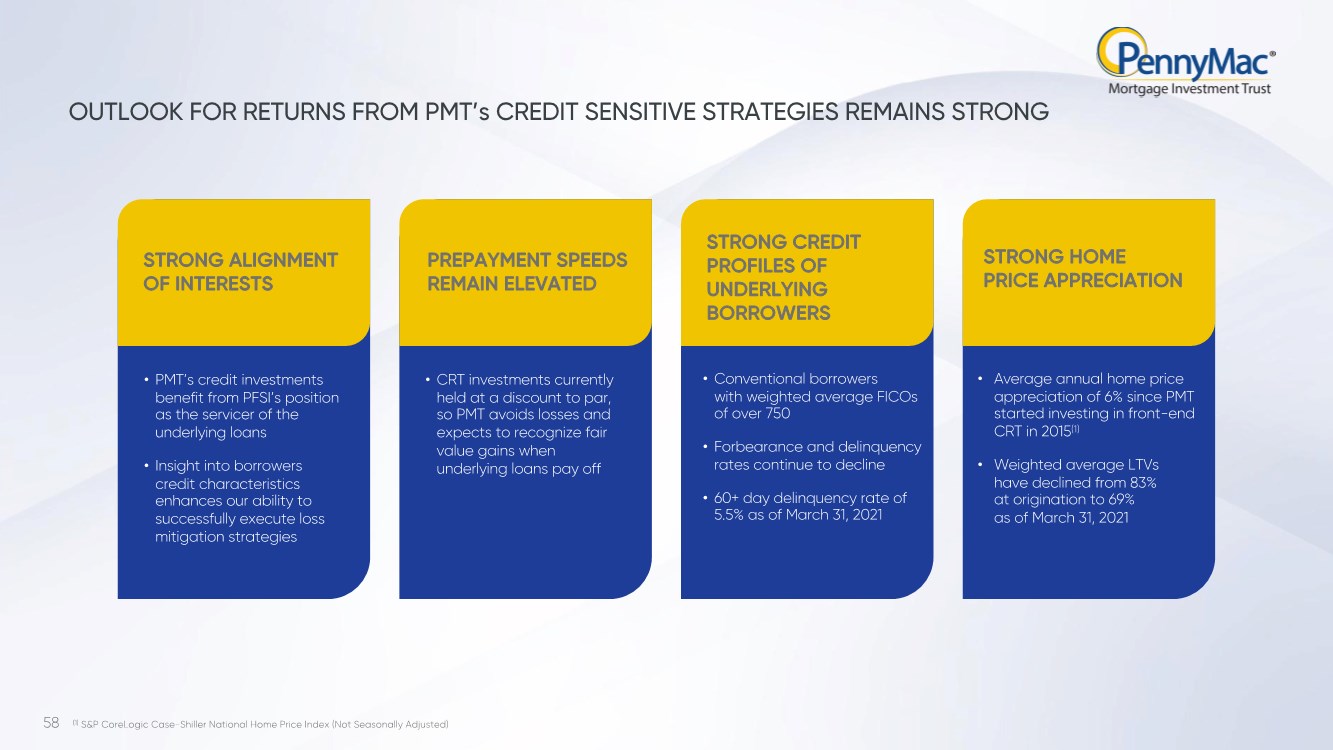
| 58 OUTLOOK FOR RETURNS FROM PMT’s CREDIT SENSITIVE STRATEGIES REMAINS STRONG STRONG ALIGNMENT OF INTERESTS • Conventional borrowers with weighted average FICOs of over 750 • Forbearance and delinquency rates continue to decline • 60+ day delinquency rate of 5.5% as of March 31, 2021 • CRT investments currently held at a discount to par, so PMT avoids losses and expects to recognize fair value gains when underlying loans pay off • Average annual home price appreciation of 6% since PMT started investing in front-end CRT in 2015(1) • Weighted average LTVs have declined from 83% at origination to 69% as of March 31, 2021 • PMT’s credit investments benefit from PFSI’s position as the servicer of the underlying loans • Insight into borrowers credit characteristics enhances our ability to successfully execute loss mitigation strategies PREPAYMENT SPEEDS REMAIN ELEVATED STRONG CREDIT PROFILES OF UNDERLYING BORROWERS STRONG HOME PRICE APPRECIATION (1) S&P CoreLogic Case-Shiller National Home Price Index (Not Seasonally Adjusted) |
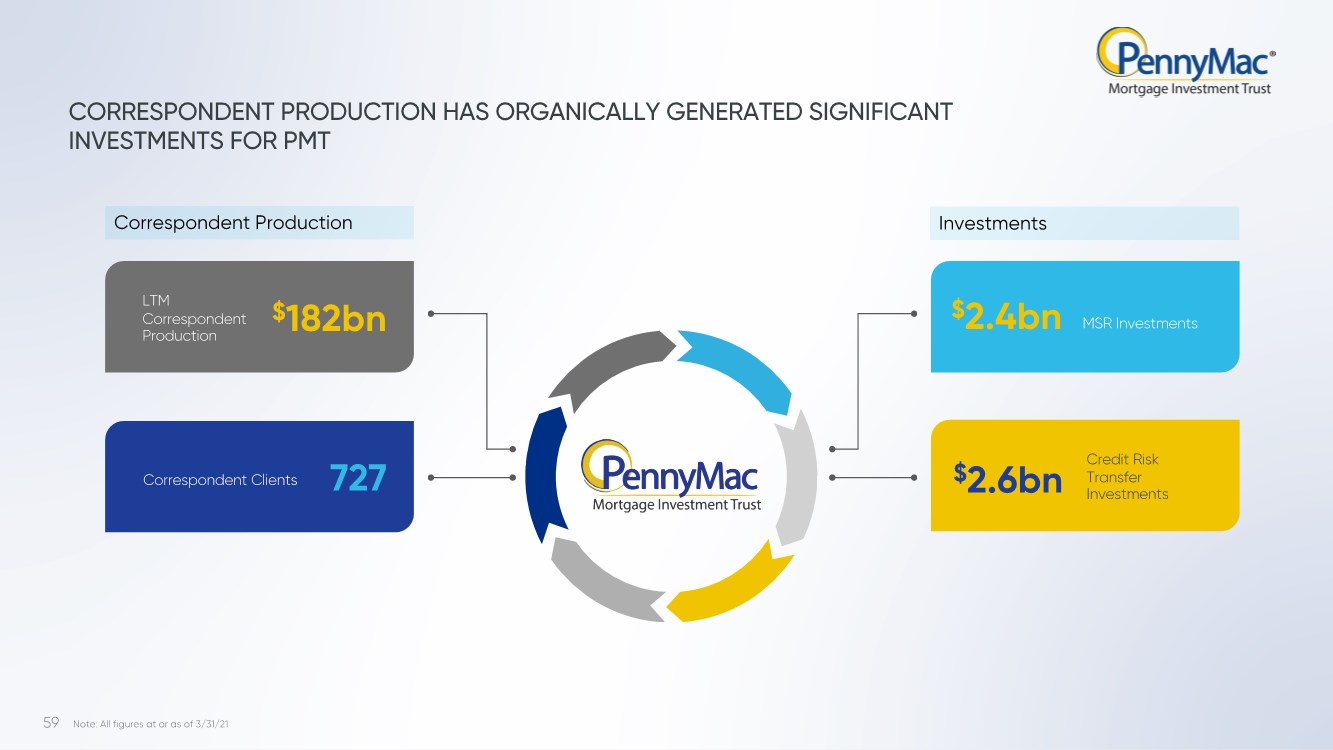
| 59 CORRESPONDENT PRODUCTION HAS ORGANICALLY GENERATED SIGNIFICANT INVESTMENTS FOR PMT LTM Correspondent Production $182bn 727 $2.4bn $2.6bn Correspondent Clients MSR Investments Credit Risk Transfer Investments Correspondent Production Investments Note: All figures at or as of 3/31/21 |
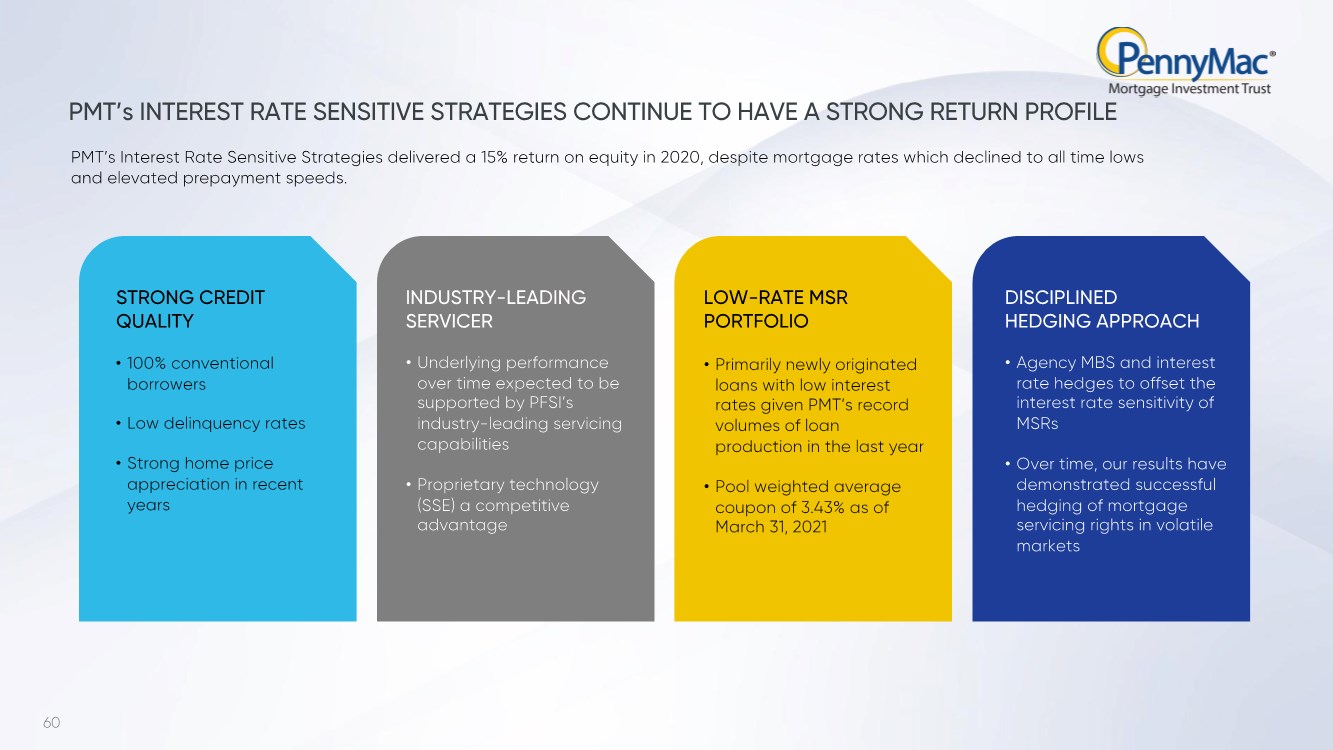
| 60 • Agency MBS and interest rate hedges to offset the interest rate sensitivity of MSRs • Over time, our results have demonstrated successful hedging of mortgage servicing rights in volatile markets • Primarily newly originated loans with low interest rates given PMT’s record volumes of loan production in the last year • Pool weighted average coupon of 3.43% as of March 31, 2021 • Underlying performance over time expected to be supported by PFSI’s industry-leading servicing capabilities • Proprietary technology (SSE) a competitive advantage • 100% conventional borrowers • Low delinquency rates • Strong home price appreciation in recent years STRONG CREDIT QUALITY INDUSTRY-LEADING SERVICER LOW-RATE MSR PORTFOLIO DISCIPLINED HEDGING APPROACH PMT’s INTEREST RATE SENSITIVE STRATEGIES CONTINUE TO HAVE A STRONG RETURN PROFILE PMT’s Interest Rate Sensitive Strategies delivered a 15% return on equity in 2020, despite mortgage rates which declined to all time lows and elevated prepayment speeds. |
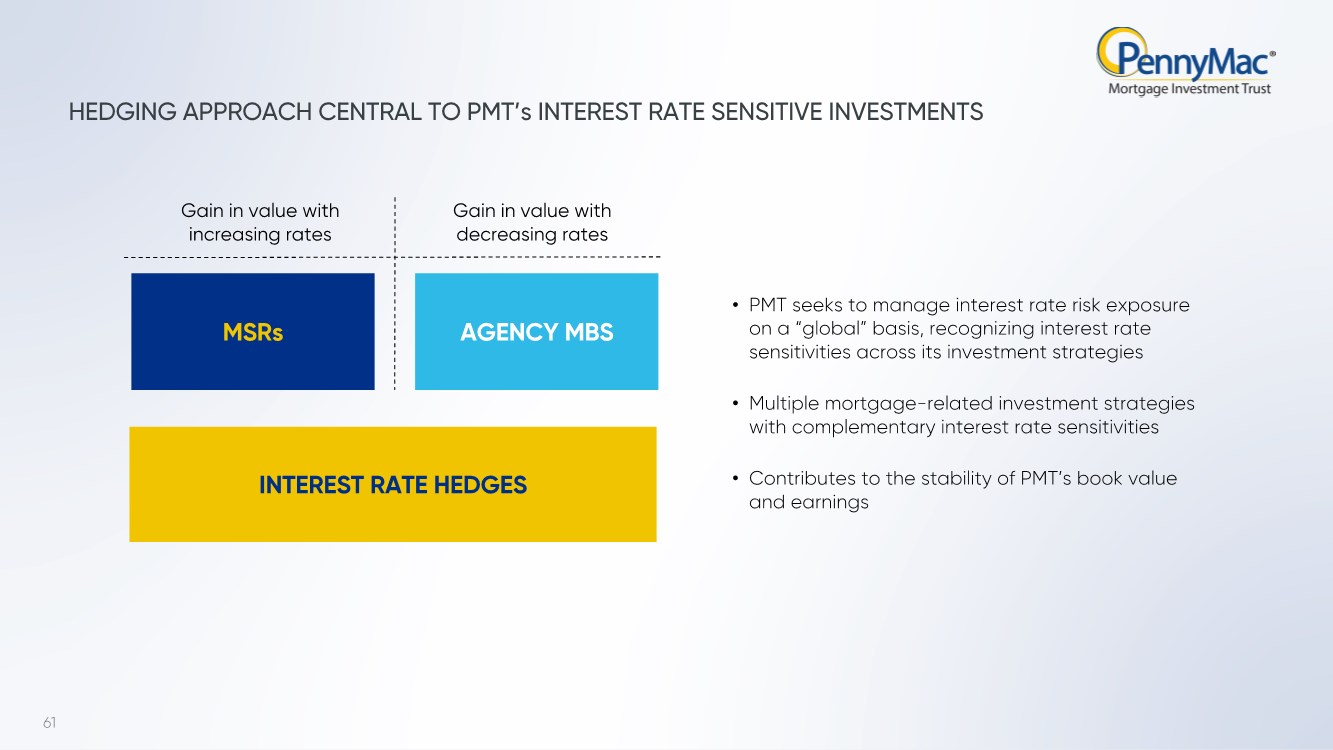
| 61 Gain in value with increasing rates Gain in value with decreasing rates MSRs AGENCY MBS INTEREST RATE HEDGES • PMT seeks to manage interest rate risk exposure on a “global” basis, recognizing interest rate sensitivities across its investment strategies • Multiple mortgage-related investment strategies with complementary interest rate sensitivities • Contributes to the stability of PMT’s book value and earnings HEDGING APPROACH CENTRAL TO PMT’s INTEREST RATE SENSITIVE INVESTMENTS |
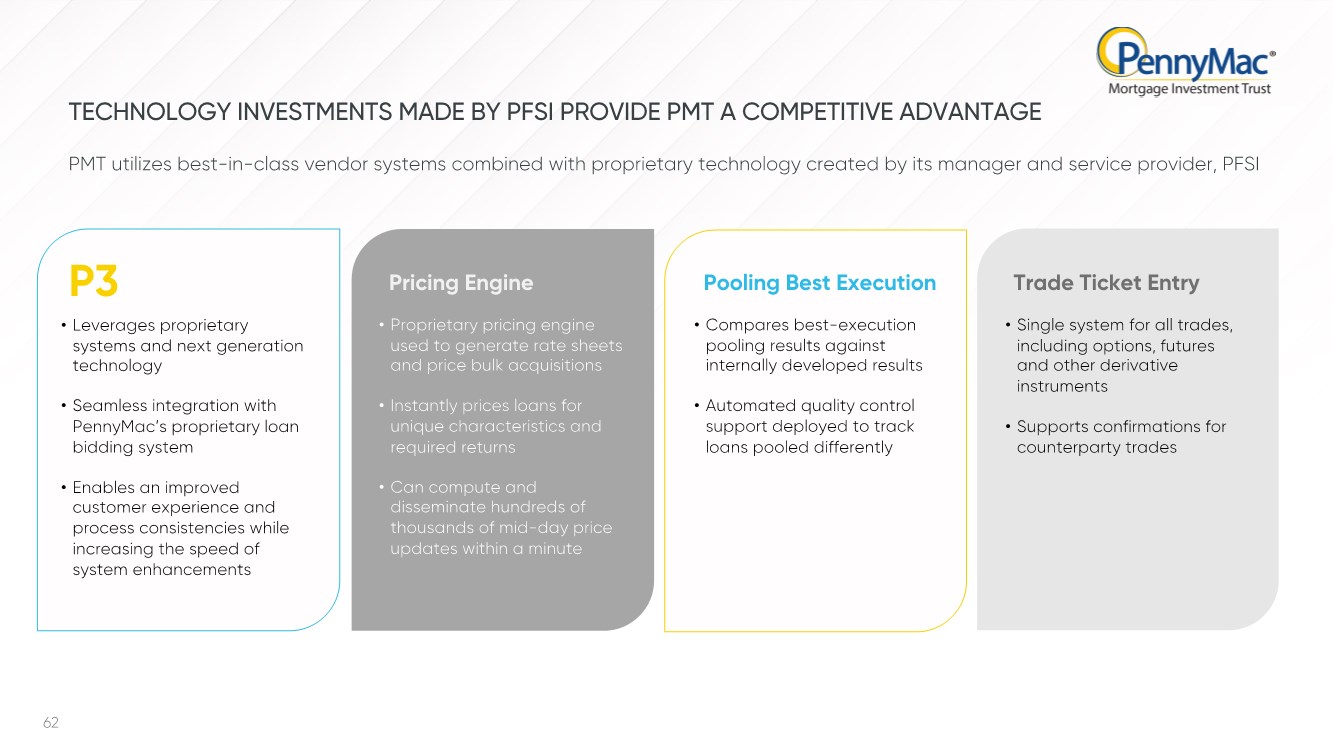
| 62 • Single system for all trades, including options, futures and other derivative instruments • Supports confirmations for counterparty trades • Compares best-execution pooling results against internally developed results • Automated quality control support deployed to track loans pooled differently • Proprietary pricing engine used to generate rate sheets and price bulk acquisitions • Instantly prices loans for unique characteristics and required returns • Can compute and disseminate hundreds of thousands of mid-day price updates within a minute • Leverages proprietary systems and next generation technology • Seamless integration with PennyMac’s proprietary loan bidding system • Enables an improved customer experience and process consistencies while increasing the speed of system enhancements P3 Pricing Engine Pooling Best Execution Trade Ticket Entry TECHNOLOGY INVESTMENTS MADE BY PFSI PROVIDE PMT A COMPETITIVE ADVANTAGE PMT utilizes best-in-class vendor systems combined with proprietary technology created by its manager and service provider, PFSI |
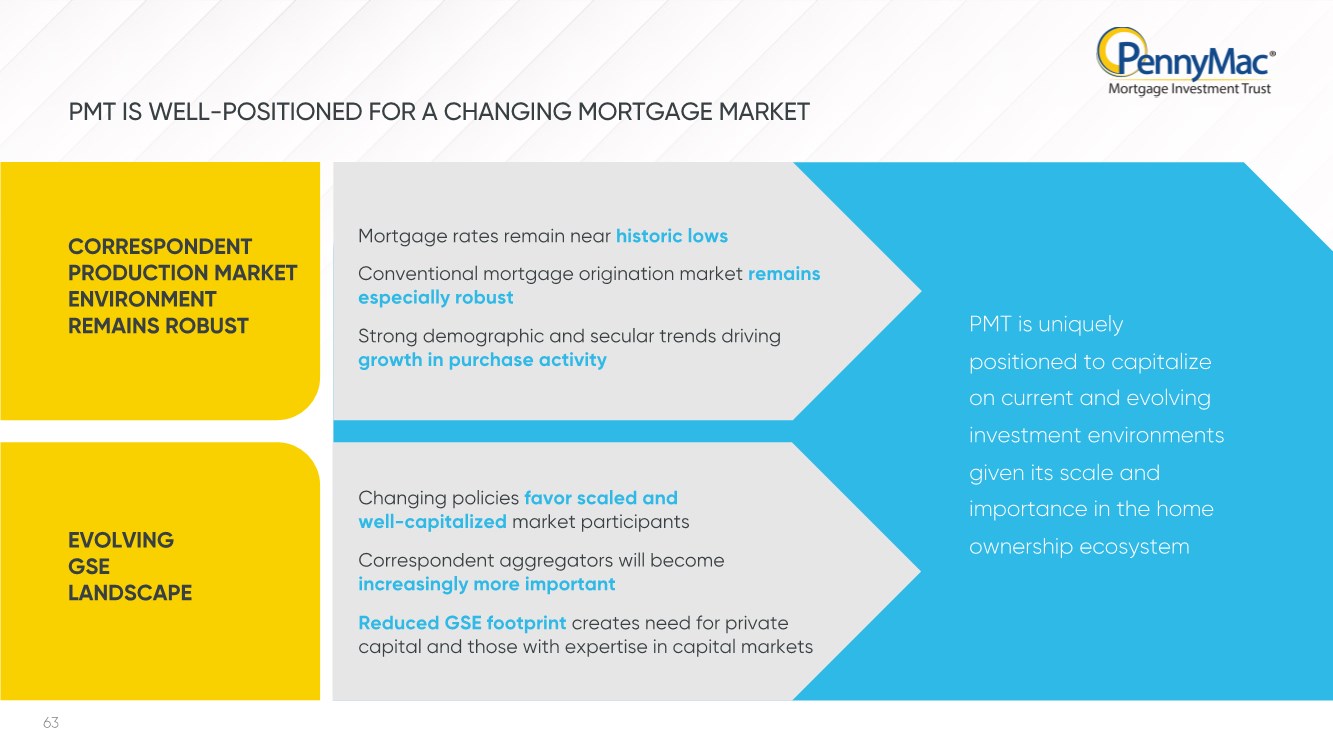
| 63 PMT is uniquely positioned to capitalize on current and evolving investment environments given its scale and importance in the home ownership ecosystem Mortgage rates remain near historic lows Conventional mortgage origination market remains especially robust Strong demographic and secular trends driving growth in purchase activity CORRESPONDENT PRODUCTION MARKET ENVIRONMENT REMAINS ROBUST EVOLVING GSE LANDSCAPE Changing policies favor scaled and well-capitalized market participants Correspondent aggregators will become increasingly more important Reduced GSE footprint creates need for private capital and those with expertise in capital markets PMT IS WELL-POSITIONED FOR A CHANGING MORTGAGE MARKET |
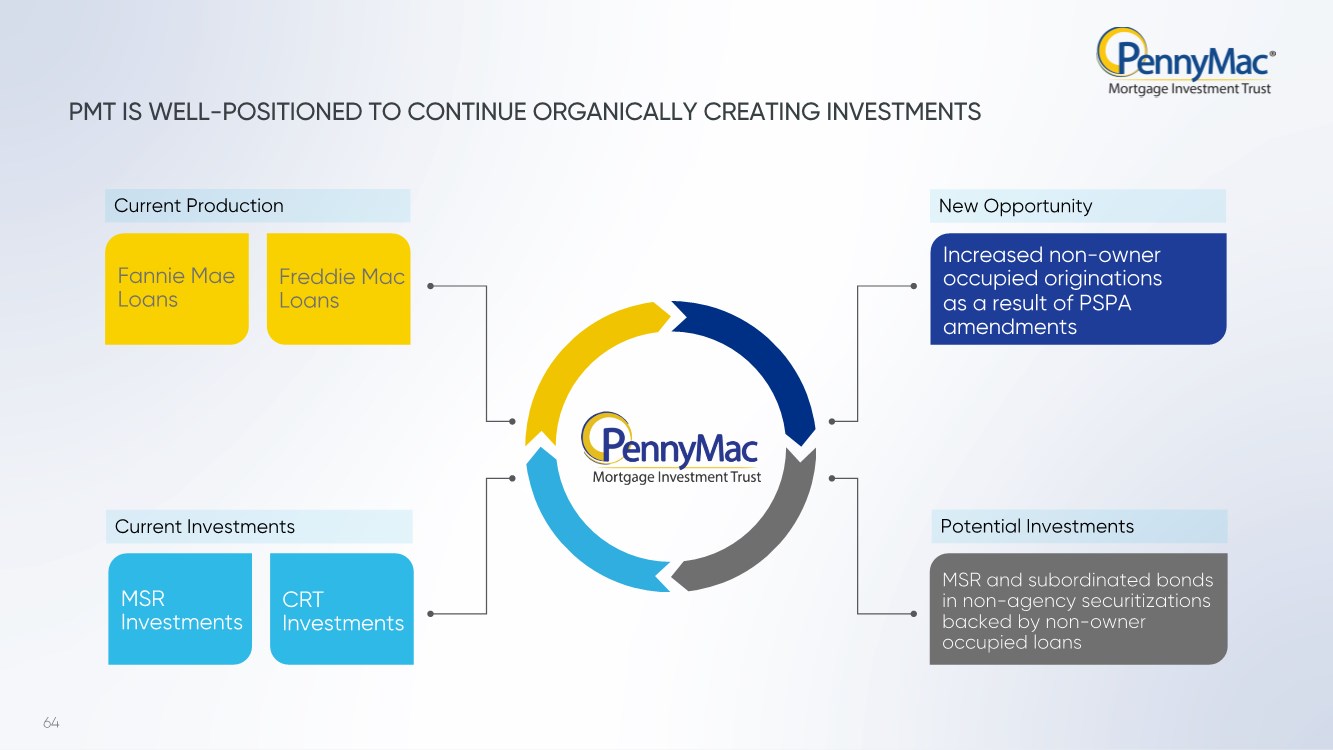
| 64 PMT IS WELL-POSITIONED TO CONTINUE ORGANICALLY CREATING INVESTMENTS Current Production New Opportunity Fannie Mae Loans Freddie Mac Loans Current Investments Potential Investments MSR Investments CRT Investments Increased non-owner occupied originations as a result of PSPA amendments MSR and subordinated bonds in non-agency securitizations backed by non-owner occupied loans |
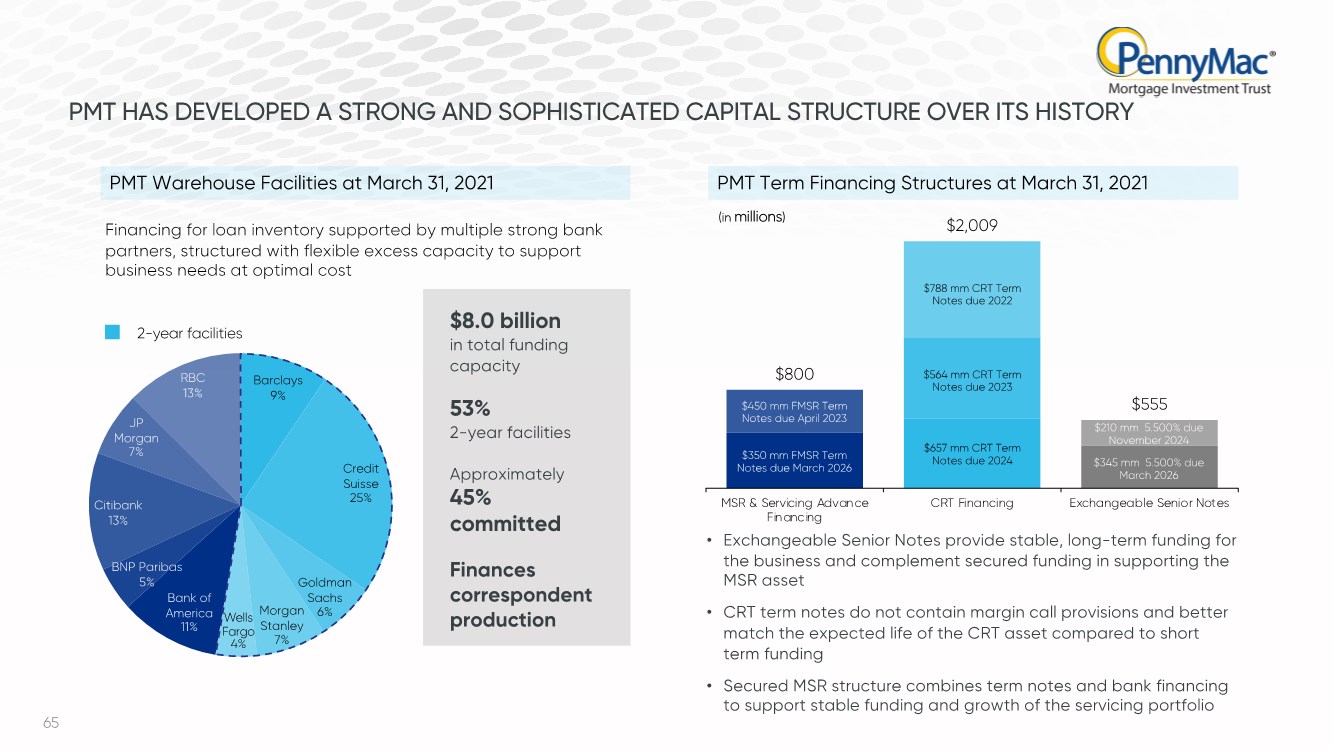
| 65 $800 $2,009 $555 MSR & Servicing Advance Financing CRT Financing Exchangeable Senior Notes $350 mm FMSR Term Notes due March 2026 $788 mm CRT Term Notes due 2022 $564 mm CRT Term Notes due 2023 $657 mm CRT Term Notes due 2024 • Exchangeable Senior Notes provide stable, long-term funding for the business and complement secured funding in supporting the MSR asset • CRT term notes do not contain margin call provisions and better match the expected life of the CRT asset compared to short term funding • Secured MSR structure combines term notes and bank financing to support stable funding and growth of the servicing portfolio $8.0 billion in total funding capacity 53% 2-year facilities Approximately 45% committed Finances correspondent production $450 mm FMSR Term Notes due April 2023 $345 mm 5.500% due March 2026 $210 mm 5.500% due November 2024 Barclays 9% Credit Suisse 25% Goldman Sachs 6% Morgan Stanley 7% Wells Fargo 4% Bank of America 11% BNP Paribas 5% Citibank 13% JP Morgan 7% RBC 13% PMT HAS DEVELOPED A STRONG AND SOPHISTICATED CAPITAL STRUCTURE OVER ITS HISTORY PMT Warehouse Facilities at March 31, 2021 PMT Term Financing Structures at March 31, 2021 2-year facilities Financing for loan inventory supported by multiple strong bank partners, structured with flexible excess capacity to support business needs at optimal cost (in millions) |
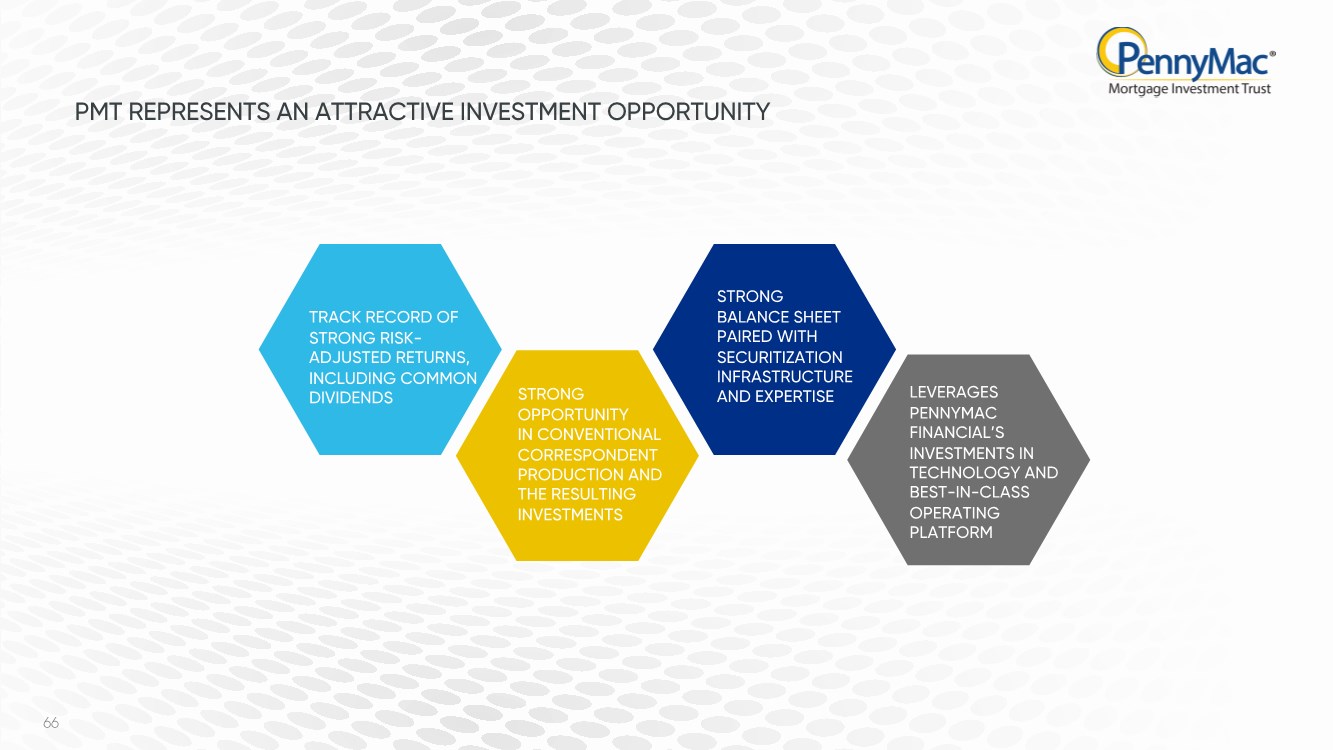
| 66 TRACK RECORD OF STRONG RISK- ADJUSTED RETURNS, INCLUDING COMMON DIVIDENDS STRONG OPPORTUNITY IN CONVENTIONAL CORRESPONDENT PRODUCTION AND THE RESULTING INVESTMENTS STRONG BALANCE SHEET PAIRED WITH SECURITIZATION INFRASTRUCTURE AND EXPERTISE LEVERAGES PENNYMAC FINANCIAL’S INVESTMENTS IN TECHNOLOGY AND BEST-IN-CLASS OPERATING PLATFORM PMT REPRESENTS AN ATTRACTIVE INVESTMENT OPPORTUNITY |
| CAPITAL MANAGEMENT & FINANCIAL OUTLOOK PAM MARSH Senior Managing Director Treasurer DAN PEROTTI Senior Managing Director Chief Financial Officer |

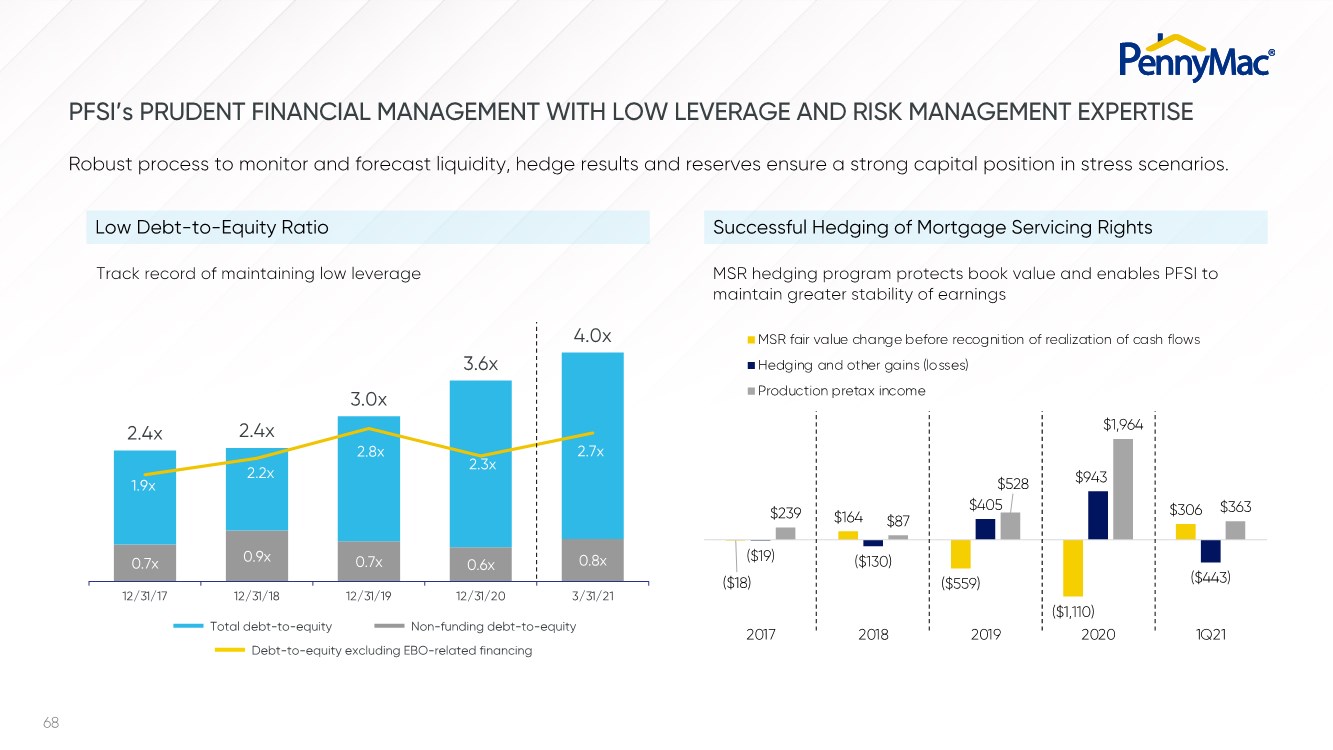
| 68 0.7x 0.9x 0.7x 0.6x 0.8x 2.4x 2.4x 3.0x 3.6x 4.0x 1.9x 2.2x 2.8x 2.3x 2.7x 12/31/17 12/31/18 12/31/19 12/31/20 3/31/21 PFSI’s PRUDENT FINANCIAL MANAGEMENT WITH LOW LEVERAGE AND RISK MANAGEMENT EXPERTISE Robust process to monitor and forecast liquidity, hedge results and reserves ensure a strong capital position in stress scenarios. ($18) $164 ($559) ($1,110) $306 ($19) ($130) $405 $943 ($443) $239 $87 $528 $1,964 $363 2017 2018 2019 2020 1Q21 MSR fair value change before recognition of realization of cash flows Hedging and other gains (losses) Production pretax income Track record of maintaining low leverage MSR hedging program protects book value and enables PFSI to maintain greater stability of earnings Low Debt-to-Equity Ratio Successful Hedging of Mortgage Servicing Rights Non-funding debt-to-equity Debt-to-equity excluding EBO-related financing Total debt-to-equity |
| 69 PFSI HAS DEVELOPED A STRONG AND SOPHISTICATED CAPITAL STRUCTURE OVER ITS HISTORY Financing for loan inventory supported by multiple strong bank partners, structured with flexible excess capacity to support business needs at optimal cost • Unsecured term notes provide stable, long-term funding for the business and complement secured funding in supporting the MSR asset • Secured MSR structure combines term notes and bank financing to support stable funding and growth of the servicing portfolio $1,300 $1,300 MSR & Servicing Advance Financing Senior Unsecured Notes $650 mm GNMA MSR Term Notes due August 2023 $650 mm GNMA MSR Term Notes due February 2023 $650 mm 4.250% due February 2029 $650 mm 5.375% due October 2025 (in millions) Barclays 5% Credit Suisse 27% Goldman Sachs 7% JP Morgan 21% Morgan Stanley 4% Wells Fargo 2% Bank of America 12% BNP Paribas 3% Citibank 7% JP Morgan 5% RBC 7% 2-year facilities PFSI Warehouse Facilities at March 31, 2021 PFSI Term Financing at March 31, 2021 $14.6 billion in total funding capacity 66% 2-year facilities Approximately 27% committed Finances government correspondent, direct lending and early buyout activity |

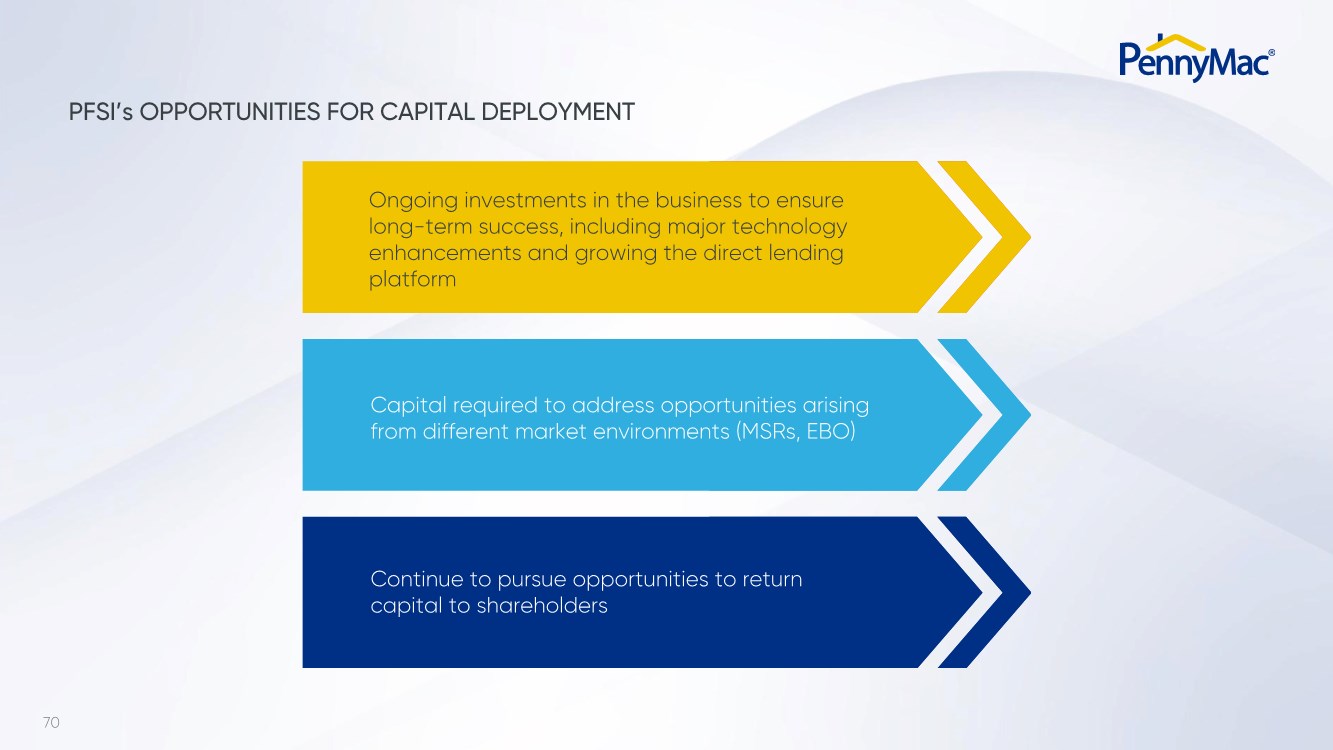
| 70 PFSI’s OPPORTUNITIES FOR CAPITAL DEPLOYMENT Ongoing investments in the business to ensure long-term success, including major technology enhancements and growing the direct lending platform Capital required to address opportunities arising from different market environments (MSRs, EBO) Continue to pursue opportunities to return capital to shareholders |
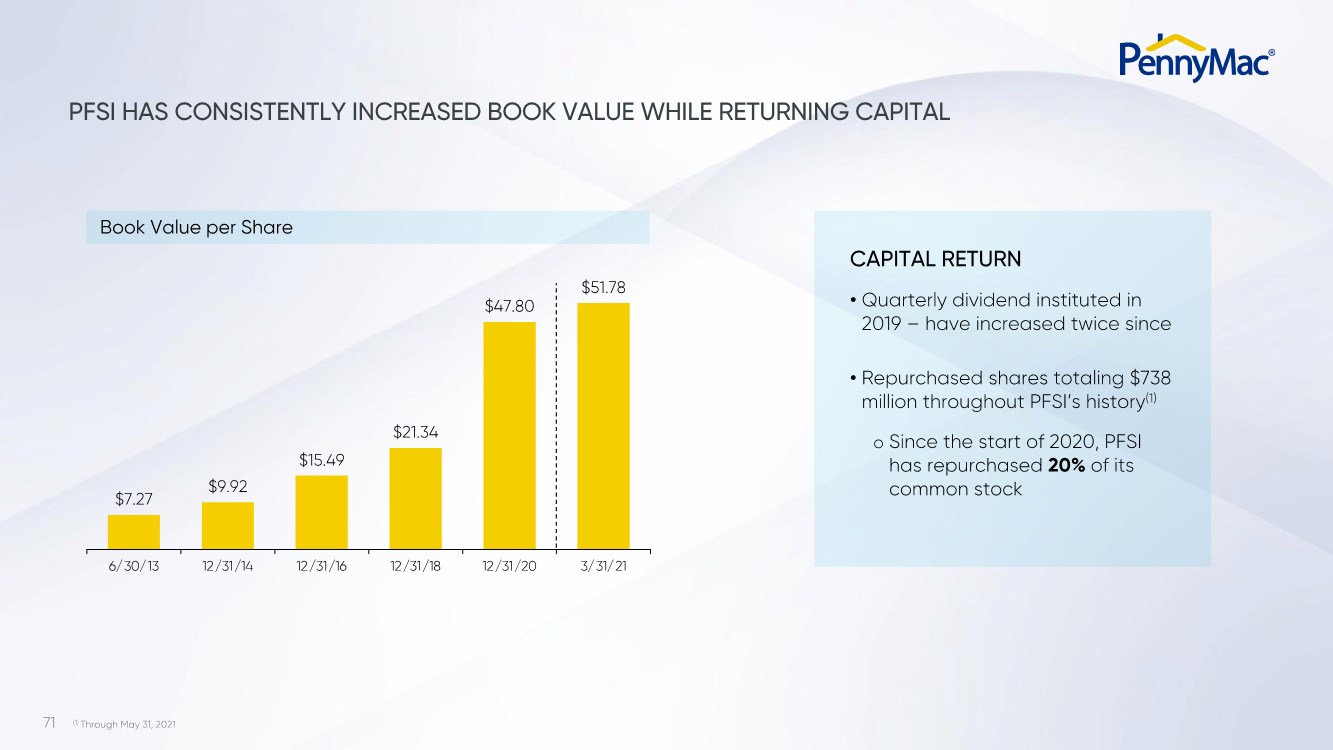
| 71 PFSI HAS CONSISTENTLY INCREASED BOOK VALUE WHILE RETURNING CAPITAL $7.27 $9.92 $15.49 $21.34 $47.80 $51.78 6/30/13 12/31/14 12/31/16 12/31/18 12/31/20 3/31/21 CAPITAL RETURN • Quarterly dividend instituted in 2019 – have increased twice since • Repurchased shares totaling $738 million throughout PFSI’s history(1) o Since the start of 2020, PFSI has repurchased 20% of its common stock Book Value per Share (1) Through May 31, 2021 |
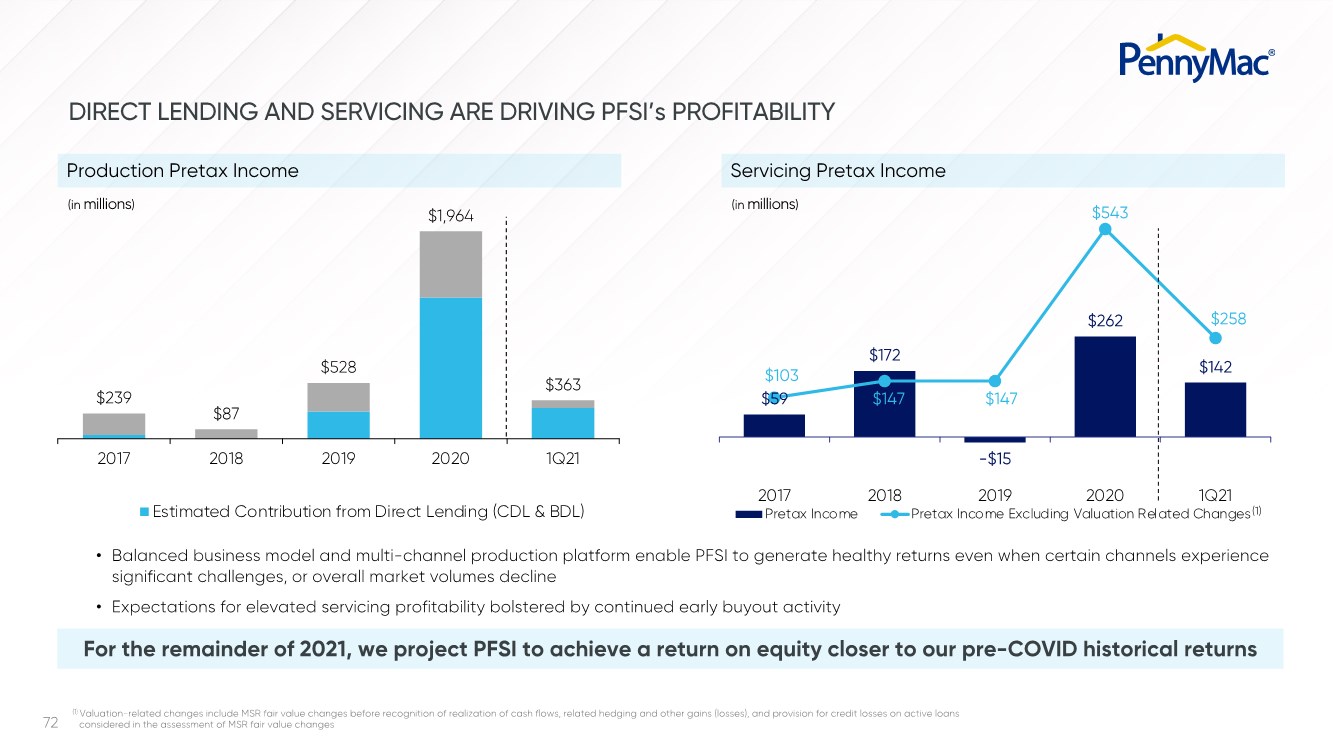
| 72 $59 $172 -$15 $262 $142 $103 $147 $147 $543 $258 2017 2018 2019 2020 1Q21 Pretax Income Pretax Income Excluding Valuation Related Changes $239 $87 $528 $1,964 $363 2017 2018 2019 2020 1Q21 Estimated Contribution from Direct Lending (CDL & BDL) DIRECT LENDING AND SERVICING ARE DRIVING PFSI’s PROFITABILITY For the remainder of 2021, we project PFSI to achieve a return on equity closer to our pre-COVID historical returns • Balanced business model and multi-channel production platform enable PFSI to generate healthy returns even when certain channels experience significant challenges, or overall market volumes decline • Expectations for elevated servicing profitability bolstered by continued early buyout activity (1) Valuation-related changes include MSR fair value changes before recognition of realization of cash flows, related hedging and other gains (losses), and provision for credit losses on active loans considered in the assessment of MSR fair value changes Production Pretax Income Servicing Pretax Income (in millions) (in millions) (1) |
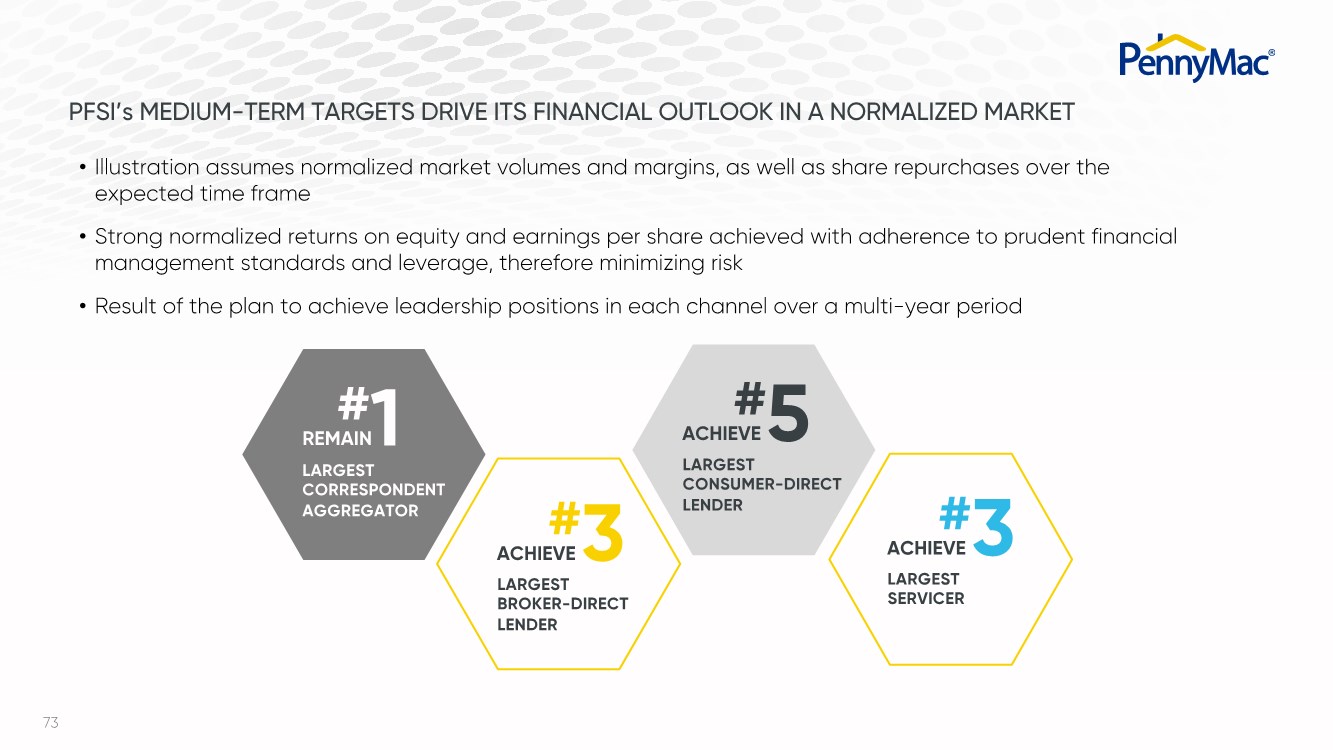
| 73 PFSI’s MEDIUM-TERM TARGETS DRIVE ITS FINANCIAL OUTLOOK IN A NORMALIZED MARKET • Illustration assumes normalized market volumes and margins, as well as share repurchases over the expected time frame • Strong normalized returns on equity and earnings per share achieved with adherence to prudent financial management standards and leverage, therefore minimizing risk • Result of the plan to achieve leadership positions in each channel over a multi-year period LARGEST CORRESPONDENT AGGREGATOR #1 REMAIN #3 ACHIEVE LARGEST BROKER-DIRECT LENDER #5 ACHIEVE LARGEST CONSUMER-DIRECT LENDER #3 ACHIEVE LARGEST SERVICER |
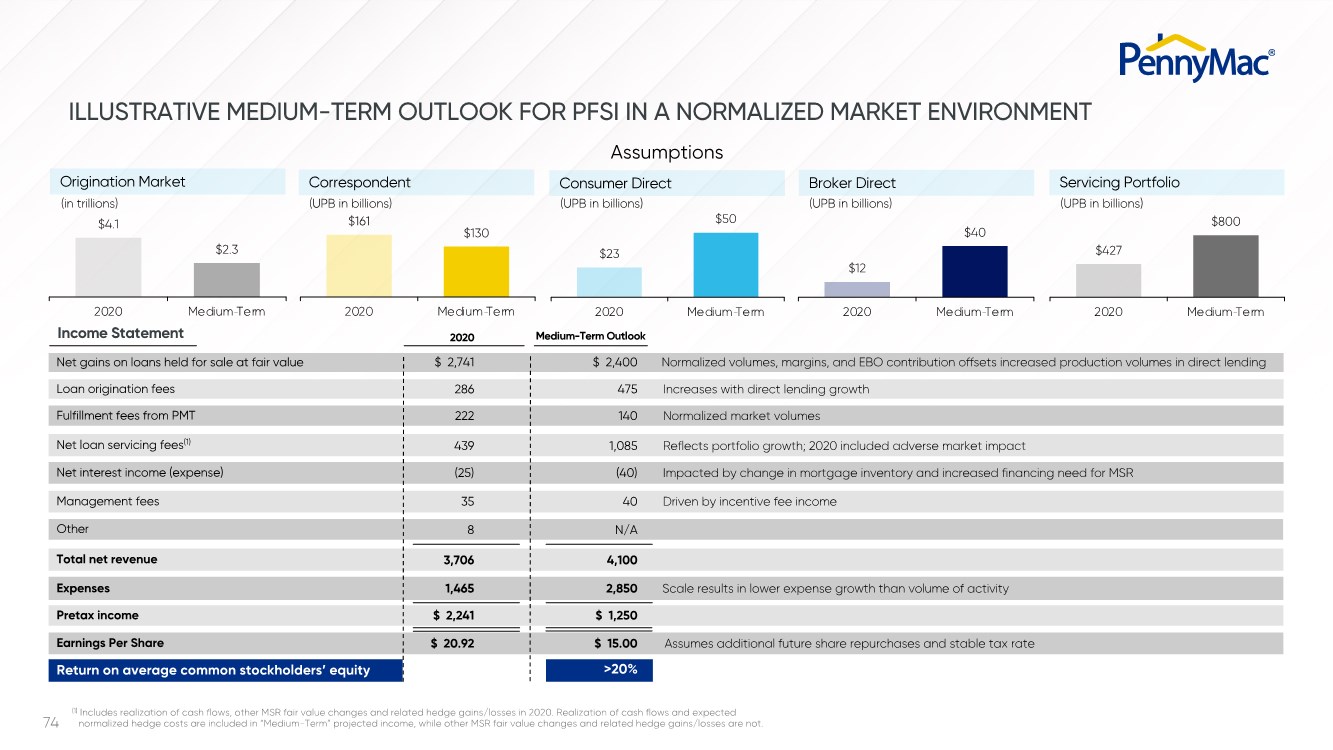
| 74 ILLUSTRATIVE MEDIUM-TERM OUTLOOK FOR PFSI IN A NORMALIZED MARKET ENVIRONMENT $4.1 $2.3 2020 Medium Term $161 $130 2020 Medium Term $23 $50 2020 Medium Term $12 $40 2020 Medium Term $427 $800 2020 Medium Term 2020 Assumptions Correspondent Consumer Direct Broker Direct Servicing Portfolio (UPB in billions) (UPB in billions) (UPB in billions) Origination Market (in trillions) (UPB in billions) Net gains on loans held for sale at fair value Loan origination fees Fulfillment fees from PMT Net loan servicing fees(1) Net interest income (expense) Total net revenue Expenses Pretax income Management fees Other Earnings Per Share Income Statement Medium-Term Outlook Normalized volumes, margins, and EBO contribution offsets increased production volumes in direct lending Increases with direct lending growth Normalized market volumes Reflects portfolio growth; 2020 included adverse market impact Impacted by change in mortgage inventory and increased financing need for MSR Driven by incentive fee income Assumes additional future share repurchases and stable tax rate Scale results in lower expense growth than volume of activity $ 2,741 286 222 439 (25) 35 8 3,706 1,465 $ 2,241 $ 20.92 $ 2,400 475 140 1,085 (40) 40 N/A 4,100 2,850 $ 1,250 $ 15.00 (1) Includes realization of cash flows, other MSR fair value changes and related hedge gains/losses in 2020. Realization of cash flows and expected normalized hedge costs are included in “Medium-Term” projected income, while other MSR fair value changes and related hedge gains/losses are not. Return on average common stockholders’ equity >20% - - - - - |
| APPENDIX |

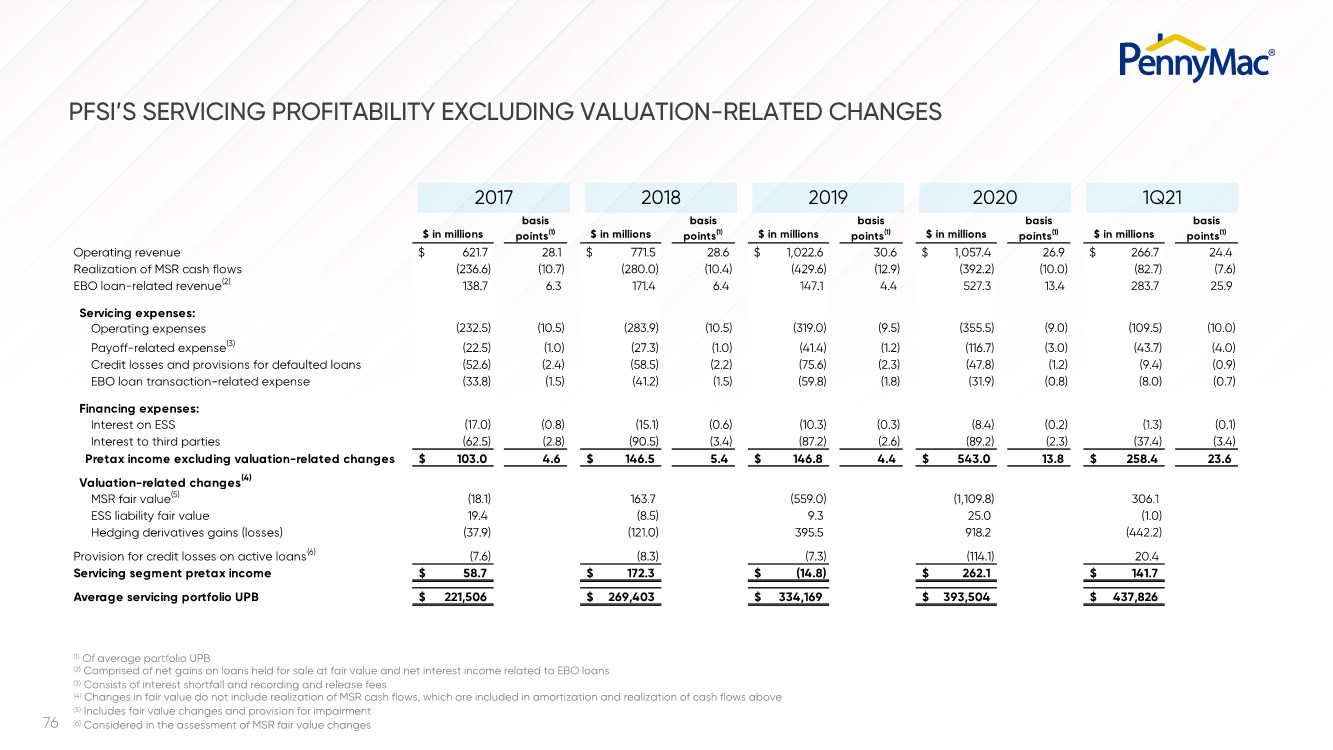
| 76 2017 2018 2019 2020 1Q21 (1) Of average portfolio UPB (2) Comprised of net gains on loans held for sale at fair value and net interest income related to EBO loans (3) Consists of interest shortfall and recording and release fees (4) Changes in fair value do not include realization of MSR cash flows, which are included in amortization and realization of cash flows above (5) Includes fair value changes and provision for impairment (6) Considered in the assessment of MSR fair value changes $ in millions basis points(1) $ in millions basis points(1) $ in millions basis points(1) $ in millions basis points(1) $ in millions basis points(1) Operating revenue 621.7 $ 28.1 771.5 $ 28.6 1,022.6 $ 30.6 1,057.4 $ 26.9 266.7 $ 24.4 Realization of MSR cash flows (236.6) (10.7) (280.0) (10.4) (429.6) (12.9) (392.2) (10.0) (82.7) (7.6) EBO loan-related revenue(2) 138.7 6.3 171.4 6.4 147.1 4.4 527.3 13.4 283.7 25.9 Servicing expenses: Operating expenses (232.5) (10.5) (283.9) (10.5) (319.0) (9.5) (355.5) (9.0) (109.5) (10.0) Payoff-related expense(3) (22.5) (1.0) (27.3) (1.0) (41.4) (1.2) (116.7) (3.0) (43.7) (4.0) Credit losses and provisions for defaulted loans (52.6) (2.4) (58.5) (2.2) (75.6) (2.3) (47.8) (1.2) (9.4) (0.9) EBO loan transaction-related expense (33.8) (1.5) (41.2) (1.5) (59.8) (1.8) (31.9) (0.8) (8.0) (0.7) Financing expenses: Interest on ESS (17.0) (0.8) (15.1) (0.6) (10.3) (0.3) (8.4) (0.2) (1.3) (0.1) Interest to third parties (62.5) (2.8) (90.5) (3.4) (87.2) (2.6) (89.2) (2.3) (37.4) (3.4) Pretax income excluding valuation-related changes 103.0 $ 4.6 146.5 $ 5.4 146.8 $ 4.4 543.0 $ 13.8 258.4 $ 23.6 Valuation-related changes(4) MSR fair value(5) (18.1) 163.7 (559.0) (1,109.8) 306.1 ESS liability fair value 19.4 (8.5) 9.3 25.0 (1.0) Hedging derivatives gains (losses) (37.9) (121.0) 395.5 918.2 (442.2) Provision for credit losses on active loans(6) (7.6) (8.3) (7.3) (114.1) 20.4 Servicing segment pretax income 58.7 $ 172.3 $ (14.8) $ 262.1 $ 141.7 $ Average servicing portfolio UPB 221,506 $ 269,403 $ 334,169 $ 393,504 $ 437,826 $ PFSI’S SERVICING PROFITABILITY EXCLUDING VALUATION-RELATED CHANGES |
Serious News for Serious Traders! Try StreetInsider.com Premium Free!
You May Also Be Interested In
- PennyMac Financial (PFSI) PT Lowered to $112 at Deutsche Bank
- NOVAGOLD Announces Date of its 2024 Virtual Annual General Meeting of Shareholders
- AirBoss Announces Details for AGSM and Q1 2024 Results Timing
Create E-mail Alert Related Categories
SEC FilingsSign up for StreetInsider Free!
Receive full access to all new and archived articles, unlimited portfolio tracking, e-mail alerts, custom newswires and RSS feeds - and more!
