

Form 8-K PS BUSINESS PARKS, INC./ For: May 02
 Tweet
Tweet Share
ShareExhibit 99.1
News Release PS Business Parks, Inc. 701 Western Avenue Glendale, CA 91201-2349 psbusinessparks.com |  | |||||||
PS Business Parks, Inc. Reports Results for the Quarter Ended March 31, 2022
GLENDALE, California, May 2, 2022—PS Business Parks, Inc. (NYSE:PSB), a real estate investment trust (“REIT”), today announced financial and operating results for the quarter ended March 31, 2022.
Financial and Operational Highlights for the Three Months Ended March 31, 2022
•Net income allocable to common stockholders for the three months ended March 31, 2022 was $72.0 million, or $2.60 per diluted common share.
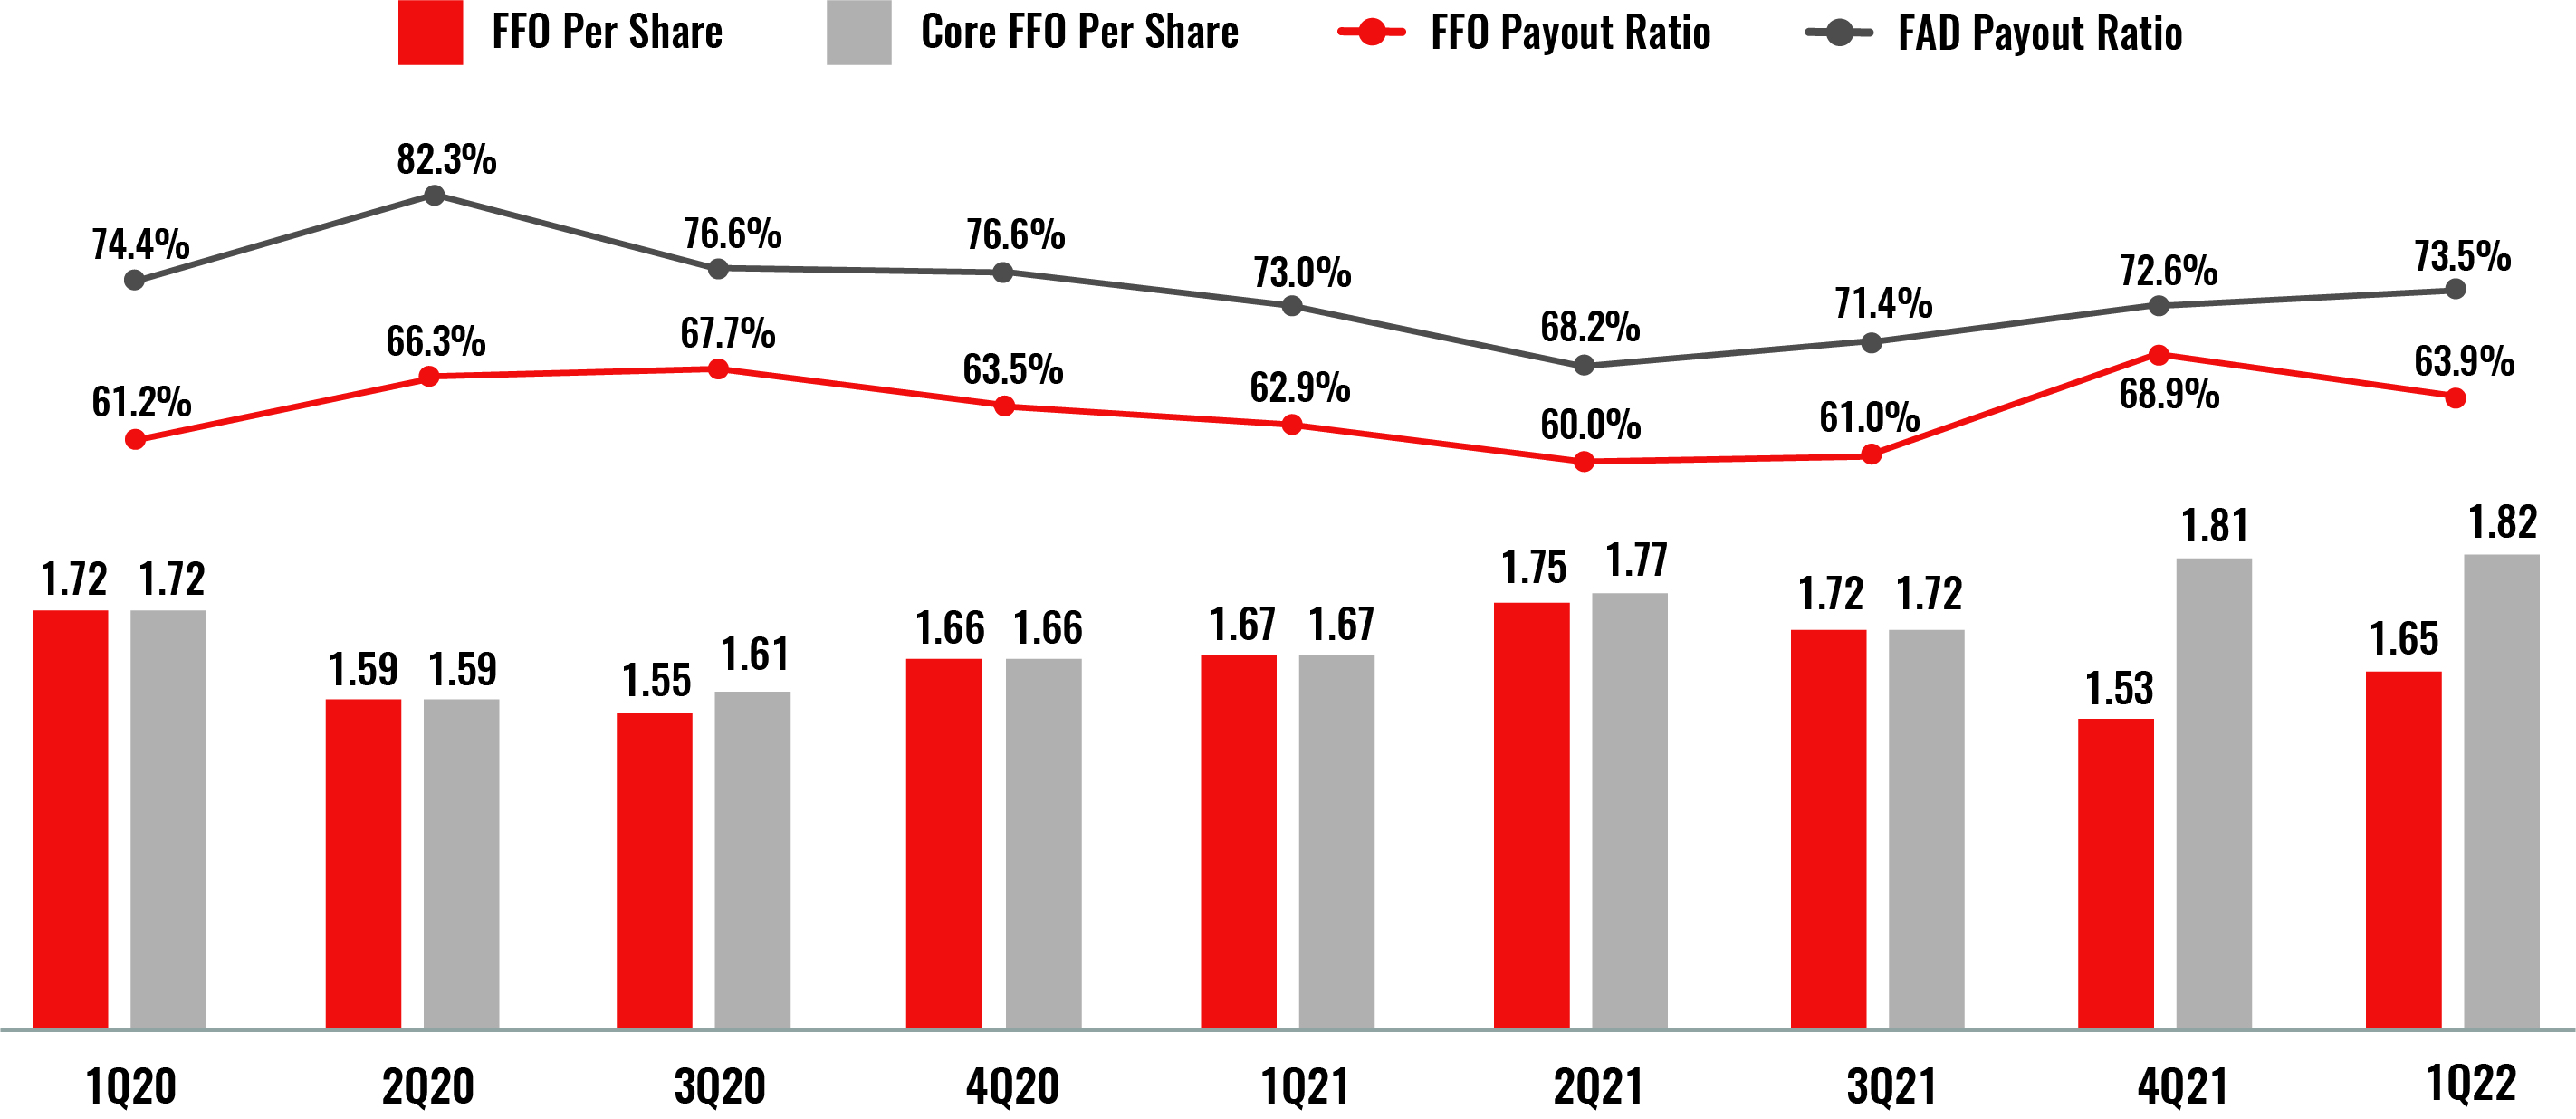
•FFO for the three months ended March 31, 2022 was $1.65 per share, representing a 1.2% decrease from the same period in 2021.
•Core FFO for the three months ended March 31, 2022 was $1.82 per share, representing a 9.0% increase from the same period in 2021.
•Cash NOI for the total portfolio was $78.1 million for the three months ended March 31, 2022, representing a 5.6% increase from the same period in 2021.
•Cash NOI for the Same Park portfolio was $73.7 million for the three months ended March 31, 2022, representing an 8.6% increase from the same period in 2021.
•Weighted average occupancy for the total portfolio was 95.5% during the three months ended March 31, 2022, compared to 93.2% for the same period in 2021.
•Weighted average occupancy for the Same Park portfolio was 96.0% during the three months ended March 31, 2022, compared to 93.3% for the same period in 2021.
•Total portfolio comparable rental rates on 1.7 million square feet of leasing were 23.4% on a GAAP rent growth basis and 10.7% on a cash basis for the three months ended March 31, 2022.
•The Company sold the Royal Tech Business Park, a 702,000 square foot industrial-flex business park located in Irving, Texas, for net sale proceeds of $91.9 million during the three months ended March 31, 2022.
1
Pending Merger Transaction
On April 24, 2022, the Company and PS Business Parks, L.P. (the “OP”) entered into an Agreement and Plan of Merger (the “Merger Agreement”) whereby affiliates of Blackstone Real Estate. (“Blackstone”) will acquire all outstanding shares of the Company’s common stock for $187.50 per share in cash. Subject to the terms and conditions set forth in the Merger Agreement, each share of the Company’s common stock and each common unit of partnership interest of the OP, respectively, will be converted into the right to receive an amount in cash equal to $187.50, without interest. Each share of the Company’s outstanding preferred stock (and each depositary share representing an interest therein) will be unaffected and will remain outstanding in accordance with their respective terms. The merger transaction is expected to close in the third quarter of 2022. However, the merger transaction is subject to customary closing conditions, including approval by the Company’s common stockholders. The Company can provide no assurances regarding whether the merger will close when expected or at all.
Financial Results
Net income allocable to common stockholders for the three months ended March 31, 2022 was $72.0 million, or $2.60 per diluted common share.
FFO for the three months ended March 31, 2022 was $1.65 per share, representing a 1.2% decrease from the same period in 2021. The decrease in FFO per share for the first quarter was due to a one-time cash payment of $6.6 million to the former Chief Executive Officer ("CEO"), for RSUs and a $0.1 million cash payment for COBRA coverage reimbursement, in accordance with his separation agreement, partially offset by $0.6 million non-cash adjustment related to the reversal of stock compensation for the unvested former CEO's shares, net of dividend forfeiture expense. The decrease in FFO was partially offset by lower preferred distributions in the first quarter due to the Series W preferred stock redemption in Q4 2021.
Core FFO for the three months ended March 31, 2022 was $1.82 per share, representing a 9.0% increase from the same period in 2021. Core FFO excludes the impact of the one-time cost associated with the Company's payout of the above-mentioned former CEO compensation expense.
FAD for the quarter ended March 31, 2022 was $50.2 million, representing a 0.1% decrease from the same period in 2021. The decrease in FAD for the quarter ended March 31, 2022 is primarily attributable to higher recurring capital expenditures compared to the same period in the prior year, virtually offset by higher Same Park Cash NOI driven by higher weighted average occupancy combined with higher cash rent growth compared to the same period in the prior year.
Same Park NOI was $74.1 million for the three months ended March 31, 2022, representing a 7.7% increase over the same period in 2021.
The Company also reports NOI on a cash basis, which excludes non-cash rental income such as amortization of deferred rent receivable and other non-cash items. Same Park Cash NOI was $73.7 million for the quarter ended March 31, 2022, representing an 8.6% increase over the same period in 2021. The increase in Same Park Cash NOI for the three months ended March 31, 2022 was primarily driven by higher weighted average occupancy in the first quarter of 2022, which was 96.0% versus 93.3% for the same period in 2021. The Company noted that Same Park Cash Rental Income per occupied square foot increased by 4.6% during the period, from $16.10 in 2021 to $16.84 in 2022.
The following table presents the unaudited details of the change in Same Park rental income for the three months ended March 31, 2022 and 2021 (in thousands):
| Three Months Ended March 31, | |||||||||||||||||||||||
| 2022 | 2021 | $ Change | % Change | ||||||||||||||||||||
| Rental income | |||||||||||||||||||||||
| Base rental income | $ | 77,002 | $ | 71,600 | $ | 5,402 | 7.5% | ||||||||||||||||
| Expense recovery income | 26,545 | 24,022 | 2,523 | 10.5% | |||||||||||||||||||
| Lease buyout income | 245 | 377 | (132) | (35.0)% | |||||||||||||||||||
| Rent receivable recovery/(write-off) | (87) | (1) | (86) | 8600.0% | |||||||||||||||||||
| Abatements | (2) | (83) | 81 | (97.6)% | |||||||||||||||||||
| Deferrals | — | (187) | 187 | (100.0)% | |||||||||||||||||||
| Deferral repayments, net | 147 | 738 | (591) | (80.1)% | |||||||||||||||||||
| Fee Income | 246 | 172 | 74 | 43.0% | |||||||||||||||||||
| Cash Rental Income | 104,096 | 96,638 | 7,458 | 7.7% | |||||||||||||||||||
Non-Cash Rental Income (1) | 918 | 1,374 | (456) | (33.2)% | |||||||||||||||||||
| Total rental income | $ | 105,014 | $ | 98,012 | $ | 7,002 | 7.1% | ||||||||||||||||
(1)Non-cash rental income includes amortization of deferred rent receivable (net of write-offs), in-place lease intangible, tenant improvement reimbursement, and lease incentives.
2
The following table presents the unaudited operating results of the Company’s Same Park facilities for the three months ended March 31, 2022 and 2021 (in thousands, except per square foot amounts):
| Three Months Ended March 31, | |||||||||||||||||||||||
| 2022 | 2021 | $ Change | % Change | ||||||||||||||||||||
| Rental income | |||||||||||||||||||||||
Cash Rental Income (1) | $ | 104,096 | $ | 96,638 | $ | 7,458 | 7.7% | ||||||||||||||||
Non-Cash Rental Income (2) (3) | 918 | 1,374 | (456) | (33.2)% | |||||||||||||||||||
| Total rental income | 105,014 | 98,012 | 7,002 | 7.1% | |||||||||||||||||||
| Cost of Operations | |||||||||||||||||||||||
| Property taxes | 11,788 | 11,197 | 591 | 5.3% | |||||||||||||||||||
| Utilities | 4,637 | 4,417 | 220 | 5.0% | |||||||||||||||||||
| Repairs and maintenance | 5,679 | 5,244 | 435 | 8.3% | |||||||||||||||||||
| Compensation | 5,168 | 4,559 | 609 | 13.4% | |||||||||||||||||||
| Snow removal | 846 | 1,002 | (156) | (15.6)% | |||||||||||||||||||
| Property insurance | 1,268 | 1,167 | 101 | 8.7% | |||||||||||||||||||
| Other expenses | 1,514 | 1,589 | (75) | (4.7)% | |||||||||||||||||||
Total Cost of Operations (1) | 30,900 | 29,175 | 1,725 | 5.9% | |||||||||||||||||||
| Less: Non-cash stock based compensation in operating costs | (496) | (421) | (75) | 17.8% | |||||||||||||||||||
| Total Cash Cost of Operations | 30,404 | 28,754 | 1,650 | 5.7% | |||||||||||||||||||
NOI (1) | $ | 74,114 | $ | 68,837 | $ | 5,352 | 7.7% | ||||||||||||||||
Cash NOI (1) | $ | 73,692 | $ | 67,884 | $ | 5,808 | 8.6% | ||||||||||||||||
| Selected Statistical Data | |||||||||||||||||||||||
| Square footage at period end | $ | 25,749 | $ | 25,749 | — | — | |||||||||||||||||
NOI margin (1) | 70.6 | % | 70.2 | % | 0.4% | ||||||||||||||||||
Cash NOI margin (1) | 70.8 | % | 70.2 | % | 0.6% | ||||||||||||||||||
| Weighted average square foot occupancy | 96.0 | % | 93.3 | % | 2.7% | ||||||||||||||||||
Revenue per Occupied Square Foot (1) | $ | 16.99 | $ | 16.32 | $ | 0.67 | 4.1% | ||||||||||||||||
Cash Rental Income per Occupied Square Foot (1) | $ | 16.84 | $ | 16.10 | $ | 0.74 | 4.6% | ||||||||||||||||
(1)Defined in Definitions/Non-GAAP Discussion.
(2)Detail of the components of Cash Rental Income can be found in the table presented under financial results above.
(3)Same Park Non-Cash Rental Income is presented net of deferred rent receivable write-offs of $0.0 and $0.1 million for the three months ended March 31, 2022 and 2021, respectively.
3
Operating Results
Total portfolio weighted average occupancy was 95.5% during the three months ended March 31, 2022, compared to 93.2% for the same period in 2021.
Leasing Production
During the three months ended March 31, 2022, the Company executed leases on 1.7 million square feet, respectively, compared to 1.9 million square feet for the three months ended March 31, 2021. The table below represents GAAP rent growth (1) and cash rental rate growth by product type for leases executed during the three months ended March 31, 2022.
| Three Months Ended March 31, 2022 | |||||||||||||||||
| Product type | Leasing volume | Cash rental rate growth | GAAP rental rate growth | ||||||||||||||
| Industrial | 1,204,000 | 15.4 | % | 30.9 | % | ||||||||||||
| Industrial-flex | 318,000 | 5.9 | % | 15.6 | % | ||||||||||||
| Office | 128,000 | (6.8) | % | (0.1) | % | ||||||||||||
| Total | 1,650,000 | 10.7 | % | 23.4 | % | ||||||||||||
The average lease term of the leases executed during the three months ended March 31, 2022 was 3.5 years, with associated average transaction costs (tenant improvements and leasing commissions) of $3.22 per square foot. For comparative purposes, average lease term and transaction costs on leases executed in the same period of 2021 were 3.3 years and $2.58 per square foot, respectively.
(1) GAAP rent represents average rental payments for the term of a lease on a straight-line basis in accordance with U.S. generally accepted accounting principles (“GAAP”) and excludes operating expense reimbursements.
COVID-19 Pandemic/Rent Collections Update
Since the onset of the COVID-19 pandemic, the Company entered into rent relief agreements consisting of $6.2 million of rent deferrals and $1.6 million of rent abatements. As of March 31, 2022, the 307 current customers that received rent relief account for 9.6% of rental income. Also as of March 31, 2022, the Company had collected $5.4 million of rent deferral repayment, representing 99.8% of the amounts scheduled to be repaid through March 31, 2022. An additional $0.8 million of rent deferral repayment is scheduled to be repaid thereafter.
Acquisition and Dispositions Update
In March 2022, the Company sold the Royal Tech Business Park, a 702,000 square foot industrial-flex business park located in Irving, Texas, for net sale proceeds of $91.9 million.
Distributions Declared
On April 29, 2022, the Company’s Board of Directors declared a quarterly dividend of $1.05 per common share. Distributions were also declared on the various series of depository shares, each representing 1/1,000 of a share of preferred stock. Distributions for both shares of common stock and preferred stock will be payable on June 30, 2022 to stockholders of record on June 15, 2022.
4
Supplemental Information and Investor Presentation
The Company’s supplemental financial reporting package as well as an updated investor presentation are available on the Company’s investor relations website at www.ir.psbusinessparks.com.
Company Information
PS Business Parks, Inc. (NYSE:PSB), a S&P MidCap 400 company, is a REIT that acquires, develops, owns, and operates commercial properties, predominantly multi-tenant industrial, industrial-flex, and low-rise suburban office space. Located primarily in major coastal markets, PS Business Parks’ 96 properties serve approximately 4,900 tenants in 27.0 million square feet of space as of March 31, 2022. The portfolio also includes 800 residential units (including units in-process).
Additional Information and Where to Find It
In connection with the proposed transaction, the Company will file relevant materials with the U.S. Securities and Exchange Commission (the “SEC”), including the Company’s proxy statement on Schedule 14A (the “Proxy Statement”). This press release is not a substitute for the Proxy Statement or any other document that the Company may file with the SEC or send to its stockholders in connection with the proposed transactions. BEFORE MAKING ANY VOTING DECISION, STOCKHOLDERS OF THE COMPANY ARE URGED TO READ ALL RELEVANT DOCUMENTS FILED WITH THE SEC, INCLUDING THE PROXY STATEMENT, WHEN THEY BECOME AVAILABLE BECAUSE THEY WILL CONTAIN IMPORTANT INFORMATION ABOUT THE PROPOSED TRANSACTION. Investors and security holders will be able to obtain the documents (when available) free of charge at the SEC’s website, http://www.sec.gov. In addition, the documents (when available) may be obtained free of charge by accessing the Investor Relations section of the Company’s website at https://ir.psbusinessparks.com or by contacting the Company’s Investor Relations by email at info@psbusinessparks.com.
Participants in the Solicitation
The Company and its directors and executive officers may be deemed to be participants in the solicitation of proxies from the holders of Company common stock in respect of the proposed transaction. Information about the directors and executive officers of the Company is set forth in the proxy statement for the Company’s 2022 annual meeting of stockholders, which was filed with the SEC on March 25, 2022, in the Company’s Annual Report on Form 10-K for the fiscal year ended December 31, 2021, which was filed with the SEC on February 22, 2022 and in other documents filed by the Company with the SEC. Other information regarding the participants in the proxy solicitation and a description of their direct and indirect interests, by security holdings or otherwise, will be contained in the Proxy Statement and other relevant materials to be filed with the SEC in respect of the proposed transaction when they become available. Investors should read the Proxy Statement carefully when it becomes available before making any voting or investment decisions.
Forward-Looking Statements
When used within this press release, the words “may,” “believes,” “anticipates,” “plans,” “expects,” “seeks,” “estimates,” “intends,” and similar expressions are intended to identify “forward-looking statements.” Such forward-looking statements involve known and unknown risks, uncertainties, and other factors, which may cause the actual results and performance of the Company to be materially different from those expressed or implied in the forward-looking statements, including but not limited to: (i) the occurrence of any event, change or other circumstance that could give rise to the termination of the merger agreement; (ii) the failure to obtain the approval of PSB’s stockholders of the proposed transaction or the failure to satisfy any of the other conditions to the completion of the proposed transaction; (iii) stockholder litigation in connection with the proposed transaction, which may affect the timing or occurrence of the proposed transaction or result in significant costs of defense, indemnification and liability; (iv) the effect of the announcement of the proposed transaction on the ability of PSB to retain and hire key personnel and maintain relationships with its tenants, vendors and others with whom it does business, or on its operating results and businesses generally; (v) risks associated with the disruption of management’s attention from ongoing business operations due to the proposed transaction; (vi) the ability to meet expectations regarding the timing and completion of the proposed transaction; (vii) significant transaction costs, fees, expenses and charges; (viii) the duration and severity of the coronavirus (“COVID-19”) pandemic and its impact on our business and our customers; (ix) changes in general economic and business conditions, including as a result of the economic fallout of the COVID-19 pandemic; (x) potential regulatory actions to close our facilities or limit our ability to evict delinquent customers; (xi) decreases in rental rates or increases in vacancy rates/failure to renew or replace expiring leases; (xii) tenant defaults; (xiii) the effect of the recent credit and financial market conditions; (xiv) our failure to maintain our status as a real estate investment trust (a “REIT”) under the Internal Revenue Code of 1986, as amended (the “Code”); (xv) the economic health of our customers; (xvi) the health of our officers and directors; (xvii) increases in operating costs; (xviii) casualties to our properties not covered by insurance; (xix) the availability and cost of capital; (xx) increases in interest rates and its effect on our stock price; (xxi) security breaches, including ransomware, or a failure of our networks, systems or technology which could adversely impact our operations or our business, customer and employee relationships or result in fraudulent payments; (xxii) the impact of inflation; and (xxiii) other factors discussed in the Company’s SEC reports, including quarterly reports on Form 10-Q, reports on Form 8-K, and annual reports on Form 10-K.
Additional information about PS Business Parks, Inc., including more financial analysis of the first quarter operating results, is available on the Company’s website at psbusinessparks.com.
5
| Contact: | ||
| Investor Relations: | ||
| Adeel Khan | ||
| (818) 244-8080, Ext 8975 | ||
6
Definitions/Discussion of Non-GAAP Financial Measures
Cash NOI – We utilize cash NOI to evaluate the cash flow performance of our business parks. Cash NOI represents NOI adjusted to exclude non-cash items included in rental income and non-cash expenses. The non-cash rental income includes amortization of deferred rent receivable (net of write-offs), in-place lease intangible, tenant improvement reimbursements, and lease incentives. The non-cash expense is equal to stock compensation expense for employees whose compensation expense is recorded in GAAP cost of operations in the amount of $0.5 million for each of the three months ended March 31, 2022 and 2021. We believe that cash NOI assists investors in analyzing cash flow performance of our business parks.
Cash NOI Margin – Cash NOI margin is computed by dividing Cash NOI by Cash Rental Income.
Cash Rental Income – Cash rental income represents rental income, excluding non-cash rental income, specifically amortization of deferred rent receivable (net of write-offs), in-place lease intangible, tenant improvement reimbursements, and lease incentives.
Cash Rental Income per Occupied Square Feet – Computed by dividing Cash rental income for the period by weighted average occupied square feet. Cash rental income per occupied square feet for the three month period shown is annualized.
Core Funds from Operations (Core FFO) – We calculate Core FFO by adjusting FFO, as defined below, excluding the impact of (i) charges related to the redemption of preferred stock and (ii) other nonrecurring income or expense items as appropriate. Management believes that Core FFO is a useful supplemental measure as it provides a more meaningful and consistent comparison of operating performance and allows investors to more easily compare the Company’s operating results. Because certain of these adjustments have a real economic impact on our financial condition and results from operations, the utility of Core FFO as a measure of our performance is limited. Other REITs may not calculate Core FFO in a consistent manner. Accordingly, our Core FFO may not be comparable to other REITs’ Core FFO. Core FFO should be considered only as a supplement to net income computed in accordance with GAAP as a measure of our performance.
Cost of Operations under Cash NOI – Cash cost of operations represents cost of operations, excluding non-cash stock compensation expense for employees whose compensation expense is recorded in cost of operations in the amount of $0.5 million, for each of the three months ended March 31, 2022 and 2021, which can vary significantly period to period based upon the performance of the Company.
Funds Available for Distribution (FAD) – FAD is a non-GAAP measure that represents FFO adjusted to (a) deduct recurring capital improvements that maintains the condition of our real estate, tenant improvements and lease commissions and (b) remove certain non-cash rental income or expenses such as amortization of deferred rent receivable and non-cash stock compensation expense, and (c) charges related to the redemption of preferred stock. We believe our presentation of FAD assists investors and analysts in analyzing and comparing our operating and financial performance between reporting periods. FAD is not a substitute for GAAP net cash flow in evaluating our liquidity or ability to pay dividends, because they exclude investing and financing activities presented on our statements of cash flows.
Funds from Operations (FFO) – We calculate FFO in accordance with the standards established by the National Association of Real Estate Investment Trusts (“NAREIT”). FFO represents net income (loss) (computed in accordance with GAAP), excluding gains (or losses) from sales of depreciable operating property, gains (or losses) from sales of assets incidental to our business, impairment losses of depreciable operating property or assets incidental to our business, real estate related depreciation and amortization (excluding amortization of deferred financing costs and amortization of above/below-market lease intangibles) and after adjustments for unconsolidated joint ventures. Management uses FFO as a supplemental performance measure because, in excluding real estate related depreciation and amortization, gains and losses from property dispositions, other than temporary impairments of unconsolidated real estate entities, and impairment on our investment in real estate, it provides a performance measure that, when compared year over year, captures trends in occupancy rates, rental rates and operating costs. We also believe that, as a widely recognized measure of performance used by other REITs, FFO may be used by investors as a basis to compare our operating performance with that of other REITs. However, because FFO excludes depreciation and amortization and captures neither the changes in the value of our properties that result from use or market conditions nor the level of capital expenditures and leasing commissions necessary to maintain the operating performance of our properties, all of which have real economic effects and could materially impact our results from operations, the utility of FFO as a measure of our performance is limited. Other equity REITs may not calculate or interpret FFO in accordance with the NAREIT definition as we do, and, accordingly, our FFO may not be comparable to such other REITs’ FFO. FFO should not be used as a measure of our liquidity and is not indicative of funds available for our cash needs, including our ability to pay dividends. FFO should be considered only as a supplement to net income computed in accordance with GAAP as a measure of our performance. A reconciliation of net income, the nearest GAAP equivalent, to FFO is under the additional financial data section.
Net Operating Income (NOI) – We utilize NOI, a non-GAAP financial measure, to evaluate the operating performance of our business parks. We define NOI as rental income less cost of operations. We believe NOI assists investors in analyzing the performance and value of our business parks by excluding (i) corporate overhead (i.e. general and administrative expenses) because it does not relate to the results of our business parks and (ii) depreciation and amortization expense because it does not accurately reflect changes in the fair value of our business parks.
NOI Margin – NOI margin is computed by dividing NOI by rental income.
7
Revenue Per Occupied Square Foot – Computed by dividing rental income for the period by weighted average occupied for the same period. Revenue per occupied square foot for the three month period shown is annualized.
Same Park – The Company believes that evaluation of the Same Park portfolio, defined as all properties owned and operated as of March 31, 2022 that were acquired prior to January 1, 2020, provides an informative view of how the Company’s portfolio has performed over comparable periods. As of March 31, 2022, the Same Park portfolio consisted of 25.7 million square feet, or 95.3% of the Company’s 27.0 million total square feet, excluding the Company’s 95.0% interest in a 395-unit multifamily property.
Additional financial data is attached.
8
PS BUSINESS PARKS, INC.
CONSOLIDATED BALANCE SHEETS
(In thousands, except share data)
| March 31, 2022 | December 31, 2021 | ||||||||||
| (unaudited) | |||||||||||
| ASSETS | |||||||||||
| Cash and cash equivalents | $ | 104,204 | $ | 27,074 | |||||||
| Real estate facilities, at cost | |||||||||||
| Land | 865,214 | 867,345 | |||||||||
| Buildings and improvements | 2,244,104 | 2,239,137 | |||||||||
| 3,109,318 | 3,106,482 | ||||||||||
| Accumulated depreciation | (1,197,811) | (1,178,397) | |||||||||
| 1,911,507 | 1,928,085 | ||||||||||
| Properties held for sale, net | — | 33,609 | |||||||||
| Land and building held for development, net | 97,212 | 78,990 | |||||||||
| 2,008,719 | 2,040,684 | ||||||||||
| Rent receivable | 2,988 | 1,621 | |||||||||
| Deferred rent receivable | 37,484 | 37,581 | |||||||||
| Other assets | 13,176 | 16,262 | |||||||||
| Total assets | $ | 2,166,571 | $ | 2,123,222 | |||||||
| LIABILITIES AND EQUITY | |||||||||||
| Accrued and other liabilities | $ | 95,509 | $ | 97,151 | |||||||
| Credit facility | 20,000 | 32,000 | |||||||||
| Total liabilities | 115,509 | 129,151 | |||||||||
| Commitments and contingencies | |||||||||||
| Equity | |||||||||||
| PS Business Parks, Inc.’s stockholders’ equity | |||||||||||
| Preferred stock, $0.01 par value, 50,000,000 shares authorized, 30,200 shares issued and outstanding at March 31, 2022 and December 31, 2021 | 755,000 | 755,000 | |||||||||
| Common stock, $0.01 par value, 100,000,000 shares authorized, 27,627,443 and 27,589,807 shares issued and outstanding at March 31, 2022 and December 31, 2021, respectively | 276 | 275 | |||||||||
| Paid-in capital | 754,387 | 752,444 | |||||||||
| Accumulated earnings | 270,243 | 226,737 | |||||||||
| Total PS Business Parks, Inc.’s stockholders’ equity | 1,779,906 | 1,734,456 | |||||||||
| Noncontrolling interests | 271,156 | 259,615 | |||||||||
| Total equity | 2,051,062 | 1,994,071 | |||||||||
| Total liabilities and equity | $ | 2,166,571 | $ | 2,123,222 | |||||||
9
PS BUSINESS PARKS, INC.
CONSOLIDATED STATEMENTS OF INCOME
(Unaudited, in thousands)
| Three Months Ended March 31, | |||||||||||
| 2022 | 2021 | ||||||||||
| Rental income | $ | 112,840 | $ | 108,047 | |||||||
| Expenses | |||||||||||
| Cost of operations | 34,114 | 33,218 | |||||||||
| Depreciation and amortization | 23,132 | 22,985 | |||||||||
| General and administrative | 11,324 | 4,382 | |||||||||
| Total operating expenses | 68,570 | 60,585 | |||||||||
| Interest and other income | 246 | 256 | |||||||||
| Interest and other expense | (330) | (211) | |||||||||
| Gain on sale of real estate facilities | 56,959 | — | |||||||||
| Net income | 101,145 | 47,507 | |||||||||
| Allocation to noncontrolling interests | (19,049) | (7,411) | |||||||||
| Net income allocable to PS Business Parks, Inc. | 82,096 | 40,096 | |||||||||
| Allocation to preferred stockholders based upon distributions | (9,580) | (12,046) | |||||||||
| Allocation to restricted stock unit holders | (523) | (164) | |||||||||
| Net income allocable to common stockholders | $ | 71,993 | $ | 27,886 | |||||||
| Net income per share of common stock | |||||||||||
| Basic | $ | 2.61 | $ | 1.01 | |||||||
| Diluted | $ | 2.60 | $ | 1.01 | |||||||
| Weighted average common stock outstanding | |||||||||||
| Basic | 27,607 | 27,495 | |||||||||
| Diluted | 27,691 | 27,594 | |||||||||
10
PS BUSINESS PARKS, INC.
Computation of FFO, Core FFO, and FAD
(Unaudited and in thousands, except per share amounts)
| Three Months Ended March 31, | |||||||||||
| 2022 | 2021 | ||||||||||
| Net income allocable to common stockholders | $ | 71,993 | $ | 27,886 | |||||||
| Adjustments | |||||||||||
| Gain on sale of real estate facilities | (56,959) | — | |||||||||
| Depreciation and amortization | 23,132 | 22,985 | |||||||||
| Net income allocable to noncontrolling interests | 19,049 | 7,411 | |||||||||
| Net income allocable to restricted stock unit holders | 523 | 164 | |||||||||
| FFO allocated to joint venture partner | (23) | (27) | |||||||||
FFO allocable to diluted common stock and units (1) | 57,715 | 58,419 | |||||||||
| CEO cash payment for RSUs net of reversal of stock compensation | 6,108 | — | |||||||||
Core FFO allocable to diluted common stock and units (1) | $ | 63,823 | $ | 58,419 | |||||||
| FAD | |||||||||||
FFO allocable to diluted common stock and units (1) | $ | 57,715 | $ | 58,419 | |||||||
| Adjustments: | |||||||||||
| Recurring capital improvements | (2,010) | (565) | |||||||||
| Tenant improvements | (3,027) | (2,422) | |||||||||
| Capitalized lease commissions | (1,304) | (1,784) | |||||||||
| Total recurring capital expenditures for assets sold or held for sale | (8) | (634) | |||||||||
| Cash paid for taxes in lieu of stock upon vesting of restricted stock units | (931) | (3,197) | |||||||||
Non-cash rental income (1) | (1,157) | (1,307) | |||||||||
| Non-cash stock compensation expense | 940 | 1,780 | |||||||||
FAD allocable to diluted common stock and units (1) | 50,218 | 50,290 | |||||||||
Distributions to common stockholders, noncontrolling interests, and restricted stock unit holders | $ | (36,892) | $ | (36,724) | |||||||
| Distribution payout ratio | (73.5) | % | (73.0) | % | |||||||
| Reconciliation of Earnings per share to FFO per share | |||||||||||
| Net income per common stock—diluted | $ | 2.60 | $ | 1.01 | |||||||
| Gain on sale of real estate facilities | (1.63) | — | |||||||||
| Depreciation and amortization expense | 0.66 | 0.66 | |||||||||
| Net income allocated to restricted stock unit holders | 0.02 | — | |||||||||
FFO per share (1) | $ | 1.65 | $ | 1.67 | |||||||
| CEO cash payment for RSUs net of reversal of stock compensation | 0.17 | — | |||||||||
| Core FFO per share | $ | 1.82 | $ | 1.67 | |||||||
| Weighted average outstanding | |||||||||||
| Common stock | 27,607 | 27,495 | |||||||||
| Operating partnership units | 7,305 | 7,305 | |||||||||
| Restricted stock units | 45 | 47 | |||||||||
| Common stock equivalents | 84 | 99 | |||||||||
| Total diluted common stock and units | 35,041 | 34,946 | |||||||||
(1) Defined in Definitions/Non-GAAP Discussion.
11
PS BUSINESS PARKS, INC.
Reconciliation of Selected Non-GAAP Measures to Analogous GAAP Measures
(Unaudited, In thousands)
| Three Months Ended March 31, | |||||||||||||||||||||||
| 2022 | 2021 | $ Change | % Change | ||||||||||||||||||||
| Rental income | |||||||||||||||||||||||
| Same Park | $ | 105,014 | $ | 98,012 | $ | 7,002 | 7.1 | % | |||||||||||||||
| Non-Same Park | 3,348 | 1,246 | 2,102 | 168.7 | % | ||||||||||||||||||
| Multifamily | 2,369 | 2,327 | 42 | 1.8 | % | ||||||||||||||||||
Assets sold or held for sale (2) | 2,109 | 6,462 | (4,353) | (67.4) | % | ||||||||||||||||||
| Total rental income | 112,840 | 108,047 | 4,793 | 4.4 | % | ||||||||||||||||||
Cost of Operations (1) | |||||||||||||||||||||||
| Same Park | 30,900 | 29,175 | 1,725 | 5.9 | % | ||||||||||||||||||
| Non-Same Park | 1,060 | 422 | 638 | 151.2 | % | ||||||||||||||||||
| Multifamily | 1,224 | 1,067 | 157 | 14.7 | % | ||||||||||||||||||
Assets sold or held for sale (2) | 930 | 2,554 | (1,624) | (63.6) | % | ||||||||||||||||||
| Total cost of operations | 34,114 | 33,218 | 896 | 2.7 | % | ||||||||||||||||||
Stock compensation expense (3) | (536) | (456) | (80) | 17.5 | % | ||||||||||||||||||
| Total cost of operations excluding stock compensation expense | 33,578 | 32,762 | 816 | 2.5 | % | ||||||||||||||||||
NOI (4) | |||||||||||||||||||||||
| Same Park | 74,114 | 68,837 | 5,277 | 7.7 | % | ||||||||||||||||||
| Non-Same Park | 2,288 | 824 | 1,464 | 177.7 | % | ||||||||||||||||||
| Multifamily | 1,145 | 1,260 | (115) | (9.1) | % | ||||||||||||||||||
Assets sold or held for sale (2) | 1,179 | 3,908 | (2,729) | (69.8) | % | ||||||||||||||||||
| Depreciation and amortization expense | (23,132) | (22,985) | (147) | 0.6 | % | ||||||||||||||||||
| General and administrative expense | (11,324) | (4,382) | (6,942) | 158.4 | % | ||||||||||||||||||
| Interest and other income | 246 | 256 | (10) | (3.9) | % | ||||||||||||||||||
| Interest and other expense | (330) | (211) | (119) | 56.4 | % | ||||||||||||||||||
| Gain on sale of real estate facilities | 56,959 | — | 56,959 | 100.0 | % | ||||||||||||||||||
| Net income | $ | 101,145 | $ | 47,507 | $ | 53,638 | 112.9 | % | |||||||||||||||
(1)Defined in Definitions/Non-GAAP Discussion.
(2)As of March 31, 2022 and 2021, included in the respective periods are assets sold in 2022 and 2021:
•a 702,000 square foot industrial-flex business park located in Irving, Texas, sold in March 2022.
(3)Stock compensation expense, as shown here, represents stock compensation expense for employees whose compensation expense is recorded in cost of operations. Note that stock compensation expense attributable to the executive management team (including divisional vice presidents) and other corporate employees is recorded within general and administrative expense.
(4)NOI represents rental income less Cost of Operations.
12
 | |||||
Exhibit 99.2
| Table of Contents | ||||
| Section | Page | ||||
| Corporate Data: | |||||
| Consolidated Financial Results: | |||||
| Portfolio Data: | |||||
Industry Concentration and Top Ten Customers | |||||
| Appendices and Definitions: | |||||
First Quarter 2022 Supplemental Financial Reporting Package 2
| Additional Information | ||||
Additional Information and Where to Find It
In connection with the proposed transaction, the Company will file relevant materials with the U.S. Securities and Exchange Commission (the “SEC”), including the Company’s proxy statement on Schedule 14A (the “Proxy Statement”). This document is not a substitute for the Proxy Statement or any other document that the Company may file with the SEC or send to its stockholders in connection with the proposed transactions. BEFORE MAKING ANY VOTING DECISION, STOCKHOLDERS OF THE COMPANY ARE URGED TO READ ALL RELEVANT DOCUMENTS FILED WITH THE SEC, INCLUDING THE PROXY STATEMENT, WHEN THEY BECOME AVAILABLE BECAUSE THEY WILL CONTAIN IMPORTANT INFORMATION ABOUT THE PROPOSED TRANSACTION. Investors and security holders will be able to obtain the documents (when available) free of charge at the SEC’s website, http://www.sec.gov. In addition, the documents (when available) may be obtained free of charge by accessing the Investor Relations section of the Company’s website at https://ir.psbusinessparks.com or by contacting the Company’s Investor Relations by email at info@psbusinessparks.com.
Participants in the Solicitation
The Company and its directors and executive officers may be deemed to be participants in the solicitation of proxies from the holders of Company common stock in respect of the proposed transaction. Information about the directors and executive officers of the Company is set forth in the proxy statement for the Company’s 2022 annual meeting of stockholders, which was filed with the SEC on March 25, 2022, in the Company’s Annual Report on Form 10-K for the fiscal year ended December 31, 2021, which was filed with the SEC on February 22, 2022 and in other documents filed by the Company with the SEC. Other information regarding the participants in the proxy solicitation and a description of their direct and indirect interests, by security holdings or otherwise, will be contained in the Proxy Statement and other relevant materials to be filed with the SEC in respect of the proposed transaction when they become available. Investors should read the Proxy Statement carefully when it becomes available before making any voting or investment decisions.
Forward-Looking Statements
When used within this supplemental information package, the words “may,” “believes,” “anticipates,” “plans,” “expects,” “seeks,” “estimates,” “intends,” and similar expressions are intended to identify “forward-looking statements.” Such forward-looking statements involve known and unknown risks, uncertainties, and other factors, which may cause the actual results and performance of the Company to be materially different from those expressed or implied in the forward-looking statements, including but not limited to: (i) the duration and severity of the COVID-19 pandemic and its impact on our business and our customers; (ii) changes in general economic and business conditions, including as a result of the economic fallout of the COVID-19 pandemic; (iii) potential regulatory actions to close our facilities or limit our ability to evict delinquent customers; (iv) decreases in rental rates or increases in vacancy rates/failure to renew or replace expiring leases; (v) tenant defaults; (vi) the effect of the recent credit and financial market conditions; (vii) our failure to maintain our status as a REIT under the Internal Revenue Code of 1986, as amended (the “Code”); (viii) the economic health of our customers; (ix) the health of our officers and directors; (x) increases in operating costs; (xi) casualties to our properties not covered by insurance; (xii) the availability and cost of capital; (xiii) increases in interest rates and its effect on our stock price; (xiv) security breaches, including ransomware, or a failure of our networks, systems or technology which could adversely impact our operations or our business, customer and employee relationships or result in fraudulent payments; (xv) the impact of inflation; and (xvi) other factors discussed in the Company’s SEC reports, including quarterly reports on Form 10-Q, reports on Form 8-K, and annual reports on Form 10-K.
First Quarter 2022 Supplemental Financial Reporting Package 3
| Investor Company Summary | ||||
| Executive Management Team | ||||||||
| Stephen W. Wilson | President and Chief Executive Officer | |||||||
| Maria R. Hawthorne | Interim Chief Operating Officer | |||||||
| Adeel Khan | Chief Financial Officer and Corporate Secretary | |||||||
| Trenton Groves | SVP, Chief Accounting Officer | |||||||
| Board of Directors | ||||||||
| Ronald L. Havner, Jr. | Chairman of the Board | |||||||
| Stephen W. Wilson | Director, President and Chief Executive Officer | |||||||
| Maria R. Hawthorne | Director, Interim Chief Operating Officer | |||||||
| Jennifer Holden Dunbar | Director | |||||||
| M. Christian Mitchell | Director | |||||||
| Irene H. Oh | Director | |||||||
| Kristy M. Pipes | Director | |||||||
| Gary E. Pruitt | Director | |||||||
| Robert S. Rollo | Director | |||||||
| Joseph D. Russell, Jr. | Director | |||||||
| Peter Schultz | Director | |||||||
| Investor Relations Information | ||
| Adeel Khan | ||
| T: 818.244.8080, Ext. 8975 | ||
| akhan@psbusinessparks.com | ||
| Equity Research Coverage | |||||||||||
| FIRM | ANALYST | PHONE | |||||||||
| Citi | Manny Korchman | 212-816-1382 | emmanuel.korchman@citi.com | ||||||||
| Green Street Advisors | Vince Tibone | 949-640-8780 | vtibone@greenstreetadvisors.com | ||||||||
| JP Morgan | Anthony Paolone | 212-622-6682 | anthony.paolone@jpmorgan.com | ||||||||
| KeyBanc | Craig Mailman | 917-368-2316 | cmailman@key.com | ||||||||
| Wells Fargo | Blaine Heck | 443-263-6529 | blaine.heck@wellsfargo.com | ||||||||
PS Business Parks, Inc. is followed by the analysts listed above. Please note that any opinions, estimates or forecasts regarding PS Business Parks, Inc.'s performance made by these analysts are theirs alone and do not represent opinions, forecasts or predictions of PS Business Parks, Inc. or its management. PS Business Parks, Inc. does not by its reference above or distribution imply its endorsement of or concurrence with such information, conclusions or recommendations.
First Quarter 2022 Supplemental Financial Reporting Package 4
| Company Overview As Of March 31, 2022 | ||||
| Company Overview | ||||||||
| Total # of Properties | 96 | |||||||
| Total Square Feet | 27,010,000 | |||||||
| Total Occupancy (Period End) | 95.5% | |||||||
| Same Park Occupancy (Period End) | 95.9% | |||||||
| Same Park YTD GAAP NOI growth | 7.7% | |||||||
| Same Park YTD Cash NOI growth | 8.6% | |||||||
(S&P/Moody's) (2) (3) | BBB+, BBB-/Baa2 (under review) | |||||||
| Net Debt to Total Combined Market Capitalization | n/a | |||||||
| Net Debt and Preferred Equity to Total Combined Market Capitalization | 11.4% | |||||||
| Net Debt to Adjusted EBITDAre | 2.8x | |||||||
| Multifamily | ||||||||
| Average rent per unit | $2,123 | |||||||
| Weighted average occupancy | 95.0% | |||||||
| Period end occupancy | 96.9% | |||||||
| Percent leased | 97.0% | |||||||
| Economic Occupancy | 89.9% | |||||||

(2) S&P downgraded PSB to 'BBB+' and subsequently downgraded PSB's preferred stock to 'BBB-'. S&P placed all their ratings on PSB, including our 'BBB+' issuer credit rating, on CreditWatch with negative implications. The CreditWatch placement reflects that S&P could lower their ratings upon closing of the transaction, based on the pro forma capital structure and their view of the acquirer's aggressive financial policy. S&P no longer view PSB as being moderately strategic to Public Storage. Public Storage, which holds approximately 41% common equity interest in PSB, has agreed to Blackstone's acquisition bid. S&P previously considered PSB to be moderately strategic to Public Storage and, as such, S&P believed that Public Storage would provide support to PSB under a stress scenario. As a result, S&P applied a one-notch improvement to their standalone rating on PSB. The transaction changes S&P's view, such that they no longer expect Public Storage to support PSB under a hypothetical stress scenario. As a result, S&P downgraded PSB by one notch to 'BBB+'. S&P also lowered their ratings on PSB's preferred stock by one notch to 'BBB-', two notches below its issuer credit rating, in line with S&P's criteria. | ||||||||||||||
(3) Moody’s Investors Service (“Moody’s”) has placed on review for downgrade the ratings of PS Business Parks, Inc. (PSB), including its Baa2 preferred stock rating and the (P)Baa1 senior unsecured shelf rating of its main operating subsidiary, PS Business Parks, L.P. The review for downgrade follows the announcement that the REIT, which owns a portfolio primarily comprised of multi-tenant industrial and flex properties, has entered into a definitive agreement by which affiliates of Blackstone Real Estate will acquire all of PSB’s outstanding shares in a transaction valued at about $7.6 billion. The review for downgrade reflects the likelihood that PSB’s credit profile will deteriorate under Blackstone’s ownership, with the potential for meaningfully higher leverage and secured debt levels that could result in a multi-notch downgrade of the REIT’s ratings, including crossing over to non-investment grade territory, upon transaction close. | ||||||||||||||
First Quarter 2022 Supplemental Financial Reporting Package 5
| Financial and Portfolio Highlights and Capitalization Data (unaudited, in thousands except share and per share data and portfolio statistics) | ||||
| Three Months Ended | |||||||||||||||||||||||||||||
| March 31, 2022 | December 31, 2021 | September 31, 2021 | June 30, 2021 | March 31, 2021 | |||||||||||||||||||||||||
| Financial Results: | |||||||||||||||||||||||||||||
| Rental income | $ | 112,840 | $ | 110,844 | $ | 110,448 | $ | 109,364 | $ | 108,047 | |||||||||||||||||||
| Net income | $ | 101,145 | $ | 357,009 | $ | 78,463 | $ | 70,050 | $ | 47,507 | |||||||||||||||||||
Net Operating Income (NOI) (1) | $ | 78,726 | $ | 78,106 | $ | 77,357 | $ | 77,515 | $ | 74,829 | |||||||||||||||||||
Cash NOI (1) | $ | 78,105 | $ | 77,641 | $ | 77,332 | $ | 77,813 | $ | 73,978 | |||||||||||||||||||
Core FFO (1) | $ | 63,823 | $ | 63,485 | $ | 60,328 | $ | 61,816 | $ | 58,419 | |||||||||||||||||||
Core FFO per common stock - diluted (1) | $ | 1.82 | $ | 1.81 | $ | 1.72 | $ | 1.77 | $ | 1.67 | |||||||||||||||||||
| EBITDAre | $ | 67,601 | $ | 74,224 | $ | 72,599 | $ | 73,503 | $ | 70,624 | |||||||||||||||||||
| Dividend declared per share of common stock | $ | 1.05 | $ | 1.05 | $ | 1.05 | $ | 1.05 | $ | 1.05 | |||||||||||||||||||
| Portfolio Statistics: | |||||||||||||||||||||||||||||
Total square footage at period end (2) | 27,010,000 | 27,010,000 | 26,869,000 | 26,151,000 | 26,151,000 | ||||||||||||||||||||||||
| Weighted average occupancy | 95.5 | % | 95.5 | % | 94.7 | % | 93.8 | % | 93.2 | % | |||||||||||||||||||
| Period end Occupancy | 95.5 | % | 95.9 | % | 95.5 | % | 94.5 | % | 93.6 | % | |||||||||||||||||||
| Rent Change - GAAP | 23.4 | % | 16.4 | % | 15.4 | % | 10.7 | % | 16.4 | % | |||||||||||||||||||
| Rent Change - Cash | 10.7 | % | 6.1 | % | 5.0 | % | 3.1 | % | 6.4 | % | |||||||||||||||||||
| Same Park Performance: | |||||||||||||||||||||||||||||
| Same Park weighted average occupancy | 96.0 | % | 95.8 | % | 94.9 | % | 94.0 | % | 93.3 | % | |||||||||||||||||||
| Same Park income per occupied square foot | $16.84 | $16.60 | $16.62 | $16.40 | $16.10 | ||||||||||||||||||||||||
Same Park GAAP NOI growth (1) (3) | 7.7 | % | 8.9 | % | 10.0 | % | 11.4 | % | 0.7 | % | |||||||||||||||||||
Same Park Cash NOI growth (1) (3) | 8.6 | % | 8.1 | % | 12.7 | % | 16.2 | % | 0.5 | % | |||||||||||||||||||
| Capitalization: | |||||||||||||||||||||||||||||
Total shares and units issued and outstanding at period end (4) | 34,932,798 | 34,895,162 | 34,851,508 | 34,846,819 | 34,822,294 | ||||||||||||||||||||||||
| Total equity market capitalization | $ | 5,871,505 | $ | 6,426,642 | $ | 5,462,625 | $ | 5,160,177 | $ | 5,382,830 | |||||||||||||||||||
Series W, X, Y and Z Preferred Stock (5) | $ | 755,000 | $ | 755,000 | $ | 944,750 | $ | 944,750 | $ | 944,750 | |||||||||||||||||||
| Total consolidated debt | $ | 20,000 | $ | 32,000 | $ | — | $ | — | $ | — | |||||||||||||||||||
Unrestricted cash (6) | $ | (20,000) | $ | (27,074) | n/a | n/a | n/a | ||||||||||||||||||||||
| Total combined market capitalization (net debt plus equity) | $ | 6,626,505 | $ | 7,186,568 | $ | 6,407,375 | $ | 6,104,927 | $ | 6,327,580 | |||||||||||||||||||
| Ratios: | |||||||||||||||||||||||||||||
| Net debt & preferred equity to total combined market capitalization | 11.4 | % | 10.6 | % | 14.1 | % | 13.8 | % | 14.0 | % | |||||||||||||||||||
Net debt to total combined market capitalization (6) | 0.0 | % | 0.1 | % | n/a | n/a | n/a | ||||||||||||||||||||||
Ratio of EBITDAre to fixed charges and preferred distributions (7) | 6.9x | 6.9x | 5.9x | 6.0x | 5.8x | ||||||||||||||||||||||||
Net debt and preferred equity to EBITDAre (8) | 2.8x | 2.6x | 3.1x | 2.8x | 3.1x | ||||||||||||||||||||||||
(1)For definition/discussion of non-GAAP financial measures and reconciliations to their nearest GAAP equivalents, see the definitions section & reconciliation section beginning on page 29 and page 10 of this report, respectively.
(2)Excludes assets sold.
(3)Represents the quarter over quarter percentage change in NOI and Cash NOI for the Same Park Portfolio.
(4)Total shares and units issued and outstanding at period end is comprised of common stock and common operating partnership units.
(5)Series W Preferred Stock redeemed in November 2021.
(6)Unrestricted cash balance is $104.2 million as of March 31, 2022 Cash used for net debt calculation is $20.0 million or the current outstanding debt balance.
(7)For each period shown, ratio of total fixed charges to EBITDAre is calculated using the respective quarter’s annualized fixed charges divided by the respective quarter’s annualized EBITDAre.
(8)For each period shown, ratio of debt and preferred equity to EBITDAre is calculated using total net debt and preferred equity reported during the quarter divided by the respective quarter’s annualized EBITDAre.
First Quarter 2022 Supplemental Financial Reporting Package 6
| Consolidated Balance Sheets (unaudited, in thousands) | ||||
| March 31, 2022 | December 31, 2021 | |||||||||||||
| ASSETS | ||||||||||||||
| Cash and cash equivalents | $ | 104,204 | $ | 27,074 | (a) | |||||||||
| Real estate facilities, at cost | ||||||||||||||
| Land | 865,214 | 867,345 | ||||||||||||
| Buildings and improvements | 2,244,104 | 2,239,137 | ||||||||||||
| 3,109,318 | 3,106,482 | |||||||||||||
| Accumulated depreciation | (1,197,811) | (1,178,397) | ||||||||||||
| 1,911,507 | 1,928,085 | (b) | ||||||||||||
| Properties held for sale, net | — | 33,609 | ||||||||||||
| Land and building held for development, net | 97,212 | 78,990 | ||||||||||||
| 2,008,719 | 2,040,684 | |||||||||||||
| Rent receivable | 2,988 | 1,621 | ||||||||||||
| Deferred rent receivable | 37,484 | 37,581 | (c) | |||||||||||
| Other assets | 13,176 | 16,262 | ||||||||||||
| Total assets | $ | 2,166,571 | $ | 2,123,222 | (d) | |||||||||
| LIABILITIES AND EQUITY | ||||||||||||||
| Accrued and other liabilities | $ | 95,509 | $ | 97,151 | (e) | |||||||||
| Credit facility | 20,000 | 32,000 | ||||||||||||
| Total liabilities | 115,509 | 129,151 | ||||||||||||
| Equity | ||||||||||||||
| PS Business Parks, Inc.’s stockholders’ equity | ||||||||||||||
| Preferred stock | 755,000 | 755,000 | ||||||||||||
| Common stock | 276 | 275 | ||||||||||||
| Paid-in capital | 754,387 | 752,444 | (f) | |||||||||||
| Accumulated earnings | 270,243 | 226,737 | (g) | |||||||||||
| Total PS Business Parks, Inc.’s stockholders’ equity | 1,779,906 | 1,734,456 | ||||||||||||
| Noncontrolling interests | 271,156 | 259,615 | ||||||||||||
| Total equity | 2,051,062 | 1,994,071 | ||||||||||||
| Total liabilities and equity | $ | 2,166,571 | $ | 2,123,222 | ||||||||||
See Appendix A for additional detail related to the tickmarks shown in the table above.
First Quarter 2022 Supplemental Financial Reporting Package 7
| Consolidated Statements of Operations, Quarterly Results (unaudited and in thousands, except per share amounts) | ||||
| Three Months Ended | |||||||||||||||||||||||||||||
| March 31, 2022 | December 31, 2021 | September 30, 2021 | June 30, 2021 | March 31, 2021 | |||||||||||||||||||||||||
| Rental income | $ | 112,840 | $ | 110,844 | $ | 110,448 | $ | 109,364 | $ | 108,047 | |||||||||||||||||||
| Expenses: | |||||||||||||||||||||||||||||
| Cost of operations | 34,114 | 32,738 | 33,091 | 31,849 | 33,218 | ||||||||||||||||||||||||
| Depreciation and amortization | 23,132 | 24,130 | 23,857 | 22,514 | 22,985 | ||||||||||||||||||||||||
General and administrative (1) | 11,324 | 4,728 | 5,148 | 4,799 | 4,382 | ||||||||||||||||||||||||
| Total operating expenses | 68,570 | 61,596 | 62,096 | 59,162 | 60,585 | ||||||||||||||||||||||||
| Interest and other income | 246 | 946 | 411 | 923 | 256 | ||||||||||||||||||||||||
Interest and other expense (2) | (330) | (3,943) | (224) | (268) | (211) | ||||||||||||||||||||||||
| Gain on sale of real estate facilities | 56,959 | 310,758 | 29,924 | 19,193 | — | ||||||||||||||||||||||||
| Net income | 101,145 | 357,009 | 78,463 | 70,050 | 47,507 | ||||||||||||||||||||||||
| Allocation to noncontrolling interests | (19,049) | (70,915) | (13,850) | (12,094) | (7,411) | ||||||||||||||||||||||||
| Net income allocable to PS Business Parks, Inc. | 82,096 | 286,094 | 64,613 | 57,956 | 40,096 | ||||||||||||||||||||||||
| Allocation to preferred stockholders | (9,580) | (10,485) | (12,046) | (12,047) | (12,046) | ||||||||||||||||||||||||
| Preferred securities redemption charge | — | (6,434) | — | — | — | ||||||||||||||||||||||||
| Allocation to restricted stock unit holders | (523) | (1,785) | (350) | (314) | (164) | ||||||||||||||||||||||||
| Net income allocable to common stockholders | $ | 71,993 | $ | 267,390 | $ | 52,217 | $ | 45,595 | $ | 27,886 | |||||||||||||||||||
| Net income per share of common stock | |||||||||||||||||||||||||||||
| Basic | $ | 2.61 | $ | 9.70 | $ | 1.90 | $ | 1.66 | $ | 1.01 | |||||||||||||||||||
| Diluted | $ | 2.60 | $ | 9.66 | $ | 1.89 | $ | 1.65 | $ | 1.01 | |||||||||||||||||||
| Weighted average common stock outstanding | |||||||||||||||||||||||||||||
| Basic | 27,607 | 27,565 | 27,543 | 27,531 | 27,495 | ||||||||||||||||||||||||
| Diluted | 27,691 | 27,671 | 27,635 | 27,632 | 27,594 | ||||||||||||||||||||||||
(1)General and administrative expense in Q1 22 includes the impact of a one-time cash payment of $6.7 million for RSUs to the former CEO less a $0.6 million reversal of stock compensation expense.
(2)Other expense includes $3.6 million related to state tax provision for the Three Months Ended December 31, 2021.
First Quarter 2022 Supplemental Financial Reporting Package 8
| Consolidated Statements of Operations and EBITDAre, Quarterly Results (unaudited and in thousands, except per share amounts) | ||||
| Three Months Ended March 31, | |||||||||||||||||
| 2022 | 2021 | ||||||||||||||||
| Rental income | $ | 112,840 | $ | 108,047 | (a) | ||||||||||||
| Expenses | |||||||||||||||||
| Cost of operations | 34,114 | 33,218 | (b) | ||||||||||||||
| Depreciation and amortization | 23,132 | 22,985 | |||||||||||||||
| General and administrative | 11,324 | 4,382 | (c) | ||||||||||||||
| Total operating expenses | 68,570 | 60,585 | |||||||||||||||
| Interest and other income | 246 | 256 | (d) | ||||||||||||||
| Interest and other expense | (330) | (211) | (e) | ||||||||||||||
| Gain on sale of real estate facilities | 56,959 | — | |||||||||||||||
| Net income | 101,145 | 47,507 | |||||||||||||||
| Allocation to noncontrolling interests | (19,049) | (7,411) | |||||||||||||||
| Net income allocable to PS Business Parks, Inc. | 82,096 | 40,096 | |||||||||||||||
| Allocation to preferred stockholders | (9,580) | (12,046) | |||||||||||||||
| Allocation to restricted stock unit holders | (523) | (164) | |||||||||||||||
| Net income allocable to common stockholders | $ | 71,993 | $ | 27,886 | |||||||||||||
| Net income per share of common stock | |||||||||||||||||
| Basic | $ | 2.61 | $ | 1.01 | |||||||||||||
| Diluted | $ | 2.60 | $ | 1.01 | |||||||||||||
| Weighted average common stock outstanding | |||||||||||||||||
| Basic | 27,607 | 27,495 | |||||||||||||||
| Diluted | 27,691 | 27,594 | |||||||||||||||
EARNINGS BEFORE INTEREST, TAXES, DEPRECIATION AND AMORTIZATION FOR REAL ESTATE (EBITDAre) (1) | |||||||||||||||||
| Three Months Ended March 31, | |||||||||||||||||
| 2022 | 2021 | $ Change | |||||||||||||||
| Net income | $ | 101,145 | $ | 47,507 | $ | 53,638 | |||||||||||
| Net interest (income) expense | 283 | 132 | 151 | ||||||||||||||
| Depreciation and amortization | 23,132 | 22,985 | 147 | ||||||||||||||
| Gain on sale of real estate facilities and development rights | (56,959) | — | (56,959) | ||||||||||||||
| EBITDAre | $ | 67,601 | $ | 70,624 | $ | (3,023) | |||||||||||
See Appendix B for additional detail related to the tickmarks shown in the table above.
(1) Refer to Page 29, Definitions and Non-GAAP Disclosures, for the definitions of EBITDAre.
First Quarter 2022 Supplemental Financial Reporting Package 9
| Non-GAAP FFO, Core FFO and FAD Reconciliations (unaudited and in thousands, except per share amounts) | ||||
| Three Months Ended | |||||||||||||||||||||||||||||
| March 31, 2022 | December 31, 2021 | September 30, 2021 | June 30, 2021 | March 31, 2021 | |||||||||||||||||||||||||
| Net income allocable to common stockholders | $ | 71,993 | $ | 267,390 | $ | 52,217 | $ | 45,595 | $ | 27,886 | |||||||||||||||||||
| Adjustments | |||||||||||||||||||||||||||||
| Gain on sale of real estate facilities | (56,959) | (310,758) | (29,924) | (19,193) | — | ||||||||||||||||||||||||
| Depreciation and amortization | 23,132 | 24,130 | 23,857 | 22,514 | 22,985 | ||||||||||||||||||||||||
| Net income allocable to noncontrolling interests | 19,049 | 70,915 | 13,850 | 12,094 | 7,411 | ||||||||||||||||||||||||
| Net income allocable to restricted stock unit holders | 523 | 1,785 | 350 | 314 | 164 | ||||||||||||||||||||||||
| FFO allocated to joint venture partner | (23) | (11) | (22) | (18) | (27) | ||||||||||||||||||||||||
FFO allocable to diluted common stock and units (1) | 57,715 | 53,451 | 60,328 | 61,306 | 58,419 | ||||||||||||||||||||||||
| CEO cash payment for RSUs net of reversal of stock compensation | 6,108 | — | — | — | — | ||||||||||||||||||||||||
| Preferred securities redemption charge | — | 6,434 | — | — | — | ||||||||||||||||||||||||
| Income tax expense | — | 3,600 | — | — | — | ||||||||||||||||||||||||
| Maryland reincorporation costs | — | — | — | 510 | — | ||||||||||||||||||||||||
Core FFO allocable to diluted common stock and units (1) | $ | 63,823 | $ | 63,485 | $ | 60,328 | $ | 61,816 | $ | 58,419 | |||||||||||||||||||
| FAD | |||||||||||||||||||||||||||||
FFO allocable to diluted common stock and units (1) | $ | 57,715 | $ | 53,451 | $ | 60,328 | $ | 61,306 | $ | 58,419 | |||||||||||||||||||
| Adjustments: | |||||||||||||||||||||||||||||
| Recurring capital improvements | (2,010) | (3,233) | (3,837) | (3,701) | (565) | ||||||||||||||||||||||||
| Tenant improvements | (3,027) | (3,462) | (3,876) | (3,918) | (2,422) | ||||||||||||||||||||||||
| Capitalized lease commissions | (1,304) | (3,274) | (1,995) | (1,439) | (1,784) | ||||||||||||||||||||||||
| Total recurring capital expenditures for assets sold or held for sale | (8) | (117) | (471) | (394) | (634) | ||||||||||||||||||||||||
| Total multifamily capital expenditures | — | (6) | — | (7) | — | ||||||||||||||||||||||||
| Cash paid for taxes in lieu of stock upon vesting of restricted stock units | (931) | (260) | (478) | (5) | (3,197) | ||||||||||||||||||||||||
| Preferred securities redemption charge | — | 6,434 | — | — | — | ||||||||||||||||||||||||
Non-cash rental income (2) | (1,157) | (857) | (453) | (183) | (1,307) | ||||||||||||||||||||||||
| Non-cash stock compensation expense | 940 | 2,073 | 2,341 | 2,301 | 1,780 | ||||||||||||||||||||||||
FAD allocable to diluted common stock and units (1) | $ | 50,218 | $ | 50,749 | $ | 51,559 | $ | 53,960 | $ | 50,290 | |||||||||||||||||||
Non-recurring property renovations (1) | (1,511) | (1,686) | (176) | (432) | (411) | ||||||||||||||||||||||||
| Investment in multifamily development | (12,455) | (12,903) | (13,516) | (7,539) | (9,485) | ||||||||||||||||||||||||
| Investment in industrial development | (3,796) | (1,223) | (165) | (93) | (1,123) | ||||||||||||||||||||||||
| Total non-recurring capital expenditures | $ | (17,762) | $ | (15,812) | $ | (13,857) | $ | (8,064) | $ | (11,019) | |||||||||||||||||||
| Free cash available after non-recurring capital expenditures | $ | 32,456 | $ | 34,937 | $ | 37,702 | $ | 45,896 | $ | 39,271 | |||||||||||||||||||
| Total Distributions | $ | (36,892) | $ | (36,833) | $ | (36,793) | $ | (36,813) | $ | (36,724) | |||||||||||||||||||
Retained cash (1) | $ | (4,436) | $ | (1,896) | $ | 909 | $ | 9,083 | $ | 2,547 | |||||||||||||||||||
| Weighted average outstanding | |||||||||||||||||||||||||||||
| Common stock | 27,607 | 27,565 | 27,543 | 27,531 | 27,495 | ||||||||||||||||||||||||
| Operating partnership units | 7,305 | 7,305 | 7,305 | 7,305 | 7,305 | ||||||||||||||||||||||||
| Restricted stock units | 45 | 46 | 33 | 32 | 47 | ||||||||||||||||||||||||
| Common stock equivalents | 84 | 106 | 92 | 101 | 99 | ||||||||||||||||||||||||
| Total diluted common stock and units | 35,041 | 35,022 | 34,973 | 34,969 | 34,946 | ||||||||||||||||||||||||
| FFO per share | $ | 1.65 | $ | 1.53 | $ | 1.72 | $ | 1.75 | $ | 1.67 | |||||||||||||||||||
| Core FFO per share | $ | 1.82 | $ | 1.81 | $ | 1.72 | $ | 1.77 | $ | 1.67 | |||||||||||||||||||
FAD distribution payout ratio (3) (4) | 73.5 | % | 72.6 | % | 71.4 | % | 68.2 | % | 73.0 | % | |||||||||||||||||||
First Quarter 2022 Supplemental Financial Reporting Package 10
| Non-GAAP FFO, Core FFO and FAD Reconciliations (cont'd) (unaudited and in thousands, except per share amounts) | ||||
| Three Months Ended March 31, | |||||||||||
| 2022 | 2021 | ||||||||||
| Net income allocable to common stockholders | $ | 71,993 | $ | 27,886 | |||||||
| Adjustments | |||||||||||
| Gain on sale of real estate facilities | (56,959) | — | |||||||||
| Depreciation and amortization | 23,132 | 22,985 | |||||||||
| Net income allocable to noncontrolling interests | 19,049 | 7,411 | |||||||||
| Net income allocable to restricted stock unit holders | 523 | 164 | |||||||||
| FFO allocated to joint venture partner | (23) | (27) | |||||||||
FFO allocable to diluted common stock and units (1) | 57,715 | 58,419 | |||||||||
| CEO cash payment for RSUs net of reversal of stock compensation | 6,108 | — | |||||||||
Core FFO allocable to diluted common stock and units (1) | $ | 63,823 | $ | 58,419 | |||||||
| FAD | |||||||||||
FFO allocable to diluted common stock and units (1) | $ | 57,715 | $ | 58,419 | |||||||
| Adjustments: | |||||||||||
| Recurring capital improvements | (2,010) | (565) | |||||||||
| Tenant improvements | (3,027) | (2,422) | |||||||||
| Capitalized lease commissions | (1,304) | (1,784) | |||||||||
| Total recurring capital expenditures for assets sold or held for sale | (8) | (634) | |||||||||
| Cash paid for taxes in lieu of stock upon vesting of restricted stock units | (931) | (3,197) | |||||||||
Non-cash rental income (2) | (1,157) | (1,307) | |||||||||
| Non-cash stock compensation expense | 940 | 1,780 | |||||||||
FAD allocable to diluted common stock and units (1) | $ | 50,218 | $ | 50,290 | |||||||
| Non-recurring capital expenditures | |||||||||||
Non-recurring property renovations (1) | (1,511) | (411) | |||||||||
| Investment in multifamily development | (12,455) | (9,485) | |||||||||
| Investment in industrial development | (3,796) | (1,123) | |||||||||
| Total non-recurring capital expenditures | $ | (17,762) | $ | (11,019) | |||||||
| Free cash available after non-recurring capital expenditures | $ | 32,456 | $ | 39,271 | |||||||
| Distributions | |||||||||||
| Distributions to common stockholders | $ | (29,010) | $ | (28,872) | |||||||
| Distributions to noncontrolling interests - common units | (7,671) | (7,671) | |||||||||
| Distributions to restricted stock unit holders | (188) | (164) | |||||||||
| Distributions to noncontrolling interests - joint venture | (23) | (17) | |||||||||
| Total Distributions | (36,892) | (36,724) | |||||||||
Retained cash (1) | (4,436) | 2,547 | |||||||||
First Quarter 2022 Supplemental Financial Reporting Package 11
| Non-GAAP FFO, Core FFO and FAD Reconciliations (cont'd) (unaudited and in thousands, except per share amounts) | ||||
| Three Months Ended March 31, | |||||||||||
| 2022 | 2021 | ||||||||||
| Weighted average outstanding | |||||||||||
| Common stock | 27,607 | 27,495 | |||||||||
| Operating partnership units | 7,305 | 7,305 | |||||||||
| Restricted stock units | 45 | 47 | |||||||||
| Common stock equivalents | 84 | 99 | |||||||||
| Total diluted common stock and units | 35,041 | 34,946 | |||||||||
| FFO per share | $ | 1.65 | $ | 1.67 | |||||||
| Core FFO per share | $ | 1.82 | $ | 1.67 | |||||||
FAD distribution payout ratio (3) (4) | 73.5 | % | 73.0 | % | |||||||
| (1) | Refer to page 29, Definitions and Non-GAAP Disclosures, for the definition of FFO, Core FFO, FAD, Non-Recurring Property Renovations and Retained Cash. | ||||
| (2) | Non-cash rental income includes amortization of deferred rent receivable (net of write-offs), in-place lease intangible, tenant improvement reimbursements, and lease incentives. | ||||
| (3) | FAD distribution payout ratio is equal to total distributions to common stockholders, unit holders, restricted stock unit holders and our joint venture partner divided by FAD during the same reporting period. | ||||
| (4) | For the three months ended December 31, 2021, the FAD distribution ratio excludes of $4.60 special dividend distributions to common stockholders, noncontrolling interest, and restricted stock unit holders. | ||||
First Quarter 2022 Supplemental Financial Reporting Package 12
| NOI and Cash NOI (unaudited, in thousands) | |||||||
| NET OPERATING INCOME | CASH NET OPERATING INCOME (2) | |||||||||||||||||||||||||||||||||||||
| Three Months Ended March 31, | Three Months Ended March 31, | |||||||||||||||||||||||||||||||||||||
| 2022 | 2021 | % Change | 2022 | 2021 | % Change | |||||||||||||||||||||||||||||||||
| Rental income | ||||||||||||||||||||||||||||||||||||||
Same Park (1) (3) (4) (5) | $ | 105,014 | $ | 98,012 | 7.1% | $ | 104,096 | $ | 96,638 | 7.7% | ||||||||||||||||||||||||||||
Non-Same Park (1) | 3,348 | 1,246 | 168.7% | 3,074 | 1,270 | 142.0% | ||||||||||||||||||||||||||||||||
| Multifamily | 2,369 | 2,327 | 1.8% | 2,369 | 2,327 | 1.8% | ||||||||||||||||||||||||||||||||
| Assets sold or held for sale | 2,109 | 6,462 | (67.4)% | 2,144 | 6,505 | (67.0)% | ||||||||||||||||||||||||||||||||
| Total rental income | 112,840 | 108,047 | 4.4% | 111,683 | 106,740 | 4.6% | ||||||||||||||||||||||||||||||||
Cost of operations (1) (6) | ||||||||||||||||||||||||||||||||||||||
Same Park (1) | 30,900 | 29,175 | 5.9% | 30,404 | 28,754 | 5.7% | ||||||||||||||||||||||||||||||||
Non-Same Park (1) | 1,060 | 422 | 151.2% | 1,035 | 417 | 148.2% | ||||||||||||||||||||||||||||||||
| Multifamily | 1,224 | 1,067 | 14.7% | 1,224 | 1,067 | 14.7% | ||||||||||||||||||||||||||||||||
| Assets sold or held for sale | 930 | 2,554 | (63.6)% | 915 | 2,524 | (63.7)% | ||||||||||||||||||||||||||||||||
| Total cost of operations | 34,114 | 33,218 | 2.7% | 33,578 | 32,762 | 2.5% | ||||||||||||||||||||||||||||||||
| Net operating income | ||||||||||||||||||||||||||||||||||||||
Same Park (1) | 74,114 | 68,837 | 7.7% | 73,692 | 67,884 | 8.6% | ||||||||||||||||||||||||||||||||
Non-Same Park (1) | 2,288 | 824 | 177.7% | 2,039 | 853 | 139.0% | ||||||||||||||||||||||||||||||||
| Multifamily | 1,145 | 1,260 | (9.1)% | 1,145 | 1,260 | (9.1)% | ||||||||||||||||||||||||||||||||
| Assets sold or held for sale | 1,179 | 3,908 | (69.8)% | 1,229 | 3,981 | (69.1)% | ||||||||||||||||||||||||||||||||
| Total net operating income | $ | 78,726 | $ | 74,829 | 5.2% | $ | 78,105 | $ | 73,978 | 5.6% | ||||||||||||||||||||||||||||
(1)Refer to page 29, Definition and Non-GAAP Disclosures, for the definitions of Same Park, Non-Same Park, and Cash Rental Income. See Appendix C for Same Park Cost of Operations table.
(2)Cash NOI excludes $0.5 million stock based compensation for the three months ended March 31, 2022 and 2021, respectively.
(3)Same Park rental income and Cash Rental Income include lease buyout income of $0.2 million and $0.4 million for the three months ended March 31, 2022 and 2021, respectively.
(4)Same Park rental income is presented net of (a) accounts receivable write-offs (recoveries) of $0.1 million and $0.0 million for the three months ended March 31, 2022 and 2021, respectively, and (b) deferred rent receivable write-offs of $0.0 million and $0.1 million for the three months ended March 31, 2022 and 2021, respectively.
(5)Same Park Cash Rental Income is presented net of (a) accounts receivable write-offs (recoveries) of $0.1 million and $0.0 million for the three months ended March 31, 2022 and 2021, respectively, and (b) rent deferrals and abatements $0.0 million and $0.3 million for the three months ended March 31, 2022 and 2021, respectively.
(6)Refer to Appendix B for a reconciliation of Cash Rental Income to rental income and Cost of Operations to Cost of Operations under Cash NOI as reported on our GAAP statements of income.
First Quarter 2022 Supplemental Financial Reporting Package 13
| Same Park Cash NOI by Region and Type (1) (in thousands) | ||||
| Three Months Ended | ||||||||||||||||||||||||||||||||||||||||||||||||||||||||||||||
| March 31, 2022 | March 31, 2021 | Period Change by Product Type | Total | |||||||||||||||||||||||||||||||||||||||||||||||||||||||||||
| Industrial | Flex | Office | Total | Industrial | Flex | Office | Total | Industrial | Flex | Office | % Change | |||||||||||||||||||||||||||||||||||||||||||||||||||
Cash NOI (1) | ||||||||||||||||||||||||||||||||||||||||||||||||||||||||||||||
| Northern California | $ | 20,195 | $ | 2,156 | $ | 1,540 | $ | 23,891 | $ | 17,448 | $ | 1,982 | $ | 1,863 | $ | 21,293 | 15.7% | 8.8% | (17.3)% | 12.2% | ||||||||||||||||||||||||||||||||||||||||||
| Southern California | 9,220 | 2,404 | 119 | 11,743 | 7,750 | 2,372 | 117 | 10,239 | 19.0% | 1.3% | 1.7% | 14.7% | ||||||||||||||||||||||||||||||||||||||||||||||||||
| Dallas | 2,277 | 1,377 | n/a | 3,654 | 1,963 | 1,160 | n/a | 3,123 | 16.0% | 18.7% | n/a | 17.0% | ||||||||||||||||||||||||||||||||||||||||||||||||||
| Austin | 1,494 | 3,835 | n/a | 5,329 | 1,406 | 4,012 | n/a | 5,418 | 6.3% | (4.4)% | n/a | (1.6)% | ||||||||||||||||||||||||||||||||||||||||||||||||||
| Northern Virginia | 3,771 | 3,562 | 5,199 | 12,532 | 3,416 | 3,631 | 5,398 | 12,445 | 10.4% | (1.9)% | (3.7)% | 0.7% | ||||||||||||||||||||||||||||||||||||||||||||||||||
| South Florida | 9,197 | 444 | 8 | 9,649 | 8,233 | 347 | 22 | 8,602 | 11.7% | 28.0% | (63.6)% | 12.2% | ||||||||||||||||||||||||||||||||||||||||||||||||||
| Seattle | 2,436 | 1,283 | 74 | 3,793 | 2,219 | 1,344 | 65 | 3,628 | 9.8% | (4.5)% | 13.8% | 4.5% | ||||||||||||||||||||||||||||||||||||||||||||||||||
| Suburban Maryland | 830 | n/a | 2,271 | 3,101 | 788 | n/a | 2,348 | 3,136 | 5.3% | n/a | (3.3)% | (1.1)% | ||||||||||||||||||||||||||||||||||||||||||||||||||
| Total | $ | 49,420 | $ | 15,061 | $ | 9,211 | $ | 73,692 | $ | 43,223 | $ | 14,848 | $ | 9,813 | $ | 67,884 | 14.3% | 1.4% | (6.1)% | 8.6% | ||||||||||||||||||||||||||||||||||||||||||
| Percentage by Product Type | 67.1 | % | 20.4 | % | 12.5 | % | 100.0 | % | 63.7 | % | 21.9 | % | 14.4 | % | 100.0 | % | ||||||||||||||||||||||||||||||||||||||||||||||
(1)Refer to page 29, Definitions and Non-GAAP Disclosures, for the definitions of Same Park and Cash NOI.
First Quarter 2022 Supplemental Financial Reporting Package 14
| Capitalization Summary (unaudited and in thousands, except share and per share data) | ||||
As of March 31, 2022 | As of December 31, 2021 | ||||||||||||||||||||||||||||||||||
| Total | % Total Market Capitalization | Wtd Avg Rate | Total | % Total Market Capitalization | Wtd Avg Rate | ||||||||||||||||||||||||||||||
| Common Stock: | |||||||||||||||||||||||||||||||||||
| Common stock, $0.01 par value, 100,000,000 shares authorized, 27,627,443 and 27,589,807 shares issued and outstanding at March 31, 2022 and December 31, 2021, respectively | $ | 4,643,621 | 70.1% | $ | 5,081,215 | 70.7% | |||||||||||||||||||||||||||||
Common operating partnership units (7,305,355 units outstanding as of March 31, 2022 and December 31, 2021, respectively) (1) | 1,227,884 | 18.5% | 1,345,427 | 18.7% | |||||||||||||||||||||||||||||||
Total common equity and operating partnership units (1) | $ | 5,871,505 | 88.6% | $ | 6,426,642 | 89.4% | |||||||||||||||||||||||||||||
| Preferred Equity: | |||||||||||||||||||||||||||||||||||
| 5.250% Series X preferred stock (9,200,000 depository shares outstanding) callable 9/21/22 | 230,000 | 3.5% | 230,000 | 3.2% | |||||||||||||||||||||||||||||||
| 5.200% Series Y preferred stock (8,000,000 depository shares outstanding) callable 12/7/22 | 200,000 | 3.0% | 200,000 | 2.8% | |||||||||||||||||||||||||||||||
| 4.875% Series Z preferred stock (13,000,000 depository shares outstanding) callable 11/4/24 | 325,000 | 4.9% | 325,000 | 4.5% | |||||||||||||||||||||||||||||||
| Total preferred equity | $ | 755,000 | 11.4% | 5.08% | $ | 755,000 | 10.5% | 5.08% | |||||||||||||||||||||||||||
| Unsecured Debt: | |||||||||||||||||||||||||||||||||||
| Credit facility borrowing ($400.0 million at LIBOR + 0.70%) | $ | 20,000 | 0.3% | 0.82% | 32,000 | 0.4% | 0.80% | ||||||||||||||||||||||||||||
Unrestricted cash (2) | (20,000) | (0.3)% | (27,074) | (0.4)% | |||||||||||||||||||||||||||||||
| Net debt | $ | — | 0.0% | $4,926 | 0.1% | ||||||||||||||||||||||||||||||
| Total net debt and preferred equity | $ | 755,000 | 11.4% | 4.97% | $759,926 | 10.6% | 4.90% | ||||||||||||||||||||||||||||
| Total implied market capitalization | $ | 6,626,505 | 100.0% | $7,186,568 | 100.0% | ||||||||||||||||||||||||||||||
Interest expense and related expenses (annualized) (3) (4) | $ | 1,144 | $ | 1,000 | |||||||||||||||||||||||||||||||
Preferred distributions (annualized) (5) | 38,320 | 41,940 | |||||||||||||||||||||||||||||||||
| Total fixed charges and preferred distributions (annualized) | $ | 39,464 | $ | 42,940 | |||||||||||||||||||||||||||||||
Ratio of EBITDAre to fixed charges and preferred distributions (6) | 6.9x | 6.9x | |||||||||||||||||||||||||||||||||
Ratio of net debt and preferred equity to EBITDAre (7) | 2.8x | 2.6x | |||||||||||||||||||||||||||||||||
(1)Total common equity is calculated as the total number of common stock and operating partnership units outstanding multiplied by the Company’s closing share price at the end of each respective period. Closing share prices on
March 31, 2022 and December 31, 2021 were $168.08 and $184.17, respectively.
(2)Unrestricted cash balance is $104.2 million as of March 31, 2022. Cash used for net debt calculation is $20 million matching the debt balance as of March 31, 2022.
(3)Interest expense and related expenses includes facility fees associated with our unsecured credit facility.
(4)We annualized Interest expense and related charges for the three months ended March 31, 2022, in the amount of $286,000.
(5)We annualized preferred distributions for the three months ended March 31, 2022, in the amount of $9.6 million.
(6)For each period shown, ratio of total fixed charges to EBITDAre is calculated using the respective quarter’s annualized fixed charges divided by the respective quarter’s annualized EBITDAre.
(7)For each period shown, ratio of debt and preferred equity to EBITDAre is calculated using total net debt and preferred equity reported during the quarter divided by the respective quarter’s annualized EBITDAre.
First Quarter 2022 Supplemental Financial Reporting Package 15
| Analysis of Capital Expenditures (unaudited and in thousands, except per square foot data) | ||||
| Three Months Ended March 31, | |||||||||||
| 2022 | 2021 | ||||||||||
Commercial Recurring Capital Expenditures (1) | |||||||||||
| Same Park | |||||||||||
| Capital improvements | $ | 1,979 | $ | 559 | |||||||
| Tenant improvements | 2,328 | 2,373 | |||||||||
| Lease commissions | 1,065 | 1,755 | |||||||||
| Total Same Park Recurring Capital Expenditures | $ | 5,372 | $ | 4,687 | |||||||
| Same Park Recurring Capital Expenditures as a percentage of Cash NOI | 7.3% | 6.9% | |||||||||
| Non-Same Park | |||||||||||
| Capital improvements | 31 | 6 | |||||||||
| Tenant improvements | 699 | 49 | |||||||||
| Lease commissions | 239 | 29 | |||||||||
| Total Non-Same Park Recurring Capital Expenditures | 969 | 84 | |||||||||
| Non-Same Park Recurring Capital Expenditures as a percentage of Cash NOI | 47.5% | 9.8% | |||||||||
| Total Recurring Capital Expenditures | 6,341 | 4,771 | |||||||||
| Total Recurring Capital Expenditures as a percentage of Cash NOI | 8.4% | 6.9% | |||||||||
| Assets sold or held for sale Recurring Capital Expenditures | 8 | 634 | |||||||||
| Total commercial Recurring Capital Expenditures | 6,349 | 5,405 | |||||||||
| Total Commercial Recurring Capital Expenditures as a percentage of Cash NOI | 8.2% | 7.4% | |||||||||
Non-recurring Property Renovations (1) | 1,511 | 411 | |||||||||
| Total capital expenditures (excluding multifamily) | 7,860 | 5,816 | |||||||||
| Total capital expenditures | $ | 7,860 | $ | 5,816 | |||||||
Development costs (2) | $ | 16,251 | $ | 10,608 | |||||||
(1)Refer to page 29, Definitions and Non-GAAP Disclosures, for the definitions of Recurring Capital Expenditures and Non-recurring Property Renovations.
(2)Development costs for the three months ended March 31, 2022 comprises Brentford ($9.6M), 212 Industrial Park ($3.3M), and Boca ($1.2M). See Developments page. We also have additional entitlement related costs for certain projects which comprise Colma Creek ($1.7M), Charlton ($0.3M), Overlake <($0.1M), and The Mile <($0.1M).
First Quarter 2022 Supplemental Financial Reporting Package 16
| Portfolio Summary (unaudited) | ||||
| PROPERTY INFORMATION | |||||||||||||||||
| Three Months Ended March 31, | |||||||||||||||||
| 2022 | 2021 | % Change | |||||||||||||||
Total Portfolio (1) | |||||||||||||||||
| Total square footage at period end | 27,010,000 | 26,151,000 | 3.3 | % | |||||||||||||
| Weighted average occupancy | 95.5 | % | 93.2 | % | 2.3 | % | |||||||||||
| Period end occupancy | 95.5 | % | 93.6 | % | 1.9 | % | |||||||||||
Cash rental income per occupied square foot (2) (3) | $ | 16.61 | $ | 16.11 | 3.1 | % | |||||||||||
| Industrial | $ | 14.66 | $ | 13.84 | 5.9 | % | |||||||||||
| Flex | $ | 20.21 | $ | 19.87 | 1.7 | % | |||||||||||
| Office | $ | 24.88 | $ | 25.05 | (0.7) | % | |||||||||||
Same Park Portfolio (2) | |||||||||||||||||
| Total square footage at period end | 25,749,000 | 25,749,000 | — | ||||||||||||||
| Weighted average occupancy | 96.0 | % | 93.3 | % | 2.7 | % | |||||||||||
| Period end occupancy | 95.9 | % | 93.8 | % | 2.1 | % | |||||||||||
Cash rental income per occupied square foot (2) (4) | $ | 16.84 | $ | 16.10 | 4.6 | % | |||||||||||
| Industrial | $ | 14.87 | $ | 13.79 | 7.8 | % | |||||||||||
| Flex | $ | 20.21 | $ | 19.87 | 1.7 | % | |||||||||||
| Office | $ | 24.88 | $ | 25.05 | (0.7) | % | |||||||||||
Non-Same Park Portfolio (2) | |||||||||||||||||
| Total square footage at period end | 1,261,000 | 402,000 | 213.7 | % | |||||||||||||
| Weighted average occupancy | 86.4 | % | 86.7 | % | (0.3) | % | |||||||||||
| Period end occupancy | 86.3 | % | 77.8 | % | 8.5 | % | |||||||||||
Cash rental income per occupied square foot (2) (5) | $ | 11.25 | $ | 16.83 | (33.2) | % | |||||||||||
| Industrial | $ | 11.25 | $ | 16.83 | (33.2) | % | |||||||||||
| Multifamily Portfolio | |||||||||||||||||
| Number of units | 395 | 395 | — | ||||||||||||||
| Weighted average occupancy | 95.0 | % | 94.2 | % | 0.8 | % | |||||||||||
| Period end occupancy | 96.9 | % | 93.6 | % | 3.3 | % | |||||||||||
Average rent per unit (6) | $ | 2,123 | $ | 2,021 | 5.0 | % | |||||||||||
(1)Operating metrics for our multifamily asset are excluded from total portfolio operating metrics.
(2)Refer to page 29, Definitions and Non-GAAP Disclosures, for the definitions of Revenue per Occupied Square Foot, Same Park and Non-Same Park.
(3)Included in the calculation of Total Park revenue per occupied square foot is (a) lease buyout income of $0.3 million and $0.4 million for the three months ended March 31, 2022 and 2021, respectively, (b) accounts receivable write-offs (recoveries) of $0.1 million and $0.0 million for the three months ended March 31, 2022 and 2021, respectively, and (c) deferred rent receivable write-offs of $0.0 million and $0.1 million for the three months ended March 31, 2022 and 2021, respectively.
(4)Included in the calculation of Same Park revenue per occupied square foot is (a) lease buyout income of $0.2 million and $0.4 million for the three months ended March 31, 2022 and 2021, respectively, (b) accounts receivable write-offs (recoveries) of $0.1 million and $0.0 million for the three months ended March 31, 2022 and 2021, and (c) deferred rent receivable write-offs of $0.0 million and $0.1 million for the three months ended March 31, 2022 and 2021, respectively.
(5)Included in the calculation of Non-Same Park revenue per occupied square foot is (a) lease buyout income of $0.0 for both of the three months ended March 31, 2022 and 2021, (b) accounts receivable write-offs of $0.0 million and $0.0 for the three months ended March 31, 2022 and 2021, respectively, and (c) deferred rent receivable write-offs of $0.0 million for both of the three months ended March 31, 2022 and 2021.
(6)Average rent per unit is defined as the total potential monthly rental revenue (actual rent for occupied apartment units plus market rent for vacant apartment units) divided by the total number of rentable apartment units.
First Quarter 2022 Supplemental Financial Reporting Package 17
| Total Portfolio Overview by Markets and Product Type (unaudited, in thousands) | ||||
Square Footage of Properties by Product Type as of March 31, 2022 | |||||||||||||||||||||||||||||
| Markets | Industrial | Flex | Office | Total | % of Total | ||||||||||||||||||||||||
| Northern California | 6,391 | 593 | 340 | 7,324 | 27.1 | % | |||||||||||||||||||||||
| Southern California | 2,989 | 582 | 31 | 3,602 | 13.3 | % | |||||||||||||||||||||||
| Dallas | 2,242 | 793 | n/a | 3,035 | 11.3 | % | |||||||||||||||||||||||
| Austin | 755 | 1,208 | n/a | 1,963 | 7.3 | % | |||||||||||||||||||||||
| Northern Virginia | 1,810 | 1,242 | 1,726 | 4,778 | 17.7 | % | |||||||||||||||||||||||
| South Florida | 3,728 | 126 | 12 | 3,866 | 14.3 | % | |||||||||||||||||||||||
| Seattle | 1,052 | 270 | 28 | 1,350 | 5.0 | % | |||||||||||||||||||||||
| Suburban Maryland | 341 | n/a | 751 | 1,092 | 4.0 | % | |||||||||||||||||||||||
| Total | 19,308 | 4,814 | 2,888 | 27,010 | 100.0 | % | |||||||||||||||||||||||
| Percentage by Product Type | 71.5 | % | 17.8 | % | 10.7 | % | 100.0 | % | |||||||||||||||||||||
Weighted Average Occupancy Rates by Product Type for the Three Months Ended March 31, 2022 | |||||||||||||||||||||||
| Markets | Industrial | Flex | Office | Total | |||||||||||||||||||
| Northern California | 99.2% | 95.1% | 71.1% | 97.6% | |||||||||||||||||||
| Southern California | 98.3% | 95.0% | 93.0% | 97.8% | |||||||||||||||||||
| Dallas | 94.9% | 92.5% | n/a | 94.3% | |||||||||||||||||||
| Austin | 99.8% | 90.7% | n/a | 94.2% | |||||||||||||||||||
| Northern Virginia | 91.2% | 95.8% | 87.2% | 91.0% | |||||||||||||||||||
| South Florida | 98.0% | 97.0% | 100.0% | 98.0% | |||||||||||||||||||
| Seattle | 97.5% | 90.6% | 65.0% | 95.4% | |||||||||||||||||||
| Suburban Maryland | 100.0% | n/a | 88.6% | 92.1% | |||||||||||||||||||
| Percentage by Product Type | 97.5% | 93.5% | 85.6% | 95.5% | |||||||||||||||||||
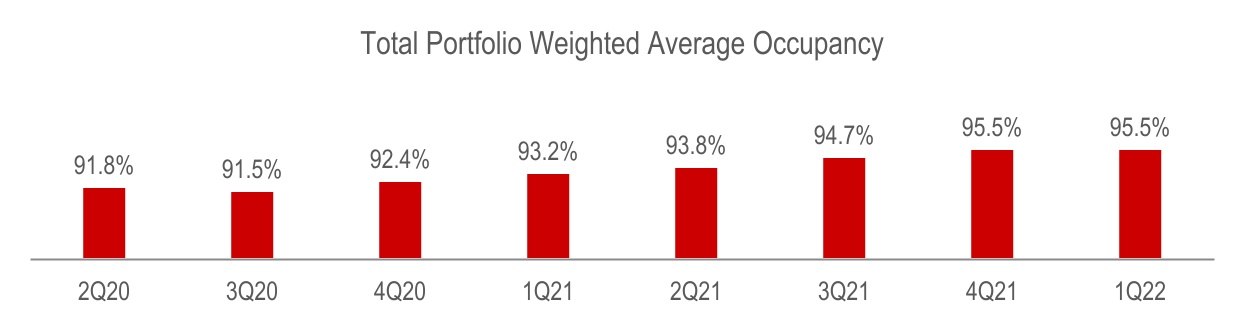
First Quarter 2022 Supplemental Financial Reporting Package 18
| Same Park Overview by Markets and Product Type (unaudited, in thousands) | ||||
Square Footage of Same Park Properties by Product Type as of March 31, 2022 | |||||||||||||||||||||||||||||
| Markets | Industrial | Flex | Office | Total | % of Total | ||||||||||||||||||||||||
| Northern California | 6,391 | 593 | 340 | 7,324 | 28.5 | % | |||||||||||||||||||||||
| Southern California | 2,916 | 582 | 31 | 3,529 | 13.7 | % | |||||||||||||||||||||||
| Dallas | 1,300 | 793 | n/a | 2,093 | 8.1 | % | |||||||||||||||||||||||
| Austin | 755 | 1,208 | n/a | 1,963 | 7.6 | % | |||||||||||||||||||||||
| Northern Virginia | 1,564 | 1,242 | 1,726 | 4,532 | 17.6 | % | |||||||||||||||||||||||
| South Florida | 3,728 | 126 | 12 | 3,866 | 15.0 | % | |||||||||||||||||||||||
| Seattle | 1,052 | 270 | 28 | 1,350 | 5.3 | % | |||||||||||||||||||||||
| Suburban Maryland | 341 | n/a | 751 | 1,092 | 4.2 | % | |||||||||||||||||||||||
| Total | 18,047 | 4,814 | 2,888 | 25,749 | 100.0 | % | |||||||||||||||||||||||
| Percentage by Product Type | 70.1 | % | 18.7 | % | 11.2 | % | 100.0 | % | |||||||||||||||||||||
Same Park Weighted Average Occupancy Rates by Product Type for the Three Months Ended March 31, 2022 | |||||||||||||||||||||||
| Markets | Industrial | Flex | Office | Total | |||||||||||||||||||
| Northern California | 99.2% | 95.1% | 71.1% | 97.6% | |||||||||||||||||||
| Southern California | 98.4% | 95.0% | 93.0% | 97.8% | |||||||||||||||||||
| Dallas | 93.1% | 92.5% | n/a | 92.9% | |||||||||||||||||||
| Austin | 99.8% | 90.7% | n/a | 94.2% | |||||||||||||||||||
| Northern Virginia | 99.1% | 95.8% | 87.2% | 93.7% | |||||||||||||||||||
| South Florida | 98.0% | 97.0% | 100.0% | 98.0% | |||||||||||||||||||
| Seattle | 97.5% | 90.6% | 65.0% | 95.4% | |||||||||||||||||||
| Suburban Maryland | 100.0% | n/a | 88.6% | 92.1% | |||||||||||||||||||
| Percentage by Product Type | 98.3% | 93.5% | 85.6% | 96.0% | |||||||||||||||||||
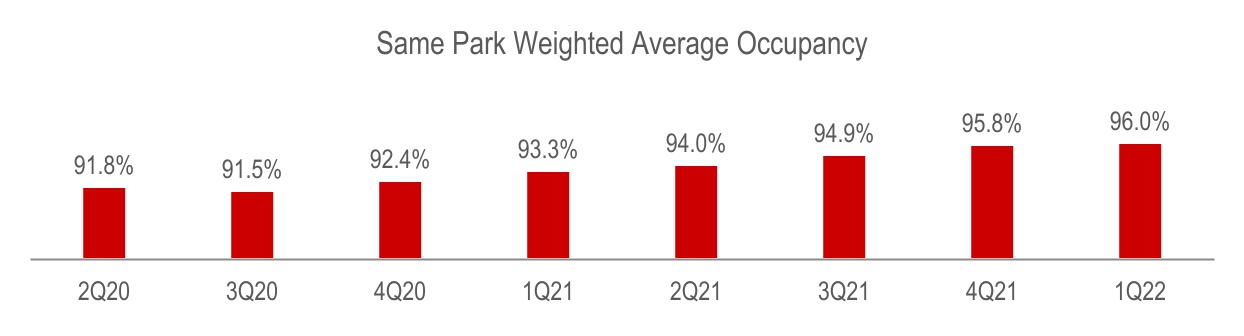
First Quarter 2022 Supplemental Financial Reporting Package 19
| Q1 2022 Production Statistics (unaudited) | ||||
Total Portfolio Activity (1) | |||||||||||||||||||||||||||||||||||
Industrial | Leasing Volume | Customer Retention | Transaction Costs per Executed Foot | Transaction Costs as a % of Rents (2) | Cash Rental Rate Change (2) | GAAP Rent Change (2) | |||||||||||||||||||||||||||||
| Northern California | 226,000 | 81.0% | $ | 2.01 | 3.7% | 14.5% | 29.6% | ||||||||||||||||||||||||||||
| Southern California | 247,000 | 81.3% | 1.94 | 4.3% | 12.1% | 23.4% | |||||||||||||||||||||||||||||
| Dallas | 158,000 | 52.3% | 3.20 | 9.4% | 14.0% | 21.1% | |||||||||||||||||||||||||||||
| Austin | 28,000 | 0.0% | 3.19 | 7.3% | 19.9% | 47.7% | |||||||||||||||||||||||||||||
| Northern Virginia | 192,000 | 97.4% | 4.54 | 7.6% | 6.7% | 17.9% | |||||||||||||||||||||||||||||
| South Florida | 299,000 | 66.2% | 1.36 | 2.7% | 25.1% | 51.0% | |||||||||||||||||||||||||||||
| Seattle | 45,000 | 71.9% | 1.80 | 3.1% | 18.4% | 37.7% | |||||||||||||||||||||||||||||
| Suburban Maryland | 9,000 | 100.0% | 1.09 | 3.3% | -1.6% | 0.5% | |||||||||||||||||||||||||||||
| Industrial Totals by Market | 1,204,000 | 74.1% | $ | 2.41 | 4.9% | 15.4% | 30.9% | ||||||||||||||||||||||||||||
Flex | |||||||||||||||||||||||||||||||||||
| Northern California | 43,000 | 91.5% | $ | 0.75 | 2.5% | 6.4% | 13.1% | ||||||||||||||||||||||||||||
| Southern California | 44,000 | 81.1% | 4.88 | 7.6% | 8.0% | 20.4% | |||||||||||||||||||||||||||||
| Dallas | 51,000 | 79.0% | 2.46 | 8.9% | 7.8% | 18.9% | |||||||||||||||||||||||||||||
| Austin | 108,000 | 90.3% | 7.28 | 10.2% | 5.1% | 16.8% | |||||||||||||||||||||||||||||
| Northern Virginia | 34,000 | 53.0% | 3.74 | 9.9% | -0.9% | 0.4% | |||||||||||||||||||||||||||||
| South Florida | 6,000 | 58.5% | 2.10 | 3.0% | 16.6% | 34.1% | |||||||||||||||||||||||||||||
| Seattle | 32,000 | 51.1% | 2.80 | 6.5% | 7.7% | 16.8% | |||||||||||||||||||||||||||||
| Flex Totals by Market | 318,000 | 75.4% | $ | 4.36 | 8.5% | 5.9% | 15.6% | ||||||||||||||||||||||||||||
| Office | |||||||||||||||||||||||||||||||||||
| Northern California | 19,000 | 91.7% | $ | 0.04 | 0.1% | -6.6% | -5.8% | ||||||||||||||||||||||||||||
| Southern California | 1,000 | 30.9% | — | — | 1.0% | 9.0% | |||||||||||||||||||||||||||||
| Northern Virginia | 85,000 | 69.1% | 9.97 | 16.8% | -8.4% | 1.1% | |||||||||||||||||||||||||||||
| Seattle | 1,000 | 100.0% | — | — | 6.2% | 15.3% | |||||||||||||||||||||||||||||
| Suburban Maryland | 22,000 | 76.2% | 8.15 | 23.8% | -1.3% | 4.0% | |||||||||||||||||||||||||||||
| Office Totals by Market | 128,000 | 72.3% | $ | 8.00 | 15.1% | -6.8% | -0.1% | ||||||||||||||||||||||||||||
| Company Totals by Type | 1,650,000 | 74.2% | $ | 3.22 | 6.4% | 10.7% | 23.4% | ||||||||||||||||||||||||||||
(1)Average lease term for leases executed during the quarter-ended March 31, 2022 was 3.5 years.
(2)Refer to page 29, Definitions and Non-GAAP Disclosures, for the definitions of Transaction Costs as a Percentage of Rents, Cash Rental Rate Change, and GAAP Rent Change.
First Quarter 2022 Supplemental Financial Reporting Package 20
| Lease Expirations by Type (unaudited, in thousands) | ||||
| Lease Expirations - Total Portfolio | |||||||||||||||||||||||
| Year of Lease Expiration | Leased Square Footage | Annualized Rental Income (1) | % Total | % of Total Annualized Rental Income | |||||||||||||||||||
| 2022 | 4,227 | $ | 74,554 | 16.2 | % | 16.2 | % | ||||||||||||||||
| 2023 | 6,169 | 105,479 | 22.9 | % | 22.9 | % | |||||||||||||||||
| 2024 | 5,159 | 92,695 | 20.1 | % | 20.1 | % | |||||||||||||||||
| 2025 | 3,931 | 71,604 | 15.5 | % | 15.5 | % | |||||||||||||||||
| 2026 | 2,508 | 45,027 | 9.7 | % | 9.7 | % | |||||||||||||||||
| Thereafter | 3,851 | 71,996 | 15.6 | % | 15.6 | % | |||||||||||||||||
| Total | 25,845 | $ | 461,355 | 100.0 | % | 100.0 | % | ||||||||||||||||
| Lease Expirations - Industrial | |||||||||||||||||||||||
| Year of Lease Expiration | Leased Square Footage | Annualized Rental Income (1) | % of Industrial | % of Total Annualized Rental Income | |||||||||||||||||||
| 2022 | 2,808 | $ | 41,965 | 14.1 | % | 9.1 | % | ||||||||||||||||
| 2023 | 4,401 | 65,477 | 22.0 | % | 14.2 | % | |||||||||||||||||
| 2024 | 3,634 | 58,191 | 19.6 | % | 12.6 | % | |||||||||||||||||
| 2025 | 2,869 | 44,807 | 15.1 | % | 9.7 | % | |||||||||||||||||
| 2026 | 1,859 | 29,555 | 9.9 | % | 6.4 | % | |||||||||||||||||
| Thereafter | 3,289 | 57,073 | 19.3 | % | 12.4 | % | |||||||||||||||||
| Total | 18,860 | $ | 297,068 | 100.0 | % | 64.4 | % | ||||||||||||||||
| Lease Expirations - Flex | |||||||||||||||||||||||
| Year of Lease Expiration | Leased Square Footage | Annualized Rental Income (1) | % of Flex | % of Total Annualized Rental Income | |||||||||||||||||||
| 2022 | 911 | $ | 19,977 | 20.6 | % | 4.4 | % | ||||||||||||||||
| 2023 | 1,095 | 22,350 | 23.1 | % | 4.9 | % | |||||||||||||||||
| 2024 | 1,014 | 21,106 | 21.8 | % | 4.6 | % | |||||||||||||||||
| 2025 | 716 | 16,175 | 16.7 | % | 3.5 | % | |||||||||||||||||
| 2026 | 366 | 7,544 | 7.8 | % | 1.6 | % | |||||||||||||||||
| Thereafter | 399 | 9,708 | 10.0 | % | 2.1 | % | |||||||||||||||||
| Total | 4,501 | $ | 96,860 | 100.0 | % | 21.1 | % | ||||||||||||||||
| Lease Expirations - Office | |||||||||||||||||||||||
| Year of Lease Expiration | Leased Square Footage | Annualized Rental Income (1) | % of Office | % of Total Annualized Rental Income | |||||||||||||||||||
| 2022 | 508 | $ | 12,612 | 18.6 | % | 2.7 | % | ||||||||||||||||
| 2023 | 673 | 17,652 | 26.2 | % | 3.8 | % | |||||||||||||||||
| 2024 | 511 | 13,398 | 19.9 | % | 2.9 | % | |||||||||||||||||
| 2025 | 346 | 10,622 | 15.8 | % | 2.3 | % | |||||||||||||||||
| 2026 | 283 | 7,928 | 11.8 | % | 1.7 | % | |||||||||||||||||
| Thereafter | 163 | 5,215 | 7.7 | % | 1.1 | % | |||||||||||||||||
| Total | 2,484 | $ | 67,427 | 100.0 | % | 14.5 | % | ||||||||||||||||
(1)Annualized rental income represents annualized outgoing rents inclusive of related estimated expense recoveries. Actual rental income amounts may vary depending upon re-leasing of expiring spaces.
First Quarter 2022 Supplemental Financial Reporting Package 21
| Industry Concentration and Top Ten Customers (unaudited and dollars in thousands) | ||||
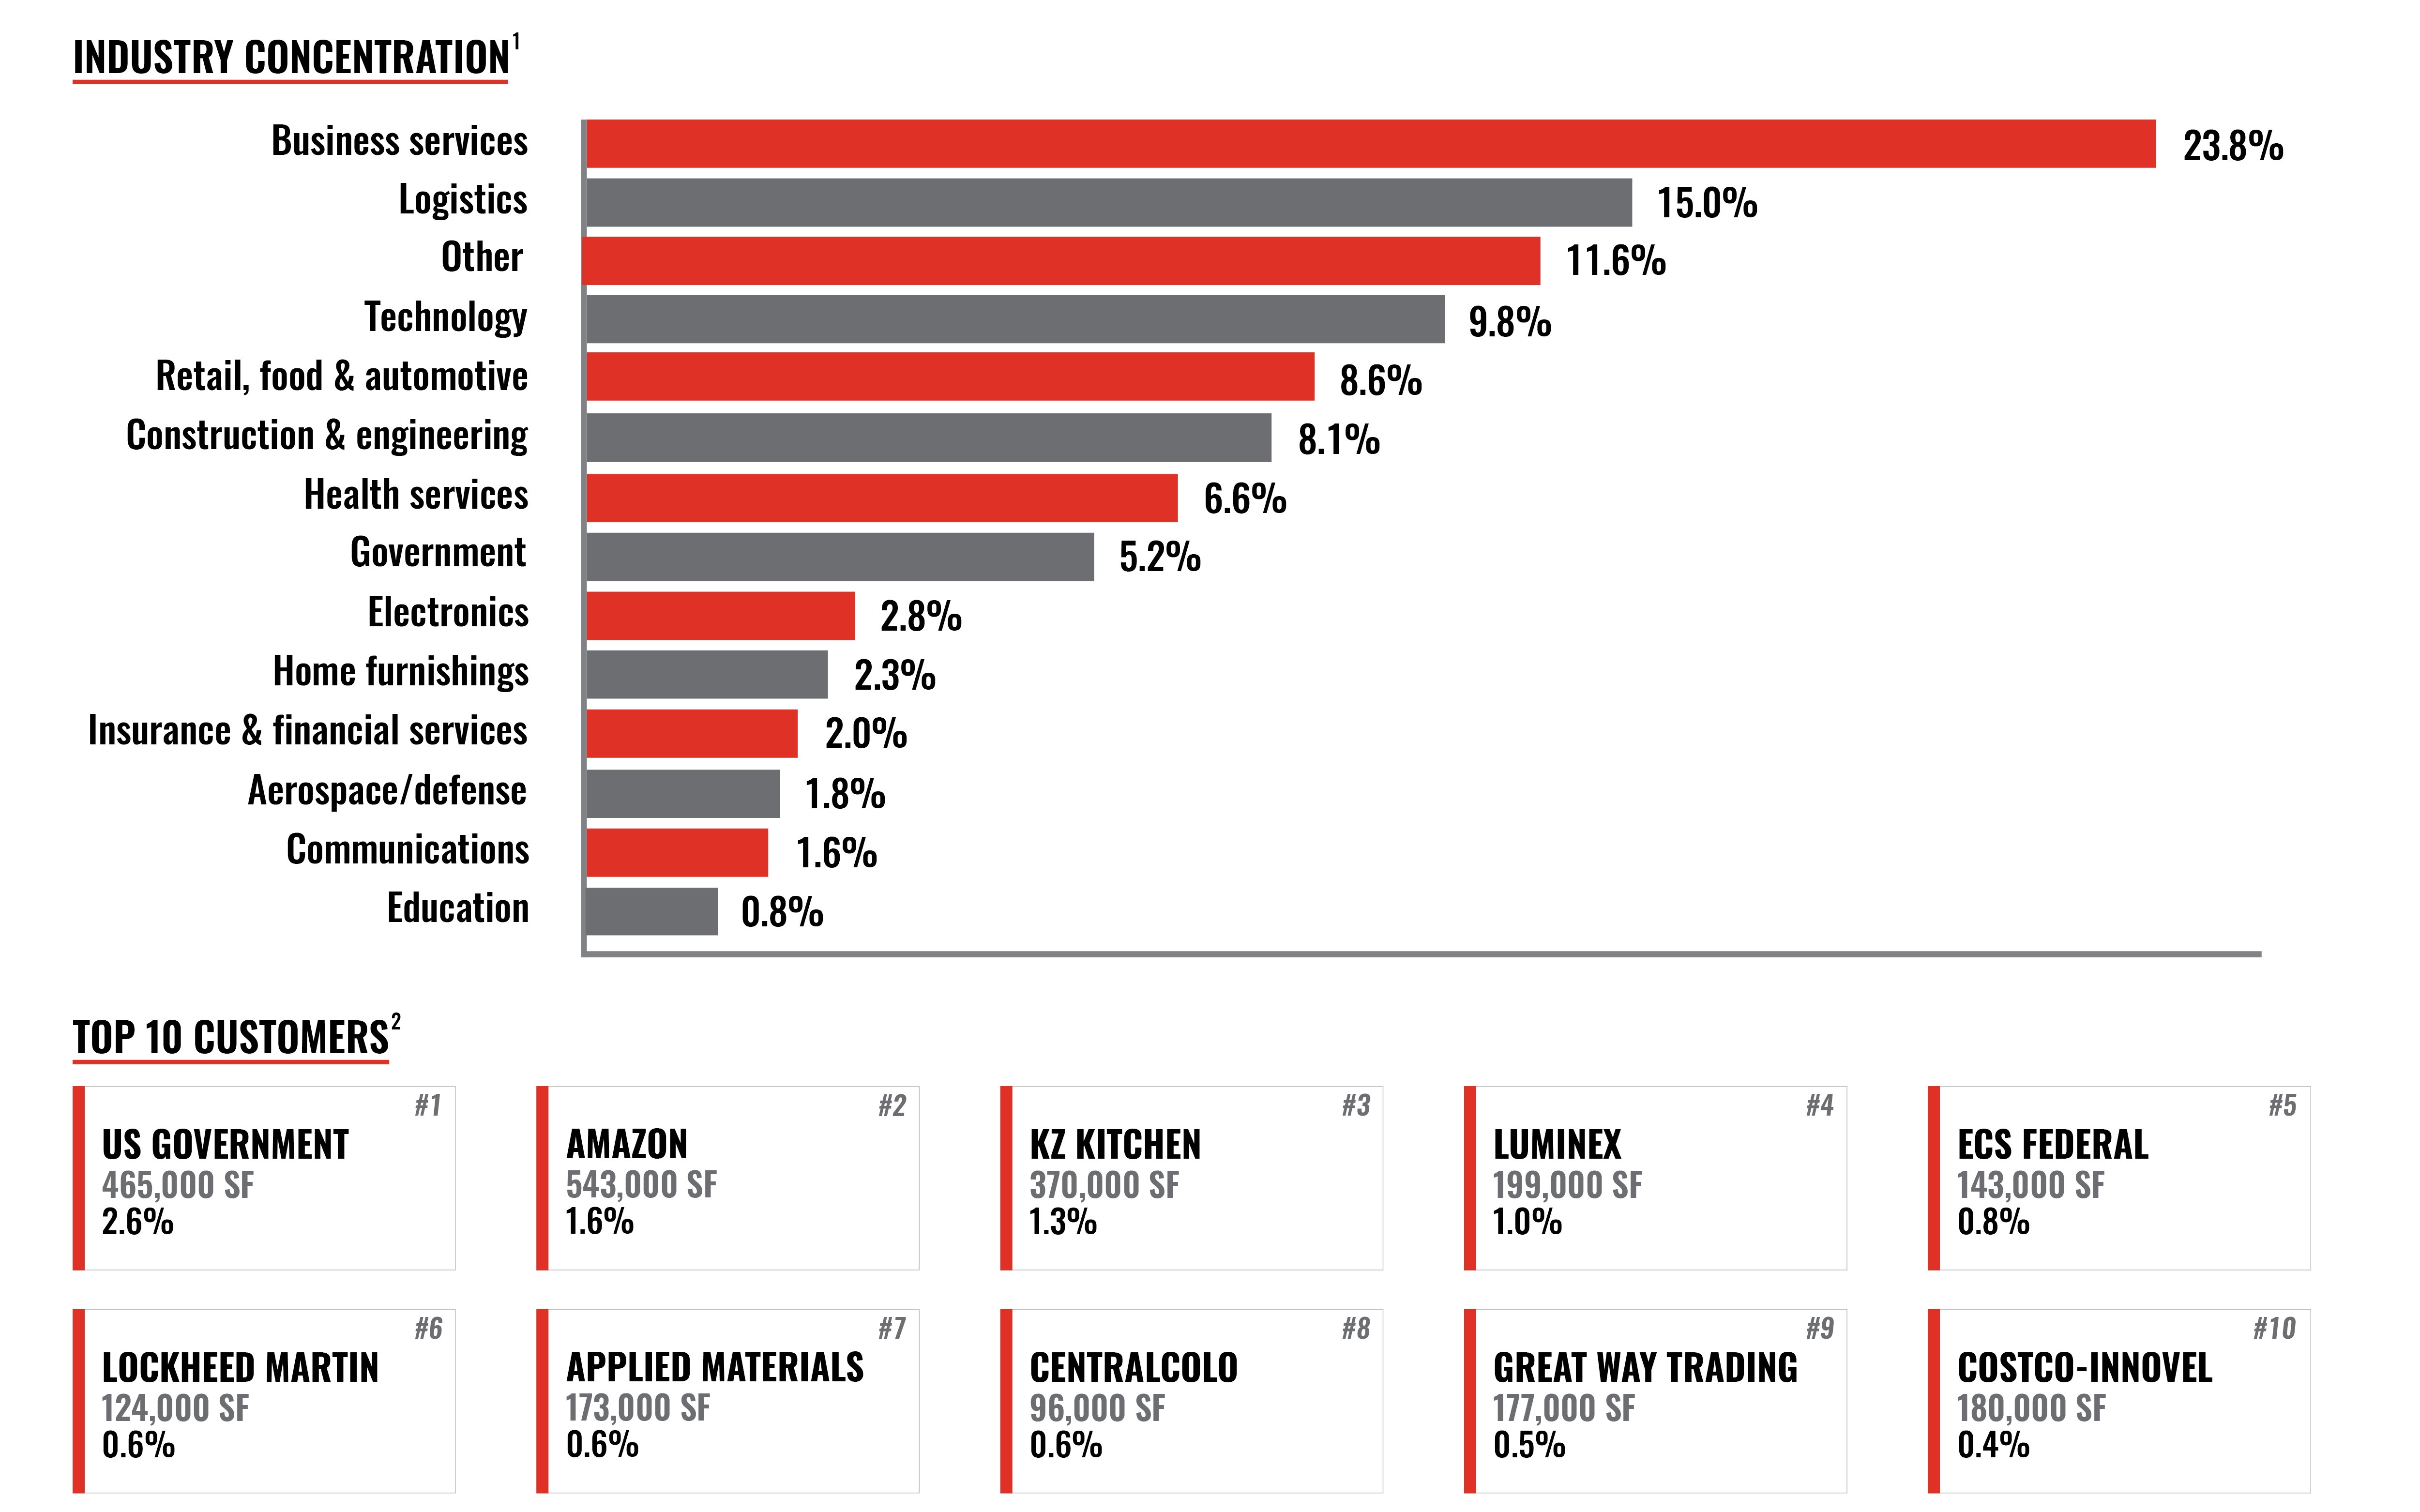
(1)Industry concentration is categorized based on customers’ Standard Industrial Classification Code.
(2)For leases expiring within one year, annualized rental income includes only the income to be received under the existing lease from January 1, 2022 through the respective date of expiration.
First Quarter 2022 Supplemental Financial Reporting Package 22
| Industrial and Multifamily Development Projects (unaudited, in thousands, except SF, No of Apt Homes, and Avg. Rent Per Home) | |||||||
Industrial
| Property Name | Location | New Bldg. SF (1) | Construction Start | Construction Complete (2) | Estimated Stabilization (2) | Land Cost (3) | Project Cost | Total Investment | Estimated Stabilized Cash NOI | Estimated Stabilized Cash Yield | ||||||||||||||||||||||
| Under Construction | ||||||||||||||||||||||||||||||||
| Boca | Boca Raton, FL | 17,235 | 4Q21 | 4Q22 | 4Q23 | $ | 616 | $ | 4,200 | $ | 4,816 | $ | 290 | 6.0% | ||||||||||||||||||
| 212 Industrial Park | Kent, WA | 83,152 | 4Q21 | 4Q22 | 3Q23 | 1,515 | 16,000 | 17,515 | 956 | 5.5% | ||||||||||||||||||||||
| Total/Wgt. Avg. Under Construction | 100,387 | $ | 2,131 | $ | 20,200 | $ | 22,331 | $ | 1,246 | 5.6% | ||||||||||||||||||||||
______________________
1 New Bldg. SF relates to new development SF (Parking lot building..etc.), New Building SF not included in Portfolio SF as of March 31, 2022.
2 Refer to page 29, Definition and Non-GAAP Disclosures, for the definition of Stabilization.
3 Land cost - Proration of the historical land basis for the overall project.
MultiFamily
| Development Name | Location | No. of Apt. Homes | Net Rentable SF (1) | Construction Start | Construction Complete (2) | Initial Occupancy.(2) | Estimated Stabilization (3) | Land Cost (4) | Project Cost | Total Investment | Avg. Rent Per Home | Estimated Stabilized Cash NOI (3) | Estimated Stabilized Cash Yield (3) | ||||||||||||||||||||||||||||
| Under Construction | |||||||||||||||||||||||||||||||||||||||||
| Brentford | McLean, VA | 411 | 372,215 | 3Q20 | 1Q23 | 3Q22 | 1Q25 | $ | 18.495 | $ | 110,000 | $ | 128,500 | $ | 2,543 | TBD | TBD | ||||||||||||||||||||||||
| Total/Wtd. Avg. Under Construction | 411 | 372,215 | $ | 18.495 | $ | 110,000 | $ | 128,500 | $ | 2,543 | TBD | TBD | |||||||||||||||||||||||||||||
1 Net Rentable SF not included in Portfolio SF as of March 31, 2022.
2 Refer to page 29, Definition and Non-GAAP Disclosures, for the definition of Stabilization.
3 Construction is completed in stages. Initial Occupancy may begin as each stage is completed. Estimated stabilized cash NOI will be presented when initial occupancy is at 50%.
4 Market value of contributed parcel of land at the start of construction/project approval.
First Quarter 2022 Supplemental Financial Reporting Package 23
| Appendix A - Select Consolidated Balance Sheets Variance Detail (unaudited and dollars in thousands) | |||||||
| (a) | Change in cash and cash equivalents | ||||||||||||||||||||||
Beginning cash balance at December 31, 2021 | $ | 27,074 | |||||||||||||||||||||
| Net cash provided by operating activities | 66,555 | ||||||||||||||||||||||
Net cash provided by investing activities | 67,796 | ||||||||||||||||||||||
| Net cash used in financing activities | (57,221) | ||||||||||||||||||||||
Ending cash balance at March 31, 2022 | $ | 104,204 | |||||||||||||||||||||
| (b) | Change in real estate facilities, at cost | ||||||||||||||||||||||
Beginning balance at December 31, 2021 | $ | 1,928,085 | |||||||||||||||||||||
| Recurring capital improvements | 2,015 | ||||||||||||||||||||||
| Tenant improvements, gross | 3,035 | ||||||||||||||||||||||
| Capitalized lease commissions | 1,307 | ||||||||||||||||||||||
| Nonrecurring capital improvements | 1,511 | ||||||||||||||||||||||
| Depreciation and amortization of real estate facilities | (22,308) | ||||||||||||||||||||||
Transfer to land and building held for development, net | (2,131) | ||||||||||||||||||||||
| Transfer to properties held for sale, net | (7) | ||||||||||||||||||||||
Ending balance at March 31, 2022 | $ | 1,911,507 | |||||||||||||||||||||
| Increase | |||||||||||||||||||||||
| (c) | Change in rent receivable | March 31, 2022 | December 31, 2021 | (Decrease) | |||||||||||||||||||
| Non-government customers | $ | 2,381 | $ | 1,186 | $ | 1,195 | |||||||||||||||||
| U.S. Government customers | 607 | 435 | 172 | ||||||||||||||||||||
| $ | 2,988 | $ | 1,621 | $ | 1,367 | ||||||||||||||||||
| Increase | |||||||||||||||||||||||
| (d) | Change in other assets | March 31, 2022 | December 31, 2021 | (Decrease) | |||||||||||||||||||
| Lease intangible assets, net | $ | 7,558 | $ | 8,555 | $ | (997) | |||||||||||||||||
| Prepaid property taxes and insurance | 1,769 | 3,439 | (1,670) | ||||||||||||||||||||
| Other | 3,849 | 4,268 | (419) | ||||||||||||||||||||
| $ | 13,176 | $ | 16,262 | $ | (3,086) | ||||||||||||||||||
| Increase | |||||||||||||||||||||||
| (e) | Change in accrued and other liabilities | March 31, 2022 | December 31, 2021 | (Decrease) | |||||||||||||||||||
| Customer security deposits | $ | 42,944 | $ | 42,027 | $ | 917 | |||||||||||||||||
| Accrued property taxes | 12,683 | 13,289 | (606) | ||||||||||||||||||||
| Customer prepaid rent | 12,569 | 14,232 | (1,663) | ||||||||||||||||||||
| Lease intangible liabilities, net | 5,687 | 6,330 | (643) | ||||||||||||||||||||
| Accrued tax liability | 3,600 | 3,600 | — | ||||||||||||||||||||
Other | 18,026 | 17,673 | 353 | ||||||||||||||||||||
| $ | 95,509 | $ | 97,151 | $ | (1,642) | ||||||||||||||||||
| (f) | Change in paid-in capital | ||||||||||||||||||||||
Beginning paid-in capital at December 31, 2021 | $ | 752,444 | |||||||||||||||||||||
| Exercise of stock options | 2,101 | ||||||||||||||||||||||
| Stock compensation expense, net | 773 | ||||||||||||||||||||||
| Cash paid for taxes in lieu of stock upon vesting of restricted stock units | (931) | ||||||||||||||||||||||
Ending paid-in capital at March 31, 2022 | $ | 754,387 | |||||||||||||||||||||
| (g) | Change in accumulated earnings | ||||||||||||||||||||||
Beginning accumulated earnings at December 31, 2021 | $ | 226,737 | |||||||||||||||||||||
| Net income | 82,096 | ||||||||||||||||||||||
| Distributions to preferred stockholders | (9,580) | ||||||||||||||||||||||
| Distributions to common stockholders | (29,010) | ||||||||||||||||||||||
Ending accumulated earnings at March 31, 2022 | $ | 270,243 | |||||||||||||||||||||
First Quarter 2022 Supplemental Financial Reporting Package 24
| Appendix B - Consolidated Statements of Operations, Quarter-to-Date (unaudited and in thousands, except per share amounts) | ||||
| Three Months Ended March 31, | Increase (Decrease) | |||||||||||||||||||
| 2022 | 2021 | |||||||||||||||||||
| (a) | Rental income: | |||||||||||||||||||
Same Park (1) (2) | $ | 104,096 | $ | 96,638 | $ | 7,458 | ||||||||||||||
Same Park non-cash rental income (1) (3) | 918 | 1,374 | (456) | |||||||||||||||||
Non-Same Park (1) (2) | 3,074 | 1,270 | 1,804 | |||||||||||||||||
Non-Same Park non-cash rental income (1) (3) | 274 | (24) | 298 | |||||||||||||||||
| Multifamily | 2,369 | 2,327 | 42 | |||||||||||||||||
Rental income from assets sold or held for sale (4) | 2,109 | 6,462 | (4,353) | |||||||||||||||||
| $ | 112,840 | $ | 108,047 | $ | 4,793 | |||||||||||||||
| (b) | Cost of operations: | |||||||||||||||||||
Same Park (1) | $ | 30,404 | $ | 28,754 | 1,650 | |||||||||||||||
Same Park non-cash expense (1) (5) | 496 | 421 | 75 | |||||||||||||||||
Non-Same Park (1) | 1,035 | 417 | 618 | |||||||||||||||||
Non-Same Park non-cash expense (1) (5) | 25 | 5 | 20 | |||||||||||||||||
| Multifamily | 1,224 | 1,067 | 157 | |||||||||||||||||
Operating expenses from assets sold or held for sale (4) | 930 | 2,554 | (1,624) | |||||||||||||||||
| $ | 34,114 | $ | 33,218 | $ | 896 | |||||||||||||||
| (c) | General and administrative expenses: | |||||||||||||||||||
Compensation expense (6) | $ | 9,286 | $ | 1,643 | $ | 7,643 | ||||||||||||||
Stock compensation expense (7) | 404 | 1,324 | (920) | |||||||||||||||||
| Professional fees and other | 1,634 | 1,415 | 219 | |||||||||||||||||
| $ | 11,324 | $ | 4,382 | $ | 6,942 | |||||||||||||||
| (d) | Interest and other income: | |||||||||||||||||||
| Management fee income | $ | 57 | $ | 68 | $ | (11) | ||||||||||||||
| Interest income | 3 | 4 | (1) | |||||||||||||||||
| Other income | 186 | 184 | 2 | |||||||||||||||||
| $ | 246 | $ | 256 | $ | (10) | |||||||||||||||
| (e) | Interest and other expense: | |||||||||||||||||||
Interest expense and credit facility fee (8) | $ | (140) | $ | (58) | $ | (82) | ||||||||||||||
| Amortization of credit facility origination costs | (146) | (78) | (68) | |||||||||||||||||
| Other expense | (44) | (75) | 31 | |||||||||||||||||
| $ | (330) | $ | (211) | $ | (119) | |||||||||||||||
(1)Refer to page 29, Definitions and Non-GAAP Disclosures, for the definitions of Same Park, Non-Same Park, Non-cash rental income, Assets Sold in 2022 and Assets Sold 2021.
(2)Same Park Cash Rental Income is presented net of (a) accounts receivable write-offs (recoveries) of $0.1 million and $0.0 million for the three months ended March 31, 2022 and 2021, respectively, and (b) rent deferrals and abatements $0.0 million and $0.3 million for the three months ended March 31, 2022 and 2021, respectively. Non-Same Park rental income is presented net of (a) accounts receivable write-offs and (b) rent deferrals and abatements of $0.0 million for each of the three months ended March 31, 2022 and 2021.
(3)Same Park non-cash rental income is presented net of deferred rent receivable write-offs of $0.0 and $0.1 million for the three months ended March 31, 2022 and 2021, respectively. Non-Same Park non-cash rental income is presented net of deferred rent receivable write-offs of $0.0 million for each of the three months ended March 31, 2022 and 2021.
(4)Amounts shown for the three months ended March 31, 2022 and 2021 include operating results attributable the Assets Sold in 2022 and Assets Sold in 2021.
(5)Non-cash expense represents stock compensation expense attributable to employees whose compensation expense is recorded in costs of operations.
(6)Compensation expense includes a one-time cash payment of $6.7 million to the former CEO in accordance with his separation agreement.
(7)Stock compensation expense includes $0.6 million related to the reversal of stock compensation for the unvested former CEO shares net of dividend forfeiture expense.
(8)Interest expense was $0.03 million and $0 for the three months ended March 31, 2022 and 2021, respectively.
First Quarter 2022 Supplemental Financial Reporting Package 25
| Appendix C - Same Park Cost of Operations (unaudited, in thousands) | |||||||
| Three Months Ended March 31, | |||||||||||||||||
| 2022 | 2021 | % Change | |||||||||||||||
| Cost of operations | |||||||||||||||||
| Property taxes | $ | 11,788 | $ | 11,197 | 5.3% | ||||||||||||
| Utilities | 4,637 | 4,417 | 5.0% | ||||||||||||||
| Repairs and maintenance | 5,679 | 5,244 | 8.3% | ||||||||||||||
| Compensation | 5,168 | 4,559 | 13.4% | ||||||||||||||
| Snow removal | 846 | 1,002 | (15.6)% | ||||||||||||||
| Property insurance | 1,268 | 1,167 | 8.7% | ||||||||||||||
| Other expenses | 1,514 | 1,589 | (4.7)% | ||||||||||||||
| Total Cash Cost of Operations | 30,900 | 29,175 | 5.9% | ||||||||||||||
| Less: Non-cash stock based compensation in operating costs | (496) | (421) | 17.8% | ||||||||||||||
| Total Cash Cost of Operations | $ | 30,404 | $ | 28,754 | 5.7% | ||||||||||||
First Quarter 2022 Supplemental Financial Reporting Package 26
| Appendix D - Lease Expiration by Market (unaudited, in thousands) | |||||||
| Lease Expirations - Northern California | |||||||||||||||||||||||
| Year of Lease Expiration | Leased Square Footage | Annualized Rental Income (1) | % of No. CA | % of Total Annualized Rental Income | |||||||||||||||||||
| 2022 | 800 | $ | 16,688 | 12.4 | % | 3.6 | % | ||||||||||||||||
| 2023 | 1,409 | 27,123 | 20.2 | % | 5.9 | % | |||||||||||||||||
| 2024 | 1,317 | 24,575 | 18.3 | % | 5.3 | % | |||||||||||||||||
| 2025 | 954 | 16,098 | 12.0 | % | 3.5 | % | |||||||||||||||||
| 2026 | 992 | 18,631 | 13.9 | % | 4.0 | % | |||||||||||||||||
| Thereafter | 1,664 | 31,225 | 23.2 | % | 6.8 | % | |||||||||||||||||
| Total | 7,136 | $ | 134,340 | 100.0 | % | 29.1 | % | ||||||||||||||||
| Lease Expirations - Southern California | |||||||||||||||||||||||
| Year of Lease Expiration | Leased Square Footage | Annualized Rental Income (1) | % of So. CA | % of Total Annualized Rental Income | |||||||||||||||||||
| 2022 | 670 | $ | 13,206 | 18.9 | % | 2.9 | % | ||||||||||||||||
| 2023 | 885 | 17,265 | 24.7 | % | 3.8 | % | |||||||||||||||||
| 2024 | 740 | 15,656 | 22.4 | % | 3.4 | % | |||||||||||||||||
| 2025 | 499 | 9,938 | 14.2 | % | 2.2 | % | |||||||||||||||||
| 2026 | 179 | 3,465 | 5.0 | % | 0.7 | % | |||||||||||||||||
| Thereafter | 557 | 10,339 | 14.8 | % | 2.2 | % | |||||||||||||||||
| Total | 3,530 | $ | 69,869 | 100.0 | % | 15.2 | % | ||||||||||||||||
Lease Expirations - Dallas | |||||||||||||||||||||||
| Year of Lease Expiration | Leased Square Footage | Annualized Rental Income (1) | % of Dallas | % of Total Annualized Rental Income | |||||||||||||||||||
| 2022 | 586 | $ | 7,063 | 20.9 | % | 1.5 | % | ||||||||||||||||
| 2023 | 818 | 9,266 | 27.4 | % | 2.0 | % | |||||||||||||||||
| 2024 | 550 | 6,760 | 20.0 | % | 1.5 | % | |||||||||||||||||
| 2025 | 337 | 4,069 | 12.1 | % | 0.9 | % | |||||||||||||||||
| 2026 | 405 | 4,511 | 13.4 | % | 1.0 | % | |||||||||||||||||
| Thereafter | 155 | 2,085 | 6.2 | % | 0.5 | % | |||||||||||||||||
| Total | 2,851 | $ | 33,754 | 100.0 | % | 7.4 | % | ||||||||||||||||
| Lease Expirations - Austin | |||||||||||||||||||||||
| Year of Lease Expiration | Leased Square Footage | Annualized Rental Income (1) | % of Austin | % of Total Annualized Rental Income | |||||||||||||||||||
| 2022 | 240 | $ | 5,241 | 13.6 | % | 1.2 | % | ||||||||||||||||
| 2023 | 305 | 6,128 | 15.9 | % | 1.3 | % | |||||||||||||||||
| 2024 | 396 | 8,880 | 23.0 | % | 1.9 | % | |||||||||||||||||
| 2025 | 457 | 9,899 | 25.6 | % | 2.0 | % | |||||||||||||||||
| 2026 | 120 | 2,934 | 7.6 | % | 0.6 | % | |||||||||||||||||
| Thereafter | 341 | 5,527 | 14.3 | % | 1.2 | % | |||||||||||||||||
| Total | 1,859 | $ | 38,609 | 100.0 | % | 8.2 | % | ||||||||||||||||
(1)Annualized rental income represents annualized outgoing rents inclusive of related estimated expense recoveries. Actual rental income amounts may vary depending upon re-leasing of expiring spaces.
First Quarter 2022 Supplemental Financial Reporting Package 27
| Appendix D - Lease Expiration by Market (unaudited, in thousands) | |||||||
| Lease Expirations - Northern Virginia | ||||||||||||||||||||||||||
| Year of Lease Expiration | Leased Square Footage | Annualized Rental Income (1) | % of No. VA | % of Total Annualized Rental Income | ||||||||||||||||||||||
| 2022 | 838 | $ | 16,299 | 18.7 | % | 3.5 | % | |||||||||||||||||||
| 2023 | 876 | 16,573 | 19.0 | % | 3.6 | % | ||||||||||||||||||||
| 2024 | 770 | 14,821 | 17.0 | % | 3.2 | % | ||||||||||||||||||||
| 2025 | 856 | 18,311 | 21.0 | % | 4.0 | % | ||||||||||||||||||||
| 2026 | 353 | 7,428 | 8.5 | % | 1.6 | % | ||||||||||||||||||||
| Thereafter | 652 | 13,813 | 15.8 | % | 3.0 | % | ||||||||||||||||||||
| Total | 4,345 | $ | 87,245 | 100.0 | % | 18.9 | % | |||||||||||||||||||
| Lease Expirations - South Florida | ||||||||||||||||||||||||||
| Year of Lease Expiration | Leased Square Footage | Annualized Rental Income (1) | % of So. FL | % of Total Annualized Rental Income | ||||||||||||||||||||||
| 2022 | 758 | $ | 9,404 | 17.4 | % | 2.0 | % | |||||||||||||||||||
| 2023 | 1,102 | 14,891 | 27.6 | % | 3.2 | % | ||||||||||||||||||||
| 2024 | 958 | 13,866 | 25.7 | % | 3.0 | % | ||||||||||||||||||||
| 2025 | 525 | 7,574 | 14.0 | % | 1.6 | % | ||||||||||||||||||||
| 2026 | 249 | 3,997 | 7.4 | % | 0.9 | % | ||||||||||||||||||||
| Thereafter | 236 | 4,228 | 7.9 | % | 0.9 | % | ||||||||||||||||||||
| Total | 3,828 | $ | 53,960 | 100.0 | % | 11.6 | % | |||||||||||||||||||
| Lease Expirations - Suburban Maryland | ||||||||||||||||||||||||||
| Year of Lease Expiration | Leased Square Footage | Annualized Rental Income (1) | % of Sub. MD | % of Total Annualized Rental Income | ||||||||||||||||||||||
| 2022 | 176 | $ | 3,257 | 15.1 | % | 0.7 | % | |||||||||||||||||||
| 2023 | 313 | 6,814 | 31.6 | % | 1.5 | % | ||||||||||||||||||||
| 2024 | 156 | 3,514 | 16.3 | % | 0.8 | % | ||||||||||||||||||||
| 2025 | 137 | 2,642 | 12.2 | % | 0.6 | % | ||||||||||||||||||||
| 2026 | 95 | 2,383 | 11.1 | % | 0.5 | % | ||||||||||||||||||||
| Thereafter | 132 | 2,954 | 13.7 | % | 0.6 | % | ||||||||||||||||||||
| Total | 1,009 | $ | 21,564 | 100.0 | % | 4.7 | % | |||||||||||||||||||
| Lease Expirations - Seattle | ||||||||||||||||||||||||||
| Year of Lease Expiration | Leased Square Footage | Annualized Rental Income (1) | % of Seattle | % of Total Annualized Rental Income | ||||||||||||||||||||||
| 2022 | 159 | $ | 3,396 | 15.4 | % | 0.8 | % | |||||||||||||||||||
| 2023 | 461 | 7,419 | 33.7 | % | 1.6 | % | ||||||||||||||||||||
| 2024 | 272 | 4,623 | 21.0 | % | 1.0 | % | ||||||||||||||||||||
| 2025 | 166 | 3,073 | 14.0 | % | 0.7 | % | ||||||||||||||||||||
| 2026 | 115 | 1,678 | 7.6 | % | 0.4 | % | ||||||||||||||||||||
| Thereafter | 114 | 1,825 | 8.3 | % | 0.4 | % | ||||||||||||||||||||
| Total | 1,287 | $ | 22,014 | 100.0 | % | 4.9 | % | |||||||||||||||||||
(1)Annualized rental income represents annualized outgoing rents inclusive of related estimated expense recoveries. Actual rental income amounts may vary depending upon re-leasing of expiring spaces.
First Quarter 2022 Supplemental Financial Reporting Package 28
| Definitions and Non-GAAP Disclosures | ||||
Provided within this supplemental information package are measures not defined in accordance with U.S. generally accepted accounting principles (“GAAP”). We believe our presentation of these non-GAAP measures assists investors and analysts in analyzing and comparing our operating and financial performance between reporting periods. These non-GAAP measures discussed below are not substitutes of other measures of financial performance presented in accordance with GAAP. In addition, other real estate investment trusts (“REITs”) may compute these measures differently, so comparisons among REITs may not be helpful.
Assets sold or held for sale – Assets sold or held for sale represents
Assets Sold in 2022:
•702,000 square foot industrial-flex business park located in Irving, Texas – Sold in March 2022
Assets Sold in 2021:
•70,000 square foot industrial-flex building located in Irving, Texas – Sold in December 2021
•53,000 square foot industrial building located in Beltsville, Maryland – Sold in December 2021
•371,000 square foot industrial-flex business park located in San Diego, California – Sold in October 2021
•22,000 square foot industrial-flex building located in Irving, Texas – Sold in September 2021
•244,000 square foot office business park located in Herndon, Virginia – Sold in July 2021
•198,000 square foot office-oriented flex business park located in Chantilly, Virginia – Sold in June 2021
Cash NOI – We utilize cash NOI to evaluate the cash flow performance of our business parks. Cash NOI represents NOI adjusted to exclude non-cash items included in rental income and non-cash expenses. The non-cash rental income includes amortization of deferred rent receivable (net of write-offs), in-place lease intangible, tenant improvement reimbursements, and lease incentives. The non-cash expense is equal to stock compensation expense for employees whose compensation expense is recorded in GAAP cost of operations in the amount of $0.5 million.for each of the three months ended March 31, 2022 and 2021. We believe that cash NOI assists investors in analyzing cash flow performance of our business parks.
Cash Rental Income – Cash rental income represents rental income, excluding non-cash rental income, specifically amortization of deferred rent receivable (net of write-offs), in-place lease intangible, tenant improvement reimbursements, and lease incentives.
Cash Rental Income per Occupied Square Feet – Computed by dividing cash rental income for the period by weighted average occupied square feet. Cash rental income per occupied square feet for the three month period shown is annualized.
Cash Rental Rate Change – Cash rental rate change percentages are computed by taking the percentage difference between outgoing rents (including estimated expense recoveries) and incoming rents (including estimated expense recoveries) for leases executed during the period. Leases executed on spaces vacant for more than the preceding twelve months have been excluded.
First Quarter 2022 Supplemental Financial Reporting Package 29
| Definitions and Non-GAAP Disclosures | ||||
Core Funds from Operations (Core FFO) – We calculate Core FFO by adjusting FFO, as defined below, excluding the impact of (i) charges related to the redemption of preferred stock and (ii) other nonrecurring income or expense items as appropriate. Management believes that Core FFO is a useful supplemental measure as it provides a more meaningful and consistent comparison of operating performance and allows investors to more easily compare the Company’s operating results. Because certain of these adjustments have a real economic impact on our financial condition and results from operations, the utility of Core FFO as a measure of our performance is limited. Other REITs may not calculate Core FFO in a consistent manner. Accordingly, our Core FFO may not be comparable to other REITs’ Core FFO. Core FFO should be considered only as a supplement to net income computed in accordance with GAAP as a measure of our performance.
Cost of Operations under Cash NOI – Cash cost of operations represents cost of operations, excluding non-cash stock compensation expense for employees whose compensation expense is recorded in cost of operations in the amount of $0.5 million, for each of the three months ended March 31, 2022 and 2021, which can vary significantly period to period based upon the performance of the Company.
Earnings before Interest, Taxes, Depreciation and Amortization for Real Estate (“EBITDAre”) – EBITDAre is defined by the National Association of Real Estate Investment Trusts (“NAREIT”) and is often utilized to evaluate the performance of real estate companies. EBITDAre is calculated as GAAP net income before interest, depreciation and amortization and adjusted to exclude gains or losses from sales of depreciable real estate assets and impairment charges on real estate assets. We believe our presentation of EBITDAre assists investors and analysts in evaluating the operating performance of our business activities, including the impact of general and administrative expenses, and without the impact from gains or losses from sales of depreciable real estate assets.
Free Cash Available after Fixed Charges – Free cash available after fixed charges represents FAD less dividends and distributions.
Funds Available for Distribution (FAD) – FAD is a non-GAAP measure that represents FFO adjusted to (a) deduct recurring capital improvements that maintains the condition of our real estate, tenant improvements and lease commissions and (b) remove certain non-cash rental income or expenses such as amortization of deferred rent receivable and non-cash stock compensation expense, and (c) charges related to the redemption of preferred stock. We believe our presentation of FAD assists investors and analysts in analyzing and comparing our operating and financial performance between reporting periods. FAD is not a substitute for GAAP net cash flow in evaluating our liquidity or ability to pay dividends, because they exclude investing and financing activities presented on our statements of cash flows. The GAAP measure most directly comparable to FAD is operating cash flow from our statements of cash flows.
Funds from Operations (FFO) – We calculate FFO in accordance with the standards established by the National Association of Real Estate Investment Trusts (“NAREIT”). FFO represents net income (loss) (computed in accordance with GAAP), excluding gains (or losses) from sales of depreciable operating property, gains (or losses) from sales of assets incidental to our business, impairment losses of depreciable operating property or assets incidental to our business, real estate related depreciation and amortization (excluding amortization of deferred financing costs and amortization of above/below-market lease intangibles) and after adjustments for unconsolidated joint ventures. Management uses FFO as a supplemental performance measure because, in excluding real estate related depreciation and amortization, gains and losses from property dispositions, other than temporary impairments of unconsolidated real estate entities, and impairment on our investment in real estate, it provides a performance measure that, when compared year over year, captures trends in occupancy rates, rental rates and operating costs. We also believe that, as a widely recognized measure of performance used by other REITs, FFO may be used by investors as a basis to compare our operating performance with that of other REITs. However, because FFO excludes depreciation and amortization and captures neither the changes in the value of our properties that result from use or market conditions nor the level of capital expenditures and leasing commissions necessary to maintain the operating performance of our properties, all of which have real economic effects and could materially impact our results from operations, the utility of FFO as a measure of our performance is limited. Other equity REITs may not calculate or interpret FFO in accordance with the NAREIT definition as we do, and, accordingly, our FFO may not be comparable to such other REITs’ FFO. FFO should not be used as a measure of our liquidity and is not indicative of funds available for our cash needs, including our ability to pay dividends. FFO should be considered only as a supplement to net income computed in accordance with GAAP as a measure of our performance. A reconciliation of net income, the nearest GAAP equivalent, to FFO is under the additional financial data section.
GAAP Rent Growth – Average net effective rent growth represents the weighted average percentage change in net effective rents for leases executed during a period compared against the prior leases for the same units. Net effective rent represents average rental payments for the term of a lease on a straight-line basis, against the ending lease rates on prior leases for the same units, excluding operating expense reimbursements.
First Quarter 2022 Supplemental Financial Reporting Package 30
| Definitions and Non-GAAP Disclosures | ||||
Net Operating Income (NOI) – We utilize NOI, a non-GAAP financial measure, to evaluate the operating performance of our business parks. We define NOI as rental income less cost of operations. We believe NOI assists investors in analyzing the performance and value of our business parks by excluding (i) corporate overhead (i.e. general and administrative expenses) because it does not relate to the results of our business parks and (ii) depreciation and amortization expense because it does not accurately reflect changes in the fair value of our business parks.
Non-Recurring Property Renovations – Non-recurring property renovations represents renovations that substantially enhance the value and useful life of a property, including capitalized costs associated with repositioning of acquired assets.
Non-Same Park – Non-Same Park includes assets acquired on or subsequent to January 1, 2020.
Recurring Capital Expenditures – Recurring capital expenditures are capitalized costs necessary to continue to operate the property at its current economic value. Capital improvements in excess of $2,000 with a useful life greater than 24 months are capitalized. Lease transaction costs (i.e. tenant improvements and leasing commissions) of $1,000 or more for leases with terms greater than 12 months are capitalized. All leasing costs, including first generation tenant improvements and leasing commissions, are included in recurring capital expenditures.
Retained Cash – Retained cash represents free cash available after fixed charges less non-recurring property renovations and funds used for development and redevelopment.
Same Park – The Company believes that evaluation of the Same Park portfolio, defined as all properties owned and operated as of March 31, 2022 that were acquired prior to January 1, 2020, provides an informative view of how the Company’s portfolio has performed over comparable periods. As of March 31, 2022, the Same Park portfolio consisted of 25.7 million square feet, or 95.3% of the Company’s 27.0 million total square feet, excluding the Company’s 95.0% interest in a 395-unit multifamily property.
Transaction Costs as a Percentage of Rents – Transaction costs as a percentage of rents are computed by taking the total transaction costs divided by the total rents (including estimated expense recoveries) over the term of the lease.
First Quarter 2022 Supplemental Financial Reporting Package 31
Serious News for Serious Traders! Try StreetInsider.com Premium Free!
You May Also Be Interested In
- World Acceptance Corporation Announces Fourth Quarter 2024 Conference Call on the Internet
- Tidal Wave Auto Spa Celebrates Grand Openings in Woodstock, IL, and Waynesboro, VA, With Free Washes
- Vacation Innovations Wins 2024 ARDA Awards for Best New Product, Prestigious ACE Emerging Leader Award
Create E-mail Alert Related Categories
SEC FilingsSign up for StreetInsider Free!
Receive full access to all new and archived articles, unlimited portfolio tracking, e-mail alerts, custom newswires and RSS feeds - and more!
