

Form 8-K PRUDENTIAL FINANCIAL For: Jun 05
 Tweet
Tweet Share
ShareUNITED STATES
SECURITIES AND EXCHANGE COMMISSION
Washington, D.C. 20549
FORM 8-K
CURRENT REPORT
Pursuant to Section 13 or 15(d)
of the Securities Exchange Act of 1934
Date of Report (Date of earliest event reported): June 5, 2019
PRUDENTIAL FINANCIAL, INC.
(Exact name of registrant as specified in its charter)
| New Jersey | 001-16707 | 22-3703799 | ||
| (State or other jurisdiction | (Commission File | (I.R.S. Employer | ||
| of incorporation) | Number) | Identification No.) |
751 Broad Street
Newark, New Jersey 07102
(Address of principal executive offices and zip code)
(973) 802-6000
(Registrant’s telephone number, including area code)
Check the appropriate box below if the Form 8-K filing is intended to simultaneously satisfy the filing obligation of the registrant under any of the following provisions:
| ☐ | Written communications pursuant to Rule 425 under the Securities Act (17 CFR 230.425) |
| ☐ | Soliciting material pursuant to Rule 14a-12 under the Exchange Act (17 CFR 240.14a-12) |
| ☐ | Pre-commencement communications pursuant to Rule 14d-2(b) under the Exchange Act (17 CFR 240.14d-2(b)) |
| ☐ | Pre-commencement communications pursuant to Rule 13e-4(c) under the Exchange Act (17 CFR 240.13e-4(c)) |
Securities registered pursuant to Section 12(b) of the Act:
| Title of Each Class |
Trading Symbol(s) |
Name of Each Exchange on Which Registered | ||
| Common Stock, Par Value $.01 |
PRU | New York Stock Exchange | ||
| 5.75% Junior Subordinated Notes |
PJH | New York Stock Exchange | ||
| 5.70% Junior Subordinated Notes |
PRH | New York Stock Exchange | ||
| 5.625% Junior Subordinated Notes |
PRS | New York Stock Exchange |
Indicate by check mark whether the registrant is an emerging growth company as defined in Rule 405 of the Securities Act of 1933 (§230.405 of this chapter) or Rule 12b-2 of the Securities Exchange Act of 1934 (§240.12b-2 of this chapter).
Emerging growth company ☐
If an emerging growth company, indicate by check mark if the registrant has elected not to use the extended transition period for complying with any new or revised financial accounting standards provided pursuant to Section 13(a) of the Exchange Act. ☐
| Item 7.01 | Regulation FD Disclosure |
Prudential Financial, Inc. is furnishing a copy of slides being presented at its Investor Day conference in Newark on June 5, 2019, as Exhibit 99.1 hereto.
| Item 9.01 | Financial Statements and Exhibits |
(d) Exhibits
| Exhibit No. |
Description | |
| 99.1 | Slide presentation of Prudential Financial, Inc. at its Investor Day conference in Newark on June 5, 2019 (furnished and not filed). | |
SIGNATURES
Pursuant to the requirements of the Securities Exchange Act of 1934, the Registrant has duly caused this report to be signed on its behalf by the undersigned hereunto duly authorized.
Date: June 5, 2019
| PRUDENTIAL FINANCIAL, INC. | ||
| By: |
/s/ Andrew Hughes | |
| Name: |
Andrew Hughes | |
| Title: |
Vice President and Assistant Secretary | |
3

Exhibit 99.1 P R U D E N T I A L T O W E R 2019 INVESTOR DAY N E W A R K , N E W J E R S E Y June 5, 2019Exhibit 99.1 P R U D E N T I A L T O W E R 2019 INVESTOR DAY N E W A R K , N E W J E R S E Y June 5, 2019

2019 Investor Day Darin Arita Welcome Senior Vice President Investor Relations2019 Investor Day Darin Arita Welcome Senior Vice President Investor Relations
Forward-Looking Statements and Non-GAAP Measures Certain of the statements included in this presentation, including those related to our strategy, prospective implementation costs and related margin expansion, future alignment of our net income and adjusted operating income, Financial Wellness platform customer activation goals, future interest rates, and prospective earnings, revenues, margins, and returns, constitute forward-looking statements within the meaning of the U.S. Private Securities Litigation Reform Act of 1995. Words such as “expects,” “believes,” “anticipates,” “includes,” “plans,” “assumes,” “estimates,” “projects,” “intends,” “should,” “will,” “shall,” or variations of such words are generally part of forward-looking statements. Forward-looking statements are made based on management’s current expectations and beliefs concerning future developments and their potential effects upon Prudential Financial, Inc. and its subsidiaries. There can be no assurance that future developments affecting Prudential Financial, Inc. and its subsidiaries will be those anticipated by management. These forward-looking statements are not a guarantee of future performance and involve risks and uncertainties, and there are certain important factors that could cause actual results to differ, possibly materially, from expectations or estimates reflected in such forward-looking statements, including, among others: (1) losses on investments or financial contracts due to deterioration in credit quality or value, or counterparty default; (2) losses on insurance products due to mortality experience, morbidity experience, or policyholder behavior experience that differs significantly from our expectations when we price our products; (3) changes in interest rates, equity prices, and foreign currency exchange rates that may (a) adversely impact the profitability of our products, the value of separate accounts supporting these products, or the value of assets we manage, (b) result in losses on derivatives we use to hedge risk or increase collateral posting requirements, and (c) limit opportunities to invest at appropriate returns; (4) guarantees within certain of our products which are market sensitive and may decrease our earnings or increase the volatility of our results of operations or financial position; (5) liquidity needs resulting from (a) derivative collateral market exposure, (b) asset/liability mismatches, (c) the lack of available funding in the financial markets, or (d) unexpected cash demands due to severe mortality calamity or lapse events; (6) financial or customer losses, or regulatory and legal actions, due to inadequate or failed processes or systems, external events, and human error or misconduct such as (a) disruption of our systems and data, (b) an information security breach, (c) a failure to protect the privacy of sensitive data, or (d) reliance on third-parties; (7) changes in the regulatory landscape, including related to (a) financial sector regulatory reform, (b) changes in tax laws, (c) fiduciary rules and other standards of care, (d) U.S. state insurance laws and developments regarding group-wide supervision, capital and reserves, (e) insurer capital standards outside the U.S., and (f) privacy and cybersecurity regulation; (8) technological changes which may adversely impact companies in our investment portfolio or cause insurance experience to deviate from our assumptions; (9) ratings downgrades; (10) market conditions that may adversely affect the sales or persistency of our products; (11) competition; (12) reputational damage; and (13) the costs, effects, timing, or success of our Financial Wellness acceleration plans. Prudential Financial, Inc. does not undertake to update any particular forward-looking statement included in this presentation. See “Risk Factors” included in the Annual Report on Form 10-K for the year ended December 31, 2018 for discussion of certain risks relating to our businesses and investment in our securities. See “Non-GAAP Measures and Other Disclosures” in the Appendix for important information about consolidated adjusted operating income, adjusted book value, adjusted operating return on equity, and PGIM’s adjusted revenue, which are not calculated based on accounting principles generally accepted in the United States of America (GAAP). ____________________________________________________________________________ Prudential Financial, Inc. of the United States is not affiliated with Prudential plc which is headquartered in the United Kingdom.Forward-Looking Statements and Non-GAAP Measures Certain of the statements included in this presentation, including those related to our strategy, prospective implementation costs and related margin expansion, future alignment of our net income and adjusted operating income, Financial Wellness platform customer activation goals, future interest rates, and prospective earnings, revenues, margins, and returns, constitute forward-looking statements within the meaning of the U.S. Private Securities Litigation Reform Act of 1995. Words such as “expects,” “believes,” “anticipates,” “includes,” “plans,” “assumes,” “estimates,” “projects,” “intends,” “should,” “will,” “shall,” or variations of such words are generally part of forward-looking statements. Forward-looking statements are made based on management’s current expectations and beliefs concerning future developments and their potential effects upon Prudential Financial, Inc. and its subsidiaries. There can be no assurance that future developments affecting Prudential Financial, Inc. and its subsidiaries will be those anticipated by management. These forward-looking statements are not a guarantee of future performance and involve risks and uncertainties, and there are certain important factors that could cause actual results to differ, possibly materially, from expectations or estimates reflected in such forward-looking statements, including, among others: (1) losses on investments or financial contracts due to deterioration in credit quality or value, or counterparty default; (2) losses on insurance products due to mortality experience, morbidity experience, or policyholder behavior experience that differs significantly from our expectations when we price our products; (3) changes in interest rates, equity prices, and foreign currency exchange rates that may (a) adversely impact the profitability of our products, the value of separate accounts supporting these products, or the value of assets we manage, (b) result in losses on derivatives we use to hedge risk or increase collateral posting requirements, and (c) limit opportunities to invest at appropriate returns; (4) guarantees within certain of our products which are market sensitive and may decrease our earnings or increase the volatility of our results of operations or financial position; (5) liquidity needs resulting from (a) derivative collateral market exposure, (b) asset/liability mismatches, (c) the lack of available funding in the financial markets, or (d) unexpected cash demands due to severe mortality calamity or lapse events; (6) financial or customer losses, or regulatory and legal actions, due to inadequate or failed processes or systems, external events, and human error or misconduct such as (a) disruption of our systems and data, (b) an information security breach, (c) a failure to protect the privacy of sensitive data, or (d) reliance on third-parties; (7) changes in the regulatory landscape, including related to (a) financial sector regulatory reform, (b) changes in tax laws, (c) fiduciary rules and other standards of care, (d) U.S. state insurance laws and developments regarding group-wide supervision, capital and reserves, (e) insurer capital standards outside the U.S., and (f) privacy and cybersecurity regulation; (8) technological changes which may adversely impact companies in our investment portfolio or cause insurance experience to deviate from our assumptions; (9) ratings downgrades; (10) market conditions that may adversely affect the sales or persistency of our products; (11) competition; (12) reputational damage; and (13) the costs, effects, timing, or success of our Financial Wellness acceleration plans. Prudential Financial, Inc. does not undertake to update any particular forward-looking statement included in this presentation. See “Risk Factors” included in the Annual Report on Form 10-K for the year ended December 31, 2018 for discussion of certain risks relating to our businesses and investment in our securities. See “Non-GAAP Measures and Other Disclosures” in the Appendix for important information about consolidated adjusted operating income, adjusted book value, adjusted operating return on equity, and PGIM’s adjusted revenue, which are not calculated based on accounting principles generally accepted in the United States of America (GAAP). ____________________________________________________________________________ Prudential Financial, Inc. of the United States is not affiliated with Prudential plc which is headquartered in the United Kingdom.

2019 Investor Day Charles Lowrey Executive Update Chairman and Chief Executive Officer 2019 Investor Day Charles Lowrey Executive Update Chairman and Chief Executive Officer

Key Messages • Strategic mix of businesses with scale and growth potential that cannot be easily replicated • Focused on connecting track record of strong operating fundamentals with financial outcomes • Accelerating execution of our strategy to enhance return on equity and earnings per share growth 2Key Messages • Strategic mix of businesses with scale and growth potential that cannot be easily replicated • Focused on connecting track record of strong operating fundamentals with financial outcomes • Accelerating execution of our strategy to enhance return on equity and earnings per share growth 2

Honed our lines of business over the past ~20 years Pre-IPO (2001) Pru Reinsurance Home Mortgage Health Insurance 2008 / 2009 Property and Casualty Pru Securities Pru Securities Real Estate and Relocation U.S. Wealth Management Global Commodities Real Estate and Relocation Wealth Management Today Global Commodities Investment Banking Individual Life Pru Equity Group U.S. Financial Wellness Com. Mortgage Origination Annuities PGIM Individual Life Retirement International Annuities Group Retirement PGIM Group PGIM International International 3Honed our lines of business over the past ~20 years Pre-IPO (2001) Pru Reinsurance Home Mortgage Health Insurance 2008 / 2009 Property and Casualty Pru Securities Pru Securities Real Estate and Relocation U.S. Wealth Management Global Commodities Real Estate and Relocation Wealth Management Today Global Commodities Investment Banking Individual Life Pru Equity Group U.S. Financial Wellness Com. Mortgage Origination Annuities PGIM Individual Life Retirement International Annuities Group Retirement PGIM Group PGIM International International 3

Proven ability to grow businesses significantly, both organically and through M&A ($ billions) Pre-tax AOI International Annuities Retirement PGIM $3.3 $1.9 $1.0 $1.0 +11% +19% +14% +10% CAGR CAGR CAGR CAGR $0.6 $0.2 $0.1 $0.1 2001 2018 2001 2018 2001 2018 2001 2018 4Proven ability to grow businesses significantly, both organically and through M&A ($ billions) Pre-tax AOI International Annuities Retirement PGIM $3.3 $1.9 $1.0 $1.0 +11% +19% +14% +10% CAGR CAGR CAGR CAGR $0.6 $0.2 $0.1 $0.1 2001 2018 2001 2018 2001 2018 2001 2018 4
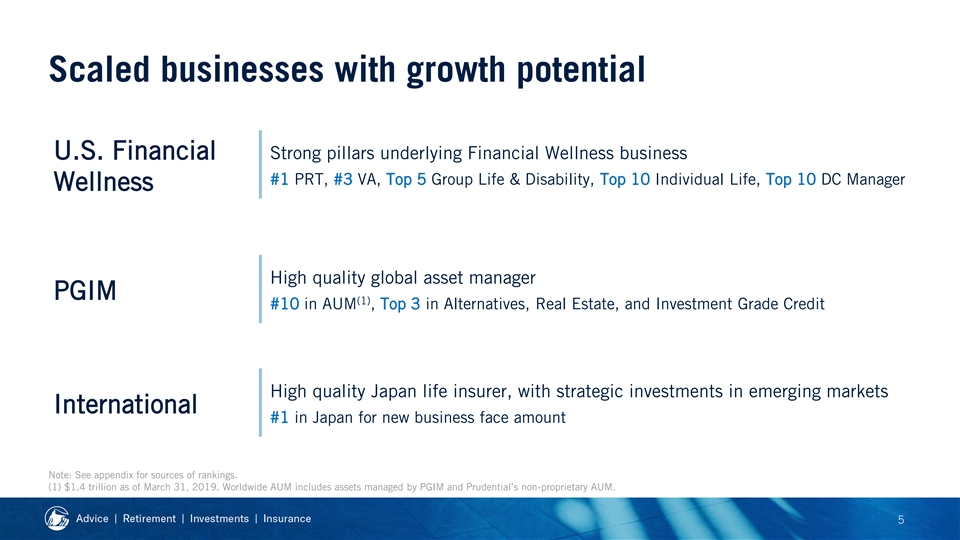
Scaled businesses with growth potential U.S. Financial Strong pillars underlying Financial Wellness business #1 PRT, #3 VA, Top 5 Group Life & Disability, Top 10 Individual Life, Top 10 DC Manager Wellness High quality global asset manager PGIM (1) #10 in AUM , Top 3 in Alternatives, Real Estate, and Investment Grade Credit High quality Japan life insurer, with strategic investments in emerging markets International #1 in Japan for new business face amount Note: See appendix for sources of rankings. (1) $1.4 trillion as of March 31, 2019. Worldwide AUM includes assets managed by PGIM and Prudential’s non-proprietary AUM. 5Scaled businesses with growth potential U.S. Financial Strong pillars underlying Financial Wellness business #1 PRT, #3 VA, Top 5 Group Life & Disability, Top 10 Individual Life, Top 10 DC Manager Wellness High quality global asset manager PGIM (1) #10 in AUM , Top 3 in Alternatives, Real Estate, and Investment Grade Credit High quality Japan life insurer, with strategic investments in emerging markets International #1 in Japan for new business face amount Note: See appendix for sources of rankings. (1) $1.4 trillion as of March 31, 2019. Worldwide AUM includes assets managed by PGIM and Prudential’s non-proprietary AUM. 5

Businesses that cannot be easily replicated U.S. Financial PGIM International Wellness Combination of Successful Unique distribution model multi-manager model Significant workplace access + Selective and collaborative wide breadth of individual solutions + approach to new markets multi-channel distribution Strategic mix of businesses produces distinct earnings, cash flow, and capital benefits 6Businesses that cannot be easily replicated U.S. Financial PGIM International Wellness Combination of Successful Unique distribution model multi-manager model Significant workplace access + Selective and collaborative wide breadth of individual solutions + approach to new markets multi-channel distribution Strategic mix of businesses produces distinct earnings, cash flow, and capital benefits 6
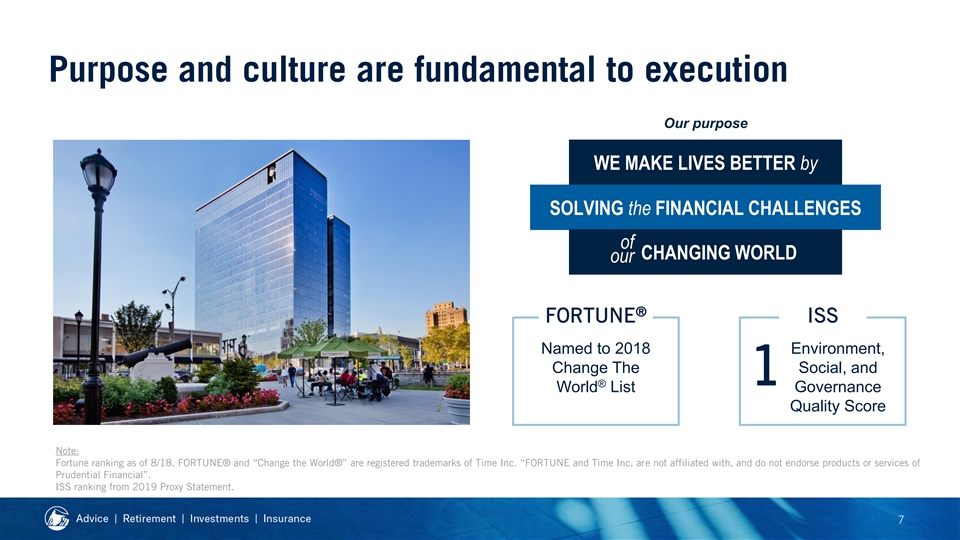
Purpose and culture are fundamental to execution Our purpose WE MAKE LIVES BETTER by SOLVING the FINANCIAL CHALLENGES of CHANGING WORLD our ® FORTUNE ISS Named to 2018 Environment, Change The Social, and 1 ® World List Governance Quality Score Note: Fortune ranking as of 8/18. FORTUNE® and “Change the World®” are registered trademarks of Time Inc. “FORTUNE and Time Inc. are not affiliated with, and do not endorse products or services of Prudential Financial”. ISS ranking from 2019 Proxy Statement. 7Purpose and culture are fundamental to execution Our purpose WE MAKE LIVES BETTER by SOLVING the FINANCIAL CHALLENGES of CHANGING WORLD our ® FORTUNE ISS Named to 2018 Environment, Change The Social, and 1 ® World List Governance Quality Score Note: Fortune ranking as of 8/18. FORTUNE® and “Change the World®” are registered trademarks of Time Inc. “FORTUNE and Time Inc. are not affiliated with, and do not endorse products or services of Prudential Financial”. ISS ranking from 2019 Proxy Statement. 7

Accelerating the execution of our strategy • Enhancing the customer experience • Transforming technology and talent to drive innovation and efficiency • Integrating business operations • Simplifying processes to increase our speed to market 8Accelerating the execution of our strategy • Enhancing the customer experience • Transforming technology and talent to drive innovation and efficiency • Integrating business operations • Simplifying processes to increase our speed to market 8

Business mix and strategy drive a higher ROE and growth potential Increased Adjusted ROE Target Multiple drivers to increase EPS growth: • Accelerating strategy and integration of businesses 12 - 14% 12 - 13% • Significant traction in Financial Wellness • Further third-party success in PGIM Adjusted EPS Growth • Higher contribution from International Low- growth markets double High-single digit digit • Pursuit of strategic M&A Intermediate term Longer term 9Business mix and strategy drive a higher ROE and growth potential Increased Adjusted ROE Target Multiple drivers to increase EPS growth: • Accelerating strategy and integration of businesses 12 - 14% 12 - 13% • Significant traction in Financial Wellness • Further third-party success in PGIM Adjusted EPS Growth • Higher contribution from International Low- growth markets double High-single digit digit • Pursuit of strategic M&A Intermediate term Longer term 9

Key Messages • Strategic mix of businesses with scale and growth potential that cannot be easily replicated • Focused on connecting track record of strong operating fundamentals with financial outcomes • Accelerating execution of our strategy to enhance return on equity and earnings per share growth 10Key Messages • Strategic mix of businesses with scale and growth potential that cannot be easily replicated • Focused on connecting track record of strong operating fundamentals with financial outcomes • Accelerating execution of our strategy to enhance return on equity and earnings per share growth 10

2019 Investor Day Robert Falzon Executive Update Vice Chairman2019 Investor Day Robert Falzon Executive Update Vice Chairman

Key Messages • High quality businesses with attractive growth prospects • Accelerating process, talent, and technology transformation • Results in higher earnings growth, increased level of free cash flow, and attractive returns 2Key Messages • High quality businesses with attractive growth prospects • Accelerating process, talent, and technology transformation • Results in higher earnings growth, increased level of free cash flow, and attractive returns 2

High quality businesses with attractive growth prospects PGIM International U.S. Financial Wellness Mid-to-high single digit Mid-single digit Mid-to-high single digit intermediate term earnings growth intermediate term earnings growth intermediate term earnings growth Expanding global investment and Expanding distribution in Investing to increase productivity as distribution capabilities proprietary and third-party channels well as expand distribution and and strategic investments in solutions emerging markets • Revenue growth and expanding margins in PGIM and U.S. Financial Wellness with stable margins and growth in International Note: Earnings growth based on pre-tax Adjusted Operating Income. 3High quality businesses with attractive growth prospects PGIM International U.S. Financial Wellness Mid-to-high single digit Mid-single digit Mid-to-high single digit intermediate term earnings growth intermediate term earnings growth intermediate term earnings growth Expanding global investment and Expanding distribution in Investing to increase productivity as distribution capabilities proprietary and third-party channels well as expand distribution and and strategic investments in solutions emerging markets • Revenue growth and expanding margins in PGIM and U.S. Financial Wellness with stable margins and growth in International Note: Earnings growth based on pre-tax Adjusted Operating Income. 3

PGIM’s earnings and margin continue to expand ($ billions) Pre-tax AOI Mid-to-high single digit growth will be driven by: ~8% • Proven ability to capture industry flows and market CAGR share $1.0 • Strong presence and focus in high-growth asset classes and markets $0.5 • Operating leverage as business continues to scale • Strategic investments and market growth 2010 2018 4PGIM’s earnings and margin continue to expand ($ billions) Pre-tax AOI Mid-to-high single digit growth will be driven by: ~8% • Proven ability to capture industry flows and market CAGR share $1.0 • Strong presence and focus in high-growth asset classes and markets $0.5 • Operating leverage as business continues to scale • Strategic investments and market growth 2010 2018 4

International’s earnings continue to expand, with stable margins ($ billions) (1) Pre-tax core AOI Mid-single digit growth will be driven by: ~5% CAGR • Sustained growth in developed markets, with impact $4.0 FX and interest of market headwinds subsiding rate adjusted $3.2 • Longer term upside driven by strategic investments in emerging markets • Deploying digital solutions to enhance customer experience and expand distribution 2013 2018 (1) Represents compound annual growth rate for pre-tax Adjusted Operating Income adjusted for notable items and foreign currency and low interest rate impacts from 2013 - 2018. See appendix for analysis of foreign exchange and interest rate adjustments. 5International’s earnings continue to expand, with stable margins ($ billions) (1) Pre-tax core AOI Mid-single digit growth will be driven by: ~5% CAGR • Sustained growth in developed markets, with impact $4.0 FX and interest of market headwinds subsiding rate adjusted $3.2 • Longer term upside driven by strategic investments in emerging markets • Deploying digital solutions to enhance customer experience and expand distribution 2013 2018 (1) Represents compound annual growth rate for pre-tax Adjusted Operating Income adjusted for notable items and foreign currency and low interest rate impacts from 2013 - 2018. See appendix for analysis of foreign exchange and interest rate adjustments. 5

Enhanced customer focus drives U.S. Financial Wellness earnings growth and margin expansion ($ billions) Pre-tax AOI, (1) excluding notable items Mid-to-high single digit growth will be driven by: ~4% CAGR • Investments in capabilities that increase productivity $3.7 and customer engagement $3.0 • Increased revenue and enhanced margins from workplace financial wellness solutions • Expanded customer access, which drives sales of our individual solutions over time 2013 2018 (1) See appendix for reconciliation. 6Enhanced customer focus drives U.S. Financial Wellness earnings growth and margin expansion ($ billions) Pre-tax AOI, (1) excluding notable items Mid-to-high single digit growth will be driven by: ~4% CAGR • Investments in capabilities that increase productivity $3.7 and customer engagement $3.0 • Increased revenue and enhanced margins from workplace financial wellness solutions • Expanded customer access, which drives sales of our individual solutions over time 2013 2018 (1) See appendix for reconciliation. 6
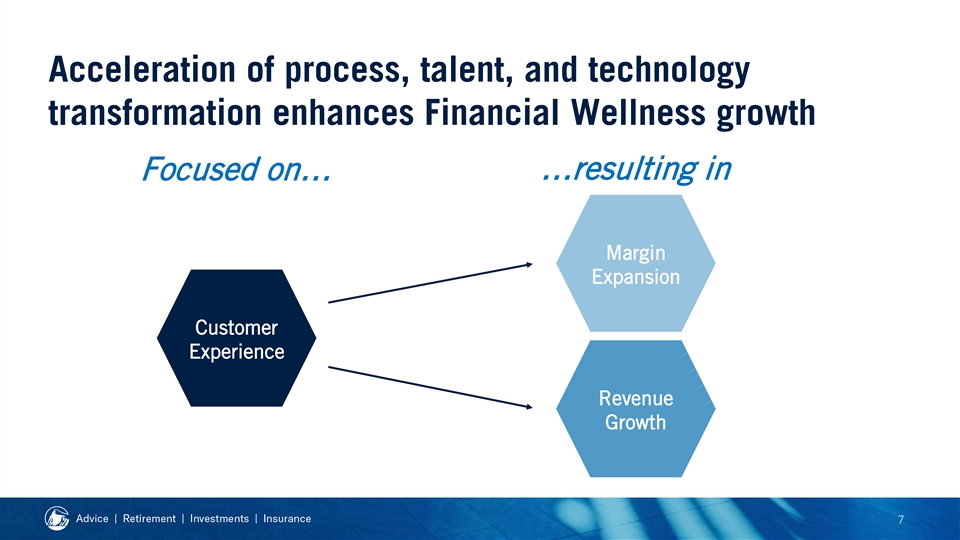
Acceleration of process, talent, and technology transformation enhances Financial Wellness growth …resulting in Focused on… Margin Expansion Customer Experience Revenue Growth 7Acceleration of process, talent, and technology transformation enhances Financial Wellness growth …resulting in Focused on… Margin Expansion Customer Experience Revenue Growth 7

Consolidated customer service center to address comprehensive needs …creates efficiencies from A simplified and seamless customer experience… • Fewer customer contact centers Margin • Highly trained customer service professionals Expansion • Streamlined, technology-enabled processes and enables Financial Wellness growth through Retirement Group • Increased participation in workplace solutions Centralized Revenue • Enhanced client retention Customer Service Growth • Incremental individual solutions Life Annuities Center 8Consolidated customer service center to address comprehensive needs …creates efficiencies from A simplified and seamless customer experience… • Fewer customer contact centers Margin • Highly trained customer service professionals Expansion • Streamlined, technology-enabled processes and enables Financial Wellness growth through Retirement Group • Increased participation in workplace solutions Centralized Revenue • Enhanced client retention Customer Service Growth • Incremental individual solutions Life Annuities Center 8

Accelerating Financial Wellness earnings growth ($ millions) ~$500 Leads to: Run-Rate Margin ✓ Higher earnings through: $275 Expansion $175 $100 – Margin expansion $50 – Future revenue ($35) ($75) ($100) growth ($135) Implementation ✓ Increased free cash flow (1) Costs ✓ Attractive returns $600 - $700 of total one-time costs 2020 2021 2019 2022 (1) Includes technology, systems, severance, reskilling, and other one-time costs. 9Accelerating Financial Wellness earnings growth ($ millions) ~$500 Leads to: Run-Rate Margin ✓ Higher earnings through: $275 Expansion $175 $100 – Margin expansion $50 – Future revenue ($35) ($75) ($100) growth ($135) Implementation ✓ Increased free cash flow (1) Costs ✓ Attractive returns $600 - $700 of total one-time costs 2020 2021 2019 2022 (1) Includes technology, systems, severance, reskilling, and other one-time costs. 9

Key Messages • High quality businesses with attractive growth prospects • Accelerating process, talent, and technology transformation • Results in higher earnings growth, increased level of free cash flow, and attractive returns 10Key Messages • High quality businesses with attractive growth prospects • Accelerating process, talent, and technology transformation • Results in higher earnings growth, increased level of free cash flow, and attractive returns 10

2019 Investor Day U.S. Financial Wellness Steve Pelletier Andy Sullivan Caroline Feeney Naveen Agarwal Executive Vice President Senior Vice President Senior Vice President Senior Vice President and Chief Operating Officer, and CEO of Workplace Solutions and CEO of Individual Solutions and Chief Marketing Officer U.S. Businesses2019 Investor Day U.S. Financial Wellness Steve Pelletier Andy Sullivan Caroline Feeney Naveen Agarwal Executive Vice President Senior Vice President Senior Vice President Senior Vice President and Chief Operating Officer, and CEO of Workplace Solutions and CEO of Individual Solutions and Chief Marketing Officer U.S. Businesses

Key Messages • We have a differentiated approach to Financial Wellness, which is a compelling growth opportunity • Financial Wellness realizes three sources of value across institutions and individuals • Financial Wellness complements our existing distribution capabilities by expanding our addressable market 2Key Messages • We have a differentiated approach to Financial Wellness, which is a compelling growth opportunity • Financial Wellness realizes three sources of value across institutions and individuals • Financial Wellness complements our existing distribution capabilities by expanding our addressable market 2
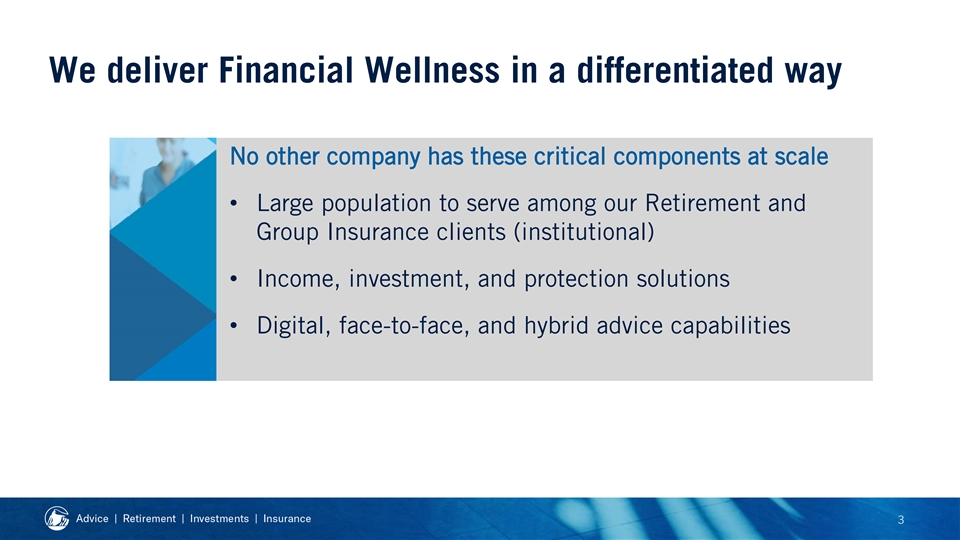
We deliver Financial Wellness in a differentiated way No other company has these critical components at scale • Large population to serve among our Retirement and Group Insurance clients (institutional) • Income, investment, and protection solutions • Digital, face-to-face, and hybrid advice capabilities 3We deliver Financial Wellness in a differentiated way No other company has these critical components at scale • Large population to serve among our Retirement and Group Insurance clients (institutional) • Income, investment, and protection solutions • Digital, face-to-face, and hybrid advice capabilities 3

We address needs of Institutions and Individuals, which deepens our relationships with them Institutions/Employers Individuals/Employees • Reduce employee stress• Manage day-to-day finances • Drive higher productivity • Achieve important • Lower absenteeism financial goals • Protect against key financial risks 4We address needs of Institutions and Individuals, which deepens our relationships with them Institutions/Employers Individuals/Employees • Reduce employee stress• Manage day-to-day finances • Drive higher productivity • Achieve important • Lower absenteeism financial goals • Protect against key financial risks 4

Financial Wellness drives three sources of revenue growth, with significant opportunity over time 1 2 3 Individuals Individuals Institutions within Institutions Winning and retaining Increasing utilization of Providing individuals with institutional clients in our savings and benefit retail solutions that Retirement and Group programs offered to address broader financial Insurance employees needs Near term Intermediate term Longer term 5Financial Wellness drives three sources of revenue growth, with significant opportunity over time 1 2 3 Individuals Individuals Institutions within Institutions Winning and retaining Increasing utilization of Providing individuals with institutional clients in our savings and benefit retail solutions that Retirement and Group programs offered to address broader financial Insurance employees needs Near term Intermediate term Longer term 5

Our value proposition is attractive for Institutions and Individuals within those Institutions 1 2 Institutions Individuals within Institutions • Understand benefit of financially well employees• Increase understanding and optimize usage of workplace benefits • Design optimal employee benefits plans • Improve understanding of personal finance • Get employees to take action by adopting topics (e.g., budgeting, debt/credit counseling) solutions in workplace environment • Access broader set of employer-provided • Help achieve key outcomes: services and solutions ̶ Lower absenteeism and disability incidence ̶ Financial coaching ̶ Greater employee productivity ̶ Emergency savings ̶ Stronger retirement readiness ̶ Student loan and other debt assistance • Monitor and measure effectiveness 6Our value proposition is attractive for Institutions and Individuals within those Institutions 1 2 Institutions Individuals within Institutions • Understand benefit of financially well employees• Increase understanding and optimize usage of workplace benefits • Design optimal employee benefits plans • Improve understanding of personal finance • Get employees to take action by adopting topics (e.g., budgeting, debt/credit counseling) solutions in workplace environment • Access broader set of employer-provided • Help achieve key outcomes: services and solutions ̶ Lower absenteeism and disability incidence ̶ Financial coaching ̶ Greater employee productivity ̶ Emergency savings ̶ Stronger retirement readiness ̶ Student loan and other debt assistance • Monitor and measure effectiveness 6

We have established goals and metrics to track our progress with Institutions and their Individuals 1 2 Institutions Individuals within Institutions Multi-Year Goals Key Metrics Examples Multi-Year Goals Key Metrics Examples • Grow 2X+ faster • New institutional • Total individuals with access • Grow 2X+ number of than overall market sales to our platform individuals with in target segments access to our digital • Persistency/retention • Rates of engagement with Financial Wellness • Renewal Pricing educational content, tools, platform and services • 10% improvement in • Retirement: Plan participation benefit enrollment and contribution rates, average and contribution account balances, hardship rates from current withdrawals baselines • Group Insurance: Voluntary participation rates and levels 7We have established goals and metrics to track our progress with Institutions and their Individuals 1 2 Institutions Individuals within Institutions Multi-Year Goals Key Metrics Examples Multi-Year Goals Key Metrics Examples • Grow 2X+ faster • New institutional • Total individuals with access • Grow 2X+ number of than overall market sales to our platform individuals with in target segments access to our digital • Persistency/retention • Rates of engagement with Financial Wellness • Renewal Pricing educational content, tools, platform and services • 10% improvement in • Retirement: Plan participation benefit enrollment and contribution rates, average and contribution account balances, hardship rates from current withdrawals baselines • Group Insurance: Voluntary participation rates and levels 7

Individuals: Financial Wellness also expands our addressable market for retail advice and solutions 3 U.S. Population by Total Investable Assets, 2018 27% 48% Reached through 67% Financial Advisors 73% Lack Financial 52% 33% Advisors Mass Affluent/ Middle Market Mass Market (1) Affluent/HNW ($100K-$500K) (<$100K) (>$500K) Source: Prudential Financial Wellness Census. (1) High net worth. 8Individuals: Financial Wellness also expands our addressable market for retail advice and solutions 3 U.S. Population by Total Investable Assets, 2018 27% 48% Reached through 67% Financial Advisors 73% Lack Financial 52% 33% Advisors Mass Affluent/ Middle Market Mass Market (1) Affluent/HNW ($100K-$500K) (<$100K) (>$500K) Source: Prudential Financial Wellness Census. (1) High net worth. 8

We are already engaging and educating Individuals at the workplace FACE-TO-FACE DIGITAL • Adopted by 600+ • Activated at 3,100+ institutional clients institutional clients • Attended by over • Provides broad set 50,000 individuals of Financial Wellness content • 25% of attendees and tools meet with a Prudential Advisor, and 20% of those become retail customers 9We are already engaging and educating Individuals at the workplace FACE-TO-FACE DIGITAL • Adopted by 600+ • Activated at 3,100+ institutional clients institutional clients • Attended by over • Provides broad set 50,000 individuals of Financial Wellness content • 25% of attendees and tools meet with a Prudential Advisor, and 20% of those become retail customers 9

LINK by Prudential is our hybrid platform for retail solutions that address broader financial needs • Helps individuals identify goals, needs, and gaps • Provides access to solutions: ̶ Income, investment, protection ̶ Adding new solutions over time • Offers access to service, engagement, and advice across channels ̶ Talk, co-browse, or video chat ̶ Needs-based, goal-oriented planning ̶ More efficient service platform ̶ Integration of service and sales 10LINK by Prudential is our hybrid platform for retail solutions that address broader financial needs • Helps individuals identify goals, needs, and gaps • Provides access to solutions: ̶ Income, investment, protection ̶ Adding new solutions over time • Offers access to service, engagement, and advice across channels ̶ Talk, co-browse, or video chat ̶ Needs-based, goal-oriented planning ̶ More efficient service platform ̶ Integration of service and sales 10

We are driving longer-term growth through expanded, deeper relationships with Individuals 3 Activated for Financial Activated for New Retail (1) (2) (3) Wellness Platform Retail Solutions Customers 20M 12M 12M 8M 2.5M 1M 2K+ 5K 200K 2025 Today 2019 Today 2019 Today 2025 2025 2019 Goal Goal Goal Goal Goal Goal Key metrics: conversion rates by channel, offering, and customer segment; average products per customer; average revenue per customer (1) Able to access educational content and tools through our digital Financial Wellness platform. (2) Able to access Financial Wellness platform and to purchase retail solutions. (3) Purchased one or more retail solutions via online, hybrid, and face-to-face referrals to Prudential Advisors. 11We are driving longer-term growth through expanded, deeper relationships with Individuals 3 Activated for Financial Activated for New Retail (1) (2) (3) Wellness Platform Retail Solutions Customers 20M 12M 12M 8M 2.5M 1M 2K+ 5K 200K 2025 Today 2019 Today 2019 Today 2025 2025 2019 Goal Goal Goal Goal Goal Goal Key metrics: conversion rates by channel, offering, and customer segment; average products per customer; average revenue per customer (1) Able to access educational content and tools through our digital Financial Wellness platform. (2) Able to access Financial Wellness platform and to purchase retail solutions. (3) Purchased one or more retail solutions via online, hybrid, and face-to-face referrals to Prudential Advisors. 11

Key Messages • We have a differentiated approach to Financial Wellness, which is a compelling growth opportunity • Financial Wellness realizes three sources of value across institutions and individuals • Financial Wellness complements our existing distribution capabilities by expanding our addressable market 12Key Messages • We have a differentiated approach to Financial Wellness, which is a compelling growth opportunity • Financial Wellness realizes three sources of value across institutions and individuals • Financial Wellness complements our existing distribution capabilities by expanding our addressable market 12

2019 Investor Day David Hunt PGIM President and CEO, PGIM 2019 Investor Day David Hunt PGIM President and CEO, PGIM

Key Messages • Our scaled, diversified multi-manager model and strong investment performance have produced consistent positive net flows that position PGIM as a winner against the backdrop of industry headwinds • PGIM’s success is underpinned by disciplined investments in broadening and globalizing our investment and distribution capabilities, and gaining recognition for our unified brand • PGIM targets mid-to-high single digit earnings growth through the cycle driven by our strong and growing position in attractive segments of the asset management industry 2Key Messages • Our scaled, diversified multi-manager model and strong investment performance have produced consistent positive net flows that position PGIM as a winner against the backdrop of industry headwinds • PGIM’s success is underpinned by disciplined investments in broadening and globalizing our investment and distribution capabilities, and gaining recognition for our unified brand • PGIM targets mid-to-high single digit earnings growth through the cycle driven by our strong and growing position in attractive segments of the asset management industry 2

PGIM’s industry-leading position is driven by strength across attractive sectors Assets (1) Top 10 Global Asset Manager ($ billions) (3) 1 BlackRock $5,976 Alternatives asset manager 2 Vanguard Group $4,867 (4) Real Estate manager worldwide 3 State Street Global Advisors $2,511 Top 4 Fidelity Investments $2,425 Assets in Investment Grade 5 BNY Mellon Investment Management $1,722 (5) credit strategies 6 The Capital Group $1,677 3 7 JP Morgan Asset Management $1,659 Foreign manager of Japanese 8 Amundi $1,633 (6) institutional assets 9 The Goldman Sachs Group $1,542 (2) 10 Prudential Financial $1,377 (1) Pensions & Investments Top Money Manager’s list, May 27, 2019. AUM as of December 31, 2018. (2) Worldwide AUM includes assets managed by PGIM and Prudential’s non-proprietary AUM. (3) Willis Towers Watson Global Alternatives Survey, July 2017. AUM as of December 2016. Ranking is based on the aggregate AUM aggregated by parent company in all alternative assets classes, regardless of sub-asset class. (4) IPE Real Assets, Real Estate Managers by Worldwide AUM as of June 30, 2018. Publication as of November / December 2018 issue. (5) Investment Grade Credit Manager Survey, IPE International Publishers Limited, January 2018. AUM as of September 30, 2017. (6) Nenkin Joho by R&I, April 1, 2019. AUM as of December 31, 2018. AUM ranking pertains to separate accounts and does not include AUM for institutional funds. 3PGIM’s industry-leading position is driven by strength across attractive sectors Assets (1) Top 10 Global Asset Manager ($ billions) (3) 1 BlackRock $5,976 Alternatives asset manager 2 Vanguard Group $4,867 (4) Real Estate manager worldwide 3 State Street Global Advisors $2,511 Top 4 Fidelity Investments $2,425 Assets in Investment Grade 5 BNY Mellon Investment Management $1,722 (5) credit strategies 6 The Capital Group $1,677 3 7 JP Morgan Asset Management $1,659 Foreign manager of Japanese 8 Amundi $1,633 (6) institutional assets 9 The Goldman Sachs Group $1,542 (2) 10 Prudential Financial $1,377 (1) Pensions & Investments Top Money Manager’s list, May 27, 2019. AUM as of December 31, 2018. (2) Worldwide AUM includes assets managed by PGIM and Prudential’s non-proprietary AUM. (3) Willis Towers Watson Global Alternatives Survey, July 2017. AUM as of December 2016. Ranking is based on the aggregate AUM aggregated by parent company in all alternative assets classes, regardless of sub-asset class. (4) IPE Real Assets, Real Estate Managers by Worldwide AUM as of June 30, 2018. Publication as of November / December 2018 issue. (5) Investment Grade Credit Manager Survey, IPE International Publishers Limited, January 2018. AUM as of September 30, 2017. (6) Nenkin Joho by R&I, April 1, 2019. AUM as of December 31, 2018. AUM ranking pertains to separate accounts and does not include AUM for institutional funds. 3

Significant scale in attractive asset classes delivers a well-balanced mix of revenues (1) Fees by Asset Class (2) ~50% of fees from higher growth areas Private Fixed Income (3) & Equity $676 mn from real assets & alternatives 8% Real Estate (4) $203 mn from private credit Debt & Equity Public 22% Fixed Income $200 mn from non-U.S. equities 45% $123 mn from liability-driven and outcome-oriented solutions Public Equity 25% $123 mn from quantitative strategies (1) Based on asset management fees for the year ended December 31, 2018. (2) Fees for the year ended December 31, 2018. Percentage excludes fee overlap across stated categories. (3) Includes real estate, infrastructure, energy, and natural resources strategies. (4) Excludes real estate lending through the PGIM Real Estate Finance business. 4Significant scale in attractive asset classes delivers a well-balanced mix of revenues (1) Fees by Asset Class (2) ~50% of fees from higher growth areas Private Fixed Income (3) & Equity $676 mn from real assets & alternatives 8% Real Estate (4) $203 mn from private credit Debt & Equity Public 22% Fixed Income $200 mn from non-U.S. equities 45% $123 mn from liability-driven and outcome-oriented solutions Public Equity 25% $123 mn from quantitative strategies (1) Based on asset management fees for the year ended December 31, 2018. (2) Fees for the year ended December 31, 2018. Percentage excludes fee overlap across stated categories. (3) Includes real estate, infrastructure, energy, and natural resources strategies. (4) Excludes real estate lending through the PGIM Real Estate Finance business. 4

Deep relationships with top tier third-party client base Fees by Client Type 1,400+ third-party institutional clients General clients have over $1 billion invested with PGIM 91 Account 18% (1) of the top 300 global pension funds 158 (2) of the 25 largest U.S. corporate pension plans 23 Institutional Retail (2) 49% of the 25 largest U.S. public pension plans 19 33% th (3) 5 fastest organic U.S. mutual fund AUM growth Information as of and for the year ended December 31, 2018, unless otherwise indicated. (1) P&I/Towers Watson Top 300 Pension Funds ranking, data as of December 31, 2017, published September 2018. (2) Based on U.S. Plan Sponsor rankings in Pensions & Investments as of September 30, 2017, published February 2018. (3) Strategic Insight/Simfund FY 2018. Ranking only references long term mutual funds and excludes ETF and money markets. Results may differ from PGIM Investments (Strategic Insight/Simfund excludes Day One and private funds). 5Deep relationships with top tier third-party client base Fees by Client Type 1,400+ third-party institutional clients General clients have over $1 billion invested with PGIM 91 Account 18% (1) of the top 300 global pension funds 158 (2) of the 25 largest U.S. corporate pension plans 23 Institutional Retail (2) 49% of the 25 largest U.S. public pension plans 19 33% th (3) 5 fastest organic U.S. mutual fund AUM growth Information as of and for the year ended December 31, 2018, unless otherwise indicated. (1) P&I/Towers Watson Top 300 Pension Funds ranking, data as of December 31, 2017, published September 2018. (2) Based on U.S. Plan Sponsor rankings in Pensions & Investments as of September 30, 2017, published February 2018. (3) Strategic Insight/Simfund FY 2018. Ranking only references long term mutual funds and excludes ETF and money markets. Results may differ from PGIM Investments (Strategic Insight/Simfund excludes Day One and private funds). 5
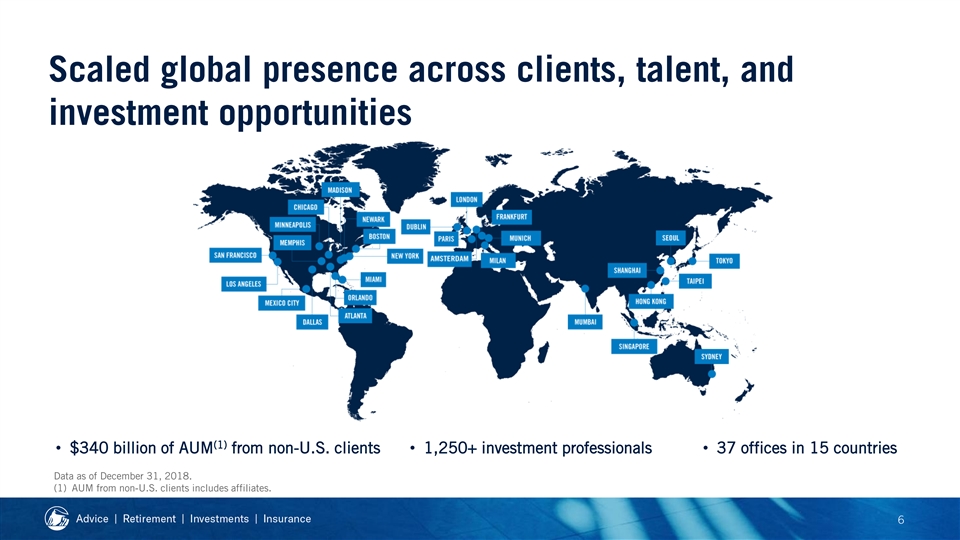
Scaled global presence across clients, talent, and investment opportunities (1) • $340 billion of AUM from non-U.S. clients• 1,250+ investment professionals• 37 offices in 15 countries Data as of December 31, 2018. (1) AUM from non-U.S. clients includes affiliates. 6Scaled global presence across clients, talent, and investment opportunities (1) • $340 billion of AUM from non-U.S. clients• 1,250+ investment professionals• 37 offices in 15 countries Data as of December 31, 2018. (1) AUM from non-U.S. clients includes affiliates. 6

Consistent, strong investment performance underpins our growth and financial success (1) Percentage of PGIM AUM Investment Outperforming Benchmark Performance 92% 87% 84% Earnings Client Flows 3 YEARS 5 YEARS 10 YEARS Source: PGIM calculations as of March 31, 2019. Past performance is not a guarantee or reliable indicator of future results. All investments involve risk, including the possible loss of capital. Performance is defined as outperformance (gross of fees) relative to each individual strategy’s respective benchmark(s). (1) Represents PGIM’s benchmarked AUM (83% of total third-party AUM is benchmarked over 3 years, 74% over 5 years, and 57% over 10 years). This calculation does not include non- benchmarked assets (including general account assets and assets not managed by PGIM). Returns are calculated gross of investment management fees, which would reduce an investor’s net return. Excess performance is based on all actively managed Fixed Income, Equity, and Real Estate AUM for Jennison Associates, PGIM Fixed Income, QMA, Prudential Capital Group, PGIM Global Partners, PGIM Real Estate, and PGIM Real Estate Finance. 7Consistent, strong investment performance underpins our growth and financial success (1) Percentage of PGIM AUM Investment Outperforming Benchmark Performance 92% 87% 84% Earnings Client Flows 3 YEARS 5 YEARS 10 YEARS Source: PGIM calculations as of March 31, 2019. Past performance is not a guarantee or reliable indicator of future results. All investments involve risk, including the possible loss of capital. Performance is defined as outperformance (gross of fees) relative to each individual strategy’s respective benchmark(s). (1) Represents PGIM’s benchmarked AUM (83% of total third-party AUM is benchmarked over 3 years, 74% over 5 years, and 57% over 10 years). This calculation does not include non- benchmarked assets (including general account assets and assets not managed by PGIM). Returns are calculated gross of investment management fees, which would reduce an investor’s net return. Excess performance is based on all actively managed Fixed Income, Equity, and Real Estate AUM for Jennison Associates, PGIM Fixed Income, QMA, Prudential Capital Group, PGIM Global Partners, PGIM Real Estate, and PGIM Real Estate Finance. 7

16 consecutive years of positive third-party net flows ($ billions) (1) Third-Party Net Flows $36.5 $30.0 $23.8 $22.6 $21.9 $20.1 $15.6 $13.7 $11.0 $11.0 $10.8 $9.8 $7.1 $5.7 $5.5 $0.5 2003 2004 2005 2006 2007 2008 2009 2010 2011 2012 2013 2014 2015 2016 2017 2018 (1) Represents unaffiliated third-party net flows; excludes flows from the General Account and other affiliated Prudential businesses. 2003 and 2004 third-party net flows shown in chart represent only institutional third-party net flows. 816 consecutive years of positive third-party net flows ($ billions) (1) Third-Party Net Flows $36.5 $30.0 $23.8 $22.6 $21.9 $20.1 $15.6 $13.7 $11.0 $11.0 $10.8 $9.8 $7.1 $5.7 $5.5 $0.5 2003 2004 2005 2006 2007 2008 2009 2010 2011 2012 2013 2014 2015 2016 2017 2018 (1) Represents unaffiliated third-party net flows; excludes flows from the General Account and other affiliated Prudential businesses. 2003 and 2004 third-party net flows shown in chart represent only institutional third-party net flows. 8
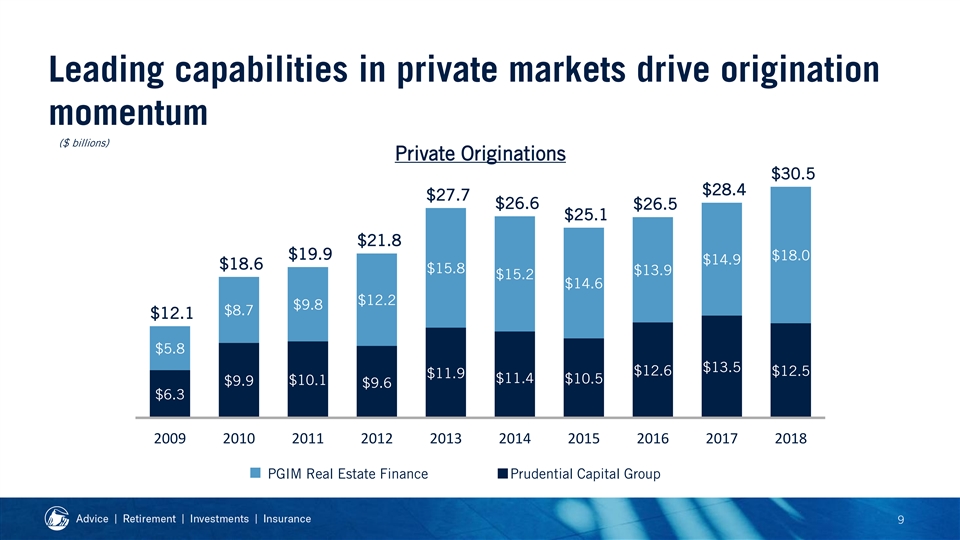
Leading capabilities in private markets drive origination momentum ($ billions) Private Originations $30.5 $28.4 $27.7 $26.6 $26.5 $25.1 $21.8 $19.9 $18.0 $14.9 $18.6 $15.8 $13.9 $15.2 $14.6 $12.2 $9.8 $8.7 $12.1 $5.8 $13.5 $12.6 $12.5 $11.9 $11.4 $10.5 $10.1 $9.9 $9.6 $6.3 2009 2010 2011 2012 2013 2014 2015 2016 2017 2018 PGIM Real Estate Finance Prudential Capital Group 9Leading capabilities in private markets drive origination momentum ($ billions) Private Originations $30.5 $28.4 $27.7 $26.6 $26.5 $25.1 $21.8 $19.9 $18.0 $14.9 $18.6 $15.8 $13.9 $15.2 $14.6 $12.2 $9.8 $8.7 $12.1 $5.8 $13.5 $12.6 $12.5 $11.9 $11.4 $10.5 $10.1 $9.9 $9.6 $6.3 2009 2010 2011 2012 2013 2014 2015 2016 2017 2018 PGIM Real Estate Finance Prudential Capital Group 9
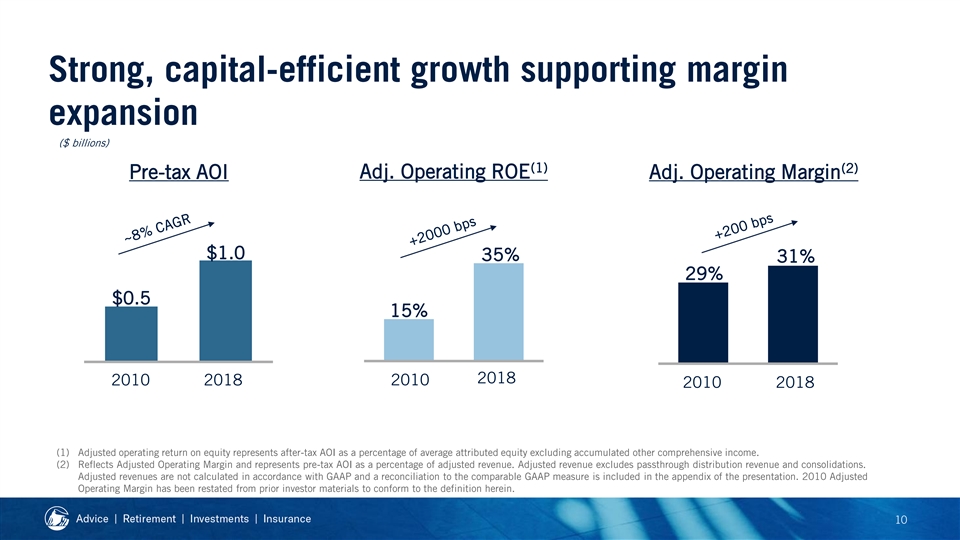
Strong, capital-efficient growth supporting margin expansion ($ billions) (1) (2) Adj. Operating ROE Pre-tax AOI Adj. Operating Margin $1.0 35% 31% 29% $0.5 15% 2018 2010 2010 2018 2010 2018 (1) Adjusted operating return on equity represents after-tax AOI as a percentage of average attributed equity excluding accumulated other comprehensive income. (2) Reflects Adjusted Operating Margin and represents pre-tax AOI as a percentage of adjusted revenue. Adjusted revenue excludes passthrough distribution revenue and consolidations. Adjusted revenues are not calculated in accordance with GAAP and a reconciliation to the comparable GAAP measure is included in the appendix of the presentation. 2010 Adjusted Operating Margin has been restated from prior investor materials to conform to the definition herein. 10Strong, capital-efficient growth supporting margin expansion ($ billions) (1) (2) Adj. Operating ROE Pre-tax AOI Adj. Operating Margin $1.0 35% 31% 29% $0.5 15% 2018 2010 2010 2018 2010 2018 (1) Adjusted operating return on equity represents after-tax AOI as a percentage of average attributed equity excluding accumulated other comprehensive income. (2) Reflects Adjusted Operating Margin and represents pre-tax AOI as a percentage of adjusted revenue. Adjusted revenue excludes passthrough distribution revenue and consolidations. Adjusted revenues are not calculated in accordance with GAAP and a reconciliation to the comparable GAAP measure is included in the appendix of the presentation. 2010 Adjusted Operating Margin has been restated from prior investor materials to conform to the definition herein. 10
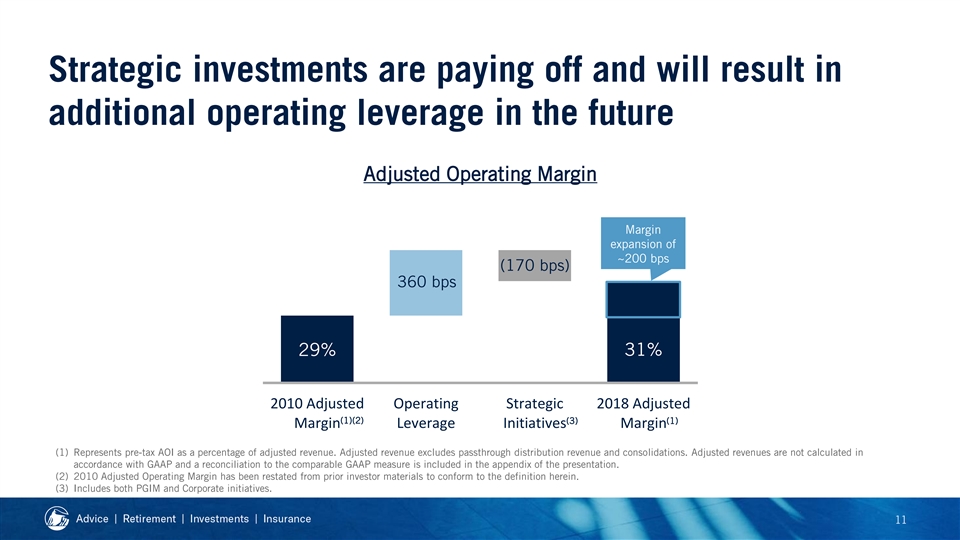
Strategic investments are paying off and will result in additional operating leverage in the future Adjusted Operating Margin Margin expansion of ~200 bps (170 bps) 360 bps 29% 31% 2010 Adjusted Operating Strategic 2018 Adjusted (1)(2) (3) (1) Margin Leverage Initiatives Margin (1) Represents pre-tax AOI as a percentage of adjusted revenue. Adjusted revenue excludes passthrough distribution revenue and consolidations. Adjusted revenues are not calculated in accordance with GAAP and a reconciliation to the comparable GAAP measure is included in the appendix of the presentation. (2) 2010 Adjusted Operating Margin has been restated from prior investor materials to conform to the definition herein. (3) Includes both PGIM and Corporate initiatives. 11Strategic investments are paying off and will result in additional operating leverage in the future Adjusted Operating Margin Margin expansion of ~200 bps (170 bps) 360 bps 29% 31% 2010 Adjusted Operating Strategic 2018 Adjusted (1)(2) (3) (1) Margin Leverage Initiatives Margin (1) Represents pre-tax AOI as a percentage of adjusted revenue. Adjusted revenue excludes passthrough distribution revenue and consolidations. Adjusted revenues are not calculated in accordance with GAAP and a reconciliation to the comparable GAAP measure is included in the appendix of the presentation. (2) 2010 Adjusted Operating Margin has been restated from prior investor materials to conform to the definition herein. (3) Includes both PGIM and Corporate initiatives. 11

Key Messages • Our scaled, diversified multi-manager model and strong investment performance have produced consistent positive net flows that position PGIM as a winner against the backdrop of industry headwinds • PGIM’s success is underpinned by disciplined investments in broadening and globalizing our investment and distribution capabilities, and gaining recognition for our unified brand • PGIM targets mid-to-high single digit earnings growth through the cycle driven by our strong and growing position in attractive segments of the asset management industry 12Key Messages • Our scaled, diversified multi-manager model and strong investment performance have produced consistent positive net flows that position PGIM as a winner against the backdrop of industry headwinds • PGIM’s success is underpinned by disciplined investments in broadening and globalizing our investment and distribution capabilities, and gaining recognition for our unified brand • PGIM targets mid-to-high single digit earnings growth through the cycle driven by our strong and growing position in attractive segments of the asset management industry 12

PGIM’s vision and strategy for long-term success To be widely regarded as a premier active global investment manager across a broad range of public and private asset classes 1 2 3 4 Broaden and Modernize our Expand our Selectively globalize our multi-manager reputation and acquire new products model brand investment capabilities Deliver superior risk-adjusted returns for clients 13PGIM’s vision and strategy for long-term success To be widely regarded as a premier active global investment manager across a broad range of public and private asset classes 1 2 3 4 Broaden and Modernize our Expand our Selectively globalize our multi-manager reputation and acquire new products model brand investment capabilities Deliver superior risk-adjusted returns for clients 13

Disciplined execution on our strategic initiatives has generated $100 billion of net flows over the past 5 years Broaden and globalize our 29% of assets from non-U.S. clients, up from 11% in 2010 1 products Modernize our multi-manager Built a broad set of vehicles including European Mutual Funds 2 (UCITS), ETFs, Collective Trusts, and Retail Separate Accounts model Global brand launched in 2016; now ranked #12 by U.S. Expand our reputation and brand 3 (1) investors (2) Selectively acquire new Acquired London-based quantitative hedge fund to broaden QMA 4 platform investment capabilities Note: All data as of year ended December 31, 2018 and comprehensive across third-party institutional, third-party retail, and general account unless otherwise specified. (1) Based on NMG Consulting Global Asset Management Study of asset management brands, September 2018. (2) PGIM signed deal to acquire Wadhwani Asset Management on November 13, 2018. 14Disciplined execution on our strategic initiatives has generated $100 billion of net flows over the past 5 years Broaden and globalize our 29% of assets from non-U.S. clients, up from 11% in 2010 1 products Modernize our multi-manager Built a broad set of vehicles including European Mutual Funds 2 (UCITS), ETFs, Collective Trusts, and Retail Separate Accounts model Global brand launched in 2016; now ranked #12 by U.S. Expand our reputation and brand 3 (1) investors (2) Selectively acquire new Acquired London-based quantitative hedge fund to broaden QMA 4 platform investment capabilities Note: All data as of year ended December 31, 2018 and comprehensive across third-party institutional, third-party retail, and general account unless otherwise specified. (1) Based on NMG Consulting Global Asset Management Study of asset management brands, September 2018. (2) PGIM signed deal to acquire Wadhwani Asset Management on November 13, 2018. 14

Key Messages • Our scaled, diversified multi-manager model and strong investment performance have produced consistent positive net flows that position PGIM as a winner against the backdrop of industry headwinds • PGIM’s success is underpinned by disciplined investments in broadening and globalizing our investment and distribution capabilities, and gaining recognition for our unified brand • PGIM targets mid-to-high single digit earnings growth through the cycle driven by our strong and growing position in attractive segments of the asset management industry 15Key Messages • Our scaled, diversified multi-manager model and strong investment performance have produced consistent positive net flows that position PGIM as a winner against the backdrop of industry headwinds • PGIM’s success is underpinned by disciplined investments in broadening and globalizing our investment and distribution capabilities, and gaining recognition for our unified brand • PGIM targets mid-to-high single digit earnings growth through the cycle driven by our strong and growing position in attractive segments of the asset management industry 15

PGIM’s winning business model While many firms struggle for scale or performance in the face of industry headwinds, three winning business models have emerged Very large public Specialized boutiques with managers offering strong investment cheap index performance Global firms managing public and private assets with strong Margin investment performance 30% Active public managers with poor performance / benchmarking-hugging 0% Size proportional to Flows (% of AUM) number of firms For illustrative purposes only. 16PGIM’s winning business model While many firms struggle for scale or performance in the face of industry headwinds, three winning business models have emerged Very large public Specialized boutiques with managers offering strong investment cheap index performance Global firms managing public and private assets with strong Margin investment performance 30% Active public managers with poor performance / benchmarking-hugging 0% Size proportional to Flows (% of AUM) number of firms For illustrative purposes only. 16

Robust growth trajectory through cycle ($ billions) Mid-to-high single digit earnings growth is expected to be driven by: Pre-tax AOI 1. Proven ability to capture industry flows and market share in areas where PGIM already has leading capabilities 2. Operating leverage across our business as we add to our scale $1.0 3. Strong presence and focus in high-growth areas • Alternatives $0.5 • U.S. Defined Contribution and Retail • International markets • Scaled technology investments 2010 2018 (1) 4. Market growth and portfolio level income (1) Includes equities and real estate market appreciation, dividends on equities, fixed income coupon reinvestments, and income on real estate properties. 17Robust growth trajectory through cycle ($ billions) Mid-to-high single digit earnings growth is expected to be driven by: Pre-tax AOI 1. Proven ability to capture industry flows and market share in areas where PGIM already has leading capabilities 2. Operating leverage across our business as we add to our scale $1.0 3. Strong presence and focus in high-growth areas • Alternatives $0.5 • U.S. Defined Contribution and Retail • International markets • Scaled technology investments 2010 2018 (1) 4. Market growth and portfolio level income (1) Includes equities and real estate market appreciation, dividends on equities, fixed income coupon reinvestments, and income on real estate properties. 17

Growth opportunity: Alternatives (1) Market Opportunity PGIM’s Positioning Investments for Future Growth ($ trillion) PGIM AUM Building out private credit capabilities (2)(3) (e.g., mezzanine, direct lending) Alternatives $229 bn Top 3 $21 (2)(3) Real Estate $136 bn Top 3 Further scaling and broadening PGIM $14 Fixed Income’s suite of hedge funds $11 (2)(3) $6 Private Credit $83 bn Top 3 $5 Driving growth of QMA’s global macro $3 and managed futures strategies (4) Infrastructure $26 bn 2004 2007 2012 2017 2020E 2025E (1) PwC Asset & Wealth Management Revolution, published 2018. (2) Data reflects AUM as of December 31, 2018. Alternatives AUM represents hedge fund, mezzanine and other private credit, real asset, and infrastructure products across all PGIM businesses. (3) Rankings per Willis Towers Watson Global Alternatives Survey 2017. (4) Infrastructure AUM includes private credit infrastructure and energy strategies, Jennison utility equity, natural resources, global infrastructure, and Master Limited Partnership (MLP) strategies as of December 31, 2018. 18Growth opportunity: Alternatives (1) Market Opportunity PGIM’s Positioning Investments for Future Growth ($ trillion) PGIM AUM Building out private credit capabilities (2)(3) (e.g., mezzanine, direct lending) Alternatives $229 bn Top 3 $21 (2)(3) Real Estate $136 bn Top 3 Further scaling and broadening PGIM $14 Fixed Income’s suite of hedge funds $11 (2)(3) $6 Private Credit $83 bn Top 3 $5 Driving growth of QMA’s global macro $3 and managed futures strategies (4) Infrastructure $26 bn 2004 2007 2012 2017 2020E 2025E (1) PwC Asset & Wealth Management Revolution, published 2018. (2) Data reflects AUM as of December 31, 2018. Alternatives AUM represents hedge fund, mezzanine and other private credit, real asset, and infrastructure products across all PGIM businesses. (3) Rankings per Willis Towers Watson Global Alternatives Survey 2017. (4) Infrastructure AUM includes private credit infrastructure and energy strategies, Jennison utility equity, natural resources, global infrastructure, and Master Limited Partnership (MLP) strategies as of December 31, 2018. 18

Growth opportunity: U.S. Defined Contribution and Retail Market Opportunity PGIM’s Positioning Investments for Future Growth Enhancing dedicated coverage (2) of DC sponsors and consultants #8 by DC AUM $10 tn U.S. (3) Leveraging Prudential’s Named Top 5 DCIO manager $6 tn Defined collective strength in retirement Leading capabilities to meet Contribution to scale target date funds growing demand for retirement Pioneer in direct Real Estate income solutions 2013 2023E investing for DC plans 61% of AUM Passive th 5 fastest organic U.S. mutual in Active MFs ETFs Continue to build on strategic (5) fund AUM growth and Active 20% partner status (e.g., Edward (4) ETFs U.S. Institutional approach to serving Jones) $17 tn Retail retail intermediaries 19% Scale up suite of active ETFs and 61% Leading Fixed Income franchise Retail Separate Accounts Active Passive meets investors’ demand for yield MFs & ETFs MFs Source: (1) North American Institutional Markets 2018; Cerulli report. (2) Pensions & Investments Top DC Money Manager’s list, July 23, 2018. Ranked by total defined contribution (DC) U.S. institutional AUM as of December 31, 2017. (3) “The Dominant Players in 401(k) Land” by Institutional Investor, June 19, 2018. Ranking of Defined Contribution Investment-Only (DCIO) managers based on ratings from plan advisers overseeing at least $100 mn across multiple plans. (4) Morningstar data as of year ended December 31, 2018 (excludes money market funds). (5) Strategic Insight/Simfund FY 2018. Ranking only references long term mutual funds and excludes ETF and money markets. Results may differ from PGIM Investments (Strategic Insight/Simfund excludes Day One and private funds). 19Growth opportunity: U.S. Defined Contribution and Retail Market Opportunity PGIM’s Positioning Investments for Future Growth Enhancing dedicated coverage (2) of DC sponsors and consultants #8 by DC AUM $10 tn U.S. (3) Leveraging Prudential’s Named Top 5 DCIO manager $6 tn Defined collective strength in retirement Leading capabilities to meet Contribution to scale target date funds growing demand for retirement Pioneer in direct Real Estate income solutions 2013 2023E investing for DC plans 61% of AUM Passive th 5 fastest organic U.S. mutual in Active MFs ETFs Continue to build on strategic (5) fund AUM growth and Active 20% partner status (e.g., Edward (4) ETFs U.S. Institutional approach to serving Jones) $17 tn Retail retail intermediaries 19% Scale up suite of active ETFs and 61% Leading Fixed Income franchise Retail Separate Accounts Active Passive meets investors’ demand for yield MFs & ETFs MFs Source: (1) North American Institutional Markets 2018; Cerulli report. (2) Pensions & Investments Top DC Money Manager’s list, July 23, 2018. Ranked by total defined contribution (DC) U.S. institutional AUM as of December 31, 2017. (3) “The Dominant Players in 401(k) Land” by Institutional Investor, June 19, 2018. Ranking of Defined Contribution Investment-Only (DCIO) managers based on ratings from plan advisers overseeing at least $100 mn across multiple plans. (4) Morningstar data as of year ended December 31, 2018 (excludes money market funds). (5) Strategic Insight/Simfund FY 2018. Ranking only references long term mutual funds and excludes ETF and money markets. Results may differ from PGIM Investments (Strategic Insight/Simfund excludes Day One and private funds). 19

Growth opportunity: International markets Market Opportunity PGIM’s Positioning and Investments for Future Growth $3.5 trillion (2) • Top 3 foreign manager of Japanese institutional assets institutional assets Japan • Generated a total of $30 billion in third-party net flows over the last 5 years (1) (10% CAGR) $11.7 trillion • 20 sales professionals covering EU institutions and intermediaries, doubled since 2013 UCITS assets• PGIM’s flagship strategies delivered through ~30 UCITS funds Europe (3) (10% CAGR) • AUM from European clients grew by 14% CAGR over the last 5 years (4) • China: $23 billion AUM JV , up from $5 billion in 2010; deepening local coverage of $6.9 trillion top institutions Emerging institutional assets (5) • EM investment capabilities: Top 5 EM active investment manager with $44 billion Markets (1) (14% CAGR) across public debt and equities strategies $1.0 trillion • Establishing deeper local origination footprint for private credit and real estate Australia institutional assets • Hired local sales team to capture international opportunities with superannuation funds (1) (12% CAGR) Source: (1) McKinsey – data as of YE 2017; CAGR since 2011. (2) Nenkin Joho by R&I, April 1, 2019. AUM as of December 31, 2018. AUM ranking pertains to separate accounts and does not include AUM for institutional funds. (3) European Fund and Asset Management Association’s Quarterly Statistical Release published in 2019 – data as of YE 2017; conversion rate of EUR/USD 1.201 (YE 2017 from Macrotrends) used. CAGR since 2011 is calculated using EUR values of the total market. (4) AUM as of YE 2018. (5) Based on eVestment data as of YE 2018. 20Growth opportunity: International markets Market Opportunity PGIM’s Positioning and Investments for Future Growth $3.5 trillion (2) • Top 3 foreign manager of Japanese institutional assets institutional assets Japan • Generated a total of $30 billion in third-party net flows over the last 5 years (1) (10% CAGR) $11.7 trillion • 20 sales professionals covering EU institutions and intermediaries, doubled since 2013 UCITS assets• PGIM’s flagship strategies delivered through ~30 UCITS funds Europe (3) (10% CAGR) • AUM from European clients grew by 14% CAGR over the last 5 years (4) • China: $23 billion AUM JV , up from $5 billion in 2010; deepening local coverage of $6.9 trillion top institutions Emerging institutional assets (5) • EM investment capabilities: Top 5 EM active investment manager with $44 billion Markets (1) (14% CAGR) across public debt and equities strategies $1.0 trillion • Establishing deeper local origination footprint for private credit and real estate Australia institutional assets • Hired local sales team to capture international opportunities with superannuation funds (1) (12% CAGR) Source: (1) McKinsey – data as of YE 2017; CAGR since 2011. (2) Nenkin Joho by R&I, April 1, 2019. AUM as of December 31, 2018. AUM ranking pertains to separate accounts and does not include AUM for institutional funds. (3) European Fund and Asset Management Association’s Quarterly Statistical Release published in 2019 – data as of YE 2017; conversion rate of EUR/USD 1.201 (YE 2017 from Macrotrends) used. CAGR since 2011 is calculated using EUR values of the total market. (4) AUM as of YE 2018. (5) Based on eVestment data as of YE 2018. 20
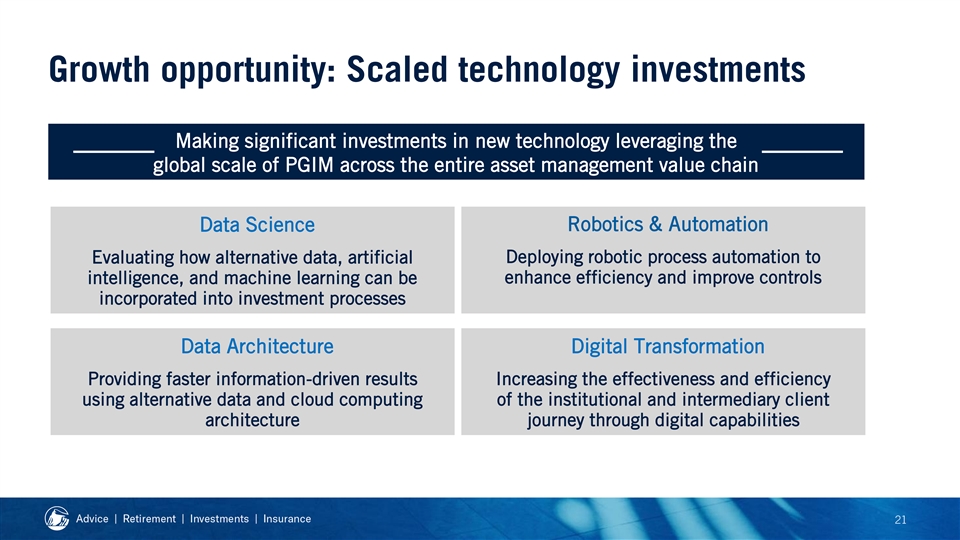
Growth opportunity: Scaled technology investments Making significant investments in new technology leveraging the global scale of PGIM across the entire asset management value chain Robotics & Automation Data Science Evaluating how alternative data, artificial Deploying robotic process automation to enhance efficiency and improve controls intelligence, and machine learning can be incorporated into investment processes Data Architecture Digital Transformation Providing faster information-driven results Increasing the effectiveness and efficiency using alternative data and cloud computing of the institutional and intermediary client architecture journey through digital capabilities 21Growth opportunity: Scaled technology investments Making significant investments in new technology leveraging the global scale of PGIM across the entire asset management value chain Robotics & Automation Data Science Evaluating how alternative data, artificial Deploying robotic process automation to enhance efficiency and improve controls intelligence, and machine learning can be incorporated into investment processes Data Architecture Digital Transformation Providing faster information-driven results Increasing the effectiveness and efficiency using alternative data and cloud computing of the institutional and intermediary client architecture journey through digital capabilities 21

Key Messages • Our scaled, diversified multi-manager model and strong investment performance have produced consistent positive net flows that position PGIM as a winner against the backdrop of industry headwinds • PGIM’s success is underpinned by disciplined investments in broadening and globalizing our investment and distribution capabilities, and gaining recognition for our unified brand • PGIM targets mid-to-high single digit earnings growth through the cycle driven by our strong and growing position in attractive segments of the asset management industry 22Key Messages • Our scaled, diversified multi-manager model and strong investment performance have produced consistent positive net flows that position PGIM as a winner against the backdrop of industry headwinds • PGIM’s success is underpinned by disciplined investments in broadening and globalizing our investment and distribution capabilities, and gaining recognition for our unified brand • PGIM targets mid-to-high single digit earnings growth through the cycle driven by our strong and growing position in attractive segments of the asset management industry 22

2019 Investor Day Scott Sleyster International Executive Vice President and Chief Operating Officer, International Businesses2019 Investor Day Scott Sleyster International Executive Vice President and Chief Operating Officer, International Businesses

Key Messages • Differentiated business model with superior execution • Sustained and stable growth through developed and emerging markets • Delivering on our strategic imperatives to capture future growth 2Key Messages • Differentiated business model with superior execution • Sustained and stable growth through developed and emerging markets • Delivering on our strategic imperatives to capture future growth 2

Consistent strategy and superior execution drive differentiated results Mid-single Digit Mid-teens 60%+ (5) Annual Growth in Core AOI Adjusted Operating ROE and Redeployment of (1)(2) (3)(4) and In-Force Since 2013 Operating Margin International’s after-tax AOI Well positioned to maintain steady growth and strong returns (1) Represents compound annual growth rate for face amount in-force and pre-tax Adjusted Operating Income adjusted for notable items and foreign currency and low interest rate impacts from 2013 - 2018. See appendix for analysis of foreign exchange and interest rate adjustments. (2) Translated to U.S. dollars at uniform currency exchange rates, including Japanese yen 111 per U.S. dollar and Korean won 1150 per U.S. dollar. (3) Adjusted operating return on equity represents reported after-tax Adjusted Operating Income as a percentage of average attributed equity excluding accumulated other comprehensive income. (4) Operating margin represents reported pre-tax Adjusted Operating Income as a percentage of total revenue. (5) Reflects net capital redeployed including through dividends, debt repayment, affiliated lending, affiliated derivatives, and reinsurance. Excludes acquisitions/dispositions and other extraordinary items. 3Consistent strategy and superior execution drive differentiated results Mid-single Digit Mid-teens 60%+ (5) Annual Growth in Core AOI Adjusted Operating ROE and Redeployment of (1)(2) (3)(4) and In-Force Since 2013 Operating Margin International’s after-tax AOI Well positioned to maintain steady growth and strong returns (1) Represents compound annual growth rate for face amount in-force and pre-tax Adjusted Operating Income adjusted for notable items and foreign currency and low interest rate impacts from 2013 - 2018. See appendix for analysis of foreign exchange and interest rate adjustments. (2) Translated to U.S. dollars at uniform currency exchange rates, including Japanese yen 111 per U.S. dollar and Korean won 1150 per U.S. dollar. (3) Adjusted operating return on equity represents reported after-tax Adjusted Operating Income as a percentage of average attributed equity excluding accumulated other comprehensive income. (4) Operating margin represents reported pre-tax Adjusted Operating Income as a percentage of total revenue. (5) Reflects net capital redeployed including through dividends, debt repayment, affiliated lending, affiliated derivatives, and reinsurance. Excludes acquisitions/dispositions and other extraordinary items. 3

Strong mix of developed and emerging markets provide long-term growth Developed Markets • Large, mature, and wealthy markets • Stable earnings with mid-single digit growth Korea • Source of significant cash flows to PFI Japan Taiwan 4Strong mix of developed and emerging markets provide long-term growth Developed Markets • Large, mature, and wealthy markets • Stable earnings with mid-single digit growth Korea • Source of significant cash flows to PFI Japan Taiwan 4

Strong mix of developed and emerging markets provide long-term growth Emerging Markets • Expanding economies and rising affluent and middle classes China • Low insurance penetration with growing demand for protection and saving products Mexico India Brazil Ghana • Thoughtful ownership approaches to capitalize on Indonesia market dynamics and Chile opportunities Argentina 5Strong mix of developed and emerging markets provide long-term growth Emerging Markets • Expanding economies and rising affluent and middle classes China • Low insurance penetration with growing demand for protection and saving products Mexico India Brazil Ghana • Thoughtful ownership approaches to capitalize on Indonesia market dynamics and Chile opportunities Argentina 5

Why we will continue to win in Japan Our differentiated business World class captive agents, model focuses on needs-based complemented by third-party selling distribution Aging population provides Wealthy households with opportunity for retirement significant investable assets solutions 6Why we will continue to win in Japan Our differentiated business World class captive agents, model focuses on needs-based complemented by third-party selling distribution Aging population provides Wealthy households with opportunity for retirement significant investable assets solutions 6
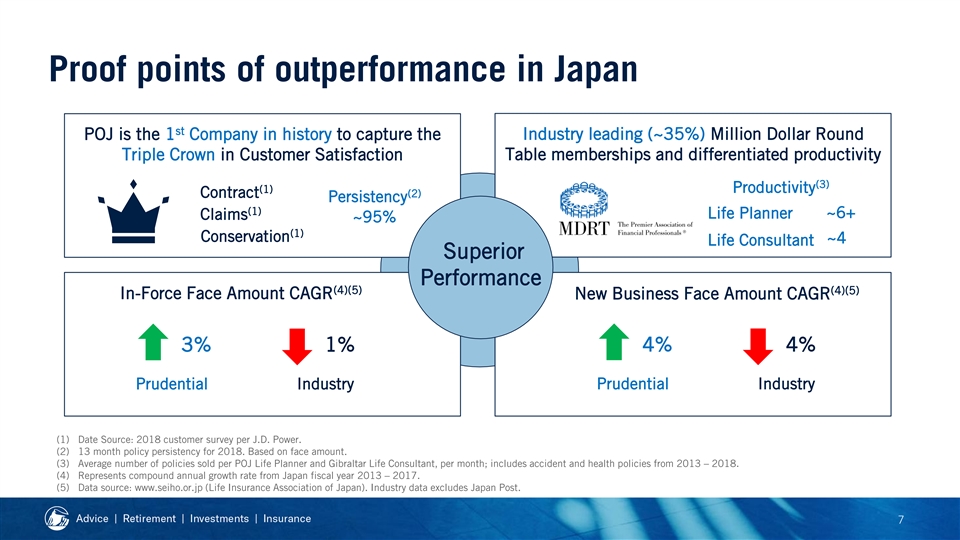
Proof points of outperformance in Japan st POJ is the 1 Company in history to capture the Industry leading (~35%) Million Dollar Round Triple Crown in Customer Satisfaction Table memberships and differentiated productivity (3) (1) Productivity (2) Contract Persistency (1) ~6+ Life Planner Claims ~95% (1) Conservation ~4 Life Consultant Superior Performance (4)(5) (4)(5) In-Force Face Amount CAGR New Business Face Amount CAGR 4% 4% 3% 1% Prudential Industry Prudential Industry (1) Date Source: 2018 customer survey per J.D. Power. (2) 13 month policy persistency for 2018. Based on face amount. (3) Average number of policies sold per POJ Life Planner and Gibraltar Life Consultant, per month; includes accident and health policies from 2013 – 2018. (4) Represents compound annual growth rate from Japan fiscal year 2013 – 2017. (5) Data source: www.seiho.or.jp (Life Insurance Association of Japan). Industry data excludes Japan Post. 7Proof points of outperformance in Japan st POJ is the 1 Company in history to capture the Industry leading (~35%) Million Dollar Round Triple Crown in Customer Satisfaction Table memberships and differentiated productivity (3) (1) Productivity (2) Contract Persistency (1) ~6+ Life Planner Claims ~95% (1) Conservation ~4 Life Consultant Superior Performance (4)(5) (4)(5) In-Force Face Amount CAGR New Business Face Amount CAGR 4% 4% 3% 1% Prudential Industry Prudential Industry (1) Date Source: 2018 customer survey per J.D. Power. (2) 13 month policy persistency for 2018. Based on face amount. (3) Average number of policies sold per POJ Life Planner and Gibraltar Life Consultant, per month; includes accident and health policies from 2013 – 2018. (4) Represents compound annual growth rate from Japan fiscal year 2013 – 2017. (5) Data source: www.seiho.or.jp (Life Insurance Association of Japan). Industry data excludes Japan Post. 7

Case study: Our success in Brazil Why Brazil? (3) Social Economic Classes (1) • World’s 9th largest economy 2005 2017 • Favorable demographics with rising affluent 64% and middle income customer base 49% • Largest life insurance sector in Latin America, accounting for ~60% of life (2) premiums in the region • Low life insurance penetration and increasing Growing Affluent & Middle Classes needs for protection products (1) Data source: International Monetary Fund, World Economic Outlook Database, April 2019. Based on 2018 GDP, current prices. (2) Data source: Sigma report from Swiss Re, 2017. Region includes Latin America and the Caribbean. (3) Data source: Bradesco (2017). Affluent and middle classes represent households with monthly income in excess of ~7,300 BRL and ~1,800 BRL, respectively. 8Case study: Our success in Brazil Why Brazil? (3) Social Economic Classes (1) • World’s 9th largest economy 2005 2017 • Favorable demographics with rising affluent 64% and middle income customer base 49% • Largest life insurance sector in Latin America, accounting for ~60% of life (2) premiums in the region • Low life insurance penetration and increasing Growing Affluent & Middle Classes needs for protection products (1) Data source: International Monetary Fund, World Economic Outlook Database, April 2019. Based on 2018 GDP, current prices. (2) Data source: Sigma report from Swiss Re, 2017. Region includes Latin America and the Caribbean. (3) Data source: Bradesco (2017). Affluent and middle classes represent households with monthly income in excess of ~7,300 BRL and ~1,800 BRL, respectively. 8
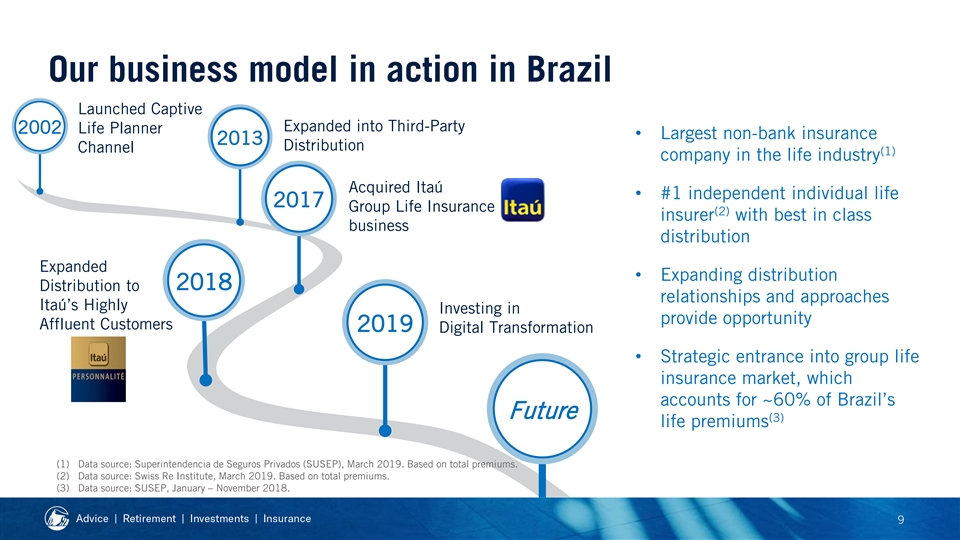
Our business model in action in Brazil Launched Captive Expanded into Third-Party 2002 Life Planner • Largest non-bank insurance 2013 Distribution Channel (1) company in the life industry Acquired Itaú • #1 independent individual life 2017 Group Life Insurance (2) insurer with best in class business distribution Expanded • Expanding distribution 2018 Distribution to relationships and approaches Itaú’s Highly Investing in provide opportunity Affluent Customers 2019 Digital Transformation • Strategic entrance into group life insurance market, which accounts for ~60% of Brazil’s Future (3) life premiums (1) Data source: Superintendencia de Seguros Privados (SUSEP), March 2019. Based on total premiums. (2) Data source: Swiss Re Institute, March 2019. Based on total premiums. (3) Data source: SUSEP, January – November 2018. 9Our business model in action in Brazil Launched Captive Expanded into Third-Party 2002 Life Planner • Largest non-bank insurance 2013 Distribution Channel (1) company in the life industry Acquired Itaú • #1 independent individual life 2017 Group Life Insurance (2) insurer with best in class business distribution Expanded • Expanding distribution 2018 Distribution to relationships and approaches Itaú’s Highly Investing in provide opportunity Affluent Customers 2019 Digital Transformation • Strategic entrance into group life insurance market, which accounts for ~60% of Brazil’s Future (3) life premiums (1) Data source: Superintendencia de Seguros Privados (SUSEP), March 2019. Based on total premiums. (2) Data source: Swiss Re Institute, March 2019. Based on total premiums. (3) Data source: SUSEP, January – November 2018. 9

Superior execution leads to rapid growth in Brazil Sales In-Force Face Amount ($ millions) ($ billions) 2013 2018 $35 10% 1% $29 $24 $18 27% CAGR $182 $55 $14 $10 ▪ Life Planner Group & Third-Party 2013 2014 2015 2016 2017 2018 (1) Strong sales momentum with increasing High quality businesses with exceptional (1) non-LP channel contributions in-force face amount growth LP Count 2013 2018 13% CAGR 1,476 798 (1) Sales and in-force face amounts are translated using the 2018 constant FX rate (3.6 BRL / USD). 10Superior execution leads to rapid growth in Brazil Sales In-Force Face Amount ($ millions) ($ billions) 2013 2018 $35 10% 1% $29 $24 $18 27% CAGR $182 $55 $14 $10 ▪ Life Planner Group & Third-Party 2013 2014 2015 2016 2017 2018 (1) Strong sales momentum with increasing High quality businesses with exceptional (1) non-LP channel contributions in-force face amount growth LP Count 2013 2018 13% CAGR 1,476 798 (1) Sales and in-force face amounts are translated using the 2018 constant FX rate (3.6 BRL / USD). 10

Delivering on our strategic imperatives to capture future growth Strategic Imperatives Attractive Business Mix Growth Distribution Expansion in Proprietary and Third-Party Channels Distribution Digital Expansion Enablement In 6 of the 10 Product Development Most Populous to meet Customer Needs Countries Next Gen New Partnerships and Largest Building Digital, Mobile, and Partnerships (2012 – 2018) Insurance Data Analytics Capabilities Markets Complementing Organic Growth with M&A 11Delivering on our strategic imperatives to capture future growth Strategic Imperatives Attractive Business Mix Growth Distribution Expansion in Proprietary and Third-Party Channels Distribution Digital Expansion Enablement In 6 of the 10 Product Development Most Populous to meet Customer Needs Countries Next Gen New Partnerships and Largest Building Digital, Mobile, and Partnerships (2012 – 2018) Insurance Data Analytics Capabilities Markets Complementing Organic Growth with M&A 11

Key Messages • Differentiated business model with superior execution • Sustained and stable growth through developed and emerging markets • Delivering on our strategic imperatives to capture future growth 12Key Messages • Differentiated business model with superior execution • Sustained and stable growth through developed and emerging markets • Delivering on our strategic imperatives to capture future growth 12

2019 Investor Day Tim Schmidt Investment Portfolio Senior Vice President, Chief Investment Officer2019 Investor Day Tim Schmidt Investment Portfolio Senior Vice President, Chief Investment Officer

Key Messages • Broadly diversified, high quality, and well matched investment portfolio • Prudential’s General Account enjoys a distinctive advantage from PGIM’s direct origination capabilities and asset management expertise • Disciplined framework for credit management and well positioned to weather the credit cycle 2Key Messages • Broadly diversified, high quality, and well matched investment portfolio • Prudential’s General Account enjoys a distinctive advantage from PGIM’s direct origination capabilities and asset management expertise • Disciplined framework for credit management and well positioned to weather the credit cycle 2

Our approach to portfolio management Fundamental Understanding of Liabilities High Quality, Disciplined Interest Rate Risk Management Well Matched Broad Diversification Investment Portfolio Rigorous Security Selection 3Our approach to portfolio management Fundamental Understanding of Liabilities High Quality, Disciplined Interest Rate Risk Management Well Matched Broad Diversification Investment Portfolio Rigorous Security Selection 3

Diversified and high quality portfolio (1) Portfolio Composition $416 billion • Over one-third in government securities Government Securities • Low allocation to Below Investment Grade 36% Other (BIG) corporates, equities and alternatives 7% Policy Loans 2% Equities / Alts 3% IG Corporate, BIG Corporates Public 4% 22% Structured Products Mortgage IG 5% Loans Corporate, 12% Private 9% (1) General Account excluding Closed Block Division as of December 31, 2018, on a U.S. GAAP carrying value basis. Mortgage loans include commercial, agricultural, residential and other loans. Equities/Alts include equity securities, investments in LPs/LLCs, and real estate held through direct ownership. Structured products include commercial and residential mortgage-backed securities, collateralized loan obligations, and other asset-backed securities. Other includes assets supporting experience-rated contractholder liabilities (“ASCL”) (5%), fixed maturities - trading, short-term investments, derivatives and other miscellaneous assets. 4Diversified and high quality portfolio (1) Portfolio Composition $416 billion • Over one-third in government securities Government Securities • Low allocation to Below Investment Grade 36% Other (BIG) corporates, equities and alternatives 7% Policy Loans 2% Equities / Alts 3% IG Corporate, BIG Corporates Public 4% 22% Structured Products Mortgage IG 5% Loans Corporate, 12% Private 9% (1) General Account excluding Closed Block Division as of December 31, 2018, on a U.S. GAAP carrying value basis. Mortgage loans include commercial, agricultural, residential and other loans. Equities/Alts include equity securities, investments in LPs/LLCs, and real estate held through direct ownership. Structured products include commercial and residential mortgage-backed securities, collateralized loan obligations, and other asset-backed securities. Other includes assets supporting experience-rated contractholder liabilities (“ASCL”) (5%), fixed maturities - trading, short-term investments, derivatives and other miscellaneous assets. 4
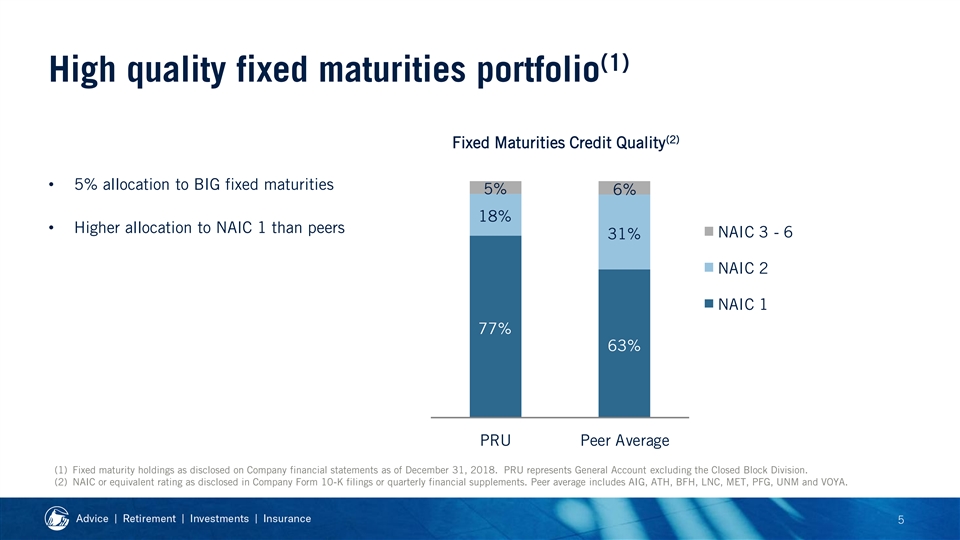
(1) High quality fixed maturities portfolio (2) Fixed Maturities Credit Quality • 5% allocation to BIG fixed maturities 5% 6% 18% • Higher allocation to NAIC 1 than peers NAIC 3 - 6 31% NAIC 2 NAIC 1 77% 63% PRU Peer Average (1) Fixed maturity holdings as disclosed on Company financial statements as of December 31, 2018. PRU represents General Account excluding the Closed Block Division. (2) NAIC or equivalent rating as disclosed in Company Form 10-K filings or quarterly financial supplements. Peer average includes AIG, ATH, BFH, LNC, MET, PFG, UNM and VOYA. 5(1) High quality fixed maturities portfolio (2) Fixed Maturities Credit Quality • 5% allocation to BIG fixed maturities 5% 6% 18% • Higher allocation to NAIC 1 than peers NAIC 3 - 6 31% NAIC 2 NAIC 1 77% 63% PRU Peer Average (1) Fixed maturity holdings as disclosed on Company financial statements as of December 31, 2018. PRU represents General Account excluding the Closed Block Division. (2) NAIC or equivalent rating as disclosed in Company Form 10-K filings or quarterly financial supplements. Peer average includes AIG, ATH, BFH, LNC, MET, PFG, UNM and VOYA. 5

High quality corporate credit (1) Corporate Securities by Credit Quality $147 billion (35% of Invested Assets) • 50% of corporate credit is rated A & above Composition of BBB 40% • Nearly half of BBB & below are 36% directly originated privates. Benefits 24% 50% include: 8% 39% – Structural protections BBB+ BBB BBB- 19% – Historically, better recoveries vs. publics 42% 6% – Strength of PGIM underwriting 20% 4% 1% A & above BBB BB B Caa or lower Publics Privates (1) General Account excluding Closed Block Division as of December 31, 2018, on a U.S. GAAP carrying value basis. Ratings shown at lowest national agency rating. 6High quality corporate credit (1) Corporate Securities by Credit Quality $147 billion (35% of Invested Assets) • 50% of corporate credit is rated A & above Composition of BBB 40% • Nearly half of BBB & below are 36% directly originated privates. Benefits 24% 50% include: 8% 39% – Structural protections BBB+ BBB BBB- 19% – Historically, better recoveries vs. publics 42% 6% – Strength of PGIM underwriting 20% 4% 1% A & above BBB BB B Caa or lower Publics Privates (1) General Account excluding Closed Block Division as of December 31, 2018, on a U.S. GAAP carrying value basis. Ratings shown at lowest national agency rating. 6

Single name diversification (1) • Low credit concentration Top 25 Credit Exposures (% of Total Credit Assets) • Credit rotation trades reduce single name credit migration risk 19.2% 14.9% 14.5% 13.1% 12.5% 12.3% 11.7% 11.7% 11.2% Company A Company B Company C Company D Company E Prudential Company F Company G Company H (1) Source: JP Morgan analysis on credit portfolios of large life insurers and S&P Global Market Intelligence. Credit assets defined as issuer obligations excluding U.S. Treasury Securities, short-term bonds, and bonds of affiliates. Data as of 2017 based on Statutory Filings. 7Single name diversification (1) • Low credit concentration Top 25 Credit Exposures (% of Total Credit Assets) • Credit rotation trades reduce single name credit migration risk 19.2% 14.9% 14.5% 13.1% 12.5% 12.3% 11.7% 11.7% 11.2% Company A Company B Company C Company D Company E Prudential Company F Company G Company H (1) Source: JP Morgan analysis on credit portfolios of large life insurers and S&P Global Market Intelligence. Credit assets defined as issuer obligations excluding U.S. Treasury Securities, short-term bonds, and bonds of affiliates. Data as of 2017 based on Statutory Filings. 7

Well balanced, high quality structured products (2) Structured Products Credit Quality (1) (% of Total Structured Products) $22 billion (5% of Invested Assets ) • 98% AAA-AA rated • CLO’s 100% AAA, with ~37% credit enhancement CMBS 80% 40% 8% 5% Other ABS 12% 33% RMBS 15% 18% 2% CLOs 34% 33% 10% 2% 6% AAA AA A & below (1) General Account excluding Closed Block Division as of December 31, 2018, on a U.S. GAAP carrying value basis and excludes ASCL. (2) Ratings shown at lowest assigned by Standard & Poor’s, Moody’s, Fitch, and Morningstar. 8Well balanced, high quality structured products (2) Structured Products Credit Quality (1) (% of Total Structured Products) $22 billion (5% of Invested Assets ) • 98% AAA-AA rated • CLO’s 100% AAA, with ~37% credit enhancement CMBS 80% 40% 8% 5% Other ABS 12% 33% RMBS 15% 18% 2% CLOs 34% 33% 10% 2% 6% AAA AA A & below (1) General Account excluding Closed Block Division as of December 31, 2018, on a U.S. GAAP carrying value basis and excludes ASCL. (2) Ratings shown at lowest assigned by Standard & Poor’s, Moody’s, Fitch, and Morningstar. 8

CLOs are high quality with significant structural protections Typical CLO Typical CLO Structure Structure 100% 100% 100% (1) Rated NAIC 1 Rated AAA externally AAA-rated Tranche 63% Investments are in the most senior tranche • Strongest structural protections in each transaction • Credit enhancement level (loss 37% protection) is very high AA 12% 25% • Underlying collateral are broadly A 6% 19% Loss Absorption syndicated loans; avoid middle BBB 6% 13% market BB 5% 8% Equity 8% (1) Ratings shown of nationally recognized rating agencies. CLO portfolio is $7.3 billion as of December 31, 2018, at fair value, in the General Account excluding the Closed Block Division and ASCL. 9CLOs are high quality with significant structural protections Typical CLO Typical CLO Structure Structure 100% 100% 100% (1) Rated NAIC 1 Rated AAA externally AAA-rated Tranche 63% Investments are in the most senior tranche • Strongest structural protections in each transaction • Credit enhancement level (loss 37% protection) is very high AA 12% 25% • Underlying collateral are broadly A 6% 19% Loss Absorption syndicated loans; avoid middle BBB 6% 13% market BB 5% 8% Equity 8% (1) Ratings shown of nationally recognized rating agencies. CLO portfolio is $7.3 billion as of December 31, 2018, at fair value, in the General Account excluding the Closed Block Division and ASCL. 9

Diversified, high quality, and defensively positioned mortgage loan portfolio (1) Mortgage Loan Type vs. ACLI Composition (2) $50 billion (12% of Invested Assets ) • Provides attractive yields More Defensive Less Defensive • Conservative underwriting 8% • Benefit of PGIM’s direct originations 4% 1% 0% -1% -5% -7% Industrial Apartments / Other Agricultural Hospitality Office Retail Multi-Family (1) American Council of Life Insurers (ACLI) peer groups represents average commercial mortgage allocations by sector for participating life insurance companies, excluding Prudential. ACLI percentages shown exclude non-USD denominated loans. (2) General Account excluding Closed Block Division as of December 31, 2018, on a U.S. GAAP carrying value basis. Mortgage loans above include commercial and agricultural mortgages. 10Diversified, high quality, and defensively positioned mortgage loan portfolio (1) Mortgage Loan Type vs. ACLI Composition (2) $50 billion (12% of Invested Assets ) • Provides attractive yields More Defensive Less Defensive • Conservative underwriting 8% • Benefit of PGIM’s direct originations 4% 1% 0% -1% -5% -7% Industrial Apartments / Other Agricultural Hospitality Office Retail Multi-Family (1) American Council of Life Insurers (ACLI) peer groups represents average commercial mortgage allocations by sector for participating life insurance companies, excluding Prudential. ACLI percentages shown exclude non-USD denominated loans. (2) General Account excluding Closed Block Division as of December 31, 2018, on a U.S. GAAP carrying value basis. Mortgage loans above include commercial and agricultural mortgages. 10

Equities and alternatives provide diversification and enhance long-term return (2) PRU vs. Peers (% of Invested Assets) 5% Equities and Alternatives Composition • Support long-duration liabilities (1) $12 billion (3% of Invested Assets ) 3% • Returns exceed fixed income yields Equity • Lower allocation than peers Securities 33% PRU Peer Average (3) Cumulative AOI Private (2013 – 2018 in billions) Real Estate Equity $3.2 21% 28% $2.7 Hedge Funds 18% Expected Actual (1) General Account excluding Closed Block Division as of December 31, 2018, on a U.S. GAAP carrying value basis. (2) Peer average includes AIG, ATH, BFH, LNC, MET, PFG, UNM and VOYA. Includes equity securities, alternative assets and other invested assets as disclosed in Company financial statements. (3) Expected AOI is based on long-term expected annual returns of the equities and alternatives portfolio for each of the respective years. 11Equities and alternatives provide diversification and enhance long-term return (2) PRU vs. Peers (% of Invested Assets) 5% Equities and Alternatives Composition • Support long-duration liabilities (1) $12 billion (3% of Invested Assets ) 3% • Returns exceed fixed income yields Equity • Lower allocation than peers Securities 33% PRU Peer Average (3) Cumulative AOI Private (2013 – 2018 in billions) Real Estate Equity $3.2 21% 28% $2.7 Hedge Funds 18% Expected Actual (1) General Account excluding Closed Block Division as of December 31, 2018, on a U.S. GAAP carrying value basis. (2) Peer average includes AIG, ATH, BFH, LNC, MET, PFG, UNM and VOYA. Includes equity securities, alternative assets and other invested assets as disclosed in Company financial statements. (3) Expected AOI is based on long-term expected annual returns of the equities and alternatives portfolio for each of the respective years. 11

Moderating impact of low interest rates as acquisition yields approach book yields (1) (1) Domestic Portfolio Japan Portfolio 5.0% 5.0% 4.5% 4.5% USD Products 4.0% 4.0% 3.5% 3.5% 3.0% 3.0% 2.5% 2.5% JPY Products 2.0% 2.0% 1.5% 1.5% 1.0% 1.0% (2) (2) Fixed Income Book Yield Acquisition Yield Fixed Income Book Yield Acquisition Yield (1) Fixed Income and Mortgage Portfolio; Domestic Portfolio excludes the Closed Block Division and Divested Businesses, and excludes U.S. Treasury securities. Japan Portfolio includes USD and JPY blocks in the Gibraltar and POJ Businesses. “USD” and “JPY” are indicative of the currency of the products that the assets are supporting. (2) Future period rates assume scheduled maturities are reinvested at the new acquisition yield and asset balances / asset mix remain constant from 1Q 2019 expected balances. Future acquisition yields are based on forward yield curves and projected spreads as of 1Q 2019, as applicable. 12 1Q17 2Q17 3Q17 4Q17 1Q18 2Q18 3Q18 4Q18 1Q19 2Q19 3Q19 4Q19 1Q20 2Q20 3Q20 4Q20 1Q21 2Q21 3Q21 4Q21 1Q17 2Q17 3Q17 4Q17 1Q18 2Q18 3Q18 4Q18 1Q19 2Q19 3Q19 4Q19 1Q20 2Q20 3Q20 4Q20 1Q21 2Q21 3Q21 4Q21Moderating impact of low interest rates as acquisition yields approach book yields (1) (1) Domestic Portfolio Japan Portfolio 5.0% 5.0% 4.5% 4.5% USD Products 4.0% 4.0% 3.5% 3.5% 3.0% 3.0% 2.5% 2.5% JPY Products 2.0% 2.0% 1.5% 1.5% 1.0% 1.0% (2) (2) Fixed Income Book Yield Acquisition Yield Fixed Income Book Yield Acquisition Yield (1) Fixed Income and Mortgage Portfolio; Domestic Portfolio excludes the Closed Block Division and Divested Businesses, and excludes U.S. Treasury securities. Japan Portfolio includes USD and JPY blocks in the Gibraltar and POJ Businesses. “USD” and “JPY” are indicative of the currency of the products that the assets are supporting. (2) Future period rates assume scheduled maturities are reinvested at the new acquisition yield and asset balances / asset mix remain constant from 1Q 2019 expected balances. Future acquisition yields are based on forward yield curves and projected spreads as of 1Q 2019, as applicable. 12 1Q17 2Q17 3Q17 4Q17 1Q18 2Q18 3Q18 4Q18 1Q19 2Q19 3Q19 4Q19 1Q20 2Q20 3Q20 4Q20 1Q21 2Q21 3Q21 4Q21 1Q17 2Q17 3Q17 4Q17 1Q18 2Q18 3Q18 4Q18 1Q19 2Q19 3Q19 4Q19 1Q20 2Q20 3Q20 4Q20 1Q21 2Q21 3Q21 4Q21

Interest rate risk is effectively managed within investable space (1) Interest Rate Sensitivity Using Key Rate Duration 0-1Y 2Y 3Y 5Y 7Y 10Y 15Y 20Y 25Y 30Y Total Assets Portfolio Benchmark (Liabilities) (1) General Account excluding Closed Block Division. Approximate change in market value per 1 basis point change in interest rates as of February 28, 2019. Portfolio benchmark including surplus duration benchmark. 13Interest rate risk is effectively managed within investable space (1) Interest Rate Sensitivity Using Key Rate Duration 0-1Y 2Y 3Y 5Y 7Y 10Y 15Y 20Y 25Y 30Y Total Assets Portfolio Benchmark (Liabilities) (1) General Account excluding Closed Block Division. Approximate change in market value per 1 basis point change in interest rates as of February 28, 2019. Portfolio benchmark including surplus duration benchmark. 13

Alternatives provide long-term value and support tail liability cash flows +/- 1 Standard Diversified Alternatives Deviation 30-yr Treasury TIME 14 RETURNSAlternatives provide long-term value and support tail liability cash flows +/- 1 Standard Diversified Alternatives Deviation 30-yr Treasury TIME 14 RETURNS

Competitive advantage of PGIM’s expertise Strong General Account CIO’s Disciplined ALM & PGIM’s Expertise & Portfolio Performance that Risk Management Capabilities Meets or Exceeds Overall Pricing Targets • Origination of Private Assets • Fundamental Credit Analysis - (1) Averaging 30 years of experience • Market Expertise (1) Average investment experience of senior professionals in PGIM Fixed Income. 15Competitive advantage of PGIM’s expertise Strong General Account CIO’s Disciplined ALM & PGIM’s Expertise & Portfolio Performance that Risk Management Capabilities Meets or Exceeds Overall Pricing Targets • Origination of Private Assets • Fundamental Credit Analysis - (1) Averaging 30 years of experience • Market Expertise (1) Average investment experience of senior professionals in PGIM Fixed Income. 15

Investment portfolio outperformance (1) U.S. Financial Wellness Businesses Full Year 2018 • Domestic fixed income portfolio 1.22% 2.01% outperformed IG Public Corporates by 201bps • Outperformance driven by asset allocation and PGIM’s security selection 0.64% 0.15% Duration Allocation Security Total Selection Outperformance Security selection contributed 96bps over the 2016-2018 period (1) Includes Workplace Solutions and Individual Solutions. Chart compares total rate of return of fixed income assets of the U.S. Financial Wellness Businesses portfolio against a benchmark comprised of IG public corporate bonds. 16Investment portfolio outperformance (1) U.S. Financial Wellness Businesses Full Year 2018 • Domestic fixed income portfolio 1.22% 2.01% outperformed IG Public Corporates by 201bps • Outperformance driven by asset allocation and PGIM’s security selection 0.64% 0.15% Duration Allocation Security Total Selection Outperformance Security selection contributed 96bps over the 2016-2018 period (1) Includes Workplace Solutions and Individual Solutions. Chart compares total rate of return of fixed income assets of the U.S. Financial Wellness Businesses portfolio against a benchmark comprised of IG public corporate bonds. 16

Actions taken to position our portfolio defensively Rebalance credit rating profile within asset classes Continue to allocate to direct Reduce aggregate originations that spread duration enjoy stronger covenants Diversify Rebalance toward Use credit rotation and defensive and trades to avoid resilient asset anticipated credit improve classes & sectors migration quality 17Actions taken to position our portfolio defensively Rebalance credit rating profile within asset classes Continue to allocate to direct Reduce aggregate originations that spread duration enjoy stronger covenants Diversify Rebalance toward Use credit rotation and defensive and trades to avoid resilient asset anticipated credit improve classes & sectors migration quality 17

Well positioned for next downturn • Increase in government securities and credit quality within public bonds • 12% decrease in structured products (1) Portfolio Composition 36% 2007: $163B 2018: $416B +16% +3% 20% -12% 17% 16% -2% 13% 13% 12%12% 9% 9% 9% 8% 6% 5% 4% 4% 4% 3% Equity / Alts Other Mortgage Government IG Corporate, BIG Structured NAIC 1 NAIC 2 loans Corporate Securities Private Products Corporate, Corporate, Public Public (1) General Account excluding Closed Block Division as of December 31, 2018, on a U.S. GAAP carrying value basis. Other includes assets supporting experience-rated contractholder liabilities, fixed maturities - trading, policy loans, short-term investments, derivatives, and other miscellaneous assets. 18Well positioned for next downturn • Increase in government securities and credit quality within public bonds • 12% decrease in structured products (1) Portfolio Composition 36% 2007: $163B 2018: $416B +16% +3% 20% -12% 17% 16% -2% 13% 13% 12%12% 9% 9% 9% 8% 6% 5% 4% 4% 4% 3% Equity / Alts Other Mortgage Government IG Corporate, BIG Structured NAIC 1 NAIC 2 loans Corporate Securities Private Products Corporate, Corporate, Public Public (1) General Account excluding Closed Block Division as of December 31, 2018, on a U.S. GAAP carrying value basis. Other includes assets supporting experience-rated contractholder liabilities, fixed maturities - trading, policy loans, short-term investments, derivatives, and other miscellaneous assets. 18

Key Messages • Broadly diversified, high quality, and well matched investment portfolio • Prudential’s General Account enjoys a distinctive advantage from PGIM’s direct origination capabilities and asset management expertise • Disciplined framework for credit management and well positioned to weather the credit cycle 19Key Messages • Broadly diversified, high quality, and well matched investment portfolio • Prudential’s General Account enjoys a distinctive advantage from PGIM’s direct origination capabilities and asset management expertise • Disciplined framework for credit management and well positioned to weather the credit cycle 19

2019 Investor Day Ken Tanji Financial Management Executive Vice President and Chief Financial Officer 2019 Investor Day Ken Tanji Financial Management Executive Vice President and Chief Financial Officer

Key Messages • Strong financial performance over time • Diversified free cash flow and consistent capital deployment • Attractive value driven by integrated business mix 2Key Messages • Strong financial performance over time • Diversified free cash flow and consistent capital deployment • Attractive value driven by integrated business mix 2

Strong financial performance over time 10% 12.7% 8% 5-yr Adjusted BVPS Adjusted Operating 5-yr Adjusted EPS (2) (3) CAGR ROE CAGR, excluding (1) notable items (1) From 2013 to 2018; based on after-tax Adjusted Operating Income excluding notable items. See appendix for more information. (2) From 2013 to 2018; based on Adjusted Book Value. See appendix for more information. (3) As of year-end 2018 after-tax Adjusted Operating Income and average Adjusted Book Value. See appendix for more information. 3Strong financial performance over time 10% 12.7% 8% 5-yr Adjusted BVPS Adjusted Operating 5-yr Adjusted EPS (2) (3) CAGR ROE CAGR, excluding (1) notable items (1) From 2013 to 2018; based on after-tax Adjusted Operating Income excluding notable items. See appendix for more information. (2) From 2013 to 2018; based on Adjusted Book Value. See appendix for more information. (3) As of year-end 2018 after-tax Adjusted Operating Income and average Adjusted Book Value. See appendix for more information. 3
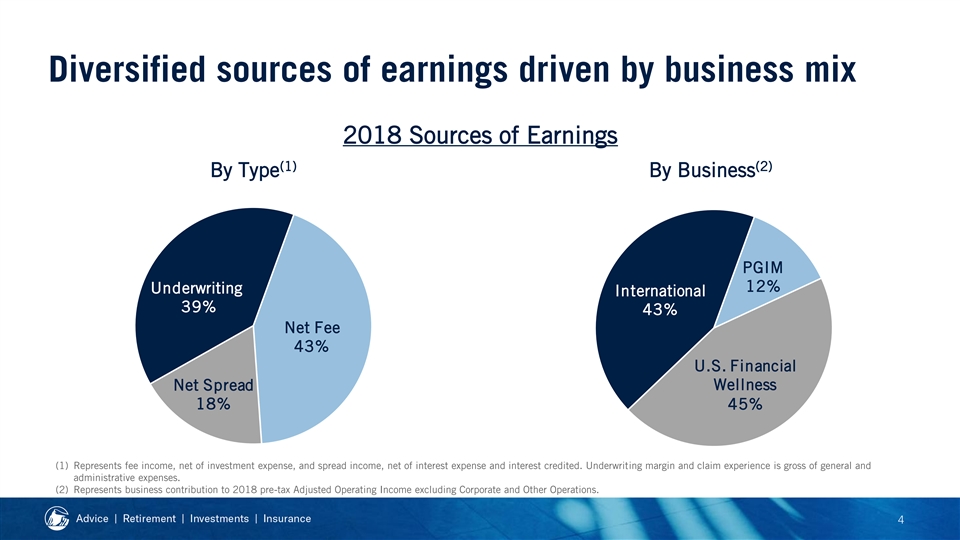
Diversified sources of earnings driven by business mix 2018 Sources of Earnings (1) (2) By Type By Business PGIM 12% Underwriting International 39% 43% Net Fee 43% U.S. Financial Wellness Net Spread 18% 45% (1) Represents fee income, net of investment expense, and spread income, net of interest expense and interest credited. Underwriting margin and claim experience is gross of general and administrative expenses. (2) Represents business contribution to 2018 pre-tax Adjusted Operating Income excluding Corporate and Other Operations. 4Diversified sources of earnings driven by business mix 2018 Sources of Earnings (1) (2) By Type By Business PGIM 12% Underwriting International 39% 43% Net Fee 43% U.S. Financial Wellness Net Spread 18% 45% (1) Represents fee income, net of investment expense, and spread income, net of interest expense and interest credited. Underwriting margin and claim experience is gross of general and administrative expenses. (2) Represents business contribution to 2018 pre-tax Adjusted Operating Income excluding Corporate and Other Operations. 4

Demonstrating financial strength and flexibility Company Measures March 31, 2019 Target vs. Target (1) Highly Liquid Assets $5.5 billion $3 – $5 billion ✓ Prudential Financial (2) Financial Leverage Ratio 24% <25% ✓ Capital December 31, 2018 Target vs. Target Prudential Insurance Company of America 385% >375% ✓ Regulatory Capital Prudential Holdings of Japan 971% >800% ✓ Ratio Prudential Annuities Life Assurance Company Well in Excess >CTE98 ✓ (1) Highly liquid assets predominantly include cash, short-term investments, U.S. Treasury securities, obligations of other U.S. government authorities and agencies, and / or foreign government bonds. (2) Financial leverage ratio represents capital debt divided by sum of capital debt and equity. Junior subordinated debt treated as 25% equity, 75% capital debt for purposes of calculation. Equity in calculation excludes non-controlling interest, accumulated other comprehensive income (except for pension and postretirement unrecognized costs), and impact of foreign currency exchange rate remeasurement. 5Demonstrating financial strength and flexibility Company Measures March 31, 2019 Target vs. Target (1) Highly Liquid Assets $5.5 billion $3 – $5 billion ✓ Prudential Financial (2) Financial Leverage Ratio 24% <25% ✓ Capital December 31, 2018 Target vs. Target Prudential Insurance Company of America 385% >375% ✓ Regulatory Capital Prudential Holdings of Japan 971% >800% ✓ Ratio Prudential Annuities Life Assurance Company Well in Excess >CTE98 ✓ (1) Highly liquid assets predominantly include cash, short-term investments, U.S. Treasury securities, obligations of other U.S. government authorities and agencies, and / or foreign government bonds. (2) Financial leverage ratio represents capital debt divided by sum of capital debt and equity. Junior subordinated debt treated as 25% equity, 75% capital debt for purposes of calculation. Equity in calculation excludes non-controlling interest, accumulated other comprehensive income (except for pension and postretirement unrecognized costs), and impact of foreign currency exchange rate remeasurement. 5

Diversified sources of cash flows support consistent capital deployment (2014 – 2018) ($ billions) (1) Free Cash Flow Capital Deployment $16.1 $14.9 As a % of after-tax AOI, 69% 64% excluding notable items PGIM M&A Debt $2.8 $1.2 Reduction Share $0.7 Repurchases U.S. $6.8 Financial (2) Corporate Wellness ($3.1) $8.3 Shareholder International Dividends $8.1 $6.2 (1) Management view of free cash flow includes dividends and returns of capital (+$18.1 billion), net receipts from capital related intercompany loans (+$4.4 billion), net distributions from subsidiaries associated with the Variable Annuities Recapture (+$1.0 billion), capital contributions to subsidiaries (-$8.6 billion), and adjusted for M&A funding (+$1.2 billion). (2) Represents Corporate expenses funded by the business segments and other net cash flows. 6Diversified sources of cash flows support consistent capital deployment (2014 – 2018) ($ billions) (1) Free Cash Flow Capital Deployment $16.1 $14.9 As a % of after-tax AOI, 69% 64% excluding notable items PGIM M&A Debt $2.8 $1.2 Reduction Share $0.7 Repurchases U.S. $6.8 Financial (2) Corporate Wellness ($3.1) $8.3 Shareholder International Dividends $8.1 $6.2 (1) Management view of free cash flow includes dividends and returns of capital (+$18.1 billion), net receipts from capital related intercompany loans (+$4.4 billion), net distributions from subsidiaries associated with the Variable Annuities Recapture (+$1.0 billion), capital contributions to subsidiaries (-$8.6 billion), and adjusted for M&A funding (+$1.2 billion). (2) Represents Corporate expenses funded by the business segments and other net cash flows. 6

Individual Annuities, an attractive financial profile Adjusted Operating (3) ($ billions) Dividends to PFI ROE and ROA Profile 19.0% 18.5% (1) ROE $1.2 $1.1 (2) 1.23% ROA 1.20% $0.3 $0.3 $0.3 $0.3 $0.3 2017 2018 2017 1Q18 2Q18 3Q18 4Q18 2018 1Q19 (1) Returns on an unlevered basis: Adjusted operating return on equity represents reported after-tax AOI as a percentage of average attributed equity excluding accumulated other comprehensive income. (2) Adjusted operating return on assets represents pre-tax AOI excluding notable items as a percentage of average daily separate account values. (3) Dividends include Prudential Annuities Life Assurance Company and Prudential Annuities Holding Company. 7Individual Annuities, an attractive financial profile Adjusted Operating (3) ($ billions) Dividends to PFI ROE and ROA Profile 19.0% 18.5% (1) ROE $1.2 $1.1 (2) 1.23% ROA 1.20% $0.3 $0.3 $0.3 $0.3 $0.3 2017 2018 2017 1Q18 2Q18 3Q18 4Q18 2018 1Q19 (1) Returns on an unlevered basis: Adjusted operating return on equity represents reported after-tax AOI as a percentage of average attributed equity excluding accumulated other comprehensive income. (2) Adjusted operating return on assets represents pre-tax AOI excluding notable items as a percentage of average daily separate account values. (3) Dividends include Prudential Annuities Life Assurance Company and Prudential Annuities Holding Company. 7
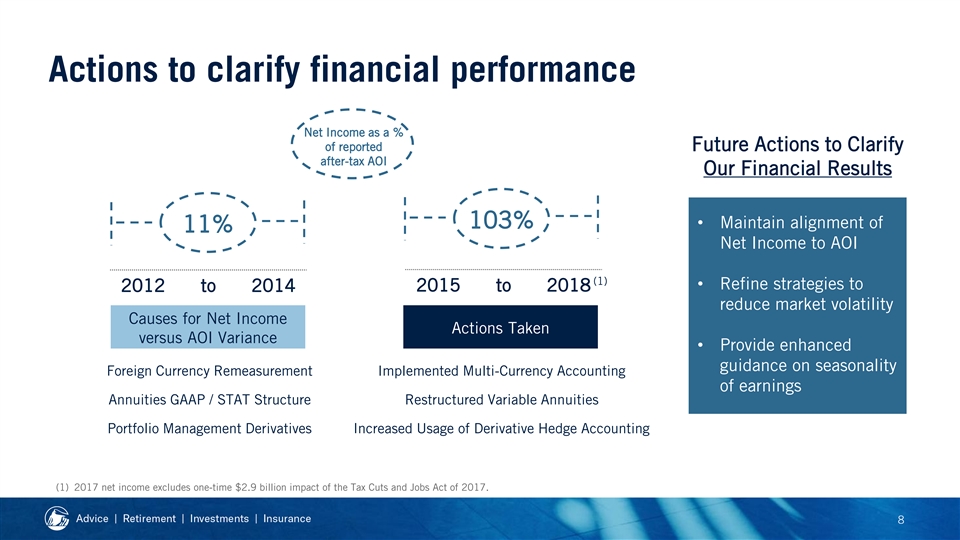
Actions to clarify financial performance Net Income as a % of reported Future Actions to Clarify after-tax AOI Our Financial Results 103%• Maintain alignment of 11% Net Income to AOI (1) • Refine strategies to 2015 to 2018 2012 to 2014 reduce market volatility Causes for Net Income Actions Taken versus AOI Variance • Provide enhanced guidance on seasonality Foreign Currency Remeasurement Implemented Multi-Currency Accounting of earnings Annuities GAAP / STAT Structure Restructured Variable Annuities Portfolio Management Derivatives Increased Usage of Derivative Hedge Accounting (1) 2017 net income excludes one-time $2.9 billion impact of the Tax Cuts and Jobs Act of 2017. 8Actions to clarify financial performance Net Income as a % of reported Future Actions to Clarify after-tax AOI Our Financial Results 103%• Maintain alignment of 11% Net Income to AOI (1) • Refine strategies to 2015 to 2018 2012 to 2014 reduce market volatility Causes for Net Income Actions Taken versus AOI Variance • Provide enhanced guidance on seasonality Foreign Currency Remeasurement Implemented Multi-Currency Accounting of earnings Annuities GAAP / STAT Structure Restructured Variable Annuities Portfolio Management Derivatives Increased Usage of Derivative Hedge Accounting (1) 2017 net income excludes one-time $2.9 billion impact of the Tax Cuts and Jobs Act of 2017. 8

Attractive value driven by integrated business mix Upside Comparable Potential Business (1) P/E Multiple P/E Multiple U.S. Financial High-Single Digit Wellness Implied Low-Double Digit Low-Double PGIM Digit Low-Double Digit International vs. (2) Enterprise Value Drivers Current 7x • Strategic mix of high quality businesses and complementary capabilities • Uniquely positioned for growth opportunities • Maintain consistent ROE and generation of cash flows (1) Represents peer next twelve month consensus price-to-earnings multiples as of May 2019. Source: Bloomberg. See “Non-GAAP Measures and Other Disclosures” in the appendix for important information. (2) Represents Prudential Financial’s next twelve month consensus price-to-earnings multiple as of May 2019. Source: Bloomberg. See “Non-GAAP Measures and Other Disclosures” in the appendix for important information. 9Attractive value driven by integrated business mix Upside Comparable Potential Business (1) P/E Multiple P/E Multiple U.S. Financial High-Single Digit Wellness Implied Low-Double Digit Low-Double PGIM Digit Low-Double Digit International vs. (2) Enterprise Value Drivers Current 7x • Strategic mix of high quality businesses and complementary capabilities • Uniquely positioned for growth opportunities • Maintain consistent ROE and generation of cash flows (1) Represents peer next twelve month consensus price-to-earnings multiples as of May 2019. Source: Bloomberg. See “Non-GAAP Measures and Other Disclosures” in the appendix for important information. (2) Represents Prudential Financial’s next twelve month consensus price-to-earnings multiple as of May 2019. Source: Bloomberg. See “Non-GAAP Measures and Other Disclosures” in the appendix for important information. 9

Key Messages • Strong financial performance over time • Diversified free cash flow and consistent capital deployment • Attractive value driven by integrated business mix 10Key Messages • Strong financial performance over time • Diversified free cash flow and consistent capital deployment • Attractive value driven by integrated business mix 10

2019 Investor Day P R U D E N T I A L T O W E R N E W A R K , N E W J E R S E Y Appendix2019 Investor Day P R U D E N T I A L T O W E R N E W A R K , N E W J E R S E Y Appendix

Non-GAAP Measures and Other Disclosures This presentation may include references to adjusted operating income, adjusted book value, and adjusted operating return on equity, which is based on adjusted operating income and adjusted book value. This presentation may also include references to PGIM’s adjusted revenue. Consolidated adjusted operating income, adjusted book value, and PGIM’s adjusted revenue are not calculated based on accounting principles generally accepted in the United States of America (GAAP). For additional information about adjusted operating income, adjusted book value, and adjusted operating return on equity and the comparable GAAP measures, including reconciliations between the comparable measures, please refer to our quarterly results news releases, which are available on our website at www.investor.prudential.com. Reconciliations of these measures and PGIM’s adjusted revenues are also included as part of this presentation. Consensus estimates or forecasts referenced in this presentation are provided for informational purposes and do not represent the Company’s estimates or forecasts. The Company does not by its reference to such information imply its endorsement or concurrence. 2Non-GAAP Measures and Other Disclosures This presentation may include references to adjusted operating income, adjusted book value, and adjusted operating return on equity, which is based on adjusted operating income and adjusted book value. This presentation may also include references to PGIM’s adjusted revenue. Consolidated adjusted operating income, adjusted book value, and PGIM’s adjusted revenue are not calculated based on accounting principles generally accepted in the United States of America (GAAP). For additional information about adjusted operating income, adjusted book value, and adjusted operating return on equity and the comparable GAAP measures, including reconciliations between the comparable measures, please refer to our quarterly results news releases, which are available on our website at www.investor.prudential.com. Reconciliations of these measures and PGIM’s adjusted revenues are also included as part of this presentation. Consensus estimates or forecasts referenced in this presentation are provided for informational purposes and do not represent the Company’s estimates or forecasts. The Company does not by its reference to such information imply its endorsement or concurrence. 2

U.S. Financial Wellness Disclosure LINK by Prudential is an umbrella marketing name for Prudential Customer Solutions LLC (“PCS”), Prudential Annuities Distributors, Inc., and various subsidiaries of The Prudential Insurance Company of America. Investment advisory products and services are made available through PCS, an SEC registered investment adviser. Life insurance and annuities are issued by The Prudential Insurance Company of America, Pruco Life Insurance Company (except in New York, issued by Pruco Life Insurance Company of New Jersey), Newark, NJ (main office) and are sold through Prudential LINK financial representatives who are licensed insurance agents appointed to represent The Prudential Insurance Company of America and its affiliated insurers. Variable annuities are distributed by Prudential Annuities Distributors, Inc., Shelton, CT and sold by registered representatives of Pruco Securities, LLC, member FINRA, SIPC. 3U.S. Financial Wellness Disclosure LINK by Prudential is an umbrella marketing name for Prudential Customer Solutions LLC (“PCS”), Prudential Annuities Distributors, Inc., and various subsidiaries of The Prudential Insurance Company of America. Investment advisory products and services are made available through PCS, an SEC registered investment adviser. Life insurance and annuities are issued by The Prudential Insurance Company of America, Pruco Life Insurance Company (except in New York, issued by Pruco Life Insurance Company of New Jersey), Newark, NJ (main office) and are sold through Prudential LINK financial representatives who are licensed insurance agents appointed to represent The Prudential Insurance Company of America and its affiliated insurers. Variable annuities are distributed by Prudential Annuities Distributors, Inc., Shelton, CT and sold by registered representatives of Pruco Securities, LLC, member FINRA, SIPC. 3
PGIM Disclosures This information has been prepared by PGIM, Inc.( PGIM ). PGIM is the primary asset management business of Prudential Financial, Inc.(“PFI”) and is a registered investment advisor with the US Securities and Exchange Commission. PFI, a company with corporate headquarters in the US, is not affiliated in any manner with Prudential plc, a company incorporated in the United Kingdom. These materials represent the views, opinions and recommendations of the author(s) regarding the economic conditions, asset classes, securities, issuers, or financial instruments referenced herein. Distribution of this information to any person other than the person to whom it was originally delivered and to such person’s advisers is unauthorized, and any reproduction of these materials, in whole or in part, or the divulgence of any of the contents hereof, without prior consent of PGIM, is prohibited. Certain information contained herein has been obtained from sources that PGIM believes to be reliable as of the date presented; however, PGIM cannot guarantee the accuracy of such information, assure its completeness, or warrant such information will not be changed. The information contained herein is current as of the date of issuance (or such earlier date as referenced herein) and is subject to change without notice. PGIM has no obligation to update any or all of such information; nor do we make any express or implied warranties or representations as to the completeness or accuracy or accept responsibility for errors. These materials are not intended as an offer or solicitation with respect to the purchase or sale of any security or other financial instrument or any investment management services and should not be used as the basis for any investment decision. Past performance is not a guarantee or a reliable indicator of future results. No liability whatsoever is accepted for any loss (whether direct, indirect, or consequential) that may arise from any use of the information contained in or derived from this report. These materials do not take into account individual client circumstances, objectives, or needs, and are not intended as recommendations of particular securities, financial instruments, or strategies to particular clients or prospects. No determination has been made regarding the suitability of any securities, financial instruments, or strategies for particular clients or prospects. For any securities or financial instruments mentioned herein, the recipient(s) of this report must make their own independent decisions. Distribution of this information to any person other than the person to whom it was originally delivered is unauthorized and any reproduction of these materials, in whole and in part, without prior consent of PGIM is prohibited. 4PGIM Disclosures This information has been prepared by PGIM, Inc.( PGIM ). PGIM is the primary asset management business of Prudential Financial, Inc.(“PFI”) and is a registered investment advisor with the US Securities and Exchange Commission. PFI, a company with corporate headquarters in the US, is not affiliated in any manner with Prudential plc, a company incorporated in the United Kingdom. These materials represent the views, opinions and recommendations of the author(s) regarding the economic conditions, asset classes, securities, issuers, or financial instruments referenced herein. Distribution of this information to any person other than the person to whom it was originally delivered and to such person’s advisers is unauthorized, and any reproduction of these materials, in whole or in part, or the divulgence of any of the contents hereof, without prior consent of PGIM, is prohibited. Certain information contained herein has been obtained from sources that PGIM believes to be reliable as of the date presented; however, PGIM cannot guarantee the accuracy of such information, assure its completeness, or warrant such information will not be changed. The information contained herein is current as of the date of issuance (or such earlier date as referenced herein) and is subject to change without notice. PGIM has no obligation to update any or all of such information; nor do we make any express or implied warranties or representations as to the completeness or accuracy or accept responsibility for errors. These materials are not intended as an offer or solicitation with respect to the purchase or sale of any security or other financial instrument or any investment management services and should not be used as the basis for any investment decision. Past performance is not a guarantee or a reliable indicator of future results. No liability whatsoever is accepted for any loss (whether direct, indirect, or consequential) that may arise from any use of the information contained in or derived from this report. These materials do not take into account individual client circumstances, objectives, or needs, and are not intended as recommendations of particular securities, financial instruments, or strategies to particular clients or prospects. No determination has been made regarding the suitability of any securities, financial instruments, or strategies for particular clients or prospects. For any securities or financial instruments mentioned herein, the recipient(s) of this report must make their own independent decisions. Distribution of this information to any person other than the person to whom it was originally delivered is unauthorized and any reproduction of these materials, in whole and in part, without prior consent of PGIM is prohibited. 4

PGIM Disclosures (continued) © 2019 Morningstar, Inc. All rights reserved. The information contained herein (1) is proprietary to Morningstar and/or its content providers; (2) may not be copied or distributed; and (3) is not warranted to be accurate, complete, or timely. Neither Morningstar nor its content providers are responsible for any damages or losses arising from any use of this information. Past performance does not guarantee future results. Prudential does not review the Morningstar data and, for mutual fund performance, you should check the fund’s current prospectus for the most up-to-date information concerning loads, fees, and expenses. Securities products and services are distributed by Prudential Investment Management Services LLC, a Prudential Financial company and member SIPC. QMA, Jennison Associates and PGIM, Inc. are registered investment advisors and Prudential Financial companies. QMA is the primary business name of Quantitative Management Associates LLC, a wholly owned subsidiary of PGIM, Inc. PGIM Fixed Income and PGIM Real Estate are units of PGIM, Inc. © 2019 Prudential Financial, Inc. and its related entities. QMA, Quantitative Management Associates, Jennison Associates, Jennison, PGIM Real Estate, the Prudential logo, and the Rock symbol are service marks of Prudential Financial, Inc. and its related entities, registered in many jurisdictions worldwide. These materials are for informational or educational purposes only. The information is not intended as investment advice and is not a recommendation about managing or investing assets. In providing these materials, PGIM is not acting as your fiduciary. Mutual funds are not insured by the FDIC or any federal government agency, are not a deposit of or guaranteed by any bank or any bank affiliate, and may lose value. 5PGIM Disclosures (continued) © 2019 Morningstar, Inc. All rights reserved. The information contained herein (1) is proprietary to Morningstar and/or its content providers; (2) may not be copied or distributed; and (3) is not warranted to be accurate, complete, or timely. Neither Morningstar nor its content providers are responsible for any damages or losses arising from any use of this information. Past performance does not guarantee future results. Prudential does not review the Morningstar data and, for mutual fund performance, you should check the fund’s current prospectus for the most up-to-date information concerning loads, fees, and expenses. Securities products and services are distributed by Prudential Investment Management Services LLC, a Prudential Financial company and member SIPC. QMA, Jennison Associates and PGIM, Inc. are registered investment advisors and Prudential Financial companies. QMA is the primary business name of Quantitative Management Associates LLC, a wholly owned subsidiary of PGIM, Inc. PGIM Fixed Income and PGIM Real Estate are units of PGIM, Inc. © 2019 Prudential Financial, Inc. and its related entities. QMA, Quantitative Management Associates, Jennison Associates, Jennison, PGIM Real Estate, the Prudential logo, and the Rock symbol are service marks of Prudential Financial, Inc. and its related entities, registered in many jurisdictions worldwide. These materials are for informational or educational purposes only. The information is not intended as investment advice and is not a recommendation about managing or investing assets. In providing these materials, PGIM is not acting as your fiduciary. Mutual funds are not insured by the FDIC or any federal government agency, are not a deposit of or guaranteed by any bank or any bank affiliate, and may lose value. 5

Source of Rankings Business Market Position Source #1 PRT Assets Based on Total Assets, LIMRA 4Q 2018 U.S. Group Annuity Risk Transfer Survey. #3 VA Sales Based on U.S. Variable Annuity advisor-sold sales as of 9/30/2018. Source: Morningstar. Top 5 Group Life & Disability Based on in-force premiums, 2017 LIMRA Studies. U.S. Financial Wellness Premiums Based on new annualized premiums, LIMRA 4Q 2018 U.S. Individual Life Insurance Sales Top 10 Individual Life Sales Survey. Top 10 Retirement DC Manager Based on DC Recordkeeping Assets, Pension & Investments, May 2018. Based on Pensions & Investments Largest Money Managers, May 27, 2019. AUM as of Top 10 Global AUM December 31, 2018. Based on Willis Towers Watson Global Alternatives Survey, July 2017. AUM as of December Top 3 Alternatives Asset Manager 2016. PGIM IPE Real Assets, Real Estate Managers by Worldwide AUM as of June 30, 2018. Publication Top 3 Real Estate Manager as of November/December 2018 issue. Top 3 Assets in Investment Grade Investment Grade Credit Manager Survey, IPE International Publishers Limited, January Credit Strategies 2018. AUM as of September 30, 2017. Market share data is based on Prudential estimates developed from publicly available data #1 New Business Face Amount in International of Japanese insurance companies. Source: Life Insurance Association of Japan (LIAJ) Japan Insurance Business in 2017 for the fiscal year ended March 31, 2018. 6Source of Rankings Business Market Position Source #1 PRT Assets Based on Total Assets, LIMRA 4Q 2018 U.S. Group Annuity Risk Transfer Survey. #3 VA Sales Based on U.S. Variable Annuity advisor-sold sales as of 9/30/2018. Source: Morningstar. Top 5 Group Life & Disability Based on in-force premiums, 2017 LIMRA Studies. U.S. Financial Wellness Premiums Based on new annualized premiums, LIMRA 4Q 2018 U.S. Individual Life Insurance Sales Top 10 Individual Life Sales Survey. Top 10 Retirement DC Manager Based on DC Recordkeeping Assets, Pension & Investments, May 2018. Based on Pensions & Investments Largest Money Managers, May 27, 2019. AUM as of Top 10 Global AUM December 31, 2018. Based on Willis Towers Watson Global Alternatives Survey, July 2017. AUM as of December Top 3 Alternatives Asset Manager 2016. PGIM IPE Real Assets, Real Estate Managers by Worldwide AUM as of June 30, 2018. Publication Top 3 Real Estate Manager as of November/December 2018 issue. Top 3 Assets in Investment Grade Investment Grade Credit Manager Survey, IPE International Publishers Limited, January Credit Strategies 2018. AUM as of September 30, 2017. Market share data is based on Prudential estimates developed from publicly available data #1 New Business Face Amount in International of Japanese insurance companies. Source: Life Insurance Association of Japan (LIAJ) Japan Insurance Business in 2017 for the fiscal year ended March 31, 2018. 6

International FX and Interest Rate Adjustments ($ billions) $4.0 ~5% $3.4 $3.2 CAGR (1) (2) 2013 AOI Business Activity FX Interest Rates 2018 AOI ex. Notable Items ex. Notable Items Yen Plan Rate: 80 111 Avg. 30-Year Japanese 1.70% 0.77% Government Bond Rate: (1) Represents foreign exchange translation impact to 2018 AOI excluding notable items based on the difference in foreign currency plan rates between 2013 and 2018. (2) Represents impact to 2018 AOI excluding notable items from the change in interest rates between 2013 and 2018. 7International FX and Interest Rate Adjustments ($ billions) $4.0 ~5% $3.4 $3.2 CAGR (1) (2) 2013 AOI Business Activity FX Interest Rates 2018 AOI ex. Notable Items ex. Notable Items Yen Plan Rate: 80 111 Avg. 30-Year Japanese 1.70% 0.77% Government Bond Rate: (1) Represents foreign exchange translation impact to 2018 AOI excluding notable items based on the difference in foreign currency plan rates between 2013 and 2018. (2) Represents impact to 2018 AOI excluding notable items from the change in interest rates between 2013 and 2018. 7

(1) Reconciliations between AOI and the Comparable GAAP Measure Year Ended ($ millions, except per share data) 2018 2013 Net income (loss) attributable to Prudential Financial, Inc. $ 4,074 $ (713) Income attributable to noncontrolling interests 14 107 Net income (loss) 4,088 (606) Less: Income (loss) from discontinued operations, net of taxes - 7 Income (loss) from continuing operations (after-tax) 4,088 (613) Less: Earnings attributable to noncontrolling interests 14 107 Income (loss) attributable to Prudential Financial, Inc. 4,074 (720) Less: Equity in earnings of operating joint ventures, net of taxes and earnings attributable to noncontrolling interests 62 (48) Income (loss) (after-tax) before equity in earnings of operating joint ventures 4,012 (672) Less: Reconciling Items: Realized investment gains (losses), net, and related charges and adjustments 303 (8,149) Investment gains (losses) on assets supporting experience-rated contractholder liabilities, net (863) (250) Change in experience-rated contractholder liabilities due to asset value changes 710 227 Divested and Run-off Businesses: Closed Block Division (62) - Other Divested and Run-off Businesses (1,535) 29 Equity in earnings of operating joint ventures and earnings attributable to noncontrolling interests (87) 28 Total reconciling items, before income taxes (1,534) (8,115) Less: Income taxes, not applicable to adjusted operating income (527) (2,857) Total reconciling items, after income taxes (1,007) (5,258) After-tax adjusted operating income 5,019 4,586 Income taxes, applicable to adjusted operating income 1,349 1,783 Adjusted operating income before income taxes $ 6,368 $ 6,369 After-tax adjusted operating income per share $ 11.69 $ 9.67 (1) Net Income Return on Equity 8.2% -2.0% (1) Adjusted Operating Return on Equity 12.7% 16.4% (1) Represents results of the former Financial Services Businesses (FSB) for 2013. Net income return on equity based on year-to-date annualized after-tax net income and average GAAP equity of $49,928 and $35,154 as of year-end 2018 and 2013, respectively. Adjusted operating return on equity based on year-to-date annualized after-tax adjusted operating income and average adjusted book value excluding accumulated other comprehensive income and adjusted to remove amount included for remeasurement of foreign currency of $39,492 and $27,896 as of year-end 2018 and 2013, respectively. 8(1) Reconciliations between AOI and the Comparable GAAP Measure Year Ended ($ millions, except per share data) 2018 2013 Net income (loss) attributable to Prudential Financial, Inc. $ 4,074 $ (713) Income attributable to noncontrolling interests 14 107 Net income (loss) 4,088 (606) Less: Income (loss) from discontinued operations, net of taxes - 7 Income (loss) from continuing operations (after-tax) 4,088 (613) Less: Earnings attributable to noncontrolling interests 14 107 Income (loss) attributable to Prudential Financial, Inc. 4,074 (720) Less: Equity in earnings of operating joint ventures, net of taxes and earnings attributable to noncontrolling interests 62 (48) Income (loss) (after-tax) before equity in earnings of operating joint ventures 4,012 (672) Less: Reconciling Items: Realized investment gains (losses), net, and related charges and adjustments 303 (8,149) Investment gains (losses) on assets supporting experience-rated contractholder liabilities, net (863) (250) Change in experience-rated contractholder liabilities due to asset value changes 710 227 Divested and Run-off Businesses: Closed Block Division (62) - Other Divested and Run-off Businesses (1,535) 29 Equity in earnings of operating joint ventures and earnings attributable to noncontrolling interests (87) 28 Total reconciling items, before income taxes (1,534) (8,115) Less: Income taxes, not applicable to adjusted operating income (527) (2,857) Total reconciling items, after income taxes (1,007) (5,258) After-tax adjusted operating income 5,019 4,586 Income taxes, applicable to adjusted operating income 1,349 1,783 Adjusted operating income before income taxes $ 6,368 $ 6,369 After-tax adjusted operating income per share $ 11.69 $ 9.67 (1) Net Income Return on Equity 8.2% -2.0% (1) Adjusted Operating Return on Equity 12.7% 16.4% (1) Represents results of the former Financial Services Businesses (FSB) for 2013. Net income return on equity based on year-to-date annualized after-tax net income and average GAAP equity of $49,928 and $35,154 as of year-end 2018 and 2013, respectively. Adjusted operating return on equity based on year-to-date annualized after-tax adjusted operating income and average adjusted book value excluding accumulated other comprehensive income and adjusted to remove amount included for remeasurement of foreign currency of $39,492 and $27,896 as of year-end 2018 and 2013, respectively. 8

Reconciliations between Adjusted Book Value and the (1) Comparable GAAP Measure December 31, ($ millions, except per share data) 2018 2013 GAAP book value $ 48,617 $ 33,885 Less: Accumulated other comprehensive income (AOCI) 10,906 8,586 GAAP book value excluding AOCI 37,711 25,299 Less: Cumulative effect of remeasurement of foreign currency (2,344) (2,818) Adjusted book value $ 40,055 $ 28,117 Number of diluted shares 422.2 468.7 (1) GAAP book value per Common share - diluted $ 116.34 $ 72.30 (1) GAAP book value excluding AOCI per Common share - diluted $ 90.50 $ 53.98 (1) Adjusted book value per Common share - diluted $ 96.06 $ 59.99 (1) Represents results of the former FSB for 2013. As of December 31, 2018, exchangeable surplus notes are dilutive when book value per share is greater than $82.16 (equivalent to an additional 6.09 million in diluted shares and an increase of $500 million in equity). Book value per share as of December 31, 2013 excludes the impact of exchangeable surplus notes due to the anti-dilutive impact of conversion. 9Reconciliations between Adjusted Book Value and the (1) Comparable GAAP Measure December 31, ($ millions, except per share data) 2018 2013 GAAP book value $ 48,617 $ 33,885 Less: Accumulated other comprehensive income (AOCI) 10,906 8,586 GAAP book value excluding AOCI 37,711 25,299 Less: Cumulative effect of remeasurement of foreign currency (2,344) (2,818) Adjusted book value $ 40,055 $ 28,117 Number of diluted shares 422.2 468.7 (1) GAAP book value per Common share - diluted $ 116.34 $ 72.30 (1) GAAP book value excluding AOCI per Common share - diluted $ 90.50 $ 53.98 (1) Adjusted book value per Common share - diluted $ 96.06 $ 59.99 (1) Represents results of the former FSB for 2013. As of December 31, 2018, exchangeable surplus notes are dilutive when book value per share is greater than $82.16 (equivalent to an additional 6.09 million in diluted shares and an increase of $500 million in equity). Book value per share as of December 31, 2013 excludes the impact of exchangeable surplus notes due to the anti-dilutive impact of conversion. 9
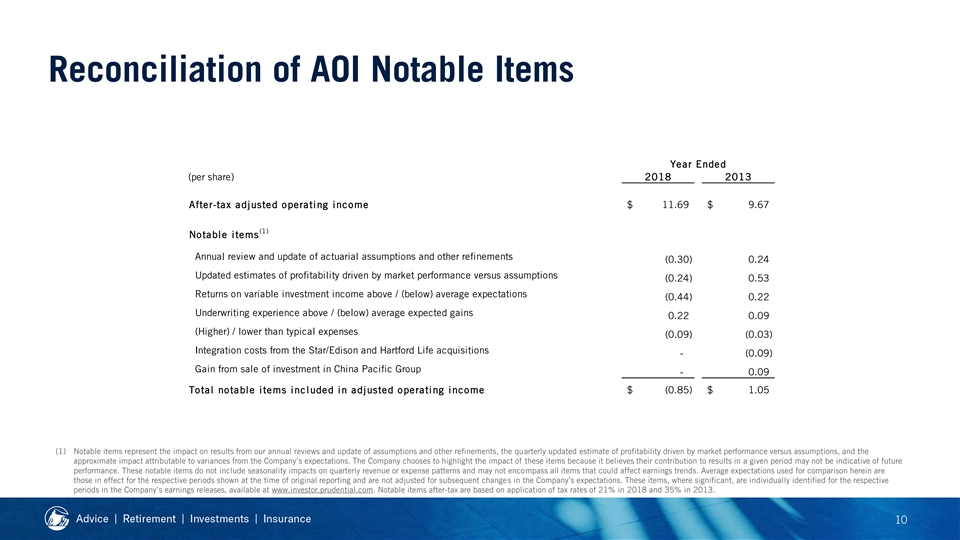
Reconciliation of AOI Notable Items Year Ended (per share) 2018 2013 After-tax adjusted operating income $ 11.69 $ 9.67 (1) Notable items Annual review and update of actuarial assumptions and other refinements (0.30) 0.24 Updated estimates of profitability driven by market performance versus assumptions (0.24) 0.53 Returns on variable investment income above / (below) average expectations (0.44) 0.22 Underwriting experience above / (below) average expected gains 0.22 0.09 (Higher) / lower than typical expenses (0.09) (0.03) Integration costs from the Star/Edison and Hartford Life acquisitions - (0.09) Gain from sale of investment in China Pacific Group - 0.09 Total notable items included in adjusted operating income $ (0.85) $ 1.05 (1) Notable items represent the impact on results from our annual reviews and update of assumptions and other refinements, the quarterly updated estimate of profitability driven by market performance versus assumptions, and the approximate impact attributable to variances from the Company’s expectations. The Company chooses to highlight the impact of these items because it believes their contribution to results in a given period may not be indicative of future performance. These notable items do not include seasonality impacts on quarterly revenue or expense patterns and may not encompass all items that could affect earnings trends. Average expectations used for comparison herein are those in effect for the respective periods shown at the time of original reporting and are not adjusted for subsequent changes in the Company’s expectations. These items, where significant, are individually identified for the respective periods in the Company’s earnings releases, available at www.investor.prudential.com. Notable items after-tax are based on application of tax rates of 21% in 2018 and 35% in 2013. 10Reconciliation of AOI Notable Items Year Ended (per share) 2018 2013 After-tax adjusted operating income $ 11.69 $ 9.67 (1) Notable items Annual review and update of actuarial assumptions and other refinements (0.30) 0.24 Updated estimates of profitability driven by market performance versus assumptions (0.24) 0.53 Returns on variable investment income above / (below) average expectations (0.44) 0.22 Underwriting experience above / (below) average expected gains 0.22 0.09 (Higher) / lower than typical expenses (0.09) (0.03) Integration costs from the Star/Edison and Hartford Life acquisitions - (0.09) Gain from sale of investment in China Pacific Group - 0.09 Total notable items included in adjusted operating income $ (0.85) $ 1.05 (1) Notable items represent the impact on results from our annual reviews and update of assumptions and other refinements, the quarterly updated estimate of profitability driven by market performance versus assumptions, and the approximate impact attributable to variances from the Company’s expectations. The Company chooses to highlight the impact of these items because it believes their contribution to results in a given period may not be indicative of future performance. These notable items do not include seasonality impacts on quarterly revenue or expense patterns and may not encompass all items that could affect earnings trends. Average expectations used for comparison herein are those in effect for the respective periods shown at the time of original reporting and are not adjusted for subsequent changes in the Company’s expectations. These items, where significant, are individually identified for the respective periods in the Company’s earnings releases, available at www.investor.prudential.com. Notable items after-tax are based on application of tax rates of 21% in 2018 and 35% in 2013. 10

Reconciliations of U.S. Financial Wellness AOI Notable Items Year Ended ($ millions) 2018 2013 U.S. Financial Wellness pre-tax adjusted operating income $ 3,426 $ 3,864 (1) Notable items Annual review and update of actuarial assumptions and other refinements (82) 369 Updated estimates of profitability driven by market performance versus assumptions (106) 395 Returns on variable investment income above / (below) average expectations (160) 90 Underwriting experience above / (below) average expected gains 105 41 (Higher) / lower than typical expenses (65) - Integration costs from the Hartford Life acquisition - (51) Total notable items included in adjusted operating income (308) 844 U.S. Financial Wellness pre-tax adjusted operating income, excluding notable items $ 3,734 $ 3,020 U.S. Financial Wellness consists of our U.S. Workplace Solutions and U.S. Individual Solutions divisions. The U.S. Workplace Solutions division consists of our Retirement and Group Insurance segments. The U.S. Individual Solutions division consists of our Individual Annuities and Individual Life segments. The results of each of these segments are included in our Annual Reports on Form 10-K and Quarterly Reports on Form 10-Q, which are available on our website at www.investor.prudential.com. (1) Notable items represent the impact on results from our annual reviews and update of assumptions and other refinements, the quarterly updated estimate of profitability driven by market performance versus assumptions, and the approximate impact attributable to variances from the Company’s expectations. The Company chooses to highlight the impact of these items because it believes their contribution to results in a given period may not be indicative of future performance. These notable items do not include seasonality impacts on quarterly revenue or expense patterns and may not encompass all items that could affect earnings trends. Average expectations used for comparison herein are those in effect for the respective periods shown at the time of original reporting and are not adjusted for subsequent changes in the Company’s expectations. 11Reconciliations of U.S. Financial Wellness AOI Notable Items Year Ended ($ millions) 2018 2013 U.S. Financial Wellness pre-tax adjusted operating income $ 3,426 $ 3,864 (1) Notable items Annual review and update of actuarial assumptions and other refinements (82) 369 Updated estimates of profitability driven by market performance versus assumptions (106) 395 Returns on variable investment income above / (below) average expectations (160) 90 Underwriting experience above / (below) average expected gains 105 41 (Higher) / lower than typical expenses (65) - Integration costs from the Hartford Life acquisition - (51) Total notable items included in adjusted operating income (308) 844 U.S. Financial Wellness pre-tax adjusted operating income, excluding notable items $ 3,734 $ 3,020 U.S. Financial Wellness consists of our U.S. Workplace Solutions and U.S. Individual Solutions divisions. The U.S. Workplace Solutions division consists of our Retirement and Group Insurance segments. The U.S. Individual Solutions division consists of our Individual Annuities and Individual Life segments. The results of each of these segments are included in our Annual Reports on Form 10-K and Quarterly Reports on Form 10-Q, which are available on our website at www.investor.prudential.com. (1) Notable items represent the impact on results from our annual reviews and update of assumptions and other refinements, the quarterly updated estimate of profitability driven by market performance versus assumptions, and the approximate impact attributable to variances from the Company’s expectations. The Company chooses to highlight the impact of these items because it believes their contribution to results in a given period may not be indicative of future performance. These notable items do not include seasonality impacts on quarterly revenue or expense patterns and may not encompass all items that could affect earnings trends. Average expectations used for comparison herein are those in effect for the respective periods shown at the time of original reporting and are not adjusted for subsequent changes in the Company’s expectations. 11

Reconciliations of International AOI Notable Items Year Ended ($ millions) 2018 2013 International pre-tax adjusted operating income $ 3,266 $ 3,152 (1) Notable items Annual review and update of actuarial assumptions and other refinements (81) (190) Updated estimates of profitability driven by market performance versus assumptions (25) - Returns on variable investment income above / (below) average expectations (75) 65 Underwriting experience above / (below) average expected gains 30 27 Integration costs from the Star/Edison acquisition - (28) Gain from sale of investment in China Pacific Group - 66 Total notable items included in adjusted operating income (151) (60) International pre-tax adjusted operating income, excluding notable items $ 3,417 $ 3,212 (1) Notable items represent the impact on results from our annual reviews and update of assumptions and other refinements, the quarterly updated estimate of profitability driven by market performance versus assumptions, and the approximate impact attributable to variances from the Company’s expectations. The Company chooses to highlight the impact of these items because it believes their contribution to results in a given period may not be indicative of future performance. These notable items do not include seasonality impacts on quarterly revenue or expense patterns and may not encompass all items that could affect earnings trends. Average expectations used for comparison herein are those in effect for the respective periods shown at the time of original reporting and are not adjusted for subsequent changes in the Company’s expectations. 12Reconciliations of International AOI Notable Items Year Ended ($ millions) 2018 2013 International pre-tax adjusted operating income $ 3,266 $ 3,152 (1) Notable items Annual review and update of actuarial assumptions and other refinements (81) (190) Updated estimates of profitability driven by market performance versus assumptions (25) - Returns on variable investment income above / (below) average expectations (75) 65 Underwriting experience above / (below) average expected gains 30 27 Integration costs from the Star/Edison acquisition - (28) Gain from sale of investment in China Pacific Group - 66 Total notable items included in adjusted operating income (151) (60) International pre-tax adjusted operating income, excluding notable items $ 3,417 $ 3,212 (1) Notable items represent the impact on results from our annual reviews and update of assumptions and other refinements, the quarterly updated estimate of profitability driven by market performance versus assumptions, and the approximate impact attributable to variances from the Company’s expectations. The Company chooses to highlight the impact of these items because it believes their contribution to results in a given period may not be indicative of future performance. These notable items do not include seasonality impacts on quarterly revenue or expense patterns and may not encompass all items that could affect earnings trends. Average expectations used for comparison herein are those in effect for the respective periods shown at the time of original reporting and are not adjusted for subsequent changes in the Company’s expectations. 12

Reconciliation of PGIM Adjusted Revenue Year Ended ($ millions) 2018 2010 Total revenue attributable to the PGIM Division $ 3,294 $ 1,973 Less: Passthrough distribution revenue 112 120 Less: Revenue associated with consolidations 46 31 Total adjusted revenue attributable to the PGIM Division $ 3,135 $ 1,822 Adjusted operating income attributable to the PGIM Division $ 959 $ 523 PGIM adjusted operating margin 30.6% 28.7% 13Reconciliation of PGIM Adjusted Revenue Year Ended ($ millions) 2018 2010 Total revenue attributable to the PGIM Division $ 3,294 $ 1,973 Less: Passthrough distribution revenue 112 120 Less: Revenue associated with consolidations 46 31 Total adjusted revenue attributable to the PGIM Division $ 3,135 $ 1,822 Adjusted operating income attributable to the PGIM Division $ 959 $ 523 PGIM adjusted operating margin 30.6% 28.7% 13
Serious News for Serious Traders! Try StreetInsider.com Premium Free!
You May Also Be Interested In
- Prudential Financial (PRU) PT Raised to $116 at Evercore ISI
- DelCam Capital Enters Fire and Safety Equipment Sector with Strategic Acquisition of Space Age Electronics, Inc.
- Alterra Mountain Company Closes Acquisition of Mike Wiegele Helicopter Skiing in British Columbia Final
Create E-mail Alert Related Categories
SEC FilingsSign up for StreetInsider Free!
Receive full access to all new and archived articles, unlimited portfolio tracking, e-mail alerts, custom newswires and RSS feeds - and more!
