

Form 8-K PROVIDENT FINANCIAL HOLD For: Apr 27
 Tweet
Tweet Share
ShareUNITED STATES
SECURITIES AND EXCHANGE COMMISSION
Washington, D.C. 20549
FORM 8-K
CURRENT REPORT
Pursuant to Section 13 or 15(d) of the Securities Exchange Act of 1934
Date of Report (Date of earliest event reported): April 27, 2021
PROVIDENT FINANCIAL HOLDINGS, INC.
(Exact name of registrant as specified in its charter)
|
Delaware
|
000-28304
|
33-0704889
|
|
(State or other jurisdiction
of incorporation)
|
(Commission
File Number)
|
(I.R.S. Employer
Identification No.)
|
|
3756 Central Avenue, Riverside, California
|
92506
|
|
(Address of principal executive offices)
|
(Zip Code)
|
Registrant’s telephone number, including area code: (951) 686-6060
|
Check the appropriate box below if the Form 8-K filing is intended to simultaneously satisfy the filing obligation of the registrant under any of the following provisions.
|
|
[ ] Written communications pursuant to Rule 425 under the Securities Act (17 CFR 230.425)
|
|
[ ] Soliciting material pursuant to Rule 14a-12 under the Exchange Act (17 CFR 240.14a-12)
|
|
[ ] Pre-commencement
communications pursuant to Rule 14d-2(b) under the Exchange Act
(17 CFR 240.14d-2(b))
|
|
[ ] Pre-commencement
communications pursuant to Rule 13e-4(c) under the Exchange Act
(17 CFR 240.13e-4(c))
|
Securities registered pursuant to Section 12(b) of the Act:
|
Title of each class
Common Stock, par value $.01 per share
|
Trading Symbol(s)
PROV
|
Name of each exchange on which registered
The NASDAQ Stock Market LLC
|
Indicate by check mark whether the registrant is an emerging growth company as defined in Rule 405 of the Securities Act of 1933
(§230.405 of this chapter) or Rule 12b-2 of the Securities Exchange Act of 1934 (§240.12b-2 of this chapter).
Emerging growth company [ ]
If an emerging growth company, indicate by check mark if the registrant has elected not to use the extended transition period for complying with any new or revised financial
accounting standards provided pursuant to Section 13(a) of the Exchange Act. [ ]
Item 2.02 Results of Operations and Financial Condition
On April 27, 2021, Provident Financial Holdings, Inc. (“Corporation”), the holding company for Provident Savings Bank, F.S.B., distributed its quarterly results
for the quarter ended March 31, 2021. A copy of the news release is attached hereto as Exhibit 99.1 and is incorporated herein by reference.
Item 7.01 Regulation FD Disclosure.
On April 27, 2021, the Corporation posted its Investor Presentation for the quarter ended March 31, 2021 on the Corporation’s website, www.myprovident.com,
under Presentations in the Investor Relations section. A copy of the Investor Presentation is attached hereto as Exhibit 99.2 and is incorporated herein by reference.
Item 9.01 Financial Statements and Exhibits
|
(d)
|
Exhibits
|
SIGNATURES
Pursuant to the requirements of the Securities Exchange Act of 1934, the Registrant has duly caused this report to be signed on its behalf by the undersigned
hereunto duly authorized.
| Date: April 27, 2021 | PROVIDENT FINANCIAL HOLDINGS, INC. |
|
|
|
|
|
/s/ Donavon P. Ternes
|
|
|
Donavon P. Ternes
|
|
|
President, Chief Operating Officer and
Chief Financial Officer
(Principal Financial and Accounting Officer)
|
Exhibit 99.1
 |
 |
|
|
|
|
3756 Central Avenue
Riverside, CA 92506
(951) 686-6060
|
NEWS RELEASE
|
PROVIDENT FINANCIAL HOLDINGS REPORTS
THIRD QUARTER FISCAL 2021 RESULTS
The Company Reports Net Income of $1.56 Million in the March 2021 Quarter
Loans Held for Investment Decrease 7% from June 30, 2020 to $840.3 Million
Total Deposits Increase 5% from June 30, 2020 to $933.8 Million
Non-Interest Expense Declines 8% to $6.91 Million in the March 2021 Quarter in
Comparison to the March 2020 Quarter
Riverside, Calif. – April 27, 2021 – Provident Financial Holdings, Inc. (“Company”), NASDAQ GS: PROV, the holding company for Provident Savings Bank, F.S.B.
(“Bank”), today announced third quarter earnings results for the fiscal year ending June 30, 2021.
For the quarter ended March 31, 2021, the Company reported net income of $1.56 million, or $0.21 per diluted share (on 7.58 million average diluted shares
outstanding), up from net income of $1.14 million, or $0.15 per diluted share (on 7.59 million average diluted shares outstanding), in the comparable period a year ago. Compared to the same quarter last year, the increase in earnings was primarily
attributable to a recovery from the allowance for loan losses and lower non-interest expenses (mainly, lower salaries and employee benefits expenses related to fewer employees and reduced incentive compensation), partly offset by lower net interest
income.
Page 1 of 20
|
|
“I am pleased with our improving operating results this quarter. We experienced stronger loan origination volumes than recent prior quarters, deposit growth
is sound, operating expenses are well controlled, and credit quality remains very good,” said Craig G. Blunden, Chairman and Chief Executive Officer of the Company. “Additionally, I believe general economic conditions are beginning to improve from
last year which is a welcome development. We are well-positioned to benefit from an increase in economic activity,” said Mr. Blunden.
Return on average assets for the third quarter of fiscal 2021 was 0.53 percent, up from 0.41 percent for the same period of fiscal 2020; and return on average
stockholders’ equity for the third quarter of fiscal 2021 was 4.99 percent, up from 3.70 percent for the comparable period of fiscal 2020.
On a sequential quarter basis, the $1.56 million net income for the third quarter of fiscal 2021 reflects a 33 percent increase from $1.18 million in the
second quarter of fiscal 2021. The increase in earnings for the third quarter of fiscal 2021 compared to the second quarter of fiscal 2021 was primarily attributable to a $225,000 increase in non-interest income and a $239,000 improvement in the
provision for loan losses, partly offset by a decrease of $181,000 in net interest income. Diluted earnings per share for the third quarter of fiscal 2021 were $0.21 per share, up 31 percent from the $0.16 per share during the second quarter of
fiscal 2021. Return on average assets was 0.53 percent for the third quarter of fiscal 2021, up from 0.40 percent in the second quarter of fiscal 2021; and return on average stockholders’ equity for the third quarter of fiscal 2021 was 4.99
percent, up from 3.77 percent for the second quarter of fiscal 2021.
Page 2 of 20
|
|
For the nine months ended March 31, 2021 net income decreased $1.89 million, or 31 percent, to $4.22 million from $6.11 million in the comparable period ended
March 31, 2020; and diluted earnings per share for the nine months ended March 31, 2021 decreased 30 percent to $0.56 per share (on 7.52 million average diluted shares outstanding) from $0.80 per share (on 7.61 million average diluted shares
outstanding) for the comparable nine-month period last year. Compared to the same period last year, the decrease in earnings was primarily attributable to a $4.85 million decrease in net-interest income; partly offset by lower non-interest expenses
as a result of a $1.97 million decrease in salaries and employee benefits expenses and a $612,000 decrease in the provision for loan losses.
Net interest income decreased $1.43 million, or 16 percent, to $7.46 million in the third quarter of fiscal 2021 from $8.89 million for the same quarter of
fiscal 2020, attributable to a decrease in the net interest margin, partly offset by a higher average interest-earning assets balance. The net interest margin during the third quarter of fiscal 2021 decreased 70 basis points to 2.60 percent from
3.30 percent in the same quarter last year, primarily due to a decrease in the average yield of interest-earning assets reflecting primarily downward pressure on adjustable rate instruments as a result of decreases in market interest rates over the
last year, partly offset by a much smaller decrease in the average cost of interest-bearing liabilities. The average yield on interest-earning assets decreased by 93 basis points to 2.94 percent in the third quarter of fiscal 2021 from 3.87 percent
in the same quarter last year while the average cost of interest-bearing liabilities decreased by 26 basis points to 0.38 percent in the third quarter of fiscal 2021 from 0.64 percent in the same quarter last year. The average balance of
interest-earning assets
Page 3 of 20
|
|
increased by $67.2 million, or six percent, to $1.15 billion in the third quarter of fiscal 2021 from $1.08 billion in the same quarter last year due primarily to purchases of
investment securities, partly offset by a decrease in loans receivable.
The average balance of loans receivable decreased by $86.1 million, or nine percent, to $843.4 million in the third quarter of fiscal 2021 from $929.5 million
in the same quarter of fiscal 2020. The average yield on loans receivable decreased by 41 basis points to 3.73 percent in the third quarter of fiscal 2021 from an average yield of 4.14 percent in the same quarter of fiscal 2020. Net deferred loan
cost amortization in the third quarter of fiscal 2021 increased to $717,000 from $451,000 in the same quarter of fiscal 2020. Total loans originated and purchased for investment in the third quarter of fiscal 2021 were $61.0 million, up 112 percent
from $28.8 million in the same quarter of fiscal 2020. Loan principal payments received in the third quarter of fiscal 2021 were $75.7 million, up 36 percent from $55.7 million in the same quarter of fiscal 2020 reflecting increased refinance
activity in the currently low interest rate environment.
The average balance of investment securities increased by $143.7 million, or 183 percent, to $222.3 million in the third quarter of fiscal 2021 from $78.6
million in the same quarter of fiscal 2020. The average yield on investment securities decreased 162 basis points to 0.81 percent in the third quarter of fiscal 2021 from 2.43 percent for the same quarter of fiscal 2020. The decrease in the average
yield was primarily attributable to investment security purchases with a lower average yield than the legacy portfolio of investment securities, reflecting the current low interest rate environment. During the third quarter of fiscal 2021, the Bank
purchased investment securities totaling $50.4 million with an average yield of approximately 0.84%; and for the first nine months of fiscal 2021, the
Page 4 of 20
|
|
Bank purchased investment securities totaling $154.2 million with an average yield of approximately 0.82%.
In the third quarter of fiscal 2021, the Federal Home Loan Bank – San Francisco (“FHLB”) distributed a $100,000 cash dividend to the Bank on its FHLB stock,
down 31 percent from $144,000 in the same quarter last year.
The average balance of the Company’s interest-earning deposits, primarily cash with the Federal Reserve Bank of San Francisco, increased $9.8 million, or 16
percent, to $71.7 million in the third quarter of fiscal 2021 from $61.9 million in the same quarter of fiscal 2020 primarily as a result of deposit growth and loan repayments outpacing new loan originations and purchases of loans and investment
securities. The average yield earned on interest-earning deposits in the third quarter of fiscal 2021 was 0.10 percent, down 110 basis points from 1.20 percent in the same quarter of fiscal 2020 as a result of decreases in the targeted Federal
Funds Rate.
Average deposits increased $79.8 million, or 10 percent, to $916.7 million in the third quarter of fiscal 2021 from $836.9 million in the same quarter of
fiscal 2020, primarily due to increases in transaction accounts resulting primarily from government stimulus programs related to the COVID-19 pandemic, partly offset by a managed run-off of higher cost time deposits. The average cost of deposits
improved, decreasing by 19 basis points to 0.17 percent in the third quarter of fiscal 2021 from 0.36 percent in the same quarter last year.
Transaction account balances or “core deposits” increased $64.4 million, or nine percent, to $787.4 million at March 31, 2021 from $723.0 million at June 30,
2020, while
Page 5 of 20
|
|
time deposits decreased $23.6 million, or 14 percent, to $146.4 million at March 31, 2021 from $170.0 million at June 30, 2020.
The average balance of borrowings, which consisted of FHLB advances, decreased $15.4 million, or 12 percent, to $115.7 million while the average cost of
borrowings decreased 36 basis points to 2.08 percent in the third quarter of fiscal 2021, compared to an average balance of $131.1 million with an average cost of 2.44 percent in the same quarter of fiscal 2020. The decrease in the average balance
of borrowings was primarily due to prepayments and maturities of borrowings.
During the third quarter of fiscal 2021, the Company recorded a recovery from the allowance for loan losses of $200,000, in contrast to an $874,000
provision for loan losses recorded during the same period of fiscal 2020 and a $39,000 provision for loan losses recorded in the second quarter of fiscal 2021 (sequential quarter). The provision for loan losses in the previous quarters was
primarily due to an increase in qualitative components in our allowance for loan losses methodology in response to the COVID-19 pandemic and its forecasted adverse economic impact. The recovery from the allowance for loan losses for the current
quarter primarily reflects an improved economic outlook as of March 31, 2021, reducing the expected impact of the pandemic to the credit quality of the loan portfolio and declining loan balances during the current quarter; while the provision for
loan losses recorded in the preceding quarters primarily reflected the deterioration in forecasted economic metrics reflecting the economic outlook that existed at each quarter end as a result of the COVID-19 pandemic, partly offset by the
decrease in loan balances.
Non-performing assets, comprised solely of non-performing loans with underlying collateral located in California, increased $4.9 million to $9.8 million, or
0.82 percent of
Page 6 of 20
|
|
total assets, at March 31, 2021, compared to $4.9 million, or 0.42 percent of total assets, at June 30, 2020 and declined from $10.3 million, or 0.88 percent of total assets, at
December 31, 2020 (sequential quarter). The non-performing loans at March 31, 2021 are comprised of 29 single-family loans and one multi-family loan. At both March 31, 2021 and June 30, 2020, there was no real estate owned.
Net loan recoveries for the quarter ended March 31, 2021 were $8,000 or 0.00 percent (annualized) of average loans receivable, as compared to net loan
recoveries of $15,000 or 0.01 percent (annualized) of average loans receivable for the quarter ended March 31, 2020 and net loan recoveries of $9,000 or 0.00 percent (annualized) of average loans receivable for the quarter ended December 31, 2020
(sequential quarter).
Classified assets, comprised solely of loans, were $12.2 million at March 31, 2021, including $2.5 million of loans in the special mention category and $9.7
million of loans in the substandard category; while classified assets at June 30, 2020 were $14.1 million, including $8.6 million of loans in the special mention category and $5.5 million of loans in the substandard category.
The Bank has received requests from borrowers for some type of payment relief due to the COVID-19 pandemic. Loans that were current on their payments prior
to the COVID-19 pandemic and modified by deferred payments, are not considered to be troubled debt restructurings pursuant to applicable accounting guidance consistent with the Coronavirus Aid, Relief, and Economic Security Act of 2020 or CARES Act
and related bank regulatory guidance. The primary method of relief is to allow the borrower to defer loan payments for up to an initial six-month period, although we have also waived late fees and suspended foreclosure proceedings. Loans in which
their payments are deferred
Page 7 of 20
|
|
beyond the initial six months are no longer in forbearance and are subsequently classified as troubled debt restructuring. As of March 31, 2021, loans in forbearance included
five single-family with outstanding balances of approximately $1.8 million or 0.22 percent of gross loans held for investment, one commercial real estate loan with an outstanding balance of $945,000 or 0.11 percent of gross loans held for
investment and one multi-family loan with an outstanding balance of $308,000 or 0.04 percent of gross loans held for investment. As of March 31, 2021, the Bank had no pending requests for payment relief. Interest income is recognized during the
forbearance period unless the loans are classified as non-performing. After the payment deferral period, scheduled loan payments will once again become due and payable. The forbearance amount will be due and payable in full as a balloon payment at
the end of the loan term or sooner if the loan becomes due and payable in full at an earlier date. The Company believes the steps it is taking are necessary to effectively manage the loan portfolio and assist its customers through the ongoing
uncertainty surrounding the duration, impact and government response to the COVID-19 pandemic.
During the quarter ended March 31, 2021, one COVID-19 related forbearance loan was restructured while two restructured loans were upgraded to pass category.
During the nine months ended March 31, 2021, 17 loans previously in a COVID-19 related payment forbearance and one pass loan were restructured and classified as restructured loans, while three restructured loans were upgraded to the pass category,
of which one loan was subsequently paid off. The outstanding balance of restructured loans at March 31, 2021 was $8.3 million (23 loans) up from $2.6 million (eight loans) at June 30, 2020. As of March 31, 2021, a total of $8.1 million or 97
percent of the restructured loans were
Page 8 of 20
|
|
classified as substandard non-accrual and all of the restructured loans have a current payment status consistent with their restructuring terms.
The allowance for loan losses was $8.3 million or 0.98 percent of gross loans held for investment at March 31, 2021, similar to the $8.3 million or 0.91
percent of gross loans held for investment at June 30, 2020. Management believes that, based on currently available information, the allowance for loan losses is sufficient to absorb potential losses inherent in loans held for investment at March
31, 2021 under the incurred loss methodology.
Non-interest income increased by $98,000, or nine percent, to $1.20 million in the third quarter of fiscal 2021 from $1.10 million in the same period of
fiscal 2020, primarily due to an increase in loan servicing and other fees resulting from a recovery from servicing asset reserves attributable to lower loan prepayment estimates, partly offset by a decrease in deposit account fees reflecting
certain fees that were waived related to accounts impacted by the COVID-19 pandemic and reduced transactions reflecting changes in spending habits due to the COVID-19 pandemic. On a sequential quarter basis, non-interest income increased $225,000,
or 23 percent, primarily as a result of an increase in loan servicing and other fees resulting from higher loan prepayment fees.
Non-interest expenses decreased $596,000, or eight percent, to $6.91 million in the third quarter of fiscal 2021 from $7.51 million in the same quarter last
year due primarily to lower salaries and employee benefits expense resulting from fewer employees and lower incentive compensation. On a sequential quarter basis, non-interest expenses remained virtually unchanged.
Page 9 of 20
|
|
The Company’s efficiency ratio in the third quarter of fiscal 2021 was 80 percent, up from 75 percent in the same quarter last year but unchanged from the
second quarter of fiscal 2021 (sequential quarter).
The Company’s provision for income tax was $386,000 for the third quarter of fiscal 2021, down 17 percent from $467,000 in the same quarter last year
primarily due to tax benefits attributable to the exercise of stock options, partly offset by higher net income before taxes. The effective tax rate in the third quarter of fiscal 2021 was 19.8%, down from 29.0% in the same quarter last year. The
Company believes that the tax provision recorded in the third quarter of fiscal 2021 reflects its current federal and state income tax obligations.
The Company repurchased 54,707 shares of its common stock with an average cost of $16.66 per share during the quarter ended March 31, 2021 pursuant to its
stock repurchase plan. As of March 31, 2021, a total of 317,108 shares or 85 percent of the shares authorized for repurchase under the April 2020 stock repurchase plan remain available to purchase until the plan expires on April 30, 2021.
The Bank currently operates 13 retail/business banking offices in Riverside County and San Bernardino County (Inland Empire).
The Company will host a conference call for institutional investors and bank analysts on Wednesday, April 28, 2021 at 9:00 a.m. (Pacific) to discuss its
financial results. The conference call can be accessed by dialing 1-877-226-8189 and referencing access code number 1087920. An audio replay of the conference call will be available through Wednesday, May 5, 2021 by dialing 1-866-207-1041 and
referencing access code number 7861926.
Page 10 of 20
|
|
For more financial information about the Company please visit the website at www.myprovident.com and click on the “Investor Relations”
section.
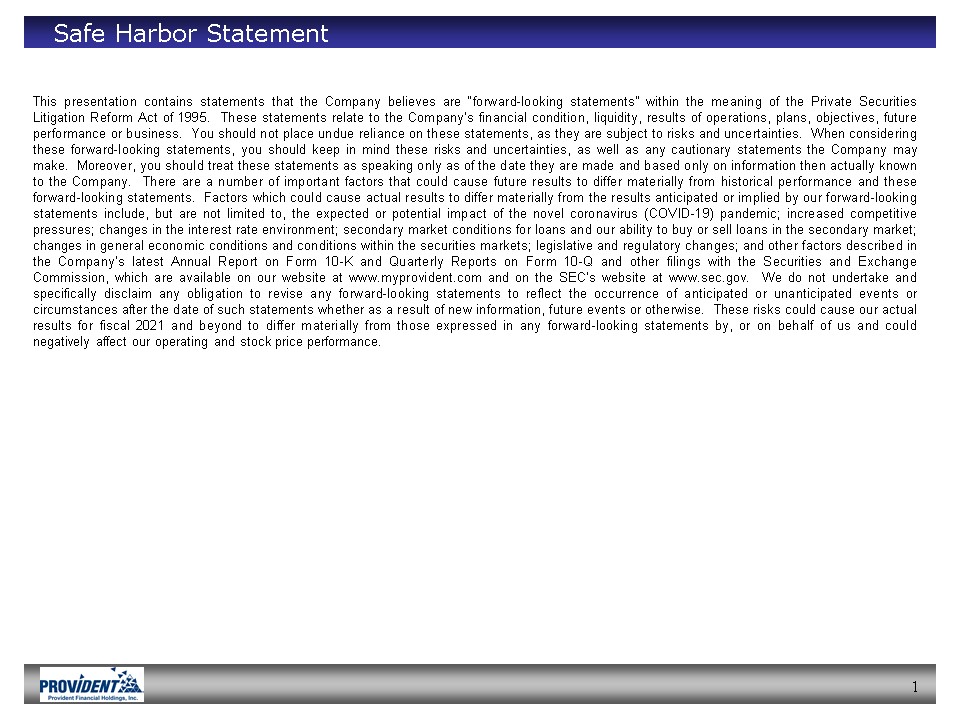
Safe-Harbor Statement
This press release contains statements that the Company believes are “forward-looking statements” within the meaning of the
Private Securities Litigation Reform Act of 1995. These statements relate to the Company’s financial condition, liquidity, results of operations, plans, objectives, future performance or business. You should not place undue reliance on these
statements, as they are subject to risks and uncertainties. When considering these forward-looking statements, you should keep in mind these risks and uncertainties, as well as any cautionary statements the Company may make. Moreover, you should
treat these statements as speaking only as of the date they are made and based only on information then actually known to the Company. There are a number of important factors that could cause future results to differ materially from historical
performance and these forward-looking statements. Factors which could cause actual results to differ materially from the results anticipated or implied by our forward-looking statements include, but are not limited to the effect of the COVID-19
pandemic, including on Company’s credit quality and business operations, as well as its impact on general economic and financial market conditions and other uncertainties resulting from the COVID-19 pandemic, such as the extent and duration of
the impact on public health, the U.S. and global economies, and consumer and corporate customers, including economic activity, employment levels and market liquidity; increased competitive pressures; changes in the interest rate environment;
changes in general economic conditions and conditions within the securities markets; legislative and regulatory changes,; including as a result of the COVID-19 pandemic; and
other factors described in the Company’s latest Annual Report on Form 10-K and Quarterly Reports on Form 10-Q and other filings with the Securities and Exchange Commission (“SEC”) - which are available on our website at www.myprovident.com and
on the SEC’s website at www.sec.gov. We do not undertake and specifically disclaim any obligation to revise any forward-looking statements to reflect the occurrence of anticipated or unanticipated events or circumstances after the date of such
statements whether as a result of new information, future events or otherwise. These risks could cause our actual results for fiscal 2021 and beyond to differ materially from those expressed in any forward-looking statements by, or on behalf of
us and could negatively affect our operating and stock price performance
|
Contacts:
|
Craig G. Blunden |
Donavon P. Ternes |
|
|
Chairman and |
President, Chief Operating Officer, |
|
|
Chief Executive Officer | and Chief Financial Officer |
|
|
|
|
Page 11 of 20
|
|
|
PROVIDENT FINANCIAL HOLDINGS, INC.
Condensed Consolidated Statements of Financial Condition
(Unaudited –In Thousands, Except Share Information)
|
||||||||||||||||||||
|
March 31,
|
December 31,
|
September 30,
|
June 30,
|
March 31,
|
||||||||||||||||
|
2021
|
2020
|
2020
|
2020
|
2020
|
||||||||||||||||
|
Assets
|
||||||||||||||||||||
|
Cash and cash equivalents
|
$
|
71,629
|
$
|
74,001
|
$
|
66,467
|
$
|
116,034
|
$
|
84,250
|
||||||||||
|
Investment securities – held to maturity, at
cost
|
239,480
|
203,098
|
193,868
|
118,627
|
69,482
|
|||||||||||||||
|
Investment securities - available for sale, at
fair value
|
3,802
|
4,158
|
4,416
|
4,717
|
4,828
|
|||||||||||||||
|
Loans held for investment, net of allowance
for loan losses of $8,346; $8,538; $8,490;
$8,265 and $7,810, respectively; includes
$1,879; $1,972; $2,240; $2,258 and $3,835
at fair value, respectively
|
840,274
|
855,086
|
884,953
|
902,796
|
914,307
|
|||||||||||||||
|
Accrued interest receivable
|
3,060
|
3,126
|
3,373
|
3,271
|
3,154
|
|||||||||||||||
|
FHLB – San Francisco stock
|
7,970
|
7,970
|
7,970
|
7,970
|
8,199
|
|||||||||||||||
|
Premises and equipment, net
|
9,608
|
9,980
|
10,099
|
10,254
|
10,606
|
|||||||||||||||
|
Prepaid expenses and other assets
|
13,473
|
13,308
|
12,887
|
13,168
|
12,741
|
|||||||||||||||
|
Total assets
|
$
|
1,189,296
|
$
|
1,170,727
|
$
|
1,184,033
|
$
|
1,176,837
|
$
|
1,107,567
|
||||||||||
|
Liabilities and Stockholders’ Equity
|
||||||||||||||||||||
|
Liabilities:
|
||||||||||||||||||||
|
Non interest-bearing deposits
|
$
|
124,043
|
$
|
109,609
|
$
|
114,537
|
$
|
118,771
|
$
|
86,585
|
||||||||||
|
Interest-bearing deposits
|
809,713
|
800,359
|
790,149
|
774,198
|
749,246
|
|||||||||||||||
|
Total deposits
|
933,756
|
909,968
|
904,686
|
892,969
|
835,831
|
|||||||||||||||
|
Borrowings
|
111,000
|
116,015
|
136,031
|
141,047
|
131,070
|
|||||||||||||||
|
Accounts payable, accrued interest and other
liabilities
|
18,790
|
19,760
|
18,657
|
18,845
|
17,508
|
|||||||||||||||
|
Total liabilities
|
1,063,546
|
1,045,743
|
1,059,374
|
1,052,861
|
984,409
|
|||||||||||||||
|
Stockholders’ equity:
|
||||||||||||||||||||
|
Preferred stock, $.01 par value (2,000,000
shares authorized; none issued and
outstanding)
|
||||||||||||||||||||
|
-
|
-
|
-
|
-
|
-
|
||||||||||||||||
|
Common stock, $.01 par value (40,000,000
shares authorized; 18,226,615; 18,097,615;
18,097,615; 18,097,615 and 18,097,615
shares issued, respectively; 7,516,547;
7,442,254; 7,441,259; 7,436,315 and
7,436,315 shares outstanding,
respectively)
|
||||||||||||||||||||
|
182
|
181
|
181
|
181
|
181
|
||||||||||||||||
|
Additional paid-in capital
|
97,323
|
96,164
|
95,948
|
95,593
|
95,355
|
|||||||||||||||
|
Retained earnings
|
195,443
|
194,923
|
194,789
|
194,345
|
193,802
|
|||||||||||||||
|
Treasury stock at cost (10,710,068;
10,655,361; 10,656,356; 10,661,300 and
10,661,300 shares, respectively)
|
||||||||||||||||||||
|
(167,276
|
)
|
(166,364
|
)
|
(166,358
|
)
|
(166,247
|
)
|
(166,247
|
)
|
|||||||||||
|
Accumulated other comprehensive income,
net of tax
|
78
|
80
|
99
|
104
|
67
|
|||||||||||||||
|
Total stockholders’ equity
|
125,750
|
124,984
|
124,659
|
123,976
|
123,158
|
|||||||||||||||
|
Total liabilities and stockholders’ equity
|
$
|
1,189,296
|
$
|
1,170,727
|
$
|
1,184,033
|
$
|
1,176,837
|
$
|
1,107,567
|
||||||||||
Page 12 of 20
|
|
|
PROVIDENT FINANCIAL HOLDINGS, INC.
Condensed Consolidated Statements of Operations
(Unaudited - In Thousands, Except Earnings Per Share)
|
||||||||||||||||
|
Quarter Ended
March 31,
|
Nine Months Ended
March 31,
|
|||||||||||||||
|
2021
|
2020
|
2021
|
2020
|
|||||||||||||
|
Interest income:
|
||||||||||||||||
|
Loans receivable, net
|
$
|
7,860
|
$
|
9,622
|
$
|
25,121
|
$
|
30,017
|
||||||||
|
Investment securities
|
452
|
478
|
1,378
|
1,659
|
||||||||||||
|
FHLB – San Francisco stock
|
100
|
144
|
300
|
432
|
||||||||||||
|
Interest-earning deposits
|
18
|
186
|
59
|
621
|
||||||||||||
|
Total interest income
|
8,430
|
10,430
|
26,858
|
32,729
|
||||||||||||
|
Interest expense:
|
||||||||||||||||
|
Checking and money market deposits
|
50
|
106
|
220
|
333
|
||||||||||||
|
Savings deposits
|
38
|
131
|
170
|
396
|
||||||||||||
|
Time deposits
|
292
|
509
|
1,009
|
1,571
|
||||||||||||
|
Borrowings
|
593
|
794
|
2,198
|
2,318
|
||||||||||||
|
Total interest expense
|
973
|
1,540
|
3,597
|
4,618
|
||||||||||||
|
Net interest income
|
7,457
|
8,890
|
23,261
|
28,111
|
||||||||||||
|
(Recovery) provision for loan losses
|
(200
|
)
|
874
|
59
|
671
|
|||||||||||
|
Net interest income, after (recovery) provision
for loan losses
|
7,657
|
8,016
|
23,202
|
27,440
|
||||||||||||
|
Non-interest income:
|
||||||||||||||||
|
Loan servicing and other fees
|
355
|
131
|
880
|
631
|
||||||||||||
|
Deposit account fees
|
318
|
423
|
957
|
1,321
|
||||||||||||
|
Card and processing fees
|
366
|
360
|
1,098
|
1,121
|
||||||||||||
|
Other
|
160
|
187
|
397
|
442
|
||||||||||||
|
Total non-interest income
|
1,199
|
1,101
|
3,332
|
3,515
|
||||||||||||
|
Non-interest expense:
|
||||||||||||||||
|
Salaries and employee benefits
|
4,241
|
4,966
|
12,985
|
14,950
|
||||||||||||
|
Premises and occupancy
|
863
|
845
|
2,631
|
2,603
|
||||||||||||
|
Equipment
|
312
|
314
|
860
|
855
|
||||||||||||
|
Professional expenses
|
367
|
351
|
1,183
|
1,090
|
||||||||||||
|
Sales and marketing expenses
|
130
|
177
|
470
|
506
|
||||||||||||
|
Deposit insurance premiums and regulatory
assessments
|
154
|
54
|
429
|
97
|
||||||||||||
|
Other
|
842
|
798
|
2,252
|
2,196
|
||||||||||||
|
Total non-interest expense
|
6,909
|
7,505
|
20,810
|
22,297
|
||||||||||||
|
Income before taxes
|
1,947
|
1,612
|
5,724
|
8,658
|
||||||||||||
|
Provision for income taxes
|
386
|
467
|
1,502
|
2,553
|
||||||||||||
|
Net income
|
$
|
1,561
|
$
|
1,145
|
$
|
4,222
|
$
|
6,105
|
||||||||
|
Basic earnings per share
|
$
|
0.21
|
$
|
0.15
|
$
|
0.57
|
$
|
0.82
|
||||||||
|
Diluted earnings per share
|
$
|
0.21
|
$
|
0.15
|
$
|
0.56
|
$
|
0.80
|
||||||||
|
Cash dividends per share
|
$
|
0.14
|
$
|
0.14
|
$
|
0.42
|
$
|
0.42
|
||||||||
Page 13 of 20
|
|
|
PROVIDENT FINANCIAL HOLDINGS, INC.
Condensed Consolidated Statements of Operations – Sequential Quarters
(Unaudited – In Thousands, Except Share Information)
|
| Quarter Ended | ||||||||||||||||||||
| March 31, | December 31, | September 30, | June 30, | March 31, | ||||||||||||||||
|
2021
|
2020
|
2020
|
2020
|
2020
|
||||||||||||||||
|
Interest income:
|
||||||||||||||||||||
|
Loans receivable, net
|
$
|
7,860
|
$
|
8,344
|
$
|
8,917
|
$
|
9,128
|
$
|
9,622
|
||||||||||
|
Investment securities
|
452
|
448
|
478
|
461
|
478
|
|||||||||||||||
|
FHLB – San Francisco stock
|
100
|
100
|
100
|
102
|
144
|
|||||||||||||||
|
Interest-earning deposits
|
18
|
17
|
24
|
36
|
186
|
|||||||||||||||
|
Total interest income
|
8,430
|
8,909
|
9,519
|
9,727
|
10,430
|
|||||||||||||||
|
Interest expense:
|
||||||||||||||||||||
|
Checking and money market deposits
|
50
|
79
|
91
|
91
|
106
|
|||||||||||||||
|
Savings deposits
|
38
|
54
|
78
|
100
|
131
|
|||||||||||||||
|
Time deposits
|
292
|
335
|
382
|
452
|
509
|
|||||||||||||||
|
Borrowings
|
593
|
803
|
802
|
794
|
794
|
|||||||||||||||
|
Total interest expense
|
973
|
1,271
|
1,353
|
1,437
|
1,540
|
|||||||||||||||
|
Net interest income
|
7,457
|
7,638
|
8,166
|
8,290
|
8,890
|
|||||||||||||||
|
(Recovery) provision for loan losses
|
(200
|
)
|
39
|
220
|
448
|
874
|
||||||||||||||
|
Net interest income, after provision (recovery) for loan losses
|
7,657
|
7,599
|
7,946
|
7,842
|
8,016
|
|||||||||||||||
|
Non-interest income:
|
||||||||||||||||||||
|
Loan servicing and other fees
|
355
|
120
|
405
|
188
|
131
|
|||||||||||||||
|
Deposit account fees
|
318
|
329
|
310
|
289
|
423
|
|||||||||||||||
|
Card and processing fees
|
366
|
368
|
364
|
333
|
360
|
|||||||||||||||
|
Other
|
160
|
157
|
80
|
195
|
187
|
|||||||||||||||
|
Total non-interest income
|
1,199
|
974
|
1,159
|
1,005
|
1,101
|
|||||||||||||||
|
Non-interest expense:
|
||||||||||||||||||||
|
Salaries and employee benefits
|
4,241
|
4,301
|
4,443
|
3,963
|
4,966
|
|||||||||||||||
|
Premises and occupancy
|
863
|
865
|
903
|
862
|
845
|
|||||||||||||||
|
Equipment
|
312
|
273
|
275
|
274
|
314
|
|||||||||||||||
|
Professional expenses
|
367
|
402
|
414
|
349
|
351
|
|||||||||||||||
|
Sales and marketing expenses
|
130
|
227
|
113
|
267
|
177
|
|||||||||||||||
|
Deposit insurance premiums and regulatory
assessments
|
154
|
141
|
134
|
130
|
54
|
|||||||||||||||
|
Other
|
842
|
707
|
703
|
758
|
798
|
|||||||||||||||
|
Total non-interest expense
|
6,909
|
6,916
|
6,985
|
6,603
|
7,505
|
|||||||||||||||
|
Income before taxes
|
1,947
|
1,657
|
2,120
|
2,244
|
1,612
|
|||||||||||||||
|
Provision for income taxes
|
386
|
481
|
635
|
660
|
467
|
|||||||||||||||
|
Net income
|
$
|
1,561
|
$
|
1,176
|
$
|
1,485
|
$
|
1,584
|
$
|
1,145
|
||||||||||
|
Basic earnings per share
|
$
|
0.21
|
$
|
0.16
|
$
|
0.20
|
$
|
0.21
|
$
|
0.15
|
||||||||||
|
Diluted earnings per share
|
$
|
0.21
|
$
|
0.16
|
$
|
0.20
|
$
|
0.21
|
$
|
0.15
|
||||||||||
|
Cash dividends per share
|
$
|
0.14
|
$
|
0.14
|
$
|
0.14
|
$
|
0.14
|
$
|
0.14
|
||||||||||
Page 14 of 20
|
|
|
PROVIDENT FINANCIAL HOLDINGS, INC.
Financial Highlights
(Unaudited - Dollars in Thousands, Except Share Information)
|
||||||||||||||||
|
Quarter Ended
March 31,
|
Nine Months Ended
March 31,
|
|||||||||||||||
|
2021
|
2020
|
2021
|
2020
|
|||||||||||||
|
SELECTED FINANCIAL RATIOS:
|
||||||||||||||||
|
Return on average assets
|
0.53
|
%
|
0.41
|
%
|
0.48
|
%
|
0.74
|
%
|
||||||||
|
Return on average stockholders’ equity
|
4.99
|
%
|
3.70
|
%
|
4.51
|
%
|
6.64
|
%
|
||||||||
|
Stockholders’ equity to total assets
|
10.57
|
%
|
11.12
|
%
|
10.57
|
%
|
11.12
|
%
|
||||||||
|
Net interest spread
|
2.56
|
%
|
3.23
|
%
|
2.66
|
%
|
3.44
|
%
|
||||||||
|
Net interest margin
|
2.60
|
%
|
3.30
|
%
|
2.70
|
%
|
3.51
|
%
|
||||||||
|
Efficiency ratio
|
79.82
|
%
|
75.12
|
%
|
78.25
|
%
|
70.50
|
%
|
||||||||
|
Average interest-earning assets to average
interest-bearing liabilities
|
110.94
|
%
|
111.39
|
%
|
110.79
|
%
|
111.48
|
%
|
||||||||
|
SELECTED FINANCIAL DATA:
|
||||||||||||||||
|
Basic earnings per share
|
$
|
0.21
|
$
|
0.15
|
$
|
0.57
|
$
|
0.82
|
||||||||
|
Diluted earnings per share
|
$
|
0.21
|
$
|
0.15
|
$
|
0.56
|
$
|
0.80
|
||||||||
|
Book value per share
|
$
|
16.73
|
$
|
16.56
|
$
|
16.73
|
$
|
16.56
|
||||||||
|
Shares used for basic EPS computation
|
7,462,795
|
7,468,932
|
7,446,970
|
7,477,922
|
||||||||||||
|
Shares used for diluted EPS computation
|
7,579,897
|
7,590,348
|
7,521,173
|
7,606,494
|
||||||||||||
|
Total shares issued and outstanding
|
7,516,547
|
7,436,315
|
7,516,547
|
7,436,315
|
||||||||||||
|
LOANS ORIGINATED AND PURCHASED
FOR INVESTMENT:
|
||||||||||||||||
|
Mortgage Loans:
|
||||||||||||||||
|
Single-family
|
$
|
38,928
|
$
|
9,654
|
$
|
74,571
|
$
|
95,954
|
||||||||
|
Multi-family
|
21,208
|
12,850
|
59,487
|
89,490
|
||||||||||||
|
Commercial real estate
|
830
|
5,570
|
2,690
|
14,468
|
||||||||||||
|
Construction
|
-
|
774
|
1,828
|
3,983
|
||||||||||||
|
Consumer loans
|
-
|
-
|
-
|
1
|
||||||||||||
|
Total loans originated and purchased for
investment
|
$
|
60,966
|
$
|
28,848
|
$
|
138,576
|
$
|
203,896
|
||||||||
Page 15 of 20
|
|
|
PROVIDENT FINANCIAL HOLDINGS, INC.
Financial Highlights
(Unaudited - Dollars in Thousands, Except Share Information)
|
||||||||||||||||||||
|
Quarter
Ended
|
Quarter
Ended
|
Quarter
Ended
|
Quarter
Ended
|
Quarter
Ended
|
||||||||||||||||
|
03/31/21
|
12/31/20
|
09/30/20
|
06/30/20
|
03/31/20
|
||||||||||||||||
|
SELECTED FINANCIAL RATIOS:
|
||||||||||||||||||||
|
Return on average assets
|
0.53
|
%
|
0.40
|
%
|
0.50
|
%
|
0.55
|
%
|
0.41
|
%
|
||||||||||
|
Return on average stockholders’ equity
|
4.99
|
%
|
3.77
|
%
|
4.78
|
%
|
5.14
|
%
|
3.70
|
%
|
||||||||||
|
Stockholders’ equity to total assets
|
10.57
|
%
|
10.68
|
%
|
10.53
|
%
|
10.53
|
%
|
11.12
|
%
|
||||||||||
|
Net interest spread
|
2.56
|
%
|
2.61
|
%
|
2.79
|
%
|
2.89
|
%
|
3.23
|
%
|
||||||||||
|
Net interest margin
|
2.60
|
%
|
2.66
|
%
|
2.84
|
%
|
2.95
|
%
|
3.30
|
%
|
||||||||||
|
Efficiency ratio
|
79.82
|
%
|
80.31
|
%
|
74.91
|
%
|
71.04
|
%
|
75.12
|
%
|
||||||||||
|
Average interest-earning assets to average
interest-bearing liabilities
|
110.94
|
%
|
110.82
|
%
|
110.62
|
%
|
110.80
|
%
|
111.39
|
%
|
||||||||||
|
SELECTED FINANCIAL DATA:
|
||||||||||||||||||||
|
Basic earnings per share
|
$
|
0.21
|
$
|
0.16
|
$
|
0.20
|
$
|
0.21
|
$
|
0.15
|
||||||||||
|
Diluted earnings per share
|
$
|
0.21
|
$
|
0.16
|
$
|
0.20
|
$
|
0.21
|
$
|
0.15
|
||||||||||
|
Book value per share
|
$
|
16.73
|
$
|
16.79
|
$
|
16.75
|
$
|
16.67
|
$
|
16.56
|
||||||||||
|
Average shares used for basic EPS
|
7,462,795
|
7,441,984
|
7,436,476
|
7,436,315
|
7,468,932
|
|||||||||||||||
|
Average shares used for diluted EPS
|
7,579,897
|
7,492,040
|
7,457,282
|
7,485,019
|
7,590,348
|
|||||||||||||||
|
Total shares issued and outstanding
|
7,516,547
|
7,442,254
|
7,441,259
|
7,436,315
|
7,436,315
|
|||||||||||||||
|
LOANS ORIGINATED AND PURCHASED
FOR INVESTMENT:
|
||||||||||||||||||||
|
Mortgage loans:
|
||||||||||||||||||||
|
Single-family
|
$
|
38,928
|
$
|
12,444
|
$
|
23,199
|
$
|
11,206
|
$
|
9,654
|
||||||||||
|
Multi-family
|
21,208
|
16,432
|
21,847
|
32,876
|
12,850
|
|||||||||||||||
|
Commercial real estate
|
830
|
-
|
1,860
|
-
|
5,570
|
|||||||||||||||
|
Construction
|
-
|
688
|
1,140
|
-
|
774
|
|||||||||||||||
|
Other
|
-
|
-
|
-
|
143
|
-
|
|||||||||||||||
|
Total loans originated and purchased for
investment
|
$
|
60,966
|
$
|
29,564
|
$
|
48,046
|
$
|
44,225
|
$
|
28,848
|
||||||||||
Page 16 of 20
|
|
|
PROVIDENT FINANCIAL HOLDINGS, INC.
Financial Highlights
(Unaudited - Dollars in Thousands)
|
||||||||||||||||||||
|
As of
|
As of
|
As of
|
As of
|
As of
|
||||||||||||||||
|
03/31/21
|
12/31/20
|
09/30/20
|
06/30/20
|
03/31/20
|
||||||||||||||||
|
ASSET QUALITY RATIOS AND
DELINQUENT LOANS:
|
||||||||||||||||||||
|
Recourse reserve for loans sold
|
$
|
215
|
$
|
390
|
$
|
370
|
$
|
270
|
$
|
250
|
||||||||||
|
Allowance for loan losses
|
$
|
8,346
|
$
|
8,538
|
$
|
8,490
|
$
|
8,265
|
$
|
7,810
|
||||||||||
|
Non-performing loans to loans held for
investment, net
|
1.16
|
%
|
1.20
|
%
|
0.51
|
%
|
0.55
|
%
|
0.40
|
%
|
||||||||||
|
Non-performing assets to total assets
|
0.82
|
%
|
0.88
|
%
|
0.38
|
%
|
0.42
|
%
|
0.33
|
%
|
||||||||||
|
Allowance for loan losses to gross loans held
|
||||||||||||||||||||
|
for investment
|
0.98
|
%
|
0.99
|
%
|
0.95
|
%
|
0.91
|
%
|
0.85
|
%
|
||||||||||
|
Net loan charge-offs (recoveries) to average
loans receivable (annualized)
|
0.00
|
%
|
0.00
|
%
|
0.00
|
%
|
0.00
|
%
|
(0.01
|
)%
|
||||||||||
|
Non-performing loans
|
$
|
9,759
|
$
|
10,270
|
$
|
4,532
|
$
|
4,924
|
$
|
3,635
|
||||||||||
|
Loans 30 to 89 days delinquent
|
$
|
-
|
$
|
350
|
$
|
2
|
$
|
219
|
$
|
2,827
|
||||||||||
|
Quarter
Ended
|
Quarter
Ended
|
Quarter
Ended
|
Quarter
Ended
|
Quarter
Ended
|
||||||||||||||||
|
03/31/21
|
12/31/20
|
09/30/20
|
06/30/20
|
03/31/20
|
||||||||||||||||
|
Recourse provision for loans sold
|
$
|
-
|
$
|
20
|
$
|
100
|
$
|
20
|
$
|
-
|
||||||||||
|
Provision (recovery) for loan losses
|
$
|
(200
|
)
|
$
|
39
|
$
|
220
|
$
|
448
|
$
|
874
|
|||||||||
|
Net loan charge-offs (recoveries)
|
$
|
(8
|
)
|
$
|
(9
|
)
|
$
|
(5
|
)
|
$
|
(7
|
)
|
$
|
(15
|
)
|
|||||
|
As of
|
As of
|
As of
|
As of
|
As of
|
||||||||||||||||
|
03/31/21
|
12/31/20
|
09/30/20
|
06/30/20
|
03/31/20
|
||||||||||||||||
|
REGULATORY CAPITAL RATIOS (BANK):
|
||||||||||||||||||||
|
Tier 1 leverage ratio
|
9.99
|
%
|
9.78
|
%
|
9.64
|
%
|
10.13
|
%
|
10.36
|
%
|
||||||||||
|
Common equity tier 1 capital ratio
|
18.77
|
%
|
18.30
|
%
|
16.94
|
%
|
17.51
|
%
|
17.26
|
%
|
||||||||||
|
Tier 1 risk-based capital ratio
|
18.77
|
%
|
18.30
|
%
|
16.94
|
%
|
17.51
|
%
|
17.26
|
%
|
||||||||||
|
Total risk-based capital ratio
|
20.02
|
%
|
19.56
|
%
|
18.19
|
%
|
18.76
|
%
|
18.45
|
%
|
||||||||||
|
As of March 31,
|
||||||||||||||||
|
2021
|
2020
|
|||||||||||||||
|
Balance
|
Rate(1)
|
Balance
|
Rate(1)
|
|||||||||||||
|
INVESTMENT SECURITIES:
|
||||||||||||||||
|
Held to maturity:
|
||||||||||||||||
|
Certificates of deposit
|
$
|
1,000
|
0.34
|
%
|
$
|
800
|
2.63
|
%
|
||||||||
|
U.S. SBA securities
|
1,877
|
0.60
|
2,083
|
2.10
|
||||||||||||
|
U.S. government sponsored enterprise MBS
|
236,603
|
1.30
|
66,599
|
2.78
|
||||||||||||
|
Total investment securities held to maturity
|
$
|
239,480
|
1.29
|
%
|
$
|
69,482
|
2.76
|
%
|
||||||||
|
Available for sale (at fair value):
|
||||||||||||||||
|
U.S. government agency MBS
|
$
|
2,360
|
2.52
|
%
|
$
|
3,001
|
3.54
|
%
|
||||||||
|
U.S. government sponsored enterprise MBS
|
1,279
|
2.62
|
1,630
|
4.17
|
||||||||||||
|
Private issue collateralized mortgage obligations
|
163
|
3.38
|
197
|
4.40
|
||||||||||||
|
Total investment securities available for sale
|
$
|
3,802
|
2.59
|
%
|
$
|
4,828
|
3.79
|
%
|
||||||||
|
Total investment securities
|
$
|
243,282
|
1.31
|
%
|
$
|
74,310
|
2.82
|
%
|
||||||||
|
(1) The interest rate described in the rate column is the weighted-average interest rate or yield of all instruments, which are included in the balance of the respective line
item.
|
||||||||||||||||
Page 17 of 20
|
|
|
PROVIDENT FINANCIAL HOLDINGS, INC.
Financial Highlights
(Unaudited - Dollars in Thousands)
|
||||||||||||||||
|
As of March 31,
|
||||||||||||||||
|
2021
|
2020
|
|||||||||||||||
|
Balance
|
Rate(1)
|
Balance
|
Rate(1)
|
|||||||||||||
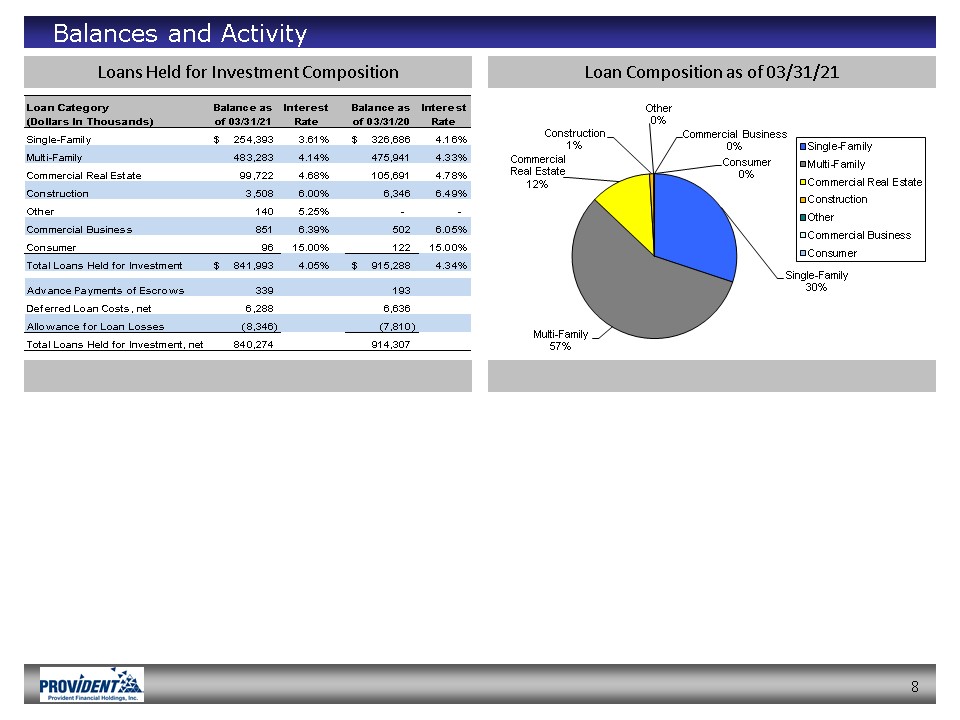
|
LOANS HELD FOR INVESTMENT:
|
||||||||||||||||
|
Held to maturity:
|
||||||||||||||||
|
Single-family (1 to 4 units)
|
$
|
254,393
|
3.61
|
%
|
$
|
326,686
|
4.16
|
%
|
||||||||
|
Multi-family (5 or more units)
|
483,283
|
4.14
|
475,941
|
4.33
|
||||||||||||
|
Commercial real estate
|
99,722
|
4.68
|
105,691
|
4.78
|
||||||||||||
|
Construction
|
3,508
|
6.00
|
6,346
|
6.49
|
||||||||||||
|
Other mortgage
|
140
|
5.25
|
-
|
-
|
||||||||||||
|
Commercial business
|
851
|
6.39
|
502
|
6.05
|
||||||||||||
|
Consumer
|
96
|
15.00
|
122
|
15.00
|
||||||||||||
|
Total loans held for investment
|
841,993
|
4.05
|
%
|
915,288
|
4.34
|
%
|
||||||||||
|
Advance payments of escrows
|
339
|
193
|
||||||||||||||
|
Deferred loan costs, net
|
6,288
|
6,636
|
||||||||||||||
|
Allowance for loan losses
|
(8,346
|
)
|
(7,810
|
)
|
||||||||||||
|
Total loans held for investment, net
|
$
|
840,274
|
$
|
914,307
|
||||||||||||
|
Purchased loans serviced by others included above
|
$
|
14,339
|
3.54
|
%
|
$
|
26,941
|
3.71
|
%
|
||||||||
|
(1) The interest rate described in the rate column is the weighted-average interest rate or yield of all instruments, which are included in the balance of the respective line
item.
|
||||||||||||||||
|
As of March 31,
|
||||||||||||||||
|
2021
|
2020
|
|||||||||||||||
|
Balance
|
Rate(1)
|
Balance
|
Rate(1)
|
|||||||||||||
|
DEPOSITS:
|
||||||||||||||||
|
Checking accounts – non interest-bearing
|
$
|
124,043
|
-
|
%
|
$
|
86,585
|
-
|
%
|
||||||||
|
Checking accounts – interest-bearing
|
320,704
|
0.04
|
270,389
|
0.12
|
||||||||||||
|
Savings accounts
|
302,673
|
0.05
|
261,659
|
0.20
|
||||||||||||
|
Money market accounts
|
39,945
|
0.08
|
31,575
|
0.21
|
||||||||||||
|
Time deposits
|
146,391
|
0.77
|
185,623
|
1.08
|
||||||||||||
|
Total deposits
|
$
|
933,756
|
0.16
|
%
|
$
|
835,831
|
0.35
|
%
|
||||||||
|
BORROWINGS:
|
||||||||||||||||
|
Overnight
|
$
|
-
|
-
|
%
|
$
|
-
|
-
|
%
|
||||||||
|
Three months or less
|
-
|
-
|
-
|
-
|
||||||||||||
|
Over three to six months
|
21,000
|
1.75
|
-
|
-
|
||||||||||||
|
Over six months to one year
|
10,000
|
2.20
|
20,000
|
3.85
|
||||||||||||
|
Over one year to two years
|
20,000
|
1.75
|
31,063
|
1.90
|
||||||||||||
|
Over two years to three years
|
40,000
|
2.25
|
20,000
|
1.75
|
||||||||||||
|
Over three years to four years
|
10,000
|
2.61
|
40,000
|
2.25
|
||||||||||||
|
Over four years to five years
|
10,000
|
2.79
|
10,007
|
2.61
|
||||||||||||
|
Over five years
|
-
|
-
|
10,000
|
2.79
|
||||||||||||
|
Total borrowings
|
$
|
111,000
|
2.14
|
%
|
$
|
131,070
|
2.40
|
%
|
||||||||
|
(1) The interest rate described in the rate column is the weighted-average interest rate or cost of all
instruments, which are included in the balance of the respective line item.
|
||||||||||||||||
Page 18 of 20
|
|
|
PROVIDENT FINANCIAL HOLDINGS, INC.
Financial Highlights
(Unaudited - Dollars in Thousands)
|
||||||||||||||||
|
Quarter Ended
|
Quarter Ended
|
|||||||||||||||
|
March 31, 2021
|
March 31, 2020
|
|||||||||||||||
|
Balance
|
Rate(1)
|
Balance
|
Rate(1)
|
|||||||||||||
|
SELECTED AVERAGE BALANCE SHEETS:
|
||||||||||||||||
|
Held to maturity:
|
||||||||||||||||
|
Loans receivable, net
|
$
|
843,374
|
3.73
|
%
|
$
|
929,485
|
4.14
|
%
|
||||||||
|
Investment securities
|
222,284
|
0.81
|
78,632
|
2.43
|
||||||||||||
|
FHLB – San Francisco stock
|
7,970
|
5.02
|
8,199
|
7.03
|
||||||||||||
|
Interest-earning deposits
|
71,728
|
0.10
|
61,900
|
1.20
|
||||||||||||
|
Total interest-earning assets
|
$
|
1,145,356
|
2.94
|
%
|
$
|
1,078,216
|
3.87
|
%
|
||||||||
|
Total assets
|
$
|
1,176,614
|
$
|
1,110,158
|
||||||||||||
|
Deposits
|
$
|
916,749
|
0.17
|
%
|
$
|
836,855
|
0.36
|
%
|
||||||||
|
Borrowings
|
115,672
|
2.08
|
131,075
|
2.44
|
||||||||||||
|
Total interest-bearing liabilities
|
$
|
1,032,421
|
0.38
|
%
|
$
|
967,930
|
0.64
|
%
|
||||||||
|
Total stockholders’ equity
|
$
|
125,052
|
$
|
123,786
|
||||||||||||
|
(1) The interest rate described in the rate column is the weighted-average interest rate or yield/cost of all
instruments, which are included in the balance of the respective line item.
|
||||||||||||||||
|
Nine Months Ended
|
Nine Months Ended
|
|||||||||||||||
|
March 31, 2021
|
March 31, 2020
|
|||||||||||||||
|
Balance
|
Rate(1)
|
Balance
|
Rate(1)
|
|||||||||||||
|
SELECTED AVERAGE BALANCE SHEETS:
|
||||||||||||||||
|
Held to maturity:
|
||||||||||||||||
|
Loans receivable, net
|
$
|
868,462
|
3.86
|
%
|
$
|
922,246
|
4.34
|
%
|
||||||||
|
Investment securities
|
195,463
|
0.94
|
87,260
|
2.53
|
||||||||||||
|
FHLB – San Francisco stock
|
7,970
|
5.02
|
8,199
|
7.03
|
||||||||||||
|
Interest-earning deposits
|
76,642
|
0.10
|
50,642
|
1.61
|
||||||||||||
|
Total interest-earning assets
|
$
|
1,148,537
|
3.12
|
%
|
$
|
1,068,347
|
4.08
|
%
|
||||||||
|
Total assets
|
$
|
1,179,517
|
$
|
1,100,162
|
||||||||||||
|
Deposits
|
$
|
906,169
|
0.21
|
%
|
$
|
833,731
|
0.37
|
%
|
||||||||
|
Borrowings
|
130,510
|
2.24
|
124,577
|
2.48
|
||||||||||||
|
Total interest-bearing liabilities
|
$
|
1,036,679
|
0.46
|
%
|
$
|
958,308
|
0.64
|
%
|
||||||||
|
Total stockholders’ equity
|
$
|
124,749
|
$
|
122,592
|
||||||||||||
|
(1) The interest rate described in the rate column is the weighted-average interest rate or yield/cost of all
instruments, which are included in the balance of the respective line item.
|
||||||||||||||||
Page 19 of 20
|
|
|
PROVIDENT FINANCIAL HOLDINGS, INC.
Financial Highlights
(Unaudited - Dollars in Thousands)
|
||||||||||||||||||||
|
ASSET QUALITY:
|
||||||||||||||||||||
|
As of
|
As of
|
As of
|
As of
|
As of
|
||||||||||||||||
|
03/31/21
|
12/31/20
|
09/30/20
|
06/30/20
|
03/31/20
|
||||||||||||||||
|
Loans on non-accrual status (excluding
restructured loans):
|
||||||||||||||||||||
|
Mortgage loans:
|
||||||||||||||||||||
|
Single-family
|
$
|
896
|
$
|
2,062
|
$
|
2,084
|
$
|
2,281
|
$
|
1,875
|
||||||||||
|
Multi-family
|
786
|
-
|
-
|
-
|
-
|
|||||||||||||||
|
Total
|
1,682
|
2,062
|
2,084
|
2,281
|
1,875
|
|||||||||||||||
|
Accruing loans past due 90 days or more:
|
-
|
-
|
-
|
-
|
-
|
|||||||||||||||
|
Total
|
-
|
-
|
-
|
-
|
-
|
|||||||||||||||
|
Restructured loans on non-accrual status:
|
||||||||||||||||||||
|
Mortgage loans:
|
||||||||||||||||||||
|
Single-family
|
8,077
|
8,208
|
2,421
|
2,612
|
1,726
|
|||||||||||||||
|
Commercial business loans
|
-
|
-
|
27
|
31
|
34
|
|||||||||||||||
|
Total
|
8,077
|
8,208
|
2,448
|
2,643
|
1,760
|
|||||||||||||||
|
Total non-performing loans (1)
|
9,759
|
10,270
|
4,532
|
4,924
|
3,635
|
|||||||||||||||
|
Real estate owned, net
|
-
|
-
|
-
|
-
|
-
|
|||||||||||||||
|
Total non-performing assets
|
$
|
9,759
|
$
|
10,270
|
$
|
4,532
|
$
|
4,924
|
$
|
3,635
|
||||||||||
(1) The non-performing loans balances are net of individually evaluated or collectively evaluated allowances, specifically attached to the individual loans and include fair value adjustments.
Page 20 of 20
Exhibit 99.2


Serious News for Serious Traders! Try StreetInsider.com Premium Free!
You May Also Be Interested In
- Provident Financial Holdings To Host Earnings Release Conference Call
- DOVRE GROUP TRADING STATEMENT JANUARY 1 – MARCH 31, 2024
- BE Semiconductor Industries N.V. Announces Q1-24 Results
Create E-mail Alert Related Categories
SEC FilingsSign up for StreetInsider Free!
Receive full access to all new and archived articles, unlimited portfolio tracking, e-mail alerts, custom newswires and RSS feeds - and more!
