

Form 8-K PEGASYSTEMS INC For: Jul 28
 Tweet
Tweet Share
ShareEXHIBIT 99.1
Pega continues strong first-half momentum through Q2 2021
•Total ACV grows 22 percent, powered by Pega Cloud Choice
•Pega Cloud ACV grows 46 percent to over 300 million dollars
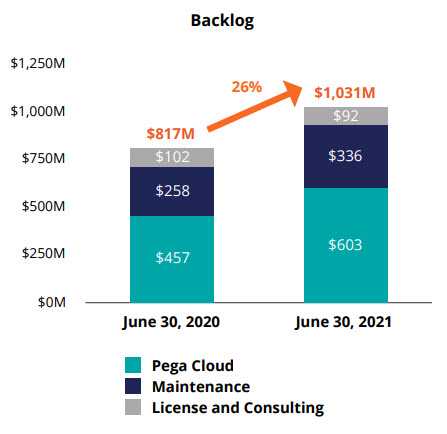
•Total Backlog increases 26 percent year over year to over 1 billion dollars
CAMBRIDGE, Mass. — July 28, 2021 — Pegasystems Inc. (NASDAQ: PEGA), the software company that crushes business complexity, released its financial results for the second quarter of 2021.
"As parts of the world begin to emerge from the acute conditions of the pandemic, we continue to see digital transformation at the forefront of our clients' priorities,” said Alan Trefler, Founder and CEO, Pegasystems. "Clients understand the need for agility is more important than ever if they are going to thrive in an increasingly unpredictable world. Pega's low-code platform and outcome-centric approach to workflow maximizes flexibility while delivering tremendous value."
"I'm excited that annual contract value grew 22 percent year-over-year in the first half of 2021," said COO and CFO Ken Stillwell. "Pega Cloud continued to be the biggest contributor to ACV growth for the third consecutive year. Equally exciting, we grew sequential backlog and delivered the strongest revenue quarter in the company’s history.”
Financial and performance metrics (1)
(Dollars in thousands, except per share amounts) | Three Months Ended June 30, | Six Months Ended June 30, | |||||||||||||||||||||||||||||||||
| 2021 | 2020 | Change | 2021 | 2020 | Change | ||||||||||||||||||||||||||||||
| Total revenue | $ | 325,702 | $ | 227,375 | 43 | % | $ | 639,201 | $ | 492,966 | 30 | % | |||||||||||||||||||||||
| Net income (loss) - GAAP | $ | 37,291 | $ | (20,740) | * | $ | 30,674 | $ | (46,112) | * | |||||||||||||||||||||||||
| Net income (loss) - Non-GAAP | $ | 19,943 | $ | (22,236) | * | $ | 42,056 | $ | (18,204) | * | |||||||||||||||||||||||||
| Diluted earnings (loss) per share - GAAP | $ | 0.43 | $ | (0.26) | * | $ | 0.36 | $ | (0.58) | * | |||||||||||||||||||||||||
| Diluted earnings (loss) per share - Non-GAAP | $ | 0.23 | $ | (0.28) | * | $ | 0.49 | $ | (0.23) | * | |||||||||||||||||||||||||
* not meaningful.
| (Dollars in thousands) | Three Months Ended June 30, | Change | Six Months Ended June 30, | Change | |||||||||||||||||||||||||||||||||||||||||||||||||
| 2021 | 2020 | 2021 | 2020 | ||||||||||||||||||||||||||||||||||||||||||||||||||
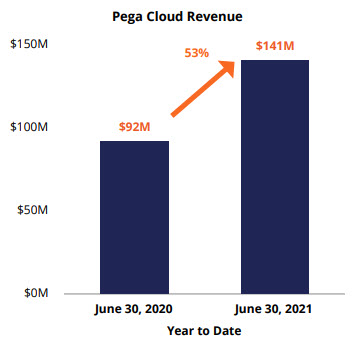
| Pega Cloud | $ | 73,293 | 23 | % | $ | 48,838 | 21 | % | $ | 24,455 | 50 | % | $ | 141,151 | 22 | % | $ | 92,304 | 19 | % | $ | 48,847 | 53 | % | |||||||||||||||||||||||||||||
| Client Cloud | 183,078 | 56 | % | 116,488 | 52 | % | 66,590 | 57 | % | 370,148 | 58 | % | 280,440 | 57 | % | 89,708 | 32 | % | |||||||||||||||||||||||||||||||||||
| Subscription | $ | 256,371 | 79 | % | $ | 165,326 | 73 | % | 91,045 | 55 | % | $ | 511,299 | 80 | % | $ | 372,744 | 76 | % | 138,555 | 37 | % | |||||||||||||||||||||||||||||||
| Perpetual license | 12,596 | 4 | % | 9,057 | 4 | % | 3,539 | 39 | % | 18,048 | 3 | % | 12,716 | 3 | % | 5,332 | 42 | % | |||||||||||||||||||||||||||||||||||
| Consulting | 56,735 | 17 | % | 52,992 | 23 | % | 3,743 | 7 | % | 109,854 | 17 | % | 107,506 | 21 | % | 2,348 | 2 | % | |||||||||||||||||||||||||||||||||||
| Total revenue | $ | 325,702 | 100 | % | $ | 227,375 | 100 | % | $ | 98,327 | 43 | % | $ | 639,201 | 100 | % | $ | 492,966 | 100 | % | $ | 146,235 | 30 | % | |||||||||||||||||||||||||||||
(1) For additional information, including a reconciliation of our Non-GAAP and GAAP measures, see the Schedules at the end of this release.
1
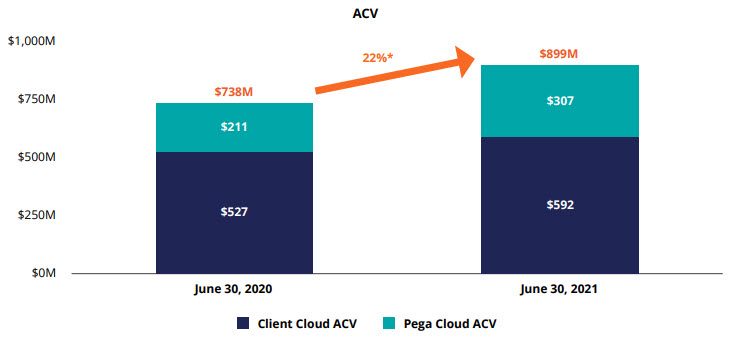
* Foreign currency exchange rate changes contributed 3-4% to total ACV growth in 2021.
2
Quarterly conference call
A conference call and audio-only webcast will be conducted at 5:00 p.m. EDT on July 28, 2021.
Members of the public and investors are invited to join the call and participate in the question and answer session by dialing 1-866-548-4713 (domestic), 1-323-794-2093 (international), or via webcast (http://public.viavid.com/index.php?id=145675) by logging onto www.pega.com at least five minutes before the event's broadcast and clicking on the webcast icon in the Investors section.
A replay of the call will also be available on www.pega.com by clicking the Earnings Calls link in the Investors section.
Discussion of Non-GAAP financial measures
We believe that non-GAAP financial measures help investors understand our core operating results and prospects, consistent with how management measures and forecasts the Company’s performance without the effect of often one-time charges and other items outside our normal operations. The supplementary non-GAAP financial measures are not meant to be superior to, or a substitute for, results of operations prepared under U.S. GAAP.
A reconciliation of our Non-GAAP and GAAP measures is at the end of this release.
Forward-looking statements
Certain statements in this press release may be "forward-looking statements” as defined in the Private Securities Litigation Reform Act of 1995.
Words such as expects, anticipates, intends, plans, believes, will, could, should, estimates, may, targets, strategies, projects, forecasts, guidance, likely, and usually, or variations of such words and other similar expressions identify forward-looking statements, which are based on current expectations and assumptions.
Forward-looking statements deal with future events and are subject to risks and uncertainties that are difficult to predict, including, but not limited to:
•our future financial performance and business plans;
•the adequacy of our liquidity and capital resources;
•the continued payment of our quarterly dividends;
•the timing of revenue recognition;
•management of our transition to a more subscription-based business model;
•variation in demand for our products and services, including among clients in the public sector;
•the impact of actual or threatened public health emergencies, such as the Coronavirus (“COVID-19”);
•reliance on third-party service providers;
•compliance with our debt obligations and covenants;
•the potential impact of our convertible senior notes and Capped Call Transactions;
•reliance on key personnel;
•the relocation of our corporate headquarters;
•the continued uncertainties in the global economy;
•foreign currency exchange rates;
•the potential legal and financial liabilities and reputation damage due to cyber-attacks;
•security breaches and security flaws;
•our ability to protect our intellectual property rights and costs associated with defending such rights;
•our client retention rate; and
•management of our growth.
These risks and others that may cause actual results to differ materially from those expressed in such forward-looking statements are described further in Part I of our Annual Report on Form 10-K for the year ended December 31, 2020, and other filings we make with the U.S. Securities and Exchange Commission (“SEC”). Except as required by applicable law, we do not undertake and expressly disclaim any obligation to update or revise these forward-looking statements publicly, whether from new information, future events, or otherwise.
The forward-looking statements in this press release represent our views as of July 28, 2021.
3
About Pegasystems
Pega delivers innovative software that crushes business complexity. From maximizing customer lifetime value to streamlining service to boosting efficiency, we help the world’s leading brands solve problems fast and transform for tomorrow. Pega clients make better decisions and get work done with real-time AI and intelligent automation. And, since 1983, we’ve built our scalable architecture and low-code platform to stay ahead of rapid change. Our solutions save people time, so our clients’ employees and customers can get back to what matters most. For more information on Pegasystems (NASDAQ: PEGA), visit www.pega.com.
Press contact:
Lisa Pintchman
Pegasystems Inc.
lisa.pintchman@pega.com
(617) 866-6022
Twitter: @pega
Investor contact:
Garo Toomajanian
ICR for Pegasystems Inc.
pegainvestorrelations@pega.com
(617) 866-6077
All trademarks are the property of their respective owners.
4
PEGASYSTEMS INC.
UNAUDITED CONDENSED CONSOLIDATED STATEMENTS OF OPERATIONS
(in thousands, except per share amounts)
| Three Months Ended June 30, | Six Months Ended June 30, | ||||||||||||||||||||||
| 2021 | 2020 | 2021 | 2020 | ||||||||||||||||||||
| Revenue | |||||||||||||||||||||||
| Software license | $ | 116,892 | $ | 53,323 | $ | 233,853 | $ | 147,239 | |||||||||||||||
| Maintenance | 78,782 | 72,222 | 154,343 | 145,917 | |||||||||||||||||||
| Pega Cloud | 73,293 | 48,838 | 141,151 | 92,304 | |||||||||||||||||||
| Consulting | 56,735 | 52,992 | 109,854 | 107,506 | |||||||||||||||||||
| Total revenue | 325,702 | 227,375 | 639,201 | 492,966 | |||||||||||||||||||
| Cost of revenue | |||||||||||||||||||||||
| Software license | 656 | 979 | 1,306 | 1,663 | |||||||||||||||||||
| Maintenance | 4,995 | 5,591 | 10,781 | 11,167 | |||||||||||||||||||
| Pega Cloud | 24,051 | 18,988 | 46,608 | 36,521 | |||||||||||||||||||
| Consulting | 54,829 | 51,133 | 108,283 | 106,868 | |||||||||||||||||||
| Total cost of revenue | 84,531 | 76,691 | 166,978 | 156,219 | |||||||||||||||||||
| Gross profit | 241,171 | 150,684 | 472,223 | 336,747 | |||||||||||||||||||
| Operating expenses | |||||||||||||||||||||||
| Selling and marketing | 156,423 | 127,607 | 305,162 | 263,631 | |||||||||||||||||||
| Research and development | 64,395 | 58,869 | 126,837 | 117,596 | |||||||||||||||||||
| General and administrative | 19,161 | 15,655 | 37,431 | 31,285 | |||||||||||||||||||
| Total operating expenses | 239,979 | 202,131 | 469,430 | 412,512 | |||||||||||||||||||
| Income (loss) from operations | 1,192 | (51,447) | 2,793 | (75,765) | |||||||||||||||||||
| Foreign currency transaction (loss) gain | (403) | 4,256 | (5,501) | (1,691) | |||||||||||||||||||
| Interest income | 236 | 242 | 389 | 849 | |||||||||||||||||||
| Interest expense | (1,959) | (5,529) | (3,839) | (7,835) | |||||||||||||||||||
| Gain on capped call transactions | 26,309 | 19,419 | 7,192 | 827 | |||||||||||||||||||
| Other income, net | — | — | 106 | 1,374 | |||||||||||||||||||
| Income (loss) before (benefit from) income taxes | 25,375 | (33,059) | 1,140 | (82,241) | |||||||||||||||||||
| (Benefit from) income taxes | (11,916) | (12,319) | (29,534) | (36,129) | |||||||||||||||||||
| Net income (loss) | $ | 37,291 | $ | (20,740) | $ | 30,674 | $ | (46,112) | |||||||||||||||
| Earnings (loss) per share | |||||||||||||||||||||||
| Basic | $ | 0.46 | $ | (0.26) | $ | 0.38 | $ | (0.58) | |||||||||||||||
| Diluted | $ | 0.43 | $ | (0.26) | $ | 0.36 | $ | (0.58) | |||||||||||||||
| Weighted-average number of common shares outstanding | |||||||||||||||||||||||
| Basic | 81,316 | 80,224 | 81,161 | 80,016 | |||||||||||||||||||
| Diluted | 90,320 | 80,224 | 86,006 | 80,016 | |||||||||||||||||||
5
PEGASYSTEMS INC.
UNAUDITED RECONCILIATION OF SELECTED GAAP MEASURES TO NON-GAAP MEASURES (1)
(in thousands, except percentages and per share amounts)
| Three Months Ended June 30, | Six Months Ended June 30, | ||||||||||||||||||||||||||||||||||
| 2021 | 2020 | Change | 2021 | 2020 | Change | ||||||||||||||||||||||||||||||
| Net income (loss) - GAAP | $ | 37,291 | $ | (20,740) | * | $ | 30,674 | $ | (46,112) | * | |||||||||||||||||||||||||
Stock-based compensation(2) | 30,688 | 25,655 | 60,788 | 48,831 | |||||||||||||||||||||||||||||||
| Capped call transactions | (26,309) | (19,419) | (7,192) | (827) | |||||||||||||||||||||||||||||||
| Convertible senior notes | 675 | 4,315 | 1,348 | 6,033 | |||||||||||||||||||||||||||||||
| Headquarters lease | (6,266) | — | (9,683) | — | |||||||||||||||||||||||||||||||
| Amortization of intangible assets | 1,002 | 1,017 | 2,004 | 2,034 | |||||||||||||||||||||||||||||||
| Foreign currency transaction loss (gain) | 403 | (4,256) | 5,501 | 1,691 | |||||||||||||||||||||||||||||||
| Other | — | (2,758) | 12 | 1,141 | |||||||||||||||||||||||||||||||
Income tax effects(3) | (17,541) | (6,050) | (41,396) | (30,995) | |||||||||||||||||||||||||||||||
| Net income (loss) - Non-GAAP | $ | 19,943 | $ | (22,236) | * | $ | 42,056 | $ | (18,204) | * | |||||||||||||||||||||||||
| Diluted earnings (loss) per share - GAAP | $ | 0.43 | $ | (0.26) | * | $ | 0.36 | $ | (0.58) | * | |||||||||||||||||||||||||
| Non-GAAP adjustments | (0.20) | (0.02) | 0.13 | 0.35 | |||||||||||||||||||||||||||||||
| Diluted earnings (loss) per share - Non-GAAP | $ | 0.23 | $ | (0.28) | * | $ | 0.49 | $ | (0.23) | * | |||||||||||||||||||||||||
| Diluted weighted-average number of common shares outstanding - GAAP | 90,320 | 80,224 | 13 | % | 86,006 | 80,016 | 7 | % | |||||||||||||||||||||||||||
| Non-GAAP Adjustments | (4,443) | — | — | — | |||||||||||||||||||||||||||||||
| Diluted weighted-average number of common shares outstanding - Non-GAAP | 85,877 | 80,224 | 7 | % | 86,006 | 80,016 | 7 | % | |||||||||||||||||||||||||||
* not meaningful
(1) We believe that non-GAAP financial measures help investors understand our core operating results and prospects, consistent with how management measures and forecasts the Company’s performance without the effect of often one-time charges and other items outside our normal operations. The supplementary non-GAAP financial measures are not meant to be superior to, or a substitute for, results of operations prepared under U.S. GAAP.
Our Non-GAAP financial measures reflect the following adjustments:
•Stock-based compensation: We have excluded stock-based compensation from our Non-GAAP operating expenses and profitability measures. Although stock-based compensation is a key incentive offered to our employees, and we believe such compensation contributed to our revenues recognized during the periods presented and is expected to contribute to our future revenues, we continue to evaluate our business performance excluding stock-based compensation.
•Capped call transactions: We have excluded gains and losses related to our capped call transactions held at fair value under U.S. GAAP. The capped call transactions are generally expected to reduce common stock dilution and/or offset any potential cash payments the Company must make, other than for principal and interest, upon conversion of the Notes. We believe excluding these amounts from our non-GAAP financial measures is useful to investors as the types of events giving rise to them are not representative of our core business operations and ongoing operating performance. We reflect the effect of the capped call transactions on the weighted-average number of common shares outstanding in our non-GAAP financial measures as we believe it provides investors with useful information in evaluating our financial performance on a per-share basis.
•Convertible senior notes: In February 2020, we issued convertible senior notes with an aggregate principal amount of $600 million, due March 1, 2025, in a private placement. Under U.S. GAAP in 2020, the conversion feature was recorded as a reduction of the debt instrument’s book value which was amortized over the debt’s life. After our adoption of Accounting Standards Update 2020-06 on January 1, 2021, the conversion feature is no longer recorded as a reduction of the debt instrument’s book value which is amortized over the debt’s life. See “Note 2. New Accounting Pronouncements” and “Note 8. Debt” in our Quarterly Report on Form 10-Q for the quarter ended June 30, 2021 for additional information. In both periods, debt issuance costs reduce the debt instrument’s book value and are amortized over the debt’s life. We believe excluding the amortization of debt discount and issuance costs provides a useful comparison of our operational performance in different periods.
•Headquarters lease: In February 2021, the Company agreed to accelerate its exit from its Cambridge, Massachusetts headquarters to October 1, 2021, in exchange for a one-time payment from the Company’s landlord of $18 million. We believe excluding the impact from our non-GAAP financial measures is useful to investors as the modified lease, including the $18 million payment, is not representative of our core business operations and ongoing operating performance.
6
•Amortization of intangible assets: We have excluded the amortization of intangible assets from our Non-GAAP operating expenses and profitability measures. Amortization of intangible assets fluctuates in amount and frequency and is significantly affected by the timing and size of acquisitions. Investors should note that the use of intangible assets contributed to our revenues recognized during the periods presented and is expected to contribute to future revenues. Amortization of intangible assets is likely to recur in future periods.
•Foreign currency transaction loss (gain): We have excluded foreign currency transaction gains and losses from our Non-GAAP profitability measures. Foreign currency transaction gains and losses fluctuate in amount and frequency and are significantly affected by foreign exchange market rates. Foreign currency transaction gains and losses are likely to recur in future periods.
•Other: We have excluded gains and losses on our venture investments and incremental fees incurred due to the cancellation of in-person sales and marketing events due to the COVID-19 pandemic, including the live event portion of our 2020 PegaWorld conference. We believe excluding these amounts from our non-GAAP financial measures is useful to investors as the types of events giving rise to them are not representative of our core business operations and ongoing operating performance.
(2) Stock-based compensation:
| Three Months Ended June 30, | Six Months Ended June 30, | ||||||||||||||||||||||
| (in thousands) | 2021 | 2020 | 2021 | 2020 | |||||||||||||||||||
| Cost of revenue | $ | 5,849 | $ | 5,384 | $ | 11,774 | $ | 10,536 | |||||||||||||||
| Selling and marketing | 14,748 | 11,592 | 28,468 | 21,310 | |||||||||||||||||||
| Research and development | 6,343 | 5,805 | 13,113 | 11,302 | |||||||||||||||||||
| General and administrative | 3,748 | 2,874 | 7,433 | 5,683 | |||||||||||||||||||
| $ | 30,688 | $ | 25,655 | $ | 60,788 | $ | 48,831 | ||||||||||||||||
| Income tax benefit | $ | (6,192) | $ | (5,107) | $ | (12,183) | $ | (9,689) | |||||||||||||||
(3) Effective income tax rates:
| Six Months Ended June 30, | |||||||||||
| 2021 | 2020 | ||||||||||
| GAAP | (2,591) | % | 44 | % | |||||||
| Non-GAAP | 22 | % | 22 | % | |||||||
Our GAAP effective income tax rate is subject to significant fluctuations due to various factors, including excess tax benefits generated by our stock-based compensation plans, gains and losses on our capped call transactions, tax credits for stock-based compensation awards to research and development employees, and unfavorable foreign stock-based compensation adjustments. We determine our Non-GAAP income tax rate by using applicable rates in taxing jurisdictions and assessing certain factors, including our historical and forecasted earnings by jurisdiction, discrete items, and our ability to realize tax assets. We believe it is beneficial for our management to review our Non-GAAP results consistent with the effective income tax rate in our annual plan as established at the beginning of each year, given this tax rate volatility.
7
PEGASYSTEMS INC.
UNAUDITED CONDENSED CONSOLIDATED BALANCE SHEETS
(in thousands)
| June 30, 2021 | December 31, 2020 | ||||||||||
| Assets | |||||||||||
| Cash, cash equivalents, and marketable securities | $ | 411,337 | $ | 465,168 | |||||||
| Accounts receivable | 166,226 | 215,827 | |||||||||
| Unbilled receivables | 236,451 | 207,155 | |||||||||
| Other current assets | 96,215 | 88,760 | |||||||||
| Total current assets | 910,229 | 976,910 | |||||||||
| Unbilled receivables | 144,065 | 113,278 | |||||||||
| Goodwill | 82,173 | 79,231 | |||||||||
| Other long-term assets | 466,103 | 434,843 | |||||||||
| Total assets | $ | 1,602,570 | $ | 1,604,262 | |||||||
| Liabilities and stockholders’ equity | |||||||||||
| Accounts payable | $ | 22,931 | $ | 24,028 | |||||||
| Accrued expenses, including compensation and related expenses | 148,993 | 182,273 | |||||||||
| Deferred revenue | 242,194 | 232,865 | |||||||||
| Other current liabilities | 16,126 | 20,969 | |||||||||
| Total current liabilities | 430,244 | 460,135 | |||||||||
| Convertible senior notes, net | 589,092 | 518,203 | |||||||||
| Operating lease liabilities | 42,063 | 59,053 | |||||||||
| Other long-term liabilities | 18,703 | 24,699 | |||||||||
| Total liabilities | 1,080,102 | 1,062,090 | |||||||||
| Stockholders’ equity | 522,468 | 542,172 | |||||||||
| Total liabilities and stockholders’ equity | $ | 1,602,570 | $ | 1,604,262 | |||||||
PEGASYSTEMS INC.
UNAUDITED CONDENSED CONSOLIDATED STATEMENTS OF CASH FLOWS
(in thousands)
| Six Months Ended June 30, | |||||||||||
| 2021 | 2020 | ||||||||||
| Net income (loss) | $ | 30,674 | $ | (46,112) | |||||||
| Adjustments to reconcile net income (loss) to cash provided by (used in) operating activities | |||||||||||
| Non-cash items | 66,038 | 69,969 | |||||||||
| Change in operating assets and liabilities, net | (77,302) | (45,056) | |||||||||
| Cash provided by (used in) operating activities | 19,410 | (21,199) | |||||||||
| Cash provided by (used in) investing activities | 10,493 | (19,404) | |||||||||
| Cash (used in) provided by financing activities | (60,717) | 485,293 | |||||||||
| Effect of exchange rate changes on cash and cash equivalents | (1,207) | (942) | |||||||||
| Net (decrease) increase in cash and cash equivalents | (32,021) | 443,748 | |||||||||
| Cash and cash equivalents, beginning of period | 171,899 | 68,363 | |||||||||
| Cash and cash equivalents, end of period | $ | 139,878 | $ | 512,111 | |||||||
8
PEGASYSTEMS INC.
Revenue Detail
(in thousands, except percentages)
| (Dollars in thousands) | Three Months Ended June 30, | Change | Six Months Ended June 30, | Change | |||||||||||||||||||||||||||||||||||||||||||||||||
| 2021 | 2020 | 2021 | 2020 | ||||||||||||||||||||||||||||||||||||||||||||||||||
| Pega Cloud | $ | 73,293 | 23 | % | $ | 48,838 | 21 | % | $ | 24,455 | 50 | % | $ | 141,151 | 22 | % | $ | 92,304 | 19 | % | $ | 48,847 | 53 | % | |||||||||||||||||||||||||||||
Client Cloud (1) | $ | 183,078 | 56 | % | $ | 116,488 | 52 | % | $ | 66,590 | 57 | % | $ | 370,148 | 58 | % | $ | 280,440 | 57 | % | $ | 89,708 | 32 | % | |||||||||||||||||||||||||||||
| Maintenance | 78,782 | 24 | % | 72,222 | 33 | % | 6,560 | 9 | % | 154,343 | 24 | % | 145,917 | 30 | % | 8,426 | 6 | % | |||||||||||||||||||||||||||||||||||
| Term license | 104,296 | 32 | % | 44,266 | 19 | % | 60,030 | 136 | % | 215,805 | 34 | % | 134,523 | 27 | % | 81,282 | 60 | % | |||||||||||||||||||||||||||||||||||
Subscription (2) | $ | 256,371 | 79 | % | $ | 165,326 | 73 | % | 91,045 | 55 | % | $ | 511,299 | 80 | % | $ | 372,744 | 76 | % | 138,555 | 37 | % | |||||||||||||||||||||||||||||||
| Perpetual license | 12,596 | 4 | % | 9,057 | 4 | % | 3,539 | 39 | % | 18,048 | 3 | % | 12,716 | 3 | % | 5,332 | 42 | % | |||||||||||||||||||||||||||||||||||
| Consulting | 56,735 | 17 | % | 52,992 | 23 | % | 3,743 | 7 | % | 109,854 | 17 | % | 107,506 | 21 | % | 2,348 | 2 | % | |||||||||||||||||||||||||||||||||||
| $ | 325,702 | 100 | % | $ | 227,375 | 100 | % | $ | 98,327 | 43 | % | $ | 639,201 | 100 | % | $ | 492,966 | 100 | % | $ | 146,235 | 30 | % | ||||||||||||||||||||||||||||||
(1) Client Cloud is composed of maintenance and term revenue.
(2) Reflects client arrangements subject to renewal (Pega Cloud, maintenance, and term license).
PEGASYSTEMS INC.
ANNUAL CONTRACT VALUE (“ACV”)
(in thousands, except percentages)
Annual contract value (“ACV”) (1) - ACV, as reported, represents the annualized value of our active contracts as of the measurement date. The contract's total value is divided by its duration in years to calculate ACV for term license and Pega Cloud contracts. Maintenance revenue for the quarter then ended is multiplied by four to calculate ACV for maintenance. Client Cloud ACV is composed of maintenance ACV and term license ACV. ACV is a performance measure that we believe provides useful information to our management and investors, particularly during our Cloud Transition.
| June 30, 2021 | June 30, 2020 | Change | ||||||||||||||||||
| Pega Cloud | $ | 306,919 | $ | 210,741 | $ | 96,178 | 46 | % | ||||||||||||
| Client Cloud | $ | 592,516 | $ | 527,156 | $ | 65,360 | 12 | % | ||||||||||||
| Maintenance | 315,128 | 288,888 | 26,240 | 9 | % | |||||||||||||||
| Term license | 277,388 | 238,268 | 39,120 | 16 | % | |||||||||||||||
| Total | $ | 899,435 | $ | 737,897 | $ | 161,538 | 22 | % | ||||||||||||
(1) Foreign currency exchange rate changes contributed 3-4% to total ACV growth in 2021.
9
PEGASYSTEMS INC.
BACKLOG
(in thousands, except percentages)
Remaining performance obligations (“Backlog”) - Backlog represents expected future revenue on existing non-cancellable contracts.
| June 30, 2021 | ||||||||||||||||||||||||||||||||||||||
| Perpetual license | Term license | Maintenance | Pega Cloud | Consulting | Total | |||||||||||||||||||||||||||||||||
1 year or less | $ | 6,707 | $ | 46,146 | $ | 214,645 | $ | 281,793 | $ | 17,863 | $ | 567,154 | 56 | % | ||||||||||||||||||||||||
1-2 years | 234 | 15,708 | 59,164 | 194,841 | 2,675 | 272,622 | 26 | % | ||||||||||||||||||||||||||||||
2-3 years | — | 909 | 36,076 | 88,855 | 762 | 126,602 | 12 | % | ||||||||||||||||||||||||||||||
Greater than 3 years | — | 255 | 26,564 | 37,246 | 693 | 64,758 | 6 | % | ||||||||||||||||||||||||||||||
| $ | 6,941 | $ | 63,018 | $ | 336,449 | $ | 602,735 | $ | 21,993 | $ | 1,031,136 | 100 | % | |||||||||||||||||||||||||
| Change in Backlog Since June 30, 2020 | ||||||||||||||||||||||||||||||||||||||
| $ | (2,879) | $ | (3,825) | $ | 78,490 | $ | 145,344 | $ | (3,173) | $ | 213,957 | |||||||||||||||||||||||||||
| (29) | % | (6) | % | 30 | % | 32 | % | (13) | % | 26 | % | |||||||||||||||||||||||||||
| June 30, 2020 | ||||||||||||||||||||||||||||||||||||||
| Perpetual license | Term license | Maintenance | Pega Cloud | Consulting | Total | |||||||||||||||||||||||||||||||||
1 year or less | $ | 8,120 | $ | 53,550 | $ | 186,618 | $ | 191,187 | $ | 21,923 | $ | 461,398 | 57 | % | ||||||||||||||||||||||||
1-2 years | 1,700 | 6,187 | 40,153 | 140,860 | 1,986 | 190,886 | 23 | % | ||||||||||||||||||||||||||||||
2-3 years | — | 6,460 | 20,671 | 88,273 | 631 | 116,035 | 14 | % | ||||||||||||||||||||||||||||||
Greater than 3 years | — | 646 | 10,517 | 37,071 | 626 | 48,860 | 6 | % | ||||||||||||||||||||||||||||||
| $ | 9,820 | $ | 66,843 | $ | 257,959 | $ | 457,391 | $ | 25,166 | $ | 817,179 | 100 | % | |||||||||||||||||||||||||
10
Serious News for Serious Traders! Try StreetInsider.com Premium Free!
You May Also Be Interested In
- Pegasystems (PEGA) PT Lowered to $70 at JPMorgan
- Vishay Intertechnology Automotive Grade IHDF Edge-Wound Inductor With Low 15.4 mm Max. Profile Delivers Saturation Current to 230 A
- LTIMindtree Closes FY24 with a Strong Order Inflow of $5.6 Bn; up 15.7% YoY
Create E-mail Alert Related Categories
SEC FilingsSign up for StreetInsider Free!
Receive full access to all new and archived articles, unlimited portfolio tracking, e-mail alerts, custom newswires and RSS feeds - and more!
