

Form 8-K NEW JERSEY RESOURCES For: Aug 06
 Tweet
Tweet Share
ShareUNITED STATES
SECURITIES AND EXCHANGE COMMISSION
Washington, DC 20549
FORM 8-K
CURRENT REPORT
PURSUANT TO SECTION 13 OR 15(d) OF THE
SECURITIES EXCHANGE ACT OF 1934
Date of Report (Date of earliest event reported): August 6, 2019
NEW JERSEY RESOURCES CORPORATION
(Exact Name of registrant as specified in its charter)
| New Jersey | 001-08359 | 22-2376465 |
| (State or Other | (Commission | (IRS Employer |
| Jurisdiction | File Number) | Identification No.) |
| of Incorporation) | ||
| 1415 Wyckoff Road | ||
| Wall, New Jersey | 07719 | |
| (Address of Principal Executive Offices) | (Zip Code) | |
(732) 938-1480
(Registrant’s telephone number, including area code)
Check the appropriate box below if the Form 8-K filing is intended to simultaneously satisfy the filing obligation of the registrant under any of the following provisions:
| [ ] | Written communications pursuant to Rule 425 under the Securities Act (17 CFR 230.425) |
| [ ] | Soliciting material pursuant to Rule 14a-12 under the Exchange Act (17 CFR 240.14a-12) |
| [ ] | Pre-commencement communications pursuant to Rule 14d-2(b) under the Exchange Act (17 CFR 240.14d-2(b)) |
| [ ] | Pre-commencement communications pursuant to Rule 13e-4(c) under the Exchange Act (17 CFR 240.13e-4(c)) |
| Securities registered pursuant to Section 12(b) of the Act: | ||
| Title of each class | Trading Symbol(s) | Name of each exchange on which registered |
| Common Stock - $2.50 par value | NJR | New York Stock Exchange |
Indicate by check mark whether the registrant is an emerging growth company as defined in Rule 405 of the Securities Act of 1933 (§230.405 of this chapter) or Rule 12b-2 of the Securities Exchange Act of 1934 (§240.12b-2 of this chapter).
Emerging growth company [ ]
If an emerging growth company, indicate by check mark if the registrant has elected not to use the extended transition period for complying with any new or revised financial accounting standards provided pursuant to Section 13(a) of the Exchange Act. [ ]
Item 2.02 Results of Operations and Financial Condition.
On August 6, 2019, New Jersey Resources Corporation (“NJR”) issued a press release reporting financial results for the third fiscal quarter ended June 30, 2019 (the “Press Release”). A copy of the Press Release is attached hereto as Exhibit 99.1 and is incorporated herein by reference.
Item 7.01 Regulation FD Disclosure.
NJR will deliver a presentation to the financial community via live webcast on August 6, 2019, at 10 a.m. ET. The slides to be used for the presentation are furnished herewith as Exhibit 99.2 and are incorporated by reference into Item 7.01 of this Current Report on Form 8-K.
The information in Item 7.01 of this Current Report on Form 8-K is being furnished and shall not be deemed “filed” for the purposes of Section 18 of the Securities Exchange Act of 1934, as amended, or otherwise subject to the liabilities of that Section and shall not be deemed to be incorporated by reference into any registration statement or other document pursuant to the Securities Act of 1933, as amended.
Item 9.01 Financial Statements and Exhibits.
(d) Exhibits.
| Exhibit Number | Exhibit | |
| 99.1 | Press Release dated August 6, 2019 (furnished, not filed) | |
| 99.2 | Presentation dated August 6, 2019 (furnished, not filed) |
SIGNATURE
Pursuant to the requirements of the Securities Exchange Act of 1934, the registrant has duly caused this report to be signed on its behalf by the undersigned hereunto duly authorized.
| NEW JERSEY RESOURCES CORPORATION | |||
| Date: August 6, 2019 | By: | /s/ Patrick J. Migliaccio | |
| Patrick J. Migliaccio | |||
| Senior Vice President and Chief Financial | |||
| Officer | |||
EXHIBIT INDEX
| Exhibit | Description | |
| Number | ||
| 99.1 | Press Release dated August 6, 2019 (furnished, not filed) | |
| 99.2 | Presentation dated August 6, 2019 (furnished, not filed) |
| Media Contact: Michael Kinney 732-938-1031 [email protected] Investor Contact: Dennis Puma 732-938-1229 [email protected] |
NEW JERSEY RESOURCES REPORTS THIRD-QUARTER FISCAL 2019 RESULTS
WALL, N.J., August 6, 2019 — Today, New Jersey Resources (NYSE: NJR) reported results for the third-quarter of fiscal 2019. Highlights include:
| ● |
Consolidated net loss of $8.4 million, compared with a loss of $14.3 million in the third quarter of fiscal 2018 |
| ● |
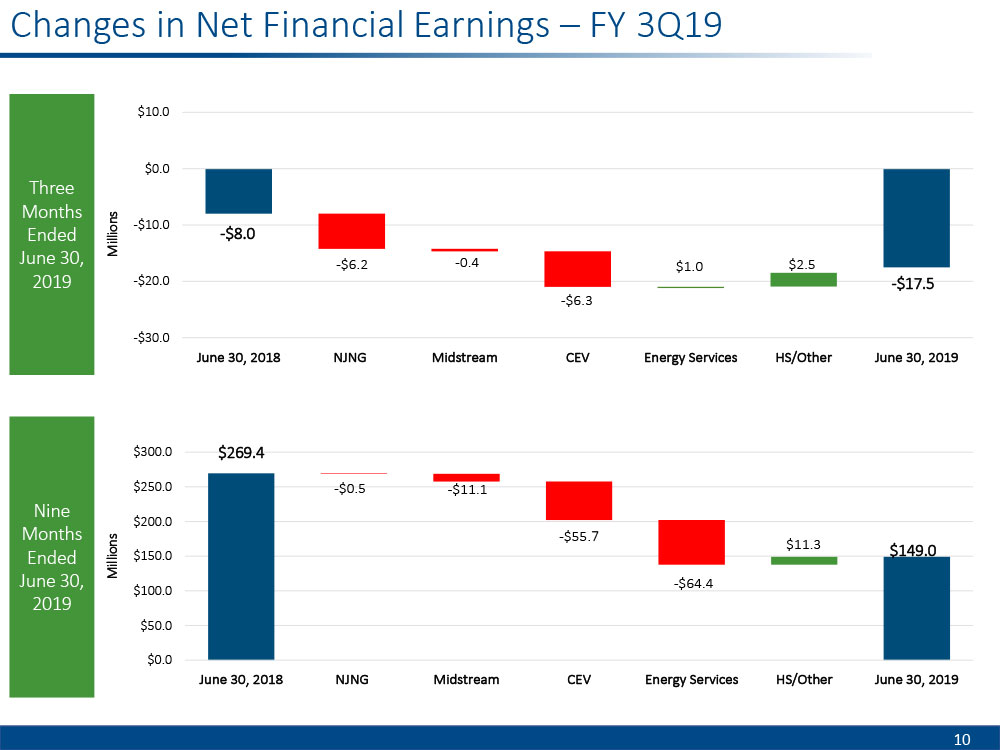
Consolidated net financial earnings (NFE), a non-GAAP financial measure, were a loss of $17.5 million, compared with a loss of $8.0 million in the third quarter of fiscal 2018 |
| ● |
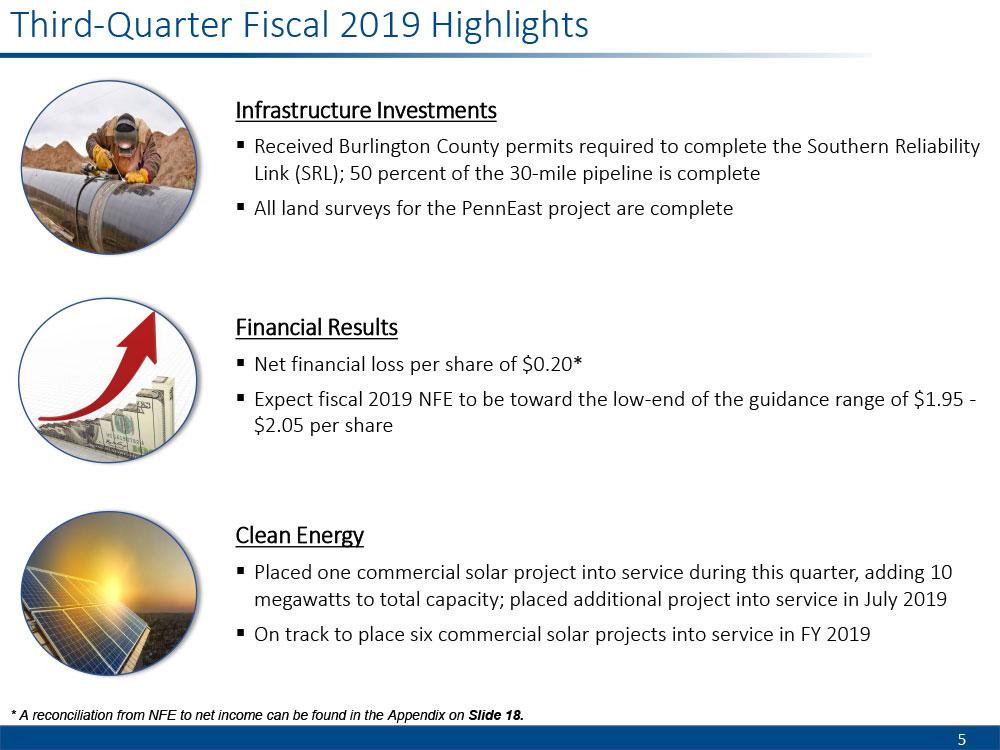
Reaffirmed NFE guidance for fiscal 2019 of $1.95 to $2.05 per share; expect to be toward the low-end of range |
| ● |
The Southern Reliability Link (SRL) received permits from Burlington County necessary to complete the project |
| ● |
The PennEast Project completed all land surveys |
| ● |
Clean Energy Ventures (CEV) on track to complete six commercial solar projects in fiscal 2019 that will add 50 megawatts (MW) of total capacity |
Third-quarter fiscal 2019 net loss totaled $8.4 million, or a loss of $0.09 per share, compared with a net loss of $14.3 million, or $0.16 per share, during the same period in fiscal 2018. Fiscal 2019 year-to-date net income totaled $151.4 million, or $1.70 per share, compared with $249.7 million, or $2.85 per share, during the same period in fiscal 2018.
The third-quarter net financial loss was $17.5 million, or $0.20 per share, compared with a loss of $8.0 million, or $0.09 per share, during the same period last year. Fiscal 2019 year-to-date NFE totaled $149.0 million, or $1.67 per share, compared with $269.4 million, or $3.08 per share, during the same period in fiscal 2018. The results during the first nine months of fiscal 2018 included an income tax benefit of $57.7 million, or $0.66 per share, due to the revaluation of deferred taxes resulting from the reduction in the federal corporate tax rate that did not recur in fiscal 2019. In addition, fiscal 2018 results included out-performance at Energy Services, driven by sustained cold weather and pricing volatility, which did not reoccur in the first nine months of fiscal 2019.
"The strength of our company has always been the dedication and hard work of our employees,” said Steve Westhoven, President and COO of New Jersey Resources. “Our performance and ability to execute our strategy, year after year, reflects that commitment. While we expect our results this year will be toward the low-end of our guidance range, we believe our portfolio of infrastructure investments positions us well for the future."
Key Performance Metrics
| Three Months Ended | Nine Months Ended | ||||||||||||
| June 30, | June 30, | ||||||||||||
| ($ in Thousands) | 2019 | 2018 | 2019 | 2018 | |||||||||
| Net (loss) income | $ | (8,402 | ) | $ | (14,274 | ) | $ | 151,419 | $ | 249,691 | |||
| Basic EPS | $ | (0.09 | ) | $ | (0.16 | ) | $ | 1.70 | $ | 2.85 | |||
| NFE | $ | (17,506 | ) | $ | (8,003 | ) | $ | 149,004 | $ | 269,392 | |||
| Basic NFE per share | $ | (0.20 | ) | $ | (0.09 | ) | $ | 1.67 | $ | 3.08 | |||
New Jersey Resources Reports Third-Quarter Fiscal 2019 Results
Page 2 of 15
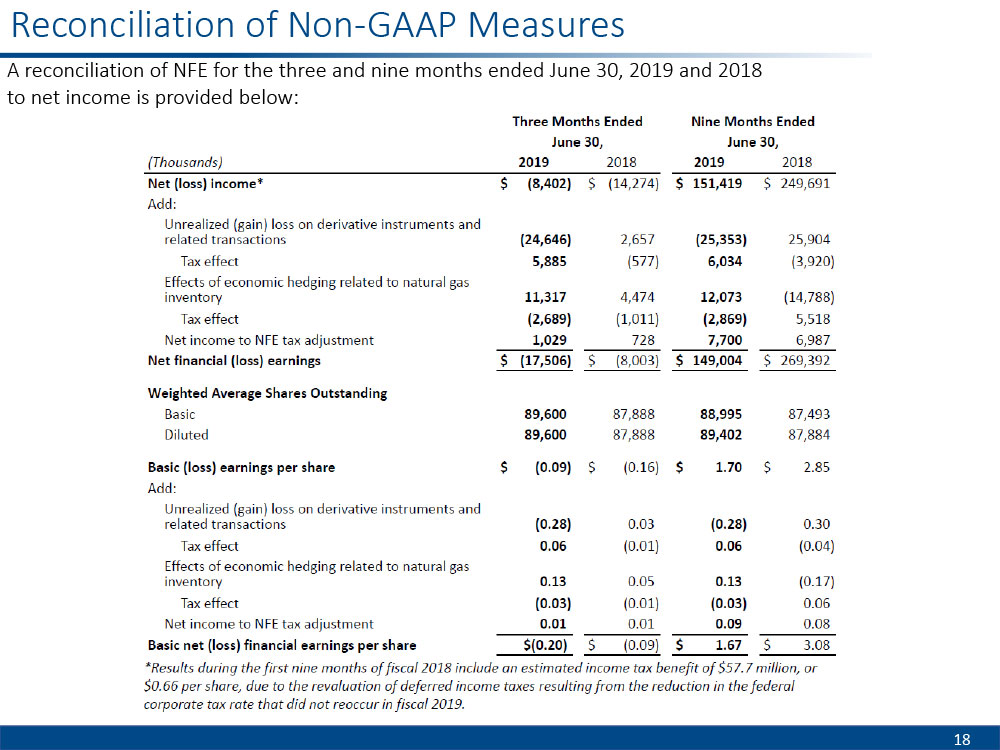
A reconciliation of net income to NFE for the three and nine months ended June 30, 2019, and 2018, is provided below.
| Three Months Ended | Nine Months Ended | |||||||||||||||
| June 30, | June 30, | |||||||||||||||
| (Thousands) | 2019 | 2018 | 2019 | 2018 | ||||||||||||
| Net (loss) income* | $ | (8,402 | ) | $ | (14,274 | ) | $ | 151,419 | $ | 249,691 | ||||||
| Add: | ||||||||||||||||
| Unrealized (gain) loss on derivative instruments and related transactions | (24,646 | ) | 2,657 | (25,353 | ) | 25,904 | ||||||||||
| Tax effect | 5,885 | (577 | ) | 6,034 | (3,920 | ) | ||||||||||
| Effects of economic hedging related to natural gas inventory | 11,317 | 4,474 | 12,073 | (14,788 | ) | |||||||||||
| Tax effect | (2,689 | ) | (1,011 | ) | (2,869 | ) | 5,518 | |||||||||
| Net income to NFE tax adjustment | 1,029 | 728 | 7,700 | 6,987 | ||||||||||||
| Net financial (loss) earnings | $ | (17,506 | ) | $ | (8,003 | ) | $ | 149,004 | $ | 269,392 | ||||||
| Weighted Average Shares Outstanding | ||||||||||||||||
| Basic | 89,600 | 87,888 | 88,995 | 87,493 | ||||||||||||
| Diluted | 89,600 | 87,888 | 89,402 | 87,884 | ||||||||||||
| Basic (loss) earnings per share | $ | (0.09 | ) | $ | (0.16 | ) | $ | 1.70 | $ | 2.85 | ||||||
| Add: | ||||||||||||||||
| Unrealized (gain) loss on derivative instruments and related transactions | (0.28 | ) | 0.03 | (0.28 | ) | 0.30 | ||||||||||
| Tax effect | 0.06 | (0.01 | ) | 0.06 | (0.04 | ) | ||||||||||
| Effects of economic hedging related to natural gas inventory | 0.13 | 0.05 | 0.13 | (0.17 | ) | |||||||||||
| Tax effect | (0.03 | ) | (0.01 | ) | (0.03 | ) | 0.06 | |||||||||
| Net income to NFE tax adjustment | 0.01 | 0.01 | 0.09 | 0.08 | ||||||||||||
| Basic net (loss) financial earnings per share | $ | (0.20 | ) | $ | (0.09 | ) | $ | 1.67 | $ | 3.08 | ||||||
*Results during the first nine months of fiscal 2018 include an estimated income-tax benefit of $57.7 million, or $0.66 per share, due to the revaluation of deferred income taxes resulting from the reduction in the federal corporate tax rate that did not reoccur in fiscal 2019.
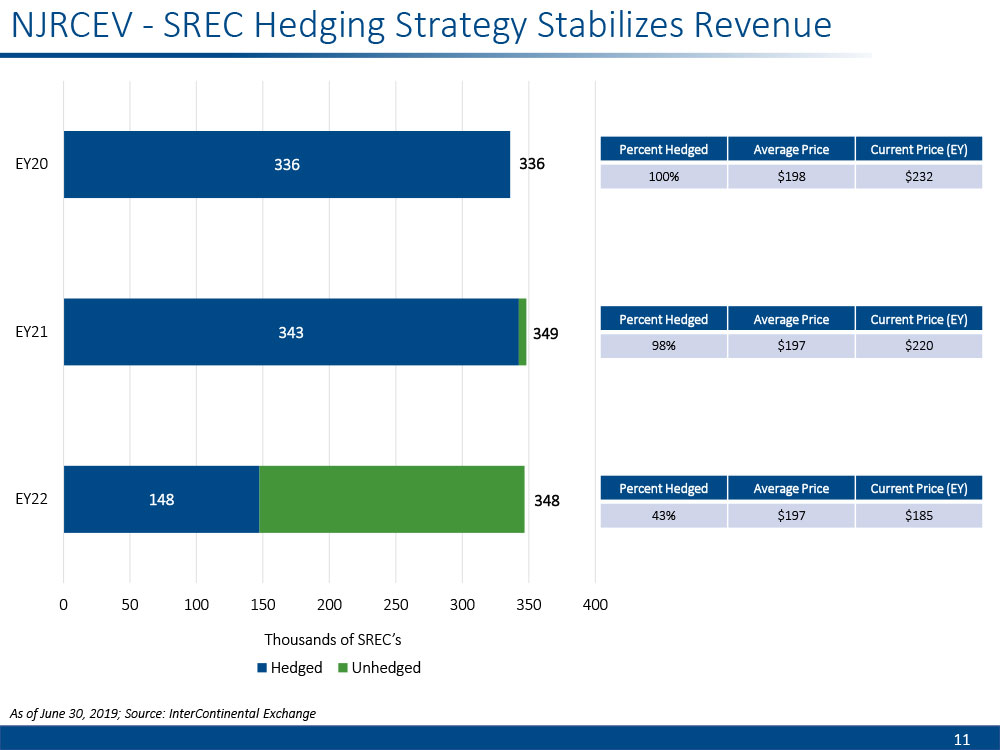
NFE is a financial measure not calculated in accordance with Generally Accepted Accounting Principles (GAAP) of the United States. It is a measure of earnings based on eliminating timing differences surrounding the recognition of certain gains or losses, net of applicable tax adjustments, to effectively match the earnings effects of the economic hedges with the physical sale of natural gas, Solar Renewable Energy Credits (SRECs) and foreign currency contracts. NFE eliminates the impact of volatility to GAAP earnings associated with unrealized gains and losses on derivative instruments in the current period. For further discussion of this financial measure, please see the explanation below under “Non-GAAP Financial Information.”
New Jersey Resources Reports Third-Quarter Fiscal 2019 Results
Page 3 of 15
A table detailing NFE for the three and nine months ended June 30, 2019, and 2018, is provided below.
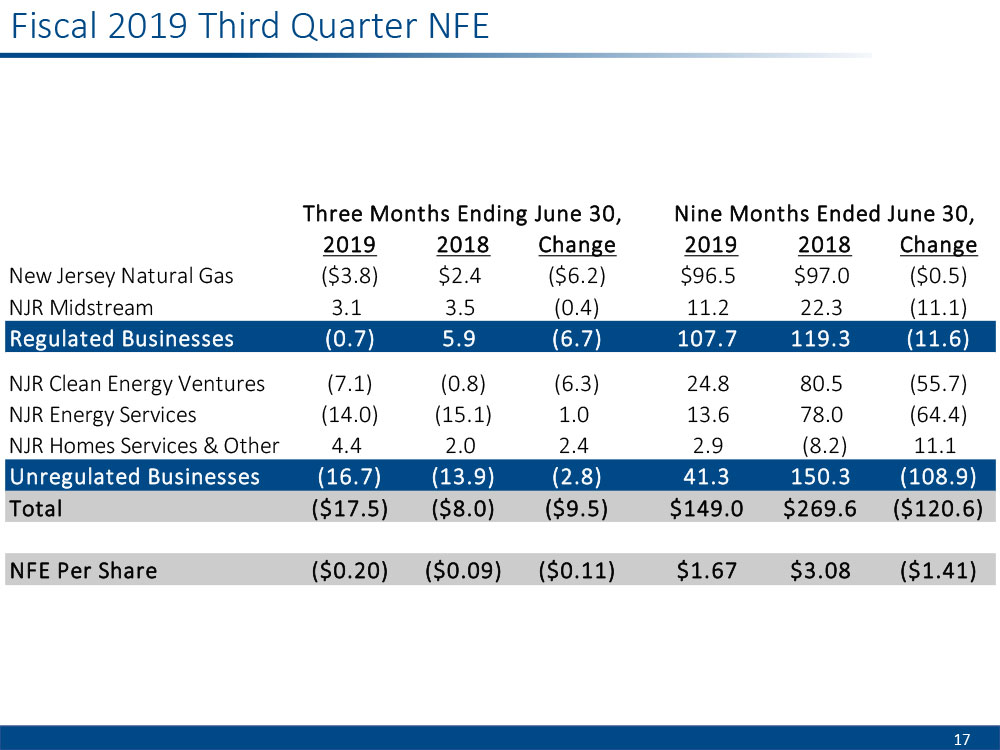
Net Financial (Loss) Earnings by Business Unit
| Three Months Ended | Nine Months Ended | |||||||||||||||
| June 30, | June 30, | |||||||||||||||
| (Thousands) | 2019 | 2018 | 2019 | 2018 | ||||||||||||
| New Jersey Natural Gas | $ | (3,795 | ) | $ | 2,440 | $ | 96,464 | $ | 96,991 | |||||||
| Midstream | 3,052 | 3,489 | 11,201 | 22,315 | ||||||||||||
| Subtotal Regulated | (743 | ) | 5,929 | 107,665 | 119,306 | |||||||||||
| Clean Energy Ventures | (7,138 | ) | (829 | ) | 24,797 | 80,472 | ||||||||||
| Energy Services | (14,030 | ) | (15,079 | ) | 13,644 | 78,027 | ||||||||||
| Home Services and Other | 4,437 | 1,993 | 2,932 | (8,211 | ) | |||||||||||
| Subtotal Unregulated | (16,731 | ) | (13,915 | ) | 41,373 | 150,288 | ||||||||||
| Subtotal | (17,474 | ) | (7,986 | ) | 149,038 | 269,594 | ||||||||||
| Eliminations | (32 | ) | (17 | ) | (34 | ) | (202 | ) | ||||||||
| Total | $ | (17,506 | ) | $ | (8,003 | ) | $ | 149,004 | $ | 269,392 | ||||||
NJR Reaffirms Fiscal 2019 NFE Guidance:
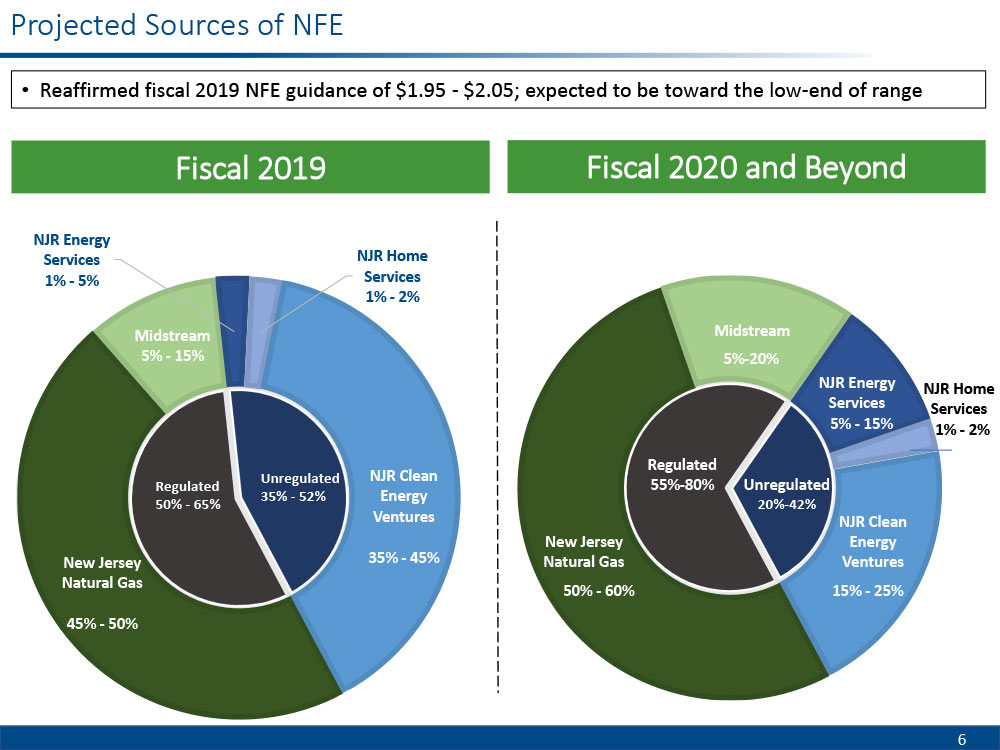
NJR reaffirmed fiscal 2019 NFE guidance of $1.95 to $2.05 per share, subject to the risks and uncertainties identified below under “Forward-Looking Statements.” Due to the continued under-performance of Energy Services, resulting from low price volatility this fiscal year, NJR expects to be at the low-end of the guidance range. The following chart represents NJR’s current expected contributions from its subsidiaries for fiscal 2019 and beyond:
| Expected Fiscal 2019 | Expected Fiscal 2020 and | |
| Net Financial Earnings | Beyond Net Financial Earnings | |
| Company | Contribution | Contribution |
| New Jersey Natural Gas | 45 to 50 percent | 50 to 60 percent |
| Midstream | 5 to 15 percent | 5 to 20 percent |
| Total Regulated | 50 to 65 percent | 55 to 80 percent |
| Clean Energy Ventures | 35 to 45 percent | 15 to 25 percent |
| Energy Services | 1 to 5 percent | 5 to 15 percent |
| Home Services and Other | 1 to 2 percent | 1 to 2 percent |
| Total Unregulated | 37 to 52 percent | 21 to 42 percent |
In providing fiscal 2019 NFE guidance, management is aware there could be differences between reported GAAP earnings and NFE due to matters such as, but not limited to, the positions of our energy-related derivatives. Management is not able to reasonably estimate the aggregate impact or significance of these items on reported earnings and, therefore, is not able to provide a reconciliation to the corresponding GAAP equivalent for its operating earnings guidance without unreasonable efforts.
New Jersey Resources Reports Third-Quarter Fiscal 2019 Results
Page 4 of 15
Regulated Business Update:
New Jersey Natural Gas (NJNG)
NJNG reported a third-quarter fiscal 2019 net financial loss of $3.8 million, compared with NFE of $2.4 million during the same period in fiscal 2018. Fiscal 2019 year-to-date NFE at NJNG were $96.5 million, compared with $97.0 million during the same period last year. The decrease in NFE for the quarter was due primarily to higher O&M expenses. The year-to-date decrease in NFE was due to lower Basic Gas Supply Service (BGSS) incentives, partially offset by an increase in rates related to existing infrastructure investments.
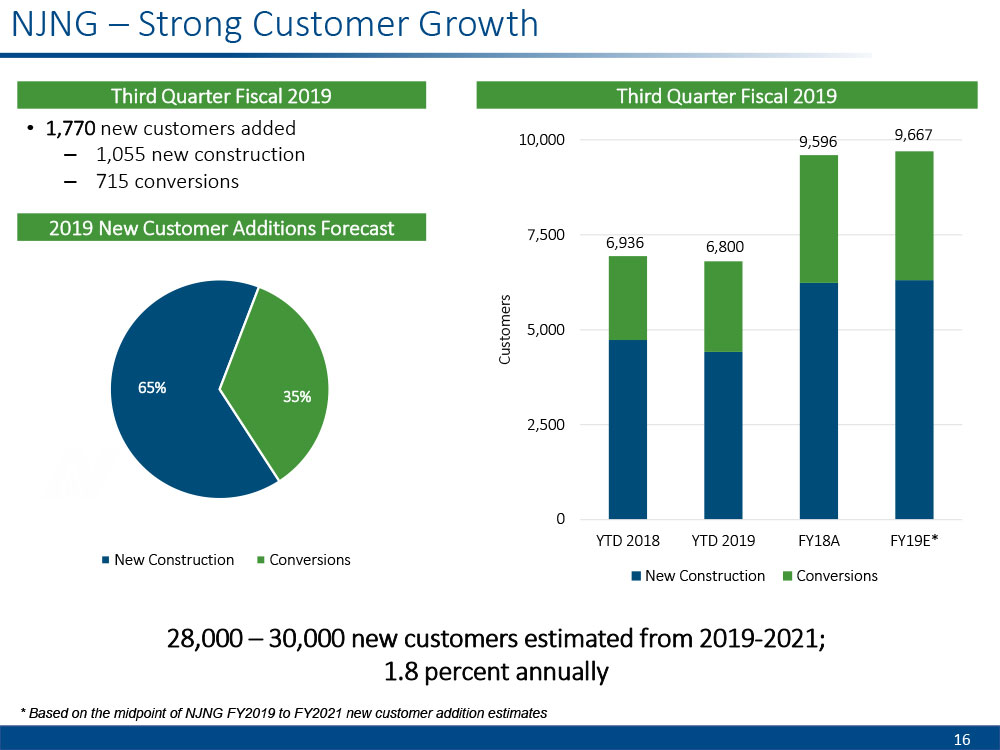
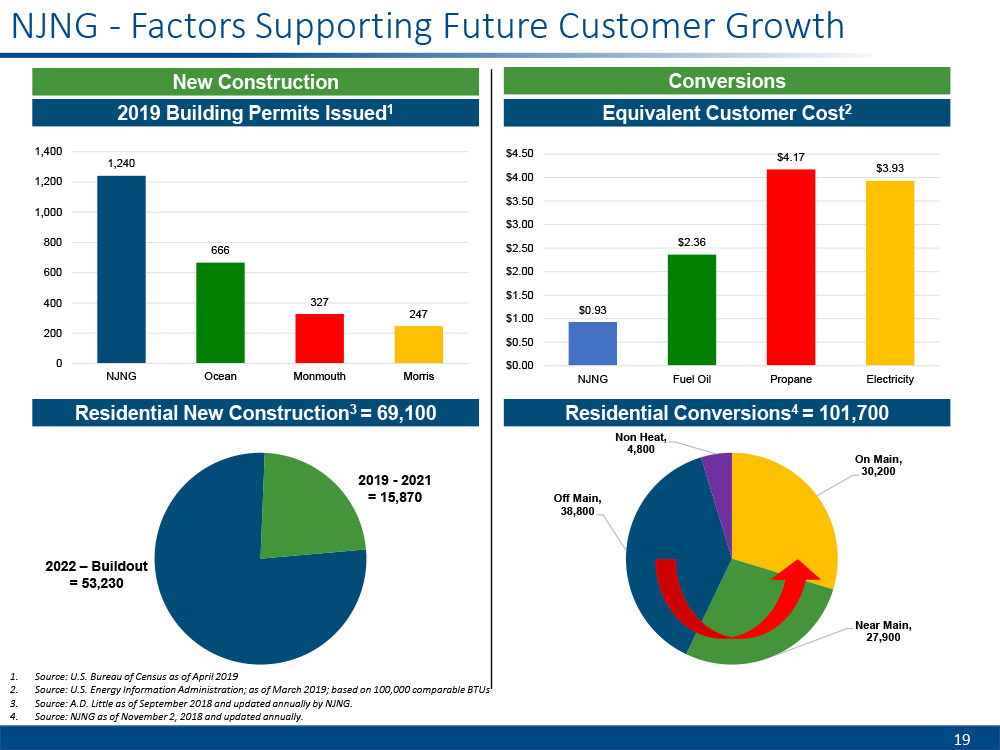
Customer Growth:
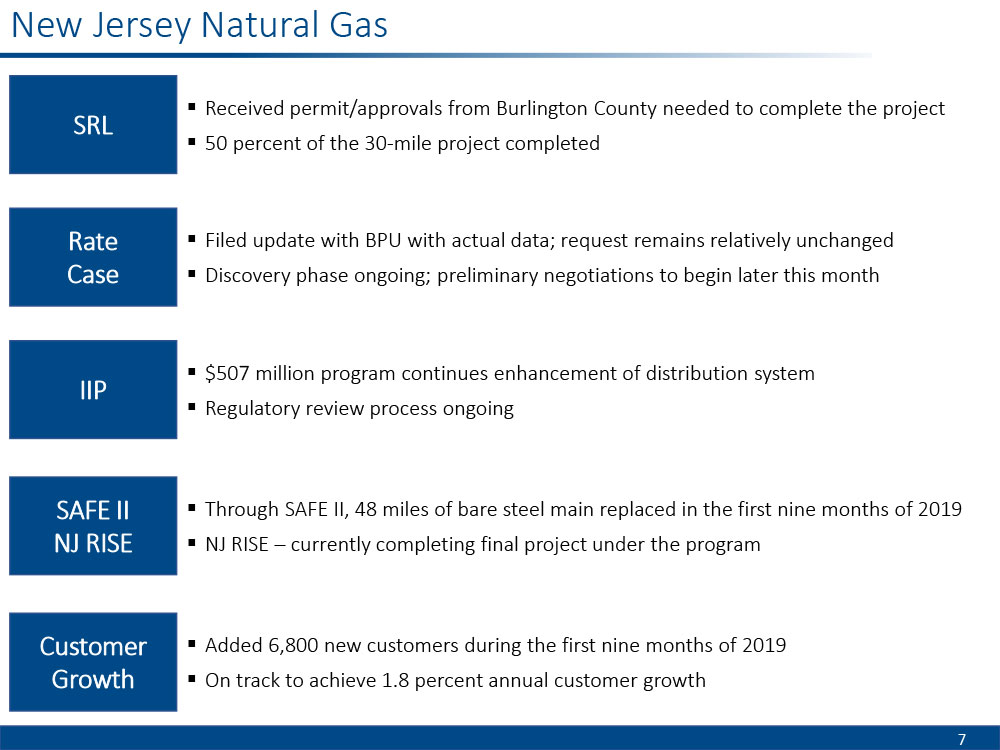
| ● | NJNG added 6,800 new customers during the first nine months of fiscal 2019, compared with 6,936 during the same period in fiscal 2018, primarily driven by the residential new construction market. In addition, 190 existing NJNG customers expanded their natural gas service during the first nine months of fiscal 2019. |
| ● | NJNG is on track to add between 28,000 and 30,000 new customers from fiscal 2019 through fiscal 2021, representing an average annual growth rate of 1.8 percent and a cumulative increase in utility gross margin of approximately $16 million. For more information on utility gross margin, please see “Non-GAAP Financial Information” on page 11 of this release. |
Base Rate Filing:
| ● | On March 29, 2019, NJNG filed a base rate case with the New Jersey Board of Public Utilities (BPU), seeking a $128.2 million increase to its base rates. The filing is based on an overall return of 7.87 percent, with a return on equity of 10.875 percent. The proposed increase reflects a 56.5 percent common equity component. On July 2, 2019, NJNG filed an update with the BPU with actual nine-month information through May 31, 2019. The requested increase was relatively unchanged. |
| ● | NJNG is also seeking permission from the BPU for a Phase II proceeding to request rate recovery for SRL upon completion. If approved, NJNG currently estimates an increase of approximately $28.5 million in base rates associated with the completion of the project. |
Infrastructure Update:
| ● | NJNG's Infrastructure Investment Program (IIP) was filed with the BPU on February 28, 2019, seeking approval to implement a five-year infrastructure investment program of $507 million. The IIP consists of two components, transmission and distribution investments and information technology replacement and enhancements. Pending BPU approval, these investments will be recovered through annual filings to adjust rates with recovery estimated to begin on October 1, 2020. |
| ● | The Southern Reliability Link (SRL), which is designed to diversify supply to our customers by providing a new interstate feed into the southern end of NJNG’s delivery system, began construction in the first-quarter of fiscal 2019. NJNG has requested a Phase II proceeding in its current base rate case to recover its capital costs. To date, nearly half of the 30-mile project has been completed. In addition, SRL has received permits from Burlington County required to complete the project. |
| ● | Safety Acceleration and Facilities Enhancement (SAFE) II is the five-year program approved by the BPU in September 2016 to replace the remaining 276 miles of unprotected steel main and associated services in NJNG’s distribution system. For the first nine months of fiscal 2019, NJNG invested $37.6 million to replace 48 miles of unprotected steel main and services. |
New Jersey Resources Reports Third-Quarter Fiscal 2019 Results
Page 5 of 15
| ● | The New Jersey Reinvestment in System Enhancement (NJ RISE) program is the five-year, $102.5 million investment that began in 2014. During the third quarter of fiscal 2019, NJNG continued construction to install a new distribution main into Long Beach Island. |
| ● | The SAFE II and NJ RISE programs are eligible for annual base rate increases. On March 29, 2019, NJNG filed its annual petition with the BPU, requesting a base rate increase of approximately $8.7 million for the recovery of the related capital costs through June 30, 2019. The filing was updated in July 2019 to reflect the actual results through June 30, 2019, which resulted in a revised base rate increase of $7.8 million, with changes expected to be effective October 1, 2019. |
BGSS Incentive Programs:
BGSS incentive programs contributed $2.5 million to utility gross margin in the third quarter of fiscal 2019, compared with $3 million during the same period in fiscal 2018. In Fiscal 2019 year-to-date, these programs contributed $5.9 million to utility gross margin, compared with $9.8 million during the same period of fiscal 2018. The lower results were due primarily to lower volumes in the capacity release program and lower margin from fewer opportunities for off-system sales and storage incentives. Total savings for NJNG customers through the BGSS incentive programs for the nine months ended June 30, 2019, were approximately $29.8 million.
Energy-Efficiency Programs:
The SAVEGREEN Project®, NJNG’s energy-efficiency program, invested $6.5 million during the third quarter of fiscal 2019 in grants and financing options designed to help customers with energy-efficiency upgrades for their homes and businesses.
Midstream
Midstream reported third-quarter fiscal 2019 NFE of $3.1 million, compared with $3.5 million during the same period in fiscal 2018, and fiscal year-to-date NFE of $11.2 million, compared with $22.3 million during the same period last year. The decrease in NFE during the quarter was primarily due to higher O&M expenses. The year-to-date decrease in NFE was due primarily to the effects of tax reform, which resulted in a tax benefit of $13.9 million recognized in fiscal 2018 that did not reoccur in fiscal 2019.
Infrastructure Updates:
| ● | The PennEast Project has completed all land surveys and plans to resubmit its application to the New Jersey Department of Environmental Protection (NJDEP) in August. Construction is expected to begin following the receipt of all governmental and regulatory permits. |
| ● | Adelphia Gateway is awaiting the Certificate of Public Convenience and Public Necessity from FERC. |
Unregulated Businesses Update:
Energy Services
Energy Services reported a third-quarter fiscal 2019 net financial loss of $14.0 million, compared with a net financial loss of $15.1 million during fiscal 2018. Fiscal 2019 year-to-date NFE were $13.6 million, compared with $78.0 million during the same period in fiscal 2018. The year-to-date change in NFE was primarily due to the lack of sustained cold weather and related pricing volatility this year compared with fiscal 2018.
New Jersey Resources Reports Third-Quarter Fiscal 2019 Results
Page 6 of 15
Clean Energy Ventures (CEV)
CEV reported a third-quarter fiscal 2019 net financial loss of $7.1 million, compared with net financial losses of $0.8 million in the same period last year. The decrease in NFE during the quarter was due primarily to higher O&M expenses and the absence of contributions from the wind portfolio, which was sold in February 2019. Fiscal 2019 year-to-date NFE were $24.8 million, compared with $80.5 million during the same period in fiscal 2018. The difference in NFE was due primarily to the effects of tax reform, which resulted in a tax benefit of $63.8 million recognized in fiscal 2018 that did not recur in fiscal 2019.
Solar Investment Update:
| ● | Placed the third commercial solar project of fiscal 2019 into service in Washington, N.J., adding 10.0 MW to total capacity. |
| ● | In July 2019, CEV placed the fourth commercial solar project of fiscal 2019 into service in Hazlet, N.J., adding 6.3 MW to total capacity. |
| ● | The Sunlight Advantage®, CEV's residential solar leasing program, added 190 residential customers and now serves over 7,800 residential customers in New Jersey. |
Home Services and Other Operations
In the third-quarter of fiscal 2019, Home Services and Other Operations reported NFE of $4.4 million, compared with NFE of $2.0 million in fiscal 2018. Fiscal 2019 year-to-date NFE were $2.9 million, compared with net financial losses of $8.2 million in fiscal 2018. The increase in NFE for both periods was due primarily to a change in contract revenue recognition and a decrease in income tax provision, which was caused by the impact of tax reform in fiscal 2018.
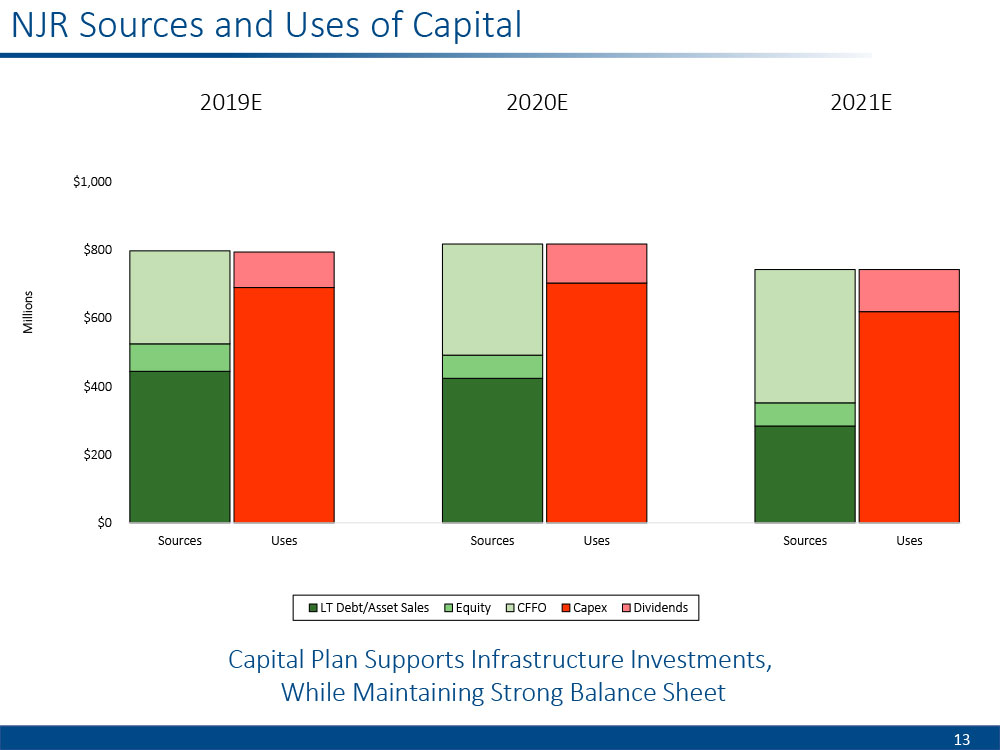
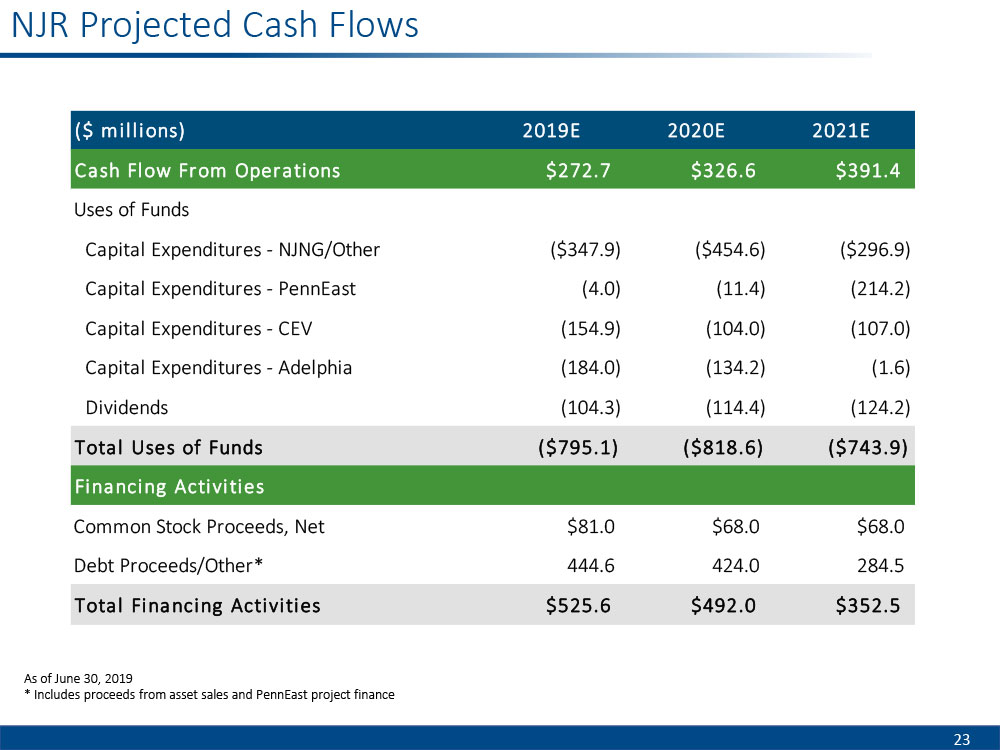
Capital Expenditures and Cash Flows:
NJR is committed to maintaining a strong financial profile, while continuing to invest capital in regulated and unregulated projects.
| ● | During the first nine months of fiscal 2019, NJR generated operating cash flows of $165.8 million, compared with $392.6 million during the same period in fiscal 2018. The decrease was due primarily to lower financial margin generated at Energy Services and increased working capital requirements. |
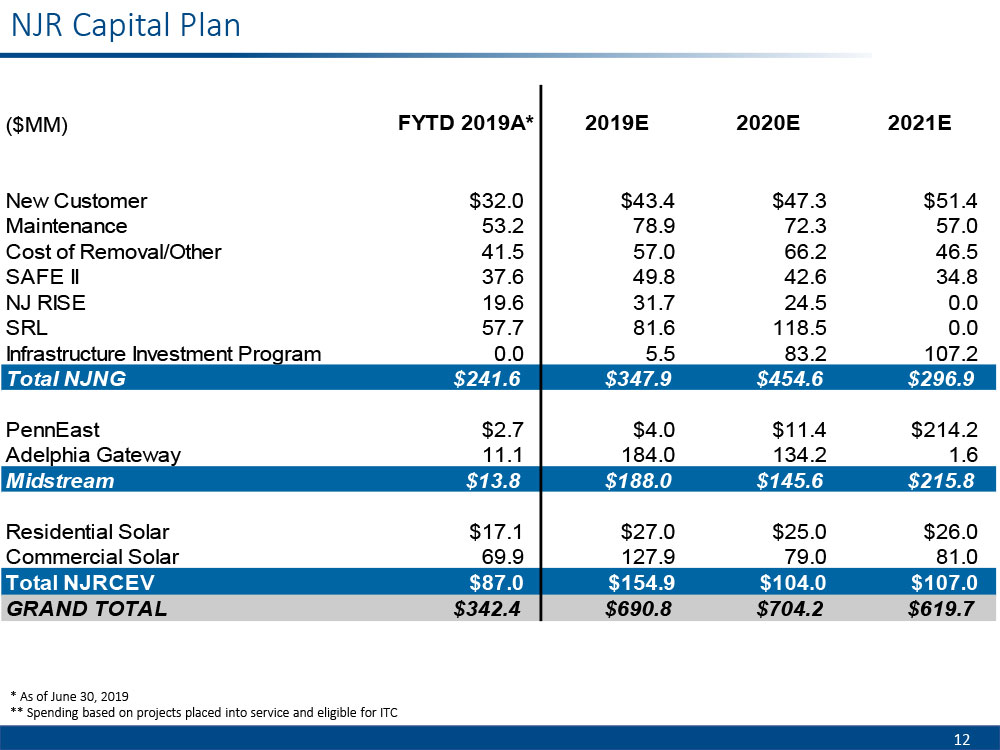
| ● | During the first nine months of fiscal 2019, capital expenditures were $408.7 million, of which $316.1 million were related to regulated assets, compared with capital expenditures of $284.4 million, of which $188.5 million were related to regulated assets, during the same period in fiscal 2018. The increase in capital expenditures is due primarily to the construction of SRL and other capital expenditures at NJNG. |
Webcast Information:
NJR will host a live webcast to discuss its financial results today at 10 a.m. ET. A few minutes prior to the webcast, go to njresources.com and select “Investor Relations,” then scroll down to the “Events & Presentations” section and click on the webcast link.
New Jersey Resources Reports Third-Quarter Fiscal 2019 Results
Page 7 of 15
Forward-Looking Statements:
This release contains forward-looking statements within the meaning of Section 27A of the Securities Act of 1933, as amended, Section 21E of the Securities Exchange Act of 1934, as amended, and the Private Securities Litigation Reform Act of 1995. NJR cautions readers that the assumptions forming the basis for forward-looking statements include many factors that are beyond NJR’s ability to control or estimate precisely, such as estimates of future market conditions and the behavior of other market participants. Words such as “anticipates,” “estimates,” “expects,” “projects,” “may,” “will,” “intends,” “plans,” “believes,” “should” and similar expressions may identify forward-looking statements and such forward-looking statements are made based upon management’s current expectations, assumptions and beliefs as of this date concerning future developments and their potential effect upon NJR. There can be no assurance that future developments will be in accordance with management’s expectations, assumptions and beliefs or that the effect of future developments on NJR will be those anticipated by management. Forward-looking statements in this release include, but are not limited to, certain statements regarding NJR’s NFE guidance for fiscal 2019, forecasted contribution of business segments to fiscal 2019 NFE and beyond, future NJNG customer and utility gross margin growth, future NJR capital expenditures, infrastructure investments, CEV's ITC-eligible projects and demand for residential solar, earnings and dividend growth, NJNG's base rate case, as well as the ability to close and successfully implement the Adelphia Gateway acquisition, and construct the SRL and PennEast Pipeline projects.
The factors that could cause actual results to differ materially from NJR’s expectations include, but are not limited to, risks associated with our investments in clean energy projects, including the availability of regulatory and tax incentives, the availability of viable projects, our eligibility for ITCs, the future market for SRECs and electricity prices, and operational risks related to projects in service; the ability to obtain governmental and regulatory approvals, land-use rights, electric grid connection (in the case of clean energy projects) and/or financing for the construction, development and operation of our unregulated energy investments, pipeline transportation systems and NJNG and Midstream infrastructure projects, including NJ RISE, SRL, PennEast and Adelphia Gateway, in a timely manner; risks associated with acquisitions and the related integration of acquired assets with our current operations, including our planned Adelphia Gateway acquisition; volatility of natural gas and other commodity prices and their impact on NJNG customer usage, NJNG’s BGSS incentive programs, our Energy Services segment operations and our risk management efforts; the ability to comply with current and future regulatory requirements; the level and rate at which NJNG’s costs and expenses are incurred and the extent to which they are approved for recovery from customers through the regulatory process, including through future base rate case filings; the impact of a disallowance of recovery of environmental-related expenditures and other regulatory changes; the performance of our subsidiaries; operating risks incidental to handling, storing, transporting and providing customers with natural gas; access to adequate supplies of natural gas and dependence on third-party storage and transportation facilities for natural gas supply; the regulatory and pricing policies of federal and state regulatory agencies; timing of qualifying for ITCs due to delays or failures to complete planned solar projects and the resulting effect on our effective tax rate and earnings; the results of legal or administrative proceedings with respect to claims, rates, environmental issues, natural gas cost prudence reviews and other matters; changes in rating agency requirements and/or credit ratings and their effect on availability and cost of capital to our company; risks related to cyber attack or failure of information technology systems; the impact of volatility in the equity and credit markets on our access to capital; the impact to the asset values and resulting higher costs and funding obligations of our pension and post-employment benefit plans as a result of potential downturns in the financial markets, lower discount rates, revised actuarial assumptions or impacts associated with the Patient Protection and Affordable Care Act; commercial and wholesale credit risks, including the availability of creditworthy customers and counterparties, and liquidity in the wholesale energy trading market; accounting effects and other risks associated with hedging activities and use of derivatives contracts; the ability to optimize our physical assets; weather and economic conditions; changes to tax laws and regulations; any potential need to record a valuation allowance for our deferred tax assets; the ability to comply with debt covenants; demographic changes in NJR’s service territory and their effect on NJR’s customer growth; the impact of natural disasters, terrorist activities and other extreme events on our operations and customers; the costs of compliance with present and future environmental laws, including potential climate change-related legislation; environmental-related and other uncertainties related to litigation or administrative proceedings; risks related to our employee workforce; and risks associated with the management of our joint ventures and partnerships. The aforementioned factors are detailed in the “Risk Factors” sections of our Form 10-K that we filed with the Securities and Exchange Commission (SEC) on November 20, 2018, which is available on the SEC’s Web site at sec.gov. Information included in this release is representative as of today only, and while NJR periodically reassesses material trends and uncertainties affecting NJR’s results of operations and financial condition in connection with its preparation of management’s discussion and analysis of results of operations and financial condition contained in its Quarterly and Annual Reports filed with the SEC, NJR does not, by including this statement, assume any obligation to review or revise any particular forward-looking statement referenced herein in light of future events.
New Jersey Resources Reports Third-Quarter Fiscal 2019 Results
Page 8 of 15
Non-GAAP Financial Information:
This release includes the non-GAAP financial measures NFE/net financial losses, financial margin and utility gross margin. A reconciliation of these non-GAAP financial measures to the most directly comparable financial measures calculated and reported in accordance with GAAP can be found below. As an indicator of NJR’s operating performance, these measures should not be considered an alternative to, or more meaningful than, net income or operating revenues as determined in accordance with GAAP. This information has been provided pursuant to the requirements of SEC Regulation G.
NFE/net financial loss and financial margin exclude unrealized gains or losses on derivative instruments related to the company’s unregulated subsidiaries and certain realized gains and losses on derivative instruments related to natural gas that has been placed into storage at Energy Services, net of applicable tax adjustments as described below. Volatility associated with the change in value of these financial instruments and physical commodity contracts is reported on the income statement in the current period. In order to manage its business, NJR views its results without the impacts of the unrealized gains and losses, and certain realized gains and losses, caused by changes in value of these financial instruments and physical commodity contracts prior to the completion of the planned transaction because it shows changes in value currently instead of when the planned transaction ultimately is settled. An annual estimated effective tax rate is calculated for NFE purposes and any necessary quarterly tax adjustment is applied to Clean Energy Ventures, as such the adjustment is related to tax credits generated by CEV.
NJNG’s utility gross margin represents the results of revenues less natural gas costs, sales, expenses and other taxes and regulatory rider expenses, which are key components of NJR’s operations. Natural gas costs, sales, expenses and other taxes and regulatory rider expenses are passed through to customers and, therefore, have no effect on utility gross margin. Management uses these non-GAAP financial measures as supplemental measures to other GAAP results to provide a more complete understanding of NJR’s performance. Management believes these non-GAAP financial measures are more reflective of NJR’s business model, provide transparency to investors and enable period-to-period comparability of financial performance. A reconciliation of all non-GAAP financial measures to the most directly comparable financial measures calculated and reported in accordance with GAAP can be found below. For a full discussion of NJR’s non-GAAP financial measures, please see NJR’s 2019 Form 10-K, Item 7.
About New Jersey Resources
New Jersey Resources (NYSE: NJR) is a Fortune 1000 company that, through its subsidiaries, provides safe and reliable natural gas and clean energy services, including transportation, distribution, asset management and home services. NJR is composed of five primary businesses:
| ● |
New Jersey Natural Gas, NJR’s principal subsidiary, operates and maintains over 7,500 miles of natural gas transportation and distribution infrastructure to serve over half a million customers in New Jersey’s Monmouth, Ocean, Morris, Middlesex and Burlington counties. |
| ● |
NJR Clean Energy Ventures invests in, owns and operates solar projects with a total capacity of more than 250 megawatts, providing residential and commercial customers with low-carbon solutions. |
| ● |
NJR Energy Services manages a diversified portfolio of natural gas transportation and storage assets and provides physical natural gas services and customized energy solutions to its customers across North America. |
| ● |
NJR Midstream serves customers from local distributors and producers to electric generators and wholesale marketers through its 50 percent equity ownership in the Steckman Ridge natural gas storage facility, as well as its 20 percent equity interest in the PennEast Pipeline Project. |
New Jersey Resources Reports Third-Quarter Fiscal 2019 Results
Page 9 of 15
| ● |
NJR Home Services provides service contracts as well as heating, central air conditioning, water heaters, standby generators, solar and other indoor and outdoor comfort products to residential homes throughout New Jersey. |
NJR and its more than 1,000 employees are committed to helping customers save energy and money by promoting conservation and encouraging efficiency through Conserve to Preserve® and initiatives such as The SAVEGREEN Project® and The Sunlight Advantage®.
For more information about NJR:
www.njresources.com.
Follow us on Twitter @NJNaturalGas.
“Like” us on facebook.com/NewJerseyNaturalGas.
Download our free NJR investor relations app for iPad, iPhone and Android.
NJR-E
New Jersey Resources Reports Third-Quarter Fiscal 2019 Results
Page 10 of 15
NEW JERSEY RESOURCES
CONDENSED CONSOLIDATED STATEMENTS OF OPERATIONS
(Unaudited)
| Three Months Ended | Nine Months Ended | |||||||||||||||
| June 30, | June 30, | |||||||||||||||
| (Thousands, except per share data) | 2019 | 2018 | 2019 | 2018 | ||||||||||||
| OPERATING REVENUES | ||||||||||||||||
| Utility | $ | 120,782 | $ | 104,538 | $ | 622,167 | $ | 631,389 | ||||||||
| Nonutility | 314,160 | 438,897 | 1,490,797 | 1,636,394 | ||||||||||||
| Total operating revenues | 434,942 | 543,435 | 2,112,964 | 2,267,783 | ||||||||||||
| OPERATING EXPENSES | ||||||||||||||||
| Gas purchases | ||||||||||||||||
| Utility | 54,861 | 53,080 | 280,627 | 227,268 | ||||||||||||
| Nonutility | 289,757 | 422,734 | 1,370,408 | 1,489,041 | ||||||||||||
| Related parties | 2,126 | 2,156 | 6,455 | 6,392 | ||||||||||||
| Operation and maintenance | 62,559 | 68,496 | 185,620 | 179,453 | ||||||||||||
| Regulatory rider expenses | 4,136 | 5,542 | 32,159 | 36,915 | ||||||||||||
| Depreciation and amortization | 23,149 | 20,320 | 67,292 | 64,634 | ||||||||||||
| Energy and other taxes | 2,373 | 7,822 | 8,678 | 45,855 | ||||||||||||
| Total operating expenses | 438,961 | 580,150 | 1,951,239 | 2,049,558 | ||||||||||||
| OPERATING (LOSS) INCOME | (4,019 | ) | (36,715 | ) | 161,725 | 218,225 | ||||||||||
| Other income, net | 1,829 | 1,731 | 5,456 | 8,735 | ||||||||||||
| Interest expense, net of capitalized interest | 11,648 | 11,037 | 37,643 | 34,740 | ||||||||||||
| (LOSS) INCOME BEFORE INCOME TAXES AND EQUITY IN EARNINGS OF AFFILIATES | (13,838 | ) | (46,021 | ) | 129,538 | 192,220 | ||||||||||
| Income tax benefit | (1,941 | ) | (28,534 | ) | (11,854 | ) | (47,801 | ) | ||||||||
| Equity in earnings of affiliates | 3,495 | 3,213 | 10,027 | 9,670 | ||||||||||||
| NET (LOSS) INCOME | $ | (8,402 | ) | $ | (14,274 | ) | $ | 151,419 | $ | 249,691 | ||||||
| (LOSS) EARNINGS PER COMMON SHARE | ||||||||||||||||
| Basic | $ | (0.09 | ) | $ | (0.16 | ) | $ | 1.70 | $ | 2.85 | ||||||
| Diluted | $ | (0.09 | ) | $ | (0.16 | ) | $ | 1.69 | $ | 2.84 | ||||||
| WEIGHTED AVERAGE SHARES OUTSTANDING | ||||||||||||||||
| Basic | 89,600 | 87,888 | 88,995 | 87,493 | ||||||||||||
| Diluted | 89,600 | 87,888 | 89,402 | 87,884 | ||||||||||||
NEW JERSEY RESOURCES REPORTS SECOND-QUARTER FISCAL 2019 RESULTS
Page 11 of 15
RECONCILIATION OF NON-GAAP PERFORMANCE MEASURES
| Three Months Ended | Nine Months Ended | |||||||||||||||
| June 30, | June 30, | |||||||||||||||
| (Thousands) | 2019 | 2018 | 2019 | 2018 | ||||||||||||
| NEW JERSEY RESOURCES | ||||||||||||||||
| A reconciliation of net income, the closest GAAP financial measurement, to net financial earnings is as follows: | ||||||||||||||||
| Net (loss) income | $ | (8,402 | ) | $ | (14,274 | ) | $ | 151,419 | $ | 249,691 | ||||||
| Add: | ||||||||||||||||
| Unrealized (gain) loss on derivative instruments and related transactions | (24,646 | ) | 2,657 | (25,353 | ) | 25,904 | ||||||||||
| Tax effect | 5,885 | (577 | ) | 6,034 | (3,920 | ) | ||||||||||
| Effects of economic hedging related to natural gas inventory | 11,317 | 4,474 | 12,073 | (14,788 | ) | |||||||||||
| Tax effect | (2,689 | ) | (1,011 | ) | (2,869 | ) | 5,518 | |||||||||
| Net income to NFE tax adjustment | 1,029 | 728 | 7,700 | 6,987 | ||||||||||||
| Net financial (loss) earnings | $ | (17,506 | ) | $ | (8,003 | ) | $ | 149,004 | $ | 269,392 | ||||||
| Weighted Average Shares Outstanding | ||||||||||||||||
| Basic | 89,600 | 87,888 | 88,995 | 87,493 | ||||||||||||
| Diluted | 89,600 | 87,888 | 89,402 | 87,884 | ||||||||||||
| A reconciliation of basic earnings per share, the closest GAAP financial measurement, to basic net financial earnings per share is as follows: | ||||||||||||||||
| Basic (loss) earnings per share | $ | (0.09 | ) | $ | (0.16 | ) | $ | 1.70 | $ | 2.85 | ||||||
| Add: | ||||||||||||||||
| Unrealized (gain) loss on derivative instruments and related transactions | $ | (0.28 | ) | $ | 0.03 | $ | (0.28 | ) | $ | 0.30 | ||||||
| Tax effect | $ | 0.06 | $ | (0.01 | ) | $ | 0.06 | $ | (0.04 | ) | ||||||
| Effects of economic hedging related to natural gas inventory | $ | 0.13 | $ | 0.05 | $ | 0.13 | $ | (0.17 | ) | |||||||
| Tax effect | $ | (0.03 | ) | $ | (0.01 | ) | $ | (0.03 | ) | $ | 0.06 | |||||
| Net income to NFE tax adjustment | $ | 0.01 | $ | 0.01 | $ | 0.09 | $ | 0.08 | ||||||||
| Basic NFE per share | $ | (0.20 | ) | $ | (0.09 | ) | $ | 1.67 | $ | 3.08 | ||||||
| NATURAL GAS DISTRIBUTION | ||||||||||||||||
| A reconciliation of operating revenue, the closest GAAP financial measurement, to utility gross margin is as follows: | ||||||||||||||||
| Operating revenues | $ | 120,782 | $ | 104,538 | $ | 622,167 | $ | 631,389 | ||||||||
| Less: | ||||||||||||||||
| Gas purchases | 57,187 | 55,404 | 294,536 | 282,147 | ||||||||||||
| Energy and other taxes | — | 5,493 | — | 35,770 | ||||||||||||
| Regulatory rider expense | 4,136 | 5,542 | 32,159 | 36,915 | ||||||||||||
| Utility gross margin | $ | 59,459 | $ | 38,099 | $ | 295,472 | $ | 276,557 | ||||||||
| CLEAN ENERGY VENTURES | ||||||||||||||||
| A reconciliation of net income to net financial earnings is as follows: | ||||||||||||||||
| Net (loss) income | $ | (8,167 | ) | $ | (1,557 | ) | $ | 17,097 | $ | 73,485 | ||||||
| Add: | ||||||||||||||||
| Net income to NFE tax adjustment | 1,029 | 728 | 7,700 | 6,987 | ||||||||||||
| Net financial (loss) earnings | $ | (7,138 | ) | $ | (829 | ) | $ | 24,797 | $ | 80,472 | ||||||
NEW JERSEY RESOURCES REPORTS SECOND-QUARTER FISCAL 2019 RESULTS
Page 12 of 15
| Three Months Ended | Nine Months Ended | |||||||||||||||
| (Unaudited) | June 30, | June 30, | ||||||||||||||
| (Thousands) | 2019 | 2018 | 2019 | 2018 | ||||||||||||
| ENERGY SERVICES | ||||||||||||||||
| The following table is a computation of financial margin: | ||||||||||||||||
| Operating revenues | $ | 290,021 | $ | 409,405 | $ | 1,425,113 | $ | 1,612,699 | ||||||||
| Less: Gas purchases | 290,881 | 423,861 | 1,373,784 | 1,492,418 | ||||||||||||
| Add: | ||||||||||||||||
| Unrealized (gain) loss on derivative instruments and related transactions | (24,684 | ) | 2,874 | (27,056 | ) | 24,498 | ||||||||||
| Effects of economic hedging related to natural gas inventory | 11,317 | 4,474 | 12,073 | (14,788 | ) | |||||||||||
| Financial margin | $ | (14,227 | ) | $ | (7,108 | ) | $ | 36,346 | $ | 129,991 | ||||||
| A reconciliation of operating income, the closest GAAP financial measurement, to financial margin is as follows: | ||||||||||||||||
| Operating (loss) income | $ | (4,345 | ) | $ | (25,122 | ) | $ | 36,285 | $ | 101,838 | ||||||
| Add: | ||||||||||||||||
| Operation and maintenance expense | 3,194 | 10,328 | 13,834 | 15,840 | ||||||||||||
| Depreciation and amortization | 23 | 21 | 75 | 50 | ||||||||||||
| Other taxes | 268 | 317 | 1,135 | 2,553 | ||||||||||||
| Subtotal | (860 | ) | (14,456 | ) | 51,329 | 120,281 | ||||||||||
| Add: | ||||||||||||||||
| Unrealized (gain) loss on derivative instruments and related transactions | (24,684 | ) | 2,874 | (27,056 | ) | 24,498 | ||||||||||
| Effects of economic hedging related to natural gas inventory | 11,317 | 4,474 | 12,073 | (14,788 | ) | |||||||||||
| Financial margin | $ | (14,227 | ) | $ | (7,108 | ) | $ | 36,346 | $ | 129,991 | ||||||
| A reconciliation of net income to net financial earnings is as follows: | ||||||||||||||||
| Net (loss) income | $ | (3,873 | ) | $ | (20,767 | ) | $ | 25,041 | $ | 66,163 | ||||||
| Add: | ||||||||||||||||
| Unrealized (gain) loss on derivative instruments and related transactions | (24,684 | ) | 2,874 | (27,056 | ) | 24,498 | ||||||||||
| Tax effect | 5,899 | (649 | ) | 6,455 | (3,364 | ) | ||||||||||
| Effects of economic hedging related to natural gas | 11,317 | 4,474 | 12,073 | (14,788 | ) | |||||||||||
| Tax effect | (2,689 | ) | (1,011 | ) | (2,869 | ) | 5,518 | |||||||||
| Net financial (loss) earnings | $ | (14,030 | ) | $ | (15,079 | ) | $ | 13,644 | $ | 78,027 | ||||||
| Home Services and Other | ||||||||||||||||
| A reconciliation of net income to net financial earnings is as follows: | ||||||||||||||||
| Net income (loss) | $ | 4,365 | $ | 2,128 | $ | 2,672 | $ | (7,982 | ) | |||||||
| Add: | ||||||||||||||||
| Unrealized loss (gain) on derivative instruments and related transactions | 100 | (204 | ) | 361 | (325 | ) | ||||||||||
| Tax effect | (28 | ) | 69 | (101 | ) | 96 | ||||||||||
| Net financial earnings (loss) | $ | 4,437 | $ | 1,993 | $ | 2,932 | $ | (8,211 | ) | |||||||
New Jersey Resources Reports Third-Quarter Fiscal 2019 Results
Page 13 of 15
FINANCIAL STATISTICS BY BUSINESS UNIT
(Unaudited)
| Three Months Ended | Nine Months Ended | |||||||||||||||
| June 30, | June 30, | |||||||||||||||
| (Thousands, except per share data) | 2019 | 2018 | 2019 | 2018 | ||||||||||||
| NEW JERSEY RESOURCES | ||||||||||||||||
| Operating Revenues | ||||||||||||||||
| Natural Gas Distribution | $ | 120,782 | $ | 104,538 | $ | 622,167 | $ | 631,389 | ||||||||
| Clean Energy Ventures | 11,450 | 15,348 | 37,707 | 42,210 | ||||||||||||
| Energy Services | 290,021 | 409,405 | 1,425,113 | 1,612,699 | ||||||||||||
| Midstream | — | — | — | — | ||||||||||||
| Home Services and Other | 13,082 | 14,759 | 37,905 | 32,977 | ||||||||||||
| Sub-total | 435,335 | 544,050 | 2,122,892 | 2,319,275 | ||||||||||||
| Eliminations | (393 | ) | (615 | ) | (9,928 | ) | (51,492 | ) | ||||||||
| Total | $ | 434,942 | $ | 543,435 | $ | 2,112,964 | $ | 2,267,783 | ||||||||
| Operating (Loss) Income | ||||||||||||||||
| Natural Gas Distribution | $ | (368 | ) | $ | (18,006 | ) | $ | 128,444 | $ | 118,070 | ||||||
| Clean Energy Ventures | (6,277 | ) | 2,550 | (8,025 | ) | (424 | ) | |||||||||
| Energy Services | (4,345 | ) | (25,122 | ) | 36,285 | 101,838 | ||||||||||
| Midstream | (952 | ) | (516 | ) | (2,659 | ) | (1,482 | ) | ||||||||
| Home Services and Other | 6,586 | 3,071 | 5,193 | (1,811 | ) | |||||||||||
| Sub-total | (5,356 | ) | (38,023 | ) | 159,238 | 216,191 | ||||||||||
| Eliminations | 1,337 | 1,308 | 2,487 | 2,034 | ||||||||||||
| Total | $ | (4,019 | ) | $ | (36,715 | ) | $ | 161,725 | $ | 218,225 | ||||||
| Equity in Earnings of Affiliates | ||||||||||||||||
| Midstream | $ | 4,167 | $ | 3,907 | $ | 11,966 | $ | 12,104 | ||||||||
| Eliminations | (672 | ) | (694 | ) | (1,939 | ) | (2,434 | ) | ||||||||
| Total | $ | 3,495 | $ | 3,213 | $ | 10,027 | $ | 9,670 | ||||||||
| Net (Loss) Income | ||||||||||||||||
| Natural Gas Distribution | $ | (3,795 | ) | $ | 2,440 | $ | 96,464 | $ | 96,991 | |||||||
| Clean Energy Ventures | (8,167 | ) | (1,557 | ) | 17,097 | 73,485 | ||||||||||
| Energy Services | (3,873 | ) | (20,767 | ) | 25,041 | 66,163 | ||||||||||
| Midstream | 3,052 | 3,489 | 11,201 | 22,315 | ||||||||||||
| Home Services and Other | 4,365 | 2,128 | 2,672 | (7,982 | ) | |||||||||||
| Sub-total | (8,418 | ) | (14,267 | ) | 152,475 | 250,972 | ||||||||||
| Eliminations | 16 | (7 | ) | (1,056 | ) | (1,281 | ) | |||||||||
| Total | $ | (8,402 | ) | $ | (14,274 | ) | $ | 151,419 | $ | 249,691 | ||||||
| Net Financial (Loss) Earnings | ||||||||||||||||
| Natural Gas Distribution | $ | (3,795 | ) | $ | 2,440 | $ | 96,464 | $ | 96,991 | |||||||
| Clean Energy Ventures | (7,138 | ) | (829 | ) | 24,797 | 80,472 | ||||||||||
| Energy Services | (14,030 | ) | (15,079 | ) | 13,644 | 78,027 | ||||||||||
| Midstream | 3,052 | 3,489 | 11,201 | 22,315 | ||||||||||||
| Home Services and Other | 4,437 | 1,993 | 2,932 | (8,211 | ) | |||||||||||
| Sub-total | (17,474 | ) | (7,986 | ) | 149,038 | 269,594 | ||||||||||
| Eliminations | (32 | ) | (17 | ) | (34 | ) | (202 | ) | ||||||||
| Total | $ | (17,506 | ) | $ | (8,003 | ) | $ | 149,004 | $ | 269,392 | ||||||
| Throughput (Bcf) | ||||||||||||||||
| NJNG, Core Customers | 21.6 | 22.0 | 88.9 | 94.5 | ||||||||||||
| NJNG, Off System/Capacity Management | 33.2 | 34.1 | 89.0 | 109.5 | ||||||||||||
| Energy Services Fuel Mgmt. and Wholesale Sales | 119.3 | 153.6 | 436.5 | 485.1 | ||||||||||||
| Total | 174.1 | 209.7 | 614.4 | 689.1 | ||||||||||||
| Common Stock Data | ||||||||||||||||
| Yield at June 30 | 2.4 | % | 2.4 | % | 2.4 | % | 2.4 | % | ||||||||
| Market Price at June 30 | $ | 49.77 | $ | 44.75 | $ | 49.77 | $ | 44.75 | ||||||||
| Shares Out. at June 30 | 89,918 | 88,212 | 89,918 | 88,212 | ||||||||||||
| Market Cap. at June 30 | $ | 4,475,212 | $ | 3,947,476 | $ | 4,475,212 | $ | 3,947,476 | ||||||||
New Jersey Resources Reports Third-Quarter Fiscal 2019 Results
Page 14 of 15
| Three Months Ended | Nine Months Ended | |||||||||||||||
| (Unaudited) | June 30, | June 30, | ||||||||||||||
| (Thousands, except customer and weather data) | 2019 | 2018 | 2019 | 2018 | ||||||||||||
| NATURAL GAS DISTRIBUTION | ||||||||||||||||
| Utility Gross Margin | ||||||||||||||||
| Operating revenues | $ | 120,782 | $ | 104,538 | $ | 622,167 | $ | 631,389 | ||||||||
| Less: | ||||||||||||||||
| Gas purchases | 57,187 | 55,404 | 294,536 | 282,147 | ||||||||||||
| Energy and other taxes | — | 5,493 | — | 35,770 | ||||||||||||
| Regulatory rider expense | 4,136 | 5,542 | 32,159 | 36,915 | ||||||||||||
| Total Utility Gross Margin | $ | 59,459 | $ | 38,099 | $ | 295,472 | $ | 276,557 | ||||||||
| Utility Gross Margin, Operating Income and Net Income | ||||||||||||||||
| Residential | $ | 35,914 | $ | 20,155 | $ | 199,698 | $ | 179,445 | ||||||||
| Commercial, Industrial & Other | 9,198 | 6,610 | 43,217 | 39,758 | ||||||||||||
| Firm Transportation | 10,259 | 6,857 | 42,526 | 43,294 | ||||||||||||
| Total Firm Margin | 55,371 | 33,622 | 285,441 | 262,497 | ||||||||||||
| Interruptible | 1,544 | 1,503 | 4,130 | 4,291 | ||||||||||||
| Total System Margin | 56,915 | 35,125 | 289,571 | 266,788 | ||||||||||||
| Off System/Capacity Management/FRM/Storage Incentive | 2,544 | 2,974 | 5,901 | 9,769 | ||||||||||||
| Total Utility Gross Margin | 59,459 | 38,099 | 295,472 | 276,557 | ||||||||||||
| Operation and maintenance expense | 43,912 | 41,842 | 120,302 | 115,352 | ||||||||||||
| Depreciation and amortization | 14,689 | 13,473 | 42,557 | 39,609 | ||||||||||||
| Other taxes not reflected in gross margin | 1,226 | 791 | 4,169 | 3,526 | ||||||||||||
| Operating (Loss) Income | $ | (368 | ) | $ | (18,006 | ) | $ | 128,444 | $ | 118,070 | ||||||
| Net (Loss) Income | $ | (3,795 | ) | $ | 2,440 | $ | 96,464 | $ | 96,991 | |||||||
| Net (Loss) Financial Earnings | $ | (3,795 | ) | $ | 2,440 | $ | 96,464 | $ | 96,991 | |||||||
| Throughput (Bcf) | ||||||||||||||||
| Residential | 5.9 | 6.6 | 43.0 | 42.7 | ||||||||||||
| Commercial, Industrial & Other | 1.2 | 1.4 | 9.0 | 8.2 | ||||||||||||
| Firm Transportation | 2.5 | 2.7 | 12.1 | 13.9 | ||||||||||||
| Total Firm Throughput | 9.6 | 10.7 | 64.1 | 64.8 | ||||||||||||
| Interruptible | 12.0 | 11.3 | 24.8 | 29.7 | ||||||||||||
| Total System Throughput | 21.6 | 22.0 | 88.9 | 94.5 | ||||||||||||
| Off System/Capacity Management | 33.2 | 34.1 | 89.0 | 109.5 | ||||||||||||
| Total Throughput | 54.8 | 56.1 | 177.9 | 204.0 | ||||||||||||
| Customers | ||||||||||||||||
| Residential | 484,720 | 472,382 | 484,720 | 472,382 | ||||||||||||
| Commercial, Industrial & Other | 29,223 | 28,321 | 29,223 | 28,321 | ||||||||||||
| Firm Transportation | 32,494 | 36,929 | 32,494 | 36,929 | ||||||||||||
| Total Firm Customers | 546,437 | 537,632 | 546,437 | 537,632 | ||||||||||||
| Interruptible | 32 | 32 | 32 | 32 | ||||||||||||
| Total System Customers | 546,469 | 537,664 | 546,469 | 537,664 | ||||||||||||
| Off System/Capacity Management* | 24 | 28 | 24 | 28 | ||||||||||||
| Total Customers | 546,493 | 537,692 | 546,493 | 537,692 | ||||||||||||
| *The number of customers represents those active during the last month of the period. | ||||||||||||||||
| Degree Days | ||||||||||||||||
| Actual | 362 | 529 | 4,495 | 4,523 | ||||||||||||
| Normal | 486 | 499 | 4,522 | 4,529 | ||||||||||||
| Percent of Normal | 74.5 | % | 106.0 | % | 99.4 | % | 99.9 | % | ||||||||
New Jersey Resources Reports Third-Quarter Fiscal 2019 Results
Page 15 of 15
| Three Months Ended | Nine Months Ended | |||||||||||||||
| (Unaudited) | June 30, | June 30, | ||||||||||||||
| (Thousands, except customer, SREC and megawatt) | 2019 | 2018 | 2019 | 2018 | ||||||||||||
| CLEAN ENERGY VENTURES | ||||||||||||||||
| Operating Revenues | ||||||||||||||||
| SREC sales | $ | 6,705 | $ | 7,756 | $ | 19,886 | $ | 20,050 | ||||||||
| Wind electricity sales and other | — | 3,675 | 5,177 | 11,963 | ||||||||||||
| Solar electricity sales and other | 2,441 | 1,934 | 6,018 | 4,477 | ||||||||||||
| Sunlight Advantage | 2,304 | 1,983 | 6,626 | 5,720 | ||||||||||||
| Total Operating Revenues | $ | 11,450 | $ | 15,348 | $ | 37,707 | $ | 42,210 | ||||||||
| Depreciation and Amortization | $ | 8,239 | $ | 6,702 | $ | 24,253 | $ | 24,565 | ||||||||
| Operating (Loss) Income | $ | (6,277 | ) | $ | 2,550 | $ | (8,025 | ) | $ | (424 | ) | |||||
| Income Tax Benefit | $ | (1,787 | ) | $ | (565 | ) | $ | (39,033 | ) | $ | (87,275 | ) | ||||
| Net (Loss) Income | $ | (8,167 | ) | $ | (1,557 | ) | $ | 17,097 | $ | 73,485 | ||||||
| Net Financial (Loss) Earnings | $ | (7,138 | ) | $ | (829 | ) | $ | 24,797 | $ | 80,472 | ||||||
| Solar Renewable Energy Certificates Generated | 96,590 | 65,159 | 197,041 | 153,215 | ||||||||||||
| Solar Renewable Energy Certificates Sold | 35,850 | 32,882 | 104,670 | 88,562 | ||||||||||||
| Solar Megawatts Eligible for ITCs | 11.9 | 25.1 | 34.7 | 28.7 | ||||||||||||
| Solar Megawatts Under Construction | 21.3 | 30.7 | 21.3 | 30.7 | ||||||||||||
| ENERGY SERVICES | ||||||||||||||||
| Operating Income | ||||||||||||||||
| Operating revenues | $ | 290,021 | $ | 409,405 | $ | 1,425,113 | $ | 1,612,699 | ||||||||
| Less: | ||||||||||||||||
| Gas purchases | 290,881 | 423,861 | 1,373,784 | 1,492,418 | ||||||||||||
| Operation and maintenance expense | 3,194 | 10,328 | 13,834 | 15,840 | ||||||||||||
| Depreciation and amortization | 23 | 21 | 75 | 50 | ||||||||||||
| Energy and other taxes, net | 268 | 317 | 1,135 | 2,553 | ||||||||||||
| Operating (Loss) Income | $ | (4,345 | ) | $ | (25,122 | ) | $ | 36,285 | $ | 101,838 | ||||||
| Net (Loss) Income | $ | (3,873 | ) | $ | (20,767 | ) | $ | 25,041 | $ | 66,163 | ||||||
| Financial Margin | $ | (14,227 | ) | $ | (7,108 | ) | $ | 36,346 | $ | 129,991 | ||||||
| Net Financial (Loss) Earnings | $ | (14,030 | ) | $ | (15,079 | ) | $ | 13,644 | $ | 78,027 | ||||||
| Gas Sold and Managed (Bcf) | 119.3 | 153.6 | 436.5 | 485.1 | ||||||||||||
| MIDSTREAM | ||||||||||||||||
| Equity in Earnings of Affiliates | $ | 4,167 | $ | 3,907 | $ | 11,966 | $ | 12,104 | ||||||||
| Other Income, Net | $ | 1,088 | $ | 1,558 | $ | 6,434 | $ | 4,135 | ||||||||
| Income Tax Provision (Benefit) | $ | 729 | $ | 989 | $ | 2,910 | $ | (8,723 | ) | |||||||
| Net Income | $ | 3,052 | $ | 3,489 | $ | 11,201 | $ | 22,315 | ||||||||
| HOME SERVICES AND OTHER | ||||||||||||||||
| Operating Revenues | $ | 13,082 | $ | 14,759 | $ | 37,905 | $ | 32,977 | ||||||||
| Operating Income (Loss) | $ | 6,586 | $ | 3,071 | $ | 5,193 | $ | (1,811 | ) | |||||||
| Other (Expense) Income , Net | $ | (99 | ) | $ | 49 | $ | (247 | ) | $ | 5,350 | ||||||
| Net Income (Loss) | $ | 4,365 | $ | 2,128 | $ | 2,672 | $ | (7,982 | ) | |||||||
| Net Financial Earnings (Loss) | $ | 4,437 | $ | 1,993 | $ | 2,932 | $ | (8,211 | ) | |||||||
| Total Service Contract Customers at June 30 | 108,980 | 110,314 | 108,980 | 110,314 | ||||||||||||


Serious News for Serious Traders! Try StreetInsider.com Premium Free!
You May Also Be Interested In
- New Jersey Resources Board of Directors Declares Quarterly Dividend
- RedTeam Announces "RedTeam on the Road" Event Series to Empower Construction Professionals
- Moomoo and Nasdaq Announce Global Strategic Partnership
Create E-mail Alert Related Categories
SEC FilingsSign up for StreetInsider Free!
Receive full access to all new and archived articles, unlimited portfolio tracking, e-mail alerts, custom newswires and RSS feeds - and more!
