

Form 8-K MEDICAL PROPERTIES TRUST For: Apr 29
 Tweet
Tweet Share
ShareExhibit 99.1

| Contact: Drew Babin, CFA | ||||
| Senior Managing Director – Corporate Communications | ||||
| Medical Properties Trust, Inc. | ||||
| (646) 884-9809 | ||||
| [email protected] |
MEDICAL PROPERTIES TRUST, INC. REPORTS FIRST QUARTER RESULTS
Per Share Net Income of $0.28 and Normalized FFO of $0.42 in First Quarter
Per Share NFFO Growth Exceeding 13% Compared to Prior-Year Quarter
Year-to-Date Investments of Approximately $1.6 Billion
Birmingham, AL – April 29, 2021 – Medical Properties Trust, Inc. (the “Company” or “MPT”) (NYSE: MPW) today announced financial and operating results for the first quarter ended March 31, 2021 as well as certain events occurring subsequent to quarter end.
| • | Net income of $0.28 and Normalized Funds from Operations (“NFFO”) of $0.42 for the 2021 first quarter on a per diluted share basis, well in line with portfolio run-rate guidance; |
| • | Closed in January on the previously disclosed £800 million real estate investment in behavioral health properties in the UK operated by Priory Group (“Priory”); |
| • | Issued £850 million in senior notes due 2026 and 2030 at a blended rate of 2.9% with proceeds used to permanently fund the Priory acquisitions; |
| • | Completed a follow-on equity offering generating net proceeds of $711 million and sold approximately 8.0 million common shares from early March through the Company’s “at-the-market” program for additional net proceeds of approximately $173 million; |
| • | Hospital tenants uniformly reporting continued strong operating and financial performance. |
“The rapid pace of accretive growth we have created in recent years is showing no signs of slowing,” said Edward K. Aldag, Jr., MPT’s Chairman, President, and Chief Executive Officer. “The positive attention brought to the need for hospitals during the COVID pandemic worldwide, and the essential role of MPT’s tenants has never been so clear. Demand for our capital is strong, and our proven ability to execute large, complex transactions continues to give us a strong competitive advantage in this rapidly expanding market.”
Mr. Aldag continued, “Our operators are well-capitalized, and their fundamentals returned to very close to normalized levels more than nine months ago and remain there today. We have observed that these levels of operations are consistent with recently reported quarterly results of the top publicly held operators in the nation.”
1
Included in the financial tables accompanying this press release is information about the Company’s assets and liabilities, net income, and reconciliations of net income to NFFO, all on a basis comparable to 2020 results, and reconciliations of total assets to pro forma total gross assets and total revenues to total adjusted revenues.
PORTFOLIO UPDATE
During and subsequent to the first quarter, MPT continued to execute on accretive acquisitions.
MPT expects to replace the £800 million Priory real estate loan with sale-leaseback transactions involving 35 properties by the end of the second quarter, at which time the Company will begin to recognize a GAAP investment yield of 8.6%.
Through today, MPT made additional investments of approximately $158 million and $335 million, respectively, in its tenants Swiss Medical Network and Steward Health Care System (“Steward”). Swiss Medical, the Company’s tenant through its Infracore investment, is the second largest private operator of hospitals in Switzerland, a nation known for world-class healthcare delivery and an affluent, aging population. At an attractive investment entry point, MPT stands to benefit from greater alignment with Infracore and Swiss Medical, additional insight into the Swiss hospital system, and desirable real estate opportunities as Swiss Medical continues to consolidate a fragmented hospital landscape.
Proceeds of the $335 million loan to Steward were used to redeem a similarly sized convertible loan from Steward’s former private equity sponsor. Terms include opportunities for attractive participation in the value of Steward’s growth as it demonstrates fundamental success consistent with recent reports from public hospital operators. Pursuant to its existing 9.9% equity interest in Steward and a direct realization of the operational strength noted above, MPT received cash distributions during the quarter of $11.0 million.
The Company has pro forma total gross assets of approximately $20.9 billion, including $15.2 billion in general acute care hospitals, $2.1 billion in inpatient rehabilitation hospitals, $1.7 billion in behavioral health facilities, $0.3 billion in long-term acute care hospitals, and $0.3 billion in freestanding emergency room and urgent care properties. MPT’s portfolio, pro forma for the transactions described herein, includes 425 properties representing roughly 44,000 licensed beds across the United States and in Germany, the United Kingdom, Switzerland, Italy, Spain, Portugal, Australia, and Colombia. The properties are leased to or mortgaged by 51 hospital operating companies. MPT continues to work with existing and new operators in the U.S. and abroad on numerous opportunities.
OPERATING RESULTS AND OUTLOOK
Net income for the first quarter ended March 31, 2021 was $164 million (or $0.28 per diluted share) compared to $81 million (or $0.15 per diluted share) in the year earlier period.
NFFO for the first quarter ended March 31, 2021 was $244 million ($0.42 per diluted share) compared to $191 million ($0.37 per diluted share) in the year earlier period.
Based on year-to-date transactions, including the Priory sale-leaseback transaction, along with an assumed capital structure resulting in a net debt to EBITDA ratio between 5.0 and 6.0 times, MPT expects an annual run-rate of $1.14 to $1.18 per diluted share for net income and $1.72 to $1.76 per diluted share for NFFO. Included in the annual run-rate estimate but not included in annualized actual results for the first quarter are timing adjustments related to investment and capital markets transactions closed during the quarter, the annualized difference between the 8.6% Priory GAAP lease rate and the current loan interest rate, and the
2
aggregate earnings contribution from two hospitals under development and various expansion projects where rent has not yet commenced. While interest income from the £250 million non-real estate acquisition loan related to the Priory transaction was included in first quarter actual results, it is not included in annual run-rate guidance due to its temporary nature.
These estimates do not include the effects, if any, of unexpected real estate operating costs, changes in accounting pronouncements, litigation costs, debt refinancing costs, acquisition costs, currency exchange rate movements, interest rate hedging activities, write-offs of straight-line rent or other non-recurring or unplanned transactions. Moreover, these estimates do not provide for the impact on MPT or its tenants and borrowers from the global COVID-19 pandemic. These estimates may change if the Company acquires or sells assets in amounts that are different from estimates, market interest rates change, debt is refinanced, new shares are issued, additional debt is incurred, other operating expenses vary, income from equity investments vary from expectations, or existing leases or loans do not perform in accordance with their terms.
CONFERENCE CALL AND WEBCAST
The Company has scheduled a conference call and webcast for Thursday, April 29, 2021 at 11:00 a.m. Eastern Time to present the Company’s financial and operating results for the quarter ended March 31, 2021. The dial-in numbers for the conference call are 844-535-3969 (U.S. and Canada) and 409-937-8903 (International); both numbers require passcode 9845178. The conference call will also be available via webcast in the Investor Relations section of the Company’s website, www.medicalpropertiestrust.com.
A telephone and webcast replay of the call will be available beginning shortly after the call’s completion through May 13, 2021. Dial-in numbers for the replay are 855-859-2056 and 404-537-3406 for U.S./Canada and International callers, respectively. The replay passcode for all callers is 9845178.
The Company’s supplemental information package for the current period will also be available on the Company’s website in the Investor Relations section.
The Company uses, and intends to continue to use, the Investor Relations page of its website, which can be found at www.medicalpropertiestrust.com, as a means of disclosing material nonpublic information and of complying with its disclosure obligations under Regulation FD, including, without limitation, through the posting of investor presentations that may include material nonpublic information. Accordingly, investors should monitor the Investor Relations page, in addition to following our press releases, SEC filings, public conference calls, presentations and webcasts. The information contained on, or that may be accessed through, our website is not incorporated by reference into, and is not a part of, this document.
About Medical Properties Trust, Inc.
Medical Properties Trust, Inc. is a self-advised real estate investment trust formed in 2003 to acquire and develop net-leased hospital facilities. From its inception in Birmingham, Alabama, the Company has grown to become one of the world’s largest owners of hospitals with 425 facilities and roughly 44,000 licensed beds in nine countries and across four continents on a pro forma basis. MPT’s financing model facilitates acquisitions and recapitalizations and allows operators of hospitals to unlock the value of their real estate assets to fund facility improvements, technology upgrades and other investments in operations. For more information, please visit the Company’s website at www.medicalpropertiestrust.com.
This press release includes forward-looking statements within the meaning of Section 27A of the Securities Act of 1933, as amended, and Section 21E of the Securities Exchange Act of 1934, as amended. Forward-looking statements can generally be identified by the use of forward-looking words such as “may”, “will”, “would”, “could”, “expect”, “intend”, “plan”, “estimate”, “target”, “anticipate”, “believe”, “objectives”, “outlook”,
3
“guidance” or other similar words, and include statements regarding our strategies, objectives, future expansion and development activities, and expected financial performance. Forward-looking statements involve known and unknown risks and uncertainties that may cause our actual results or future events to differ materially from those expressed in or underlying such forward-looking statements, including, but not limited to: (i) the economic, political and social impact of, and uncertainty relating to, the COVID-19 pandemic, including governmental assistance to hospitals and healthcare providers, including certain of our tenants; (ii) the ability of our tenants, operators and borrowers to satisfy their obligations under their respective contractual arrangements with us, especially as a result of the adverse economic impact of the COVID-19 pandemic, and government regulation of hospitals and healthcare providers in connection with same (as further detailed in our Current Report on Form 8-K filed with the SEC on April 8, 2020); (iii) our expectations regarding annual run-rate net income and NFFO per share; (iv) our success in implementing our business strategy and our ability to identify, underwrite, finance, consummate and integrate acquisitions and investments; (v) the nature and extent of our current and future competition; (vi) macroeconomic conditions, such as a disruption of or lack of access to the capital markets or movements in currency exchange rates; (vii) our ability to obtain debt financing on attractive terms or at all, which may adversely impact our ability to pursue acquisition and development opportunities and pay down, refinance, restructure or extend our indebtedness as it becomes due; (viii) increases in our borrowing costs as a result of changes in interest rates and other factors, including the potential phasing out of LIBOR after 2021; (ix) international, national and local economic, real estate and other market conditions, which may negatively impact, among other things, the financial condition of our tenants, lenders and institutions that hold our cash balances, and may expose us to increased risks of default by these parties; (x) factors affecting the real estate industry generally or the healthcare real estate industry in particular; (xi) our ability to maintain our status as a REIT for federal and state income tax purposes; (xii) federal and state healthcare and other regulatory requirements, as well as those in the foreign jurisdictions where we own properties; (xiii) the value of our real estate assets, which may limit our ability to dispose of assets at attractive prices or obtain or maintain equity or debt financing secured by our properties or on an unsecured basis; (xiv) the ability of our tenants and operators to comply with applicable laws, rules and regulations in the operation of the our properties, to deliver high-quality services, to attract and retain qualified personnel and to attract patients; (xv) potential environmental contingencies and other liabilities; and (xvi) the closing of the Priory sale-leaseback transaction.
The risks described above are not exhaustive and additional factors could adversely affect our business and financial performance, including the risk factors discussed under the section captioned “Risk Factors” in our Annual Report on Form 10-K for the year ended December 31, 2020 and as updated in our quarterly reports on Form 10-Q. Forward-looking statements are inherently uncertain and actual performance or outcomes may vary materially from any forward-looking statements and the assumptions on which those statements are based. Readers are cautioned to not place undue reliance on forward-looking statements as predictions of future events. We disclaim any responsibility to update such forward-looking statements, which speak only as of the date on which they were made.
# # #
4
MEDICAL PROPERTIES TRUST, INC. AND SUBSIDIARIES
Consolidated Balance Sheets
| (Amounts in thousands, except for per share data) | March 31, 2021 | December 31, 2020 | ||||||
| (Unaudited) | (A) | |||||||
| Assets |
||||||||
| Real estate assets |
||||||||
| Land, buildings and improvements, intangible lease assets, and other |
$ | 12,107,170 | $ | 12,078,927 | ||||
| Investment in financing leases |
2,021,480 | 2,010,922 | ||||||
| Mortgage loans |
1,324,865 | 248,080 | ||||||
|
|
|
|
|
|||||
| Gross investment in real estate assets |
15,453,515 | 14,337,929 | ||||||
| Accumulated depreciation and amortization |
(903,798 | ) | (833,529 | ) | ||||
|
|
|
|
|
|||||
| Net investment in real estate assets |
14,549,717 | 13,504,400 | ||||||
| Cash and cash equivalents |
746,753 | 549,884 | ||||||
| Interest and rent receivables |
44,558 | 46,208 | ||||||
| Straight-line rent receivables |
545,385 | 490,462 | ||||||
| Equity investments |
1,080,214 | 1,123,623 | ||||||
| Other loans |
1,522,666 | 858,368 | ||||||
| Other assets |
256,382 | 256,069 | ||||||
|
|
|
|
|
|||||
| Total Assets |
$ | 18,745,675 | $ | 16,829,014 | ||||
|
|
|
|
|
|||||
| Liabilities and Equity |
||||||||
| Liabilities |
||||||||
| Debt, net |
$ | 9,999,538 | $ | 8,865,458 | ||||
| Accounts payable and accrued expenses |
445,595 | 438,750 | ||||||
| Deferred revenue |
21,533 | 36,177 | ||||||
| Obligations to tenants and other lease liabilities |
158,799 | 144,772 | ||||||
|
|
|
|
|
|||||
| Total Liabilities |
10,625,465 | 9,485,157 | ||||||
| Equity |
||||||||
| Preferred stock, $0.001 par value. Authorized 10,000 shares; no shares outstanding |
— | — | ||||||
| Common stock, $0.001 par value. Authorized 750,000 shares; issued and outstanding - 583,109 shares at March 31, 2021 and 541,419 shares at December 31, 2020 |
583 | 541 | ||||||
| Additional paid-in capital |
8,252,966 | 7,461,503 | ||||||
| Distributions in excess of net income |
(71,071 | ) | (71,411 | ) | ||||
| Accumulated other comprehensive loss |
(66,720 | ) | (51,324 | ) | ||||
| Treasury shares, at cost |
(777 | ) | (777 | ) | ||||
|
|
|
|
|
|||||
| Total Medical Properties Trust, Inc. Stockholders’ Equity |
8,114,981 | 7,338,532 | ||||||
| Non-controlling interests |
5,229 | 5,325 | ||||||
|
|
|
|
|
|||||
| Total Equity |
8,120,210 | 7,343,857 | ||||||
|
|
|
|
|
|||||
| Total Liabilities and Equity |
$ | 18,745,675 | $ | 16,829,014 | ||||
|
|
|
|
|
|||||
| (A) | Financials have been derived from the prior year audited financial statements. |
MEDICAL PROPERTIES TRUST, INC. AND SUBSIDIARIES
Consolidated Statements of Income
(Unaudited)
| (Amounts in thousands, except for per share data) | For the Three Months Ended | |||||||
| March 31, 2021 | March 31, 2020 | |||||||
| Revenues |
||||||||
| Rent billed |
$ | 213,344 | $ | 171,767 | ||||
| Straight-line rent |
54,873 | 31,421 | ||||||
| Income from financing leases |
50,894 | 52,436 | ||||||
| Interest and other income |
43,654 | 38,508 | ||||||
|
|
|
|
|
|||||
| Total revenues |
362,765 | 294,132 | ||||||
| Expenses |
||||||||
| Interest |
86,972 | 80,899 | ||||||
| Real estate depreciation and amortization |
75,642 | 60,921 | ||||||
| Property-related |
5,453 | 5,412 | ||||||
| General and administrative |
36,073 | 33,385 | ||||||
|
|
|
|
|
|||||
| Total expenses |
204,140 | 180,617 | ||||||
| Other income (expense) |
||||||||
| Gain on sale of real estate |
989 | 1,325 | ||||||
| Real estate impairment charges |
— | (19,006 | ) | |||||
| Earnings from equity interests |
7,101 | 4,079 | ||||||
| Debt refinancing and unutilized financing costs |
(2,269 | ) | (611 | ) | ||||
| Other (including mark-to-market adjustments on equity securities) |
7,794 | (14,135 | ) | |||||
|
|
|
|
|
|||||
| Total other income (expense) |
13,615 | (28,348 | ) | |||||
|
|
|
|
|
|||||
| Income before income tax |
172,240 | 85,167 | ||||||
| Income tax expense |
(8,360 | ) | (4,010 | ) | ||||
|
|
|
|
|
|||||
| Net income |
163,880 | 81,157 | ||||||
| Net income attributable to non-controlling interests |
(97 | ) | (165 | ) | ||||
|
|
|
|
|
|||||
| Net income attributable to MPT common stockholders |
$ | 163,783 | $ | 80,992 | ||||
|
|
|
|
|
|||||
| Earnings per common share - basic and diluted: |
||||||||
| Net income attributable to MPT common stockholders |
$ | 0.28 | $ | 0.15 | ||||
|
|
|
|
|
|||||
| Weighted average shares outstanding - basic |
576,240 | 521,076 | ||||||
| Weighted average shares outstanding - diluted |
577,541 | 522,179 | ||||||
| Dividends declared per common share |
$ | 0.28 | $ | 0.27 | ||||
MEDICAL PROPERTIES TRUST, INC. AND SUBSIDIARIES
Reconciliation of Net Income to Funds From Operations
(Unaudited)
| (Amounts in thousands, except for per share data) | For the Three Months Ended | |||||||
| March 31, 2021 | March 31, 2020 | |||||||
| FFO information: |
||||||||
| Net income attributable to MPT common stockholders |
$ | 163,783 | $ | 80,992 | ||||
| Participating securities’ share in earnings |
(370 | ) | (464 | ) | ||||
|
|
|
|
|
|||||
| Net income, less participating securities’ share in earnings |
$ | 163,413 | $ | 80,528 | ||||
| Depreciation and amortization |
88,536 | 70,502 | ||||||
| Gain on sale of real estate |
(989 | ) | (1,325 | ) | ||||
| Real estate impairment charges |
— | 19,006 | ||||||
|
|
|
|
|
|||||
| Funds from operations |
$ | 250,960 | $ | 168,711 | ||||
| Write-off (recovery) of straight-line rent and other |
(5,238 | ) | 6,740 | |||||
| Non-cash fair value adjustments |
(4,065 | ) | 14,195 | |||||
| Tax rate change |
— | 977 | ||||||
| Debt refinancing and unutilized financing costs |
2,269 | 611 | ||||||
|
|
|
|
|
|||||
| Normalized funds from operations |
$ | 243,926 | $ | 191,234 | ||||
| Share-based compensation |
12,264 | 10,036 | ||||||
| Debt costs amortization |
4,009 | 3,409 | ||||||
| Rent deferral, net |
803 | — | ||||||
| Straight-line rent revenue and other |
(67,275 | ) | (49,614 | ) | ||||
|
|
|
|
|
|||||
| Adjusted funds from operations |
$ | 193,727 | $ | 155,065 | ||||
|
|
|
|
|
|||||
| Per diluted share data: |
||||||||
| Net income, less participating securities’ share in earnings |
$ | 0.28 | $ | 0.15 | ||||
| Depreciation and amortization |
0.15 | 0.13 | ||||||
| Gain on sale of real estate |
— | — | ||||||
| Real estate impairment charges |
— | 0.04 | ||||||
|
|
|
|
|
|||||
| Funds from operations |
$ | 0.43 | $ | 0.32 | ||||
| Write-off (recovery) of straight-line rent and other |
(0.01 | ) | 0.02 | |||||
| Non-cash fair value adjustments |
— | 0.03 | ||||||
| Tax rate change |
— | — | ||||||
| Debt refinancing and unutilized financing costs |
— | — | ||||||
|
|
|
|
|
|||||
| Normalized funds from operations |
$ | 0.42 | $ | 0.37 | ||||
| Share-based compensation |
0.02 | 0.02 | ||||||
| Debt costs amortization |
0.01 | — | ||||||
| Rent deferral, net |
— | — | ||||||
| Straight-line rent revenue and other |
(0.11 | ) | (0.09 | ) | ||||
|
|
|
|
|
|||||
| Adjusted funds from operations |
$ | 0.34 | $ | 0.30 | ||||
|
|
|
|
|
|||||
Notes:
| (A) | Certain line items above (such as depreciation and amortization) include our share of such income/expense from unconsolidated joint ventures. These amounts are included with the activity of all of our equity interests in the “Earnings from equity interests” line on the consolidated statements of income. |
| (B) | Investors and analysts following the real estate industry utilize funds from operations, or FFO, as a supplemental performance measure. FFO, reflecting the assumption that real estate asset values rise or fall with market conditions, principally adjusts for the effects of GAAP depreciation and amortization of real estate assets, which assumes that the value of real estate diminishes predictably over time. We compute FFO in accordance with the definition provided by the National Association of Real Estate Investment Trusts, or Nareit, which represents net income (loss) (computed in accordance with GAAP), excluding gains (losses) on sales of real estate and impairment charges on real estate assets, plus real estate depreciation and amortization and after adjustments for unconsolidated partnerships and joint ventures. |
In addition to presenting FFO in accordance with the Nareit definition, we also disclose normalized FFO, which adjusts FFO for items that relate to unanticipated or non-core events or activities or accounting changes that, if not noted, would make comparison to prior period results and market expectations less meaningful to investors and analysts. We believe that the use of FFO, combined with the required GAAP presentations, improves the understanding of our operating results among investors and the use of normalized FFO makes comparisons of our operating results with prior periods and other companies more meaningful. While FFO and normalized FFO are relevant and widely used supplemental measures of operating and financial performance of REITs, they should not be viewed as a substitute measure of our operating performance since the measures do not reflect either depreciation and amortization costs or the level of capital expenditures and leasing costs necessary to maintain the operating performance of our properties, which can be significant economic costs that could materially impact our results of operations. FFO and normalized FFO should not be considered an alternative to net income (loss) (computed in accordance with GAAP) as indicators of our results of operations or to cash flow from operating activities (computed in accordance with GAAP) as an indicator of our liquidity.
We calculate adjusted funds from operations, or AFFO, by subtracting from or adding to normalized FFO (i) non-cash revenue, (ii) non-cash share-based compensation expense, and (iii) amortization of deferred financing costs. AFFO is an operating measurement that we use to analyze our results of operations based on the receipt, rather than the accrual, of our rental revenue and on certain other adjustments. We believe that this is an important measurement because our leases generally have significant contractual escalations of base rents and therefore result in recognition of rental income that is not collected until future periods, and costs that are deferred or are non-cash charges. Our calculation of AFFO may not be comparable to AFFO or similarly titled measures reported by other REITs. AFFO should not be considered as an alternative to net income (calculated pursuant to GAAP) as an indicator of our results of operations or to cash flow from operating activities (calculated pursuant to GAAP) as an indicator of our liquidity.
MEDICAL PROPERTIES TRUST, INC. AND SUBSIDIARIES
Annual Run-Rate Guidance Reconciliation
(Unaudited)
| Annual Run-Rate Guidance - Per Share(1) | ||||||||
| Low | High | |||||||
| Net income attributable to MPT common stockholders |
$ | 1.14 | $ | 1.18 | ||||
| Participating securities’ share in earnings |
— | — | ||||||
|
|
|
|
|
|||||
| Net income, less participating securities’ share in earnings |
$ | 1.14 | $ | 1.18 | ||||
| Depreciation and amortization |
0.58 | 0.58 | ||||||
|
|
|
|
|
|||||
| Funds from operations |
$ | 1.72 | $ | 1.76 | ||||
| Other adjustments |
— | — | ||||||
|
|
|
|
|
|||||
| Normalized funds from operations |
$ | 1.72 | $ | 1.76 | ||||
|
|
|
|
|
|||||
| (1) | The guidance is based on current expectations and actual results or future events may differ materially from those expressed in this table, which is a forward-looking statement within the meaning of the federal securities laws. Please refer to the forward-looking statement included in this press release and our filings with the Securities and Exchange Commission for a discussion of risk factors that affect our performance. |
Pro Forma Total Gross Assets
(Unaudited)
| (Amounts in thousands) | March 31, 2021 | December 31, 2020 | ||||||
| Total Assets |
$ | 18,745,675 | $ | 16,829,014 | ||||
| Add: |
||||||||
| Real estate commitments on new investments(1) |
157,630 | 1,901,087 | ||||||
| Unfunded amounts on development deals and commenced capital improvement projects(2) |
114,129 | 166,258 | ||||||
| Accumulated depreciation and amortization |
903,798 | 833,529 | ||||||
| Incremental gross assets of our joint ventures(3) |
1,211,206 | 1,287,077 | ||||||
| Proceeds from new debt and equity subsequent to period-end |
— | 1,479,961 | ||||||
| Less: |
||||||||
| Cash used for funding the transactions above(4) |
(271,759 | ) | (2,067,345 | ) | ||||
|
|
|
|
|
|||||
| Pro Forma Total Gross Assets(5) |
$ | 20,860,679 | $ | 20,429,581 | ||||
|
|
|
|
|
|||||
| (1) | The 2021 column reflects our investment in Swiss Medical Network on April 16, 2021. The 2020 column reflects investments made in 2021, including the acquisition of 35 facilities in the United Kingdom on January 19, 2021. |
| (2) | Includes $53.6 million and $65.5 million of unfunded amounts on ongoing development projects and $60.5 million and $100.8 million of unfunded amounts on capital improvement projects and development projects that have commenced rent, as of March 31, 2021 and December 31, 2020, respectively. |
| (3) | Adjustment to reflect our share of our joint ventures’ gross assets. |
| (4) | Includes cash available on-hand plus cash generated from activities subsequent to period-end including proceeds from new debt, equity or loan repayments, if any. |
| (5) | Pro forma total gross assets is total assets before accumulated depreciation/amortization and assumes all real estate commitments on new investments and unfunded amounts on development deals and commenced capital improvement projects are fully funded using cash on hand (if available). We believe pro forma total gross assets is useful to investors as it provides a more current view of our portfolio and allows for a better understanding of our concentration levels as our commitments close and our other commitments are fully funded. |
Adjusted Revenues
(Unaudited)
| (Amounts in thousands) | For the Three Months Ended March 31, 2021 |
|||
| Total revenues |
$ | 362,765 | ||
| Revenue from real estate properties owned through joint venture arrangements |
31,652 | |||
|
|
|
|||
| Total adjusted revenues(1) |
$ | 394,417 | ||
|
|
|
|||
| (1) | Adjusted revenues are total revenues adjusted for our pro rata portion of similar revenues in our real estate joint venture arrangements. We believe adjusted revenue is useful to investors as it provides a more complete view of revenue across all of our investments and allows for better understanding of our revenue concentration. |
Exhibit 99.2
Q SUPPLEMENTAL 1 2021

3 COMPANY OVERVIEW Company Information 3 FINANCIAL INFORMATION Reconciliation of Net Income to Funds from Operations 6 6 Debt Summary 7 Debt Maturity Schedule 8 Pro Forma Net Debt /Annualized Adjusted EBITDA 9 PORTFOLIO INFORMATION Lease and Loan Maturity Schedule 10 10 Total Pro Forma Gross Assets and Adjusted Revenue by Asset Type, Operator, State and Country 11 EBITDARM to Rent Coverage 14 Summary of Investments and Development Projects 16 FINANCIAL STATEMENTS 17 Consolidated Statements of Income 17 Consolidated Balance Sheets 18 Unconsolidated Joint Venture Investments 19 FORWARD-LOOKING STATEMENTS Forward-looking statements involve known and unknown risks, uncertainties and other factors that may cause the actual results of the Company or future events to differ materially from those expressed in or underlying such forward-looking statements, including without limitation: Normalized FFO per share; expected payout ratio; the amount of acquisitions of healthcare real estate, if any; estimated debt metrics; portfolio diversification; capital markets conditions; the repayment of debt arrangements; statements concerning the additional income to the Company as a result of ownership interests in certain hospital operations and the timing of such income; the payment of future dividends, if any; completion of additional debt arrangements and additional investments; national and international economic, business, real estate and other market conditions; the competitive environment in which the Company operates; the execution of the Company’s business plan; financing risks; the Company’s ability to maintain its status as a REIT for federal income tax purposes; acquisition and development risks; potential environ- mental and other liabilities; potential impact from COVID-19 on our tenants/ borrowers and the related impact to us; and other factors affecting the real estate industry generally or healthcare real estate in particular. For further discussion of the factors that could affect outcomes, please refer to the “Risk Factors” section of the Company’s Annual Report on Form 10-K for the year ended December 31, 2020, and as updated by the Company’s subsequently filed Quarterly Reports on Form 10-Q and other SEC filings. Except as otherwise required by the federal securities laws, the Company undertakes no obligation to update the information in this report. Certain information in the supplemental package is shown pro forma for the transactions completed subsequent to period end and the consummation of pending transactions. The pro forma adjustments are based upon available information and assumptions that we believe are reasonable. There is no assurance that the pending transactions will occur. Clinica Centenario, an acute care facility in Bogota, Colombia. MEDICAL PROPERTIES TRUST | SUPPLEMENTAL INFORMATION | Q1 2021 2
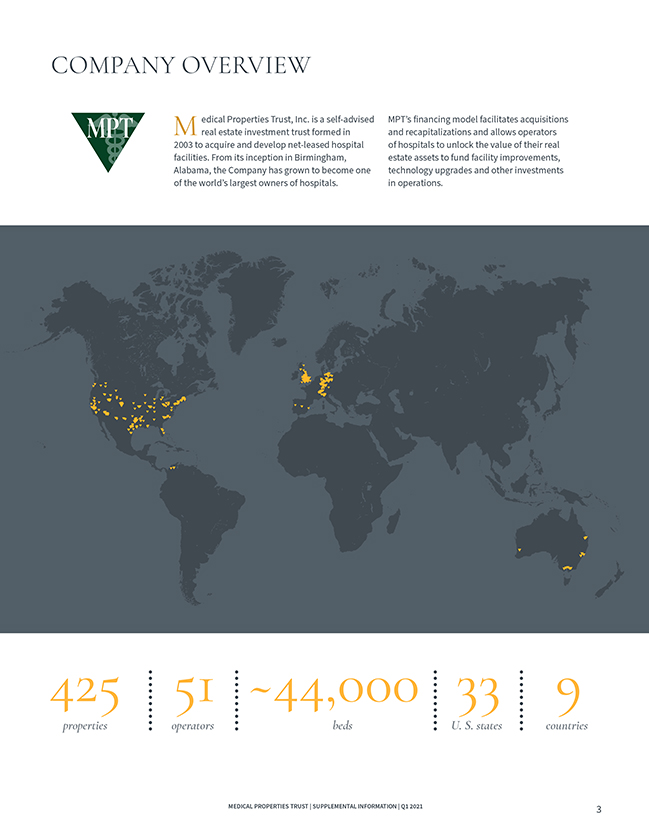
COMPANY OVERVIEW M edical Properties Trust, Inc. is a self-advised MPT’s financing model facilitates acquisitions real estate investment trust formed in and recapitalizations and allows operators 2003 to acquire and develop net-leased hospital of hospitals to unlock the value of their real facilities. From its inception in Birmingham, estate assets to fund facility improvements, Alabama, the Company has grown to become one technology upgrades and other investments of the world’s largest owners of hospitals. in operations. 425 51 ~44,000 33 9 properties operators bedsU. S. states countries MEDICAL PROPERTIES TRUST | SUPPLEMENTAL INFORMATION | Q1 2021 3

COMPANY OVERVIEW MPT OFFICERS: From the Left: Charles R. Lambert, Rosa H. Hooper, R. Lucas Savage, Edward K. Aldag, Jr., R. Steven Hamner, Emmett E. McLean and J. Kevin Hanna. Officers Edward K. Aldag, Jr. Chairman, President and Chief Executive Officer R. Steven Hamner Executive Vice President and Chief Financial Officer Emmett E. McLean Executive Vice President, Chief Operating Officer and Secretary J. Kevin Hanna Vice President, Controller and Chief Accounting Officer Rosa H. Hooper Vice President, Managing Director of Asset Management and Underwriting R. Lucas Savage Vice President, Head of Global Acquisitions Charles R. Lambert Vice President, Treasurer and Managing Director of Capital Markets Board of Directors Corporate Headquarters Edward K. Aldag, Jr. G. Steven Dawson Medical Properties Trust, Inc. R. Steven Hamner 1000 Urban Center Drive, Suite 501 Caterina A. Mozingo Birmingham, AL 35242 Elizabeth N. Pitman (205) 969-3755 D. Paul Sparks, Jr. (205) 969-3756 (fax) Michael G. Stewart C. Reynolds Thompson, III www.medicalpropertiestrust.com MEDICAL PROPERTIES TRUST | SUPPLEMENTAL INFORMATION | Q1 2021 4

COMPANY OVERVIEW INVESTOR RELATIONS Drew BabinTim Berryman Senior Managing Director of Corporate Communications Managing Director of Investor Relations (646) 884-9809 [email protected] (205) 397-8589 [email protected] Stock Exchange Senior Transfer Listing and Unsecured Agent Trading Symbol Debt Ratings American Stock Transfer New York Stock Exchange Moody’s – Ba1 and Trust Company (NYSE): MPW Standard & Poor’s – BBB- 6201 15th Avenue Brooklyn, NY 11219 Above: HM Torrelodones operated by HM Hospitales in Madrid, Spain. MEDICAL PROPERTIES TRUST | SUPPLEMENTAL INFORMATION | Q1 2021 5

FINANCIAL INFORMATION RECONCILIATION OF NET INCOME TO FUNDS FROM OPERATIONS (Unaudited) (Amounts in thousands, except per share data) For the Three Months Ended March 31, 2021March 31, 2020 FFO INFORMATION: Net income attributable to MPT common stockholders $ 163,783 $ 80,992 Participating securities’ share in earnings(370)(464) Net income, less participating securities’ share in earnings $ 163,413 $ 80,528 Depreciation and amortization88,53670,502 Gain on sale of real estate(989)(1,325) Real estate impairment charges-19,006 Funds from operations $ 250,960 $ 168,711 Write-off (recovery) of straight-line rent and other(5,238)6,740 Non-cash fair value adjustments(4,065)14,195 Tax rate change-977 Debt refinancing and unutilized financing costs2,269611 Normalized funds from operations $ 243,926 $ 191,234 Share-based compensation12,26410,036 Debt costs amortization4,0093,409 Rent deferral, net803- Straight-line rent revenue and other(67,275)(49,614) Adjusted funds from operations $ 193,727 $ 155,065 PER DILUTED SHARE DATA: Net income, less participating securities’ share in earnings $ 0.28 $ 0.15 Depreciation and amortization0.150.13 Gain on sale of real estate— Real estate impairment charges-0.04 Funds from operations $ 0.43 $ 0.32 Write-off (recovery) of straight-line rent and other(0.01)0.02 Non-cash fair value adjustments-0.03 Tax rate change— Debt refinancing and unutilized financing costs— Normalized funds from operations $ 0.42 $ 0.37 Share-based compensation0.020.02 Debt costs amortization0.01- Rent deferral, net-- Straight-line rent revenue and other(0.11)(0.09) Adjusted funds from operations $ 0.34 $ 0.30 Notes: (A) Certain line items above (such as depreciation and amortization) include our share of such income/expense from unconsolidated joint ventures. These amounts are included with the activity of all of our equity interests in the “Earnings from equity interests” line on the consolidated statements of income. (B) Investors and analysts following the real estate industry utilize funds from operations, or FFO, as a supplemental performance measure. FFO, reflecting the assumption that real estate asset values rise or fall with market conditions, principally adjusts for the effects of GAAP depreciation and amortization of real estate assets, which assumes that the value of real estate diminishes predictably over time. We compute FFO in accordance with the definition provided by the National Association of Real Estate Investment Trusts, or Nareit, which represents net income (loss) (computed in accordance with GAAP), excluding gains (losses) on sales of real estate and impairment charges on real estate assets, plus real estate depreciation and amortization and after adjustments for unconsolidated partnerships and joint ventures. In addition to presenting FFO in accordance with the Nareit definition, we also disclose normalized FFO, which adjusts FFO for items that relate to unanticipated or non-core events or activities or accounting changes that, if not noted, would make comparison to prior period results and market expectations less meaningful to investors and analysts. We believe that the use of FFO, combined with the required GAAP presentations, improves the understanding of our operating results among investors and the use of normalized FFO makes comparisons of our operating results with prior periods and other companies more meaningful. While FFO and normalized FFO are relevant and widely used supplemental measures of operating and financial performance of REITs, they should not be viewed as a substitute measure of our operating performance since the measures do not reflect either depreciation and amortization costs or the level of capital expenditures and leasing costs necessary to maintain the operating performance of our properties, which can be significant economic costs that could materially impact our results of operations. FFO and normalized FFO should not be considered an alternative to net income (loss) (computed in accordance with GAAP) as indicators of our results of operations or to cash flow from operating activities (computed in accordance with GAAP) as an indicator of our liquidity. We calculate adjusted funds from operations, or AFFO, by subtracting from or adding to normalized FFO (i) non-cash revenue, (ii) non-cash share-based compensation expense, and (iii) amortization of deferred financing costs. AFFO is an operating measurement that we use to analyze our results of operations based on the receipt, rather than the accrual, of our rental revenue and on certain other adjustments. We believe that this is an important measurement because our leases generally have significant contractual escalations of base rents and therefore result in recognition of rental income that is not collected until future periods, and costs that are deferred or are non-cash charges. Our calculation of AFFO may not be comparable to AFFO or similarly titled measures reported by other REITs. AFFO should not be considered as an alternative to net income (calculated pursuant to GAAP) as an indicator of our results of operations or to cash flow from operating activities (calculated pursuant to GAAP) as an indicator of our liquidity. MEDICAL PROPERTIES TRUST | SUPPLEMENTAL INFORMATION | Q1 2021 6
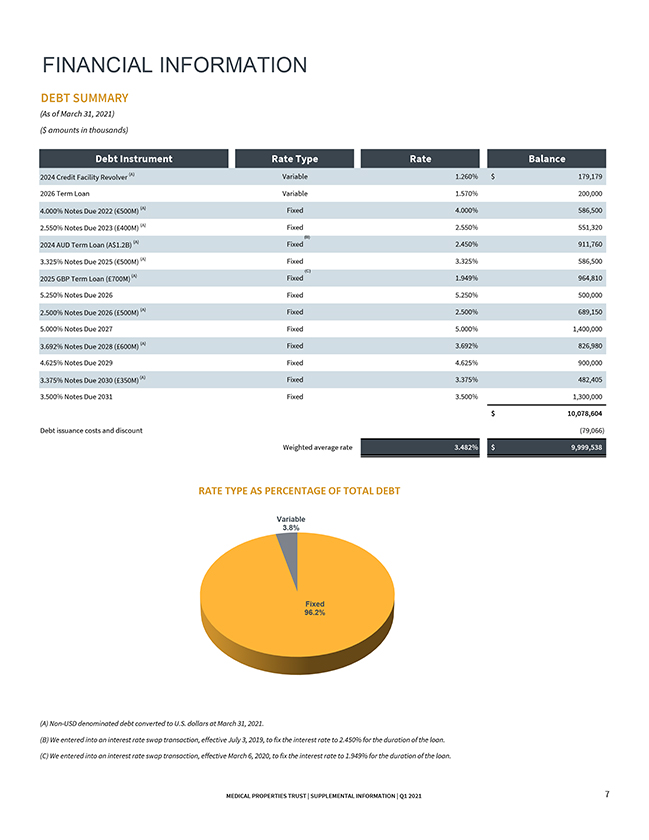
FINANCIAL INFORMATION DEBT SUMMARY (As of March 31, 2021) ($ amounts in thousands) Debt Instrument Rate Type Rate Balance 2024 Credit Facility Revolver (A) Variable1.260% $179,179 2026 Term Loan Variable1.570% 200,000 4.000% Notes Due 2022 (€500M) (A) Fixed4.000% 586,500 2.550% Notes Due 2023 (£400M) (A) Fixed2.550% 551,320 (B) 2024 AUD Term Loan (A$1.2B) (A) Fixed2.450% 911,760 3.325% Notes Due 2025 (€500M) (A) Fixed3.325% 586,500 (C) 2025 GBP Term Loan (£700M) (A) Fixed1.949% 964,810 5.250% Notes Due 2026 Fixed5.250% 500,000 2.500% Notes Due 2026 (£500M) (A) Fixed2.500% 689,150 5.000% Notes Due 2027 Fixed5.000% 1,400,000 3.692% Notes Due 2028 (£600M) (A) Fixed3.692% 826,980 4.625% Notes Due 2029 Fixed4.625% 900,000 3.375% Notes Due 2030 (£350M) (A) Fixed3.375% 482,405 3.500% Notes Due 2031 Fixed3.500% 1,300,000 $10,078,604 Debt issuance costs and discount(79,066) Weighted average rate3.482% $9,999,538 RATE TYPE AS PERCENTAGE OF TOTAL DEBT Variable 3.8% Fixed 96.2% (A) Non-USD denominated debt converted to U.S. dollars at March 31, 2021. (B) We entered into an interest rate swap transaction, effective July 3, 2019, to fix the interest rate to 2.450% for the duration of the loan. (C) We entered into an interest rate swap transaction, effective March 6, 2020, to fix the interest rate to 1.949% for the duration of the loan. MEDICAL PROPERTIES TRUST | SUPPLEMENTAL INFORMATION | Q1 20217
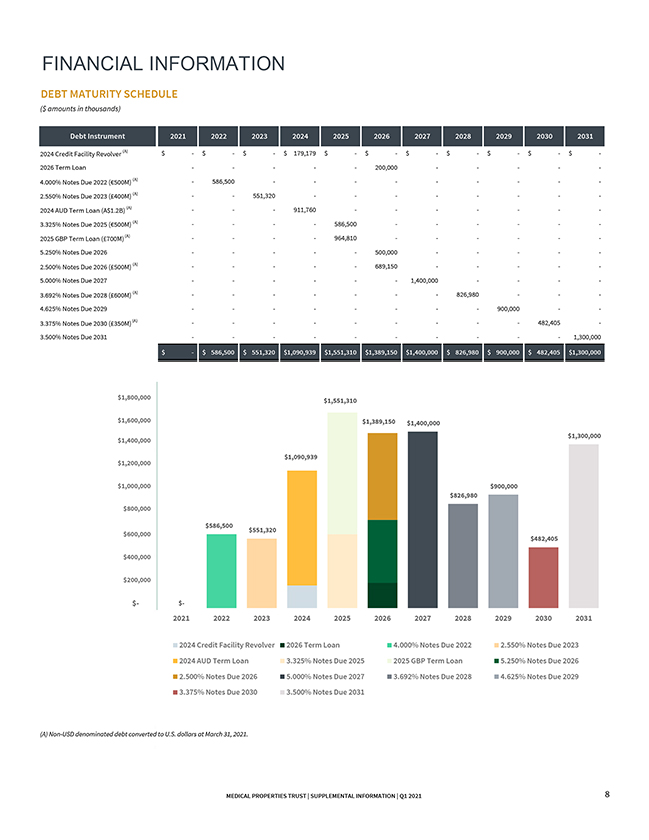
FINANCIAL INFORMATION DEBT MATURITY SCHEDULE ($ amounts in thousands) Debt Instrument202120222023 2024202520262027 2028202920302031 2024 Credit Facility Revolver (A) $- $—$—$ 179,179 $—$—$—$—$—$—$—2026 Term Loan ———200,000-—— 4.000% Notes Due 2022 (€500M) (A) -586,500- ———— 2.550% Notes Due 2023 (£400M) (A) --551,320 ———— 2024 AUD Term Loan (A$1.2B) (A) —- 911,760 ——-— 3.325% Notes Due 2025 (€500M) (A) —- -586,500-—-— 2025 GBP Term Loan (£700M) (A) —- -964,810-—-— 5.250% Notes Due 2026 ———500,000-—— 2.500% Notes Due 2026 (£500M) (A) ———689,150-—— 5.000% Notes Due 2027 —— — 1,400,000--— 3.692% Notes Due 2028 (£600M) (A) —— —-826,980-— 4.625% Notes Due 2029 —— —--900,000-—3.375% Notes Due 2030 (£350M) (A) —— ——-482,405—3.500% Notes Due 2031 —— ——--1,300,000 $- $ 586,500 $ 551,320 $1,090,939 $1,551,310 $1,389,150 $1,400,000 $ 826,980 $ 900,000 $ 482,405 $1,300,000 $1,800,000$ 1,551,310 $1,600,000$1,389,150 $1,400,000 $1,400,000 $ 1,300,000 $1,090,939 $1,200,000 $1,000,000 $ 900,000 $ 826,980 $800,000 $ 586,500 $600,000 $551,320 $ 482,405 $400,000 $200,000 $-$— 202120222023 2024202520262027 2028202920302031 2024 Credit Facility Revolver 2026 Term Loan 4.000% Notes Due 20222.550% Notes Due 2023 2024 AUD Term Loan3.325% Notes Due 20252025 GBP Term Loan5.250% Notes Due 2026 2.500% Notes Due 2026 5.000% Notes Due 20273.692% Notes Due 20284.625% Notes Due 2029 3.375% Notes Due 2030 3.500% Notes Due 2031 (A) Non-USD denominated debt converted to U.S. dollars at March 31, 2021. MEDICAL PROPERTIES TRUST | SUPPLEMENTAL INFORMATION | Q1 20218
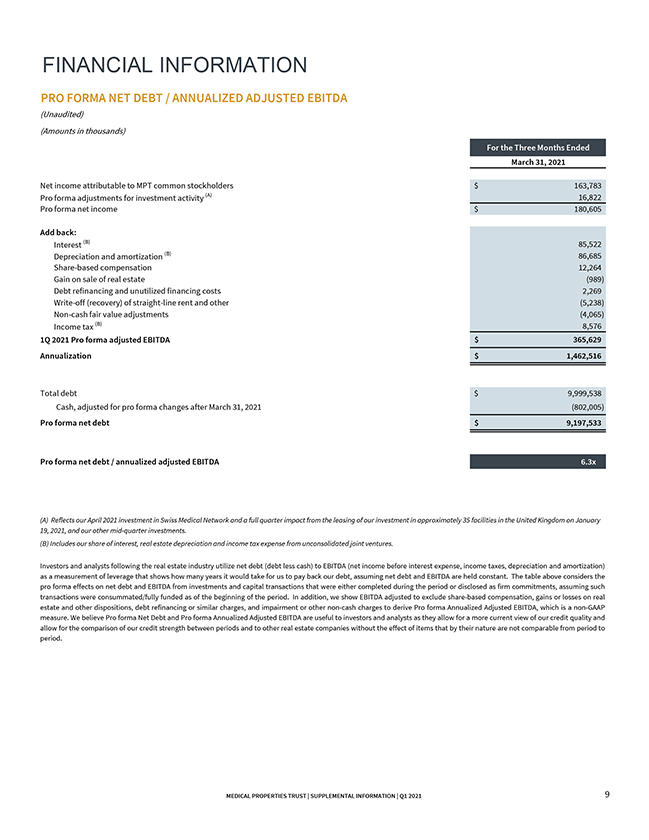
FINANCIAL INFORMATION PRO FORMA NET DEBT / ANNUALIZED ADJUSTED EBITDA (Unaudited) (Amounts in thousands) For the Three Months Ended March 31, 2021 Net income attributable to MPT common stockholders $ 163,783 Pro forma adjustments for investment activity (A)16,822 Pro forma net income $ 180,605 Add back: Interest (B)85,522 Depreciation and amortization (B)86,685 Share-based compensation12,264 Gain on sale of real estate(989) Debt refinancing and unutilized financing costs2,269 Write-off (recovery) of straight-line rent and other(5,238) Non-cash fair value adjustments(4,065) Income tax (B)8,576 1Q 2021 Pro forma adjusted EBITDA $ 365,629 Annualization $ 1,462,516 Total debt $ 9,999,538 Cash, adjusted for pro forma changes after March 31, 2021(802,005) Pro forma net debt $ 9,197,533 Pro forma net debt / annualized adjusted EBITDA6.3x (A) Reflects our April 2021 investment in Swiss Medical Network and a full quarter impact from the leasing of our investment in approximately 35 facilities in the United Kingdom on January 19, 2021, and our other mid-quarter investments. (B) Includes our share of interest, real estate depreciation and income tax expense from unconsolidated joint ventures. Investors and analysts following the real estate industry utilize net debt (debt less cash) to EBITDA (net income before interest expense, income taxes, depreciation and amortization) as a measurement of leverage that shows how many years it would take for us to pay back our debt, assuming net debt and EBITDA are held constant. The table above considers the pro forma effects on net debt and EBITDA from investments and capital transactions that were either completed during the period or disclosed as firm commitments, assuming such transactions were consummated/fully funded as of the beginning of the period. In addition, we show EBITDA adjusted to exclude share-based compensation, gains or losses on real estate and other dispositions, debt refinancing or similar charges, and impairment or other non-cash charges to derive Pro forma Annualized Adjusted EBITDA, which is a non-GAAP measure. We believe Pro forma Net Debt and Pro forma Annualized Adjusted EBITDA are useful to investors and analysts as they allow for a more current view of our credit quality and allow for the comparison of our credit strength between periods and to other real estate companies without the effect of items that by their nature are not comparable from period to period. MEDICAL PROPERTIES TRUST | SUPPLEMENTAL INFORMATION | Q1 20219

PORTFOLIO INFORMATION LEASE AND LOAN MATURITY SCHEDULE (A) ($ amounts in thousands) (B)Percentage of Total Years of MaturitiesTotal Properties (C) Base Rent/Interest (D) Base Rent/Interest 20211 $2,250 0.2% 20221656,674 4.6% 2023413,944 1.1% 202412,731 0.2% 2025717,470 1.4% 202629,027 0.7% 202713,540 0.3% 202845,591 0.5% 20291245,712 3.7% 203064,907 0.4% Thereafter3511,071,834 86.9% 405 $1,233,680 100.0% Percentage of total base rent/interest 100% 90% 86.9% 80% 70% 60% 50% 40% 30% 20% 10% 4.6% 3.7% 0.2% 1.1% 0.2% 1.4% 0.7% 0.3% 0.5% 0.4% 0% (A) Schedule includes leases and mortgage loans. (B) Lease/Loan expiration is based on the fixed term of the lease/loan and does not factor in potential renewal options provided for in our agreements. (C) Reflects all properties, including those that are part of joint ventures except vacant properties representing approximately 1% of total pro forma gross assets and two facilities that are under development. (D) Represents base rent/interest income on an annualized basis but does not include tenant recoveries, additional rents and other lease-related adjustments to revenue (i.e., straight-line rents and deferred revenues). MEDICAL PROPERTIES TRUST | SUPPLEMENTAL INFORMATION | Q1 2021 10
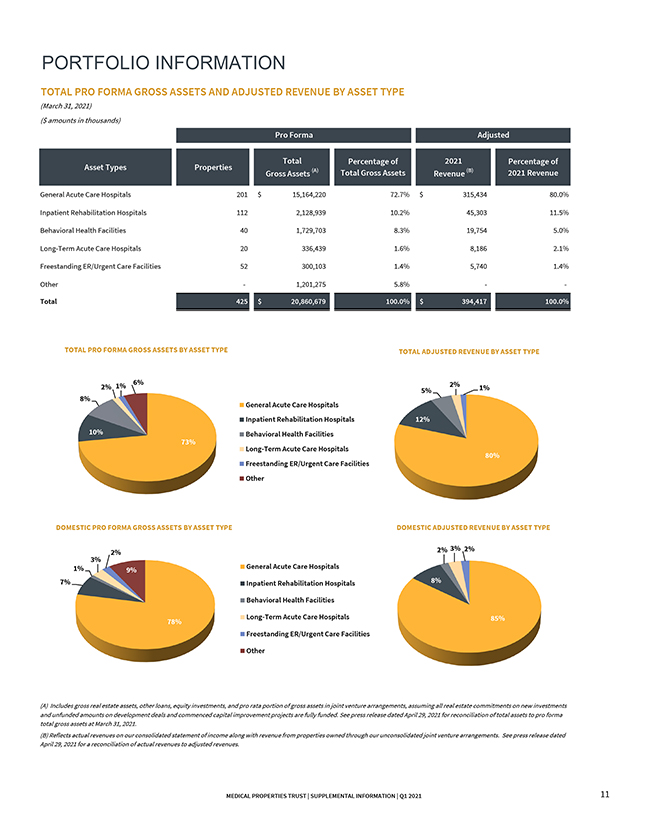
PORTFOLIO INFORMATION TOTAL PRO FORMA GROSS ASSETS AND ADJUSTED REVENUE BY ASSET TYPE (March 31, 2021) ($ amounts in thousands) Pro Forma Adjusted Total Percentage of2021 Percentage of Asset Types PropertiesGross Assets (A) Total Gross AssetsRevenue (B) 2021 Revenue General Acute Care Hospitals201 $ 15,164,22072.7% $315,434 80.0% Inpatient Rehabilitation Hospitals112 2,128,93910.2% 45,303 11.5% Behavioral Health Facilities40 1,729,7038.3% 19,754 5.0% Long-Term Acute Care Hospitals20 336,4391.6% 8,186 2.1% Freestanding ER/Urgent Care Facilities52 300,1031.4% 5,740 1.4% Other—1,201,2755.8% — Total 425 $ 20,860,679100.0% $394,417 100.0% TOTAL PRO FORMA GROSS ASSETS BY ASSET TYPETOTAL ADJUSTED REVENUE BY ASSET TYPE 2% 1% 6% 2% 1% 5% 8% General Acute Care Hospitals Inpatient Rehabilitation Hospitals 12% 10%Behavioral Health Facilities 73% Long-Term Acute Care Hospitals 80% Freestanding ER/Urgent Care Facilities Other DOMESTIC PRO FORMA GROSS ASSETS BY ASSET TYPEDOMESTIC ADJUSTED REVENUE BY ASSET TYPE 2% 2% 3% 2% 3% 1% 9%General Acute Care Hospitals 7% Inpatient Rehabilitation Hospitals 8% Behavioral Health Facilities 78% Long-Term Acute Care Hospitals85% Freestanding ER/Urgent Care Facilities Other (A) Includes gross real estate assets, other loans, equity investments, and pro rata portion of gross assets in joint venture arrangements, assuming all real estate commitments on new investments and unfunded amounts on development deals and commenced capital improvement projects are fully funded. See press release dated April 29, 2021 for reconciliation of total assets to pro forma total gross assets at March 31, 2021. (B) Reflects actual revenues on our consolidated statement of income along with revenue from properties owned through our unconsolidated joint venture arrangements. See press release dated April 29, 2021 for a reconciliation of actual revenues to adjusted revenues. MEDICAL PROPERTIES TRUST | SUPPLEMENTAL INFORMATION | Q1 202111
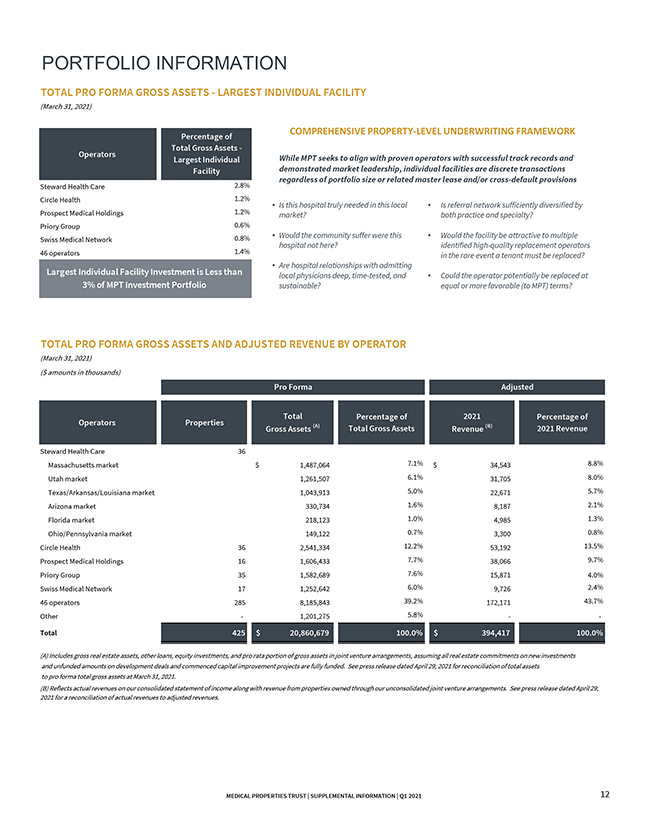
PORTFOLIO INFORMATION TOTAL PRO FORMA GROSS ASSETS—LARGEST INDIVIDUAL FACILITY (March 31, 2021) Percentage of COMPREHENSIVE PROPERTY-LEVEL UNDERWRITING FRAMEWORK Total Gross Assets—Operators Largest IndividualWhile MPT seeks to align with proven operators with successful track records and Facility demonstrated market leadership, individual facilities are discrete transactions regardless of portfolio size or related master lease and/or cross-default provisions Steward Health Care2.8% Circle Health1.2% • Is this hospital truly needed in this local • Is referral network sufficiently diversified by Prospect Medical Holdings1.2%market? both practice and specialty? Priory Group0.6% Swiss Medical Network0.8% • Would the community suffer were this • Would the facility be attractive to multiple hospital not here? identified high-quality replacement operators 46 operators1.4% in the rare event a tenant must be replaced? • Are hospital relationships with admitting Largest Individual Facility Investment is Less thanlocal physicians deep, time-tested, and • Could the operator potentially be replaced at 3% of MPT Investment Portfolio sustainable? equal or more favorable (to MPT) terms? TOTAL PRO FORMA GROSS ASSETS AND ADJUSTED REVENUE BY OPERATOR (March 31, 2021) ($ amounts in thousands) Pro Forma Adjusted Total Percentage of2021 Percentage of Operators PropertiesGross Assets (A) Total Gross AssetsRevenue (B) 2021 Revenue Steward Health Care36 Massachusetts market $ 1,487,064 7.1% $ 34,543 8.8% Utah market1,261,507 6.1%31,705 8.0% Texas/Arkansas/Louisiana market1,043,913 5.0%22,671 5.7% Arizona market330,734 1.6%8,187 2.1% Florida market218,123 1.0%4,985 1.3% Ohio/Pennsylvania market149,122 0.7%3,300 0.8% Circle Health362,541,334 12.2%53,192 13.5% Prospect Medical Holdings161,606,433 7.7%38,066 9.7% Priory Group351,582,689 7.6%15,871 4.0% Swiss Medical Network171,252,642 6.0%9,726 2.4% 46 operators2858,185,843 39.2%172,171 43.7% Other-1,201,275 5.8%— Total425 $ 20,860,679 100.0% $ 394,417 100.0% (A) Includes gross real estate assets, other loans, equity investments, and pro rata portion of gross assets in joint venture arrangements, assuming all real estate commitments on new investments and unfunded amounts on development deals and commenced capital improvement projects are fully funded. See press release dated April 29, 2021 for reconciliation of total assets to pro forma total gross assets at March 31, 2021. (B) Reflects actual revenues on our consolidated statement of income along with revenue from properties owned through our unconsolidated joint venture arrangements. See press release dated April 29, 2021 for a reconciliation of actual revenues to adjusted revenues. MEDICAL PROPERTIES TRUST | SUPPLEMENTAL INFORMATION | Q1 2021 12
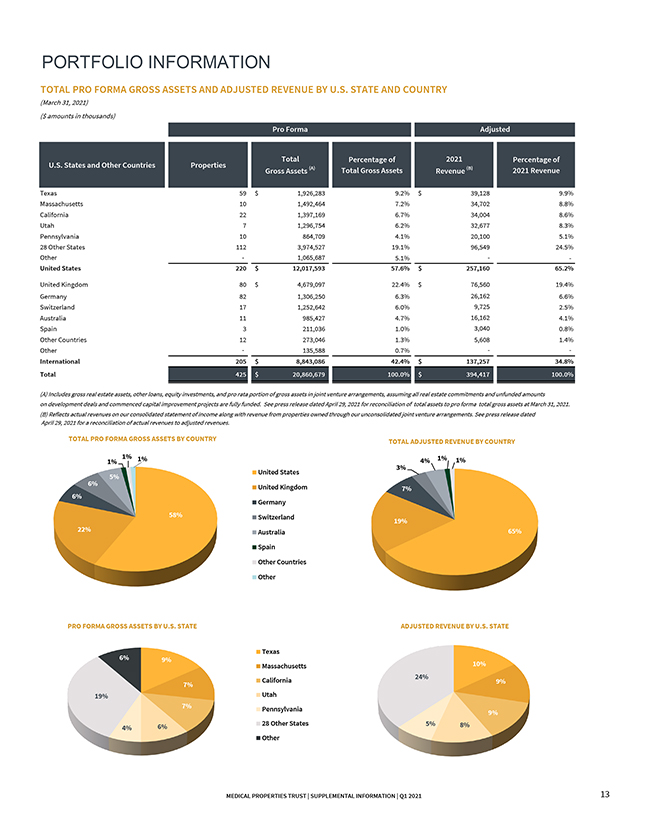
PORTFOLIO INFORMATION TOTAL PRO FORMA GROSS ASSETS AND ADJUSTED REVENUE BY U.S. STATE AND COUNTRY (March 31, 2021) ($ amounts in thousands) Pro FormaAdjusted Total Percentage of 2021 Percentage of U.S. States and Other Countries Properties Gross Assets (A) Total Gross Assets Revenue (B) 2021 Revenue Texas59 $ 1,926,283 9.2% $39,128 9.9% Massachusetts101,492,464 7.2% 34,702 8.8% California221,397,169 6.7% 34,004 8.6% Utah71,296,754 6.2% 32,677 8.3% Pennsylvania10864,709 4.1% 20,100 5.1% 28 Other States1123,974,527 19.1% 96,549 24.5% Other-1,065,687 5.1% — United States220 $ 12,017,593 57.6% $ 257,160 65.2% United Kingdom80 $ 4,679,097 22.4% $76,560 19.4% Germany821,306,250 6.3% 26,162 6.6% Switzerland171,252,642 6.0% 9,725 2.5% Australia11985,427 4.7% 16,162 4.1% Spain3211,036 1.0% 3,040 0.8% Other Countries12273,046 1.3% 5,608 1.4% Other-135,588 0.7% — International205 $ 8,843,086 42.4% $ 137,257 34.8% Total425 $ 20,860,679 100.0% $ 394,417 100.0% (A) Includes gross real estate assets, other loans, equity investments, and pro rata portion of gross assets in joint venture arrangements, assuming all real estate commitments and unfunded amounts on development deals and commenced capital improvement projects are fully funded. See press release dated April 29, 2021 for reconciliation of total assets to pro forma total gross assets at March 31, 2021. (B) Reflects actual revenues on our consolidated statement of income along with revenue from properties owned through our unconsolidated joint venture arrangements. See press release dated April 29, 2021 for a reconciliation of actual revenues to adjusted revenues. TOTAL PRO FORMA GROSS ASSETS BY COUNTRYTOTAL ADJUSTED REVENUE BY COUNTRY 1% 1% 1%4% 1% 1% 3% 5% United States 6% United Kingdom 7% 6% Germany 58%Switzerland 19% 22% Australia65% Spain Other Countries Other PRO FORMA GROSS ASSETS BY U.S. STATEADJUSTED REVENUE BY U.S. STATE Texas 6% 9% Massachusetts10% 24% 7% California9% 19%Utah 7% Pennsylvania 9% 4% 6% 28 Other States 5% 8% Other MEDICAL PROPERTIES TRUST | SUPPLEMENTAL INFORMATION | Q1 2021 13
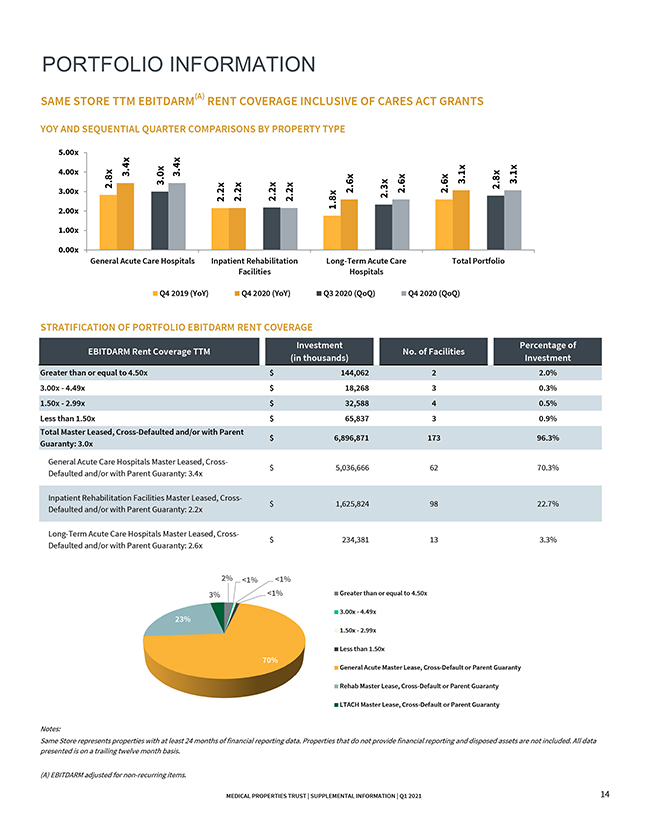
PORTFOLIO INFORMATION SAME STORE TTM EBITDARM(A) RENT COVERAGE INCLUSIVE OF CARES ACT GRANTS YOY AND SEQUENTIAL QUARTER COMPARISONS BY PROPERTY TYPE 5.00x 4.00x 3.4x 3.4x 3.00x 2.8x 3.0x 2.2x 2.2x 2.2x 2.2x 2.6x 2.3x 2.6x 2.6x 3.1x 2.8x 3.1x 2.00x1.8x 1.00x 0.00x General Acute Care Hospitals Inpatient Rehabilitation Long-Term Acute Care Total Portfolio FacilitiesHospitals Q4 2019 (YoY)Q4 2020 (YoY) Q3 2020 (QoQ) Q4 2020 (QoQ) STRATIFICATION OF PORTFOLIO EBITDARM RENT COVERAGE InvestmentPercentage of EBITDARM Rent Coverage TTM No. of Facilities (in thousands)Investment Greater than or equal to 4.50x $ 144,0622 2.0% 3.00x—4.49x$ 18,2683 0.3% 1.50x—2.99x$ 32,5884 0.5% Less than 1.50x $ 65,8373 0.9% Total Master Leased, Cross-Defaulted and/or with Parent Guaranty: 3.0x $ 6,896,871173 96.3% General Acute Care Hospitals Master Leased, Cross- Defaulted and/or with Parent Guaranty: 3.4x$ 5,036,66662 70.3% Inpatient Rehabilitation Facilities Master Leased, Cross- Defaulted and/or with Parent Guaranty: 2.2x$ 1,625,82498 22.7% Long-Term Acute Care Hospitals Master Leased, Cross- Defaulted and/or with Parent Guaranty: 2.6x$ 234,38113 3.3% 2% <1% <1% 3% <1% Greater than or equal to 4.50x 3.00x—4.49x 23% 1.50x—2.99x Less than 1.50x 70% General Acute Master Lease, Cross-Default or Parent Guaranty Rehab Master Lease, Cross-Default or Parent Guaranty LTACH Master Lease, Cross-Default or Parent Guaranty Notes: Same Store represents properties with at least 24 months of financial reporting data. Properties that do not provide financial reporting and disposed assets are not included. All data presented is on a trailing twelve month basis. (A) EBITDARM adjusted for non-recurring items. MEDICAL PROPERTIES TRUST | SUPPLEMENTAL INFORMATION | Q1 2021 14
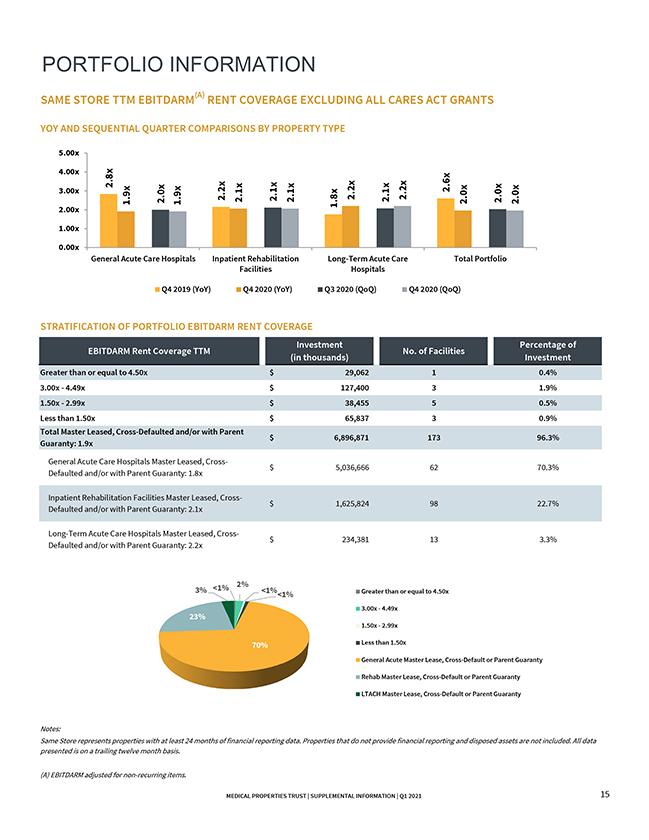
PORTFOLIO INFORMATION SAME STORE TTM EBITDARM(A) RENT COVERAGE EXCLUDING ALL CARES ACT GRANTS YOY AND SEQUENTIAL QUARTER COMPARISONS BY PROPERTY TYPE 5.00x 4.00x 3.00x 2.8x 1.9x 2.0x 1.9x 2.2x 2.1x 2.1x 2.1x 1.8x 2.2x 2.1x 2.2x 2.6x 2.0x 2.0x 2.0x 2.00x 1.00x 0.00x General Acute Care Hospitals Inpatient Rehabilitation Long-Term Acute Care Total Portfolio FacilitiesHospitals Q4 2019 (YoY)Q4 2020 (YoY) Q3 2020 (QoQ) Q4 2020 (QoQ) STRATIFICATION OF PORTFOLIO EBITDARM RENT COVERAGE InvestmentPercentage of EBITDARM Rent Coverage TTMNo. of Facilities (in thousands)Investment Greater than or equal to 4.50x$ 29,0621 0.4% 3.00x—4.49x$ 127,4003 1.9% 1.50x—2.99x$ 38,4555 0.5% Less than 1.50x $ 65,8373 0.9% Total Master Leased, Cross-Defaulted and/or with Parent Guaranty: 1.9x $ 6,896,871173 96.3% General Acute Care Hospitals Master Leased, Cross- Defaulted and/or with Parent Guaranty: 1.8x$ 5,036,66662 70.3% Inpatient Rehabilitation Facilities Master Leased, Cross- Defaulted and/or with Parent Guaranty: 2.1x$ 1,625,82498 22.7% Long-Term Acute Care Hospitals Master Leased, Cross- Defaulted and/or with Parent Guaranty: 2.2x$ 234,38113 3.3% 3% <1% 2% <1%Greater than or equal to 4.50x <1% 3.00x—4.49x 23% 1.50x—2.99x 70% Less than 1.50x General Acute Master Lease, Cross-Default or Parent Guaranty Rehab Master Lease, Cross-Default or Parent Guaranty LTACH Master Lease, Cross-Default or Parent Guaranty Notes: Same Store represents properties with at least 24 months of financial reporting data. Properties that do not provide financial reporting and disposed assets are not included. All data presented is on a trailing twelve month basis. (A) EBITDARM adjusted for non-recurring items. MEDICAL PROPERTIES TRUST | SUPPLEMENTAL INFORMATION | Q1 2021 15
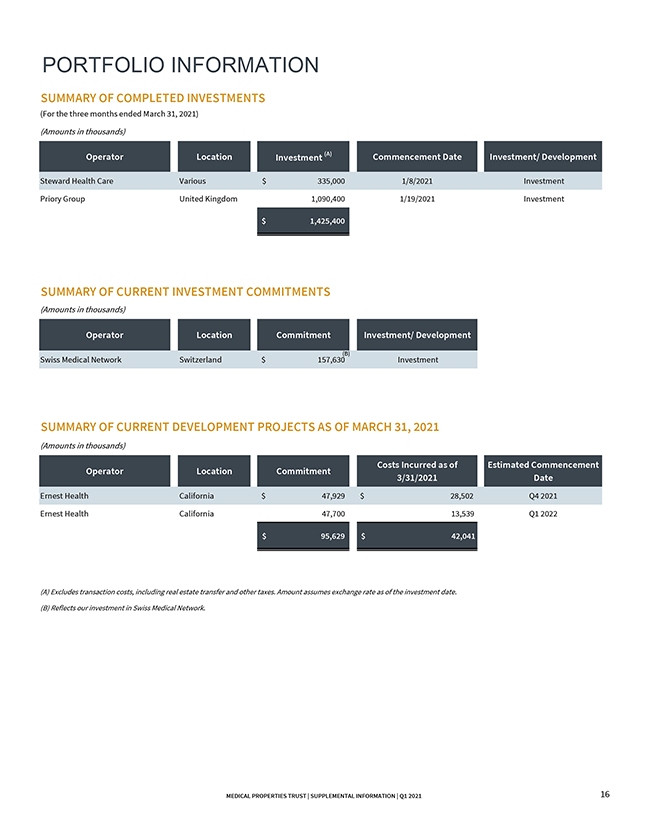
PORTFOLIO INFORMATION SUMMARY OF COMPLETED INVESTMENTS (For the three months ended March 31, 2021) (Amounts in thousands) Operator LocationInvestment (A) Commencement Date Investment/ Development Steward Health Care Various $ 335,000 1/8/2021Investment Priory Group United Kingdom1,090,400 1/19/2021Investment $ 1,425,400 SUMMARY OF CURRENT INVESTMENT COMMITMENTS (Amounts in thousands) Operator LocationCommitment Investment/ Development Swiss Medical Network Switzerland $ 157,630(B) Investment SUMMARY OF CURRENT DEVELOPMENT PROJECTS AS OF MARCH 31, 2021 (Amounts in thousands) Operator LocationCommitment Costs Incurred as of Estimated Commencement 3/31/2021Date Ernest Health California $ 47,929 $ 28,502 Q4 2021 Ernest Health California47,70013,539 Q1 2022 $ 95,629 $ 42,041 (A) Excludes transaction costs, including real estate transfer and other taxes. Amount assumes exchange rate as of the investment date. (B) Reflects our investment in Swiss Medical Network. MEDICAL PROPERTIES TRUST | SUPPLEMENTAL INFORMATION | Q1 202116
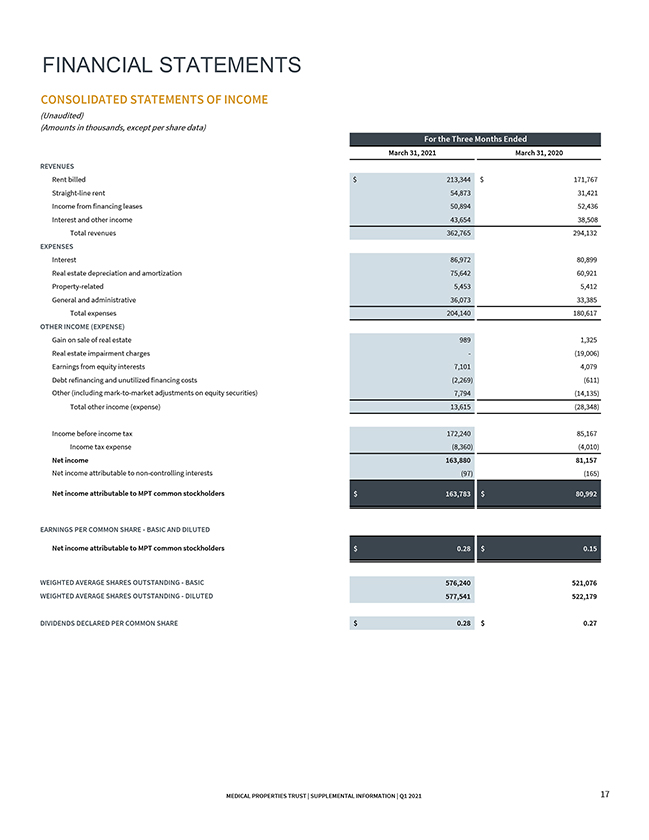
FINANCIAL STATEMENTS CONSOLIDATED STATEMENTS OF INCOME (Unaudited) (Amounts in thousands, except per share data) For the Three Months Ended March 31, 2021March 31, 2020 REVENUES Rent billed $ 213,344 $ 171,767 Straight-line rent 54,87331,421 Income from financing leases 50,89452,436 Interest and other income 43,65438,508 Total revenues 362,765294,132 EXPENSES Interest 86,97280,899 Real estate depreciation and amortization 75,64260,921 Property-related 5,4535,412 General and administrative 36,07333,385 Total expenses 204,140180,617 OTHER INCOME (EXPENSE) Gain on sale of real estate 9891,325 Real estate impairment charges -(19,006) Earnings from equity interests 7,1014,079 Debt refinancing and unutilized financing costs (2,269)(611) Other (including mark-to-market adjustments on equity securities) 7,794(14,135) Total other income (expense) 13,615(28,348) Income before income tax 172,24085,167 Income tax expense (8,360)(4,010) Net income 163,88081,157 Net income attributable to non-controlling interests (97)(165) Net income attributable to MPT common stockholders $ 163,783 $ 80,992 EARNINGS PER COMMON SHARE—BASIC AND DILUTED Net income attributable to MPT common stockholders $ 0.28 $ 0.15 WEIGHTED AVERAGE SHARES OUTSTANDING—BASIC 576,240521,076 WEIGHTED AVERAGE SHARES OUTSTANDING—DILUTED 577,541522,179 $—DIVIDENDS DECLARED PER COMMON SHARE $ 0.28 $ 0.27 MEDICAL PROPERTIES TRUST | SUPPLEMENTAL INFORMATION | Q1 2021 17
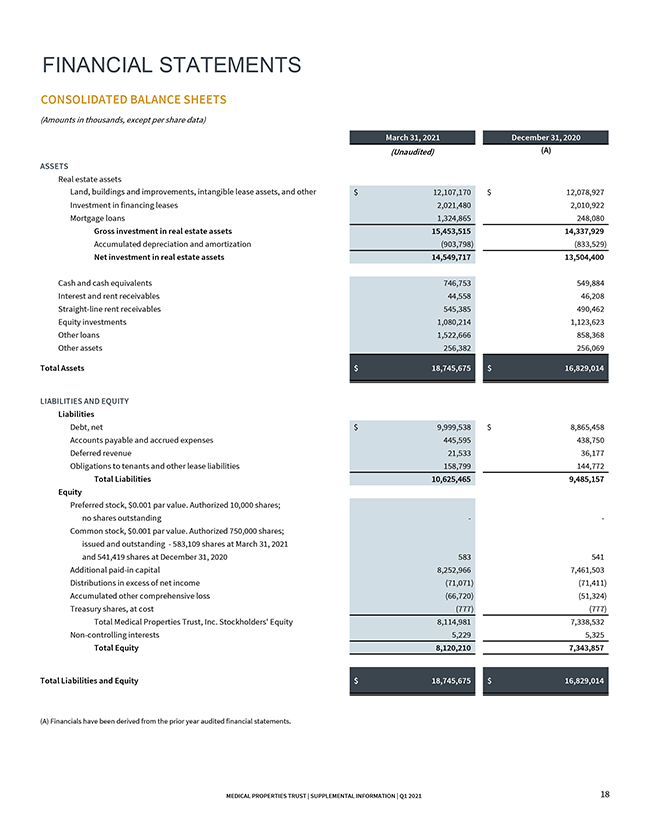
FINANCIAL STATEMENTS CONSOLIDATED BALANCE SHEETS (Amounts in thousands, except per share data) March 31, 2021December 31, 2020 (Unaudited)(A) ASSETS Real estate assets Land, buildings and improvements, intangible lease assets, and other $ 12,107,170 $ 12,078,927 Investment in financing leases2,021,4802,010,922 Mortgage loans1,324,865248,080 Gross investment in real estate assets15,453,51514,337,929 Accumulated depreciation and amortization(903,798)(833,529) Net investment in real estate assets14,549,71713,504,400 Cash and cash equivalents746,753549,884 Interest and rent receivables44,55846,208 Straight-line rent receivables545,385490,462 Equity investments1,080,2141,123,623 Other loans1,522,666858,368 Other assets256,382256,069 Total Assets $ 18,745,675 $ 16,829,014 LIABILITIES AND EQUITY Liabilities Debt, net $ 9,999,538 $ 8,865,458 Accounts payable and accrued expenses445,595438,750 Deferred revenue21,53336,177 Obligations to tenants and other lease liabilities158,799144,772 Total Liabilities10,625,4659,485,157 Equity Preferred stock, $0.001 par value. Authorized 10,000 shares; no shares outstanding— Common stock, $0.001 par value. Authorized 750,000 shares; issued and outstanding—583,109 shares at March 31, 2021 and 541,419 shares at December 31, 2020583541 Additional paid-in capital8,252,9667,461,503 Distributions in excess of net income(71,071)(71,411) Accumulated other comprehensive loss(66,720)(51,324) Treasury shares, at cost(777)(777) Total Medical Properties Trust, Inc. Stockholders’ Equity8,114,9817,338,532 Non-controlling interests5,2295,325 Total Equity8,120,2107,343,857 Total Liabilities and Equity $ 18,745,675 $ 16,829,014 (A) Financials have been derived from the prior year audited financial statements. MEDICAL PROPERTIES TRUST | SUPPLEMENTAL INFORMATION | Q1 2021 18
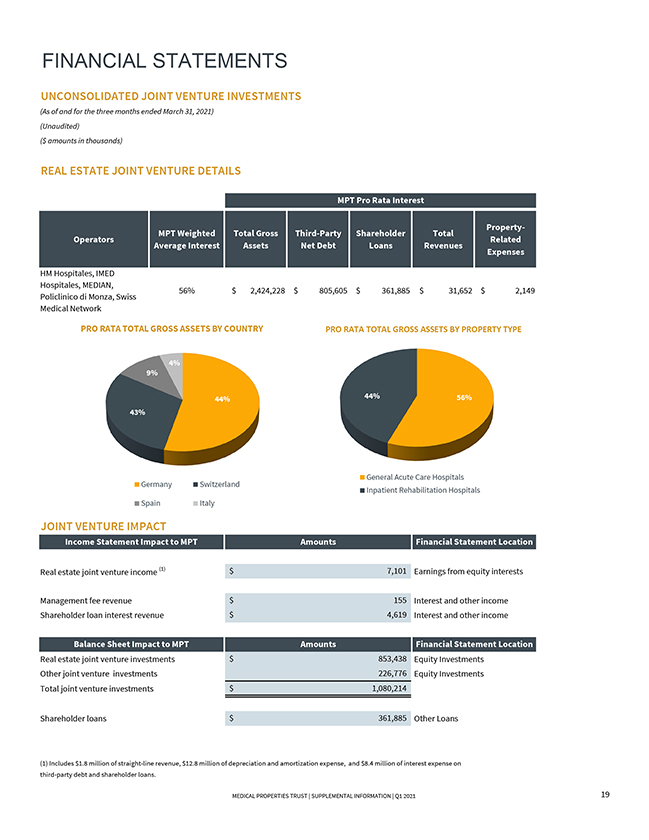
FINANCIAL STATEMENTS UNCONSOLIDATED JOINT VENTURE INVESTMENTS (As of and for the three months ended March 31, 2021) (Unaudited) ($ amounts in thousands) REAL ESTATE JOINT VENTURE DETAILS MPT Pro Rata Interest MPT Weighted Total Gross Third-Party ShareholderTotal Property- OperatorsRelated Average InterestAssets Net DebtLoans Revenues Expenses HM Hospitales, IMED Hospitales, MEDIAN, 56% $ 2,424,228 $ 805,605 $ 361,885 $ 31,652 $ 2,149 Policlinico di Monza, Swiss Medical Network PRO RATA TOTAL GROSS ASSETS BY COUNTRYPRO RATA TOTAL GROSS ASSETS BY PROPERTY TYPE 4% 9% 44% 44%56% 43% General Acute Care Hospitals Germany Switzerland Inpatient Rehabilitation Hospitals Spain Italy JOINT VENTURE IMPACT Income Statement Impact to MPT Amounts Financial Statement Location Real estate joint venture income (1)$ 7,101 Earnings from equity interests Management fee revenue$ 155 Interest and other income Shareholder loan interest revenue$ 4,619 Interest and other income Balance Sheet Impact to MPT Amounts Financial Statement Location Real estate joint venture investments$ 853,438 Equity Investments Other joint venture investments 226,776 Equity Investments Total joint venture investments$ 1,080,214 Shareholder loans$ 361,885 Other Loans (1) Includes $1.8 million of straight-line revenue, $12.8 million of depreciation and amortization expense, and $8.4 million of interest expense on third-party debt and shareholder loans. MEDICAL PROPERTIES TRUST | SUPPLEMENTAL INFORMATION | Q1 2021 19
1000 Urban Center Drive, Suite 501 Birmingham, AL 35242 (205) 969-3755 NYSE: MPW www.medicalpropertiestrust.com Contact: Drew Babin, Senior Managing Director of Corporate Communications (646) 884-9809 or [email protected] or Tim Berryman, Managing Director of Investor Relations (205) 397-8589 or [email protected]
Serious News for Serious Traders! Try StreetInsider.com Premium Free!
You May Also Be Interested In
- Deutsche Bank Upgrades Medical Properties Trust (MPW) to Hold, 'Debt Maturity Likely Resolved Until At Least 2025'
- ROSEN, TOP RANKED INVESTOR COUNSEL, Encourages Sonder Holdings Inc. Investors to Secure Counsel Before Important Deadline in Securities Class Action First Filed by the Firm – SOND
- Turtle Creek Asset Management Responds to Gildan Board’s Governance Charade
Create E-mail Alert Related Categories
SEC FilingsSign up for StreetInsider Free!
Receive full access to all new and archived articles, unlimited portfolio tracking, e-mail alerts, custom newswires and RSS feeds - and more!
