

Form 8-K LEXINGTON REALTY TRUST For: Feb 20
 Tweet
Tweet Share
ShareExhibit 99.1

LEXINGTON REALTY TRUST
QUARTERLY SUPPLEMENTAL INFORMATION
December 31, 2019
Table of Contents
This Quarterly Earnings Press Release and Quarterly Supplemental Information contains certain forward-looking statements which involve known and unknown risks, uncertainties or other factors not under the control of Lexington Realty Trust (“Lexington”), which may cause actual results, performance or achievements of Lexington and its subsidiaries to be materially different from the results, performance, or other expectations implied by these forward-looking statements. Factors that could cause or contribute to such differences include, but are not limited to, those discussed under the headings “Management’s Discussion and Analysis of Financial Condition and Results of Operations” and “Risk Factors” in Lexington’s periodic reports filed with the Securities and Exchange Commission, including, but not limited to, risks related to: (1) the authorization of Lexington’s Board of Trustees of future dividend declarations, (2) Lexington’s ability to achieve its estimates of net income attributable to common shareholders and Adjusted Company FFO available to all equity holders and unitholders – diluted for the year ending December 31, 2020, (3) the successful consummation of any lease, acquisition, build-to-suit, development project, disposition, financing or other transaction on the terms described herein or at all, (4) the failure to continue to qualify as a real estate investment trust, (5) changes in general business and economic conditions, including the impact of any new legislation, (6) competition, (7) increases in real estate construction costs, (8) changes in interest rates, (9) changes in accessibility of debt and equity capital markets, and (10) future impairment charges. Copies of the periodic reports Lexington files with the Securities and Exchange Commission are available on Lexington’s web site at www.lxp.com. Forward-looking statements, which are based on certain assumptions and describe Lexington’s future plans, strategies and expectations, are generally identifiable by use of the words “believes,” “expects,” “intends,” “anticipates,” “estimates,” “projects,” may,” “plans,” “predicts,” “will,” “will likely result,” “is optimistic,” “goal,” “objective” or similar expressions. Except as required by law, Lexington undertakes no obligation to revise those forward-looking statements to reflect events or circumstances after the occurrence of unanticipated events. Accordingly, there is no assurance that Lexington’s expectations will be realized.
| LEXINGTON REALTY TRUST | |
| TRADED: NYSE: LXP | |
| ONE PENN PLAZA, SUITE 4015 | |
| NEW YORK, NY 10119-4015 |
FOR IMMEDIATE RELEASE
LEXINGTON REALTY TRUST REPORTS FOURTH QUARTER 2019 RESULTS
New York, NY - February 20, 2020 - Lexington Realty Trust (“Lexington”) (NYSE: LXP), a real estate investment trust focused on single-tenant industrial real estate investments, today announced results for the fourth quarter and year ended December 31, 2019.
Fourth Quarter 2019 Highlights
| • | Generated Net Income attributable to common shareholders of $83.6 million, or $0.33 per diluted common share. |
| • | Generated Adjusted Company Funds From Operations available to all equityholders and unitholders - diluted (“Adjusted Company FFO”) of $52.4 million, or $0.20 per diluted common share. |
| • | Raised net proceeds of approximately $71.0 million by issuing approximately 6.6 million common shares through the ATM program. |
| • | Disposed of 10 properties for an aggregate gross sale price of $172.7 million. |
| • | Acquired six industrial properties for an aggregate cost of $264.1 million. |
| • | Invested an aggregate of approximately $15.0 million in three new industrial development projects. |
| • | Completed 2.2 million square feet of new leases and lease extensions. |
| • | Declared a quarterly common share/unit dividend/distribution of $0.105 per share/unit, an increase of 2.4%. |
| • | Increased industrial portfolio to 81.5% of gross real estate assets. |
Full Year 2019 Highlights
| • | Generated Net Income attributable to common shareholders of $273.2 million, or $1.15 per diluted common share. |
| • | Generated Adjusted Company FFO of $196.6 million, or $0.80 per diluted common share. |
| • | Disposed of 22 properties for an aggregate gross sale price of $621.6 million. |
| • | Acquired 17 industrial properties for an aggregate cost of $703.8 million. |
| • | Invested an aggregate of $18.5 million in industrial development projects. |
| • | Increased total gross book value attributable to industrial assets from 71.2% to 81.5%. |
| • | Satisfied $199.2 million of secured debt at a weighted-average interest rate of 4.4%. |
| • | Extended the maturity of the revolving credit facility to 2023 and 2021 term loan to 2025, lowered the applicable margin rate and increased the commitment on the revolving credit facility, and swapped the LIBOR portion of the term loan interest rate to obtain a current fixed interest rate of 2.732% per annum. |
| • | Completed 6.4 million square feet of new leases and lease extensions, raising renewal Base Rents by 7.5%. |
3
Subsequent Events
| • | Acquired four industrial properties for an aggregate gross cost of approximately $195.0 million. |
Adjusted Company FFO is a non-GAAP financial measure. It and certain other non-GAAP financial measures are defined and reconciled later in this press release.
T. Wilson Eglin, Chief Executive Officer and President of Lexington Realty Trust, commented “Our excellent fourth quarter execution raised overall 2019 investment activity to more than $700 million of high-quality industrial assets. Further, property sales exceeded $620 million, and leasing volume was approximately six million square feet. Adding to our growth opportunities, we invested approximately $15 million during the quarter in three new development projects. We were also active on the capital markets front during the quarter, raising net proceeds of $71 million through our ATM program.
We continue to focus on becoming a single-tenant industrial REIT, having made tremendous progress thus far in repositioning our portfolio. At year-end, our industrial exposure represented nearly 82% of gross book value, and we are well-positioned to grow our industrial portfolio to 90% or more of gross book value by year-end 2020. As a result of all of these positive developments, we announced early in the fourth quarter an increase in our annualized dividend to $0.42 per share, with the intent of raising it steadily each year moving forward, subject to Board approval.”
FINANCIAL RESULTS
Revenues
For the quarter ended December 31, 2019, total gross revenues were $83.0 million, compared with total gross revenues of $88.2 million for the quarter ended December 31, 2018. The decrease was primarily attributable to a decrease in revenue due to property sales, partially offset by 2019 and 2018 property acquisitions.
Net Income Attributable to Common Shareholders
For the quarter ended December 31, 2019, net income attributable to common shareholders was $83.6 million, or $0.33 per diluted share, compared with net income attributable to common shareholders for the quarter ended December 31, 2018 of $23.8 million, or $0.10 per diluted share.
Adjusted Company FFO
For the quarter ended December 31, 2019, Lexington generated Adjusted Company FFO of $52.4 million, or $0.20 per diluted share, compared to Adjusted Company FFO for the quarter ended December 31, 2018 of $53.7 million, or $0.22 per diluted share.
4
Dividends/Distributions
As previously announced, during the fourth quarter of 2019, Lexington declared its quarterly common share/unit dividend/distribution for the quarter ended December 31, 2019 of $0.105 per common share/unit, an increase of 2.4%, which was paid on January 15, 2020 to common shareholders/unitholders of record as of December 31, 2019. Lexington previously declared a dividend of $0.8125 per share on its Series C Cumulative Convertible Preferred Stock (“Series C Preferred”) for the quarter ended December 31, 2019, which was paid February 18, 2020 to Series C Preferred shareholders of record as of January 31, 2020.
TRANSACTIONS
ACQUISITION TRANSACTIONS
| Property Type | Market | Sq. Ft. | Initial Basis ($000) | Approximate Lease Term (Yrs) | ||||||||||
| Industrial - warehouse/distribution | Greenville/Spartanburg, SC | 196,000 | $ | 16,817 | 5 | |||||||||
| Industrial - warehouse/distribution | Greenville/Spartanburg, SC | 177,320 | 15,583 | 6 | ||||||||||
| Industrial - warehouse/distribution | Phoenix, AZ | 186,336 | 21,020 | 7 | ||||||||||
| Industrial - warehouse/distribution | Phoenix, AZ | 801,424 | 67,079 | 11 | ||||||||||
| Industrial - warehouse/distribution | Chicago, IL | 1,034,200 | 49,348 | 10 | ||||||||||
| Industrial - warehouse/distribution | Greenville/Spartanburg, SC | 1,318,680 | 94,233 | 15 | ||||||||||
| 3,713,960 | $ | 264,080 | ||||||||||||
Including fourth quarter acquisition activity, consolidated 2019 acquisition activity totaled $703.8 million at aggregate weighted-average GAAP and cash capitalization rates of 5.8% and 5.4%, respectively.
DEVELOPMENT PROJECTS
| Project (% owned) | Market | Property
Type | Estimated | Estimated | GAAP Investment Balance as of 12/31/2019 ($000)(1) | Lexington | Estimated | |||||||||||||||
| Consolidated: | ||||||||||||||||||||||
| Fairburn (90%) | Atlanta, GA | Industrial | 910,000 | $ | 53,812 | $ | 10,088 | $ | 7,687 | 4Q 20 | ||||||||||||
| Rickenbacker (100%) | Columbus, OH | Industrial | 320,000 | 20,300 | 3,225 | 2,805 | 1Q 21 | |||||||||||||||
| $ | 74,112 | $ | 13,313 | $ | 10,492 | ||||||||||||||||
| Non-consolidated: | ||||||||||||||||||||||
| ETNA Park 70 (90%)(2) | Columbus, OH | Industrial | TBD | TBD | $ | 8,352 | $ | 8,644 | TBD | |||||||||||||
| ETNA Park 70 East (90%)(2) | Columbus, OH | Industrial | TBD | TBD | 4,310 | 4,351 | TBD | |||||||||||||||
| $ | 12,662 | $ | 12,995 | |||||||||||||||||||
| 1. | GAAP investment balance is in real estate under construction for consolidated projects and in investments in non-consolidated entities for non-consolidated projects. |
| 2. | Plans and specifications for completion have not been completed and the estimated square footage, project cost and completion date cannot be determined. |
5
PROPERTY DISPOSITIONS
| Primary Tenant | Location | Property | Gross | Annualized | Annualized NOI(1) ($000) | Month of Disposition | % | |||||||||||||||||
| Home Depot | Danville, VA | Other | $ | 4,650 | $ | 205 | $ | 276 | October | 100 | % | |||||||||||||
| Vacant | Watertown, NY | Other | 500 | (240 | ) | (244 | ) | October | 0 | % | ||||||||||||||
| Multi-Tenant | Indianapolis, IN | Office | 8,640 | 1,212 | 1,665 | November | 21 | % | ||||||||||||||||
| Multi-Tenant | Farmers Branch, TX | Office | 30,874 | 844 | 1,777 | November | 88 | % | ||||||||||||||||
| Vacant | Fairlea, WV | Other | 390 | (85 | ) | (86 | ) | November | 0 | % | ||||||||||||||
| Faurecia | Auburn Hills, MI | Office | 48,363 | 1,695 | 3,361 | December | 100 | % | ||||||||||||||||
| Multi-Tenant | Houston, TX | Office | 20,041 | (613 | ) | (477 | ) | December | 66 | % | ||||||||||||||
| Cummins | Columbus, IN | Office | 46,915 | 2,413 | 4,868 | December | 100 | % | ||||||||||||||||
| Mimeo | Memphis, TN | Industrial | 4,050 | 398 | 459 | December | 77 | % | ||||||||||||||||
| Alstom Power | Midlothian, VA | Office | 8,300 | 1,654 | 1,881 | December | 100 | % | ||||||||||||||||
| $ | 172,723 | $ | 7,483 | $ | 13,480 | |||||||||||||||||||
| 1. | Generally, quarterly period prior to sale annualized, excluding impairment charges. |
Including fourth quarter disposition activity, consolidated 2019 property disposition volume totaled $621.6 million at aggregate weighted-average GAAP and cash capitalization rates of 6.4% and 5.6%, respectively.
LEASING
During the fourth quarter of 2019, Lexington executed the following new and extended leases:
| LEASE EXTENSIONS | ||||||||||||||
| Location | Primary Tenant(1) | Prior Term | Lease Expiration Date | Sq. Ft. | ||||||||||
| Industrial | ||||||||||||||
| 1 | Antioch | TN | Wirtgen | 12/2019 | 12/2021 | 73,500 | ||||||||
| 2 | Laurens | SC | Michelin | 03/2020 | 01/2021 | 1,164,000 | ||||||||
| 3 | Austell | GA | Mars Wrigley | 05/2020 | 05/2025 | 604,852 | ||||||||
| 3 | Total industrial lease extensions | 1,842,352 | ||||||||||||
| NEW LEASES | ||||||||||||||
| Location | Lease Expiration Date | Sq. Ft. | ||||||||||||
| Industrial | ||||||||||||||
| 1 | Tampa | FL | RC Moore | 02/2023 | 229,605 | |||||||||
| 1 | Total industrial new leases | 229,605 | ||||||||||||
| Office | ||||||||||||||
| 1 | Phoenix | AZ | Valor IT | 07/2025 | 10,785 | |||||||||
| 2 | Lenexa | KS | Quest Diagnostics | 06/2030 | 77,484 | |||||||||
| 2 | Total office new leases | 88,269 | ||||||||||||
| 3 | Total new leases | 317,874 | ||||||||||||
| 6 | TOTAL NEW AND EXTENDED LEASES | 2,160,226 | ||||||||||||
| 1. | Leases greater than 10,000 square feet. |
As of December 31, 2019, Lexington's portfolio was 97.0% leased.
6
BALANCE SHEET/CAPITAL MARKETS
In the fourth quarter of 2019, Lexington issued approximately 6.6 million common shares under its ATM program raising net proceeds of approximately $71.0 million.
In the fourth quarter of 2019, Lexington satisfied $22.0 million of non-recourse debt. In addition, Lexington assumed $41.9 million of non-recourse debt in connection with the acquisition of a property in the Phoenix, Arizona market. The non-recourse debt has a fixed interest rate of 4.29% and matures in 2031.
As of December 31, 2019, Lexington did not have an outstanding balance under its unsecured revolving credit facility.
2020 EARNINGS GUIDANCE
Lexington estimates that its net income attributable to common shareholders per diluted common share for the year ended December 31, 2020 will be within an expected range of $0.95 to $0.98. Lexington estimates that its Adjusted Company FFO for the year ended December 31, 2020 will be within an expected range of $0.74 to $0.77 per diluted common share. This guidance is forward looking, excludes the impact of certain items and is based on current expectations.
FOURTH QUARTER 2019 CONFERENCE CALL
Lexington will host a conference call today February 20, 2020, at 8:30 a.m. Eastern Time, to discuss its results for the quarter ended December 31, 2019. Interested parties may participate in this conference call by dialing 1-844-825-9783 (U.S.), 1-412-317-5163 (International) or 1-855-669-9657 (Canada). A replay of the call will be available through May 20, 2020, at 1-877-344-7529 (U.S.), 1-412-317-0088 (International) or 1-855-669-9658 (Canada); pin code for all replay numbers is 10138613. A link to a live webcast of the conference call is available at www.lxp.com within the Investors section.
7
ABOUT LEXINGTON REALTY TRUST
Lexington Realty Trust (NYSE: LXP) is a publicly traded real estate investment trust (REIT) focused on single-tenant industrial real estate investments across the United States. Lexington seeks to expand its industrial portfolio through acquisitions, build-to-suit transactions, sale-leaseback transactions, development projects and other transactions, including acquisitions. For more information, including Lexington's Quarterly Supplemental Information package, or to follow Lexington on social media, visit www.lxp.com.
Contact:
Investor or Media Inquiries for Lexington Realty Trust:
Heather Gentry, Senior Vice President of Investor Relations
Lexington Realty Trust
Phone: (212) 692-7200 E-mail: [email protected]
This release contains certain forward-looking statements which involve known and unknown risks, uncertainties or other factors not under Lexington's control which may cause actual results, performance or achievements of Lexington to be materially different from the results, performance, or other expectations implied by these forward-looking statements. Factors that could cause or contribute to such differences include, but are not limited to, those discussed under the headings “Management's Discussion and Analysis of Financial Condition and Results of Operations” and “Risk Factors” in Lexington's periodic reports filed with the Securities and Exchange Commission, including risks related to: (1) the authorization by Lexington's Board of Trustees of future dividend declarations, (2) Lexington's ability to achieve its estimates of net income attributable to common shareholders and Adjusted Company FFO for the year ending December 31, 2020, (3) the successful consummation of any lease, acquisition, build-to-suit, development project, disposition, financing or other transaction, (4) the failure to continue to qualify as a real estate investment trust, (5) changes in general business and economic conditions, including the impact of any legislation, (6) competition, (7) increases in real estate construction costs, (8) changes in interest rates, (9) changes in accessibility of debt and equity capital markets, and (10) future impairment charges. Copies of the periodic reports Lexington files with the Securities and Exchange Commission are available on Lexington's web site at www.lxp.com. Forward-looking statements, which are based on certain assumptions and describe Lexington's future plans, strategies and expectations, are generally identifiable by use of the words “believes,” “expects,” “intends,” “anticipates,” “estimates,” “projects”, “may,” “plans,” “predicts,” “will,” “will likely result,” “is optimistic,” “goal,” “objective” or similar expressions. Except as required by law, Lexington undertakes no obligation to publicly release the results of any revisions to those forward-looking statements which may be made to reflect events or circumstances after the occurrence of unanticipated events. Accordingly, there is no assurance that Lexington's expectations will be realized.
References to Lexington refer to Lexington Realty Trust and its consolidated subsidiaries. All interests in properties and loans are held, and all property operating activities are conducted, through special purpose entities, which are separate and distinct legal entities that maintain separate books and records, but in some instances are consolidated for financial statement purposes and/or disregarded for income tax purposes. The assets and credit of each special purpose entity with a property subject to a mortgage loan are not available to creditors to satisfy the debt and other obligations of any other person, including any other special purpose entity or affiliate. Consolidated entities that are not property owner subsidiaries do not directly own any of the assets of a property owner subsidiary (or the general partner, member of managing member of such property owner subsidiary), but merely hold partnership, membership or beneficial interests therein which interests are subordinate to the claims of the property owner subsidiary's (or its general partner's, member's or managing member's) creditors.
8
Non-GAAP Financial Measures - Definitions
Lexington has used non-GAAP financial measures as defined by the Securities and Exchange Commission Regulation G in this Quarterly Earnings Release and in other public disclosures.
Lexington believes that the measures defined below are helpful to investors in measuring our performance or that of an individual investment. Since these measures exclude certain items which are included in their respective most comparable measures under generally accepted accounting principles (“GAAP”), reliance on the measures has limitations; management compensates for these limitations by using the measures simply as supplemental measures that are weighed in balance with other GAAP measures. These measures are not necessarily indications of our cash flow available to fund cash needs. Additionally, they should not be used as an alternative to the respective most comparable GAAP measures when evaluating Lexington's financial performance or cash flow from operating, investing or financing activities or liquidity.
Company Funds Available for Distribution (“FAD”): FAD is calculated by making adjustments to Adjusted Company FFO (see below) for (1) straight-line adjustments, (2) lease incentive amortization, (3) amortization of above/below market leases, (4) lease termination payments, net, (5) non-cash interest, net, (6) non-cash charges, net, (7) cash paid for tenant improvements, and (8) cash paid for lease costs. Although FAD may not be comparable to that of other real estate investment trusts (“REITs”), Lexington believes it provides a meaningful indication of its ability to fund cash needs. FAD is a non-GAAP financial measure and should not be viewed as an alternative measurement of operating performance to net income, as an alternative to net cash flows from operating activities or as a measure of liquidity.
Funds from Operations (“FFO”) and Adjusted Company FFO: Lexington believes that Funds from Operations, or FFO, which is a non-GAAP measure, is a widely recognized and appropriate measure of the performance of an equity REIT. Lexington believes FFO is frequently used by securities analysts, investors and other interested parties in the evaluation of REITs, many of which present FFO when reporting their results. FFO is intended to exclude GAAP historical cost depreciation and amortization of real estate and related assets, which assumes that the value of real estate diminishes ratably over time. Historically, however, real estate values have risen or fallen with market conditions. As a result, FFO provides a performance measure that, when compared year over year, reflects the impact to operations from trends in occupancy rates, rental rates, operating costs, development activities, interest costs and other matters without the inclusion of depreciation and amortization, providing perspective that may not necessarily be apparent from net income.
The National Association of Real Estate Investment Trusts, or NAREIT, defines FFO as “net income (calculated in accordance with GAAP), excluding depreciation and amortization related to real estate, gains and losses from the sales of certain real estate assets, gains and losses from change in control and impairment write-downs of certain real estate assets and investments in entities when the impairment is directly attributable to decreases in value of depreciable real estate held by the entity. The reconciling items include amounts to adjust earnings from consolidated partially-owned entities and equity in earnings of unconsolidated affiliates to FFO.” FFO does not represent cash generated from operating activities in accordance with GAAP and is not indicative of cash available to fund cash needs.
Lexington presents FFO available to common shareholders and unitholders - basic and also presents FFO available to all equityholders and unitholders - diluted on a company-wide basis as if all securities that are convertible, at the holder's option, into Lexington’s common shares, are converted at the beginning of the period. Lexington also presents Adjusted Company FFO available to all equityholders and unitholders - diluted which adjusts FFO available to all equityholders and unitholders - diluted for certain items which we believe are not indicative of the operating results of Lexington's real estate portfolio. Lexington believes this is an appropriate presentation as it is frequently requested by security analysts, investors and other interested parties. Since others do not calculate these measures in a similar fashion, these measures may not be comparable to similarly titled measures as reported by others. These measures should not be considered as an alternative to net income as an indicator of Lexington’s operating performance or as an alternative to cash flow as a measure of liquidity.
GAAP and Cash Yield or Capitalization Rate: GAAP and cash yields or capitalization rates are measures of operating performance used to evaluate the individual performance of an investment. These measures are estimates and are not presented or intended to be viewed as a liquidity or performance measure that present a numerical measure of Lexington's historical or future financial performance, financial position or cash flows. The yield or capitalization rate is calculated by dividing the annualized NOI (as defined below, except GAAP rent adjustments are added back to rental income to calculate GAAP yield or capitalization rate) the investment is expected to generate (or has generated) divided by the acquisition/completion cost (or sale) price.
Net Operating Income (“NOI”): NOI is a measure of operating performance used to evaluate the individual performance of an investment. This measure is not presented or intended to be viewed as a liquidity or performance measure that presents a numerical measure of Lexington's historical or future financial performance, financial position or cash flows. Lexington defines NOI as operating revenues (rental income (less GAAP rent adjustments and lease termination income), and other property income) less property operating expenses. Other REITs may use different methodologies for calculating NOI, and accordingly, Lexington's NOI may not be comparable to other companies. Because NOI excludes general and administrative expenses, interest expense, depreciation and amortization, acquisition-related expenses, other nonproperty income and losses, and gains and losses from property dispositions, it provides a performance measure that, when compared year over year, reflects the revenues and expenses directly associated with owning and operating commercial real estate and the impact to operations from trends in occupancy rates, rental rates, and operating costs, providing a perspective on operations not immediately apparent from net income. Lexington believes that net income is the most directly comparable GAAP measure to NOI.
# # #
9
LEXINGTON REALTY TRUST AND CONSOLIDATED SUBSIDIARIES
CONDENSED CONSOLIDATED STATEMENTS OF OPERATIONS
(Unaudited and in thousands, except share and per share data)
| Three months ended December 31, | Twelve months ended December 31, | |||||||||||||||
| 2019 | 2018 | 2019 | 2018 | |||||||||||||
| Gross revenues: | ||||||||||||||||
| Rental revenue | $ | 81,564 | $ | 87,251 | $ | 320,622 | $ | 395,339 | ||||||||
| Other revenue | 1,472 | 932 | 5,347 | 1,632 | ||||||||||||
| Total gross revenues | 83,036 | 88,183 | 325,969 | 396,971 | ||||||||||||
| Expense applicable to revenues: | ||||||||||||||||
| Depreciation and amortization | (35,977 | ) | (38,498 | ) | (147,594 | ) | (168,191 | ) | ||||||||
| Property operating | (11,052 | ) | (9,614 | ) | (42,018 | ) | (42,675 | ) | ||||||||
| General and administrative | (7,133 | ) | (7,763 | ) | (30,785 | ) | (31,662 | ) | ||||||||
| Non-operating income | 335 | 893 | 2,262 | 1,859 | ||||||||||||
| Interest and amortization expense | (14,380 | ) | (16,656 | ) | (65,095 | ) | (79,880 | ) | ||||||||
| Debt satisfaction gains (charges), net | 10 | (368 | ) | (4,517 | ) | (2,596 | ) | |||||||||
| Impairment charges | (2,974 | ) | (4,953 | ) | (5,329 | ) | (95,813 | ) | ||||||||
| Gains on sales of properties | 74,227 | 13,336 | 250,889 | 252,913 | ||||||||||||
| Income before provision for income taxes and equity in earnings (losses) of non-consolidated entities | 86,092 | 24,560 | 283,782 | 230,926 | ||||||||||||
| Provision for income taxes | (271 | ) | (402 | ) | (1,379 | ) | (1,728 | ) | ||||||||
| Equity in earnings (losses) of non-consolidated entities | (398 | ) | 1,516 | 2,890 | 1,708 | |||||||||||
| Net income | 85,423 | 25,674 | 285,293 | 230,906 | ||||||||||||
| Less net income attributable to noncontrolling interests | (192 | ) | (266 | ) | (5,383 | ) | (3,491 | ) | ||||||||
| Net income attributable to Lexington Realty Trust shareholders | 85,231 | 25,408 | 279,910 | 227,415 | ||||||||||||
| Dividends attributable to preferred shares – Series C | (1,572 | ) | (1,572 | ) | (6,290 | ) | (6,290 | ) | ||||||||
| Allocation to participating securities | (85 | ) | (40 | ) | (395 | ) | (287 | ) | ||||||||
| Net income attributable to common shareholders | $ | 83,574 | $ | 23,796 | $ | 273,225 | $ | 220,838 | ||||||||
| Net income attributable to common shareholders – per common share basic | $ | 0.34 | $ | 0.10 | $ | 1.15 | $ | 0.93 | ||||||||
| Weighted-average common shares outstanding – basic | 248,943,975 | 233,963,608 | 237,642,048 | 236,666,375 | ||||||||||||
| Net income attributable to common shareholders – per common share diluted | $ | 0.33 | $ | 0.10 | $ | 1.15 | $ | 0.93 | ||||||||
| Weighted-average common shares outstanding – diluted | 252,939,590 | 238,292,912 | 237,934,515 | 240,810,990 | ||||||||||||
10
LEXINGTON REALTY TRUST AND CONSOLIDATED SUBSIDIARIES
CONDENSED CONSOLIDATED BALANCE SHEETS
As of December 31,
(In thousands, except share and per share data)
| 2019 | 2018 | |||||||
| (unaudited) | ||||||||
| Assets: | ||||||||
| Real estate, at cost | $ | 3,320,574 | $ | 3,090,134 | ||||
| Real estate - intangible assets | 409,756 | 419,612 | ||||||
| Investments in real estate under construction | 13,313 | — | ||||||
| Real estate, gross | 3,743,643 | 3,509,746 | ||||||
| Less: accumulated depreciation and amortization | 887,629 | 954,087 | ||||||
| Real estate, net | 2,856,014 | 2,555,659 | ||||||
| Assets held for sale | — | 63,868 | ||||||
| Operating lease right-of-use assets, net | 38,133 | — | ||||||
| Cash and cash equivalents | 122,666 | 168,750 | ||||||
| Restricted cash | 6,644 | 8,497 | ||||||
| Investments in non-consolidated entities | 57,168 | 66,183 | ||||||
| Deferred expenses, net | 18,404 | 15,937 | ||||||
| Rent receivable – current | 3,229 | 3,475 | ||||||
| Rent receivable – deferred | 66,294 | 58,692 | ||||||
| Other assets | 11,708 | 12,779 | ||||||
| Total assets | $ | 3,180,260 | $ | 2,953,840 | ||||
| Liabilities and Equity: | ||||||||
| Liabilities: | ||||||||
| Mortgages and notes payable, net | $ | 390,272 | $ | 570,420 | ||||
| Term loans payable, net | 297,439 | 298,733 | ||||||
| Senior notes payable, net | 496,870 | 496,034 | ||||||
| Trust preferred securities, net | 127,396 | 127,296 | ||||||
| Dividends payable | 32,432 | 48,774 | ||||||
| Liabilities held for sale | — | 386 | ||||||
| Operating lease liabilities | 39,442 | — | ||||||
| Accounts payable and other liabilities | 29,925 | 30,790 | ||||||
| Accrued interest payable | 7,897 | 4,523 | ||||||
| Deferred revenue - including below market leases, net | 20,350 | 20,531 | ||||||
| Prepaid rent | 13,518 | 9,675 | ||||||
| Total liabilities | 1,455,541 | 1,607,162 | ||||||
| Commitments and contingencies | ||||||||
| Equity: | ||||||||
| Preferred shares, par value $0.0001 per share; authorized 100,000,000 shares: | ||||||||
| Series C Cumulative Convertible Preferred, liquidation preference $96,770; 1,935,400 shares issued and outstanding | 94,016 | 94,016 | ||||||
| Common shares, par value $0.0001 per share; authorized 400,000,000 shares, 254,770,719 and 235,008,554 shares issued and outstanding in 2019 and 2018, respectively | 25 | 24 | ||||||
| Additional paid-in-capital | 2,976,670 | 2,772,855 | ||||||
| Accumulated distributions in excess of net income | (1,363,676 | ) | (1,537,100 | ) | ||||
| Accumulated other comprehensive income (loss) | (1,928 | ) | 76 | |||||
| Total shareholders’ equity | 1,705,107 | 1,329,871 | ||||||
| Noncontrolling interests | 19,612 | 16,807 | ||||||
| Total equity | 1,724,719 | 1,346,678 | ||||||
| Total liabilities and equity | $ | 3,180,260 | $ | 2,953,840 | ||||
11
LEXINGTON REALTY TRUST AND CONSOLIDATED SUBSIDIARIES
EARNINGS PER SHARE
(Unaudited and in thousands, except share and per share data)
| Three Months Ended December 31, | Twelve Months Ended December 31, | |||||||||||||||
| 2019 | 2018 | 2019 | 2018 | |||||||||||||
| EARNINGS PER SHARE: | ||||||||||||||||
| Basic: | ||||||||||||||||
| Net income attributable to common shareholders | $ | 83,574 | $ | 23,796 | $ | 273,225 | $ | 220,838 | ||||||||
| Weighted-average common shares outstanding - basic | 248,943,975 | 233,963,608 | 237,642,048 | 236,666,375 | ||||||||||||
| Net income attributable to common shareholders - per common share basic | $ | 0.34 | $ | 0.10 | $ | 1.15 | $ | 0.93 | ||||||||
| Diluted: | ||||||||||||||||
| Net income attributable to common shareholders - basic | $ | 83,574 | $ | 23,796 | $ | 273,225 | $ | 220,838 | ||||||||
| Impact of assumed conversions | (34 | ) | 21 | — | 2,528 | |||||||||||
| Income from continuing operations attributable to common shareholders | $ | 83,540 | $ | 23,817 | $ | 273,225 | $ | 223,366 | ||||||||
| Weighted-average common shares outstanding - basic | 248,943,975 | 233,963,608 | 237,642,048 | 236,666,375 | ||||||||||||
| Effect of dilutive securities: | ||||||||||||||||
| Unvested share-based payment awards and options | 639,178 | 723,120 | 292,467 | 528,495 | ||||||||||||
| Operating Partnership Units | 3,356,437 | 3,606,184 | — | 3,616,120 | ||||||||||||
| Weighted-average common shares outstanding - diluted | 252,939,590 | 238,292,912 | 237,934,515 | 240,810,990 | ||||||||||||
| Net income attributable to common shareholders - per common share diluted | $ | 0.33 | $ | 0.10 | $ | 1.15 | $ | 0.93 | ||||||||
12
LEXINGTON REALTY TRUST AND CONSOLIDATED SUBSIDIARIES
ADJUSTED COMPANY FUNDS FROM OPERATIONS & FUNDS AVAILABLE FOR DISTRIBUTION
(Unaudited and in thousands, except share and per share data)
| Three Months Ended December 31, | Twelve Months Ended December 31, | |||||||||||||||
| 2019 | 2018 | 2019 | 2018 | |||||||||||||
| FUNDS FROM OPERATIONS: | ||||||||||||||||
| Basic and Diluted: | ||||||||||||||||
| Net income attributable to common shareholders | $ | 83,574 | $ | 23,796 | $ | 273,225 | $ | 220,838 | ||||||||
| Adjustments: | ||||||||||||||||
| Depreciation and amortization | 35,323 | 37,819 | 144,792 | 164,261 | ||||||||||||
| Impairment charges - real estate | 2,974 | 4,953 | 5,329 | 95,813 | ||||||||||||
| Noncontrolling interests - OP units | (34 | ) | 22 | 4,376 | 2,528 | |||||||||||
| Amortization of leasing commissions | 654 | 679 | 2,802 | 3,930 | ||||||||||||
| Joint venture and noncontrolling interest adjustment | 2,249 | 2,567 | 9,449 | 4,063 | ||||||||||||
| Gains on sales of properties, including non-consolidated entities and net of tax | (74,211 | ) | (14,821 | ) | (255,048 | ) | (254,269 | ) | ||||||||
| FFO available to common shareholders and unitholders - basic | 50,529 | 55,015 | 184,925 | 237,164 | ||||||||||||
| Preferred dividends | 1,572 | 1,572 | 6,290 | 6,290 | ||||||||||||
| Amount allocated to participating securities | 85 | 40 | 395 | 287 | ||||||||||||
| FFO available to all equityholders and unitholders - diluted | 52,186 | 56,627 | 191,610 | 243,741 | ||||||||||||
| Debt satisfaction (gains) charges, net, including non-consolidated entities | (9 | ) | 368 | 4,773 | 2,596 | |||||||||||
| Other(1) | 202 | (3,305 | ) | 202 | (10,038 | ) | ||||||||||
| Adjusted Company FFO available to all equityholders and unitholders - diluted | 52,379 | 53,690 | 196,585 | 236,299 | ||||||||||||
| FUNDS AVAILABLE FOR DISTRIBUTION: | ||||||||||||||||
| Adjustments: | ||||||||||||||||
| Straight-line rents | (3,656 | ) | (4,722 | ) | (14,502 | ) | (20,968 | ) | ||||||||
| Lease incentives | 293 | 227 | 1,191 | 1,686 | ||||||||||||
| Amortization of above/below market leases | (269 | ) | (28 | ) | (443 | ) | 285 | |||||||||
| Lease termination payments, net | 25 | (309 | ) | (1,095 | ) | (1,234 | ) | |||||||||
| Non-cash interest, net | 563 | 854 | 2,709 | 4,209 | ||||||||||||
| Non-cash charges, net | 1,577 | 1,611 | 6,410 | 6,810 | ||||||||||||
| Tenant improvements | (2,885 | ) | (1,608 | ) | (7,817 | ) | (8,271 | ) | ||||||||
| Lease costs | (3,743 | ) | (1,448 | ) | (14,367 | ) | (4,522 | ) | ||||||||
| Joint venture and non-controlling interest adjustment | (63 | ) | (449 | ) | (3,794 | ) | (505 | ) | ||||||||
| Company Funds Available for Distribution | $ | 44,221 | $ | 47,818 | $ | 164,877 | $ | 213,789 | ||||||||
| Per Common Share and Unit Amounts | ||||||||||||||||
| Basic: | ||||||||||||||||
| FFO | $ | 0.20 | $ | 0.23 | $ | 0.77 | $ | 0.99 | ||||||||
| Diluted: | ||||||||||||||||
| FFO | $ | 0.20 | $ | 0.23 | $ | 0.78 | $ | 0.99 | ||||||||
| Adjusted Company FFO | $ | 0.20 | $ | 0.22 | $ | 0.80 | $ | 0.96 | ||||||||
| Weighted-Average Common Shares | ||||||||||||||||
| Basic: | ||||||||||||||||
| Weighted-average common shares outstanding - basic EPS | 248,943,975 | 233,963,608 | 237,642,048 | 236,666,375 | ||||||||||||
| Operating partnership units(2) | 3,356,437 | 3,606,184 | 3,490,147 | 3,616,120 | ||||||||||||
| Weighted-average common shares outstanding - basic FFO | 252,300,412 | 237,569,792 | 241,132,195 | 240,282,495 | ||||||||||||
| Diluted: | ||||||||||||||||
| Weighted-average common shares outstanding - diluted EPS | 252,939,590 | 238,292,912 | 237,934,515 | 240,810,990 | ||||||||||||
| Unvested share-based payment awards | 36,516 | — | 22,813 | — | ||||||||||||
| Operating partnership units(1) | — | — | 3,490,147 | — | ||||||||||||
| Preferred shares - Series C | 4,710,570 | 4,710,570 | 4,710,570 | 4,710,570 | ||||||||||||
| Weighted-average common shares outstanding - diluted FFO | 257,686,676 | 243,003,482 | 246,158,045 | 245,521,560 | ||||||||||||
| (1) | "Other" primarily consisted of transaction related costs in 2019 and the acceleration of below-market lease intangible accretion in 2018. |
| (2) | Includes OP units other than OP units held by Lexington. |
13
LEXINGTON REALTY TRUST AND CONSOLIDATED SUBSIDIARIES
RECONCILIATION OF NON-GAAP MEASURES
(UNAUDITED)
2020 EARNINGS GUIDANCE
| Twelve
Months Ended December 31, 2020 | ||||||||
| Range | ||||||||
| Estimated: | ||||||||
| Net income attributable to common shareholders per diluted common share(1) | $ | 0.95 | $ | 0.98 | ||||
| Depreciation and amortization | 0.62 | 0.62 | ||||||
| Impact of capital transactions | (0.83 | ) | (0.83 | ) | ||||
| Estimated Adjusted Company FFO per diluted common share | $ | 0.74 | $ | 0.77 | ||||
| (1) | Assumes all convertible securities are dilutive. |
14
LEXINGTON REALTY TRUST
2019 Fourth Quarter Investments / Capital Recycling Summary
PROPERTY INVESTMENTS
| Property Type | Market | Square Feet | Initial Basis ($000) | Month Closed | Primary Lease Expiration | |||||||||||||||
| 1 | Industrial - Warehouse/distribution | Greenville/Spartanburg | SC | 196,000 | $ | 16,817 | October | 01/2024 | ||||||||||||
| 2 | Industrial - Warehouse/distribution | Greenville/Spartanburg | SC | 177,320 | 15,583 | October | 04/2025 | |||||||||||||
| 3 | Industrial - Warehouse/distribution | Phoenix | AZ | 186,336 | 21,020 | October | 09/2026 | |||||||||||||
| 4 | Industrial - Warehouse/distribution | Phoenix | AZ | 801,424 | 67,079 | November | 09/2030 | |||||||||||||
| 5 | Industrial - Warehouse/distribution | Chicago | IL | 1,034,200 | 49,348 | December | 09/2029 | |||||||||||||
| 6 | Industrial - Warehouse/distribution | Greenville/Spartanburg | SC | 1,318,680 | 94,233 | December | 12/2034 | |||||||||||||
| 6 | TOTAL PROPERTY INVESTMENTS | 3,713,960 | $ | 264,080 | ||||||||||||||||
CAPITAL RECYCLING
PROPERTY DISPOSITIONS
| Primary Tenant | Location | Property Type | Gross Disposition Price ($000) | Annualized Net Income ($000) (1) | Annualized NOI ($000)(1)(2) | Month of Disposition | % Leased | Gross Disposition Price PSF | ||||||||||||||||||
| 1 | Home Depot | Danville | VA | Other | $ | 4,650 | $ | 205 | $ | 276 | October | 100 | % | $ | - | |||||||||||
| 2 | Vacant | Watertown | NY | Other | 500 | (240 | ) | (244 | ) | October | 0 | % | 4.14 | |||||||||||||
| 3 | Multi-Tenant | Indianapolis | IN | Office | 8,640 | 1,212 | 1,665 | November | 21 | % | 61.26 | |||||||||||||||
| 4 | Multi-Tenant | Farmers Branch | TX | Office | 30,874 | 844 | 1,777 | November | 88 | % | 170.50 | |||||||||||||||
| 5 | Vacant | Fairlea | WV | Other | 390 | (85 | ) | (86 | ) | November | 0 | % | 4.29 | |||||||||||||
| 6 | Faurecia | Auburn Hills | MI | Office | 48,363 | 1,695 | 3,361 | December | 100 | % | 173.97 | |||||||||||||||
| 7 | Multi-Tenant | Houston | TX | Office | 20,041 | (613 | ) | (477 | ) | December | 66 | % | 128.96 | |||||||||||||
| 8 | Cummins | Columbus | IN | Office | 46,915 | 2,413 | 4,868 | December | 100 | % | 120.26 | |||||||||||||||
| 9 | Mimeo | Memphis | TN | Industrial | 4,050 | 398 | 459 | December | 77 | % | 28.91 | |||||||||||||||
| 10 | Alstom Power | Midlothian | VA | Office | 8,300 | 1,654 | 1,881 | December | 100 | % | 83.79 | |||||||||||||||
| 10 | TOTAL PROPERTY DISPOSITIONS | $ | 172,723 | $ | 7,483 | $ | 13,480 | |||||||||||||||||||
| Footnotes | |
| (1) | Generally, quarterly period prior to sale annualized, excluding impairment charges. |
| (2) | See definitions of non-GAAP measures and reconciliations to applicable GAAP measures in this document. |
| 15 |
LEXINGTON REALTY TRUST
12/31/2019
DEVELOPMENT PROJECTS
| GAAP | Lexington | ||||||||||||||||||
| Estimated | Investment Balance | Amount Funded | Estimated | ||||||||||||||||
| Project | Property | Estimated | Project Cost | as of 12/31/19 | as of 12/31/19 | Completion | |||||||||||||
| (% owned) | Market | Type | Sq. Ft. | ($000) | ($000) (1) | ($000) | Date | ||||||||||||
| Consolidated | |||||||||||||||||||
| 1 | Fairburn (90%) | Atlanta, GA | Industrial | 910,000 | $ | 53,812 | $ | 10,088 | $ | 7,687 | 4Q 2020 | ||||||||
| 2 | Rickenbacker (100%) | Columbus, OH | Industrial | 320,000 | 20,300 | 3,225 | 2,805 | 1Q 2021 | |||||||||||
| 2 | Total Consolidated Development | $ | 74,112 | $ | 13,313 | $ | 10,492 | ||||||||||||
| Non - Consolidated | |||||||||||||||||||
| 1 | Etna Park 70 (90%) (2) | Columbus, OH | Industrial | TBD | TBD | $ | 8,352 | $ | 8,644 | TBD | |||||||||
| 2 | Etna Park 70 East (90%) (2) | Columbus, OH | Industrial | TBD | TBD | 4,310 | 4,351 | TBD | |||||||||||
| 2 | Total Non-Consolidated Development | $ | 12,662 | $ | 12,995 | ||||||||||||||
| 4 | Total Development Projects | $ | 25,975 | $ | 23,487 | ||||||||||||||
| Footnotes | |
| (1) | GAAP investment balance is in real estate under construction for consolidated projects and in investments in non-consolidated entities for non-consolidated projects. |
| (2) | Plans and specifications for completion have not been completed and the estimated square footage, project cost and completion date cannot be determined. |
| 16 |
LEXINGTON REALTY TRUST
2019 Fourth Quarter Financing Summary
DEBT RETIRED
| Location | Tenant | Property Type | Face / Satisfaction ($000) | Rate | Maturity Date | ||||||||||
| 1 | Oakland, ME | T-Mobile USA | Office | $ | 7,939 | 5.930 | % | 10/2020 | |||||||
| 2 | Lenexa, KS | Quest Diagnostics | Office | 7,777 | 6.270 | % | 12/2019 | ||||||||
| 3 | Lavonia, GA | TI Automotive | Industrial | 6,297 | 5.460 | % | 12/2020 | ||||||||
| 3 | Total Mortgage Debt | $ | 22,013 | ||||||||||||
PROPERTY LEVEL FINANCING (1)
| Location | Tenant (3) | Property Type | Face ($000) | Fixed Rate | Maturity Date | |||||||||
| Goodyear, AZ (2) | Undisclosed | Industrial | $ | 41,877 | 4.290 | % | 08/2031 |
| Footnotes | |
| (1) | Also, a 20% owned joint venture incurred an additional $7.3 million of secured debt. |
| (2) | Assumed mortgage at acquisition. |
| (3) | Lease restricts certain disclosures. |
| 17 |
LEXINGTON REALTY TRUST
2019 Fourth Quarter Leasing Summary
LEASE EXTENSIONS
| Tenant (1) | Location | Prior Term | Lease Expiration Date | Sq. Ft. | New Base Rent Per Annum ($000)(2)(3) | Prior Base Rent Per Annum ($000) | New Cash Base Rent Per Annum ($000)(2)(3) | Prior Cash Base Rent Per Annum ($000)(3) | |||||||||||||||||
| Industrial | |||||||||||||||||||||||||
| 1 | Wirtgen | Antioch | TN | 12/2019 | 12/2021 | 73,500 | $ | 184 | $ | 216 | $ | 184 | $ | 216 | |||||||||||
| 2 | Michelin | Laurens | SC | 03/2020 | 01/2021 | 1,164,000 | 3,594 | 3,594 | 3,594 | 3,594 | |||||||||||||||
| 3 | Mars Wrigley | Austell | GA | 05/2020 | 05/2025 | 604,852 | 4,406 | 2,590 | 4,235 | 3,587 | |||||||||||||||
| 3 | Total Industrial Lease Extensions | 1,842,352 | $ | 8,184 | $ | 6,400 | $ | 8,013 | $ | 7,397 | |||||||||||||||
| 3 | TOTAL EXTENDED LEASES | 1,842,352 | $ | 8,184 | $ | 6,400 | $ | 8,013 | $ | 7,397 | |||||||||||||||
NEW LEASES
| Tenant (1) | Location | Lease Expiration Date | Sq. Ft. | New Base Rent Per Annum ($000)(2)(3) | New Cash Base Rent Per Annum ($000)(2)(3) | |||||||||||||
| Industrial | ||||||||||||||||||
| 1 | RC Moore (4) | Tampa | FL | 02/2023 | 229,605 | $ | 1,152 | $ | 1,160 | |||||||||
| 1 | Total Industrial New Leases | 229,605 | $ | 1,152 | $ | 1,160 | ||||||||||||
| Office | ||||||||||||||||||
| 1 | Valor IT | Phoenix | AZ | 07/2025 | 10,785 | $ | 215 | $ | 187 | |||||||||
| 2 | Quest Diagnostics (5) | Lenexa | KS | 06/2030 | 77,484 | 1,013 | 1,103 | |||||||||||
| 2 | Total Office New Leases | 88,269 | $ | 1,228 | $ | 1,290 | ||||||||||||
| 3 | TOTAL NEW LEASES | 317,874 | $ | 2,380 | $ | 2,450 | ||||||||||||
| 6 | TOTAL NEW AND EXTENDED LEASES | 2,160,226 | $ | 10,564 | $ | 10,463 | ||||||||||||
| 18 |
LEXINGTON REALTY TRUST
2019 Fourth Quarter Leasing Summary
NEW VACANCY (6)
| Prior Lease | 2019 | 2019 | ||||||||||||||||
| Expiration | Base Rent | Cash Rent | ||||||||||||||||
| Former Tenant | Location | Date | Sq. Ft. | ($000)(3) | ($000)(3) | |||||||||||||
| Industrial | ||||||||||||||||||
| Michelin | Moody | AL | 12/2019 | 595,346 | $ | 1,408 | $ | 1,450 | ||||||||||
| Footnotes | |
| (1) | Leases greater than 10,000 square feet. |
| (2) | Assumes twelve months rent from the later of 1/1/20 or lease commencement/extension, excluding free rent periods as applicable. |
| (3) | See definitions of non-GAAP measures and reconciliations to applicable GAAP measures in this document. |
| (4) | Prior tenant terminated lease 12/11/19; new tenant (RC Moore) will lease building effective 1/1/20. |
| (5) | Previous tenant lease expired and sub-lease tenant (Quest Diagnostics) entered into a direct lease. |
| (6) | Excludes multi-tenant properties, disposed properties and non-consolidated investments. |
| 19 |
LEXINGTON REALTY TRUST
12/31/2019
($000)
Other Revenue Data
| Base Rent | ||||||||||||
| Twelve months ended | ||||||||||||
| Asset Class | 12/31/19 (1) | 12/31/19 Percentage | 12/31/18 Percentage | |||||||||
| Industrial | $ | 194,485 | 75.5 | % | 65.4 | % | ||||||
| Office/Other | 63,274 | 24.5 | % | 34.6 | % | |||||||
| $ | 257,759 | 100.0 | % | 100.0 | % | |||||||
| Base Rent | ||||||||||||
| Twelve months ended | ||||||||||||
| Credit Ratings (2) | 12/31/19 (1) | 12/31/19 Percentage | 12/31/18 Percentage | |||||||||
| Investment Grade | $ | 125,509 | 48.7 | % | 39.1 | % | ||||||
| Non-Investment Grade | 60,016 | 23.3 | % | 19.0 | % | |||||||
| Unrated | 72,234 | 28.0 | % | 41.9 | % | |||||||
| $ | 257,759 | 100.0 | % | 100.0 | % | |||||||
| Weighted-Average Lease Term - Cash Basis | As of 12/31/19 | As of 12/31/18 | ||
| 8.4 years | 8.9 years |
Rent Estimates for Current Assets
| Year | Base Rent (3) | Cash Base Rent (3) | Difference | |||||||||
| 2020 | $ | 279,385 | $ | 265,202 | $ | (14,183 | ) | |||||
| 2021 | 259,213 | 250,661 | (8,552 | ) | ||||||||
Footnotes
| (1) | Twelve months ended 12/31/2019 Base Rent recognized for consolidated properties owned as of 12/31/2019. |
| (2) | Credit ratings are based upon either tenant, guarantor or parent/ultimate parent. Historical comparison was not adjusted for subsequent tenant entity changes and multi-tenant was generally reflected as unrated. |
| (3) | Amounts assume (1) lease terms for non-cancellable periods only, (2) no new or renegotiated leases are entered into after 12/31/2019, and (3) no properties are sold or acquired after 12/31/2019. |
20
LEXINGTON REALTY TRUST
Other Revenue Data (Continued)
12/31/2019
($000)
Same-Store NOI (1)
| Twelve months ended December 31, | ||||||||
| 2019 | 2018 | |||||||
| Total Cash Base Rent | $ | 214,081 | $ | 216,563 | ||||
| Tenant Reimbursements | 22,044 | 17,791 | ||||||
| Property Operating Expenses | (28,226 | ) | (22,924 | ) | ||||
| Same-Store NOI | $ | 207,899 | $ | 211,430 | ||||
| Change in Same-Store NOI (2) | (1.7 | )% | ||||||
| Same-Store Percent Leased (3) | As of 12/31/19 | As of 12/31/18 | ||||||
| 96.7 | % | 98.5 | % | |||||
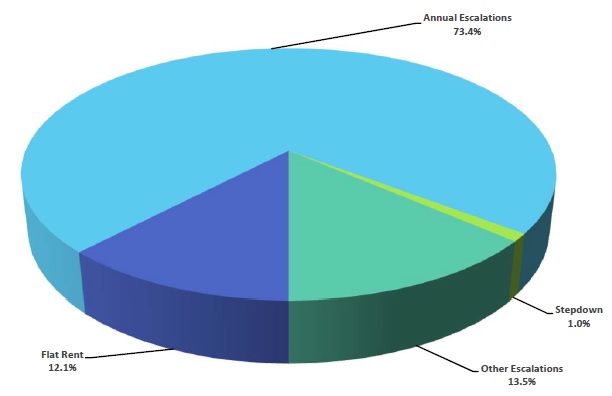
Lease Escalation Data (4)
Footnotes
| (1) | NOI is on a consolidated cash basis excluding properties acquired and sold in 2019 and 2018 and properties subject to mortgage loans in default at December 31, 2019. |
| See definitions of non-GAAP measures and reconciliations to applicable GAAP measures in this document. |
| (2) | Change in Same-Store NOI was breakeven excluding single-tenant property vacancies. |
| (3) | Excludes properties acquired or sold in 2019 and 2018 and properties subject to mortgage loans in default at December 31, 2019. |
| (4) | Based on twelve months consolidated Cash Base Rents for single-tenant leases (properties greater than 50% leased to a single tenant) owned as of December 31, 2019. Excludes parking operations and rents from prior tenants. |
21
LEXINGTON REALTY TRUST
Portfolio Detail By Asset Class
12/31/2019
($000, except square footage)
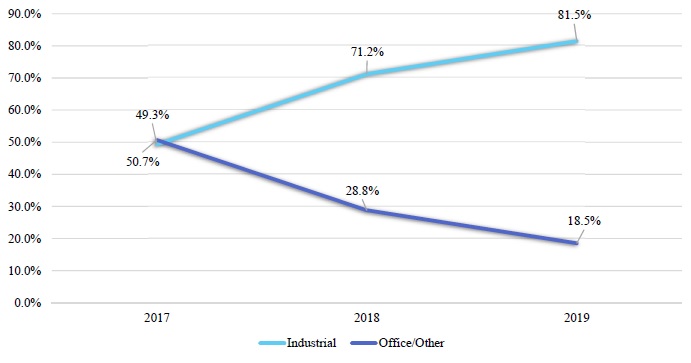
| Asset Class | YE 2017 (1) | YE 2018 (1)(2) | YE 2019 | |||||||||
| Industrial | ||||||||||||
| % of Cost (3) | 49.3 | % | 71.2 | % | 81.5 | % | ||||||
| % of ABR (4) | 44.3 | % | 65.4 | % | 75.5 | % | ||||||
| % Leased | 99.9 | % | 96.3 | % | 97.9 | % | ||||||
| Wtd. Avg. Lease Term (5) | 10.5 | 9.7 | 8.3 | |||||||||
| Mortgage Debt | $ | 193,529 | $ | 206,006 | $ | 109,939 | ||||||
| % Investment Grade (4) | 28.4 | % | 31.6 | % | 45.9 | % | ||||||
| Square Feet | 36,071,422 | 41,447,962 | 48,742,014 | |||||||||
| Office/Other | ||||||||||||
| % of Cost (3) | 50.7 | % | 28.8 | % | 18.5 | % | ||||||
| % of ABR (4)(6) | 55.7 | % | 34.6 | % | 24.5 | % | ||||||
| % Leased | 96.0 | % | 87.1 | % | 85.8 | % | ||||||
| Wtd. Avg. Lease Term (5) | 7.9 | 7.2 | 8.5 | |||||||||
| Mortgage Debt | $ | 503,539 | $ | 369,508 | $ | 283,933 | ||||||
| % Investment Grade (4) | 49.4 | % | 53.2 | % | 57.3 | % | ||||||
| Square Feet | 12,542,640 | 6,111,588 | 3,876,294 | |||||||||
| Construction in progress (7) | $ | 4,219 | $ | 1,840 | $ | 15,208 | ||||||
Footnotes
| (1) | Office and Other properties combined. |
| (2) | Pataskala, Ohio property reclassed to Industrial from Office/Other. |
| (3) | Based on gross book value of real estate assets; excludes held for sale assets. |
| (4) | Percentage of Base Rent, for consolidated properties owned as of each respective period. |
| (5) | Cash basis. |
| (6) | YE 2018 excludes the acceleration of below-market lease intangible accretion on one Kmart asset. |
| (7) | Includes development classified as real estate under construction on a consolidated basis. |
22
LEXINGTON REALTY TRUST
12/31/2019
As a Percent of Gross Book Value (1)

Portfolio Composition (2)
Footnotes
| (1) | Based on gross book value of real estate assets as of 12/31/2019. |
| (2) | Based on gross book value of real estate assets as of 12/31/2019, 12/31/2018 and 12/31/2017, as applicable and excludes held for sale assets. |
23
LEXINGTON REALTY TRUST
12/31/2019
($000)
The purpose of providing the following information is to enable readers to derive their own estimates of net asset value. This information is not intended to be an asset-by-asset or enterprise valuation.
| Consolidated properties twelve month net operating income (NOI) (1) | ||||
| Industrial | $ | 167,797 | ||
| Office/Other | 57,891 | |||
| Total Net Operating Income | $ | 225,688 | ||
| Lexington's share of non-consolidated twelve month NOI (1) | ||||
| NNN OFFICE JV | ||||
| Office | $ | 10,312 | ||
| OTHER JV | ||||
| Other | $ | 1,490 | ||
| Other income | ||||
| Advisory fees | $ | 3,918 | ||
| In service assets not fairly valued by capitalized NOI method (1) | ||||
| Wholly-owned assets acquired in 2019 | $ | 690,720 | ||
| Wholly-owned assets less than 70% leased | $ | 42,391 | ||
| Add other assets: | ||||
| Construction in progress | $ | 1,895 | ||
| Developable land | 12,995 | |||
| Development investment at cost incurred | 10,492 | |||
| Cash and cash equivalents | 122,666 | |||
| Restricted cash | 6,644 | |||
| Accounts receivable | 3,229 | |||
| Other assets | 11,708 | |||
| Total other assets | $ | 169,629 | ||
| Liabilities: | ||||
| Corporate level debt (face amount) | $ | 929,120 | ||
| Mortgages and notes payable (face amount) | 393,872 | |||
| Dividends payable | 32,432 | |||
| Accounts payable, accrued expenses and other liabilities | 51,340 | |||
| Preferred stock, at liquidation value | 96,770 | |||
| Lexington's share of non-consolidated mortgages (face amount) | 89,418 | |||
| Total deductions | $ | 1,592,952 | ||
| Common shares & OP units at 12/31/2019 | 257,956,216 |
Footnotes
| (1) | NOI for the existing property portfolio at December 31, 2019, excludes NOI related to assets undervalued by a capitalized NOI method and assets held for sale. Assets undervalued by a capitalized NOI method are identified generally by occupancies under 70% and assets acquired in 2019. For assets in this category an NOI capitalization approach is not appropriate, and accordingly, Lexington's net book value has been used. See definitions of non-GAAP measures and reconciliations to applicable GAAP measures in this document. |
24
LEXINGTON REALTY TRUST
Consolidated Portfolio Concentration
12/31/2019
| Markets (1) | Percent of Base Rent as of 12/31/19 (2) | |||||
| 1 | Houston, TX | 11.4 | % | |||
| 2 | Memphis, TN | 7.1 | % | |||
| 3 | New York, NY | 4.3 | % | |||
| 4 | Atlanta, GA | 4.1 | % | |||
| 5 | Detroit, MI | 4.0 | % | |||
| 6 | Nashville, TN | 3.8 | % | |||
| 7 | Dallas, TX | 3.5 | % | |||
| 8 | Philadelphia, PA | 2.9 | % | |||
| 9 | San Jose, CA | 2.6 | % | |||
| 10 | Jackson, MS | 2.4 | % | |||
| 11 | St. Louis, MO | 2.4 | % | |||
| 12 | Phoenix, AZ | 2.2 | % | |||
| 13 | Cincinnati, OH | 2.1 | % | |||
| 14 | Columbus, OH | 1.9 | % | |||
| 15 | Kansas City, MO | 1.7 | % | |||
| 16 | Champaign, IL | 1.6 | % | |||
| 17 | Charlotte, NC | 1.6 | % | |||
| 18 | Spartanburg, SC | 1.6 | % | |||
| 19 | Jackson, TN | 1.5 | % | |||
| 20 | Richmond, VA | 1.5 | % | |||
| Total Consolidated Portfolio Concentration (3) | 64.1 | % | ||||
| Footnotes | |
| (1) | Markets are based on a Core Based Statistical Area, which is the official term for a functional region based around an urban center of at least 10,000 people, based on standards published by the Office of Management and Budget (OMB) in 2000. These standards are used to replace the definitions of metropolitan areas that were defined in 1990. |
| (2) | Twelve months ended 12/31/2019 Base Rent recognized for consolidated properties owned as of 12/31/2019. |
| (3) | Total shown may differ from detailed amounts due to rounding. |
25
LEXINGTON REALTY TRUST
Portfolio Concentration - Industrial
12/31/2019
| Markets (1) | Percent of Base Rent as of 12/31/19 (2) | |||||
| 1 | Memphis, TN | 9.5 | % | |||
| 2 | Houston, TX | 7.4 | % | |||
| 3 | Detroit, MI | 5.3 | % | |||
| 4 | Atlanta, GA | 5.1 | % | |||
| 5 | Nashville, TN | 5.0 | % | |||
| 6 | Jackson, MS | 3.2 | % | |||
| 7 | St. Louis, MO | 3.2 | % | |||
| 8 | Cincinnati, OH | 2.7 | % | |||
| 9 | New York, NY | 2.6 | % | |||
| 10 | Dallas, TX | 2.6 | % | |||
| 11 | Columbus, OH | 2.5 | % | |||
| 12 | Champaign, IL | 2.2 | % | |||
| 13 | Spartanburg, SC | 2.1 | % | |||
| 14 | Jackson, TN | 2.0 | % | |||
| 15 | Richmond, VA | 2.0 | % | |||
| 16 | Winchester, VA | 2.0 | % | |||
| 17 | Greenville, SC | 1.9 | % | |||
| 18 | Chicago, IL | 1.9 | % | |||
| 19 | Indianapolis, IN | 1.8 | % | |||
| 20 | Shreveport, LA | 1.8 | % | |||
| Total Industrial Portfolio Concentration (3) | 66.7 | % | ||||
| Footnotes | |
| (1) | Markets are based on a Core Based Statistical Area, which is the official term for a functional region based around an urban center of at least 10,000 people, based on standards published by the Office of Management and Budget (OMB) in 2000. These standards are used to replace the definitions of metropolitan areas that were defined in 1990. |
| (2) | Twelve months ended 12/31/2019 Base Rent recognized for consolidated industrial properties owned as of 12/31/2019. |
| (3) | Total shown may differ from detailed amounts due to rounding. |
26
LEXINGTON REALTY TRUST
Portfolio Concentration - Office/Other
12/31/2019
| Markets (1) | Percent of Base Rent as of 12/31/19 (2) | |||||
| 1 | Houston, TX | 23.6 | % | |||
| 2 | San Jose, CA | 10.5 | % | |||
| 3 | Philadelphia, PA | 10.1 | % | |||
| 4 | New York, NY | 9.3 | % | |||
| 5 | Charlotte, NC | 6.5 | % | |||
| 6 | Dallas, TX | 6.3 | % | |||
| 7 | Washington, DC | 4.9 | % | |||
| 8 | Kansas City, MO | 4.8 | % | |||
| 9 | Phoenix, AZ | 3.9 | % | |||
| 10 | Miami, FL | 3.5 | % | |||
| 11 | Sarasota, FL | 3.0 | % | |||
| 12 | Baton Rouge, LA | 1.8 | % | |||
| 13 | McAllen, TX | 1.6 | % | |||
| 14 | Augusta, ME | 1.5 | % | |||
| 15 | Orlando, FL | 1.4 | % | |||
| 16 | Knoxville, TN | 1.4 | % | |||
| 17 | Atlanta, GA | 1.3 | % | |||
| 18 | Baltimore, MD | 1.0 | % | |||
| 19 | Florence, SC | 0.9 | % | |||
| 20 | Tucson, AZ | 0.9 | % | |||
| Total Office/Other Portfolio Concentration (3) | 98.3 | % | ||||
| Footnotes | |
| (1) | Markets are based on a Core Based Statistical Area, which is the official term for a functional region based around an urban center of at least 10,000 people, based on standards published by the Office of Management and Budget (OMB) in 2000. These standards are used to replace the definitions of metropolitan areas that were defined in 1990. |
| (2) | Twelve months ended 12/31/2019 Base Rent recognized for consolidated office/other properties owned as of 12/31/2019. |
| (3) | Total shown may differ from detailed amounts due to rounding. |
27
LEXINGTON REALTY TRUST
Tenant Industry Diversification - Industrial Assets (1)
12/31/2019

Footnotes
| (1) | Twelve months ended 12/31/2019 Base Rent recognized for consolidated properties owned as of 12/31/2019. |
28
LEXINGTON REALTY TRUST
Tenant Industry Diversification - Office/Other Assets (1)
12/31/2019

Footnotes
| (1) | Twelve months ended 12/31/2019 Base Rent recognized for consolidated properties owned as of 12/31/2019. |
29
LEXINGTON REALTY TRUST
12/31/2019
Top 15 Tenants
| Tenants (1) | Property Type | Lease Expirations | Number of Leases | Sq. Ft. Leased | Sq.
Ft. Leased as a Percent of Consolidated Portfolio (2)(3) | Base Rent as of 12/31/2019 ($000) | Percent of Base Rent as of 12/31/2019 ($000) (2)(4) | |||||||||||||||
| Dow | Office | 2036 | 1 | 664,100 | 1.3 | % | $ | 14,850 | 5.9 | % | ||||||||||||
| Nissan | Industrial | 2027 | 2 | 2,971,000 | 5.8 | % | 12,760 | 5.0 | % | |||||||||||||
| Dana | Industrial | 2021-2026 | 7 | 2,053,359 | 4.0 | % | 9,941 | 3.9 | % | |||||||||||||
| Undisclosed (5) | Industrial | 2031-2035 | 3 | 1,090,383 | 2.1 | % | 7,139 | 2.8 | % | |||||||||||||
| Watco | Industrial | 2038 | 1 | 132,449 | 0.3 | % | 6,773 | 2.7 | % | |||||||||||||
| Xerox | Office | 2023 | 1 | 202,000 | 0.4 | % | 6,642 | 2.6 | % | |||||||||||||
| Morgan Lewis (6) | Office | 2024 | 1 | 289,432 | 0.6 | % | 5,655 | 2.2 | % | |||||||||||||
| Amazon | Industrial | 2026-2030 | 3 | 2,515,492 | 4.9 | % | 5,637 | 2.2 | % | |||||||||||||
| Undisclosed (5) | Industrial | 2023-2027 | 3 | 2,132,290 | 4.2 | % | 5,527 | 2.2 | % | |||||||||||||
| FedEx | Industrial | 2023 & 2028 | 2 | 292,021 | 0.6 | % | 5,479 | 2.2 | % | |||||||||||||
| Hamilton Beach | Industrial | 2021 & 2026 | 2 | 1,645,436 | 3.2 | % | 4,948 | 2.0 | % | |||||||||||||
| Asics | Industrial | 2030 | 1 | 855,878 | 1.7 | % | 4,388 | 1.7 | % | |||||||||||||
| Spitzer | Industrial | 2035 | 2 | 449,895 | 0.9 | % | 4,344 | 1.7 | % | |||||||||||||
| Vista Outdoor | Industrial | 2034 | 1 | 813,126 | 1.6 | % | 4,195 | 1.7 | % | |||||||||||||
| Wells Fargo | Office | 2024 | 2 | 338,301 | 0.7 | % | 4,101 | 1.6 | % | |||||||||||||
| 32 | 16,445,162 | 32.2 | % | $ | 102,379 | 40.5 | % | |||||||||||||||
| Footnotes | |
| (1) | Tenant, guarantor or parent. |
| (2) | Total shown may differ from detailed amounts due to rounding. |
| (3) | Excludes vacant square feet. |
| (4) | Twelve months ended 12/31/2019 Base Rent recognized for consolidated properties owned as of 12/31/2019, excluding rent from prior tenants. |
| (5) | Lease restricts certain disclosures. |
| (6) | Includes parking operations. |
30
LEXINGTON REALTY TRUST
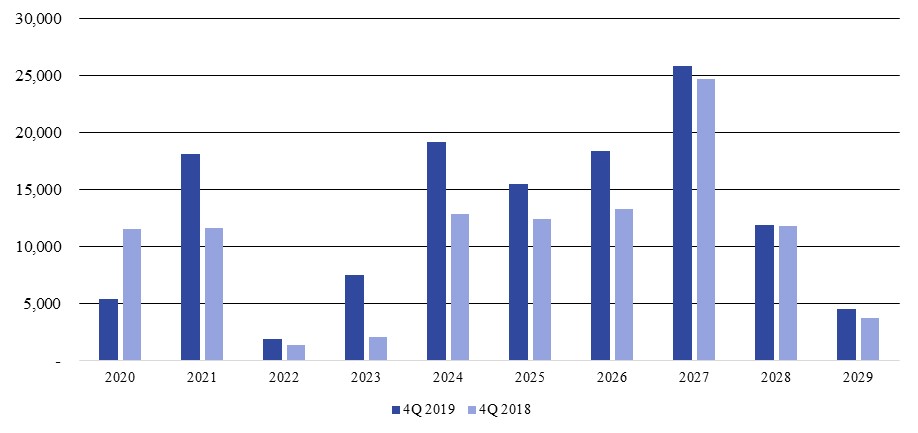
Lease Rollover Schedule - Consolidated Industrial Properties
12/31/2019
($000)
| Year | Number of Leases Expiring | Base Rent as of 12/31/2019 | Percent of Base Rent as of 12/31/2019 | Percent of Base Rent as of 12/31/2018 | ||||||||||||
| 2020 | 4 | $ | 5,363 | 2.8 | % | 6.2 | % | |||||||||
| 2021 | 13 | 18,136 | 9.4 | % | 6.3 | % | ||||||||||
| 2022 | 2 | 1,907 | 1.0 | % | 0.7 | % | ||||||||||
| 2023 | 8 | 7,468 | 3.9 | % | 1.1 | % | ||||||||||
| 2024 | 16 | 19,168 | 9.9 | % | 7.0 | % | ||||||||||
| 2025 | 13 | 15,476 | 8.0 | % | 6.7 | % | ||||||||||
| 2026 | 11 | 18,392 | 9.5 | % | 7.2 | % | ||||||||||
| 2027 | 9 | 25,835 | 13.4 | % | 13.4 | % | ||||||||||
| 2028 | 4 | 11,855 | 6.2 | % | 6.4 | % | ||||||||||
| 2029 | 3 | 4,507 | 2.3 | % | 2.0 | % | ||||||||||
| Thereafter | 25 | 64,634 | 33.5 | % | 39.6 | % | ||||||||||
| Total (1) | 108 | $ | 192,741 | 100.0 | % | |||||||||||
Footnotes
| (1) | Total shown may differ from detailed amounts due to rounding. |
31
LEXINGTON REALTY TRUST
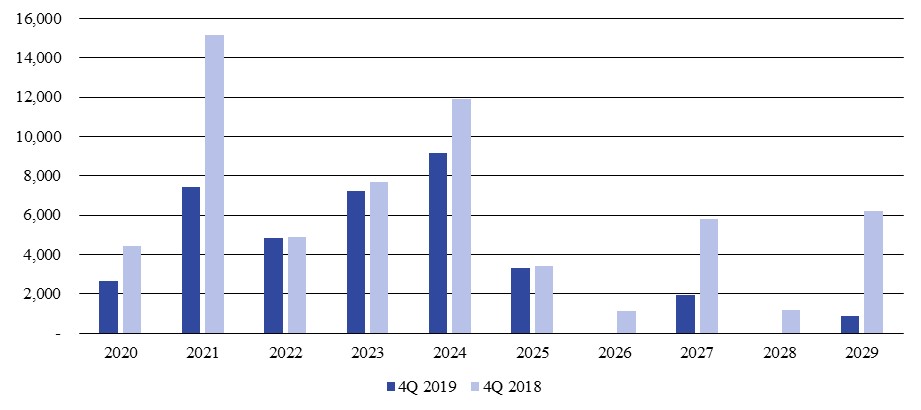
Lease Rollover Schedule - Consolidated Office/Other Properties
12/31/2019
($000)
| Year | Number of Leases Expiring | Base Rent as of 12/31/2019 | Percent of Base Rent as of 12/31/2019 | Percent of Base Rent as of 12/31/2018 | ||||||||||||
| 2020 | 30 | $ | 2,643 | 4.3 | % | 4.8 | % | |||||||||
| 2021 | 9 | 7,451 | 12.1 | % | 16.6 | % | ||||||||||
| 2022 | 3 | 4,837 | 7.9 | % | 5.3 | % | ||||||||||
| 2023 | 3 | 7,201 | 11.7 | % | 8.4 | % | ||||||||||
| 2024 | 5 | 9,180 | 14.9 | % | 13.0 | % | ||||||||||
| 2025 | 5 | 3,320 | 5.4 | % | 3.7 | % | ||||||||||
| 2026 | 0 | - | 0.0 | % | 1.2 | % | ||||||||||
| 2027 | 3 | 1,956 | 3.2 | % | 6.4 | % | ||||||||||
| 2028 | 0 | - | 0.0 | % | 1.3 | % | ||||||||||
| 2029 | 1 | 881 | 1.4 | % | 6.8 | % | ||||||||||
| Thereafter | 8 | 24,053 | 39.1 | % | 21.0 | % | ||||||||||
| Total (1) | 67 | $ | 61,522 | 100.0 | % | |||||||||||
Footnotes
| (1) | Total shown may differ from detailed amounts due to rounding and does not include parking operations. |
32
LEXINGTON REALTY TRUST
Property Leases and Vacancies - Consolidated Portfolio - 12/31/2019
| Year of Lease Expiration | Date of Lease Expiration | Property Location | City | State | Note | Primary Tenant, Guarantor, or Parent | Sq. Ft. Leased or Available (1) | Base Rent as of 12/31/2019 ($000) (2) | Cash Base Rent as of 12/31/2019($000) (2) | 12/31/2019 Debt Balance ($000) | Debt Maturity | |||||||||||||||||||||
| INDUSTRIAL PROPERTIES | ||||||||||||||||||||||||||||||||
| Single-tenant | ||||||||||||||||||||||||||||||||
| 2020 | 6/30/2020 | 1650-1654 Williams Rd. | Columbus | OH | -- | ODW Logistics | 772,450 | 1,347 | 1,347 | - | - | |||||||||||||||||||||
| 12/19/2020 | 1901 Ragu Dr. | Owensboro | KY | 5 | Unilever | 443,380 | 1,493 | 1,288 | - | - | ||||||||||||||||||||||
| 12/31/2020 | 2203 Sherrill Dr. | Statesville | NC | -- | Geodis America | 639,800 | 2,493 | 2,537 | - | - | ||||||||||||||||||||||
| 2021 | 1/31/2021 | 101 Michelin Dr. | Laurens | SC | -- | Michelin | 1,164,000 | 3,745 | 3,745 | - | - | |||||||||||||||||||||
| 3/31/2021 | 2455 Premier Row | Orlando | FL | -- | Walgreen Co. | 205,016 | 786 | 508 | - | - | ||||||||||||||||||||||
| 5/31/2021 | 291 Park Center Dr. | Winchester | VA | -- | Kraft Heinz | 344,700 | 1,422 | 1,451 | - | - | ||||||||||||||||||||||
| 6/30/2021 | 11624 S. Distribution Cv. | Olive Branch | MS | -- | Hamilton Beach | 1,170,218 | 3,789 | 3,189 | - | - | ||||||||||||||||||||||
| 9/30/2021 | 3820 Micro Dr. | Millington | TN | -- | Ingram Micro | 701,819 | 1,812 | 1,874 | - | - | ||||||||||||||||||||||
| 10/25/2021 | 6938 Elm Valley Dr. | Kalamazoo | MI | -- | Dana | 150,945 | 1,747 | 2,027 | - | - | ||||||||||||||||||||||
| 11/30/2021 | 2880 Kenny Biggs Rd. | Lumberton | NC | -- | Quickie Manufacturing | 423,280 | 1,356 | 1,459 | - | - | ||||||||||||||||||||||
| 12/31/2021 | 191 Arrowhead Dr. | Hebron | OH | -- | Owens Corning | 250,410 | 573 | 573 | - | - | ||||||||||||||||||||||
| 200 Arrowhead Dr. | Hebron | OH | -- | Owens Corning | 400,522 | 916 | 916 | - | - | |||||||||||||||||||||||
| 3686 South Central Ave. | Rockford | IL | -- | Pierce Packaging | 93,000 | 321 | 321 | - | - | |||||||||||||||||||||||
| 2022 | 3/31/2022 | 5417 Campus Dr. | Shreveport | LA | -- | Tire Rack | 257,849 | 1,343 | 1,403 | - | - | |||||||||||||||||||||
| 8/31/2022 | 50 Tyger River Dr. | Duncan | SC | -- | Plastic Omnium | 221,833 | 564 | 336 | - | - | ||||||||||||||||||||||
| 2023 | 2/28/2023 | 3102 Queen Palm Dr. | Tampa | FL | 8 | RC Moore | 229,605 | 1,081 | 1,303 | - | - | |||||||||||||||||||||
| 7670 Hacks Cross Rd. | Olive Branch | MS | -- | MAHLE Industries | 268,104 | 906 | 902 | - | - | |||||||||||||||||||||||
| 5/31/2023 | 6495 Polk Ln. | Olive Branch | MS | 13 | Undisclosed | 151,691 | 344 | 330 | - | - | ||||||||||||||||||||||
| 8/31/2023 | 10535 Red Bluff Rd. | Pasadena | TX | -- | Unis | 257,835 | 1,231 | 1,199 | - | - | ||||||||||||||||||||||
| 3737 Duncanville Rd. | Dallas | TX | -- | Owens Corning | 510,440 | 1,175 | 1,134 | - | - | |||||||||||||||||||||||
| 10/31/2023 | 493 Westridge Pkwy. | McDonough | GA | -- | Carlstar | 676,000 | 1,777 | 1,694 | - | - | ||||||||||||||||||||||
| 12/31/2023 | 120 Southeast Pkwy. Dr. | Franklin | TN | -- | United Technologies | 289,330 | 735 | 735 | - | - | ||||||||||||||||||||||
| 675 Gateway Blvd. | Monroe | OH | -- | Blue Buffalo | 143,664 | 219 | 209 | - | - | |||||||||||||||||||||||
| 2024 | 1/31/2024 | 1285 W. State Road 32 | Lebanon | IN | -- | Continental Tire | 741,880 | 2,286 | 2,383 | - | - | |||||||||||||||||||||
| 6495 Polk Ln. | Olive Branch | MS | 13 | Undisclosed | 118,211 | 291 | 276 | - | - | |||||||||||||||||||||||
| 70 Tyger River Dr. | Duncan | SC | -- | BMW | 408,000 | 1,367 | 1,310 | - | - | |||||||||||||||||||||||
| 33 |
LEXINGTON REALTY TRUST
Property Leases and Vacancies - Consolidated Portfolio - 12/31/2019
| Year of Lease Expiration | Date of Lease Expiration | Property Location | City | State | Note | Primary Tenant, Guarantor, or Parent | Sq. Ft. Leased or Available (1) | Base Rent as of 12/31/2019 ($000) (2) | Cash Base Rent as of 12/31/2019($000) (2) | 12/31/2019 Debt Balance ($000) | Debt Maturity | |||||||||||||||||||||
| INDUSTRIAL PROPERTIES | ||||||||||||||||||||||||||||||||
| 2024 | 1/31/2024 | 231 Apple Valley Road | Duncan | SC | 13 | Undisclosed | 120,680 | 141 | 133 | - | - | |||||||||||||||||||||
| 3/31/2024 | 1520 Lauderdale Memorial Hwy. | Cleveland | TN | -- | General Electric | 851,370 | 2,658 | 2,648 | - | - | ||||||||||||||||||||||
| 4/30/2024 | 113 Wells St. | North Berwick | ME | -- | United Technologies | 993,685 | 1,798 | 1,739 | - | - | ||||||||||||||||||||||
| 11555 Silo Dr. | Olive Branch | MS | -- | Olam Cotton | 927,742 | 1,681 | 1,258 | - | - | |||||||||||||||||||||||
| 5/31/2024 | 901 East Bingen Point Way | Bingen | WA | -- | Boeing | 124,539 | 2,636 | 2,637 | - | - | ||||||||||||||||||||||
| 7225 Goodson Rd. | Union City | GA | -- | Interface Americas | 370,000 | 745 | 698 | - | - | |||||||||||||||||||||||
| 7/31/2024 | 5795 North Blackstock Road | Spartanburg | SC | -- | Wal-Mart | 341,660 | 1,672 | 1,623 | - | - | ||||||||||||||||||||||
| 231 Apple Valley Road | Duncan | SC | 13 | Undisclosed | 75,320 | 88 | 88 | - | - | |||||||||||||||||||||||
| 9/30/2024 | 1621 Veterans Memorial Pkwy. E | Lafayette | IN | -- | Caterpillar | 309,400 | 1,215 | 1,204 | - | - | ||||||||||||||||||||||
| 10/31/2024 | 43955 Plymouth Oaks Blvd. | Plymouth | MI | -- | Tower Automotive | 311,612 | 1,591 | 1,542 | - | - | ||||||||||||||||||||||
| 2115 East Belt Line Rd. | Carrollton | TX | -- | L.E. Klein | 58,202 | 229 | 153 | - | - | |||||||||||||||||||||||
| 12/31/2024 | 749 Southrock Dr. | Rockford | IL | -- | Jacobson Warehouse | 150,000 | 638 | 600 | - | - | ||||||||||||||||||||||
| 2025 | 4/30/2025 | 235 Apple Valley Road | Duncan | SC | 13 | Undisclosed | 177,320 | 219 | 205 | - | - | |||||||||||||||||||||
| 5/31/2025 | 7875 White Road SW | Austell | GA | -- | Mars Wrigley | 604,852 | 1,407 | 1,853 | - | - | ||||||||||||||||||||||
| 6/30/2025 | 10000 Business Blvd. | Dry Ridge | KY | -- | Dana | 336,350 | 1,346 | 1,346 | - | - | ||||||||||||||||||||||
| 4010 Airpark Dr. | Owensboro | KY | -- | Metalsa / Dana | 211,598 | 1,208 | 1,208 | - | - | |||||||||||||||||||||||
| 730 North Black Branch Rd. | Elizabethtown | KY | -- | Metalsa / Dana | 167,770 | 537 | 537 | - | - | |||||||||||||||||||||||
| 750 North Black Branch Rd. | Elizabethtown | KY | -- | Metalsa / Dana | 539,592 | 2,838 | 2,838 | - | - | |||||||||||||||||||||||
| 301 Bill Bryan Blvd. | Hopkinsville | KY | -- | Metalsa / Dana | 424,904 | 1,687 | 1,687 | - | - | |||||||||||||||||||||||
| 7/14/2025 | 590 Ecology Ln. | Chester | SC | -- | Boral Limited | 420,597 | 1,798 | 2,391 | 5,763 | 08/2025 | ||||||||||||||||||||||
| 7/31/2025 | 7005 Cochran Rd. | Glenwillow | OH | -- | Royal Appliance | 458,000 | 2,061 | 2,101 | - | - | ||||||||||||||||||||||
| 5352 Performance Way | Whitestown | IN | -- | LaCrosse | 380,000 | 1,250 | 1,091 | - | - | |||||||||||||||||||||||
| 12/31/2025 | 1700 47th Ave North | Minneapolis | MN | -- | Owens Corning | 18,620 | 550 | 550 | - | - | ||||||||||||||||||||||
| 2026 | 3/30/2026 | 121 Technology Dr. | Durham | NH | 12 | Heidelberg | 500,500 | 2,537 | 2,479 | - | - | |||||||||||||||||||||
| 3/31/2026 | 633 Garrett Pkwy. | Lewisburg | TN | -- | Calsonic Kansei | 310,000 | 1,288 | 1,286 | - | - | ||||||||||||||||||||||
| 4/30/2026 | 16811 W. Commerce Dr. | Goodyear | AZ | -- | Blue Buffalo | 540,349 | 2,444 | 1,161 | - | - | ||||||||||||||||||||||
| 6/30/2026 | 351 Chamber Dr. | Chillicothe | OH | 16 | Kitchen Collection | 475,218 | 1,159 | 1,164 | - | - | ||||||||||||||||||||||
| 34 |
LEXINGTON REALTY TRUST
Property Leases and Vacancies - Consolidated Portfolio - 12/31/2019
| Year of Lease Expiration | Date of Lease Expiration | Property Location | City | State | Note | Primary Tenant, Guarantor, or Parent | Sq. Ft. Leased or Available (1) | Base Rent as of 12/31/2019 ($000) (2) | Cash Base Rent as of 12/31/2019($000) (2) | 12/31/2019 Debt Balance ($000) | Debt Maturity | |||||||||||||||||||||
| INDUSTRIAL PROPERTIES | ||||||||||||||||||||||||||||||||
| 2026 | 9/30/2026 | 900 Industrial Blvd. | Crossville | TN | -- | Dana | 222,200 | 578 | 578 | - | - | |||||||||||||||||||||
| 3931 Lakeview Corporate Dr. | Edwardsville | IL | -- | Amazon.com | 769,500 | 2,696 | 2,588 | - | - | |||||||||||||||||||||||
| 9494 W. Buckeye Rd. | Tolleson | AZ | -- | CHEP | 186,336 | 236 | 218 | - | - | |||||||||||||||||||||||
| 10/31/2026 | 10345 Philipp Pkwy. | Streetsboro | OH | -- | L'Oreal USA | 649,250 | 2,725 | 2,788 | - | - | ||||||||||||||||||||||
| 5001 Greenwood Rd. | Shreveport | LA | -- | Libbey | 646,000 | 2,165 | 2,229 | - | - | |||||||||||||||||||||||
| 11/30/2026 | 250 Rittenhouse Cir. | Bristol | PA | -- | Estée Lauder | 241,977 | 1,146 | 1,182 | - | - | ||||||||||||||||||||||
| 736 Addison Rd. | Erwin | NY | -- | Corning | 408,000 | 1,418 | 1,425 | - | - | |||||||||||||||||||||||
| 2027 | 1/31/2027 | 27200 West 157th St. | New Century | KS | -- | Amazon.com | 446,500 | 1,240 | 1,090 | - | - | |||||||||||||||||||||
| 2/28/2027 | 554 Nissan Pkwy. | Canton | MS | -- | Nissan | 1,466,000 | 6,200 | 6,037 | - | - | ||||||||||||||||||||||
| 4/30/2027 | 16407 Applewhite Rd. | San Antonio | TX | 13 | Undisclosed | 849,275 | 2,994 | 2,822 | - | - | ||||||||||||||||||||||
| 200 Sam Griffin Rd. | Smyrna | TN | -- | Nissan | 1,505,000 | 6,560 | 6,325 | - | - | |||||||||||||||||||||||
| 6/30/2027 | 1501 Nolan Ryan Expy. | Arlington | TX | -- | Arrow Electronics | 74,739 | 406 | 405 | - | - | ||||||||||||||||||||||
| 8/31/2027 | 600 Gateway Blvd. | Monroe | OH | -- | Hayneedle | 994,013 | 1,227 | 1,004 | - | - | ||||||||||||||||||||||
| 9/30/2027 | 1550 Hwy 302 | Byhalia | MS | -- | McCormick | 615,600 | 2,451 | 2,416 | - | - | ||||||||||||||||||||||
| 10/31/2027 | 201 James Lawrence Rd. | Jackson | TN | -- | Kellogg | 1,062,055 | 3,944 | 3,753 | - | - | ||||||||||||||||||||||
| 12/31/2027 | 10590 Hamilton Ave. | Cincinnati | OH | -- | Hillman Group | 264,598 | 813 | 813 | - | - | ||||||||||||||||||||||
| 2028 | 1/31/2028 | 490 Westridge Pkwy. | McDonough | GA | -- | Georgia-Pacific | 1,121,120 | 3,737 | 3,458 | - | - | |||||||||||||||||||||
| 3/31/2028 | 29-01-Borden Ave./29-10 Hunters Point Ave. | Long Island City | NY | -- | FedEx | 140,330 | 5,135 | 5,128 | 36,449 | 03/2028 | ||||||||||||||||||||||
| 8/31/2028 | 1420 Greenwood Rd. | McDonough | GA | -- | United States Cold Storage | 296,972 | 2,170 | 2,160 | - | - | ||||||||||||||||||||||
| 9/30/2028 | 904 Industrial Rd. | Marshall | MI | -- | Tenneco | 246,508 | 813 | 743 | - | - | ||||||||||||||||||||||
| 2029 | 7/31/2029 | 8500 Nail Rd. | Olive Branch | MS | -- | Sephora | 716,080 | 2,751 | 2,603 | - | - | |||||||||||||||||||||
| 9/30/2029 | 6255 East Minooka Road | Minooka | IL | -- | Kellogg | 1,034,200 | 16 | 14 | - | - | ||||||||||||||||||||||
| 11/24/2029 | 318 Pappy Dunn Blvd. | Anniston | AL | -- | IAC Group | 276,782 | 1,740 | 1,671 | - | - | ||||||||||||||||||||||
| 2030 | 3/31/2030 | 549 Wingo Rd. | Byhalia | MS | -- | Asics | 855,878 | 4,388 | 4,174 | - | - | |||||||||||||||||||||
| 5/31/2030 | 359 Gateway Dr. | Lavonia | GA | -- | TI Automotive | 133,221 | 799 | 997 | - | - | ||||||||||||||||||||||
| 4015 Lakeview Corporate Dr. | Edwardsville | IL | -- | Spectrum | 1,017,780 | 3,460 | 2,739 | - | - | |||||||||||||||||||||||
| 6/30/2030 | 2601 Bermuda Hundred Rd. | Chester | VA | 14 | Philip Morris | 1,034,470 | 3,851 | 3,807 | - | - | ||||||||||||||||||||||
| 35 |
LEXINGTON REALTY TRUST
Property Leases and Vacancies - Consolidated Portfolio - 12/31/2019
| Year of Lease Expiration | Date of Lease Expiration | Property Location | City | State | Note | Primary Tenant, Guarantor, or Parent | Sq. Ft. Leased or Available (1) | Base Rent as of 12/31/2019 ($000) (2) | Cash Base Rent as of 12/31/2019 ($000) (2) | 12/31/2019 Debt Balance ($000) | Debt Maturity | |||||||||||||||||||||
| INDUSTRIAL PROPERTIES | ||||||||||||||||||||||||||||||||
| 2030 | 6/30/2030 | 700 Gateway Blvd. | Monroe | OH | -- | Amazon.com | 1,299,492 | 1,701 | 1,535 | - | - | |||||||||||||||||||||
| 9/30/2030 | 255 143rd Ave. | Goodyear | AZ | 13 | Undisclosed | 801,424 | 389 | 351 | 41,877 | 08/2031 | ||||||||||||||||||||||
| 2031 | 10/31/2031 | 1020 W. Airport Rd. | Romeoville | IL | -- | ARYZTA | 188,166 | 3,640 | 3,463 | - | - | |||||||||||||||||||||
| 12/18/2031 | 80 Tyson Dr. | Winchester | VA | 13 | Undisclosed | 400,400 | 2,368 | 2,109 | - | - | ||||||||||||||||||||||
| 2032 | 4/30/2032 | 13930 Pike Rd. | Missouri City | TX | -- | Vulcan | - | 2,123 | 1,995 | - | - | |||||||||||||||||||||
| 8/24/2032 | 16950 Pine Dr. | Romulus | MI | 13 | Undisclosed | 500,023 | 2,567 | 2,424 | - | - | ||||||||||||||||||||||
| 10/31/2032 | 27255 SW 95th Ave. | Wilsonville | OR | -- | Pacific Natural Foods | 508,277 | 3,120 | 2,687 | - | - | ||||||||||||||||||||||
| 26700 Bunert Rd. | Warren | MI | -- | Lipari | 260,243 | 3,883 | 3,499 | 25,850 | 11/2032 | |||||||||||||||||||||||
| 2033 | 12/31/2033 | 2115 East Belt Line Rd. | Carrollton | TX | -- | Teasdale | 298,653 | 1,297 | 1,021 | - | - | |||||||||||||||||||||
| 2034 | 9/30/2034 | 5625 North Sloan Ln. | North Las Vegas | NV | -- | Nicholas | 180,235 | 2,557 | 2,328 | - | - | |||||||||||||||||||||
| 10/31/2034 | 1001 Innovation Rd. | Rantoul | IL | -- | Vista Outdoor | 813,126 | 4,195 | 3,774 | - | - | ||||||||||||||||||||||
| 12/31/2034 | 27 Inland Pkwy. | Greer | SC | 13 | Undisclosed | 1,318,680 | 15 | - | - | - | ||||||||||||||||||||||
| 2035 | 3/31/2035 | 13863 Industrial Rd. | Houston | TX | -- | Spitzer | 187,800 | 2,434 | 2,159 | - | - | |||||||||||||||||||||
| 7007 F.M. 362 Rd. | Brookshire | TX | -- | Spitzer | 262,095 | 1,910 | 1,694 | - | - | |||||||||||||||||||||||
| 6/30/2035 | 111 West Oakview Pkwy. | Oak Creek | WI | -- | Stella & Chewy's | 164,007 | 2,098 | 1,907 | - | - | ||||||||||||||||||||||
| 10/22/2035 | 2860 Clark Street | Detroit | MI | 13 | Undisclosed | 189,960 | 2,204 | 2,204 | - | - | ||||||||||||||||||||||
| 2036 | 5/31/2036 | 671 Washburn Switch Rd. | Shelby | NC | -- | Clearwater Paper | 673,425 | 2,786 | 2,487 | - | - | |||||||||||||||||||||
| 2037 | 3/31/2037 | 4005 E I-30 | Grand Prairie | TX | -- | O'Neal Industries | 215,000 | 1,872 | 1,592 | - | - | |||||||||||||||||||||
| 2038 | 3/31/2038 | 13901/14035 Industrial Rd. | Houston | TX | -- | Watco | 132,449 | 6,773 | 5,925 | - | - | |||||||||||||||||||||
| 2042 | 5/31/2042 | 4801 North Park Dr. | Opelika | AL | -- | Golden State Enterprises | 165,493 | 3,244 | 2,590 | - | - | |||||||||||||||||||||
| 2067 | 12/31/2067 | 10201 Schuster Way | Pataskala | OH | -- | Kohl's | - | 960 | 434 | - | - | |||||||||||||||||||||
| SINGLE TENANT INDUSTRIAL TOTAL | 47,067,194 | $ | 190,335 | $ | 180,014 | $ | 109,939 | |||||||||||||||||||||||||
| 36 |
LEXINGTON REALTY TRUST
Property Leases and Vacancies - Consolidated Portfolio - 12/31/2019
| Year of Lease Expiration | Date of Lease Expiration | Property Location | City | State | Note | Primary Tenant, Guarantor, or Parent | Sq. Ft. Leased or Available (1) | Base Rent as of 12/31/2019 ($000) (2) | Cash Base Rent as of 12/31/2019 ($000) (2) | 12/31/2019 Debt Balance ($000) | Debt Maturity | |||||||||||||||||||||
| INDUSTRIAL PROPERTIES | ||||||||||||||||||||||||||||||||
| Multi-tenant / Vacancy (7)(11) | ||||||||||||||||||||||||||||||||
| Various | 6050 Dana Way | Antioch | TN | 3 (97%) | Multi-Tenant | 674,528 | 2,406 | 2,342 | - | - | ||||||||||||||||||||||
| Vacancy | 2415 US Hwy. 78 East | Moody | AL | 8 | (Available for Lease) | 595,346 | 1,408 | 1,450 | - | - | ||||||||||||||||||||||
| Vacancy | 1133 Poplar Creek Rd. | Henderson | NC | -- | (Available for Lease) | 196,946 | - | - | - | - | ||||||||||||||||||||||
| Vacancy | 3301 Stagecoach Rd. NE | Thomson | GA | 8 | (Available for Lease) | 208,000 | 336 | 616 | - | - | ||||||||||||||||||||||
| MULTI-TENANT/VACANCY INDUSTRIAL TOTAL | 1,674,820 | $ | 4,150 | $ | 4,408 | $ | - | |||||||||||||||||||||||||
| INDUSTRIAL TOTAL/WEIGHTED AVERAGE | 97.9% Leased | 48,742,014 | $ | 194,485 | $ | 184,422 | $ | 109,939 | ||||||||||||||||||||||||
| 37 |
LEXINGTON REALTY TRUST
Property Leases and Vacancies - Consolidated Portfolio - 12/31/2019
| Year
of Lease Expiration |
Date
of Lease Expiration |
Property Location | City | State | Note | Primary Tenant, Guarantor, or Parent | Sq.Ft.
Leased or Available (1) |
Base
Rent as of 12/31/2019 ($000) (2) |
Cash
Base Rent as of 12/31/2019 ($000) (2) |
12/31/2019 Debt Balance ($000) |
Debt Maturity | |||||||||||||||||||
| OFFICE PROPERTIES | ||||||||||||||||||||||||||||||
| Single-tenant | ||||||||||||||||||||||||||||||
| 2020 | 2/14/2020 | 5600 Broken Sound Blvd. | Boca Raton | FL | -- | Oce - USA Holding | 143,290 | 2,244 | 2,500 | 18,465 | 02/2020 | |||||||||||||||||||
| 2021 | 3/31/2021 | 1701 Market St. | Philadelphia | PA | -- | Prime Communications | 1,220 | 62 | 62 | - | - | |||||||||||||||||||
| 6/30/2021 | 1415 Wyckoff Rd. | Wall | NJ | 15 | NJ Natural Gas | 157,511 | 3,774 | 3,774 | 5,576 | 01/2021 | ||||||||||||||||||||
| 2050 Roanoke Rd. | Westlake | TX | -- | Charles Schwab | 130,199 | 2,068 | 2,200 | - | - | |||||||||||||||||||||
| 8/31/2021 | 3500 North Loop Rd. | McDonough | GA | -- | Global Payments | 62,218 | 848 | 848 | - | - | ||||||||||||||||||||
| 10/31/2021 | 1401 Nolan Ryan Expy. | Arlington | TX | -- | Butler America Aerospace | 4,979 | 85 | 85 | - | - | ||||||||||||||||||||
| 2022 | 5/30/2022 | 13651 McLearen Rd. | Herndon | VA | -- | United States of America | 159,644 | 3,128 | 3,220 | - | - | |||||||||||||||||||
| 7/31/2022 | 1440 E 15th St. | Tucson | AZ | -- | CoxCom | 28,591 | 544 | 544 | - | - | ||||||||||||||||||||
| 10/31/2022 | 4455 American Way | Baton Rouge | LA | 17 | New Cingular Wireless | 70,100 | 1,165 | 1,148 | - | - | ||||||||||||||||||||
| 2023 | 9/30/2023 | 1701 Market St. | Philadelphia | PA | -- | CBC Restaurant | 8,070 | 243 | 243 | - | - | |||||||||||||||||||
| 12/14/2023 | 3333 Coyote Hill Rd. | Palo Alto | CA | -- | Xerox | 202,000 | 6,642 | 7,070 | 26,301 | 12/2023 | ||||||||||||||||||||
| 2024 | 1/31/2024 | 1701 Market St. | Philadelphia | PA | -- | Morgan Lewis | 289,432 | 4,226 | 4,576 | - | - | |||||||||||||||||||
| 2/14/2024 | 1362 Celebration Blvd. | Florence | SC | -- | Change Healthcare | 32,000 | 573 | 588 | - | - | ||||||||||||||||||||
| 5/31/2024 | 3476 Stateview Blvd. | Fort Mill | SC | -- | Wells Fargo | 169,083 | 2,014 | 1,953 | - | - | ||||||||||||||||||||
| 3480 Stateview Blvd. | Fort Mill | SC | -- | Wells Fargo | 169,218 | 2,087 | 1,954 | - | - | |||||||||||||||||||||
| 2025 | 1/31/2025 | 1401 Nolan Ryan Expy. | Arlington | TX | -- | Triumph Group | 111,409 | 1,617 | 1,777 | - | - | |||||||||||||||||||
| 2/28/2025 | 1401 Nolan Ryan Expy. | Arlington | TX | -- | Infotech Enterprise | 13,590 | 210 | 216 | - | - | ||||||||||||||||||||
| 5/31/2025 | 1701 Market St. | Philadelphia | PA | -- | TruMark Financial | 2,641 | 259 | 259 | - | - | ||||||||||||||||||||
| 6/30/2025 | 3711 San Gabriel | Mission | TX | -- | T-Mobile West | 75,016 | 999 | 1,022 | - | - | ||||||||||||||||||||
| 2027 | 1/31/2027 | 1701 Market St. | Philadelphia | PA | -- | Drybar | 1,975 | 145 | 110 | - | - | |||||||||||||||||||
| 5/31/2027 | 2401 Cherahala Blvd. | Knoxville | TN | -- | CaremarkPCS | 59,748 | 866 | 800 | - | - | ||||||||||||||||||||
| 8/31/2027 | 133 First Park Dr. | Oakland | ME | -- | T-Mobile USA | 78,610 | 945 | 1,542 | - | - | ||||||||||||||||||||
| 2029 | 9/30/2029 | 9200 South Park Center Loop | Orlando | FL | -- | CardWorks | 59,927 | 881 | 255 | - | - | |||||||||||||||||||
| 2030 | 6/30/2030 | 9601 Renner Blvd. | Lenexa | KS | 8 | Quest Diagnostics | 77,484 | 1,121 | 1,289 | - | - | |||||||||||||||||||
| 2031 | 4/30/2031 | 9201 Stateline Rd. | Kansas City | MO | 8 | Burns & McDonnell Engineering | 155,925 | 1,947 | 1,841 | - | - | |||||||||||||||||||
| 11/30/2031 | 4 Apollo Drive | Whippany | NJ | -- | CAE | 123,734 | 2,140 | 1,953 | 11,572 | 11/2021 | ||||||||||||||||||||
38
LEXINGTON REALTY TRUST
Property Leases and Vacancies - Consolidated Portfolio - 12/31/2019
| Year
of Lease Expiration |
Date
of Lease Expiration |
Property Location | City | State | Note | Primary
Tenant, Guarantor, or Parent |
Sq.Ft.
Leased or Available (1) |
Base
Rent as of 12/31/2019 ($000) (2) |
Cash
Base Rent as of 12/31/2019 ($000) (2) |
12/31/2019 Debt Balance ($000) |
Debt Maturity |
|||||||||||||||||||
| OFFICE PROPERTIES | ||||||||||||||||||||||||||||||
| Single-tenant | ||||||||||||||||||||||||||||||
| 2033 | 12/31/2033 | 8555 South River Pkwy. | Tempe | AZ | -- | Versum | 95,133 | 1,479 | 1,300 | - | - | |||||||||||||||||||
| 2036 | 10/31/2036 | 270 Abner Jackson Pkwy. | Lake Jackson | TX | -- | Dow | 664,100 | 14,850 | 12,662 | 183,077 | 10/2036 | |||||||||||||||||||
| N/A | N/A | 1701 Market St. | Philadelphia | PA | -- | Parking Operations | - | 1,429 | 1,429 | - | - | |||||||||||||||||||
| Vacancy | 1701 Market St. | Philadelphia | PA | -- | (Available for Lease) | 699 | - | - | - | - | ||||||||||||||||||||
| 1401 Nolan Ryan Expy. | Arlington | TX | -- | (Available for Lease) | 31,830 | - | - | - | - | |||||||||||||||||||||
| SINGLE TENANT OFFICE TOTAL | 3,179,376 | $ | 58,591 | $ | 57,220 | $ | 244,991 | |||||||||||||||||||||||
| Multi-tenant / Vacancy (7)(11) | ||||||||||||||||||||||||||||||
| Vacancy | 5200 Metcalf Ave. | Overland Park | KS | -- | (Available for Lease) | 320,198 | - | - | 32,112 | N/A | ||||||||||||||||||||
| Vacancy | 820 Gears Rd. | Houston | TX | 8 | (Available for Lease) | 78,895 | 99 | 99 | - | - | ||||||||||||||||||||
| Various | 13430 North Black Canyon Fwy. | Phoenix | AZ | 3 (73%) | Multi-Tenant | 138,940 | 1,017 | 1,162 | - | - | ||||||||||||||||||||
| Various | 1460 Tobias Gadson Blvd. | Charleston | SC | 3,8 (23%) | Multi-Tenant | 50,246 | 516 | 506 | 6,830 | 02/2021 | ||||||||||||||||||||
| MULTI-TENANT/VACANCY OFFICE TOTAL | 588,279 | $ | 1,632 | $ | 1,767 | $ | 38,942 | |||||||||||||||||||||||
| OFFICE SUBTOTAL/WEIGHTED AVERAGE | 86.5% Leased | 3,767,655 | $ | 60,223 | $ | 58,987 | $ | 283,933 | ||||||||||||||||||||||
39
LEXINGTON REALTY TRUST
Property Leases and Vacancies - Consolidated Portfolio - 12/31/2019
| Year
of Lease Expiration | Date
of Lease Expiration | Property Location | City | State | Note | Primary
Tenant, Guarantor, or Parent | Sq.Ft.
Leased or Available (1) | Base
Rent as of 12/31/2019 ($000) (2) | Cash
Base Rent as of 12/31/2019 ($000) (2) | 12/31/2019 Debt Balance ($000) | Debt Maturity | |||||||||||||||||||
| OTHER PROPERTIES | ||||||||||||||||||||||||||||||
| Single-tenant | ||||||||||||||||||||||||||||||
| Specialty | ||||||||||||||||||||||||||||||
| 2048 | 12/31/2048 | 30 Light St. | Baltimore | MD | -- | 30 Charm City | - | 299 | 299 | $ | - | - | ||||||||||||||||||
| 2055 | 1/31/2055 | 499 Derbyshire Dr. | Venice | FL | -- | Littlestone Brotherhood | 31,180 | 1,908 | 1,366 | - | - | |||||||||||||||||||
| 2112 | 8/31/2112 | 201-215 N. Charles St. | Baltimore | MD | -- | HCRE 201NCharles | - | 309 | 309 | - | - | |||||||||||||||||||
| SINGLE TENANT OTHER TOTAL | 31,180 | $ | 2,516 | $ | 1,974 | $ | - | |||||||||||||||||||||||
| Multi-tenant / Vacancy (7)(11) | ||||||||||||||||||||||||||||||
| Various | King St./1042 Fort St. Mall | Honolulu | HI | 3 (43%) | Multi-Tenant | 77,459 | 535 | 535 | - | - | ||||||||||||||||||||
| MULTI-TENANT/VACANCY OTHER TOTAL | 77,459 | $ | 535 | $ | 535 | $ | - | |||||||||||||||||||||||
| OTHER SUBTOTAL/WEIGHTED AVERAGE | 59.4% Leased | 108,639 | $ | 3,051 | $ | 2,509 | $ | - | ||||||||||||||||||||||
| TOTAL OFFICE & OTHER/WEIGHTED AVERAGE | 85.8% Leased | 3,876,294 | $ | 63,274 | $ | 61,496 | $ | 283,933 | ||||||||||||||||||||||
| TOTAL CONSOLIDATED PORTFOLIO/WEIGHTED AVERAGE | 97.0% Leased | 52,618,308 | $ | 257,759 | $ | 245,918 | $ | 393,872 | ||||||||||||||||||||||
40
LEXINGTON REALTY TRUST
Property Leases and Vacancies - Consolidated Portfolio - 12/31/2019
| Year
of Lease Expiration | Date
of Lease Expiration | Property Location | City | State | Note | Primary
Tenant, Guarantor, or Parent | Sq.Ft.
Leased or Available (1) | LXP % Ownership | Base
Rent as of 12/31/2019 ($000) (2) | Cash
Base Rent as of 12/31/2019 ($000) (2) | 12/31/2019 Debt Balance ($000) | Debt Maturity (10) | |||||||||||||||||||||||
| NON-CONSOLIDATED PROPERTIES | |||||||||||||||||||||||||||||||||||
| NNN OFFICE JV PROPERTIES | |||||||||||||||||||||||||||||||||||
| 2022 | 12/31/2022 | 231 N. Martingale Rd. | Schaumburg | IL | 6 | Career Education Corporation | 317,198 | 20 | % | 4,598 | 4,666 | 277,580 | 09/2021 | ||||||||||||||||||||||
| 2023 | 3/31/2023 | 8900 Freeport Pkwy. | Irving | TX | 6 | Nissan | 268,445 | 20 | % | 4,906 | 4,543 | - | - | ||||||||||||||||||||||
| 2025 | 2/28/2025 | 6555 Sierra Dr. | Irving | TX | 6, 9 | TXU | 247,254 | 20 | % | 3,803 | 3,201 | - | - | ||||||||||||||||||||||
| 3/14/2025 | 601 & 701 Experian Pkwy. | Allen | TX | 6 | Experian Holdings | 292,700 | 20 | % | 3,240 | 3,073 | - | - | |||||||||||||||||||||||
| 6/30/2025 | 2500 Patrick Henry Pkwy. | McDonough | GA | 6 | Georgia Power | 111,911 | 20 | % | 1,628 | 1,413 | - | - | |||||||||||||||||||||||
| 12/31/2025 | 4001 International Pkwy. | Carrollton | TX | 6 | Motel 6 | 138,443 | 20 | % | 2,534 | 2,327 | - | - | |||||||||||||||||||||||
| 2026 | 3/31/2026 | 500 Olde Worthington Rd. | Westerville | OH | 6 | Syneos | 97,000 | 20 | % | 1,344 | 1,193 | - | - | ||||||||||||||||||||||
| 4/30/2026 | 800 East Canal St. | Richmond | VA | 4 | Richmond Belly Ventures | 2,568 | 20 | % | 81 | 81 | - | - | |||||||||||||||||||||||
| 11/30/2026 | 500 Kinetic Dr. | Huntington | WV | 6 | Amazon.com | 68,693 | 20 | % | 1,237 | 1,159 | - | - | |||||||||||||||||||||||
| 2027 | 2/28/2027 | 800 East Canal St. | Richmond | VA | 4 | Sumitomo | 8,503 | 20 | % | 203 | 146 | - | - | ||||||||||||||||||||||
| 6/30/2027 | 3902 Gene Field Rd. | St. Joseph | MO | 6 | Boehringer Ingelheim USA | 98,849 | 20 | % | 2,116 | 1,961 | - | - | |||||||||||||||||||||||
| 7/6/2027 | 2221 Schrock Rd. | Columbus | OH | 6 | MS Consultants | 42,290 | 20 | % | 684 | 636 | - | - | |||||||||||||||||||||||
| 8/7/2027 | 25 Lakeview Dr. | Jessup | PA | 6 | TMG Health | 150,000 | 20 | % | 2,330 | 2,167 | - | - | |||||||||||||||||||||||
| 2029 | 1/31/2029 | 6226 West Sahara Ave. | Las Vegas | NV | 6 | Nevada Power | 282,000 | 20 | % | 3,474 | 3,089 | - | - | ||||||||||||||||||||||
| 2030 | 8/31/2030 | 800 East Canal St. | Richmond | VA | -- | McGuireWoods | 224,537 | 20 | % | 6,995 | 7,034 | 57,500 | 02/2031 | ||||||||||||||||||||||
| 9/30/2030 | 800 East Canal St. | Richmond | VA | 4 | The Riverstone Group | 25,707 | 20 | % | 770 | 658 | - | - | |||||||||||||||||||||||
| 2031 | 1/10/2031 | 810 Gears Rd. | Houston | TX | 6 | United States of America | 68,985 | 20 | % | 1,201 | 1,425 | - | - | ||||||||||||||||||||||
| 3/1/2031 | 800 East Canal St. | Richmond | VA | 4 | Towne Bank | 26,047 | 20 | % | 844 | 711 | - | - | |||||||||||||||||||||||
| 2032 | 4/30/2032 | 1210 AvidXchange Ln. | Charlotte | NC | -- | AvidXchange | 201,450 | 20 | % | 6,025 | 5,335 | 46,900 | 12/2022; 01/2033 | ||||||||||||||||||||||
| 9/30/2032 | 10001 Richmond Ave. | Houston | TX | 6 | Schlumberger | 554,385 | 20 | % | 6,195 | 5,798 | - | - | |||||||||||||||||||||||
| 2035 | 4/30/2035 | 143 Diamond Ave. | Parachute | CO | 6 | Alenco | 49,024 | 20 | % | 1,107 | 1,178 | - | - | ||||||||||||||||||||||
| 2088 | 8/8/2088 | 800 East Canal St. | Richmond | VA | 4 | The City of Richmond, Virginia | - | 20 | % | 356 | 419 | - | - | ||||||||||||||||||||||
| N/A | Vacancy | 810 Gears Rd. | Houston | TX | 6 | (Available for Lease) | 9,910 | 20 | % | - | - | - | - | ||||||||||||||||||||||
| 800 East Canal St. | Richmond | VA | 4 | (Available for Lease) | 42,947 | 20 | % | - | - | - | - | ||||||||||||||||||||||||
| NNN OFFICE JV TOTAL/WEIGHTED AVERAGE | 98.4% Leased | 3,328,846 | $ | 55,671 | $ | 52,213 | $ | 381,980 | |||||||||||||||||||||||||||
41
LEXINGTON REALTY TRUST
Property Leases and Vacancies - Consolidated Portfolio - 12/31/2019
| Year
of Lease Expiration | Date
of Lease Expiration | Property Location | City | State | Note | Primary
Tenant, Guarantor, or Parent | Sq.Ft.
Leased or Available (1) | LXP % Ownership | Base
Rent as of 12/31/2019 ($000) (2) | Cash
Base Rent as of 12/31/2019 ($000) (2) | 12/31/2019 Debt Balance ($000) | Debt Maturity (10) | |||||||||||||||||||||||
| OTHER NON-CONSOLIDATED PROPERTIES | |||||||||||||||||||||||||||||||||||
| 2036 | 8/31/2036 | 2203 North Westgreen Blvd. | Katy | TX | -- | British Schools | 274,000 | 25 | % | 6,613 | 6,613 | 52,089 | 12/2022 | ||||||||||||||||||||||
| OTHER NON-CONSOLIDATED TOTAL/WEIGHTED AVERAGE | 100% Leased | 274,000 | $ | 6,613 | $ | 6,613 | $ | 52,089 | |||||||||||||||||||||||||||
| NON-CONSOLIDATED TOTAL/WEIGHTED AVERAGE | 98.5% Leased | 3,602,846 | $ | 62,284 | $ | 58,826 | $ | 434,069 | |||||||||||||||||||||||||||
Footnotes
| 1 | Square footage leased or available. |
| 2 | Twelve months ended 12/31/2019 Base Rent and Cash Base Rent. See definitions of non-GAAP measures and reconciliations to applicable GAAP measures in this document. |
| 3 | Percent represents % leased as of 12/31/2019. |
| 4 | Part of Richmond, Virginia property, which is primarily leased to McGuireWoods LLP. |
| 5 | Lexington has a 71.1% interest in this property. |
| 6 | All debt is cross-collateralized and cross-defaulted. |
| 7 | Multi-tenant properties are properties less than 50% leased to a single tenant. |
| 8 | Base Rent and Cash Base Rent amounts represent/include prior tenant. |
| 9 | Lease extended to 02/2035 upon completion of adjacent parking garage. |
| 10 | Interest rates range from 0.25% to 5.3% at 12/31/2019. |
| 11 | The multi-tenanted / vacant properties incurred approximately $3.7 million in operating expenses, net for the twelve months ended 12/31/2019. |
| 12 | Heidelberg Americas, Inc. lease expires 3/30/2021; however, new tenant (manroland Goss Web Systems America, LLC) lease expires 3/30/2026. |
| 13 | Lease restricts certain disclosures. |
| 14 | Property includes four warehouses (252,351 square feet each) and one other property (25,066 square feet). |
| 15 | Subsequent to 12/31/2019, lease extended to 6/30/2037. |
| 16 | Subsequent to 12/31/2019, the tenant dissolved and surrendered the premises. Subleases will be assumed and/or direct leases will be entered into with the subtenants. |
| 17 | Subsequent to 12/31/2019, the tenant amended the lease and terminated 46,350 square feet effective 11/7/2020 and extended the remaining 23,750 square feet to 11/6/2023. |
42
LEXINGTON REALTY TRUST
Select Credit Metrics Summary (1)
| 12/31/2019 | ||||
| Adjusted Company FFO Payout Ratio | 51.6 | % | ||
| Unencumbered Assets | $3.3 billion | |||
| Unencumbered NOI | 84.1 | % | ||
| (Debt + Preferred) / Gross Assets | 34.5 | % | ||
| Debt/Gross Assets | 32.1 | % | ||
| Secured Debt / Gross Assets | 9.6 | % | ||
| Net Debt / Adjusted EBITDA | 4.9 | x | ||
| (Net Debt + Preferred) / Adjusted EBITDA | 5.3 | x | ||
| Credit Facilities Availability (2) | $600.0 million | |||
| Unsecured Debt / Unencumbered NOI | 4.6 | x | ||
| Footnotes | |
| (1) | See reconciliations of non-GAAP measures in this document. Lexington believes these credit metrics provide investors with additional information to evaluate its liquidity and performance. |
| (2) | Subject to covenant compliance. |
43
LEXINGTON REALTY TRUST
Corporate Level Debt
| Must be: | 12/31/2019 | |||||||
| Bank Loans: | ||||||||
| Maximum Leverage | <60% | 36.2 | % | |||||
| Fixed Charge Coverage | >1.5x | 2.8 | x | |||||
| Recourse Secured Indebtedness Ratio | <10% cap value | 0.0 | % | |||||
| Secured Indebtedness Ratio | <40% | 13.3 | % | |||||
| Unsecured Debt Service Coverage | >2.0x | 5.8 | x | |||||
| Unencumbered Leverage | <60% | 26.3 | % | |||||
| Bonds: | ||||||||
| Debt to Total Assets | <60% | 32.8 | % | |||||
| Secured Debt to Total Assets | <40% | 9.8 | % | |||||
| Debt Service Coverage | >1.5x | 4.0 | x | |||||
| Unencumbered Assets to Unsecured Debt | >150% | 372.4 | % | |||||
| Footnotes | |
| (1) | The following is a summary of the key financial covenants for Lexington's credit facility and term loan and senior notes, as of December 31, 2019 and as defined and calculated per the terms of the credit facility and term loan and senior notes, as of such date and applicable. These calculations are presented to show Lexington's compliance with such covenants only and are not measures of Lexington's liquidity or performance. |
44
LEXINGTON REALTY TRUST
Consolidated Properties: Mortgages and Notes Payable
12/31/2019
| Property | Footnotes | Debt Balance ($000) | Interest Rate (%) | Maturity (a) | Current Estimated Annual Debt Service ($000) (b) | Balloon Payment ($000) | ||||||||||||||||||
| INDUSTRIAL | ||||||||||||||||||||||||
| Chester, SC | $ | 5,763 | 5.380 | % | 08/2025 | $ | 1,144 | $ | 362 | |||||||||||||||
| Long Island City, NY | 36,449 | 3.500 | % | 03/2028 | 4,879 | - | ||||||||||||||||||
| Goodyear, AZ | 41,877 | 4.290 | % | 08/2031 | 1,797 | 33,399 | ||||||||||||||||||
| Warren, MI | 25,850 | 5.380 | % | 11/2032 | 1,391 | 22,037 | ||||||||||||||||||
| Industrial Subtotal/Wtg. Avg./Years Remaining (c) | $ | 109,939 | 4.342 | % | 10.4 | $ | 9,211 | $ | 55,798 | |||||||||||||||
| OFFICE | ||||||||||||||||||||||||
| Overland Park, KS | (e) | $ | 32,112 | 5.891 | % | N/A | $ | - | $ | 32,112 | ||||||||||||||
| Boca Raton, FL | (j) | 18,465 | 6.470 | % | 02/2020 | 293 | 18,414 | |||||||||||||||||
| Wall, NJ | 5,576 | 6.250 | % | 01/2021 | 4,004 | - | ||||||||||||||||||
| Charleston, SC | (e) | 6,830 | 5.850 | % | 02/2021 | 520 | 6,632 | |||||||||||||||||
| Whippany, NJ | 11,572 | 6.298 | % | 11/2021 | 1,344 | 10,400 | ||||||||||||||||||
| Palo Alto, CA | 26,301 | 3.970 | % | 12/2023 | 7,059 | - | ||||||||||||||||||
| Lake Jackson, TX | 183,077 | 4.040 | % | 10/2036 | 12,656 | 11,305 | ||||||||||||||||||
| Office Subtotal/Wtg. Avg./Years Remaining (c) | $ | 283,933 | 4.580 | % | 11.3 | $ | 25,876 | $ | 78,863 | |||||||||||||||
| Subtotal/Wtg. Avg./Years Remaining (c) | $ | 393,872 | 4.513 | % | 11.1 | $ | 35,087 | $ | 134,661 | |||||||||||||||
| CORPORATE (f) | ||||||||||||||||||||||||
| Revolving Credit Facility | (g) | $ | - | - | 02/2023 | $ | - | $ | - | |||||||||||||||
| Senior Notes | 250,000 | 4.250 | % | 06/2023 | 10,625 | 250,000 | ||||||||||||||||||
| Senior Notes | 250,000 | 4.400 | % | 06/2024 | 11,000 | 250,000 | ||||||||||||||||||
| Term Loan | (h) | 300,000 | 2.732 | % | 01/2025 | 8,310 | 300,000 | |||||||||||||||||
| Trust Preferred Notes | (i) | 129,120 | 3.636 | % | 04/2037 | 4,760 | 129,120 | |||||||||||||||||
| Subtotal/Wtg. Avg./Years Remaining (c) | $ | 929,120 | 3.715 | % | 6.1 | $ | 34,695 | $ | 929,120 | |||||||||||||||
| Total/Wtg. Avg./Years Remaining (c) | (d) | $ | 1,322,992 | 3.953 | % | 7.6 | $ | 69,782 | $ | 1,063,781 | ||||||||||||||
| Footnotes | |||||||
| (a) | Subtotal and total based on weighted-average term to maturity shown in years based on debt balance. | ||||||
| (b) | Remaining payments for debt with less than 12 months to maturity, all others are debt service for next 12 months. | ||||||
| (c) | Total shown may differ from detailed amounts due to rounding. | ||||||
| (d) | See reconciliations of non-GAAP measures in this document. | ||||||
| (e) | Loan is in default. | ||||||
| (f) | Unsecured. | ||||||
| (g) | Rate ranges from LIBOR plus 0.775% to 1.45% | ||||||
| (h) | Rate ranges from LIBOR plus 0.85% to 1.65%. LIBOR rate was fixed at 1.732% through January 2025 via interest rate swap agreements. | ||||||
| (i) | Rate is three month LIBOR plus 170 bps. | ||||||
| (j) | Loan in default subsequent to 12/31/19. | ||||||
45
LEXINGTON REALTY TRUST
12/31/2019
($000)
| Consolidated Properties | ||||||||||||||
| Year | Mortgage Scheduled Amortization | Mortgage Balloon Payments (1) | Corporate
Debt | |||||||||||
| 2020 | $ | 20,573 | $ | 50,526 | $ | - | ||||||||
| 2021 | 19,565 | 17,032 | - | |||||||||||
| 2022 | 18,564 | - | - | |||||||||||
| 2023 | 20,136 | - | 250,000 | |||||||||||
| 2024 | 13,856 | - | 250,000 | |||||||||||
| $ | 92,694 | $ | 67,558 | $ | 500,000 | |||||||||
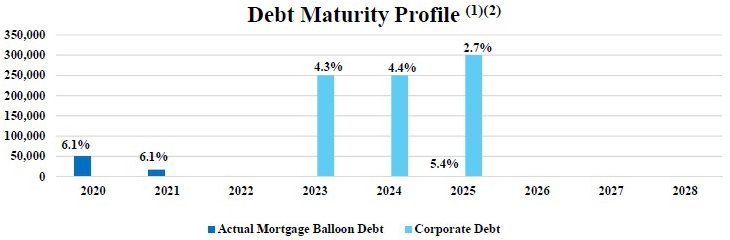
Footnotes
| (1) | Includes mortgage balloons in default |
| (2) | Percentage denotes weighted-average interest rate. |
46
LEXINGTON REALTY TRUST
Selected Balance Sheet Account Data
12/31/2019
($000)
| Balance Sheet | ||||
| Other assets | $ | 11,708 | ||
| The components of other assets are: | ||||
| Deposits | $ | 1,748 | ||
| Equipment | 468 | |||
| Prepaids | 1,081 | |||
| Other receivables | 724 | |||
| Deferred lease incentives | 7,687 | |||
| Accounts payable and other liabilities | ||||
| The components of accounts payable and other liabilities are: | $ | 29,925 | ||
| Accounts payable and accrued expenses | $ | 18,184 | ||
| CIP accruals and other | 4,465 | |||
| Taxes | 341 | |||
| Deferred lease costs | 2,457 | |||
| Deposits | 1,631 | |||
| Escrows | 806 | |||
| Transaction costs | 113 | |||
| Derivative liability | 1,928 | |||
47
LEXINGTON REALTY TRUST
DEFINITIONS
Lexington has used non-GAAP financial measures as defined by the Securities and Exchange Commission Regulation G in the Quarterly Earnings Press Release, in this Quarterly Supplemental Information and in other public disclosures.
Lexington believes that the measures defined below are helpful to investors in measuring our performance or that of an individual investment. Since these measures exclude certain items which are included in their respective most comparable Generally Accepted Accounting Principles (“GAAP”) measures, reliance on the measures has limitations; management compensates for these limitations by using the measures simply as supplemental measures that are weighed in balance with other GAAP measures. These measures are not necessarily indications of our cash flow available to fund cash needs. Additionally, they should not be used as an alternative to the respective most comparable GAAP measures when evaluating Lexington's financial performance or cash flow from operating, investing, or financing activities or liquidity.
Definitions:
Adjusted EBITDA: Adjusted EBITDA represents EBITDA (earnings before interest, taxes, depreciation and amortization) modified to include other adjustments to GAAP net income for gains on sales of properties, impairment charges, debt satisfaction gains (charges), net, non-cash charges, net, straight-line adjustments, non-recurring charges and adjustments for pro-rata share of non-wholly owned entities. Lexington’s calculation of Adjusted EBITDA may not be comparable to similarly titled measures used by other companies. Lexington believes that net income is the most directly comparable GAAP measure to Adjusted EBITDA.
Base Rent: Base Rent is calculated by making adjustments to GAAP rental revenue to exclude billed tenant reimbursements, and lease termination income and to include ancillary income. Lexington believes Base Rent provides a meaningful measure due to the net lease structure of leases in the portfolio.
Cash Base Rent: Cash Base Rent is calculated by making adjustments to GAAP rental revenue to remove the impact of GAAP required adjustments to rental income such as adjustments for straight-line rents related to free rent periods and contractual rent increases. Cash Base Rent excludes billed tenant reimbursements and lease termination income and includes ancillary income. Lexington believes Cash Base Rent provides a meaningful indication of an investments ability to fund cash needs.
Funds from Operations (“FFO”) and Adjusted Company FFO: Lexington believes that Funds from Operations, or FFO, which is a non-GAAP measure, is a widely recognized and appropriate measure of the performance of an equity real estate investment trust (“REIT”). Lexington believes FFO is frequently used by securities analysts, investors and other interested parties in the evaluation of REITs, many of which present FFO when reporting their results. FFO is intended to exclude GAAP historical cost depreciation and amortization of real estate and related assets, which assumes that the value of real estate diminishes ratably over time. Historically, however, real estate values have risen or fallen with market conditions. As a result, FFO provides a performance measure that, when compared year over year, reflects the impact to operations from trends in occupancy rates, rental rates, operating costs, development activities, interest costs and other matters without the inclusion of depreciation and amortization, providing perspective that may not necessarily be apparent from net income.
The National Association of Real Estate Investment Trusts, or NAREIT, defines FFO as “net income (calculated in accordance with GAAP), excluding depreciation and amortization related to real estate, gains and losses from the sales of certain real estate assets, gains and losses from change in control and impairment write-downs of certain real estate assets and investments in entities when the impairment is directly attributable to decreases in value of depreciable real estate held by the entity. The reconciling items include amounts to adjust earnings from consolidated partially-owned entities and equity in earnings of unconsolidated affiliates to FFO.” FFO does not represent cash generated from operating activities in accordance with GAAP and is not indicative of cash available to fund cash needs.
Lexington presents FFO available to common shareholders and unitholders - basic and also presents FFO available to all equityholders and unitholders - diluted on a company-wide basis as if all securities that are convertible, at the holder's option, into Lexington’s common shares, are converted at the beginning of the period. Lexington also presents Adjusted Company FFO available to all equityholders and unitholders - diluted which adjusts FFO available to all equityholders and unitholders - diluted for certain items which we believe are not indicative of the operating results of Lexington's real estate portfolio. Lexington believes this is an appropriate presentation as it is frequently requested by security analysts, investors and other interested parties. Since others do not calculate these measures in a similar fashion, these measures may not be comparable to similarly titled measures as reported by others. These measures should not be considered as an alternative to net income as an indicator of Lexington’s operating performance or as an alternative to cash flow as a measure of liquidity.
GAAP and Cash Yield or Capitalization Rate: GAAP and cash yields or capitalization rates are measures of operating performance used to evaluate the individual performance of an investment. These measures are estimates and are not presented or intended to be viewed as a liquidity or performance measure that present a numerical measure of Lexington's historical or future financial performance, financial position or cash flows. The yield or capitalization rate is calculated by dividing the annualized NOI (as defined below, except GAAP rent adjustments are added back to rental income to calculate GAAP yield or capitalization rate) the investment is expected to generate (or has generated) by the acquisition/completion cost (or sale) price.
48
LEXINGTON REALTY TRUST
NON-GAAP MEASURES
DEFINITIONS (CONTINUED)
Net Operating Income (NOI): NOI is a measure of operating performance used to evaluate the individual performance of an investment. This measure is not presented or intended to be viewed as a liquidity or performance measure that presents a numerical measure of Lexington's historical or future financial performance, financial position or cash flows. Lexington defines NOI as operating revenues (rental income (less GAAP rent adjustments and lease termination income) and other property income) less property operating expenses. Other REITs may use different methodologies for calculating NOI, and accordingly, Lexington's NOI may not be comparable to that of other companies. Because NOI excludes general and administrative expenses, interest expense, depreciation and amortization, acquisition-related expenses, other nonproperty income and losses, and gains and losses from property dispositions, it provides a performance measure that, when compared year over year, reflects the revenues and expenses directly associated with owning and operating commercial real estate and the impact to operations from trends in occupancy rates, rental rates, and operating costs, providing a perspective on operations not immediately apparent from net income. Lexington believes that net income is the most directly comparable GAAP measure to NOI.
Same-Store NOI: Same-Store NOI represents the NOI for consolidated properties that were owned and included in our portfolio for two comparable reporting periods excluding properties encumbered by mortgage loans in default and the revenue associated with the expansion of properties, as applicable. As Same-Store NOI excludes the change in NOI from acquired and disposed of properties, it highlights operating trends such as occupancy levels, rental rates and operating costs on properties. Other REITs may use different methodologies for calculating Same-Store NOI, and accordingly, Lexington's Same-Store NOI may not be comparable to other REITs. Management believes that Same-Store NOI is a useful supplemental measure of Lexington's operating performance. However, Same-Store NOI should not be viewed as an alternative measure of Lexington 's financial performance since it does not reflect the operations of Lexington's entire portfolio, nor does it reflect the impact of general and administrative expenses, acquisition-related expenses, interest expense, depreciation and amortization costs, other nonproperty income and losses, the level of capital expenditures and leasing costs necessary to maintain the operating performance of Lexington's properties, or trends in development and construction activities which are significant economic costs and activities that could materially impact Lexington's results from operations. Lexington believes that net income is the most directly comparable GAAP measure to Same-Store NOI.
49
LEXINGTON REALTY TRUST
RECONCILIATION OF NON-GAAP MEASURES
($000)
| Twelve
months ended December 31, 2019 | ||||
| Rent Reconciliation: | ||||
| Rental revenue as reported | $ | 320,622 | ||
| Base Rent from sold properties | (31,824 | ) | ||
| Lease termination income | (2,226 | ) | ||
| Ancillary revenue | 1,429 | |||
| Reimbursements | (30,242 | ) | ||
| Base Rent per supplement | $ | 257,759 | ||
| Adjustments: (1) | ||||
| Straight-line adjustments | $ | (12,101 | ) | |
| Lease incentives | 916 | |||
| Amortization of above/below market leases | (656 | ) | ||
| Cash Base Rent per supplement | $ | 245,918 | ||
Consolidated debt reconciliation December 31, 2019:
| GAAP Balance | Deferred
Loan Costs, net | Discounts | Gross Balance | |||||||||||||
| Mortgages and notes payable (2) | $ | 390,272 | $ | 3,600 | $ | - | $ | 393,872 | ||||||||
| Term loans payable (3) | 297,439 | 2,561 | - | 300,000 | ||||||||||||
| Senior notes payable(3) | 496,870 | 2,167 | 963 | 500,000 | ||||||||||||
| Trust preferred securities (3) | 127,396 | 1,724 | - | 129,120 | ||||||||||||
| Consolidated debt | $ | 1,311,977 | $ | 10,052 | $ | 963 | $ | 1,322,992 | ||||||||
| Footnotes | |
| (1) | Individual items are adjusted for sold properties, which were previously reflected in the reconciliation. |
| (2) | Secured. |
| (3) | Unsecured. |
50
LEXINGTON REALTY TRUST
RECONCILIATION OF NON-GAAP MEASURES (CONTINUED)
($000)
Same-Store NOI Reconciliation:
| Twelve months ended December 31, | ||||||||
| 2019 | 2018 | |||||||
| Net income | $ | 285,293 | $ | 230,906 | ||||
| Interest and amortization expense | 65,095 | 79,880 | ||||||
| Provision for income taxes | 1,379 | 1,728 | ||||||
| Depreciation and amortization | 147,594 | 168,191 | ||||||
| General and administrative | 30,785 | 31,662 | ||||||
| Transaction costs | 202 | 260 | ||||||
| Non-operating/advisory income | (6,180 | ) | (3,491 | ) | ||||
| Gains on sales of properties | (250,889 | ) | (252,913 | ) | ||||
| Impairment charges | 5,329 | 95,813 | ||||||
| Debt satisfaction charges, net | 4,517 | 2,596 | ||||||
| Equity in (earnings) of non-consolidated entities | (2,890 | ) | (1,708 | ) | ||||
| Lease termination income | (2,226 | ) | (2,755 | ) | ||||
| Straight-line adjustments | (14,502 | ) | (20,968 | ) | ||||
| Lease incentives | 1,191 | 1,686 | ||||||
| Amortization of above/below market leases | (443 | ) | (10,132 | ) | ||||
| Net Operating Income - ("NOI") | 264,255 | 320,755 | ||||||
| Less NOI: | ||||||||
| Acquisitions and dispositions | (57,320 | ) | (103,640 | ) | ||||
| Properties in default | 964 | (5,685 | ) | |||||
| Same-Store NOI | $ | 207,899 | $ | 211,430 | ||||
NOI for NAV:
| Twelve months ended | ||||||||
| December 31, 2019 | ||||||||
| NOI per above | $ | 264,255 | ||||||
| Less NOI: | ||||||||
| Disposed of properties | (25,790 | ) | ||||||
| Assets acquired in 2019 | (13,426 | ) | ||||||
| Assets less than 70% leased / Other | 649 | |||||||
| NOI for NAV | $ | 225,688 | ||||||
51
LEXINGTON REALTY TRUST
RECONCILIATION OF NON-GAAP MEASURES (CONTINUED)
($000)
Reconciliation to Adjusted EBITDA:
| Year-end
December 31, 2019 | ||||
| Net income attributable to | ||||
| Lexington Realty Trust shareholders | $ | 279,910 | ||
| Interest and amortization expense | 65,095 | |||
| Provision for income taxes | 1,379 | |||
| Depreciation and amortization | 147,594 | |||
| Straight-line adjustments | (14,502 | ) | ||
| Lease incentives | 1,191 | |||
| Amortization of above/below market leases | (443 | ) | ||
| Gains on sales of properties | (250,889 | ) | ||
| Impairment charges | 5,329 | |||
| Debt satisfaction charges, net | 4,517 | |||
| Non-cash charges, net | 6,410 | |||
| Pro-rata share adjustments: | ||||
| Non-consolidated entities adjustment | 9,390 | |||
| Noncontrolling interests adjustment | 4,349 | |||
| Adjusted EBITDA | $ | 259,330 | ||
52
LEXINGTON REALTY TRUST
RECONCILIATION OF NON-GAAP MEASURES (CONTINUED)
($000)
Reconciliation of Select Credit Metrics:
| Adjusted Company FFO Payout: | Twelve
months ended December 31, 2019 |
(Debt + Preferred) / Gross Assets: | Twelve
months ended December 31, 2019 |
|||||||
| Common share dividends per share | $ | 0.4125 | Consolidated debt | $ | 1,311,977 | |||||
| Adjusted Company FFO per diluted share | 0.80 | Preferred shares liquidation preference | 96,770 | |||||||
| Adjusted Company FFO payout ratio | 51.6 | % | Debt and preferred | $ | 1,408,747 | |||||
| Unencumbered Assets: | Total assets | $ | 3,180,260 | |||||||
| Real estate, at cost | $ | 3,743,643 | Plus depreciation and amortization: | |||||||
| less encumbered real estate, at cost | (470,231 | ) | Real estate | 887,629 | ||||||
| Unencumbered assets | $ | 3,273,412 | Deferred lease costs | 14,902 | ||||||
| Unencumbered NOI: | Gross assets | $ | 4,082,791 | |||||||
| NOI | $ | 264,255 | ||||||||
| Disposed of properties NOI | (25,790 | ) | (Debt + Preferred) / Gross Assets | 34.5 | % | |||||
| Adjusted NOI | 238,465 | |||||||||
| less encumbered adjusted NOI | (38,029 | ) | Debt / Gross Assets: | |||||||
| Unencumbered adjusted NOI | $ | 200,436 | Consolidated debt | $ | 1,311,977 | |||||
| Unencumbered NOI % | 84.1 | % | ||||||||
| Gross assets | $ | 4,082,791 | ||||||||
| Net Debt / Adjusted EBITDA: | ||||||||||
| Adjusted EBITDA | $ | 259,330 | Debt / Gross assets | 32.1 | % | |||||
| Consolidated debt | $ | 1,311,977 | Secured Debt / Gross Assets: | |||||||
| less consolidated cash and cash equivalents | (122,666 | ) | Mortgages and notes payable | $ | 390,272 | |||||
| Non-consolidated debt, net | 87,703 | |||||||||
| Net debt | $ | 1,277,014 | Gross assets | $ | 4,082,791 | |||||
| Net debt / Adjusted EBITDA | 4.9 | x | Secured Debt / Gross Assets | 9.6 | % | |||||
| (Net Debt + Preferred) / Adjusted EBITDA: | Unsecured Debt / Unencumbered NOI: | |||||||||
| Adjusted EBITDA | $ | 259,330 | Consolidated debt | $ | 1,311,977 | |||||
| less mortgages and notes payable | (390,272 | ) | ||||||||
| Net debt | $ | 1,277,014 | Unsecured Debt | $ | 921,705 | |||||
| Preferred shares liquidation preference | 96,770 | |||||||||
| Net debt + preferred | $ | 1,373,784 | Unencumbered adjusted NOI (Annual) | $ | 200,436 | |||||
| (Net Debt + Preferred) / Adjusted EBITDA | 5.3 | x | Unsecured Debt / Unencumbered NOI | 4.6 | x | |||||
53
| Transfer Agent |
| Computershare | Overnight Correspondence: |
| PO Box 505000 | 462 South 4th Street, Suite 1600 |
| Louisville, KY 40233 | Louisville, KY 40202 |
| (800) 850-3948 | |
| www-us.computershare.com/investor |
| Investor Relations |
| Heather Gentry | |
| Senior Vice President, Investor Relations | |
| Telephone (direct) | (212) 692-7219 |
| Facsimile (main) | (212) 594-6600 |
| [email protected] | |
| Research Coverage |
| Bank of America/Merrill Lynch | KeyBanc Capital Markets Inc. | ||
| James Feldman | (646) 855-5808 | Craig Mailman | (917) 368-2316 |
| Evercore Partners | Ladenburg Thalmann & Co., Inc. | ||
| Sheila K. McGrath | (212) 497-0882 | John Massocca | (212) 409-2543 |
| J.P. Morgan Chase | Stifel Nicolaus | ||
| Anthony Paolone | (212) 622-6682 | John W. Guinee | (443) 224-1307 |
| Jeffries & Company, Inc. | Wells Fargo Securities, LLC | ||
| Jon Peterson | (212) 284-1705 | Todd J. Stender | (562) 637-1371 |
54

LEXINGTON REALTY TRUST
One Penn Plaza, Suite 4015 | New York, NY 10119-4015 | (212) 692-7200 | www.lxp.com
55
EXHIBIT 99.2
Lexington Realty Trust – UNEDITED TRANSCRIPT
Q4 2019 Earnings Call
Company Participants:
T. Wilson Eglin, Chairman and Chief Executive Officer
Beth Boulerice, Executive Vice President, Chief Financial Officer and Treasurer
Brendan Mullinix, Executive Vice President
Lara Johnson, Executive Vice President
James Dudley, Executive Vice President and Director of Asset Management
Heather Gentry, Senior Vice President of Investor Relations
Operator:
Good day, and welcome to the Lexington Realty Trust Fourth Quarter 2019 Conference Call and Webcast. (Operator Instructions) Please note, this event is being recorded. I would now like to turn the call over to Heather Gentry of Investor Relations. Please go ahead.
Heather Gentry:
Thank you, operator. Welcome to Lexington Realty Trust’s Fourth Quarter 2019 conference call and webcast. The earnings release was distributed this morning, and both the release and quarterly supplemental are available on our website at www.lxp.com in the Investors section and will be furnished to the SEC on a Form 8-K.
Certain statements made during this conference call regarding future events and expected results may constitute forward-looking statements within the meaning of the Private Securities Litigation Reform Act of 1995. Lexington believes that these statements are based on reasonable assumptions; however, certain factors and risks, including those included in today’s earnings press release and those described in reports that Lexington files with the SEC from time to time could cause Lexington’s actual results to differ materially from those expressed or implied by such statements. Except as required by law, Lexington does not undertake a duty to update any forward-looking statements.
In the earnings press release and quarterly supplemental disclosure package, Lexington has reconciled all non-GAAP financial measures to the most directly comparable GAAP measure. Any references in these documents to Adjusted Company FFO refer to Adjusted Company Funds from Operations available to all equityholders and unitholders on a fully diluted basis. Operating performance measures of an individual investment are not intended to be viewed as presenting a numerical measure of Lexington's historical or future financial performance, financial position or cash flows.
On today’s call Will Eglin, Chairman and CEO, Beth Boulerice, CFO, and Executive Vice Presidents Brendan Mullinix, Lara Johnson, and James Dudley will provide commentary focused on third-quarter results. I will now turn the call over to Will.
| 1 |
T. Wilson Eglin:
Thanks, Heather. Good morning everyone. We had an excellent fourth quarter and demonstrated strong execution across all areas of our business, including investments, dispositions, portfolio operations, and capital markets. We successfully implemented our business plan each quarter throughout 2019, which brought us closer to our goal of becoming a 100% single-tenant industrial REIT and resulted in our new classification as an industrial REIT by both NAREIT and MSCI. Our execution has been purposeful and prudent during this transition, with the patient accumulation of successes rewarding our shareholders. In just two years, we’ve grown our industrial assets nearly 65%, ending 2019 with our industrial exposure at close to 82% of gross book value. As we’ve continued to add high-quality, well-located assets to our industrial portfolio, we have increased our industrial investment grade tenancy to 46%, lowered the average industrial portfolio age to 12.6 years, and boosted our exposure in the top 50 industrial markets to 80%.
Starting with investments, we had a very active year, investing over $700 million dollars in warehouse and distribution centers at weighted-average GAAP and cash cap rates of 5.8% and 5.4%, respectively. Although the investment landscape has remained competitive, we have been pleased with our Class A industrial purchases, which are well-located in strong primary and secondary submarkets. Our goal is to have another year of significant investment activity. We are off to a great start thus far in 2020, with acquisitions of approximately $195 million dollars closed to date. Given our steady execution, we believe we are well-positioned to grow our industrial exposure to over 90% of gross book value by year-end.
During the quarter, we capitalized on our long-standing relationships with developers to close on three select development projects. While these projects are just getting underway, we are excited about expanding this avenue of growth in our business. In addition to property purchases, we believe it’s valuable to further diversify our growth opportunities and build a deeper presence in certain key markets.
Moving onto dispositions, we had a strong finish to the year, which brought total consolidated property sales to $622 million dollars at very attractive weighted-average GAAP and cash cap rates of 6.4% and 5.6%, respectively. Our accelerated sales efforts over the last few years have reduced our office and other non-industrial assets to less than 20% of our total gross book value.
Looking at 2020, we expect to have substantial capacity to fund our investments primarily from disposition proceeds. That said, we prefer to be a net acquirer this year as we were last year and it’s possible that we will take advantage of capital markets opportunities as they arise, like they did in 2019, to support growth objectives. During the quarter, we issued 6.6 million shares through our ATM program, raising net proceeds of approximately $71 million dollars. The proceeds were used primarily to fund new investments. We have also maintained an exceptionally strong balance sheet with net debt to Adjusted EBITDA of 4.9 times at year end. We believe our conservative balance sheet position provides for additional flexibility should we need capital as the year progresses.
Looking at our portfolio operations, we were heavily focused on executing new and extended leases over the course of the year, and the effort paid off. We leased over six million square feet in 2019, increasing base rents over 7%. The majority of our 2020 leasing expirations have been addressed, and our focus is on 2021 and beyond, particularly as we work to maximize the value of future office dispositions.
| 2 |
Finally, turning to our financial results, in the fourth quarter we generated net income of $0.33 cents per diluted common share and Adjusted Company FFO of $0.20 cents per diluted common share. Our 2019 Adjusted Company FFO of $0.80 cents per diluted common share was at the top end of our guidance range. In connection with our earnings release this morning, we announced estimated 2020 Adjusted Company FFO guidance in the range of $0.74 to $0.77 cents per diluted common share.
This guidance considers our continued capital recycling strategy out of office and into industrial. While this results in earnings dilution in the short-term, we have made tremendous strides in repositioning our portfolio to focus on assets that we believe provide for capital appreciation, income growth, consistent cash flows, and lower operating costs over the longer-term. Additionally, as a result of these portfolio changes, we believe AFFO is trending positively, although the trend may be impacted from time to time in the context of value creating capital expenditures. As a result, we expect annual modest dividend growth to continue, consistent with our recent dividend increase.
With that, I’ll turn the call over to Brendan to talk more specifically about investments.
Brendan Mullinix:
Thanks, Will. We acquired six industrial assets in the fourth quarter for $264 million dollars at weighted-average GAAP and cash cap rates of 5.9% and 5.3%, respectively, ending our year better than previously forecasted. These properties comprise roughly 3.7 million square feet and include a mix of bulk distribution centers and smaller warehouse facilities. They are primarily located within two logistics markets that we have targeted for further investment, including Phoenix and Greenville/Spartanburg.
As discussed on last quarter’s call, we closed on two of the Greenville/Spartanburg assets early in the fourth quarter. These properties are located within an established industrial market in a submarket close to I-85 and the Greer Inland Port. Leased to two logistics companies for five years on average, the properties were built within the last two years to modern specs and together average attractive annual rental escalations of approximately 2.6 percent. Late in the fourth quarter, we closed on a brand new, Class A, distribution center in the same market. The facility is leased to an investment-grade rated home improvement retailer for 15 years with annual rental escalations of about 2 and a half percent. We like the Greenville/Spartanburg logistics market due to its positive demand drivers from tenants, increased population growth, high levels of absorption, and easy access to freeways and the Greer Inland Port.
On last quarter’s call, we had also discussed a facility we purchased in Phoenix’s most active submarket, which is leased to CHEP Pallets for seven years, with annual rental escalations of approximately 2 and a half percent. This property is part of a two-property portfolio, in which the second property, leased to Ball Corporation for six years with average rental escalations of two and a quarter percent per annum, closed subsequent to the quarter in early January of this year. In addition, during the fourth quarter, we closed on a distribution center in the same logistics submarket leased to an e-commerce company, for a long-term lease of approximately 11 years with two percent escalations. We continue to be attracted to this market due to its growth prospects, the strong labor pool, and its position as a lower cost alternative to higher priced West Coast markets.
| 3 |
In December, we committed to the purchase of a three-property industrial portfolio in a logistics submarket of Chicago. All three properties, which had different scheduled closing dates, are leased for approximately 10 years with average annual rental escalations of just over two percent. One of the properties closed in the fourth quarter, and the two others closed in January 2020. The properties are leased to strong credit tenants, Kellogg’s and BMW, and enjoy close proximity to I-80 and I-55. The I-80 submarket is one of Chicago’s most active bulk distribution submarkets.
Also, during the quarter, we invested roughly $15 million dollars in three new development projects in Atlanta and Columbus, Ohio. Most notable is our land parcel in Atlanta where we are developing approximately 900,000 square feet, with an estimated completion date by the end of 2020. We also exercised our option with our development partner to purchase approximately 130 acres across the street from our existing development project in Etna, Ohio and we separately acquired 23.6 acres of developable land in the Rickenbacker submarket of Columbus, Ohio. As Will mentioned, we are looking to open additional avenues of growth and expand our presence in some of our existing markets, and these development projects support our goals.
Finally, subsequent to the quarter, we closed on a newly constructed facility located in the North Fort Worth submarket of the Dallas/Fort Worth metroplex that has excellent access to I-35. The property is leased to Black & Decker for close to 10 years with annual rental bumps of approximately 2%.
We are off to a strong start in 2020, with $195 million dollars of new industrial acquisitions closed to date, and we continue to actively review additional industrial opportunities in the market.
I’ll now turn the call over to Lara to discuss dispositions.
Lara Johnson:
Thanks, Brendan. We finished the year strong, disposing of $173 million dollars of non-core assets in the fourth quarter at weighted-average GAAP and cash cap rates of 8.1% and 7.8%, respectively. These assets consisted of six office properties, three retail properties, and one small non-core industrial property, which generated a combined annualized NOI of approximately $13 million dollars. These transactions brought our total 2019 consolidated sales volume to $622 million, with an additional $177 million of joint venture dispositions last year.
We will continue to move toward our portfolio composition objectives in 2020, with targeted disposition volume of $250 to $500 million dollars. At the high end of the range, the targeted pool of sale assets generated approximately $35 million dollars of fourth quarter annualized NOI and was 68% occupied at year-end.
| 4 |
Our Dow Chemical office property is included, we have received off-market expressions of interest in the Dow property, and while it is still possible that a transaction will be completed off-market, we are simultaneously preparing for a marketing campaign.
Our 2020 disposition plan is well underway. We currently have approximately $72 million dollars of consolidated assets either under contract or with an accepted offer, and we are actively in the market with several other properties. We were very pleased with our sale outcomes in 2019, and we expect to continue our steady execution in 2020 as we work diligently to complete the plan and advance our broader objective to become 100% industrial.
With that, I will turn the call over to James who will provide an update on leasing.
James Dudley:
Thanks Lara. During the quarter, we executed lease extensions and new leases in excess of two million square feet, with an overall leased portfolio of 97% at quarter end. When compared to the third quarter, occupancy is slightly down as a result of Michelin’s planned move out in Moody, Alabama at the end of 2019. Despite this move out, our industrial portfolio remains almost 98% leased.
Same-store NOI on the entire portfolio was down 1.7% as of year-end, and when removing single-tenant vacancy, was flat. Approximately 87% of our industrial portfolio has rental escalations, which we believe should ultimately lead to positive same store growth as we continue to reduce our office holdings. Execution of our 2020 plan is expected to produce industrial same-store NOI growth of approximately 2%, subject to vacancy and renewal outcomes.
On the industrial side, we were pleased to see positive leasing outcomes, which resulted in an increase in base and cash base rents of 28% and 8%, respectively. If you recall, we acquired our Mars property in Atlanta with a short-term lease at the time of purchase last year. During the quarter, negotiations resulted in a five-year renewal at an 18% cash base rental increase with 3% annual rental bumps. We will invest approximately $9 million dollars in the property, with approximately $7.5 million being amortized over the term at 7%. This type of capital improvement creates considerable near- and long-term value in view of rate of return, strong credit tenant, and enhanced probability of renewal. We also executed a new three- year lease with RC Moore at our industrial facility in Tampa. Our previous tenant was scheduled to move out in June of 2020. We were able to re-tenant the building at an attractive rent for the market without experiencing any down time from the expected move out. Lastly, during the quarter, the lease on our Michelin facility in Laurens, South Carolina was further extended until January 2021.
Subsequent to quarter end, Kitchen Collection liquidated and vacated our Chillicothe, Ohio warehouse. The current subtenants occupy 95% of the facility, and we believe that we will be able to completely back fill the vacated space.
| 5 |
On the office side, during the quarter, we executed a 10-plus year extension with Quest Diagnostics in Lenexa, Kansas, and the property is now being marketed for sale. Subsequent to the quarter, we extended our lease with New Jersey Natural Gas in Wall, New Jersey for 15 years with annual renewal rents starting at approximately $3 million dollars. Our plan is to sell the asset following the expiration of the $52.5 million-dollar purchase option at the end of 2022. We will spend approximately $13.5 million over the next two years to secure this early lease renewal, which greatly enhances the sale value.
Additionally, our office property that was formerly leased to Oce-USA Holdings until earlier this month has a non-recourse mortgage encumbering the property and is in the process of being conveyed to the lender.
We continue to work diligently on 2020 lease expirations and beyond. Of our remaining three 2020 industrial lease expirations, we are in negotiations with ODW Logistics for a renewal, Unilever is likely to be a user-buyer sale, and we believe Geodis will extend their lease, but it is still too early in the year to have clear visibility on this late December 2020 expiration.
With that, I will now turn the call over to Beth who will discuss financial results.
Beth Boulerice:
Thanks, James. Overall, 2019 was a positive year with many notable highlights. We raised more than $200 million dollars of equity, extended the maturity dates of our revolving credit facility and our term loan, while lowering the applicable margin rates, and satisfied a great deal of secured debt. Our balance sheet remains in excellent shape with low leverage and provides a great deal of flexibility as we think about funding alternatives for growth.
Moving onto fourth quarter financial results, net income attributable to common shareholders was $84 million dollars, or $0.33 cents per diluted common share in the quarter, compared to $24 million dollars, or $0.10 cents per diluted common share for the same time period in 2018.
Adjusted Company FFO was approximately $52 million dollars, or $0.20 cents per diluted common share in the fourth quarter, for a total of $197 million dollars, or $0.80 cents per diluted common share for the year. Our Adjusted Company FFO payout ratio of 51.6% at quarter end remains extremely attractive, which we believe positions us to both grow our dividend and retain capital to fund investment opportunities.
The estimated 2020 Adjusted Company FFO guidance range of $0.74-$0.77 cents per diluted common share that was announced today incorporates our commentary on dispositions, investments, and leasing that we have made on this call.
Gross revenues of $83 million dollars for the quarter were down when compared to the same time period last year as a result of sales and our continued transition to becoming a 100% single-tenant, industrial REIT.
Property operating expenses were $11 million dollars for the quarter, of which 79% was attributable to tenant reimbursements. G&A expenses were about $7 million dollars in the quarter, bringing total G&A for the year to just under $31 million dollars. This figure was slightly better than we had anticipated and represented a slight improvement when compared to 2018 G&A. We estimate our 2020 G&A will be within a range of $31 to $33 million dollars, and we continue to explore ways to operate more efficiently.
| 6 |
Leasing costs and tenant improvements were approximately $6.6 million dollars in the fourth quarter, bringing the 2019 total to $22 million dollars. As we look to 2020, our budget for leasing costs and tenant improvements includes the investment of approximately $13 to $15 million dollars in connection with the lease extensions for Mars and New Jersey Natural Gas that James discussed. Additionally, we anticipate another $10 to $12 million dollars for other expenditures that support occupancy for a total of $23 to $27 million dollars for the year. Costs for the New Jersey Natural Gas lease were previously budgeted for in 2021, when the lease was scheduled to expire. Keep in mind that leasing costs and tenant improvement estimates are always subject to change due to a variety of factors including the timing of the improvements and leasing activity.
Turning to the balance sheet, at quarter end, we had approximately $130 million dollars of cash, including restricted cash, with nothing outstanding on our revolver. Leverage remained low, and at quarter end was 4.9 times net debt to Adjusted EBITDA. While we expect fluctuations in this metric in any given quarter as we continue to move through our capital recycling strategy, sales proceeds and our capital markets transactions during the quarter provided the necessary funding for our investments and supported low leverage at quarter end. As Will mentioned earlier in the call, we issued an additional 6.6 million shares under our ATM program during the quarter, for net proceeds of $71 million dollars. Our current diluted weighted-average share count is now estimated to be 261 million common shares.
At quarter end, our consolidated debt outstanding was approximately $1.3 billion with a weighted-average interest rate of approximately 4% and a weighted-average term of 7.6 years. Unencumbered NOI represented more than 84% of our portfolio at quarter end.
With that, I’ll turn the call back over to Will.
T. Wilson Eglin:
Thanks Beth. I will now turn the call over to the operator who will conduct Q&A.
Operator:
Thank you. We will now begin the question and answer session. (Operator Instructions)
And our first question today comes from Anthony Paolone from JPMorgan. Please go ahead with your question.
Anthony Paolone:
Thank you. Good morning. I guess first question maybe for Brendan, can you talk about just the difference in cap rates on something like Greenville with five or six years of duration on the lease versus say BMW in Chicago and kind of how those vary?
| 7 |
Brendan Mullinix:
Yes, sure. Between the two, it’s actually fairly wide. If you look at the two smaller Greenville assets, those cap rates were around 5.70 cap rate whereas if you have a 15-year investment grade in credit, that cap rate was just above 5.
Anthony Paolone:
Okay. And as you’re looking at the pipeline right now, where do you kind of see the sweet spot where you’re getting paid for the risk you’re taking and where Lexington can compete best?
Brendan Mullinix:
It’s hard to solely look at cap rate as the only metric and we really have to consider the long-term performance and there’s rent base, there’s escalation structure, there’s lease duration. If you look at our recent activity, we’ve favored longer lease terms, stronger credits and more primary markets in our recent activity. And in those markets we’ve seen cap rates be anywhere in the range for sort of the very best combination of those factors. In today’s market it could be as low as something around 4.75 to 5 in that kind of range. And then as I’ve said, when we were discussing the Greenville market, in those opportunities it could be in the mid to upper 5 range. So it’s a fairly wide range and a lot of it will just depend on mix of the market filtrations [ph] in credit. So it is a wide range if you looked at the 4.75 to 5.75 that we’re talking about, but it will sort of remain to be seen.
Anthony Paolone:
Okay, but that sounds like that should be the general zip code we’re thinking about for your activity in 2020. Is that fair?
Brendan Mullinix:
Yes.
Anthony Paolone:
All right. And then just one final question. You show the pie chart in the supplemental around the escalations built into your leases. What does that look like when you roll it up in terms of just contractually across the portfolio?
Beth Boulerice:
The average escalation rate is about 2%. Is that where you’re getting at?
Anthony Paolone:
Yes. Is that kind of where those pieces of the pie roll up to?
Beth Boulerice:
Right, exactly.
Anthony Paolone:
Okay. That’s all I have. Thank you.
T. Wilson Eglin:
Thanks, Tony.
| 8 |
Operator:
Our next question comes from Sheila McGrath from Evercore ISI. Please go ahead with your question.
Sheila McGrath:
Yes. Good morning. Will, you mentioned re-categorizing the company to the industrial category. Just wondering if you still plan on focusing exclusively on single tenant industrial, not multitenant? And how you think about length of lease term and credit, are you more focused on longer lease term and investment grade tenants for acquisitions?
T. Wilson Eglin:
Sure. We have been focused more on longer leases and higher grade credit recently. But if you look at what we’ve done in the last 12 months, it’s been – we’ve invested in some things with shorter lease duration that we think will turn out very well. The identity of the company is clearly in the single tenant industrial area. That doesn’t mean we wouldn’t buy a building with a couple of large tenants in it. It also doesn’t mean that we wouldn’t buy a building with one substantial tenant and some vacancy where we’re confident about the leasing outcomes. But we’re very committed to the single tenant industrial area. That’s the strength of the franchise.
Sheila McGrath:
Okay, great. And then could you give us more detail on the developments? Are these speculative or build to suite and what kind of stabilized returns on costs you’re forecasting?
Brendan Mullinix:
Sure. I’ll take that. The development activity that we announced I guess separating them, the ETNA East land acquisition which is an expansion of our original ETNA project, that project is really going to be around build to suite. And then the two other projects that we announced this quarter, a project in Atlanta which is underway and the planned project in the Rickenbacker submarket of Columbus, those two would be [indiscernible] projects. And in those cases, starting with Atlanta, those were joint ventures at the project level. We’re targeting development yields around 6%. And in the Rickenbacker project, we’re targeting investment yields around 7.
Sheila McGrath:
Okay. And one last question. The capital expenditure guidance that you outlined, is it possible to roughly give us how much is from the office part of the portfolio versus the industrial?
Beth Boulerice:
Yes, sure, Sheila. Primarily it is in the office area. And when we talk about the additional 10 million to 12 million in that area, it’s mainly I would say about 85% in the office.
Sheila McGrath:
Okay, great. Thank you.
| 9 |
Operator:
Our next question comes from John Guinee from Stifel. Please go ahead with your question.
John Guinee:
Great. Thank you. Nice quarter. Nice guidance. First a big picture question. You guys are in One Penn Plaza which I think Vornado is renaming Penn One. I know you’re upset that Kmart’s moving out of 131,000 square feet in your lower level shortly – you found another place?
T. Wilson Eglin:
We’re looking.
John Guinee:
Okay. Question, what do you think of that renovation, what do you think about your – what are you willing to pay in that building once they’ve turned it into a Class A property in that market?
T. Wilson Eglin
I think that Vornado’s plans here around Penn are fantastic and likely to be highly successful. It may take a little bit of time to play out, but what they’re doing here is tremendous and will surely drive rents well higher than what we’re currently paying. So we’re looking at other occupancy alternatives for us so that we can stay in Manhattan, but be at a lower price point. But we have five years to go on our lease at a very, very inexpensive rate relative to market.
John Guinee:
Great. Okay. And then looking at your investments, acquisitions, Chicago looks like about $47 a square foot, Greenville and Spartanburg $72 a square, $85 a square, $88 a square. Obviously $47 shouldn’t concern anybody but getting up in the 70s to 80s in Greenville-Spartanburg seems a little high. Does it really cost that much to build in that part of the world?
Brendan Mullinix:
This is Brendan. I guess the first thing I should say the Chicago portfolio was three closings, so two of the properties in that portfolio closed in the first quarter. So on average that portfolio was around $65 a foot, I think it was $64 a foot. So the one that closed in fourth quarter was a little bit older building with low clear height, John, which I think explains the price point.
John Guinee:
Got you.
Brendan Mullinix:
But with new construction we are seeing building cost increase. Some of the cost that – some of the other acquisition activity that we referenced were fairly brand new buildings. So some of those is newer, but there is – in our market there is a premium to lease assets relative to construction cost for sure.
John Guinee:
Great. Thank you.
| 10 |
T. Wilson Eglin:
Thanks, John.
Operator:
Our next question comes from John Massocca from Landenburg Thalmann. Please go ahead with your question.
John Massocca:
Good morning.
Beth Boulerice:
Good morning.
John Massocca:
How should we think about timing for a sale of the Dow Chemical property if you guys go through a fully marketed process for that disposition?
Lara Johnson:
Yes, there’s quite an appetite – this is Lara. Good morning. There’s quite an appetite for longer term leases with investment grade credit and that certainly falls into that category. So we don’t expect if we go to market to have a particularly protracted process. Generally once marketing materials are developed and an asset is launched, we would be in the market for roughly 30 days, go through call for our first process with multiple rounds we expect on an asset of that quality. And essentially execute in 90 days or so or less.
John Massocca:
Okay. And maybe I guess what would kind of prevent that from happening essentially tomorrow? You’re still going through and kind of looking over potential off-market expressions of interests or --?
Lara Johnson:
Yes, we are. We’ve had significant off-market interest in the asset. It is encumbered by a significant amount of debt as you likely know. So we are talking both to buyers who would buy free clear and to folks who would be interested in acquiring it as encumbered and an assignment of the debt.
John Massocca:
Okay, understood. And then on 1701 Market Street, has there been any kind of changes in your thought process in terms of potentially selling that asset or kind of what your long-term plan is there?
Lara Johnson:
We do have a fair amount of term left on the lease there now on the office component. As you would expect, there’s been significant interest in the market relative to what our plans are for that asset. But we are evaluating numerous options and opportunities there, but we expect to firm up over the next quarter or two. So TBD what will happen with that asset this year, but significant interest out there in it.
| 11 |
John Massocca:
Okay. And then lastly, excuse me if I missed this, with ODW in Columbus, what is kind of the general – your general view on where those rents are going to be on a potential renewal versus kind of current rents?
James Dudley:
We think our rent is below market. But since we’re in negotiation with the tenant, we don’t want to sort of negotiate against ourselves in a public context. But I think the rent is inexpensive and hopefully we can renew the lease and raise the rents.
John Massocca:
Okay. That’s it from me. Thank you very much.
Operator:
[Operator Instructions]. Our next question is a follow up from John Guinee from Stifel. Please go ahead with your follow up.
John Guinee:
I forgot to ask, Cummins in Columbus, Indiana, wasn’t that – didn’t they have a $5 million purchase option?
T. Wilson Eglin
They did.
John Guinee:
And were they the ones who are paying 47 million or somebody else?
T. Wilson Eglin:
They purchased the building from us.
John Guinee:
Nicely done.
T. Wilson Eglin:
Thank you.
Operator:
[Operator Instructions]. And ladies and gentlemen, at this time I’m showing no additional questions. I’d like to turn the conference call back over to management for any closing remarks.
| 12 |
T. Wilson Eglin:
We appreciate all of you joining us this morning. Please visit our Web site or contact Heather Gentry if you would like to receive our quarterly materials. And in addition as always, you may contact me or the other members of senior management with any questions. Thanks again for joining the call.
Operator:
Ladies and gentlemen, that does end today’s conference call. We do thank you for joining today’s presentation. You may now disconnect your lines.
| 13 |
Serious News for Serious Traders! Try StreetInsider.com Premium Free!
You May Also Be Interested In
- International Truck Integrates Allison Fully Automatic Transmissions with S13 Engine
- Renesas Announces Consolidated Forecasts
- Blackwell 3D Launches New Website, Eyes Project Development
Create E-mail Alert Related Categories
SEC FilingsSign up for StreetInsider Free!
Receive full access to all new and archived articles, unlimited portfolio tracking, e-mail alerts, custom newswires and RSS feeds - and more!
