

Form 8-K Kennedy-Wilson Holdings, For: May 05
 Tweet
Tweet Share
Share
1
Kennedy-Wilson Holdings, Inc.
Supplemental Financial Information
For the Quarter Ended March 31, 2021
TABLE OF CONTENTS
Earnings Release | ||||||||
News Release | ||||||||
Consolidated Balance Sheets (unaudited) | ||||||||
Consolidated Statements of Operations (unaudited) | ||||||||
Non-GAAP Metrics (unaudited) | ||||||||
| Supplemental Financial Information (unaudited) | ||||||||
Capitalization Summary | ||||||||
| Components of Value | ||||||||
Components of Value Summary | ||||||||
Segment Investment Summary | ||||||||
Multifamily Portfolio | ||||||||
| Office Portfolio | ||||||||
| Retail and Industrial Portfolio | ||||||||
Hotel, Loans, Residential and Other Investment Portfolio | ||||||||
Lease-up Portfolio and Development Projects | ||||||||
Debt Schedule | ||||||||
Investment Management | ||||||||
| Other Portfolio and Financial Information | ||||||||
Same Property - Multifamily | ||||||||
Investment Transactions | ||||||||
EBITDA by Segment (Non-GAAP) | ||||||||
Pro-rata Financial Information | ||||||||
Appendix | ||||||||
Certain terms used in this release are defined below under the caption "Common Definitions". Certain information included in
this release constitutes non-GAAP financial measures. For a definition of the non-GAAP financial measures used in this release, see "Common Definitions" below, and for a reconciliation of those measures to their most comparable GAAP measure, see the tables set forth in the Company's supplemental financial information available at www.kennedywilson.com.
 | |||||
| Contact: Daven Bhavsar, CFA | |||||
| Vice President of Investor Relations | |||||
| (310) 887-3431 | |||||
| dbhavsar@kennedywilson.com | 151 S. El Camino Drive | ||||
| www.kennedywilson.com | Beverly Hills, CA 90212 | ||||
NEWS RELEASE
KENNEDY WILSON REPORTS FIRST QUARTER 2021 RESULTS
BEVERLY HILLS, Calif. (May 5, 2021) - Kennedy-Wilson Holdings, Inc. (NYSE: KW) today reported results for 1Q-2021:
| 1Q | |||||||||||
| (Amounts in millions, except per share data) | 2021 | 2020 | |||||||||
| GAAP Results | |||||||||||
GAAP Net Loss to Common Shareholders1 | ($5.6) | ($9.9) | |||||||||
| Per Diluted Share | (0.04) | (0.07) | |||||||||
| Non-GAAP Results | |||||||||||
| Adjusted EBITDA | $127.6 | $112.0 | |||||||||
Adjusted Net Income1 | 47.0 | 44.8 | |||||||||
1 Includes $15 million of loss on early extinguishment of debt in 1Q-21 and $0 in 1Q-20
"The first quarter was highlighted by a 14% increase to Adjusted EBITDA, continued growth of our investment management business and the completion of two unsecured bond transactions that will result in $18 million of annual interest savings and further improved our bond maturity profile" said William McMorrow, Chairman and CEO of Kennedy Wilson. "Armed with strong liquidity, we have an extremely robust investment and leasing pipeline that we expect will help drive further near-term growth in our NOI and fee-bearing capital."
1Q Highlights
•14% Increase to 1Q-21 Adjusted EBITDA to $128 million (vs. $112 million in 1Q-20):
◦KW's share of gains from the sale of real estate1, increases in fair values and promotes totaled $70 million in 1Q-21 , an increase of $30 million from 1Q-20.
◦KW's share of recurring property NOI, loan income, and fees1 totaled $97 million in 1Q-21, a decrease of $12 million from 1Q-20, primarily due to planned asset sales and the COVID-19 impact to hotel operations and reserves for bad debt.
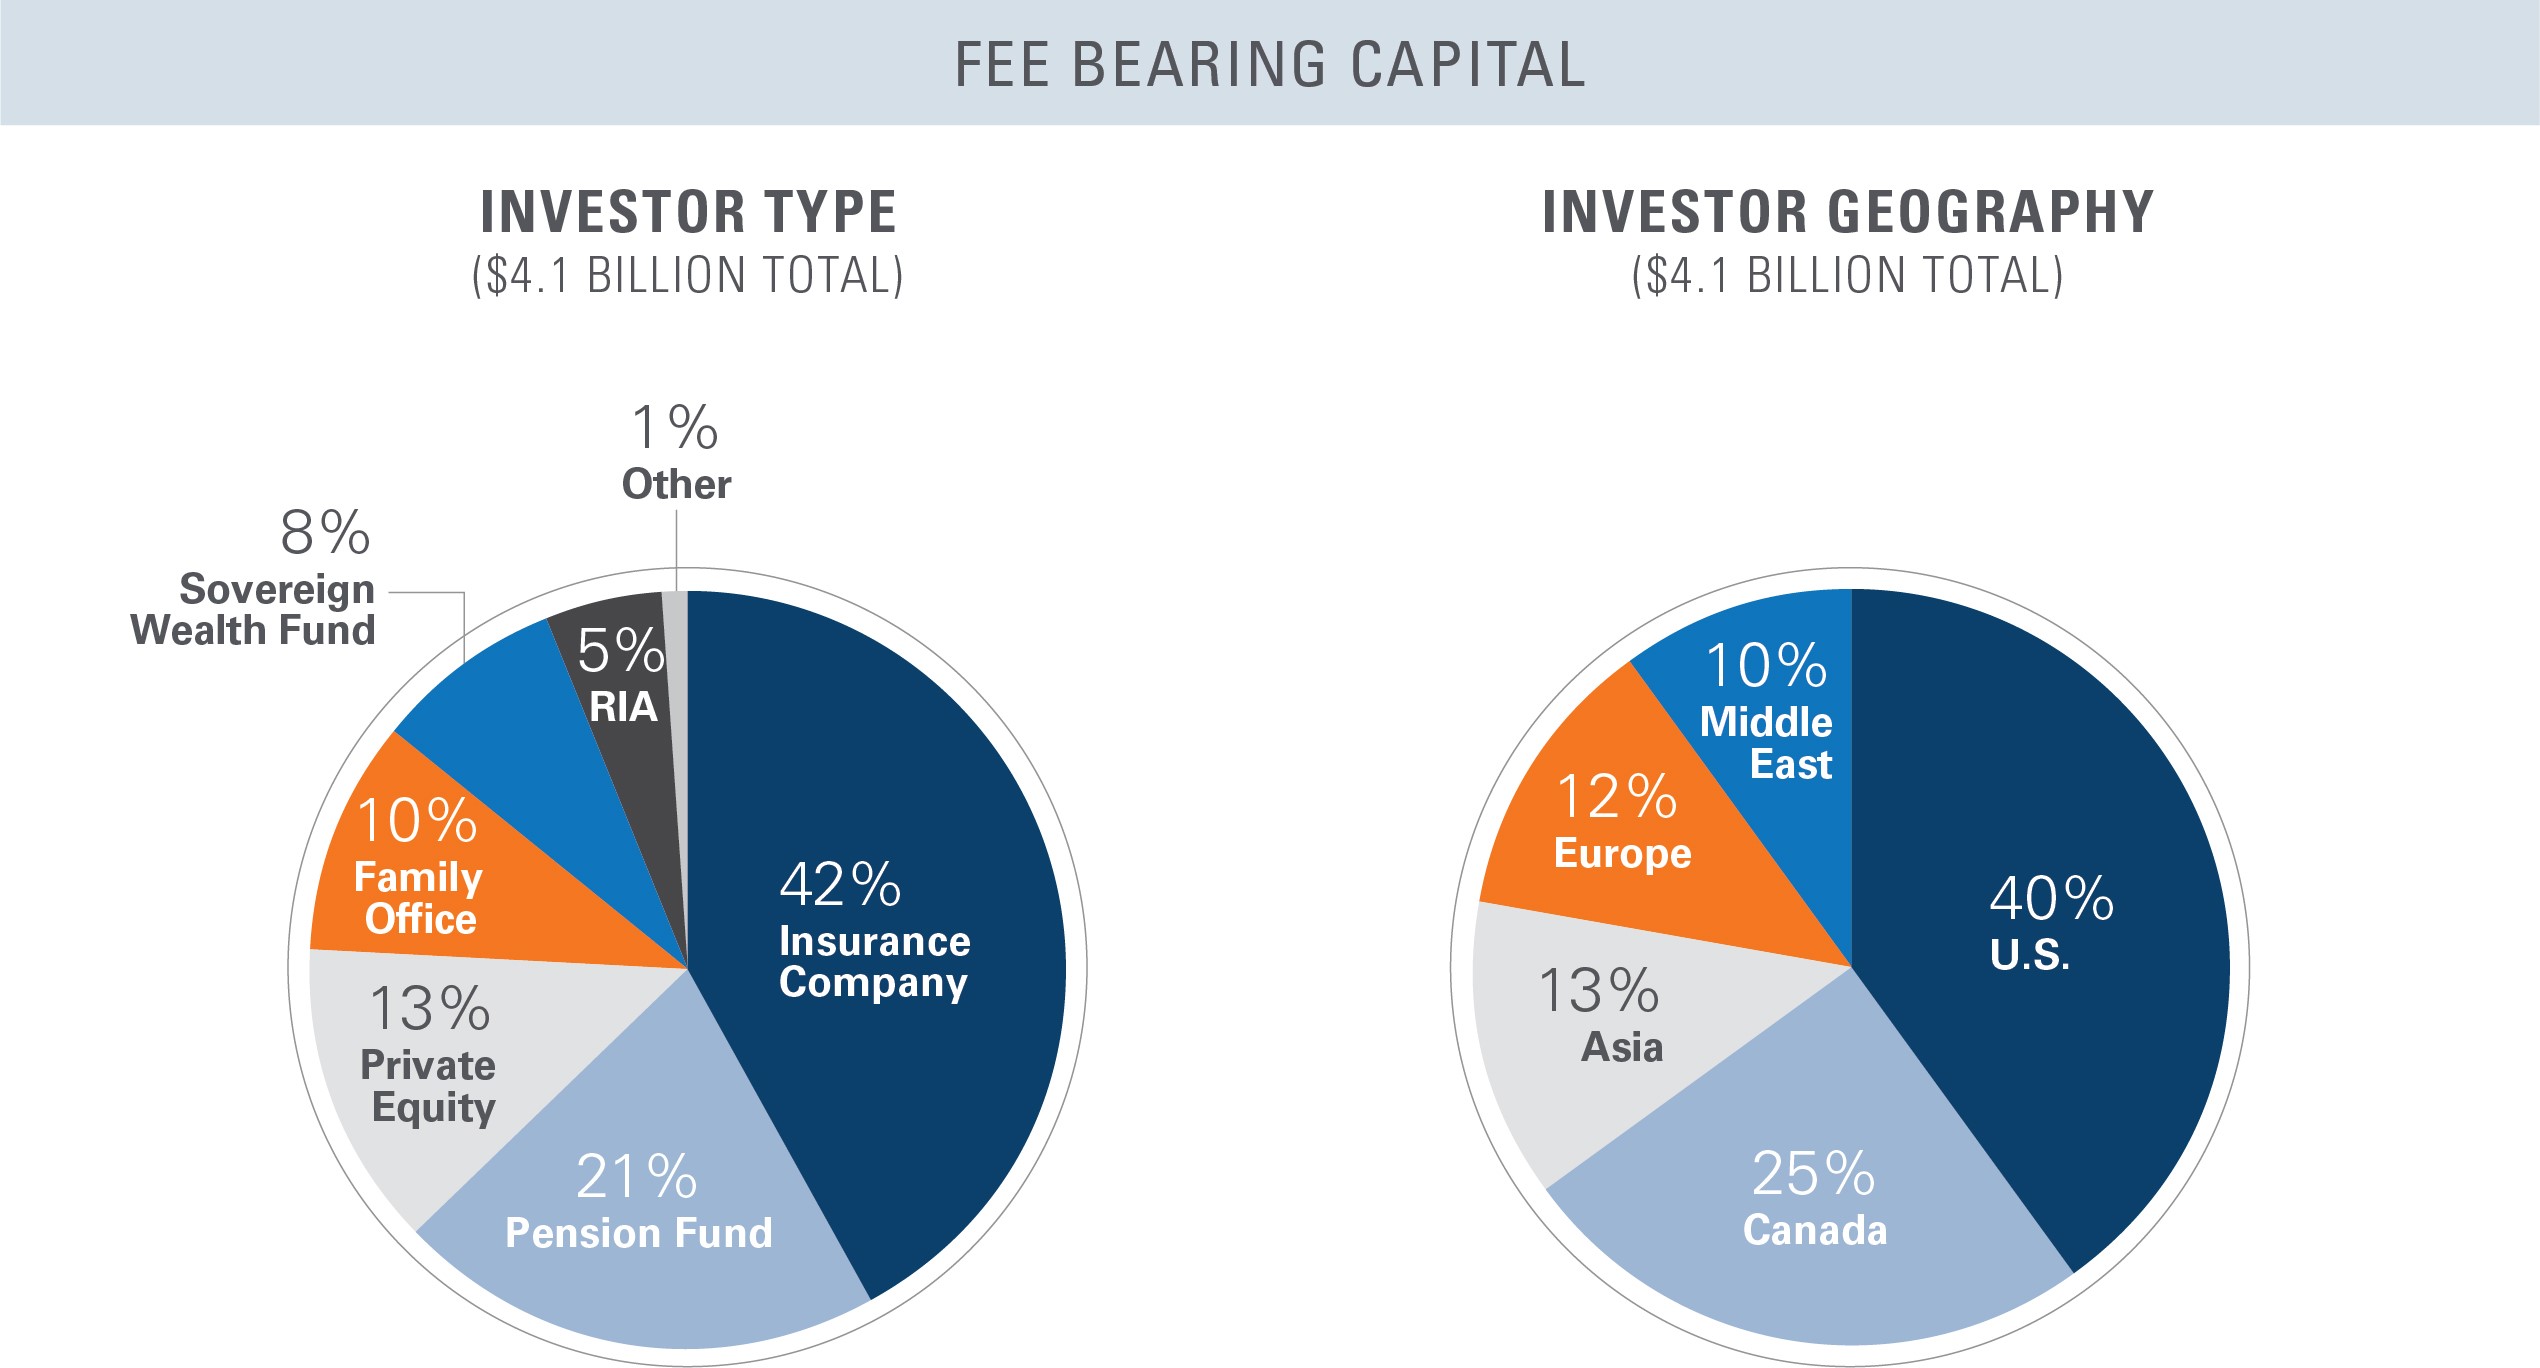
•5% Growth in Fee-Bearing Capital: Fee-Bearing Capital totaled $4.1 billion as of March 31, 2021, a 5% increase from YE-20 and an 86% increase from 4Q-18. Fee-Bearing Capital increased by $245 million due to new investments and commitments, offset by $94 million primarily due to asset dispositions. In addition, as of March 31, 2021, the Company has approximately $2.0 billion in
3
additional non-discretionary capital with certain strategic partners that is available for investment. If invested, these amounts will be added to Fee-Bearing Capital.
•17% Growth in U.S. Debt Platform: Completed loan investments totaling $137 million in 1Q-21, resulting in 17% growth of our debt platform. The Company has a 9% ownership in its debt platform, which totals $928 million of assets and $846 million of Fee-Bearing Capital as of quarter-end.
•89% Growth in European Logistics Platform: Acquired $209 million in logistics assets in 1Q-21, resulting in an additional $67 million in Fee-Bearing Capital. The Company has a 20% ownership in its logistics platform, which totals $444 million of assets and $142 million of Fee-Bearing Capital as of 1Q-21.
•In-Place Estimated Annual NOI of $389 Million; 82% of which is Multifamily and Office:
◦Stabilized The Clara Phase 1, 38° North Phase 1, 400/430 California, and The View by Vintage, which added approximately $6 million in Estimated Annual NOI.
◦Post quarter-end, the Company has $640 million in gross investment transactions that have either closed or are under contract. If completed, these transactions are expected to add a net $9 million of Estimated Annual NOI to KW in 2Q-21, resulting in a pro-forma Estimated Annual NOI of $398 million.
◦The Company's development and lease-up portfolio now totals 3,938 multifamily units, 2.3 million commercial square feet, and one hotel.
•Multifamily and Office Same Property Performance1:
| 1Q - 2021 vs. 1Q - 2020 | |||||||||||||||||
| Occupancy | Revenue | NOI | |||||||||||||||
| Multifamily - Market Rate | 0.6% | (2.1)% | (4.6)% | ||||||||||||||
| Multifamily - Affordable | —% | 2.0% | 1.2% | ||||||||||||||
| Office | (1.2)% | 10.3% | 12.9% | ||||||||||||||
| Total | 2.0% | 2.1% | |||||||||||||||
1 Excludes minority-held investments and includes $1.7 million of COVID-19 related bad debt reserves in 1Q-21 (2% of same-property rents).
•1Q-21 Rent Collections: The following is a summary of KW's share of contractual cash rent collections for 1Q-21:
| Asset Class | 1Q-21 Rent Collections | % of Billed Rents | ||||||
| Multifamily | 96% | 57% | ||||||
| Office | 99% | 31% | ||||||
| Retail | 71% | 11% | ||||||
| Industrial | 88% | 1% | ||||||
| Total | 94% | 100% | ||||||
1Q-21 Investment Activity
•Capital Investment: Invested $129 million of cash, allocating 52% to capex and development initiatives, 39% to new investments, and 9% to share repurchases.
•New Investments: Completed $377 million of property acquisitions and loan originations, of which KW's share was $56 million.
4
•Disposition Activity: Completed $556 million of dispositions, of which KW's share was $270 million. The dispositions generated net cash proceeds of $175 million to KW. The following key disposition was completed in 1Q-21:
◦The Company sold Friars Bridge Court, a wholly-owned 103,000 square foot office property located in London, UK, for $220 million (£160 million), generating a net gain on sale of $65 million (including a one-time $8 million reduction to rental income)1.
Balance Sheet and Capital Markets
•$1.1 billion in Cash and Lines of Credit: Pro forma for the two unsecured debt paydowns described below, Kennedy Wilson had total pro forma consolidated cash and cash equivalents of $644 million(2) and $450 million of capacity on its $500 million revolving line of credit.
•Unsecured Debt Transactions Result in $18 million of Annual Interest Savings:
◦During the quarter, the Company issued $1.2 billion of principal amount of unsecured notes. The bonds were issued in two separate tranches, $600 million aggregate principal amount of 4.75% senior notes due 2029 and $600 million aggregate principal amount at 5.00% due 2031, with a combined effective interest rate of 4.826%. The proceeds were used to fully redeem all of the Company's $1.15 billion in principal amount of its 5.875% unsecured notes due April 2024, including $573 million of principal repaid in 2Q-21.
◦Post quarter-end, the Company completed a redemption of $207 million (£150 million) of its 3.95% sterling-denominated Kennedy Wilson Europe unsecured bonds due 2022 ("KWE notes"), with $303 million remaining. In total, the Company has redeemed $387 million (£280 million) or 56% of the initial $690 million (£500 million) KWE notes.
◦As a result of these two transactions, the Company expects to save $18 million in annual interest. The Company used total cash of $794 million in Q2 in connection with the redemption of the 2024 notes and the KWE notes. The Company recognized a one-time loss on early extinguishment of debt of $15 million in 1Q-21 and with a further $21 million expected in 2Q-21, composed of prepayment penalties and the non-cash write-off of unamortized deferred financing costs and debt discounts.
•Improving Debt Profile: Pro forma for the two unsecured debt transactions described above, Kennedy Wilson's share of debt had a pro forma weighted average interest rate of 3.5% per annum vs. 3.7% in 4Q-20 and a pro forma weighted-average maturity of 5.9 years vs. 4.1 years as of 4Q-20.
•Share Repurchase Program(3): In 1Q-21, Kennedy Wilson repurchased 0.7 million shares for $12 million at a weighted-average price of $17.73 per share. As of March 31, 2021, the Company had $245 million remaining available under its $500 million share repurchase plan. Since the launch of the plan in March 2018, the Company has repurchased 14.3 million shares for $255 million at a weighted-average price of $17.90 per share.
5
Subsequent Events
The Company has either closed or is under contract on the following investment transactions:
•Completed 7 real estate acquisitions and loan originations for $368 million ($112 million at KW share)
•Under contract to acquire 5 real estate and loan investments for $146 million ($61 million at KW share)
•Under contract to sell 3 real estate investments for $126 million ($9 million at KW share).
•If completed, these transactions are expected to add $9 million of Estimated Annual NOI to KW in 2Q-21, resulting in a pro-forma Estimated Annual NOI of $398 million.
Subsequent to quarter-end, the Company drew $100 million on its revolving line of credit, with $350 million of availability remaining.
_____________________________________________________________________________________
Footnotes
(1) In 1Q-21, the Company recognized a one-time $8 million straight-line rent receivable write off to rental income related to the disposition of Friars Bridge Court. The Company has excluded this amount from its recurring property NOI and included as a reduction to the Company's share of gains from the sale of real estate.
(2) Represents consolidated cash and includes $83 million of restricted cash, which is included in cash and cash equivalents. The Company's share of cash, including unconsolidated joint-ventures, totals $740 million. The amounts shown are pro-forma for the repayments described in the Unsecured Debt Transactions above.
(3) Future purchases under the program may be made in the open market, in privately negotiated transactions, through the net settlement of the company's restricted stock grants or otherwise, with the amount and timing of the repurchases dependent on market conditions and subject to the Company's discretion. The program does not obligate the Company to repurchase any specific number of shares and, subject to compliance with applicable laws, may be suspended or terminated at any time without prior notice.
Conference Call and Webcast Details
Kennedy Wilson will hold a live conference call and webcast to discuss results at 7:00 a.m. PT/ 10:00 a.m. ET on Thursday, May 6. The direct dial-in number for the conference call is (844) 340-4761 for U.S. callers and (412) 717-9616 for international callers. A replay of the call will be available for one week beginning one hour after the live call and can be accessed by (877) 344-7529 for U.S. callers and (412) 317-0088 for international callers. The passcode for the replay is 10154188.
6
The webcast will be available at: https://services.choruscall.com/links/kw210506uS6eIgBe.html. A replay of the webcast will be available one hour after the original webcast on the Company’s investor relations web site for three months.
About Kennedy Wilson
Kennedy Wilson (NYSE:KW) is a leading global real estate investment company. We own, operate, and invest in real estate both on our own and through our investment management platform. We focus on multifamily and office properties located in the Western U.S., UK, and Ireland. For further information on Kennedy Wilson, please visit www.kennedywilson.com.
7
Kennedy-Wilson Holdings, Inc.
Consolidated Balance Sheets
(Unaudited)
(Dollars in millions)
| March 31, 2021 | December 31, 2020 | |||||||||||||
| Assets | ||||||||||||||
Cash and cash equivalents(1) | $ | 1,438.6 | $ | 965.1 | ||||||||||
| Accounts receivable | 46.3 | 47.9 | ||||||||||||
Real estate and acquired in place lease values (net of accumulated depreciation and amortization of $841.2 and $815.0) | 4,562.7 | 4,720.5 | ||||||||||||
Unconsolidated investments (including $1,157.8 and $1,136.5 at fair value) | 1,311.0 | 1,289.3 | ||||||||||||
| Other assets | 191.4 | 199.1 | ||||||||||||
| Loan purchases and originations | 98.5 | 107.1 | ||||||||||||
| Total assets | $ | 7,648.5 | $ | 7,329.0 | ||||||||||
| Liabilities | ||||||||||||||
| Accounts payable | $ | 15.6 | $ | 30.1 | ||||||||||
| Accrued expenses and other liabilities | 479.3 | 531.7 | ||||||||||||
| Mortgage debt | 2,555.3 | 2,589.8 | ||||||||||||
KW unsecured debt(1) | 1,799.8 | 1,332.2 | ||||||||||||
KWE unsecured bonds(1) | 1,152.2 | 1,172.5 | ||||||||||||
| Total liabilities | 6,002.2 | 5,656.3 | ||||||||||||
| Equity | ||||||||||||||
| Cumulative perpetual preferred stock | 295.2 | 295.2 | ||||||||||||
| Common stock | — | — | ||||||||||||
| Additional paid-in capital | 1,718.6 | 1,725.2 | ||||||||||||
| (Accumulated deficit) retained earnings | (18.9) | 17.7 | ||||||||||||
| Accumulated other comprehensive loss | (377.1) | (393.6) | ||||||||||||
| Total Kennedy-Wilson Holdings, Inc. shareholders’ equity | 1,617.8 | 1,644.5 | ||||||||||||
| Noncontrolling interests | 28.5 | 28.2 | ||||||||||||
| Total equity | 1,646.3 | 1,672.7 | ||||||||||||
| Total liabilities and equity | $ | 7,648.5 | $ | 7,329.0 | ||||||||||
(1) During April 2021, the Company paid down $573.1 million in principal of its KW unsecured debt, and $207.0 million in principal of its KWE unsecured bonds.
8
Kennedy-Wilson Holdings, Inc.
Consolidated Statements of Operations
(Unaudited)
(Dollars in millions, except share amounts and per share data)
| Three Months Ended March 31, | ||||||||||||||
| 2021 | 2020 | |||||||||||||
| Revenue | ||||||||||||||
| Rental | $ | 88.9 | $ | 107.7 | ||||||||||
| Hotel | 0.8 | 7.2 | ||||||||||||
| Investment management and property services fees | 8.1 | 8.4 | ||||||||||||
| Loans and other | 1.6 | — | ||||||||||||
| Total revenue | 99.4 | 123.3 | ||||||||||||
| Expenses | ||||||||||||||
| Rental | 33.0 | 36.7 | ||||||||||||
| Hotel | 1.6 | 6.0 | ||||||||||||
| Commission and marketing | 0.3 | 0.7 | ||||||||||||
Compensation and related (includes $7.7 and $8.6 of share-based compensation) | 34.7 | 31.4 | ||||||||||||
| General and administrative | 6.8 | 9.5 | ||||||||||||
| Depreciation and amortization | 44.4 | 45.5 | ||||||||||||
| Total expenses | 120.8 | 129.8 | ||||||||||||
Income from unconsolidated investments, net of depreciation and amortization | 18.4 | 10.9 | ||||||||||||
| Gain on sale of real estate, net | 73.5 | 44.2 | ||||||||||||
| Transaction-related expenses | — | — | ||||||||||||
| Interest expense | (51.6) | (48.8) | ||||||||||||
| Loss on early extinguishment of debt | (14.8) | — | ||||||||||||
| Other (loss) income | (3.0) | — | ||||||||||||
| Income (loss) before provision for income taxes | 1.1 | (0.2) | ||||||||||||
| Provision for income taxes | (2.7) | (5.7) | ||||||||||||
| Net loss | (1.6) | (5.9) | ||||||||||||
| Net loss attributable to noncontrolling interests | 0.3 | 0.3 | ||||||||||||
Preferred dividends | (4.3) | (4.3) | ||||||||||||
| Net loss income attributable to Kennedy-Wilson Holdings, Inc. common shareholders | $ | (5.6) | $ | (9.9) | ||||||||||
Basic and diluted loss per share(1) | ||||||||||||||
| Loss per basic and diluted | $ | (0.04) | $ | (0.07) | ||||||||||
| Weighted average shares outstanding for basic and diluted | 138,772,819 | 140,210,705 | ||||||||||||
| Dividends declared per common share | $ | 0.22 | $ | 0.22 | ||||||||||
(1) Includes impact of the Company allocating income and dividends per basic and diluted share to participating securities.
9
Kennedy-Wilson Holdings, Inc.
Adjusted EBITDA
(Unaudited)
(Dollars in millions)
The table below reconciles net income attributable to Kennedy-Wilson Holdings, Inc. common shareholders to Adjusted EBITDA, using Kennedy Wilson’s pro-rata share amounts for each adjustment item.
| Three Months Ended | ||||||||||||||
| March 31, | ||||||||||||||
| 2021 | 2020 | |||||||||||||
| Net loss attributable to Kennedy-Wilson Holdings, Inc. common shareholders | $ | (5.6) | $ | (9.9) | ||||||||||
| Non-GAAP adjustments: | ||||||||||||||
Add back (Kennedy Wilson's Share)(1): | ||||||||||||||
| Interest expense | 58.8 | 56.1 | ||||||||||||
| Loss on early extinguishment of debt | 14.8 | — | ||||||||||||
Depreciation and amortization | 44.9 | 46.1 | ||||||||||||
| Provision for income taxes | 2.7 | 6.8 | ||||||||||||
| Preferred dividends | 4.3 | 4.3 | ||||||||||||
| Share-based compensation | 7.7 | 8.6 | ||||||||||||
| Adjusted EBITDA | $ | 127.6 | $ | 112.0 | ||||||||||
(1) See Appendix for reconciliation of Kennedy Wilson's Share amounts.
The table below provides a detailed reconciliation of net income to Adjusted EBITDA.
| Three Months Ended | ||||||||||||||
| March 31, | ||||||||||||||
| 2021 | 2020 | |||||||||||||
| Net loss | $ | (1.6) | $ | (5.9) | ||||||||||
| Non-GAAP adjustments: | ||||||||||||||
| Add back: | ||||||||||||||
| Interest expense | 51.6 | 48.8 | ||||||||||||
| Loss on early extinguishment of debt | 14.8 | — | ||||||||||||
Kennedy Wilson's share of interest expense included in unconsolidated investments | 7.9 | 8.1 | ||||||||||||
| Depreciation and amortization | 44.4 | 45.5 | ||||||||||||
Kennedy Wilson's share of depreciation and amortization included in unconsolidated investments | 1.7 | 1.7 | ||||||||||||
| Provision for income taxes | 2.7 | 5.7 | ||||||||||||
| Kennedy Wilson's share of taxes included in unconsolidated investments | — | 1.1 | ||||||||||||
| Share-based compensation | 7.7 | 8.6 | ||||||||||||
EBITDA attributable to noncontrolling interests(1) | (1.6) | (1.6) | ||||||||||||
| Adjusted EBITDA | $ | 127.6 | $ | 112.0 | ||||||||||
(1) EBITDA attributable to noncontrolling interest includes $1.2 million and $1.1 million of depreciation and amortization, $0.7 million and $0.8 million of interest, and $0.0 million and $0.0 million of taxes, for the three months ended March 31, 2021 and 2020, respectively.
10
Kennedy-Wilson Holdings, Inc.
Adjusted Net Income
(Unaudited)
(Dollars in millions, except share data)
The table below reconciles net income attributable to Kennedy-Wilson Holdings, Inc. common shareholders to Adjusted Net Income, using Kennedy Wilson’s pro-rata share amounts for each adjustment item.
| Three Months Ended | ||||||||||||||
| March 31, | ||||||||||||||
| 2021 | 2020 | |||||||||||||
| Net loss attributable to Kennedy-Wilson Holdings, Inc. common shareholders | $ | (5.6) | $ | (9.9) | ||||||||||
| Non-GAAP adjustments: | ||||||||||||||
Add back (Kennedy Wilson's Share)(1): | ||||||||||||||
| Depreciation and amortization | 44.9 | 46.1 | ||||||||||||
| Share-based compensation | 7.7 | 8.6 | ||||||||||||
| Adjusted Net Income | $ | 47.0 | $ | 44.8 | ||||||||||
| Weighted average shares outstanding for diluted | 138,772,819 | 140,210,705 | ||||||||||||
(1) See Appendix for reconciliation of Kennedy Wilson's Share amounts.
The table below provides a detailed reconciliation of net income to Adjusted Net Income.
| Three Months Ended | ||||||||||||||
| March 31, | ||||||||||||||
| 2021 | 2020 | |||||||||||||
| Net loss | $ | (1.6) | $ | (5.9) | ||||||||||
| Non-GAAP adjustments: | ||||||||||||||
| Add back (less): | ||||||||||||||
| Depreciation and amortization | 44.4 | 45.5 | ||||||||||||
Kennedy Wilson's share of depreciation and amortization included in unconsolidated investments | 1.7 | 1.7 | ||||||||||||
| Share-based compensation | 7.7 | 8.6 | ||||||||||||
| Preferred dividends | (4.3) | (4.3) | ||||||||||||
Net income attributable to the noncontrolling interests, before depreciation and amortization(1) | (0.9) | (0.8) | ||||||||||||
| Adjusted Net Income | $ | 47.0 | $ | 44.8 | ||||||||||
| Weighted average shares outstanding for diluted | 138,772,819 | 140,210,705 | ||||||||||||
(1) Includes $1.2 million and $1.1 million of depreciation and amortization for the three months ended March 31, 2021 and 2020, respectively.
11
Forward-Looking Statements
Statements made by us in this report and in other reports and statements released by us that are not historical facts constitute "forward-looking statements" within the meaning of Section 27A of the Securities Act of 1933, as amended, and Section 21E of the Securities Exchange Act of 1934, as amended. These forward-looking statements are necessarily estimates reflecting the judgment of our senior management based on our current estimates, expectations, forecasts and projections and include comments that express our current opinions about trends and factors that may impact future operating results. Disclosures that use words such as "believe," "anticipate," "estimate," "intend," "may," "could," "plan," "expect," "project" or the negative of these, as well as similar expressions, are intended to identify forward-looking statements. These statements are not guarantees of future performance, rely on a number of assumptions concerning future events, many of which are outside of our control, and involve known and unknown risks and uncertainties that could cause our actual results, performance or achievement, or industry results, to differ materially from any future results, performance or achievements expressed or implied by such forward-looking statements. These risks and uncertainties may include the factors and the risks and uncertainties described elsewhere in this report and other filings with the Securities and Exchange Commission (the "SEC"), including the Item 1A. "Risk Factors" sections of each our Annual Report on Form 10-K for the year ended December 31, 2020, as amended by our subsequent filings with the SEC. Any such forward-looking statements, whether made in this report or elsewhere, should be considered in the context of the various disclosures made by us about our businesses including, without limitation, the risk factors discussed in our filings with the SEC. Except as required under the federal securities laws and the rules and regulations of the SEC, we do not have any intention or obligation to update publicly any forward-looking statements, whether as a result of new information, future events, changes in assumptions, or otherwise.
Common Definitions
· “KWH,” "KW," “Kennedy Wilson,” the "Company," "we," "our," or "us" refers to Kennedy-Wilson Holdings, Inc. and its wholly-owned subsidiaries.
· “Adjusted EBITDA” represents net income (loss) before interest expense, loss on early extinguishment of debt, our share of interest expense included in investments in unconsolidated investments, (benefit from) provision for income taxes, depreciation and amortization, our share of depreciation and amortization included in income from unconsolidated investments, share-based compensation and EBITDA attributable to noncontrolling interests.
Please also see the reconciliation to GAAP in the Company’s supplemental financial information included in this release and also available at www.kennedywilson.com. Our management uses Adjusted EBITDA to analyze our business because it adjusts net income for items we believe do not accurately reflect the nature of our business going forward or that relate to non-cash compensation expense or noncontrolling interests. Such items may vary for different companies for reasons unrelated to overall operating performance. Additionally, we believe Adjusted EBITDA is useful to investors to assist them in getting a more accurate picture of our results from operations. However, Adjusted EBITDA is not a recognized measurement under GAAP and when analyzing our operating performance, readers should use Adjusted EBITDA in addition to, and not as an alternative for, net income as determined in accordance with GAAP. Because not all companies use identical calculations, our presentation of Adjusted EBITDA may not be comparable to similarly titled measures of other companies. Furthermore, Adjusted EBITDA is not intended to be a measure of free cash flow for our management’s discretionary use, as it does not remove all non-cash items (such as acquisition-related gains) or consider certain cash requirements such as tax and debt service payments. The amount shown for Adjusted EBITDA also differs from the amount calculated under similarly titled definitions in our debt instruments, which are further adjusted to reflect certain other cash and non-cash charges and are used to determine compliance with financial covenants and our ability to engage in certain activities, such as incurring additional debt and making certain restricted payments.
12
· "Adjusted Fees" refers to Kennedy Wilson’s gross investment management and property services fees adjusted to include Kennedy Wilson's share of fees eliminated in consolidation, Kennedy Wilson’s share of fees in unconsolidated service businesses and performance fees included in unconsolidated investments. Our management uses Adjusted fees to analyze our investment management and real estate services business because the measure removes required eliminations under GAAP for properties in which the Company provides services but also has an ownership interest. These eliminations understate the economic value of the investment management and property services fees and makes the Company comparable to other real estate companies that provide investment management and real estate services but do not have an ownership interest in the properties they manage. Our management believes that adjusting GAAP fees to reflect these amounts eliminated in consolidation presents a more holistic measure of the scope of our investment management and real estate services business.
· “Adjusted Net Income” represents net (loss) income before depreciation and amortization, our share of depreciation and amortization included in unconsolidated investments, share-based compensation, preferred dividends and net income attributable to noncontrolling interests, before depreciation and amortization. Please also see the reconciliation to GAAP in the Company’s supplemental financial information included in this release and also available at www.kennedywilson.com.
· “Annual Return on Loans” is a metric that applies to our real estate debt business that represents the sum of annual interest income, transaction fees and the payback of principal for discounted loan purchases, amortized over the life of the loans and divided by the principal balances of the loans.
· "Cap rate" represents the net operating income of an investment for the year preceding its acquisition or disposition, as applicable, divided by the purchase or sale price, as applicable. Cap rates set forth in this presentation only includes data from income-producing properties. We calculate cap rates based on information that is supplied to us during the acquisition diligence process. This information is not audited or reviewed by independent accountants and may be presented in a manner that is different from similar information included in our financial statements prepared in accordance with GAAP. In addition, cap rates represent historical performance and are not a guarantee of future NOI. Properties for which a cap rate is provided may not continue to perform at that cap rate.
· "Equity partners" refers to non-wholly-owned subsidiaries that we consolidate in our financial statements under U.S. GAAP and third-party equity providers.
· "Estimated Annual NOI" is a property-level non-GAAP measure representing the estimated annual net operating income from each property as of the date shown, inclusive of rent abatements (if applicable). The calculation excludes depreciation and amortization expense, bad debt expense for commercial assets, and does not capture the changes in the value of our properties that result from use or market conditions, nor the level of capital expenditures, tenant improvements, and leasing commissions necessary to maintain the operating performance of our properties. For the Company’s hotel portfolio, the Company provides a trailing-12 month NOI of $9 million, which excludes the period during which the hotel was fully closed due to restrictions related to the COVID-19 pandemic. Additionally, for assets wholly-owned and fully occupied by KW, the Company provides an estimated NOI for valuation purposes of $4 million, which includes an assumption for applicable market rents. Any of the enumerated items above could have a material effect on the performance of our properties. Also, where specifically noted, for properties purchased in 2021the last twelve months, the NOI represents the estimated Year 1 NOI from our original underwriting. Estimated year 1 NOI for properties purchased in 2021 may not be indicative of the actual results for those properties. Estimated annual NOI is not an indicator of the actual annual net operating income that the Company will or expects to realize in any period. Please also see the definition of "Net operating income" below. The Company does not provide a reconciliation for estimated annual NOI to its most directly comparable forward-looking GAAP financial measure, because it is unable to provide a meaningful or accurate estimation of each of the component reconciling items, and the information is not available without unreasonable effort. This is due to the inherent difficulty of forecasting the timing and/or amount of various items that would impact estimated annual NOI, including, for example, the sale of real estate that have not yet occurred and other items that are out of the Company’s control. For the same reasons, the Company is unable to meaningfully address the probable significance of the unavailable
13
information and believes that providing a reconciliation for estimated annual NOI would imply a degree of precision as to its forward-looking net operating income that would be confusing or misleading to investors.
· "Estimated Forward Yield on Cost” represents the Company’s estimate of future net operating income, assuming it has completed its planned value-add asset management initiatives, divided by the sum of the purchase price and additional capital expenditure costs that are expected to be incurred in accordance with the Company’s original underwriting at the time of acquisition. This information is not audited or reviewed by independent accountants and may be presented in a manner that is different from similar information included in our financial statements prepared in accordance with GAAP. Estimated Forward Yield on Cost is based on management’s current expectations and are based on assumptions that may prove to be inaccurate and involve known and unknown risks. For example, Estimated Forward Return on Cost is based in part on data made available to us during the course of our due diligence process in connection with asset acquisitions and assumes the timely and on-budget completion of our value-add initiatives, the timely leasing of all additional capacity and the absence of customer defaults or early lease terminations. Accordingly, the actual return on cost of an investment made by the Company may differ materially and adversely from the Estimated Forward Return on Cost figures set forth in this release, and we caution you not to place undue reliance on such figures. This information is not provided for development assets with no current income-producing component.
· "Fee-Bearing Capital" represents total third-party committed or invested capital that we manage in our joint-ventures and commingled funds that entitle us to earn fees, including without limitation, asset management fees, construction management fees, acquisition and disposition fees and/or promoted interest, if applicable.
· "Gross Asset Value” refers to the gross carrying value of assets, before debt, depreciation and amortization, and net of noncontrolling interests.
· "Internal Rate of Return" (“IRR”) is based on cumulative contributions and distributions to Kennedy Wilson on each investment that has been sold and is the leveraged internal rate of return on equity invested in the investment. The IRR measures the return to Kennedy Wilson on each investment, expressed as a compound rate of interest over the entire investment period. This return does take into account carried interest, if applicable, but excludes management fees, organizational fees, or other similar expenses.
· "Net operating income" or "NOI” is a non-GAAP measure representing the income produced by a property calculated by deducting certain property expenses from property revenues. Our management uses net operating income to assess and compare the performance of our properties and to estimate their fair value. Net operating income does not include the effects of depreciation or amortization or gains or losses from the sale of properties because the effects of those items do not necessarily represent the actual change in the value of our properties resulting from our value-add initiatives or changing market conditions. Our management believes that net operating income reflects the core revenues and costs of operating our properties and is better suited to evaluate trends in occupancy and lease rates. Please also see the reconciliation to GAAP in the Company’s supplemental financial information included in this release and also available at www.kennedywilson.com.
· "Noncontrolling interests" represents the portion of equity ownership in a consolidated subsidiary not attributable to Kennedy Wilson.
· "Pro-Rata" represents Kennedy Wilson's share calculated by using our proportionate economic ownership of each asset in our portfolio. Please also refer to the pro-rata financial data in our supplemental financial information.
· "Property NOI" or "Property-level NOI" is a non-GAAP measure calculated by deducting the Company's Pro-Rata share of rental and hotel property expenses from the Company's Pro-Rata rental and hotel revenues. Please also see the reconciliation to GAAP in the Company’s supplemental financial information included in this release and also available at www.kennedywilson.com.
· "Real Estate Services Assets under Management" ("AUM") generally refers to the properties and other assets with respect to which we provide (or participate in) oversight, investment management services and other advice, and which generally consist of real estate properties or loans, and investments in joint ventures. Our AUM is principally intended to reflect the extent of our presence in the real estate market, not the basis for determining our management fees. Our AUM consists of the total estimated fair value of the real estate
14
properties and other real estate related assets either owned by third parties, wholly-owned by us or held by joint ventures and other entities in which our sponsored funds or investment vehicles and client accounts have invested. Committed (but unfunded) capital from investors in our sponsored funds is not included in our AUM. The estimated value of development properties is included at estimated completion cost.
· "Return on Equity" is a ratio calculated by dividing the net cash distributions of an investment to Kennedy Wilson, after the cost of leverage, if applicable, by the total cash contributions by Kennedy Wilson over the lifetime of the investment.
· “Same property” refers to properties in which Kennedy Wilson has an ownership interest during the entire span of both periods being compared. The same property information presented throughout this report is shown on a cash basis and excludes non-recurring expenses. This analysis excludes properties that are either under development or undergoing lease up as part of our asset management strategy.
Note about Non-GAAP and certain other financial information included in this presentation
In addition to the results reported in accordance with U.S. generally accepted accounting principles ("GAAP") included within this presentation, Kennedy Wilson has provided certain information, which includes non-GAAP financial measures (including Adjusted EBITDA, Adjusted Net Income, Net Operating Income, and Adjusted Fees, as defined above). Such information is reconciled to its closest GAAP measure in accordance with the rules of the SEC, and such reconciliations are included within this presentation. These measures may contain cash and non-cash acquisition-related gains and expenses and gains and losses from the sale of real-estate related investments. Consolidated non-GAAP measures discussed throughout this report contain income or losses attributable to non-controlling interests. Management believes that these non-GAAP financial measures are useful to both management and Kennedy Wilson's shareholders in their analysis of the business and operating performance of the Company. Management also uses this information for operational planning and decision-making purposes. Non-GAAP financial measures are not and should not be considered a substitute for any GAAP measures. Additionally, non-GAAP financial measures as presented by Kennedy Wilson may not be comparable to similarly titled measures reported by other companies. Annualized figures used throughout this release and supplemental financial information, and our estimated annual net operating income metrics, are not an indicator of the actual net operating income that the Company will or expects to realize in any period.
KW-IR
15
| Supplemental Financial Information | ||||||||
16
Kennedy-Wilson Holdings, Inc.
Capitalization Summary
(Unaudited)
(Dollars in millions, except per share data)
| March 31, 2021 | December 31, 2020 | |||||||||||||
| Market Data | ||||||||||||||
Common stock price per share | $ | 20.21 | $ | 17.89 | ||||||||||
| Common stock and convertible preferred stock | ||||||||||||||
| Common stock shares outstanding | 141,074,136 | 141,365,323 | ||||||||||||
Shares of common stock underlying convertible perpetual preferred stock(1) | 12,000,000 | 12,000,000 | ||||||||||||
| Total Common stock outstanding and underlying convertible preferred stock | 153,074,136 | 153,365,323 | ||||||||||||
| Equity Market Capitalization | $ | 3,093.6 | $ | 2,743.7 | ||||||||||
| Kennedy Wilson's Share of Debt | ||||||||||||||
Kennedy Wilson's share of property debt(2) | 4,109.6 | 4,105.8 | ||||||||||||
Senior notes payable(3) | 1,200.0 | 1,150.0 | ||||||||||||
Kennedy Wilson Europe bonds(4) | 949.6 | 1,177.2 | ||||||||||||
| Credit Facility | 50.0 | 200.0 | ||||||||||||
| Total Kennedy Wilson's share of debt | 6,309.2 | 6,633.0 | ||||||||||||
| Total Capitalization | $ | 9,402.8 | $ | 9,376.7 | ||||||||||
Less: Kennedy Wilson's share of cash(3)(4) | (740.4) | (1,033.2) | ||||||||||||
| Total Enterprise Value | $ | 8,662.4 | $ | 8,343.5 | ||||||||||
(1) Assumes conversion of $300 million convertible perpetual preferred investment based on current conversion price of $25.00 per share. The preferred stock is callable by Kennedy Wilson on and after October 15, 2024.
(2) Includes Kennedy Wilson's share of debt at Vintage Housing Holdings of $413 million and $391 million as of March 31, 2021 and December 31, 2020, respectively, based on economic ownership.
(3)Pro-Forma for $573.1 million paydown of remainder of 2024 Senior Notes, made on April 1, 2021.
(4)Pro-Forma for $207.0 million paydown of the 2022 KWE Bonds, made on April 26, 2021.
17
Kennedy-Wilson Holdings, Inc.
Components of Value Summary
As of March 31, 2021
(Unaudited, Dollars in millions)
Below are key valuation metrics provided to assist in the calculation of a sum-of-the-parts valuation of the Company as of March 31, 2021. Please note that excluded below is the potential value of the Company's future promoted interest as well as the value of the Company's team and brand.
| Kennedy Wilson's Share | ||||||||||||||||||||||||||||||||
| Investments | Description | Occupancy | Est. Annual NOI(1)(2) | Common Valuation Approach | Page # | |||||||||||||||||||||||||||
| Income Producing Assets | ||||||||||||||||||||||||||||||||
| 1 | Multifamily(3) | 26,082 units | 95.1% | $ | 187.8 | Cap rate | ||||||||||||||||||||||||||
| 2 | Office | 9.6 million square feet | 93.7% | 131.0 | Cap rate | |||||||||||||||||||||||||||
| 3 | Retail and Industrial | 9.8 million square feet | 92.1% | 55.3 | Cap rate | |||||||||||||||||||||||||||
| 4 | Hotels | 2 Hotels / 337 Hotel Rooms | N/A | 9.0 | Cap rate | |||||||||||||||||||||||||||
| 5 | Loans(5) | 18 loan investments | N/A | 5.6 | KW Loan Balance of $89.2 million | |||||||||||||||||||||||||||
| Total | $ | 388.7 | ||||||||||||||||||||||||||||||
| Lease-up, Development, and Non-income Producing Assets | KW Gross Asset Value | |||||||||||||||||||||||||||||||
| 6 | Lease-up Portfolio(5) (6) | 639 multifamily units 1.0 million office sq. ft. 0.5 million retail sq. ft. | 39.1% | $ | 655.6 | Multiple of gross asset value | ||||||||||||||||||||||||||
| 7 | Development Projects(5)(6) | 3,299 multifamily units 0.6 million office sq. ft. 0.2 million industrial sq. ft. One five-star resort | N/A | 508.2 | Multiple of gross asset value | |||||||||||||||||||||||||||
| 8 | Residential and other(5) | 18 investments | N/A | 293.0 | Multiple of gross asset value | |||||||||||||||||||||||||||
| Total | $ | 1,456.8 | ||||||||||||||||||||||||||||||
| Investment Management and Real Estate Services | Fee-Bearing Capital | Adj. Fees(7) | ||||||||||||||||||||||||||||||
| 9 | Investment management | Management and promote fees | $4,100 | $ | 30.0 | Adj. Fees Multiple | ||||||||||||||||||||||||||
| Net Debt | Total | |||||||||||||||||||||||||||||||
| 10 | KW Share of Debt(4)(8)(9) | Secured and Unsecured Debt | $ | 6,309.2 | Face Value | |||||||||||||||||||||||||||
| 11 | KW Share of Cash | Cash | (740.4) | Book Value | ||||||||||||||||||||||||||||
| Total Net Debt | $ | 5,568.8 | ||||||||||||||||||||||||||||||
(1) Please see “common definitions” for a definition of estimated annual NOI and a description of its limitations. The Company does not provide a reconciliation for Estimated Annual NOI to its most directly comparable forward-looking GAAP financial measure, because it is unable to provide a meaningful or accurate estimation of each of the component reconciling items, and the information is not available without unreasonable effort. This is due to the inherent difficulty of forecasting the timing and/or amount of various items that would impact Estimated Annual NOI, including, for example, gains on sales of depreciable real estate and other items that have not yet occurred and are out of the Company’s control. For the same reasons, the Company is unable to meaningfully address the probable significance of the unavailable
18
information and believes that providing a reconciliation for Estimated Annual NOI would imply a degree of precision as to its forward-looking net operating income that would be confusing or misleading to investors.
(2) Based on weighted-average ownership figures held by KW.
(3) Includes 8,425 affordable units the Company owns through its Vintage Housing Holdings platform. Kennedy Wilson's equity investment in Vintage Housing Holdings has a fair value of $136.1 million as of March 31, 2021.
(4) Includes Kennedy Wilson's share of debt at Vintage Housing Holdings of $413 million, based on economic ownership.
(5) See additional detail related to Lease-up, Development, and Non-income Producing Assets, as of March 31, 2021. KW Share of Debt below is included in the Net Debt amounts within the Components of Value Summary above.
| KW Gross Asset Value | KW Share of Debt | Investment Account | ||||||||||||||||||
| Lease-up - Multifamily and Commercial | $ | 655.6 | $ | 143.5 | $ | 512.1 | ||||||||||||||
Development - Multifamily, Commercial, and Hotel | 508.2 | 247.4 | 260.8 | |||||||||||||||||
Residential and other | 293.0 | 30.1 | 262.9 | |||||||||||||||||
| Lease-up, Development, and Non-income Producing Assets | $ | 1,456.8 | $ | 421.0 | $ | 1,035.8 | ||||||||||||||
(6) Includes $15.3 million of gross asset value related to assets undergoing lease-up and $61.6 million of gross asset value related to assets under development in Vintage Housing Holdings as of March 31, 2021.
(7) TTM figures are representative of the trailing 12 months and are not indicators of the actual results that the Company will or expects to realize in any period.
(8) Pro-Forma for $207.0 million paydown of the 2022 KWE Bonds, made on April 26, 2021.
(9) Pro-Forma for $573.1 million paydown of remainder of 2024 Senior Notes, made on April 1, 2021.
19
Kennedy-Wilson Holdings, Inc.
Stabilized Incoming-Producing Portfolio
As of March 31, 2021
(Unaudited, Dollars in millions)
The following information reflects Kennedy Wilson's Pro-rata share of Estimated Annual NOI (from income-producing assets) by geography and property type, as of March 31, 2021, of which 72% is derived from wholly-owned assets.
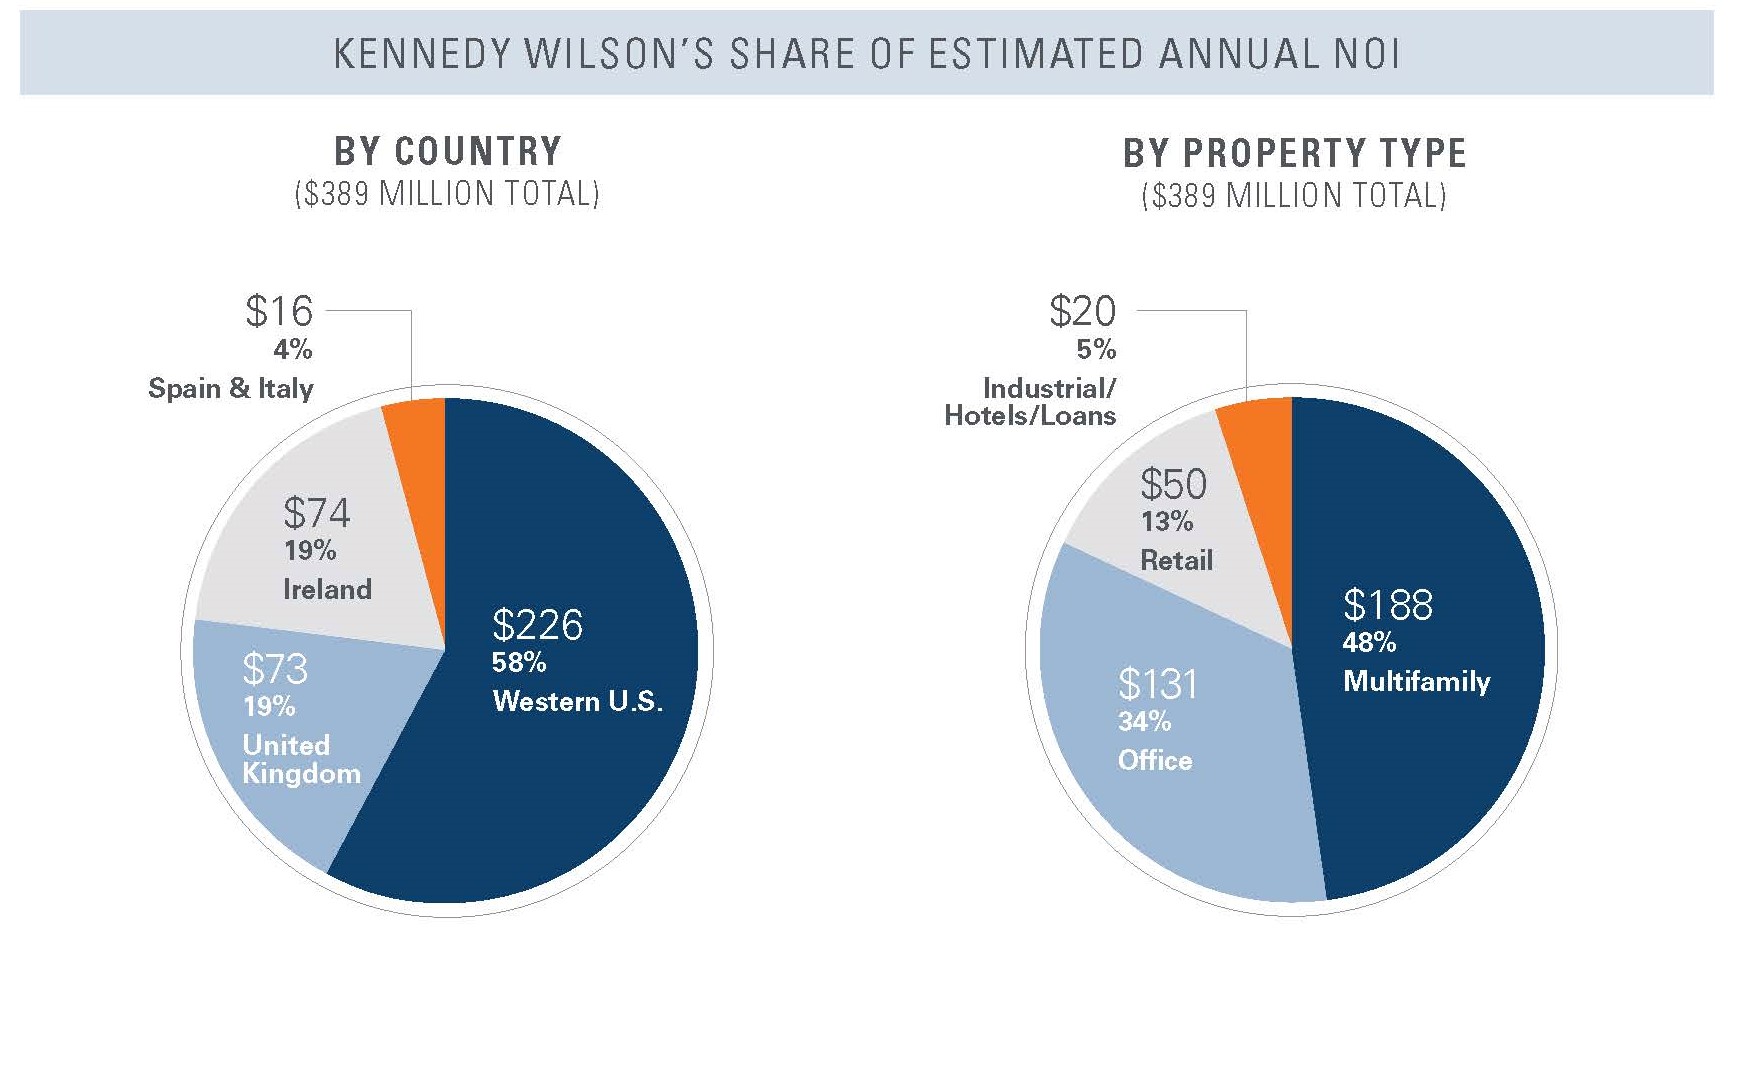
The following summarizes Kennedy Wilson's Pro-rata share of Estimated Annual NOI from its stabilized income-producing portfolio by property type and geography.
| Pacific Northwest | Southern California | Northern California | Mountain States | Hawaii | U.K. | Ireland | Italy | Spain | Total | |||||||||||||||||||||||
| Multifamily - Market Rate | $ | 39.6 | $ | 24.2 | $ | 25.8 | $ | 47.8 | $ | — | $ | — | $ | 22.9 | $ | — | $ | — | $ | 160.3 | ||||||||||||
| Multifamily - Affordable | 17.5 | 3.2 | 2.3 | 4.5 | — | — | — | — | — | 27.5 | ||||||||||||||||||||||
| Commercial - Office | 18.2 | 11.8 | 11.7 | 2.6 | — | 45.1 | 32.2 | 9.4 | — | 131.0 | ||||||||||||||||||||||
| Commercial - Retail | 0.3 | 3.3 | — | 7.6 | — | 22.5 | 9.6 | — | 7.0 | 50.3 | ||||||||||||||||||||||
| Commercial - Industrial | — | — | — | — | — | 5.0 | — | — | — | 5.0 | ||||||||||||||||||||||
| Hotel | — | — | — | — | — | — | 9.0 | — | — | 9.0 | ||||||||||||||||||||||
| Loans | 1.4 | 1.2 | 2.3 | 0.6 | 0.1 | — | — | — | — | 5.6 | ||||||||||||||||||||||
| Total Estimated Annual NOI | $ | 77.0 | $ | 43.7 | $ | 42.1 | $ | 63.1 | $ | 0.1 | $ | 72.6 | $ | 73.7 | $ | 9.4 | $ | 7.0 | $ | 388.7 | ||||||||||||
20
Kennedy-Wilson Holdings, Inc.
Segment Investment Summary
As of March 31, 2021
(Unaudited)
(Dollars in millions, except Fee-Bearing Capital)
The following summarizes Kennedy Wilson's income-producing portfolio by segment. Excluded below are lease-up, development, and residential and other investments.
| Stabilized Portfolio | ||||||||||||||||||||||||||||||||
| KW Segment | Description | Balance Sheet Classification | Multifamily Units | Commercial Rentable Sq. Ft. | Hotels | Loan Investments | KW Share of Est. Annual NOI(1) | Fee-Bearing Capital(2) ($bn) | KW Gross Asset Value | Ownership(3) | ||||||||||||||||||||||
| 1) Consolidated | Consists primarily of wholly-owned real estate investments | Consolidated | 9,709 | 7.1 | 1 | — | $279.6 | $— | $4,659.6 | 98.3% | ||||||||||||||||||||||
| 2) Co-investment Portfolio: | ||||||||||||||||||||||||||||||||
| ~50% owned | Consists primarily of 50/50 investments with partners and our Vintage Housing joint-venture | Unconsolidated | 12,065 | 0.8 | — | — | 78.0 | 0.8 | 1,654.5 | 44.6% | ||||||||||||||||||||||
| Minority owned | Includes fund investments, loans, and other minority-owned investments | Unconsolidated | 4,308 | 11.5 | 1 | 18 | 31.1 | 3.3 | 577.2 | 12.3% | ||||||||||||||||||||||
| Co-investment Portfolio | 16,373 | 12.3 | 1 | 18 | $109.1 | $4.1 | $2,231.7 | 25.5% | ||||||||||||||||||||||||
| Total Portfolio | 26,082 | 19.4 | 2 | 18 | $388.7 | $4.1 | $6,891.3 | 54.6% | ||||||||||||||||||||||||
(1) Please see “common definitions” for a definition of Estimated Annual NOI and a description of its limitations, including the inability to provide a reconciliation to its most directly comparable forward-looking GAAP financial measure.
(2) Includes Fee-Bearing Capital related to lease-up, development, and non-income producing assets.
(3) Weighted average ownership figures based on the Company’s share of NOI and are presented on a pre-promote basis.
21
Kennedy-Wilson Holdings, Inc.
Multifamily Portfolio
As of March 31, 2021
(Unaudited)
(Dollars in millions, except average rents per unit)
| Consolidated | Co-Investment (Unconsolidated) | |||||||||||||||||||||||||||||||||||||||||||
| Multifamily | # of Assets | Market-Rate Units | Market-Rate Units | Vintage Housing Affordable Units | Total # of Units | Occupancy (Asset Level) | Occupancy (KW Share) | Average Monthly Rents Per Market Rate Unit(1)(2) | KW Share of Estimated Annual NOI(3) | |||||||||||||||||||||||||||||||||||
| Pacific Northwest | 42 | 2,540 | 1,335 | 5,453 | 9,328 | 96.1 | % | 96.2 | % | $ | 1,627 | $ | 57.1 | |||||||||||||||||||||||||||||||
| Southern California | 10 | 1,211 | 1,289 | 704 | 3,204 | 95.5 | 96.1 | 1,974 | 27.4 | |||||||||||||||||||||||||||||||||||
| Northern California | 8 | 1,848 | — | 676 | 2,524 | 95.2 | 94.9 | 1,963 | 28.1 | |||||||||||||||||||||||||||||||||||
| Mountain States | 32 | 4,110 | 3,257 | 1,592 | 8,959 | 94.2 | 94.1 | 1,289 | 52.3 | |||||||||||||||||||||||||||||||||||
| Total Western U.S. | 92 | 9,709 | 5,881 | 8,425 | 24,015 | 95.2 | % | 95.3 | % | $ | 1,598 | $ | 164.9 | |||||||||||||||||||||||||||||||
Ireland(4) | 9 | — | 2,067 | — | 2,067 | 92.4 | 92.4 | 2,525 | 22.9 | |||||||||||||||||||||||||||||||||||
Total Stabilized(5) | 101 | 9,709 | 7,948 | 8,425 | 26,082 | 95.0 | % | 95.1 | % | $ | 1,675 | $ | 187.8 | |||||||||||||||||||||||||||||||
| Lease-up Assets | 3 | — | 469 | 170 | 639 | See Page 26 for more information | ||||||||||||||||||||||||||||||||||||||
| Development Projects | 14 | 641 | 1,091 | 1,567 | 3,299 | See Page 27 for more information | ||||||||||||||||||||||||||||||||||||||
| Total | 17 | 641 | 1,560 | 1,737 | 3,938 | |||||||||||||||||||||||||||||||||||||||
| Total Multifamily | 118 | 10,350 | 9,508 | 10,162 | 30,020 | |||||||||||||||||||||||||||||||||||||||
(1) Average Monthly Rents Per Unit is defined as the total potential monthly rental revenue (actual rent for occupied units plus market rent for vacant units) divided by the number of units, and are weighted-averages based on the Company's ownership percentage in the underlying properties.
(2) Average Monthly Rents Per Market Rate Unit for the market rate portfolio based on Kennedy Wilson's share of units. Average Monthly Rents Per Unit for the affordable portfolio are $892, $965, $908, and $805 for Pacific Northwest, Southern California, Northern California, and Mountain States, respectively.
(3) Please see “common definitions” for a definition of Estimated Annual NOI and a description of its limitations.
(4) Estimated foreign exchange rates are €0.85 = $1 USD, and £0.72 = $1 USD related to NOI.
(5) Includes 8,425 affordable units the Company owns through its Vintage platform, which the Company has a 37% economic ownership interest in.
22
Kennedy-Wilson Holdings, Inc.
Office Portfolio
As of March 31, 2021
(Unaudited)
(Dollars and Square Feet in millions, except average rent per sq. ft.)
| Office | # of Assets | Consolidated Rentable Sq. Ft. | Co-Investment Rentable Sq. Ft. (Unconsolidated) | Total Rentable Sq. Ft. | Occupancy (Asset Level) | Occupancy (KW Share) | Average Annual Rent per Sq. Ft.(1) | Kennedy Wilson's Share of Estimated Annual NOI(2) | |||||||||||||||||||||||||||||||||
| Pacific Northwest | 5 | 0.6 | 1.0 | 1.6 | 95.6 | % | 99.8 | % | $ | 25.2 | $ | 18.2 | |||||||||||||||||||||||||||||
Southern California(3) | 6 | 0.2 | 1.3 | 1.5 | 86.1 | 92.2 | 60.7 | 11.8 | |||||||||||||||||||||||||||||||||
| Northern California | 5 | 0.4 | 1.2 | 1.6 | 89.4 | 87.1 | 32.2 | 11.7 | |||||||||||||||||||||||||||||||||
| Mountain States | 5 | — | 1.7 | 1.7 | 90.2 | 90.9 | 18.7 | 2.6 | |||||||||||||||||||||||||||||||||
| Total Western U.S. | 21 | 1.2 | 5.2 | 6.4 | 90.4 | % | 93.6 | % | $ | 33.1 | $ | 44.3 | |||||||||||||||||||||||||||||
United Kingdom(4) | 11 | 1.2 | 0.3 | 1.5 | 87.2 | 88.1 | 38.6 | 45.1 | |||||||||||||||||||||||||||||||||
Ireland(4)(5) | 9 | 0.5 | 0.5 | 1.0 | 97.8 | 98.8 | 45.9 | 32.2 | |||||||||||||||||||||||||||||||||
Italy(4) | 7 | 0.7 | — | 0.7 | 100.0 | 100.0 | 15.7 | 9.4 | |||||||||||||||||||||||||||||||||
Total Europe(4) | 27 | 2.4 | 0.8 | 3.2 | 93.1 | % | 93.7 | % | $ | 34.7 | $ | 86.7 | |||||||||||||||||||||||||||||
| Total Stabilized | 48 | 3.6 | 6.0 | 9.6 | 91.3 | % | 93.7 | % | $ | 34.1 | $ | 131.0 | |||||||||||||||||||||||||||||
| Lease-up Assets | 7 | 0.8 | 0.2 | 1.0 | See page 26 for more information | ||||||||||||||||||||||||||||||||||||
| Development Projects | 5 | 0.2 | 0.4 | 0.6 | See page 27 for more information | ||||||||||||||||||||||||||||||||||||
| Total | 12 | 1.0 | 0.6 | 1.6 | |||||||||||||||||||||||||||||||||||||
| Total Office | 60 | 4.6 | 6.6 | 11.2 | |||||||||||||||||||||||||||||||||||||
(1) Average Annual Rent per Sq. Ft. represents contractual rents as in-place as of March 31, 2021 and are weighted-averages based on the Company's ownership percentage in the underlying properties.
(2) Please see “common definitions” for a definition of Estimated Annual NOI and a description of its limitations.
(3) Includes our corporate headquarters wholly owned by KW comprising 58,000 sq. ft., $35 million of debt, 100% occupancy, $3.0 million in Estimated Annual NOI and KW Gross Asset Value of $66.8 million as of March 31, 2021.
(4) Estimated foreign exchange rates are €0.85 = $1 USD, and £0.72 = $1 USD, related to NOI.
(5) Includes our Irish headquarters wholly owned by KW comprising 16,000 sq. ft., 100% occupancy, $1.1 million in Estimated Annual NOI and KW Gross Asset Value of $30.0 million as of March 31, 2021.
23
Kennedy-Wilson Holdings, Inc.
Retail and Industrial Portfolio
As of March 31, 2021
(Unaudited)
(Dollars and Square Feet in millions, except average rent per sq. ft.)
| Retail and Industrial | # of Assets | Consolidated Rentable Sq. Ft. | Co-Investment Rentable Sq. Ft. (Unconsolidated) | Total Rentable Sq. Ft. | Occupancy (Asset Level) | Occupancy (KW Share) | Average Annual Rent per Sq. Ft.(1) | Kennedy Wilson's Share of Estimated Annual NOI(2) | |||||||||||||||||||||||||||||||||
| Pacific Northwest | 1 | 0.1 | — | 0.1 | 100.0 | % | 100.0 | % | $ | 8.8 | $ | 0.3 | |||||||||||||||||||||||||||||
| Southern California | 5 | 0.2 | 0.9 | 1.1 | 94.4 | 94.6 | 21.3 | 3.3 | |||||||||||||||||||||||||||||||||
| Mountain States | 9 | 0.8 | 0.8 | 1.6 | 86.3 | 88.6 | 11.2 | 7.6 | |||||||||||||||||||||||||||||||||
| Total Western U.S. | 15 | 1.1 | 1.7 | 2.8 | 87.5 | % | 90.1 | % | $ | 12.8 | $ | 11.2 | |||||||||||||||||||||||||||||
United Kingdom(3) | 75 | 1.8 | 4.4 | 6.2 | 94.3 | 92.5 | 14.6 | 27.5 | |||||||||||||||||||||||||||||||||
Ireland(3) | 3 | 0.4 | — | 0.4 | 91.5 | 91.5 | 25.7 | 9.6 | |||||||||||||||||||||||||||||||||
Spain(3) | 4 | 0.4 | — | 0.4 | 96.0 | 96.0 | 22.1 | 7.0 | |||||||||||||||||||||||||||||||||
Total Europe(3) | 82 | 2.6 | 4.4 | 7.0 | 94.2 | % | 92.7 | % | $ | 17.0 | $ | 44.1 | |||||||||||||||||||||||||||||
| Total Stabilized | 97 | 3.7 | 6.1 | 9.8 | 92.7 | % | 92.1 | % | $ | 16.0 | $ | 55.3 | |||||||||||||||||||||||||||||
| Lease-up Assets | 6 | 0.2 | 0.3 | 0.5 | See page 26 for more information | ||||||||||||||||||||||||||||||||||||
| Development Projects | 2 | — | 0.2 | 0.2 | See page 27 for more information | ||||||||||||||||||||||||||||||||||||
| Total | 8 | 0.2 | 0.5 | 0.7 | |||||||||||||||||||||||||||||||||||||
| Total Retail and Industrial | 105 | 3.9 | 6.6 | 10.5 | |||||||||||||||||||||||||||||||||||||
(1) Average Annual Rent per Sq. Ft. represents contractual rents as in-place as of March 31, 2021 and are weighted-averages based on the Company's ownership percentage in the underlying properties.
(2) Please see “common definitions” for a definition of Estimated Annual NOI and a description of its limitations.
(3) Estimated foreign exchange rates are €0.85 = $1 USD, and £0.72 = $1 USD, related to NOI.
24
Kennedy-Wilson Holdings, Inc.
Hotel, Loans, Residential and Other Investment Portfolio
As of March 31, 2021
(Unaudited)
(Dollars in millions, except ADR)
| Hotel | # of Assets | Hotel Rooms | Average Daily Rate(2) | Kennedy Wilson's Share of Estimated Annual NOI(1) | |||||||||||||||||||
| Hawaii | 1 | 72 | $ | 91.0 | $ | — | |||||||||||||||||
Ireland(3) | 1 | 265 | 287.8 | 9.0 | |||||||||||||||||||
| Total Hotel | 2 | 337 | $ | 258.9 | $ | 9.0 | |||||||||||||||||
| Development | 1 | 150 | See page 27 for more information | ||||||||||||||||||||
| Total Hotel | 3 | 487 | |||||||||||||||||||||
(1) Please see “common definitions” for a definition of Estimated Annual NOI and a description of its limitations.
(2) Average Daily Rate data is based on the most recent 12 months and is weighted based on the Company's ownership percentage in the underlying properties.
(3) Estimated foreign exchange rates are €0.85 = $1 USD, and £0.72 = $1 USD, related to NOI.
| Loans | # of Loans | Average Interest Rate | Loan Balance (KW Share) | Kennedy Wilson's Share of Annual Interest Income | ||||||||||||||||
| Pacific Northwest | 3 | 7.5 | % | $ | 18.8 | $ | 1.4 | |||||||||||||
| Southern California | 4 | 5.5 | % | 22.2 | 1.2 | |||||||||||||||
| Northern California | 9 | 6.0 | % | 39.1 | 2.3 | |||||||||||||||
| Mountain States | 1 | 7.5 | % | 8.1 | 0.6 | |||||||||||||||
| Hawaii | 1 | 5.0 | % | 1.0 | 0.1 | |||||||||||||||
| Total Loans | 18 | 6.4 | % | $ | 89.2 | $ | 5.6 | |||||||||||||
| Residential and Other | # of Investments | Residential Units/Lots | Total Acres | KW Gross Asset Value | |||||||||||||||||||
| Southern California | 2 | — | 633 | $ | 24.0 | ||||||||||||||||||
| Hawaii | 5 | 232 | 3,242 | 208.8 | |||||||||||||||||||
| Total Western U.S. | 7 | 232 | 3,875 | $ | 232.8 | ||||||||||||||||||
United Kingdom(1) | 1 | — | 1 | 4.7 | |||||||||||||||||||
| Total Residential | 8 | 232 | 3,876 | $ | 237.5 | ||||||||||||||||||
| Other Investments | 10 | — | — | $ | 55.5 | ||||||||||||||||||
| Total Residential and Other | 18 | 232 | 3,876 | $ | 293.0 | ||||||||||||||||||
(3) Estimated foreign exchange rates are €0.85 = $1 USD, and £0.72 = $1 USD, related to Gross Asset Value.
25
Kennedy-Wilson Holdings, Inc.
Lease-up Portfolio
As of March 31, 2021
(Unaudited)
(Dollars in millions)
Lease-Up Portfolio
This section includes the Company's assets that are undergoing lease-up. There is no certainty that these assets will reach stabilization in the time periods shown. In addition, the cost to complete lease-up assets is subject to many uncertainties that are beyond our control, and the actual costs may be significantly higher than the estimates shown below. All dollar amounts are Kennedy Wilson's share.
| Property | Location | Type | KW Ownership % | # of Assets | Commercial Sq. Ft. | MF Units | Leased % | KW Share Est. Stabilized NOI | KW Est. Costs to Complete(1) | KW Gross Asset Value | ||||||||||||||||||||||
| 2021 | ||||||||||||||||||||||||||||||||
| Old School | United Kingdom(2) | Office | 100% | 1 | 21,000 | — | 67 | % | $ | 0.6 | $ | 0.5 | $ | 7.9 | ||||||||||||||||||
| Capital Dock | Ireland(2) | Mixed-Use | 50% | 1 | 27,000 | 190 | 53 | 4.6 | 3.0 | 90.3 | ||||||||||||||||||||||
| Clancy Quay - Phase 3 | Ireland | Multifamily | 50% | 1 | 7,000 | 279 | 54 | 3.5 | 3.1 | 84.3 | ||||||||||||||||||||||
| 2021 Subtotal | 3 | 55,000 | 469 | 58 | % | $ | 8.7 | $ | 6.6 | $ | 182.5 | |||||||||||||||||||||
| 2022 | ||||||||||||||||||||||||||||||||
| Stockley Park | United Kingdom(2) | Office | 100% | 1 | 54,000 | — | — | $ | 2.7 | $ | 0.2 | $ | 40.0 | |||||||||||||||||||
| Maidenhead | United Kingdom(2) | Office | 100% | 1 | 65,000 | — | — | 2.7 | 0.1 | 38.0 | ||||||||||||||||||||||
| The Oaks | Southern California | Office | 100% | 1 | 357,000 | — | 62 | % | 6.3 | 10.9 | 128.5 | |||||||||||||||||||||
| Various | United Kingdom(2) | Retail | 100% | 3 | 184,000 | — | — | 2.0 | 3.3 | 27.4 | ||||||||||||||||||||||
| Various | United Kingdom(2) | Office | 100% | 2 | 281,000 | — | 34 | 8.6 | 14.8 | 145.9 | ||||||||||||||||||||||
| 2022 Subtotal | 8 | 941,000 | — | 34 | % | $ | 22.3 | $ | 29.3 | $ | 379.8 | |||||||||||||||||||||
| Total Lease-Up | 11 | 996,000 | 469 | 35 | % | $ | 31.0 | $ | 35.9 | $ | 562.3 | |||||||||||||||||||||
Note: The table above excludes fund assets and one asset expected to sell, totaling 0.6 million commercial sq. ft. and KW Gross Asset Value of $77.9 million.
(1) Figures shown in this column are an estimate of KW's remaining costs to develop to completion or to complete the entitlement process, as applicable, as of March 31, 2021. Total remaining costs may be financed with third-party cash contributions, proceeds from projected sales, and/or debt financing. These figures are budgeted costs and are subject to change. There is no guarantee that the Company will be able to secure the project-level debt financing that is assumed in the figures above. If the Company is unable to secure such financing, the amount of capital that the Company will have to invest to complete the projects above may significantly increase.
(2) Estimated foreign exchange rates are €0.85 = $1 USD and £0.72 = $1 USD, related to NOI.
26
Kennedy-Wilson Holdings, Inc.
Development Projects - Income Producing
As of March 31, 2021
(Unaudited)
(Dollars in millions)
Development Projects - Income Producing
This section includes the market rate development or redevelopment projects that the Company is undergoing or considering, and excludes Vintage Housing Holdings and residential investments. The scope of these projects may change. There is no certainty that the Company will develop or redevelop any or all of these potential projects. In addition, the cost to complete development projects is subject to many uncertainties that are beyond our control, and the actual costs may be significantly higher than the estimates shown below. All dollar amounts are Kennedy Wilson's share.
| If Completed | Current | ||||||||||||||||||||||||||||||||||||||||
| Property | Location | Type | Status | KW Ownership % | Est. Completion Date(1) | Est. Stabilization Date | Commercial Sq. Ft. | MF Units / Hotel Rooms | KW Share Est. Stabilized NOI | KW Est. Total Cost(1) | Est. Yield on Cost | KW Costs Incurred(2) | KW Est. Costs to Complete(1) | ||||||||||||||||||||||||||||
| 2022-2024 | |||||||||||||||||||||||||||||||||||||||||
| The Clara | Mountain States | Multifamily | Under Construction | 80% | 2021 | 2022 | — | 148 | $ | 2 | $ | 25 | 6% | $ | 19 | $ | 6 | ||||||||||||||||||||||||
| Hanover Quay | Ireland(3) | Office | Under Construction | 60% | 2021 | 2022 | 69,000 | — | 3 | 41 | 6% | 32 | 9 | ||||||||||||||||||||||||||||
| Kildare | Ireland(3) | Office | Under Construction | 100% | 2022 | 2022 | 64,000 | — | 4 | 65 | 6% | 35 | 30 | ||||||||||||||||||||||||||||
| River Pointe | Mountain States | Multifamily | Under Construction | 100% | 2022 | 2022 | — | 89 | 1 | 23 | 6% | 6 | 17 | ||||||||||||||||||||||||||||
| 38° North Phase II | Nor. California | Multifamily | Planning Received | 100% | 2023 | 2024 | — | 172 | 4 | 65 | 6% | 5 | 60 | ||||||||||||||||||||||||||||
| Coopers Cross | Ireland(3) | Office | Under Construction | 50% | 2023 | 2024 | 394,000 | — | 13 | 175 | 7% | 59 | 116 | ||||||||||||||||||||||||||||
| Coopers Cross | Ireland(3) | Multifamily | Under Construction | 50% | 2023 | 2024 | — | 471 | 6 | 129 | 5% | 66 | 63 | ||||||||||||||||||||||||||||
| Grange | Ireland(3) | Multifamily | Planning Received | 50% | 2023 | 2024 | 7,000 | 287 | 3 | 71 | 5% | 24 | 47 | ||||||||||||||||||||||||||||
| Kona Village Resort | Hawaii | Hotel | Under Construction | 50% | 2023 | 2024 | — | 150 | 19-22 | 335 | 6-7% | 126 | 209 | ||||||||||||||||||||||||||||
| Leisureplex | Ireland(3) | Mixed-Use | Planning Received | 100% | 2024 | 2025 | 20,000 | 232 | 7 | 151 | 5% | 25 | 126 | ||||||||||||||||||||||||||||
| 2022-2025 Subtotal | 554,000 | 1,549 | $ 62-65 | $ | 1,080 | 6% | $ | 397 | $ | 683 | |||||||||||||||||||||||||||||||
Note: The table above excludes one fund multifamily development project for 333 units, two fund industrial development projects for 0.2 million commercial sq. ft., and one development project where the scope is still being explored, totaling KW Gross Asset Value of $53 million.
(1) Figures shown in this column are an estimate of KW's remaining costs to develop to completion or to complete the entitlement process, as applicable, as of March 31, 2021. Total remaining costs may be financed with third-party cash contributions, proceeds from projected sales, and/or debt financing. Kennedy Wilson expects to fund approximately $309 million of its share of remaining costs to complete with cash. These figures are budgeted costs and are subject to change. There is no guarantee that the Company will be able to secure the project-level debt financing that is assumed in the figures above. If the Company is unable to secure such financing, the amount of capital that the Company will have to invest to complete the projects above may significantly increase. KW cost to complete differs from KW share total capitalization as the latter includes costs that have already been incurred to date while the former relates to future estimated costs.
(2) Includes land costs.
(3) Estimated foreign exchange rates are €0.85 = $1 USD and £0.72 = $1 USD, related to NOI.
27
Kennedy-Wilson Holdings, Inc.
Vintage Housing Holdings - Lease-up Assets and Development Projects
As of March 31, 2021
(Unaudited)
(Dollars in millions)
Lease-up Assets and Development Projects - Vintage Housing Holdings
This section includes the Company's lease-up assets and development projects or redevelopment projects that the Company is undergoing or considering through its Vintage platform, which the Company has a 37% ownership interest in. The Company expects to have no cash equity basis in these projects at completion due to the use of property level debt and proceed from the sale of tax credits. The scope of these projects may change. There is no certainty the lease-up assets will reach stabilization or the Company will develop or redevelop any or all of these potential projects. All dollar amounts are Kennedy Wilson's share.
| If Completed | Current | ||||||||||||||||||||||||||||
| Property | Location | Status | Est. Completion Date(1) | Est. Stabilization Date | MF Units | Est. Cash to KW(2) | KW Share Est. Stabilized NOI | KW Cash Basis | Leased % | ||||||||||||||||||||
| Seatac | Pacific Northwest | Lease-up | N/A | 2021 | 170 | 1.2 | 0.7 | — | 80 | ||||||||||||||||||||
| The Farm | Pacific Northwest | Under Construction | 2021 | 2022 | 354 | 3.0 | 2.1 | — | NA | ||||||||||||||||||||
| Sanctuary | Mountain States | Under Construction | 2022 | 2022 | 208 | 0.4 | 0.4 | — | NA | ||||||||||||||||||||
| Quinn | Pacific Northwest | Under Construction | 2022 | 2023 | 227 | 2.8 | 1.1 | — | NA | ||||||||||||||||||||
| Station | Pacific Northwest | Under Construction | 2022 | 2023 | 197 | 2.7 | 0.9 | — | NA | ||||||||||||||||||||
| The Point | Pacific Northwest | Under Construction | 2022 | 2023 | 161 | 1.5 | 0.7 | — | NA | ||||||||||||||||||||
| Springview | Mountain States | Under Construction | 2023 | 2023 | 180 | 0.4 | 0.5 | — | NA | ||||||||||||||||||||
| Beacon Hill | Pacific Northwest | In Planning | 2023 | 2023 | 240 | 5.8 | 0.9 | 5.7 | NA | ||||||||||||||||||||
| 1,737 | $ | 17.8 | $ | 7.3 | $ | 5.7 | |||||||||||||||||||||||
(1) The actual completion date for projects is subject to several factors, many of which are not within our control. Accordingly, the projects identified may not be completed when expected, or at all. Kennedy Wilson expects to have no cash equity basis in these projects at completion.
(2) Represents the total cash Kennedy Wilson currently expects to receive from paid developer fees and proceeds from the sale of tax credits. Payment of the developer fee is contingent on the Company’s ability to meet certain criteria as outlined in each project’s Limited Partnership Agreement and may vary based on a number of factors.
28
Kennedy-Wilson Holdings, Inc.
Debt and Liquidity Schedule
As of March 31, 2021
(Unaudited)
(Dollars in millions)
| Consolidated | Unconsolidated | ||||||||||||||||||||||||||||
| Maturity | Consolidated Secured(1)(5) | Kennedy Wilson Europe Unsecured Bonds(2)(5) | KW Unsecured Debt(6) | Unconsolidated Secured | KW Share(3)(5)(6) | ||||||||||||||||||||||||
| 2021 | $ | 38.6 | $ | — | $ | — | $ | 318.1 | $ | 104.0 | |||||||||||||||||||
| 2022 | 324.8 | 303.3 | — | 749.9 | 836.7 | ||||||||||||||||||||||||
| 2023 | 365.0 | — | — | 581.0 | 497.7 | ||||||||||||||||||||||||
| 2024 | 248.0 | — | 50.0 | (4) | 671.4 | 569.1 | |||||||||||||||||||||||
| 2025 | 545.1 | 646.3 | — | 687.9 | 1,409.7 | ||||||||||||||||||||||||
| 2026 | 358.5 | — | — | 333.5 | 473.5 | ||||||||||||||||||||||||
| 2027 | 247.4 | — | — | 176.2 | 329.2 | ||||||||||||||||||||||||
| 2028 | 335.6 | — | — | 256.0 | 429.3 | ||||||||||||||||||||||||
| 2029 | 31.6 | — | 600.0 | 330.1 | 686.1 | ||||||||||||||||||||||||
| 2030 | 46.6 | — | — | 215.3 | 83.5 | ||||||||||||||||||||||||
| Thereafter | 21.7 | — | 600.0 | 752.9 | 890.4 | ||||||||||||||||||||||||
| Total | $ | 2,562.9 | $ | 949.6 | $ | 1,250.0 | $ | 5,072.3 | $ | 6,309.2 | |||||||||||||||||||
Cash(5)(6) | (312.4) | (185.7) | (146.2) | (364.9) | (740.4) | ||||||||||||||||||||||||
| Net Debt | $ | 2,250.5 | $ | 763.9 | $ | 1,103.8 | $ | 4,707.4 | $ | 5,568.8 | |||||||||||||||||||
(1) Excludes $11.7 million of unamortized loan fees and unamortized net premium of $4.2 million, as of March 31, 2021.
(2) Excludes $1.8 million of unamortized loan fees and unamortized net discount of $2.6 million, as of March 31, 2021.
(3) Includes Kennedy Wilson's share of debt at Vintage Housing Holdings of $412.5 million, based on economic ownership.
(4) Represents principal balance of credit facility ($50.0 million).
(5) Pro-Forma for $207.0 million paydown of the 2022 KWE Bonds, made on April 26, 2021.
(6) Pro-Forma for $573.1 million paydown of remainder of 2024 Senior Notes, made on April 1, 2021.
Weighted Average(1)(2) | |||||||||||
| Debt Type | Annual Interest Rate | Years to Maturity | |||||||||
| Consolidated Secured | 3.3% | 4.6 | |||||||||
| Kennedy Wilson Europe Unsecured Bonds | 3.4% | 3.5 | |||||||||
| KW Unsecured Debt | 4.8% | 9.2 | |||||||||
| Unconsolidated Secured | 3.0% | 6.8 | |||||||||
| Total (KW Share) | 3.5% | 5.9 | |||||||||
(1) Pro-Forma for $207.0 million paydown of the 2022 KWE Bonds, made on April 26, 2021.
(2) Pro-Forma for $573.1 million paydown of remainder of 2024 Senior Notes, made on April 22, 2021.
29
Kennedy-Wilson Holdings, Inc.
Debt and Liquidity Schedule (continued)
As of March 31, 2021
(Unaudited)
(Dollars in millions)
Kennedy Wilson has exposure to fixed and floating rate debt through its corporate debt along with debt encumbering its consolidated properties and its joint venture investments. The table below details Kennedy Wilson's total consolidated and unconsolidated debt by interest rate type.
KW Share of Debt(1)(2)(3) | |||||||||||||||||||||||
| Fixed Rate Debt | Floating with Interest Rate Caps | Floating without Interest Rate Caps | Total KW Share of Debt | ||||||||||||||||||||
| Secured Investment Level Debt | $ | 2,607.0 | $ | 764.7 | $ | 737.9 | $ | 4,109.6 | |||||||||||||||
Kennedy Wilson Europe Unsecured Bonds(2) | 949.6 | — | — | 949.6 | |||||||||||||||||||
KW Unsecured Debt(3) | 1,200.0 | — | 50.0 | 1,250.0 | |||||||||||||||||||
| Total | $ | 4,756.6 | $ | 764.7 | $ | 787.9 | $ | 6,309.2 | |||||||||||||||
| % of Total Debt | 75 | % | 13 | % | 12 | % | 100 | % | |||||||||||||||
(1) Includes Kennedy Wilson's share of debt at Vintage Housing Holdings of $412.5 million, based on economic ownership.
(2) Pro-Forma for $207.0 million paydown of the 2022 KWE Bonds, made on April 22, 2021.
(3) Pro-Forma for $573.1 million paydown of remainder of 2024 Senior Notes, made on April 22, 2021.
KW Share of Secured Investment Debt(1) | |||||||||||||||||||||||||||||||||||||||||||||||
| Multifamily | Office | Retail | Industrial | Hotels | Residential and Other | Total | % of KW Share | ||||||||||||||||||||||||||||||||||||||||
| Pacific Northwest | $ | 744.8 | $ | 107.0 | $ | 9.5 | $ | — | $ | — | $ | — | $ | 861.3 | 21 | % | |||||||||||||||||||||||||||||||
| Southern California | 286.5 | 162.9 | 30.9 | — | — | — | 480.3 | 12 | % | ||||||||||||||||||||||||||||||||||||||
| Northern California | 343.6 | 75.2 | — | — | — | — | 418.8 | 10 | % | ||||||||||||||||||||||||||||||||||||||
| Mountain States | 613.6 | 22.1 | 62.6 | — | — | — | 698.3 | 17 | % | ||||||||||||||||||||||||||||||||||||||
| Hawaii | — | — | — | — | 36.8 | 30.1 | 66.9 | 1 | % | ||||||||||||||||||||||||||||||||||||||
| Total Western US | $ | 1,988.5 | $ | 367.2 | $ | 103.0 | $ | — | $ | 36.8 | $ | 30.1 | $ | 2,525.6 | 61 | % | |||||||||||||||||||||||||||||||
| United Kingdom | $ | — | $ | 230.5 | $ | 207.2 | $ | 92.4 | $ | — | $ | — | $ | 530.1 | 13 | % | |||||||||||||||||||||||||||||||
| Ireland | 445.7 | 380.6 | 101.1 | — | 84.6 | — | 1,012.0 | 25 | % | ||||||||||||||||||||||||||||||||||||||
| Spain | — | — | 41.9 | — | — | — | 41.9 | 1 | % | ||||||||||||||||||||||||||||||||||||||
| Italy | — | — | — | — | — | — | — | — | % | ||||||||||||||||||||||||||||||||||||||
| Total Europe | $ | 445.7 | $ | 611.1 | $ | 350.2 | $ | 92.4 | $ | 84.6 | $ | — | $ | 1,584.0 | 39 | % | |||||||||||||||||||||||||||||||
| Total | $ | 2,434.2 | $ | 978.3 | $ | 453.2 | $ | 92.4 | $ | 121.4 | $ | 30.1 | $ | 4,109.6 | 100 | % | |||||||||||||||||||||||||||||||
| % of Total Debt | 59 | % | 24 | % | 11 | % | 2 | % | 3 | % | 1 | % | 100 | % | |||||||||||||||||||||||||||||||||
(1) Includes Kennedy Wilson's share of debt at Vintage Housing Holdings of $412.5 million, based on economic ownership
30
Kennedy-Wilson Holdings, Inc.
Investment Management Platform
(Unaudited, Dollars in millions)
Kennedy Wilson's investment management and real estate services platform offers a comprehensive line of real estate services for the full lifecycle of real estate ownership. Kennedy Wilson has approximately $18 billion in Real Estate AUM(1) and 42.8 million square feet under management as of March 31, 2021.
| Adjusted Fees - Detail | ||||||||||||||
| 1Q | ||||||||||||||
| Fee Description | 2021 | 2020 | ||||||||||||
| Investment Management — Base | $ | 7.5 | $ | 4.6 | ||||||||||
| Investment Management — Performance | (0.4) | (1.1) | ||||||||||||
| Property Services | 0.9 | 4.0 | ||||||||||||
Total Adjusted Fees(2) | $ | 8.0 | $ | 7.5 | ||||||||||
(1) As defined in "Common Definitions" section of the earnings release.
(2) Please see the appendix for a reconciliation of Adjusted Fees to its closest GAAP measure.
31
Kennedy-Wilson Holdings, Inc.
Multifamily Same Property Analysis
(Unaudited)
(Dollars in millions)
Same Property Analysis By Region - Kennedy Wilson's Pro-Rata Share
The Same Property analysis below reflects Kennedy Wilson's ownership in each underlying property and is shown to provide greater clarity of the impact of the Same Property(1) changes to Kennedy Wilson. The analysis below excludes the effects of minority-owned investments.
| Three Months Ended March 31, | Same Property Units | Average Occupancy % | Total Revenues(2) | Net Operating Income(2) | ||||||||||||||||||||||||||||||||||||||||||||||||||||||||||
| 2021 vs. 2020 | 2021 | 2021 | 2020 | % Change | 2021 | 2020 | % Change | 2021 | 2020 | % Change | ||||||||||||||||||||||||||||||||||||||||||||||||||||
| Market Rate Portfolio | ||||||||||||||||||||||||||||||||||||||||||||||||||||||||||||||
| Region: | ||||||||||||||||||||||||||||||||||||||||||||||||||||||||||||||
| Pacific Northwest | 3,426 | 96.3 | % | 94.9 | % | 1.5 | % | $ | 15.3 | $ | 15.8 | (3.2) | % | $ | 9.6 | $ | 10.4 | (6.8) | % | |||||||||||||||||||||||||||||||||||||||||||
| Southern California | 1,898 | 95.8 | 94.2 | 1.8 | 9.2 | 9.4 | (2.1) | 5.9 | 6.1 | (4.1) | ||||||||||||||||||||||||||||||||||||||||||||||||||||
| Northern California | 1,728 | 95.4 | 93.9 | 1.6 | 9.6 | 10.3 | (6.6) | 5.9 | 6.7 | (11.8) | ||||||||||||||||||||||||||||||||||||||||||||||||||||
| Mountain States | 3,655 | 95.4 | 94.6 | 0.9 | 14.4 | 13.8 | 4.4 | 9.7 | 9.2 | 4.7 | ||||||||||||||||||||||||||||||||||||||||||||||||||||
| Western U.S. | 10,707 | 95.8 | % | 94.5 | % | 1.3 | % | $ | 48.5 | $ | 49.3 | (1.6) | % | $ | 31.1 | $ | 32.4 | (4.0) | % | |||||||||||||||||||||||||||||||||||||||||||
| Ireland | 2,067 | 91.9 | 98.4 | (6.6) | 6.8 | 7.2 | (5.8) | 5.3 | 5.7 | (7.6) | ||||||||||||||||||||||||||||||||||||||||||||||||||||
| Total | 12,774 | 95.4 | % | 94.9 | % | 0.6 | % | $ | 55.3 | $ | 56.5 | (2.1) | % | $ | 36.4 | $ | 38.1 | (4.6) | % | |||||||||||||||||||||||||||||||||||||||||||
| Affordable Portfolio | ||||||||||||||||||||||||||||||||||||||||||||||||||||||||||||||
| Region: | ||||||||||||||||||||||||||||||||||||||||||||||||||||||||||||||
| Pacific Northwest | 5,045 | 97.0 | % | 96.9 | % | 0.1 | % | $ | 6.0 | $ | 6.0 | 1.1 | % | $ | 4.1 | $ | 4.1 | 0.1 | % | |||||||||||||||||||||||||||||||||||||||||||
| Southern California | 704 | 97.2 | 97.6 | (0.4) | 1.1 | 1.0 | 5.3 | 0.8 | 0.8 | 6.2 | ||||||||||||||||||||||||||||||||||||||||||||||||||||
| Northern California | 676 | 96.9 | 98.3 | (1.4) | 0.9 | 0.9 | (1.4) | 0.6 | 0.6 | (4.2) | ||||||||||||||||||||||||||||||||||||||||||||||||||||
| Mountain States | 944 | 97.4 | 96.5 | 1.0 | 1.0 | 0.9 | 7.1 | 0.7 | 0.6 | 7.8 | ||||||||||||||||||||||||||||||||||||||||||||||||||||
Western U.S. | 7,369 | 97.0 | % | 97.0 | % | — | % | $ | 9.0 | $ | 8.8 | 2.0 | % | $ | 6.2 | $ | 6.1 | 1.2 | % | |||||||||||||||||||||||||||||||||||||||||||
Note: Percentage changes are based on whole numbers while revenues and net operating income are shown in millions.
(1) As defined in "Common definitions" section of the earnings release.
(2) Please see the appendix for a reconciliation of same property revenues and NOI to its closest GAAP measure.
32
Kennedy-Wilson Holdings, Inc.
Office Same Property Analysis
(Unaudited)
(Dollars and Square Feet in millions)
Same Property Analysis By Region - Kennedy Wilson's Pro-Rata Share
The Same Property analysis below reflects Kennedy Wilson's ownership in each underlying property and is shown to provide greater clarity of the impact of the Same Property(1) changes to Kennedy Wilson. The analysis below excludes the effects of straight-line rent, and minority-owned investments.
| Three Months Ended March 31, | Same Property Square Feet | Average Occupancy % | Total Revenues(2) | Net Operating Income(2) | ||||||||||||||||||||||||||||||||||||||||||||||||||||||||||
| 2021 vs. 2020 | 2021 | 2021 | 2020 | % Change | 2021 | 2020 | % Change | 2021 | 2020 | % Change | ||||||||||||||||||||||||||||||||||||||||||||||||||||
| Region: | ||||||||||||||||||||||||||||||||||||||||||||||||||||||||||||||
Pacific Northwest(3) | 0.6 | 100.0 | % | 100.0 | % | — | % | $ | 4.4 | $ | 4.2 | 4.3 | % | $ | 3.7 | $ | 3.6 | 5.4 | % | |||||||||||||||||||||||||||||||||||||||||||
Southern California(4) | 0.2 | 96.9 | 99.3 | (2.4) | 2.5 | 2.9 | (15.7) | 1.5 | 1.9 | (22.5) | ||||||||||||||||||||||||||||||||||||||||||||||||||||
Northern California(5) | 0.4 | 86.0 | 89.4 | (3.8) | 3.4 | 3.4 | 0.2 | 2.1 | 2.0 | 8.4 | ||||||||||||||||||||||||||||||||||||||||||||||||||||
| Western U.S. | 1.2 | 94.6 | % | 96.2 | % | (1.6) | % | 10.3 | 10.5 | (2.6) | % | 7.3 | 7.5 | (0.9) | % | |||||||||||||||||||||||||||||||||||||||||||||||
United Kingdom(6) | 1.4 | 92.5 | 94.6 | (2.3) | 10.2 | 7.8 | 31.0 | 9.7 | 7.3 | 32.3 | ||||||||||||||||||||||||||||||||||||||||||||||||||||
Ireland(7) | 0.9 | 98.8 | 98.7 | 0.1 | 7.8 | 7.0 | 10.8 | 7.6 | 6.9 | 11.2 | ||||||||||||||||||||||||||||||||||||||||||||||||||||
| Italy | 0.7 | 100.0 | 100.0 | — | 2.6 | 2.6 | (0.6) | 2.3 | 2.3 | 0.8 | ||||||||||||||||||||||||||||||||||||||||||||||||||||
| Europe | 3.0 | 96.2 | % | 97.2 | % | (1.0) | % | 20.6 | 17.4 | 18.1 | % | 19.6 | 16.5 | 19.1 | % | |||||||||||||||||||||||||||||||||||||||||||||||
| Total | 4.2 | 95.7 | % | 96.9 | % | (1.2) | % | $ | 30.9 | $ | 27.9 | 10.3 | % | $ | 26.9 | $ | 24.0 | 12.9 | % | |||||||||||||||||||||||||||||||||||||||||||
Note: Percentage changes are based on whole numbers while revenues and net operating income are shown in millions.
(1) As defined in "Common definitions" section of the earnings release.
(2) Please see the appendix for a reconciliation of same property revenues and NOI to its closest GAAP measure.
(3) Including the effects of straight-lining of rents during the period, Pacific Northwest Same Property portfolio experienced revenue and NOI growth of 1.6% and 2.2%, respectively.
(4) Including the effects of straight-lining of rents during the period, Southern California Same Property portfolio experienced revenue and NOI decline of 12.5% and 17.3%, respectively.
(5) Including the effects of straight-lining of rents during the period, Northern California Same Property portfolio experienced revenue decline and NOI growth of 1.9% and 4.1%, respectively.
(6) Including the effects of straight-lining of rents during the period, United Kingdom Same Property portfolio experienced revenue and NOI growth of 1.0% and 0.5%, respectively.
(7) Including the effects of straight-lining of rents during the period, Ireland Same Property portfolio experienced revenue and NOI decline of 1.0% and 1.0%, respectively.
(8) Including the effects of straight-lining of rents during the period, Total Same Property portfolio experienced revenue and NOI decline of 1.2% and 0.7%, respectively.
33
Kennedy-Wilson Holdings, Inc.
Investment Transactions
(Unaudited)
(Dollars in millions)
Listed below is additional detailed information about the acquisitions and dispositions completed during the three months ended March 31, 2021:
| 100% | Kennedy Wilson's Share | |||||||||||||||||||||||||||||||
| Acquisitions | Real Estate Aggregate Purchase Price | Cap Rate(1) | Loan Purchases/Originations | Annual Return on Loans(4) | Real Estate Pro-Rata Purchase Price | Cap Rate(2)(4) | Real Estate Est. Forward Yield | Loan Purchases/Originations | Annual Return on Loans(4) | KW Ownership(3) | ||||||||||||||||||||||
| 1Q-21 | ||||||||||||||||||||||||||||||||
| Western U.S. | $ | 58.8 | 6.5% | $ | 136.8 | 5.6% | $ | 6.9 | 6.5% | 6.8% | $ | 12.4 | 7.5% | 9.9% | ||||||||||||||||||
| Europe | 181.0 | 4.0% | — | —% | 36.3 | 4.0% | 5.2% | — | —% | 20.1% | ||||||||||||||||||||||
| Total | $ | 239.8 | 4.6% | $ | 136.8 | 5.6% | $ | 43.2 | 4.4% | 5.4% | $ | 12.4 | 7.5% | 14.8% | ||||||||||||||||||
| 100% | Kennedy Wilson's Share | ||||||||||||||||||||||
| Dispositions | Aggregate Sale Price | Cap Rate(1) | Pro-Rata Sale Price | Cap Rate(2)(4) | KW Ownership(3) | ||||||||||||||||||
| 1Q-21 | |||||||||||||||||||||||
| Western U.S. | $ | 295.0 | 5.7% | $ | 17.3 | 5.8% | 5.9% | ||||||||||||||||
| Europe | 260.8 | 3.8% | 252.6 | 3.8% | 96.8% | ||||||||||||||||||
| Total | $ | 555.8 | 4.8% | $ | 269.9 | 3.9% | 48.5% | ||||||||||||||||
Note: The table above excludes five partial retail sales and two partial loan sales in the Western U.S. totaling $31.7 million, of which Kennedy Wilson's share was $20.6 million.
(1) For acquisitions and dispositions, the Cap Rate includes only income-producing properties. For the three months ended March 31, 2021, there were $2.6 million of acquisitions and no dispositions of non-income producing real estate assets. Please see "common definitions" for a definition of Cap Rate and a description of its limitations.
(2) For acquisitions and dispositions, the Cap Rate includes only income-producing properties at Kennedy Wilson's share. For the three months ended March 31, 2021, there were $1.0 million of acquisitions and no dispositions of non-income producing real estate assets. Please see "common definitions" for a definition of Cap Rate and a description of its limitations.
(3) Kennedy Wilson's ownership is shown on a weighted-average basis based upon the aggregate purchase/sale price of each investment and Kennedy Wilson's ownership in each investment at the time of acquisition/disposition.
(4) As defined in "Common Definitions" section of the earnings release.
34
Kennedy-Wilson Holdings, Inc.
Segment Detail
(Unaudited)
(Dollars in millions)
| Three Months Ended March 31, 2021 | ||||||||||||||||||||||||||
| Consolidated | Co-Investment | Corporate | Total | |||||||||||||||||||||||
| Revenue | ||||||||||||||||||||||||||
| Rental | $ | 88.9 | $ | — | $ | — | $ | 88.9 | ||||||||||||||||||
| Hotel | 0.8 | — | — | 0.8 | ||||||||||||||||||||||
| Investment management and property services fees | — | 7.4 | 0.7 | 8.1 | ||||||||||||||||||||||
| Loans and other | — | 1.6 | — | 1.6 | ||||||||||||||||||||||
| Total revenue | 89.7 | 9.0 | 0.7 | 99.4 | ||||||||||||||||||||||
| Expenses | ||||||||||||||||||||||||||
| Rental | 33.0 | — | — | 33.0 | ||||||||||||||||||||||
| Hotel | 1.6 | — | — | 1.6 | ||||||||||||||||||||||
| Commission and marketing | — | — | 0.3 | 0.3 | ||||||||||||||||||||||
| Compensation and related | 15.1 | 5.7 | 13.9 | 34.7 | ||||||||||||||||||||||
| General and administrative | 4.3 | 1.3 | 1.2 | 6.8 | ||||||||||||||||||||||
| Depreciation and amortization | 44.4 | — | — | 44.4 | ||||||||||||||||||||||
| Total expenses | 98.4 | 7.0 | 15.4 | 120.8 | ||||||||||||||||||||||
| Income from unconsolidated investments, net of depreciation and amortization | — | 18.4 | — | 18.4 | ||||||||||||||||||||||
| Gain on sale of real estate, net | 73.5 | — | — | 73.5 | ||||||||||||||||||||||
| Interest expense | (32.1) | — | (19.5) | (51.6) | ||||||||||||||||||||||
| Loss on early extinguishment of debt | — | — | (14.8) | (14.8) | ||||||||||||||||||||||
| Other (loss) income | (2.3) | — | (0.7) | (3.0) | ||||||||||||||||||||||
| (Loss) income before (provision for) benefit from income taxes | 30.4 | 20.4 | (49.7) | 1.1 | ||||||||||||||||||||||
| (Provision for) benefit from income taxes | (3.9) | — | 1.2 | (2.7) | ||||||||||||||||||||||
| Net (loss) income | 26.5 | 20.4 | (48.5) | (1.6) | ||||||||||||||||||||||
| Net loss attributable to noncontrolling interests | 0.3 | — | — | 0.3 | ||||||||||||||||||||||
| Preferred dividends | — | — | (4.3) | (4.3) | ||||||||||||||||||||||
| Net (loss) income attributable to Kennedy-Wilson Holdings, Inc. common shareholders | $ | 26.8 | $ | 20.4 | $ | (52.8) | $ | (5.6) | ||||||||||||||||||
| Add back (less) (Kennedy Wilson's Share): | ||||||||||||||||||||||||||
| Interest expense | $ | 31.4 | $ | 7.9 | $ | 19.5 | $ | 58.8 | ||||||||||||||||||
| Loss on early extinguishment of debt | — | — | 14.8 | 14.8 | ||||||||||||||||||||||
| Depreciation and amortization | 43.2 | 1.7 | — | 44.9 | ||||||||||||||||||||||
| Provision for (benefit from) income taxes | 3.9 | — | (1.2) | 2.7 | ||||||||||||||||||||||
| Preferred dividends | — | — | 4.3 | 4.3 | ||||||||||||||||||||||
| Share-based compensation | — | — | 7.7 | 7.7 | ||||||||||||||||||||||
| Fees eliminated in consolidation | (0.3) | 0.3 | — | — | ||||||||||||||||||||||
| Adjusted EBITDA | $ | 105.0 | $ | 30.3 | $ | (7.7) | $ | 127.6 | ||||||||||||||||||
35
Kennedy-Wilson Holdings, Inc.
Segment Detail (continued)
(Unaudited)
(Dollars in millions)
| Three Months Ended March 31, 2020 | ||||||||||||||||||||||||||
| Consolidated | Co-Investment | Corporate | Total | |||||||||||||||||||||||
| Revenue | ||||||||||||||||||||||||||
| Rental | $ | 107.7 | $ | — | $ | — | $ | 107.7 | ||||||||||||||||||
| Hotel | 7.2 | — | — | 7.2 | ||||||||||||||||||||||
| Investment management and property services fees | — | 4.5 | 3.9 | 8.4 | ||||||||||||||||||||||
| Loans and other | — | — | — | — | ||||||||||||||||||||||
| Total revenue | 114.9 | 4.5 | 3.9 | 123.3 | ||||||||||||||||||||||
| Expenses | ||||||||||||||||||||||||||
| Rental | 36.7 | — | — | 36.7 | ||||||||||||||||||||||
| Hotel | 6.0 | — | — | 6.0 | ||||||||||||||||||||||
| Commission and marketing | — | — | 0.7 | 0.7 | ||||||||||||||||||||||
| Compensation and related | 11.9 | 4.6 | 14.9 | 31.4 | ||||||||||||||||||||||
| General and administrative | 5.6 | 1.7 | 2.2 | 9.5 | ||||||||||||||||||||||
| Depreciation and amortization | 45.5 | — | — | 45.5 | ||||||||||||||||||||||
| Total expenses | 105.7 | 6.3 | 17.8 | 129.8 | ||||||||||||||||||||||
| Income from unconsolidated investments, net of depreciation and amortization | — | 10.9 | — | 10.9 | ||||||||||||||||||||||
| Gain on sale of real estate, net | 44.2 | — | — | 44.2 | ||||||||||||||||||||||
| Interest expense | (33.4) | — | (15.4) | (48.8) | ||||||||||||||||||||||
| Other income | (0.9) | — | 0.9 | — | ||||||||||||||||||||||
| Income (loss) before provision for income taxes | 19.1 | 9.1 | (28.4) | (0.2) | ||||||||||||||||||||||
| Provision for income taxes | (5.1) | — | (0.6) | (5.7) | ||||||||||||||||||||||
| Net income (loss) | 14.0 | 9.1 | (29.0) | (5.9) | ||||||||||||||||||||||
| Net income attributable to noncontrolling interests | 0.3 | — | — | 0.3 | ||||||||||||||||||||||
| Preferred dividends | — | — | (4.3) | (4.3) | ||||||||||||||||||||||
| Net income (loss) attributable to Kennedy-Wilson Holdings, Inc. common shareholders | $ | 14.3 | $ | 9.1 | $ | (33.3) | $ | (9.9) | ||||||||||||||||||
| Add back (less) (Kennedy Wilson's Share): | ||||||||||||||||||||||||||
| Interest expense | $ | 32.6 | $ | 8.1 | $ | 15.4 | $ | 56.1 | ||||||||||||||||||
| Depreciation and amortization | 44.4 | 1.7 | — | 46.1 | ||||||||||||||||||||||
| Provision for income taxes | 5.1 | 1.1 | 0.6 | 6.8 | ||||||||||||||||||||||
| Preferred dividends | — | — | 4.3 | 4.3 | ||||||||||||||||||||||
| Share-based compensation | — | — | 8.6 | 8.6 | ||||||||||||||||||||||
| Fees eliminated in consolidation | (0.1) | — | 0.1 | — | ||||||||||||||||||||||
| Adjusted EBITDA | $ | 96.3 | $ | 20.0 | $ | (4.3) | $ | 112.0 | ||||||||||||||||||
36
NON-GAAP PRO RATA FINANCIAL INFORMATION
The following non-GAAP Pro-rata information is not intended to be a presentation in accordance with GAAP. The Pro-rata financial information reflects our proportionate economic ownership of each asset in our portfolio that we do not wholly own. The amounts in the column labeled “KW Share of Unconsolidated Investments” were derived on a property-by-property basis by applying to each financial statement line item the ownership percentage interest used to arrive at our share of net income or loss during the period when applying the equity method of accounting to each of our unconsolidated joint ventures. A similar calculation was performed for the amounts in the column labeled “Noncontrolling Interests,” which represents the share of consolidated assets attributable to noncontrolling interests.
We do not control the unconsolidated investments and the presentations of the assets and liabilities and revenues and expenses do not represent our legal claim to such items. The operating agreements of the unconsolidated investments generally provide that partners may receive cash distributions (1) to the extent there is available cash from operations, (2) upon a capital event, such as a refinancing or sale or (3) upon liquidation of the venture. The amount of cash each partner receives is based upon specific provisions of each operating agreement and varies depending on factors including the amount of capital contributed by each partner and whether any contributions are entitled to priority distributions. Upon liquidation of the unconsolidated investments and after all liabilities, priority distributions and initial equity contributions have been repaid, the partners generally would be entitled to any residual cash remaining based on their respective legal ownership percentages. We provide this information because we believe it assists investors and analysts in estimating our economic interest in our unconsolidated investments when read in conjunction with the Company’s reported results under GAAP.
The presentation of Pro-rata financial information has limitations as an analytical tool. Some of these limitations include:
• The amounts shown on the individual line items were derived by applying our overall economic ownership interest percentage determined when applying the equity method of accounting and do not necessarily represent our legal claim to the assets and liabilities, or the revenues and expenses; and
• Other companies in our industry may calculate their pro rata interest differently than we do, which limits the usefulness of the amount in our pro rata financial statements as a comparative measure.
Because of these limitations, the pro rata financial information should not be considered in isolation or as a substitute for our financial statements as reported under U.S. GAAP. We compensate for these limitations by relying primarily on our U.S. GAAP results and using the Pro-rata financial information only supplementally.
37
Kennedy-Wilson Holdings, Inc.
Non-GAAP Pro-rata Financial Information
(Unaudited)
(Dollars in millions)
| March 31, 2021 | December 31, 2020 | |||||||||||||||||||||||||
| Non-GAAP | Non-GAAP | Non-GAAP | Non-GAAP | |||||||||||||||||||||||
Noncontrolling Interests (2) | KW Share of Unconsolidated Investments (3) | Noncontrolling Interests (2) | KW Share of Unconsolidated Investments (3) | |||||||||||||||||||||||
| Assets | ||||||||||||||||||||||||||
| Cash and cash equivalents | $ | (9.3) | $ | 105.5 | $ | (9.2) | $ | 77.3 | ||||||||||||||||||
| Accounts receivable | (1.8) | 7.0 | (1.2) | 7.1 | ||||||||||||||||||||||
Real estate and acquired in place lease values, net of accumulated depreciation and amortization (1) | (117.0) | 2,685.2 | (116.4) | 2,461.5 | ||||||||||||||||||||||
| Unconsolidated investments | — | (1,311.0) | — | (1,289.3) | ||||||||||||||||||||||
| Other assets | (3.2) | 198.6 | (3.4) | 197.9 | ||||||||||||||||||||||
| Total assets | $ | (131.3) | $ | 1,685.3 | $ | (130.2) | $ | 1,454.5 | ||||||||||||||||||
| Liabilities | ||||||||||||||||||||||||||
| Accounts payable | $ | (0.7) | $ | — | $ | (1.7) | $ | — | ||||||||||||||||||
| Accrued expenses and other liabilities | (25.4) | 61.9 | (25.6) | 64.6 | ||||||||||||||||||||||
| Mortgage debt | (76.7) | 1,623.4 | (74.7) | 1,582.8 | ||||||||||||||||||||||
| KW unsecured debt | — | — | — | — | ||||||||||||||||||||||
| KWE unsecured bonds | — | — | — | — | ||||||||||||||||||||||
| Total liabilities | (102.8) | 1,685.3 | (102.0) | 1,647.4 | ||||||||||||||||||||||
| Equity | ||||||||||||||||||||||||||
| Total Kennedy-Wilson Holdings, Inc. shareholders’ equity | — | — | — | — | ||||||||||||||||||||||
| Noncontrolling interests | (28.5) | — | (28.2) | — | ||||||||||||||||||||||
| Total equity | (28.5) | — | (28.2) | — | ||||||||||||||||||||||
| Total liabilities and equity | $ | (131.3) | $ | 1,685.3 | $ | (130.2) | $ | 1,647.4 | ||||||||||||||||||
(1) Includes Kennedy Wilson's total share of accumulated depreciation and amortization of $27.9 million and $67.6 million relating to noncontrolling interests and unconsolidated investments, and $27.9 million and $65.6 million relating to noncontrolling interests and unconsolidated investments, as of March 31, 2021 and December 31, 2020, respectively.
(2) Represents the portion of equity ownership in a consolidated subsidiary not attributable to Kennedy Wilson.
(3) Represents Kennedy Wilson's pro-rata share of unconsolidated joint-ventures.
38
Kennedy-Wilson Holdings, Inc.
Non-GAAP Pro-rata Financial Information
(Unaudited)
(Dollars in millions)
| 1Q - 2021 | 1Q - 2020 | |||||||||||||||||||||||||
| Non-GAAP | Non-GAAP | Non-GAAP | Non-GAAP | |||||||||||||||||||||||
Noncontrolling Interests(1) | KW Share of Unconsolidated Investments(2) | Noncontrolling Interests(1) | KW Share of Unconsolidated Investments(2) | |||||||||||||||||||||||
| Revenue | ||||||||||||||||||||||||||
| Rental | $ | (2.9) | $ | 37.7 | $ | (3.0) | $ | 40.6 | ||||||||||||||||||
| Hotel | — | — | — | — | ||||||||||||||||||||||
| Sale of real estate | — | 18.6 | — | 2.0 | ||||||||||||||||||||||
| Investment management and property services fees | 0.3 | (0.4) | — | (1.0) | ||||||||||||||||||||||
| Total revenue | (2.6) | 55.9 | (3.0) | 41.6 | ||||||||||||||||||||||
| Expenses | ||||||||||||||||||||||||||
| Rental | (1.0) | 11.3 | (1.1) | 10.7 | ||||||||||||||||||||||
| Hotel | — | — | — | — | ||||||||||||||||||||||
| Cost of real estate sold | — | 15.9 | — | 2.5 | ||||||||||||||||||||||
| Commission and marketing | — | — | — | — | ||||||||||||||||||||||
| Compensation and related | — | — | — | — | ||||||||||||||||||||||
| General and administrative | — | — | — | — | ||||||||||||||||||||||
| Depreciation and amortization | (1.1) | 1.8 | (1.2) | 1.7 | ||||||||||||||||||||||
| Total expenses | (2.1) | 29.0 | (2.3) | 14.9 | ||||||||||||||||||||||
| Income from unconsolidated investments, net of depreciation and amortization | — | (18.4) | — | (10.9) | ||||||||||||||||||||||
| Gain on sale of real estate, net | — | — | — | (0.6) | ||||||||||||||||||||||
| Transaction-related expenses | — | — | 0.1 | — | ||||||||||||||||||||||
| Interest expense | 0.9 | (7.9) | 0.7 | (8.1) | ||||||||||||||||||||||
| Other income (loss) | (0.1) | (4.9) | 0.2 | (3.2) | ||||||||||||||||||||||
Fair Value/Other Adjustments (3) | — | 4.3 | — | (2.9) | ||||||||||||||||||||||
| Income before benefit from income taxes | 0.3 | — | 0.3 | 1.0 | ||||||||||||||||||||||
| Benefit from income taxes | — | — | — | (1.0) | ||||||||||||||||||||||
| Net income | 0.3 | — | 0.3 | — | ||||||||||||||||||||||
| Net loss attributable to noncontrolling interests | (0.3) | — | (0.3) | — | ||||||||||||||||||||||
| Net income attributable to Kennedy-Wilson Holdings, Inc. common shareholders | $ | — | $ | — | $ | — | $ | — | ||||||||||||||||||
(1) Represents the portion of equity ownership in a consolidated subsidiary not attributable to Kennedy Wilson.
(2) Represents Kennedy Wilson's pro-rata share of unconsolidated joint-ventures.
(3) Includes the reclassification of cumulative unrealized fair value gains/losses on unconsolidated investments, as realized.
39
APPENDIX
40
Kennedy-Wilson Holdings, Inc.
Multifamily Same Property Analysis
(Unaudited)
(Dollars in millions)
Same Property Analysis By Region - Kennedy Wilson's Pro-Rata Share
The Same Property analysis below reflects Kennedy Wilson's ownership in each underlying property and is shown to provide greater clarity of the impact of the Same Property(1) changes to Kennedy Wilson.
| Three Months Ended March 31, | Same Property Units | Average Occupancy % | Total Revenues(2) | Net Operating Income(2) | ||||||||||||||||||||||||||||||||||||||||||||||||||||||||||
| 2021 vs. 2020 | 2021 | 2021 | 2020 | % Change | 2021 | 2020 | % Change | 2021 | 2020 | % Change | ||||||||||||||||||||||||||||||||||||||||||||||||||||
| Market Rate Portfolio | ||||||||||||||||||||||||||||||||||||||||||||||||||||||||||||||
| Region: | ||||||||||||||||||||||||||||||||||||||||||||||||||||||||||||||
| Pacific Northwest | 3,875 | 96.3 | % | 94.9 | % | 1.5 | % | $ | 15.7 | $ | 16.2 | (3.1) | % | $ | 9.9 | $ | 10.6 | (6.7) | % | |||||||||||||||||||||||||||||||||||||||||||
| Southern California | 2,500 | 95.8 | 94.2 | 1.7 | 9.6 | 9.9 | (2.6) | 6.1 | 6.4 | (4.9) | ||||||||||||||||||||||||||||||||||||||||||||||||||||
| Northern California | 1,728 | 95.4 | 93.9 | 1.6 | 9.6 | 10.3 | (6.6) | 5.9 | 6.7 | (11.8) | ||||||||||||||||||||||||||||||||||||||||||||||||||||
| Mountain States | 6,292 | 95.3 | 94.4 | 1.0 | 15.6 | 15.0 | 4.2 | 10.4 | 10.0 | 4.4 | ||||||||||||||||||||||||||||||||||||||||||||||||||||
| Western U.S. | 14,395 | 95.7 | % | 94.4 | % | 1.4 | % | $ | 50.5 | $ | 51.4 | (1.6) | % | $ | 32.3 | $ | 33.7 | (4.1) | % | |||||||||||||||||||||||||||||||||||||||||||
| Ireland | 2,067 | 91.9 | 98.4 | (6.6) | 6.8 | 7.2 | (5.8) | 5.3 | 5.7 | (7.6) | ||||||||||||||||||||||||||||||||||||||||||||||||||||
| Total | 16,462 | 95.4 | % | 94.8 | % | 0.6 | % | $ | 57.3 | $ | 58.6 | (2.1) | % | $ | 37.6 | $ | 39.4 | (4.6) | % | |||||||||||||||||||||||||||||||||||||||||||
| Affordable Portfolio | ||||||||||||||||||||||||||||||||||||||||||||||||||||||||||||||
| Region: | ||||||||||||||||||||||||||||||||||||||||||||||||||||||||||||||
| Pacific Northwest | 5,045 | 97.0 | % | 96.9 | % | 0.1 | % | $ | 6.0 | $ | 6.0 | 1.1 | % | $ | 4.1 | $ | 4.1 | 0.1 | % | |||||||||||||||||||||||||||||||||||||||||||
| Southern California | 704 | 97.2 | 97.6 | (0.4) | 1.1 | 1.0 | 5.3 | 0.8 | 0.8 | 6.2 | ||||||||||||||||||||||||||||||||||||||||||||||||||||
| Northern California | 676 | 96.9 | 98.3 | (1.4) | 0.9 | 0.9 | (1.4) | 0.6 | 0.6 | (4.2) | ||||||||||||||||||||||||||||||||||||||||||||||||||||
| Mountain States | 944 | 97.4 | 96.5 | 1.0 | 1.0 | 0.9 | 7.1 | 0.7 | 0.6 | 7.8 | ||||||||||||||||||||||||||||||||||||||||||||||||||||
Western U.S. | 7,369 | 97.0 | % | 97.0 | % | — | % | $ | 9.0 | $ | 8.8 | 2.0 | % | $ | 6.2 | $ | 6.1 | 1.2 | % | |||||||||||||||||||||||||||||||||||||||||||
Note: Percentage changes are based on whole numbers while revenues and net operating income are shown in millions.
(1) As defined in "Common definitions" section of the earnings release.
(2) Please see the appendix for a reconciliation of same property revenues and NOI to its closest GAAP measure.
41
Kennedy-Wilson Holdings, Inc.
Commercial Same Property Analysis
(Unaudited)
(Dollars and Square Feet in millions)
Same Property Analysis By Region - Kennedy Wilson's Pro-Rata Share (including Minority-Owned investments)
The Same Property analysis below reflects Kennedy Wilson's ownership in each underlying property and is shown to provide greater clarity of the impact of the Same Property(1) changes to Kennedy Wilson. The analysis below excludes the effects of straight-line rent.
| Three Months Ended March 31, | Same Property Square Feet | Average Occupancy % | Total Revenues(2) | Net Operating Income(2) | ||||||||||||||||||||||||||||||||||||||||||||||||||||||||||
| 2021 vs. 2020 | 2021 | 2021 | 2020 | % Change | 2021 | 2020 | % Change | 2021 | 2020 | % Change | ||||||||||||||||||||||||||||||||||||||||||||||||||||
| Region: | ||||||||||||||||||||||||||||||||||||||||||||||||||||||||||||||
Pacific Northwest(3) | 1.2 | 99.8 | % | 99.1 | % | 0.7 | % | $ | 5.6 | $ | 5.3 | 5.6 | % | $ | 4.6 | $ | 4.3 | 7.3 | % | |||||||||||||||||||||||||||||||||||||||||||
Southern California(4) | 1.6 | 93.7 | 92.9 | 0.8 | 4.0 | 4.5 | (11.2) | 2.5 | 2.9 | (14.7) | ||||||||||||||||||||||||||||||||||||||||||||||||||||
Northern California(5) | 1.1 | 86.3 | 89.9 | (4.1) | 3.9 | 3.9 | 0.4 | 2.5 | 2.3 | 8.3 | ||||||||||||||||||||||||||||||||||||||||||||||||||||
| Mountain States | 2.8 | 89.8 | 91.0 | (1.3) | 3.2 | 3.3 | (1.5) | 2.3 | 2.4 | (3.4) | ||||||||||||||||||||||||||||||||||||||||||||||||||||
| Western U.S. | 6.7 | 92.5 | % | 93.3 | % | (0.9) | % | 16.7 | 17.0 | (1.5) | % | 11.9 | 11.9 | (0.1) | % | |||||||||||||||||||||||||||||||||||||||||||||||
United Kingdom(6) | 5.2 | 94.8 | 95.3 | (0.6) | 15.7 | 14.7 | 6.9 | 14.4 | 13.5 | 6.8 | ||||||||||||||||||||||||||||||||||||||||||||||||||||
Ireland(7) | 1.5 | 95.9 | 96.7 | (0.8) | 9.6 | 10.0 | (4.4) | 9.1 | 9.5 | (3.8) | ||||||||||||||||||||||||||||||||||||||||||||||||||||
Spain(8) | 0.4 | 95.2 | 96.5 | (1.4) | 1.5 | 1.8 | (18.1) | 1.2 | 1.4 | (15.9) | ||||||||||||||||||||||||||||||||||||||||||||||||||||
| Italy | 0.7 | 100.0 | 100.0 | — | 2.6 | 2.6 | (0.6) | 2.3 | 2.3 | 0.8 | ||||||||||||||||||||||||||||||||||||||||||||||||||||
| Europe | 7.8 | 95.7 | % | 96.3 | % | (0.6) | % | 29.4 | 29.1 | 0.8 | % | 27.0 | 26.7 | 1.3 | % | |||||||||||||||||||||||||||||||||||||||||||||||
Total(9) | 14.5 | 94.7 | % | 95.4 | % | (0.7) | % | $ | 46.1 | $ | 46.1 | — | % | $ | 38.9 | $ | 38.6 | 0.9 | % | |||||||||||||||||||||||||||||||||||||||||||
Note: Percentage changes are based on whole numbers while revenues and net operating income are shown in millions.
(1) As defined in "Common definitions" section of the earnings release.
(2) Please see the appendix for a reconciliation of same property revenues and NOI to its closest GAAP measure.
(3) Including the effects of straight-lining of rents during the period, Pacific Northwest Same Property portfolio experienced revenue and NOI growth of 3.4% and 4.6%, respectively.
(4) Including the effects of straight-lining of rents during the period, Southern California Same Property portfolio experienced revenue and NOI decline of 9.2% and 11.6%, respectively.
(5) Including the effects of straight-lining of rents during the period, Northern California Same Property portfolio experienced revenue decline and revenue growth of 1.5% and 4.6%, respectively.
(6) Including the effects of straight-lining of rents during the period, United Kingdom Same Property portfolio experienced revenue and NOI decline of 6.2% and 7.2%, respectively.
(7) Including the effects of straight-lining of rents during the period, Ireland Same Property portfolio experienced revenue and NOI decline of 11.1% and 11.1%, respectively.
(8) Including the effects of straight-lining of rents during the period, Spain Same Property portfolio experienced revenue and NOI decline of 38.6% and 43.4%, respectively.
(9) Including the effects of straight-lining of rents during the period, Total Same Property portfolio experienced revenue and NOI decline of 6.6% and 6.9%, respectively
42
Kennedy-Wilson Holdings, Inc.
Same Property Reconciliation
(Unaudited)
(Dollars in million
| 1Q - 2021 | 1Q - 2020 | |||||||||||||||||||||||||
| Same Property | Same Property | |||||||||||||||||||||||||
| Revenue | NOI | Revenue | NOI | |||||||||||||||||||||||
| Rental Revenues | $ | 88.9 | $ | 88.9 | $ | 107.7 | $ | 107.7 | ||||||||||||||||||
| Hotel Revenues | 0.8 | 0.8 | 7.2 | 7.2 | ||||||||||||||||||||||
| Rental (Expenses) | — | (33.0) | — | (36.7) | ||||||||||||||||||||||
| Hotel (Expenses) | — | (1.6) | — | (6.0) | ||||||||||||||||||||||
| Consolidated Total | 89.7 | 55.1 | 114.9 | 72.2 | ||||||||||||||||||||||
Less: NCI adjustments (1) | (1.8) | (1.1) | (2.2) | (1.3) | ||||||||||||||||||||||
Add: Unconsolidated investment adjustments (2) | 31.2 | 23.0 | 31.8 | 23.8 | ||||||||||||||||||||||
Add: Straight-line and above/below market rents | 7.1 | 7.1 | (3.7) | (3.7) | ||||||||||||||||||||||
Less: Reimbursement of recoverable operating expenses | (5.5) | — | (6.9) | — | ||||||||||||||||||||||
Less: Properties bought and sold (3) | (1.2) | 0.2 | (10.0) | (8.7) | ||||||||||||||||||||||
Less: Other properties excluded (4) | (8.0) | (0.1) | (12.6) | 0.1 | ||||||||||||||||||||||
Other Reconciling Items (5) | 0.9 | (1.5) | 2.2 | 1.7 | ||||||||||||||||||||||
| Same Property | $ | 112.4 | $ | 82.7 | $ | 113.5 | $ | 84.1 | ||||||||||||||||||
| 1Q - 2021 | 1Q - 2020 | |||||||||||||||||||||||||
| Same Property | Same Property | |||||||||||||||||||||||||
| Same Property (Reported) | Revenue | NOI | Revenue | NOI | ||||||||||||||||||||||
| Commercial - Same Property | $ | 46.1 | $ | 38.9 | $ | 46.1 | $ | 38.6 | ||||||||||||||||||
| Multifamily Market Rate Portfolio - Same Property | 57.3 | 37.6 | 58.6 | 39.4 | ||||||||||||||||||||||
| Multifamily Affordable Portfolio - Same Property | 9.0 | 6.2 | 8.8 | 6.1 | ||||||||||||||||||||||
Same Property(6) | $ | 112.4 | $ | 82.7 | $ | 113.5 | $ | 84.1 | ||||||||||||||||||
(1) Represents rental revenue and operating expenses and hotel revenue and operating expenses attributable to non-controlling interests.
(2) Represents the Company’s share of unconsolidated investment rental revenues and net operating income, as applicable, which are within the applicable same property population.
(3) Represents properties excluded from the same property population that were purchased or sold during the applicable period.
(4) Represents properties excluded from the same property population that were not stabilized during the applicable periods.
(5) Represents other properties excluded from the same property population that were not classified as either a commercial or multifamily property within the Company’s portfolio. Also includes immaterial adjustments for foreign exchange rates, changes in ownership percentages, and certain non-recurring income and expenses.
(5) Represents other properties excluded from the same property population that were not classified as either a commercial or multifamily property within the Company’s portfolio. Also includes immaterial adjustments for foreign exchange rates, changes in ownership percentages, and certain non-recurring income and expenses.
(6) Total Same Property portfolio experienced revenue and NOI decline of 0.9% and 1.7%, respectively
43
Kennedy-Wilson Holdings, Inc.
Same Property Reconciliation
(Unaudited)
(Dollars in million
| 1Q - 2021 | 1Q - 2020 | |||||||||||||||||||||||||
| Same Property | Same Property | |||||||||||||||||||||||||
| Revenue | NOI | Revenue | NOI | |||||||||||||||||||||||
| Net Income | $ | (1.6) | $ | (1.6) | $ | (5.9) | $ | (5.9) | ||||||||||||||||||
Less: (Provision for) benefit from income taxes | 2.7 | 2.7 | 5.7 | 5.7 | ||||||||||||||||||||||
Less: Income from unconsolidated investments | (18.4) | (18.4) | (10.9) | (10.9) | ||||||||||||||||||||||
Less: Gain on sale of real estate, net | (73.5) | (73.5) | (44.2) | (44.2) | ||||||||||||||||||||||
Add: Transaction-related expenses | — | — | 0.2 | 0.2 | ||||||||||||||||||||||
Add: Interest expense | 66.4 | 66.4 | 48.8 | 48.8 | ||||||||||||||||||||||
Less: Other (loss) income | 1.4 | 1.4 | (0.2) | (0.2) | ||||||||||||||||||||||
Less: Sale of real estate | — | — | — | — | ||||||||||||||||||||||
Less: Investment management, property services and research fees | (8.1) | (8.1) | (8.4) | (8.4) | ||||||||||||||||||||||
Add: Rental expenses | 33.0 | — | 36.7 | — | ||||||||||||||||||||||
Add: Hotel expenses | 1.6 | — | 6.0 | — | ||||||||||||||||||||||
Add: Cost of real estate sold | — | — | — | — | ||||||||||||||||||||||
Add: Commission and marketing | 0.3 | 0.3 | 0.7 | 0.7 | ||||||||||||||||||||||
Add: Compensation and related | 34.7 | 34.7 | 31.4 | 31.4 | ||||||||||||||||||||||
Add: General and administrative | 6.8 | 6.8 | 9.5 | 9.5 | ||||||||||||||||||||||
Add: Depreciation and amortization | 44.4 | 44.4 | 45.5 | 45.5 | ||||||||||||||||||||||
Less: NCI adjustments (1) | (1.8) | (1.1) | (2.2) | (1.3) | ||||||||||||||||||||||
Add: Unconsolidated investment adjustments (2) | 31.2 | 23.0 | 31.8 | 23.8 | ||||||||||||||||||||||
Add: Straight-line and above/below market rents | 7.1 | 7.1 | (3.7) | (3.7) | ||||||||||||||||||||||
Less: Reimbursement of recoverable operating expenses | (5.5) | — | (6.9) | — | ||||||||||||||||||||||
Less: Properties bought and sold (3) | (1.2) | 0.2 | (10.0) | (8.7) | ||||||||||||||||||||||
Less: Other properties excluded (4) | (8.0) | (0.1) | (12.6) | 0.1 | ||||||||||||||||||||||
Other Reconciling Items (5) | 0.9 | (1.5) | 2.2 | 1.7 | ||||||||||||||||||||||
| Same Property | $ | 112.4 | $ | 82.7 | $ | 113.5 | $ | 84.1 | ||||||||||||||||||
| 1Q - 2021 | 1Q - 2020 | |||||||||||||||||||||||||
| Same Property | Same Property | |||||||||||||||||||||||||
| Same Property (Reported) | Revenue | NOI | Revenue | NOI | ||||||||||||||||||||||
| Commercial - Same Property | $ | 46.1 | $ | 38.9 | $ | 46.1 | $ | 38.6 | ||||||||||||||||||
| Multifamily Market Rate Portfolio - Same Property | 57.3 | 37.6 | 58.6 | 39.4 | ||||||||||||||||||||||
| Multifamily Affordable Portfolio - Same Property | 9.0 | 6.2 | 8.8 | 6.1 | ||||||||||||||||||||||
| Same Property | $ | 112.4 | $ | 82.7 | $ | 113.5 | $ | 84.1 | ||||||||||||||||||
(1) Represents rental revenue and operating expenses and hotel revenue and operating expenses attributable to non-controlling interests.
(2) Represents the Company’s share of unconsolidated investment rental revenues and net operating income, as applicable, which are within the applicable same property population.
(3) Represents properties excluded from the same property population that were purchased or sold during the applicable period.
(4) Represents properties excluded from the same property population that were not stabilized during the applicable periods.
(5) Represents other properties excluded from the same property population that were not classified as either a commercial or multifamily property within the Company’s portfolio. Also includes immaterial adjustments for foreign exchange rates, changes in ownership percentages, and certain non-recurring income and expenses.
44
Kennedy-Wilson Holdings, Inc.
Reconciliation of Kennedy Wilson's Share Amounts
(Unaudited)
(Dollars in millions)
| Three Months Ended | ||||||||||||||
| March 31, | ||||||||||||||
| 2021 | 2020 | |||||||||||||
| Interest expense - investment (Kennedy Wilson's Share) | ||||||||||||||
| Interest expense - investment | $ | 32.1 | $ | 33.4 | ||||||||||
| Interest expense (attributable to noncontrolling interests) | (0.7) | (0.8) | ||||||||||||
Kennedy Wilson's share of interest expense included in unconsolidated investments | 7.9 | 8.1 | ||||||||||||
| Interest expense - investment (Kennedy Wilson's Share) | $ | 39.3 | $ | 40.7 | ||||||||||
| Interest expense - corporate (Kennedy Wilson's Share) | ||||||||||||||
| Interest expense - corporate | $ | 19.5 | $ | 15.4 | ||||||||||
| Interest expense - corporate (Kennedy Wilson's Share) | $ | 19.5 | $ | 15.4 | ||||||||||
| Loss on early extinguishment of debt (Kennedy Wilson's Share) | ||||||||||||||
| Loss on early extinguishment of debt | $ | 14.8 | $ | — | ||||||||||
| Loss on early extinguishment of debt (Kennedy Wilson's Share) | $ | 14.8 | $ | — | ||||||||||
| Depreciation and amortization (Kennedy Wilson's Share) | ||||||||||||||
| Depreciation and amortization | $ | 44.4 | $ | 45.5 | ||||||||||
Depreciation and amortization (attributable to noncontrolling interests) | (1.2) | (1.1) | ||||||||||||
Kennedy Wilson's share of depreciation and amortization included in unconsolidated investments | 1.7 | 1.7 | ||||||||||||
| Depreciation and amortization (Kennedy Wilson's Share) | $ | 44.9 | $ | 46.1 | ||||||||||
| Provision for (benefit from) income taxes (Kennedy Wilson's Share) | ||||||||||||||
| Provision for (benefit from) income taxes | $ | 2.7 | $ | 5.7 | ||||||||||
Benefit from taxes (attributable to noncontrolling interests) | — | — | ||||||||||||
Provision for income taxes included in unconsolidated investments | — | 1.1 | ||||||||||||
| Provision for income taxes (Kennedy Wilson's Share) | $ | 2.7 | $ | 6.8 | ||||||||||
45
Kennedy-Wilson Holdings, Inc
Property-Level NOI Reconciliation
(Unaudited)
(Dollars in millions)
| Property-Level NOI | ||||||||||||||
| Three Months Ended March 31, | ||||||||||||||
| 2021 | 2020 | |||||||||||||
| Net Income | $ | (1.6) | $ | (5.9) | ||||||||||
Less: (Provision for) benefit from income taxes | 2.7 | 5.7 | ||||||||||||
Less: Income from unconsolidated investments | (18.4) | (10.9) | ||||||||||||
Less: Gain on sale of real estate, net | (73.5) | (44.2) | ||||||||||||
Add: Acquisition-related expenses | — | 0.2 | ||||||||||||
Add: Interest expense | 66.4 | 48.8 | ||||||||||||
Less: Other (loss) income | 1.4 | (0.2) | ||||||||||||
Less: Sale of real estate | — | — | ||||||||||||
Less: Investment management, property services and research fees | (8.1) | (8.4) | ||||||||||||
Add: Cost of real estate sold | — | — | ||||||||||||
Add: Commission and marketing | 0.3 | 0.7 | ||||||||||||
Add: Compensation and related | 34.7 | 31.4 | ||||||||||||
Add: General and administrative | 6.8 | 9.5 | ||||||||||||
Add: Depreciation and amortization | 44.4 | 45.5 | ||||||||||||
Less: NCI adjustments (1) | (1.9) | (1.9) | ||||||||||||
Add: Unconsolidated investment adjustments (2) | 26.4 | 29.9 | ||||||||||||
| Property-Level NOI (KW Share) | $ | 79.6 | $ | 100.2 | ||||||||||
(1) Rental revenues and operating expenses and hotel revenues and operating expenses attributable to non-controlling interests.
(2) The Company’s share of unconsolidated investment net operating income.
46
Kennedy-Wilson Holdings, Inc.
Reconciliation of Adjusted Fees
(Unaudited)
(Dollars in millions)
| Adjusted Fees | ||||||||||||||
| YTD | ||||||||||||||
| 2021 | 2020 | |||||||||||||
| Investment management, property services and research fees | $ | 8.1 | $ | 8.4 | ||||||||||
| Non-GAAP adjustments: | ||||||||||||||
| Add back: | ||||||||||||||
KW share of fees eliminated in consolidation(1) | 0.3 | 0.1 | ||||||||||||
Performance fees included in unconsolidated investments | (0.4) | (1.0) | ||||||||||||
| Adjusted Fees | $ | 8.0 | $ | 7.5 | ||||||||||
(1) Represents fees recognized in net (income) loss attributable to noncontrolling interests relating to portion of fees paid by noncontrolling interest holders.
47
Serious News for Serious Traders! Try StreetInsider.com Premium Free!
You May Also Be Interested In
- Dicello Levitt LLP Announces Investor Class Action Lawsuit Filed Against QuidelOrtho Corp. f/k/a Quidel Corp. (NASDAQ: QDEL) And Lead Plaintiff Deadline
- Deveron Announces Closing of Private Placement of Convertible Debentures
- Australian Oilseeds, Largest APAC Producer of Non-Chemical, Non-GMO “Cold-Processing” Vegetable Oil, Enters into Contract with Woolworths and Costco Australia.
Create E-mail Alert Related Categories
SEC FilingsSign up for StreetInsider Free!
Receive full access to all new and archived articles, unlimited portfolio tracking, e-mail alerts, custom newswires and RSS feeds - and more!
