

Form 8-K KOHLS Corp For: May 19
 Tweet
Tweet Share
ShareExhibit 99.1
Kohl’s Reports First Quarter Fiscal 2022 Financial Results
| • | First quarter net sales and comparable sales decrease 5.2% |
| • | First quarter diluted earnings per share of $0.11 |
| • | Updates full year 2022 financial outlook |
| • | Board continues to run a robust process to explore all strategic initiatives to maximize value |
MENOMONEE FALLS, Wis.—(BUSINESS WIRE)—May 19, 2022— Kohl’s Corporation (NYSE: KSS) today reported results for the quarter ended April 30, 2022.
| Three Months | ||||||||||||
| ($ in millions, except per share data) |
2022 | 2021 | Change | |||||||||
| Total revenue |
$ | 3,715 | $ | 3,887 | (4.4 | %) | ||||||
| Net sales(1) |
(5.2 | %) | 69.5 | % | ||||||||
| Gross margin |
38.3 | % | 39.0 | % | (69) bps | |||||||
| Selling, general, and administrative expenses |
$ | 1,293 | $ | 1,170 | 10.5 | % | ||||||
| Reported |
||||||||||||
| Net income |
$ | 14 | $ | 14 | 0 | % | ||||||
| Diluted earnings per share |
$ | 0.11 | $ | 0.09 | 22 | % | ||||||
|
Non-GAAP(2) |
||||||||||||
| Adjusted net income |
$ | 14 | $ | 165 | (92 | %) | ||||||
| Adjusted diluted earnings per share |
$ | 0.11 | $ | 1.05 | (90 | %) | ||||||
| (1) | Represents change in Net sales vs. prior year period. |
| (2) | Amounts shown for the three months ended April 30, 2022 are GAAP as there are no adjustments to Non-GAAP. These amounts are shown for comparability purposes. |
“The year has started out below our expectations. Following a strong start to the quarter with positive low-single digits comps through late March, sales considerably weakened in April as we encountered macro headwinds related to lapping last year’s stimulus and an inflationary consumer environment. We remain committed to our long-term strategy and are encouraged that our updated store experience, with Sephora at Kohl’s shops, delivered positive comparable store sales across these 200 locations for the quarter. We continue to expect our business to improve as the year progresses, with growth in the second half as we benefit from the roll out of 400 additional Sephora stores, enhanced loyalty rewards and further investment in our stores,” said Michelle Gass, Kohl’s chief executive officer.
“Regarding our review of strategic alternatives, we continue to engage with multiple interested parties. We have formally communicated the specific procedures for the submission of actionable bids due in the coming weeks. We continue with our detailed diligence phase and are pleased with the number of parties who recognize the value of our business and plan,” said Gass.
Updated 2022 Financial Outlook
The Company is updating its full year 2022 financial outlook to include the following:
| • | Net sales is now expected to be in the range of 0% to 1% as compared to the prior year |
| • | Operating margin is now expected to be in the range of 7.0% to 7.2% |
| • | Earnings per share is now expected to be in the range of $6.45 to $6.85, excluding any non-recurring charges |
Process Update
The Kohl’s Board is thoroughly testing the Company’s standalone strategic plan against potential alternatives and has designated its Finance Committee to lead the ongoing review of expressions of interest. The Board engaged Goldman Sachs to conduct a broad process to explore strategic alternatives, which to date has included engagement with over 25 parties. Multiple bidders have been invited to a data room containing over 550,000 pages across over 55,000 documents, as well as meetings with management. While preliminary, non-binding proposals have been received, further diligence is ongoing and the Board has requested fully-financed final bids to be submitted in the coming weeks.
Dividend
As previously announced, on May 10, 2022, Kohl’s Board of Directors declared a quarterly cash dividend on the Company’s common stock of $0.50 per share. The dividend is payable June 22, 2022 to shareholders of record at the close of business on June 8, 2022.
First Quarter 2022 Earnings Conference Call
Kohl’s will host its quarterly earnings conference call at 9:00 am ET on May 19, 2022. A webcast of the conference call and the related presentation materials will be available via the Company’s web site at investors.kohls.com, both live and after the call.
Cautionary Statement Regarding Forward-Looking Information and Non-GAAP Measures
This press release contains “forward-looking statements” within the meaning of the Private Securities Litigation Reform Act of 1995. The Company intends forward-looking terminology such as “believes,” “expects,” “may,” “will,” “should,” “anticipates,” “plans,” or similar expressions to identify forward-looking statements. Such statements, including statements regarding the outcome and timing of the strategic review process, are subject to certain risks and uncertainties, which could cause the Company’s actual results to differ materially from those anticipated by the forward-looking statements, and there can be no guarantee that the process will result in an agreement to sell the Company or that any such agreement will ultimately be consummated. These risks and uncertainties include, but are not limited to, risks described more fully in Item 1A in the Company’s Annual Report on Form 10-K, which are expressly incorporated herein by reference, and other factors as may periodically be described in the Company’s filings with the SEC. Forward-looking statements relate to the date initially made, and Kohl’s undertakes no obligation to update them.
In this press release, the Company provides information regarding adjusted net income and adjusted diluted earnings per share, which are not recognized terms under U.S. generally accepted accounting principles (“GAAP”) and do not purport to be alternatives to net income as a measure of operating performance. A reconciliation of adjusted net income and adjusted diluted earnings per share is provided in this release. The Company believes that the use of these non-GAAP financial measures provides investors with enhanced visibility into its results with respect to the impact of certain costs. Because not all companies use identical calculations, these presentations may not be comparable to other similarly titled measures of other companies.
About Kohl’s
Kohl’s (NYSE: KSS) is a leading omnichannel retailer. With more than 1,100 stores in 49 states and the online convenience of Kohls.com and the Kohl’s App, Kohl’s offers amazing national and exclusive brands at incredible savings for families nationwide. Kohl’s is uniquely positioned to deliver against its strategy and its vision to be the most trusted retailer of choice for the active and casual lifestyle. Kohl’s is committed to progress in its diversity and inclusion pledges, and the company’s environmental, social and corporate governance (ESG) stewardship. For a list of store locations or to shop online, visit Kohls.com. For more information about Kohl’s impact in the community or how to join our winning team, visit Corporate.Kohls.com or follow @KohlsNews on Twitter.
Contacts
Investor Relations:
Mark Rupe, (262) 703-1266, [email protected]
Media:
Jen Johnson, (262) 703-5241, [email protected]
KOHL’S CORPORATION
CONSOLIDATED STATEMENTS OF OPERATIONS
(Unaudited)
| Three Months Ended |
||||||||
| (Dollars in Millions, Except per Share Data) |
April 30, 2022 |
May 1, 2021 |
||||||
| Net sales |
$ | 3,471 | $ | 3,662 | ||||
| Other revenue |
244 | 225 | ||||||
|
|
|
|
|
|||||
| Total revenue |
3,715 | 3,887 | ||||||
| Cost of merchandise sold |
2,140 | 2,233 | ||||||
| Gross margin rate |
38.3 | % | 39.0 | % | ||||
| Operating expenses: |
||||||||
| Selling, general, and administrative |
1,293 | 1,170 | ||||||
| As a percent of total revenue |
34.8 | % | 30.1 | % | ||||
| Depreciation and amortization |
200 | 211 | ||||||
|
|
|
|
|
|||||
| Operating income |
82 | 273 | ||||||
| Interest expense, net |
68 | 67 | ||||||
| Loss on extinguishment of debt |
— | 201 | ||||||
|
|
|
|
|
|||||
| Income before income taxes |
14 | 5 | ||||||
| (Benefit) for income taxes |
— | (9 | ) | |||||
|
|
|
|
|
|||||
| Net income |
$ | 14 | $ | 14 | ||||
|
|
|
|
|
|||||
| Average number of shares: |
||||||||
| Basic |
127 | 154 | ||||||
| Diluted |
129 | 156 | ||||||
| Earnings per share: |
||||||||
| Basic |
$ | 0.11 | $ | 0.09 | ||||
| Diluted |
$ | 0.11 | $ | 0.09 | ||||
|
|
|
|
|
|||||
ADJUSTED NET INCOME AND DILUTED EARNINGS PER SHARE, NON-GAAP FINANCIAL MEASURES
(Unaudited)
| (Dollars in Millions, Except per Share Data) |
Three Months Ended |
|||||||
| April 30, 2022 |
May 1, 2021 |
|||||||
| Net income |
||||||||
| GAAP |
$ | 14 | $ | 14 | ||||
| Loss on extinguishment of debt |
— | 201 | ||||||
| Income tax impact of items noted above |
— | (50 | ) | |||||
|
|
|
|
|
|||||
| Adjusted (non-GAAP)(1) |
$ | 14 | $ | 165 | ||||
|
|
|
|
|
|||||
| Diluted earnings per share |
||||||||
| GAAP |
$ | 0.11 | $ | 0.09 | ||||
| Loss on extinguishment of debt |
— | 1.29 | ||||||
| Income tax impact of items noted above |
— | (0.33 | ) | |||||
|
|
|
|
|
|||||
| Adjusted (non-GAAP)(1) |
$ | 0.11 | $ | 1.05 | ||||
|
|
|
|
|
|||||
| (1) | Amounts shown for the three months ended April 30, 2022 are GAAP as there are no adjustments to Non-GAAP. These amounts are shown for comparability purposes. |
KOHL’S CORPORATION
CONSOLIDATED BALANCE SHEETS
(Unaudited)
| (Dollars in Millions) |
April 30, 2022 |
May 1, 2021 |
||||||
| Assets |
||||||||
| Current assets: |
||||||||
| Cash and cash equivalents |
$ | 646 | $ | 1,609 | ||||
| Merchandise inventories |
3,736 | 2,667 | ||||||
| Other |
381 | 919 | ||||||
|
|
|
|
|
|||||
| Total current assets |
4,763 | 5,195 | ||||||
| Property and equipment, net |
7,790 | 6,653 | ||||||
| Operating leases |
2,224 | 2,392 | ||||||
| Other assets |
476 | 449 | ||||||
|
|
|
|
|
|||||
| Total assets |
$ | 15,253 | $ | 14,689 | ||||
|
|
|
|
|
|||||
| Liabilities and Shareholders’ Equity |
||||||||
| Current liabilities: |
||||||||
| Accounts payable |
$ | 1,679 | $ | 1,378 | ||||
| Accrued liabilities |
1,316 | 1,289 | ||||||
| Current portion of: |
||||||||
| Long-term debt |
164 | — | ||||||
| Finance leases and financing obligations |
108 | 112 | ||||||
| Operating leases |
127 | 159 | ||||||
|
|
|
|
|
|||||
| Total current liabilities |
3,394 | 2,938 | ||||||
| Long-term debt |
1,746 | 1,909 | ||||||
| Finance leases and financing obligations |
2,584 | 1,473 | ||||||
| Operating leases |
2,474 | 2,620 | ||||||
| Deferred income taxes |
209 | 242 | ||||||
| Other long-term liabilities |
390 | 390 | ||||||
| Shareholders’ equity |
4,456 | 5,117 | ||||||
|
|
|
|
|
|||||
| Total liabilities and shareholders’ equity |
$ | 15,253 | $ | 14,689 | ||||
|
|
|
|
|
|||||
KOHL’S CORPORATION
CONSOLIDATED STATEMENTS OF CASH FLOWS
(Unaudited)
| Three Months Ended |
||||||||
| (Dollars in Millions) |
April 30, 2022 |
May 1, 2021 |
||||||
| Operating activities |
||||||||
| Net income |
$ | 14 | $ | 14 | ||||
| Adjustments to reconcile net income to net cash (used in) provided by operating activities: |
||||||||
| Depreciation and amortization |
200 | 211 | ||||||
| Share-based compensation |
18 | 12 | ||||||
| Deferred income tax expense |
2 | (65 | ) | |||||
| Loss on extinguishment of debt |
— | 201 | ||||||
| Non-cash lease expense |
31 | 38 | ||||||
| Other non-cash expense |
3 | 7 | ||||||
| Changes in operating assets and liabilities: |
||||||||
| Merchandise inventories |
(668 | ) | (75 | ) | ||||
| Other current and long-term assets |
(42 | ) | 31 | |||||
| Accounts payable |
(4 | ) | (99 | ) | ||||
| Accrued and other long-term liabilities |
17 | 42 | ||||||
| Operating lease liabilities |
(31 | ) | (39 | ) | ||||
|
|
|
|
|
|||||
| Net cash (used in) provided by operating activities |
(460 | ) | 278 | |||||
|
|
|
|
|
|||||
| Investing activities |
||||||||
| Acquisition of property and equipment |
(221 | ) | (59 | ) | ||||
| Proceeds from sale of real estate |
4 | 2 | ||||||
|
|
|
|
|
|||||
| Net cash used in investing activities |
(217 | ) | (57 | ) | ||||
|
|
|
|
|
|||||
| Financing activities |
||||||||
| Proceeds from issuance of debt |
— | 500 | ||||||
| Deferred financing costs |
— | (5 | ) | |||||
| Treasury stock purchases |
(158 | ) | (46 | ) | ||||
| Shares withheld for taxes on vested stock-based awards |
(18 | ) | (22 | ) | ||||
| Dividends paid |
(63 | ) | (39 | ) | ||||
| Reduction of long-term borrowings |
— | (1,044 | ) | |||||
| Premium paid on redemption of debt |
— | (192 | ) | |||||
| Finance lease and financing obligation payments |
(29 | ) | (33 | ) | ||||
| Proceeds from financing obligations |
4 | — | ||||||
| Proceeds from stock option exercises |
— | 1 | ||||||
| Other |
— | (3 | ) | |||||
|
|
|
|
|
|||||
| Net cash used in financing activities |
(264 | ) | (883 | ) | ||||
|
|
|
|
|
|||||
| Net decrease in cash and cash equivalents |
(941 | ) | (662 | ) | ||||
| Cash and cash equivalents at beginning of period |
1,587 | 2,271 | ||||||
|
|
|
|
|
|||||
| Cash and cash equivalents at end of period |
$ | 646 | $ | 1,609 | ||||
|
|
|
|
|
|||||

Exhibit 99.2 Q1 2022 Results Presentation May 19, 2022

Cautionary Statement Regarding Forward-Looking Information This presentation contains “forward-looking statements” within the meaning of the Private Securities Litigation Reform Act of 1995. The Company intends forward-looking terminology such as “believes,” “expects,” “may,” “will,” “should,” “anticipates,” “plans,” or similar expressions to identify forward-looking statements. Such statements, including statements regarding the outcome and timing of the strategic review process, are subject to certain risks and uncertainties, which could cause the Company’s actual results to differ materially from those anticipated by the forward-looking statements, and there can be no guarantee that the process will result in an agreement to sell the Company or that any such agreement will ultimately be consummated. These risks and uncertainties include, but are not limited to, risks described more fully in Item 1A in the Company’s Annual Report on Form 10-K, which are expressly incorporated herein by reference, and other factors as may periodically be described in the Company’s filings with the SEC. Forward-looking statements relate to the date initially made, and Kohl’s undertakes no obligation to update them. Non-GAAP Financial Measures In addition, this presentation contains non-GAAP financial measures, including Adjusted EPS, Adjusted Net Income, and Free Cash Flow. Reconciliations of all non-GAAP measures to the most directly comparable GAAP measures are included in the Appendix of this presentation. 2

Q1 2022 Results Presentation Q1 2022 Results 4 Updated 2022 Outlook 10 Our Strategy 12 3

Q1 2022 Results 4

Q1 2022 Summary Key Takeaways • Q1 results were below our expectations. The quarter started off strong with positive low-single digits comp growth through late March, however in April demand considerably weakened as we lapped last year’s stimulus and as consumers started to experience inflationary pressures • Recent trends in May have notably improved as we moved past key stimulus weeks from last year and as the weather turned favorable, which has accelerated demand for our spring seasonal classifications • The 200 stores with Sephora at Koh's shops delivered positive low-single digits comp store sales growth for the quarter • The sale process is ongoing with due diligence entering the final phase. The Board has requested that the multiple parties submit fully-financed bids in the coming weeks Q1 2022 • Net sales decreased by (5%) versus Q1 2021 • Gross margin decreased (69 bps) compared to last year due to increased freight costs • SG&A expense increased 10.5% in Q1, driven largely by investments in key strategic initiatives, including Sephora store openings and store refreshes, as well as expenses related to the proxy contest and ongoing sale process, and higher wages and transportation costs • Operating margin of 2.2% in Q1 2022 with diluted earnings per share of $0.11 • Inventory increased 40% to last year due primarily to the investment in beauty inventory to support the 200 Sephora shops opened last Fall as well as the Sephora openings this year, higher in-transit and pack and hold inventory 5 5

Q1 Key Metrics Consolidated Statement of Operations Three Months Ended (Dollars in Millions) April 30, 2022 May 1, 2021 Net Sales $ 3,471 $ 3,662 Total Revenue 3,715 3,887 Gross Margin Rate 38.3% 39.0% SG&A 1,293 1,170 Depreciation 200 211 Operating Income 82 273 Interest Expense 68 67 Loss on extinguishment of debt — 201 Benefit for Income Taxes — (9) Net Income 14 14 Diluted EPS $0.11 $0.09 (1) 14 165 Adjusted Net Income (Non-GAAP) (1) $0.11 $1.05 Adjusted Diluted EPS (Non-GAAP) Key Balance Sheet Items April 30, 2022 May 1, 2021 (Dollars in Millions) Cash and Cash Equivalents $ 646 $ 1,609 Merchandise Inventories 3,736 2,667 Accounts Payable 1,679 1,378 Current portion of Long-term debt 164 0 Long-term Debt 1,746 1,909 Key Cash Flow items Three Months Ended (Dollars in Millions) April 30, 2022 Operating Cash Flow $ (460) Capital Expenditures (221) Net, Finance lease and Financing obligations (25) (1) $ (706) Free Cash Flow (1)-Free Cash Flow, Adjusted Net Income, and Adjusted EPS are non-GAAP financial measures. Please refer to the reconciliations included in the Appendix for more information. 6 Amounts shown for Adjusted Net Income and Adjusted EPS for the three months ended April 30, 2022 are GAAP as there are no adjustments to Non-GAAP. These amounts are shown for comparability purposes.

Q1 2022 Gross Margin & SG&A Expense Performance Gross Margin SG&A Expense Decreased (69 bps) versus Q1 2021 Deleveraged (468 bps) vs Q1 2021 39.0% $1,293M $1,170M 38.3% % Total 30.1% 34.8% Revenue Q1 2021 Q1 2022 Q1 2021 Q1 2022 Q1 2022 Gross Margin Takeaways Q1 2022 SG&A Takeaways Higher freight costs due to global supply chain challenges Growth investments in our stores, including Sephora and store refreshes totaling nearly $50 million Continue to benefit from ongoing pricing and promotional optimization strategies Higher wages and transportation costs Expenses related to proxy contest and ongoing sale process 7

Q1 Inventory driven largely by unique factors $3,736M +$441M +$82M +$214M +$332M $2,667M Q1 2021 Sephora / Beauty In-Transit Pack & Hold Core Q1 2022 Q1 2022 Inventory Increased 40% Y/Y Driven By: • The investment in beauty inventory to support the 200 Sephora shops opened last Fall as well as the Sephora openings this year • In-transit inventory increased as we incorporated additional transportation time to ensure we meet consumer demand • Pack & hold strategies were leveraged for late holiday receipts including sleepwear and fleece • Excluding these three unique factors, inventory would be up 16.5% to last year, but down (15%) to Q1 2019 8

Sephora at Kohl’s continues to drive impressive results in Q1 • Positive low-single digits comp growth in the 200 stores with Sephora • Sales strength across all categories, including Skincare, Makeup, and Fragrance • 400 Sephora stores to open in 2022 (48 stores opened during the last week of April, nearly 300 planned in Q2 and remainder in early August) • Continue to target $2 billion in sales by 2025 9

Updated 2022 Outlook 10

2022 Updated Outlook Metric Full Year Guidance Flat to +1% increase Net Sales versus 2021 Operating Margin 7.0% to 7.2% EPS $6.45 to $6.85 Capital Allocation Strategy • Capex: ~$850 million • Dividend: $0.50 quarterly dividend payable on June 22, 2022 • Share Repurchase Program: As part of its $3.0 billion share repurchase authorization, the Company plans to repurchase at least $1.0 billion in shares in 2022, of which $500 million is expected to be repurchased through an ASR program executed in Q2 2022 11

Our Strategy 12
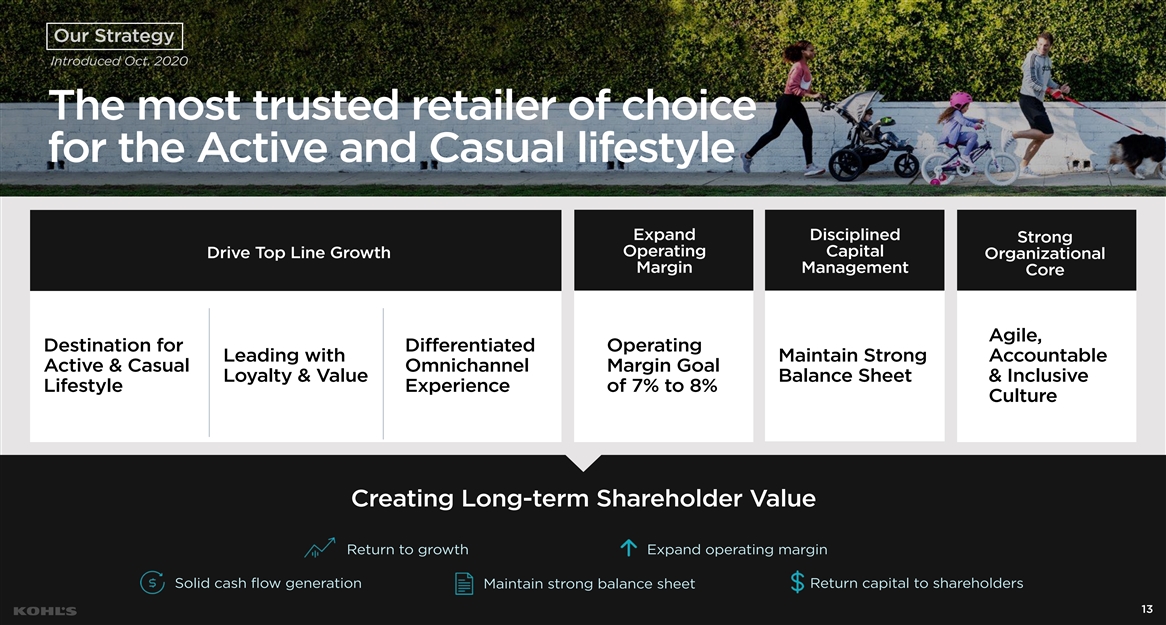
Our Strategy Introduced Oct. 2020 The most trusted retailer of choice for the Active and Casual lifestyle Expand Disciplined Strong Operating Capital Drive Top Line Growth Organizational Margin Management Core Agile, Destination for Differentiated Operating Leading with Maintain Strong Accountable Active & Casual Omnichannel Margin Goal Loyalty & Value Balance Sheet & Inclusive Lifestyle Experience of 7% to 8% Culture Creating Long-term Shareholder Value Return to growth Expand operating margin Solid cash flow generation Return capital to shareholders Maintain strong balance sheet 13

Committed to Creating Value Kohl’s Financial Framework 1 SALES GROWTH OPERATING MARGIN EPS GROWTH Low-Single Mid-to-High 7% to 8% + = Digits % Single Digits % Capital Allocation Principles Strong Significant Capital Invest in Growth Balance Sheet Returns (1) Mid-to-High single digits EPS growth off of FY22 base 14 14

Multiple initiatives to support sales growth Destination for the Grow Sephora to a Leading with Differentiated Active & Casual Lifestyle $2 Billion Business Loyalty & Value Omnichannel Experience • Fuel growth in Active to at least 30% • Sephora at Kohl’s will become a leading • Kohl’s Cash: Iconic and differentiated • Planning to open 100+ new smaller of sales, driven by key national brands beauty destination as we expand to 850 loyalty device that provides a fly-wheel format stores in next four years, (Nike, Under Armour, and Adidas) stores by 2023 (600 open by Fall 2022) effect on customer return visits expanding reach with $500M+ sales opportunity • Reignite growth in Women’s • Positive low-single digits % comps in • Kohl’s Rewards: 30M+ loyalty members 200 Sephora at Kohl’s locations in Q1 spend 2x more than non-loyalty • Expanding omni capabilities in stores • Lead in Women’s casual apparel members (e.g. self-service BOPUS in all stores in • Sephora is driving new, younger and • Lean into adjacent categories 2022, piloting self-service returns in 100 more diverse customers to Kohl’s (25% • Kohl’s Card: Industry-leading private (dresses, swim) stores, and testing self-service of Sephora customers are new to label credit card checkout) • Amplify inclusivity Kohl’s) • Enhanced rewards to get 50% more • Enhancing digital experience to drive • Strong, differentiated brand and • Drive innovation across partnership on every purchase (7.5%) growth category portfolio (cross company BOPUS, impulse • Launching co-branded card merchandising) • Expanded online assortment • Scale new, traffic driving brands • Loyalty platform drives enhanced • Kohl’s Media Network • Deliver through quality private brands personalized marketing and efficiencies • Pipeline of newness and discovery Driving Sustainable Low-Single-Digits % Sales Growth 15

Multiple initiatives to support sales growth in 2022 and beyond… +LSD% Growth $18,471 Net Sales (in millions) 1 2 3 4 5 2021 Sephora New Stores Other Initiatives Displacement 2026 1. Sephora sales goal of $2 billion by 2025 from a base of less than $200 million in 2021. 2. New store sales opportunity of $500 million plus as company opens 100 or more new smaller format stores during 2022-2025 3. Other initiatives include Women’s growth as well as digital and loyalty, distinct from sales generated in new stores. 4. Displacement includes pre-Sephora beauty business at Kohl’s (800 sq. ft. in-store and online), as well as additional square footage in stores impacted by launch of 2,500 sq. ft. Sephora shops (e.g. fine jewelry, men’s dress, and accessories) 16 5. 2026 referenced to capture the majority of the key sales initiatives as outlined in the company’s recent investor day presentation. Chart assumes mid-point of 2022 sales guidance of 2-3%, as well as mid-point of long-term sales guidance of low-single digits % for 2023-2026.

Sephora at Kohl’s is driving impressive results Positive low-single digits comps $2 billion in the 200 stores with sales goal by 2025 Sephora in Q1 • Sephora becomes Kohl’s exclusive beauty partner online and in at least 850 stores • 200 Sephora shops opened in 2021 and opening an additional 400 in 2022 and 250 in 2023 • Innovating and testing to drive engagement including cross- company BOPUS, impulse merchandising, and Men’s offering 50% of Sephora • Partnership structured to drive joint success with equal share baskets Highly accretive to in the operating profit operating margin have an additional • Large cross-selling opportunity with 50% of Sephora baskets category purchased having an additional category purchased • Significant return on investment (capex per store of ~$850k) with expected payback period of less than 3.5 years 17

New store expansion opportunity allows Kohl’s to expand reach Smaller Format $500M+ primarily 35k sq ft sales opportunity New Store Economics • 100+ new small store openings planned in the next four years allowing Kohl’s to reach smaller markets • Testing new experiences, including more localized assortments and Sephora at Kohl’s in smaller stores 5 stores • Expansion follows successful pilot of 20+ smaller stores opening in 2022 15%+ Tacoma, WA • Avg. fulfilled sales per store of $5M Morgantown, WV targeted return Lenox, MA • Avg. 4-wall cash flow of ~$1.0M per store San Angelo, TX Bonney Lake, WA • Solid targeted return on investment (capex per store of ~$5M) with expected payback period of 5 years 18

Fundamental business model improvements in place, driving a consistent 7% to 8% operating margin Gross Margin Drivers SG&A Expense Management Initiatives • Drive inventory turn of 4.0x+ Transform labor across • Scale self-service across chain • Dynamic inventory allocation stores and fulfillment Inventory Management • Drive productivity across fulfillment centers to mitigate • Strategic focus on more productive centers wage inflation categories • Continue to leverage our centralized • Goal to lower spend ratio to 4.0% of Build on initial success sourcing and direct factory negotiations sales or below Sourcing Cost Savings in improving marketing • Developing strategies to further reduce • Reduced marketing expenses by more + efficiency reliance on third party agents than $130M since 2019 • Simplified pricing while reducing • Reduced technology expenses by more promoted offers than $100M since 2019 Optimizing Price / Focused on maintaining Promotion Strategies technology efficiency • Greater deployment of targeted and • Rebalanced technology staff with more personalized offers internal labor Gross Margin 36% to 37% SG&A Expense Ratio 27% to 28% We are confident in our ability to navigate ongoing margin pressure from cost inflation, higher freight expense, wage investments, and increasing digital penetration 19

Significant cash flow generation allows investment in high ROI growth initiatives… Strong Expected Cash Flow … … Which Goes Towards Impactful Organic Investments 1 2 Sephora Opportunity New Store Expansion Operating Cash Flow • $2B sales opportunity • $500M+ sales opportunity • Will be in 850+ locations by 2023 • 100+ smaller format stores in next four ~$5.5B+ years • Drives overall traffic and new customer 2022-2024E acquisition • Injecting localization and new initiatives to broaden reach 3 4 Technology Enhancing Supply Chain Free Cash Flow • Kohl’s Media Network • Distribution network optimization • Store automation • Strategic sourcing opportunities ~$2.5B • Localization • Improved inventory management 2022-2024E • Personalization We have developed a powerful data analytics engine which will enable us to invest our substantial cash flow in the highest-growth opportunities Note: Operating Cash Flow defined as cash flow from operations; free cash flow defined as operating cash flow less capex and finance lease and financing obligation payments. 20

…And commitment to returning capital to shareholders $2.3B+ of Expected Share Repurchases Doubled the Annual Dividend in 2022 in 2021 and 2022 ($ in mm) ($ per share) $2.00 $1.35B $1.0B+ $1.00 2021 2022 2021 2022 • Repurchased ~$13B in shares since 2006, reducing share count by ~60% • Distributed $3.4B in dividends since 2011 • Announced $3B share repurchase authorization in 2022 • Announced 100% increase in dividend per share in 2022 • Plan to repurchase at least $1B shares in fiscal 2022, with $500M • Remain committed to growing our dividend over time expected to be repurchased in Q2 2022 (1) Direct peers include Macy’s, Nordstrom, and Dillard’s. 21
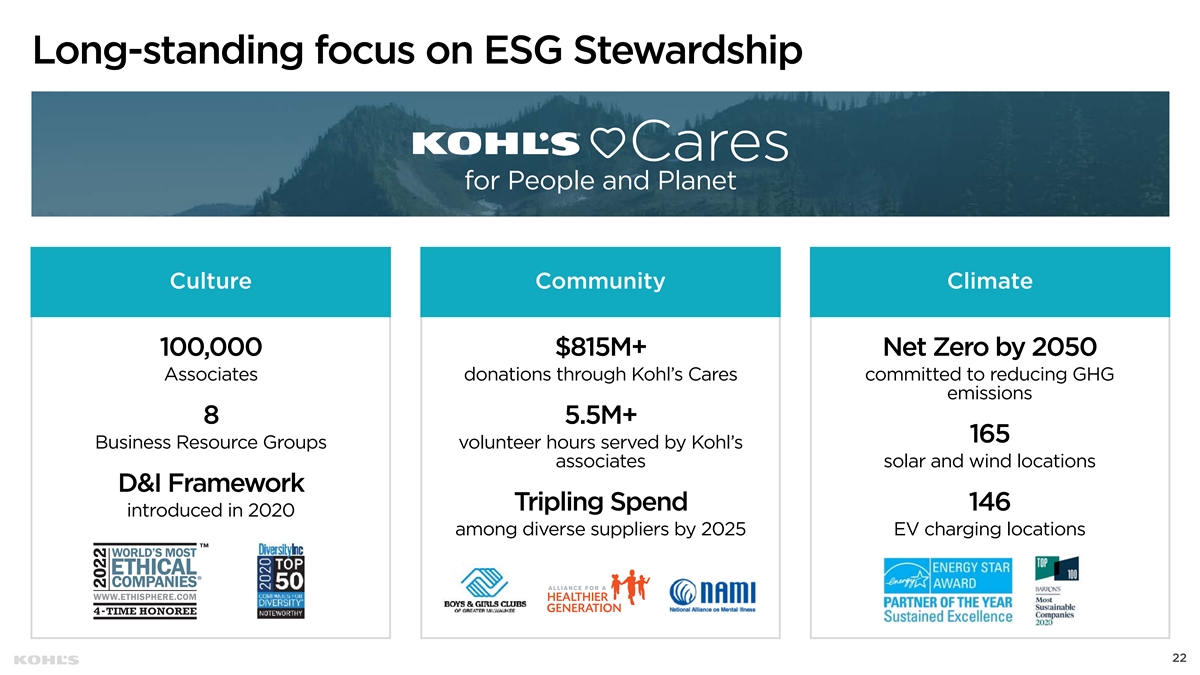
Long-standing focus on ESG Stewardship Culture Community Climate 100,000 $815M+ Net Zero by 2050 Associates donations through Kohl’s Cares committed to reducing GHG emissions 8 5.5M+ 165 Business Resource Groups volunteer hours served by Kohl’s associates solar and wind locations D&I Framework Tripling Spend 146 introduced in 2020 among diverse suppliers by 2025 EV charging locations 4 22

Appendix 23

Reconciliations Adjusted Net Income and Diluted Earnings per Share, Non-GAAP Financial Measures (unaudited) Three Months Ended (Dollars in Millions, Except per Share Data) April 30, 2022 May 1, 2021 Net Income GAAP $ 14 $ 14 Impairments, store closing, and other — 201 Income tax impact of items noted above — (50) Adjusted (non-GAAP) $ 14 $ 165 Diluted Earnings per Share April 30, 2022 May 1, 2021 $ 0.11 $ 0.09 GAAP Loss on extinguishment of debt — 1.29 Income tax impact of items noted above — (0.33) Adjusted (non-GAAP) $ 0.11 $ 1.05 24
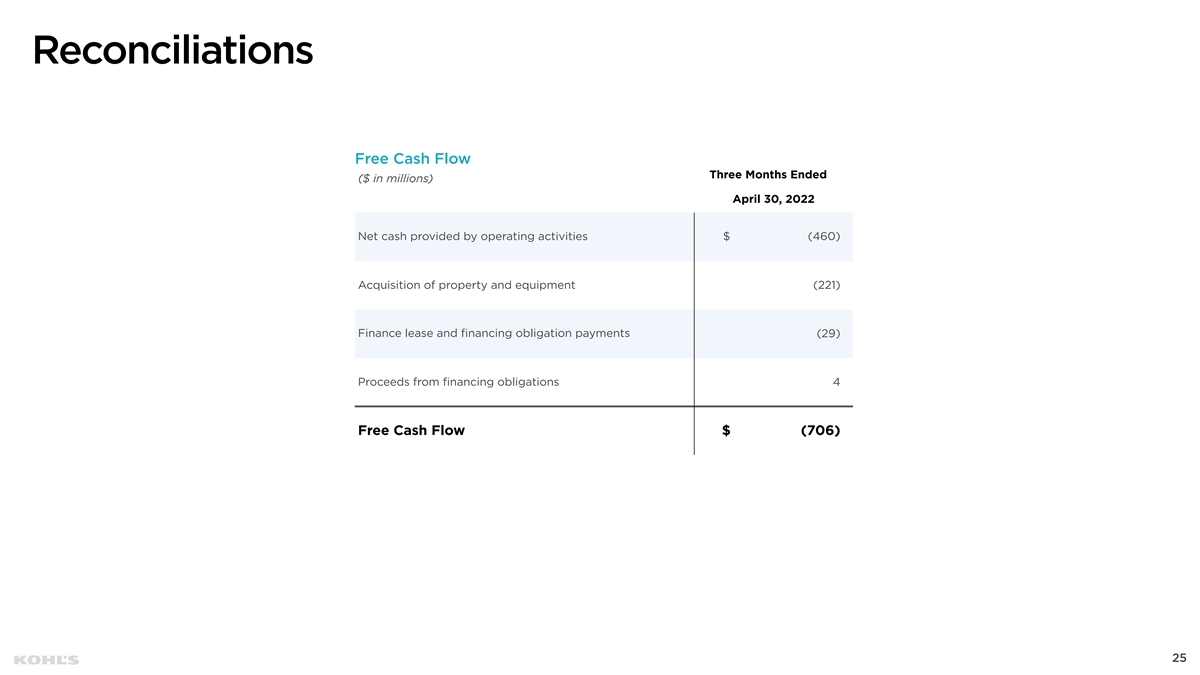
Reconciliations Free Cash Flow Three Months Ended ($ in millions) April 30, 2022 Net cash provided by operating activities $ (460) Acquisition of property and equipment (221) Finance lease and financing obligation payments (29) Proceeds from financing obligations 4 Free Cash Flow $ (706) 25

Serious News for Serious Traders! Try StreetInsider.com Premium Free!
You May Also Be Interested In
- Form 8.5 (EPT/RI) - Renalytix plc
- Mountain City Christian Academy Celebrates Student Athlete Faith Carter’s College Signing
- HostScore Conducts Extensive ScalaHosting Web Server Load Testing, Offering Insights on Performance of Cloud Servers in Comprehensive Reviews
Create E-mail Alert Related Categories
SEC FilingsSign up for StreetInsider Free!
Receive full access to all new and archived articles, unlimited portfolio tracking, e-mail alerts, custom newswires and RSS feeds - and more!
