

Form 8-K James River Group Holdin For: May 11
 Tweet
Tweet Share
Share
Exhibit 99.1

Investor Presentation May 2021

Disclosure Forward - Looking Statements This presentation contains forward - looking statements as that term is defined in the Private Securities Litigation Reform Act of 1995 . In some cases, such forward - looking statements may be identified by terms such as believe, expect, seek, may, will, intend, project, anticipate, plan, estimate, guidance or similar words . Forward - looking statements involve risks and uncertainties that could cause actual results to differ materially from those in the forward - looking statements . Although it is not possible to identify all of these risks and factors, they include, among others, the following : the inherent uncertainty of estimating reserves and the possibility that incurred losses may be greater than our loss and loss adjustment expense reserves ; inaccurate estimates and judgments in our risk management may expose us to greater risks than intended ; downgrades in the financial strength rating of our regulated insurance subsidiaries may impact our ability to attract and retain insurance and reinsurance business that our subsidiaries write, our competitive position, and our financial condition ; the potential loss of key members of our management team or key employees and our ability to attract and retain personnel ; adverse economic factors resulting in the sale of fewer policies than expected or an increase in the frequency or severity of claims, or both ; reliance on a select group of brokers and agents for a significant portion of our business and the impact of our potential failure to maintain such relationships ; reliance on a select group of customers for a significant portion of our business and the impact of our potential failure to maintain, or decision to terminate, such relationships ; our ability to obtain reinsurance coverage at prices and on terms that allow us to transfer risk and adequately protect our company against financial loss ; losses resulting from reinsurance counterparties failing to pay us on reinsurance claims, insurance companies with whom we have a fronting arrangement failing to pay us for claims, or a former customer with whom we have an indemnification arrangement failing to perform their reimbursement obligations ; inadequacy of premiums we charge to compensate us for our losses incurred ; changes in laws or government regulation, including tax or insurance law and regulations ; the ongoing effect of Public Law No . 115 - 97 , informally titled the Tax Cuts and Jobs Act, which may have a significant effect on us including, among other things, by potentially increasing our tax rate, as well as taxes on our shareholders ; in the event we do not qualify for the insurance company exception to the passive foreign investment company (“PFIC”) rules and are therefore considered a PFIC, there could be material adverse tax consequences to an investor that is subject to U . S . federal income taxation ; the Company or any of its foreign subsidiaries becoming subject to U . S . federal income taxation ; a failure of any of the loss limitations or exclusions we utilize to shield us from unanticipated financial losses or legal exposures, or other liabilities ; losses from catastrophic events, such as natural disasters and terrorist acts, which substantially exceed our expectations and/or exceed the amount of reinsurance we have purchased to protect us from such events ; the effects of the COVID - 19 pandemic and associated government actions on our operations and financial performance ; potential effects on our business of emerging claim and coverage issues ; exposure to credit risk, interest rate risk and other market risk in our investment portfolio ; the potential impact of internal or external fraud, operational errors, systems malfunctions or cyber security incidents ; our ability to manage our growth effectively ; failure to maintain effective internal controls in accordance with Sarbanes - Oxley Act of 2002 , as amended (“Sarbanes - Oxley”) ; and changes in our financial condition, regulations or other factors that may restrict our subsidiaries’ ability to pay us dividends . Additional information about these risks and uncertainties, as well as others that may cause actual results to differ materially from those in the forward - looking statements, is contained in our filings with the U . S . Securities and Exchange Commission ("SEC"), including our Annual Report on Form 10 - K filed with the SEC on February 26 , 2021 and our Quarterly Report on Form 10 - Q filed with the SEC on May 5 , 2021 . These forward - looking statements speak only as of the date of this release and the Company does not undertake any obligation to update or revise any forward - looking information to reflect changes in assumptions, the occurrence of unanticipated events, or otherwise . Non - GAAP Financial Measures This presentation contains non - GAAP financial measures as defined by Regulation G of the rules of the SEC . These non - GAAP measures, such as underwriting profit, adjusted net operating income, tangible equity and adjusted net operating return on average tangible equity (which is calculated as adjusted net operating income divided by the average tangible equity for the trailing five quarters) are not in accordance with, nor are they a substitute for, GAAP measures . We believe these non - GAAP measures provide users of our financial information useful insight into our performance . Investors should consider non - GAAP measures in addition to, and not as a substitute for, or superior to, the comparable GAAP measures . Please refer to pages 29 & 30 of this presentation for a reconciliation of the non - GAAP financial measures to the equivalent GAAP equivalents . Ratings Disclaimer Notice Reproduction of any information, data or material, including ratings (“Content”) in any form is prohibited except with the prior written permission of the relevant party . Such party, its affiliates and suppliers (“Content Providers”) do not guarantee the accuracy, adequacy, completeness, timeliness or availability of any Content and are not responsible for any errors or omissions (negligent or otherwise), regardless of the cause, or for the results obtained from the use of such Content . In no event shall Content Providers be liable for any damages, costs, expenses, legal fees, or losses (including lost income or lost profit and opportunity costs) in connection with any use of the Content . A reference to a particular investment or security, a rating or any observation concerning an investment that is part of the Content is not a recommendation to buy, sell or hold such investment or security, does not address the suitability of an investment or security and should not be relied on as investment advice . Credit ratings are statements of opinions and are not statements of fact . Market and Industry Data This presentation includes market and industry data, forecasts and projections . We have obtained certain market and industry data from publicly available industry publications . These sources generally state that the information they provide has been obtained from sources believed to be reliable, but that the accuracy and completeness of the information are not guaranteed . The forecasts and projections are based on historical market data, and there is no assurance that any of the forecasts or projected amounts will be achieved . 2
Executive Summary
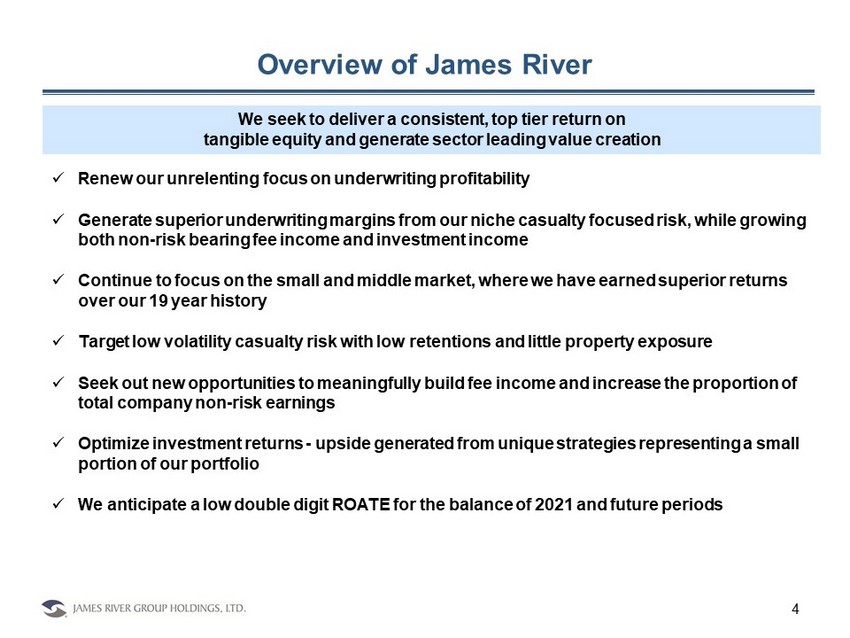
4 Overview of James River x Renew our unrelenting focus on underwriting profitability x Generate superior underwriting margins from our niche casualty focused risk, while growing both non - risk bearing fee income and investment income x Continue to focus on the small and middle market, where we have earned superior returns over our 19 year history x Target low volatility casualty risk with low retentions and little property exposure x Seek out new opportunities to meaningfully build fee income and increase the proportion of total company non - risk earnings x Optimize investment returns - upside generated from unique strategies representing a small portion of our portfolio x We anticipate a low double digit ROATE for the balance of 2021 and future periods We seek to deliver a consistent, top tier return on tangible equity and generate sector leading value creation

First Quarter 2021 Review Strong quarterly rate of growth in Core E&S ( 1 ) ( 36 % GWP vs Q 1 2020 ) o Core E&S GWP has doubled in size over past two years o Obtained a 15 % renewal rate increase during the quarter, the 17 th consecutive quarter of rate increases, representing a compound aggregate rate increase of 36 % over that period Specialty Admitted segment GWP increased 24 % during Q 1 2021 as recently added fronted programs continue to mature and expand o Fee income generated by the Specialty Admitted segment increased 22 % in Q 1 2021 over the same period last year We recorded $ 170 . 1 M of adverse development on prior accident year loss reserves, driven by commercial auto ( $ 170 . 0 M, primarily from one large runoff account) and our Casualty Reinsurance segment ( $ 2 . 5 M), offset by favorable development in Core E&S ( $ 1 . 4 M) and the Specialty Admitted segment ( $ 1 . 0 M) o We believe the overhang related to commercial auto has been eliminated, and that we are now fully able to focus on our prospective business and what continues to be a historically strong E&S marketplace Tangible Book Value per Share ( 2 ) of $ 14 . 00 , a decrease of 26 % from December 31 , 2020 , before the deduction of dividends, due to a net loss of $ 103 . 5 M and after - tax unrealized losses in the Company's fixed income investment portfolio of $ 42 . 7 M due to an increase in interest rates during the quarter o Tangible Book Value Per Share ( 2 ) excluding AOCI of $ 12 . 42 , a decrease of 23 % from December 31 , 2020 , before the deduction of dividends COVID - 19 and natural catastrophes (including Q 1 winter storms) have had little impact on our business 5 (1) Core E&S represents the Excess and Surplus Lines segment excluding commercial auto. (2) Tangible book value per share is a Non - GAAP Financial Measure. Please see reconciliation of GAAP to Non - GAAP measures in the App endix.

6 Commercial Auto Overview: Timeline • Recorded $170.0M in adverse development related to terminated commercial auto account • Meaningful change in actuarial methodologies using experience development methods only, giving more weight to incurred data • Surge in paid and incurred losses in Q4 2020 and Q1 2021 following delays in reporting due to COVID - 19 and higher severity • Most recent adverse development stems from accident years 2018 and 2019 • In Q 1 2021 , we continued to experience paid and incurred loss emergence which meaningfully exceeded expectations in our runoff large commercial auto account that we cancelled effective December 31 , 2019 • In response, we meaningfully adjusted our actuarial methodologies using our own loss experience in paid and incurred projections and giving greater weight to incurred methods, resulting in a significant strengthening of reserves ( $ 170 . 0 M pre - tax) • As noted, this account has been in run - off and has not produced any GWP since 2019 ( 1 ) • We believe this overhang has been eliminated, and that we are now fully able to focus on our prospective business and what continues to be a historically strong E&S market Commercial Auto Account Timeline Commercial auto represents 28% of consolidated GWP We delivered early notice of termination to the large account on 10/8/19 effective 12/31/19 following poor underwriting performance, changes to the risk and a desire to refocus on our Core E&S business We begin insuring rideshare business including one commercial auto account which grew significantly in later years Large account produced no premium; commercial auto represents 2 % of consolidated GWP (1) 2013 2019 2020 Large account produced no premium; commercial auto represents 2% of consolidated YTD GWP (1) 2021 (1) The large commercial auto account in runoff represents the bulk of our commercial auto gross written premiums. None of the remaining commercial auto business we write is exposed to the “ride - share” sector.

7 Commercial Auto Overview: Claims and Reserves Statistics ~8,000 Current Open Claims Closing ~100 Claims Per Week Closed >400K Claims Over $55K Average Reserve Per Open Claim Meaningfully Higher Than $39K Net Paid Per Open Claim Since 1/1/21 Infrequent Newly Reported Claims in Runoff Portfolio; No Accidents Insured After 12/31/2019 Closing Run - off Related Claims Quickly Current Reserve Mix: 42% IBNR 58% Case Meaningful IBNR Balance For Book in Run Off Since FY 2019 Recent claims emergence pattern and internal actuarial work gives us significant comfort around current carried reserves $450M Current Commercial Auto Reserves Reserve Balance Increased +33% Since Q4 2020 Reserves are Greater than Carried Reserves at 12/31/2019 Closed ~60% of Open Claims Since Large Account Went Into Run Off in December 2019

8 Capital Position (1) Net proceeds on a $200M primary common equity raise at $31/ share. (2) Leverage ratio, in accordance with the Company’s credit agreements, is calculated as adjusted consolidated debt / total capit al. Adjusted consolidated debt treats hybrid securities as equity capital up to 15% of total capitalization. Total capital is defined as total debt plus tangible equity excluding accumulated other comprehensive income. (3) NWP for the trailing twelve month period. Commentary • Completed equity raise has bolstered the balance sheet to position the business for profitable growth at current strong pace to generate a compelling return on tangible equity • Provided for continued growth at current pace, while maintaining operating and financial leverage ratios within recent historical ranges o Operating leverage of 1.2x – 1.5x and financial leverage of 25% – 33% • Our Core E&S and Specialty Admitted Businesses continue to be our main sources of growth and drive our anticipated returns of a low double digit ROATE Our newly fortified balance sheet enables us to continue to capitalize on tailwinds from a hard P&C market and a re - opening economy ($ and shares in M) Q1 2021 Pro Forma Q4 2020 Q1 2021 Raise (1) Assets Cash and Cash Equivalents $162.3 $183.5 $374.2 Goodwill and Intangible Assets 218.2 218.1 218.1 Total Assets 5,063.1 5,109.7 5,300.5 Liabilities and Shareholders' Equity Reserve for Losses and Loss Adjustment Expenses 2,192.1 2,413.8 2,413.8 Senior Debt 262.3 262.3 262.3 Junior Subordinated Debt 104.1 104.1 104.1 Total Debt 366.4 366.4 366.4 AOCI 81.9 39.2 39.2 Total Shareholders' Equity 795.6 639.6 830.4 Total Tangible Shareholders' Equity 577.4 421.5 612.2 BVPS $25.96 $20.78 $22.31 TBVPS $18.84 $13.70 $16.45 Shares Outstanding 30.6 30.8 37.2 Leverage Ratio (2) 30% 35% 28% NWP / Tangible Shareholders' Equity (3) 1.12x 1.63x 1.12x
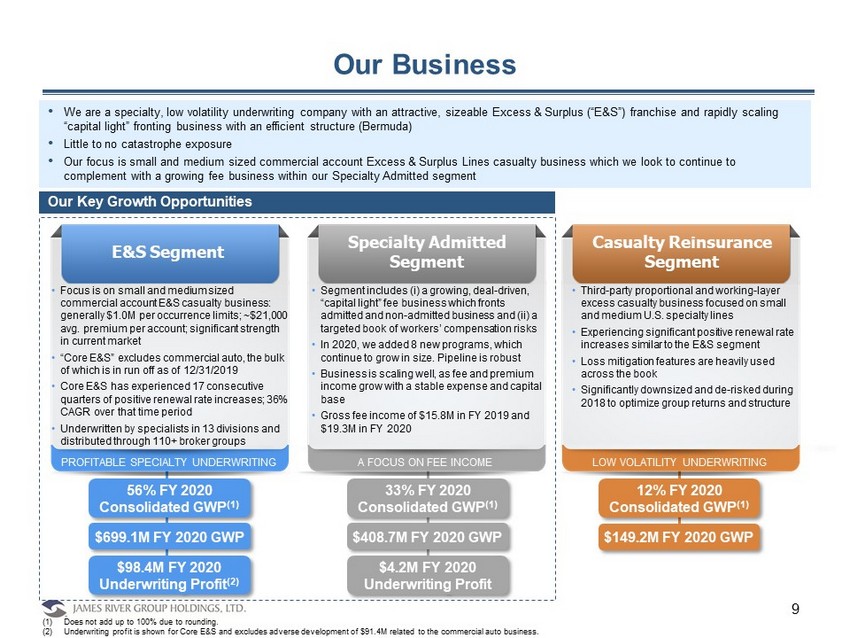
9 Our Business E&S Segment Specialty Admitted Segment Casualty Reinsurance Segment • Focus is on small and medium sized commercial account E&S casualty business: generally $1.0M per occurrence limits; ~$21,000 avg. premium per account; significant strength in current market • “Core E&S” excludes commercial auto, the bulk of which is in run off as of 12/31/2019 • Core E&S has experienced 17 consecutive quarters of positive renewal rate increases; 36% CAGR over that time period • Underwritten by specialists in 13 divisions and distributed through 110+ broker groups • Segment includes ( i ) a growing, deal - driven, “capital light” fee business which fronts admitted and non - admitted business and (ii) a targeted book of workers’ compensation risks • In 2020, we added 8 new programs, which continue to grow in size. Pipeline is robust • Business is scaling well, as fee and premium income grow with a stable expense and capital base • Gross f ee income of $15.8M in FY 2019 and $19.3M in FY 2020 • Third - party proportional and working - layer excess casualty business focused on small and medium U.S. specialty lines • Experiencing significant positive renewal rate increases similar to the E&S segment • Loss mitigation features are heavily used across the book • Significantly downsized and de - risked during 2018 to optimize group returns and structure PROFITABLE SPECIALTY UNDERWRITING A FOCUS ON FEE INCOME LOW VOLATILITY UNDERWRITING • We are a specialty, low volatility underwriting company with an attractive, sizeable Excess & Surplus (“E&S”) franchise and r api dly scaling “capital light” fronting business with an efficient structure (Bermuda) • Little to no catastrophe exposure • Our focus is small and medium sized commercial account Excess & Surplus Lines casualty business which we look to continue to complement with a growing fee business within our Specialty Admitted segment 56% FY 2020 Consolidated GWP (1) 33% FY 2020 Consolidated GWP (1) 12% FY 2020 Consolidated GWP (1) $699.1M FY 2020 GWP $408.7M FY 2020 GWP $149.2M FY 2020 GWP Our Key Growth Opportunities (1) Does not add up to 100% due to rounding. (2) Underwriting profit is shown for Core E&S and excludes adverse development of $91.4M related to the commercial auto business. $98.4M FY 2020 Underwriting Profit (2) $4.2M FY 2020 Underwriting Profit

$189.9 $218.1 $234.9 $260.8 $282.2 $334.4 $516.8 $669.1 $20.6 $59.4 $91.0 $182.2 $316.4 $374.3 $387.6 $408.7 2013 2014 2015 2016 2017 2018 2019 2020 Core E&S Specialty Admitted Commercial Auto Casualty Re 10 Attractive Growth Businesses • Already hard E&S market poised for continued profitable growth as new businesses replace failed businesses in the wake of COVID - 19, and are forced to find insurance coverage in the E&S market given their lack of insurance loss history • Our primary businesses (Core E&S and Specialty Admitted) have been profitably growing and consistently since 2013, and represented 86% of gross written premiums in 2020 • Core E&S has doubled in size over the past 2 years • Core E&S is benefiting from significant rate hardening and strong submission flow as major industry competitors retrench and standard market writers recalibrate their risk appetite Historical GWP ($M) (1) Quarterly Core E&S Renewal Rate Increases Growing businesses % of Consolidated GWP: 57% 53% 60% 55 % 57% 61 % 61% 86 % Compound aggregate rate increases on renewal book last 17 quarters = 36% (1) The large commercial auto account in runoff represents the bulk of our commercial auto gross written premiums. None of the re mai ning commercial auto business we write is exposed to the “ride - share” sector. 13% 2% 2% 10% 3% 5% 6% 6% 14% 19% 13% 9% 15% Q1 '18 Q2 '18 Q3 '18 Q4 '18 Q1 '19 Q2 '19 Q3 '19 Q4 '19 Q1 '20 Q2 '20 Q3 '20 Q4 '20 Q1 '21
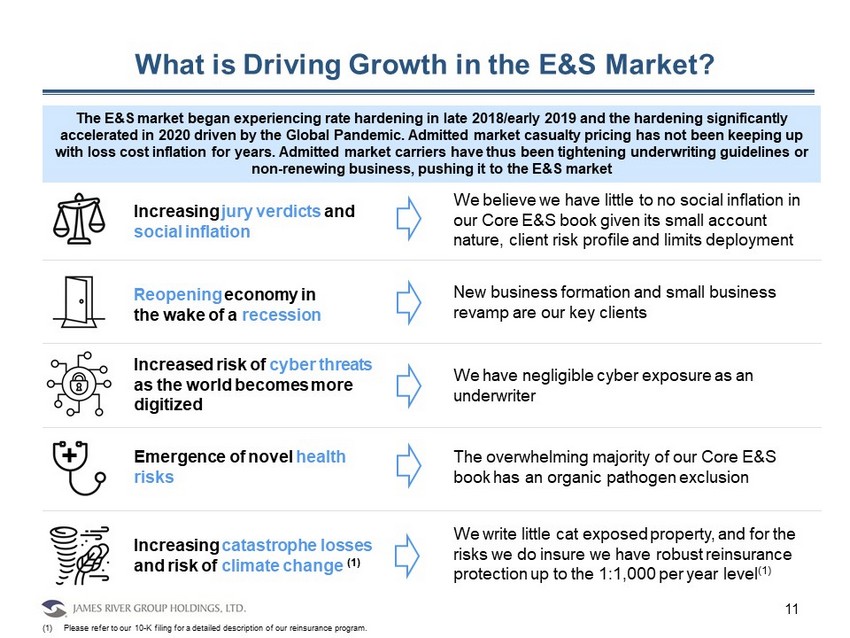
11 What is Driving Growth in the E&S Market? The E&S market began experiencing rate hardening in late 2018/early 2019 and the hardening significantly accelerated in 2020 driven by the Global Pandemic. Admitted market casualty pricing has not been keeping up with loss cost inflation for years. Admitted market carriers have thus been tightening underwriting guidelines or non - renewing business, pushing it to the E&S market Increasing jury verdicts and social inflation Reopening economy in the wake of a recession Increased risk of cyber threats as the world becomes more digitized Emergence of novel health risks Increasing catastrophe losses and risk of climate change (1) + (1) Please refer to our 10 - K filing for a detailed description of our reinsurance program. We believe we have little to no social inflation in our Core E&S book given its small account nature, client risk profile and limits deployment New business formation and small business revamp are our key clients We have negligible cyber exposure as an underwriter The overwhelming majority of our Core E&S book has an organic pathogen exclusion We write little cat exposed property, and for the risks we do insure we have robust reinsurance protection up to the 1:1,000 per year level (1)

12 Building a Best - in - Class Core E&S Business Core E&S Initial and Developed Accident Year Loss Ratios Core E&S Calendar Year Loss Ratio vs. Surplus Line Specialists Peer Group (1) AYs have developed favorably by over 8 points on average since 2013 Specialist Peer Group 2007 – 2020 Average Loss Ratio: 61% JRVR 2007 – 2020 Average Loss Ratio: 57% JRVR has generated over 4 points of underwriting alpha vs. peer group Source: Company filings, A.M. Best data and research, and S&P Global Market Intelligence (and its affiliates, as applicable). (1) Specialists Peer Group = Alleghany Insurance Holdings Group, Argo Group, Crum & Forster Insurance Group, Global Indemnity Gro up, HIIG Group, Houston Casualty Group, IFG Companies, Kinsale Insurance Company, Markel Corporation Group, RLI Group, W.R. Berkley Insurance Group. 69% 71% 76% 72% 67% 69% 71% 62% 59% 56% 66% 65% 57% 61% 65% 62% 2013 2014 2015 2016 2017 2018 2019 2020 Initial Loss "Pick" Current Loss Ratio 56% 61% 63% 55% 49% 53% 40% 52% 57% 55% 58% 67% 69% 57% 64% 59% 60% 64% 66% 57% 60% 56% 60% 63% 63% 61% 2007 2008 2009 2010 2011 2012 2013 2014 2015 2016 2017 2018 2019 JRVR Core E&S Loss Ratio Specialist Peer Group Calendar paid and reported loss ratios continued to be extremely low in recent periods; 16.4% and 31.7%, respectively for Q1 202 1, following 26.4% and 30.0%, respectively, for full year 2020 o Q1 calendar paid and reported loss ratios are over 20 points and 23 points lower, respectively, than 2017 and 2018 averages o In the last 12 months of claims, frequency is 20% - 30% lower than prior periods and severity remains benign o We assume that this decline in frequency is temporary in our 2021 loss picks and don’t believe we will experience a catchup i n r eported claims from the 2020 accident year

Specialty Admitted Segment: Growth in Process 13 Fronted Programs GWP ($M) Fee Income ($M) • Fronting business continues to experience meaningful growth as recently added programs mature and expand • Eight new programs added Q2 - Q4 2020 will continue to ramp through 2021 • Capital light, deal - driven business with limited risk retention • Lower risk fee - income business complements our highly profitable Core E&S underwriting business • Increased demand for fronting paper driven by hard market conditions as start - ups and MGAs/MGUs search for capacity • Seeing encouraging signs of growth for our largest program partner as the economy recovers and workers’ compensation pricing begins to inflect higher after years of soft market conditions $86.0 $73.5 $84.8 $79.8 $85.3 $72.3 $96.6 $90.6 $110.9 Q1 '19 Q2 '19 Q3 '19 Q4 '19 Q1 '20 Q2 '20 Q3 '20 Q4 '20 Q1 '21 Fronted programs premium represent 87% of the GWP of our Specialty Admitted Segment (1) $3.8 $3.8 $4.0 $4.2 $4.2 $5.4 $4.6 $5.1 $5.1 Q1 '19 Q2 '19 Q3 '19 Q4 '19 Q1 '20 Q2 '20 Q3 '20 Q4 '20 Q1 '21 Consistent and predictable stream of earnings (1) As of Q1 2021.

0% 26% 30% 31% 34% 59% 100% 14 We Represent a Unique Investment Opportunity Source: S&P Global Market Intelligence (and its affiliates, as applicable), SEC filings. (1) Weather related catastrophe losses only. Excludes catastrophe losses from COVID - 19 for those companies who categorize COVID - 19 a s a catastrophe. (2) Statutory E&S direct written premium as defined and calculated by S&P Global Market Intelligence. Represents statutory E&S di rec t written premium divided by GAAP gross written premium. Excludes companies with total gross written premium of less than $150.0M. (3) 59% is based on statutory E&S DWP premium as defined and calculated by S&P Global Market Intelligence. 70% is based on GAAP E &S GWP (including assumed business in our Casualty Reinsurance segment). 0% 0% 2% 3% 6% 6% 7% 2020 Cat Losses % of Loss Ratio (1) 2020 E&S DWP as a % of total GWP (2) Our focus on low volatility, niche casualty E&S business results in little to no cat exposure, differentiating us from public specialty peers We are the 2 nd most concentrated company in terms of E&S exposure, providing investors concentrated exposure to an attractive market (3) 70% (3)

Our Valuation Supports Meaningful Upside JRVR Historical Discount to Peers (2) We have historically traded at a discount to peers based on a regression analysis ARGO MKL WRB AMSF JRVR RLI KNSL 0.00x 1.00x 2.00x 3.00x 4.00x 5.00x 6.00x 7.00x 8.00x 7% 12% 17% 22% Price to TBV 2022 Consensus ROTE Source: S&P Global Market Intelligence (and its affiliates, as applicable), SEC filings, FactSet . Market data as of 4/30/2021. (1) Mean analyst consensus operating earnings per share for the full financial year divided by December 31, 2020 tangible equity per share for all companies except for RLI and WRB which are as of March 31, 2021. (2) Discount calculated as the variance between price to tangible book value and implied price to tangible book value based on th e r egression of FY+1 ROATE and price to tangible book value of the peer group. Peers include: MKL, WRB, RLI, KNSL, ARGO, and AMSF. (3) Represents mean 2022E consensus operating EPS estimates of $2.96 per FactSet. P/TBV vs Operating ROTE (1) We are “inexpensive” relative to our specialty peers: Our current valuation supports meaningful upside Price/2022E Consensus EPS (3) We trade at the low end of our peers on a price to 2022E consensus EPS basis (15%) (30%) (38%) (43%) (43%) (53%) (46%) (41%) 10/8/2019 12/31/2019 3/31/2020 6/30/2020 9/30/2020 12/31/2020 2/15/2021 4/30/2021 35.6x 35.0x 20.5x 18.0x 17.8x 15.9x 12.6x KNSL RLI AMSF MKL WRB JRVR ARGO VALUATION HAS MEANINGFUL UPSIDE OPPORTUNITY TO NARROW DISCOUNT 2022E P/E MULTIPLE AT LOW END OF PEERS 15 10/8/2019 – 12/31/2019: Exit from large comm’l auto account Median: 18.0x
Appendix
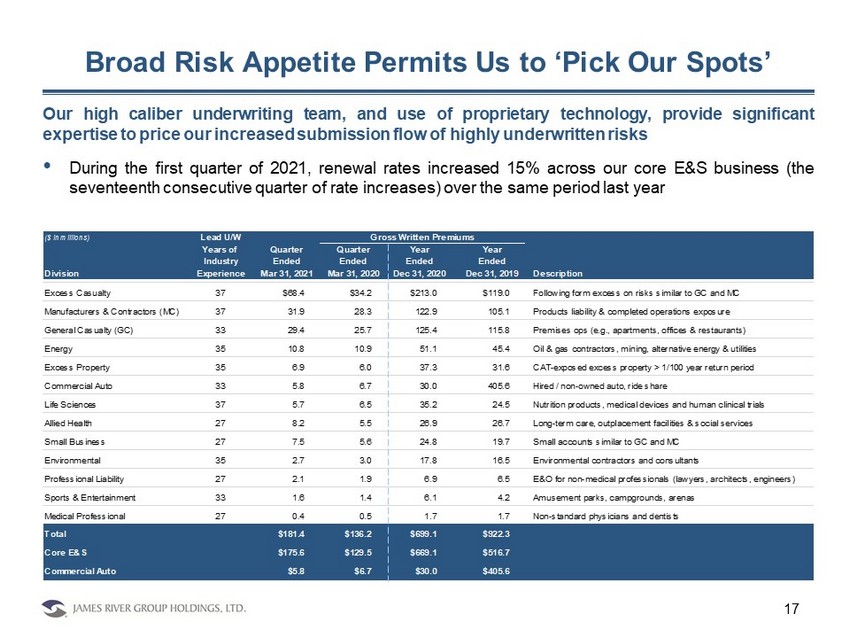
Broad Risk Appetite Permits Us to ‘Pick Our Spots’ 17 Our high caliber underwriting team, and use of proprietary technology, provide significant expertise to price our increased submission flow of highly underwritten risks • During the first quarter of 2021 , renewal rates increased 15 % across our core E&S business (the seventeenth consecutive quarter of rate increases) over the same period last year ($ in millions) Lead U/W Years of Quarter Quarter Year Year Industry Ended Ended Ended Ended Division Experience Mar 31, 2021 Mar 31, 2020 Dec 31, 2020 Dec 31, 2019 Description Excess Casualty 37 $68.4 $34.2 $213.0 $119.0 Following form excess on risks similar to GC and MC Manufacturers & Contractors (MC) 37 31.9 28.3 122.9 105.1 Products liability & completed operations exposure General Casualty (GC) 33 29.4 25.7 125.4 115.8 Premises ops (e.g., apartments, offices & restaurants) Energy 35 10.8 10.9 51.1 45.4 Oil & gas contractors, mining, alternative energy & utilities Excess Property 35 6.9 6.0 37.3 31.6 CAT-exposed excess property > 1/100 year return period Commercial Auto 33 5.8 6.7 30.0 405.6 Hired / non-owned auto, ride share Life Sciences 37 5.7 6.5 35.2 24.5 Nutrition products, medical devices and human clinical trials Allied Health 27 8.2 5.5 26.9 26.7 Long-term care, outplacement facilities & social services Small Business 27 7.5 5.6 24.8 19.7 Small accounts similar to GC and MC Environmental 35 2.7 3.0 17.8 16.5 Environmental contractors and consultants Professional Liability 27 2.1 1.9 6.9 6.5 E&O for non-medical professionals (lawyers, architects, engineers) Sports & Entertainment 33 1.6 1.4 6.1 4.2 Amusement parks, campgrounds, arenas Medical Professional 27 0.4 0.5 1.7 1.7 Non-standard physicians and dentists Total $181.4 $136.2 $699.1 $922.3 Core E&S $175.6 $129.5 $669.1 $516.7 Commercial Auto $5.8 $6.7 $30.0 $405.6 Gross Written Premiums
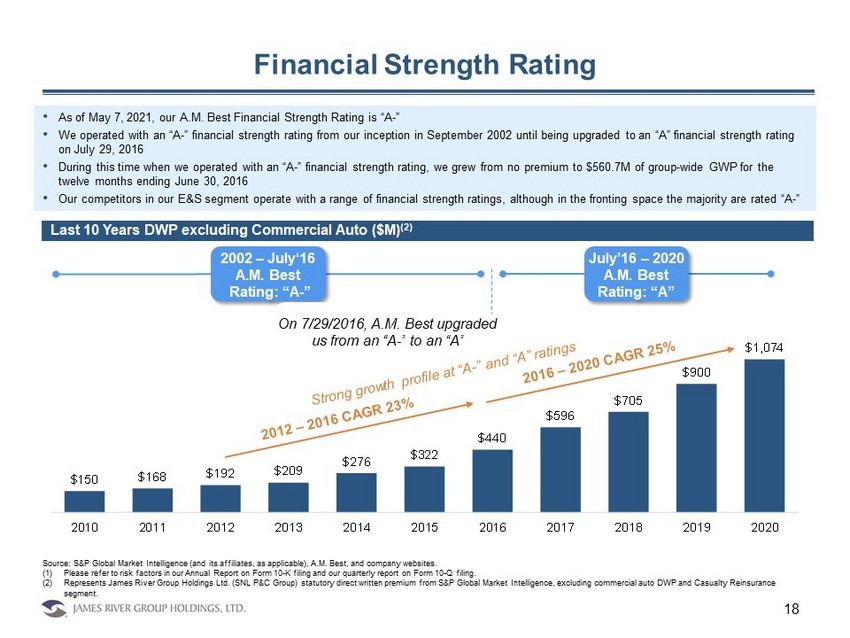
$150 $168 $192 $209 $276 $322 $440 $596 $705 $900 $1,074 2010 2011 2012 2013 2014 2015 2016 2017 2018 2019 2020 Financial Strength Rating • As of May 7, 2021, our A.M. Best Financial Strength Rating is “A - ” • We operated with an “A - ” financial strength rating from our inception in September 2002 until being upgraded to an “A” financial strength rating on July 29, 2016 • During this time when we operated with an “A - ” financial strength rating, we grew from no premium to $560.7M of group - wide GWP f or the twelve months ending June 30, 2016 • Our competitors in our E&S segment operate with a range of financial strength ratings, although in the fronting space the maj ori ty are rated “A - ” 18 Source: S&P Global Market Intelligence (and its affiliates, as applicable), A.M. Best, and company websites. (1) Please refer to risk factors in our Annual Report on Form 10 - K filing and our quarterly report on Form 10 - Q filing. (2) Represents James River Group Holdings Ltd. (SNL P&C Group) statutory direct written premium from S&P Global Market Intelligen ce, excluding commercial auto DWP and Casualty Reinsurance segment. Last 10 Years DWP excluding Commercial Auto ($M) (2) 2002 – July‘16 A.M. Best Rating: “ A - ” July’16 – 2020 A.M. Best Rating: “ A” On 7/29/2016, A.M. Best upgraded us from an “A - ” to an “A”
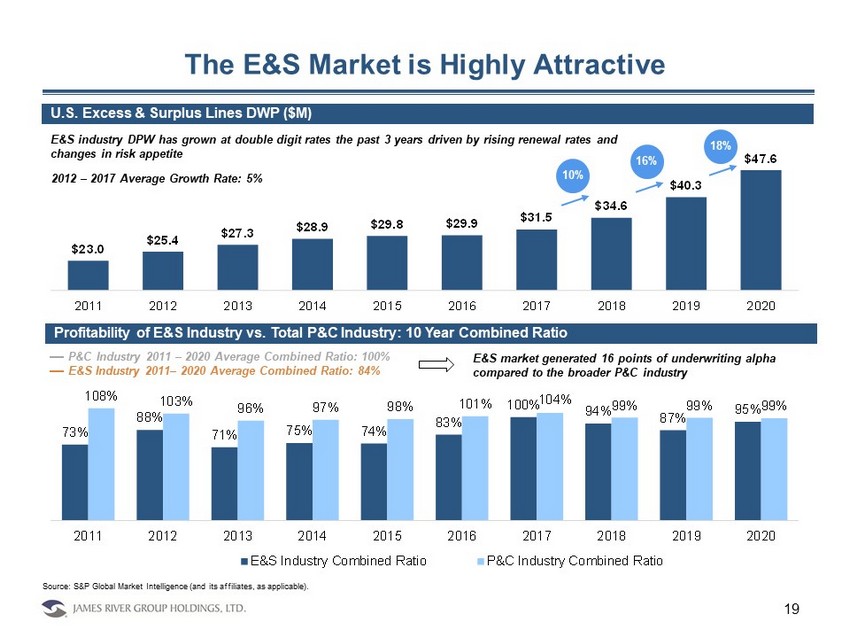
$23.0 $25.4 $27.3 $28.9 $29.8 $29.9 $31.5 $34.6 $40.3 $47.6 2011 2012 2013 2014 2015 2016 2017 2018 2019 2020 19 73% 88% 71% 75% 74% 83% 100% 94% 87% 95% 108% 103% 96% 97% 98% 101% 104% 99% 99% 99% 2011 2012 2013 2014 2015 2016 2017 2018 2019 2020 E&S Industry Combined Ratio P&C Industry Combined Ratio The E&S Market is Highly Attractive U.S. Excess & Surplus Lines DWP ($M) Profitability of E&S Industry vs. Total P&C Industry: 10 Year Combined Ratio Source: S&P Global Market Intelligence (and its affiliates, as applicable). P&C Industry 2011 – 2020 Average Combined Ratio: 100% E&S Industry 2011 – 2020 Average Combined Ratio: 84% 18% 16% 10% E&S industry DPW has grown at double digit rates the past 3 years driven by rising renewal rates and changes in risk appetite 2012 – 2017 Average Growth Rate: 5% E&S market generated 16 points of underwriting alpha compared to the broader P&C industry

Appendix: Q1 2021 Earnings
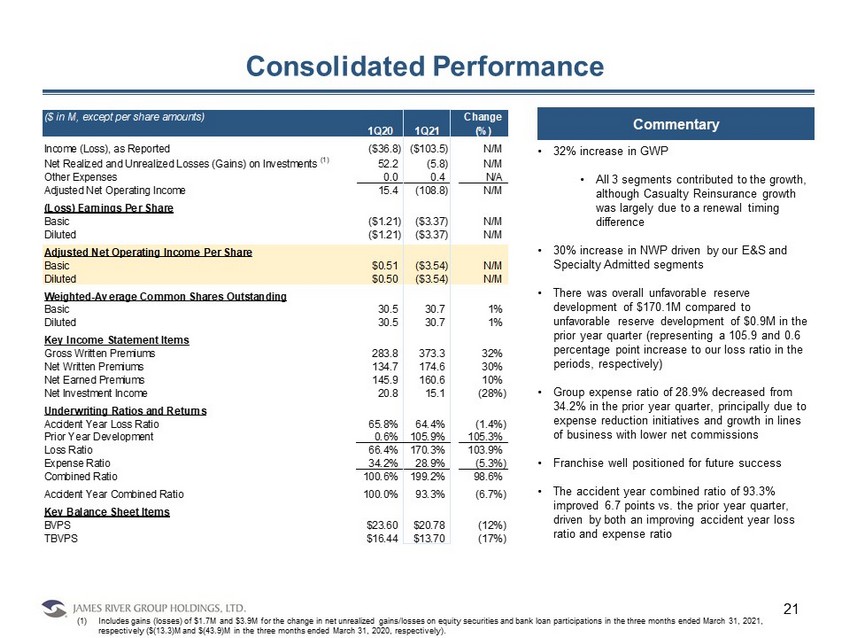
($ in M, except per share amounts) Change 1Q20 1Q21 (%) Income (Loss), as Reported ($36.8) ($103.5) N/M Net Realized and Unrealized Losses (Gains) on Investments (1) 52.2 (5.8) N/M Other Expenses 0.0 0.4 N/A Adjusted Net Operating Income 15.4 (108.8) N/M (Loss) Earnings Per Share Basic ($1.21) ($3.37) N/M Diluted ($1.21) ($3.37) N/M Adjusted Net Operating Income Per Share Basic $0.51 ($3.54) N/M Diluted $0.50 ($3.54) N/M Weighted-Average Common Shares Outstanding Basic 30.5 30.7 1% Diluted 30.5 30.7 1% Key Income Statement Items Gross Written Premiums 283.8 373.3 32% Net Written Premiums 134.7 174.6 30% Net Earned Premiums 145.9 160.6 10% Net Investment Income 20.8 15.1 (28%) Underwriting Ratios and Returns Accident Year Loss Ratio 65.8% 64.4% (1.4%) Prior Year Development 0.6% 105.9% 105.3% Loss Ratio 66.4% 170.3% 103.9% Expense Ratio 34.2% 28.9% (5.3%) Combined Ratio 100.6% 199.2% 98.6% Accident Year Combined Ratio 100.0% 93.3% (6.7%) Key Balance Sheet Items BVPS $23.60 $20.78 (12%) TBVPS $16.44 $13.70 (17%) 21 Consolidated Performance (1) Includes gains (losses) of $1.7M and $3.9M for the change in net unrealized gains/losses on equity securities and bank loan p art icipations in the three months ended March 31, 2021, respectively ($(13.3)M and $(43.9)M in the three months ended March 31, 2020, respectively). Commentary • 32% increase in GWP • All 3 segments contributed to the growth, although Casualty Reinsurance growth was largely due to a renewal timing difference • 30% increase in NWP driven by our E&S and Specialty Admitted segments • There was overall unfavorable reserve development of $170.1M compared to unfavorable reserve development of $0.9M in the prior year quarter (representing a 105.9 and 0.6 percentage point increase to our loss ratio in the periods, respectively) • Group expense ratio of 28.9% decreased from 34.2% in the prior year quarter, principally due to expense reduction initiatives and growth in lines of business with lower net commissions • Franchise well positioned for future success • The accident year combined ratio of 93.3% improved 6.7 points vs. the prior year quarter, driven by both an improving accident year loss ratio and expense ratio

($ in M) Change 1Q20 1Q21 (%) Gross Written Premiums $136.2 $181.4 33% Net Written Premiums 92.2 108.4 18% Net Earned Premiums 99.7 113.7 14% Losses and Loss Adjustment Expenses (65.5) (241.7) N/M Underwriting Expenses (26.1) (22.9) (12%) Underwriting Profit (1) 8.1 (150.9) N/M Gross Fee Income 1.3 0.0 N/M Ratios Accident Year Loss Ratio 65.7% 64.3% (1.4%) Prior Year Development 0.0% 148.3% 148.3% Loss Ratio 65.7% 212.6% 146.9% Expense Ratio 26.2% 20.1% (6.1%) Combined Ratio 91.9% 232.7% 140.8% Accident Year Combined Ratio 91.9% 84.4% (7.5%) 22 E&S Segment Performance Commentary • 36% growth in Core E&S GWP • Rate and submission volume remain strong • Eight out of twelve core underwriting divisions grew • Due to continued stronger relative growth in our Excess Casualty underwriting division, where we cede a larger portion of risk as compared to other lines, retention declined and NWP increased at a lower rate than GWP • 15% increase in first quarter 2021 E&S renewal pricing, up from 14% in full year 2020 • 17 th consecutive quarter in which E&S rates have increased • Compound annual aggregate rate increase in our Core E&S renewal book has been 36% over those 17 quarters • Core E&S has grown 86% since the first quarter of 2019 • $168.7M of unfavorable development, inclusive of $170.0M of unfavorable development in Commercial Auto, primarily driven by Rasier, which has been in runoff since 12/31/2019, partially offset by $1.4M of favorable development in Core E&S • Decline in gross fee income is due to the termination of the large commercial auto account (1) Underwriting results include fee income of $1.3M and $0.0M for the three months ended March 31, 2020 and 2021, respectively. The se amounts are included in “Other income” in our Condensed Consolidated Income Statements.

($ in M) Change 1Q20 1Q21 (%) Gross Written Premiums $102.8 $127.0 24% Net Written Premiums 13.4 22.0 65% Net Earned Premiums 13.3 16.4 23% Losses and Loss Adjustment Expenses (9.9) (10.7) 8% Underwriting Expenses (4.4) (4.3) (0%) Underwriting Profit (1) (1.0) 1.3 N/M Gross Fee Income 4.2 5.1 22% Ratios Accident Year Loss Ratio 82.2% 71.8% (10.4%) Prior Year Development (7.6%) (6.1%) 1.5% Loss Ratio 74.6% 65.7% (8.9%) Expense Ratio 32.8% 26.6% (6.2%) Combined Ratio 107.4% 92.3% (15.1%) Accident Year Combined Ratio 115.0% 98.4% (16.6%) 23 Specialty Admitted Performance Commentary • Fronting business grew meaningfully as recently added programs continued to mature and expand • Eight new programs added since Q1 2020, as those and other recently added programs continue to renew and expand • GWP grew 24% • 30% increase in fronting GWP • Net written premium increased at a greater rate than gross written premium due to a higher premium retention on fronted business • Fee income grew 22% due to the continued growth of our fronting relationships • $1.0M of favorable development in our individual risk workers’ compensation business • Strong pipeline of new fronting relationships (1) Underwriting results include fee income of $4.2M and $5.1M for the three months ended March 31, 2020 and 2021, respectively.

($ in M) Change 1Q20 1Q21 (%) Gross Written Premiums $44.8 $64.9 45% Net Written Premiums 29.1 44.2 52% Net Earned Premiums 32.9 30.5 (7%) Losses and Loss Adjustment Expenses (21.4) (21.0) (2%) Underwriting Expenses (11.3) (11.1) (1%) Underwriting Profit 0.2 (1.6) N/M Ratios Accident Year Loss Ratio 59.4% 60.7% 1.3% Prior Year Development 5.7% 8.1% 2.4% Loss Ratio 65.1% 68.8% 3.7% Expense Ratio 34.3% 36.5% 2.2% Combined Ratio 99.4% 105.3% 5.9% Accident Year Combined Ratio 93.7% 97.2% 3.5% Casualty Reinsurance Performance Commentary • GWP and NWP increased due to a change in the renewal date of one large treaty • $2.5M of unfavorable development 24
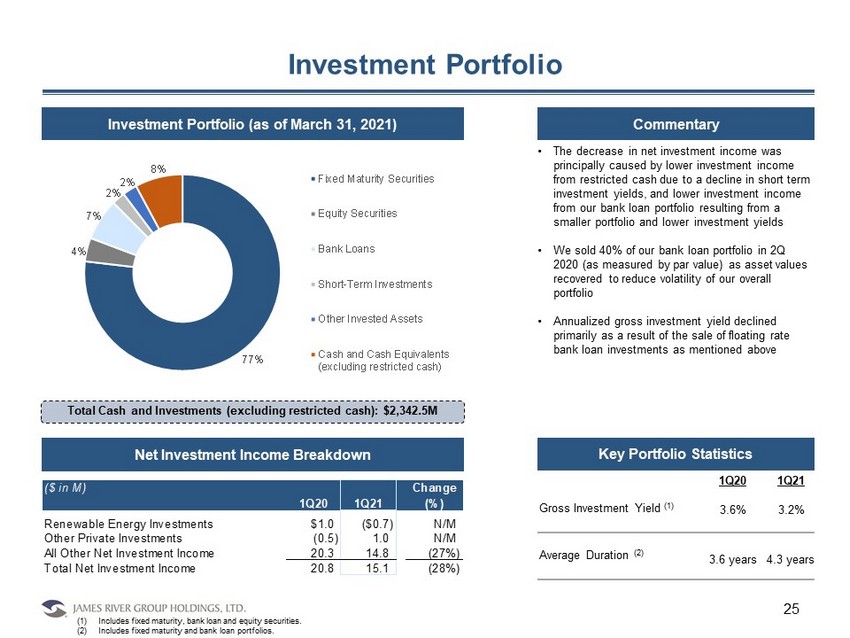
($ in M) Change 1Q20 1Q21 (%) Renewable Energy Investments $1.0 ($0.7) N/M Other Private Investments (0.5) 1.0 N/M All Other Net Investment Income 20.3 14.8 (27%) Total Net Investment Income 20.8 15.1 (28%) 77% 4% 7% 2% 2% 8% Fixed Maturity Securities Equity Securities Bank Loans Short-Term Investments Other Invested Assets Cash and Cash Equivalents (excluding restricted cash) Investment Portfolio Commentary • The decrease in net investment income was principally caused by lower investment income from restricted cash due to a decline in short term investment yields, and lower investment income from our bank loan portfolio resulting from a smaller portfolio and lower investment yields • We sold 40% of our bank loan portfolio in 2Q 2020 (as measured by par value) as asset values recovered to reduce volatility of our overall portfolio • Annualized gross investment yield declined primarily as a result of the sale of floating rate bank loan investments as mentioned above Investment Portfolio (as of March 31, 2021) Net Investment Income Breakdown Total Cash and Investments (excluding restricted cash): $2,342.5M Key Portfolio Statistics 1Q20 1Q21 Gross Investment Yield (1) 3.6% 3.2% Average Duration (2) 3.6 years 4.3 years (1) Includes fixed maturity, bank loan and equity securities. (2) Includes fixed maturity and bank loan portfolios. 25

Appendix: Non - GAAP Reconciliation

Non - GAAP Measures Reconciliation 27 Source: Company filings. Note: All amounts are for the year ended December 31 for each period indicated, except Q1 2020 and Q1 2021 which are for the qua rter ended March 31. Non-GAAP Reconciliation Underwriting Profit (Loss) Q1 Q1 ($mm) 2017 2020 2020 2021 Underwriting profit (loss) of the operating segments: Excess and Surplus Lines 29.7$ 42.8$ 19.2$ 9.8$ 8.1$ (150.9)$ Specialty Admitted Insurance 3.2 7.0 5.9 4.2 (1.0) 1.2 Casualty Reinsurance (1.8) 5.1 (7.2) (18.4) 0.2 (1.6) Total underwriting profit of operating segments 31.1 54.9 17.9 (4.4) 7.3 (151.3) Operating expenses of Corporate segment (25.3) (26.9) (27.7) (29.4) (8.2) (8.1) Underwriting profit (loss) 5.8 28.0 (9.8) (33.8) (0.9) (159.4) Net investment income 61.1 61.3 75.7 73.3 20.8 15.1 Net realized investment (losses) gains (2.0) (5.5) (2.9) (16.0) (58.4) 6.3 Other income and expenses (0.2) (0.8) 0.1 (1.0) 0.3 (0.5) Interest expense (9.0) (11.6) (10.6) (10.1) (2.9) (2.2) Amortization of intangible assets (0.6) (0.6) (0.6) (0.5) (0.1) (0.1) Income (loss) before taxes 55.1$ 70.8$ 51.9$ 11.9$ (41.2)$ (140.8)$ 20192018

Non - GAAP Measures Reconciliation 28 Note: In the Tangible Equity Table, 2008 to 2013 shares outstanding are retroactively adjusted for 50/1 stock split. Addition all y, all amounts are as of or for the year ended December 31 for each period indicated, except Q1 2020 and Q1 2021 which are as of or for the quarter ended March 31. Source: Company filings. Non-GAAP Reconciliation ($mm) Q1 Q1 Adj. Net Operating Income 2017 2018 2019 2020 2020 2021 Income (loss) as reported 43.6$ 63.8$ 38.3$ 4.8$ (36.8)$ (103.5)$ Net realized inv. (gains) losses 1.4 4.4 3.8 14.8 52.2 (5.8) Initial public offering costs - - - - - - Dividend withholding taxes 1.0 - - - - - Other expenses 0.5 1.1 0.8 1.6 - 0.4 Interest expense on leased building the Company was previosuly deemed to own for accounting purposes 0.8 1.3 - - - - Adjusted net operating income 47.3$ 70.6$ 42.9$ 21.2$ 15.4$ (108.9)$ Q1 Q1 Tangible Book Value 2008 2009 2010 2011 2012 2013 2014 2015 2016 2017 2020 2020 2021 Shareholders’ equity 677.8$ 724.7$ 714.2$ 762.4$ 784.0$ 701.5$ 687.9$ 681.0$ 693.2$ 694.7$ 709.2$ 778.6$ 795.6$ 720.3$ 639.6$ Goodwill & intangible assets (289.8) (282.4) (232.7) (233.9) (225.0) (222.6) (221.9) (221.3) (220.7) (220.2) (219.3) (218.8) (218.2) (218.6) (218.1) Tangible Book Value 388.0$ 442.3$ 481.5$ 528.5$ 559.0$ 478.9$ 466.0$ 459.7$ 472.5$ 474.5$ 489.9$ 559.8$ 577.4$ 501.7$ 421.5$ Shares Outstanding (000's) 35,718 35,718 35,718 35,718 36,030 28,540 28,540 28,942 29,258 29,697 29,988 30,424 30,649 30,520 30,775 Tangible Book Value per Share 10.86$ 12.38$ 13.48$ 14.80$ 15.52$ 16.78$ 16.33$ 15.89$ 16.15$ 15.98$ 16.34$ 18.40$ 18.84$ 16.44$ 13.70$ 20192018

Serious News for Serious Traders! Try StreetInsider.com Premium Free!
You May Also Be Interested In
- James River Completes Sale of Casualty Reinsurance Business to Fleming Holdings
- TabaPay to Acquire the Assets of Synapse Financial Technologies, Inc.
- FendX Announces Corporate Update
Create E-mail Alert Related Categories
SEC FilingsSign up for StreetInsider Free!
Receive full access to all new and archived articles, unlimited portfolio tracking, e-mail alerts, custom newswires and RSS feeds - and more!
