

Form 8-K IVERIC bio, Inc. For: Jul 06
 Tweet
Tweet Share
Share UNITED STATES
SECURITIES AND EXCHANGE COMMISSION
WASHINGTON, D.C. 20549
FORM 8-K
CURRENT REPORT
Pursuant to Section 13 or 15(d) of the Securities Exchange Act of 1934
Date of Report (Date of earliest event reported): July 6, 2021
(Exact Name of Registrant as Specified in its Charter)
| (State or Other Jurisdiction of Incorporation) | (Commission File Number) | (IRS Employer Identification No.) | ||||||||||||
Five Penn Plaza , Suite 2372
(Address of Principal Executive Offices) (Zip Code)
Registrant’s telephone number, including area code: (212 ) 845-8200
Check the appropriate box below if the Form 8-K filing is intended to simultaneously satisfy the filing obligation of the registrant under any of the following provisions (see General Instruction A.2. below):
Securities registered pursuant to Section 12(b) of the Act:
| Title of each class | Trading Symbol(s) | Name of each exchange on which registered | ||||||
Indicate by check mark whether the registrant is an emerging growth company as defined in Rule 405 of the Securities Act of 1933 (§230.405 of this chapter) or Rule 12b-2 of the Securities Exchange Act of 1934 (§240.12b-2 of this chapter). Emerging growth company ☐
If an emerging growth company, indicate by check mark if the registrant has elected not to use the extended transition period for complying with any new or revised financial accounting standards provided pursuant to Section 13(a) of the Exchange Act. ☐
Forward-Looking Statements
This Current Report on Form 8-K contains forward-looking statements of IVERIC bio, Inc. (the "Company"). Any statements in this Form 8-K about the Company’s future expectations, plans and prospects constitute forward-looking statements for purposes of the safe harbor provisions under the Private Securities Litigation Reform Act of 1995. Forward-looking statements include any statements about the Company’s strategy, future operations and future expectations and plans and prospects for the Company, and any other statements containing the words “anticipate,” “believe,” “estimate,” “expect,” “intend”, “goal,” “future”, “may”, “might,” “plan,” “predict,” “project,” “seek,” “target,” “potential,” “will,” “would,” “could,” “should,” “continue,” and similar expressions. In this Form 8-K, the Company’s forward looking statements include statements about the Company’s development and regulatory strategy for Zimura, including its strategy to submit an NDA to and seek marketing approval from the FDA for Zimura for the treatment of GA secondary to AMD if the ongoing GATHER2 clinical trial meets its primary efficacy endpoint at 12 months, the timing, progress and results of clinical trials, including expectations regarding patient enrollment and retention in and the availability of topline data from GATHER2, and other research and development activities and the potential utility of Zimura. Such forward-looking statements involve substantial risks and uncertainties that could cause the Company’s development programs, future results, performance or achievements to differ significantly from those expressed or implied by the forward-looking statements. Such risks and uncertainties include, among others, those related to expectations for regulatory matters, the progression and duration of the COVID-19 pandemic and responsive measures thereto and related effects on the Company’s research and development programs, operations and financial position, the initiation and the progress of research and development programs and clinical trials, including enrollment and retention in clinical trials, availability of data from these programs, reliance on clinical trial sites, contract research organizations and other third parties, establishment of manufacturing capabilities, developments from the Company’s competitors and the marketplace for its products, need for additional financing and negotiation and consummation of business development transactions and other factors discussed in the “Risk Factors” section contained in the quarterly and annual reports that the Company files with the Securities and Exchange Commission. Any forward-looking statements represent the Company’s views only as of the date of this Form 8-K. The Company anticipates that subsequent events and developments may cause its views to change. While the Company may elect to update these forward-looking statements at some point in the future, the Company specifically disclaims any obligation to do so except as required by law.
Item 8.01 Other Events
On July 6, 2021, the Company announced that it had received written agreement from the U.S. Food and Drug Administration (the "FDA") under a Special Protocol Assessment ("SPA") for the overall design of GATHER2, the Company's pivotal clinical trial of Zimura® (avacincaptad pegol), its complement factor C5 inhibitor, in development for geographic atrophy ("GA") secondary to age-related macular degeneration ("AMD"). The SPA process is a procedure by which the FDA provides a clinical trial sponsor with an official evaluation and written guidance on the design of a proposed protocol intended to form the basis for a new drug application ("NDA"). In connection with the SPA, the FDA recommended, and the Company accepted, modifying the primary efficacy endpoint for the GATHER2 trial from the mean rate of change in GA area over 12 months measured by fundus autofluorescence ("FAF") at three timepoints: baseline, month 6 and month 12, to the mean rate of growth (slope) estimated based on GA area measured by FAF in at least three timepoints: baseline, month 6 and month 12.
The Company also announced that, in parallel discussions with those for the GATHER2 SPA, the FDA indicated to the Company that, as part of a future NDA for Zimura, the results from GATHER1, the Company's completed clinical trial of Zimura for GA secondary to AMD, will be considered using the original prespecified primary efficacy endpoint analysis, together with a post-hoc analysis using the same FDA-preferred method that will be used for the GATHER2 trial (mean rate of growth (slope) estimated based on GA area measured by FAF in the relevant timepoints). The 12 month and 18 month results of this post-hoc analysis, as compared to the results of the original prespecified analysis for GATHER1, are described below. Safety results from GATHER1 were not impacted as part of this analysis.
Although the Company believes that the post-hoc analyses from the GATHER1 trial are consistent with the positive results from the original prespecified analysis from the trial, any analyses, whether prespecified or post-hoc, that are intended to support an application for marketing approval are a matter of review for the FDA and other regulatory authorities.
Original Prespecified Analysis and Post-hoc Analysis of GATHER1
Zimura 2 mg Data
The tables and graphs below contain the GATHER1 12-month and 18-month results for the Zimura 2 mg group as compared to its sham group, using both the original prespecified primary efficacy endpoint analysis and the FDA preferred method that will be used prospectively for the GATHER2 trial:
2
Explanatory notes - in the following presentation:
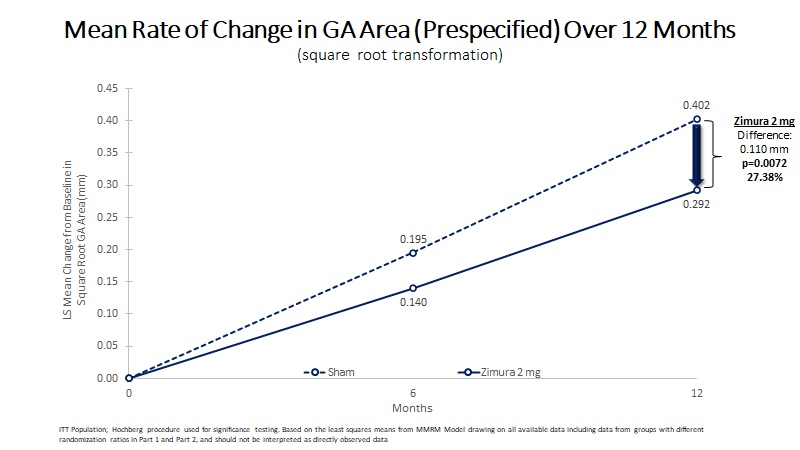
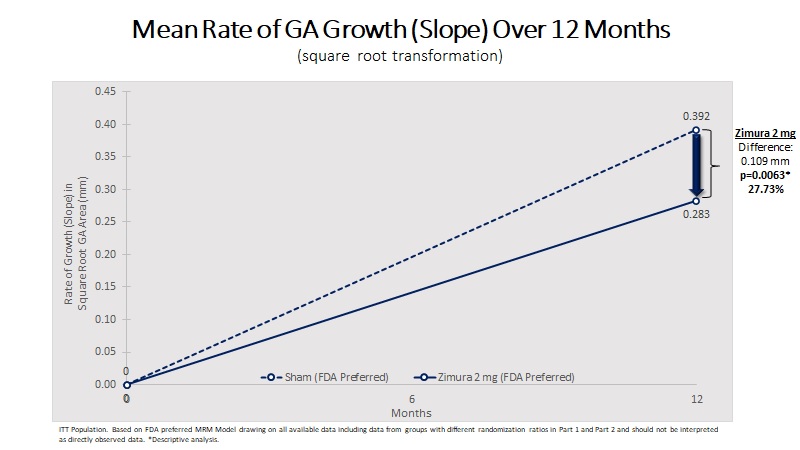
•the estimates for the Zimura 2 mg group vs. sham are from the MMRM model, drawing on all available data, including data from groups with different randomization ratios in Part 1 and Part 2 of the trial, and should not be interpreted as directly observed data;
(a) indicates prespecified primary endpoint; statistically significant; and
(b) indicates descriptive p-value.
| MRM Analysis | Zimura 2 mg (N = 67) | Sham (N = 110) | Difference | % Difference | P-Value | ||||||||||||
| 12 Month Sq. Rt. Transformation: | |||||||||||||||||
| Mean Rate of Change in GA Area (mm) | 0.292 | 0.402 | 0.110 | 27.38% | 0.0072(a) | ||||||||||||
| Mean Rate of GA Growth (Slope) (mm) | 0.283 | 0.392 | 0.109 | 27.73% | 0.0063(b) | ||||||||||||
| MRM Analysis | Zimura 2 mg (N = 67) | Sham (N = 110) | Difference | % Difference | P-Value | ||||||||||||
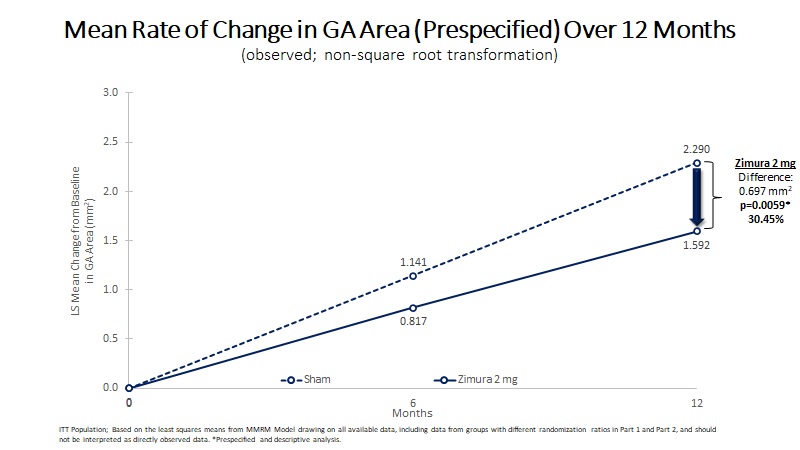
| 12 Month Observed Data: | |||||||||||||||||
Mean Rate of Change in GA Area (mm2) | 1.592 | 2.29 | 0.697 | 30.45% | 0.0059(b) | ||||||||||||
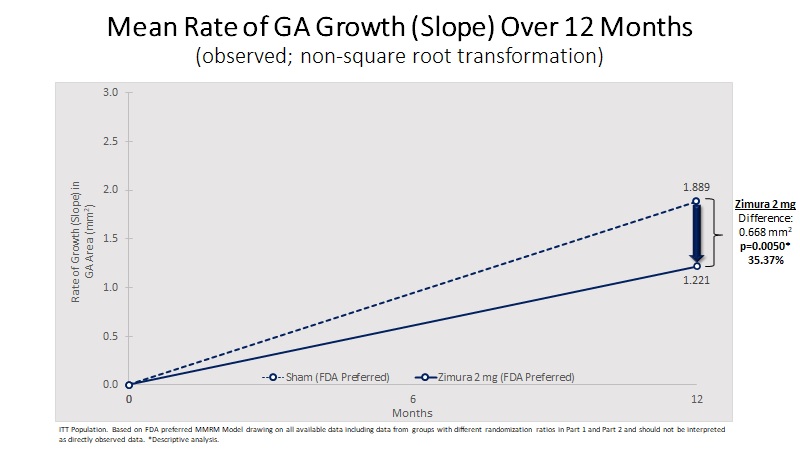
Mean Rate of GA Growth (Slope) (mm2) | 1.221 | 1.889 | 0.668 | 35.37% | 0.0050(b) | ||||||||||||
3
| MRM Analysis | Zimura 2 mg (N = 67) | Sham (N = 110) | Difference | % Difference | P-Value | ||||||||||||
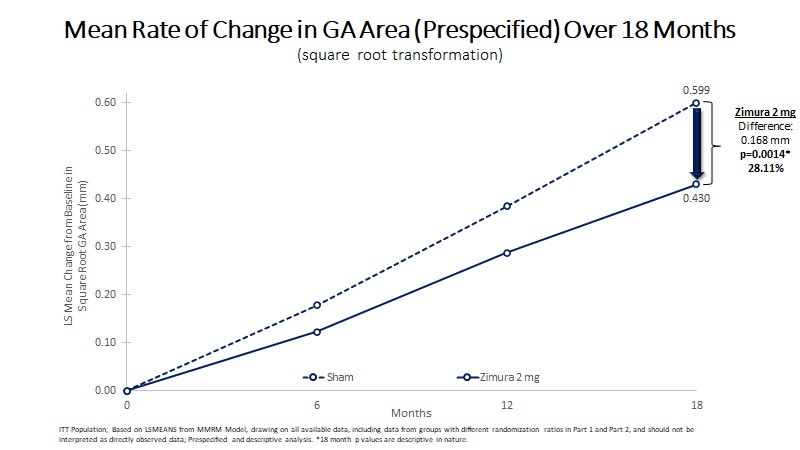
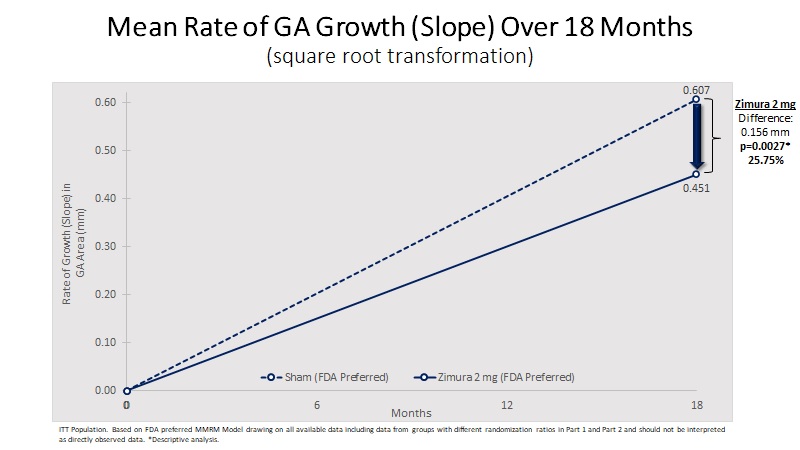
| 18 Month Sq. Rt. Transformation: | |||||||||||||||||
| Mean Rate of Change in GA Area (mm) | 0.430 | 0.599 | 0.168 | 28.11% | 0.0014(b) | ||||||||||||
| Mean Rate of GA Growth (Slope) (mm) | 0.451 | 0.607 | 0.156 | 25.75% | 0.0027(b) | ||||||||||||
| MRM Analysis | Zimura 2 mg (N = 67) | Sham (N = 110) | Difference | % Difference | P-Value | ||||||||||||
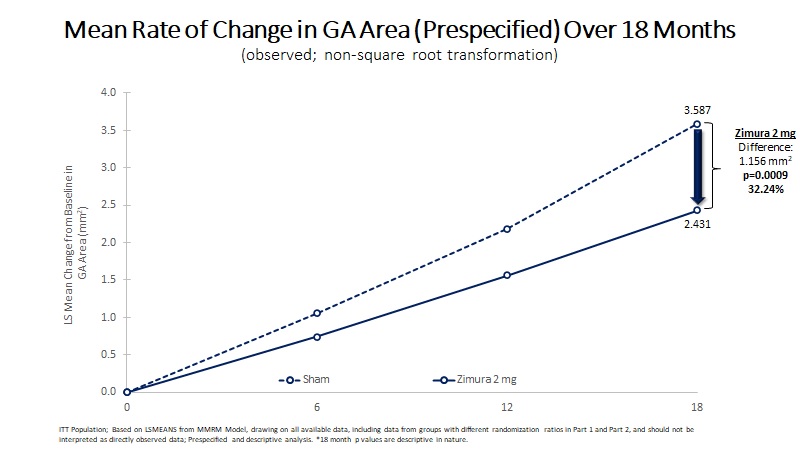
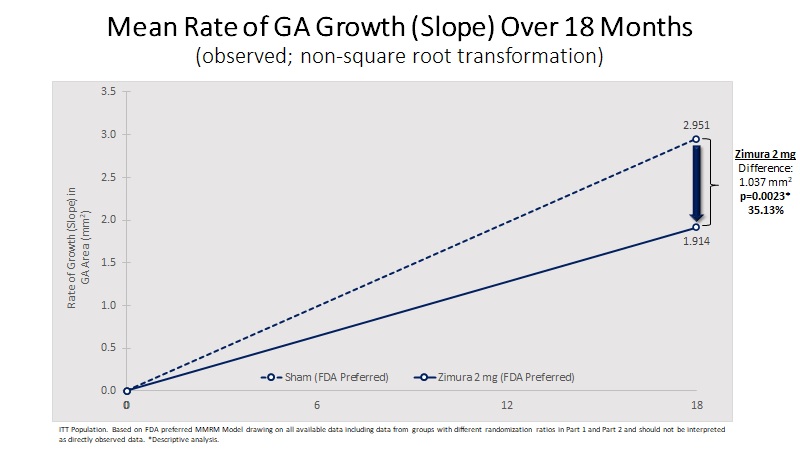
| 18 Month Observed Data: | |||||||||||||||||
Mean Rate of Change in GA Area (mm2) | 2.431 | 3.587 | 1.156 | 32.24% | 0.0009(b) | ||||||||||||
Mean Rate of GA Growth (Slope) (mm2) | 1.914 | 2.951 | 1.037 | 35.13% | 0.0023(b) | ||||||||||||
4
Zimura 4 mg Data
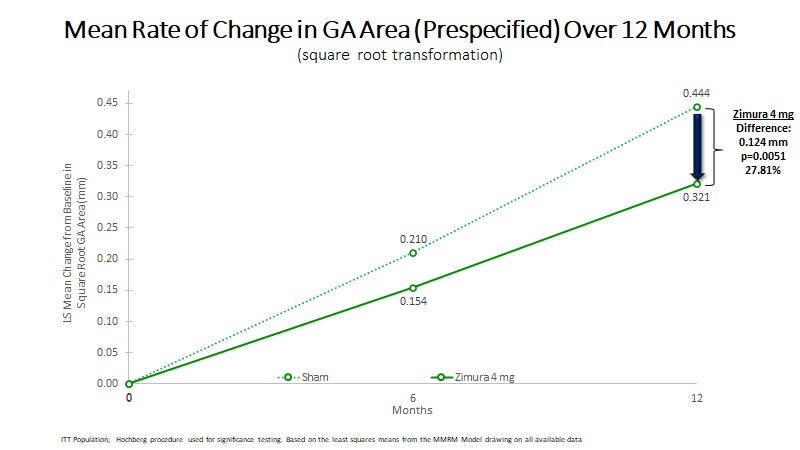
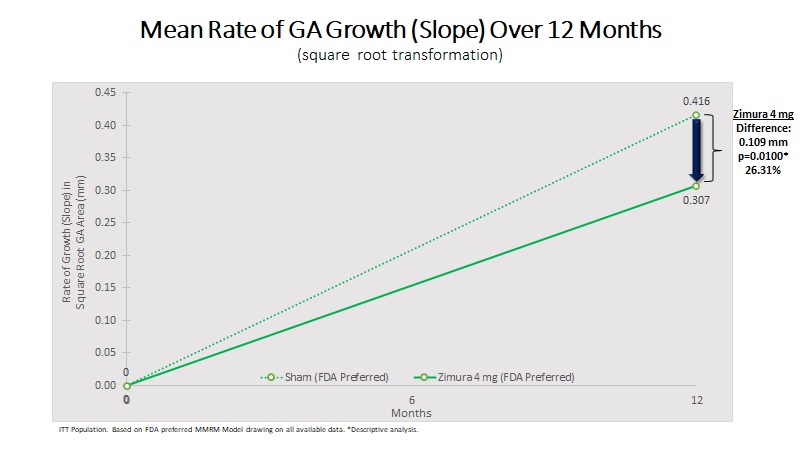
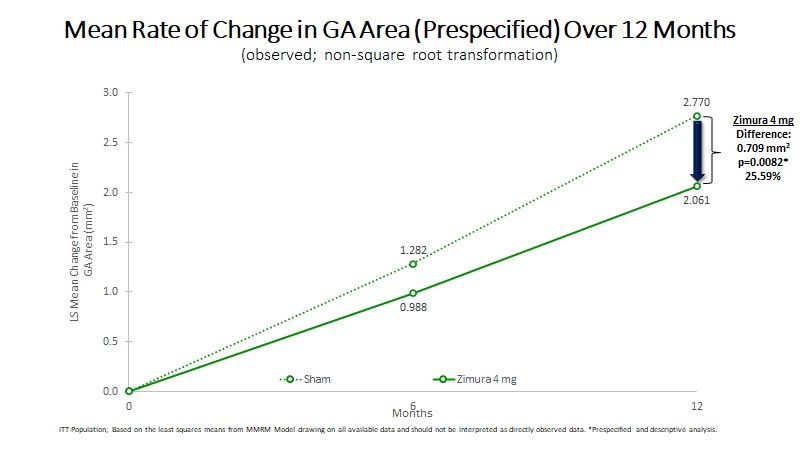
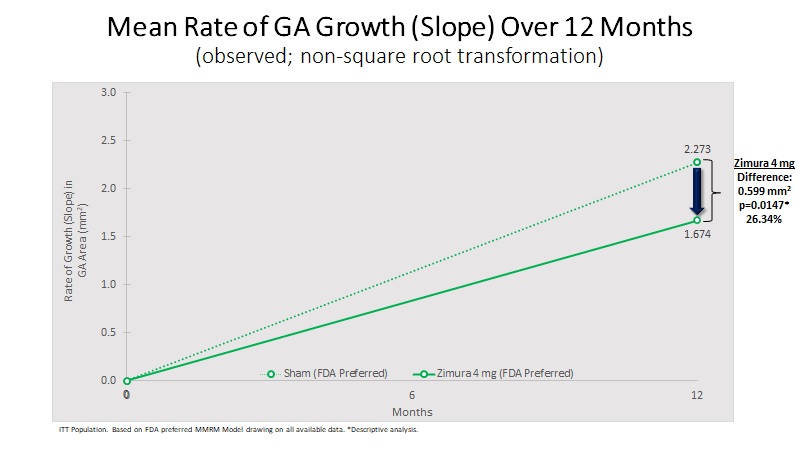
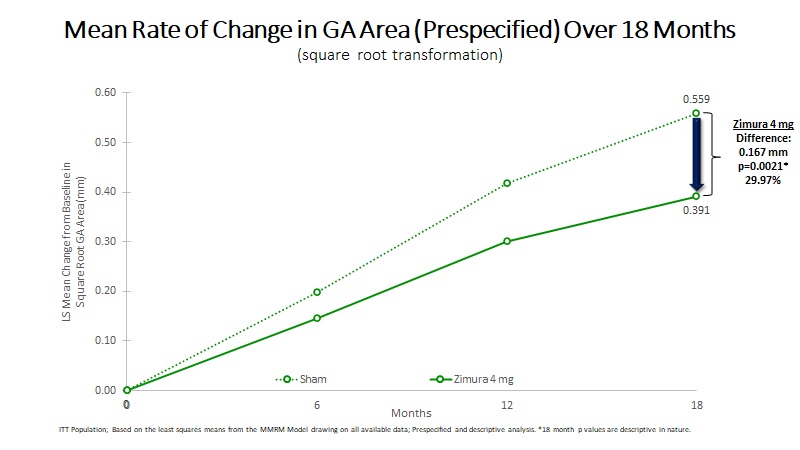
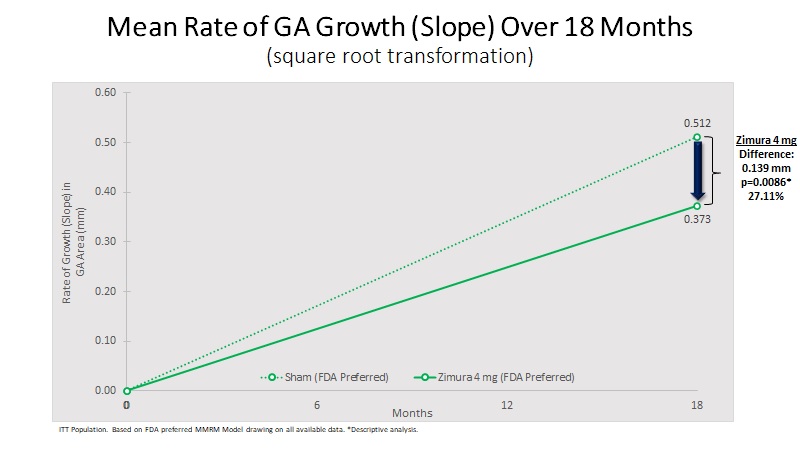
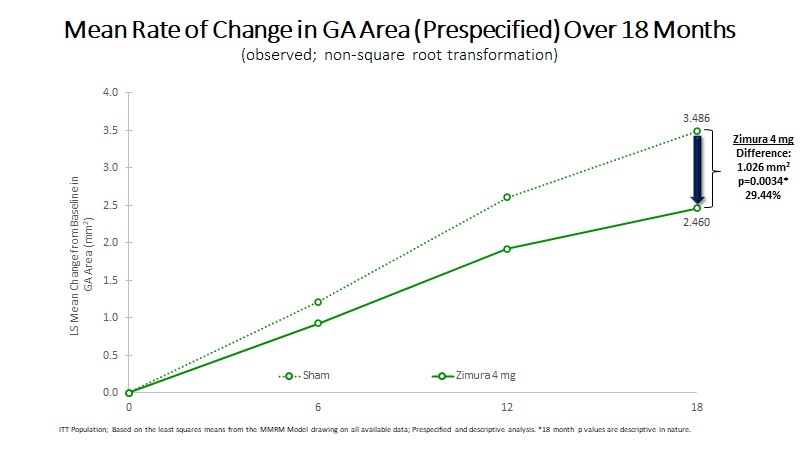
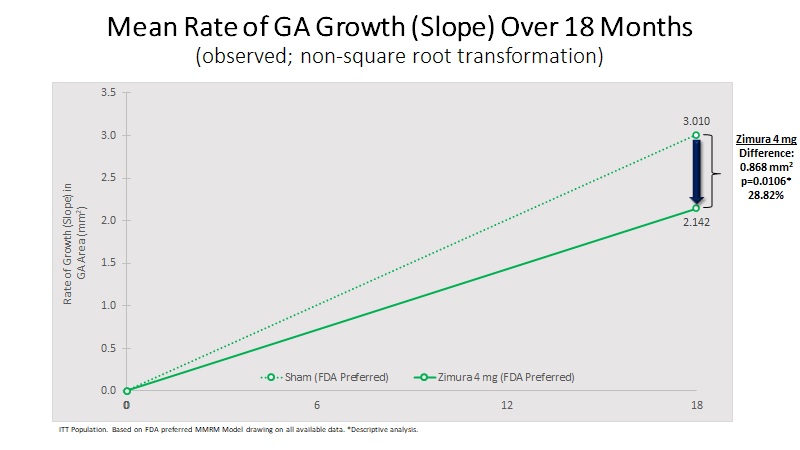
The tables and graphs below contain the GATHER1 12-month and 18-month results for the Zimura 4 mg group as compared to its sham group, using both the original prespecified primary efficacy endpoint analysis and the FDA preferred method that will be used prospectively for the GATHER2 trial:
Explanatory notes - in the following presentation:
(a) indicates prespecified primary endpoint; statistically significant; and
(b) indicates descriptive p-value.
| MRM Analysis | Zimura 4 mg (N = 83) | Sham (N = 84) | Difference | % Difference | P-Value | ||||||||||||
| 12 Month Sq. Rt. Transformation: | |||||||||||||||||
| Mean Rate of Change in GA Area (mm) | 0.321 | 0.444 | 0.124 | 27.81% | 0.0051(a) | ||||||||||||
| Mean Rate of GA Growth (Slope) (mm) | 0.307 | 0.416 | 0.109 | 26.31% | 0.0100(b) | ||||||||||||
| MRM Analysis | Zimura 4 mg (N = 83) | Sham (N = 84) | Difference | % Difference | P-Value | ||||||||||||
| 12 Month Observed Data: | |||||||||||||||||
Mean Rate of Change in GA Area (mm2) | 2.061 | 2.770 | 0.709 | 25.59% | 0.0082(b) | ||||||||||||
Mean Rate of GA Growth (Slope) (mm2) | 1.674 | 2.273 | 0.599 | 26.34% | 0.0147(b) | ||||||||||||
5
| MRM Analysis | Zimura 4 mg (N = 83) | Sham (N = 84) | Difference | % Difference | P-Value | ||||||||||||
| 18 Month Sq. Rt. Transformation: | |||||||||||||||||
| Mean Rate of Change in GA Area (mm) | 0.391 | 0.559 | 0.167 | 29.97% | 0.0021(b) | ||||||||||||
| Mean Rate of GA Growth (Slope) (mm) | 0.373 | 0.512 | 0.139 | 27.11% | 0.0086(b) | ||||||||||||
| MRM Analysis | Zimura 4 mg (N = 83) | Sham (N = 84) | Difference | % Difference | P-Value | ||||||||||||
| 18 Month Observed Data: | |||||||||||||||||
Mean Rate of Change in GA Area (mm2) | 2.460 | 3.486 | 1.026 | 29.44% | 0.0034(b) | ||||||||||||
Mean Rate of GA Growth (Slope) (mm2) | 2.142 | 3.010 | 0.868 | 28.82% | 0.0106(b) | ||||||||||||
6
Zimura 2 mg Data by Part
As previously disclosed, the Company enrolled patients for the GATHER1 trial in two different parts, Part 1 and Part 2, with different dosages and randomization ratios in each Part. Twenty-five patients receiving Zimura 2 mg were enrolled in Part 1 of the trial and 42 patients receiving Zimura 2 mg were enrolled in Part 2 of the trial.
Below are the month 12 and month 18 results for the Zimura 2 mg group as compared to its corresponding sham group, for both Part 1 and Part 2, using both the original prespecified primary efficacy endpoint analysis for the GATHER1 trial and the post-hoc analysis using the FDA-preferred method that will be used prospectively for the GATHER2 trial:
Part 1 Only Data
| MRM Analysis | Zimura 2 mg (N = 25) | Sham (N = 26) | Difference | % Difference | ||||||||||
| 12 Month Sq. Rt. Transformation: | ||||||||||||||
| Mean Rate of Change in GA Area (mm) | 0.329 | 0.422 | 0.093 | 22.07% | ||||||||||
| Mean Rate of GA Growth (Slope) (mm) | 0.307 | 0.423 | 0.116 | 27.39% | ||||||||||
| 12 Month Observed Data: | ||||||||||||||
Mean Rate of Change in GA Area (mm2) | 1.910 | 2.593 | 0.683 | 26.35% | ||||||||||
Mean Rate of GA Growth (Slope) (mm2) | 1.655 | 2.238 | 0.584 | 26.08% | ||||||||||
| 18 Month Sq. Rt. Transformation: | ||||||||||||||
| Mean Rate of Change in GA Area (mm) | 0.464 | 0.635 | 0.170 | 26.84% | ||||||||||
| Mean Rate of GA Growth (Slope) (mm) | 0.446 | 0.630 | 0.184 | 29.23% | ||||||||||
| 18 Month Observed Data: | ||||||||||||||
Mean Rate of Change in GA Area (mm2) | 2.789 | 4.103 | 1.314 | 32.03% | ||||||||||
Mean Rate of GA Growth (Slope) (mm2) | 2.482 | 3.393 | 0.911 | 26.85% | ||||||||||
Part 2 Only Data
| MRM Analysis | Zimura 2 mg (N = 42) | Sham (N = 84) | Difference | % Difference | ||||||||||
| 12 Month Sq. Rt. Transformation: | ||||||||||||||
| Mean Rate of Change in GA Area (mm) | 0.308 | 0.422 | 0.114 | 27.02% | ||||||||||
| Mean Rate of GA Growth (Slope) (mm) | 0.303 | 0.424 | 0.121 | 28.51% | ||||||||||
| 12 Month Observed Data: | ||||||||||||||
Mean Rate of Change in GA Area (mm2) | 1.743 | 2.434 | 0.690 | 28.36% | ||||||||||
Mean Rate of GA Growth (Slope) (mm2) | 1.419 | 2.154 | 0.735 | 34.14% | ||||||||||
| 18 Month Sq. Rt. Transformation: | ||||||||||||||
| Mean Rate of Change in GA Area (mm) | 0.440 | 0.608 | 0.168 | 27.67% | ||||||||||
| Mean Rate of GA Growth (Slope) (mm) | 0.474 | 0.622 | 0.148 | 23.85% | ||||||||||
| 18 Month Observed Data: | ||||||||||||||
Mean Rate of Change in GA Area (mm2) | 2.550 | 3.649 | 1.099 | 30.12% | ||||||||||
Mean Rate of GA Growth (Slope) (mm2) | 2.203 | 3.264 | 1.061 | 32.51% | ||||||||||
7
SIGNATURES
Pursuant to the requirements of the Securities Exchange Act of 1934, the registrant has duly caused this report to be signed on its behalf by the undersigned hereunto duly authorized.
| IVERIC bio, Inc. | ||||||||
| Date: July 6, 2021 | By: | /s/ David F. Carroll | ||||||
| David F. Carroll | ||||||||
| Senior Vice President, Chief Financial Officer and Treasurer | ||||||||
8
Serious News for Serious Traders! Try StreetInsider.com Premium Free!
You May Also Be Interested In
- Bill Negotiation Service For Unemployed Professionals With No Upfront Fee—Update
- Defence's AccuTOX Anti-Cancer ARM-002 Vaccine Exhibits Potent Antigen Presentation
- SOLE Treadmills With Training Programs & Daily Fitness Classes Announced
Create E-mail Alert Related Categories
SEC FilingsSign up for StreetInsider Free!
Receive full access to all new and archived articles, unlimited portfolio tracking, e-mail alerts, custom newswires and RSS feeds - and more!
