

Form 8-K HarborOne Bancorp, Inc. For: May 05
 Tweet
Tweet Share
ShareExhibit 99.1
| Customer Focused. Values Driven. |

| 2021 Investor Report 2 Forward Looking Statements Certain statements herein constitute forward-looking statements within the meaning of Section 27A of the Securities Act of 1933, as amended, and Section 21E of the Securities Exchange Act of 1934, as amended and are intended to be covered by the safe harbor provisions of the Private Securities Litigation Reform Act of 1995. Such statements may be identified by words such as ”may,” “will,” “should,” “could,” “would,” “plan,” “potential,” “estimate,” “project,” “believe,” “intend,” “anticipate,” “expect,” “target” and similar expressions. These statements are based upon the current assumptions and beliefs of the Company’s management, are expectations of future results, and are subject to significant risks and uncertainties. Actual results may differ materially from those set forth in the forward-looking statements as a result of numerous factors. Factors that could cause such differences to exist include, but are not limited to, the negative impacts and disruptions of the COVID-19 pandemic and measures taken to contain its spread on our employees, customers, business operations, credit quality, financial position, liquidity and results of operations; changes in general business and economic conditions on a national basis and in the local markets in which the Company operates; changes in customer behavior; the possibility that future credit losses, loan defaults and charge-off rates are higher than expected due to changes in economic assumptions or adverse economic developments; turbulence in the capital and debt markets; changes in interest rates; decreases in the value of securities and other assets; decreases in deposit levels necessitating increased borrowing to fund loans and investments; competitive pressures from other financial institutions; operational risks including, but not limited to, cybersecurity incidents, fraud, natural disasters and future pandemics; changes in regulation; reputational risks relating to the Company’s participation in the Paycheck Protection Program and other pandemic-related legislative and regulatory initiatives and programs; changes in accounting standards and practices; the risk that goodwill and intangibles recorded in our financial statements will become impaired; risks related to the implementation of acquisitions, dispositions, and restructurings, including the risk that acquisitions may not produce results at levels or within time frames originally anticipated; the risk that we may not be successful in the implementation of our business strategy; changes in assumptions used in making such forward-looking statements; and the other risks and uncertainties detailed in the Company’s Annual Report on Form 10-K and Quarterly Reports on Form 10-Q as filed with the Securities and Exchange Commission (the “SEC”), which are available at the SEC’s website, www.sec.gov. Should one or more of these risks materialize or should underlying beliefs or assumptions prove incorrect, HarborOne Bancorp, Inc.’s actual results could differ materially from those discussed. Forward-looking statements speak only as of the date on which they are made. The Company does not undertake any obligation to update any forward-looking statement to reflect circumstances or events that occur after the date the forward-looking statements aremade. |
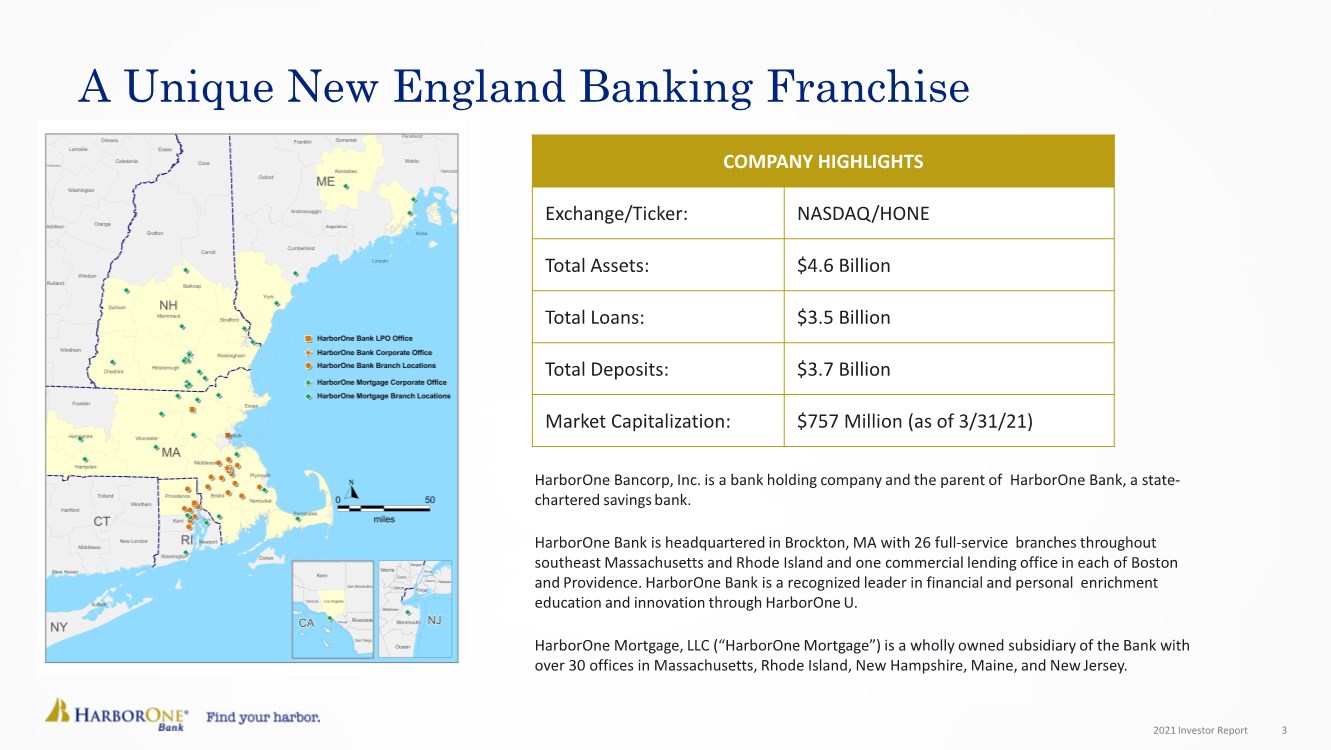
| 2021 Investor Report 3 COMPANY HIGHLIGHTS Exchange/Ticker: NASDAQ/HONE Total Assets: $4.6 Billion Total Loans: $3.5 Billion Total Deposits: $3.7 Billion Market Capitalization: $757 Million (as of 3/31/21) A Unique New England Banking Franchise HarborOne Bancorp, Inc. is a bank holding company and the parent of HarborOne Bank, a state- chartered savingsbank. HarborOne Bank is headquartered in Brockton, MA with 26 full-service branches throughout southeast Massachusetts and Rhode Island and one commercial lending office in each of Boston and Providence. HarborOne Bank is a recognized leader in financial and personal enrichment education and innovation through HarborOne U. HarborOne Mortgage, LLC (“HarborOne Mortgage”) is a wholly owned subsidiary of the Bank with over 30 offices in Massachusetts, Rhode Island, New Hampshire, Maine, and New Jersey. |
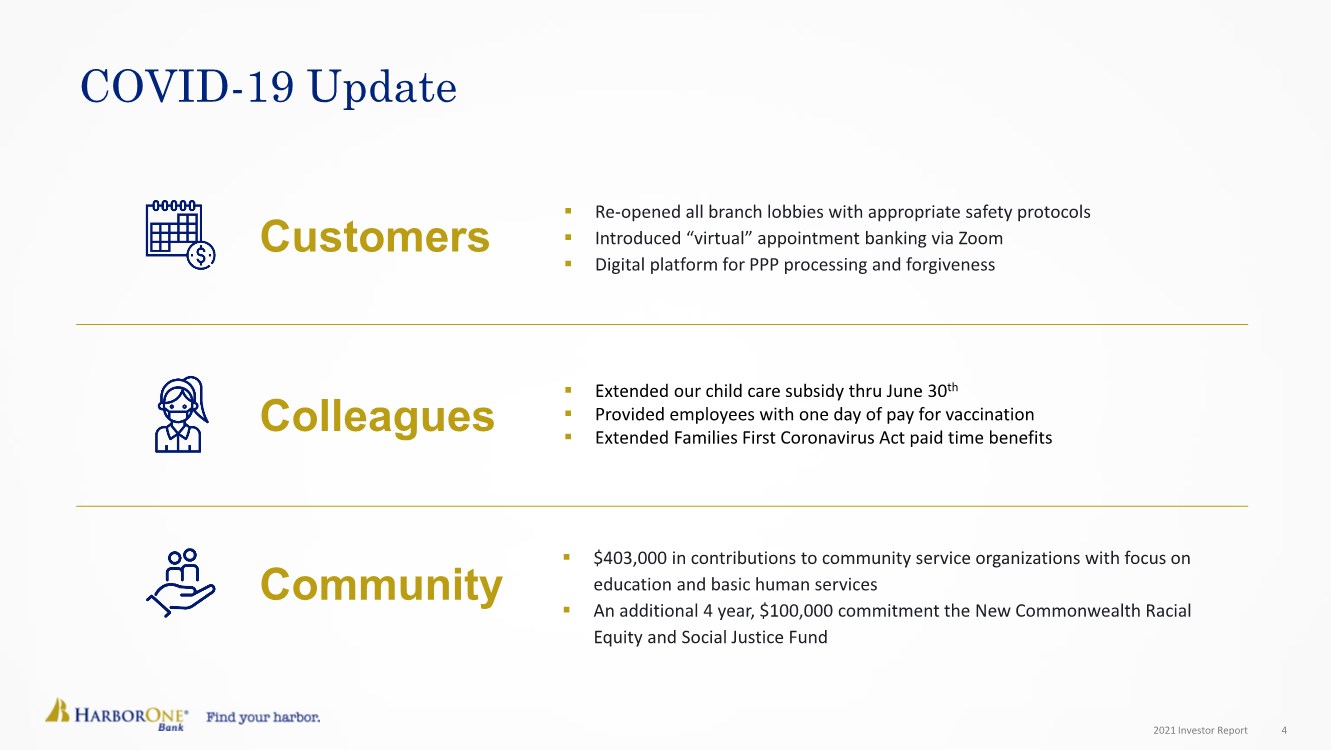
| 2021 Investor Report 4 .. Re-opened all branch lobbies with appropriate safety protocols .. Introduced “virtual” appointment banking via Zoom .. Digital platform for PPP processing and forgiveness COVID-19 Update .. Extended our child care subsidy thru June 30th .. Provided employees with one day of pay for vaccination .. Extended Families First Coronavirus Act paid time benefits .. $403,000 in contributions to community service organizations with focus on education and basic human services .. An additional 4 year, $100,000 commitment the New Commonwealth Racial Equity and Social Justice Fund Customers Colleagues Community |
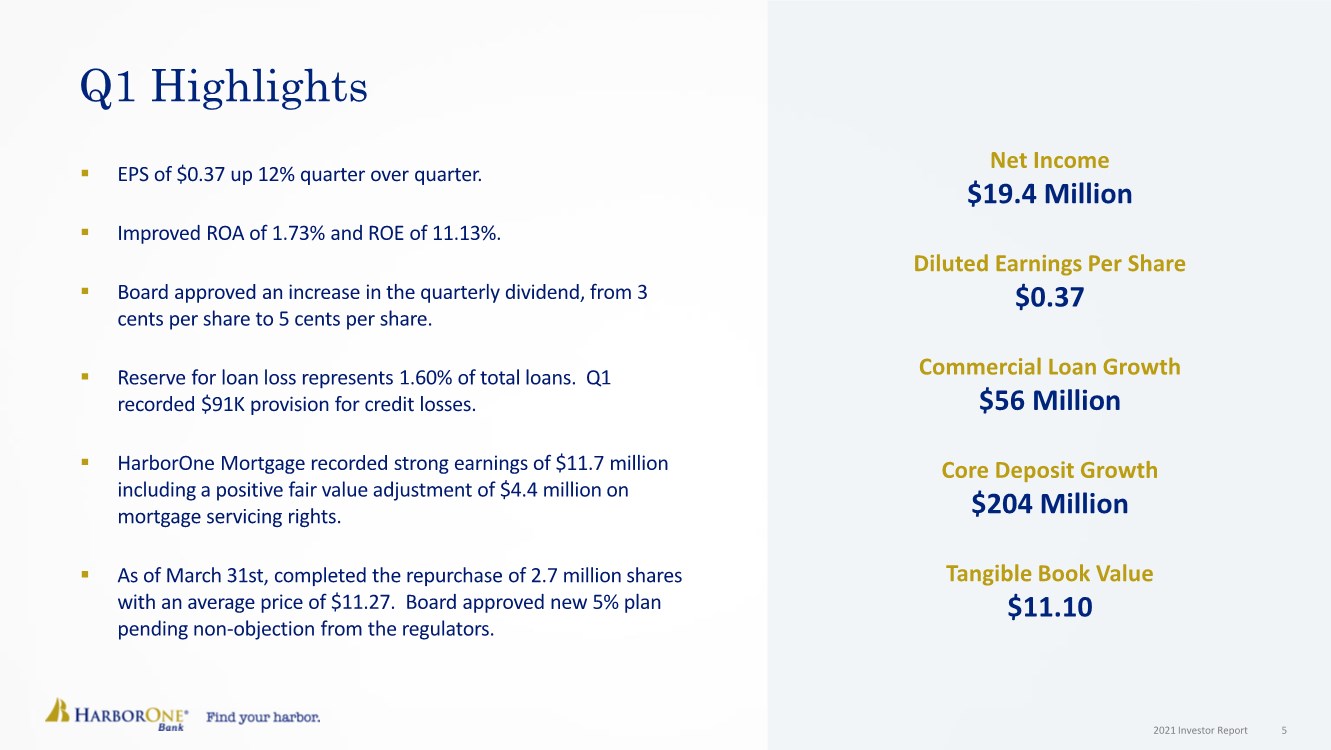
| 2021 Investor Report 5 Q1 Highlights .. EPS of $0.37 up 12% quarter over quarter. .. Improved ROA of 1.73% and ROE of 11.13%. .. Board approved an increase in the quarterly dividend, from 3 cents per share to 5 cents per share. .. Reserve for loan loss represents 1.60% of total loans. Q1 recorded $91K provision for credit losses. .. HarborOne Mortgage recorded strong earnings of $11.7 million including a positive fair value adjustment of $4.4 million on mortgage servicing rights. .. As of March 31st, completed the repurchase of 2.7 million shares with an average price of $11.27. Board approved new 5% plan pending non-objection from the regulators. Net Income $19.4 Million Diluted Earnings Per Share $0.37 Commercial Loan Growth $56 Million Core Deposit Growth $204 Million Tangible Book Value $11.10 |
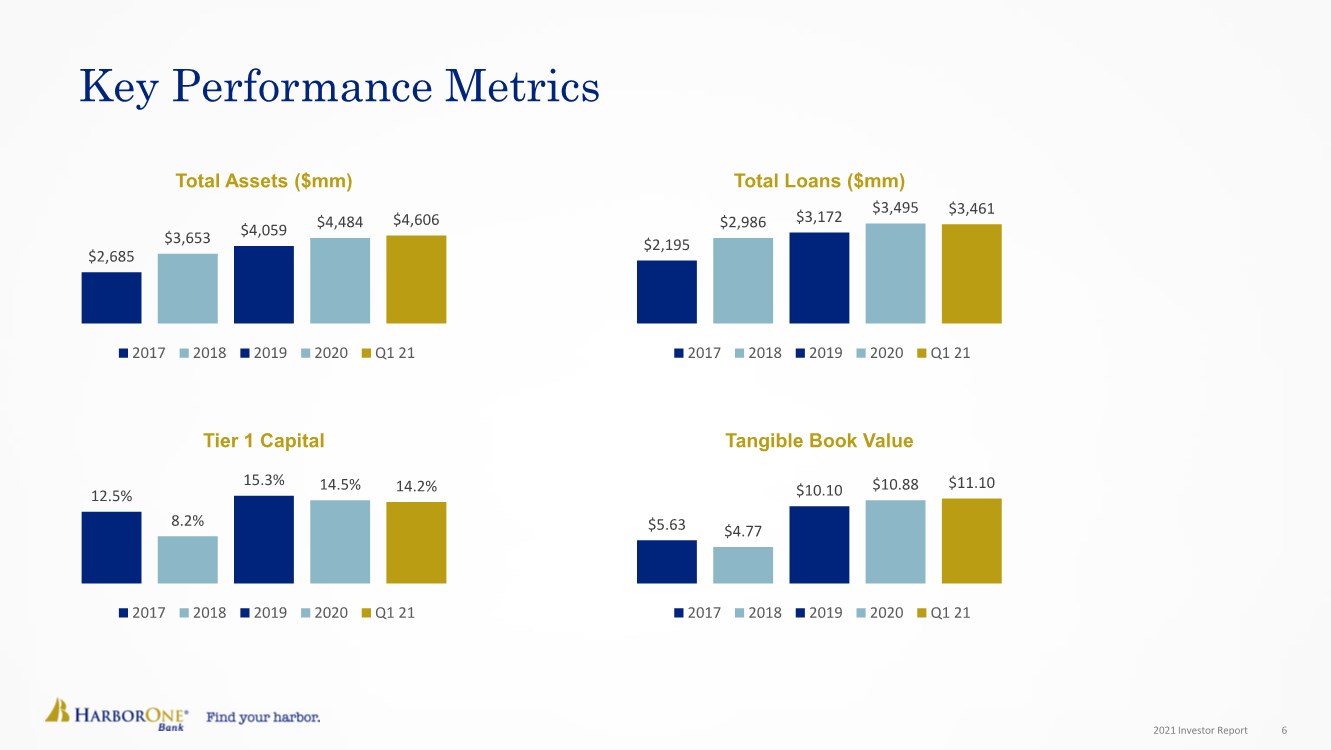
| 2021 Investor Report 6 Key Performance Metrics $2,685 $3,653 $4,059 $4,484 $4,606 Total Assets ($mm) 2017 2018 2019 2020 Q1 21 12.5% 8.2% 15.3% 14.5% 14.2% Tier 1 Capital 2017 2018 2019 2020 Q1 21 $2,195 $2,986 $3,172 $3,495 $3,461 Total Loans ($mm) 2017 2018 2019 2020 Q1 21 $5.63 $4.77 $10.10 $10.88 $11.10 Tangible Book Value 2017 2018 2019 2020 Q1 21 |
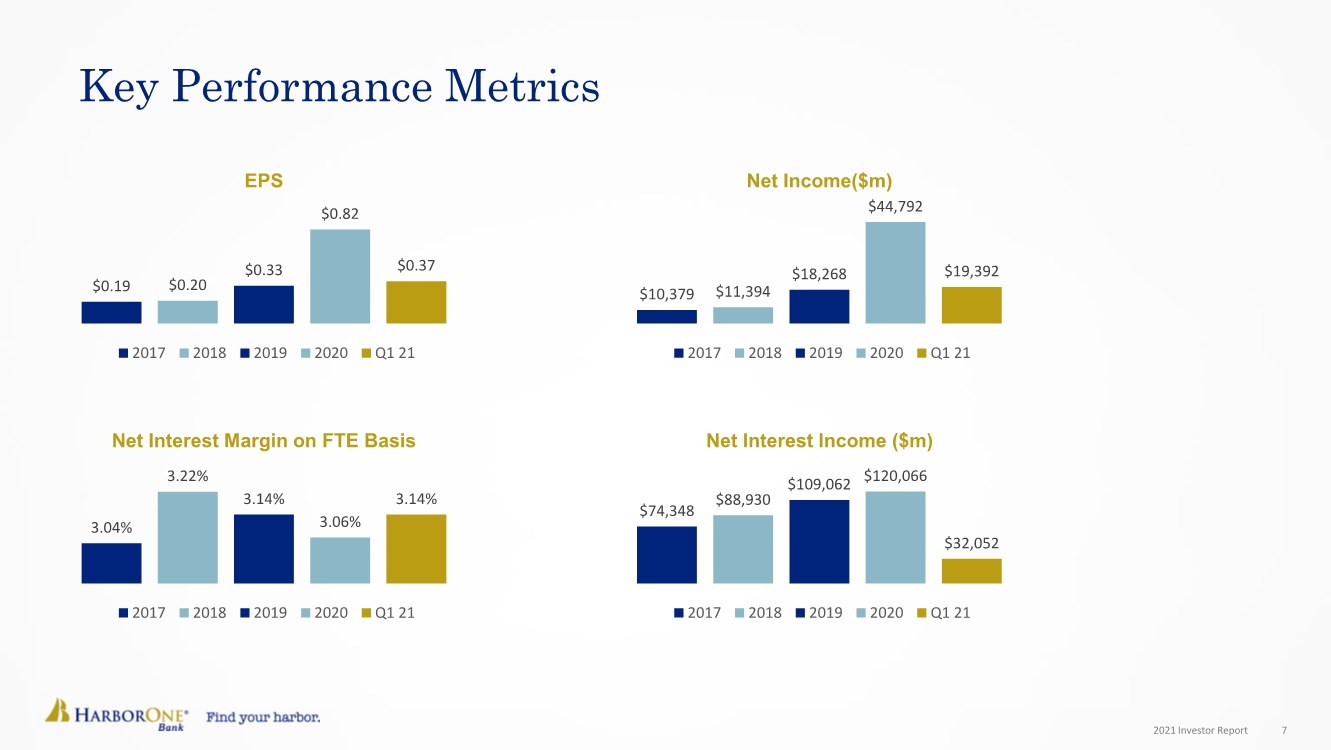
| 2021 Investor Report 7 Key Performance Metrics $0.19 $0.20 $0.33 $0.82 $0.37 EPS 2017 2018 2019 2020 Q1 21 3.04% 3.22% 3.14% 3.06% 3.14% Net Interest Margin on FTE Basis 2017 2018 2019 2020 Q1 21 $10,379 $11,394 $18,268 $44,792 $19,392 Net Income($m) 2017 2018 2019 2020 Q1 21 $74,348 $88,930 $109,062 $120,066 $32,052 Net Interest Income ($m) 2017 2018 2019 2020 Q1 21 |
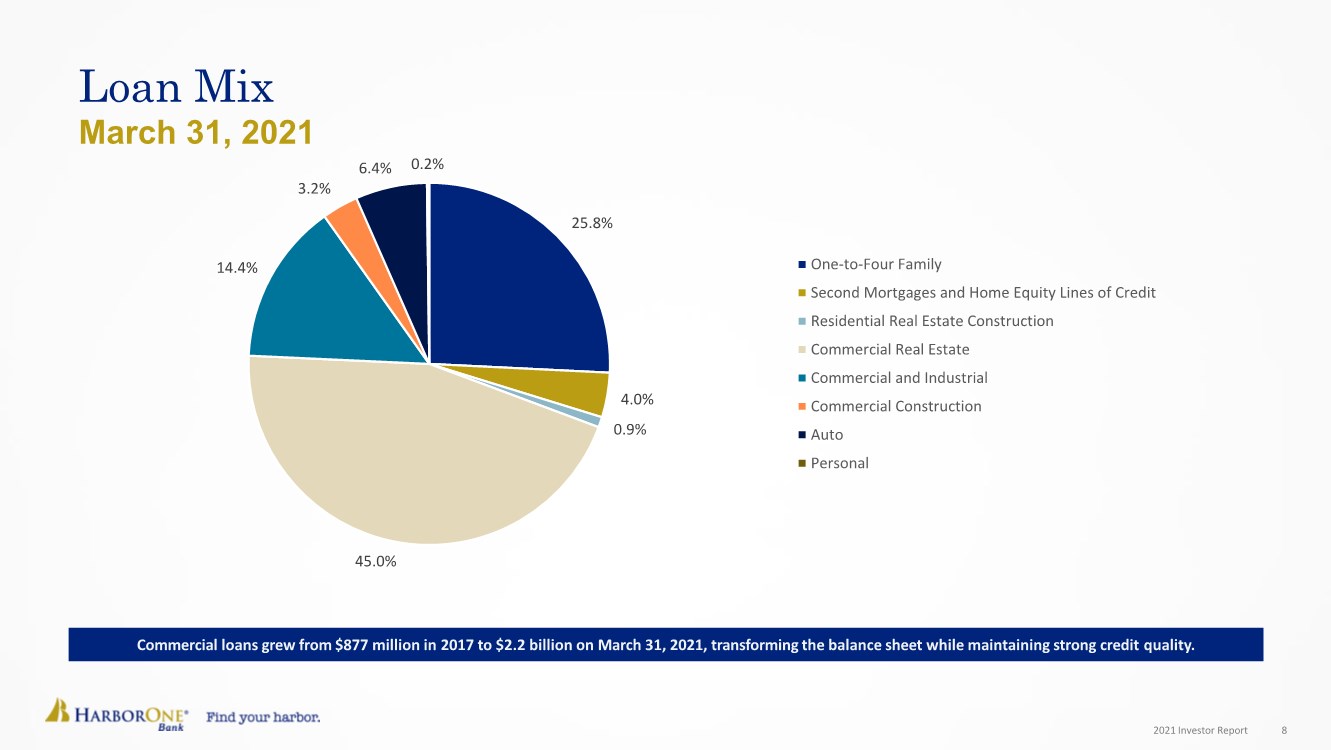
| 2021 Investor Report 8 Loan Mix March 31, 2021 25.8% 4.0% 0.9% 45.0% 14.4% 3.2% 6.4% 0.2% One-to-Four Family Second Mortgages and Home Equity Lines of Credit Residential Real Estate Construction Commercial Real Estate Commercial and Industrial Commercial Construction Auto Personal Commercial loans grew from $877 million in 2017 to $2.2 billion on March 31, 2021, transforming the balance sheet while maintaining strong credit quality. |
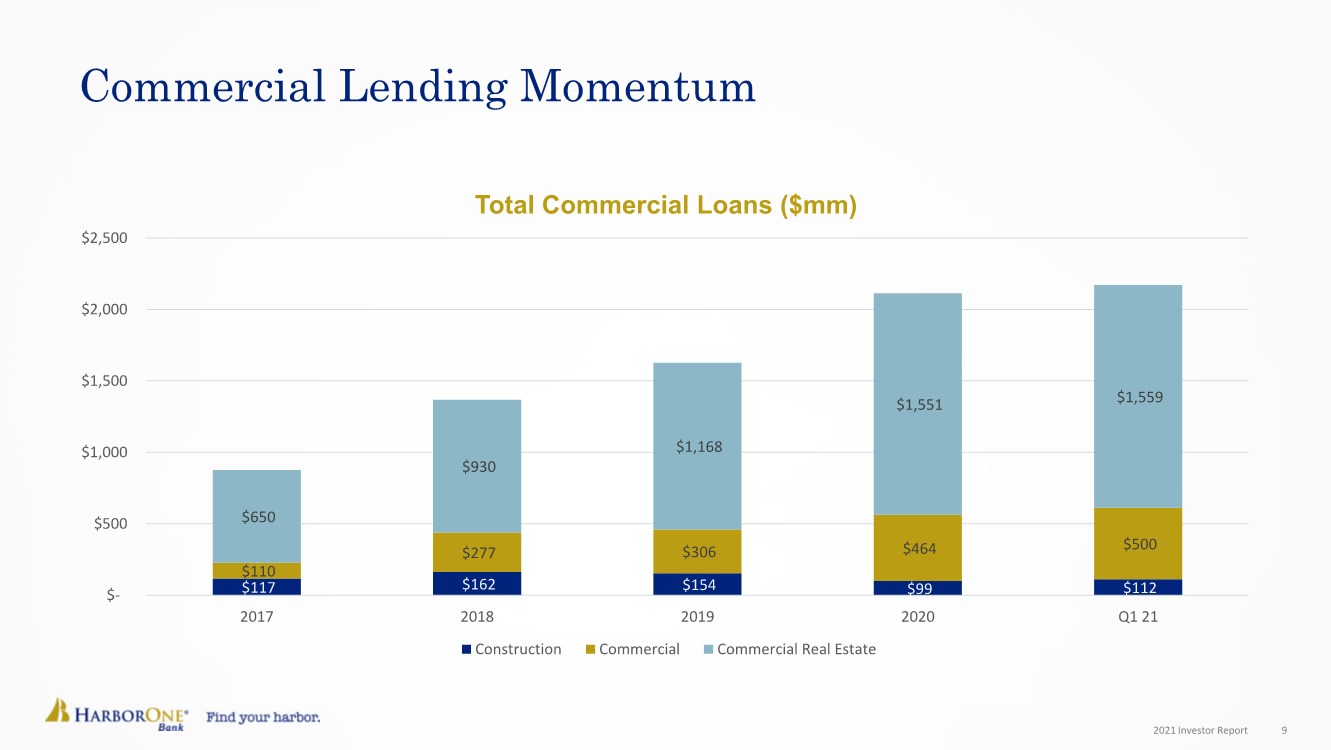
| 2021 Investor Report 9 Commercial Lending Momentum $117 $162 $154 $99 $112 $110 $277 $306 $464 $500 $650 $930 $1,168 $1,551 $1,559 $- $500 $1,000 $1,500 $2,000 $2,500 2017 2018 2019 2020 Q1 21 Total Commercial Loans ($mm) Construction Commercial Commercial Real Estate |
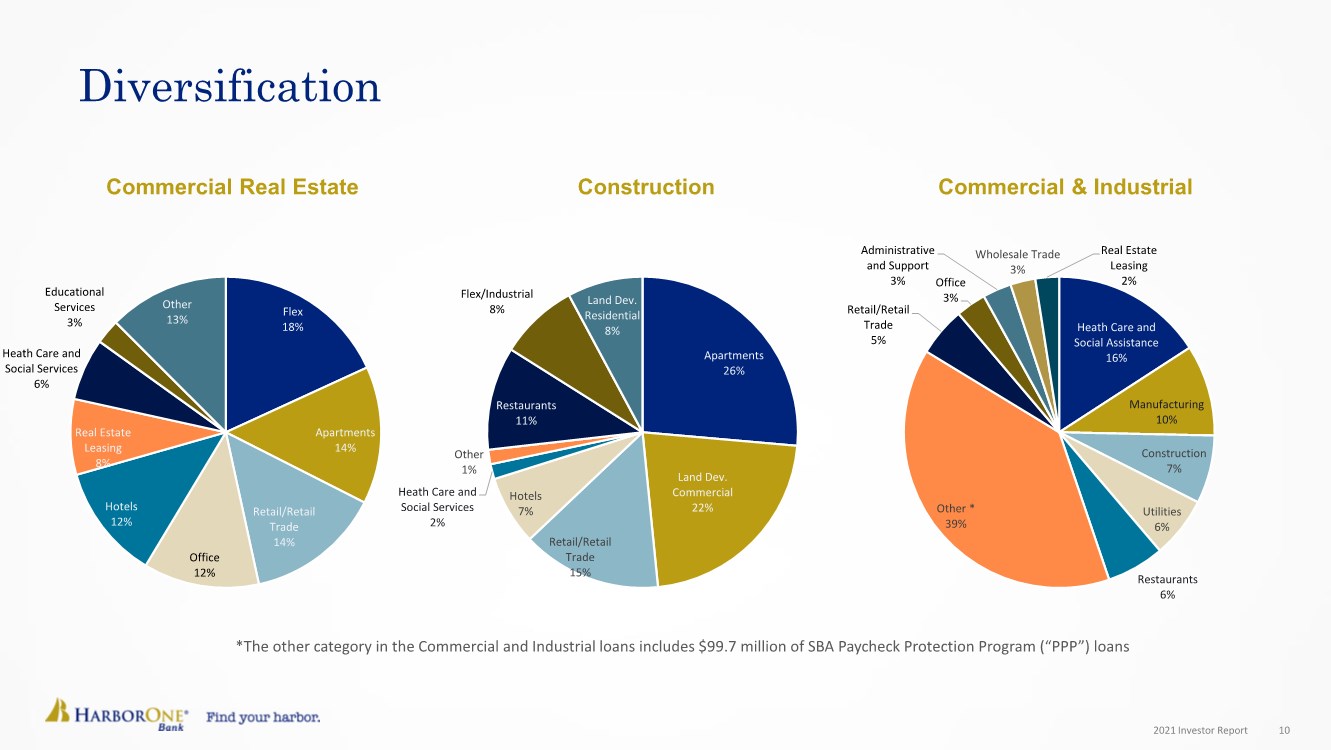
| 2021 Investor Report 10 Diversification Flex 18% Apartments 14% Retail/Retail Trade 14% Office 12% Hotels 12% Real Estate Leasing 8% Heath Care and Social Services 6% Educational Services 3% Other 13% Apartments 26% Land Dev. Commercial 22% Retail/Retail Trade 15% Hotels 7% Heath Care and Social Services 2% Other 1% Restaurants 11% Flex/Industrial 8% Land Dev. Residential 8% Heath Care and Social Assistance 16% Manufacturing 10% Construction 7% Utilities 6% Restaurants 6% Other * 39% Retail/Retail Trade 5% Office 3% Administrative and Support 3% Wholesale Trade 3% Real Estate Leasing 2% Commercial Real Estate Construction Commercial & Industrial *The other category in the Commercial and Industrial loans includes $99.7 million of SBA Paycheck Protection Program (“PPP”) loans |
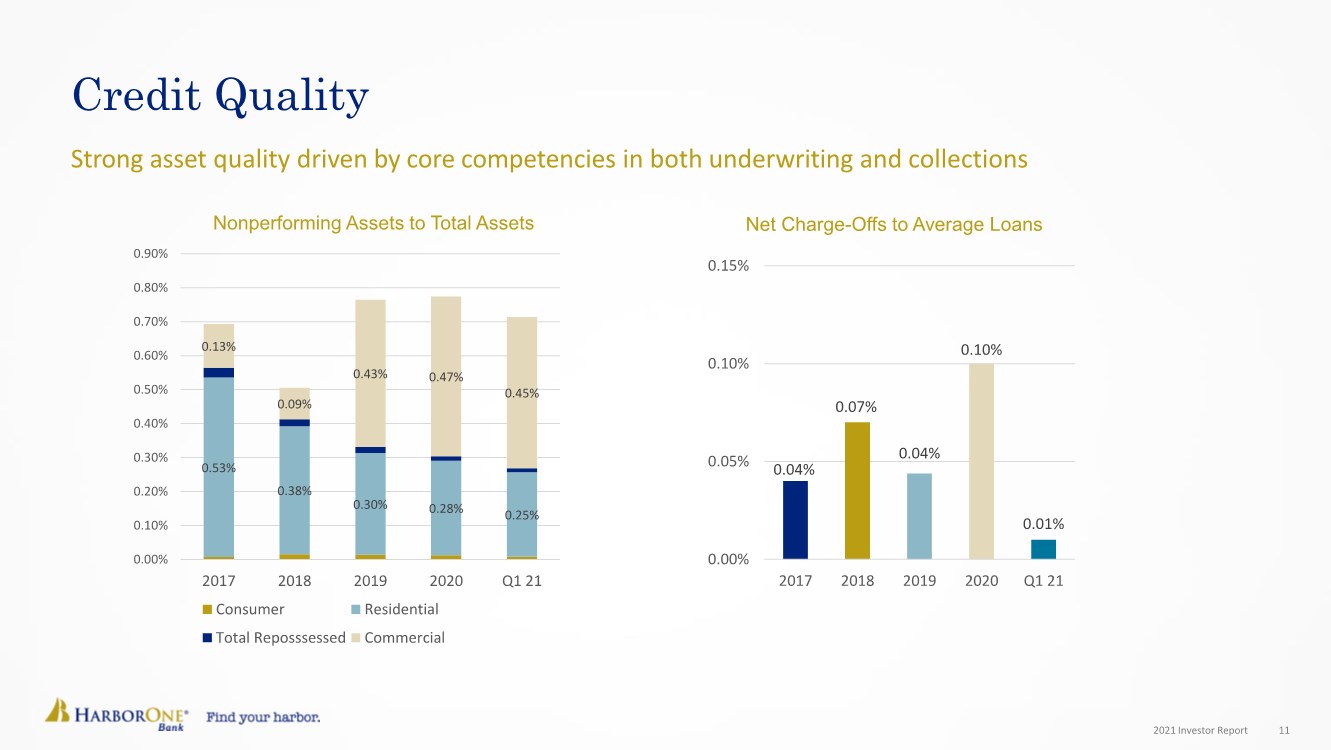
| 2021 Investor Report 11 Credit Quality Strong asset quality driven by core competencies in both underwriting and collections 0.53% 0.38% 0.30% 0.28% 0.25% 0.13% 0.09% 0.43% 0.47% 0.45% 0.00% 0.10% 0.20% 0.30% 0.40% 0.50% 0.60% 0.70% 0.80% 0.90% 2017 2018 2019 2020 Q1 21 Nonperforming Assets to Total Assets Consumer Residential Total Reposssessed Commercial 0.04% 0.07% 0.04% 0.10% 0.01% 0.00% 0.05% 0.10% 0.15% 2017 2018 2019 2020 Q1 21 Net Charge-Offs to Average Loans |
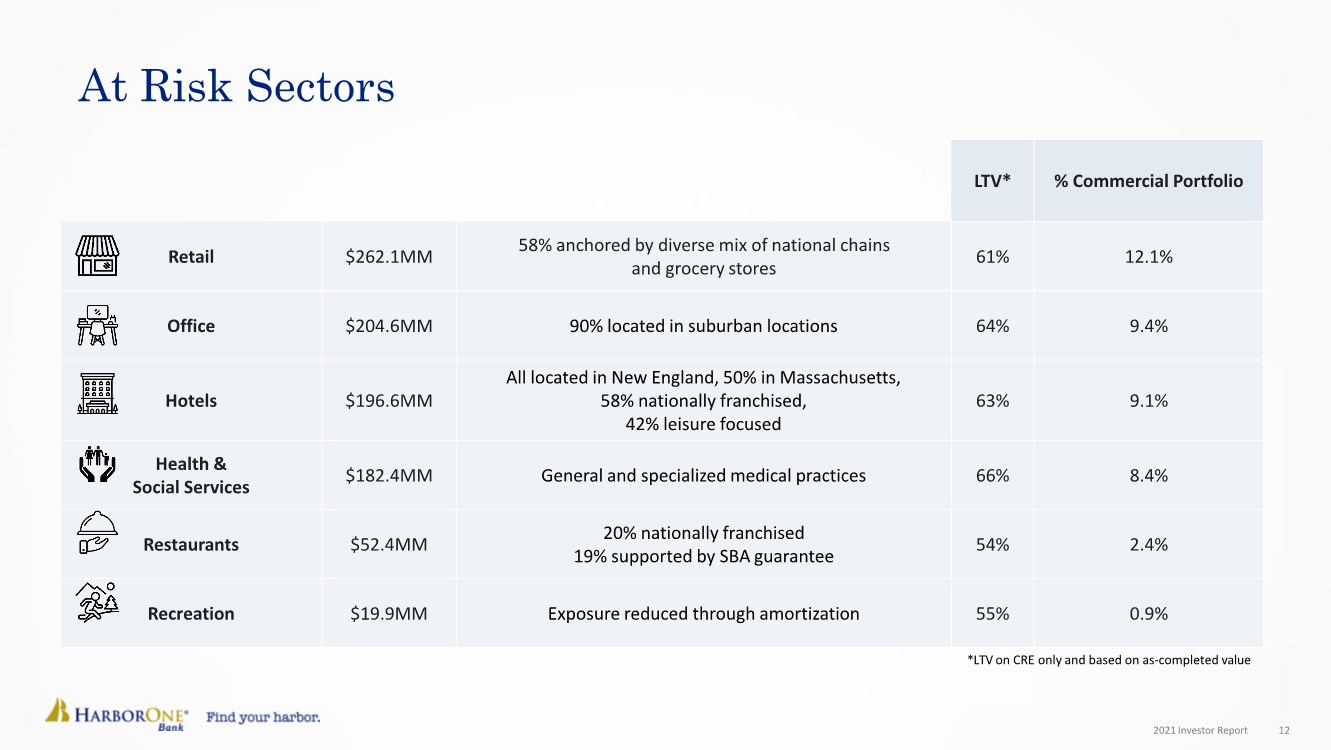
| 2021 Investor Report 12 At Risk Sectors LTV* % Commercial Portfolio Retail $262.1MM 58% anchored by diverse mix of national chains and grocery stores 61% 12.1% Office $204.6MM 90% located in suburban locations 64% 9.4% Hotels $196.6MM All located in New England, 50% in Massachusetts, 58% nationally franchised, 42% leisure focused 63% 9.1% Health & Social Services $182.4MM General and specialized medical practices 66% 8.4% Restaurants $52.4MM 20% nationally franchised 19% supported by SBA guarantee 54% 2.4% Recreation $19.9MM Exposure reduced through amortization 55% 0.9% *LTV on CRE only and based on as-completed value |
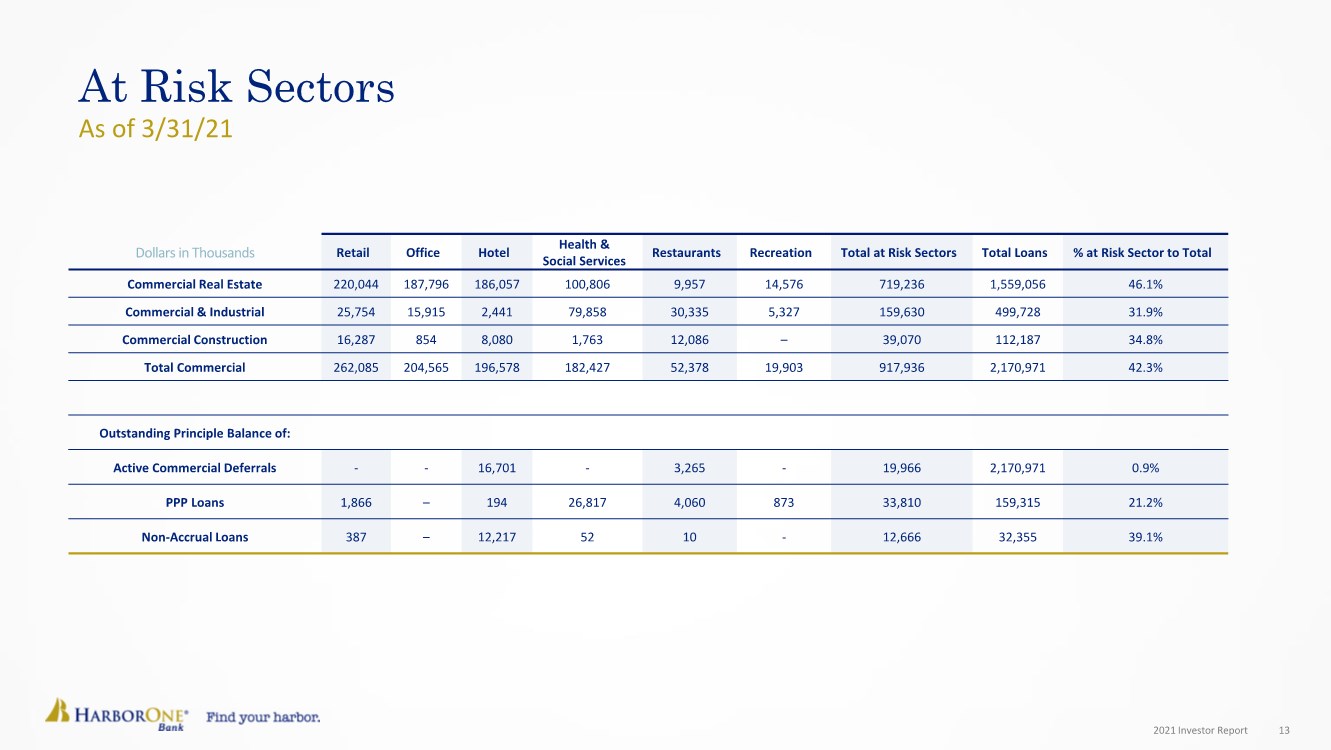
| 2021 Investor Report 13 Dollars in Thousands Retail Office Hotel Health & Social Services Restaurants Recreation Total at Risk Sectors Total Loans % at Risk Sector to Total Commercial Real Estate 220,044 187,796 186,057 100,806 9,957 14,576 719,236 1,559,056 46.1% Commercial & Industrial 25,754 15,915 2,441 79,858 30,335 5,327 159,630 499,728 31.9% Commercial Construction 16,287 854 8,080 1,763 12,086 – 39,070 112,187 34.8% Total Commercial 262,085 204,565 196,578 182,427 52,378 19,903 917,936 2,170,971 42.3% Outstanding Principle Balance of: Active Commercial Deferrals -- 16,701 - 3,265 - 19,966 2,170,971 0.9% PPP Loans 1,866 – 194 26,817 4,060 873 33,810 159,315 21.2% Non-Accrual Loans 387 – 12,217 52 10 - 12,666 32,355 39.1% At Risk Sectors As of 3/31/21 |
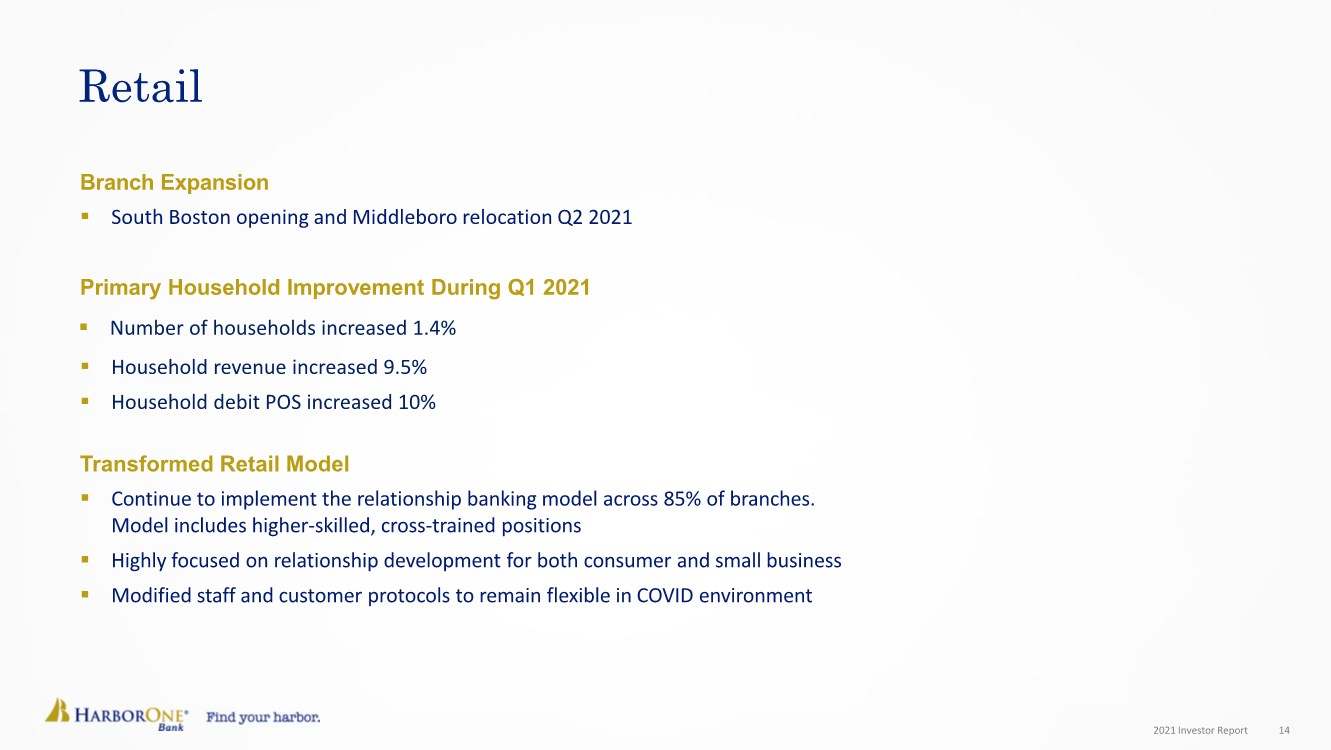
| 2021 Investor Report 14 Retail Branch Expansion .. South Boston opening and Middleboro relocation Q2 2021 Primary Household Improvement During Q1 2021 .. Number of households increased 1.4% .. Household revenue increased 9.5% .. Household debit POS increased 10% Transformed Retail Model .. Continue to implement the relationship banking model across 85% of branches. Model includes higher-skilled, cross-trained positions .. Highly focused on relationship development for both consumer and small business .. Modified staff and customer protocols to remain flexible in COVID environment |
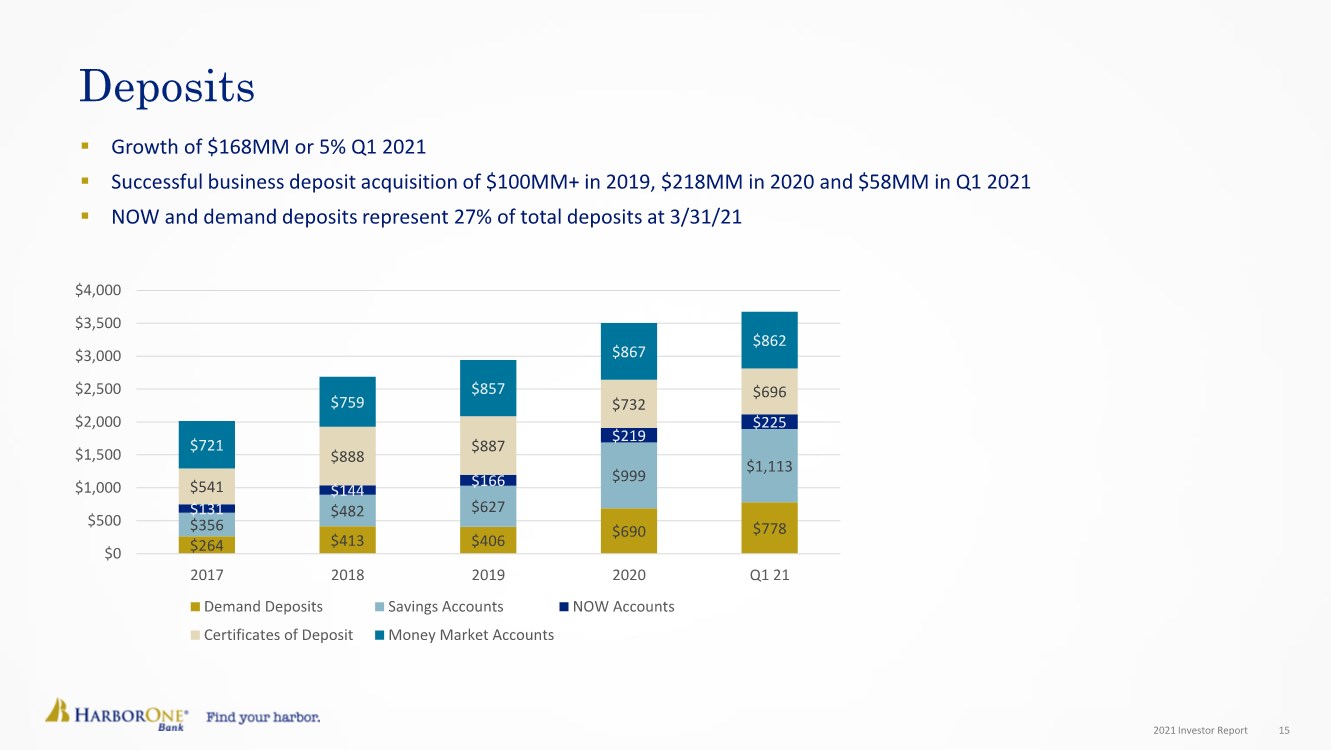
| 2021 Investor Report 15 Deposits .. Growth of $168MM or 5% Q1 2021 .. Successful business deposit acquisition of $100MM+ in 2019, $218MM in 2020 and $58MM in Q1 2021 .. NOW and demand deposits represent 27% of total deposits at 3/31/21 $264 $413 $406 $690 $778 $356 $482 $627 $999 $1,113 $131 $144 $166 $219 $225 $541 $888 $887 $732 $696 $721 $759 $857 $867 $862 $0 $500 $1,000 $1,500 $2,000 $2,500 $3,000 $3,500 $4,000 2017 2018 2019 2020 Q1 21 Demand Deposits Savings Accounts NOW Accounts Certificates of Deposit Money Market Accounts |
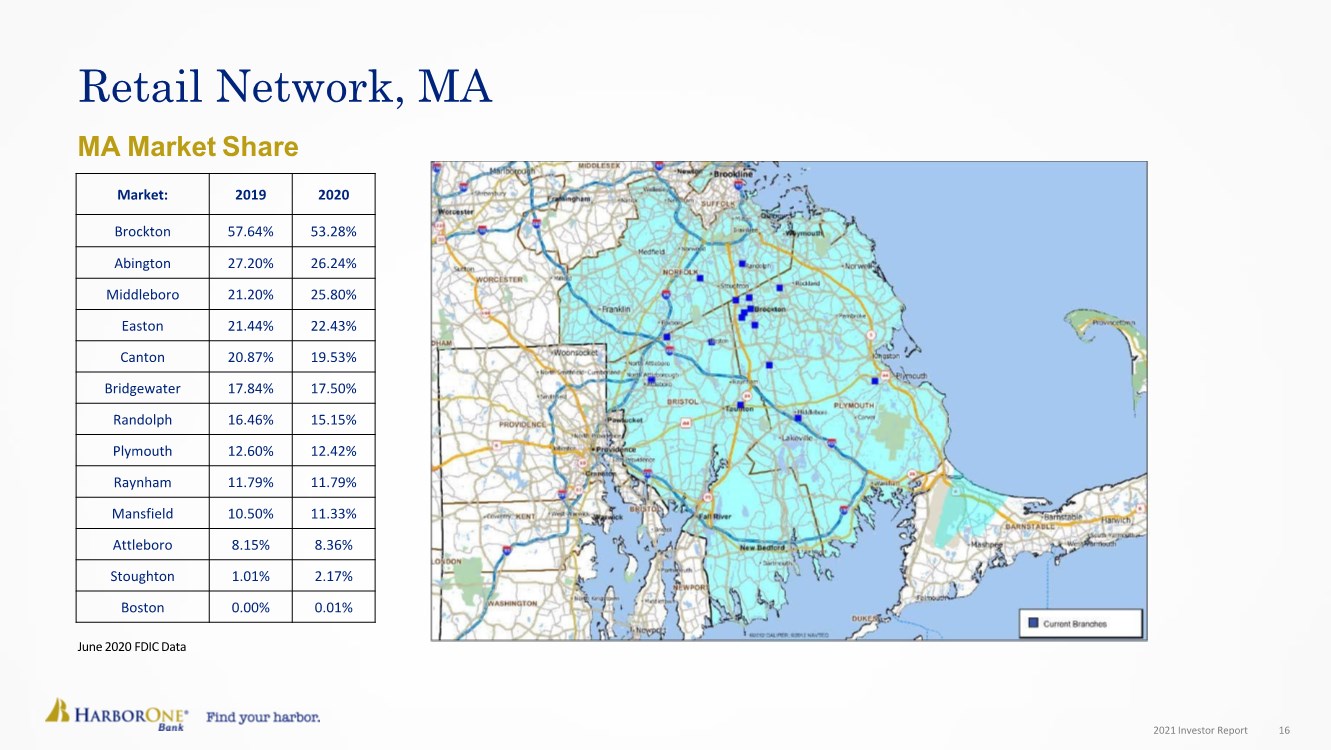
| 2021 Investor Report 16 Retail Network, MA MA Market Share Market: 2019 2020 Brockton 57.64% 53.28% Abington 27.20% 26.24% Middleboro 21.20% 25.80% Easton 21.44% 22.43% Canton 20.87% 19.53% Bridgewater 17.84% 17.50% Randolph 16.46% 15.15% Plymouth 12.60% 12.42% Raynham 11.79% 11.79% Mansfield 10.50% 11.33% Attleboro 8.15% 8.36% Stoughton 1.01% 2.17% Boston 0.00% 0.01% June 2020 FDIC Data |
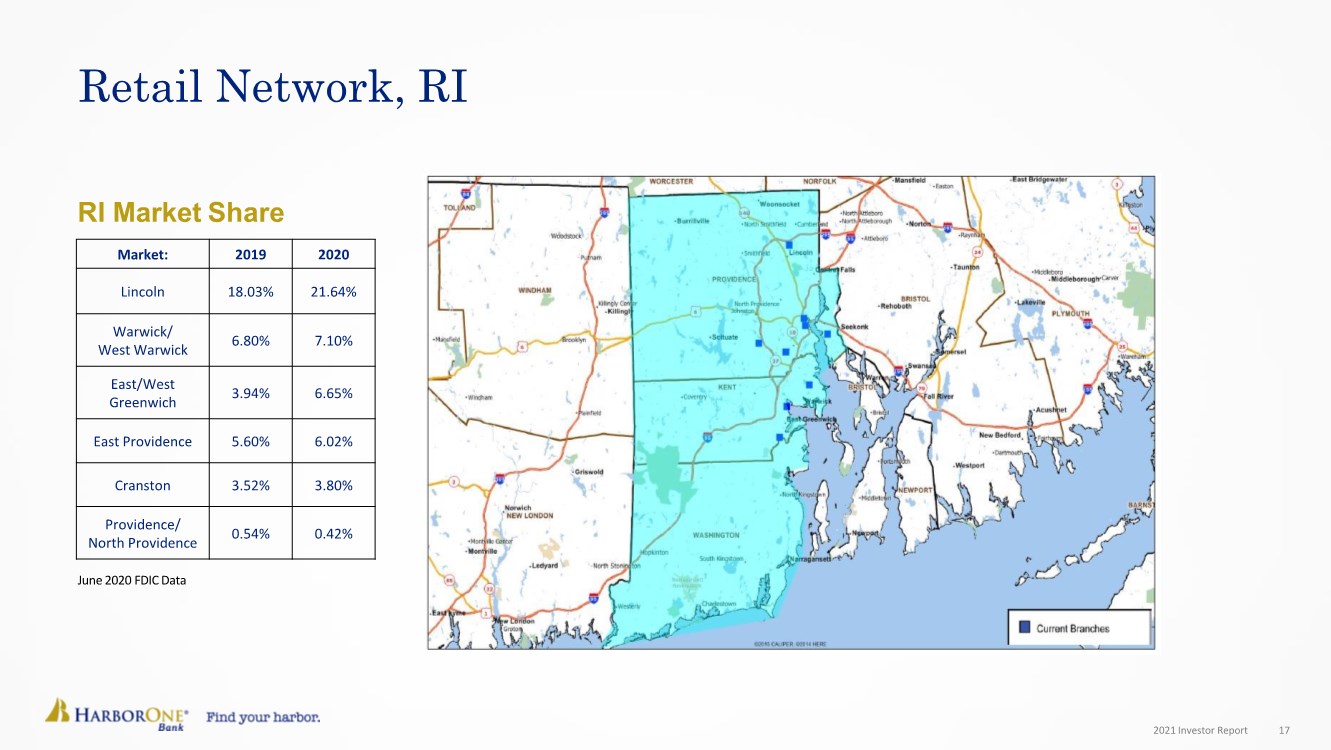
| 2021 Investor Report 17 Retail Network, RI RI Market Share Market: 2019 2020 Lincoln 18.03% 21.64% Warwick/ West Warwick 6.80% 7.10% East/West Greenwich 3.94% 6.65% East Providence 5.60% 6.02% Cranston 3.52% 3.80% Providence/ North Providence 0.54% 0.42% June 2020 FDIC Data |
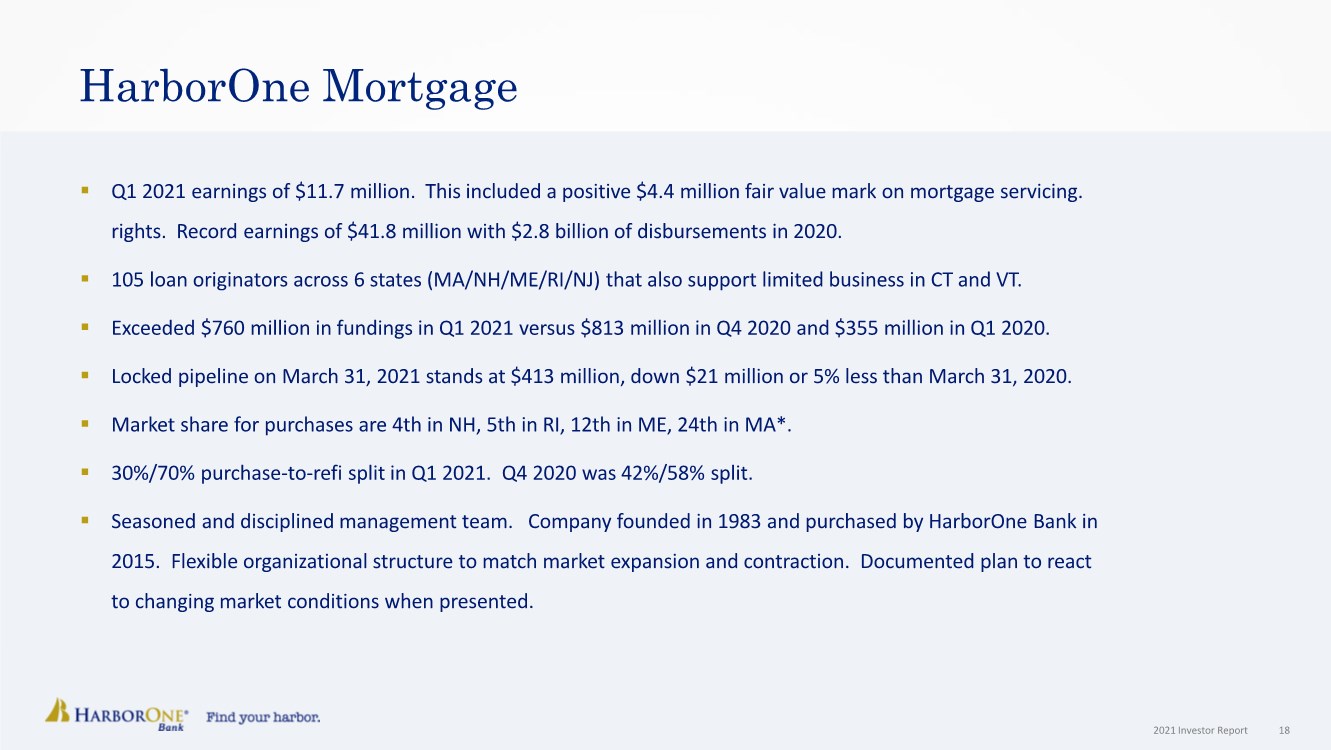
| 2021 Investor Report 18 HarborOne Mortgage .. Q1 2021 earnings of $11.7 million. This included a positive $4.4 million fair value mark on mortgage servicing. rights. Record earnings of $41.8 million with $2.8 billion of disbursements in 2020. .. 105 loan originators across 6 states (MA/NH/ME/RI/NJ) that also support limited business in CT and VT. .. Exceeded $760 million in fundings in Q1 2021 versus $813 million in Q4 2020 and $355 million in Q1 2020. .. Locked pipeline on March 31, 2021 stands at $413 million, down $21 million or 5% less than March 31, 2020. .. Market share for purchases are 4th in NH, 5th in RI, 12th in ME, 24th in MA*. .. 30%/70% purchase-to-refi split in Q1 2021. Q4 2020 was 42%/58% split. .. Seasoned and disciplined management team. Company founded in 1983 and purchased by HarborOne Bank in 2015. Flexible organizational structure to match market expansion and contraction. Documented plan to react to changing market conditions when presented. |
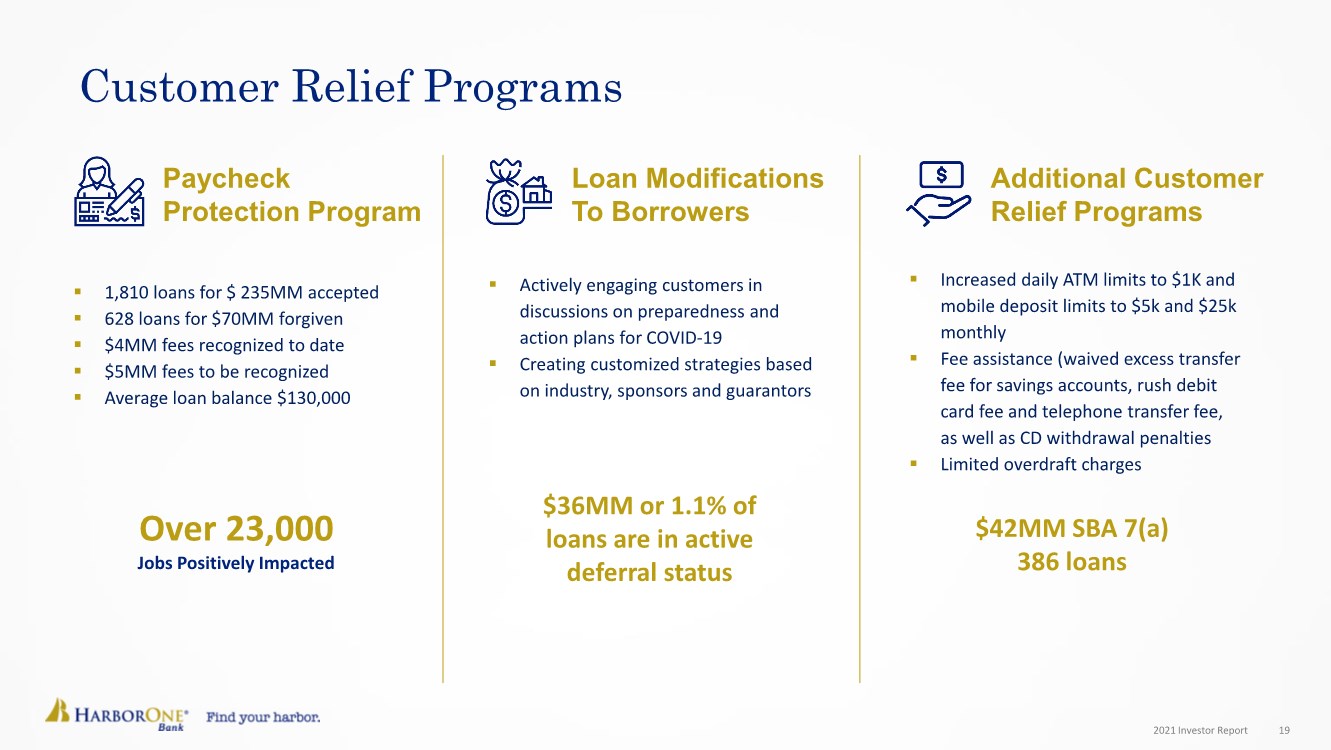
| 2021 Investor Report 19 .. 1,810 loans for $ 235MM accepted .. 628 loans for $70MM forgiven .. $4MM fees recognized to date .. $5MM fees to be recognized .. Average loan balance $130,000 Customer Relief Programs Paycheck Protection Program Over 23,000 Jobs Positively Impacted .. Actively engaging customers in discussions on preparedness and action plans for COVID-19 .. Creating customized strategies based on industry, sponsors and guarantors Loan Modifications To Borrowers .. Increased daily ATM limits to $1K and mobile deposit limits to $5k and $25k monthly .. Fee assistance (waived excess transfer fee for savings accounts, rush debit card fee and telephone transfer fee, as well as CD withdrawal penalties .. Limited overdraft charges Additional Customer Relief Programs $36MM or 1.1% of loans are in active deferral status $42MM SBA 7(a) 386 loans |
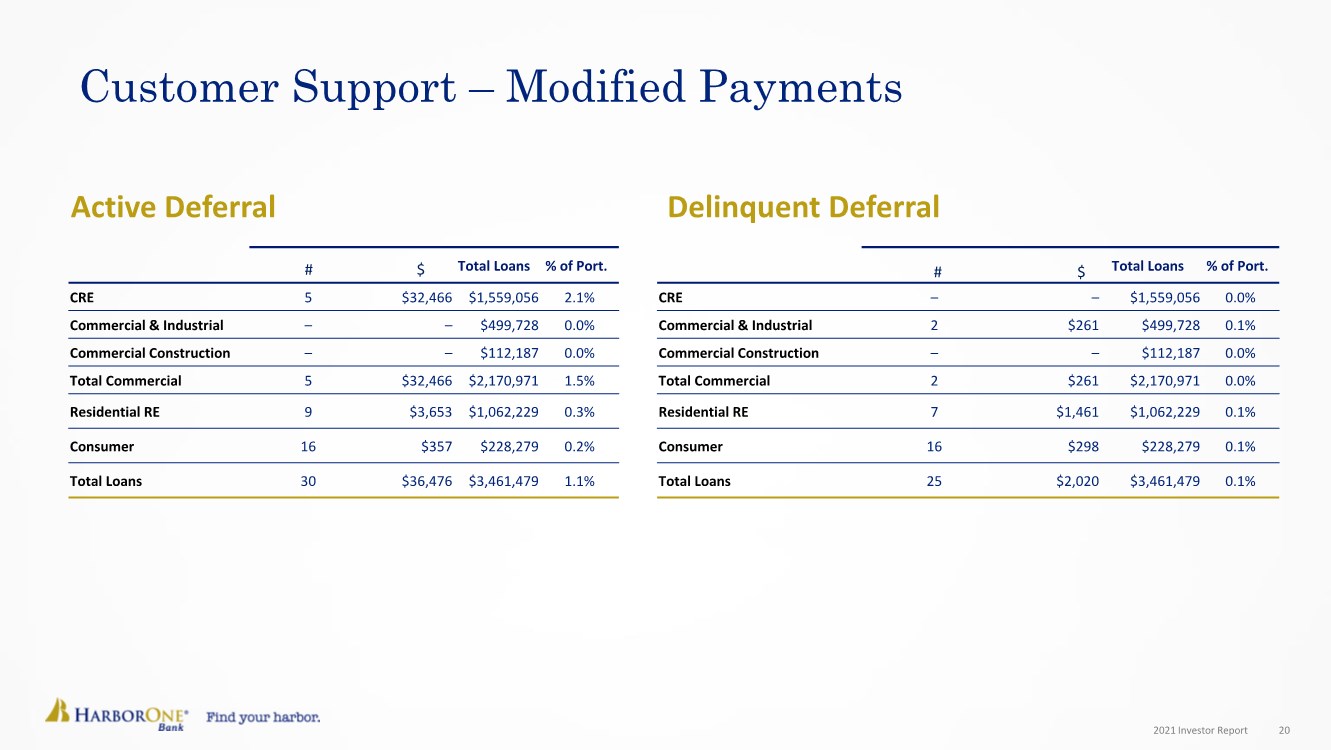
| 2021 Investor Report 20 Customer Support – Modified Payments Total Loans % of Port. CRE 5 $32,466 $1,559,056 2.1% Commercial & Industrial –– $499,728 0.0% Commercial Construction –– $112,187 0.0% Total Commercial 5 $32,466 $2,170,971 1.5% Residential RE 9 $3,653 $1,062,229 0.3% Consumer 16 $357 $228,279 0.2% Total Loans 30 $36,476 $3,461,479 1.1% Active Deferral Total Loans % of Port. CRE –– $1,559,056 0.0% Commercial & Industrial 2 $261 $499,728 0.1% Commercial Construction –– $112,187 0.0% Total Commercial 2 $261 $2,170,971 0.0% Residential RE 7 $1,461 $1,062,229 0.1% Consumer 16 $298 $228,279 0.1% Total Loans 25 $2,020 $3,461,479 0.1% Delinquent Deferral # $ # $ |
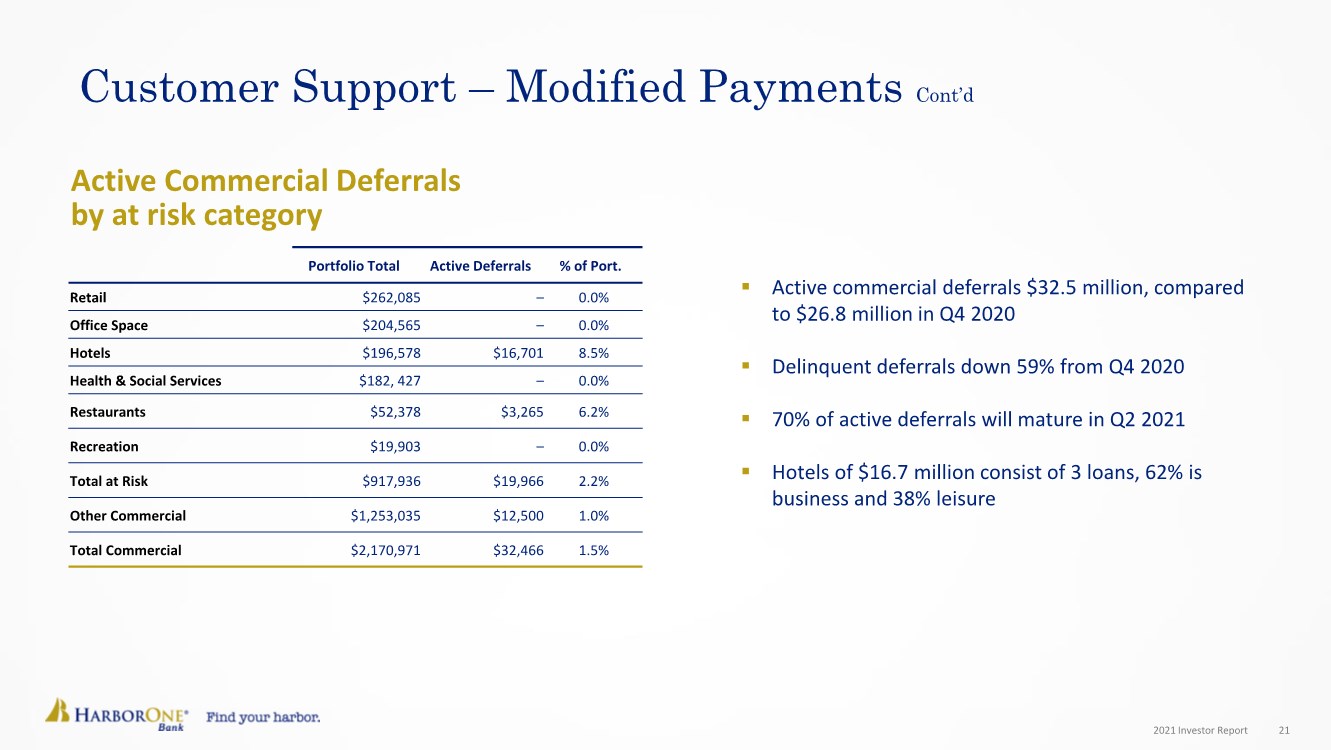
| 2021 Investor Report 21 Customer Support – Modified Payments Cont’d Portfolio Total Active Deferrals % of Port. Retail $262,085 – 0.0% Office Space $204,565 – 0.0% Hotels $196,578 $16,701 8.5% Health & Social Services $182, 427 – 0.0% Restaurants $52,378 $3,265 6.2% Recreation $19,903 – 0.0% Total at Risk $917,936 $19,966 2.2% Other Commercial $1,253,035 $12,500 1.0% Total Commercial $2,170,971 $32,466 1.5% Active Commercial Deferrals by at risk category .. Active commercial deferrals $32.5 million, compared to $26.8 million in Q4 2020 .. Delinquent deferrals down 59% from Q4 2020 .. 70% of active deferrals will mature in Q2 2021 .. Hotels of $16.7 million consist of 3 loans, 62% is business and 38% leisure |
| 2021 Investor Report 22 Committed to the Fundamentals .. Focused on organic growth .. Ongoing balance sheet transformation to achieve margin stability .. Lower cost deposit drivers with focus on commercial and small business funding sources .. Digital transformation: enhanced tools, processes, and products that meet customer expectations .. We win with our people: investments in training, talent acquisition, and retention .. Seasoned and aligned management team and Board that drive results .. Maintain our commitment to being an outstanding community leader – Community is in our DNA, from our Foundation contributions to our Caring Crew volunteer programs .. Will only consider M&A with a financially attractive opportunity that ensures minimal TBV dilution |
| 2021 Investor Report 23 Key Priorities Next 12 Months .. Grow digital banking penetration among primary households .. Disciplined deployment of capital, focused on technology and process improvements .. Capitalize on recent M&A activity in the market with customer and talent acquisition .. Continuation of profitable commercial loan growth (CRE, C&I, small business) and associated low-cost deposits .. Invest in brand-building in the Rhode Island and Boston markets .. Extend our successful Rhode Island SBA model into Massachusetts .. Enhance and expand our Diversity, Equity, and Inclusion programs |
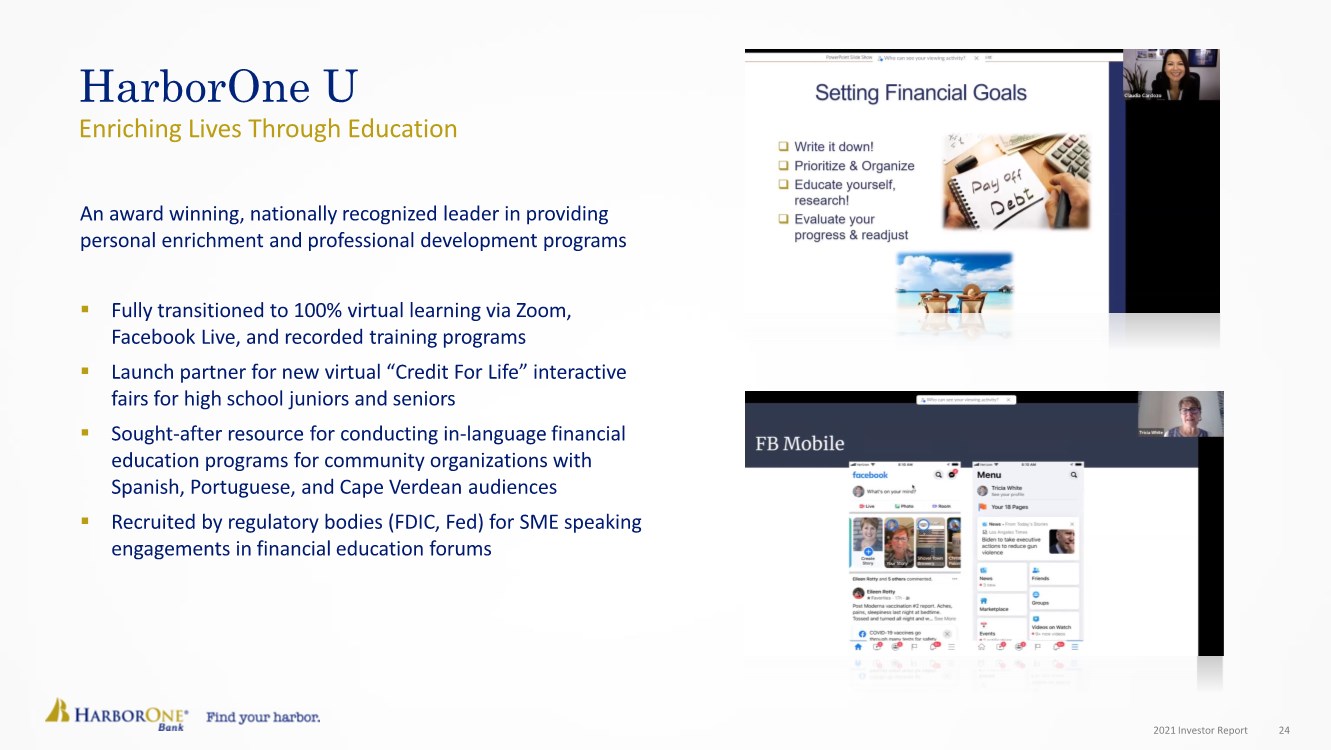
| 2021 Investor Report 24 An award winning, nationally recognized leader in providing personal enrichment and professional development programs .. Fully transitioned to 100% virtual learning via Zoom, Facebook Live, and recorded training programs .. Launch partner for new virtual “Credit For Life” interactive fairs for high school juniors and seniors .. Sought-after resource for conducting in-language financial education programs for community organizations with Spanish, Portuguese, and Cape Verdean audiences .. Recruited by regulatory bodies (FDIC, Fed) for SME speaking engagements in financial education forums HarborOne U Enriching Lives Through Education |
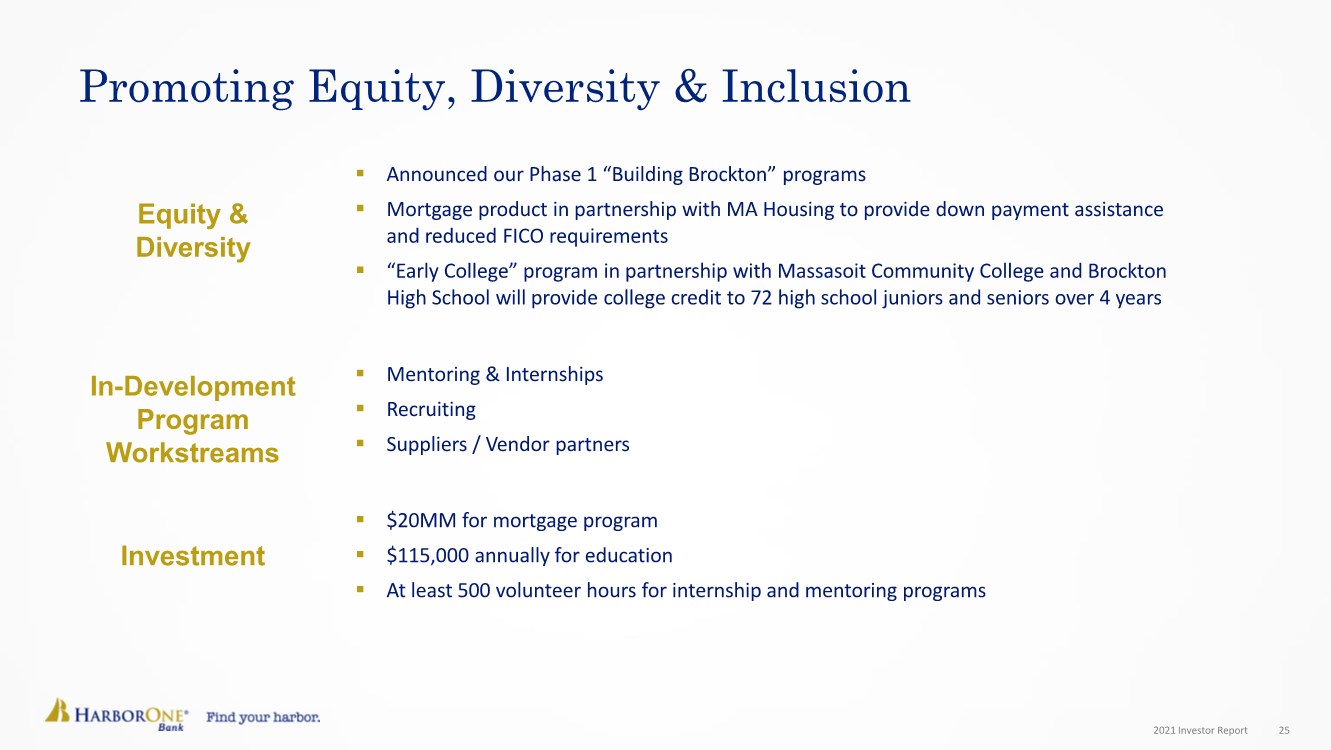
| 2021 Investor Report 25 Promoting Equity, Diversity & Inclusion .. Announced our Phase 1 “Building Brockton” programs .. Mortgage product in partnership with MA Housing to provide down payment assistance and reduced FICO requirements ..“Early College” program in partnership with Massasoit Community College and Brockton High School will provide college credit to 72 high school juniors and seniors over 4 years .. Mentoring & Internships .. Recruiting .. Suppliers / Vendor partners .. $20MM for mortgage program .. $115,000 annually for education .. At least 500 volunteer hours for internship and mentoring programs Equity & Diversity In-Development Program Workstreams Investment |
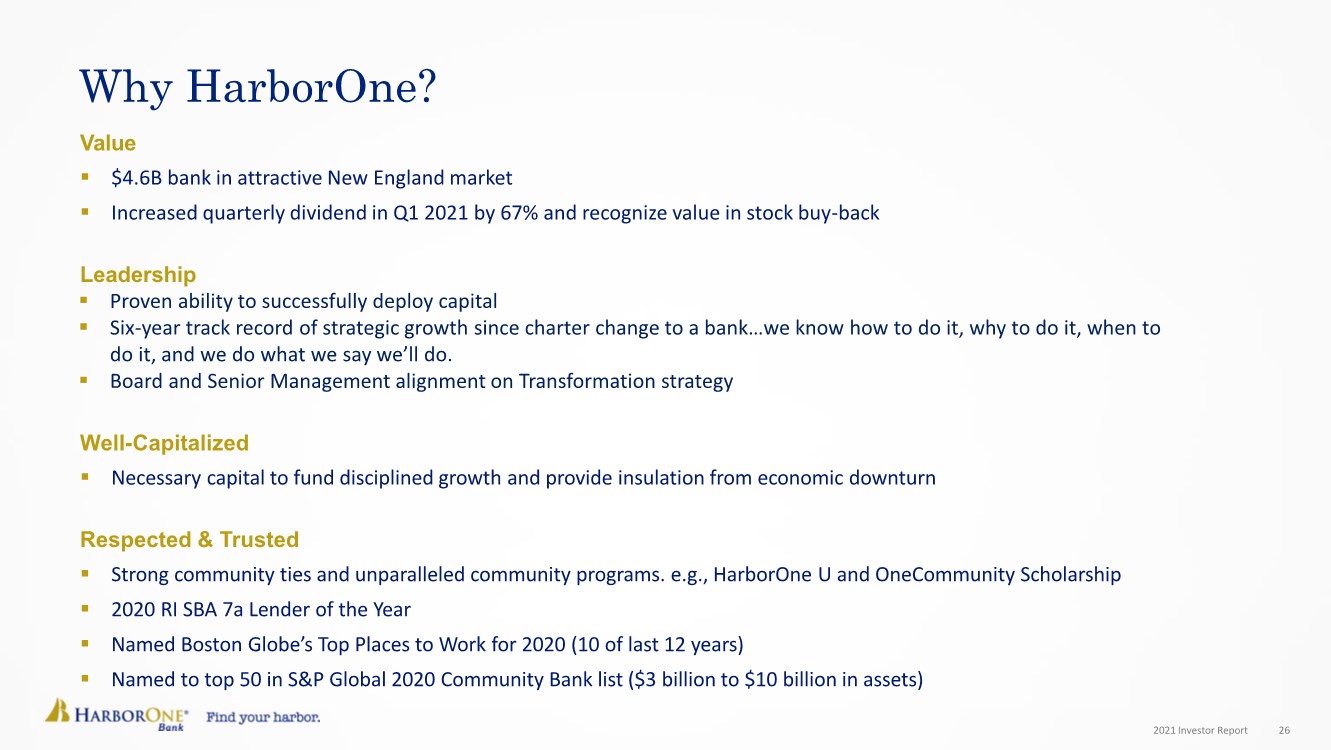
| 2021 Investor Report 26 Why HarborOne? Value .. $4.6B bank in attractive New England market .. Increased quarterly dividend in Q1 2021 by 67% and recognize value in stock buy-back Leadership .. Proven ability to successfully deploy capital .. Six-year track record of strategic growth since charter change to a bank…we know how to do it, why to do it, when to do it, and we do what we say we’ll do. .. Board and Senior Management alignment on Transformation strategy Well-Capitalized .. Necessary capital to fund disciplined growth and provide insulation from economic downturn Respected & Trusted .. Strong community ties and unparalleled community programs. e.g., HarborOne U and OneCommunity Scholarship .. 2020 RI SBA 7a Lender of the Year .. Named Boston Globe’s Top Places to Work for 2020 (10 of last 12 years) .. Named to top 50 in S&P Global 2020 Community Bank list ($3 billion to $10 billion in assets) |
| 2021 Investor Report 27 A Commitment To Doing What’s Right Mission Statement We provide a personalized experience while caring about every customer. We focus on understanding their financial goals for today and dreams for tomorrow. We are unwavering in our commitment to the communities that we serve. Vision Statement To be our customers’ most trusted financial partner. Our Values Integrity. Teamwork. Trust. Respect. Accountability. |

| 2021 Investor Report 28 “Our vision for the future is disciplined, organic growth. Our commitment to those we serve and each other is to be the very best that we can be, every day. We embrace challenge, seek opportunity, and are steadfast in our focus to build an exceptional company.” – Jim Blake,CEO |
Serious News for Serious Traders! Try StreetInsider.com Premium Free!
You May Also Be Interested In
- HarborOne Bancorp, Inc. (HONE) Tops Q1 EPS by 6c
- loanDepot Names Jeff Wilkish Regional Vice President for New England
- Ariento Expands Microsoft Relationship, Adds AOS-G Partnership
Create E-mail Alert Related Categories
SEC FilingsSign up for StreetInsider Free!
Receive full access to all new and archived articles, unlimited portfolio tracking, e-mail alerts, custom newswires and RSS feeds - and more!
