

Form 8-K HYSTER-YALE MATERIALS For: May 24
 Tweet
Tweet Share
Share
UNITED STATES
SECURITIES AND EXCHANGE COMMISSION
WASHINGTON, DC 20549
FORM 8-K
CURRENT REPORT
Pursuant to Section 13 OR 15(d)
of The Securities Exchange Act of 1934
Date of Report (Date of earliest event reported): May 24, 2018
HYSTER-YALE MATERIALS HANDLING, INC.
(Exact name of registrant as specified in its charter)
| DELAWARE | 000-54799 | 31-1637659 | ||
| (State or other jurisdiction of incorporation) |
(Commission File Number) |
(IRS Employer Identification No.) | ||
| 5875 LANDERBROOK DRIVE, SUITE 300, CLEVELAND, OHIO | 44124-4069 | |||
| (Address of principal executive offices) | (Zip code) | |||
(440) 449-9600
(Registrant’s telephone number, including area code)
N/A
(Former name or former address, if changed since last report)
Check the appropriate box below if the Form 8-K filing is intended to simultaneously satisfy the filing obligation of the registrant under any of the following provisions:
| ☐ | Written communications pursuant to Rule 425 under the Securities Act (17 CFR 230.425) |
| ☐ | Soliciting material pursuant to Rule 14a-12 under the Exchange Act (17 CFR 240.14a-12) |
| ☐ | Pre-commencement communications pursuant to Rule 14d-2(b) under the Exchange Act (17 CFR 240.14d-2(b)) |
| ☐ | Pre-commencement communications pursuant to Rule 13e-4(c) under the Exchange Act (17 CFR 240.13e-4(c)) |
Indicate by check mark whether the registrant is an emerging growth company as defined in Rule 405 of the Securities Act of 1933 (§230.405 of this chapter) or Rule 12b-2 of the Securities Exchange Act of 1934 (§240.12b-2 of this chapter).
Emerging growth company ☐
If an emerging growth company, indicate by check mark if the registrant has elected not to use the extended transition period for complying with any new or revised financial accounting standards provided pursuant to Section 13(a) of the Exchange Act. ☐
| Item 2.02 | Results of Operations and Financial Condition. |
On May 24, 2018, Hyster-Yale Materials Handling, Inc. (the “Company”) posted on its website, www.hyster-yale.com, an updated investor presentation for its Investor Day. A copy is attached as Exhibit 99 hereto.
| Item 7.01 | Regulation FD Disclosure. |
The information disclosed above under Item 2.02 with respect to the investor presentation is incorporated herein by reference.
The information contained in this Current Report on Form 8-K, including Exhibit 99, is furnished pursuant to Item 2.02 and Item 7.01 of Form 8-K and shall not be deemed to be “filed” for purposes of Section 18 of the Securities Exchange Act of 1934, as amended, or otherwise subject to the liability of that section, nor shall it be deemed incorporated by reference in any filing under the Securities Act of 1933, as amended, except as shall be expressly stated by specific reference in such filing.
| Item 9.01 | Financial Statements and Exhibits. |
(d) Exhibits.
| Exhibit Number |
Description | |
| 99 | Hyster-Yale Materials Handling, Inc. Investor Presentation, dated May 24, 2018 | |
SIGNATURES
Pursuant to the requirements of the Securities Exchange Act of 1934, the registrant has duly caused this report to be signed on its behalf by the undersigned hereunto duly authorized.
| Date: May 24, 2018 | HYSTER-YALE MATERIALS HANDLING, INC. | |||||
| By: | /s/ Kenneth C. Schilling | |||||
| Name: | Kenneth C. Schilling | |||||
| Title: | Senior Vice President and Chief Financial Officer | |||||
 DAY Thursday, May 24, 2018 INVESTOR Exhibit 99 |
 Introduction Christina Kmetko Investor Relations |
 Solutions that DRIVE Productivity
Safe Harbor Statement & Disclosure
This presentation includes forward-looking comments subject to important
risks and uncertainties. Any and all
statements regarding Hyster-Yale’s expected future financial position,
results of operations, cash flows, business strategy, budgets,
projected costs, capital expenditures, products, competitive positions, growth opportunities, plans, goals and objectives of management for future operations, as well as statements that include words such as
“anticipate,” “if,” “believe,” “plan,”
“estimate,” “expect,” “intend,” “may,” “could,” “should,” “will,” and other similar expressions are forward-looking statements. Such statements are inherently uncertain, and readers must recognize that actual results may differ materially from the expectations of Hyster-Yale’s management. The Company does not
undertake a duty to update such forward-looking statements.
This presentation may also contain financial measures that do not conform with
accounting principles generally accepted in the United States of
America (GAAP). Refer to Hyster-Yale’s reports filed on
Forms 8-K (current), 10-Q (quarterly), and 10-K (annual) for information on factors that could cause actual results to differ materially from information in this presentation and for information
reconciling financial measures to GAAP.
Past performance may not be representative of future results.
This presentation is not an offer to sell or a solicitation of offers to buy
any of Hyster-Yale’s securities. 3
|
 Solutions that DRIVE Productivity
Today’s Presenters
8:30 – 8:35 am Christina Kmetko Investor Relations 8:35 – 8:55 am Alfred Rankin, Jr. Chairman, President and Chief Executive Officer, Hyster-Yale Materials Handling 8:55 – 9:20 am Colin Wilson President and Chief Executive Officer, Hyster-Yale Group 9:20 – 9:50 am Rajiv Prasad Chief Product and Operations Officer 9:50 – 10:15 am Tony Salgado Senior Vice President, JAPIC 10:15 – 10:45 am Break & Questions 10:45 – 11:05 am Roberto Scotti President and Chief Executive Officer of Bolzoni 11:05 – 11:35 am Jon Taylor President and Chief Executive Officer of Nuvera Fuel Cells 11:35 – 12:00 pm Ken Schilling Senior Vice President and Chief Financial Officer 12:00 – 12:10 pm Alfred Rankin, Jr. Chairman, President and Chief Executive Officer, Hyster-Yale Materials Handling 12:10 – 12:30 pm Questions 4 |
 Solutions that DRIVE Productivity
ir@hyster-yale.com
Subject: Investor Day Question
5 E-mail for Questions Submitted by Webcast Audience |
 Hyster-Yale Overview Alfred Rankin, Jr. Chairman, President and
CEO Hyster-Yale
Materials Handling Chairman Hyster-Yale
Group |
 Solutions that DRIVE Productivity
Our Core Lift Truck Business
Our Businesses
7 Our Attachment Business Our Fuel Cell Business |
 Solutions that DRIVE Productivity
Hyster-Yale at a Glance
8 Hyster-Yale Materials Handling, Inc. (NYSE: HY) is a leading globally integrated, full-line lift truck manufacturer
offering a broad array of solutions aimed at meeting the specific materials
handling needs of its customers.
_____________________
(1) EBITDA and ROTCE are non-GAAP measures and should not be considered in isolation or as a substitute for GAAP measures.
See non-GAAP explanations and the related reconciliations to GAAP measures in the Financial Appendix starting on page 151. Key Metrics In millions (except employee data) LTM 3/31/18 Lift Truck Nuvera Bolzoni Revenue $2,794.9 $1.4 $186.8 Net Income (loss) $70.2 $(28.3) $4.3 EBITDA (1) $168.5 $(35.2) $18.0 ROTCE (1) (Net debt basis) 20.8% n/m 3.1% Net Debt at end of period $23.8 n/m $31.5 Approximate # of Employees (globally) 5,800 200 900 LTM 3/31/18 Sales by Segment Separate lift truck, attachment and fuel cell segments Americas 63.0% EMEA 25.4% JAPIC 6.0% Bolzoni 5.5% Nuvera 0.1% |
 Solutions that DRIVE Productivity
ICE Units 48% Electric Units 29% Bolzoni 5% Aftermarket 13% Overview and Sources of Revenue 9 2017 Worldwide Sales by Product _____________________ (1) Represents Hyster-Yale North American Lift Truck unit shipments by industry.
(2) Includes Big Truck sales that represent 12.6% of total sales. A leading global lift truck manufacturer in terms of units sold 2017 Retail Lift Truck Shipments by End Market (1) #4 Globally in 2017 Large installed lift truck base that drives parts sales Over 830,000 units worldwide at 12/31/17 HY sales of ~ 95,000 lift truck units in LTM 3/31/18 ~89,000 units sold -
produced in HY plants
~ 6,000 units sold – produced
by JV or other
third parties
Additional >
6,800 lift truck units sold in Japan in 2017 Direct sales by JV partner (2) National Accounts 17% Independent Dealers 83% 2017 Lift Truck Distribution Channel Mix Food and Beverage 23% Short-term Rental 12% Logistics 14% Manufacturing 13% Consumer and Business Trades 13% Durable Goods 11% Natural Resources & Materials 14% Service, Rental & Other 5% |
 Solutions that DRIVE Productivity
A Positive Profitability Trend
10 $57.5 $72.4 $106.9 2.1% 2.9% 3.8% 0.0% 1.0% 2.0% 3.0% 4.0% 5.0% 6.0% 7.0% $20.0 $45.0 $70.0 $95.0 $120.0 $145.0 2007 2016 LTM Q1 2018 ($ in millions) 7% OPERATING PROFIT MARGIN TARGET 4.1% Gap 3.2% Gap Prior Cycle Market Peak |
 Hyster-Yale’s Global Footprint
11 Ramos Arizpé, Mexico Fabrication Manufacture Sulligent, Alabama Component Manufacture Berea, Kentucky Lift Truck Manufacture Greenville, North Carolina Division Headquarters; Lift Truck Manufacture; Warehouse Development Center Cleveland, Ohio Corporate Headquarters Danville, Illinois Parts Distribution Center Charlotte, North Carolina Experience Center Barueri, Brazil Brazil Marketing and Administration Center Itu, Brazil Lift Truck Manufacture; Parts Distribution Center Craigavon, N. Ireland Lift Truck Manufacture Nijmegen, Netherlands Lift Truck Manufacture; Big Truck Development Center; Parts Distribution Center Masate, Italy Lift Truck Manufacture; European Warehouse Development Center Shanghai, China (JV) Lift Truck Manufacture; Parts Distribution; China Marketing and Administration Center Obu, Japan (JV) Lift Truck Manufacture; Parts Distribution Cavite, Philippines (JV) Fabrication Manufacture Irvine, Scotland European Administration Center Hanoi, Vietnam (JV) Component Manufacture Sydney, Australia Division Headquarters; Parts Distribution Pune, India Engineering, Supply Chain and Marketing Center Frimley, UK Division Headquarters; Engineering Concept Centre Kuala Lumpur, Malaysia Asia Support Office Hefei, China Supply Chain Center Fairview, Oregon Counterbalanced Development Center; Administration Center San Donato, Italy European Offices; Research & Development; Testing Facilities Billerica, Massachusetts Fuel Cell Business Headquarters; Research and Development; Manufacturing and Sales Homewood, Illinois Attachment Manufacture Piacenza, Italy Bolzoni Headquarters; Attachment, Lift Table and Fork Manufacture Järvenpää, Finland Attachment Manufacture Salzgitter, Germany Attachment Manufacture Wuxi, China Attachment Manufacture Hebei, China Fork Manufacture Pointe-Claire, Canada Commercial Subsidiary Prestons/Sydney, Australia Commercial Subsidiary Warrington, UK Commercial Subsidiary Montcarda/Reixac, Spain Commercial Subsidiary Forbach, France Commercial Subsidiary Prato, Italy Attachment Manufacture Lublin, Poland Commercial Subsidiary Moscow, Russia Commercial Subsidiary Korschenbroich, Germany Commercial Subsidiary Gävle, Sweden Commercial Subsidiary Helmond, Netherlands Commercial Subsidiary Lift Truck Business locations Fuel Cell Business (Nuvera) locations Attachment Business (Bolzoni) locations Global Headquarters LEGEND: Tyler, Texas HY Telematics Chessy, France Commercial Offices Neu-Isenburg, Germany Commercial Offices Weeze, Germany Experience & Test Center Solutions that DRIVE Productivity |
 Our Agenda and Presenters Today
12 Alfred Rankin, Jr. Hyster-Yale Overview Colin Wilson Market, Trends and Strategy. Strategy 1 – Leader in Independent Distribution. Strategy 2 – Leader in Delivery of Industry – and Customer – Focused Solutions Rajiv Prasad Strategy 3 – Low Cost of Ownership and Enhanced Productivity for Customers Tony Salgado Strategy 4 – Grow in Emerging Markets Roberto Scotti Strategy 5 – Leader in the Attachment Business Jon Taylor Strategy 6 – Leader in the Fuel Cell Business Ken Schilling Financial Overview Alfred Rankin, Jr. Prospects for Volume Growth and Concluding Remarks Solutions that DRIVE Productivity |
 Solutions that DRIVE Productivity
Long-Term Focused, not Short-Term Oriented
13 Investing for the Future |
 Solutions that DRIVE Productivity
Key Perspectives to Emphasize
14 Global markets expected to be strong for next several years Investments to expand HY’s product and solutions portfolio and geographic breadth and depth Core lift truck programs aim to trigger organic growth through intensified industry focus Nuvera remains a
venture business with
developed technology;
break even by late
2019 |
 Solutions that DRIVE Productivity
Our Long-Term Philosophy
15 Long-term growth Long-term shareholders Shareholder protection Senior management incentivized as long-term shareholders Increase shareholder value |
 Solutions that DRIVE Productivity
Operating profit
With adequate volume growth,
the Lift Truck business can achieve
We are Committed to Our Lift Truck Financial Targets
16 While maintaining a ROTCE |
 Solutions that DRIVE Productivity
The Economy of Scale Logic of Hyster-Yale’s Economic
Engine…. 17
Geographic
and Product
Balance
Worldwide Distribution
Strength to Drive
Market Share
Parts and Service
Volume Large Lift Truck Population in Service Volume Economies of Scale A large lift truck population base drives parts and service volume resulting in enhanced profitability for dealers and
Hyster-Yale Design
Component Commonality Supply Chain Manufacturing Quality Marketing Parts Infrastructure Capital Requirements …is key to driving from current level to 7% operating profit target |
 Solutions that DRIVE Productivity
18 Leader in delivery of industry and customer focused solutions Low cost of ownership and enhanced productivity for customers Leader in independent distribution Grow in emerging markets Leader in fuel cells and their applications Leader in the attachments business Core Strategies for Achieving Targets are in Place |
 Solutions that DRIVE Productivity
Corporate Themes Underlying Our Strategies are…
19 Innovation Quality Culture Pricing and Cost Leadership Services Excellence Develop People Capabilities for the Future |
 Solutions that DRIVE Productivity
by selling and
producing 115,000 HY-factory trucks by selling and producing 115,000 HY-factory trucks In Summary, Over the Next Few Years…. 20 Get to approximately $3.9 billion HY Lift Truck segment revenue irrespective of industry size and maintain ROTCE >20% Get to approximately $3.9 billion HY Lift Truck segment revenue irrespective of industry size and maintain ROTCE >20% to Fill existing assembly line capacity through Significant share growth Which leverages Technology accelerators and business acquisitions Get Bolzoni operating profit margins to
7% Move Nuvera
to break- even by late 2019
then on toward profitability
|
 Market,
Trends & Strategy
Colin Wilson President and Chief Executive Officer
Hyster-Yale Group |
 Solutions that DRIVE Productivity
Global industry remains strong
Significant shifts in customer base
Our strategies address changing landscape
Secular shift in product mix
Rise of enabling technologies
Strong growth in emerging markets
Key HY and Market Perspectives
22 |
 Solutions that DRIVE Productivity
Long-term CAGR (2004 –
2017) = 5.4%
_____________________
Source: ITA. Represents order intake.
Class 1 Electric 17% Class 2 Electric 10% Class 3 Electric 35% Class 4 ICE 2% Class 5 ICE 36% Europe 32% Americas 23% China 28% Japan 6% Asia-Pacific 7% Middle East & Africa 4% Global Industry Remains Strong 872 547 794 975 944 1,010 1,094 1,100 1,182 1,395 1,437 0 300 600 900 1,200 1,500 2008 2009 2010 2011 2012 2013 2014 2015 2016 2017 LTM 2018 (units in thousands) Global Lift Truck Industry Size _____________________ Trend line represents 5.4% long-term CAGR Average Industry Size. Source: WITS. Represents order intake.
North America Retail Lift Truck at Peak Trend
Lift Truck Industry –
Unit Distribution by Class
_____________________
Source: WITS. LTM 3/31/18
Orders Reports.
ICE = Internal Combustion Engine
Total Industry = 1,437k Units
Class 4 ICE 4% Market Size - $ _____________________ Source: Internal Company estimates Market Size - Units Class 5 ICE 55% Class 1 Electric 19% Class 2 Electric 12% Class 3 Electric 10% Estimated Industry Revenue Mix _____________________ Source: WITS. LTM 3/31/18 Orders Reports. Global Lift Truck Industry Breakdown (Units) Trend
Upper Limit Lower
Limit NA 23 - 10,000 20,000 30,000 40,000 50,000 60,000 70,000 80,000 |
 Solutions that DRIVE Productivity
Japan Western Europe Eastern Europe Brazil North America Middle East & Africa Latin America (excluding Brazil) Asia (excluding China & Japan) China ( 3 & 12 months rate of change trend) Global Lift Truck Market Rates of Change _____________________ Source: WITS. Bookings Reports. 24 |
 Solutions that DRIVE Productivity
Significant Shift in Customer Base
25 Products Shift Applications Shift Geographic Shift Industries Shift |
 Solutions that DRIVE Productivity
Growth Rates by Region
Cumulative Annual Growth Rates by Region
Past 3 years
(Units) Past
10 years (Units) USA and Canada 3 Yr: 6.7% 10 Yr: 3.4% Latin America 3 Yr: 0.5% 10 Yr: 1.3% East Europe 3 Yr: 10.0% 10 Yr: 0.4% West Europe 3 Yr: 11.3% 10 Yr: 1.5% China 3 Yr: 11.8% 10 Yr: 12.4% Asia (excl. China) 3 Yr: 6.4% 10 Yr: 7.1% Africa/ Middle East 3 Yr: -1.4%
10 Yr: 1.6%
Pacific 3 Yr: 7.3% 10 Yr: -0.5%
Japan 3 Yr: 2.0% 10 Yr: -0.3%
26 |
 Solutions that DRIVE Productivity
Secular Shift in Product Mix
Today 2017 _____________________ Source: WITS. Orders Reports. ICE = Internal Combustion Engine Utility = HYG Estimates DRIVERS: • Customer shift • Growth of warehousing and logistics • Environmental, health and safety • Evolving technologies • Growth in emerging markets Class 1 Electric 17% C1/2 Utility 1% Class 2 Electric 10% Class 3 Electric 27% C3 Utility 0% Class 4 ICE 3% Class 5 ICE 32% C5 Utility 10% Previous Peak 2007 Class 1 Electric 14% C1/2 Utility 3% Class 2 Electric 10% Class 3 Electric 29% C3 Utility 5% Class 4 ICE 3% Class 5 ICE 18% C5 Utility 18% 27 |
 Solutions that DRIVE Productivity
Trends – Product & Solutions 28 Workforce availability Faster response Lower costs Environment Automation robotics Wireless communications Modular platforms Alternative energy Big Data analytics Electrification |
 Solutions that DRIVE Productivity
Our Strategies Address Changing Landscape and Will Drive Our Economic
Engine Basic Business Areas
Geographic
and Product
Balance
Worldwide
Distribution
Strength to Drive
Market Share
Parts and Service
Volume Large Lift Truck Population in Service Volume Economies of Scale Design Component commonality Supply Chain Manufacturing Quality Marketing Parts Infrastructure Capital requirements Leader in Independent Distribution Grow in Emerging Markets Leader in Delivery of Industry- & Customer-Focused Solutions Leader in Fuel Cells & Their Applications Low Cost of Ownership & Enhanced Productivity for Customers Hyster-Yale’s economic engine is driven by increasing unit volume and economies of scale. Core strategic initiatives are
designed to drive the economic engine by increasing market
share... Leader in the
Attachments
Business
A large lift truck population base drives parts and service volume
resulting in enhanced profitability for Hyster-Yale and dealers
29 |
 Solutions that DRIVE Productivity
Leader in Independent Distribution
30 Enhancing performance Dealer Excellence programs Dealer incentives Term-based contracts 1,000+ global dealer locations 2,000+ application consultants 11,000+ service technicians Independent Exclusive Entrepreneurial Profitable Committed partner Dual-line or single Strengthening the distribution footprint Sales and Service territories (SSTs) Competitor conversions In-territory acquisitions |
 Solutions that DRIVE Productivity
31 Only Major Manufacturer Committed to Exclusive and Independent Distribution
Strong value proposition
attracts successful,
entrepreneurial dealers with
long term outlook
Limits HY capital requirements,
lowers cost structure and
drives high ROTCE
Key dealer criteria: To be
customer obsessed with
intimate local knowledge
HY teams incentivized on
retail sales performance, so
aligned with dealer interests
High ROTCE achieved despite
lower operating profit % than
peer group High dealer ROI encourages increased investment, propelling HY economic engine Dealer supported with: Great products High quality marketing Direct sales or sales support for large accounts Dealer Excellence programs Financial services Systems support A True Partnership Independent Dealer |
 Solutions that DRIVE Productivity
32 Leadership in Delivering Industry and Customer Focused Solutions |
 Solutions that DRIVE Productivity
Forklifts Internal Combustion Engine Lithium-Ion Reach Stackers Big Trucks Very Narrow Aisle Trucks Products for All Needs… 33 Electric Counterbalanced Rider Trucks Electric Narrow Aisle Trucks Electric Hand Trucks Internal Combustion Engine (cushion tire) Internal Combustion Engine (pneumatic tire) 3 wheel Electric 4 wheel Electric Pallet Trucks Stackers Order Pickers Reach Trucks Empty / Laden CLASS 1 CLASS 2 CLASS 3 CLASS 4 CLASS 5 1.0T to 5.5T 1.5T to 6.0T 1.5T to 8.0T 1.0T to 7.0T 1.0T to 52.0T Warehouse Equipment Warehouse Equipment Over 290 different truck models available Electric CB Electric CB Container Handlers Internal Combustion Engine Counterbalance |
 Solutions that DRIVE Productivity
Full Range of Power Options…
Electric Counterbalanced Rider Trucks
Electric Narrow Aisle Trucks
Electric Hand Trucks Internal Combustion Engine (cushion tire) Internal Combustion Engine (pneumatic tire) CLASS 1, CLASS 2 & CLASS 3 Lead-Acid Battery Fuel Cell Engine LPG & Bi-fuel Diesel Tier 3 / Stage III LPG & CNG Diesel Tier 4 / Stage IV Lithium- Ion Battery 34 CLASS 4 & CLASS 5 |
 Solutions that DRIVE Productivity
…with a Broad Range of Attachments…
35 Clamps Multipallets Rotators Sideshifters Fork Positioners Push Pulls Lifting Tables Forks |
 Solutions that DRIVE Productivity
Solutions for all industries
36 LOGISTICS FOOD & BEVERAGE MANUFACTURING NATURAL RESOURCES & MATERIALS DURABLE GOODS SHORT- TERM RENTALS CONSUMER & BUSINESS TRADES Warehouse
Counterbalanced Source: 2017 ITA Market Size and Mix by Vertical and
Segment |
 Solutions that DRIVE Productivity
Realigned, Industry-Focused Sales and Marketing
• Market opportunity defined by industry • Dedicated team focus to drive results • Key industry drivers defined • Competitive requirements defined • Individual customer requirements identified • Translated into value-added solutions • Industry-based teams • Experts in industry verticals 37 |
 Solutions that DRIVE Productivity
Sales Deployment
38 Top Buyers ~ 200 Accounts Top Buyers ~ 200 Accounts Industry Leaders ~1600 Accounts Industry Leaders ~1600 Accounts 25% of Market 35% of Market Rest of the Market High Value National Accounts Team 40% of Market Dealer Sales Team Market Share HYG Sales Approach Dealer Sales Team |
 Solutions that DRIVE Productivity
Hyster-Yale National Accounts Program
~200 designated accounts with annual purchases of ~60,000 units and high market share Over 2,400
Customer and Dealer Visits per year 30 account managers,
5 segment focused directors, deployed throughout the U.S. Committed to customer- obsessed industry-specific, strategic partnerships 39 |
 Solutions that DRIVE Productivity
40 Dealer Support Team Dealers also manage ~ 300 “Industry Leader” Accounts Dealer Area Business Manager Field Based Specialized Sales Support Inside Sales Support Financial Services Manager Regional Aftermarket Manager Field Service Engineer |
 Solutions that DRIVE Productivity
Sales Deployment
41 Top Buyers ~ 200 Accounts Top Buyers ~ 200 Accounts Industry Leaders ~1600 Accounts Industry Leaders ~1600 Accounts 25% of Market 35% of Market Rest of the Market High Value National Accounts Team 40% of Market New Industry Sales Team Dealer Sales Team Market Share HYG Sales Approach |
 Solutions that DRIVE Productivity
New Industry Sales Team
Enhance the knowledge and
skills of dealer sales personnel
20 account managers, 4 segment focused directors, deployed throughout the U.S. Committed to working with dealers to identify and serve needs of large “Industry Leader” accounts 42 Develop and execute “Account Development Plans”. Create “why change, why now, why us” messaging |
 Solutions that DRIVE Productivity
Industry Accounts Breakdown
43 Goal is to improve position with all target “Industry Leader” accounts |
 Delivering Low Cost of
Ownership & Enhanced
Productivity for Customers
Rajiv Prasad Chief
Product and Operations Officer
Hyster-Yale
Group |
 Solutions that DRIVE Productivity
Low Cost of Ownership Drivers
45 Factors Impacting Low Cost of Ownership Factors Impacting Low Cost of Ownership *Typical truck cost/hour for 5,000lb North American applications Productivity Ergonomics/ fatigue Auto functions Automated trucks Operator Energy usage Alternative powertrains ICE to ER Mode control Fuel Cost/hour Fleet Management Extended Warranty Telematics Service & Repair Fleet optimization Price management Cost control Residuals Lease Operator 69% Fuel 11% Service & Repair 11% Lease 9% Typical Truck Cost/Hour * |
 The Right Product Solution Drives Lowest Cost of Ownership 46 Solutions that DRIVE Productivity |
 Solutions that DRIVE Productivity
HY Product / Solutions Value Proposition
47 Customer Value Productivity Customer Needs Lowest Cost of Ownership Capital & Labor Input vs Work Output Cost of Equipment, Labor, Energy, Maintenance, etc. |
 Solutions that DRIVE Productivity
Hyster-Yale New Products
48 New Euro Stacker Range New RS45 Reachstacker New End Rider |
 Solutions that DRIVE Productivity
Test conducted by USAC Properties, Inc
Segmentation -
Right Truck at the Right Price Drives Growth
49 Since the launch of the XT/MX, -10% 0% 10% 20% 30% 40% 2015 2016 2017 Hyster and Yale Class V Truck Bookings have outpaced the Market ITA HYG |
 Solutions that DRIVE Productivity
Automation Technologies and Trends
50 Dual Mode Flexibility Automated & Operator Driven Technologies Sensors Electronics and Software Model Based Automation Controllers Traffic Manager Communications WiFi Ethernet Cellular V2V Hyster Movematic Pallet Carrier Automated, Mid 1980s LIDAR RADAR Camera Ultrasonic |
 HY Automation with Dual Mode Operation
51 Balyo Collaboration • Strategic Ownership Interest • Seat on the Board Automated Reach Truck • Collaboration with partner • Consumer product customer Internally Developed Automation (IDA) • Sixteen engineers • Dedicated center • Modular approach Solutions that DRIVE Productivity |
 Solutions that DRIVE Productivity
Integrated Lithium-ion Truck
ICE like Performance
Lithium-ion Solutions
52 Battery Box Replacement Trucks Lithium-ion Ready • High voltage powertrain • Excellent productivity • 6-9T capacity • Fast charge • Food and beverage • Paper industry • Automotive • Cold storage |
 Solutions that DRIVE Productivity
Fuel Cell Solution
53 N. America electric trucks sold per year 175,000+
25-50%
Estimated up to
can benefit from fuel
cell solutions
Global 850,000+
electric trucks sold
per year 6,087 8,255 9,053 11,715 16,518 21,700 - 5,000 10,000 15,000 20,000 25,000 2012 2013 2014 2015 2016 2017 DOE reported North America (1) Population of Fuel Cell Powered Lift Trucks in North America Growth Opportunities Trend in population of fuel cell powered lift trucks in North America expected to continue (1) Source: DOE Hydrogen and Fuel Cells Program Record. Record #17003. May 25, 2017
(2) 2016 is the most recent DOE data available at time of publication. 2017 totals are
company estimate.
(2) Leads to Lower Cost of Ownership Constant power and refuel as quick as 3 minutes No batteries or battery charging rooms Environmentally clean Benefits |
 Solutions that DRIVE Productivity
Hydrogen Fuel Cells: An Increasingly Accepted Source of Motive Power
54
Outcome: Growing customer base 9 sites live operating > 130
units Backlog of
over 300 units Strong sales funnel Opportunities of over 800
units Launch to dealer and
internal sales channel
Strong market demand
Recent implementation
success Continuous Product Development Drive market participation Industry Units Aerospace 20 Consumer Goods 50 Electronics 100 Big Box Retailer 243 Food Distribution 30 Automotive 225 Current Sales Activity |
 Solutions that DRIVE Productivity
Integrated Fuel Cell to Enable Big Truck Electrification
55 Electric drives for traction and hydraulics Fuel cell Battery pack HV cable harness NCEA Controls architecture Hydrogen storage Cooling system |
 Low Cost of Ownership Solutions and Successes – Big Trucks 56 Customer – Port Operation: • High productivity • Operating cost • KPIs at different sites • Hyster - Best solution • 2 Year/4,000 hrs. power train warranty • Cost of Operation (TCO) KPIs • Online TCO Calculator • Telemetry Standard Big Truck Actions: TCO KPIs Solutions that DRIVE Productivity |
 Solutions that DRIVE Productivity
Telemetry Customer Benefits
57 • $9K/month on impact abuse • Telemetry added to fleet • First impact after installation used to enforce accountability • Immediate reduction in impacts Telemetry Unit Annual Sales Impact related cost reduction of 90% Telemetry system provides vast amount of operational and usage data. Identified right amount and type of equipment, leading to reduced downtime and improved productivity Cost Reduction of Fleet Optimization of Fleet Within the first 6 months ** Company forecast - 2,000 4,000 6,000 8,000 10,000 12,000 14,000 16,000 18,000 20,000 2013 2014 2015 2016 2017 2018 ** Data used for fleet optimization & maintenance |
 Development of a Smart, Connected Ecosystem
58 Smart Connected Equipment Integrated Service and Automation Lifecycle Analytics and Insights Clean, consolidated customer interfaces Integrated Solutions Hydrogen fuel cells Telematics solutions Attachments Automation Customer Portal View Dashboards Telematics driven Actionable insights Fleet management Parts order fulfillment Service Integration & Automation Service event management Fleet management Mobile diagnostics Lifecycle Analytics and Insights Data analytics Product development Predictive maintenance (PdM) Solutions that DRIVE Productivity |
 Industry Focus ER Freight Special Truck Engineering (STE) Methodology and Process 59 Meet unique customer needs Design & Verification Production Required Adjustments Planning & Requirements STE Process Objectives Solutions that DRIVE Productivity |
 Productivity –
Right Equipment for Application
60 Paper* Paper bale handling Dusty environment - 24/5 Congested operations Loads in and out of trailers Hot and dusty Varied sized and shaped loads Application Solution Outcome since 2014 Swing out mounting Access to needed tools Improve productivity Special Attachment 25% increased throughput Up to 61% less cost Cooling package Reversible fan Extends cleaning intervals Triple digit unit growth since 2014 Over 70% unit growth
since 2014 Significant Share Growth Trucking* Steel* *EMEA market applications Solutions that DRIVE Productivity |
 Solutions that DRIVE Productivity
Our Investment in R&D
Lift Truck R&D Investment
$71 $70 $72 $78 $83 2014 2015 2016 2017 Est. 2018 2.6% 2.7% 2.9% 2.9% 2.7% % of Revenue $ in millions • Product Development Target - 2.5% of Sales • Actions to Achieve Target Increase revenue Modular architecture India and China development centers Process automation Co-located suppliers 61 |
 Solutions that DRIVE Productivity
Cost of Ownership Summary
62 Industry Focus Customer Centric Low Cost of Ownership Application Fit – Modular Operational Integration Global Footprint |
 Grow in
Emerging
Markets Tony Salgado Senior Vice President, JAPIC, Hyster-Yale Group |
 64 Global Profile of Lift Truck Mix by Market Opportunity to Grow in Emerging Markets and Utility to Standard Product Segments Solutions that DRIVE Productivity |
 Solutions that DRIVE Productivity
Emerging versus
Mature Lift Truck Market Size (Last 12 months) 65 NORTH AMERICA 278,230 WESTERN EUROPE 381,960 PACIFIC 24,120 JAPAN 86,890 MIDDLE EAST & AFRICA 33,650 INDIAN SUBCONTINENT 14,360 ASIA 66,025 CHINA 399,050 EASTERN EUROPE 81,650 LATIN AMERICA 19,590 BRAZIL 15,950 MATURE MARKETS 790,900 EMERGING MARKETS 630,275 M A R K E T S I Z E S U B – T O T A L S MEXICO 11,600 SOUTH AFRICA 8,100 Indicative Map Only: Company’s estimate of market type |
 Solutions that DRIVE Productivity
Lift Truck Market Growth Potential by Region
66 Emerging markets still have very low lift truck usage… _____________________ Source: WITS. 2017 Orders Reports. Population – www.worldometers.info/world-populations by country Lift Truck Market (per million population) Population (in millions) India SC Asia China Pacific Japan MEA Latin America Eastern Europe North America Western Europe Variance 2014 to 2017 1,525 1,868 Brazil 9 69 273 560 676 28 76 268 693 840 78 0 0 209 830 1,410 41 127 292 361 450 436 Emerging Markets Mature Markets |
 Competition is Re-Positioning
67 Top Global Manufacturers are increasing product depth into utility and standard product line-up Top Chinese Manufacturers are increasing quality and specification of Utility and Standard product line-up Premium Lift Truck Segment Sub-Utility Important to defend and drive profitable share gain in standard and utility segments Standard Utility Solutions that DRIVE Productivity |
 Solutions that DRIVE Productivity
Benefits of Product Segment Positioning
68 Distinguish the value of standard and premium segments Increase global market participation Support exclusive & independent dealer network Leverage modular and scalable design approach Deliver right tool for right application Product Segment Positioning |
 Solutions that DRIVE Productivity
Enhance HY Position in Emerging Markets
69 Opportunity to Expand in Emerging Markets _____________________ Source: Company: LTM 12/31/17 Units Shipped Note: Units sold direct by SN JV are not included Product Breadth is Mature, Opportunity to Enhance Depth Opportunity to Focus Development on Emerging Markets Expand Production Capabilities to Serve Emerging Markets Americas EMEA JAPIC 56% 82% 44% 18% Global HY 0% 20% 40% 60% 80% 100% Emerging Developed |
 Solutions that DRIVE Productivity
Building a Platform to Grow in Emerging Markets
70 • Investing in 75% controlling interest in Zhejiang Maximal Forklift Co., Ltd.
• Establishing China-based Emerging Market Development Center Actions: Impact: • Expand low-cost, global manufacturing capabilities • Enhance access to competitive component sourcing • Strengthen utility and standard product portfolio • Enhance presence in China market and global utility and standard segments
• Increase core brand share, and global group unit volume • Deliver accretive earnings by 2020 and contribute to Company’s achievement of
7% operating profit margin*
*Estimate does not include the impact of the $10M incentive payout or any
potential purchase price accounting adjustments recorded after acquisition |
 About Zhejiang Maximal Forklift Co., Ltd.
71 Source: Audited 2017 financials, Chinese statutory report for all except bookings growth, which is unaudited • Established in 2006 in Fuyang District • Founder & CEO: Mr. JinHong Lu • 600 employees and 1.4 million ft 2 office and factory • Original Equipment Manufacturer with design, manufacture, sales and service operations
• Full production capabilities including fabrication, weld, paint & assembly
• Domestic and export sales, with globally respected product, brand and distribution
2017 Performance
Volume: 6,765 units Revenue: $77M Op Profit: 4.2% 13% Growth in Revenue 25% Growth in Bookings Solutions that DRIVE Productivity |
 Solutions that DRIVE Productivity
Maximal Overview -
Video 72 |
 Solutions that DRIVE Productivity
Why Maximal 73 Best Value Best Fit Best Potential • Management • Culture • Local market experience • Production and design capability • Facilities and location • Brand and distribution network • Utility Counterbalance forklifts • Big Trucks • Rough Terrain forklifts • Side Loader forklift Organization Product People |
 Solutions that DRIVE Productivity
Hyster-Yale Maximal Forklift [Zhejiang] Co., Ltd.
74 Investment of $90 Million
for 75% controlling interest
• 25% ownership to remain with seller and new company CEO • HY will pay up to an additional $10 Million after 3 years as incentive to the seller Closing planned Q2 2018 Agreement signed December 6, 2017 Anticipate to be accretive to earnings by 2020 |
 Solutions that DRIVE Productivity
Near Term Synergy Plan - Operations 75 • Consolidate existing China operations • Insource and expand manufacturing • Leverage low cost sourcing • Introduce HY expertise • Implement HY best practices Rationalize Operations Leverage Cost Advantage Improve Operations Enhance Development Expand Products Optimize Distribution |
 Solutions that DRIVE Productivity
Rationalize
Operations Leverage Cost Advantage Improve Operations Expand Products Optimize Distribution Leverage local design expertise and regional supply base to deliver right specification at right price Product Development for: • Emerging markets • Global utility and standard product segments Emerging Market Development Center Fuyang, China Near Term Synergy Plan - Development Enhance Development 76 |
 Solutions that DRIVE Productivity
Near Term Synergy Plan - Distribution 77 • Maximize coverage • Maintain two channels to target diverse markets • Optimize product line-up • Apply Hyster-Yale expertise to enhance dealer performance HY Independent Global Distribution Maximal Global Distribution Rationalize Operations Leverage Cost Advantage Improve Operations Enhance Development Expand Products Optimize Distribution |
 Solutions that DRIVE Productivity
Key Investments – First 5 Years 78 Finance Cybersecurity & Licences Acquisition Due Diligence Business Processes Audit & SOX Factory Capacity ERP System Automation & Quality Engineering Core Compliance Engineering Compliance Investment Capability Investment People Investment Sales |
 Solutions that DRIVE Productivity
Projected Investment Return Summary
79 Upside Case Investment Case 2016 2017 2018 2019 2020 2021 2022 Impact on Global Hyster-Yale Earnings Investment case to deliver accretive earnings with upside potential Upside Opportunities • Expand export and aftermarket opportunities Investment Case Synergy Considerations • Rationalize China production and purchasing • Include integration investments *Graphic does not include impact of the $10M incentive payout or any potential purchase price accounting adjustments recorded after
acquisition |
 Solutions that DRIVE Productivity
Summary 80 Drive global revenue and absorption through growth in unit and aftermarket sales China investment is fundamental to addressing demand in emerging markets and shifts in product segment mix Drive lower cost production and sourcing Grow share in the global emerging markets and standard and utility segments Critical component to long-term global growth and acquire a strategic platform to: Deliver a broader range of competitive standard and utility products Support China-based Emerging Market Development Center |
 The
Attachment Business
Roberto Scotti President and Chief Executive Officer of Bolzoni 81 |
 Solutions that DRIVE Productivity
Bolzoni Key Attachment Markets
82 A complete range of attachments to serve material handling industries in the area of forest products, food and beverage, white goods, logistics, chemistry, automotive and many others… |
 Solutions that DRIVE Productivity
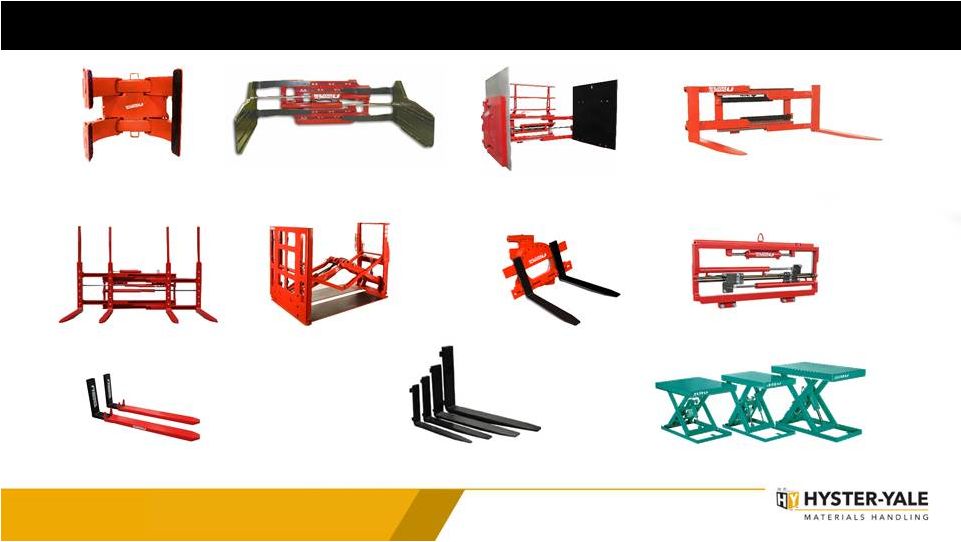
Bolzoni Products
83 Paper Roll Clamps Intelligent and standard Pulp & Waste Paper Bale Clamps Carton Clamps Intelligent and standard Multi Pallet Handlers Parallel Clamps Push Pulls Sideshifters and Fork positioners Forks Lifting Tables Specialized Products Rotators |
 Solutions that DRIVE Productivity
LTM Q1 2018 – Bolzoni Revenue by Product Line 84 Other Revenues 4% Forks 15% Lift Table 5% Attachments 76% $ 186.8 M Sales outside of Italy = 86.5% of 2017 Global Sales |
 Solutions that DRIVE Productivity
Bolzoni in the World
85 Manufacturing plants in Italy, Germany, Finland, United States and China
A wide network of direct branches and independent dealers covering all
continents to satisfy all market requirements
|
 Solutions that DRIVE Productivity
86 1945 1950s 1960-1975 1986 1989 1991 Bolzoni foundation (focus on agricultural machinery production) Attachments market entrance (brick fork & fork lift truck attachments) Foreign market entrance (first branch opened in France) Merging with Teko (lifting tables and hand pallet trucks) USA market entrance (first manufacturing plant opened in Chicago) Acquisition of Elman (Spanish leader for lift truck attachments) 2001 2002 2010-2013 2006 2014 2016 Acquisition of Auramo Group (leader in forest products handling attachments) Acquisition of Brudi (USA leader in palletless handling attachments) China (fork production plant in Hebei and attachment production plant in Wuxi) Acquisition of Meyer Group (German leader in lift truck attachments). Bolzoni SpA listing on Italian Stock Exchange Auramo OY new plant (forest products handling attachments production plant in Finland) Bolzoni Group acquired by Hyster-Yale Bolzoni History |
 Solutions that DRIVE Productivity
Net Sales Trend CAGR: Years 2000 – 2017 87 € 43.2 € 76.2 € 78.9 € 75.1 € 84.0 € 94.7 € 107.1 € 145.6 € 141.1 € 76.9 € 93.5 € 115.8 € 119.1 € 121.2 € 119.9 € 138.3 € 137.6 € 157.7 2000 2001 2002 2003 2004 2005 2006 2007 2008 2009 2010 2011 2012 2013 2014 2015 2016 2017 2000 – 2008 +13% 2009 – 2017 +9% (1) (2) (3) (1) Includes (for 10 months) acquisition of Finnish company Auramo OY, leader in the market of paper bale clamps
(2) Includes acquisition of Brudi
(3) Sale of mast business |
 Solutions that DRIVE Productivity
88 The Concept Strategy: Targeting Additional Customers, by Industry Cultivate customers in certain end-user industry segments to achieve preferred supplier status Priority to EMEA Region and extension to America and JAPIC in the second part of the year |
 Solutions that DRIVE Productivity
BEVERAGE WHITE GOODS 3PLs The Target Accounts Dedicated plan for each country Detailed reporting for each target account’s facility PAPER AUTOMOTIVE Strategy: Targeting Additional Customers, by Industry 89 |
 Solutions that DRIVE Productivity
90 …and many further products to meet the customer demand Strategy: New Product and Market Concept Designed in Europe Produced in China STANDARD PRODUCT LINE TO MEET GLOBAL MARKET DEMAND Develop Silver Line range High quality Very competitive price Often sold against competitors’ refurbished product (buy new vs. buy used) |
 Solutions that DRIVE Productivity
91 SWING FRAME PAPER ROLL CLAMP 2-1 PALLET HANDLER FORK POSITIONER CARTON CLAMP WITH FORCE BALANCE PAD/Patent pending Strategy: Listen to Voice of Customer NEW PRODUCTS FOR NEW APPLICATIONS NEW PRODUCTS AT THE RIGHT TIME CONTINUOUS INNOVATION |
 Solutions that DRIVE Productivity
92 Strategy: Align to Major Trends DEVELOP KNOW-HOW FOR AGV SYSTEMS Support to AGV manufacturers for product customization Learn from advanced experience |
 Solutions that DRIVE Productivity
93 USA – Homewood – IL FINLAND – Järvenpää GERMANY – Salzgitter ITALY – Piacenza CHINA – Wuxi CHINA – Hebei Strategy: Leveraging Focused Factories |
 Solutions that DRIVE Productivity
BOLZONI-AURAMO
(HEBEI) – CHINA Increased capacity to 400,000 forks per year Ability to meet special design requests Three automated production lines 94 Strategy: Expand Fork Business 2012 2013 2014 2015 2016 2017 SALES 2017 vs 2016: +82% |
 Solutions that DRIVE Productivity
95 BOLZONI-AURAMO (WUXI) – CHINA Increase product localization to fit Asian market Manufacture parts and components for global factories Lower global cost Lower cost Quicker delivery time Strategy: Expand China Localization |
 Solutions that DRIVE Productivity
BOLZONI AURAMO –
USA Strategy: Expand Rapidly in US market Enhance people capabilities Produce a complete range of attachments Enhance local design capability Expand production capacity Increase spare parts management Grow the customer base Create specific marketing plans by customer segment 96 |
 Solutions that DRIVE Productivity
AURAMO OY –
FINLAND Dedicated plant for paper roll clamps Enhance sales coverage Strengthen presence in US and China Leverage program targeting new customers in the paper industry Continuous new product innovation 97 Strategy: Enhance Sales of High-Value Paper Roll Clamps |
 Solutions that DRIVE Productivity
98 Strategy: Expand Capacity and Enhance Production Efficiency in Germany MEYER GMBH – GERMANY Facility located in Europe’s largest forklift truck market Dedicated plant for multiple-pallet handlers Increase market share in Europe and worldwide Leverage program targeting new customers in the beverage and automotive industries |
 Solutions that DRIVE Productivity
Strategy: Synergies with HY
99 Develop Bolzoni as global supplier of attachments & forks to HY globally Accelerate growth of attachment business in North America Leverage Bolzoni manufacturing capacity Achieve procurement and logistics cost savings Increase sales of HY forklift & Bolzoni attachments by creating high-quality product package GROWTH Promote through HY distribution system |
 Solutions that DRIVE Productivity
100 Lift Truck Manufacturers – OEM Lift Truck & Material Handling Dealers 2017 CUSTOMER MIX Strategy: Enhance Strong OEM Relationships Managed as separate business segment
Separation to maintain OEM information
integrity 43% 57% EUROPE 58% AMERICAS 36% ASIA 6% OEM SALES BY REGION OEM 1 29.4% OEM 2 26.7% OEM 3 21.5% OEM 4 16.0% OEM 5 3.6% TOP 5 OEM CUSTOMERS |
 Solutions that DRIVE Productivity
Why Choose Bolzoni?
101 INTEGRATION SERVICES STRONG TEAM BROAD PRODUCT LINE RIGHT PRODUCT FOR APPLICATION GLOBAL MANUFACTURING LOCATIONS OPERATIONAL EXCELLENCE INDUSTRY FOCUS AFTERMARKET SERVICES CUSTOMERS STRONG OEM RELATIONSHIPS |
 The Fuel
Cell Business
Jon Taylor President and Chief Executive Officer of Nuvera Fuel Cells 102 |
 Solutions that DRIVE Productivity
Importance of Fuel Cell for Mobility Growing
103 Source: KPMG International https://gaes.kpmg.de/brain.html#automotive-key-trends Global Automotive Executive Trends until 2025 Automotive key trends “Fuel cell electric vehicles have replaced battery electric vehicles as this year’s #1 key trend until 2025” 2017 2014 Fuel cell electric mobility #1 #7 Connectivity & digitalization #2 #9 Battery electric mobility #3 #10 Hybrid electric mobility #4 #2* Market growth in emerging marketing #5 #1 Creating value out of big data #6 #7* Mobility-as-a-service #7 #6 Autonomous & self-driving vehicles #8 #11 Platform strategies & standardization modules #9 #2 Downsizing of internal combustion engines #10 #3 *2016 rankings |
 Solutions that DRIVE Productivity
Trends in Alternative Energy
104 KPMG surveyed Automotive executives to determine their opinion on the share between ICE, Hybrids, BEV & FCEV in 2030 and 2040. FCEV BEV Hybrids ICE 101.58M 122.66M 140.48M 90% 30% 24% 24% 21% 25% 24% 26% 25% 2020 2030 2040 Source: KPMG International’s Global Automotive Executive Survey 2018
https://gaes.kpmg.de/brain.html#automotive-key-trends
Note: Shares for 2020 are based on global production forecast for 2020. 2040
volumes are estimated on GAGR 2027-2032. Both are as calculated by KPMG. |
 Solutions that DRIVE Productivity
Trends in Alternative Energy
105 Source: Hydrogen Council: http://hydrogencouncil.com/wp-content/uploads/2017/11/Hydrogen-Scaling-up_Hydrogen-Council_2017.compressed.pdf
Fuel Cell vehicles offer the range and refueling capability required for mass consumer vehicles |
 Solutions that DRIVE Productivity
Trends in Alternative Energy
106 Today 2020 2025 2035 2040 2045 Source: Hydrogen Council:
http://hydrogencouncil.com/wp-content/uploads/2017/11/Hydrogen-Scaling-up_Hydrogen-Council_2017.compressed.pdf
|
 Solutions that DRIVE Productivity
Business Focus
107 High technology fuel cell company Integrator of fuel cell engines into lift trucks Design of Fuel Cell Stacks and Engines Reliability Growth Engineering Manufacture of Fuel Cell Stacks and Engines Sales & Marketing to OEM’s and Partners Development of Hydrogen Compression Technology & Products Design of BBR and Integrated Solutions Reliability Growth Engineering Manufacture of BBR and Integrated Solutions Sales & Marketing Product Support in Field |
 Solutions that DRIVE Productivity
Vision and Mission
108 Achieve break-even operating profit by late 2019 Produce ~ 1,000 Nuvera® engines quarterly at target margins AND leverage our technology and expertise through partnerships conversion of existing battery users Our vision is to establish Nuvera as the preferred provider of heavy-duty fuel cell engines to zero-emissions mobility customers Limitless Mobility NUVERA MISSION: …through share gain of existing fuel cell users and conversion of existing IC engine users |
 Solutions that DRIVE Productivity
Nuvera People: Fuel Cells are our Passion
109 170 Total Employees Majority of employees cover technical disciplines Strengthening operations team Supply Chain Quality Manufacturing Sales & Marketing Aftermarket support Customer solutions Strengthening Intellectual Property Portfolio • 205 International patents granted • 235 International patents pending • 67 US patents granted • 37 US patents pending • 8 US Provisional patent applications pending Strengthening Intellectual Property Portfolio • 205 International patents granted • 235 International patents pending • 67 US patents granted • 37 US patents pending • 8 US Provisional patent applications pending Focus: Provide the best fuel cell solution to our customers. • Technology • Design • Supply Chain Focus: Provide the best fuel cell solution to our customers. • Technology • Design • Supply Chain • Cost • Quality • Aftermarket solutions |
 Solutions that DRIVE Productivity
Nuvera Fuel Cell Stack Heritage
110 First Stack (1993) Andromeda TM (2003 – 2011) • Metallic construction since 1993 • Patented open flow field architecture • High power density XDS-900 (2004 - 2011) (2010 & ongoing) (2019+) Gen2 |
 Lift Truck Power System Optimization: Cost and Robustness
111 Target Product Cost and Robustness • Approximately 40% reduction in costs by 2019 • Double MTBF (mean time between failure) Driven by • Strengthening supply chain • Internal process improvements • Product design and architecture Solutions that DRIVE Productivity 2017 1H-18 2H-18 1H-19 2H-19 Cost MTBF |
 Solutions that DRIVE Productivity
Organization and people
High power, efficient and durable
Simplification & robust operation
Right product/right cost
Nuvera Fuel Cell Engine Design Principles 112 Focus on core competencies Leverage technology attributes Optimize engine design Industry & application focus |
 Solutions that DRIVE Productivity
Strategic Focus
113 BBR and Integrated Lift Truck Solution Large OEM’s Integrators |
 Solutions that DRIVE Productivity
114 Business Development Approach Nuvera L3 Fuel Cell Hybrid Vehicle L2 Fuel Cell Engine L1 Fuel Cell Module L0 Fuel Cell Stack L3 Fuel Cell Hybrid Vehicle L2 Fuel Cell Engine L1 Fuel Cell Module L0 Fuel Cell Stack Integrators OEM’s • Speed to Market • Close to customer • Quality Control • Control of IP • Long term partnership • Custom design and development • IP Transfer/ sharing • Economies of scale |
 IC Engine Transmission Air Filter Traditional IC Engine Vehicle Electric / Fuel Cell FC Engine DC/DC Fuel Cell Engine Solutions Refueling 3-10 minutes 115 Engine Clean Fuel Clean Air Power Nuvera Engine System Integration Solutions that DRIVE Productivity Air Filter |
 Solutions that DRIVE Productivity
Automotive Lift Trucks Industrial Fleets Fuel Cell Deployment Strategy Potential Annual Volume and Nuvera Fit* Stack Optimization Engine Integration Power Modules Experience Knowledge Technology Low Medium High 116 10,000 – 50,000 3,000-10,000 Degree of Fit *Company Estimates Nuvera’s Fit 100,000+ |
 Solutions that DRIVE Productivity
117 Fuel Cell Commercialization Pathway 100,000+ 10,000 – 50,000 3,000-10,000 Strong supply chain Robust design Economies of scale Experience Knowledge Technology |
 Solutions that DRIVE Productivity
Expansion of Product Line
118 Demonstration in critical port application in California Performance benefits • Metal plates – higher durability • High power density • Open flow field – improved fuel efficiency Modular, easily integrated solution 2019 Heavy duty engine Leverage experience from HY supply Scale up manufacturing capability Planned localization for China market (post-2019) Shown: Hyster 1150HD CH ICE configuration |
 Solutions that DRIVE Productivity
Future Non-Lift Truck Growth Opportunities
119 Heavy duty applications Port equipment Delivery vehicles Buses China market entry Market research Local industry engagement Engaging System Integrator(s) OEM product evaluation Low cost sourcing |
 Solutions that DRIVE Productivity
China Market Research and Engagement
120 Engaged China-based market research and segmentation study • Significant government incentives driving market interest • Several companies are early entrants, but market open to other partners • Nuvera technology is a strong fit at a competitive cost Engaging with the Chinese Hydrogen Fuel Cell Industry and Businesses China Central Government Roadmap 2020 2025 2030 Vehicles Deployed 5,000 Public Transport 50,000 Public Transport Private Application 1 million Total Units Hydrogen Fueling Stations 100 300 1,000 • Attended the Second China International Hydrogen & Fuel Cell 2017 Conference and Exhibition
• Attended the 8 China International New Energy Vehicle 2018 Forum th |
 Solutions that DRIVE Productivity
At At Lift Truck Business
The Nuvera Plan 2018 + 121 • Further develop engines for the lift truck market • Utilize Reinstated US Tax Credit • Introduce higher-power engines to enter new markets • Leverage EU growth opportunities • Leverage OEM / Integrators opportunities in China • Strengthen backlog • Further develop supply chain • Introduce higher power engines to enter new markets • Launch Orion® 2 fuel cell stack with increased power density and lower cost • Target break even by late 2019 • Achieve profitability at or above Hyster-Yale target economics over longer term • Complete product line-up of Battery Box Replacements (BBR) • Integrate FC engines into higher-capacity lift trucks • Start production at Greenville, NC plant • Continue to engage independent dealers in sales, marketing and service • Continue to focus on reducing product costs to target • Expand into EMEA and JAPIC markets • Achieve profitability at or above Hyster-Yale target economics over longer term |
 Financial Overview Ken Schilling Senior Vice President and Chief Financial Officer
Hyster-Yale Materials Handling / Hyster-Yale Group
|
 Solutions that DRIVE Productivity
Results for 2017 Consolidated vs. 2016 Full Year
($ in millions)
123 _____________________ (1) EBITDA and ROTCE are non-GAAP measures and should not be considered in isolation or as a substitute for GAAP measures.
See non-GAAP explanations and the related reconciliations to GAAP measures in the Financial Appendix starting on page 151. (2) ROTCE adjusted to exclude the impact of new U.S. tax reform legislation. The calculation reflects an unfavorable adjustment
to income of $16.6m at Lift Truck, $1.6m at Nuvera and $0.2m at Bolzoni. See reconciliation to GAAP measures in the Financial Appendix starting on page 151. (3) These entities are presented on a stand-alone basis, and as such, do not sum to the Consolidated financial information. HY
HY Lift Truck (3) Bolzoni (3) Nuvera (3) 2017 2016 Variance Revenues $2,723.8 $177.2 $3.7 $2,885.2 $2,569.7 $315.5 Gross Profit $450.5 $54.8 ($2.1) $502.6 $427.5 $75.1 Operating Expenses ($338.3) ($48.4) ($39.9) ($426.6) ($392.6) ($34.0) Operating Profit (Loss) $112.2 $6.4 ($42.0) $76.0 $34.9 $41.1 Net Income (Loss) $71.8 $3.9 ($26.7) $48.6 $42.8 $5.8 EBITDA (1) $170.6 $17.6 ($35.1) $152.5 $82.1 $70.4 ROTCE (1)(2) 17.3%/21.0% (2) 2.8%/2.9% (2) n/m During 2017 Hyster-Yale’s business units returned year over year growth from full-year 2016.
|
 Solutions that DRIVE Productivity
Results for Q1 2018 Consolidated vs. Q1 2017
Hyster-Yale’s business units are at different stages, which makes the
variance best understood by individual business unit ($ in
millions) 124
_____________________
(1) EBITDA is a non-GAAP measure and should not be considered in isolation or as a substitute for GAAP measures. See
non-GAAP explanations and the related reconciliations to GAAP measures in the Financial Appendix starting on page 151. (2) These entities are presented on a stand-alone basis, and as such, do not sum to the Consolidated financial information. HY
HY Lift Truck (2) Bolzoni (2) Nuvera (2) Q1 2018 Q1 2017 Variance Revenues $743.3 $51.2 $0.3 $788.2 $713.1 $75.1 Gross Profit $116.1 $17.0 ($0.9) $132.1 $126.1 $6.0 Operating Expenses ($89.5) ($14.3) ($9.1) ($112.9) ($103.5) ($9.4) Operating Profit (Loss) $26.6 $2.7 ($10.0) $19.2 $22.6 ($3.4) Net Income (Loss) $20.7 $1.9 ($7.3) $14.9 $18.1 ($3.2) EBITDA (1) $38.0 $5.6 ($9.1) $34.4 $36.3 ($1.9) |
    Solutions that DRIVE Productivity
HY
HY
Variance in 2017 Q1 2018 % Revenue Revenues $2,885.2 $788.2 Sales Growth % 12.3% 10.5% vs. 2016 vs. Q1 2017 Gross Profit $502.6 $132.1 % of Revenue 17.4% 16.7% (0.7%) Operating Expenses ($426.6) ($112.9) % of Revenue 14.8% 14.3% 0.5% Operating Profit $76.0 $19.2 Operating Proft Margin % 2.6% 2.4% (0.2%) Margin / OPEX Leverage ($ in millions) 125 Gross profit percent declined due to unit margin compression related to material price inflation Operating expenses continue to grow consistent with strategic programs Beginning to gain leverage on revenue growth |
 Solutions that DRIVE Productivity
Lift Truck Summary
126 Q1 2018 Q1 2017 Variance Revenues $743.3 $672.2 $71.1 Gross Profit $116.1 $112.9 $3.2 Operating Expenses ($89.5) ($83.1) ($6.4) Operating Profit $26.6 $29.8 ($3.2) Net Income $20.7 $22.3 ($1.6) EBITDA (1) $38.0 $40.1 ($2.1) Key Metrics: Operating Profit Margin% 3.6% 4.4% (0.8%) Adjusted LTM ROTCE (1)(2) 20.8% 18.6% 2.2% Net Working Capital $388.3 $321.6 $66.7 Financial Results Trends • Lift Truck business focused on increasing unit volumes and market share through continued implementation of strategic initiatives • Strong volume performance • Price increases not fully offsetting material cost inflation and tariff impact in short term $672.2 $743.3 Q1 2017 Q1 2018 Revenue 23.3 24.8 Q1 2017 Q1 2018 Units +10.6% ($ in millions) +6.4% (thousands) _____________________ (1) EBITDA and ROTCE are non-GAAP measures and should not be considered in isolation or as a substitute for GAAP measures.
See non-GAAP explanations and the related
reconciliations to GAAP measures in the Financial Appendix starting on page 151. (2) ROTCE adjusted to exclude the impact of new U.S. tax reform legislation. The calculation reflects an unfavorable adjustment
to income of $16.6m at the Lift Truck business. See
reconciliation to GAAP measures in the Financial Appendix starting on page 151. |
 Solutions that DRIVE Productivity
Bolzoni Summary 127 ($ in millions) Financial Results Trends: • Bolzoni continues investment in strategic growth programs • Global attachment volume driven by new Class 1, 4 & 5 forklift truck volumes • Strengthening presence outside EMEA will generate higher than market growth rates $181.0 $197.1 $685.2 $796.3 $0.0 $100.0 $200.0 $300.0 $400.0 $500.0 $600.0 $700.0 $800.0 Counterbalanced (Class 1, 4 & 5) Market Unit Volume 16.2% GROWTH Worldwide LTM Q1 18 Worldwide LTM Q1 17 EMEA LTM Q1 17 EMEA LTM Q1 18 (In thousands) 8.9% GROWTH _____________________ (1) EBITDA and ROTCE are non-GAAP measures and should not be considered in isolation or as a substitute for GAAP measures.
See non-GAAP explanations and the related
reconciliations to GAAP measures in the Financial Appendix starting on page 151. (2) ROTCE adjusted to exclude the impact of new U.S. tax reform legislation. The calculation reflects an unfavorable adjustment
to income of $0.2m at Bolzoni. See reconciliation to GAAP
measures in the Financial Appendix starting on page 151.
_____________________
Source: WITS. LTM 3/31/18
Orders Reports.
Bolzoni Bolzoni Q1 2018 Q1 2017 Variance Revenues $51.2 $41.6 $9.6 Gross Profit $17.0 $13.8 $3.2 Operating Expenses ($14.3) ($11.5) ($2.8) Operating Profit $2.7 $2.3 $0.4 Net Income $1.9 $1.5 $0.4 EBITDA (1) $5.6 $5.2 $0.4 Key Metrics: Operating Profit Margin % 5.3% 5.5% (0.2%) Adjusted LTM ROTCE (1)(2) 3.1% 1.2% 1.9% Net Working Capital $58.3 $44.8 $13.5 |
 Solutions that DRIVE Productivity
Nuvera Summary
128 Nuvera Nuvera Q1 2018 Q1 2017 Variance Revenues $0.3 $2.6 ($2.3) Gross Profit ($0.9) ($0.6) ($0.3) Operating Expenses ($9.1) ($8.9) ($0.2) Operating Loss ($10.0) ($9.5) ($0.5) Net Loss ($7.3) ($5.7) ($1.6) EBITDA (1) ($9.1) ($9.0) ($0.1) Key Metrics: Countries of Distribution 3 1 2 BBR Shipments 71 29 42 ($ in millions)
Financial Results
Trends • Enhanced growth opportunities driven by U.S. and China tax and government policy • Focused on achieving break even product cost • Development projects’ scope tightly focused on fuel cell stacks and engines 0 5000 10000 15000 20000 25000 2012 2013 2014 2015 2016 2017* Long-term CAGR (2012 – 2017) = 28.8%* Total Market - Installed BBRs (units) *Company estimate _____________________ (1) EBITDA is a non-GAAP measure and should not be considered in isolation or as a substitute for GAAP measures. See
non-GAAP explanations and the related reconciliations
to GAAP measures in the Financial Appendix starting on page 151. |
 Consolidated Key Financial Metrics
129 Working Capital, Cash Flow and Capitalization LTM 3/31/18 Year Ended 12/31/17 Variance Fav/(Unfav)
Working Capital
(1) $463.1 $461.0 ($2.1) LTM Cash Flow before Financing (2) $44.0 $117.4 ($73.4) Adjusted LTM Cash Flow before Financing (3) $44.0 $37.4 $6.6 Cash $228.1 $220.1 $8.0 Debt $283.4 $290.7 $7.3 Equity $608.0 $572.4 $35.6 Debt to Total Capitalization (4) 32% 34% 2% ($ in millions) • Working Capital continues to be efficiently managed at increased sales volume
• Cash flow affected by one-time AP recovery in the Americas of $80m • Improved Cash, Debt and Capitalization at 2018 Q1 over 2017 year end performance
Solutions that DRIVE Productivity
(1) Working Capital is defined as Accounts Receivable plus Inventory less
Accounts Payable. (2) Cash Flow before Financing is defined as cash from operating activities less cash from investing activities for the respective
period. (3) Adjusted LTM Cash Flow before Financing excludes approximately $80m impact of unplanned systems-related acceleration of
supplier payments in December 2016. Adjusted Cash Flow before Financing is a non-GAAP measure and should not
be considered in isolation or as a substitute for
GAAP measures. See non-GAAP explanations and the related reconciliations to GAAP measures in the Financial Appendix
starting on page 151. (4) Debt to Total Capitalization is
defined as Debt divided by the sum of Debt plus Equity at the end of the period.
|
 Solutions that DRIVE Productivity
Hyster-Yale Use of Cash Priorities
130 Return Cash to Stockholders Investments in Adjacent or Complementary Businesses Investments in Fuel Cell Business Investments in Share Gain Programs Investments in Lift Truck & Attachments Businesses Strategic initiatives to accelerate growth or enhance margins Acquisitions of technologies and other forklift-related businesses Investments to commercialize Nuvera’s fuel cell technology |
 Solutions that DRIVE Productivity
Key Capital Investments
131 0.0 10.0 20.0 30.0 40.0 50.0 60.0 2013 2014 2015 2016 2017 Est. 2018* Bolzoni Nuvera New Brazil Plant SAP & CRM/CPQ Core Forklift Investments Capital expenditures directed to support key HY lift truck initiatives along
with development of Nuvera and Bolzoni products and facilities
* Excluding Maximal |
 Solutions that DRIVE Productivity
Maximal Acquisition
• Timing: Targeted Q2 2018 closing • Acquisition Price: $90m for 75% ownership stake • 2017 Performance * – 6,765 unit volume; $77m revenue; 4.2% operating profit margin • Additional Incremental Expenses – $5-10m spend in 2018/early 2019 – 80% operating expense vs. 20% capital expenditures – Up to $10m earn out over three-year period • Timing of impact to HY: – 2018/2019: Slightly decremental to EPS as Chinese production consolidation, IT integration program and additional product development/transfers/introductions are placed in service
– Post 2019: Expect incremental to EPS as production ramp up and IT programs are
completed 132 * Audited 2017 Chinese statutory results |
 Solutions that DRIVE Productivity
Dividend Growth
133 Annual Dividends Amount Paid in Total and Annualized $ Per Share (total $ in millions) ($ per share annualized) Share Repurchase Program: Approximately 694,700 Class A shares repurchased for $49.8m
during 2013 and 2014. (1) Dividend decisions are made
quarterly by HY’s Board of Directors. The above graph assumes the continuation of a quarterly dividend in Q3 and Q4 2018 similar to the new rate established in Q2 2018.
Q3-4 (1) Dividend Strong continuing dividend support and growth $17.8 $18.4 $19.2 $19.8 $5.0 $1.00 $1.05 $1.10 $1.15 $1.20 $1.25 $1.30 $0 $3 $6 $9 $12 $15 $18 $21 $24 2014 2015 2016 2017 Est. 2018 $5.15m to be paid 6/15/18 |
 Solutions that DRIVE Productivity
2018 Earnings Perspective -
Lift Truck Business
134 Unit and Parts Volumes FY 2018: Overall global lift
truck market expected to
grow modestly in 2018
compared to 2017.
Expected unit and parts
revenue increases driven
by continued investments
in HY's strategic
initiatives.
Currency FY 2018: No change from strong US dollar scenario forecasted. Net Income/ EBITDA FY 2018: Net
income in 2018 is
expected to
increase substantially over 2017 as a result of the absence of the tax adjustments made in 2017 for the U.S. tax reform legislation. Income Taxes FY 2018: Global Lift
Truck effective income
tax rate expected to be
in the range of 23% to
26% in 2018 based on
expected mix of
earnings. Operating Profit FY 2018: Expected increase in revenues, mostly offset by material cost inflation and higher operating expenses, is expected to result in a modest increase in operating profit in 2018 compared with 2017. |
 Solutions that DRIVE Productivity
2018 Earnings Perspective -
Bolzoni Attachment Business 135 Revenues FY 2018: Bolzoni expects revenues in 2018 to increase compared with 2017 as a result of anticipated growth in both the Americas and EMEA and continued implementation of sales enhancement programs. Net Income/ EBITDA FY 2018: Expected
operating leverage
from sales growth and
continued implementation of several key strategic programs expected to generate substantial growth in 2018 net income compared with 2017. Income Taxes FY 2018: Tax rates consistent with prior year. Operating Profit FY 2018: Expected
operating leverage
from sales growth
and continued
implementation of
several key strategic
programs expected
to generate
substantial growth
in 2018 operating
profit compared
with 2017. Currency FY 2018: No change from strong US dollar scenario expected. |
 Solutions that DRIVE Productivity
2018 Earnings Perspective - Nuvera Fuel Cell Business 136 Revenues FY 2018: Nuvera
expects demand to
continue to increase
throughout the year.
Net Loss/ EBITDA FY 2018: The net
loss in 2018 is
expected to be
comparable to 2017
due to smaller tax
benefit . The Company's current target is to achieve break-even by late 2019. Income Taxes FY 2018: A smaller tax benefit is expected to be realized on Nuvera's losses due to a lower effective income tax rate under the new U.S. tax reform legislation. Operating Loss FY 2018: Operating
loss in 2018 is
expected to decrease
compared with 2017,
especially in Q4, and
moderate more
substantially over
2019. Product Development and Launch Expenses FY 2018: Cost base expected to fall due to substantial cost reductions secured on future purchases of core components. Further cost reductions expected in 2019 from improved designs and higher volumes. |
 Solutions that DRIVE Productivity
Lift Truck Business Target Economics Goal and Gap to Target
Achieve 7% operating profit margin target over the medium term Maintain ROTCE > 20% Target Economics gap closure can be achieved with unit volume… Stronger Industry + Share Growth = Volume Leverage LTM 3/31/18 Gap to Target Economics Actual Lift Truck Operating Profit Margin % 3.8% Margin Variances 1.2% Volume Variances* 2.0% Manufacturing variances/other 0.3% Operating Expenses 1.7% Lift Truck Operating Profit Margin % Gap 3.2% Lift Truck Operating Profit Margin % Target 7.0% *Expected to achieve with annual sales of 115,000 HY-produced lift
truck units, excluding trucks sold by Maximal.
137 |
 Solutions that DRIVE Productivity
HY Lift Truck Incremental Volume Leverage
138 Incremental Units Produced +5,000 Trucks Sales $186m Gross Profit $37m Operating Expenses $16m Operating Profit $21m Incremental Operating Profit % 11.0% As we make progress toward the 115,000 unit production levels, HY Lift
Truck will generate significant incremental operating profit
contribution. |
 Solutions that DRIVE Productivity
Lift Trucks Sold
124,000 Lift Trucks Produced in HY plants 115,000 Revenues $3,920 Gross Profit $725 Operating Expenses $450 Operating Profit $275 Operating Margin 7.0% Target Economics HY Lift Truck Target is to move from significant loss to break even in late 2019 then on towards significant profitability in the long term Importance of volume growth to reaching target operating margin Nuvera Expect to exceed 7% operating profit target as programs mature Bolzoni 139 |
 Prospects for Volume Growth Alfred Rankin Chairman, President and
CEO Hyster-Yale
Materials Handling Chairman Hyster -Yale
Group |
 Key Perspectives to Emphasize
141 Global markets expected to be strong for next several years Investments to expand HY’s product and solutions portfolio and geographic breadth and depth Core lift truck programs aim to trigger organic growth through intensified industry focus Nuvera remains a venture business with developed technology; break even by late 2019 Solutions that DRIVE Productivity |
 Solutions that DRIVE Productivity
One Set of Strategies, Different Priorities for Execution
142 Americas HYG Position: Strong Full execution of strategies Significant investment to enhance share Increased dual-brand coverage Europe, Middle East, Africa HYG Position :Moderate Industry and customer solutions Low cost of ownership Distribution enhancements JAPIC HYG Position: Varies Acquisition and partnership Emerging Market Development Center Distribution strengthening |
 Solutions that DRIVE Productivity
Key Developments Since Last Investor Day
143 Nuvera strategy implementation – clear focus Bolzoni fully integrated and performing well Improved financial performance in core lift truck business Developments in automation and key product platforms Industry focus with new sales and marketing organizations Solid base for expansion in developing markets being established |
 Solutions that DRIVE Productivity
Long-Term Focused, not Short-Term Oriented
144 Investing for the Future Leverage, but also control, our expense structure With the ability to |
 Solutions that DRIVE Productivity
Operating profit margin
With adequate volume growth,
the Lift Truck business can achieve
Committed to Lift Truck Financial Targets
145 |
 Solutions that DRIVE Productivity
With Lift Truck Performance Supplemented by Acquisitions 146 * * Acquisition of 75% of Maximal announced in December 2017. As of the date of this presentation, the acquisition has not yet
closed. |
 Solutions that DRIVE Productivity
Valuation Approach Needs to Vary By Business
147 Lift Truck and Attachment Businesses Lift Truck and Attachment Businesses Fuel Cell Business Fuel Cell Business • Board Oversight as Separate Businesses • Incentives Tied to Individual Businesses Strong Operating Cash Generation Market Leading Products and Position Mature Cyclical Industry Value using Traditional Valuation Model of EBITDA Multiple on a Net Debt Basis Multiple should reflect ROIC levels and growth prospects Developing / Technology Industry Distinct Technology / Patents in Fuel Cell and Hydrogen Generation Operating Cash Invested in New Product Commercialization / Ramp Up Value as Venture Business with Developed Technology |
 Solutions that DRIVE Productivity
A Solid Investment Option
148 HYSTER-YALE HYSTER-YALE Strong Balance Sheet Cash Generation & Commitment to Shareholder Return Investment & Growth in Game Changing Technologies Leading Products & Market Position Strategies to Gain Share in all Segments & Markets Customer Focused & Solutions Oriented Strong Return on Capital |
 Solutions that DRIVE Productivity
Questions? ir@hyster-yale.com Subject: Investor Day Question 149 |
 Solutions that DRIVE Productivity
Appendix Appendix |
 151 Solutions that DRIVE Productivity Non-GAAP Disclosure EBITDA and return on total capital employed are not measurements under U.S. GAAP, should not be considered in isolation or as a substitute for GAAP measures, and are not necessarily comparable with similarly titled measures of other companies. Hyster-Yale defines each as the following: EBITDA is defined as income (loss) before asset impairment charges, income taxes and noncontrolling interest income (loss) plus net interest expense and depreciation and amortization expense; Adjusted Return on Total Capital Employed (“ROTCE”) is defined as net income (loss), as reported, before interest expense, after tax and before the impact of U.S. Tax Reform legislation, divided by average capital employed. Average capital employed is defined as average stockholders’ equity plus average debt less average cash. Adjusted Cash Flow before Financing is defined as cash from operating activities less cash from investing activities, excluding the approximately $80m impact of an unplanned systems-related acceleration of supplier payments in December 2016. For reconciliations from GAAP measurements to non-GAAP measurements, see the following pages. |
 Non-GAAP Reconciliation
152 Solutions that DRIVE Productivity ($ in millions) Year Ended December 31 Qtr. Qtr. Consolidated 2013 2014 2015 2016 2017 3/31/2017 3/31/2018 3/31/2018 Reconciliation of EBITDA Net income attributable to stockholders $ 110.0 $ 109.8 $ 74.7 $ 42.8 $ 48.6 18.1 $ 14.9 $ $ 45.4 Nuvera asset impairment - - - - 4.9 - - 4.9 Noncontrolling interest income (loss) 0.2 0.4 0.4 (0.5) 0.3 - - 0.3 Income tax provision (benefit) 17.2 39.9 29.4 (4.0) 44.9 6.2 4.9 43.6 Interest expense 9.0 3.9 4.7 6.7 14.6 1.8 4.0 16.8 Interest income (1.8) (1.1) (1.5) (2.0) (3.6) (0.3) (0.8) (4.1) Depreciation and amortization expense 30.2 29.7 28.9 39.1 42.8 10.5 11.4 43.7 EBITDA $ 164.8 $ 182.6 $ 136.6 $ 82.1 $ 152.5 36.3 $ 34.4 $ 150.6 $ Trailing 12 Months Note: EBITDA in this investor presentation is provided solely as a supplemental disclosure with respect to operating results.
EBITDA does not represent net income (loss), as defined by U.S. GAAP and should not be considered as a substitute for net income or net loss, or as an indicator of operating performance. The Company
defines EBITDA as income (loss) before asset impairment charges, income
taxes and noncontrolling interest income (loss) plus net interest expense and depreciation and amortization expense. EBITDA is not a measurement under U.S. GAAP and is not necessarily comparable with similarly titled measures of other
companies. ($ in millions)
Year Ended December 31
Qtr. Qtr. Lift Truck 2013 2014 2015 2016 2017 3/31/2017 3/31/2018 3/31/2018 Reconciliation of EBITDA Net income attributable to stockholders $ 110.0 $ 111.2 $ 89.3 $ 66.9 $ 71.8 22.3 $ 20.7 $ $ 70.2 Noncontrolling interest income (loss) 0.2 0.4 0.4 (0.5) (0.4) (0.1) (0.1) (0.4) Income tax provision 17.2 40.7 39.4 12.2 59.4 9.4 6.8 56.8 Interest expense 9.0 3.9 4.7 6.9 13.9 1.6 3.8 16.1 Interest income (1.8) (1.1) (1.5) (3.0) (3.7) (0.3) (0.8) (4.2) Depreciation and amortization expense 30.2 29.6 27.3 28.1 29.6 7.2 7.6 30.0 EBITDA $ 164.8 $ 184.7 $ 159.6 $ 110.6 $ 170.6 40.1 $ 38.0 $ $ 168.5 Trailing 12 Months |
 Solutions that DRIVE Productivity
Non-GAAP Reconciliation (continued)
153 ($ in millions) Qtr. Qtr. Nuvera 2014 2015 2016 2017 3/31/2017 3/31/2018 3/31/2018 Reconciliation of EBITDA Net loss attributable to stockholders $ (1.4) $ (14.6) $ (23.8) $ (26.7) (5.7) $ (7.3) $ $ (28.3) Nuvera asset impairment - - - 4.9 - - 4.9 Noncontrolling interest income - - - - - - - Income tax benefit (0.8) (10.0) (15.8) (15.3) (3.8) (2.7) (14.2) Interest expense - - - - - - - Interest income - - - - - - - Depreciation and amortization expense 0.1 1.6 1.5 2.0 0.5 0.9 2.4 EBITDA $ (2.1) $ (23.0) $ (38.1) $ (35.1) (9.0) $ (9.1) $ $ (35.2) Trailing 12 Months Year Ended December 31 ($ in millions) Bolzoni 2016 2017 3/31/2017 3/31/2018 3/31/2018 Reconciliation of EBITDA Net income attributable to stockholders $
(0.3) 3.9
$
1.5
$
1.9
$
4.3
$
Noncontrolling interest income
-
0.7 0.1 0.1 0.7 Income tax provision (benefit) (0.4) 1.0 0.6 0.5 0.9 Interest expense 0.8 0.8 0.2 0.2 0.8 Interest income - - - - - Depreciation and amortization expense 9.5 11.2 2.8 2.9 11.3 EBITDA $ 9.6
17.6
$
5.2
$
5.6
$
18.0
$
Trailing 12
Months 9 Months Ended December 31 Year Ended December 31 Qtr. Qtr. Note: EBITDA in this investor presentation is provided solely as a supplemental disclosure with respect to operating results.
EBITDA does not represent net income (loss), as defined by U.S. GAAP and should not be considered as a substitute for net income or net loss, or as an indicator of operating performance. The Company defines EBITDA as income
(loss) before asset impairment charges, income taxes and noncontrolling
interest income (loss) plus net interest expense and depreciation and amortization expense. EBITDA is not a measurement under U.S. GAAP and is not necessarily comparable with similarly titled measures of other companies.
|
 154 Solutions that DRIVE Productivity Non-GAAP Reconciliation (continued) _____________________ Note: Return on capital employed is provided solely as a supplemental disclosure with respect to income generation because
management believes it provides useful information with respect to earnings in a form that is comparable to the Company’s cost of capital employed, which includes both equity and debt securities, net of cash.
Consolidated
Lift Truck
(1) Nuvera Bolzoni Average Stockholders' Equity (12/31/17, 9/30/17, 6/30/17, 3/31/17, and 12/31/16)
$518.8
$571.4
$21.3
$117.7
Average Debt (12/31/17, 9/30/17, 6/30/17, 3/31/17, and
12/31/16) 247.9
205.6
2.2 49.0 Average Cash (12/31/17, 9/30/17, 6/30/17, 3/31/17, and 12/31/16)
(161.3)
(325.2)
(0.2)
(10.9)
Average capital employed
$605.4 $451.8 $23.3 $155.8 Net income (loss) $48.6 $71.8 $(26.7) $3.9 Plus: Interest expense, net 11.0 10.2 - 0.8 Less: Income taxes on interest expense, net at 38% (4.2) (3.9) - (0.3) Actual return on capital employed = actual net income (loss) before interest expense, net, after tax
$55.4 $78.1 $(26.7) $4.4 Plus: Income tax expense impact of U.S. Tax Reform 38.2 36.4 1.6 0.2 Less:
U.S. Tax Reform impact on equity earnings
(19.8)
(19.8)
-
-
$73.8 $94.7 $(25.1) $4.6 Actual return on capital employed percentage 9.2% 17.3% n/m 2.8% Adjusted return on capital employed percentage 12.2% 21.0% n/m 2.9% ($ in millions) (1) Lift Truck return on capital employed excludes the average initial investment of $99.3 million for the acquisition of Bolzoni
and continuing average investments of $75.6 million in Nuvera. Investment numbers are based on a 5-point average.
12/31/17
12/31/17
12/31/17
12/31/17
Adjusted return on capital employed = Actual return on capital employed
less impact of U.S. tax reform Reconciliation of Return on Total Capital Employed / Adjusted Return on
Capital Employed (ROTCE) |
 155 Solutions that DRIVE Productivity Non-GAAP Reconciliation (continued) _____________________ Note: Return on capital employed is provided solely as a supplemental disclosure with respect to income generation because
management believes it provides useful information with respect to earnings in a form that is comparable to the Company’s cost of capital employed, which includes both equity and debt securities, net of cash.
Consolidated
Lift Truck
(1) Nuvera Bolzoni LTM 3/31/18 Average Stockholders' Equity (3/31/18, 12/31/17, 9/30/17, 6/30/17 and 3/31/17)
$546.2
$601.4
$19.2
$123.1
Average Debt (3/31/18, 12/31/17, 9/30/17, 6/30/17 and
3/31/17) 262.3
219.3
2.3 48.9 Average Cash (3/31/18, 12/31/17, 9/30/17, 6/30/17 and 3/31/17) (198.3) (366.8) (0.2) (11.1) Average capital employed $610.2 $453.9 $21.3 $160.9 Net income (loss) $45.4 $70.2 $(28.3) $4.3 Plus: Interest expense, net 12.7 11.9 - 0.8 Less: Income taxes on interest expense, net at 38% (4.8) (4.5) - (0.3) Actual return on capital employed = actual net income (loss) before interest expense, net, after tax
$53.3 $77.6 $(28.3) $4.8 Plus: Income tax expense impact of U.S. Tax Reform 38.2 36.4 1.6 0.2 Less:
U.S. Tax Reform impact on equity earnings
(19.8)
(19.8)
-
- Adjusted return on capital employed = Actual return on capital employed less impact of U.S. tax reform
$71.7 $94.2 $(26.7) $5.0 Actual return on capital employed percentage 8.7% 17.1% n/m 3.0% Adjusted return on capital employed percentage 11.7% 20.8% n/m 3.1% ($ in millions) Reconciliation of Return on Total Capital Employed / Adjusted Return on Capital Employed (ROTCE) (1) Lift Truck return on capital employed excludes the average initial investment of $99.3 million for the acquisition of Bolzoni
and continuing average investments of $80.4 million in Nuvera. Investment numbers are based on a 5-point average. |
 156 Solutions that DRIVE Productivity Non-GAAP Reconciliation (continued) _____________________ Note: Return on capital employed is provided solely as a supplemental disclosure with respect to income generation because
management believes it provides useful information with respect to earnings in a form that is comparable to the Company’s cost of capital employed, which includes both equity and debt securities, net of cash. Reconciliation of Return on Total Capital Employed / Adjusted Return on Capital Employed (ROTCE) Consolidated Lift Truck (1) Nuvera Bolzoni LTM 3/31/17 Average Stockholders' Equity (3/31/17, 12/31/16, 9/30/16, 6/30/16 and 3/31/16)
$489.6
$525.0
$12.9
$101.3
Average Debt (3/31/17, 12/31/16, 9/30/16, 6/30/16 and
3/31/16) 144.1
111.5
2.4 57.1 Average Cash (3/31/17, 12/31/16, 9/30/16, 6/30/16 and 3/31/16) (76.7) (216.4) - (8.8) Average capital employed $557.1 $420.2 $15.3 $149.7 Net income (loss) $50.9 $75.5 $(25.8) $1.2 Plus: Interest expense, net 5.5 4.5 - 1.0 Less: Income taxes on interest expense, net at 38% (2.1) (1.7) - (0.4) Actual return on capital employed = actual net income (loss) before interest expense, net, after tax
$54.3 $78.3 $(25.8) $1.8 Actual return on capital employed percentage 9.7% 18.6% n/m 1.2% ($ in millions) (1) Lift Truck return on capital employed excludes the average initial investment of $99.3 million for the acquisition of Bolzoni
and continuing average investments of $47.4 million in Nuvera. Investment numbers are based on a 5-point average. |
 Solutions that DRIVE Productivity
Cash Flow before Financing Calculation
157 Consolidated ($ in millions) Year Ended December 31 Qtr. Trailing 12 Months 2013 2014 2015 2016 2017 3/31/2018 3/31/2018 Reconciliation of Cash Flow before Financing $152.9 $100.0 $89.4 $(48.9) $164.7 $28.5 $91.2 Net cash used for investing activities (26.1) (44.4) (31.3) (145.1) (47.3) (7.0) (47.2) Cash Flow before Financing $126.8 $55.6 $58.1 $(194.0) $117.4 $21.5 $44.0 Impact of accelerated supplier payments - - - 80.0 (80.0) - - Adjusted Cash Flow before Financing $126.8 $55.6 $58.1 $(114.0) $37.4 $21.5 $44.0 Net cash provided by (used for) operating activities
|
 Alfred M. Rankin, Jr.
Chairman, President and Chief Executive Officer of Hyster-Yale Materials
Handling Chairman,
Hyster-Yale Group
Biography 158 Mr. Rankin became Chairman, President and Chief Executive Officer of Hyster-Yale Materials Handling, Inc. in September 2012 and has
been Chairman of Hyster-Yale Group, Inc. since October
2008. Mr. Rankin has also guided NACCO Industries since May 1994. In September 2017, he retired as President and Chief Executive Officer of NACCO when NACCO spun-off its housewares-related
businesses as Hamilton Beach Brands Holding Company. In
October 2017, Mr. Rankin became Non-Executive Chairman of the Board of NACCO and Executive Chairman of the Board of Hamilton Beach Brands Holding Company. He joined NACCO as President and Chief Operating Officer
in April 1989 and became President and Chief Executive Officer
in May 1991. Prior to joining NACCO, he was Vice Chairman, Chief Operating Officer, and a Director of Eaton Corporation, a position he had held since April 1986. Previous to that, he had served
successively as President of Eaton's Materials Handling and
Industrial Groups, and as Executive Vice President - Operations. Prior to his fifteen years at Eaton, Mr. Rankin worked for McKinsey and Company, a management consulting firm.
Mr. Rankin received a Bachelor of Arts degree, magna cum laude, in Economics and a Juris Doctor degree from Yale University. Mr.
Rankin is a director of Hyster-Yale Materials Handling, NACCO
Industries, Hamilton Beach Brands Holding Company and the National Association of Manufacturers. He is a trustee and former Chairman of the Board of University Hospitals of Cleveland, Trustee of the Cleveland
Museum of Art, and trustee of the Musical Arts Association. He
is a former director of The Vanguard Group, Goodrich
Corporation, Standard Products, and Reliance Electric, and a former director
and Chairman of the Board of the Fourth District Federal Reserve
Bank. Solutions that DRIVE Productivity |
 Solutions that DRIVE Productivity
Colin Wilson President and Chief Executive Officer,
Hyster-Yale Group Biography 159 Colin Wilson became President and Chief Executive Officer of Hyster-Yale Group in September 2014 and is charged with providing the
strategic vision and global leadership that keeps
Hyster-Yale Group moving forward, a role for which he has spent much of his career preparing. Mr. Wilson has over 40 years of experience in the materials handling industry. He began his career in 1970 with Coles Cranes
in Sunderland, England, where he worked in production
engineering, marketing, product management and overseas licensing. After time with a compressor company and a European lift truck competitor, Mr. Wilson joined Hyster-Yale Group (formerly NACCO Materials Handling
Group) in 1988 as European Sales and Marketing Director for the
Yale® brand. From here, he moved into the role of Managing Director of Yale Europe before being named President of Yale Materials Handling Corporation, based in Flemington, New Jersey, in 1995. In 2002,
Mr. Wilson was appointed President of Hyster-Yale Group's
Americas operations and three years later became Vice President and Chief Operating Officer of Hyster-Yale Group. Most recently, prior to becoming President and Chief Executive Officer, Mr. Wilson served
as Hyster-Yale Group’s President and Chief
Operating Officer since November 2013. Mr. Wilson graduated with a Bachelor of Science Degree in Mechanical Engineering, with highest honors, from the University of
Sunderland. Mr. Wilson recently served on the Executive
Committee and Board of Directors of the Industrial Truck Association of America (ITA), is the past chairman and current board member of the Materials Handling Institute of America (MHI) and has also served
as a member
of the Material Handling Equipment Distributors Association’s Board of Advisors (MHEDA) and as President of the British
Industrial Truck Association (BITA). Mr. Wilson served on the Board of
Directors of the local Boys and Girls Clubs in North Carolina and
currently serves on the Board of Directors of the Cleveland Boys and Girls
Club and on the Board of Directors of Cleveland Playhouse. |
 Solutions that DRIVE Productivity
Rajiv K. Prasad
Chief Product and Operations Officer
As Chief Product and Operations Officer, Mr. Prasad guides all aspects
of the Hyster-Yale Group product development, manufacturing
and supply chain. His ultimate responsibility is to ensure that the products
and innovations introduced by Hyster-Yale Group address
customer needs fully and efficiently. Prior to February 2018, Mr. Prasad was
Senior Vice President, Global Product Development, Manufacturing
and Supply Chain Strategy. His career in product development began in 1986 with Ford Motor Company. In 1999, he joined Lear Corporation, taking on positions with greater responsibility, before moving to International Truck and Engine Corporation
where he served as Vice President of Global Product Development.
Mr. Prasad joined Hyster-Yale Group (formerly NACCO Materials
Handling Group) in 2007 where he has guided developments that have included
introduction of the new Electric Rider Platform. He holds a
Bachelor’s Degree in Electrical/Electronic Engineering and a Master’s Degree in Advanced Vehicle Concepts from Loughborough University, in Leicestershire, UK. Biography 160 |
 Solutions that DRIVE Productivity
Anthony J. Salgado
Senior Vice President, JAPIC
Biography 161 Mr. Salgado joined Hyster-Yale Group in 2016 as Senior Vice President, responsible for the company’s businesses and interests in
the Japan, Asia Pacific, India and China regions. Prior to
joining the group, Mr. Salgado held the role of Vice President and Corporate Officer of Unicarrers Corporation (formerly Nissan Forklift), and President of the Americas Division. During his 15 years with
UniCarriers/Nissan, his experience also included leadership
roles in quality, manufacturing, and aftermarket operations, including the role of Vice President, manufacturing operations. During this time, Mr. Salgado was also a member of the Industrial Truck Association Board of Directors and
Executive Committee. His previous roles included positions
with GE Appliances and GE Capital in Six Sigma and Quality leadership roles, as well serving as a Lieutenant in the United States Navy, completing a tour as Surface Warfare Officer aboard the USS Fort McHenry, and
another as the Executive Officer of the US Navy Ceremonial Guard
in Washington, DC. Mr. Salgado holds a Bachelors of Science degree in Aerospace Engineering from the United States Naval Academy. |
 Solutions that DRIVE Productivity
Roberto Scotti
President and Chief Executive Officer of Bolzoni S.p.A. 162 Biography Roberto Scotti obtained his high school diploma in mechanical engineering in 1970. From 1970 to 1973 he attended the
faculty of Mechanical Engineering at the University of Milan. From 1973
to 1979 Mr. Scotti was Sales Manager for Bolzoni. In 1980
he left Bolzoni and founded Teko S.r.l., a company manufacturing lifting tables and hand pallet trucks (later merged into Bolzoni) of which he was C.E.O. until 1987. After this merger, Mr. Scotti became C.E.O. of Bolzoni and since then he has held
the position of C.E.O. of Bolzoni and many other companies of
the Bolzoni Group. He has been the promoter of the great
expansion of the group worldwide and the acquisition of the important group
brands. After the acquisition by the Hyster-Yale Group
in 2016, he was appointed President and Chief Executive Officer of Bolzoni S.p.A. |
 Solutions that DRIVE Productivity
Jon Taylor President and Chief Executive Officer of Nuvera Fuel Cells Biography 163 Mr. Taylor became President and Chief Executive Officer of Nuvera Fuel Cells in April 2015. Previously, Mr. Taylor was the Interim CEO
of Nuvera from December 2014 and Vice President, Business
Development and Financial Planning and Analysis from September
2014. Prior to September 2014, he served as Director Corporate Strategy,
Financial Planning and Analysis since 2008. Mr. Taylor also
serves on the Board of Directors for the Company’s joint venture in
Japan, Sumitomo-NACCO Material Handling Group. From 1993 to 2008, Mr. Taylor served in various accounting, finance and marketing roles at Hyster-Yale Group (formerly NACCO Materials Handling
Group) in both the Corporate and European Headquarters. Mr.
Taylor has a B.S. in Business Finance from the University of Utah and an MBA in International Business from the University of Washington. He also completed international study programs at Cambridge
University and the Cranfield Institute of Technology in the U.K.
He has represented Hyster-Yale on the Industry Trade Advisory
Committee for Automotive Equipment and Capital Goods, and is a former member
of the Pacific Northwest International Trade Association. Mr.
Taylor is a longtime volunteer classroom teacher for Junior Achievement. |
 Solutions that DRIVE Productivity
Kenneth C. Schilling
Senior Vice President, Chief Financial Officer
Biography 164 Mr. Schilling oversees public financial reporting, accounting, tax compliance and strategies, treasury activities and investor relations
at Hyster-Yale. Most recently, Mr. Schilling was Vice
President and Chief Financial Officer of Hyster-Yale and Hyster-Yale Group, positions he held from September 2012 and October 2008, respectively, to August 2014. Previously, Mr. Schilling was Vice President and
Controller of NACCO Industries from May 1997 to September 2012.
Mr. Schilling joined NACCO Industries in 1991 as Tax Manager. In
1995, he was promoted to NACCO Industries Manager of Tax and Budgeting and
became Controller in 1996. Prior to joining NACCO Industries,
Mr. Schilling worked at Arthur Anderson LLP as Tax Manager from 1985 to 1991. Mr. Schilling received his Bachelor of Science degree in Accounting from Miami University in 1982 and obtained his Juris Doctor degree from The Ohio State University
School of Law in 1985. Mr. Schilling is a Certified Public
Accountant in the State of Ohio and was also admitted to the practice of law in the State of Ohio in 1985. He is a member of the American Institute of CPAs, Financial Executives International, The Manufacturers Alliance
for Productivity and Innovation - CFO Council and the
Cleveland Metropolitan Bar Association. |
 Solutions that DRIVE Productivity
Christina Kmetko, CPA, IRC
Investor Relations
Biography 165 Ms. Kmetko is the President and Owner of Evergreen Consulting & Associates, L.L.C., formed in January 2010, which provides investor
relations support to Hyster-Yale Materials Handling, Inc.
and NACCO Industries, Inc. (Hyster-Yale’s previous parent company). Prior to forming Evergreen Consulting, Ms. Kmetko spent more than six years with NACCO Industries, Inc. as the Manager of Finance responsible for
all aspects of investor relations activities. Prior to
joining NACCO, Ms. Kmetko was Director of Accounting and External Reporting for Agilysys, Inc. (f.k.a., Pioneer Standard Electronics, Inc.)., a distributor of enterprise computer technology products and solutions
located in Solon, Ohio, a position she held since January 2002.
From August 2000 until January 2002, she was Director of External Reporting of Pioneer Standard Electronics. From December 1991 to July 2000 Ms. Kmetko held various positions of increasing responsibility in the audit
practice of Arthur Andersen LLP in Cleveland, Ohio. Ms. Kmetko received a Bachelor of Science degree in Accounting, with highest honors, from The University of Akron in 1991, and earned a
Certificate in Investor Relations from The University of
California at Irvine in June 2007. Ms. Kmetko is a Certified Public Accountant and received her certification in the State of Ohio in 1994. Ms. Kmetko is also an Investor Relations Charter professional, a credential she
earned in April 2016. Ms. Kmetko is a member of the National
Investor Relations Institute (NIRI), the NIRI Senior Roundtable, the Manufacturers’ Alliance and Productivity Initiative (MAPI) – Investor Relations Council, the Ohio Society of Certified Public Accountants, the
American Institute of Certified Public Accountants and the
Financial Executives Institute (FEI). She is also a member of the Board of Directors of the Cuyahoga Valley Scenic Railroad, and a member of the Finance Committee of Providence House, both located in Cleveland, Ohio. |
 Solutions that DRIVE Productivity
Hyster founded in Portland Oregon as the Willamette Ersted Company 1929 1944 1959 Company name officially changed to Hyster Company First Hyster container handling trucks 1875 1920 Yale Lock Mfg. broadens its scope into materials handling Yale and Towne launched a new battery powered low-lift platform truck 1963 Yale forklift truck business merges with Eaton Mfg. Industrial Truck Division 1950 Yale added gas, LP gas and diesel-powered fork lift trucks to its range Hyster introduces the famous Monotrol® pedal 1971 Yale forges a partnership with Sumitomo Ltd 2011 2011 NMHG introduces the UTILEV ® lift truck for the utility segment of the market 2016 2016 1985 Yale acquired by NACCO Industries 1989 Hyster acquired by NACCO Industries NMHG renamed Hyster-Yale Group HY completes acquisition of 100% of Bolzoni S.p.A. The History of Hyster-Yale and its brands 166 1989 1989 2012 2012 Hyster-Yale formed as independent public company following spin- off by NACCO 2014 2014 NMHG, HY’s operating company, acquires Nuvera to enter the fast- growing hydrogen fuel cell market Hyster and Yale merge to form NACCO Materials Handling Group (NMHG) Dec. 2017 Dec. 2017 HY announces pending acquisition of a 75% interest in Zhejiang Maximal Forklift Company Limited |
 Solutions that DRIVE Productivity
Nuvera History
167 • Formed April, 2000 • Over 20 years of hydrogen and fuel cell experience • Certified: ISO 9001, 14001, OHSAS 18001 2004 2012 2003 Hess buys out Arthur D. Little 2004 Renault invests 2008 Hess buys out Renault and De Nora 2000 2000 Arthur D. Little, De Nora and Hess establish Nuvera 2016 2008 2014 NMHG Acquires Nuvera from Hess Headquarters, Billerica MA EU Offices and Testing Facilities, San Donato, Italy 2016 NMHG Renamed HYG Subsidiary of |
Serious News for Serious Traders! Try StreetInsider.com Premium Free!
You May Also Be Interested In
- Compass Therapeutics Announces First Patient Dosed in the Phase 1 Study of CTX-8371 in Patients with Solid Tumors
- Amneal Launches PEMRYDI RTU®, the First Ready-to-Use Version of Important Oncology Injectable Medicine
- Masimo Founder and CEO Joe Kiani to Speak on AI at Global Patient Safety Summit in Chile
Create E-mail Alert Related Categories
SEC FilingsSign up for StreetInsider Free!
Receive full access to all new and archived articles, unlimited portfolio tracking, e-mail alerts, custom newswires and RSS feeds - and more!
