

Form 8-K HARROW HEALTH, INC. For: Aug 09
 Tweet
Tweet Share
Share
UNITED STATES
SECURITIES AND EXCHANGE COMMISSION
Washington, D.C. 20549
FORM
CURRENT REPORT
Pursuant to Section 13 OR 15(d) of The Securities Exchange Act of 1934
Date
of Report (Date of earliest event reported):
(Exact name of registrant as specified in its charter)
(State or other jurisdiction of incorporation) |
(Commission File Number) |
(IRS Employer Identification No.) |
| (Address of principal executive offices) | (Zip Code) |
Registrant’s
telephone number, including area code:
(Former Name or Former Address, if Changed Since Last Report)
Securities registered pursuant to Section 12(b) of the Act:
| Title of each class | Trading Symbol(s) | Name on exchange on which registered | ||
Check the appropriate box below if the Form 8-K filing is intended to simultaneously satisfy the filing obligation of the registrant under any of the following provisions:
| Written communications pursuant to Rule 425 under the Securities Act (17 CFR 230.425) | |
| Soliciting material pursuant to Rule 14a-12 under the Exchange Act (17 CFR 240.14a-12) | |
| Pre-commencement communications pursuant to Rule 14d-2(b) under the Exchange Act (17 CFR 240.14d-2(b)) | |
| Pre-commencement communications pursuant to Rule 13e-4(c) under the Exchange Act (17 CFR 240.13e-4(c)) |
Indicate
by check mark whether the registrant is an emerging growth company as defined in Rule 405 of the Securities Act of 1933 or Rule 12b-2
of the Securities Act of 1934: Emerging growth company
If any emerging growth company, indicate by check mark if the registrant has elected not to use the extended transition period for complying with any new or revised financial accounting standards provided pursuant to Section 13(a) of the Exchange Act. ☐
Item 2.02 Results of Operations and Financial Condition.
On August 9, 2022, Harrow Health, Inc. (the “Company”) issued a press release and a letter to stockholders announcing its financial results for the period ended June 30, 2022 and an update on recent corporate events. The press release and letter to stockholders are being furnished as Exhibits 99.1 and 99.2, respectively, to this Current Report on Form 8-K.
Item 7.01. Regulation FD Disclosure
Attached as Exhibit 99.3 to this Current Report on Form 8-K is a presentation of the Company that may be used by the management of the Company at investor conferences and at meetings describing the Company.
The information furnished under Items 2.02 and 7.01 of this Current Report on Form 8-K, including Exhibits 99.1, 99.2 and 99.3, shall not be deemed to be “filed” for the purposes of Section 18 of the Securities Exchange Act of 1934, as amended (the “Exchange Act”), or otherwise subject to the liabilities of that Section. The information in Items 2.02 and 7.01, including Exhibits 99.1, 99.2 and 99.3, shall not be deemed incorporated by reference into any filing under the Securities Act of 1933, as amended, or the Exchange Act, except to the extent it is specifically incorporated by reference but regardless of any general incorporation language in such filing.
The information furnished under Items 2.02 and 7.01 of this Current Report on Form 8-K, including Exhibits 99.1, 99.2 and 99.3, shall not be deemed to constitute an admission that such information or exhibit is required to be furnished pursuant to Regulation FD or that such information or exhibit contains material information that is not otherwise publicly available. In addition, the Company does not assume any obligation to update such information or exhibit in the future.
Item 9.01. Financial Statements and Exhibits
| (d) | Exhibits | |
| 99.1 | Press Release issued by Harrow Health, Inc. on August 9, 2022 | |
| 99.2 | Letter to Stockholders by Harrow Health, Inc. dated August 9, 2022 | |
| 99.3 | Harrow Health, Inc. Corporate Presentation dated August 2022 | |
| 104 | Cover Page Interactive Data File (embedded within the Inline XBRL document) |
SIGNATURES
Pursuant to the requirements of the Securities Exchange Act of 1934, the registrant has duly caused this report to be signed on its behalf by the undersigned hereunto duly authorized.
| HARROW HEALTH, INC. | ||
| Dated: August 9, 2022 | By: | /s/ Andrew R. Boll |
| Name: | Andrew R. Boll | |
| Title: | Chief Financial Officer | |
EXHIBIT 99.1

Harrow Health Announces Second Quarter 2022 Financial Results
Revenues Increase for Eighth Consecutive Quarter
Highlights for Second Quarter 2022:
| ● | Record revenues of $23.3 million, up 29% over $18.1 million for the prior-year quarter | |
| ● | Record gross profit of $16.8 million, up 22% over $13.7 million for the prior-year quarter | |
| ● | A record 718,000 product units shipped, up 4% from the prior-year quarter | |
| ● | Cash and cash equivalents of $46.4 million as of June 30, 2022 |
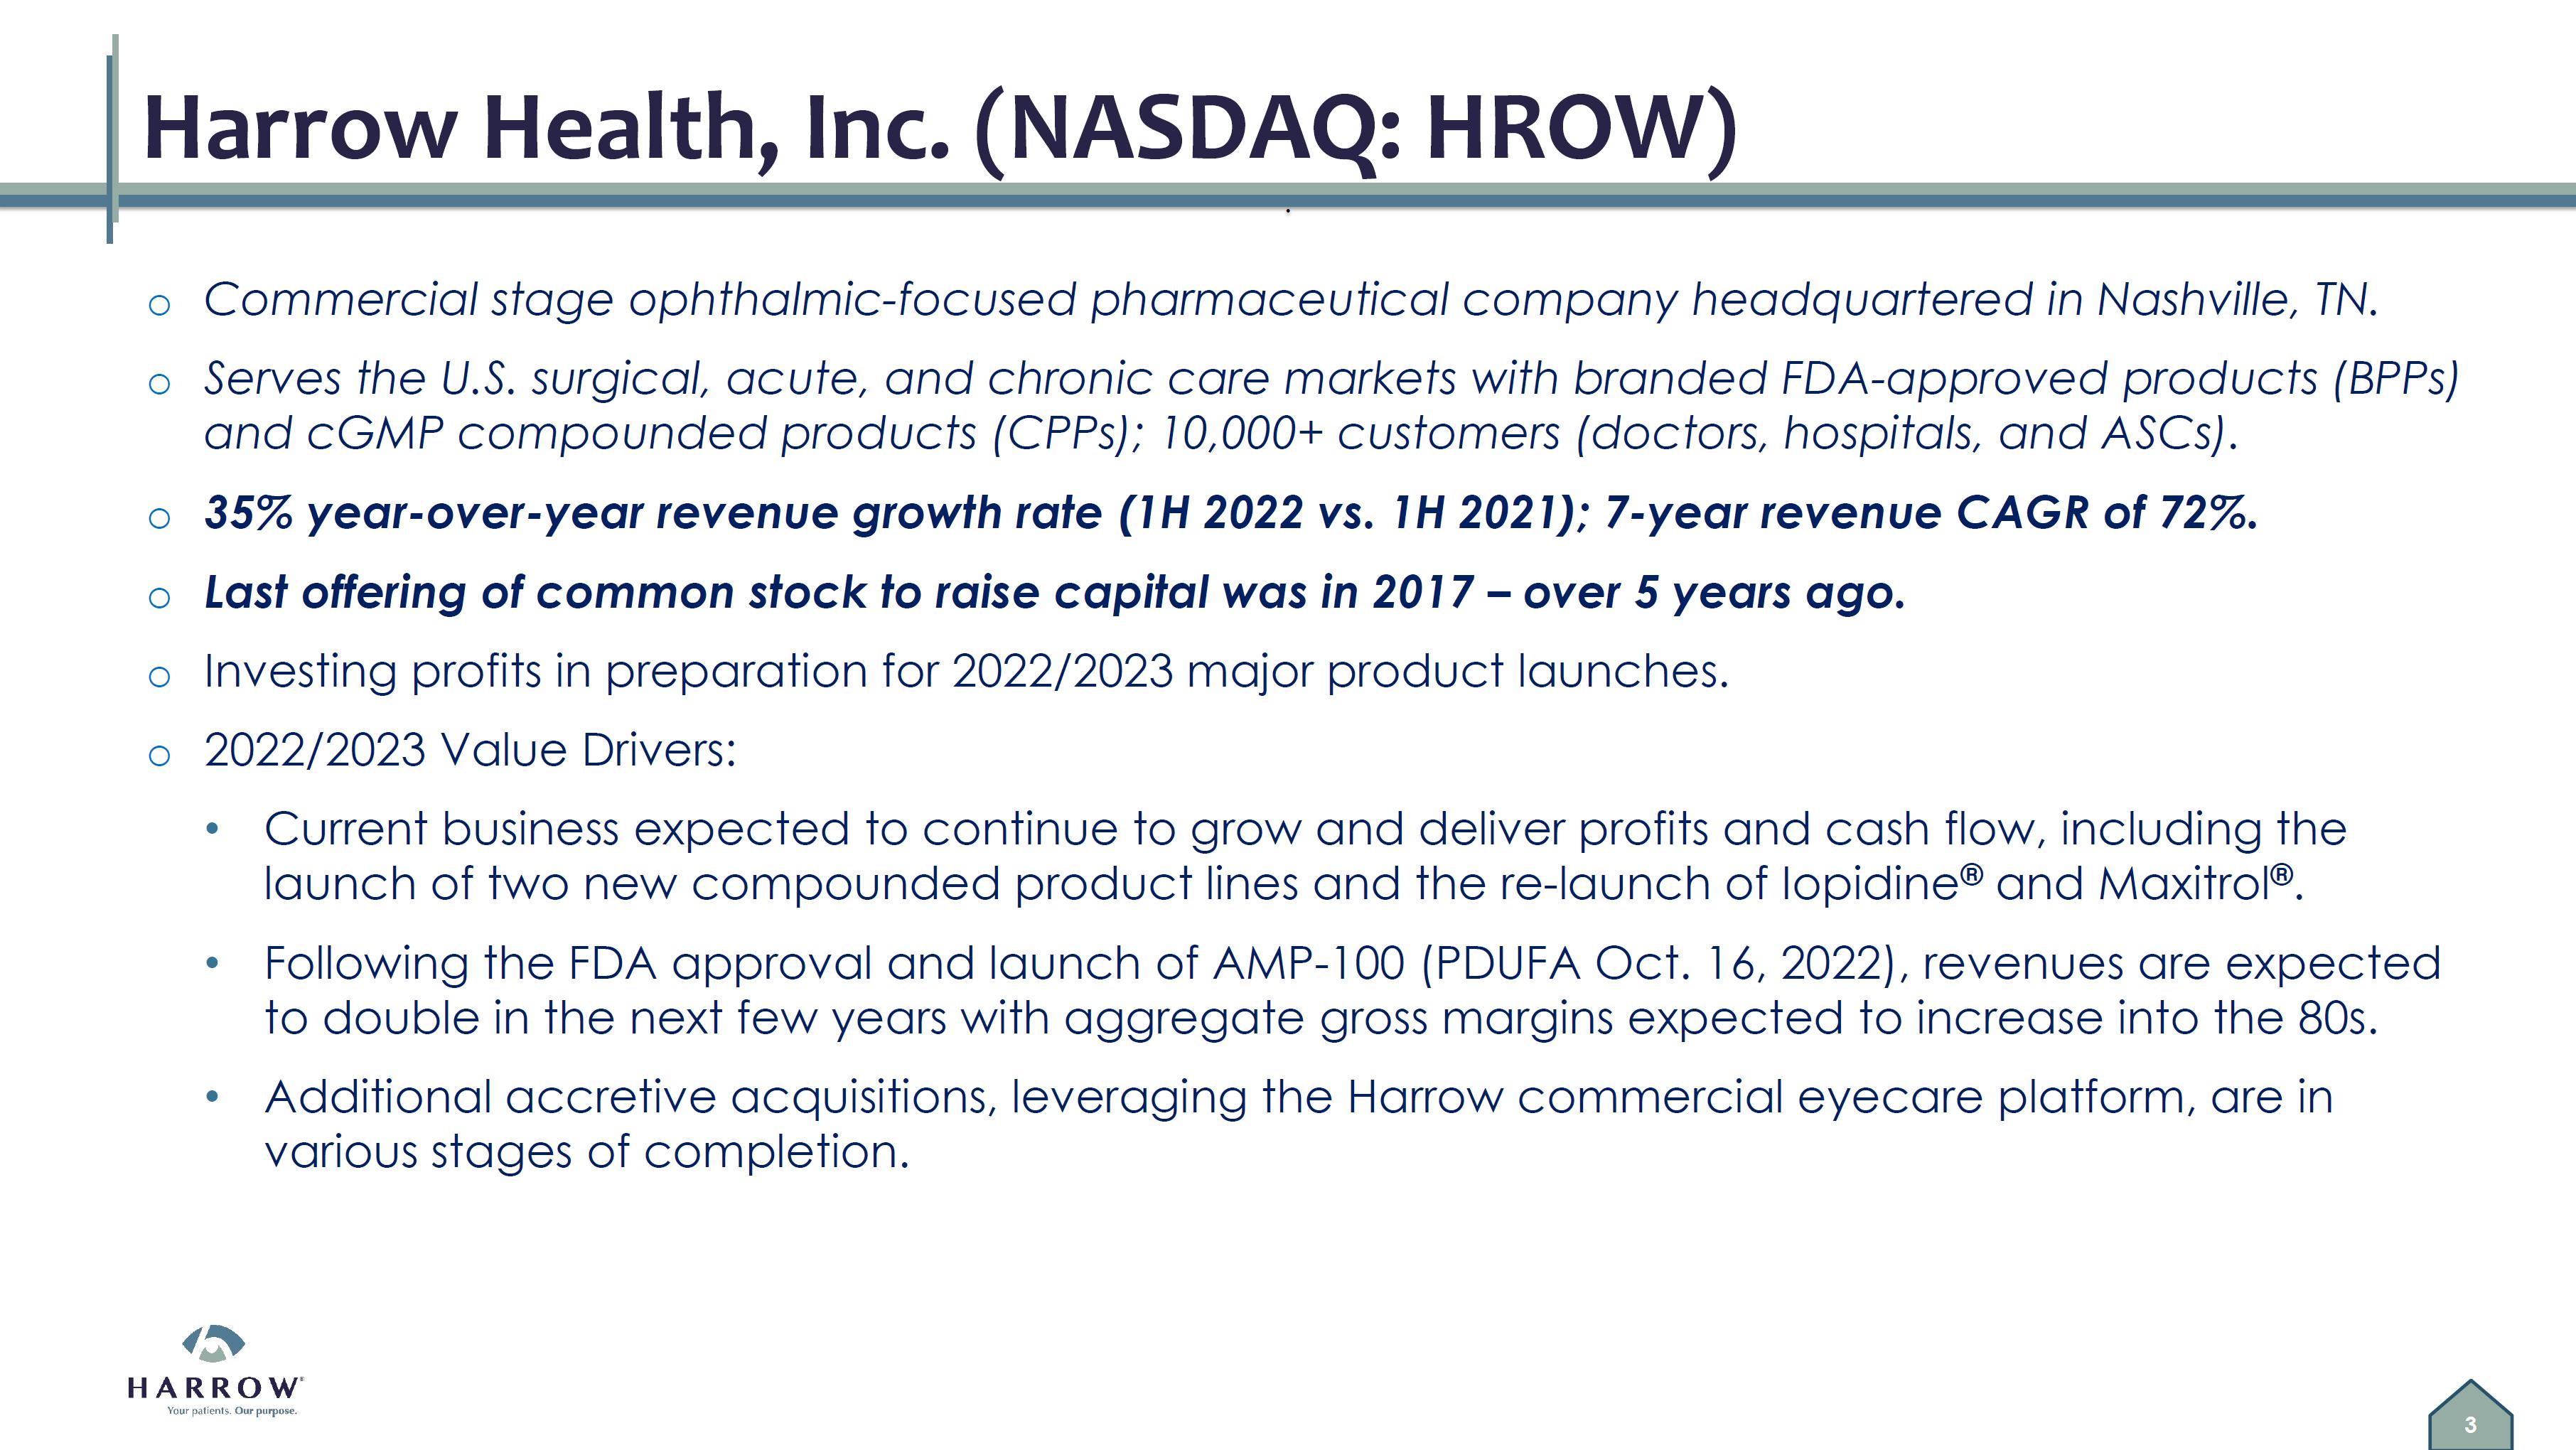
NASHVILLE, Tenn., August 9, 2022 – Harrow Health, Inc. (NASDAQ: HROW), an eyecare pharmaceutical company focused on the development, production, sale, and distribution of innovative ophthalmic prescription medicines, today announced results for the second quarter ended June 30, 2022. The Company also posted its second quarter Letter to Stockholders and corporate presentation to the “Investors” section of its website, harrowinc.com.
“We are pleased with both our financial and operational performance during the second quarter of 2022,” said Mark L. Baum, CEO of Harrow Health. “The second quarter was our eighth consecutive quarter of record results in many of the financial metrics that we track, including total revenues, revenue per shipping day, and total number of product units distributed. From an operational perspective, during the quarter, we continued to focus on ensuring that the Harrow eyecare platform has the infrastructure, systems, resources, and talent needed to execute on the growth that we expect in our compounded pharmaceutical business and new and even more dramatic growth we expect from the continued integration of FDA-approved branded pharmaceutical products into the Harrow platform.
“Our business remains strong, and we believe the second half of 2022 will be a very consequential period for Harrow. We expect several milestone events during the second half, including the PDUFA target action date for AMP-100, a patented ocular surface anesthetic drug candidate, as well as several product launches of compounded formulations. In addition, we continue to be hard at work trying to close transactions, which are at various stages of completion, that we strongly believe will add value to our company in several important ways.”
Second quarter figures of merit:
For the Three Months Ended June 30, | For the Six Months Ended June 30, | |||||||||||||||
| 2022 | 2021 | 2022 | 2021 | |||||||||||||
| Net revenues | $ | 23,323,000 | $ | 18,134,000 | $ | 45,443,000 | $ | 33,577,000 | ||||||||
| Gross margin | 72 | % | 76 | % | 73 | % | 76 | % | ||||||||
| Core gross margin(1) | 73 | % | 76 | % | 74 | % | 76 | % | ||||||||
| Net loss | (6,239,000 | ) | (2,950,000 | ) | (8,677,000 | ) | (2,733,000 | ) | ||||||||
| Core net income(1) | 254,000 | 2,087,000 | 967,000 | 4,531,000 | ||||||||||||
| Adjusted EBITDA(1) | 4,505,000 | 5,698,000 | 9,445,000 | 9,974,000 | ||||||||||||
| Diluted net loss per share | (0.23 | ) | (0.11 | ) | (0.32 | ) | (0.10 | ) | ||||||||
| Core diluted net income per share(1) | 0.01 | 0.07 | 0.04 | 0.16 | ||||||||||||
| (1) | Core gross margin, core net income, core diluted net income per share (collectively, “Core Results”), and Adjusted EBITDA are non-GAAP measures. For additional information, including a reconciliation of such Core Results and Adjusted EBITDA to the most directly comparable measures presented in accordance with GAAP, see the explanation of non-GAAP measures and reconciliation tables at the end of this release. |
| -MORE- |
| HROW Announces Second Quarter 2022 Financial Results |
| Page 2 |
| August 9, 2022 |
Conference Call and Webcast
The Company’s management team will host a conference call and live webcast today at 4:45 p.m. Eastern Time to discuss the second quarter results and provide a business update. To participate in the call, see details below:
| Conference Call Details: | ||
| Date: | Tuesday, August 9, 2022 | |
| Time: | 4:45 p.m. Eastern time | |
| Participant Dial-in: | 1-833-953-2434 (U.S.) 1-412-317-5763 (International) | |
Replay Dial-in (Passcode 8466369): (telephonic replay through August 16, 2022) |
1-877-344-7529 (U.S.) 1-412-317-0088 (International) | |
| Webcast: (online replay through November 9, 2022) | harrowinc.com |
About Harrow Health
Harrow Health, Inc. (Nasdaq: HROW) is an eyecare pharmaceutical company focused on the development, production, sale, and distribution of innovative ophthalmic prescription medications that are accessible and affordable. For more information about Harrow Health, please visit the Investors section of the corporate website, harrowinc.com.
Forward-Looking Statements
This press release contains “forward-looking statements” within the meaning of the U.S. Private Securities Litigation Reform Act of 1995. Any statements in this release that are not historical facts may be considered such “forward-looking statements.” Forward-looking statements are based on management’s current expectations and are subject to risks and uncertainties which may cause results to differ materially and adversely from the statements contained herein. Some of the potential risks and uncertainties that could cause actual results to differ from those predicted include the continued impact of the COVID-19 pandemic and any future health epidemics on our financial condition, liquidity and results of operations; our ability to make commercially available our FDA-approved products and compounded formulations and technologies in a timely manner or at all; market acceptance of the Company’s products and challenges related to the marketing of the Company’s products; risks related to our pharmacy operations; our ability to enter into other strategic alliances, including arrangements with pharmacies, physicians and healthcare organizations for the development and distribution of our products; our ability to obtain intellectual property protection for our assets; our ability to accurately estimate our expenses and cash burn, and raise additional funds when necessary; risks related to research and development activities; the projected size of the potential market for our technologies and products; unexpected new data, safety and technical issues; regulatory and market developments impacting compounding pharmacies, outsourcing facilities and the pharmaceutical industry; competition; and market conditions. These and additional risks and uncertainties are more fully described in Harrow Health’s filings with the Securities and Exchange Commission, including its Annual Report on Form 10-K and its Quarterly Reports on Form 10-Q. Such documents may be read free of charge on the SEC’s web site at www.sec.gov. Undue reliance should not be placed on forward-looking statements, which speak only as of the date they are made. Except as required by law, Harrow Health undertakes no obligation to update any forward-looking statements to reflect new information, events, or circumstances after the date they are made, or to reflect the occurrence of unanticipated events.
Contact:
Jamie Webb, Director of Communications and Investor Relations
615-733-4737
| -MORE- |
| HROW Announces Second Quarter 2022 Financial Results |
| Page 3 |
| August 9, 2022 |
HARROW HEALTH, INC.
CONDENSED CONSOLIDATED BALANCE SHEETS
June 30, 2022 | December 31, 2021 | |||||||
| (unaudited) | ||||||||
| ASSETS | ||||||||
| Cash and cash equivalents | $ | 46,438,000 | $ | 42,167,000 | ||||
| All other current assets | 18,265,000 | 18,495,000 | ||||||
| Total current assets | 64,703,000 | 60,662,000 | ||||||
| All other assets | 33,359,000 | 37,667,000 | ||||||
| TOTAL ASSETS | $ | 98,062,000 | $ | 98,329,000 | ||||
| LIABILITIES AND STOCKHOLDERS’ EQUITY | ||||||||
| Current liabilities | $ | 12,922,000 | $ | 9,722,000 | ||||
| Senior April 2026 Notes, net of discount | 72,042,000 | 71,654,000 | ||||||
| All other liabilities | 7,704,000 | 6,022,000 | ||||||
| TOTAL LIABILITIES | 92,668,000 | 87,398,000 | ||||||
| TOTAL STOCKHOLDERS’ EQUITY | 5,394,000 | 10,931,000 | ||||||
| TOTAL LIABILITIES AND STOCKHOLDERS’ EQUITY | $ | 98,062,000 | $ | 98,329,000 | ||||
| -MORE- |
| HROW Announces Second Quarter 2022 Financial Results |
| Page 4 |
| August 9, 2022 |
HARROW HEALTH, INC.
UNAUDITED CONDENSED CONSOLIDATED STATEMENTS OF OPERATIONS
| For the Three Months Ended June 30, | For the Six Months Ended June 30, | |||||||||||||||
| 2022 | 2021 | 2022 | 2021 | |||||||||||||
| Total revenues | $ | 23,323,000 | $ | 18,134,000 | $ | 45,443,000 | $ | 33,577,000 | ||||||||
| Cost of sales | 6,534,000 | 4,417,000 | 12,497,000 | 8,187,000 | ||||||||||||
| Gross profit | 16,789,000 | 13,717,000 | 32,946,000 | 25,390,000 | ||||||||||||
| Selling, general and administrative | 14,185,000 | 9,123,000 | 27,583,000 | 17,287,000 | ||||||||||||
| Research and development | 914,000 | 425,000 | 1,572,000 | 1,017,000 | ||||||||||||
| Total operating expenses | 15,099,000 | 9,548,000 | 29,155,000 | 18,304,000 | ||||||||||||
| Income from operations | 1,690,000 | 4,169,000 | 3,791,000 | 7,086,000 | ||||||||||||
| Total other expense, net | 7,889,000 | 6,647,000 | 12,428,000 | 9,347,000 | ||||||||||||
| Income taxes | 40,000 | - | 40,000 | - | ||||||||||||
| Net loss attributable to Harrow Health, Inc. | (6,239,000 | ) | (2,478,000 | ) | (8,677,000 | ) | (2,261,000 | ) | ||||||||
| Preferred dividends and accretion of preferred stock discount | - | (472,000 | ) | - | (472,000 | ) | ||||||||||
| Net loss attributable to Harrow Health, Inc. common stockholders | $ | (6,239,000 | ) | $ | (2,950,000 | ) | $ | (8,677,000 | ) | $ | (2,733,000 | ) | ||||
| Net loss per share of common stock, basic and diluted | $ | (0.23 | ) | $ | (0.11 | ) | $ | (0.32 | ) | $ | (0.10 | ) | ||||
| -MORE- |
| HROW Announces Second Quarter 2022 Financial Results |
| Page 5 |
| August 9, 2022 |
HARROW HEALTH, INC.
UNAUDITED CONDENSED CONSOLIDATED STATEMENTS OF CASH FLOW
| For the Six Months Ended June 30, | ||||||||
| 2022 | 2021 | |||||||
| Net cash provided by (used in): | ||||||||
| Operating activities | $ | 5,827,000 | $ | 8,648,000 | ||||
| Investing activities | (669,000 | ) | 8,445,000 | |||||
| Financing activities | (887,000 | ) | 51,457,000 | |||||
| Net change in cash and cash equivalents | 4,271,000 | 68,550,000 | ||||||
| Cash, cash equivalents and restricted cash at beginning of the period | 42,167,000 | 4,301,000 | ||||||
| Cash, cash equivalents and restricted cash at end of the year | $ | 46,438,000 | $ | 72,851,000 | ||||
| -MORE- |
| HROW Announces Second Quarter 2022 Financial Results |
| Page 6 |
| August 9, 2022 |
Non-GAAP Financial Measures
In addition to the Company’s results of operations determined in accordance with U.S. generally accepted accounting principles (GAAP), which are presented and discussed above, management also utilizes Adjusted EBITDA and Core Results, unaudited financial measures that are not calculated in accordance with GAAP, to evaluate the Company’s financial results and performance and to plan and forecast future periods. Adjusted EBITDA and Core Results are considered “non-GAAP” financial measures within the meaning of Regulation G promulgated by the SEC. Management believes that these non-GAAP financial measures reflect an additional way of viewing aspects of the Company’s operations that, when viewed with GAAP results, provide a more complete understanding of the Company’s results of operations and the factors and trends affecting its business. Management believes Adjusted EBITDA and Core Results provide meaningful supplemental information regarding the Company’s performance because (i) they allow for greater transparency with respect to key metrics used by management in its financial and operational decision-making; (ii) they exclude the impact of non-cash or, when specified, non-recurring items that are not directly attributable to the Company’s core operating performance and that may obscure trends in the Company’s core operating performance; and (iii) they are used by institutional investors and the analyst community to help analyze the Company’s results. However, Adjusted EBITDA, Core Results, and any other non-GAAP financial measures should be considered as a supplement to, and not as a substitute for, or superior to, the corresponding measures calculated in accordance with GAAP. Further, non-GAAP financial measures used by the Company and the way they are calculated may differ from the non-GAAP financial measures or the calculations of the same non-GAAP financial measures used by other companies, including the Company’s competitors.
Adjusted EBITDA
The Company defines Adjusted EBITDA as net (loss) income attributable to Harrow Health, Inc., excluding the effects of stock-based compensation and expenses, interest, taxes, depreciation, amortization, investment loss, net, gain or forgiveness of debt, and, if any and when specified, other non-recurring income or expense items. Management believes that the most directly comparable GAAP financial measure to Adjusted EBITDA is net (loss) income attributable to Harrow Health, Inc. Adjusted EBITDA has limitations and should not be considered as an alternative to gross profit or net (loss) income as a measure of operating performance or to net cash provided by (used in) operating, investing, or financing activities as a measure of ability to meet cash needs.
The following is a reconciliation of Adjusted EBITDA, a non-GAAP measure, to the most comparable GAAP measure, net (loss) income, for the three months ended June 30, 2022, and for the same period in 2021:
HARROW HEALTH, INC.
RECONCILIATION OF NET (LOSS) INCOME TO ADJUSTED EBITDA
| For the Three Months Ended June 30, | ||||||||
| 2022 | 2021 | |||||||
| GAAP net (loss) income | $ | (6,239,000 | ) | $ | (2,478,000 | ) | ||
| Stock-based compensation and expenses | 1,993,000 | 1,078,000 | ||||||
| Interest expense, net | 1,794,000 | 1,314,000 | ||||||
| Income taxes | 40,000 | - | ||||||
| Depreciation and amortization | 424,000 | 412,000 | ||||||
| Amortization of intangible assets | 398,000 | 39,000 | ||||||
| Investment loss, net | 6,095,000 | 4,526,000 | ||||||
| Other expense, net | - | 807,000 | (1) | |||||
| Adjusted EBITDA | $ | 4,505,000 | $ | 5,698,000 | ||||
| (1) | Includes $756,000 for early extinguishment of loan. |
| -MORE- |
| HROW Announces Second Quarter 2022 Financial Results |
| Page 7 |
| August 9, 2022 |
Core Results
Harrow Health Core Results, including core gross margin, core net income, core operating income, core EPS (basic and diluted), and core operating margin, exclude all amortization and impairment charges of intangible assets, excluding software development costs, net gains and losses on investments and equity securities, including equity method gains and losses and equity valued at fair value through profit and loss (“FVPL”), preferred stock dividends, and gains/losses on forgiveness of debt. In other periods, Core Results may also exclude fair value adjustments of financial assets in the form of options to acquire a company carried at FVPL, obligations related to product recalls, certain acquisition related items, the integration and divestment related income and expenses, divestment gains and losses, restructuring charges/releases and related items, legal related items, gains/losses on early extinguishment of debt or debt modifications, impairments of property, plant and equipment and software, as well as income and expense items that management deems exceptional and that are or are expected to accumulate within the year to be over a $100,000 threshold.
The following is a reconciliation of Core Results, a non-GAAP measure, to the most comparable GAAP measure for the three and six months ended June 30, 2022, and for the same period in 2021:
| For the Three Months Ended June 30, 2022 | ||||||||||||||||
GAAP Results | Amortization of Certain Intangible Assets | Investment Losses | Core Results | |||||||||||||
| Gross profit | $ | 16,789,000 | $ | 341,000 | $ | - | $ | 17,130,000 | ||||||||
| Gross margin | 72 | % | 73 | % | ||||||||||||
| Operating income | 1,690,000 | 398,000 | - | 2,088,000 | ||||||||||||
| (Loss) income before taxes | (6,199,000 | ) | 398,000 | 6,095,000 | 294,000 | |||||||||||
| Taxes | (40,000 | ) | - | - | (40,000 | ) | ||||||||||
| Net (loss) income | (6,239,000 | ) | 398,000 | 6,095,000 | 254,000 | |||||||||||
| Basic (loss) earnings per share ($)(1) | (0.23 | ) | 0.01 | |||||||||||||
| Diluted (loss) earnings per share ($)(1) | (0.23 | ) | 0.01 | |||||||||||||
| Weighted average number of shares of common stock outstanding, basic | 27,303,458 | 27,303,458 | ||||||||||||||
| Weighted average number of shares of common stock outstanding, diluted | 27,303,458 | 28,234,177 | ||||||||||||||
| For the Six Months Ended June 30, 2022 | ||||||||||||||||
GAAP Results | Amortization of Certain Intangible Assets | Investment Losses | Core Results | |||||||||||||
| Gross profit | $ | 32,946,000 | $ | 682,000 | $ | - | $ | 33,628,000 | ||||||||
| Gross margin | 73 | % | 74 | % | ||||||||||||
| Operating income | 3,791,000 | 802,000 | - | 4,593,000 | ||||||||||||
| (Loss) Income before taxes | (8,637,000 | ) | 802,000 | 8,842,000 | 1,007,000 | |||||||||||
| Taxes | (40,000 | ) | - | - | (40,000 | ) | ||||||||||
| Net (loss) income | (8,677,000 | ) | 802,000 | 8,842,000 | 967,000 | |||||||||||
| Basic (loss) earnings per share ($)(1) | (0.32 | ) | 0.04 | |||||||||||||
| Diluted (loss) earnings per share ($)(1) | (0.32 | ) | 0.03 | |||||||||||||
| Weighted average number of shares of common stock outstanding, basic | 27,265,350 | 27,265,350 | ||||||||||||||
| Weighted average number of shares of common stock outstanding, diluted | 27,265,350 | 28,270,639 | ||||||||||||||
| -MORE- |
| HROW Announces Second Quarter 2022 Financial Results |
| Page 8 |
| August 9, 2022 |
| For the Three Months Ended June 30, 2021 | ||||||||||||||||||||
GAAP Results | Amortization of Certain Intangible Assets | Investment Losses | Other Items | Core Results | ||||||||||||||||
| Gross profit | $ | 13,717,000 | $ | - | $ | - | $ | - | $ | 13,717,000 | ||||||||||
| Gross margin | 76 | % | - | 76 | % | |||||||||||||||
| Operating income | 4,169,000 | 39,000 | - | - | 4,208,000 | |||||||||||||||
| (Loss) income before taxes | (2,478,000 | ) | 39,000 | 4,526,000 | - | 2,087,000 | ||||||||||||||
| Taxes | - | - | - | - | - | |||||||||||||||
| Net (loss) income attributable to common stockholders | (2,950,000 | ) | 39,000 | 4,526,000 | 472,000 | 2,087,000 | ||||||||||||||
| Basic (loss) earnings per share ($)(1) | (0.11 | ) | 0.06 | |||||||||||||||||
| Diluted (loss) earnings per share ($)(1) | (0.11 | ) | 0.07 | |||||||||||||||||
| Weighted average number of shares of common stock outstanding, basic | 26,736,970 | 26,736,970 | ||||||||||||||||||
| Weighted average number of shares of common stock outstanding, diluted | 26,736,970 | 28,309,490 | ||||||||||||||||||
| For the Six Months Ended June 30, 2021 | ||||||||||||||||||||
GAAP Results | Amortization of Certain Intangible Assets | Investment Losses | Other Items | Core Results | ||||||||||||||||
| Gross profit | $ | 25,390,000 | $ | - | $ | - | $ | - | $ | 25,390,000 | ||||||||||
| Gross margin | 76 | % | 76 | % | ||||||||||||||||
| Operating income | 7,086,000 | 79,000 | - | - | 7,165,000 | |||||||||||||||
| (Loss) Income before taxes | (2,261,000 | ) | 79,000 | 6,713,000 | - | 4,531,000 | ||||||||||||||
| Taxes | - | - | - | - | - | |||||||||||||||
| Net (loss) income attributable to common stockholders | (2,733,000 | ) | 79,000 | 6,713,000 | 472,000 | 4,531,000 | ||||||||||||||
| Basic (loss) earnings per share ($)(1) | (0.10 | ) | 0.15 | |||||||||||||||||
| Diluted (loss) earnings per share ($)(1) | (0.10 | ) | 0.16 | |||||||||||||||||
| Weighted average number of shares of common stock outstanding, basic | 26,379,943 | 26,379,943 | ||||||||||||||||||
| Weighted average number of shares of common stock outstanding, diluted | 26,379,943 | 27,914,254 | ||||||||||||||||||
| (1) | Core basic earnings per share is calculated using the weighted-average number of shares of common stock outstanding during the period. Core diluted earnings per share also contemplates dilutive shares associated with equity-based awards and warrants as described in Note 2 and elsewhere in the Condensed Consolidated Interim Financial Statements filed with the Company’s Quarterly Report on Form 10-Q for the quarterly period ended June 30, 2022. |
| -END- |
EXHIBIT 99.2

Letter to Stockholders
August 9, 2022
Dear Harrow Stockholders:
Today I was delighted to report our eighth consecutive quarter of record financial results, including the addition of nearly $5 million in new cash generated from operations, making the cash position on our balance sheet at the end of the second quarter a total of more than $46 million. Our business remains strong, and as I will discuss, I believe the second half of 2022 will be a very consequential period for Harrow.
At the beginning of 2022, the Harrow leadership team developed a Five-Year Strategic Plan that included an ambitious list of operational and financial goals that we believed, if achieved, would transform Harrow into a leading U.S. eyecare company. Our plan included leveraging our strong U.S. market position by investing some of our profits into the Harrow eyecare platform, which includes our large, growing, and loyal customer base, production and distribution capabilities for our innovative family of products, and information technology that seamlessly knits the platform together. Our objective was to better serve our customers with new and high-value pharmaceutical products, including our market-leading compounded pharmaceutical products (CPPs) and branded pharmaceuticals products (BPPs). Our formal and anecdotal market research confirmed that Harrow’s customers wanted access to such a platform, and that is what we are working to deliver.
I’ll talk more about our execution of our Five-Year Strategic Plan later, but first, let’s go over our second quarter financial results.
Second Quarter Core Results
Beginning in 2022, we began providing additional non-GAAP financial metrics – Core Results, which we define as the after-tax earnings and other operational and financial metrics generated from our principal business.
For the Three Months Ended June 30, | For the Six Months Ended June 30, | |||||||||||||||
| 2022 | 2021 | 2022 | 2021 | |||||||||||||
| Net revenues | $ | 23,323,000 | $ | 18,134,000 | $ | 45,443,000 | $ | 33,577,000 | ||||||||
| Gross margin | 72 | % | 76 | % | 73 | % | 76 | % | ||||||||
| Core gross margin(1) | 73 | % | 76 | % | 74 | % | 76 | % | ||||||||
| Net loss | (6,239,000 | ) | (2,950,000 | ) | (8,677,000 | ) | (2,733,000 | ) | ||||||||
| Core net income(1) | 254,000 | 2,087,000 | 967,000 | 4,531,000 | ||||||||||||
| Adjusted EBITDA(1) | 4,505,000 | 5,698,000 | 9,445,000 | 9,974,000 | ||||||||||||
| Diluted net loss per share | (0.23 | ) | (0.11 | ) | (0.32 | ) | (0.10 | ) | ||||||||
| Core diluted net income per share(1) | 0.01 | 0.07 | 0.04 | 0.16 | ||||||||||||
| (1) | Core gross margin, core net income, core diluted net income per share (collectively, “Core Results”), and Adjusted EBITDA are non-GAAP measures. For additional information, including a reconciliation of such Core Results and Adjusted EBITDA to the most directly comparable measures presented in accordance with GAAP, see the explanation of non-GAAP measures and reconciliation tables at the end of this Letter to Stockholders. |
| Page 1 of 11 |
Financial Highlights and Key Metrics
Revenues of $23.3 million for the second quarter of 2022 represent our eighth consecutive quarter of record revenues, a 29% increase over prior-year revenues of $18.1 million as well as a 5% sequential increase over revenues for the first quarter of 2022.
Our second quarter revenues included the transfer of profits from sales of IOPIDINE® and MAXITROL® from the prior owner for the majority of the second quarter, with the transfer of the New Drug Applications (NDAs) from these products to Harrow being completed in mid-June. We then successfully re-launched IOPIDINE and MAXITROL under the Harrow umbrella and recorded our first revenues from sales of these products before the end of the second quarter.
Second quarter sales of DEXYCU®, which is sold under a Commercial Alliance Agreement between Harrow and EyePoint Pharmaceuticals, decreased slightly over the prior quarter due to a decrease in the product’s average sales price (ASP). This is a trend that we expect to continue throughout the remainder of the year following the July 15, 2022, issuance of CMS’ Proposed CY 2023 Payment Rule for Hospital Outpatient Services and Ambulatory Surgery Centers (ASCs). Based on the summary in the proposed rule, DEXYCU will no longer qualify as a separately payable product in an ASC or outpatient setting and will instead be bundled into the general cataract procedure code effective January 1, 2023, when the Final Rule, if approved as currently proposed, will go into effect. We do not expect the status of DEXYCU to materially affect our business, and any decrease in our revenues related to DEXYCU commissions should be replaced by products Harrow currently sells as well as anticipated organic and inorganic growth anticipated during 2023.
Revenue per shipping day was a record $364,000 in the second quarter of 2022, a 4% sequential increase over the first quarter of 2022.
The total product units distributed was approximately 718,000 for the second quarter of 2022, a 4% sequential increase over the first quarter of 2022 and another distribution record for our company.
Core gross margin was 73% in the second quarter of 2022 compared with core gross margin of 76% in the prior-year second quarter. Gross margins during the second quarter period were affected, in part, by a one-time partial inventory purge at our New Jersey facility. We do not expect such events to occur again, and therefore believe core gross margin should float back to recent historical levels and beyond in the coming quarters as more of our revenue is expected to come from BPPs.
Selling, general and administrative expenses for the second quarter of 2022 increased to $14.2 million over the prior-year quarter’s $9.1 million, largely as a result of our initiatives to add key talent, support the transition and implementation of recently acquired branded products, increased expenses associated with the expansion of our commercial activities, and increased stock-based compensation associated with performance (market-based vesting) stock units that were granted in July 2021.
Research and development costs increased to $914,000 in the second quarter of 2022, compared with $425,000 in the prior-year quarter. This increase was primarily the result of increased costs associated with the clinical programs for AMP-100 and MAQ-100 and program fees associated with IOPIDINE.
GAAP operating income was $1.7 million for the second quarter of 2022, compared with $4.2 million during the same period last year.
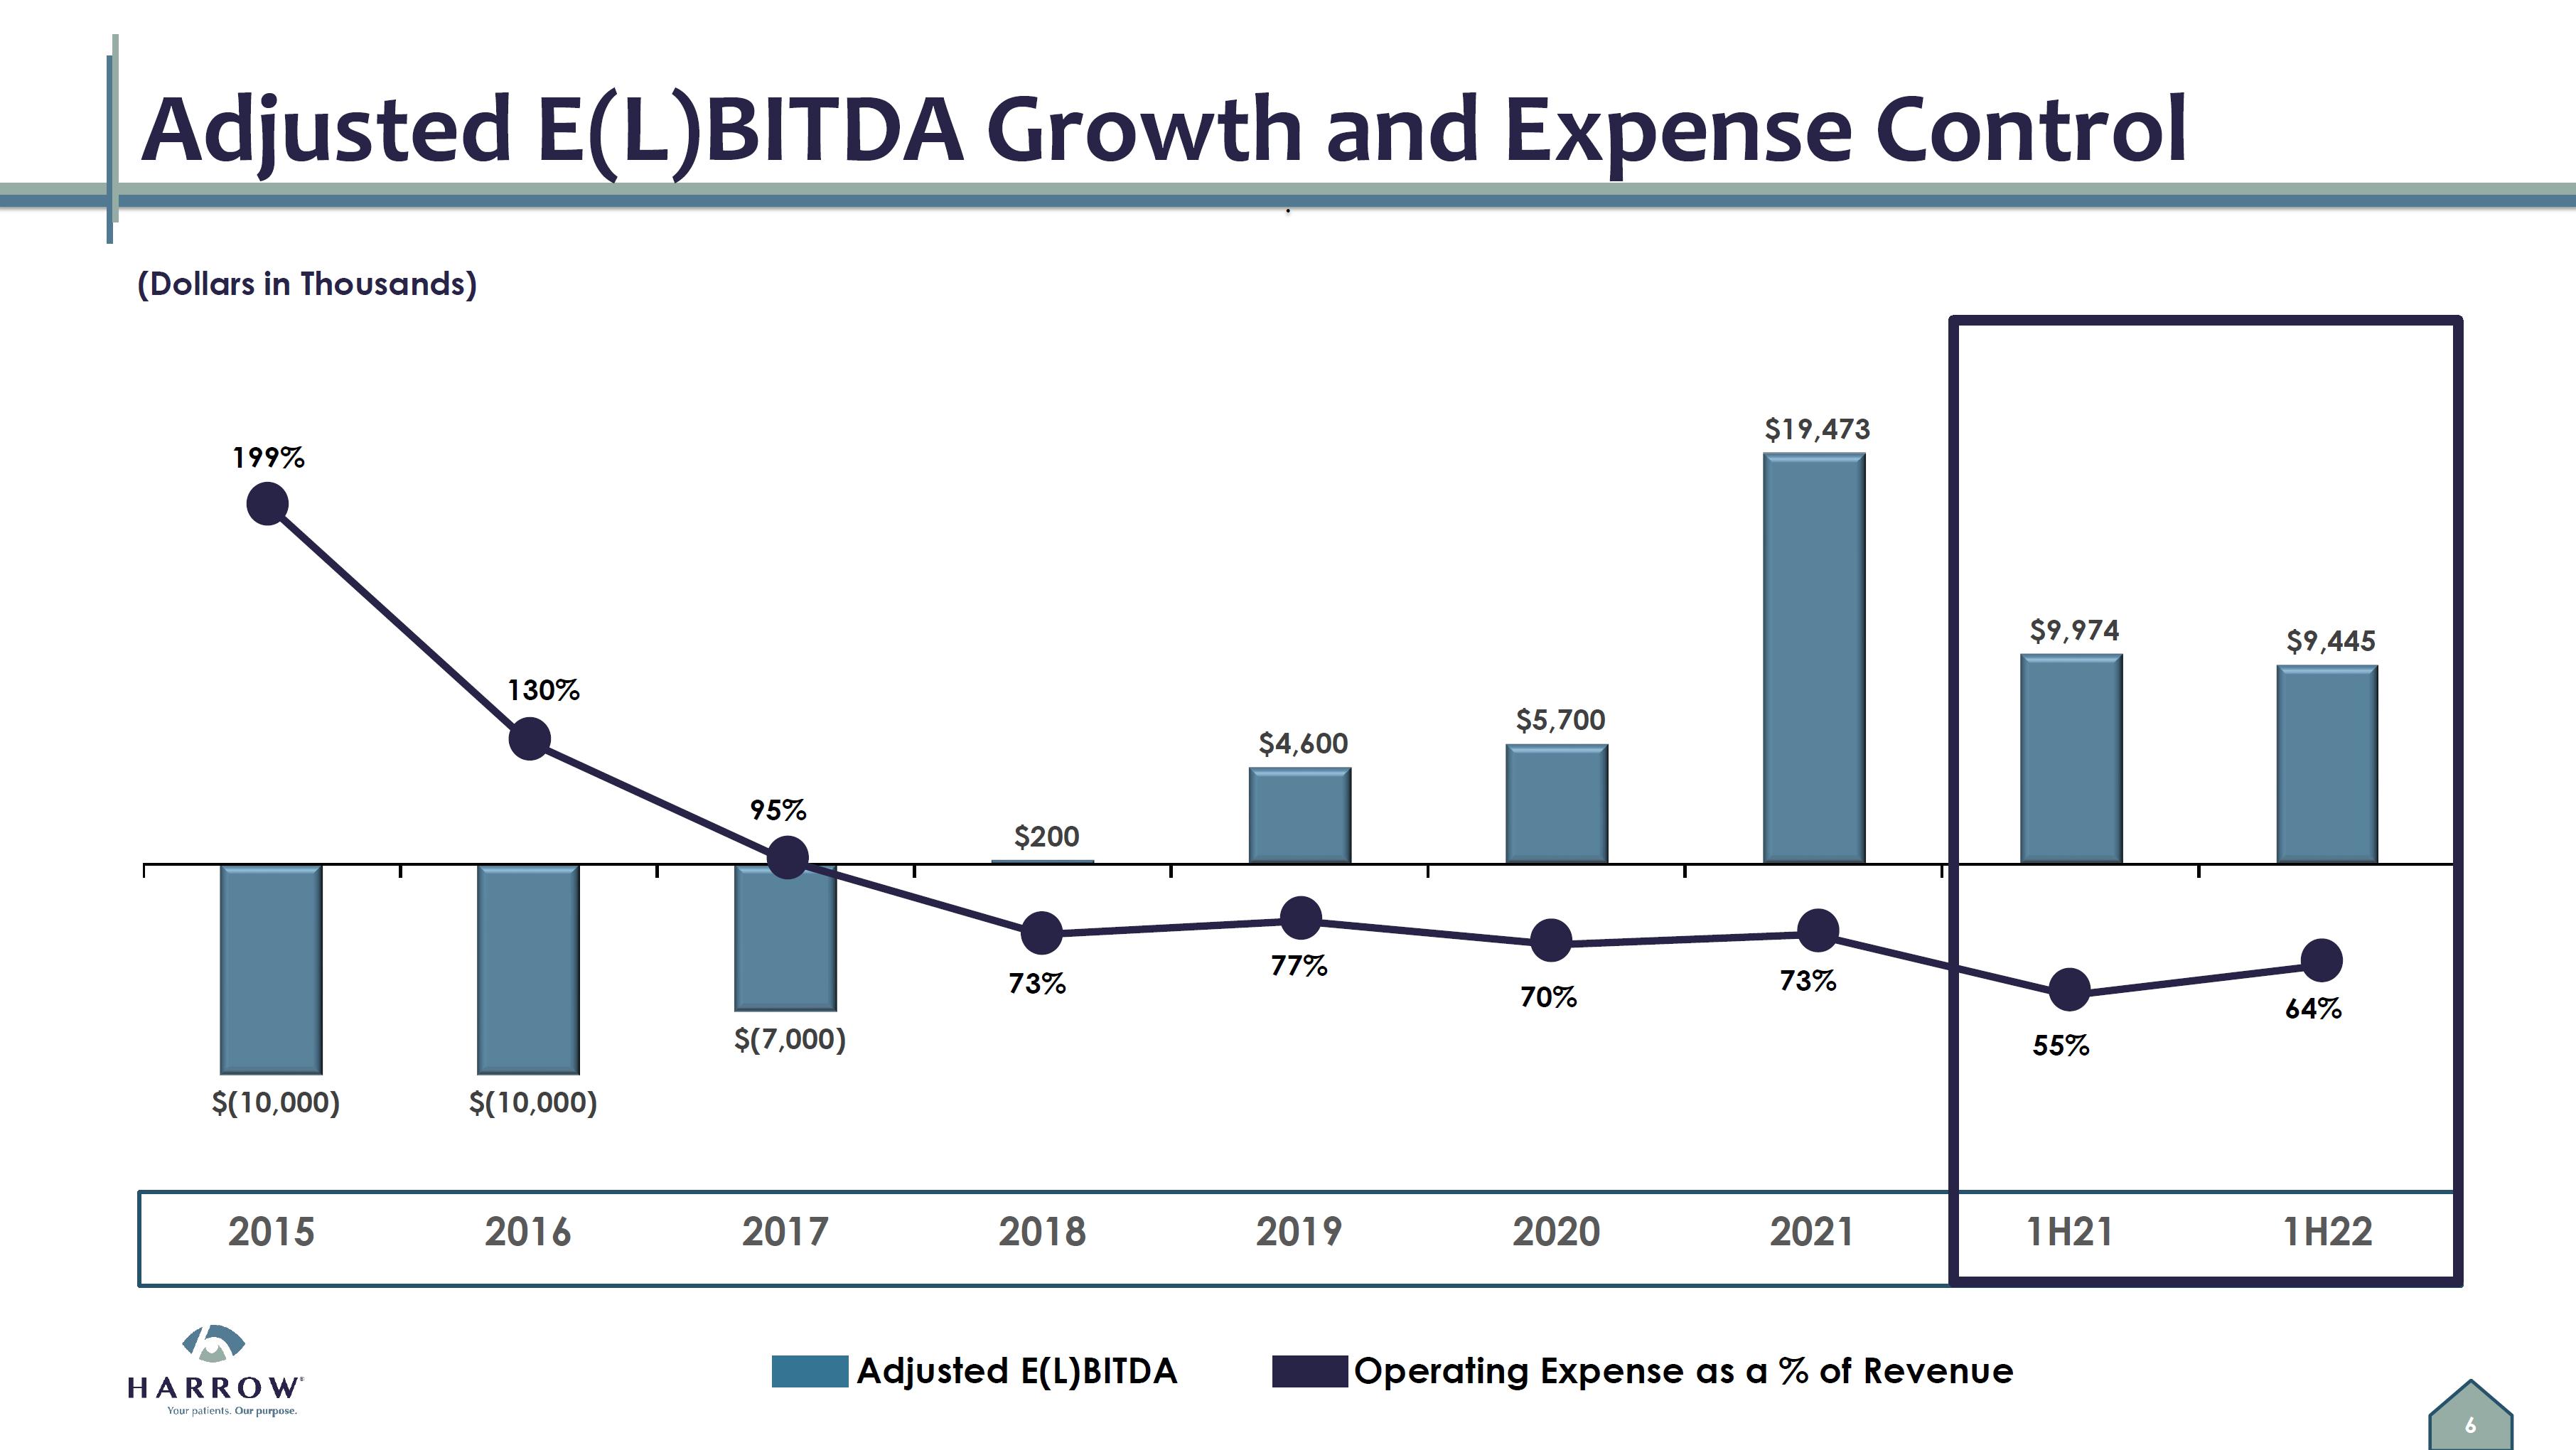
Adjusted EBITDA was $4.5 million for the second quarter of 2022 compared with Adjusted EBITDA of $5.7 million reported in the prior-year quarter. Core net income was $254,000 for the second quarter of 2022 compared with core net income of $1.6 million in the second quarter of 2021.
| Page 2 of 11 |
Core diluted net income per share for the second quarter of 2022 was $0.01 compared with $0.06 during the same period last year.
A reconciliation of all non-GAAP financial measures in this letter begins on page 7.
Selected highlights regarding GAAP operating results for the three months and six months ended June 30, 2022, and for the same periods in 2021 are as follows:
For the Three Months Ended June 30, | For the Six Months Ended June 30, | |||||||||||||||
| 2022 | 2021 | 2022 | 2021 | |||||||||||||
| Total revenues | $ | 23,323,000 | $ | 18,134,000 | $ | 45,443,000 | $ | 33,577,000 | ||||||||
| Cost of sales | 6,534,000 | 4,417,000 | 12,497,000 | 8,187,000 | ||||||||||||
| Gross profit | 16,789,000 | 13,717,000 | 32,946,000 | 25,390,000 | ||||||||||||
| Selling, general and administrative | 14,185,000 | 9,123,000 | 27,583,000 | 17,287,000 | ||||||||||||
| Research and development | 914,000 | 425,000 | 1,572,000 | 1,017,000 | ||||||||||||
| Total operating expenses | 15,099,000 | 9,548,000 | 29,155,000 | 18,304,000 | ||||||||||||
| Income from operations | 1,690,000 | 4,169,000 | 3,791,000 | 7,086,000 | ||||||||||||
| Total other expense, net | 7,889,000 | 6,647,000 | 12,428,000 | 9,347,000 | ||||||||||||
| Income taxes | 40,000 | - | 40,000 | - | ||||||||||||
Net loss attributable to Harrow Health, Inc. | (6,239,000 | ) | (2,478,000 | ) | (8,677,000 | ) | (2,261,000 | ) | ||||||||
| Preferred dividends and accretion of preferred stock discount | - | (472,000 | ) | - | (472,000 | ) | ||||||||||
Net loss attributable to Harrow Health, Inc. common stockholders | $ | (6,239,000 | ) | $ | (2,950,000 | ) | $ | (8,677,000 | ) | $ | (2,733,000 | ) | ||||
| Net loss per share of common stock, basic and diluted | $ | (0.23 | ) | $ | (0.11 | ) | $ | (0.32 | ) | $ | (0.10 | ) | ||||
| Page 3 of 11 |
Growth is the Plan
I previously referred to our Five-Year Strategic Plan, which was created, in part, to ensure that the Harrow eyecare platform has the infrastructure, systems, resources, and talent needed to execute on the growth we expect in our CPP business and new and even more dramatic revenue growth we expect from the integration of FDA-approved BPPs into the Harrow platform.
These investments we are making, as well as other operational moves we intend to make, are consistent with what I first disclosed and referred to in my 4Q20 Stockholders’ Letters as the “next major phase of growth for Harrow.” As we proceed, the Harrow management team is committed to having our platform ready and able to sustain the growth we expect, in keeping with our Five-Year Strategic Plan.
As a stockholder myself, I believe these are but a few items my fellow stockholders should be particularly excited about:
| ● | In late September, we expect to launch a new and exciting compounded formulation at the upcoming American Academy of Ophthalmology (AAO) meeting in Chicago. This will be a premium-priced, patent-pending product that we’ve been working on for several years and that we believe could fill a large unmet need for acute sight-threatening needs in ophthalmology and optometry practices across the country. We hope we can visit with some of our stockholders at the AAO meeting and discuss this exciting new product launch. | |
| ● | Following our October 16th PDUFA target action date for AMP-100, a patented ocular surface anesthetic drug candidate, we expect to begin commercialization activities in furtherance of an expected launch at or around the time of the American Society of Cataract and Refractive Surgery (ASCRS) meeting in San Diego in May of 2023. | |
| We are very excited about the potential we see to offer our customers a completely new ocular anesthesia solution for the broad ocular procedures category, including cataract surgery and intravitreal injections. Our market research has validated that there are massively diverse approaches to ocular anesthesia, with doctors using different active pharmaceutical ingredients at different time intervals during these procedures. We believe AMP-100 has the potential to provide ophthalmologists with a market-differentiated, reimbursable – unifying solution – to anesthesia and intra-procedure pain. It should go without saying that as we achieve success in educating doctors about AMP-100’s clinical benefits, this will in turn lead to success in growing our revenues and profits. | ||
| We believe that the U.S. market AMP-100 could impact exceeds 12 million procedures annually, and it’s a market that we already serve, in part, in a significant way with other products. | ||
| ● | On August 4, 2022, we had a successful Type B meeting with the FDA on our MAQ-100 program, during which the FDA provided clarity on what would be required in a future NDA filing for MAQ-100. We are currently awaiting the release of the FDA’s minutes from the meeting, as well as the completion of additional discussions with our Japanese manufacturing partner, but we remain optimistic we will be able to efficiently advance this program as we had intended. | |
| ● | Later this year, we expect to launch yet another new, patent-pending, chronic care suite of compounded formulations that address a large and growing market in the United States. This is a family of products that we have been working on for many years, that we have, over the past year or so, had positive market acceptance testing with, and that we are excited to make more broadly available soon. | |
| ● | Last, but certainly not least, we are hard at work trying to close transactions, which are at various stages of completion, that we strongly believe will add value to our company in several important ways. |
| Page 4 of 11 |
Investments and Royalties
Harrow owns non-controlling equity positions in Surface Ophthalmics, Melt Pharmaceuticals, and Eton Pharmaceuticals, companies founded as Harrow subsidiaries before being deconsolidated into independent and separately managed companies.
| ● | We own approximately 3.5 million shares of Surface Ophthalmics common stock or about 20% of the outstanding equity interests. Surface is focused on ocular surface disease, specifically dry eye disease. The U.S. market for dry eye disease is large and growing and importantly, continues to be underserved by the current weak array of available FDA-approved products. Harrow also owns royalty rights on all three active Surface drug development programs: |
SURF-100 for Chronic Dry Eye Disease
| ○ | Surface completed its 350-patient Phase 2 clinical trial, comparing five active arms of SURF-100 study drugs with the current market-leading prescription chronic dry eye treatments, Xiidra® and Restasis®. | ||
| ○ | Based on the SURF-100 Phase 2 clinical trial results, which exceeded our expectations, we believe Surface possesses a clinically superior medicine relative to all currently approved drugs and known data from drug candidates in development, for the highly underserved chronic dry eye disease market. We also believe that Surface has distinguished itself in its SURF-100 trial design, going up against the market leaders, and the success in doing so should translate meaningfully, from a commercial perspective, as Surface or other parties interested in Surface consider the impact of the SURF-100 program. |
SURF-200 for Acute Dry Eye
| ○ | Surface has completed enrollment of its Phase 2 clinical trial and expects to announce top-line results later this year. |
SURF-201 for Pain and Inflammation Following Ocular Surgery
| ○ | Surface reported that its Phase 2 SURF-201 study, with twice-daily dosing, met the primary endpoints of absence of inflammation at both Day 8 and Day 15, and was found to be safe and well-tolerated by the patient group. In addition, a secondary endpoint showed almost 90% of patients given SURF-201 were pain free at Day 15. |
| ● | We own approximately 3.5 million shares of Melt Pharmaceuticals common stock or about 46% of the outstanding equity interests. We also own a $13.5 million senior secured note receivable from Melt and royalty rights on its flagship drug candidate, MELT-300. |
| ○ | We believe MELT-300, a patented non-opioid sublingually delivered sedation and analgesia drug candidate, has the potential to transform the way U.S. cataract surgery patients are sedated. In addition, Melt’s drug candidates and related patented technologies may have a broader application that goes beyond ophthalmic surgery and for a global market. | ||
| ○ | Melt began enrolling patients in a Phase 2 efficacy study of MELT-300 during the fourth quarter of 2021. Melt has enrolled more than 200 patients out of 350 in the MELT-300 program and expects to report top-line clinical results in the fourth quarter of 2022. |
| ● | We own just under 2.0 million shares of common stock of Eton Pharmaceuticals (Nasdaq: ETON), an orphan drug-focused pharmaceutical company. We continue to be excited about our investment in Eton and its focus on orphan drugs, and we believe in its mission. |
| Page 5 of 11 |
Closing
We are growing Harrow the “old-fashioned way.” We are committed to steady growth, making great pharmaceutical products that we can make a respectable profit on, that are ordered and reordered by customers who appreciate the tremendous value we bring to them and their patients. We focus on an area of healthcare – eyecare – in which we have considerable expertise and experience, and our agile and creative approach to serving our customers allows us to maintain a competitive advantage. While we are quite proud of what we have accomplished to date, we know that our story is just beginning.
Though we are focused on growth and profitability, we remain committed to our corporate values, producing attractive profits for stockholders by using the Harrow eyecare platform as a growth engine that we believe will bear fruit for all its constituents for many years to come.
As always, I want to express my gratitude to all members of the Harrow Family for their hard work and dedication which has led us to this important time in our company’s history. I also want to thank ALL my fellow stockholders for the confidence you have shown in us. We realize that investing in smaller market capitalization companies can be challenging, so we aim to be as transparent as possible. I assure you that your investment in Harrow is a responsibility that every member of the Harrow Family takes very seriously, and we appreciate your continued confidence and support.
I look forward to updating you on our accomplishments and progress in my next Letter to Stockholders in November of 2022.
Sincerely,
Mark L. Baum
Founder, Chief Executive Officer, and Chairman of the Board
Nashville, Tennessee
| Page 6 of 11 |
FORWARD-LOOKING STATEMENTS
Management’s remarks in this stockholder letter include forward-looking statements within the meaning of federal securities laws. Forward-looking statements are subject to numerous risks and uncertainties, many of which are beyond Harrow Health’s control, including risks and uncertainties described from time to time in its SEC filings, such as the risks and uncertainties related to the Company’s ability to make commercially available its FDA-approved products and compounded formulations and technologies, and FDA approval of certain drug candidates in a timely manner or at all.
For a list and description of those risks and uncertainties, please see the “Risk Factors” section of the Company’s Annual Report on Form 10-K, Quarterly Reports on Form 10-Q, and other filings with the SEC.
Harrow Health’s results may differ materially from those projected. Harrow disclaims any intention or obligation to update or revise any financial projections or forward-looking statements whether because of new information, future events or otherwise. This stockholder letter contains time-sensitive information and is accurate only as of today.
Additionally, Harrow Health refers to non-GAAP financial measures, specifically Adjusted EBITDA, adjusted earnings, core gross margin, core net income and core diluted net income per share. A reconciliation of non-GAAP measures with the most directly comparable GAAP measures is included in this letter.
No compounded formulation is FDA-approved. All compounded formulations are customizable. Other than drugs compounded at a registered outsourcing facility, all compounded formulations require a prescription for an individually identified patient consistent with federal and state laws.
All trademarks, service marks and trade names included or referenced in this publication are the property of their respective owners.
Non-GAAP Financial Measures
In addition to the Company’s results of operations determined in accordance with U.S. generally accepted accounting principles (GAAP), which are presented and discussed above, management also utilizes Adjusted EBITDA and Core Results, unaudited financial measures that are not calculated in accordance with GAAP, to evaluate the Company’s financial results and performance and to plan and forecast future periods. Adjusted EBITDA and Core Results are considered “non-GAAP” financial measures within the meaning of Regulation G promulgated by the SEC. Management believes that these non-GAAP financial measures reflect an additional way of viewing aspects of the Company’s operations that, when viewed with GAAP results, provide a more complete understanding of the Company’s results of operations and the factors and trends affecting its business. Management believes Adjusted EBITDA and Core Results provide meaningful supplemental information regarding the Company’s performance because (i) they allow for greater transparency with respect to key metrics used by management in its financial and operational decision-making; (ii) they exclude the impact of non-cash or, when specified, non-recurring items that are not directly attributable to the Company’s core operating performance and that may obscure trends in the Company’s core operating performance; and (iii) they are used by institutional investors and the analyst community to help analyze the Company’s results. However, Adjusted EBITDA, Core Results, and any other non-GAAP financial measures should be considered as a supplement to, and not as a substitute for, or superior to, the corresponding measures calculated in accordance with GAAP. Further, non-GAAP financial measures used by the Company and the way they are calculated may differ from the non-GAAP financial measures or the calculations of the same non-GAAP financial measures used by other companies, including the Company’s competitors.
| Page 7 of 11 |
Adjusted EBITDA
The Company defines Adjusted EBITDA as net (loss) income attributable to Harrow Health, Inc., excluding the effects of stock-based compensation and expenses, interest, taxes, depreciation, amortization, investment loss, net, gain or forgiveness of debt, and, if any and when specified, other non-recurring income or expense items. Management believes that the most directly comparable GAAP financial measure to Adjusted EBITDA is net (loss) income attributable to Harrow Health, Inc. Adjusted EBITDA has limitations and should not be considered as an alternative to gross profit or net (loss) income as a measure of operating performance or to net cash provided by (used in) operating, investing, or financing activities as a measure of ability to meet cash needs.
The following is a reconciliation of Adjusted EBITDA, a non-GAAP measure, to the most comparable GAAP measure, net (loss) income, for the three months ended June 30, 2022, and for the same period in 2021:
For the Three Months Ended June 30, | ||||||||
| 2022 | 2021 | |||||||
| GAAP net (loss) income | $ | (6,239,000 | ) | $ | (2,478,000 | ) | ||
| Stock-based compensation and expenses | 1,993,000 | 1,078,000 | ||||||
| Interest expense, net | 1,794,000 | 1,314,000 | ||||||
| Income taxes | 40,000 | - | ||||||
| Depreciation and amortization | 424,000 | 412,000 | ||||||
| Amortization of intangible assets | 398,000 | 39,000 | ||||||
| Investment loss, net | 6,095,000 | 4,526,000 | ||||||
| Other expense, net | - | 807,000 | (1) | |||||
| Adjusted EBITDA | $ | 4,505,000 | $ | 5,698,000 | ||||
| (1) | Includes $756,000 for early extinguishment of loan. |
| Page 8 of 11 |
Core Results
Harrow Health Core Results, including core gross margin, core net income, core operating income, core EPS (basic and diluted), and core operating margin, exclude all amortization and impairment charges of intangible assets, excluding software development costs, net gains and losses on investments and equity securities, including equity method gains and losses and equity valued at fair value through profit and loss (“FVPL”), preferred stock dividends, and gains/losses on forgiveness of debt. In other periods, Core Results may also exclude fair value adjustments of financial assets in the form of options to acquire a company carried at FVPL, obligations related to product recalls, certain acquisition related items, the integration and divestment related income and expenses, divestment gains and losses, restructuring charges/releases and related items, legal related items, gains/losses on early extinguishment of debt or debt modifications, impairments of property, plant and equipment and software, as well as income and expense items that management deems exceptional and that are or are expected to accumulate within the year to be over a $100,000 threshold.
The following is a reconciliation of Core Results, a non-GAAP measure, to the most comparable GAAP measure for the three and six months ended June 30, 2022, and for the same period in 2021:
| For the Three Months Ended June 30, 2022 | ||||||||||||||||
GAAP Results | Amortization of Certain Intangible Assets | Investment Losses | Core Results | |||||||||||||
| Gross profit | $ | 16,789,000 | $ | 341,000 | $ | - | $ | 17,130,000 | ||||||||
| Gross margin | 72 | % | 73 | % | ||||||||||||
| Operating income | 1,690,000 | 398,000 | - | 2,088,000 | ||||||||||||
| (Loss) income before taxes | (6,199,000 | ) | 398,000 | 6,095,000 | 294,000 | |||||||||||
| Taxes | (40,000 | ) | - | - | (40,000 | ) | ||||||||||
| Net (loss) income | (6,239,000 | ) | 398,000 | 6,095,000 | 254,000 | |||||||||||
| Basic (loss) earnings per share ($)(1) | (0.23 | ) | 0.01 | |||||||||||||
| Diluted (loss) earnings per share ($)(1) | (0.23 | ) | 0.01 | |||||||||||||
| Weighted average number of shares of common stock outstanding, basic | 27,303,458 | 27,303,458 | ||||||||||||||
| Weighted average number of shares of common stock outstanding, diluted | 27,303,458 | 28,234,177 | ||||||||||||||
| For the Six Months Ended June 30, 2022 | ||||||||||||||||
GAAP Results | Amortization of Certain Intangible Assets | Investment Losses | Core Results | |||||||||||||
| Gross profit | $ | 32,946,000 | $ | 682,000 | $ | - | $ | 33,628,000 | ||||||||
| Gross margin | 73 | % | 74 | % | ||||||||||||
| Operating income | 3,791,000 | 802,000 | - | 4,593,000 | ||||||||||||
| (Loss) Income before taxes | (8,637,000 | ) | 802,000 | 8,842,000 | 1,007,000 | |||||||||||
| Taxes | (40,000 | ) | - | - | (40,000 | ) | ||||||||||
| Net (loss) income | (8,677,000 | ) | 802,000 | 8,842,000 | 967,000 | |||||||||||
| Basic (loss) earnings per share ($)(1) | (0.32 | ) | 0.04 | |||||||||||||
| Diluted (loss) earnings per share ($)(1) | (0.32 | ) | 0.03 | |||||||||||||
| Weighted average number of shares of common stock outstanding, basic | 27,265,350 | 27,265,350 | ||||||||||||||
| Weighted average number of shares of common stock outstanding, diluted | 27,265,350 | 28,270,639 | ||||||||||||||
| Page 9 of 11 |
| For the Three Months Ended June 30, 2021 | ||||||||||||||||||||
GAAP Results | Amortization of Certain Intangible Assets | Investment Losses | Other Items | Core Results | ||||||||||||||||
| Gross profit | $ | 13,717,000 | $ | - | $ | - | $ | - | $ | 13,717,000 | ||||||||||
| Gross margin | 76 | % | - | 76 | % | |||||||||||||||
| Operating income | 4,169,000 | 39,000 | - | - | 4,208,000 | |||||||||||||||
| (Loss) income before taxes | (2,478,000 | ) | 39,000 | 4,526,000 | - | 2,087,000 | ||||||||||||||
| Taxes | - | - | - | - | - | |||||||||||||||
| Net (loss) income attributable to common stockholders | (2,950,000 | ) | 39,000 | 4,526,000 | 472,000 | 2,087,000 | ||||||||||||||
Basic (loss) earnings per share ($)(1) | (0.11 | ) | 0.06 | |||||||||||||||||
Diluted (loss) earnings per share ($)(1) | (0.11 | ) | 0.07 | |||||||||||||||||
| Weighted average number of shares of common stock outstanding, basic | 26,736,970 | 26,736,970 | ||||||||||||||||||
| Weighted average number of shares of common stock outstanding, diluted | 26,736,970 | 28,309,490 | ||||||||||||||||||
| For the Six Months Ended June 30, 2021 | ||||||||||||||||||||
GAAP Results | Amortization of Certain Intangible Assets | Investment Losses | Other Items | Core Results | ||||||||||||||||
| Gross profit | $ | 25,390,000 | $ | - | $ | - | $ | - | $ | 25,390,000 | ||||||||||
| Gross margin | 76 | % | 76 | % | ||||||||||||||||
| Operating income | 7,086,000 | 79,000 | - | - | 7,165,000 | |||||||||||||||
| (Loss) Income before taxes | (2,261,000 | ) | 79,000 | 6,713,000 | - | 4,531,000 | ||||||||||||||
| Taxes | - | - | - | - | - | |||||||||||||||
| Net (loss) income attributable to common stockholders | (2,733,000 | ) | 79,000 | 6,713,000 | 472,000 | 4,531,000 | ||||||||||||||
Basic (loss) earnings per share ($)(1) | (0.10 | ) | 0.15 | |||||||||||||||||
Diluted (loss) earnings per share ($)(1) | (0.10 | ) | 0.16 | |||||||||||||||||
| Weighted average number of shares of common stock outstanding, basic | 26,379,943 | 26,379,943 | ||||||||||||||||||
| Weighted average number of shares of common stock outstanding, diluted | 26,379,943 | 27,914,254 | ||||||||||||||||||
| (1) | Core basic earnings per share is calculated using the weighted-average number of shares of common stock outstanding during the period. Core diluted earnings per share also contemplates dilutive shares associated with equity-based awards and warrants as described in Note 2 and elsewhere in the Condensed Consolidated Interim Financial Statements filed with the Company’s Quarterly Report on Form 10-Q for the quarterly period ended June 30, 2022. |
| Page 10 of 11 |
Investment Portfolio
(includes Non-GAAP Values)
| June 30, 2022 | ||||||||
| Company | Number of Shares of Common Stock | Management Estimated Value | ||||||
| Eton Pharmaceuticals | 1,982,000 | $ | 5,192,840 | |||||
| Surface Ophthalmics | 3,500,000 | 15,750,000 | (1) | |||||
| Melt Pharmaceuticals | 3,500,000 | 17,500,000 | (2) | |||||
| Melt Pharmaceuticals – Secured Loan + PIK | - | 14,984,312 | (3) | |||||
| Estimated Total Value | $ | 53,427,152 | ||||||
| (1) | Represents a non-GAAP value, calculated as the purchase and conversion price ($4.50) of the Series A-1 Preferred Stock (the most recent equity offering) multiplied by the number of common shares owned by Harrow at June 30, 2022. |
| (2) | Represents a non-GAAP value, calculated as the purchase and conversion price ($5.00) of the Series A Preferred Stock (the most recent equity offering) multiplied by the number of common shares owned by Harrow at June 30, 2022. |
| (3) | Represents the principal balance owed under the loan agreement including interest paid in kind (or PIK). In accordance with ASC 323, Harrow’s presentation of this loan receivable on its consolidated balance sheet is presented at its carry value less reductions in the carry value related to Harrow’s share of Melt equity losses. |
| Page 11 of 11 |
Exhibit 99.3


Serious News for Serious Traders! Try StreetInsider.com Premium Free!
You May Also Be Interested In
- Share Buyback Transaction Details April 18 – April 24, 2024
- UAB Partnerystės projektai keturi 2023 audited annual report
- SOTI Report Reveals Emergency Care is Suffering Due to 92% of Global Emergency Service Teams Experiencing Mobile Technology Challenges
Create E-mail Alert Related Categories
SEC FilingsSign up for StreetInsider Free!
Receive full access to all new and archived articles, unlimited portfolio tracking, e-mail alerts, custom newswires and RSS feeds - and more!
