

Form 8-K Expensify, Inc. For: Dec 16
 Tweet
Tweet Share
ShareExhibit 99.1
Expensify Announces Third Quarter 2021 Results
Increased revenues 72.6% year-over-year, introduced Free Plan with unparalleled functionality, and announced up to 2% cash back on all Expensify Card spend
PORTLAND, Ore.–(BUSINESS WIRE)–Expensify, Inc. (Nasdaq: EXFY), a payments superapp that helps individuals and businesses around the world simplify the way they manage money across expenses, corporate cards and bills, today announced results for its quarter ended September 30, 2021.
“The biggest news coming out of Q3 was the launch of our Free Plan for SMBs. It offers all the basics of Expensify for free – including corporate cards with up to 2% cash back, reimbursements, bill pay, invoicing, and travel booking – so teams don't have to worry about their back office while they grow their business,” said David Barrett, founder and CEO of Expensify. “We're especially excited to watch our Free Plan spread naturally across organizations as a result of our viral, bottom-up business model and the immense greenfield opportunity that still remains in our target market.”
"We saw strong paid member growth in Q3 as SMBs continue to bounce back from the pandemic, business-wise," said Ryan Schaffer, CFO of Expensify. "Combine that with a 200% year-over-year increase in Expensify Card interchange and we're very confident in our ability to continue executing our long-term vision."
Third Quarter 2021 Highlights
Financial:
•Revenue was $37.4 million, an increase of 72.6% from the same period last year.
•An IPO-related bonus expense of $26.3 million impacted net (loss) income and Adjusted EBITDA.
•Net loss was $(6.3) million, compared to $(6.9) million for the same period last year. This was due to the IPO-related bonus.
◦However, Non-GAAP net income (excluding the IPO-related bonus) was $19.9 million.
•Adjusted EBITDA was $(6.5) million, compared to $7.4 million for the same period last year. The decrease was due to the IPO-related bonus.
◦Adjusted EBITDA excluding the IPO-related bonus was $19.8 million.
•Operating cash flows were $34.6 million.
Business:
•Paid members saw the biggest uptick in Q3 since the onset of the COVID-19 pandemic in March 2020. Average monthly paid members increased to 667 thousand, up from 639 thousand in the previous quarter. This is attributed to an increase in marketing spend and the strengthening of SMBs as lockdown restrictions were lifted.
•In September 2021, Expensify introduced the Free Plan, which allows members to roll out Expensify functionality across their businesses for free. The Expensify Card, expense management, next-day reimbursement, invoicing, bill pay, and travel booking are all included in the Free Plan.
•The Expensify Card continues to perform well. Interchange from the card increased by 207% from the same period last year.
•Cash back, a new Expensify Card benefit, launched in September 2021. Now, all Expensify members can get up to 2% cash back on all purchases using the Expensify Card.
Exhibit 99.1
•Expensify.org selected 62 grassroots organizations as winners of the Community Justice Grant Challenge. All 62 organizations will be reimbursed up to $5,000 each to help fight injustice in their communities. From those 62 organizations, 10 were selected by community vote to be reimbursed up to $25,000 each.
•In line with its continued commitment to ESG principles, Expensify reached carbon neutrality in 2021 and set a goal of Net Zero emissions by 2030.
Financial Outlook
Expensify's outlook statements are based on current expectations. The following statements are forward-looking and actual results could differ materially depending on market conditions and the factors set forth under “Forward-Looking Statements” below.
For the fiscal fourth quarter ending December 31, 2021, Expensify expects:
•Revenue between $38.2 million and $39.2 million.
•Average monthly paid members between 673 thousand and 691 thousand.
Availability of Information on Expensify’s Website
Investors and others should note that Expensify routinely announces material information to investors and the marketplace using SEC filings, press releases, public conference calls, webcasts and the Expensify Investor Relations website at https://ir.expensify.com. While not all of the information that the Company posts to its Investor Relations website is of a material nature, some information could be deemed to be material. Accordingly, the Company encourages investors, the media and others interested in Expensify to review the information that it shares on its Investor Relations website.
Conference Call
Expensify will host a video call to discuss the results at 2:00 p.m. Pacific Time today. The video call information is available on Expensify’s Investor Relations website at https://ir.expensify.com. A replay of the call will be available on the site for three months.
Non-GAAP Financial Measures
In addition to financial measures prepared in accordance with U.S. generally accepted accounting principles (“GAAP”), we provide certain non-GAAP financial measures, including Adjusted EBITDA, Adjusted EBITDA excluding the IPO-related bonus, and Non-GAAP net income.
We believe our non-GAAP financial measures are useful in evaluating our business, measuring our performance, identifying trends affecting our business, formulating business plans and making strategic decisions. Accordingly, we believe that these non-GAAP financial measures provide useful information to investors and others in understanding and evaluating our results of operations in the same manner as our management team. These non-GAAP financial measures are presented for supplemental informational purposes only, should not be considered a substitute for financial information presented in accordance with GAAP, and may be different from similarly titled metrics or measures presented by other companies. Non-GAAP financial measures have limitations as analytical tools and should not be considered in isolation or as substitutes for financial information presented under GAAP. There are a number of limitations related to the use of non-GAAP financial measures versus comparable financial measures determined under GAAP. For example, other companies in our industry may calculate these non-GAAP financial measures differently or may use other measures to evaluate their performance. All of these limitations could reduce the usefulness of these non-GAAP financial measures as analytical tools. Investors are encouraged to review the related GAAP financial measures and the reconciliations of these non-GAAP financial measures to their most directly comparable GAAP financial measures and to not rely on any single financial measure to evaluate our
Exhibit 99.1
business. A reconciliation of each non-GAAP financial measure to the most directly comparable financial measure stated in accordance with GAAP is at the end of this press release.
We define Adjusted EBITDA as net income from operations excluding provision for income taxes, interest and other expenses, net, depreciation and amortization and stock based compensation.
We define Adjusted EBITDA excluding the IPO-related bonus as net income from operations excluding provision for income taxes, interest and other expenses, net, depreciation and amortization, stock based compensation, and IPO-related bonus costs.
We define Non-GAAP net income as GAAP net income excluding the IPO-related bonus costs.
The tables at the end of the Financial Statements provide reconciliations to the most directly comparable GAAP financial measure to each of these non-GAAP financial measures.
Forward-Looking Statements
Forward-looking statements in this press release, which are not historical facts, are forward-looking statements within the meaning of the Private Securities Litigation Reform Act of 1955. These statements include statements regarding our strategy, future financial condition, future operations, projected costs, prospects, plans, objectives of management and expected market growth and involve known and unknown risks that are difficult to predict. As a result, our actual results, performance or achievements may differ materially from those expressed or implied by these forward-looking statements. In some cases, you can identify forward-looking statements because they contain words such as “may,” “will,” “shall,” “should,” “expects,” “plans,” “anticipates,” “could,” “intends,” “target,” “projects,” “contemplates,” “believes,” “estimates,” “predicts,” “potential,” “goal,” “objective,” “seeks,” or “continue” or the negative of these words or other similar terms or expressions that concern our expectations, strategy, plans, or intentions. Such forward-looking statements are necessarily based upon estimates and assumptions that, while considered reasonable by us and our management, are inherently uncertain. Factors that may cause actual results to differ materially from current expectations include, but are not limited to: the effects of the COVID-19 pandemic and the end of the COVID-19 pandemic on our business, results of operations and financial condition, and the global economy generally; our expectations regarding our financial performance and future operating performance; our ability to attract and retain members, expand usage of our platform, sell subscriptions to our platform and convert individuals and organizations into paying customers; the timing and success of new features, integrations, capabilities and enhancements by us, or by competitors to their products, or any other changes in the competitive landscape of our market; the amount and timing of operating expenses and capital expenditures that we may incur to maintain and expand our business and operations to remain competitive; the sufficiency of our cash, cash equivalents and investments to meet our liquidity needs; our ability to make required payments under and to comply with the various requirements of our current and future indebtedness; our ability to effectively manage our exposure to fluctuations in foreign currency exchange rates; the increased expenses associated with being a public company; the size of our addressable markets, market share and market trends; anticipated trends, developments and challenges in our industry, business and the highly competitive markets in which we operate; our expectations regarding our income tax liabilities and the adequacy of our reserves; our ability to effectively manage our growth and expand our infrastructure and maintain our corporate culture; our ability to identify, recruit and retain skilled personnel, including key members of senior management; the safety, affordability and convenience of our platform and our offerings; our ability to successfully defend litigation brought against us; our ability to successfully identify, manage and integrate any existing and potential acquisitions of businesses, talent, technologies or intellectual property; general economic conditions in either domestic or international markets, including the societal and economic impact of the COVID-19 pandemic, and geopolitical uncertainty and instability; our protections against security breaches, technical difficulties, or interruptions to our platform; our ability to maintain, protect and enhance our intellectual property; and other risks discussed in our filings with the SEC. All forward-looking statements attributable to us or persons acting on our behalf are expressly qualified in their entirety by the cautionary statements set forth above. We caution you not to place undue reliance on any forward-looking
Exhibit 99.1
statements, which are made only as of the date of this press release. We do not undertake or assume any obligation to update publicly any of these forward-looking statements to reflect actual results, new information or future events, changes in assumptions or changes in other factors affecting forward-looking statements, except to the extent required by applicable law. If we update one or more forward-looking statements, no inference should be drawn that we will make additional updates with respect to those or other forward-looking statements.
About Expensify
Expensify is a payments superapp that helps individuals and businesses around the world simplify the way they manage money. More than 10 million people use Expensify's free features, which include corporate cards, expense tracking, next-day reimbursement, invoicing, bill pay, and travel booking in one app. All free. Whether you own a small business, manage a team, or close the books for your clients, Expensify makes it easy so you have more time to focus on what really matters.
Investor Relations Contact
Nick Tooker
investors@expensify.com
Press Contact
James Dean
press@expensify.com
Exhibit 99.1
Expensify, Inc.
Consolidated Balance Sheets
(unaudited, in thousands, except share and per share data)
| As of September 30, | As of December 31, | ||||||||||
| 2021 | 2020 | ||||||||||
| Assets | |||||||||||
| Cash and cash equivalents | $ | 68,058 | $ | 34,401 | |||||||
| Accounts receivable, net | 13,608 | 10,024 | |||||||||
| Settlement assets | 25,107 | 14,308 | |||||||||
| Prepaid expenses | 3,813 | 927 | |||||||||
| Related party loan receivable, current | 824 | 600 | |||||||||
| Other current assets | 11,817 | 3,404 | |||||||||
| Total current assets | 123,227 | 63,664 | |||||||||
| Capitalized software, net | 6,607 | 3,722 | |||||||||
| Property and equipment, net | 16,335 | 15,363 | |||||||||
| Lease right-of-use assets | 2,588 | 3,733 | |||||||||
| Deferred tax assets, net | 418 | 418 | |||||||||
| Related party loan receivable, non-current | — | — | |||||||||
| Other assets | 712 | 833 | |||||||||
| Total assets | $ | 149,887 | $ | 87,733 | |||||||
| Liabilities, convertible preferred stock and stockholders' deficit | |||||||||||
| Accounts payable | $ | 1,998 | $ | 2,328 | |||||||
| Accrued expenses and other liabilities | 23,200 | 3,535 | |||||||||
| Borrowings under line of credit | 15,000 | 15,000 | |||||||||
| Current portion of long-term debt, net of issuance costs | 547 | 2,454 | |||||||||
| Lease liabilities, current | 1,540 | 1,575 | |||||||||
| Settlement liabilities | 25,007 | 14,308 | |||||||||
| Total current liabilities | 67,292 | 39,200 | |||||||||
| Lease liabilities, non-current | 1,192 | 2,350 | |||||||||
| Deferred tax liabilities, net | 916 | 916 | |||||||||
| Other liabilities | 405 | 877 | |||||||||
| Long-term debt, net of issuance costs | 52,093 | 30,321 | |||||||||
| Total liabilities | 121,898 | 73,664 | |||||||||
| Commitments and contingencies (Note 12) | |||||||||||
Convertible preferred stock, par value $0.0001; 4,203,139 shares authorized, issued and outstanding at September 30, 2021 and December 31, 2020 (aggregate liquidation preference of $24,929,457 at September 30, 2021 and December 31, 2020 | 45,105 | 45,105 | |||||||||
| Stockholders' deficit: | |||||||||||
Common stock, par value $0.0001; 95,000,000 shares authorized: 36,240,800 and 29,366,940 shares issued and outstanding at September 30, 2021 and December 31, 2020 respectively | — | — | |||||||||
| Additional paid-in capital | 27,416 | 21,312 | |||||||||
Subscriptions receivable (including accrued interest of $0) | (513) | — | |||||||||
| Accumulated deficit | (44,019) | (52,348) | |||||||||
| Total stockholders' deficit | (17,116) | (31,036) | |||||||||
| Total liabilities, convertible preferred stock and stockholders' deficit | $ | 149,887 | $ | 87,733 | |||||||
Exhibit 99.1
Expensify, Inc.
Consolidated Statements of Income
(unaudited, in thousands, except share and per share data)
| Three months ended September 30, | Nine months ended September 30, | ||||||||||||||||||||||
| 2021 | 2020 | 2021 | 2020 | ||||||||||||||||||||
| Revenue | $ | 37,447 | $ | 21,694 | $ | 102,471 | $ | 62,335 | |||||||||||||||
| Cost of revenue, net | 18,197 | 8,443 | 33,768 | 23,881 | |||||||||||||||||||
| Gross margin | 19,250 | 13,251 | 68,703 | 38,454 | |||||||||||||||||||
| Operating expenses: | |||||||||||||||||||||||
| Research and development | 2,167 | 2,268 | 8,138 | 4,645 | |||||||||||||||||||
| General and administrative | 18,333 | 14,579 | 35,827 | 24,717 | |||||||||||||||||||
| Sales and marketing | 7,608 | 1,491 | 14,555 | 7,814 | |||||||||||||||||||
| Total operating expenses | 28,108 | 18,338 | 58,520 | 37,176 | |||||||||||||||||||
| (Loss) income from operations | (8,858) | (5,087) | 10,183 | 1,278 | |||||||||||||||||||
| Interest and other expenses, net | (1,054) | (646) | (2,560) | (2,160) | |||||||||||||||||||
| (Loss) income before income taxes | (9,912) | (5,733) | 7,623 | (882) | |||||||||||||||||||
| Benefit (provision) for income taxes | 3,567 | (1,205) | 706 | (2,570) | |||||||||||||||||||
| Net (loss) income | $ | (6,345) | $ | (6,938) | $ | 8,329 | $ | (3,452) | |||||||||||||||
| Less: income allocated to participating securities | — | — | (5,625) | — | |||||||||||||||||||
| Net (loss) income attributable to common stockholders | $ | (6,345) | $ | (6,938) | $ | 2,704 | $ | (3,452) | |||||||||||||||
| Net (loss) income per share attributable to common stockholders: | |||||||||||||||||||||||
| Basic | $ | (0.18) | $ | (0.25) | $ | 0.09 | $ | (0.13) | |||||||||||||||
| Diluted | $ | (0.18) | $ | (0.25) | $ | 0.07 | $ | (0.13) | |||||||||||||||
| Weighted-average shares of common stock used to compute net (loss) income per share attributable to common stockholders: | |||||||||||||||||||||||
| Basic | 34,490,860 | 27,951,536 | 31,301,387 | 27,095,925 | |||||||||||||||||||
| Diluted | 34,490,860 | 27,951,536 | 41,452,880 | 27,095,925 | |||||||||||||||||||
Exhibit 99.1
Expensify, Inc.
Consolidated Statements of Cash Flows
(unaudited, in thousands)
| Nine months ended September 30, | |||||||||||
| 2021 | 2020 | ||||||||||
| Cash flows from operating activities: | |||||||||||
| Net income (loss) | $ | 8,329 | $ | (3,452) | |||||||
| Adjustments to reconcile net income (loss) to net cash provided (used) by operating activities: | |||||||||||
| Depreciation and amortization | 3,732 | 2,353 | |||||||||
| Reduction of operating lease right-of-use assets | 552 | 1,120 | |||||||||
| Loss on impairment, receivables and sale or disposal of equipment | 283 | 91 | |||||||||
| Stock-based compensation | 2,495 | 12,951 | |||||||||
| Amortization of debt issuance costs | 23 | 24 | |||||||||
| Deferred tax assets | — | 2,304 | |||||||||
| Changes in assets and liabilities: | |||||||||||
| Accounts receivable | (3,865) | (229) | |||||||||
| Related party loan receivables | (224) | — | |||||||||
| Settlement assets | (3,344) | 312 | |||||||||
| Prepaid expenses | (2,886) | (291) | |||||||||
| Other current assets | 1,212 | (934) | |||||||||
| Other assets | 120 | (287) | |||||||||
| Accounts payable | (330) | (1,563) | |||||||||
| Accrued expenses and other liabilities | 18,870 | 162 | |||||||||
| Operating lease liabilities | (614) | (1,179) | |||||||||
| Settlement liabilities | 10,699 | (16,084) | |||||||||
| Other liabilities | (472) | 310 | |||||||||
| Net cash provided (used) by operating activities | 34,580 | (4,392) | |||||||||
| Cash flows from investing activities: | |||||||||||
| Purchase of property and equipment | (2,602) | (1,857) | |||||||||
| Software development costs | (4,397) | (1,051) | |||||||||
| Net cash used by investing activities | (6,999) | (2,908) | |||||||||
| Cash flows from financing activities: | |||||||||||
| Principal payments of finance leases | (579) | (617) | |||||||||
| Principal payments of term loan | (25,157) | (92) | |||||||||
| Principal payments of line of credit | — | (1,000) | |||||||||
| Proceeds from line of credit | — | 9,613 | |||||||||
| Proceeds from term loan | 45,000 | — | |||||||||
| Payments of deferred offering costs | (4,796) | — | |||||||||
| Vesting of restricted common stock | 234 | — | |||||||||
| Proceeds from issuance of common stock on exercise of stock options | 2,862 | 559 | |||||||||
| Net cash provided by financing activities | 17,564 | 8,463 | |||||||||
| Net increase in cash and cash equivalents | 45,145 | 1,163 | |||||||||
| Cash and cash equivalents and restricted cash, beginning of period | 46,878 | 34,801 | |||||||||
| Cash and cash equivalents and restricted cash, end of period | $ | 92,023 | $ | 35,964 | |||||||
| Supplemental disclosure of cash flow information: | |||||||||||
| Cash paid for interest | $ | 2,182 | $ | 2,186 | |||||||
| Cash paid for income taxes | $ | 6,910 | $ | 101 | |||||||
| Noncash investing and financing items: | |||||||||||
| Right-of-use assets acquired with lease liabilities | $ | — | $ | 1,260 | |||||||
| Accrued deferred offering costs | $ | 795 | $ | — | |||||||
| Reconciliation of cash, cash equivalents and restricted cash to the consolidated balance sheets | |||||||||||
| Cash and cash equivalents | $ | 68,058 | $ | 25,881 | |||||||
| Restricted cash included in other current assets | 5,989 | 1,666 | |||||||||
| Restricted cash included in other assets | 47 | 45 | |||||||||
| Restricted cash included in settlement assets | 17,929 | 8,372 | |||||||||
| Total cash, cash equivalents and restricted cash | $ | 92,023 | $ | 35,964 | |||||||
Exhibit 99.1
Expensify, Inc.
Reconciliation of GAAP to Non-GAAP Financial Measures
(unaudited, in thousands)
Adjusted EBITDA
| Three months ended September 30, | |||||||||||
| 2021 | 2020 | ||||||||||
| Net (loss) income | $ | (6,345) | $ | (6,938) | |||||||
| Add: | |||||||||||
| (Benefit) provision for income taxes | (3,567) | 1,205 | |||||||||
| Interest and other expenses, net | 1,054 | 646 | |||||||||
| Depreciation and amortization | 1,438 | 744 | |||||||||
| Stock-based compensation | 897 | 11,765 | |||||||||
| Adjusted EBITDA | $ | (6,523) | $ | 7,422 | |||||||
Adjusted EBITDA Excluding the IPO-Related Bonus
| Three months ended September 30, | |||||||||||
| 2021 | 2020 | ||||||||||
| Net (loss) income | $ | (6,345) | $ | (6,938) | |||||||
| Add: | |||||||||||
| (Benefit) provision for income taxes | (3,567) | 1,205 | |||||||||
| Interest and other expenses, net | 1,054 | 646 | |||||||||
| Depreciation and amortization | 1,438 | 744 | |||||||||
| Stock-based compensation | 897 | 11,765 | |||||||||
| IPO Related Bonuses | 26,287 | — | |||||||||
| Adjusted EBITDA Excluding the IPO-Related Bonus | $ | 19,764 | $ | 7,422 | |||||||
Non-GAAP Net Income
| Three months ended September 30, | |||||||||||
| 2021 | 2020 | ||||||||||
| Net (loss) income | $ | (6,345) | $ | (6,938) | |||||||
| Add: | |||||||||||
| IPO Related Bonuses | 26,287 | — | |||||||||
| Non-GAAP Net (loss) income | $ | 19,942 | $ | (6,938) | |||||||
Exhibit 99.2
Expensify, Inc.
Investor Presentation

Exhibit 99.2
Expensify, Inc.
Investor Presentation
Exhibit 99.2
Expensify, Inc.
Investor Presentation
Exhibit 99.2
Expensify, Inc.
Investor Presentation

Exhibit 99.2
Expensify, Inc.
Investor Presentation
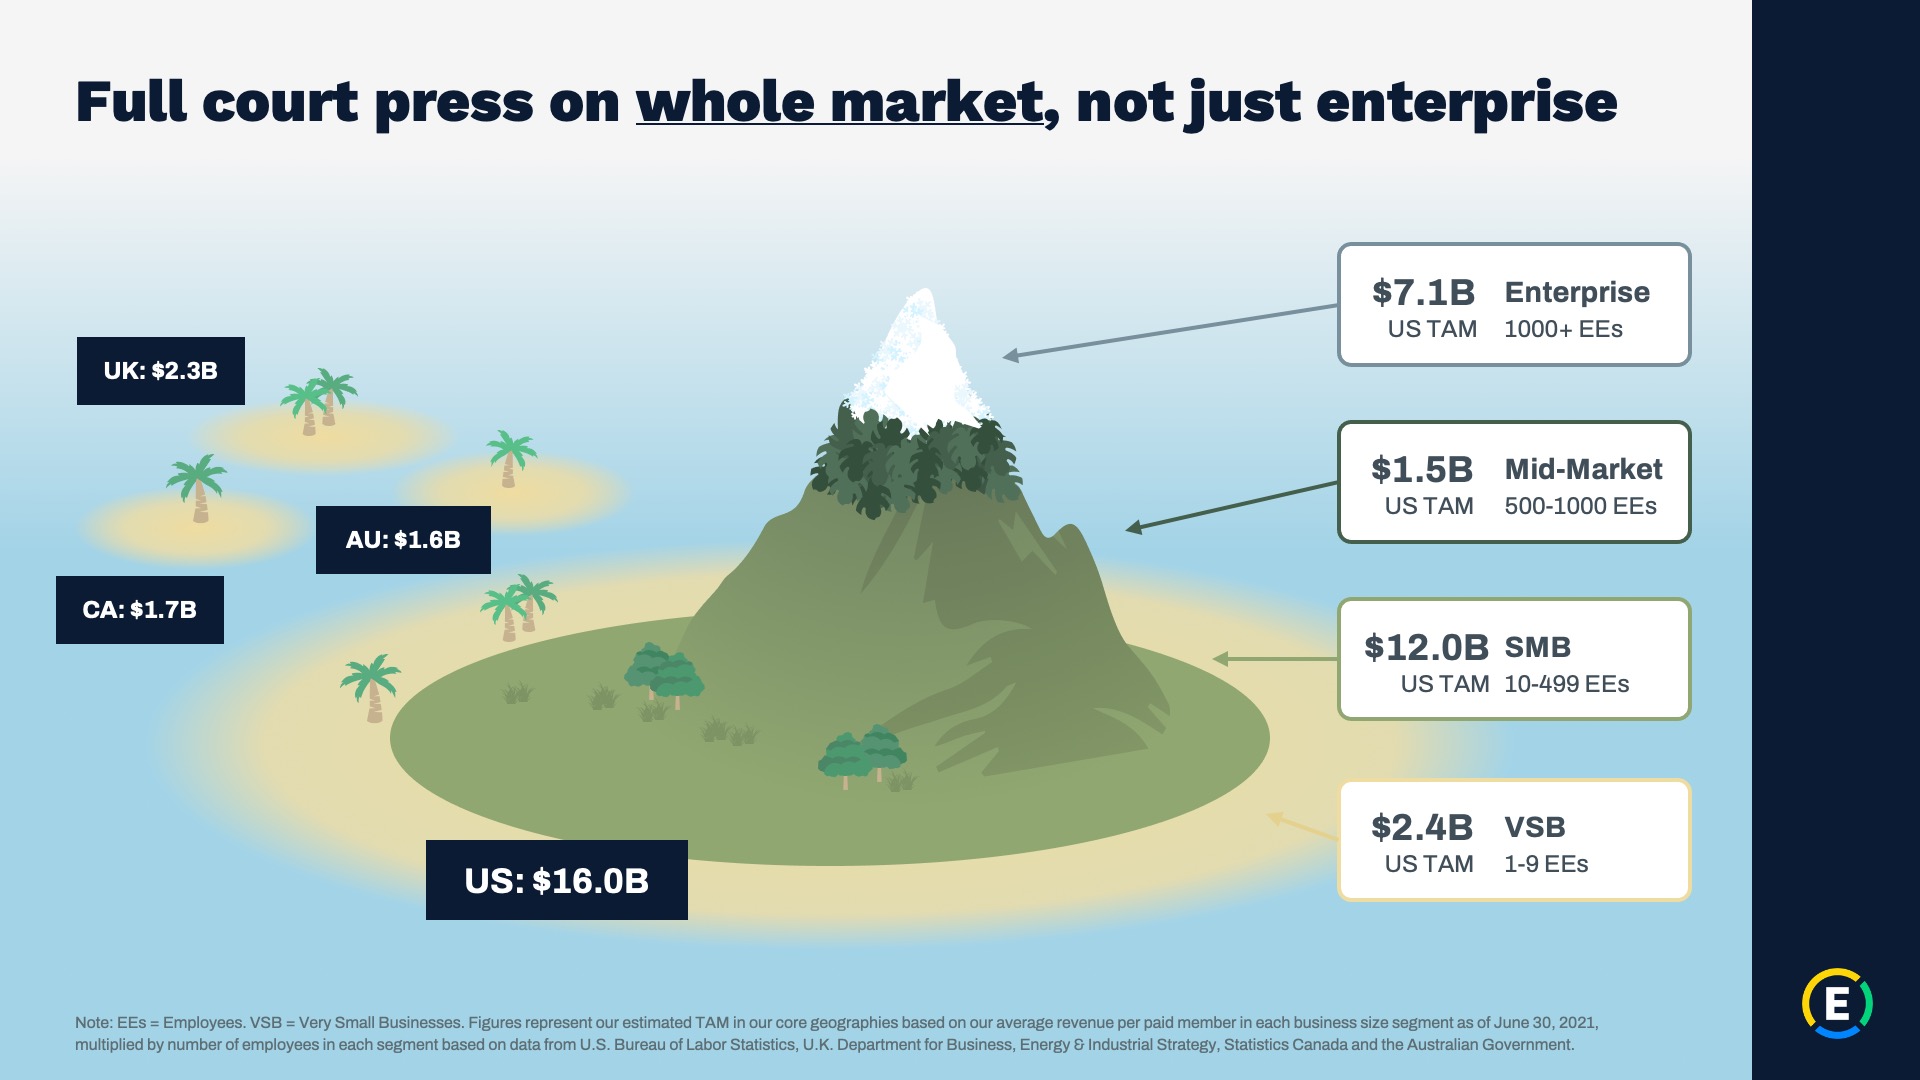
Exhibit 99.2
Expensify, Inc.
Investor Presentation

Exhibit 99.2
Expensify, Inc.
Investor Presentation

Exhibit 99.2
Expensify, Inc.
Investor Presentation

Exhibit 99.2
Expensify, Inc.
Investor Presentation
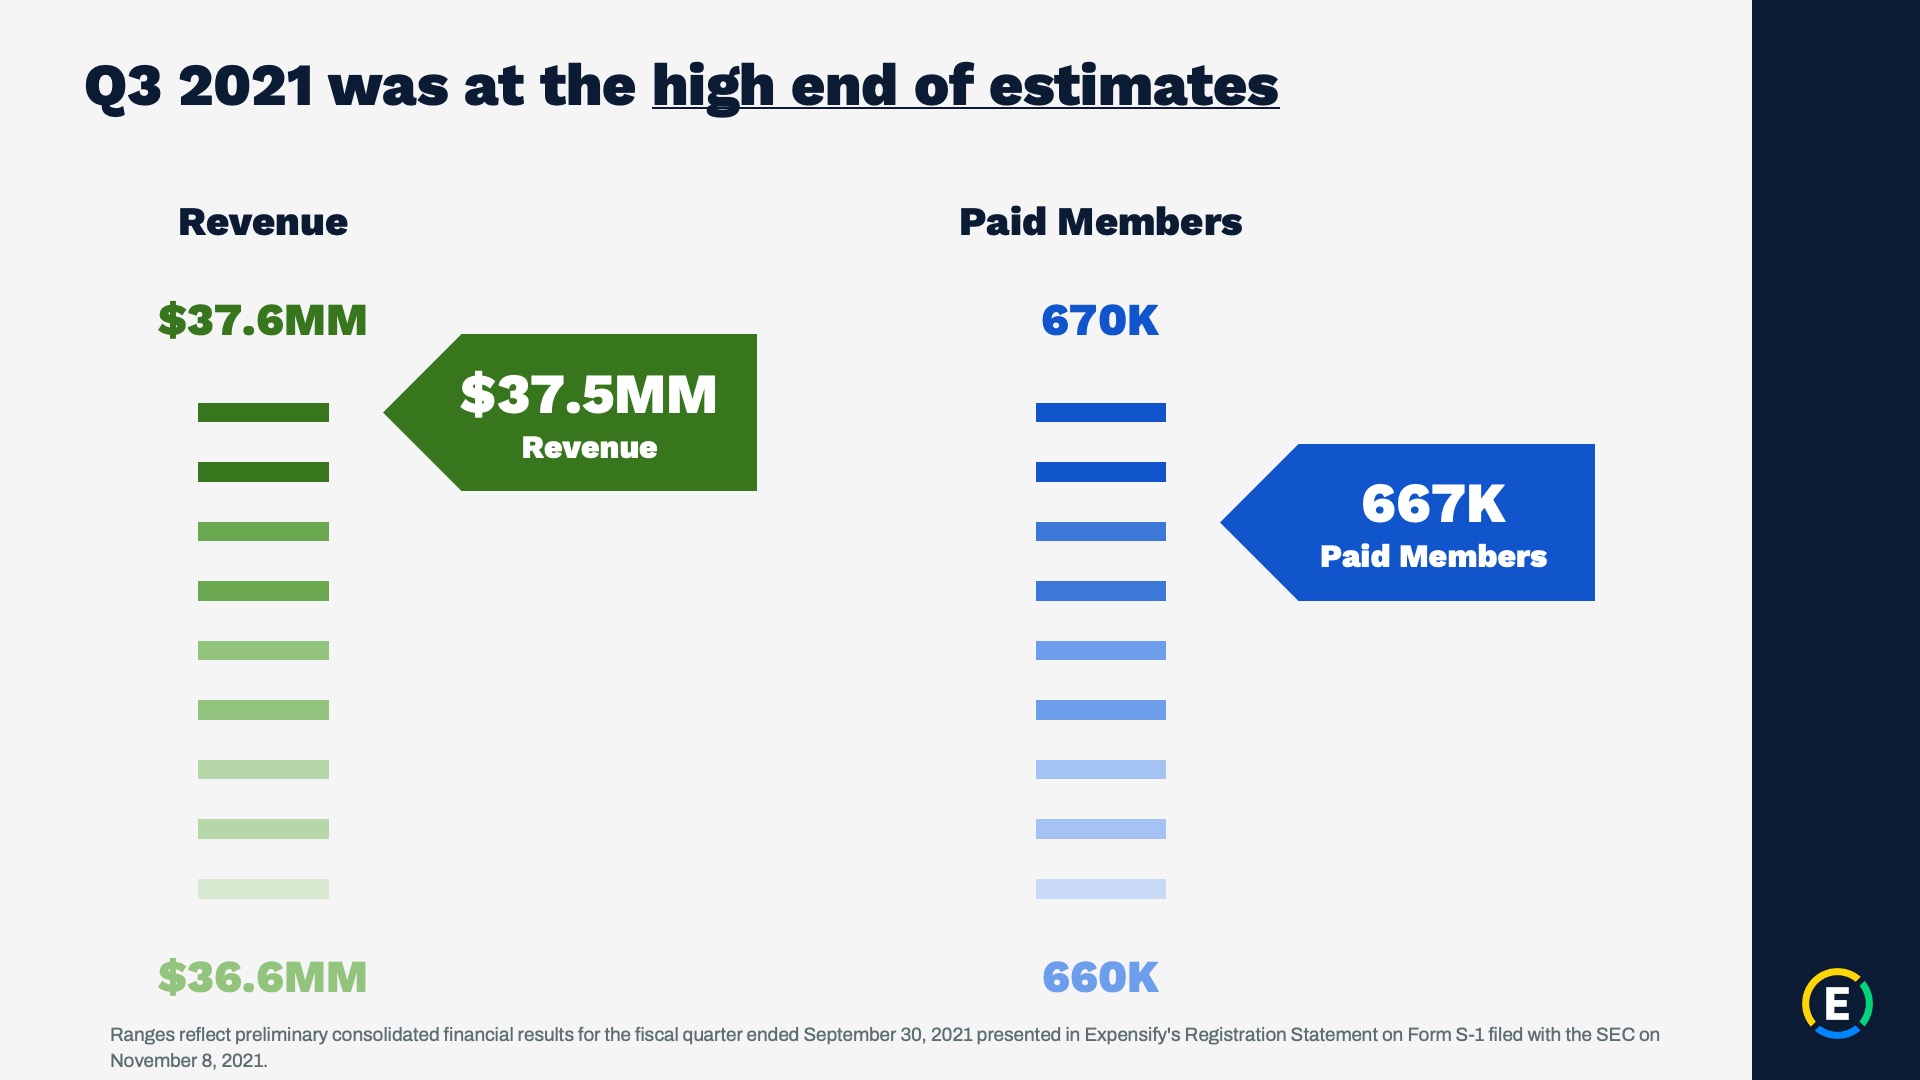
Exhibit 99.2
Expensify, Inc.
Investor Presentation
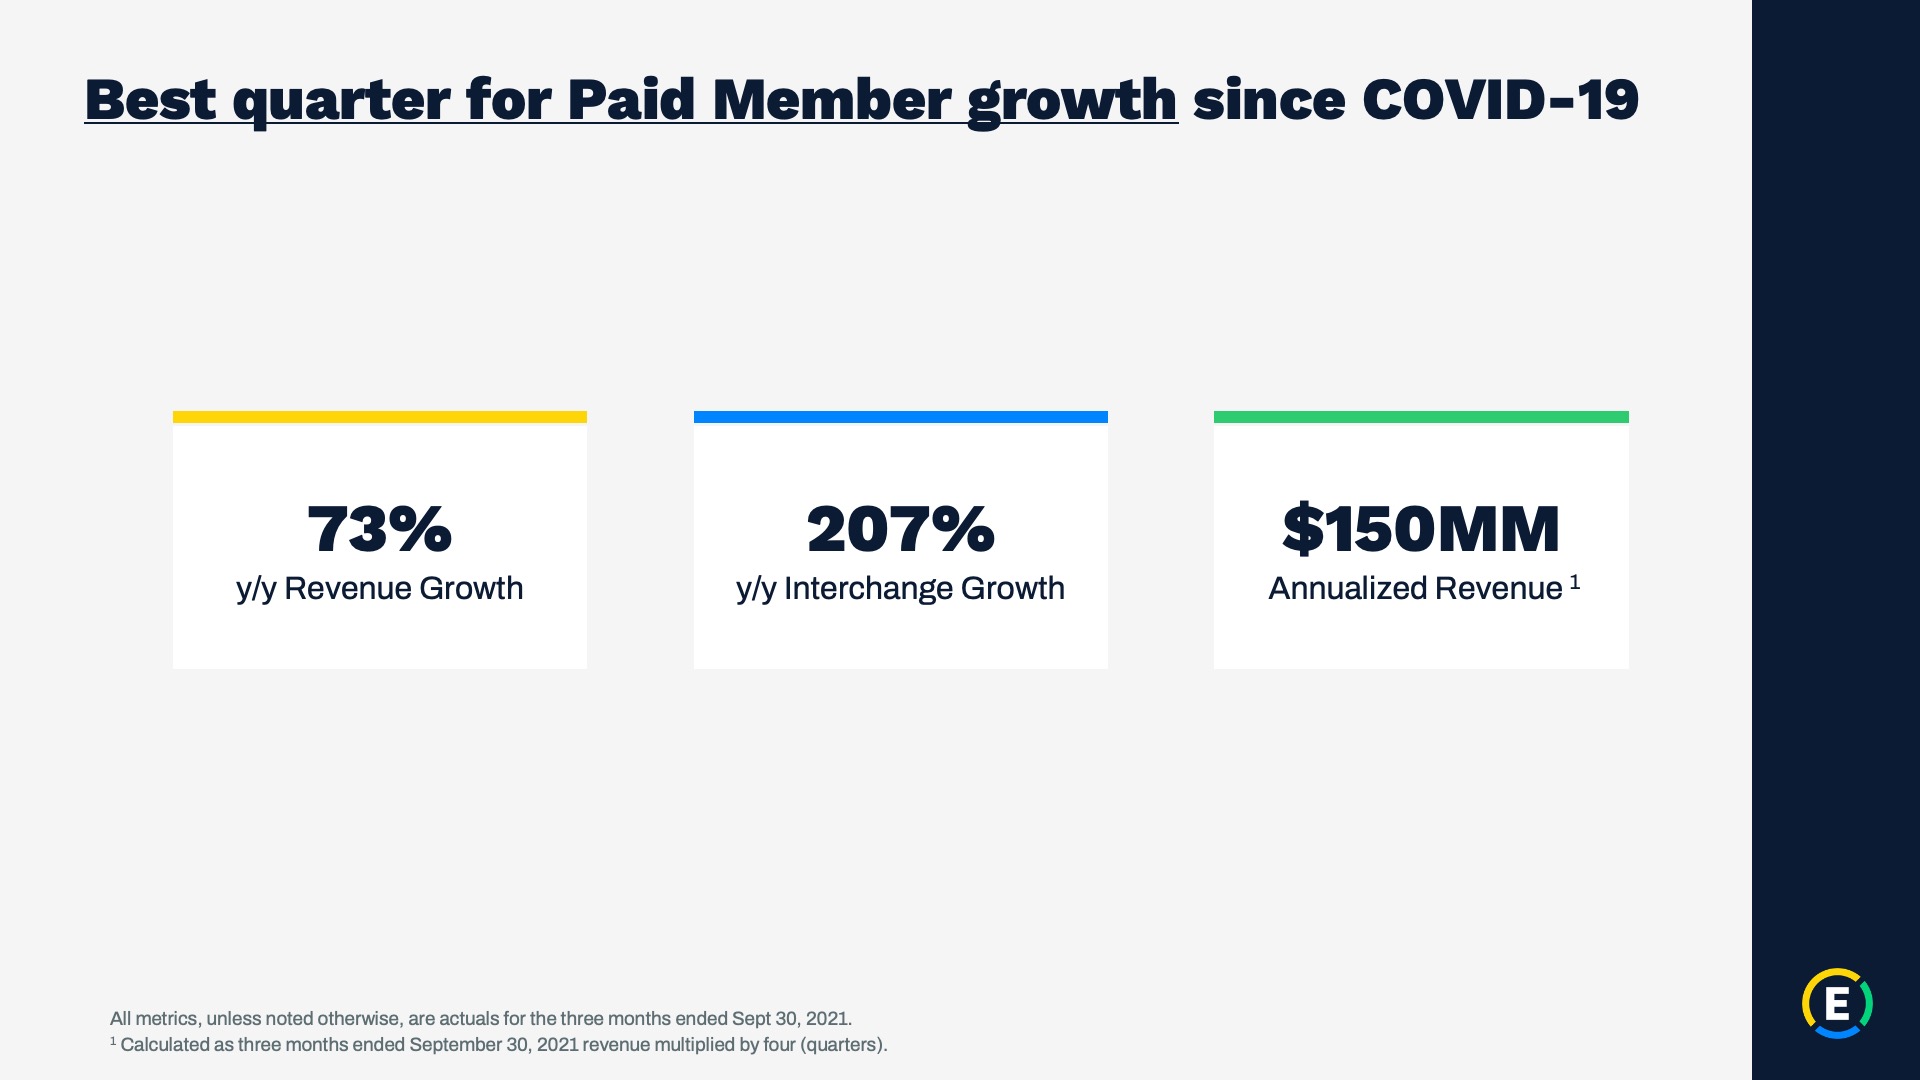
Exhibit 99.2
Expensify, Inc.
Investor Presentation

Exhibit 99.2
Expensify, Inc.
Investor Presentation
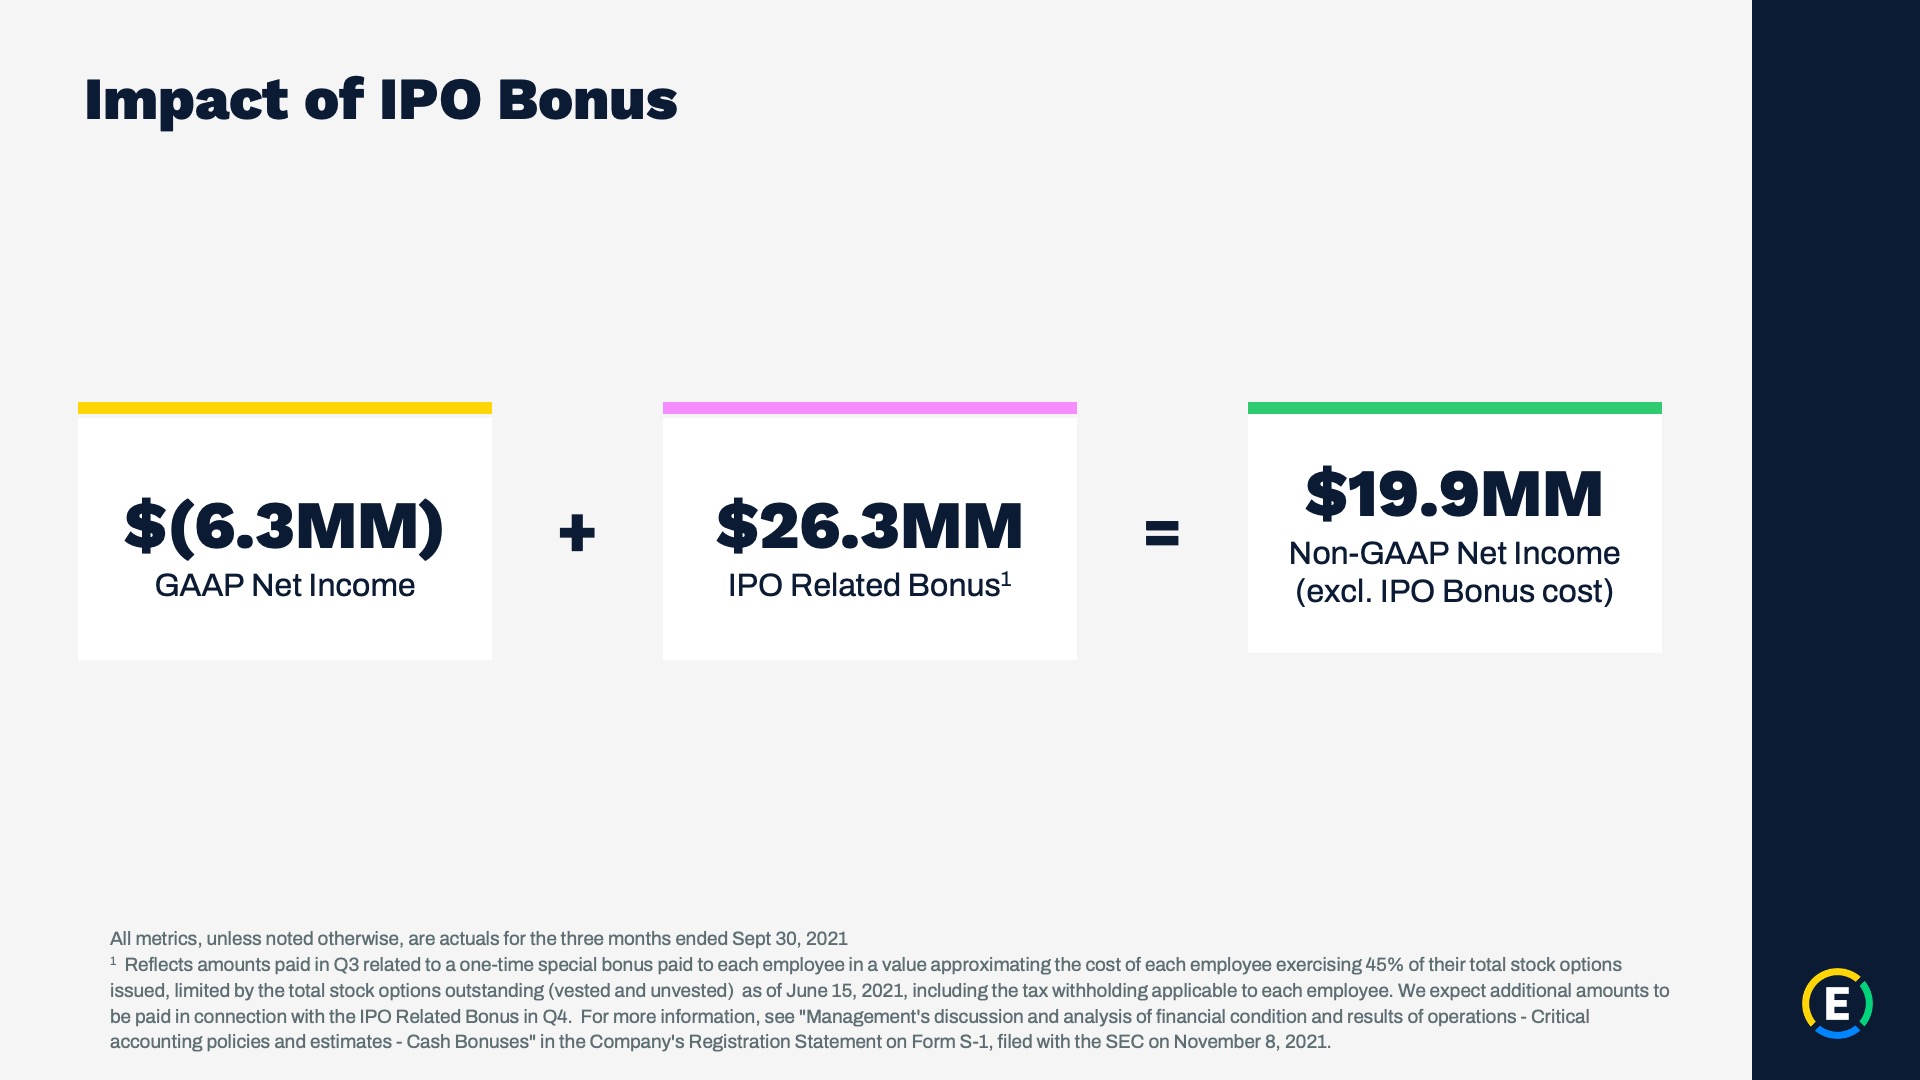
Exhibit 99.2
Expensify, Inc.
Investor Presentation
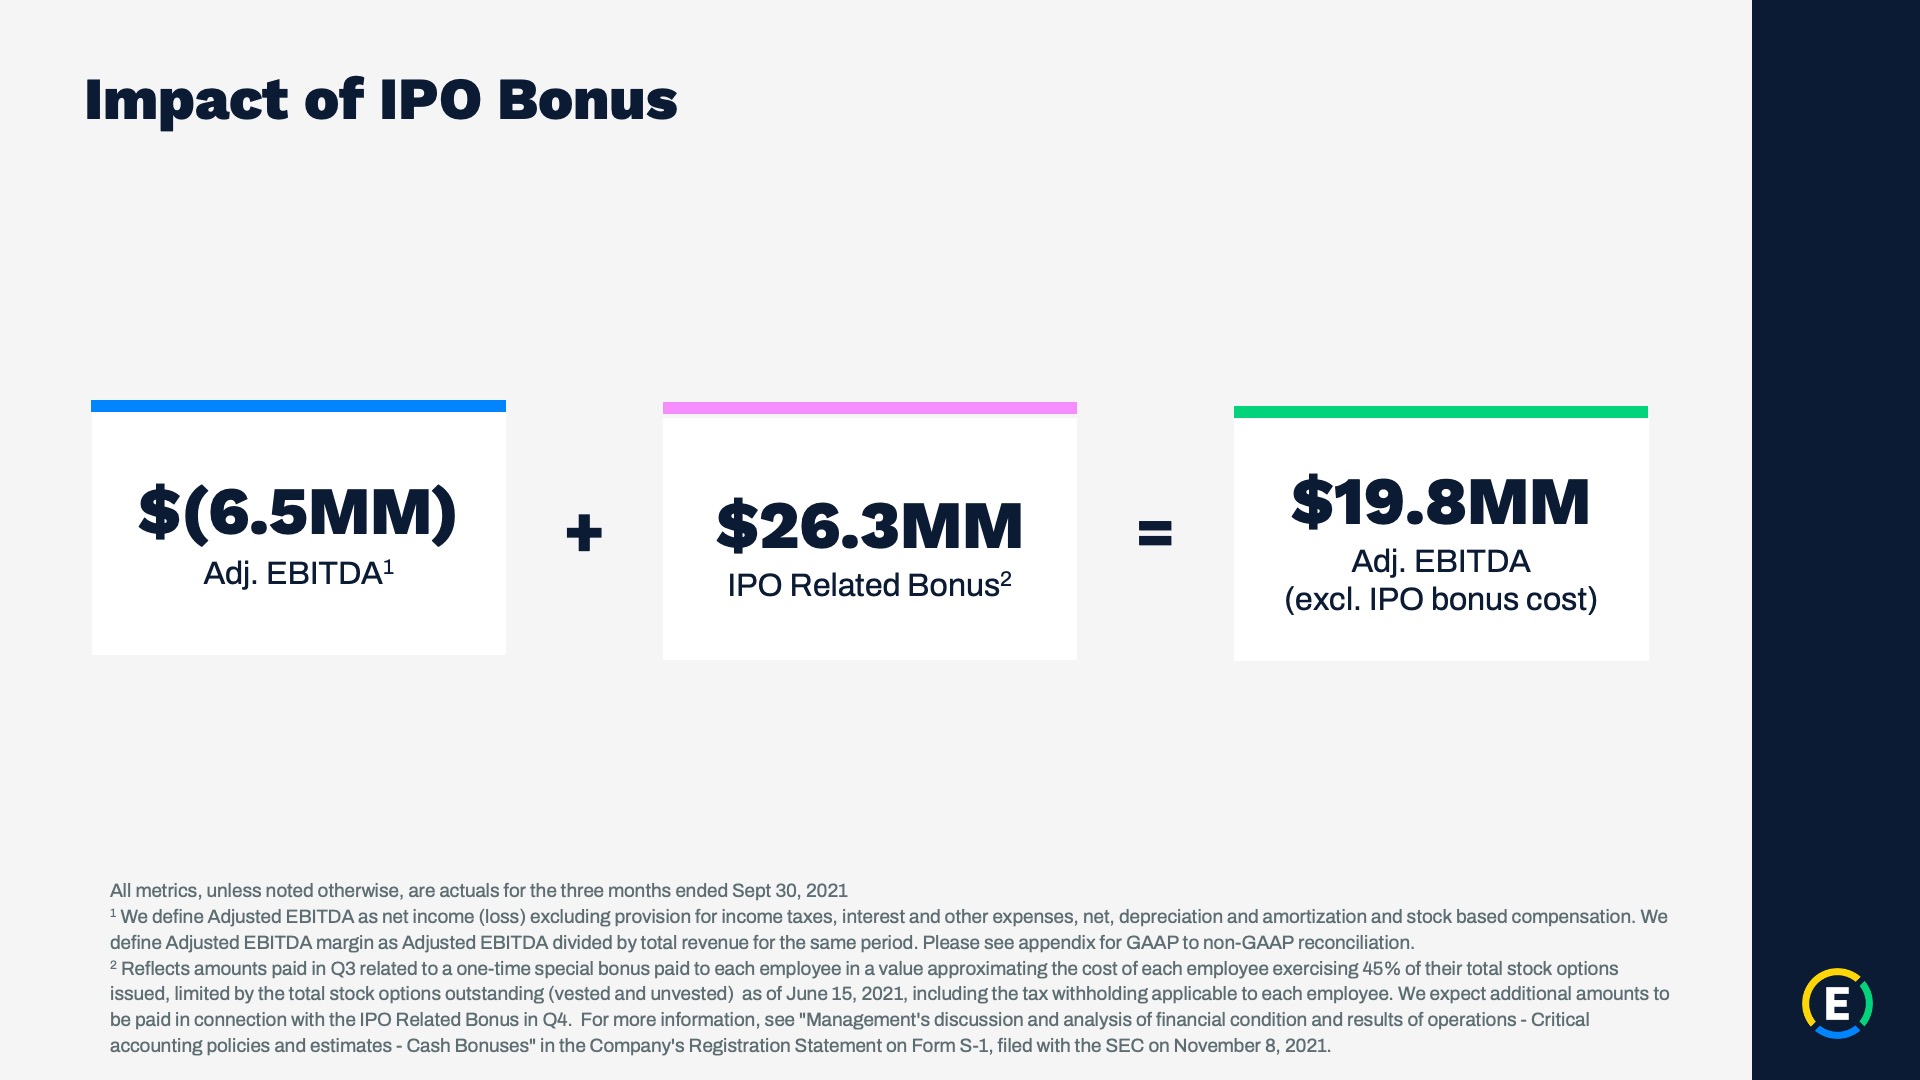
Exhibit 99.2
Expensify, Inc.
Investor Presentation
Exhibit 99.2
Expensify, Inc.
Investor Presentation

Exhibit 99.2
Expensify, Inc.
Investor Presentation
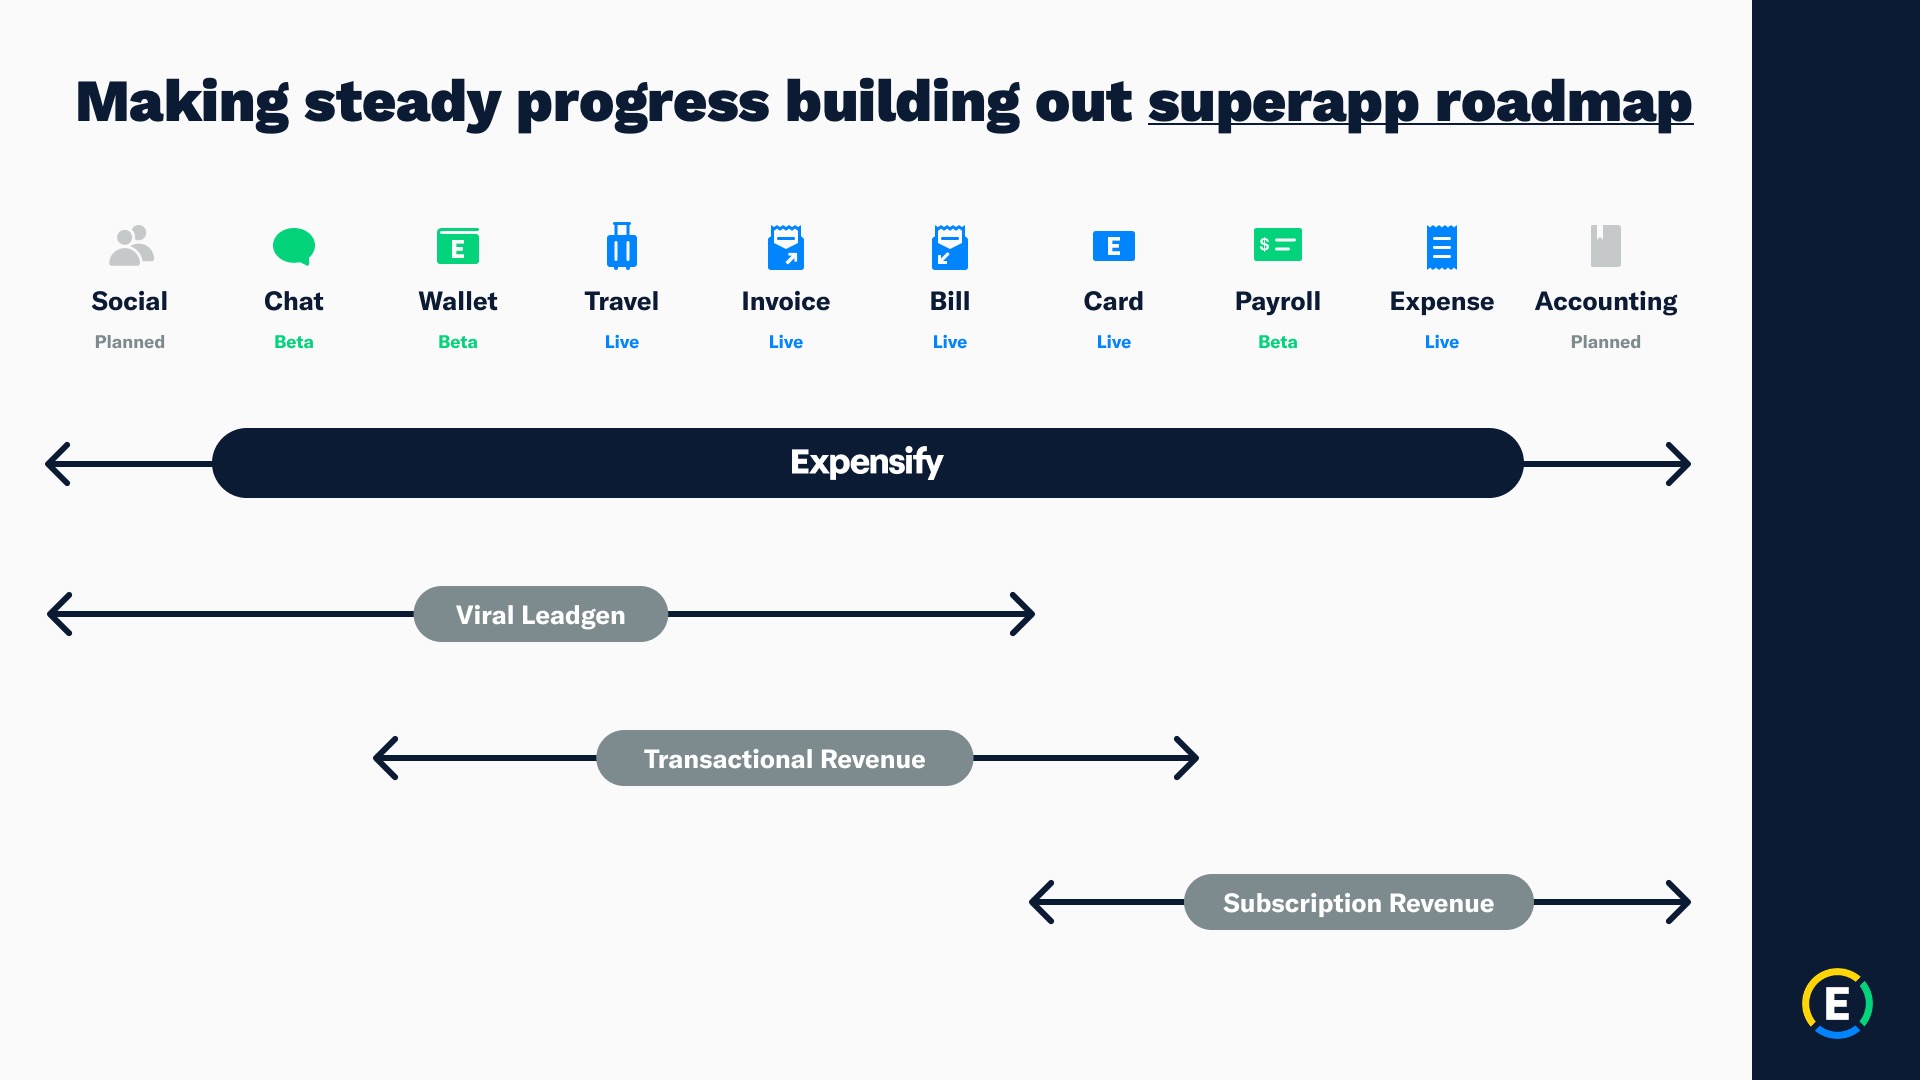
Exhibit 99.2
Expensify, Inc.
Investor Presentation

Exhibit 99.2
Expensify, Inc.
Investor Presentation
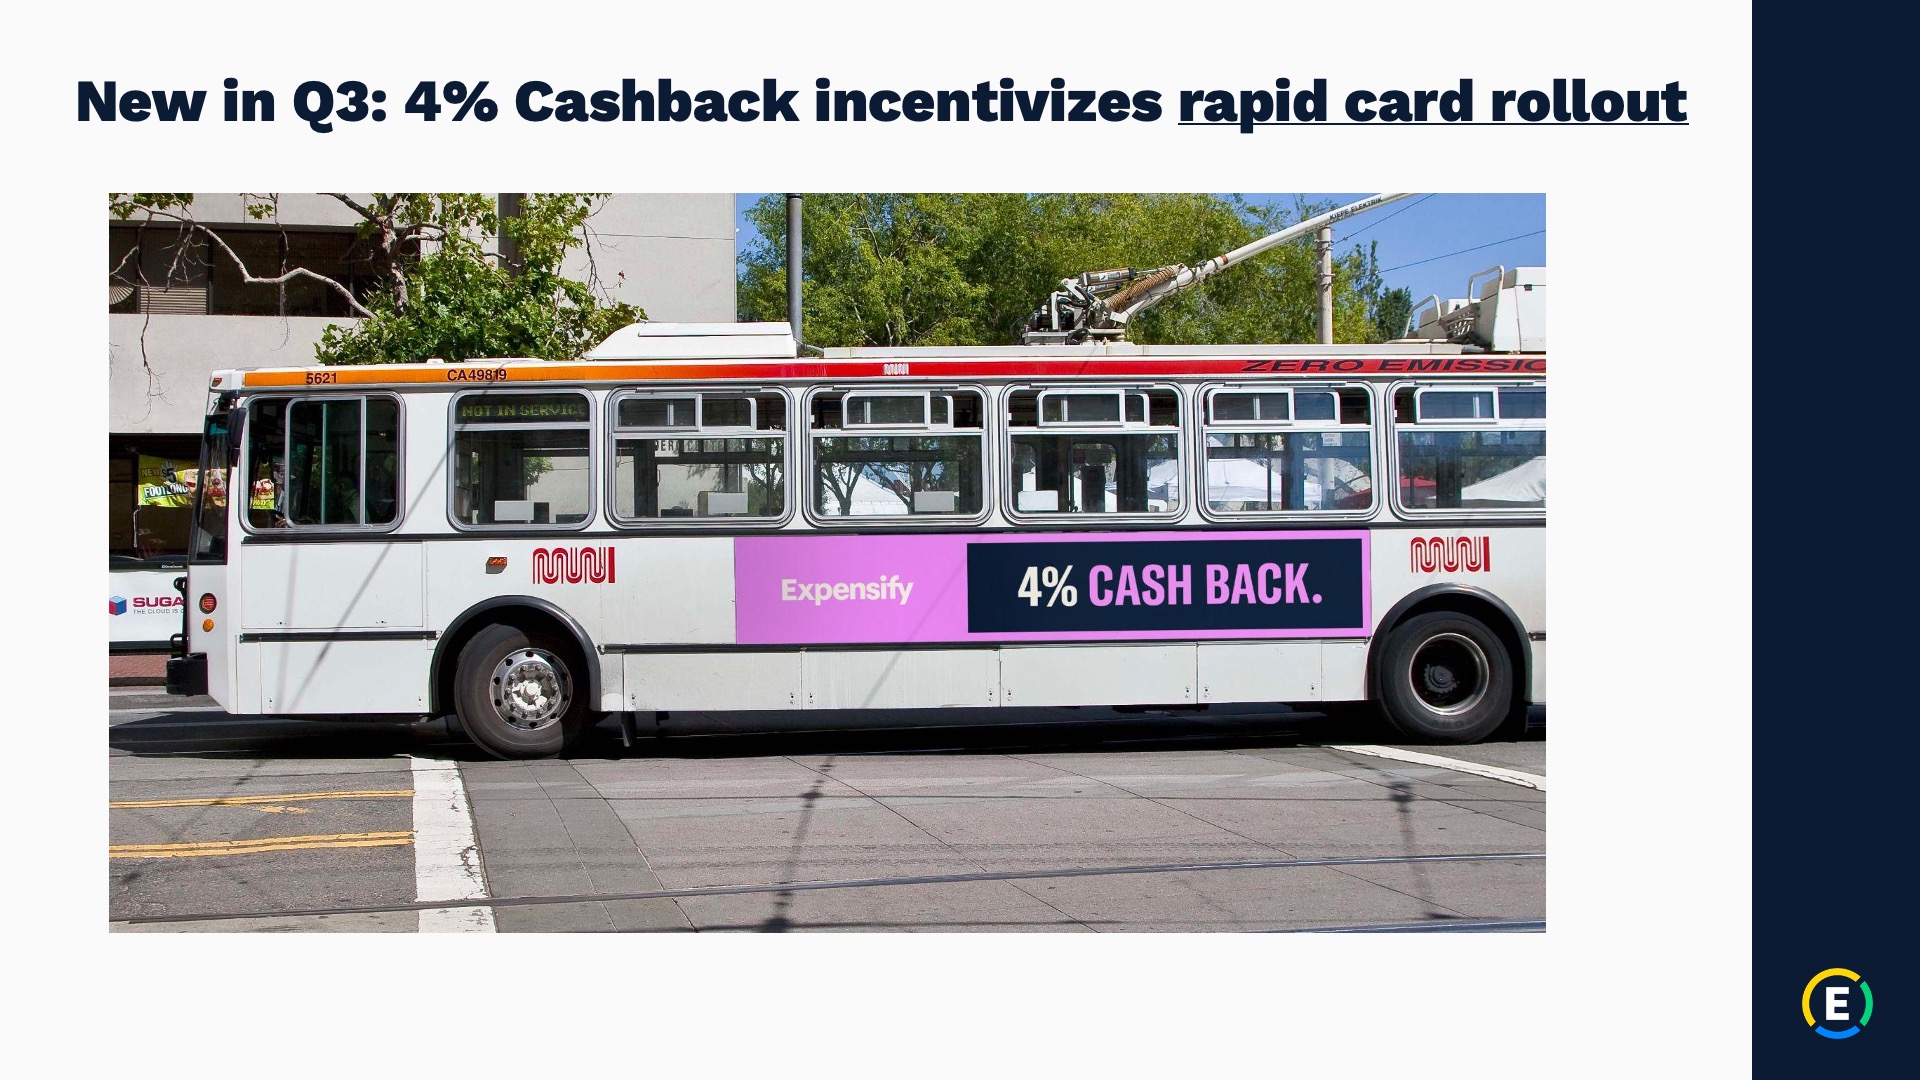
Exhibit 99.2
Expensify, Inc.
Investor Presentation

Exhibit 99.2
Expensify, Inc.
Investor Presentation
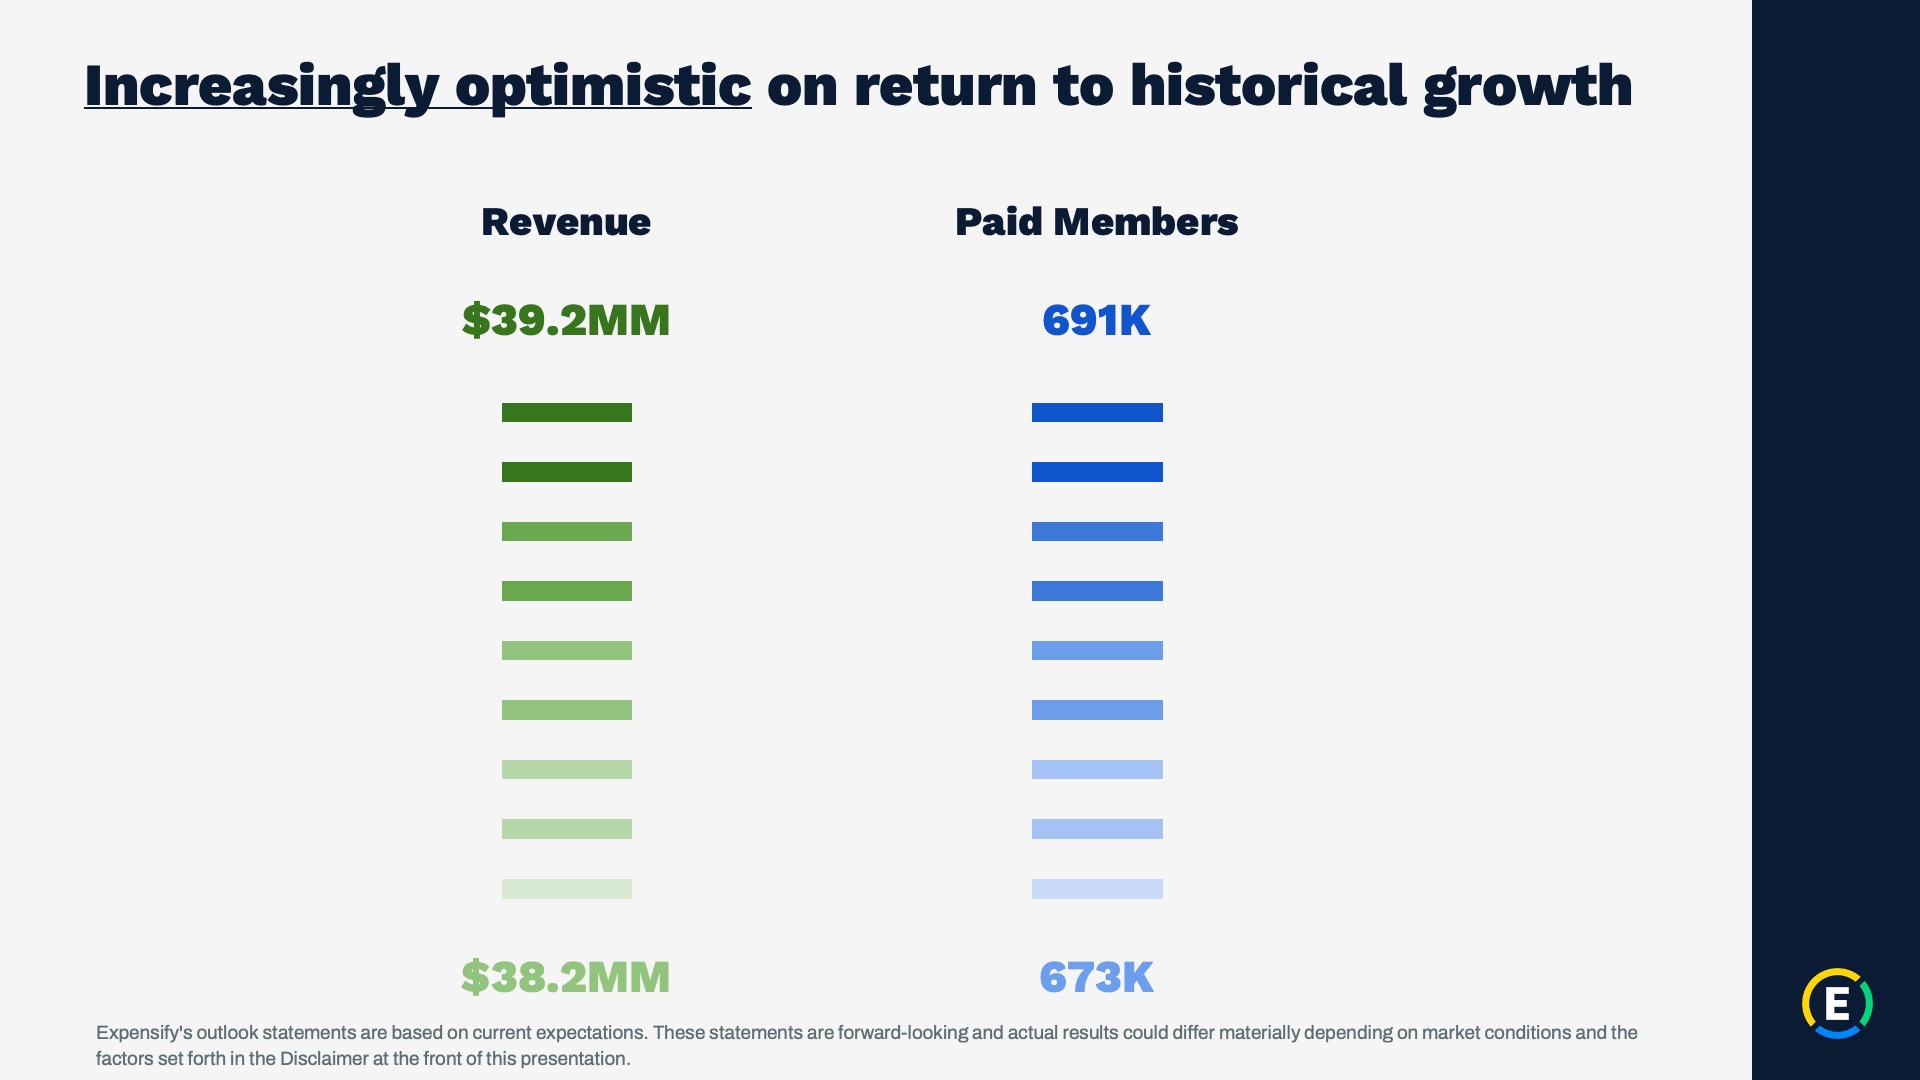
Exhibit 99.2
Expensify, Inc.
Investor Presentation
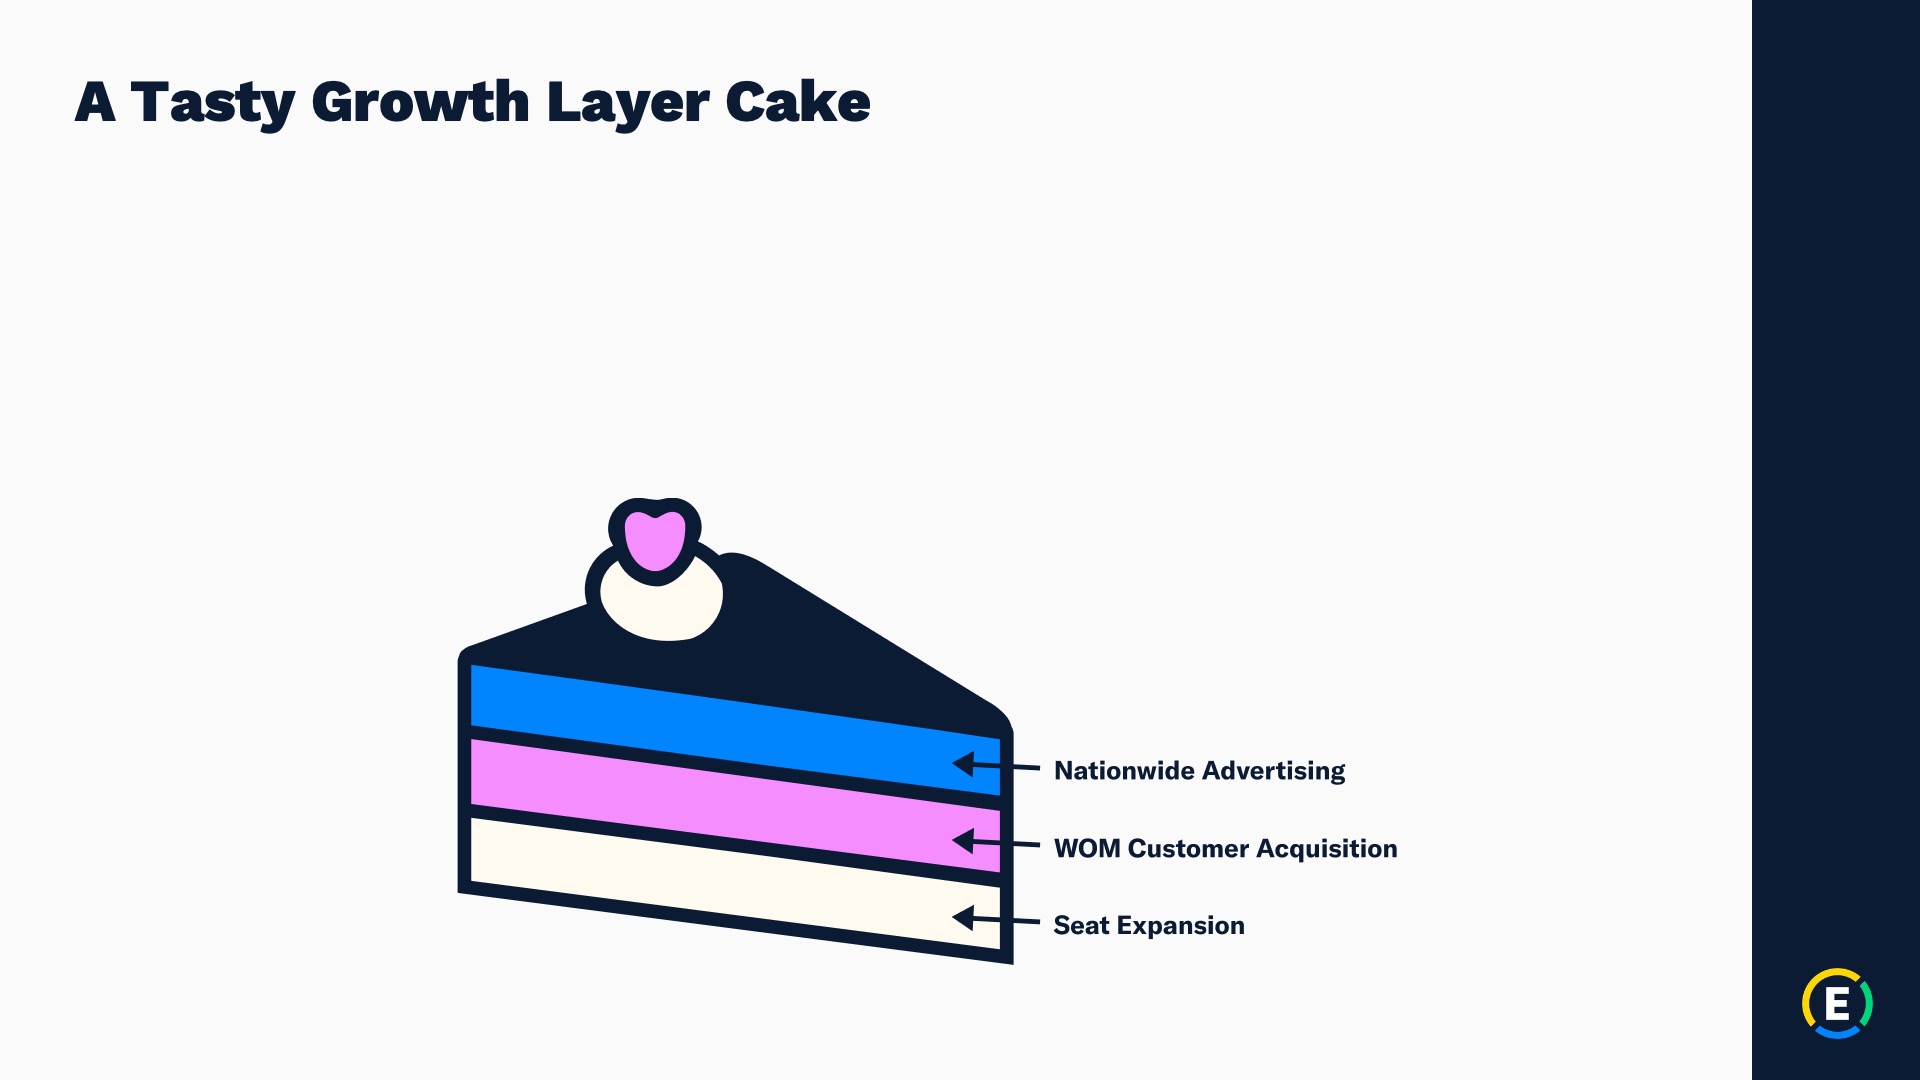
Exhibit 99.2
Expensify, Inc.
Investor Presentation

Exhibit 99.2
Expensify, Inc.
Investor Presentation

Exhibit 99.2
Expensify, Inc.
Investor Presentation

Exhibit 99.2
Expensify, Inc.
Investor Presentation

Exhibit 99.2
Expensify, Inc.
Investor Presentation
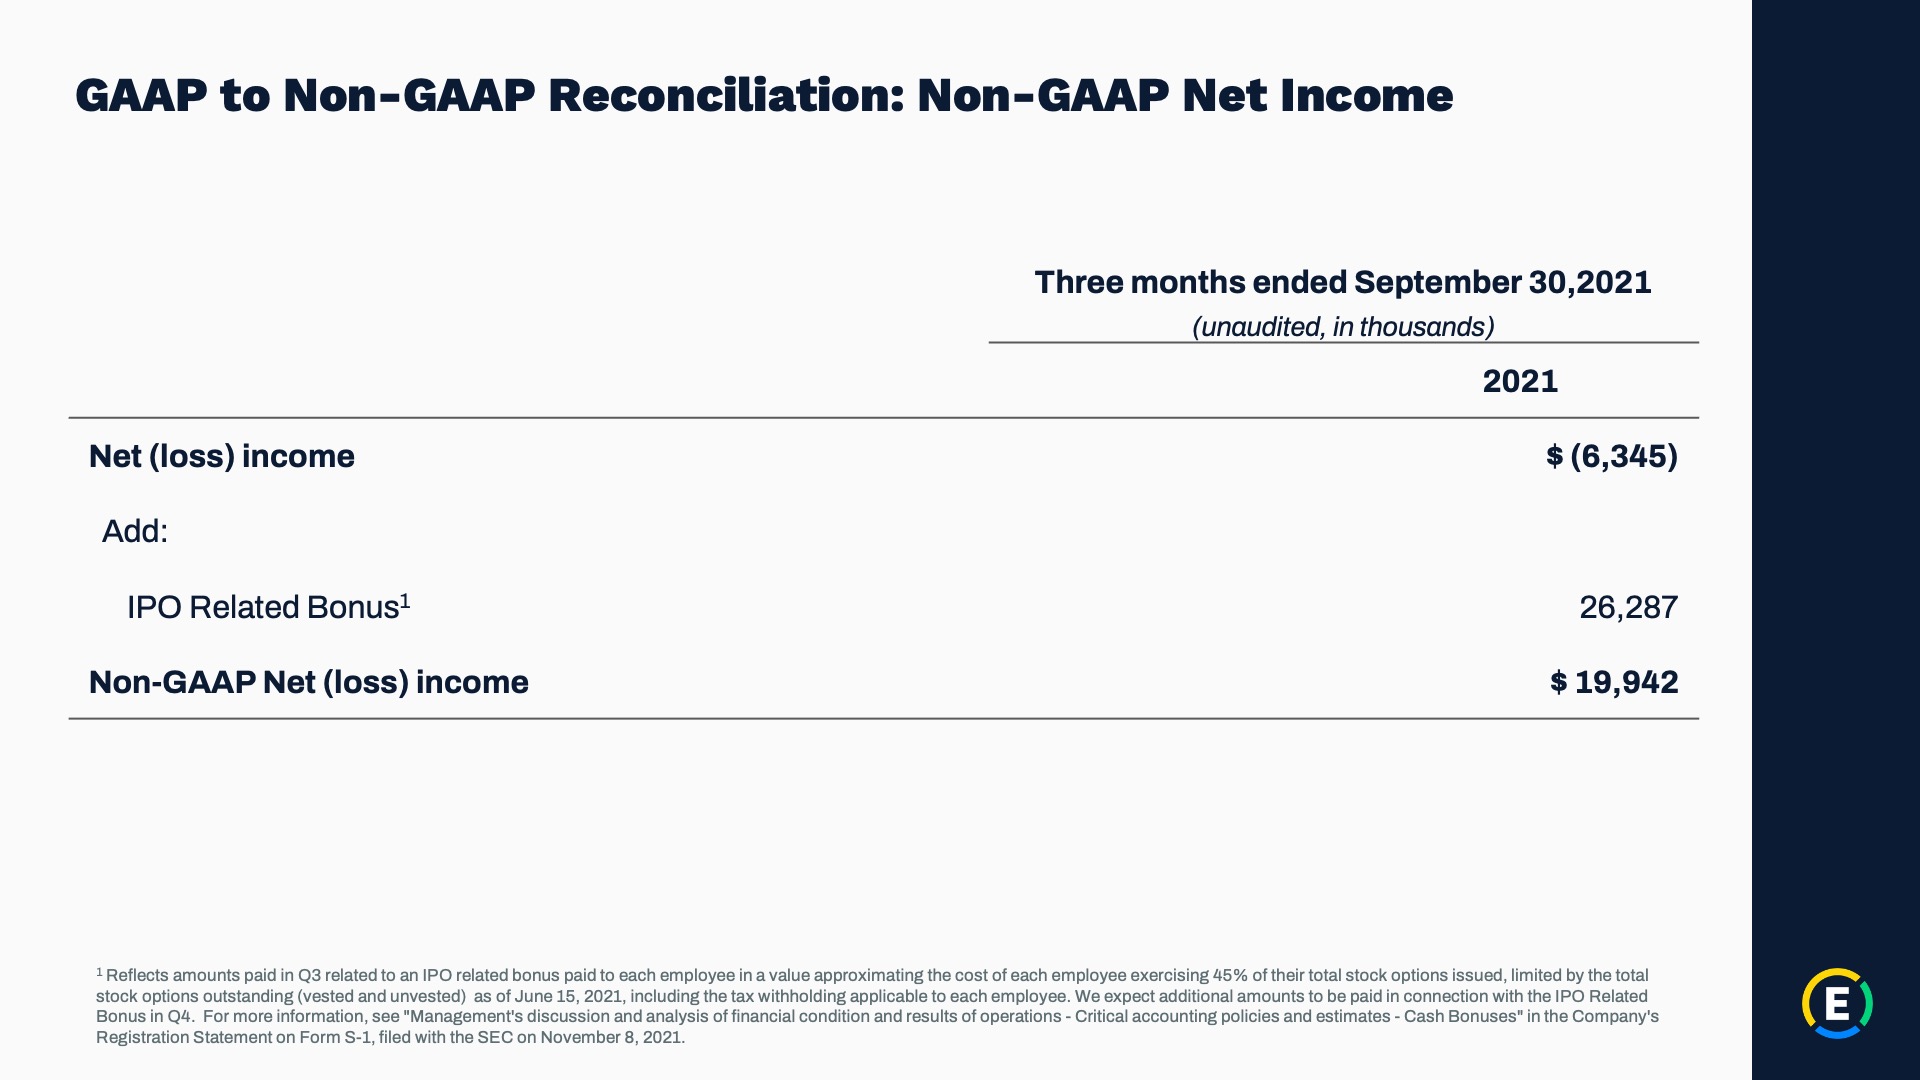
Exhibit 99.2
Expensify, Inc.
Investor Presentation
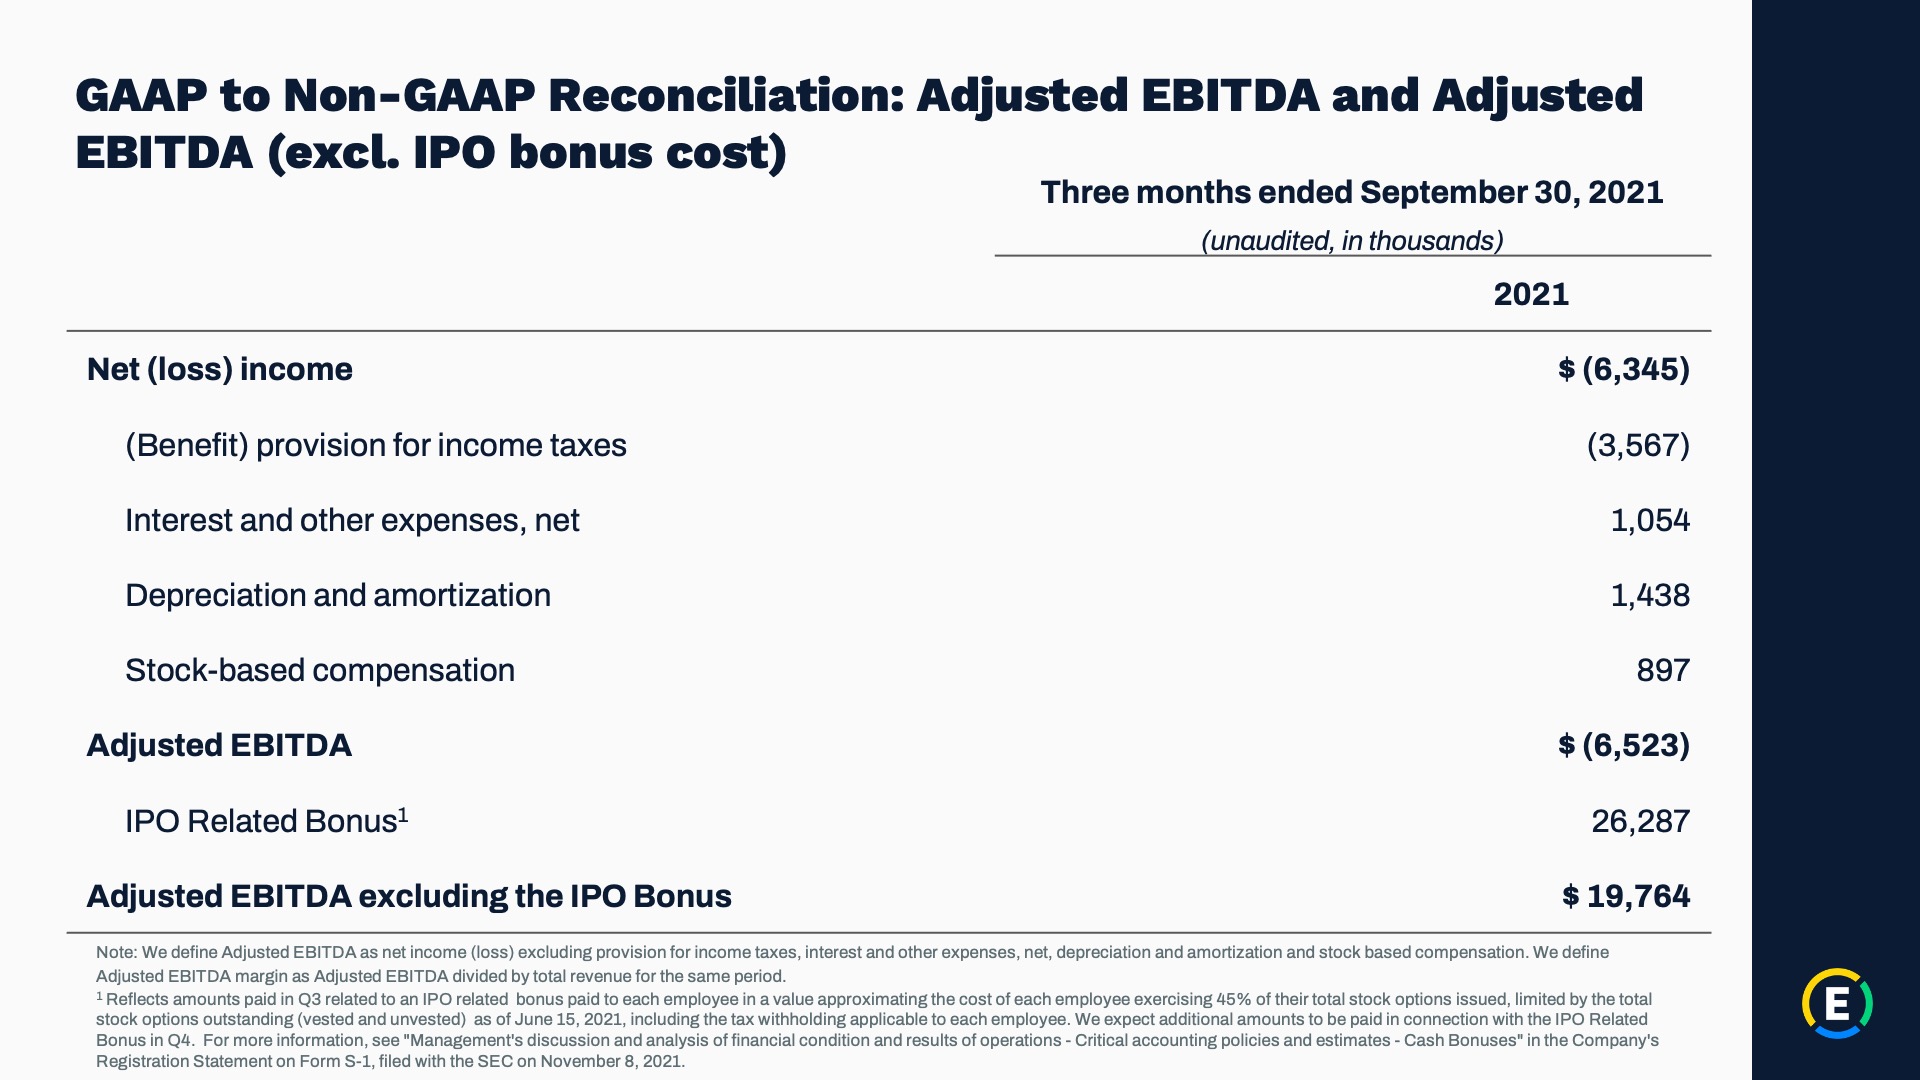
Exhibit 99.2
Expensify, Inc.
Investor Presentation
Serious News for Serious Traders! Try StreetInsider.com Premium Free!
You May Also Be Interested In
- Scepter Simplifies Refueling with the Flip of a Switch
- NOTICE TO DISREGARD -- InFlux Technologies Ltd.
- RomReal 2023 Annual report including accounts and Audit statement
Create E-mail Alert Related Categories
SEC FilingsSign up for StreetInsider Free!
Receive full access to all new and archived articles, unlimited portfolio tracking, e-mail alerts, custom newswires and RSS feeds - and more!
