

Form 8-K EarthLink Holdings Corp. For: Nov 17
 Tweet
Tweet Share
Share�
�
UNITED STATES
SECURITIES AND EXCHANGE COMMISSION
WASHINGTON, D. C. 20549
�
�
FORM�8-K
�
CURRENT REPORT
PURSUANT TO SECTION�13 OR 15(d)�OF THE
SECURITIES EXCHANGE ACT OF 1934
�
Date of report (Date of earliest event reported): November�17, 2014
�
EARTHLINK HOLDINGS CORP.
(Exact Name of Registrant as Specified in Its Charter)
�
|
Delaware |
� |
001-15605 |
� |
46-4228084 |
�
|
1170 Peachtree Street, Suite�900, Atlanta, Georgia |
� |
30309 |
|
(Address of principal executive offices) |
� |
(Zip Code) |
�
(404) 815-0770
(Registrant�s telephone number, including area code)
�
�
�
(Former name, former address and former fiscal year, if changed since last report date)
�
�
Check the appropriate box below if the Form�8-K filing is intended to simultaneously satisfy the filing obligation of the registrant under any of the following provisions:
�
o Written communications pursuant to Rule�425 under the Securities Act (17 CFR 230.425)
�
o Soliciting material pursuant to Rule�14a-12 under the Exchange Act (17 CFR 240.14a-12)
�
o Pre-commencement communications pursuant to Rule�14d-2(b)�under the Exchange Act (17 CFR 240.14d-2(b))
�
o Pre-commencement communications pursuant to Rule�13e-4(c)�under the Exchange Act (17 CFR 240.13e-4(c))
�
�
�
�
Item 7.01 Regulation FD Disclosure
�
A copy of the slides used by EarthLink Holdings Corp. during presentations to investors commencing on November�17, 2014 is attached hereto as Exhibit�99.1 and incorporated herein by reference.
�
In accordance with General Instruction B.2 of Form�8-K, the information furnished in Item 7.01 of this Current Report on Form�8-K and in Exhibit�99.1 attached hereto shall not be deemed �filed� for the purposes of Section�18 of the Securities Exchange Act of 1934, as amended, or otherwise subject to the liability of that section, nor shall it be deemed incorporated by reference in any filing under the Securities Act of 1933, as amended, except as shall be expressly set forth by specific reference in such a filing.
�
Item 9.01 Financial Statements and Exhibits
�
(d)�������������������������������� Exhibits
�
|
Exhibit�No. |
� |
Description |
|
99.1 |
� |
Presentation to investors made by EarthLink Holdings Corp. |
�
�
SIGNATURE
�
Pursuant to the requirements of the Securities Exchange Act of 1934, the registrant has duly caused this report to be signed on its behalf by the undersigned hereunto duly authorized.
�
|
� |
EARTHLINK HOLDINGS CORP. | ||
|
� |
(Registrant) | ||
|
� |
� | ||
|
� |
� | ||
|
� |
By: |
/s/ Bradley A. Ferguson | |
|
� |
� |
Name: |
Bradley A. Ferguson |
|
� |
� |
Title: |
Executive Vice President, |
|
� |
� |
Chief Financial Officer | |
|
� |
� | ||
|
Date: November�17, 2014 |
� | ||
�
�
Exhibit�Index
�
|
Exhibit�No. |
� |
Description |
|
99.1 |
� |
Presentation to investors made by EarthLink Holdings Corp. |
�
Exhibit 99.1
�
|
|
[LOGO] |

�
|
|
EarthLink Overview �2015 EarthLink. All rights reserved. |
|
� |
� |

�
|
|
Company History Acquired 10 New CEO, companies Running consumer Joe Eazor, joined Building Business services company in Q1 ISP for cash flow Consumer ISP became ~80% of 2014 20-plus percent revenues Heavy sales and Driving improved annual revenue marketing spend Stemmed revenue cash flow declines decline from 20+% Narrowing focus down to 7% 1994 - 2007 2010 - 2013 Company operates in five distinct customer product categories: Consumer, Small Business CLEC, Wholesale (Carrier/Transport), Managed Network Services, Cloud & IT Services 3 �2015 EarthLink. All rights reserved. |

�
|
|
Operational Transformation Steps Protect and improve the performance of our base business, and significantly improve our cash flow � Focused effort to manage cost of revenue and operating expenses � Significant reductions in capital spending � Additional focus on protecting revenue base through re-terms and targeted price actions Complete key integration activities and drive operational excellence � Many key system consolidations completed earlier this year with more to follow � Increasing accountability for execution by managing to specific KPI�s � Notable improvements in service delivery intervals and customer satisfaction Define and follow a clear strategy to maximize value and establish a clear path to profitable growth. � Narrowing our product and market focus to managed network and relevant cloud services � Rationalizing non-core products � Optimizing our portfolio of businesses, including pursuing strategic options Implement a business and operating model along that will deliver on these commitments � Established an EVP-level office of strategy, operations, and transformation � Changing operating model to be market-focused, with value-optimizing strategies for each market 4 �2015 EarthLink. All rights reserved. |
�
|
|
EarthLink Businesses Carrier / Managed Consumer Small Business Transport Services Customer Base Individuals & families Small, often single Telco providers & Distributed multi- location businesses large enterprises location companies Operating Strategy Manage for cash Manage for cash Pursue strategic Invest in growth alternatives products 5 �2015 EarthLink. All rights reserved. |
�
|
|
Market Opportunity �2015 EarthLink. All rights reserved. |

�
|
|
Market Opportunity Technology advances are driving to a more software based future and we are already seeing it happening 7% 41% CAGR CAGR IPSec/SDN proliferation MPLS growth rate declines over time as market matures Pre-2010, shift from packet switched technology to MPLS (ex. mkt size for ATM <$1b) Source: Gartner Dataquest June 2002 ATM Networks Market Size and Forecast, 2000-2006 Plexxi SDN market sizing report June 2013 7 �2015 EarthLink. All rights reserved. �Market size ($�billions) 2010 2Q14 2018 MPLS IPSec/SDN |

�
|
|
EarthLink Advantage Focus on Value EarthLink Brand EarthLink begins with a focus on customer value, and A brand study of IT professionals shows EarthLink has delivers technology solutions that leverage both among the highest brand recognition among our network and cloud capabilities. competitors. We are investing more in the brand to build awareness in the managed network services space. AT&T 99% Comcast 97% Verizon 97% Sprint 95% Time Warner Cable 93% EarthLink 91% Cox 89% CenturyLink 84% Cablevision 84% Charter 82% Frontier 73% Bright House 71% Windstream 68% Level 3 65% Legacy Telcos Rackspace 63% XO 63% Terremark 57% TW Telecom 56% Savvis 56% Cloud Providers Cbeyond 54% Megapath 52% 0% 20% 40% 60% 80% 100% 120% Source: December 2013 Marketing Workshop A&U Study; n=500 IT Decision makers, nationally representative sample 8 �2015 EarthLink. All rights reserved. |

�
|
|
Recent Sales Highlights Harman Management Corporation (KFC�s first and largest franchisee) Business Need Business Need Business Need Security, compliance, backup Security, compliance, improved customer PCI & Router Compliance experience EarthLink Solution EarthLink Solution EarthLink Solution MPLS Network, PCI, Disaster Recovery for 155 MPLS Network, PCI, Guest WiFi for 157 Renewal of 260-location MPLS Network, PCI locations nationwide locations Business Need Business Need Business Need Reliable, secure MPLS solution connecting New networking partner with proven record More flexibility in their warehouse and distribution facilities serving retail customers existing network to support multiple VLANs EarthLink Solution EarthLink Solution EarthLink Solution MPLS network, including primary and Blended access MPLS network for 58 Upgrade to 1,400 existing routers enabling secondary, leveraging EarthLink locations with Hosted Voice, Hosted solutions for Point of Sale, Wi-Fi, Digital interconnection with six other providers Network Security, WiFi and PCI applications Media and other retail applications 9 �2015 EarthLink. All rights reserved. |

�
|
|
Financial Trends �2015 EarthLink. All rights reserved. |
�
|
|
Q3 2014 Operating & Financial Results Var to Q2 $�Millions Q3 '13 Q2 '14 Q3 '14 '14 Revenue � Q3 �14 includes Total Revenue $�308.6 $�297.4 $�297.7 $�0.4 Business Revenue 240.6 234.2 237.0 2.8 settlements, includes $0.8M Consumer Revenue 68.0 63.1 60.7 (2.4) favorable settlements Cost of Revenue 144.8 144.2 135.7 (8.5) Total Gross Margin $�163.8 $�153.2 $�162.1 $�8.9 Gross Margin Gross Margin % 53% 52% 54% 3% Business Gross Margin 119.2 112.7 123.3 10.6 �Gross margin expanded on an Business Gross Margin % 50% 48% 52% 4% absolute and percentage basis Consumer Gross Margin 44.6 40.5 38.8 (1.7) Consumer Gross Margin % 66% 64% 64% 0% Unlevered Free Cash Flow Selling, G&A Expenses 108.9 104.6 105.9 1.3 �Strong Adjusted EBITDA results Adjusted EBITDA(1) $�56.1 $�50.9 $�59.0 $�8.1 combined with lower capital Net Income/(Loss) $�(11.3) $�(21.8) $�(2.0) $�19.9 expenditures Shares Outstanding(2) 103 102 102 0 �Highest Unlevered Free Cash Flow in Earnings Per Share $�(0.11) $�(0.21) $�(0.02) $�0.19 eight quarters Capital Expenditures $�32.8 $�26.0 $�24.9 $�(1.1) Unlevered Free Cash Flow(1) $�23.4 $�24.9 $�34.1 $�9.2 (1) Adjusted EBITDA and Unlevered Free Cash Flow are Non-GAAP measures. See appendix for additional information on non-GAAP measures. (2) Fully Diluted Weighted Average Shares 11 �2015 EarthLink. All rights reserved. |

�
|
|
Revenue Components Q3 �14 Q3 2013 Q2 2014 Q3 2014 Outlook / Commentary $�in Millions Q3 �13 � In Q2 2014, churn and ARPU increased Consumer $68 $63 $61 -11% following some pricing actions. � Expect 2014 revenue decline of 10%-11% � In Q3 2014, churn remained higher than CLEC historical levels, offsetting some of the benefit (Primarily Small $160 $148 $144 -10% of prices increases earlier in the year Business) � Expect 2014 decline of ~11% � Q3 2014 includes $7 M in settlements Wholesale $36 $38 $43 20% � Expect FY revenue to be within 1% of 2013 (Carrier/Transport) revenue � Q2 growth rate was 22% Managed Network � YoY growth rate declined in Q3 due to inclusion and Cloud & IT $45 $49 $51 14% of CenterBeam revenue in Q3 2013 Services � Expect 2014 growth rate of 20 � 21% Total Company $308 $297 $298 -4% Notes: � Revenue component amounts sourced from billing data. � Revenue outlook information does not represent guidance, is subject to various risks and uncertainties, one or more of which could cause actual results to differ, and is not subject to being updated. 12 �2015 EarthLink. All rights reserved. |

�
|
|
Cash Flow � Strong Unlevered Free Cash Flow driven by Adjusted EBITDA and Capex improvements $�Millions Q3 '14 Beginning Cash & Cash Equivalents $�98 � Capex of $25 million, continuing trend of lower capital Adjusted EBITDA(1) $�59 spending Capital Expenditures $�(25) � Improved processes and efficiencies around CPE, LEC, Integration & Restructuring $�(7) Outsourced Installs and Internal Capitalized Labor driving Dividends $�(5) down costs Other/Changes in Net Working Capital $�10 � Driving vendor cost savings through improved Ending Cash & Cash Equivalents $�130 procurement practices Adj. EBITDA, Cap. Exp., and Unlevered Free Cash Flow(1) $75 $56 $59 $50 $50 $51 $50 $34 $23 $27 $25 $25 $16 Millions $- $(25) $(23) $(26) $(25) $(33) $(34) $(50) Q3 2013 Q4 2013 Q1 2014 Q2 2014 Q3 2014 Adj. EBITDA Cap. Exp. Unlevered Free Cash Flow (1) Adjusted EBITDA and Unlevered Free Cash Flow are a Non-GAAP measures. See appendix for additional information on non-GAAP measures 13 �2015 EarthLink. All rights reserved. |

�
|
|
Balance Sheet Highlights $�MillionsQ3 '14 EarthLink Cash & Marketable Securities $130 8 7/8% Senior Notes due 2019 300 7 3/8% Senior Secured Notes due 2020 300 $135 M Credit Facility - Undrawn- Total Debt(1) 600 Net Debt 470$�2014 Adjusted EBITDA(2) Guidance midpoint 210$�Total Debt/Adj. EBITDA 2.9xNet Debt/Adj. EBITDA 2.2x (1) Excludes capital leases (2) Adjusted EBITDA is a Non-GAAP measure. See appendix for additional information on non-GAAP measures �2015 EarthLink. All rights reserved. We maintain a healthy balance sheet�Gross leverage fell below 3x during Q3. �We continue to maintain net leverage below 3x�We have access to a $135M revolving credit facility that remains undrawn 14 |

�
|
|
Summary � Focus on managed network with relevant cloud services to retail-like industries � Manage other products for cash flow � Simplifying and improving products and marketing � Transformation of go-to-market efforts � Complete IT systems integration � Look for opportunities to accelerate transformation through strategic portfolio alternatives � Simplified organization and operating model � Improved opex and cash flow management � Company has a solid balance sheet � Valuable assets (e.g. fiber, tax assets) underpinning the business 15 �2015 EarthLink. All rights reserved. |

�
|
|
Appendix �2015 EarthLink. All rights reserved. |

�
|
|
Executive & Financial Leadership Joseph F. Eazor Brad Ferguson President and Chief Executive Officer EVP and Chief Financial Officer � Joined EarthLink in January 2014 � Chief Financial Officer since August 2009. EarthLink's Vice President, � Served as Executive Vice President, Global Accounts and OEM at Controller since September 2005 and Principal Accounting Officer; EMC Corporation, where he managed the company�s Global previously EarthLink's Vice President, Commercial Finance and Treasurer Accounts to help customers maximize � Joined EarthLink with merger with MindSpring Enterprises, Inc. in 2000,the benefits of EMC�s technologies and services where he was Vice President, Treasurer of MindSpring � Joined EMC in 2010 from McKinsey & Co., where he was a senior � CPA; previously member of the audit practice at Arthur Andersen LLP partner focusing on large technology companies and consulted with EMC, a McKinsey client � Prior to that, head of HP Enterprise Services, a $25 billion division with 130,000 employees worldwide. He joined HP in 2008, when the company acquired the leading services provider EDS, where he led acquisition negotiations and integration with HP over the subsequent two years � For 15 years before the merger, served in key strategic and executive roles with EDS, A.T. Kearney, and in the oil and gas industry 17 �2015 EarthLink. All rights reserved. |
�
|
|
2014 Full Year Guidance Range Original Guidance Previous Guidance Revised 2014 Guidance (February 2014) (August 2014) (November 2014) $�Millions Low End High End Low End High End Low End High End Revenue $1,160 $1,180 $1,160 $1,180 $1,168 $1,175 Adjusted $180 $195 $190 $200 $206 $213 EBITDA(1) Net Loss $(85) $(95) $(83) $(90) $(65) $(68) Capital $125 $135 $105 $115 $100 $105 Expenditures Reduced expected capital Raised midpoint of Adjusted EBITDA expenditures by $10 million in guidance from $195 to $210. May, again in August, and by Raised midpoint of Net Income guidance $7.5 million in November. from $(87) to $(67). (1) Adjusted EBITDA is a Non-GAAP measure. See appendix for additional information on non-GAAP measures 18 �2015 EarthLink. All rights reserved. |

�
|
|
EarthLink Customers Gov. Retail Financial Services Other Health-care 19 �2015 EarthLink. All rights reserved. |

�
|
|
Network Map 20 �2015 EarthLink. All rights reserved. |

�
|
|
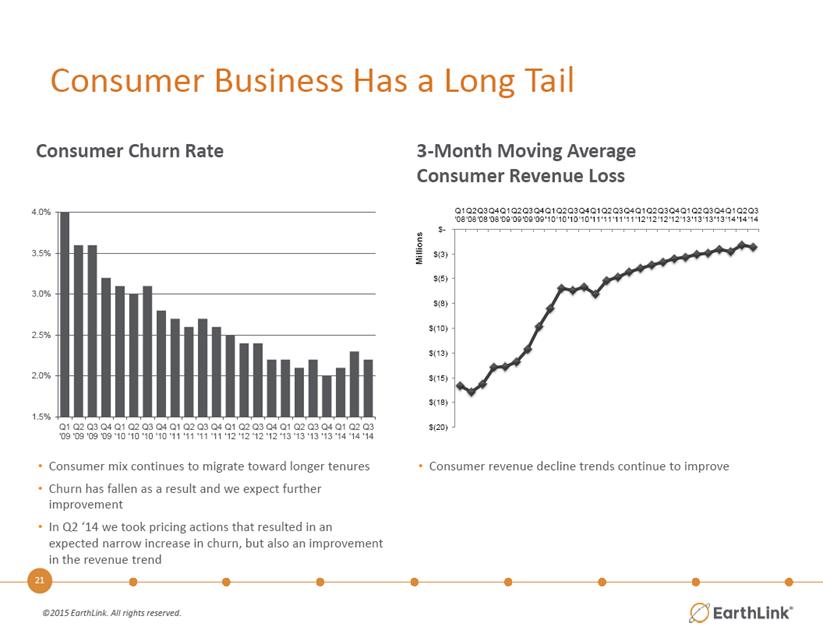
Consumer Business Has a Long Tail Consumer Churn Rate 3-Month Moving Average Consumer Revenue Loss �Consumer mix continues to migrate toward longer tenures�Churn has fallen as a result and we expect further improvement�In Q2 �14 we took pricing actions that resulted in an expected narrow increase in churn, but also an improvement in the revenue trend �Consumer revenue decline trends continue to improve �2015 EarthLink. All rights reserved. 21 |
�
|
|
Significant Tax Assets ~$600M Federal NOLs � Legacy ELNK & Deltacom Assuming $50M Currently paying taxable income $32M Net State low single digit average, we NOLs millions of expect to shield dollars cash taxes well into 2020s(1) One Comm purchase treated as asset acquisition �Able to deduct Dep/Amort We have tax assets that will save approximately $200 million of cash taxes (1) Illustrative � if taxable income averaged ~$50 million annually 22 �2015 EarthLink. All rights reserved. |

�
|
|
Non GAAP Information EarthLink Non-GAAP Measures Adjusted EBITDA is defined as net income (loss) before interest expense and other, net, income taxes, depreciation and amortization, stock-based compensation expense, impairment of goodwill and long-lived assets, restructuring, acquisition and integration-related costs, and gain (loss) from discontinued operations, net of tax. Unlevered Free Cash Flow is defined as net income (loss) before interest expense and other, net, income taxes, depreciation and amortization, stock based compensation expense, impairment of goodwill and long-lived, restructuring, acquisition and integration-related costs, and gain (loss) from discontinued operations, net of tax, less cash used for purchases of property and equipment. Adjusted Net Loss is defined as net loss excluding the non-cash charge to record a valuation allowance against deferred tax assets, the non-cash impairment of goodwill and estimated tax impact and the non-cash impairment of long-lived assets. Adjusted EBITDA, Unlevered Free Cash Flow and Adjusted Net Loss are non-GAAP measures and are not determined in accordance with U.S. generally accepted accounting principles. These non-GAAP financial measures are commonly used in the industry and are presented because management believes they provide relevant and useful information to investors. Management uses these non-GAAP financial measures to evaluate the performance of its business and determine bonuses. Management believes that excluding the effects of certain non-cash and non-operating items enables investors to better understand and analyze the current period�s results and provides a better measure of comparability. There are limitations to using these non-GAAP financial measures. Adjusted EBITDA, Unlevered Free Cash Flow and Adjusted Net Loss are not indicative of cash provided or used by operating activities and may differ from comparable information provided by other companies. Adjusted EBITDA, Unlevered Free Cash Flow and Adjusted Net Loss should not be considered in isolation, as an alternative to, or more meaningful than measures of financial performance determined in accordance with U.S. GAAP. 23 �2015 EarthLink. All rights reserved. |

�
|
|
2014 Guidance Non GAAP Reconciliation Year Ending December 31, 2014 Net loss $(68) - $(65) Interest expense and other, net 56 Income tax benefit (4) - (3) Depreciation and amortization186 - 187 Stock-based compensation expense 13 Impairment of good will and long-lived assets 11 Restructuring, acquisition and integration-related costs 12 - 14 Adjusted EBITDA $206- $213 EARTHLINK HOLDINGS CORP. Reconciliation of Net Loss to Adjusted EBITDA(in millions) 24�2015 EarthLink. All rights reserved. 24 |

�
|
|
Historical Non GAAP Reconciliations EARTHLINK HOLDINGS CORP. Reconciliation of Net Loss to Adjusted EBITDA (In thousands) Three Months Ended September 30, 2013 December 31, 2013 March 31, 2014 June 30, 2014 September 30,2014 Net loss $(11,338) $(279,873) $(26,470) $(21,838) $(1,952) Interest expense and other, net 13,985 13,972 13,956 14,082 13,970 Income tax provision (benefit) (4,582) 251,260 363 374 (4,329) Depreciation and amortization 46,689 48,800 46,855 45,615 46,716 Stock-based compensation expense 1,238 4,057 4,943 2,335 2,930 Impairment of goodwill and long-lived assets - - 5,334 5,437 589 Restructuring, acquisition and integration-related costs 9,928 11,562 4,977 4,908 1,108 (Gain) loss from discontinued operations, net of tax 225 339 (55) (6) - Adjusted EBITDA $56,145 $50,117 $49,903 $50,907 $59,032 25 |

�
|
|
Additional Non GAAP Reconciliations EARTHLINK HOLDINGS CORP. Reconciliation of Net Loss to Unlevered Free Cash Flow (in thousands) Three Months Ended September 30, December 31, March 31, June 30, September 30, 2013 2013 2014 2014 2014 Net loss (11,338) $�(279,873) $�(26,470) $�(21,838) $�(1,952) $�Interest expense and other, net 13,985 13,972 13,956 14,082 13,970 Income tax provision (benefit) (4,582) 251,260 363 374 (4,329) Depreciation and amortization 46,689 48,800 46,855 45,615 46,716 Stock-based compensation expense 1,238 4,057 4,943 2,335 2,930 Impairment of goodwill and long-lived assets - - 5,334 5,437 589 Restructuring, acquisition and integration-related costs 9,928 11,562 4,977 4,908 1,108 (Gain) loss from discontinued operations, net of tax 225 339 (55) (6) - Purchases of property and equipment (32,792) (33,967) (23,384) (25,965) (24,890) Unlevered Free Cash Flow 23,353 $�16,150 $�26,519 $�24,942 $�34,142 $�EARTHLINK HOLDINGS CORP Reconciliation of Net Cash Provided by Operating Activities to Unlevered Free Cash Flow (in thousands) Three Months Ended September 30, December 31, March 31, June 30, September 30, 2013 2013 2014 2014 2014 Net cash provided by operating activities 39,890 $�40,726 $�21,306 $�17,969 $�62,063 $�Income tax provision (benefit) (4,582) 251,260 363 374 (4,329) Non-cash income taxes 4,603 (253,076) (210) (242) 4,391 Interest expense and other, net 13,985 13,972 13,956 14,082 13,970 Amortization of debt discount, premium and issuance costs (996) (1,017) (1,016) (1,022) (1,029) Restructuring, acquisition and integration-related costs 9,928 11,562 4,977 4,908 1,108 Changes in operating assets and liabilities (6,910) (13,612) 10,437 14,732 (16,918) Purchases of property and equipment (32,792) (33,967) (23,384) (25,965) (24,890) Other, net 227 302 90 106 (224) Unlevered Free Cash Flow 23,353 $�16,150 $�26,519 $�24,942 $�34,142 $�Net cash used in investing activities (20,311) (33,967) (23,384) (25,379) (25,390) Net cash used in financing activities (17,576) (6,026) (6,045) (2,651) (5,513) 26 |

�
|
|
Cautionary Information Regarding Forward Looking Statements This presentation -looking� statements (rather than historical includes �forward es that could cause actual results to differ materially from thosefacts) that are subject described. Although we believe that the expectations expressed in these forward-looking statements are reasonable, we cannot promise that our expectations will turn out to be correct. Our actual results could be materially different from and worse than our expectations. With respect to such forward-looking statements, we seek the protections afforded by the Private Securities Litigation Reform Act of 1995. These risks include, without limitation: (1) we may not be able to execute our strategy to be a leading IT services and communications provider, which could adversely affect our results of operations and cash flows; (2) we may not be able to grow revenues from our growth products and services to offset declining revenues from our traditional products and services, which could adversely affect our results of operations and cash flows; (3) our failure to achieve operating efficiencies will adversely affect our results of operations; (4) as a result of our continuing review of our business, we may determine to undertake further restructuring plans that would require additional charges, including incurring facility exit and restructuring charges; (5) we may be unsuccessful integrating acquisitions into our business, which could result in operating difficulties, losses and other adverse consequences; (6) if we are unable to adapt to changes in technology and customer demands, we may not remain competitive, and our revenues and operating results could suffer; (7) unfavorable general economic conditions could harm our business; (8) we may be unable to successfully identify, manage and assimilate future acquisitions, which could adversely affect our results of operations; (9) we face significant competition in the communications and IT services industry that could reduce our profitability; (10) failure to retain existing customers could adversely affect our results of operations and cash flows; (11) decisions by legislative or regulatory authorities, including the Federal Communications Commission relieving incumbent carriers of certain regulatory requirements, and possible further deregulation in the future, may restrict our ability to provide services and may increase the costs we incur to provide these services; (12) if we are unable to interconnect with AT&T, Verizon and other incumbent carriers on acceptable terms, our ability to offer competitively priced local telephone services will be adversely affected; (13) our operating performance will suffer if we are not offered competitive rates for the access services we need to provide our long distance services; (14) we may experience reductions in switched access and reciprocal compensation revenue; (15) that failure to obtain and maintain necessary permits and rights-of-way could interfere with our network infrastructure and operations; (16) we have substantial business relationships with several large telecommunications carriers, and some of our customer agreements may not continue due to financial difficulty, acquisitions, non-renewal or other factors, which could adversely affect our wholesale revenue and results of operations; (17) we obtain a majority of our network equipment and software from a limited number of third-party suppliers; (18) work stoppages experienced by other communications companies on whom we rely for service could adversely impact our ability to provision and service our customers; (19) our commercial and alliance arrangements may not be renewed or may not generate expected benefits, which could adversely affect our results of operations; (20) our consumer business is dependent on the availability of third-party network service providers; (21) we face significant competition in the Internet access industry that could reduce our profitability; (22) the continued decline of our consumer access subscribers will adversely affect our results of operations; (23) potential regulation of Internet service providers could adversely affect our operations; (24) cyber security breaches could harm our business; (25) privacy concerns relating to our business could damage our reputation and deter current and potential users from using our services; (26) interruption or failure of our network, information systems or other technologies could impair our ability to provide our services, which could damage our reputation and harm our operating results; (27) our business depends on effective business support systems and processes; (28) if we, or other industry participants, are unable to successfully defend against disputes or legal actions, we could face substantial liabilities or suffer harm to our financial and operational prospects; (29) we may be accused of infringing upon the intellectual property rights of third parties, which is costly to defend and could limit our ability to use certain technologies in the future; (30) we may not be able to protect our intellectual property; (31) we may be unable to hire and retain sufficient qualified personnel, and the loss of any of our key executive officers could adversely affect us; (32) government regulations could adversely affect our business or force us to change our business practices; (33) our business may suffer if third parties are unable to provide services or terminate their relationships with us; (34) we may be required to recognize impairment charges on our goodwill and intangible assets, which would adversely affect our results of operations and financial position; (35) we may not realize our deferred tax assets, we may have exposure to greater than anticipated tax liabilities and we may be limited in the use of our net operating losses and certain other tax attributes in the future; (36) our indebtedness could adversely affect our financial health and limit our ability to react to changes in our industry; (37) we may require substantial capital to support business growth, and this capital may not be available to us on acceptable terms, or at all; (38) our debt agreements include restrictive covenants, and failure to comply with these covenants could trigger acceleration of payment of outstanding indebtedness or limit our ability to draw on our revolving credit facility; (39) we may reduce, or cease payment of, quarterly cash dividends; (40) our stock price may be volatile; (41) provisions of our certificate of incorporation, bylaws and other elements of our capital structure could limit our share price and delay a change of control of the company; and (42) our bylaws designate the Court of Chancery of the State of Delaware as the sole and exclusive forum for certain types of actions and proceedings that may be n obtaining a judicial forum for disputes with us or our directors,by our stockholders, which officers or employees. These risks and uncertainties, as well as other risks and uncertainties that could cause our actual results to differ significantly from not intended to represent a complete list of all risks and uncertainties inherent in our business, and should be read in conjunction with the more detailed cautionary statements and risk factors included in our Annual Report on Form 10-K for the year ended December 31, 2013. 27 �2015 EarthLink. All rights reserved. |

�
|
|
[LOGO] |

�
�
Serious News for Serious Traders! Try StreetInsider.com Premium Free!
You May Also Be Interested In
- ACTS LAW Addresses Federal Correctional Institution in Dublin Controversy
- Amteck Graduates Seven Apprentices
- FINSIGHT Acquires T-REX to Drive the Next Generation Cashflow Analytics Solution for the Global Private Credit and Structured Finance Industries
Create E-mail Alert Related Categories
SEC FilingsSign up for StreetInsider Free!
Receive full access to all new and archived articles, unlimited portfolio tracking, e-mail alerts, custom newswires and RSS feeds - and more!
