

Form 8-K Daseke, Inc. For: May 07
 Tweet
Tweet Share
ShareExhibit 99.1
| Q1 Earnings Presentation May 7, 2021 |

| Important Disclaimers 2 Forward-Looking Statements This presentation contains “forward-looking statements” within the meaning of the Private Securities Litigation Reform Act of 1995. All statements, other than statements of historical fact, are forward-looking statements. Forward-looking statements may be identified by the use of words such as “may,” “will,” “continue,” “forecast,” “intend,” “seek,” “target,” “anticipate,” “believe,” “expect,” “estimate,” “plan,” “outlook,” “should,” “could,” “would,” “predict,” “potential,” and “project,” the negative of these terms, or other comparable terminology and similar expressions. Forward-looking statements may include projected financial information and results as well as statements about Daseke’s goals, including its restructuring plans; Daseke’s financial strategy, liquidity and capital required for its business strategy and plans; and general economic conditions. The forward-looking statements contained herein are based on information available as of the date of this news release and current expectations, forecasts and assumptions. While management believes that these forward-looking statements are reasonable as and when made, there can be no assurance that future developments affecting us will be those that Daseke anticipates, and readers are cautioned not to place undue reliance on the forward-looking statements. A number of factors, many of which are beyond our control, could cause actual results or outcomes to differ materially from those indicated by the forward-looking statements contained herein. These factors include, but are not limited to, general economic and business risks, such as downturns in customers’ business cycles and disruptions in capital and credit markets (including as a result of the coronavirus (COVID-19) pandemic or other global and national heath epidemics or concerns); Daseke’s ability to adequately address downward pricing and other competitive pressures; driver shortages and increases in driver compensation or owner-operator contracted rates; Daseke’s ability to execute and realize all of the expected benefits of its integration, business improvement and comprehensive restructuring plans; loss of key personnel; Daseke’s ability to realize all of the intended benefits from recent or future acquisitions; Daseke’s ability to complete recent or future divestitures successfully; seasonality and the impact of weather and other catastrophic events; fluctuations in the price or availability of diesel fuel; increased prices for, or decreases in the availability of, new revenue equipment and decreases in the value of used revenue equipment; Daseke’s ability to generate sufficient cash to service all of its indebtedness and Daseke’s ability to finance its capital requirements; restrictions in Daseke’s existing and future debt agreements; increases in interest rates; changes in existing laws or regulations, including environmental and worker health safety laws and regulations and those relating to tax rates or taxes in general; the impact of governmental regulations and other governmental actions related to Daseke and its operations; insurance and claims expenses; and litigation and governmental proceedings. For additional information regarding known material factors that could cause our actual results to differ from those expressed in forward-looking statements, please see Daseke’s filings with the Securities and Exchange Commission (the “SEC”), available at www.sec.gov, including Daseke’s Annual Report on Form 10-K/A filed with the SEC on March 6, 2020 and subsequent Quarterly Reports on Form 10-Q, particularly the section titled “Risk Factors.” The effect of the COVID-19 pandemic may remain prevalent for a significant period of time and may continue to adversely affect the Company’s business, results of operations and financial condition even after the COVID-19 pandemic has subsided and “stay at home” mandates have been lifted. The extent to which the COVID-19 pandemic impacts the Company will depend on numerous evolving factors and future developments that we are not able to predict. There are no comparable recent events that provide guidance as to the effect the COVID-19 global pandemic may have, and, as a result, the ultimate impact of the pandemic is highly uncertain and subject to change. Additionally, the Company will regularly evaluate its capital structure and liquidity position. From time to time and as opportunities arise, the Company may access the debt capital markets and modify its debt arrangements to optimize its capital structure and liquidity position. Daseke does not undertake any obligation to update forward-looking statements to reflect events or circumstances after the date as of when they were made, whether as a result of new information, future events or otherwise, except as may be required under applicable securities laws. You should not place undue reliance on these forward-looking statements. Non-GAAP Financial Measures This presentation includes non-GAAP financial measures for the Company and its reporting segments. The Company believes its presentation of Non-GAAP financial measures is useful because it provides investors and industry analysts the same information that the Company uses internally for purposes of assessing its core operating performance. You can find the reconciliations of these measures to the nearest comparable GAAP measure in the Appendix of this presentation. Please note that non-GAAP measures are not a substitute for, or more meaningful than, net income (loss), cash flows from operating activities, operating income or any other measure prescribed by GAAP, and there are limitations to using non-GAAP measures. Certain items excluded from these non-GAAP measures are significant components in understanding and assessing a company’s financial performance, such as a company’s cost of capital, tax structure and the historic costs of depreciable assets. Also, other companies in Daseke’s industry may define these non‐GAAP measures differently than Daseke does, and as a result, it may be difficult to use these non‐GAAP measures to compare the performance of those companies to Daseke’s performance. Because of these limitations, these non-GAAP measures should not be considered a measure of the income generated by Daseke’s business or discretionary cash available to it to invest in the growth of its business. Daseke’s management compensates for these limitations by relying primarily on Daseke’s GAAP results and using these non-GAAP measures supplementally. In the non-GAAP measures discussed below, management refers to certain material items that management believes do not reflect the Company’s core operating performance, which management believes represent its performance in the ordinary, ongoing and customary course of its operations. Management views the Company’s core operating performance as its operating results excluding the impact of items including, but not limited to, stock based compensation, impairments, amortization of intangible assets, restructuring, business transformation costs, and severance. Management believes excluding these items enables investors to evaluate more clearly and consistently the Company’s core operational performance in the same manner that management evaluates its core operational performance. Daseke defines: Adjusted EBITDA as net income (loss) plus depreciation and amortization, interest, income taxes, and other material items that management believes do not reflect our core operating performance. Adjusted EBITDA Margin as Adjusted EBITDA as a percentage of total revenue. Adjusted Net Income (Loss) ex-Aveda as net income (loss) tax-adjusted using an adjusted effective tax rate for material items that management believes do not reflect our core operating performance and excluding the impact of Aveda. Adjusted Net Income (Loss) per share as Adjusted Net Income (Loss) ex-Aveda divided by the weighted average number of shares of common stock outstanding during the period under the two-class method. Free Cash Flow as net cash provided by operating activities less purchases of property and equipment, plus proceeds from sale of property and equipment as such amounts are shown on the face of the Statements of Cash Flows. Adjusted Operating Income (Loss) as total revenue less Adjusted Operating Expenses. Adjusted Operating Expenses as total operating expenses less material items that management believes do not reflect our core operating performance. Adjusted Operating Ratio as Adjusted Operating Expenses, as a percentage of total revenue. Revenue excluding fuel surcharge as revenue less fuel surcharges. Net Debt as total debt less cash and cash equivalents. The Company uses certain metrics and ratios as a supplement to its GAAP results in evaluating certain aspects of its business, as described below. The Company defines previously defined terms appended with “ex-Aveda” as their previously defined term excluding the impact of the Aveda business, which was disposed of in 2020. See the Appendix for directly comparable GAAP measures. In the non-GAAP measures discussed above, management refers to certain material items that management believes do not reflect the Company’s core operating performance, which management believes represent its performance in the ordinary, ongoing and customary course of its operations. Management views the Company’s core operating performance as its operating results excluding the impact of items including, but not limited to, stock-based compensation, impairments, amortization of intangible assets, restructuring, business transformation costs, and severance. Management believes excluding these items enables investors to evaluate more clearly and consistently the Company’s core operational performance in the same manner that management evaluates its core operational performance. Industry and Market Data This presentation includes market data and other statistical information from third party sources, including independent industry publications, government publications and other published independent sources. Although Daseke believes these third-party sources are reliable as of their respective dates, Daseke has not independently verified the accuracy or completeness of this information. |
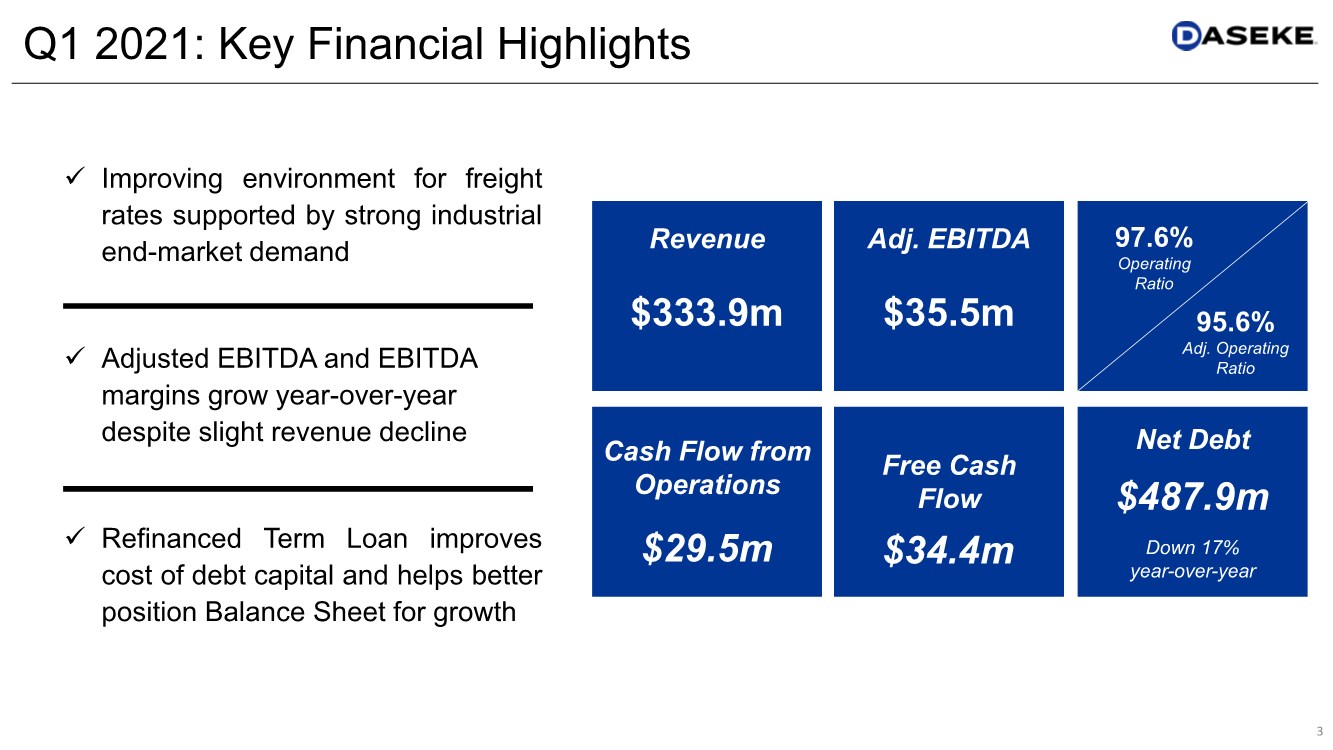
| Q1 2021: Key Financial Highlights 3 ✓ Improving environment for freight rates supported by strong industrial end-market demand ✓ Adjusted EBITDA and EBITDA margins grow year-over-year despite slight revenue decline ✓ Refinanced Term Loan improves cost of debt capital and helps better position Balance Sheet for growth Cash Flow from Operations $29.5m Net Debt $487.9m Down 17% year-over-year Revenue $333.9m Adj. EBITDA $35.5m Free Cash Flow 95.6% Adj. Operating Ratio 97.6% Operating Ratio $34.4m |
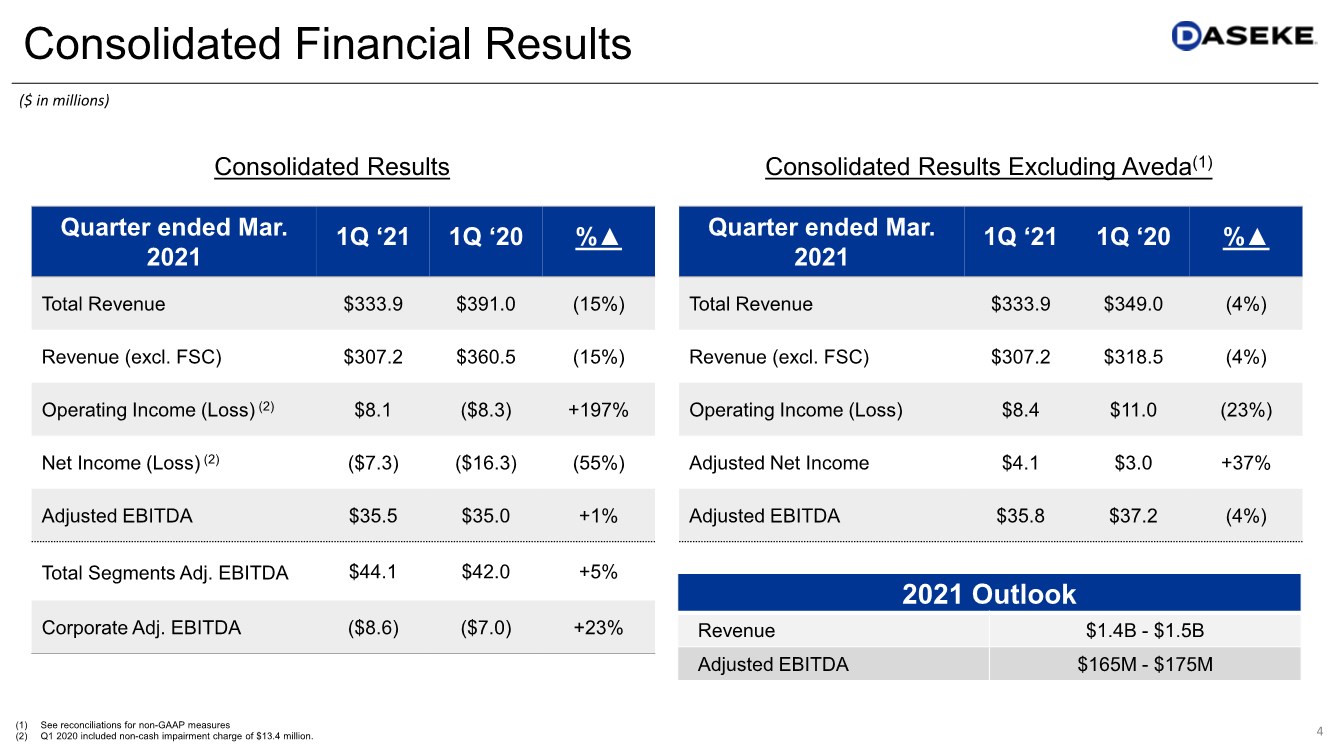
| 4 Consolidated Financial Results (1) See reconciliations for non-GAAP measures (2) Q1 2020 included non-cash impairment charge of $13.4 million. Quarter ended Mar. 2021 1Q ‘21 1Q ‘20 %▲ Total Revenue $333.9 $391.0 (15%) Revenue (excl. FSC) $307.2 $360.5 (15%) Operating Income (Loss) (2) $8.1 ($8.3) +197% Net Income (Loss) (2) ($7.3) ($16.3) (55%) Adjusted EBITDA $35.5 $35.0 +1% Total Segments Adj. EBITDA $44.1 $42.0 +5% Corporate Adj. EBITDA ($8.6) ($7.0) +23% Quarter ended Mar. 2021 1Q ‘21 1Q ‘20 %▲ Total Revenue $333.9 $349.0 (4%) Revenue (excl. FSC) $307.2 $318.5 (4%) Operating Income (Loss) $8.4 $11.0 (23%) Adjusted Net Income $4.1 $3.0 +37% Adjusted EBITDA $35.8 $37.2 (4%) Consolidated Results Excluding Aveda(1) ($ in millions) 2021 Outlook Revenue $1.4B - $1.5B Adjusted EBITDA $165M - $175M Consolidated Results |
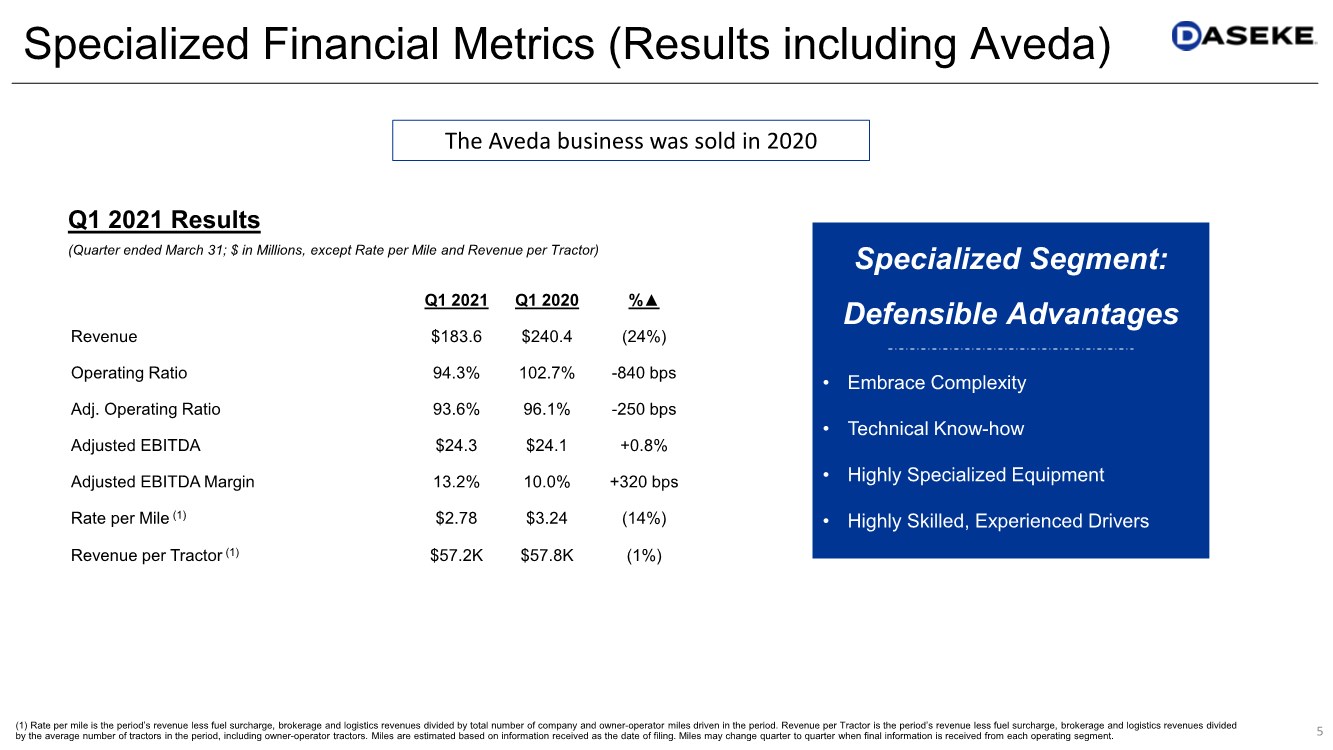
| 5 Specialized Financial Metrics (Results including Aveda) (1) Rate per mile is the period’s revenue less fuel surcharge, brokerage and logistics revenues divided by total number of company and owner-operator miles driven in the period. Revenue per Tractor is the period’s revenue less fuel surcharge, brokerage and logistics revenues divided by the average number of tractors in the period, including owner-operator tractors. Miles are estimated based on information received as the date of filing. Miles may change quarter to quarter when final information is received from each operating segment. Q1 2021 Q1 2020 %▲ Revenue $183.6 $240.4 (24%) Operating Ratio 94.3% 102.7% -840 bps Adj. Operating Ratio 93.6% 96.1% -250 bps Adjusted EBITDA $24.3 $24.1 +0.8% Adjusted EBITDA Margin 13.2% 10.0% +320 bps Rate per Mile (1) $2.78 $3.24 (14%) Revenue per Tractor (1) $57.2K $57.8K (1%) (Quarter ended March 31; $ in Millions, except Rate per Mile and Revenue per Tractor) Q1 2021 Results Specialized Segment: Defensible Advantages • Embrace Complexity • Technical Know-how • Highly Specialized Equipment • Highly Skilled, Experienced Drivers The Aveda business was sold in 2020 |
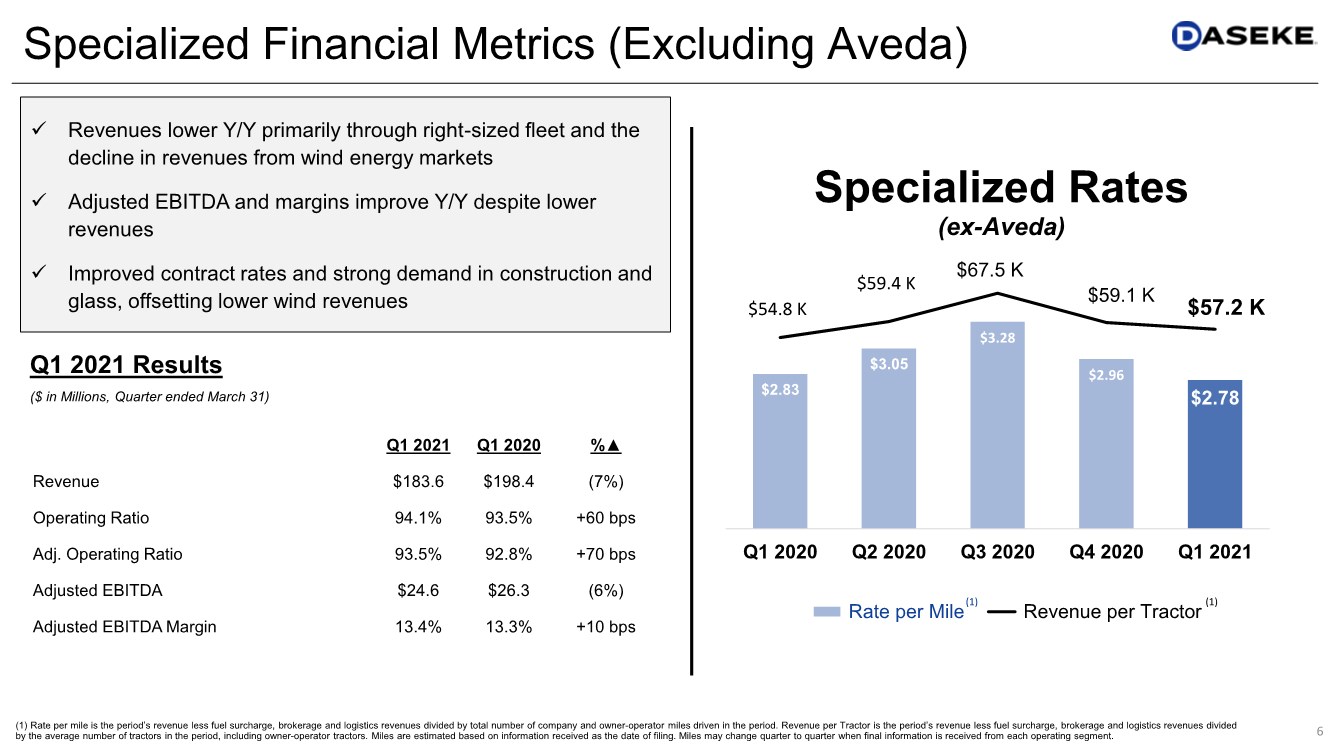
| $2.83 $3.05 $3.28 $2.96 $2.78 $54.8 K $59.4 K $67.5 K $59.1 K $57.2 K $0.00 $4.00 $8.00 $12.00 $16.00 $20.00 $24.00 $28.00 $32.00 $36.00 $40.00 $44.00 $48.00 $52.00 $56.00 $60.00 $64.00 $68.00 $72.00 $1.50 $1.70 $1.90 $2.10 $2.30 $2.50 $2.70 $2.90 $3.10 $3.30 $3.50 $3.70 Q1 2020 Q2 2020 Q3 2020 Q4 2020 Q1 2021 Specialized Rates (ex-Aveda) Rate per Mile Revenue per Tractor 6 Specialized Financial Metrics (Excluding Aveda) Q1 2021 Q1 2020 %▲ Revenue $183.6 $198.4 (7%) Operating Ratio 94.1% 93.5% +60 bps Adj. Operating Ratio 93.5% 92.8% +70 bps Adjusted EBITDA $24.6 $26.3 (6%) Adjusted EBITDA Margin 13.4% 13.3% +10 bps (1) (1) ($ in Millions, Quarter ended March 31) Q1 2021 Results ✓ Revenues lower Y/Y primarily through right-sized fleet and the decline in revenues from wind energy markets ✓ Adjusted EBITDA and margins improve Y/Y despite lower revenues ✓ Improved contract rates and strong demand in construction and glass, offsetting lower wind revenues (1) Rate per mile is the period’s revenue less fuel surcharge, brokerage and logistics revenues divided by total number of company and owner-operator miles driven in the period. Revenue per Tractor is the period’s revenue less fuel surcharge, brokerage and logistics revenues divided by the average number of tractors in the period, including owner-operator tractors. Miles are estimated based on information received as the date of filing. Miles may change quarter to quarter when final information is received from each operating segment. |
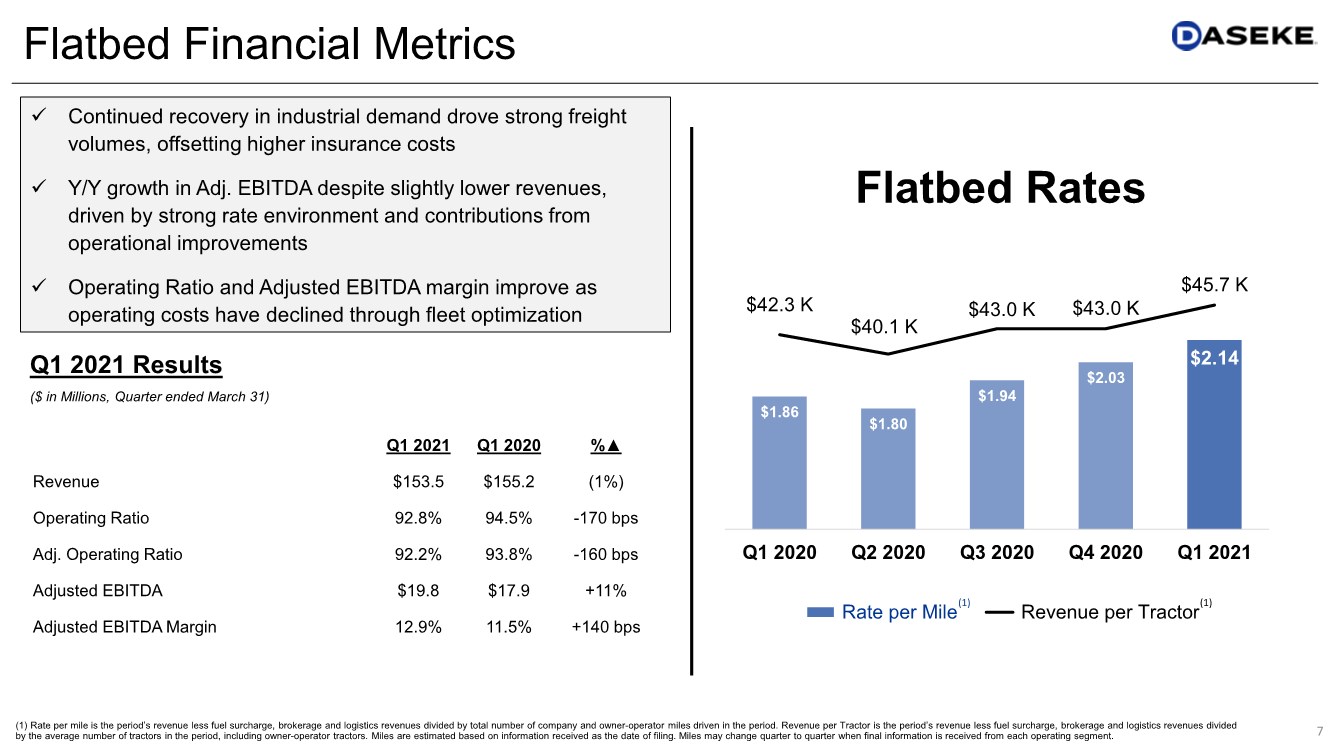
| 7 Flatbed Financial Metrics $1.86 $1.80 $1.94 $2.03 $2.14 $42.3 K $40.1 K $43.0 K $43.0 K $45.7 K $20.00 $25.00 $30.00 $35.00 $40.00 $45.00 $50.00 $1.20 $1.40 $1.60 $1.80 $2.00 $2.20 $2.40 Q1 2020 Q2 2020 Q3 2020 Q4 2020 Q1 2021 Flatbed Rates Rate per Mile Revenue per Tractor (1) (1) Q1 2021 Q1 2020 %▲ Revenue $153.5 $155.2 (1%) Operating Ratio 92.8% 94.5% -170 bps Adj. Operating Ratio 92.2% 93.8% -160 bps Adjusted EBITDA $19.8 $17.9 +11% Adjusted EBITDA Margin 12.9% 11.5% +140 bps ($ in Millions, Quarter ended March 31) Q1 2021 Results ✓ Continued recovery in industrial demand drove strong freight volumes, offsetting higher insurance costs ✓ Y/Y growth in Adj. EBITDA despite slightly lower revenues, driven by strong rate environment and contributions from operational improvements ✓ Operating Ratio and Adjusted EBITDA margin improve as operating costs have declined through fleet optimization (1) Rate per mile is the period’s revenue less fuel surcharge, brokerage and logistics revenues divided by total number of company and owner-operator miles driven in the period. Revenue per Tractor is the period’s revenue less fuel surcharge, brokerage and logistics revenues divided by the average number of tractors in the period, including owner-operator tractors. Miles are estimated based on information received as the date of filing. Miles may change quarter to quarter when final information is received from each operating segment. |
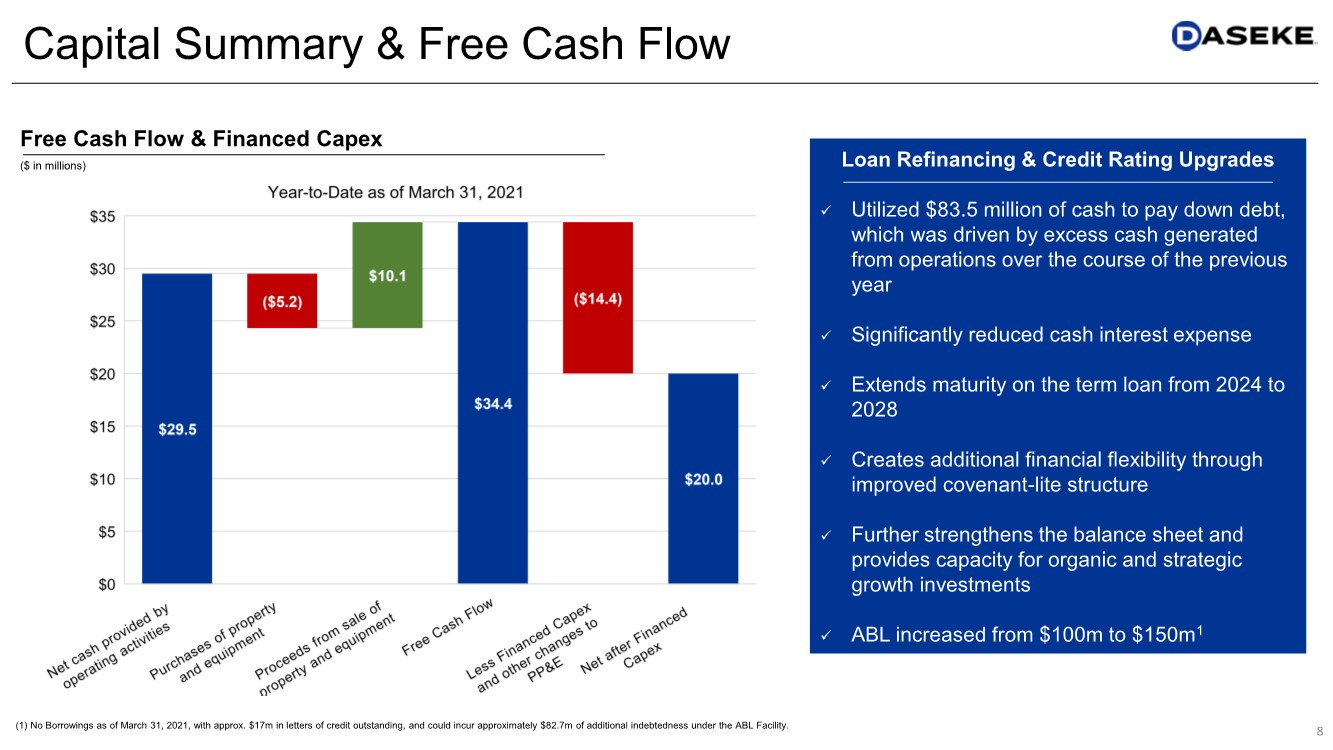
| 8 Capital Summary & Free Cash Flow ($ in millions) Free Cash Flow & Financed Capex Loan Refinancing & Credit Rating Upgrades ✓ Utilized $83.5 million of cash to pay down debt, which was driven by excess cash generated from operations over the course of the previous year ✓ Significantly reduced cash interest expense ✓ Extends maturity on the term loan from 2024 to 2028 ✓ Creates additional financial flexibility through improved covenant-lite structure ✓ Further strengthens the balance sheet and provides capacity for organic and strategic growth investments ✓ ABL increased from $100m to $150m1 (1) No Borrowings as of March 31, 2021, with approx. $17m in letters of credit outstanding, and could incur approximately $82.7m of additional indebtedness under the ABL Facility. |
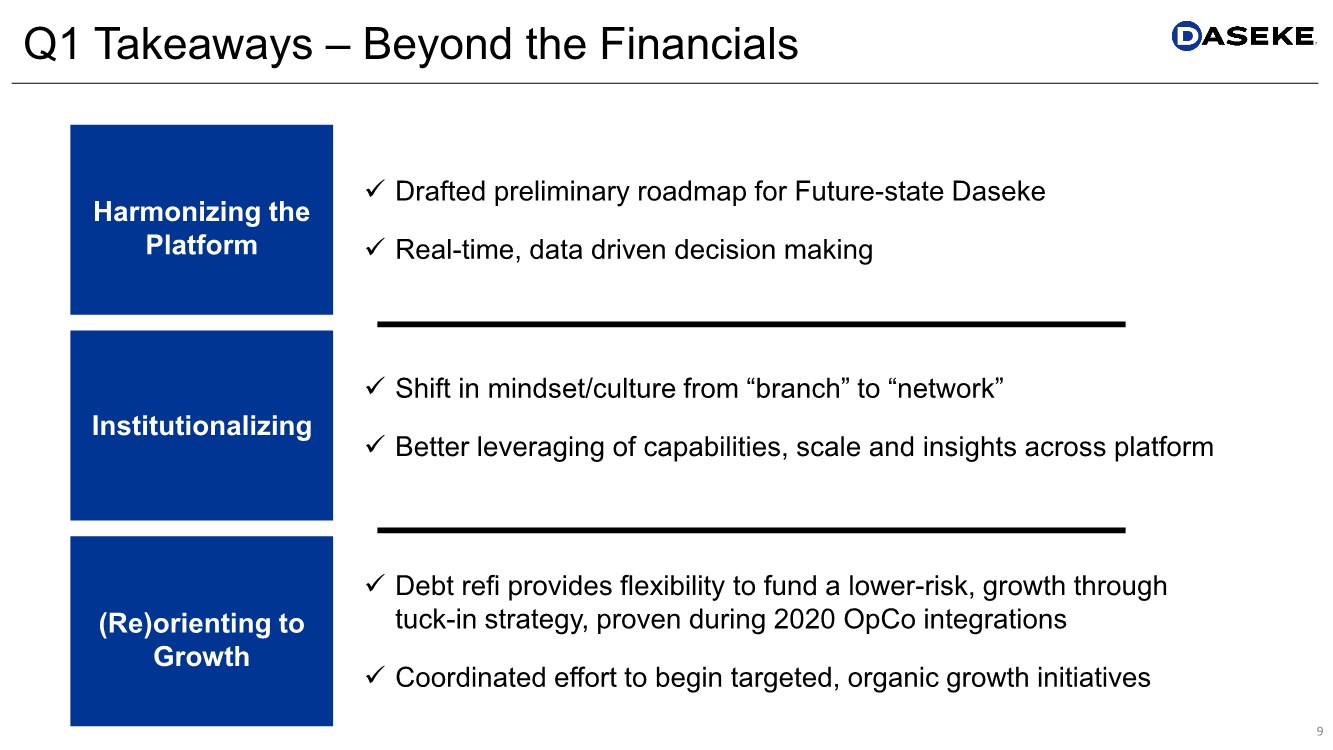
| Q1 Takeaways – Beyond the Financials 9 ✓ Drafted preliminary roadmap for Future-state Daseke ✓ Real-time, data driven decision making (Re)orienting to Growth Harmonizing the Platform Institutionalizing ✓ Shift in mindset/culture from “branch” to “network” ✓ Better leveraging of capabilities, scale and insights across platform ✓ Debt refi provides flexibility to fund a lower-risk, growth through tuck-in strategy, proven during 2020 OpCo integrations ✓ Coordinated effort to begin targeted, organic growth initiatives |
| APPENDIX |
| 11 Financial Reconciliations (Dollars in millions) Net income (loss) $ 6.6 $ 6.4 $ (20.3) $ (7.3) Depreciation and amortization 8.8 13.1 0.3 22.2 Interest income (0.1) — — (0.1) Interest expense 1.7 2.1 7.3 11.1 Income tax expense (benefit) 2.7 2.4 (5.9) (0.8) Stock based compensation 0.1 0.3 2.0 2.4 Change in fair value of warrant liability — — 5.6 5.6 Third party debt refinancing charges — — 2.3 2.3 Other (1) — — 0.1 0.1 Adjusted EBITDA $ 19.8 $ 24.3 $ (8.6) $ 35.5 Less Aveda Adjusted EBITDA (0.3) (0.3) Adjusted EBITDA ex-Aveda $ 24.6 $ 35.8 Total revenue 153.5 183.6 (3.2) 333.9 Total revenue ex-Aveda 183.6 333.9 Net income (loss) margin 4.3 % 3.5 % 634.4 %(2.2) % Adjusted EBITDA margin 12.9 % 13.2 % 268.8 % 10.6 % Adjusted EBITDA ex-Aveda margin 13.4 % 10.7 % Three Months Ended Daseke, Inc. and Subsidiaries Reconciliation of Net Income (Loss) to Adjusted EBITDA ex-Aveda by Segment Reconciliation of Net Income (Loss) Margin to Adjusted EBITDA ex-Aveda Margin by Segment (Unaudited) (In millions) March 31, 2021 Flatbed Specialized Corporate Consolidated (1) Other includes business transformation costs, restructuring, and severance. |

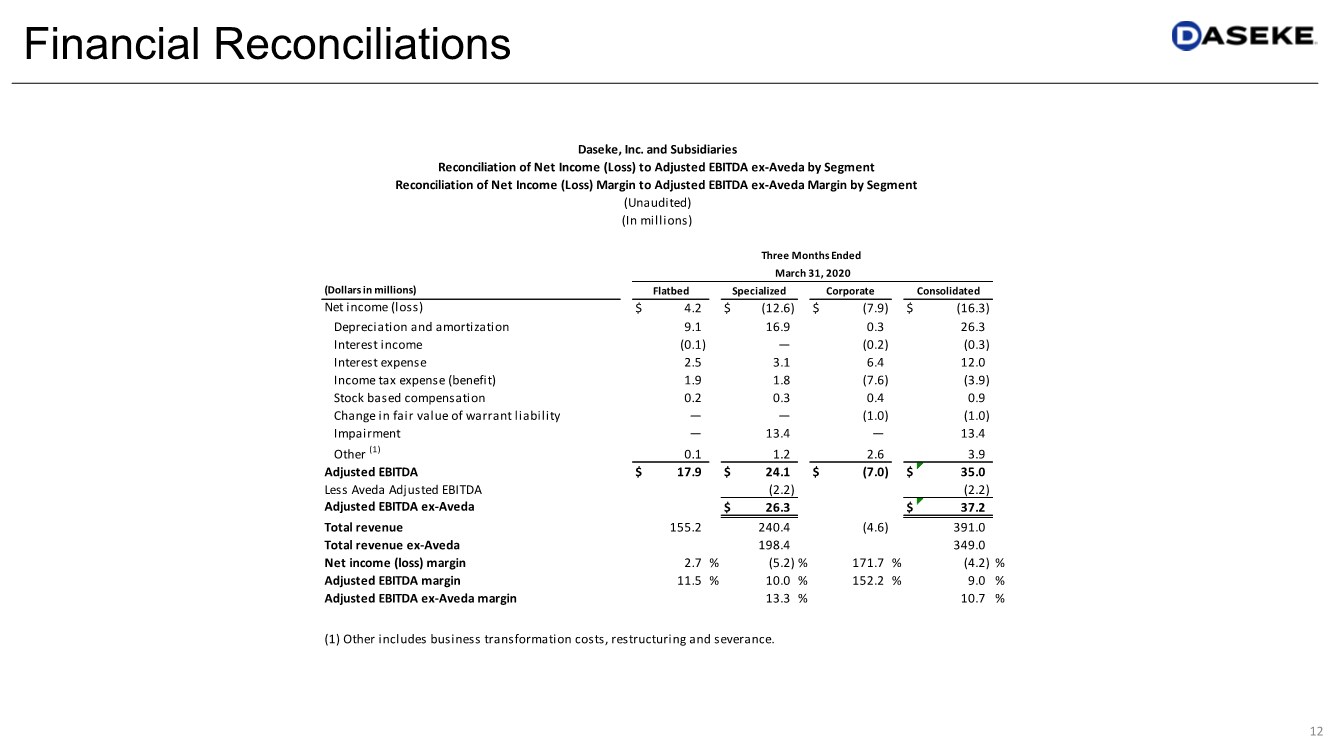
| 12 Financial Reconciliations (Dollars in millions) Net income (loss) $ 4.2 $ (12.6) $ (7.9) $ (16.3) Depreciation and amortization 9.1 16.9 0.3 26.3 Interest income (0.1) — (0.2) (0.3) Interest expense 2.5 3.1 6.4 12.0 Income tax expense (benefit) 1.9 1.8 (7.6) (3.9) Stock based compensation 0.2 0.3 0.4 0.9 Change in fair value of warrant liability — — (1.0) (1.0) Impairment — 13.4 — 13.4 Other (1) 0.1 1.2 2.6 3.9 Adjusted EBITDA $ 17.9 $ 24.1 $ (7.0) $ 35.0 Less Aveda Adjusted EBITDA (2.2) (2.2) Adjusted EBITDA ex-Aveda $ 26.3 $ 37.2 Total revenue 155.2 240.4 (4.6) 391.0 Total revenue ex-Aveda 198.4 349.0 Net income (loss) margin 2.7 %(5.2) % 171.7 %(4.2) % Adjusted EBITDA margin 11.5 % 10.0 % 152.2 % 9.0 % Adjusted EBITDA ex-Aveda margin 13.3 % 10.7 % (In millions) Daseke, Inc. and Subsidiaries Reconciliation of Net Income (Loss) to Adjusted EBITDA ex-Aveda by Segment Reconciliation of Net Income (Loss) Margin to Adjusted EBITDA ex-Aveda Margin by Segment (Unaudited) (1) Other includes business transformation costs, restructuring and severance. Three Months Ended March 31, 2020 Flatbed Specialized Corporate Consolidated |
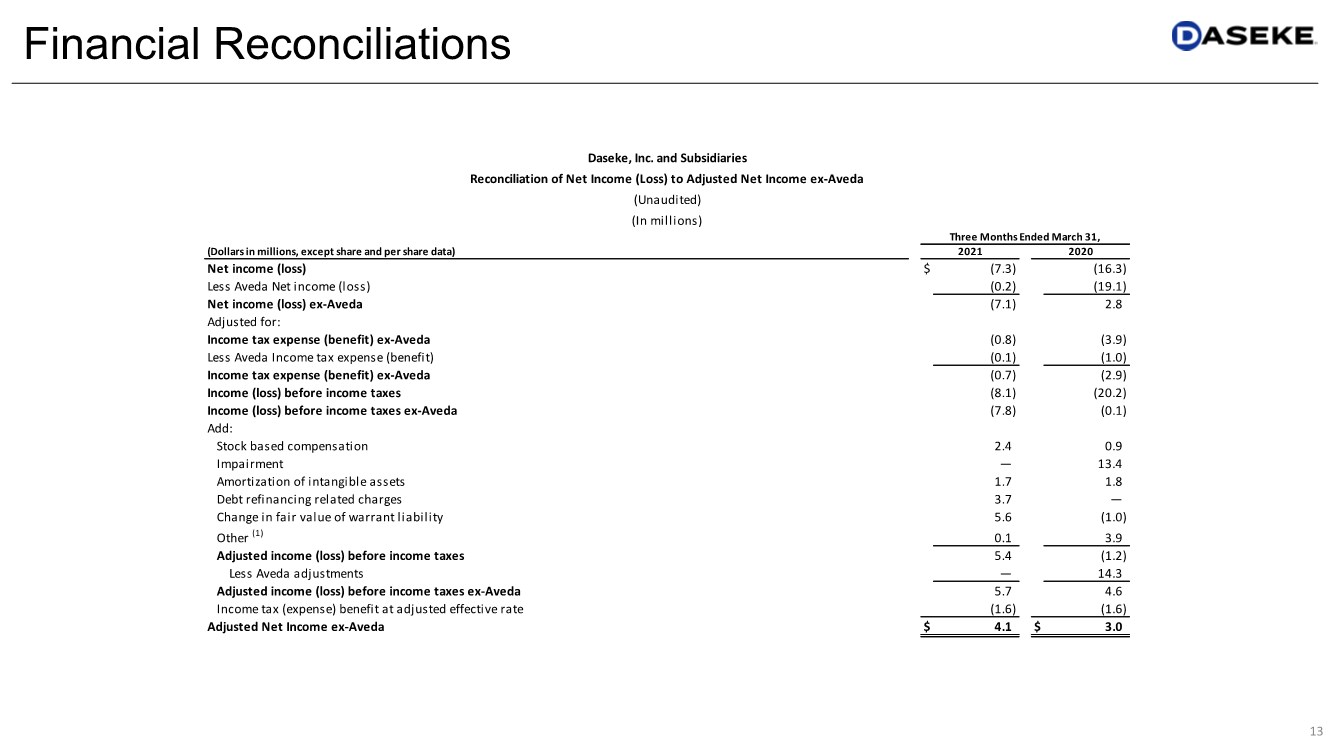
| 13 Financial Reconciliations (Dollars in millions, except share and per share data) Net income (loss) $ (7.3) (16.3) Less Aveda Net income (loss) (0.2) (19.1) Net income (loss) ex-Aveda (7.1) 2.8 Adjusted for: Income tax expense (benefit) ex-Aveda (0.8) (3.9) Less Aveda Income tax expense (benefit) (0.1) (1.0) Income tax expense (benefit) ex-Aveda (0.7) (2.9) Income (loss) before income taxes (8.1) (20.2) Income (loss) before income taxes ex-Aveda (7.8) (0.1) Add: Stock based compensation 2.4 0.9 Impairment — 13.4 Amortization of intangible assets 1.7 1.8 Debt refinancing related charges 3.7 — Change in fair value of warrant liability 5.6 (1.0) Other (1) 0.1 3.9 Adjusted income (loss) before income taxes 5.4 (1.2) Less Aveda adjustments — 14.3 Adjusted income (loss) before income taxes ex-Aveda 5.7 4.6 Income tax (expense) benefit at adjusted effective rate (1.6) (1.6) Adjusted Net Income ex-Aveda $ 4.1 $ 3.0 (In millions) Daseke, Inc. and Subsidiaries Reconciliation of Net Income (Loss) to Adjusted Net Income ex-Aveda (Unaudited) Three Months Ended March 31, 2021 2020 |
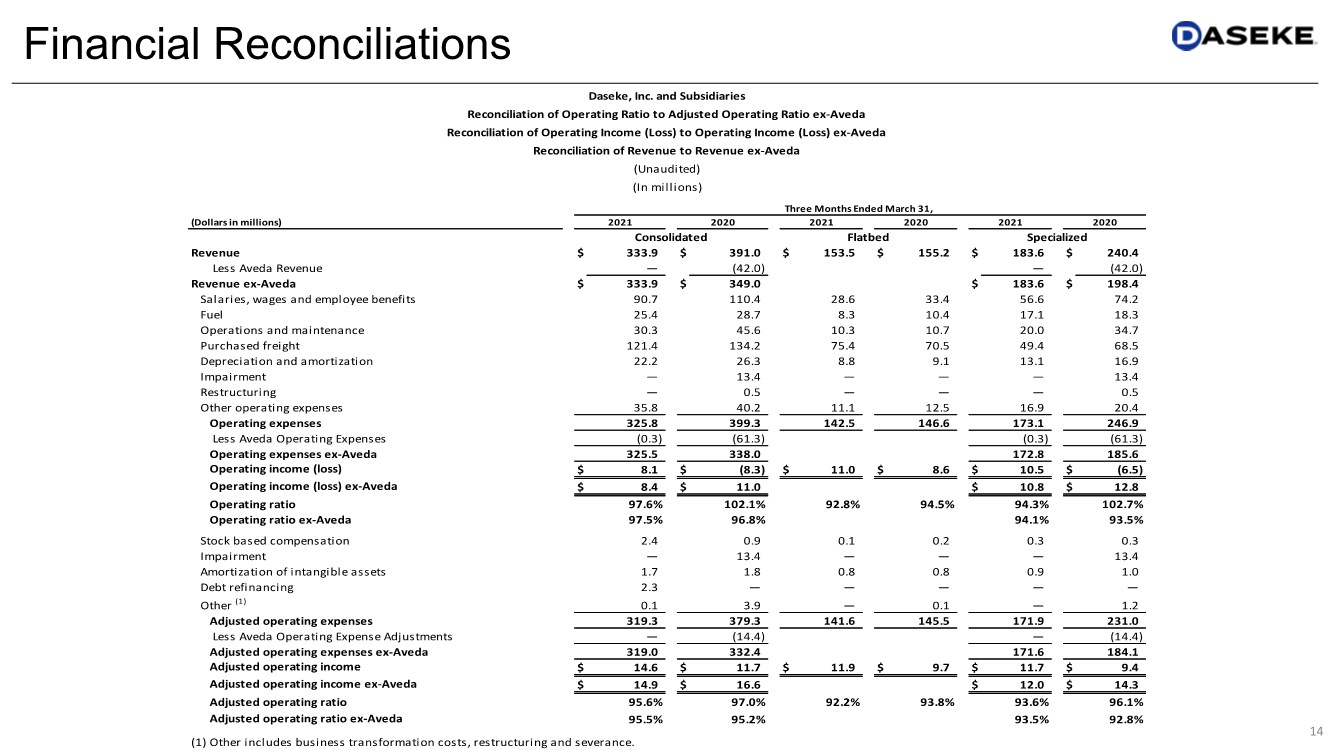
| 14 Financial Reconciliations (Dollars in millions) Revenue $ 333.9 $ 391.0 $ 153.5 $ 155.2 $ 183.6 $ 240.4 Less Aveda Revenue — (42.0) — (42.0) Revenue ex-Aveda $ 333.9 $ 349.0 $ 183.6 $ 198.4 Salaries, wages and employee benefits 90.7 110.4 28.6 33.4 56.6 74.2 Fuel 25.4 28.7 8.3 10.4 17.1 18.3 Operations and maintenance 30.3 45.6 10.3 10.7 20.0 34.7 Purchased freight 121.4 134.2 75.4 70.5 49.4 68.5 Depreciation and amortization 22.2 26.3 8.8 9.1 13.1 16.9 Impairment — 13.4 — — — 13.4 Restructuring — 0.5 — — — 0.5 Other operating expenses 35.8 40.2 11.1 12.5 16.9 20.4 Operating expenses 325.8 399.3 142.5 146.6 173.1 246.9 Less Aveda Operating Expenses (0.3) (61.3) (0.3) (61.3) Operating expenses ex-Aveda 325.5 338.0 172.8 185.6 Operating income (loss) $ 8.1 $ (8.3) $ 11.0 $ 8.6 $ 10.5 $ (6.5) Operating income (loss) ex-Aveda $ 8.4 $ 11.0 $ 10.8 $ 12.8 Operating ratio 97.6% 102.1% 92.8% 94.5% 94.3% 102.7% Operating ratio ex-Aveda 97.5% 96.8% 94.1% 93.5% Stock based compensation 2.4 0.9 0.1 0.2 0.3 0.3 Impairment — 13.4 — — — 13.4 Amortization of intangible assets 1.7 1.8 0.8 0.8 0.9 1.0 Debt refinancing 2.3 — — — — — Other (1) 0.1 3.9 — 0.1 — 1.2 Adjusted operating expenses 319.3 379.3 141.6 145.5 171.9 231.0 Less Aveda Operating Expense Adjustments — (14.4) — (14.4) Adjusted operating expenses ex-Aveda 319.0 332.4 171.6 184.1 Adjusted operating income $ 14.6 $ 11.7 $ 11.9 $ 9.7 $ 11.7 $ 9.4 Adjusted operating income ex-Aveda $ 14.9 $ 16.6 $ 12.0 $ 14.3 Adjusted operating ratio 95.6% 97.0% 92.2% 93.8% 93.6% 96.1% Adjusted operating ratio ex-Aveda 95.5% 95.2% 93.5% 92.8% (In millions) Daseke, Inc. and Subsidiaries Reconciliation of Operating Ratio to Adjusted Operating Ratio ex-Aveda Reconciliation of Operating Income (Loss) to Operating Income (Loss) ex-Aveda Reconciliation of Revenue to Revenue ex-Aveda (Unaudited) Three Months Ended March 31, 2021 2020 2021 2020 2021 2020 Consolidated Flatbed Specialized (1) Other includes business transformation costs, restructuring and severance. |
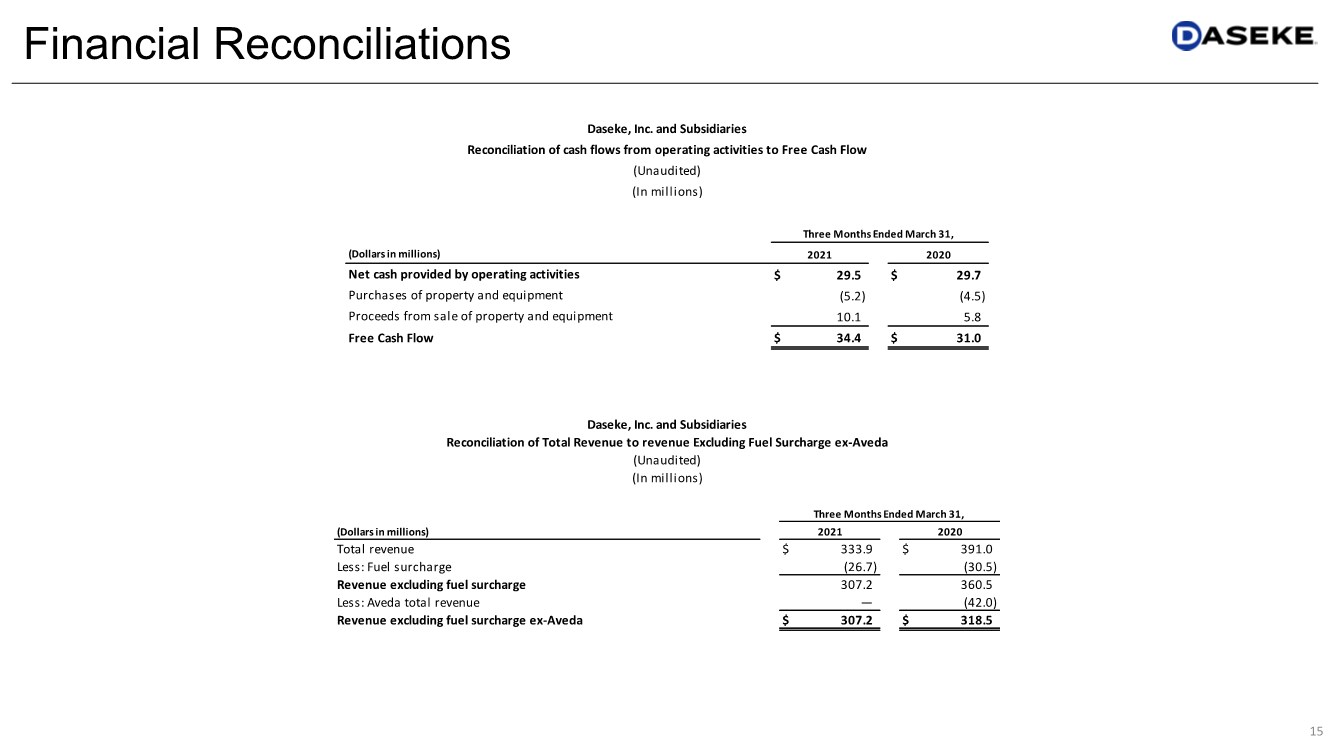
| 15 Financial Reconciliations (Dollars in millions) Net cash provided by operating activities $ 29.5 $ 29.7 Purchases of property and equipment (5.2) (4.5) Proceeds from sale of property and equipment 10.1 5.8 Free Cash Flow $ 34.4 $ 31.0 Daseke, Inc. and Subsidiaries Reconciliation of cash flows from operating activities to Free Cash Flow (Unaudited) (In millions) Three Months Ended March 31, 2021 2020 (Dollars in millions) Total revenue $ 333.9 $ 391.0 Less: Fuel surcharge (26.7) (30.5) Revenue excluding fuel surcharge 307.2 360.5 Less: Aveda total revenue — (42.0) Revenue excluding fuel surcharge ex-Aveda $ 307.2 $ 318.5 2021 2020 Daseke, Inc. and Subsidiaries Reconciliation of Total Revenue to revenue Excluding Fuel Surcharge ex-Aveda (Unaudited) (In millions) Three Months Ended March 31, |
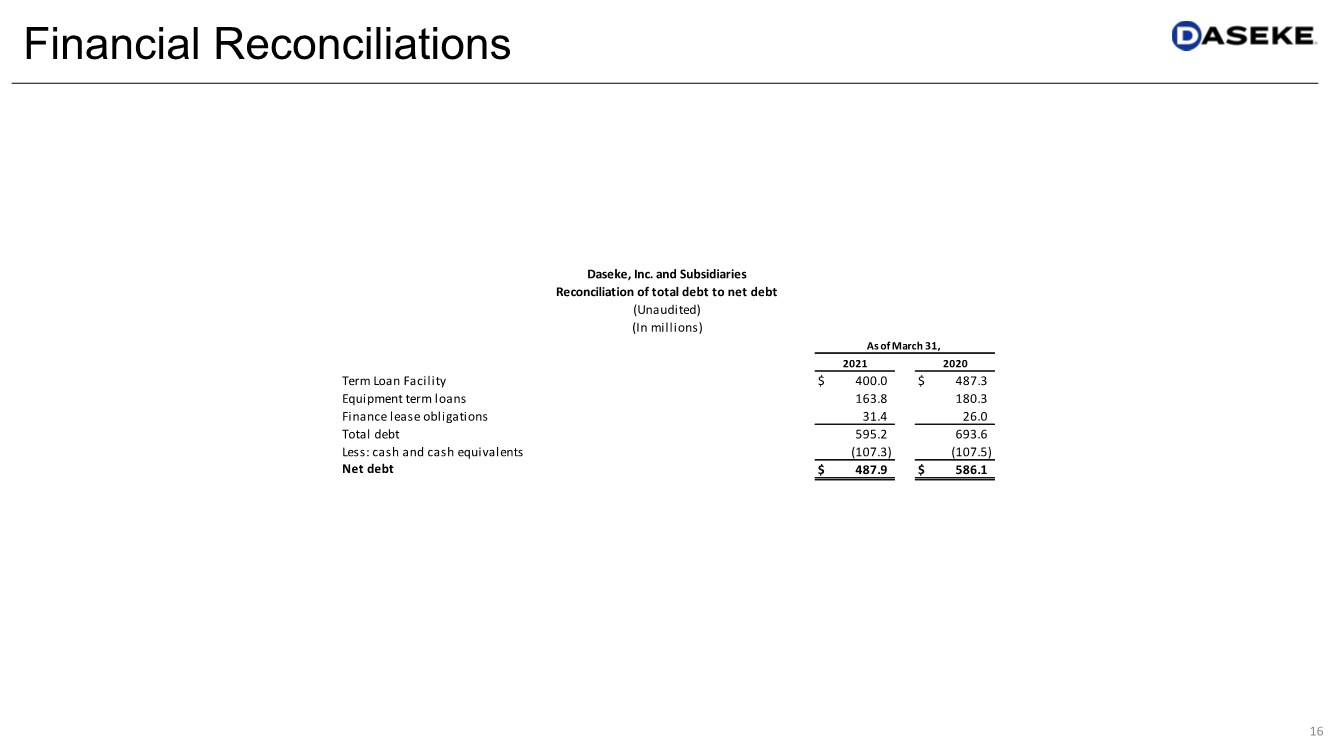
| Financial Reconciliations 16 Term Loan Facility $ 400.0 $ 487.3 Equipment term loans 163.8 180.3 Finance lease obligations 31.4 26.0 Total debt 595.2 693.6 Less: cash and cash equivalents (107.3) (107.5) Net debt $ 487.9 $ 586.1 2021 2020 Daseke, Inc. and Subsidiaries Reconciliation of total debt to net debt (Unaudited) (In millions) As of March 31, |
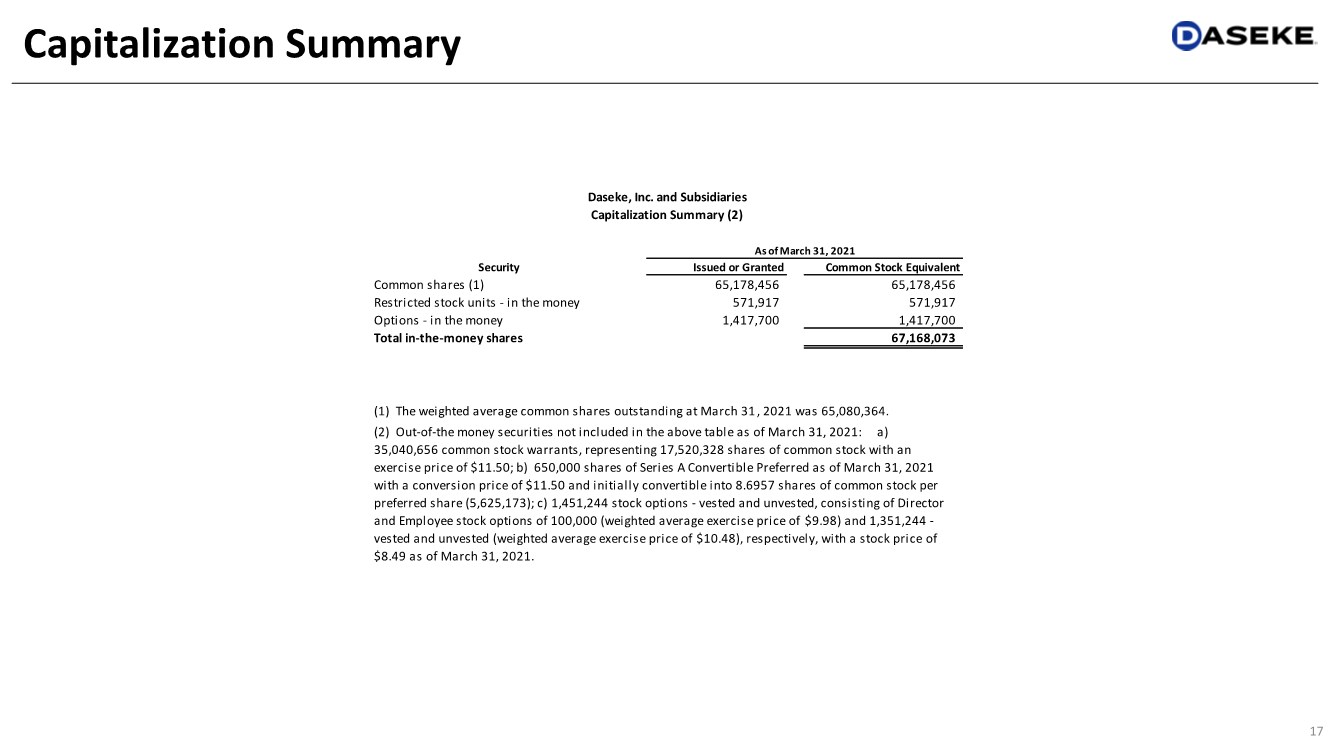
| 17 Capitalization Summary Security Issued or Granted Common Stock Equivalent Common shares (1) 65,178,456 65,178,456 Restricted stock units - in the money 571,917 571,917 Options - in the money 1,417,700 1,417,700 Total in-the-money shares 67,168,073 (1) The weighted average common shares outstanding at March 31, 2021 was 65,080,364. (2) Out-of-the money securities not included in the above table as of March 31, 2021: a) 35,040,656 common stock warrants, representing 17,520,328 shares of common stock with an exercise price of $11.50; b) 650,000 shares of Series A Convertible Preferred as of March 31, 2021 with a conversion price of $11.50 and initially convertible into 8.6957 shares of common stock per preferred share (5,625,173); c) 1,451,244 stock options - vested and unvested, consisting of Director and Employee stock options of 100,000 (weighted average exercise price of $9.98) and 1,351,244 - vested and unvested (weighted average exercise price of $10.48), respectively, with a stock price of $8.49 as of March 31, 2021. Capitalization Summary (2) Daseke, Inc. and Subsidiaries As of March 31, 2021 |
| Daseke, Inc. 15455 Dallas Parkway, Ste 550 Addison, TX 75001 www.Daseke.com Investor Relations Joe Caminiti or Ashley Gruenberg, Alpha IR 312-445-2870 [email protected] 18 Contact Information |

Serious News for Serious Traders! Try StreetInsider.com Premium Free!
You May Also Be Interested In
- Moveworks Showcases the Power of its Next-Generation Copilot at Moveworks.global 2024
- How I Got Here: Burge Diemer
- ARKMining Unveils Free Cloud Mining Service, Paving the Way for Seamless Crypto Investment in 2024.
Create E-mail Alert Related Categories
SEC FilingsSign up for StreetInsider Free!
Receive full access to all new and archived articles, unlimited portfolio tracking, e-mail alerts, custom newswires and RSS feeds - and more!
