

Form 8-K Consolidated Communicati For: Jun 02
 Tweet
Tweet Share
ShareExhibit 99.1
| Cowen 49th Annual TMT Conference June 2, 2021 |
| Safe Harbor The Securities and Exchange Commission (“SEC”) encourages companies to disclose forward-looking information so that investors can better understand a company’s future prospects and make informed investment decisions. Certain statements in this communication are forward-looking statements and are made pursuant to the safe harbor provisions of the Securities Litigation Reform Act of 1995. These forward-looking statements reflect, among other things, our current expectations, plans, strategies, and anticipated financial results. There are a number of risks, uncertainties, and conditions that may cause our actual results to differ materially from those expressed or implied by these forward-looking statements. These risks and uncertainties include a number of factors related to our business, including the uncertainties relating to the impact of the novel coronavirus (COVID-19) pandemic on the company’s business, results of operations, cash flows, stock price and employees; the ability to obtain regulatory approvals required for the Searchlight investment and meet other closing conditions to the investment on a timely basis or at all; economic and financial market conditions generally and economic conditions in our service areas; various risks to the price and volatility of our common stock; changes in the valuation of pension plan assets; the substantial amount of debt and our ability to repay or refinance it or incur additional debt in the future; our need for a significant amount of cash to service and repay the debt restrictions contained in our debt agreements that limit the discretion of management in operating the business; regulatory changes, including changes to subsidies, rapid development and introduction of new technologies and intense competition in the telecommunications industry; risks associated with our possible pursuit of acquisitions; system failures; cyber-attacks, information or security breaches or technology failure of ours or of a third party; losses of large customers or government contracts; risks associated with the rights-of-way for the network; disruptions in the relationship with third party vendors; losses of key management personnel and the inability to attract and retain highly qualified management and personnel in the future; changes in the extensive governmental legislation and regulations governing telecommunications providers and the provision of telecommunications services; new or changing tax laws or regulations; telecommunications carriers disputing and/or avoiding their obligations to pay network access charges for use of our network; high costs of regulatory compliance; the competitive impact of legislation and regulatory changes in the telecommunications industry; and liability and compliance costs regarding environmental regulations; and risks associated with discontinuing paying dividends on our common stock. A detailed discussion of these and other risks and uncertainties that could cause actual results and events to differ materially from such forward-looking statements are discussed in more detail in our filings with the SEC, including our reports on Form 10-K and Form 10-Q. Many of these circumstances are beyond our ability to control or predict. Moreover, forward-looking statements necessarily involve assumptions on our part. These forward- looking statements generally are identified by the words “believe,” “expect,” “anticipate,” “estimate,” “project,” “intend,” “plan,” “should,” “may,” “will,” “would,” “will be,” “will continue” or similar expressions. Such forward-looking statements involve known and unknown risks, uncertainties and other factors that may cause actual results, performance or achievements of Consolidated Communications Holdings, Inc. and its subsidiaries to be different from those expressed or implied in the forward-looking statements. All forward-looking statements attributable to us or persons acting on our behalf are expressly qualified in their entirety by the cautionary statements that appear throughout this communication. Furthermore, forward-looking statements speak only as of the date they are made. Except as required under the federal securities laws or the rules and regulations of the SEC, we disclaim any intention or obligation to update or revise publicly any forward- looking statements. You should not place undue reliance on forward-looking statements. |
| Non-GAAP Measures This presentation includes certain non-GAAP historical and forward-looking financial measures, including but not limited to “EBITDA,” “adjusted EBITDA,” “total net debt to last twelve month adjusted EBITDA ratio,” and “free cash flow.” In addition to providing key metrics for management to evaluate the Company’s performance, we believes these measurements assist investors in their understanding of operating performance and in identifying historical and prospective trends. A reconciliation of the differences between these non-GAAP financial measures and the most directly comparable financial measures presented in accordance with GAAP are available on the Company’s website at https://ir.consolidated.com. Non-GAAP measures are not presented to be replacements or alternatives to the GAAP measures, and investors are urged to consider these non-GAAP measures in addition to, and not in substitution for, measures prepared in accordance with GAAP. Consolidated may present or calculate its non-GAAP measures differently from other companies. Consolidated has filed a Form 8-K reporting the quarterly results for the first quarter of 2021. The Company’s 8-K, Form 10-K, Form 10-Q and other filings should be read in conjunction with this presentation as they contain additional important details on the quarterly results. .. |
| Today’s Presenters Bob Udell President and Chief Executive Officer Steve Childers Chief Financial Officer |

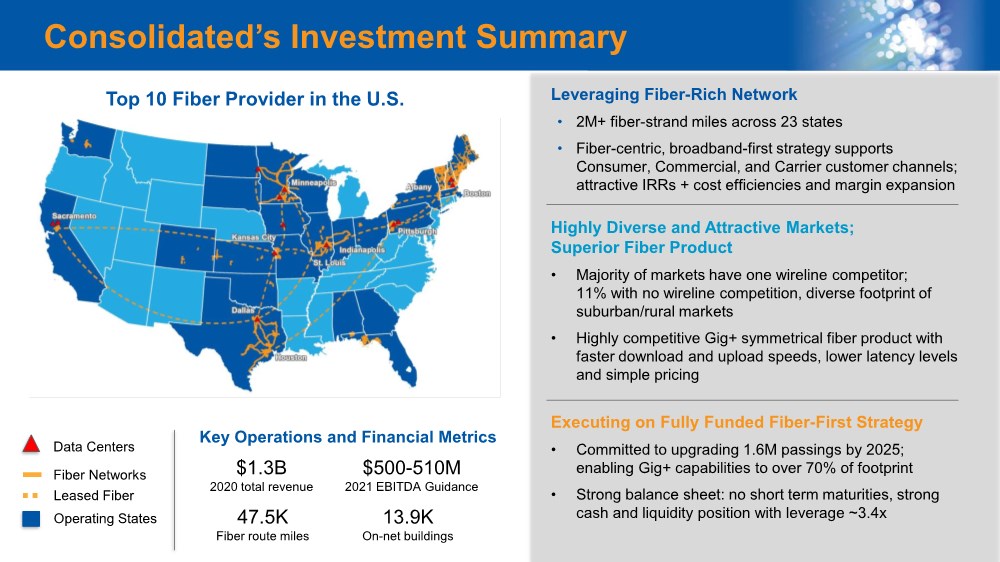
| Consolidated’s Investment Summary Data Centers Operating States Fiber Networks Leased Fiber Leveraging Fiber-Rich Network • 2M+ fiber-strand miles across 23 states • Fiber-centric, broadband-first strategy supports Consumer, Commercial, and Carrier customer channels; attractive IRRs + cost efficiencies and margin expansion Highly Diverse and Attractive Markets; Superior Fiber Product • Majority of markets have one wireline competitor; 11% with no wireline competition, diverse footprint of suburban/rural markets • Highly competitive Gig+ symmetrical fiber product with faster download and upload speeds, lower latency levels and simple pricing Executing on Fully Funded Fiber-First Strategy • Committed to upgrading 1.6M passings by 2025; enabling Gig+ capabilities to over 70% of footprint • Strong balance sheet: no short term maturities, strong cash and liquidity position with leverage ~3.4x Top 10 Fiber Provider in the U.S. Key Operations and Financial Metrics $1.3B 2020 total revenue $500-510M 2021 EBITDA Guidance 47.5K Fiber route miles 13.9K On-net buildings |
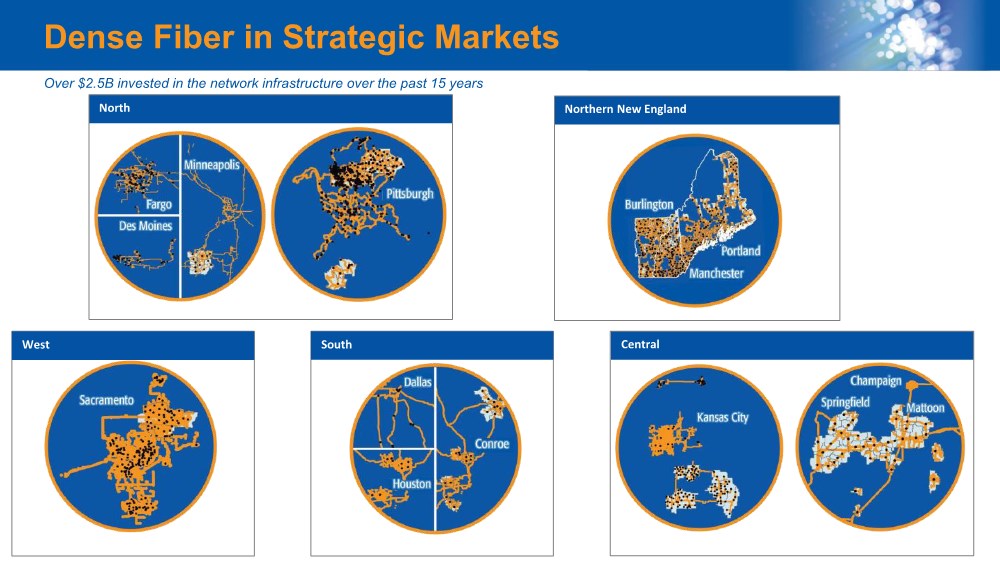
| Dense Fiber in Strategic Markets West South Over $2.5B invested in the network infrastructure over the past 15 years North Northern New England Central |
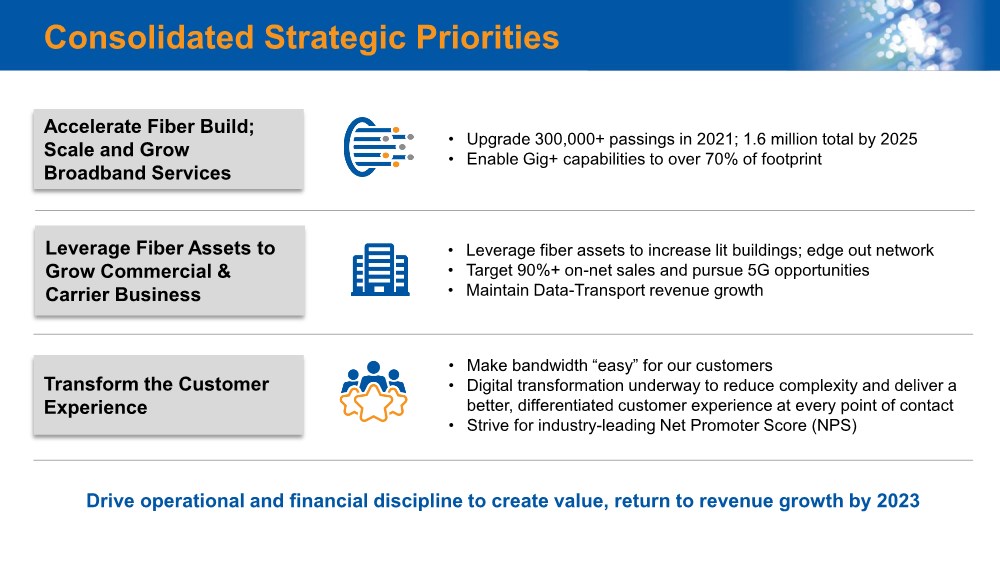
| Consolidated Strategic Priorities • Upgrade 300,000+ passings in 2021; 1.6 million total by 2025 • Enable Gig+ capabilities to over 70% of footprint Accelerate Fiber Build; Scale and Grow Broadband Services Leverage Fiber Assets to Grow Commercial & Carrier Business • Leverage fiber assets to increase lit buildings; edge out network • Target 90%+ on-net sales and pursue 5G opportunities • Maintain Data-Transport revenue growth • Make bandwidth “easy” for our customers • Digital transformation underway to reduce complexity and deliver a better, differentiated customer experience at every point of contact • Strive for industry-leading Net Promoter Score (NPS) Transform the Customer Experience Drive operational and financial discipline to create value, return to revenue growth by 2023 |
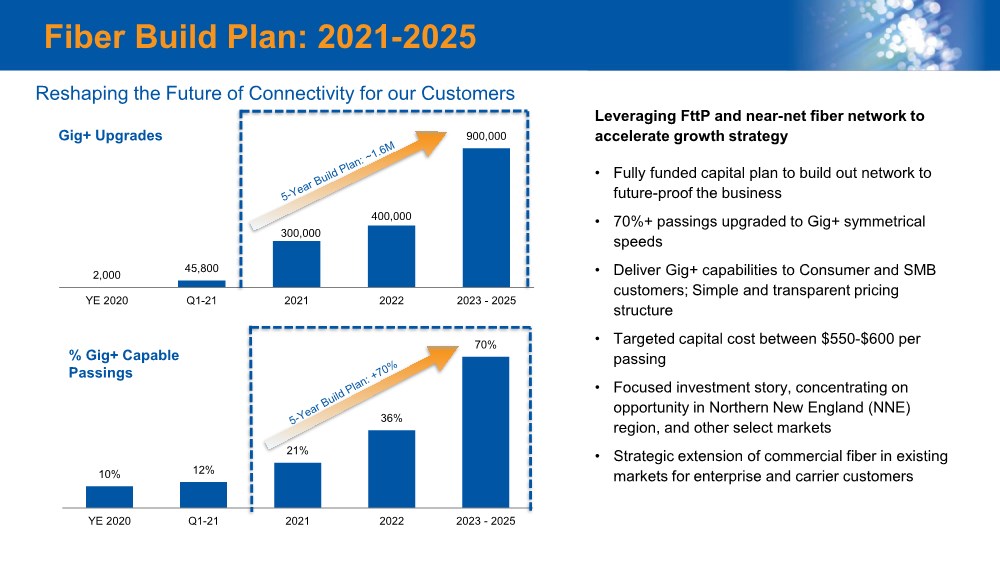
| 2,000 45,800 300,000 400,000 900,000 YE 2020 Q1-21 2021 2022 2023 - 2025 Fiber Build Plan: 2021-2025 Reshaping the Future of Connectivity for our Customers Leveraging FttP and near-net fiber network to accelerate growth strategy • Fully funded capital plan to build out network to future-proof the business • 70%+ passings upgraded to Gig+ symmetrical speeds • Deliver Gig+ capabilities to Consumer and SMB customers; Simple and transparent pricing structure • Targeted capital cost between $550-$600 per passing • Focused investment story, concentrating on opportunity in Northern New England (NNE) region, and other select markets • Strategic extension of commercial fiber in existing markets for enterprise and carrier customers Gig+ Upgrades 10% 12% 21% 36% 70% YE 2020 Q1-21 2021 2022 2023 - 2025 % Gig+ Capable Passings |
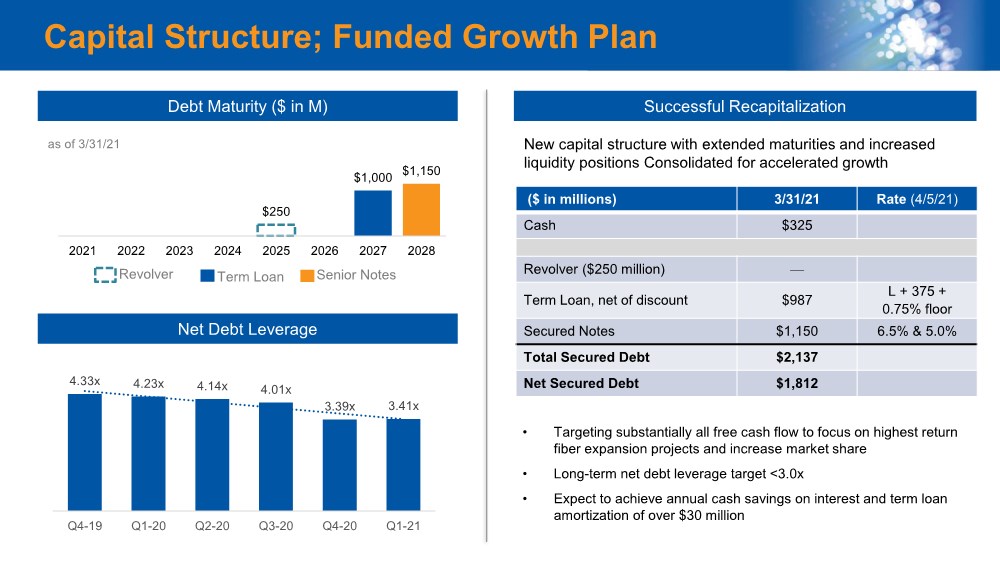
| $250 $1,000 $1,150 2021 2022 2023 2024 2025 2026 2027 2028 Senior Notes Term Loan Revolver Capital Structure; Funded Growth Plan Debt Maturity ($ in M) Net Debt Leverage • Targeting substantially all free cash flow to focus on highest return fiber expansion projects and increase market share • Long-term net debt leverage target <3.0x • Expect to achieve annual cash savings on interest and term loan amortization of over $30 million Successful Recapitalization New capital structure with extended maturities and increased liquidity positions Consolidated for accelerated growth as of 3/31/21 ($ in millions) 3/31/21 Rate (4/5/21) Cash $325 Revolver ($250 million) ⸺ Term Loan, net of discount $987 L + 375 + 0.75% floor Secured Notes $1,150 6.5% & 5.0% Total Secured Debt $2,137 Net Secured Debt $1,812 4.33x 4.23x 4.14x 4.01x 3.39x 3.41x Q4-19 Q1-20 Q2-20 Q3-20 Q4-20 Q1-21 |
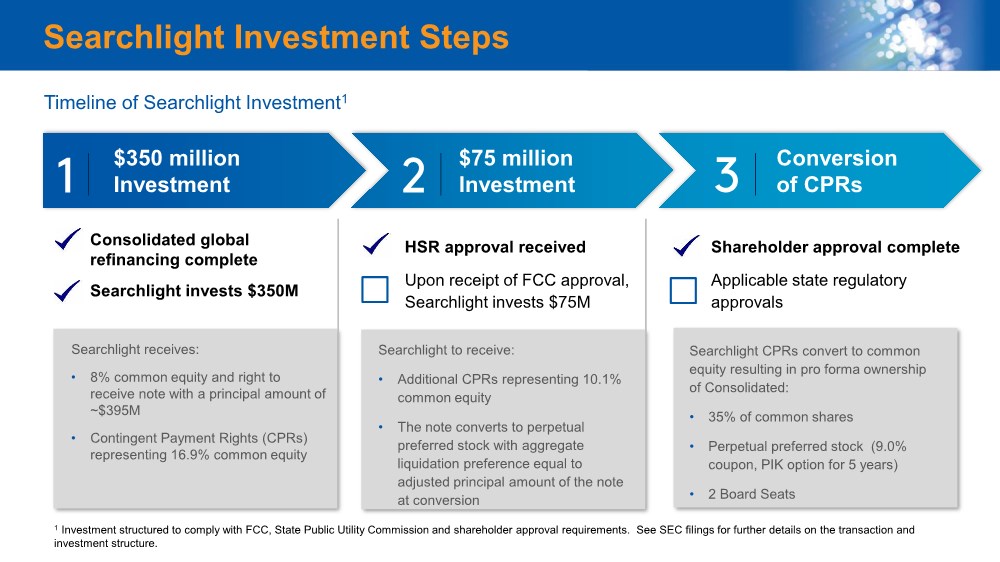
| Searchlight receives: • 8% common equity and right to receive note with a principal amount of ~$395M • Contingent Payment Rights (CPRs) representing 16.9% common equity Searchlight to receive: • Additional CPRs representing 10.1% common equity • The note converts to perpetual preferred stock with aggregate liquidation preference equal to adjusted principal amount of the note at conversion Searchlight Investment Steps Conversion of CPRs $350 million Investment $75 million Investment 1 Investment structured to comply with FCC, State Public Utility Commission and shareholder approval requirements. See SEC filings for further details on the transaction and investment structure. Timeline of Searchlight Investment1 Consolidated global refinancing complete Searchlight invests $350M HSR approval received Upon receipt of FCC approval, Searchlight invests $75M Searchlight CPRs convert to common equity resulting in pro forma ownership of Consolidated: • 35% of common shares • Perpetual preferred stock (9.0% coupon, PIK option for 5 years) • 2 Board Seats Shareholder approval complete Applicable state regulatory approvals |
| Appendix |
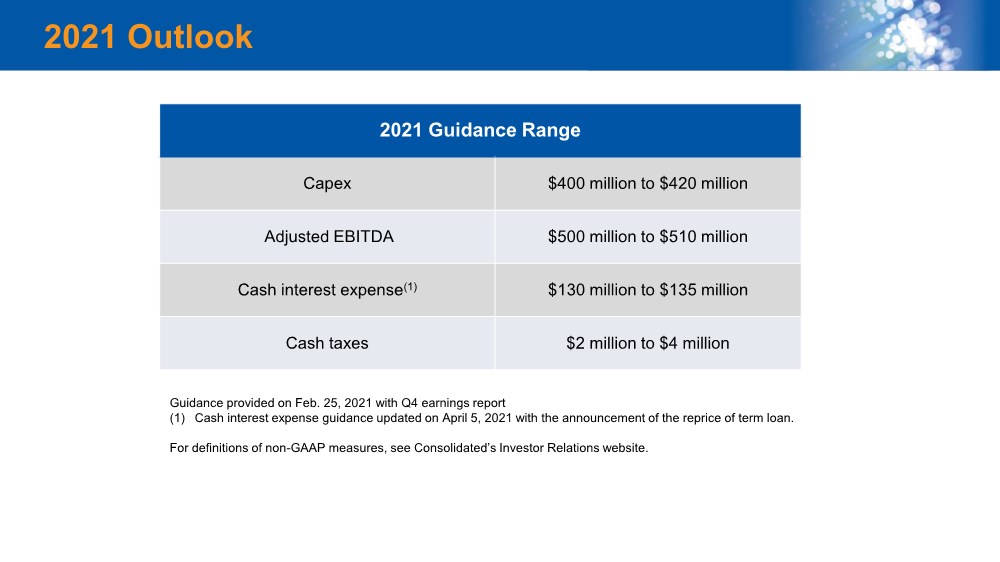
| 2021 Outlook 2021 Guidance Range Capex $400 million to $420 million Adjusted EBITDA $500 million to $510 million Cash interest expense(1) $130 million to $135 million Cash taxes $2 million to $4 million Guidance provided on Feb. 25, 2021 with Q4 earnings report (1) Cash interest expense guidance updated on April 5, 2021 with the announcement of the reprice of term loan. For definitions of non-GAAP measures, see Consolidated’s Investor Relations website. |
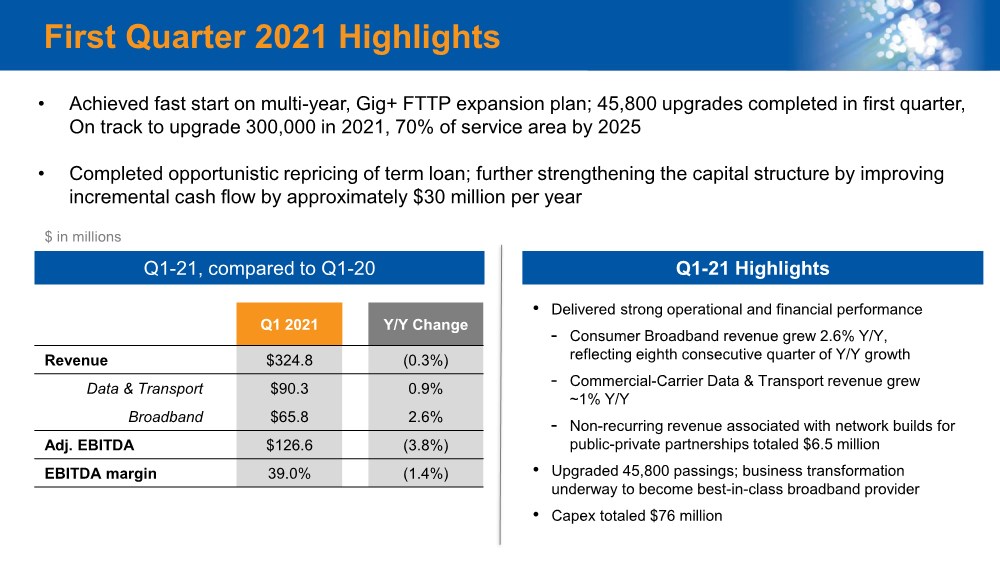
| First Quarter 2021 Highlights • Delivered strong operational and financial performance - Consumer Broadband revenue grew 2.6% Y/Y, reflecting eighth consecutive quarter of Y/Y growth - Commercial-Carrier Data & Transport revenue grew ~1% Y/Y - Non-recurring revenue associated with network builds for public-private partnerships totaled $6.5 million • Upgraded 45,800 passings; business transformation underway to become best-in-class broadband provider • Capex totaled $76 million Q1-21 Highlights • Achieved fast start on multi-year, Gig+ FTTP expansion plan; 45,800 upgrades completed in first quarter, On track to upgrade 300,000 in 2021, 70% of service area by 2025 • Completed opportunistic repricing of term loan; further strengthening the capital structure by improving incremental cash flow by approximately $30 million per year Q1-21, compared to Q1-20 Q1 2021 Y/Y Change Revenue $324.8 (0.3%) Data & Transport $90.3 0.9% Broadband $65.8 2.6% Adj. EBITDA $126.6 (3.8%) EBITDA margin 39.0% (1.4%) $ in millions |
| $64.1 $65.6 $67.2 $66.3 $65.8 Q1-20 Q2-20 Q3-20 Q4-20 Q1-21 $89.6 $89.6 $90.2 $92.8 $90.3 Q1-20 Q2-20 Q3-20 Q4-20 Q1-21 Strategic Revenue Growth • Broadband revenue grew +2.6% Y/Y • Data ARPU +7%; Consumer ARPU +2.6% Y/Y • 45,800 passings upgraded in Q1 to Gig+ FTTP; Plan to upgrade 300,000 locations in 2021 • Customer experience and digital transformation projects underway Consumer Strategy & Highlights $ in millions Broadband Revenue 2.6% Y/Y 2.8% Y/Y 2.6% Y/Y 2.3% Y/Y 1.6% Y/Y Data and Transport Revenue 0.9% Y/Y 3.2% Y/Y 1.6% Y/Y 1.2% Y/Y 1.6% Y/Y • Data & Transport revenue grew ~1% Y/Y • VoIP revenue +7.2% Y/Y • On-net buildings: 13,910, +11% Y/Y • Leverage best-in-breed partnerships to enable network solutions • Utilize solutions-based sales approach; lead with fiber and data solutions Commercial-Carrier Strategy & Highlights |

Serious News for Serious Traders! Try StreetInsider.com Premium Free!
You May Also Be Interested In
- Consolidated Communications Releases 2023 Environmental, Social and Governance Report
- Bread Financial™ Declares Dividend on Common Stock
- Melco Announces Earnings Release Date
Create E-mail Alert Related Categories
SEC FilingsSign up for StreetInsider Free!
Receive full access to all new and archived articles, unlimited portfolio tracking, e-mail alerts, custom newswires and RSS feeds - and more!
