

Form 8-K Celanese Corp For: Jul 28
 Tweet
Tweet Share
ShareUNITED STATES
SECURITIES AND EXCHANGE COMMISSION
Washington, D.C. 20549
FORM 8-K
CURRENT REPORT
Pursuant to Section 13 or 15(d) of the Securities Exchange Act of 1934
Date of Report (Date of earliest event reported): July 28, 2022
(Exact name of registrant as specified in its charter)
| (State or other jurisdiction of incorporation) | (Commission File Number) | (IRS Employer Identification No.) | ||||||||||||
(Address of Principal Executive Offices) (Zip Code)
Registrant's telephone number, including area code: (972 ) 443-4000
(Former name or former address, if changed since last report)
Check the appropriate box below if the Form 8-K filing is intended to simultaneously satisfy the filing obligation of the registrant under any of the following provisions (see General Instruction A.2. below):
Securities registered pursuant to Section 12(b) of the Act:
| Title of Each Class | Trading Symbol(s) | Name of Each Exchange on Which Registered | ||||||
Indicate by check mark whether the registrant is an emerging growth company as defined in Rule 405 of the Securities Act of 1933 or Rule 12b-2 of the Securities Exchange Act of 1934.
Emerging growth company ☐
If an emerging growth company, indicate by check mark if the registrant has elected not to use the extended transition period for complying with any new or revised financial accounting standards provided pursuant to Section 13(a) of the Exchange Act. ☐
1
Item 7.01 Regulation FD Disclosure
On July 29, 2022, Lori J. Ryerkerk, Chairman of the Board of Directors, Chief Executive Officer and President of Celanese Corporation (the "Company"), will make a presentation to investors and analysts via a webcast hosted by the Company at 10:00 a.m. ET (9:00 a.m. CT) regarding the Company's financial results for its second quarter 2022. The webcast, press release and prepared remarks from management may be accessed on our website at investors.celanese.com under News & Events / Events Calendar. A copy of the prepared remarks posted for the webcast is attached to this Current Report on Form 8-K ("Current Report") as Exhibit 99.1(a) and is incorporated herein solely for purposes of this Item 7.01 disclosure. During the webcast, management may make, and management's prepared remarks contain, references to certain Non-US GAAP financial measures. Non-US GAAP financial measures appearing in management's prepared remarks are defined and reconciled to the most comparable US GAAP financial measure in our Non-US GAAP Financial Measures and Supplemental Information document furnished with this Current Report as Exhibit 99.2 (and available on our website) and is incorporated herein solely for purpose of this Item 7.01 disclosure.
Item 9.01 Financial Statements and Exhibits
(d) The following exhibits are being furnished herewith:
| Exhibit Number | ||||||||
Description | ||||||||
| 99.1(a) | ||||||||
| 99.2 | ||||||||
| 104 | Cover Page Interactive Data File (the cover page XBRL tags are embedded within the inline XBRL document contained in Exhibit 101) | |||||||
* In connection with the disclosure set forth in Item 7.01, the information in this Current Report, including the exhibits attached hereto, is being furnished and shall not be deemed "filed" for purposes of Section 18 of the Securities Exchange Act of 1934, as amended (the "Exchange Act"), or otherwise subject to the liabilities of such section. The information in this Current Report, including the exhibits, shall not be incorporated by reference into any filing under the Securities Act of 1933, as amended, or the Exchange Act, regardless of any incorporation by reference language in any such filing. This Current Report will not be deemed an admission as to the materiality of any information in this Current Report that is required to be disclosed solely by Regulation FD.
2
SIGNATURES
Pursuant to the requirements of the Securities Exchange Act of 1934, the registrant has duly caused this report to be signed on its behalf by the undersigned hereunto duly authorized.
CELANESE CORPORATION | |||||||||||
| By: | /s/ MICHAEL R. SULLIVAN | ||||||||||
| Name: | Michael R. Sullivan | ||||||||||
| Title: | Vice President, Deputy General Counsel and Assistant Corporate Secretary | ||||||||||
| Date: | July 28, 2022 | ||||||||||
3
Exhibit 99.1(a)

Second Quarter 2022 Earnings Prepared Comments
Brandon Ayache, Celanese Corporation, Vice President, Investor Relations
This is the Celanese Corporation second quarter 2022 earnings prepared comments. The Celanese Corporation second quarter 2022 earnings release was distributed via Business Wire this afternoon and posted on our investor relations website, investors.celanese.com. As a reminder, some of the matters discussed below may include forward-looking statements concerning, for example, our future objectives and plans. Please note the cautionary language contained at the end of these comments. Also, some of the matters discussed include references to non-GAAP financial measures. Explanations of these measures and reconciliations to the comparable GAAP measures are included on our investor relations website under Financial Information/Non-GAAP Financial Measures. The earnings release and non-GAAP information and the reconciliations are being furnished to the SEC in a Current Report on Form 8-K. These prepared comments are also being furnished to the SEC in a separate Current Report on Form 8-K.
On the earnings conference call tomorrow morning, management will be available to answer questions.
Lori Ryerkerk, Celanese Corporation, Chairman of the Board and Chief Executive Officer
I am very pleased to report second quarter adjusted earnings of $4.99 per share and free cash flow generation of $368 million. Across the first two quarters of 2022, we delivered adjusted earnings per share performance that surpassed the combined performance of our best two quarters of 2021. I thank each of our employees and am continually inspired by their unwavering drive to perform at an exceptional level. The performance they have delivered so far in 2022 has prepared us to address, from a position of strength, some of the developing macro concerns.
We see the same headlines with increasingly foreboding views of runaway inflation, rising interest rates, consumer fear, energy insecurity, and Chinese lockdowns among others. We are well aware that each of these external dynamics, to varying degrees, have dramatically challenged the recent stock performance of Celanese and others and, in our case, overshadowed record levels of performance. Let me be clear that we see little firsthand indication, in our order books or otherwise, that warrants the prevailing anticipation of a
1
dramatic pullback in demand. Let me be even more clear that this in no way stops us from taking controllable actions to position ourselves to continue to deliver differentiated performance, even in challenging environments.
For this reason, my comments today will be action-oriented, under a familiar framework that clearly communicates our priorities as an organization.
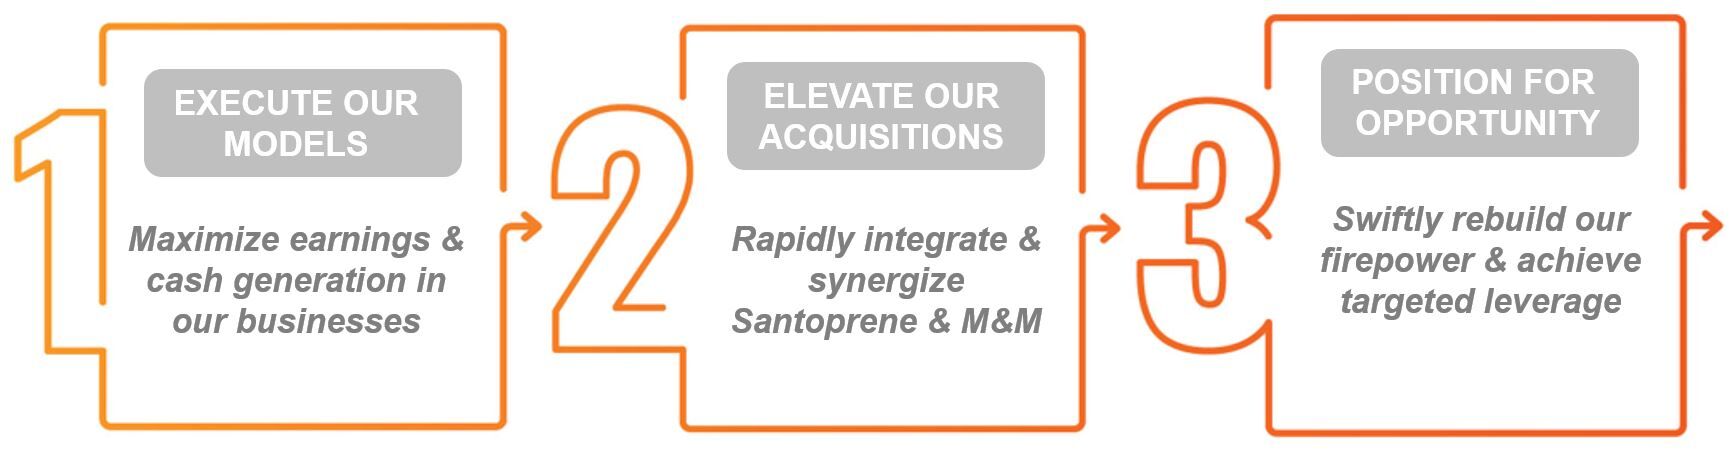
 Let me start with the performance of our existing businesses.
 In the second quarter, Engineered Materials (EM) delivered record quarterly adjusted EBIT of $224 million and operating EBITDA of $265 million at margins of 24 and 28 percent, respectively. Highest-ever quarterly net sales of $948 million were driven by a 6 percent sequential lift in pricing, the sixth consecutive quarter of pricing expansion and the result of commercial initiatives taken by the EM team. They continued to demonstrate a unique ability to proactively protect our margins despite further inflationary cost pressure and sequential currency headwinds. Volume expanded 1 percent sequentially and reflected a number of dynamics including contributions from the KEPCO joint venture restructuring and improved end market mix as the business worked to offset expected sequential volume moderation in our legacy automotive business. Our medical business also contributed to improved mix as our broader medical portfolio volume in the quarter returned to pre-COVID levels despite a continued impact from the deferral of elective procedures. EM is an example of an actively and dynamically managed business and I congratulate our teams for successfully lifting pricing and enhancing our mix in the quarter.
Global automotive industry builds in the second quarter were down 6 percent sequentially, led by Asia which reported an 11 percent sequential decline. COVID lockdowns clearly had a meaningful impact on Asia auto builds beyond the ongoing supply constraints including the semiconductor chip shortage. By contrast EM's global auto volume was consistent with the first quarter, due in part to sequential volume gains in Santoprene. More impressively, EM auto volume in Asia grew sequentially. Our growth in Asia
2
outperformed industry build rates due to two primary factors. First, the combination of our project pipeline model and continued investment in resources to serve electric vehicles (EV) has positioned Celanese to win. We continue to expand our content per vehicle in the EV space, which we expect will drive meaningful growth in our legacy business and tremendous opportunities for the M&M product portfolio. As an example of our growth in EVs, our GUR® volumes sold for use in lithium-ion battery separators grew by approximately 20 percent in the first six months of 2022 compared to the same period in 2021. Second, we think there was a strong desire among auto tiers in China to restore depleted inventories coming out of Chinese New Year, subsequent COVID lockdowns, and in anticipation of higher Asia OEM build rates in the third quarter. While harder to quantify, we think this pre-buying was effectively the delayed Asia equivalent of the first quarter pull-forward in the West.
Setting aside automotive conditions, the EM questions we hear most center around the availability and cost of natural gas in Europe. To date, the challenge has been the escalation and volatility in natural gas pricing across Europe, rather than availability. The natural gas surcharge which we implemented late last year has proven to be an effective means of preserving our profitability by passing along incremental natural gas costs with a one month lag. While we will continue to pass through incremental costs, we do anticipate that the timing of the most recent surge in cost, if it persists, will result in some shift in earnings from the third to the fourth quarter due to the one month lag. As our teams have been working to preserve our profitability, they have been simultaneously preparing us for the potential, though unlikely, unavailability of natural gas. I will remind you that approximately 70 percent of our natural gas exposure across Europe is at our production facility in Frankfurt, Germany where it is primarily used as a feedstock for steam generation. Let me share some of the actions that we have taken to increase the continuity of our production at that facility. A portion of the steam generation that supports Celanese and site partner operations in Frankfurt comes from a waste heat incinerator that our infrastructure joint venture, Infraserv, implemented years ago. This incinerator project, which we affectionately refer to as "trash to cash", uses combustible waste as the primary feedstock for energy generation as opposed to natural gas. This waste, if not diverted to our incinerator, would otherwise be dumped in municipal landfills. For the remainder of steam generation at Frankfurt we, through Infraserv, have proactively launched a capital project to be able to use fuel oil as an alternative replacement for natural gas in the event of curtailments. This project is another example of the power of our controllable actions to address economic and commercial risks, including the risk of natural gas curtailments in Germany.
As we look to the third quarter, we see the headlines from major retailers about softening consumer demand and elevated inventories. We are seeing modest softness that amounts to an order book that is a few percent below expectation at this stage. Looking across the segments, the order book for auto remains
3
strong as we expect raw material shortages, including chips, will continue to be the limiting constraint on production rather than demand. The order book has been primarily impacted by appliances and consumer electronics and we anticipate potential for further softness in these segments as the quarter progresses. With a broad array of polymers and end-markets we serve, our teams will pivot to place volume in alternative applications. Depending on the pace of demand in the back half of the quarter and subsequent impacts to mix, we anticipate third quarter EM adjusted EBIT of $190 to $215 million. The bottom end of the range is reflective of incremental demand softness beyond what we currently see in the order book. Given the strong first half performance in EM, we expect 2022 adjusted EBIT of $800 million or above.
The Acetyl Chain (AC) generated second quarter adjusted EBIT of $440 million and operating EBITDA of $482 million at margins of 30 percent and 33 percent, respectively. Our AC team has maintained for the second consecutive quarter, a rolling twelve month adjusted EBIT of $2 billion. The business delivered these results despite a 35 percent increase in the pricing of U.S. Gulf Coast natural gas, which is the primary feedstock for our flagship Clear Lake, Texas facility, a significant force majeure impacting our Western Hemisphere sales, and continued moderation in Chinese acetic acid pricing. The speed and agility with which AC adapts to changing market dynamics is unique in the chemical industry and demonstrates the resiliency of our performance across a broad range of headwinds.
In May, our Clear Lake acetic acid plant experienced an unanticipated interruption due to unplanned outages and resulting supply disruptions from our two largest external raw material suppliers to the site. The extent of our production losses, paired with already lean inventory levels, resulted in a declaration of force majeure in the Western Hemisphere, spanning the breadth of our integrated Acetyl Chain and into acetate tow. The force majeure was the primary driver of approximately 90 kt of lost AC production in the West in the second quarter. In an effort to support our customers as reliably as possible given the circumstances, the team quickly began sourcing volume in the market. Additionally, with the inability to serve Europe from our U.S. production, the team immediately started diverting product from Asia to Europe. Despite challenging global logistics, our teams were successful in placing a remarkable 85 kt of product in the second quarter on ships from Asia to Europe. I am pleased to share that our Clear Lake acetic acid facility is now operating at full rates and we are working to rapidly replenish our network in the West in order to lift the force majeure as quickly as possible.
The agility of AC to adapt to changing dynamics spans not only geographically, as evidenced by our response to the force majeure, but also the integrated product chain. In the second quarter, Chinese acetic acid pricing moderated further sequentially as pricing fell to approximately $500 per metric ton in June and sub-$500 since. This marked the third time in 2022 that China acid pricing has tested these levels.
4
Contributions from acetic acid in the second quarter were most comparable to the first quarter of 2021. In fact, acetic acid variable margin for the current quarter was approximately $25 million lower. Despite this compression in acetic acid margin contribution, AC delivered approximately $160 million higher adjusted EBIT by pursuing value in the downstream vinyls chain (VAM, emulsions, redispersible powders (RDP), and EVA). AC is uniquely able to capture this value when others cannot, due to the combination of the flexibility in our feedstocks, the breadth of our geographic footprint, and the optionality of our integrated chain spanning from methanol to RDP. To further demonstrate the sustainability of this differentiation, over the last 5 years AC has averaged 29 percent quarterly EBITDA margins and delivered greater than 20 percent EBITDA margins in every quarter including during the height of COVID.
As we look to the third quarter, demand and pricing remain strongest in the Americas, followed by Europe and Asia. Looking at our order books, we are seeing some signs of softness in select industries such as paints and coatings, and construction which represent about one-third of our end market exposure. Additionally, inventory across customer's supply chains in Asia appears to have recovered to pre-COVID levels. We believe current acetic acid pricing has largely incorporated these dynamics. We expect sequential moderation in the third quarter to largely be driven by VAM, particularly in Asia, as industry production recovers. VAM pricing in Asia has been moderating across the back half of June and July and declined by over $500 per ton over that period. Based on these factors, we anticipate third quarter adjusted EBIT for AC of $350 to $400 million. A slightly larger guidance range reflects, at the bottom of the range, the potential for further modest demand softness as the quarter progresses. Given the strength of our first half performance in AC, we continue to expect full year adjusted EBIT of approximately $1.6 billion.
Acetate Tow (AT) delivered second quarter adjusted EBIT of $35 million, $36 million of which came as dividends from our affiliates in China. Unfortunately, the story is old: severe cost inflation on all fronts without the ability to increase pricing to offset these cost increases. It is absolutely clear that this dynamic is inhibiting the realization of appropriate value for these products. Historically, this business created value for our customers and shareholders by providing unparalleled quality and security of supply of acetate flake and tow across the globe. Simply put, the current situation in AT is both unacceptable and untenable.
As a result, we have initiated a strategic overhaul of the AT business and will begin the transition to managing acetate flake and tow within the Acetyl Chain as downstream derivatives of acetic acid, similar to how we manage VAM, emulsions, or redispersible powders. I am convinced there is value to be created in managing these products with the same strategic optionality we exercise in AC.
5
Over the coming months we will explore additional ways to restore the profitability of the acetate flake and tow products by reexamining our commercial contracting strategy, sourcing activity, and cost structure. We will share additional updates as the strategic overhaul progresses. Upon completion of the strategic overhaul process, we anticipate that the AT financial results may be reported as part of the AC reporting segment.
To summarize our business commentary, we are seeing some firsthand indications of softening demand including modest order deferrals and signals of normalizing inventory levels at customers. That said, at this stage, our order books, which currently extend around a month into the future, remain largely consistent with expectations. When we look at the resilience of our order books juxtaposed against foreboding headlines, it is unclear to what extent our firsthand observations should temper those headline concerns or are simply lagging upstream indicators of demand deterioration. We think the reality is somewhere in the middle. For this reason, our guidance range for total Celanese, like our businesses, is wider than typical with expected third quarter adjusted earnings of $4.00 to $4.50 per share. The bottom end of the range represents some degree of further, albeit modest, demand deterioration between now and the end of the quarter. We are utilizing a similar approach for the full year given current visibility. With the strength of our first half performance, and even with modest demand softness, we expect to deliver 2022 adjusted earnings per share approximately in line with our 2021 adjusted earnings per share performance.
 To transition to our second objective of rapidly integrating and synergizing the Santoprene and M&M acquisitions, let me start by congratulating our combined teams who are managing the recently acquired Santoprene product line. The team contributed second quarter adjusted EBIT of approximately $15 million, despite cost inflation of over 10 percent versus the prior quarter. In addition to the continued capture of synergies in the quarter, the team lifted second quarter pricing levels another few percent sequentially. We are on track to capture more than $15 million in synergies in 2022, double our year one projection at the time of announcing the acquisition, and to complete the full integration of the business ahead of closing the M&M acquisition.
Turning to the M&M business, let me start by addressing the numerous questions we have received regarding their first quarter performance. Regardless of the assumptions and math used, it is clear that first quarter performance was not at a run-rate consistent with the 2022 outlook either party had for that business. Quite frankly, we were disappointed by the performance. Beyond any challenges unique to that
6
business, we have every reason to assume they are facing many similar challenges as EM including severe cost inflation, volatility in Asia automotive, and currency headwinds.
We know firsthand that short-term performance can be impeded by such dynamics. You will recall that our EM adjusted EBIT in the fourth quarter of 2021 was approximately half of what we delivered this quarter, due primarily to the sudden surge in natural gas pricing. We also know that decisive actions, like the energy surcharge and aggressive energy productivity program we implemented, can very rapidly improve performance.
Like all of you, we will be watching the ongoing performance trajectory of the M&M business. As we cross over into the second half of the year, we are much more interested in the momentum that business has coming into the transaction close, and its go-forward potential as part of Celanese, than we are the first half of 2022. We are eager to welcome the current M&M employees as part of Celanese and jointly work to enhance and accelerate that momentum post-closing and into 2023.
We continue to target closing the M&M acquisition in the fourth quarter and our teams are working tremendously hard to this end. To date, we have successfully secured approximately $10.5 billion in permanent financing for the acquisition across a series of transactions which Scott will discuss in detail. We continue to make progress with the regulatory review process across all necessary jurisdictions including the U.S., China, European Union, Brazil, Mexico, South Korea, and Turkey. Finally, we continue to engage daily with our partners at DuPont to complete pre-integration work across all functions which will allow us to accelerate our integration and synergy capture after closing.
The progress we make in rapidly capturing synergies will be a critical early offset to the added interest expense for the transaction financing relative to interest rate conditions when we announced the deal. While early financial contributions from the transaction will be more challenged than originally guided due to interest expense, our primary focus is on maximizing our cash generation.
•Synergies: The more pre-integration work we complete, the more confidence we have in our ability to capture the committed synergies, and likely more. We are finding new opportunities for synergies. We are working to aggressively accelerate the timing of the anticipated synergies, not unlike what we have done with Santoprene this year, versus original expectations.
•Working Capital: We are increasingly confident that the combined global production and logistics networks of EM and M&M will deliver meaningful working capital opportunities in addition to cost synergies. We see greater opportunity than we previously anticipated to leverage our
7
combined warehouse and logistics networks to minimize cross-regional shipments and monetize concentrations of inventory.
•Capital Expenditures: Last quarter we guided to a $50 million reduction in our 2022 capital expenditures as a result of combining EM and M&M. There exists a much larger opportunity for us to reduce our capital expenditures in 2023. This will be driven by additional capacity opportunities we are identifying in the combined EM and M&M networks as well as a capital budget for the acquired business that we previously alluded to, and have since validated, is larger than needed. More broadly across Celanese, given current material pricing levels and the broader capital investment cycle, we are assessing certain projects where we are confident there is real capital savings to be captured from short-term deferral or a slowed construction timeline.
We expect that the above drivers of early incremental cash paired with swift deleveraging will increasingly offset the impact of a higher-than-anticipated interest expense. As we refine the estimated contributions from these items, build out our own business forecasts for next year, and solidify the timing of closing, we will share a revised outlook for our pro forma 2023 cash generation and earnings.
In summary, our businesses are executing and our integration of Santoprene and pre-integration of M&M are rapidly progressing. Our teams are delivering at an exceptional level on that which they can control. We are optimistic about the future of Celanese and the power of our employees to deliver shareholder value, even in challenging environments. We are eager to close the M&M acquisition and partner with our new colleagues to drive further value.
Scott Richardson, Celanese Corporation, Chief Financial Officer
Before I address the third of our organizational objectives, let me thank our teams for executing our business models and M&A action plans exceptionally well. They have also been active in positioning us to swiftly deleverage following the close of the M&M acquisition.
 Our post-close capital structure is quickly taking shape as we have secured approximately $10.5 billion in permanent financing for the transaction including:
•the $1.5 billion of delayed draw term loans under the Term Loan Credit Agreement dated March 18, 2022;
8
•the registered offering of $7.5 billion principal amount of U.S. dollar notes priced on July 7, 2022;
•the euro cross-currency swap entered on July 7, 2022 to effectively convert $2.5 billion of the U.S. dollar denominated debt into euro-denominated borrowing at prevailing euro interest rates; and
•the registered offering of €1.5 billion principal amount of euro notes priced on July 12, 2022.
We are very pleased to have secured permanent financing for the M&M acquisition. I would like to recognize the many teams within Celanese who worked to rapidly and successfully secure this financing amid a challenging market backdrop. They remained agile in assessing volatile debt market conditions and vigilant in optimizing the structure and pricing of our financing.
It was critical for us to maintain ample flexibility and optionality for the future. We were purposeful in optimizing the maturity profile of our debt to provide us with flexibility to rapidly deleverage over the next few years and to refinance debt as market conditions change.
We were equally focused on reducing our net borrowing rate by aligning our currency mix in lower interest rate currencies with our anticipated global earnings. To date, approximately $4.0 billion of our permanent financing is euro-denominated, either through the euro direct issuance or the euro cross-currency swap we entered. As a result, our effective net borrowing rate across the secured financing for the M&M transaction currently stands at 5.4 percent. We expect opportunities over the coming quarters to enter into additional cross-currency swaps to effectively convert more of our U.S. dollar debt into lower interest rates currencies, namely euro and yen.
We anticipate incurring between approximately $75 and $150 million of net interest expense on the M&M financing ahead of closing which we are targeting for sometime in the fourth quarter. This was also factored into the $1.4 billion free cash flow estimate we previously provided for 2022 and which we are maintaining. As the interest expense incurred ahead of closing the transaction will not be paired with a corresponding economic benefit from owning the M&M business, we intend to adjust out this interest expense from adjusted earnings per share until the time of closing. Similarly, we will remove from adjusted earnings per share any interest income which is generated from excess cash balances from the proceeds of the M&M financing. Our 2022 adjusted earnings per share guidance provided in April also reflected this anticipated accounting treatment.
Let me now address questions received regarding the recent increase in prevailing interest rates and the impact on our deleveraging plan of a higher borrowing rate than originally anticipated when we announced the acquisition. In conjunction with the recent debt offerings, we met with credit rating
9
agencies to update the leveraging plan and financial outlook we originally shared with them in February. Anticipated leverage levels at the time of closing remain at approximately 4.0x net debt to trailing pro-forma EBITDA. Elevated performance in both EM and AC across 2022, relative to the original financials shared, is more than offsetting first-quarter M&M performance that is below expectations. Additionally, we are still on track to reach a deleveraging target of 3.0x net debt to EBITDA within two years, which is consistent with a sustainable investment grade rating. We remain fully committed to maintaining our investment grade rating.
We are working to ensure that the free cash flow generation and debt paydown capabilities of Celanese remain remarkably resilient, even in the most challenging of environments. We demonstrated that resilience in 2020 during the height of COVID, when our free cash flow only declined 12 percent year over year. Our teams brought down working capital, rapidly adjusted our capital expenditures, and aggressively enhanced cost savings and productivity within the year. In the event of a severe recession, we have the same controllable levers available to us right now and many could be more impactful:
•At the end of the second quarter, we held approximately $700 million more in net working capital than we did across 2020.
•Our outlook for capex in 2022 is approximately $200 million higher than we spent in 2020 and in a severe recession we could trim below 2020 capex levels.
•Our productivity and one-time costs savings in 2020 contributed $100 million above typical levels.
All together, this is an opportunity to unlock $1 billion in cash if we were to replicate the actions of 2020. We could do more if needed. This does not include additional opportunities to replicate these actions across the acquired M&M business. We are confident in our ability to take controllable actions to generate cash flow and pay down our debt even in a recessionary environment.
Celanese is a company built on execution. Our teams have a very clear vision of the objectives at hand to deliver continued value and growth for our customers, employees, and investors and we are hard at work executing on those objectives.
This concludes our prepared remarks. We look forward to discussing our second quarter results and addressing your questions.
10
Forward-Looking Statements
These prepared comments may contain "forward-looking statements," which include information concerning the Company's plans, objectives, goals, strategies, future revenues, performance, capital expenditures, financing needs, and other information that is not historical information. All forward-looking statements are based upon current expectations and beliefs and various assumptions. There can be no assurance that the Company will realize these expectations or that these beliefs will prove correct. There are a number of risks and uncertainties that could cause actual results to differ materially from the results expressed or implied in the forward-looking statements contained in these comments. These risks and uncertainties include, among other things: changes in general economic, business, political and regulatory conditions in the countries or regions in which we operate; volatility or changes in the price and availability of raw materials and energy, particularly changes in the demand for, supply of, and market prices of ethylene, methanol, natural gas, wood pulp and fuel oil and the prices for electricity and other energy sources; the length and depth of product and industry business cycles, particularly in the automotive, electrical, mobility, textiles, medical, electronics and construction industries; the extent to which resurgences or variants of COVID-19 may adversely impact the economic environment, market demand, our operations, availability and cost of transportation and materials, the labor supply, and pace of economic recovery; the ability to pass increases in raw material prices, logistics costs or other costs on to customers or otherwise improve margins through price increases; the ability to complete the pending acquisition by us of the majority of DuPont’s Mobility & Materials business (the "M&M Acquisition"), including the possibility that the M&M Acquisition is not completed within the expected timeframe, or at all, because required regulatory approvals are not received or other closing conditions are not satisfied on a timely basis, or at all; the accuracy or inaccuracy of our assumptions regarding anticipated benefits of the M&M Acquisition; the possibility that the anticipated benefits of the M&M Acquisition, including synergies and growth opportunities, may not be realized as expected or may not be achieved within the anticipated timeframe, or at all, whether as a result of difficulties arising from the integration of the M&M Business or other unanticipated delays, costs, inefficiencies or liabilities; increased commercial, legal or regulatory complexity of entering into, or expanding our exposure to, certain end markets and geographies; risks in the global economy and equity and credit markets and their potential impact on our ability to finance the remainder of the purchase price for the M&M Acquisition on acceptable terms, at favorable pricing, in a timely manner, or at all; diversion of management's attention from ongoing business operations and opportunities and other disruption caused by the M&M Acquisition and the integration processes and their impact on our existing business and relationships; risks and costs associated with increased leverage from the M&M Acquisition, including increased interest expense and potential reduction of business and strategic flexibility; the ability to maintain plant utilization rates and to implement planned capacity additions and expansions as well as facility turnarounds; the ability to reduce or maintain their current levels of production costs and to improve productivity by implementing technological improvements to existing plants; the ability to identify desirable potential acquisition targets and to complete and integrate acquisition or investment transactions, including regulatory approvals, consistent with the Company's strategy; increased price competition and the introduction of competing products by other companies; market acceptance of our products and technology; compliance and other costs and potential disruption or interruption of production or operations due to accidents, interruptions in sources of raw materials, transportation, logistics or supply chain disruptions, cyber security incidents, terrorism or political unrest, public health crises (including, but not limited to, the COVID-19 pandemic); other unforeseen events or delays in construction or operation of facilities, including as a result of geopolitical conditions, the occurrence of acts of war (such as the Russia-Ukraine conflict) or terrorist incidents or as a result of weather or natural disasters or other crises including public health crises; the ability to obtain governmental approvals and to construct facilities on terms and schedules acceptable to the Company; changes in applicable tariffs, duties and trade agreements, tax rates or legislation throughout the world including, but not limited to, adjustments, changes in estimates or interpretations or the resolution of tax examinations or audits that may impact recorded or future tax impacts and potential regulatory and legislative tax developments in the United States and other jurisdictions; changes in the degree of intellectual property and other legal protection afforded to our products or technologies, or the theft of such intellectual property; potential liability for remedial actions and increased costs under existing or future environmental, health and safety regulations, including those relating to climate change; potential liability resulting from pending or future claims or litigation, including investigations or enforcement action, or from changes in the laws, regulations or policies of governments or other governmental activities in the countries in which we operate; changes in currency exchange rates and interest rates; our level of indebtedness, which could diminish our ability to raise additional capital to fund operations or limit our ability to react to changes in the economy or the chemicals industry; tax rates and changes thereto; our ability to obtain regulatory approval for, and satisfy closing conditions to, any transactions described herein; and various other factors discussed from time to time in the Company's filings with the Securities and Exchange Commission.
Any forward-looking statement speaks only as of the date on which it is made, and the Company undertakes no obligation to update any forward-looking statements to reflect events or circumstances after the date on which it is made or to reflect the occurrence of anticipated or unanticipated events or circumstances.
Results Unaudited
The results in this document, together with the adjustments made to present the results on a comparable basis, have not been audited and are based on internal financial data furnished to management. Quarterly results should not be taken as an indication of the results of operations to be reported for any subsequent period or for the full fiscal year.
Non-GAAP Financial Measures
These prepared comments, and statements made in connection with these prepared comments, refer to non-GAAP financial measures. For more information on the non-GAAP financial measures used by the Company, including the most directly comparable GAAP financial measure for each non-GAAP financial measure used, including definitions and reconciliations of the differences between such non-GAAP financial measures and the comparable GAAP financial measures, please refer to the Non-US GAAP Financial Measures and Supplemental Information document available on our website, investors.celanese.com, under Financial Information/Financial Document Library.
11

Exhibit 99.2
Non-US GAAP Financial Measures and Supplemental Information
July 28, 2022
In this document, the terms the "Company," "we" and "our" refer to Celanese Corporation and its subsidiaries on a consolidated basis.
Purpose
The purpose of this document is to provide information of interest to investors, analysts and other parties including supplemental financial information and reconciliations and other information concerning our use of non-US GAAP financial measures. This document is updated quarterly.
Presentation
This document presents the Company's three business segments, Engineered Materials, Acetate Tow and Acetyl Chain.
Use of Non-US GAAP Financial Measures
From time to time, management may publicly disclose certain numerical "non-GAAP financial measures" in the course of our earnings releases, financial presentations, earnings conference calls, investor and analyst meetings and otherwise. For these purposes, the Securities and Exchange Commission ("SEC") defines a "non-GAAP financial measure" as a numerical measure of historical or future financial performance, financial position or cash flows that excludes amounts, or is subject to adjustments that effectively exclude amounts, included in the most directly comparable measure calculated and presented in accordance with US GAAP, and vice versa for measures that include amounts, or are subject to adjustments that effectively include amounts, that are excluded from the most directly comparable US GAAP measure so calculated and presented. For these purposes, "GAAP" refers to generally accepted accounting principles in the United States.
Non-GAAP financial measures disclosed by management are provided as additional information to investors, analysts and other parties because the Company believes them to be important supplemental measures for assessing our financial and operating results and as a means to evaluate our financial condition and period-to-period comparisons. These non-GAAP financial measures should be viewed as supplemental to, and should not be considered in isolation or as alternatives to, net earnings (loss), operating profit (loss), operating margin, cash flow from operating activities (together with cash flow from investing and financing activities), earnings per share or any other US GAAP financial measure. These non-GAAP financial measures should be considered within the context of our complete audited and unaudited financial results for the given period, which are available on the Financial Information/Financial Document Library page of our website, investors.celanese.com. The definition and method of calculation of the non-GAAP financial measures used herein may be different from other companies' methods for calculating measures with the same or similar titles. Investors, analysts and other parties should understand how another company calculates such non-GAAP financial measures before comparing the other company's non-GAAP financial measures to any of our own. These non-GAAP financial measures may not be indicative of the historical operating results of the Company nor are they intended to be predictive or projections of future results.
Pursuant to the requirements of SEC Regulation G, whenever we refer to a non-GAAP financial measure, we will also present in this document, in the presentation itself or on a Form 8-K in connection with the presentation on the Financial Information/Financial Document Library page of our website, investors.celanese.com, to the extent practicable, the most directly comparable financial measure calculated and presented in accordance with GAAP, along with a reconciliation of the differences between the non-GAAP financial measure we reference and such comparable GAAP financial measure.
This document includes definitions and reconciliations of non-GAAP financial measures used from time to time by the Company.
Specific Measures Used
This document provides information about the following non-GAAP measures: adjusted EBIT, adjusted EBIT margin, operating EBITDA, operating EBITDA margin, operating profit (loss) attributable to Celanese Corporation, adjusted earnings per share, net debt, free cash flow and return on invested capital (adjusted). The most directly comparable financial measure presented in accordance with US GAAP in our consolidated financial statements for adjusted EBIT and operating EBITDA is net earnings (loss) attributable to Celanese Corporation; for adjusted EBIT margin and operating EBITDA margin is operating margin; for operating profit (loss) attributable to Celanese Corporation is operating profit (loss); for adjusted earnings per share is earnings (loss) from continuing operations attributable to Celanese Corporation per common share-diluted; for net debt
1
is total debt; for free cash flow is net cash provided by (used in) operations; and for return on invested capital (adjusted) is net earnings (loss) attributable to Celanese Corporation divided by the sum of the average of beginning and end of the year short- and long-term debt and Celanese Corporation stockholders' equity.
Definitions
•Adjusted EBIT is a performance measure used by the Company and is defined by the Company as net earnings (loss) attributable to Celanese Corporation, plus (earnings) loss from discontinued operations, less interest income, plus interest expense, plus refinancing expense and taxes, and further adjusted for Certain Items (refer to Table 8). We believe that adjusted EBIT provides transparent and useful information to management, investors, analysts and other parties in evaluating and assessing our primary operating results from period-to-period after removing the impact of unusual, non-operational or restructuring-related activities that affect comparability. Our management recognizes that adjusted EBIT has inherent limitations because of the excluded items. Adjusted EBIT is one of the measures management uses for planning and budgeting, monitoring and evaluating financial and operating results and as a performance metric in the Company's incentive compensation plan. We do not provide reconciliations for adjusted EBIT on a forward-looking basis (including those contained in this document) when we are unable to provide a meaningful or accurate calculation or estimation of reconciling items and the information is not available without unreasonable effort. This is due to the inherent difficulty of forecasting the timing and amount of Certain Items, such as mark-to-market pension gains and losses, that have not yet occurred, are out of our control and/or cannot be reasonably predicted. For the same reasons, we are unable to address the probable significance of the unavailable information. Adjusted EBIT margin is defined by the Company as adjusted EBIT divided by net sales. Adjusted EBIT margin has the same uses and limitations as Adjusted EBIT.
•Operating EBITDA is a performance measure used by the Company and is defined by the Company as net earnings (loss) attributable to Celanese Corporation, plus (earnings) loss from discontinued operations, less interest income, plus interest expense, plus refinancing expense, taxes and depreciation and amortization, and further adjusted for Certain Items, which Certain Items include accelerated depreciation and amortization expense. Operating EBITDA is equal to adjusted EBIT plus depreciation and amortization. We believe that Operating EBITDA provides transparent and useful information to investors, analysts and other parties in evaluating our operating performance relative to our peer companies. Operating EBITDA margin is defined by the Company as Operating EBITDA divided by net sales. Operating EBITDA margin has the same uses and limitations as Operating EBITDA.
•Operating profit (loss) attributable to Celanese Corporation is defined by the Company as operating profit (loss), less earnings (loss) attributable to noncontrolling interests ("NCI"). We believe that operating profit (loss) attributable to Celanese Corporation provides transparent and useful information to management, investors, analysts and other parties in evaluating our core operational performance. Operating margin attributable to Celanese Corporation is defined by the Company as operating profit (loss) attributable to Celanese Corporation divided by net sales. Operating margin attributable to Celanese Corporation has the same uses and limitations as Operating profit (loss) attributable to Celanese Corporation.
•Adjusted earnings per share is a performance measure used by the Company and is defined by the Company as earnings (loss) from continuing operations attributable to Celanese Corporation, adjusted for income tax (provision) benefit, Certain Items, and refinancing and related expenses, divided by the number of basic common shares and dilutive restricted stock units and stock options calculated using the treasury method. We believe that adjusted earnings per share provides transparent and useful information to management, investors, analysts and other parties in evaluating and assessing our primary operating results from period-to-period after removing the impact of the above stated items that affect comparability and as a performance metric in the Company's incentive compensation plan. We do not provide reconciliations for adjusted earnings per share on a forward-looking basis (including those contained in this document) when we are unable to provide a meaningful or accurate calculation or estimation of reconciling items and the information is not available without unreasonable effort. This is due to the inherent difficulty of forecasting the timing and amount of Certain Items, such as mark-to-market pension gains and losses, that have not yet occurred, are out of our control and/or cannot be reasonably predicted. For the same reasons, we are unable to address the probable significance of the unavailable information.
Note: The income tax expense (benefit) on Certain Items ("Non-GAAP adjustments") is determined using the applicable rates in the taxing jurisdictions in which the Non-GAAP adjustments occurred and includes both current and deferred income tax expense (benefit). The income tax rate used for adjusted earnings per share approximates the midpoint in a range of forecasted tax rates for the year. This range may include certain partial or full-year forecasted tax opportunities and related costs, where applicable, and specifically excludes changes in uncertain tax positions, discrete recognition of GAAP items on a quarterly basis, other pre-tax items adjusted out of our GAAP earnings for adjusted earnings per share purposes and changes in management's assessments regarding the ability to realize deferred tax assets for GAAP. In determining the adjusted earnings per share tax rate, we reflect the impact of foreign tax credits when utilized, or expected to be utilized, absent discrete events impacting the timing of foreign tax credit utilization. We analyze this rate quarterly and adjust it if there is a material change in the range of forecasted tax rates; an updated forecast would not necessarily result in a change to our tax rate used for adjusted earnings per share. The adjusted tax rate is an estimate and may differ from the actual tax rate used for GAAP reporting in any given reporting period. Table 3a summarizes the reconciliation of our estimated GAAP effective tax rate to the adjusted tax rate. The estimated GAAP rate excludes discrete recognition of GAAP items due to our inability to forecast such items. As part of the year-end reconciliation, we will update the reconciliation of the GAAP effective tax rate to the adjusted tax rate for actual results.
2
•Free cash flow is a liquidity measure used by the Company and is defined by the Company as net cash provided by (used in) operations, less capital expenditures on property, plant and equipment, and adjusted for capital contributions from or distributions to Mitsui & Co., Ltd. ("Mitsui") related to our methanol joint venture, Fairway Methanol LLC ("Fairway"). We believe that free cash flow provides useful information to management, investors, analysts and other parties in evaluating the Company's liquidity and credit quality assessment because it provides an indication of the long-term cash generating ability of our business. Although we use free cash flow as a measure to assess the liquidity generated by our business, the use of free cash flow has important limitations, including that free cash flow does not reflect the cash requirements necessary to service our indebtedness, lease obligations, unconditional purchase obligations or pension and postretirement funding obligations. Free cash flow is not a measure of cash available for discretionary expenditures since the Company has certain debt service and finance lease payments that are not deducted from that measure.
•Net debt is defined by the Company as total debt less cash and cash equivalents. We believe that net debt provides useful information to management, investors, analysts and other parties in evaluating changes to the Company's capital structure and credit quality assessment.
•Return on invested capital (adjusted) is defined by the Company as adjusted EBIT, tax effected using the adjusted tax rate, divided by the sum of the average of beginning and end of the year short- and long-term debt and Celanese Corporation stockholders' equity. We believe that return on invested capital (adjusted) provides useful information to management, investors, analysts and other parties in order to assess our income generation from the point of view of our stockholders and creditors who provide us with capital in the form of equity and debt and whether capital invested in the Company yields competitive returns.
Supplemental Information
Supplemental Information we believe to be of interest to investors, analysts and other parties includes the following:
•Net sales for each of our business segments and the percentage increase or decrease in net sales attributable to price, volume, currency and other factors for each of our business segments.
•Cash dividends received from our equity investments.
•For those consolidated ventures in which the Company owns or is exposed to less than 100% of the economics, the outside stockholders' interests are shown as NCI. Beginning in 2014, this includes Fairway for which the Company's ownership percentage is 50%. Amounts referred to as "attributable to Celanese Corporation" are net of any applicable NCI.
Results Unaudited
The results in this document, together with the adjustments made to present the results on a comparable basis, have not been audited and are based on internal financial data furnished to management. Quarterly results should not be taken as an indication of the results of operations to be reported for any subsequent period or for the full fiscal year.
3
Table 1
Adjusted EBIT and Operating EBITDA - Reconciliation of Non-GAAP Measures - Unaudited
| Q2 '22 | Q1 '22 | 2021 | Q4 '21 | Q3 '21 | Q2 '21 | Q1 '21 | |||||||||||||||||||||||||||||||||||
| (In $ millions) | |||||||||||||||||||||||||||||||||||||||||
Net earnings (loss) attributable to Celanese Corporation | 434 | 502 | 1,890 | 524 | 506 | 538 | 322 | ||||||||||||||||||||||||||||||||||
(Earnings) loss from discontinued operations | 6 | — | 22 | 4 | 13 | 4 | 1 | ||||||||||||||||||||||||||||||||||
| Interest income | (1) | (1) | (8) | (1) | (2) | (4) | (1) | ||||||||||||||||||||||||||||||||||
| Interest expense | 48 | 35 | 91 | 21 | 21 | 24 | 25 | ||||||||||||||||||||||||||||||||||
| Refinancing expense | — | — | 9 | — | 9 | — | — | ||||||||||||||||||||||||||||||||||
| Income tax provision (benefit) | 112 | 112 | 330 | 27 | 102 | 116 | 85 | ||||||||||||||||||||||||||||||||||
Certain Items attributable to Celanese Corporation (Table 8) | 47 | 65 | 139 | 77 | (1) | 13 | 50 | ||||||||||||||||||||||||||||||||||
| Adjusted EBIT | 646 | 713 | 2,473 | 652 | 648 | 691 | 482 | ||||||||||||||||||||||||||||||||||
Depreciation and amortization expense(1) | 98 | 100 | 362 | 93 | 91 | 90 | 88 | ||||||||||||||||||||||||||||||||||
| Operating EBITDA | 744 | 813 | 2,835 | 745 | 739 | 781 | 570 | ||||||||||||||||||||||||||||||||||
| Q2 '22 | Q1 '22 | 2021 | Q4 '21 | Q3 '21 | Q2 '21 | Q1 '21 | |||||||||||||||||||||||||||||||||||
| (In $ millions) | |||||||||||||||||||||||||||||||||||||||||
| Engineered Materials | 4 | 4 | 9 | 4 | 2 | 1 | 2 | ||||||||||||||||||||||||||||||||||
| Acetate Tow | — | — | — | — | — | — | — | ||||||||||||||||||||||||||||||||||
| Acetyl Chain | — | 2 | — | — | — | — | — | ||||||||||||||||||||||||||||||||||
Other Activities(2) | 1 | — | — | — | — | — | — | ||||||||||||||||||||||||||||||||||
Accelerated depreciation and amortization expense | 5 | 6 | 9 | 4 | 2 | 1 | 2 | ||||||||||||||||||||||||||||||||||
Depreciation and amortization expense(1) | 98 | 100 | 362 | 93 | 91 | 90 | 88 | ||||||||||||||||||||||||||||||||||
Total depreciation and amortization expense | 103 | 106 | 371 | 97 | 93 | 91 | 90 | ||||||||||||||||||||||||||||||||||
______________________________
(1)Excludes accelerated depreciation and amortization expense as detailed in the table above, which amounts are included in Certain Items above.
(2)Other Activities includes corporate Selling, general and administrative ("SG&A") expenses, the results of captive insurance companies and certain components of net periodic benefit cost (interest cost, expected return on plan assets and net actuarial gains and losses).
4
| Table 2 - Supplemental Segment Data and Reconciliation of Segment Adjusted EBIT and Operating EBITDA - Non-GAAP Measures - Unaudited | | |||||||
| Q2 '22 | Q1 '22 | 2021 | Q4 '21 | Q3 '21 | Q2 '21 | Q1 '21 | |||||||||||||||||||||||||||||||||||||||||||||||||||||||||||||||||||||||||||||
| (In $ millions, except percentages) | |||||||||||||||||||||||||||||||||||||||||||||||||||||||||||||||||||||||||||||||||||
| Operating Profit (Loss) / Operating Margin | |||||||||||||||||||||||||||||||||||||||||||||||||||||||||||||||||||||||||||||||||||
| Engineered Materials | 166 | 17.5 | % | 124 | 13.6 | % | 411 | 15.1 | % | 67 | 9.5 | % | 91 | 13.3 | % | 123 | 18.0 | % | 130 | 20.2 | % | ||||||||||||||||||||||||||||||||||||||||||||||||||||||||||||||
| Acetate Tow | (1) | (0.8) | % | 4 | 3.2 | % | 56 | 10.9 | % | 4 | 3.1 | % | 12 | 9.4 | % | 24 | 17.4 | % | 16 | 13.4 | % | ||||||||||||||||||||||||||||||||||||||||||||||||||||||||||||||
Acetyl Chain(1) | 429 | 29.5 | % | 499 | 32.4 | % | 1,819 | 33.5 | % | 535 | 36.2 | % | 517 | 34.7 | % | 516 | 36.6 | % | 251 | 23.8 | % | ||||||||||||||||||||||||||||||||||||||||||||||||||||||||||||||
Other Activities(2) | (111) | (96) | (340) | (89) | (84) | (96) | (71) | ||||||||||||||||||||||||||||||||||||||||||||||||||||||||||||||||||||||||||||
| Total | 483 | 19.4 | % | 531 | 20.9 | % | 1,946 | 22.8 | % | 517 | 22.7 | % | 536 | 23.7 | % | 567 | 25.8 | % | 326 | 18.1 | % | ||||||||||||||||||||||||||||||||||||||||||||||||||||||||||||||
Less: Net Earnings (Loss) Attributable to NCI(1) | 2 | 2 | 6 | 2 | 1 | 2 | 1 | ||||||||||||||||||||||||||||||||||||||||||||||||||||||||||||||||||||||||||||
| Operating Profit (Loss) Attributable to Celanese Corporation | 481 | 19.3 | % | 529 | 20.8 | % | 1,940 | 22.7 | % | 515 | 22.6 | % | 535 | 23.6 | % | 565 | 25.7 | % | 325 | 18.1 | % | ||||||||||||||||||||||||||||||||||||||||||||||||||||||||||||||
| Operating Profit (Loss) / Operating Margin Attributable to Celanese Corporation | |||||||||||||||||||||||||||||||||||||||||||||||||||||||||||||||||||||||||||||||||||
| Engineered Materials | 166 | 17.5 | % | 124 | 13.6 | % | 411 | 15.1 | % | 67 | 9.5 | % | 91 | 13.3 | % | 123 | 18.0 | % | 130 | 20.2 | % | ||||||||||||||||||||||||||||||||||||||||||||||||||||||||||||||
| Acetate Tow | (1) | (0.8) | % | 4 | 3.2 | % | 56 | 10.9 | % | 4 | 3.1 | % | 12 | 9.4 | % | 24 | 17.4 | % | 16 | 13.4 | % | ||||||||||||||||||||||||||||||||||||||||||||||||||||||||||||||
Acetyl Chain(1) | 427 | 29.3 | % | 497 | 32.3 | % | 1,813 | 33.4 | % | 533 | 36.1 | % | 516 | 34.7 | % | 514 | 36.5 | % | 250 | 23.7 | % | ||||||||||||||||||||||||||||||||||||||||||||||||||||||||||||||
Other Activities(2) | (111) | (96) | (340) | (89) | (84) | (96) | (71) | ||||||||||||||||||||||||||||||||||||||||||||||||||||||||||||||||||||||||||||
| Total | 481 | 19.3 | % | 529 | 20.8 | % | 1,940 | 22.7 | % | 515 | 22.6 | % | 535 | 23.6 | % | 565 | 25.7 | % | 325 | 18.1 | % | ||||||||||||||||||||||||||||||||||||||||||||||||||||||||||||||
| Equity Earnings and Dividend Income, Other Income (Expense) Attributable to Celanese Corporation | |||||||||||||||||||||||||||||||||||||||||||||||||||||||||||||||||||||||||||||||||||
| Engineered Materials | 53 | 49 | 127 | 30 | 40 | (3) | 32 | 25 | |||||||||||||||||||||||||||||||||||||||||||||||||||||||||||||||||||||||||||
| Acetate Tow | 36 | 36 | 146 | 34 | 34 | 37 | 41 | ||||||||||||||||||||||||||||||||||||||||||||||||||||||||||||||||||||||||||||
| Acetyl Chain | 3 | 4 | 8 | 2 | 2 | 2 | 2 | ||||||||||||||||||||||||||||||||||||||||||||||||||||||||||||||||||||||||||||
Other Activities(2) | 1 | 6 | 7 | 1 | 1 | 4 | 1 | ||||||||||||||||||||||||||||||||||||||||||||||||||||||||||||||||||||||||||||
| Total | 93 | 95 | 288 | 67 | 77 | 75 | 69 | ||||||||||||||||||||||||||||||||||||||||||||||||||||||||||||||||||||||||||||
| Non-Operating Pension and Other Post-Retirement Employee Benefit (Expense) Income Attributable to Celanese Corporation | |||||||||||||||||||||||||||||||||||||||||||||||||||||||||||||||||||||||||||||||||||
| Engineered Materials | — | — | — | — | — | — | — | ||||||||||||||||||||||||||||||||||||||||||||||||||||||||||||||||||||||||||||
| Acetate Tow | — | — | — | — | — | — | — | ||||||||||||||||||||||||||||||||||||||||||||||||||||||||||||||||||||||||||||
| Acetyl Chain | — | — | — | — | — | — | — | ||||||||||||||||||||||||||||||||||||||||||||||||||||||||||||||||||||||||||||
Other Activities(2) | 25 | 24 | 106 | (7) | 37 | 38 | 38 | ||||||||||||||||||||||||||||||||||||||||||||||||||||||||||||||||||||||||||||
| Total | 25 | 24 | 106 | (7) | 37 | 38 | 38 | ||||||||||||||||||||||||||||||||||||||||||||||||||||||||||||||||||||||||||||
Certain Items Attributable to Celanese Corporation (Table 8) | |||||||||||||||||||||||||||||||||||||||||||||||||||||||||||||||||||||||||||||||||||
| Engineered Materials | 5 | 38 | 33 | 16 | 6 | 6 | 5 | ||||||||||||||||||||||||||||||||||||||||||||||||||||||||||||||||||||||||||||
| Acetate Tow | — | — | 5 | — | — | 1 | 4 | ||||||||||||||||||||||||||||||||||||||||||||||||||||||||||||||||||||||||||||
| Acetyl Chain | 10 | 2 | 28 | 1 | (1) | (2) | 30 | ||||||||||||||||||||||||||||||||||||||||||||||||||||||||||||||||||||||||||||
Other Activities(2) | 32 | 25 | 73 | 60 | (6) | 8 | 11 | ||||||||||||||||||||||||||||||||||||||||||||||||||||||||||||||||||||||||||||
| Total | 47 | 65 | 139 | 77 | (1) | 13 | 50 | ||||||||||||||||||||||||||||||||||||||||||||||||||||||||||||||||||||||||||||
___________________________
(1)Net earnings (loss) attributable to NCI is included within the Acetyl Chain segment.
(2)Other Activities includes corporate SG&A expenses, the results of captive insurance companies and certain components of net periodic benefit cost (interest cost, expected return on plan assets and net actuarial gains and losses).
(3)Includes $39 million of Equity in net earnings (loss) of affiliates and $1 million of Other income.
5
| Table 2 - Supplemental Segment Data and Reconciliation of Segment Adjusted EBIT and Operating EBITDA - Non-GAAP Measures - Unaudited (cont.) | | |||||||
| Q2 '22 | Q1 '22 | 2021 | Q4 '21 | Q3 '21 | Q2 '21 | Q1 '21 | |||||||||||||||||||||||||||||||||||||||||||||||||||||||||||||||||||||||||||||
| (In $ millions, except percentages) | |||||||||||||||||||||||||||||||||||||||||||||||||||||||||||||||||||||||||||||||||||
Adjusted EBIT / Adjusted EBIT Margin | |||||||||||||||||||||||||||||||||||||||||||||||||||||||||||||||||||||||||||||||||||
| Engineered Materials | 224 | 23.6 | % | 211 | 23.2 | % | 571 | 21.0 | % | 113 | 16.0 | % | 137 | 20.0 | % | 161 | 23.6 | % | 160 | 24.8 | % | ||||||||||||||||||||||||||||||||||||||||||||||||||||||||||||||
| Acetate Tow | 35 | 29.4 | % | 40 | 32.0 | % | 207 | 40.3 | % | 38 | 29.5 | % | 46 | 35.9 | % | 62 | 44.9 | % | 61 | 51.3 | % | ||||||||||||||||||||||||||||||||||||||||||||||||||||||||||||||
| Acetyl Chain | 440 | 30.2 | % | 503 | 32.7 | % | 1,849 | 34.1 | % | 536 | 36.3 | % | 517 | 34.7 | % | 514 | 36.5 | % | 282 | 26.7 | % | ||||||||||||||||||||||||||||||||||||||||||||||||||||||||||||||
Other Activities(2) | (53) | (41) | (154) | (35) | (52) | (46) | (21) | ||||||||||||||||||||||||||||||||||||||||||||||||||||||||||||||||||||||||||||
| Total | 646 | 26.0 | % | 713 | 28.1 | % | 2,473 | 29.0 | % | 652 | 28.7 | % | 648 | 28.6 | % | 691 | 31.4 | % | 482 | 26.8 | % | ||||||||||||||||||||||||||||||||||||||||||||||||||||||||||||||
Depreciation and Amortization Expense(1) | |||||||||||||||||||||||||||||||||||||||||||||||||||||||||||||||||||||||||||||||||||
| Engineered Materials | 41 | 42 | 135 | 35 | 33 | 34 | 33 | ||||||||||||||||||||||||||||||||||||||||||||||||||||||||||||||||||||||||||||
| Acetate Tow | 10 | 11 | 39 | 10 | 10 | 9 | 10 | ||||||||||||||||||||||||||||||||||||||||||||||||||||||||||||||||||||||||||||
| Acetyl Chain | 42 | 43 | 171 | 43 | 44 | 43 | 41 | ||||||||||||||||||||||||||||||||||||||||||||||||||||||||||||||||||||||||||||
Other Activities(2) | 5 | 4 | 17 | 5 | 4 | 4 | 4 | ||||||||||||||||||||||||||||||||||||||||||||||||||||||||||||||||||||||||||||
| Total | 98 | 100 | 362 | 93 | 91 | 90 | 88 | ||||||||||||||||||||||||||||||||||||||||||||||||||||||||||||||||||||||||||||
Operating EBITDA / Operating EBITDA Margin | |||||||||||||||||||||||||||||||||||||||||||||||||||||||||||||||||||||||||||||||||||
| Engineered Materials | 265 | 28.0 | % | 253 | 27.8 | % | 706 | 26.0 | % | 148 | 20.9 | % | 170 | 24.9 | % | 195 | 28.6 | % | 193 | 29.9 | % | ||||||||||||||||||||||||||||||||||||||||||||||||||||||||||||||
| Acetate Tow | 45 | 37.8 | % | 51 | 40.8 | % | 246 | 47.9 | % | 48 | 37.2 | % | 56 | 43.8 | % | 71 | 51.4 | % | 71 | 59.7 | % | ||||||||||||||||||||||||||||||||||||||||||||||||||||||||||||||
| Acetyl Chain | 482 | 33.1 | % | 546 | 35.5 | % | 2,020 | 37.2 | % | 579 | 39.2 | % | 561 | 37.7 | % | 557 | 39.5 | % | 323 | 30.6 | % | ||||||||||||||||||||||||||||||||||||||||||||||||||||||||||||||
Other Activities(2) | (48) | (37) | (137) | (30) | (48) | (42) | (17) | ||||||||||||||||||||||||||||||||||||||||||||||||||||||||||||||||||||||||||||
| Total | 744 | 29.9 | % | 813 | 32.0 | % | 2,835 | 33.2 | % | 745 | 32.7 | % | 739 | 32.6 | % | 781 | 35.5 | % | 570 | 31.7 | % | ||||||||||||||||||||||||||||||||||||||||||||||||||||||||||||||
___________________________
(1)Excludes accelerated depreciation and amortization expense, which amounts are included in Certain Items above. See Table 1 for details.
(2)Other Activities includes corporate SG&A expenses, the results of captive insurance companies and certain components of net periodic benefit cost (interest cost, expected return on plan assets and net actuarial gains and losses).
6
Table 3
Adjusted Earnings (Loss) per Share - Reconciliation of a Non-GAAP Measure - Unaudited
| Q2 '22 | Q1 '22 | 2021 | Q4 '21 | Q3 '21 | Q2 '21 | Q1 '21 | |||||||||||||||||||||||||||||||||||||||||||||||||||||||||||||||||||||||||||||
| per share | per share | per share | per share | per share | per share | per share | |||||||||||||||||||||||||||||||||||||||||||||||||||||||||||||||||||||||||||||
| (In $ millions, except per share data) | |||||||||||||||||||||||||||||||||||||||||||||||||||||||||||||||||||||||||||||||||||
Earnings (loss) from continuing operations attributable to Celanese Corporation | 440 | 4.03 | 502 | 4.61 | 1,912 | 17.06 | 528 | 4.83 | 519 | 4.67 | 542 | 4.81 | 323 | 2.83 | |||||||||||||||||||||||||||||||||||||||||||||||||||||||||||||||||||||
Income tax provision (benefit) | 112 | 112 | 330 | 27 | 102 | 116 | 85 | ||||||||||||||||||||||||||||||||||||||||||||||||||||||||||||||||||||||||||||
Earnings (loss) from continuing operations before tax | 552 | 614 | 2,242 | 555 | 621 | 658 | 408 | ||||||||||||||||||||||||||||||||||||||||||||||||||||||||||||||||||||||||||||
Certain Items attributable to Celanese Corporation (Table 8) | 47 | 65 | 139 | 77 | (1) | 13 | 50 | ||||||||||||||||||||||||||||||||||||||||||||||||||||||||||||||||||||||||||||
| Refinancing and related expenses | 26 | (1) | 14 | (1) | 9 | — | 9 | — | — | ||||||||||||||||||||||||||||||||||||||||||||||||||||||||||||||||||||||||||
Adjusted earnings (loss) from continuing operations before tax | 625 | 693 | 2,390 | 632 | 629 | 671 | 458 | ||||||||||||||||||||||||||||||||||||||||||||||||||||||||||||||||||||||||||||
Income tax (provision) benefit on adjusted earnings(2) | (81) | (90) | (359) | (95) | (94) | (105) | (64) | ||||||||||||||||||||||||||||||||||||||||||||||||||||||||||||||||||||||||||||
Adjusted earnings (loss) from continuing operations(3) | 544 | 4.99 | 603 | 5.54 | 2,031 | 18.12 | 537 | 4.91 | 535 | 4.82 | 566 | 5.02 | 394 | 3.46 | |||||||||||||||||||||||||||||||||||||||||||||||||||||||||||||||||||||
Diluted shares (in millions)(4) | |||||||||||||||||||||||||||||||||||||||||||||||||||||||||||||||||||||||||||||||||||
Weighted average shares outstanding | 108.4 | 108.2 | 111.2 | 108.6 | 110.5 | 112.3 | 113.5 | ||||||||||||||||||||||||||||||||||||||||||||||||||||||||||||||||||||||||||||
Incremental shares attributable to equity awards | 0.7 | 0.7 | 0.9 | 0.8 | 0.5 | 0.5 | 0.5 | ||||||||||||||||||||||||||||||||||||||||||||||||||||||||||||||||||||||||||||
| Total diluted shares | 109.1 | 108.9 | 112.1 | 109.4 | 111.0 | 112.8 | 114.0 | ||||||||||||||||||||||||||||||||||||||||||||||||||||||||||||||||||||||||||||
______________________________
(1)Includes interest expense for fees related to a bridge facility commitment letter for our acquisition of a majority of the Mobility & Materials business of DuPont de Nemours, Inc.
(2)Calculated using adjusted effective tax rates (Table 3a) as follows:
| Q2 '22 | Q1 '22 | 2021 | Q4 '21 | Q3 '21 | Q2 '21 | Q1 '21 | |||||||||||||||||||||||||||||||||||||||||||||||||||||||||||||||||||||||||||||
Adjusted effective tax rate | 13 | 13 | 15 | 15 | 15 | 16 | 14 | ||||||||||||||||||||||||||||||||||||||||||||||||||||||||||||||||||||||||||||
(3)Excludes the immediate recognition of actuarial gains and losses and the impact of actual vs. expected plan asset returns.
| Actual Plan Asset Returns | Expected Plan Asset Returns | |||||||||||||
| (In percentages) | ||||||||||||||
| 2021 | 1.1 | 6.3 | ||||||||||||
(4)Potentially dilutive shares are included in the adjusted earnings per share calculation when adjusted earnings are positive.
7
Table 3a
Adjusted Tax Rate - Reconciliation of a Non-GAAP Measure - Unaudited
| Estimated | Actual | ||||||||||
| 2022 | 2021 | ||||||||||
| (In percentages) | |||||||||||
| US GAAP annual effective tax rate | 19 | 15 | |||||||||
Discrete quarterly recognition of GAAP items(1) | (1) | (2) | |||||||||
Tax impact of other charges and adjustments(2) | (4) | (1) | |||||||||
| Utilization of foreign tax credits | — | (1) | |||||||||
Changes in valuation allowances, excluding impact of other charges and adjustments(3) | — | 3 | |||||||||
Other(4) | (1) | 1 | |||||||||
| Adjusted tax rate | 13 | 15 | |||||||||
______________________________
Note: As part of the year-end reconciliation, we will update the reconciliation of the GAAP effective tax rate for actual results.
(1)Such as changes in tax laws (including US tax reform), deferred taxes on outside basis differences, changes in uncertain tax positions and prior year audit adjustments.
(2)Reflects the tax impact on pre-tax adjustments presented in Certain Items (Table 8), which are excluded from pre-tax income for adjusted earnings per share purposes.
(3)Reflects changes in valuation allowances related to changes in judgment regarding the realizability of deferred tax assets or current year operations, excluding other charges and adjustments.
(4)Tax impacts related to full-year forecasted tax opportunities and related costs.
8
Table 4
Net Sales by Segment - Unaudited
| Q2 '22 | Q1 '22 | 2021 | Q4 '21 | Q3 '21 | Q2 '21 | Q1 '21 | |||||||||||||||||||||||||||||||||||
| (In $ millions) | |||||||||||||||||||||||||||||||||||||||||
| Engineered Materials | 948 | 910 | 2,718 | 707 | 684 | 682 | 645 | ||||||||||||||||||||||||||||||||||
| Acetate Tow | 119 | 125 | 514 | 129 | 128 | 138 | 119 | ||||||||||||||||||||||||||||||||||
| Acetyl Chain | 1,456 | 1,538 | 5,430 | 1,476 | 1,489 | 1,409 | 1,056 | ||||||||||||||||||||||||||||||||||
| Other Activities | — | — | — | — | — | — | — | ||||||||||||||||||||||||||||||||||
Intersegment eliminations(1) | (37) | (35) | (125) | (37) | (35) | (31) | (22) | ||||||||||||||||||||||||||||||||||
| Net sales | 2,486 | 2,538 | 8,537 | 2,275 | 2,266 | 2,198 | 1,798 | ||||||||||||||||||||||||||||||||||
___________________________
(1)Includes intersegment sales primarily related to the Acetyl Chain.
9
Table 4a
Factors Affecting Segment Net Sales Sequentially - Unaudited
Three Months Ended June 30, 2022 Compared to Three Months Ended March 31, 2022
| Volume | Price | Currency | Other | Total | ||||||||||||||||||||||||||||
| (In percentages) | ||||||||||||||||||||||||||||||||
| Engineered Materials | 1 | 6 | (3) | — | 4 | |||||||||||||||||||||||||||
| Acetate Tow | (6) | 1 | — | — | (5) | |||||||||||||||||||||||||||
| Acetyl Chain | (3) | — | (2) | — | (5) | |||||||||||||||||||||||||||
| Total Company | (2) | 2 | (2) | — | (2) | |||||||||||||||||||||||||||
Three Months Ended March 31, 2022 Compared to Three Months Ended December 31, 2021
| Volume | Price | Currency | Other | Total | ||||||||||||||||||||||||||||
| (In percentages) | ||||||||||||||||||||||||||||||||
| Engineered Materials | 23 | 7 | (1) | — | 29 | |||||||||||||||||||||||||||
| Acetate Tow | (6) | 3 | — | — | (3) | |||||||||||||||||||||||||||
| Acetyl Chain | 8 | (3) | (1) | — | 4 | |||||||||||||||||||||||||||
| Total Company | 12 | 1 | (1) | — | 12 | |||||||||||||||||||||||||||
Three Months Ended December 31, 2021 Compared to Three Months Ended September 30, 2021
| Volume | Price | Currency | Other | Total | ||||||||||||||||||||||||||||
| (In percentages) | ||||||||||||||||||||||||||||||||
| Engineered Materials | (1) | 5 | (1) | — | 3 | (1) | ||||||||||||||||||||||||||
| Acetate Tow | — | 1 | — | — | 1 | |||||||||||||||||||||||||||
| Acetyl Chain | (10) | 10 | (1) | — | (1) | |||||||||||||||||||||||||||
| Total Company | (7) | 8 | (1) | — | — | |||||||||||||||||||||||||||
Three Months Ended September 30, 2021 Compared to Three Months Ended June 30, 2021
| Volume | Price | Currency | Other | Total | ||||||||||||||||||||||||||||
| (In percentages) | ||||||||||||||||||||||||||||||||
| Engineered Materials | (2) | 3 | (1) | — | — | |||||||||||||||||||||||||||
| Acetate Tow | (8) | — | — | — | (8) | |||||||||||||||||||||||||||
| Acetyl Chain | 3 | 3 | — | — | 6 | |||||||||||||||||||||||||||
| Total Company | 1 | 3 | (1) | — | 3 | |||||||||||||||||||||||||||
________________________
(1)2021 includes the effect of the acquisition of the Santoprene™ thermoplastic vulcanizates elastomers business.
Three Months Ended June 30, 2021 Compared to Three Months Ended March 31, 2021
| Volume | Price | Currency | Other | Total | ||||||||||||||||||||||||||||
| (In percentages) | ||||||||||||||||||||||||||||||||
| Engineered Materials | (1) | 7 | — | — | 6 | |||||||||||||||||||||||||||
| Acetate Tow | 16 | — | — | — | 16 | |||||||||||||||||||||||||||
| Acetyl Chain | 7 | 27 | — | — | 34 | |||||||||||||||||||||||||||
| Total Company | 4 | 18 | — | — | 22 | |||||||||||||||||||||||||||
Three Months Ended March 31, 2021 Compared to Three Months Ended December 31, 2020
| Volume | Price | Currency | Other | Total | ||||||||||||||||||||||||||||
| (In percentages) | ||||||||||||||||||||||||||||||||
| Engineered Materials | 6 | 6 | 1 | — | 13 | |||||||||||||||||||||||||||
| Acetate Tow | (10) | (1) | — | — | (11) | |||||||||||||||||||||||||||
| Acetyl Chain | (7) | 23 | — | — | 16 | |||||||||||||||||||||||||||
| Total Company | (3) | 15 | 1 | — | 13 | |||||||||||||||||||||||||||
10
Table 4b
Factors Affecting Segment Net Sales Year Over Year - Unaudited
Three Months Ended June 30, 2022 Compared to Three Months Ended June 30, 2021
| Volume | Price | Currency | Other | Total | ||||||||||||||||||||||||||||
| (In percentages) | ||||||||||||||||||||||||||||||||
| Engineered Materials | 24 | 24 | (9) | — | 39 | |||||||||||||||||||||||||||
| Acetate Tow | (18) | 4 | — | — | (14) | |||||||||||||||||||||||||||
| Acetyl Chain | (4) | 10 | (3) | — | 3 | |||||||||||||||||||||||||||
| Total Company | 3 | 14 | (4) | — | 13 | |||||||||||||||||||||||||||
Three Months Ended March 31, 2022 Compared to Three Months Ended March 31, 2021
| Volume | Price | Currency | Other | Total | ||||||||||||||||||||||||||||
| (In percentages) | ||||||||||||||||||||||||||||||||
| Engineered Materials | 20 | 25 | (4) | — | 41 | |||||||||||||||||||||||||||
| Acetate Tow | 1 | 4 | — | — | 5 | |||||||||||||||||||||||||||
| Acetyl Chain | 8 | 39 | (1) | — | 46 | |||||||||||||||||||||||||||
| Total Company | 12 | 32 | (2) | (1) | 41 | |||||||||||||||||||||||||||
Three Months Ended December 31, 2021 Compared to Three Months Ended December 31, 2020
| Volume | Price | Currency | Other | Total | ||||||||||||||||||||||||||||
| (In percentages) | ||||||||||||||||||||||||||||||||
| Engineered Materials | 5 | 20 | (1) | — | 24 | |||||||||||||||||||||||||||
| Acetate Tow | (3) | (1) | — | — | (4) | |||||||||||||||||||||||||||
| Acetyl Chain | (6) | 68 | — | — | 62 | |||||||||||||||||||||||||||
| Total Company | (2) | 46 | (1) | — | 43 | |||||||||||||||||||||||||||
Three Months Ended September 30, 2021 Compared to Three Months Ended September 30, 2020
| Volume | Price | Currency | Other | Total | ||||||||||||||||||||||||||||
| (In percentages) | ||||||||||||||||||||||||||||||||
| Engineered Materials | 11 | 17 | 2 | — | 30 | |||||||||||||||||||||||||||
| Acetate Tow | — | (2) | — | 1 | (1) | |||||||||||||||||||||||||||
| Acetyl Chain | 11 | 80 | 1 | — | 92 | |||||||||||||||||||||||||||
| Total Company | 10 | 50 | 1 | — | 61 | |||||||||||||||||||||||||||
Three Months Ended June 30, 2021 Compared to Three Months Ended June 30, 2020
| Volume | Price | Currency | Other | Total | ||||||||||||||||||||||||||||
| (In percentages) | ||||||||||||||||||||||||||||||||
| Engineered Materials | 43 | 11 | 8 | — | 62 | |||||||||||||||||||||||||||
| Acetate Tow | 10 | (1) | — | — | 9 | |||||||||||||||||||||||||||
| Acetyl Chain | 27 | 83 | 3 | — | 113 | |||||||||||||||||||||||||||
| Total Company | 31 | 50 | 4 | (1) | 84 | |||||||||||||||||||||||||||
Three Months Ended March 31, 2021 Compared to Three Months Ended March 31, 2020
| Volume | Price | Currency | Other | Total | ||||||||||||||||||||||||||||
| (In percentages) | ||||||||||||||||||||||||||||||||
| Engineered Materials | 7 | 2 | 6 | — | 15 | |||||||||||||||||||||||||||
| Acetate Tow | (8) | — | — | — | (8) | |||||||||||||||||||||||||||
| Acetyl Chain | 5 | 25 | 2 | — | 32 | |||||||||||||||||||||||||||
| Total Company | 5 | 14 | 4 | — | 23 | |||||||||||||||||||||||||||
11
Table 4c
Factors Affecting Segment Net Sales Year Over Year - Unaudited
Year Ended December 31, 2021 Compared to Year Ended December 31, 2020
| Volume | Price | Currency | Other | Total | ||||||||||||||||||||||||||||
| (In percentages) | ||||||||||||||||||||||||||||||||
| Engineered Materials | 15 | 12 | 4 | — | 31 | |||||||||||||||||||||||||||
| Acetate Tow | — | (1) | — | — | (1) | |||||||||||||||||||||||||||
| Acetyl Chain | 9 | 62 | 2 | — | 73 | |||||||||||||||||||||||||||
| Total Company | 10 | 39 | 2 | — | 51 | |||||||||||||||||||||||||||
12
Table 5
Free Cash Flow - Reconciliation of a Non-GAAP Measure - Unaudited
| Q2 '22 | Q1 '22 | 2021 | Q4 '21 | Q3 '21 | Q2 '21 | Q1 '21 | |||||||||||||||||||||||||||||||||||
| (In $ millions, except percentages) | |||||||||||||||||||||||||||||||||||||||||
| Net cash provided by (used in) investing activities | (136) | (149) | (1,119) | (1,286) | (108) | 177 | 98 | ||||||||||||||||||||||||||||||||||
| Net cash provided by (used in) financing activities | (159) | (95) | (1,042) | (99) | (228) | (344) | (371) | ||||||||||||||||||||||||||||||||||
| Net cash provided by (used in) operating activities | 495 | 316 | 1,757 | 584 | 630 | 427 | 116 | ||||||||||||||||||||||||||||||||||
| Capital expenditures on property, plant and equipment | (124) | (137) | (467) | (163) | (102) | (110) | (92) | ||||||||||||||||||||||||||||||||||
| Distributions to NCI | (3) | (4) | (27) | (6) | (8) | (8) | (5) | ||||||||||||||||||||||||||||||||||
Free cash flow(1)(2) | 368 | 175 | 1,263 | 415 | 520 | 309 | 19 | ||||||||||||||||||||||||||||||||||
| Net sales | 2,486 | 2,538 | 8,537 | 2,275 | 2,266 | 2,198 | 1,798 | ||||||||||||||||||||||||||||||||||
| Free cash flow as % of Net sales | 14.8 | % | 6.9 | % | 14.8 | % | 18.2 | % | 22.9 | % | 14.1 | % | 1.1 | % | |||||||||||||||||||||||||||
______________________________
(1)Free cash flow is a liquidity measure used by the Company and is defined by the Company as net cash provided by (used in) operating activities, less capital expenditures on property, plant and equipment, and adjusted for capital contributions or distributions to Mitsui related to our joint venture, Fairway.
13
Table 6
Cash Dividends Received - Unaudited
| Q2 '22 | Q1 '22 | 2021 | Q4 '21 | Q3 '21 | Q2 '21 | Q1 '21 | |||||||||||||||||||||||||||||||||||
| (In $ millions) | |||||||||||||||||||||||||||||||||||||||||
| Dividends from equity method investments | 82 | 26 | 112 | 51 | 8 | 18 | 35 | ||||||||||||||||||||||||||||||||||
| Dividends from equity investments without readily determinable fair values | 36 | 37 | 147 | 33 | 35 | 37 | 42 | ||||||||||||||||||||||||||||||||||
| Total | 118 | 63 | 259 | 84 | 43 | 55 | 77 | ||||||||||||||||||||||||||||||||||
Table 7
Net Debt - Reconciliation of a Non-GAAP Measure - Unaudited
| Q2 '22 | Q1 '22 | 2021 | Q4 '21 | Q3 '21 | Q2 '21 | Q1 '21 | |||||||||||||||||||||||||||||||||||
| (In $ millions) | |||||||||||||||||||||||||||||||||||||||||
Short-term borrowings and current installments of long-term debt - third party and affiliates | 809 | 860 | 791 | 791 | 103 | 500 | 497 | ||||||||||||||||||||||||||||||||||
| Long-term debt, net of unamortized deferred financing costs | 3,022 | 3,132 | 3,176 | 3,176 | 3,724 | 3,156 | 3,135 | ||||||||||||||||||||||||||||||||||
| Total debt | 3,831 | 3,992 | 3,967 | 3,967 | 3,827 | 3,656 | 3,632 | ||||||||||||||||||||||||||||||||||
| Cash and cash equivalents | (783) | (605) | (536) | (536) | (1,340) | (1,054) | (791) | ||||||||||||||||||||||||||||||||||
| Net debt | 3,048 | 3,387 | 3,431 | 3,431 | 2,487 | 2,602 | 2,841 | ||||||||||||||||||||||||||||||||||
14
Table 8
Certain Items - Unaudited
The following Certain Items attributable to Celanese Corporation are included in Net earnings (loss) and are adjustments to non-GAAP measures:
| Q2 '22 | Q1 '22 | 2021 | Q4 '21 | Q3 '21 | Q2 '21 | Q1 '21 | Income Statement Classification | ||||||||||||||||||||||||||||||||||||||||
| (In $ millions) | |||||||||||||||||||||||||||||||||||||||||||||||
| Exit and shutdown costs | 29 | 7 | 18 | 8 | 7 | 5 | (2) | Cost of sales / SG&A / Other (charges) gains, net / Gain (loss) on disposition of businesses and assets, net / Non-operating pension and other postretirement employee benefit (expense) income | |||||||||||||||||||||||||||||||||||||||
| Asset impairments | (1) | — | 2 | — | — | 1 | 1 | Cost of sales / Other (charges) gains, net | |||||||||||||||||||||||||||||||||||||||
Impact from plant incidents and natural disasters(1) | — | — | 41 | — | — | — | 41 | Cost of sales | |||||||||||||||||||||||||||||||||||||||
| Mergers, acquisitions and dispositions | 29 | 56 | 29 | 19 | 4 | 6 | — | Cost of sales / SG&A | |||||||||||||||||||||||||||||||||||||||
Actuarial (gain) loss on pension and postretirement plans | — | — | 43 | 43 | — | — | — | Cost of sales / SG&A / Non-operating pension and other postretirement employee benefit (expense) income | |||||||||||||||||||||||||||||||||||||||
| Legal settlements and commercial disputes | — | 2 | 16 | 4 | 2 | 1 | 9 | Cost of sales / SG&A / Other (charges) gains, net | |||||||||||||||||||||||||||||||||||||||
| Other | (10) | — | (10) | 3 | (14) | (2) | — | 1 | Cost of sales / SG&A / Gain (loss) on disposition of businesses and assets, net | ||||||||||||||||||||||||||||||||||||||
Certain Items attributable to Celanese Corporation | 47 | 65 | 139 | 77 | (1) | 13 | 50 | ||||||||||||||||||||||||||||||||||||||||
___________________________
(1)Primarily associated with Winter Storm Uri.
(2)Primarily associated with the sale of our Spondon site.
15
Table 9
Return on Invested Capital (Adjusted) - Presentation of a Non-GAAP Measure - Unaudited
| 2021 | |||||||||||||||||
| (In $ millions, except percentages) | |||||||||||||||||
| Net earnings (loss) attributable to Celanese Corporation | 1,890 | ||||||||||||||||
Adjusted EBIT (Table 1) | 2,473 | ||||||||||||||||
Adjusted effective tax rate (Table 3a) | 15 | % | |||||||||||||||
| Adjusted EBIT tax effected | 2,102 | ||||||||||||||||
| 2021 | 2020 | Average | |||||||||||||||
| (In $ millions, except percentages) | |||||||||||||||||
Short-term borrowings and current installments of long-term debt - third parties and affiliates | 791 | 496 | 644 | ||||||||||||||
| Long-term debt, net of unamortized deferred financing costs | 3,176 | 3,227 | 3,202 | ||||||||||||||
| Celanese Corporation stockholders' equity | 4,189 | 3,526 | 3,858 | ||||||||||||||
| Invested capital | 7,704 | ||||||||||||||||
| Return on invested capital (adjusted) | 27.3 | % | |||||||||||||||
Net earnings (loss) attributable to Celanese Corporation as a percentage of invested capital | 24.5 | % | |||||||||||||||
16
Serious News for Serious Traders! Try StreetInsider.com Premium Free!
You May Also Be Interested In
- Celanese Corp. (CE) Declares $0.70 Quarterly Dividend; 1.8% Yield
- Form 8.3 - International Distributions Services Plc
- Nykredit’s and Totalkredit’s auctions for 1 July 2024 refinancing - Totalkredit A/S
Create E-mail Alert Related Categories
SEC FilingsSign up for StreetInsider Free!
Receive full access to all new and archived articles, unlimited portfolio tracking, e-mail alerts, custom newswires and RSS feeds - and more!
