

Form 8-K CURTISS WRIGHT CORP For: May 02
 Tweet
Tweet Share
Share
SECURITIES
AND EXCHANGE COMMISSION
Washington,
D.C. 20549
FORM 8-K
CURRENT REPORT
Pursuant to Section 13 or 15(D) of the Securities Exchange Act of 1934
Date of
Report: (Date of earliest event reported): May 2, 2018
CURTISS-WRIGHT
CORPORATION
(Exact
Name of Registrant as Specified in Its Charter)
|
Delaware |
1-134 |
13-0612970 |
|
State or Other Jurisdiction of Incorporation or Organization |
Commission File Number |
IRS Employer Identification No. |
|
130 Harbour Place Drive, Suite 300 Davidson, North Carolina |
28036 |
|
Address of Principal Executive Offices |
Zip Code |
Registrant’s telephone number, including area code: (704) 869-4600
--------------
|
(Former name or former address, if changed since last report) |
Check the appropriate box below if the Form 8-K filing is intended to simultaneously satisfy the filing obligation of the registrant under any of the following provisions (see General Instruction A.2. below):
⃞
Written
communications pursuant to Rule 425 under the Securities Act (17 CFR
230.425)
⃞
Soliciting
material pursuant to Rule 14a-12 under the Exchange Act (17 CFR
240.14a-12)
⃞
Pre-commencement
communications pursuant to Rule 14d-2(b) under the Exchange Act (17 CFR
240.14d-2(b))
⃞
Pre-commencement
communications pursuant to Rule 13e-4(c) under the Exchange Act (17 CFR
240.13e-4(c))
Indicate by check mark whether the registrant is an emerging growth company as defined in Rule 405 of the Securities Act of 1933 (§230.405 of this chapter) or Rule 12b-2 of the Securities Exchange Act of 1934 (§240.12b-2 of this chapter).
Emerging growth company ⃞
If an emerging growth company, indicate by check mark if the registrant has elected not to use the extended transition period for complying with any new or revised financial accounting standards provided pursuant to Section 13(a) of the Exchange Act. ⃞
SECTION 2 – FINANCIAL INFORMATION
ITEM 2.02. RESULTS OF OPERATIONS AND FINANCIAL CONDITION.
On Wednesday, May 2, 2018, the Company issued a press release announcing financial results for the first quarter ended March 31, 2018. A conference call and webcast presentation will be held on May 3, 2018 at 9:00 am EDT for management to discuss the Company's first quarter 2018 performance and updates to 2018 financial guidance. David C. Adams, Chairman and CEO, and Glenn E. Tynan, Vice President and CFO, will host the call. A copy of the press release and the webcast slide presentation are attached hereto as Exhibits 99.1 and 99.2.
The financial press release, access to the webcast, and the accompanying financial presentation will be posted on Curtiss-Wright's website at www.curtisswright.com. In addition, the Listen-Only dial-in number for domestic callers is (844) 220-4970, while international callers can dial (262) 558-6349. For those unable to participate live, a webcast replay will be available for 90 days on the Company's website beginning one hour after the call takes place. A conference call replay will also be available for seven days.
| Conference Call Replay: | |
| Domestic (855) 859-2056 | |
| International (404) 537-3406 | |
| Passcode 8391309 |
The information contained in this Current Report, including Exhibits
99.1 and 99.2, are being furnished and shall not be deemed to be “filed”
for the purposes of Section 18 of the Securities and Exchange Act of
1934 or otherwise subject to the liabilities of that Section. The
information in this report shall not be incorporated by reference into
any filing of the registrant with the SEC, whether made before or after
the date hereof, regardless of any general incorporation language in
such filings.
ITEM 9.01 FINANCIAL STATEMENTS AND EXHIBITS.
| (a) | Not applicable. | |
| (b) | Not applicable. | |
| (c) |
Exhibits. |
|
99.1 Press Release dated May 2, 2018 |
|
| 99.2 Presentation shown during investor and securities analyst webcast on May 3, 2018 |
SIGNATURE
Pursuant to the requirements of the Securities Exchange Act of 1934, the
Registrant has caused
this report to be signed on its behalf by the
undersigned, thereunto duly authorized.
|
|
CURTISS-WRIGHT CORPORATION |
||
|
|
|
By: |
/s/ Glenn E. Tynan |
|
Glenn E. Tynan |
|||
|
|
Vice-President and |
||
|
Chief Financial Officer |
|||
|
Date: |
May 2, 2018 |
EXHIBIT INDEX
|
Exhibit |
Description |
|
Presentation shown during investor and securities analyst webcast on May 3, 2018 |
4
Exhibit 99.1
Curtiss-Wright Reports First Quarter 2018 Financial Results; Raises Full-Year Organic Guidance
DAVIDSON, N.C.--(BUSINESS WIRE)--May 2, 2018--Curtiss-Wright Corporation (NYSE: CW) reports financial results for the first quarter ended March 31, 2018.
First Quarter 2018 Highlights
- Diluted earnings per share (EPS) of $0.98, up 35% compared with the prior year;
- Net sales of $548 million, up 5%, including 3% organic growth;
- Operating income of $64 million, up 35%;
- Operating margin of 11.8%, up 270 basis points;
- Backlog of $2.1 billion, up 2% from December 31, 2017; and
- Share repurchases of approximately $12 million.
Full-Year 2018 Business Outlook
- Full-year 2018 organic guidance reflects a $0.06 increase in full-year EPS driven by the benefit of solid first quarter performance and improved outlook in the Commercial/Industrial segment, which added $10 million to sales and approximately $3 million to operating income;
- Full-year 2018 organic guidance reflects higher sales (up 3-5%), operating income (up 10-13%), operating margin (up 90-110 bps) and diluted EPS (up 19-22%);
- Full-year 2018 guidance updated to include the acquisition of the Dresser-Rand government business (Dresser-Rand) within the Power segment, which added $70 million in sales and $10 million in free cash flow, but reduced operating income by approximately $14 million, operating margin by 100 basis points and diluted EPS by $0.24, due to first year purchase accounting costs associated with the acquisition. Excluding first year purchase accounting costs, the acquisition would otherwise be accretive to 2018 diluted EPS; and
- Overall, we increased full-year 2018 sales guidance by $80 million; reduced operating income guidance by approximately $12 million, reduced operating margin guidance by 100 basis points, and reduced diluted EPS guidance by $0.18 to new range of $5.47 to $5.62 (up 14-17%).
|
|
EPS Guidance | ||||
| Prior Guidance | $ 5.65 - $5.80 | ||||
| Increase driven by solid 1Q performance | $0.06 | ||||
| Guidance prior to impact of acquisition | $ 5.71 - $5.86 | ||||
| Dresser-Rand impact including first year purchase accounting costs | ($0.24 | ) | |||
| Current Guidance | $ 5.47 - $5.62 | ||||
“First quarter diluted EPS of $0.98 was ahead of our expectations, as we delivered solid 5% top-line growth, led by increased defense and industrial sales, and improved profitability, driven by the benefits of our ongoing margin improvement initiatives,” said David C. Adams, Chairman and CEO of Curtiss-Wright Corporation.
“We are off to a solid start to 2018 and anticipate steady, sequential margin and EPS improvement over the remainder of the year. We are projecting another solid organic operational performance this year and expect higher sales in all end markets, double-digit growth in operating income, strong margin expansion and free cash flow conversion in excess of 100%. The recently completed acquisition of Dresser-Rand significantly expands our naval defense business and supports our objective for long-term profitable growth and strong free cash flow generation. Excluding the purchase accounting costs associated with the acquisition, we expect Dresser-Rand to be accretive to 2018 diluted earnings per share. Overall, we are executing on our long-term strategy and continuing to drive solid operating margin expansion and free cash flow generation to deliver significant value for our shareholders.”
First Quarter 2018 Operating Results
| (In thousands) | 1Q-2018 | 1Q-2017 | Change | ||||||||
| Sales | $ | 547,522 | $ | 523,591 | 5% | ||||||
| Operating income | 64,498 | 47,692 | 35% | ||||||||
| Operating margin | 11.8% | 9.1% | 270 bps | ||||||||
Sales
Sales of $548 million in the first quarter increased $24 million, or 5%, compared with the prior year, reflecting a $15 million, or 3%, increase in organic sales, and a $9 million, or 2%, benefit from favorable foreign currency translation.
Higher organic revenues were principally driven by solid defense sales in all three segments. In addition, we also experienced improved industrial demand in the Commercial/Industrial segment and lower power generation revenues in the Power segment.
From an end market perspective, sales to the defense markets increased 12%, 11% of which was organic, while sales to the commercial markets were flat compared with the prior year, as increased sales to the general industrial market were mainly offset by reduced sales to the power generation market. Please refer to the accompanying tables for a breakdown of sales by end market.
Operating Income
Operating income in the first quarter was $64 million, an increase of $17 million, or 35%, compared with the prior year. These results primarily reflect higher defense and industrial sales, the benefits of our margin improvement initiatives, most notably in the Commercial/Industrial segment, and increased profitability in the Defense segment as we moved beyond the first year purchase accounting costs associated with the Teletronics Technology Corporation (TTC) acquisition, which negatively impacted prior year results.
Operating margin was 11.8%, an increase of 270 basis points over the prior year, primarily reflecting higher revenues and favorable overhead absorption, the benefits of our ongoing margin improvement initiatives, as well as the aforementioned increase in profitability in the Defense segment associated with the TTC acquisition.
Non-segment Expense
Non-segment expenses of $10 million were essentially flat compared with the prior year.
Net Earnings
First quarter net earnings increased 34% compared with the prior year, as higher operating income and lower interest expense more than offset a higher tax rate. The effective tax rate (ETR) for the first quarter was 28.4%, an increase from 20.9% in the prior year quarter, primarily driven by an additional provisional tax expense associated with the 2017 Tax Cuts and Jobs Act (TCJA) for foreign withholding taxes, partially offset by a discrete tax benefit related to share based compensation.
Free Cash Flow
| (In thousands) | 1Q-2018 | 1Q-2017 | ||||||||
| Net cash used for operating activities | $ | (71,262 | ) | $ | (24,941 | ) | ||||
| Capital expenditures | (8,971 | ) | (10,374 | ) | ||||||
| Free cash flow | $ | (80,233 | ) | $ | (35,315 | ) | ||||
| Pension payment | 50,000 | - | ||||||||
| Adjusted free cash flow | $ | (30,233 | ) | $ | (35,315 | ) | ||||
Free cash flow, defined as cash flow from operations less capital expenditures, was ($80 million) for the first quarter of 2018, a decrease of $45 million compared with the prior year. Adjusted free cash flow, defined as free cash flow excluding a $50 million voluntary contribution to the Company’s corporate defined benefit pension plan, increased approximately $5 million to ($30 million), primarily due to higher cash earnings. Capital expenditures decreased by $1 million to $9 million compared with the prior year period.
New Orders and Backlog
New orders of $605 million in the first quarter decreased 6% compared with the prior year, primarily due to the timing of naval defense orders received within the Commercial/Industrial and Power segments, compared with the prior year period. Backlog of $2.1 billion increased 2% from December 31, 2017.
Other Items – Share Repurchase
During the first quarter, the Company repurchased 93,438 shares of its common stock for approximately $12 million.
Full-Year 2018 Guidance
The Company is updating its full-year 2018 financial guidance to include the recently completed acquisition of the Dresser-Rand government business as well as increased sales and operating income in the Commercial/Industrial segment:
|
Prior Guidance |
Current Guidance |
||||||||
| Total sales | $2.335 - $2.375 billion | $2.415 - $2.455 billion | |||||||
| Operating income | $355 - $365 million | $343 - $353 million | |||||||
| Operating margin | 15.2% - 15.4% | 14.2% - 14.4% | |||||||
| Interest expense | $37 - $38 million | $36 - $37 million | |||||||
| Effective tax rate | 24.0% | 24.0% | |||||||
| Diluted earnings per share | $5.65 - $5.80 | $5.47 - $5.62 | |||||||
| Diluted shares outstanding | 44.7 million | 44.7 million | |||||||
| Free cash flow | $230 - $250 million | $240 - $260 million | |||||||
| Adjusted free cash flow | $280 - $300 million | $290 - $310 million | |||||||
Notes:
- Full-year 2018 guidance includes the impact from the adoption of Accounting Standards Update (ASU) 2017-07 that requires the reclassification of the non-service components of Pension expense from Operating Income to Other Income/Expense effective for fiscal years beginning after December 15, 2017. Because our non-service components are a benefit, this accounting change lowered full-year 2018 operating income by $14.0 million and operating margin by 60 basis points. This change is neutral to earnings per share.
- Adjusted free cash flow for full-year 2018 excludes a $50 million voluntary contribution to the Company’s corporate defined benefit pension plan that it elected to make in February 2018.
- A more detailed breakdown of the Company’s 2018 guidance by segment and by market can be found in the accompanying schedules.
First Quarter 2018 Segment Performance
Commercial/Industrial
| (In thousands) | 1Q-2018 | 1Q-2017 | Change | ||||||||
| Sales | $ | 296,641 | $ | 278,822 | 6% | ||||||
| Operating income | 39,225 | 30,552 | 28% | ||||||||
| Operating margin | 13.2% | 11.0% | 220 bps | ||||||||
Sales for the first quarter were $297 million, an increase of $18 million, or 6%, over the prior year. Organic sales increased $11 million, or 4%, while favorable foreign currency translation added $7 million, or 2%. Our results reflect strong sales growth in the aerospace and naval defense markets, led by higher sales of actuation systems on fighter jets and increased valve revenues on the CVN-80 Ford class aircraft carrier program. We also experienced higher sales in the general industrial market, due to solid demand for industrial vehicle products and increased sales of surface treatment services. Sales to the commercial aerospace market were flat, as higher sales of sensors, actuation systems and surface treatment services on narrowbody airplanes were offset by lower revenues resulting from FAA directives.
Operating income in the first quarter was $39 million, an increase of $9 million, or 28%, compared with the prior year, while operating margin increased 220 basis points to 13.2%. The increase in operating income and margin primarily reflects higher sales and favorable overhead absorption for industrial vehicle products, naval valve products, sensors and controls products, and surface treatment services, and includes the benefits of our ongoing margin improvement initiatives.
Defense
| (In thousands) | 1Q-2018 | 1Q-2017 | Change | ||||||||
| Sales | $ | 118,901 | $ | 114,662 | 4% | ||||||
| Operating income | 19,728 | 11,097 | 78% | ||||||||
| Operating margin | 16.6% | 9.7% | 690 bps | ||||||||
Sales for the first quarter were $119 million, an increase of $4 million, or 4%, from the prior year. These results reflect a $2 million, or 2%, increase in organic sales, and a $2 million, or 2%, benefit from favorable foreign currency translation. In the aerospace defense market, our results reflect higher sales of data acquisition and flight test equipment, most notably on the F-18 program. We also experienced higher domestic vehicle product sales, most notably on the G/ATOR program, in the ground defense market.
Operating income in the first quarter was $20 million, an increase of $9 million, or 78%, compared with the prior year, while operating margin increased 690 basis points to 16.6%. This performance reflects increased profitability as we moved beyond the first year purchase accounting costs associated with the TTC acquisition which impacted prior year results, as well as the benefits of our ongoing margin improvement initiatives. Meanwhile, unfavorable foreign currency translation reduced current quarter operating income by approximately $1 million, or 7%.
Power
| (In thousands) | 1Q-2018 | 1Q-2017 | Change | ||||||||
| Sales | $ | 131,980 | $ | 130,107 | 1% | ||||||
| Operating income | 15,342 | 15,545 | (1%) | ||||||||
| Operating margin | 11.6% | 11.9% | (30 bps) | ||||||||
Sales for the first quarter were $132 million, an increase of $2 million, or 1%, from the prior year. In the naval defense market, our results reflect higher aircraft carrier revenues, partially offset by lower revenues on the Columbia class submarine, as this program transitions from the development to the production phase. In the power generation market, our results reflect lower revenues on the domestic AP1000 program and lower domestic aftermarket sales supporting currently operating nuclear reactors, which were partially offset by higher revenues on the AP1000 China Direct program and increased international aftermarket sales.
Operating income in the first quarter was $15 million, essentially flat compared with the prior year, while operating margin decreased 30 basis points to 11.6%. This performance reflects reduced sales and profitability in the nuclear aftermarket business and lower revenues on the domestic AP1000 program, partially offset by higher production and profitability on the AP1000 China Direct program.
Conference Call & Webcast Information
The Company will host a conference call to discuss first quarter 2018 financial results at 9:00 a.m. EDT on Thursday, May 3, 2018. A live webcast of the call and the accompanying financial presentation, as well as a replay of the call, will be made available on the internet by visiting the Investor Relations section of the Company’s website at www.curtisswright.com.
(Tables to Follow)
| CURTISS-WRIGHT CORPORATION and SUBSIDIARIES | |||||||||||||||||||
| CONDENSED CONSOLIDATED STATEMENTS OF EARNINGS (UNAUDITED) | |||||||||||||||||||
| ($'s in thousands, except per share data) | |||||||||||||||||||
| Three Months Ended | |||||||||||||||||||
| March 31, | Change | ||||||||||||||||||
| 2018 | 2017 | $ | % | ||||||||||||||||
| Product sales | $ | 444,687 | $ | 423,229 | $ | 21,458 | 5 | % | |||||||||||
| Service sales | 102,835 | 100,362 | 2,473 | 2 | % | ||||||||||||||
| Total net sales | 547,522 | 523,591 | 23,931 | 5 | % | ||||||||||||||
| Cost of product sales | 299,311 | 289,610 | 9,701 | 3 | % | ||||||||||||||
| Cost of service sales | 67,020 | 67,046 | (26 | ) | 0 | % | |||||||||||||
| Total cost of sales | 366,331 | 356,656 | 9,675 | 3 | % | ||||||||||||||
| Gross profit | 181,191 | 166,935 | 14,256 | 9 | % | ||||||||||||||
| Research and development expenses | 15,941 | 15,591 | 350 | 2 | % | ||||||||||||||
| Selling expenses | 31,520 | 29,458 | 2,062 | 7 | % | ||||||||||||||
| General and administrative expenses | 69,232 | 74,194 | (4,962 | ) | (7 | %) | |||||||||||||
| Operating income | 64,498 | 47,692 | 16,806 | 35 | % | ||||||||||||||
| Interest expense | 8,204 | 10,377 | (2,173 | ) | (21 | %) | |||||||||||||
| Other income, net | 4,683 | 3,847 | 836 | 22 | % | ||||||||||||||
| Earnings before income taxes | 60,977 | 41,162 | 19,815 | 48 | % | ||||||||||||||
| Provision for income taxes | (17,334 | ) | (8,615 | ) | (8,719 | ) | (101 | %) | |||||||||||
| Net earnings | $ | 43,643 | $ | 32,547 | $ | 11,096 | 34 | % | |||||||||||
| Net earnings per share | |||||||||||||||||||
| Basic earnings per share | $ | 0.99 | $ | 0.74 | |||||||||||||||
| Diluted earnings per share | $ | 0.98 | $ | 0.73 | |||||||||||||||
| Dividends per share | $ | 0.15 | $ | 0.13 | |||||||||||||||
| Weighted average shares outstanding: | |||||||||||||||||||
| Basic | 44,188 | 44,246 | |||||||||||||||||
| Diluted | 44,678 | 44,860 | |||||||||||||||||
| CURTISS-WRIGHT CORPORATION and SUBSIDIARIES | ||||||||||||||
| CONDENSED CONSOLIDATED BALANCE SHEETS (UNAUDITED) | ||||||||||||||
| ($'s in thousands, except par value) | ||||||||||||||
| March 31, | December 31, | Change | ||||||||||||
| 2018 | 2017 | % | ||||||||||||
| Assets | ||||||||||||||
| Current assets: | ||||||||||||||
| Cash and cash equivalents | $ | 396,518 | $ | 475,120 | (17 | %) | ||||||||
| Receivables, net | 518,784 | 494,923 | 5 | % | ||||||||||
| Inventories, net | 386,787 | 378,866 | 2 | % | ||||||||||
| Other current assets | 50,688 | 52,951 | (4 | %) | ||||||||||
| Total current assets | 1,352,777 | 1,401,860 | (4 | %) | ||||||||||
| Property, plant, and equipment, net | 385,287 | 390,235 | (1 | %) | ||||||||||
| Goodwill | 1,099,450 | 1,096,329 | 0 | % | ||||||||||
| Other intangible assets, net | 322,856 | 329,668 | (2 | %) | ||||||||||
| Other assets | 18,689 | 18,229 | 3 | % | ||||||||||
| Total assets | $ | 3,179,059 | $ | 3,236,321 | (2 | %) | ||||||||
| Liabilities | ||||||||||||||
| Current liabilities: | ||||||||||||||
| Current portion of long-term and short term debt | $ | 982 | $ | 150 | 555 | % | ||||||||
| Accounts payable | 165,413 | 185,176 | (11 | %) | ||||||||||
| Accrued expenses | 102,602 | 150,406 | (32 | %) | ||||||||||
| Income taxes payable | 8,810 | 4,564 | 93 | % | ||||||||||
| Deferred revenue | 217,959 | 214,891 | 1 | % | ||||||||||
| Other current liabilities | 45,519 | 35,810 | 27 | % | ||||||||||
| Total current liabilities | 541,285 | 590,997 | (8 | %) | ||||||||||
| Long-term debt, net | 813,576 | 813,989 | 0 | % | ||||||||||
| Deferred tax liabilities, net | 58,486 | 49,360 | 18 | % | ||||||||||
| Accrued pension and other postretirement benefit costs | 67,984 | 121,043 | (44 | %) | ||||||||||
| Long-term portion of environmental reserves | 14,681 | 14,546 | 1 | % | ||||||||||
| Other liabilities | 104,072 | 118,586 | (12 | %) | ||||||||||
| Total liabilities | 1,600,084 | 1,708,521 | (6 | %) | ||||||||||
| Stockholders' equity | ||||||||||||||
| Common stock, $1 par value | $ | 49,187 | $ | 49,187 | 0 | % | ||||||||
| Additional paid in capital | 116,221 | 120,609 | (4 | %) | ||||||||||
| Retained earnings | 1,979,051 | 1,944,324 | 2 | % | ||||||||||
| Accumulated other comprehensive loss | (198,807 | ) | (216,840 | ) | 8 | % | ||||||||
| Less: cost of treasury stock | (366,677 | ) | (369,480 | ) | 1 | % | ||||||||
| Total stockholders' equity | 1,578,975 | 1,527,800 | 3 | % | ||||||||||
| Total liabilities and stockholders' equity | $ | 3,179,059 | $ | 3,236,321 | (2 | %) | ||||||||
| CURTISS-WRIGHT CORPORATION and SUBSIDIARIES | ||||||||||||||
| SEGMENT INFORMATION (UNAUDITED) | ||||||||||||||
| ($'s in thousands) | ||||||||||||||
| Three Months Ended | ||||||||||||||
| March 31, | ||||||||||||||
| Change | ||||||||||||||
| 2018 | 2017 | % | ||||||||||||
|
Sales: |
||||||||||||||
| Commercial/Industrial | $ | 296,641 | $ | 278,822 | 6 | % | ||||||||
| Defense | 118,901 | 114,662 | 4 | % | ||||||||||
| Power | 131,980 | 130,107 | 1 | % | ||||||||||
| Total sales | $ | 547,522 | $ | 523,591 | 5 | % | ||||||||
|
Operating income (expense): |
||||||||||||||
| Commercial/Industrial | $ | 39,225 | $ | 30,552 | 28 | % | ||||||||
| Defense | 19,728 | 11,097 | 78 | % | ||||||||||
| Power | 15,342 | 15,545 | (1 | %) | ||||||||||
| Total segments | $ | 74,295 | $ | 57,194 | 30 | % | ||||||||
| Corporate and other | (9,797 | ) | (9,502 | ) | (3 | %) | ||||||||
| Total operating income | $ | 64,498 | $ | 47,692 | 35 | % | ||||||||
|
Operating margins: |
||||||||||||||
| Commercial/Industrial | 13.2 | % | 11.0 | % | ||||||||||
| Defense | 16.6 | % | 9.7 | % | ||||||||||
| Power | 11.6 | % | 11.9 | % | ||||||||||
| Total Curtiss-Wright | 11.8 | % | 9.1 | % | ||||||||||
| Segment margins | 13.6 | % | 10.9 | % | ||||||||||
| CURTISS-WRIGHT CORPORATION and SUBSIDIARIES | ||||||||||||||
| SALES BY END MARKET (UNAUDITED) | ||||||||||||||
| ($'s in thousands) | ||||||||||||||
| Three Months Ended | ||||||||||||||
| March 31, | ||||||||||||||
| Change | ||||||||||||||
| 2018 | 2017 | % | ||||||||||||
| Defense markets: | ||||||||||||||
| Aerospace | $ | 75,941 | $ | 65,293 | 16 | % | ||||||||
| Ground | 22,011 | 19,737 | 12 | % | ||||||||||
| Naval | 102,782 | 90,970 | 13 | % | ||||||||||
| Other | 4,581 | 7,041 | (35 | %) | ||||||||||
| Total Defense | $ | 205,315 | $ | 183,041 | 12 | % | ||||||||
| Commercial markets: | ||||||||||||||
| Aerospace | $ | 99,404 | $ | 98,614 | 1 | % | ||||||||
| Power Generation | 99,012 | 105,551 | (6 | %) | ||||||||||
| General Industrial | 143,791 | 136,385 | 5 | % | ||||||||||
| Total Commercial | $ | 342,207 | $ | 340,550 | 0 | % | ||||||||
| Total Curtiss-Wright | $ | 547,522 | $ | 523,591 | 5 | % | ||||||||
Use of Non-GAAP Financial Information (Unaudited)
The Corporation supplements its financial information determined under U.S. generally accepted accounting principles (GAAP) with certain non-GAAP financial information. Curtiss-Wright believes that these non-GAAP measures provide investors with additional insight into the Company’s ongoing business performance. These non-GAAP measures should not be considered in isolation or as a substitute for the related GAAP measures, and other companies may define such measures differently. Curtiss-Wright encourages investors to review its financial statements and publicly-filed reports in their entirety and not to rely on any single financial measure. The following definitions are provided:
Organic Revenue and Organic Operating Income
The Corporation discloses organic revenue and organic operating income because the Corporation believes it provides investors with insight as to the Company’s ongoing business performance. Organic revenue and organic operating income are defined as revenue and operating income excluding the impact of foreign currency fluctuations and contributions from acquisitions made during the last twelve months.
| Three Months Ended | |||||||||||||||||
| March 31, | |||||||||||||||||
| 2018 vs. 2017 | |||||||||||||||||
| Commercial/Industrial | Defense | Power | Total Curtiss-Wright | ||||||||||||||
| Sales |
Operating |
Sales |
Operating |
Sales |
Operating |
Sales |
Operating |
||||||||||
| Organic | 4% | 28% | 2% | 85% | 1% | (1%) | 3% | 37% | |||||||||
| Acquisitions | 0% | 0% | 0% | 0% | 0% | 0% | 0% | 0% | |||||||||
| Foreign Currency | 2% | 0% | 2% | (7%) | 0% | 0% | 2% | (2%) | |||||||||
| Total | 6% | 28% | 4% | 78% | 1% | (1%) | 5% | 35% | |||||||||
Free Cash Flow and Free Cash Flow Conversion
The Corporation discloses free cash flow because it measures cash flow available for investing and financing activities. Free cash flow represents cash available to repay outstanding debt, invest in the business, acquire businesses, return capital to shareholders and make other strategic investments. Free cash flow is defined as cash flow provided by operating activities less capital expenditures. Adjusted free cash flow excludes contributions made to the Company’s corporate defined benefit pension plan. The Corporation discloses free cash flow conversion because it measures the proportion of net earnings converted into free cash flow and is defined as free cash flow divided by net earnings from continuing operations.
| CURTISS-WRIGHT CORPORATION and SUBSIDIARIES | ||||||||||
| NON-GAAP FINANCIAL DATA (UNAUDITED) | ||||||||||
| ($'s in thousands) | ||||||||||
| Three Months Ended | ||||||||||
| March 31, | ||||||||||
| 2018 | 2017 | |||||||||
| Net cash used for operating activities | $ | (71,262 | ) | $ | (24,941 | ) | ||||
| Capital expenditures | (8,971 | ) | (10,374 | ) | ||||||
| Free cash flow | $ | (80,233 | ) | $ | (35,315 | ) | ||||
| Pension payment | 50,000 | — | ||||||||
| Adjusted free cash flow | $ | (30,233 | ) | $ | (35,315 | ) | ||||
| Free Cash Flow Conversion | (69 | %) | (109 | %) | ||||||
| CURTISS-WRIGHT CORPORATION | ||||||||||||||||||||||||||||||||||||||
| 2018 Guidance (1) (2) (3) | ||||||||||||||||||||||||||||||||||||||
| As of May 2, 2018 | ||||||||||||||||||||||||||||||||||||||
| ($'s in millions, except per share data) | ||||||||||||||||||||||||||||||||||||||
| 2018 Guidance (Prior) | 2018 Guidance (Current) | |||||||||||||||||||||||||||||||||||||
|
|
|
2018 Guidance |
|
|||||||||||||||||||||||||||||||||||
|
2017 |
Low | High |
2018 % Change |
Low | High |
2018 % Change |
||||||||||||||||||||||||||||||||
|
Sales: |
||||||||||||||||||||||||||||||||||||||
| Commercial/Industrial | $ | 1,163 | $ | 1,183 | $ | 1,203 | $ | 1,193 | $ | 1,213 | ||||||||||||||||||||||||||||
| Defense | 555 | 565 | 575 | 565 | 575 | |||||||||||||||||||||||||||||||||
| Power | 553 | 587 | 597 | 657 | 667 | |||||||||||||||||||||||||||||||||
| Total sales | $ | 2,271 | $ | 2,335 | $ | 2,375 | 3 to 5% | $ | 2,415 | $ | 2,455 | 6 to 8% | ||||||||||||||||||||||||||
|
Operating income: |
||||||||||||||||||||||||||||||||||||||
| Commercial/Industrial | $ | 168 | $ | 174 | $ | 179 | $ | 177 | $ | 182 | ||||||||||||||||||||||||||||
| Defense | 109 | 121 | 124 | 121 | 124 | |||||||||||||||||||||||||||||||||
| Power | 81 | 94 | 97 | 80 | 83 | |||||||||||||||||||||||||||||||||
| Total segments | 359 | 389 | 400 | 378 | 389 | |||||||||||||||||||||||||||||||||
| Corporate and other | (34 | ) | (34 | ) | (35 | ) | (34 | ) | (35 | ) | ||||||||||||||||||||||||||||
| Total operating income | $ | 325 | $ | 355 | $ | 365 | 9 to 12% | $ | 343 | $ | 353 | 6 to 9% | ||||||||||||||||||||||||||
| Interest expense | $ | (41 | ) | $ | (37 | ) | $ | (38 | ) | $ | (36 | ) | $ | (37 | ) | |||||||||||||||||||||||
| Other income, net | 16 | 14 | 14 | 14 | 14 | |||||||||||||||||||||||||||||||||
| Earnings before income taxes | 300 | 332 | 341 | 322 | 331 | |||||||||||||||||||||||||||||||||
| Provision for income taxes | (85 | ) | (80 | ) | (82 | ) | (77 | ) | (79 | ) | ||||||||||||||||||||||||||||
| Net earnings | $ | 215 | $ | 253 | $ | 259 | $ | 245 | $ | 251 | ||||||||||||||||||||||||||||
| Reported diluted earnings per share | $ | 4.80 | $ | 5.65 | $ | 5.80 | 18 to 21% | $ | 5.47 | $ | 5.62 | 14 to 17% | ||||||||||||||||||||||||||
| Diluted shares outstanding | 44.8 | 44.7 | 44.7 | 44.7 | 44.7 | |||||||||||||||||||||||||||||||||
| Effective tax rate | 28.3 | % | 24.0 | % | 24.0 | % | 24.0 | % | 24.0 | % | ||||||||||||||||||||||||||||
|
Operating margins: |
||||||||||||||||||||||||||||||||||||||
| Commercial/Industrial | 14.5 | % | 14.7 | % | 14.9 | % | 20 to 40 bps | 14.8 | % | 15.0 | % | 30 to 50 bps | ||||||||||||||||||||||||||
| Defense | 19.7 | % | 21.3 | % | 21.5 | % | 160 to 180 bps | 21.3 | % | 21.5 | % | 160 to 180 bps | ||||||||||||||||||||||||||
| Power | 14.7 | % | 16.0 | % | 16.2 | % | 130 to 150 bps | 12.2 | % | 12.4 | % | (230 to 250 bps) | ||||||||||||||||||||||||||
| Total operating margin | 14.3 | % | 15.2 | % | 15.4 | % | 90 to 110 bps | 14.2 | % | 14.4 | % | (10) to 10 bps | ||||||||||||||||||||||||||
| Note: Full year amounts may not add due to rounding | ||||||||||||||||||||||||||||||||||||||
| (1) Full-year 2017 and 2018 effective tax rate guidance includes the impacts of the Tax Cuts and Jobs Act. | ||||||||||||||||||||||||||||||||||||||
| (2) Full-year 2017 adjusted results and expectations for 2018 guidance include the impacts from the adoption of ASU 2017-07 Improving the Presentation of Net Periodic Pension Cost and Net Periodic Postretirement Benefit Cost resulting in the reclassification of the non-service components of Pension expense from Operating Income to Other Income/Expense. This accounting change lowered operating income by $14.6 million and $14.0 million, respectfully, and lowered operating margin by 70 and 60 basis points, respectively, in full-year 2017 and projected full-year 2018 periods. This change is neutral to earnings per share in both periods. | ||||||||||||||||||||||||||||||||||||||
| (3) Full-year 2018 guidance updated to include the acquisition of the Dresser-Rand government business (Dresser-Rand) within the Power segment, which adds $70 million in sales, but reduces operating income and operating margin, due to first year purchase accounting costs associated with the acquisition. Guidance update also reflects an improved outlook in the Commercial/Industrial segment. | ||||||||||||||||||||||||||||||||||||||
| CURTISS-WRIGHT CORPORATION | ||||||
| 2018 Sales Growth Guidance by End Market (1) | ||||||
| As of May 2, 2018 | ||||||
| 2018 % Change vs 2017 | 2018 % Change vs 2017 | |||||
| (Prior) | (Current) | |||||
|
Defense Markets |
||||||
| Aerospace | 8 - 10% | 8 - 10% | ||||
| Ground | 0 - 2% | 0 - 2% | ||||
| Navy | 0 - 2% | 16 - 18% | ||||
| Total Defense | 3 - 5% | 9 - 11% | ||||
| (Including Other Defense) | ||||||
|
Commercial Markets |
||||||
| Commercial Aerospace | 0 - 2% | 0 - 2% | ||||
| Power Generation | 6 - 8% | 6 - 8% | ||||
| General Industrial | 3 - 5% | 4 - 6% | ||||
| Total Commercial | 3 - 5% | 3 - 5% | ||||
| Total Curtiss-Wright Sales | 3 - 5% | 6 - 8% | ||||
| Note: Full year amounts may not add due to rounding | ||||||
| (1) Full-year 2018 guidance updated to include the acquisition of the Dresser-Rand government business, which primarily adds sales to the naval defense market, as well as an improved outlook in the Commercial/Industrial segment, which primarily adds sales to the general industrial market. | ||||||
About Curtiss-Wright Corporation
Curtiss-Wright Corporation (NYSE: CW) is a global innovative company that delivers highly engineered, critical function products and services to the commercial, industrial, defense and energy markets. Building on the heritage of Glenn Curtiss and the Wright brothers, Curtiss-Wright has a long tradition of providing reliable solutions through trusted customer relationships. The company employs approximately 8,600 people worldwide. For more information, visit www.curtisswright.com.
Certain statements made in this press release, including statements about future revenue, financial performance guidance, quarterly and annual revenue, net income, operating income growth, future business opportunities, cost saving initiatives, the successful integration of the Company’s acquisitions, and future cash flow from operations, are forward-looking statements within the meaning of the Private Securities Litigation Reform Act of 1995. These statements present management's expectations, beliefs, plans and objectives regarding future financial performance, and assumptions or judgments concerning such performance. Any discussions contained in this press release, except to the extent that they contain historical facts, are forward-looking and accordingly involve estimates, assumptions, judgments and uncertainties. Such forward-looking statements are subject to certain risks and uncertainties that could cause actual results to differ materially from those expressed or implied. Readers are cautioned not to place undue reliance on these forward-looking statements, which speak only as of the date hereof. Such risks and uncertainties include, but are not limited to: a reduction in anticipated orders; an economic downturn; changes in the competitive marketplace and/or customer requirements; a change in government spending; an inability to perform customer contracts at anticipated cost levels; and other factors that generally affect the business of aerospace, defense contracting, electronics, marine, and industrial companies. Such factors are detailed in the Company's Annual Report on Form 10-K for the fiscal year ended December 31, 2017, and subsequent reports filed with the Securities and Exchange Commission.
This press release and additional information are available at www.curtisswright.com.
CONTACT:
Curtiss-Wright Corporation
Jim Ryan, 704-869-4621
[email protected]
Exhibit 99.2

1Q 2018 Earnings Conference CallMay 3, 2018 NYSE: CW
Safe Harbor Statement Please note that the information provided in this presentation is accurate as of the date of the original presentation. The presentation will remain posted on this website from one to twelve months following the initial presentation, but content will not be updated to reflect new information that may become available after the original presentation posting. The presentation contains forward-looking statements including, among other things, management's estimates of future performance, revenue and earnings, our management's growth objectives, our management’s ability to integrate our acquisition, and our management's ability to produce consistent operating improvements. These forward-looking statements are based on expectations as of the time the statements were made only, and are subject to a number of risks and uncertainties which could cause us to fail to achieve our then-current financial projections and other expectations. This presentation also includes certain non-GAAP financial measures with reconciliations being made available in the earnings release that is posted to our website and furnished with the SEC. We undertake no duty to update this information. More information about potential factors that could affect our business and financial results is included in our filings with the Securities and Exchange Commission, including our Annual Reports on Form 10-K and Quarterly Reports on Form 10-Q, including, among other sections, under the captions, "Risk Factors" and "Management's Discussion and Analysis of Financial Condition and Results of Operations," which is on file with the SEC and available at the SEC's website at www.sec.gov.
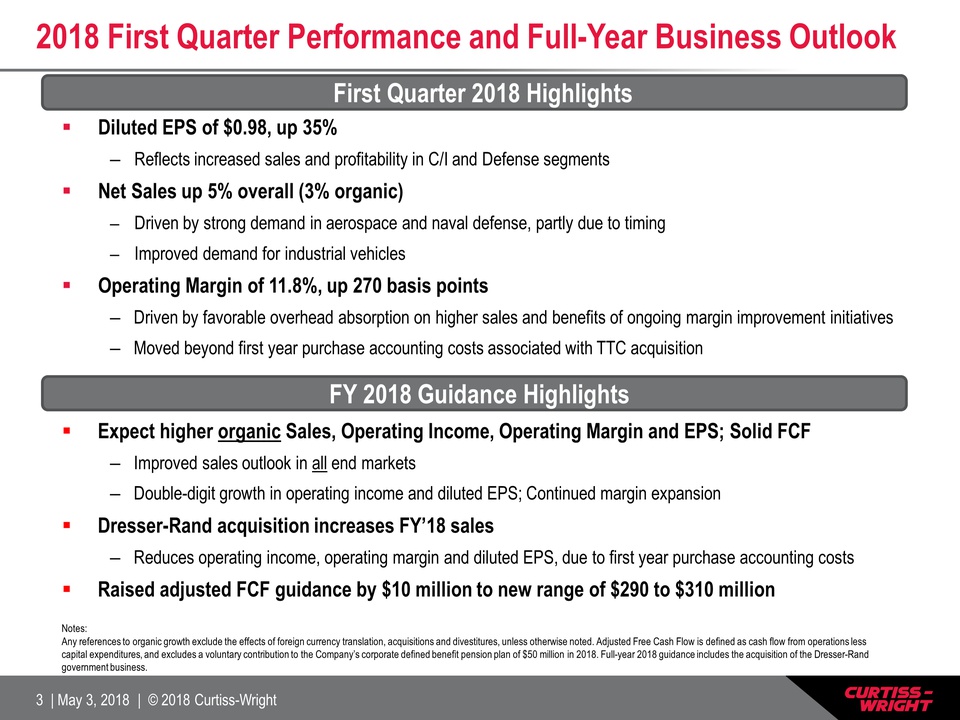
2018 First Quarter Performance and Full-Year Business Outlook Diluted EPS of $0.98, up 35%Reflects increased sales and profitability in C/I and Defense segmentsNet Sales up 5% overall (3% organic) Driven by strong demand in aerospace and naval defense, partly due to timingImproved demand for industrial vehiclesOperating Margin of 11.8%, up 270 basis pointsDriven by favorable overhead absorption on higher sales and benefits of ongoing margin improvement initiatives Moved beyond first year purchase accounting costs associated with TTC acquisition First Quarter 2018 Highlights FY 2018 Guidance Highlights Expect higher organic Sales, Operating Income, Operating Margin and EPS; Solid FCF Improved sales outlook in all end marketsDouble-digit growth in operating income and diluted EPS; Continued margin expansionDresser-Rand acquisition increases FY’18 salesReduces operating income, operating margin and diluted EPS, due to first year purchase accounting costsRaised adjusted FCF guidance by $10 million to new range of $290 to $310 million Notes: Any references to organic growth exclude the effects of foreign currency translation, acquisitions and divestitures, unless otherwise noted. Adjusted Free Cash Flow is defined as cash flow from operations less capital expenditures, and excludes a voluntary contribution to the Company’s corporate defined benefit pension plan of $50 million in 2018. Full-year 2018 guidance includes the acquisition of the Dresser-Rand government business.
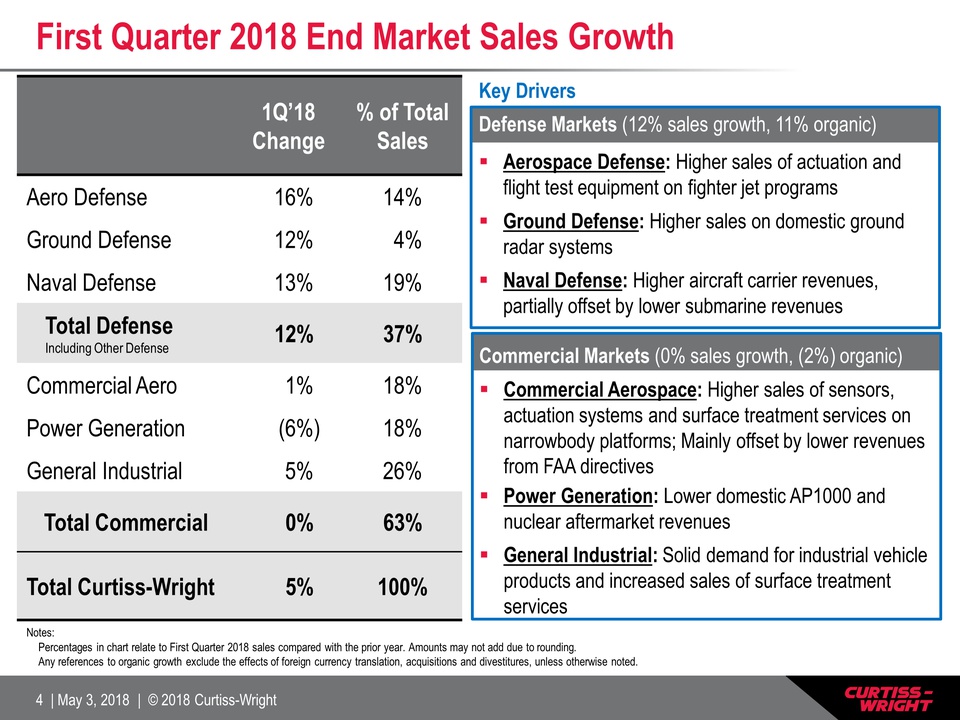
Key DriversDefense Markets (12% sales growth, 11% organic)Aerospace Defense: Higher sales of actuation and flight test equipment on fighter jet programsGround Defense: Higher sales on domestic ground radar systems Naval Defense: Higher aircraft carrier revenues, partially offset by lower submarine revenues First Quarter 2018 End Market Sales Growth Notes: Percentages in chart relate to First Quarter 2018 sales compared with the prior year. Amounts may not add due to rounding.Any references to organic growth exclude the effects of foreign currency translation, acquisitions and divestitures, unless otherwise noted. 1Q’18Change % of Total Sales Aero Defense 16% 14% Ground Defense 12% 4% Naval Defense 13% 19% Total DefenseIncluding Other Defense 12% 37% Commercial Aero 1% 18% Power Generation (6%) 18% General Industrial 5% 26% Total Commercial 0% 63% Total Curtiss-Wright 5% 100% Commercial Markets (0% sales growth, (2%) organic)Commercial Aerospace: Higher sales of sensors, actuation systems and surface treatment services on narrowbody platforms; Mainly offset by lower revenues from FAA directivesPower Generation: Lower domestic AP1000 and nuclear aftermarket revenuesGeneral Industrial: Solid demand for industrial vehicle products and increased sales of surface treatment services
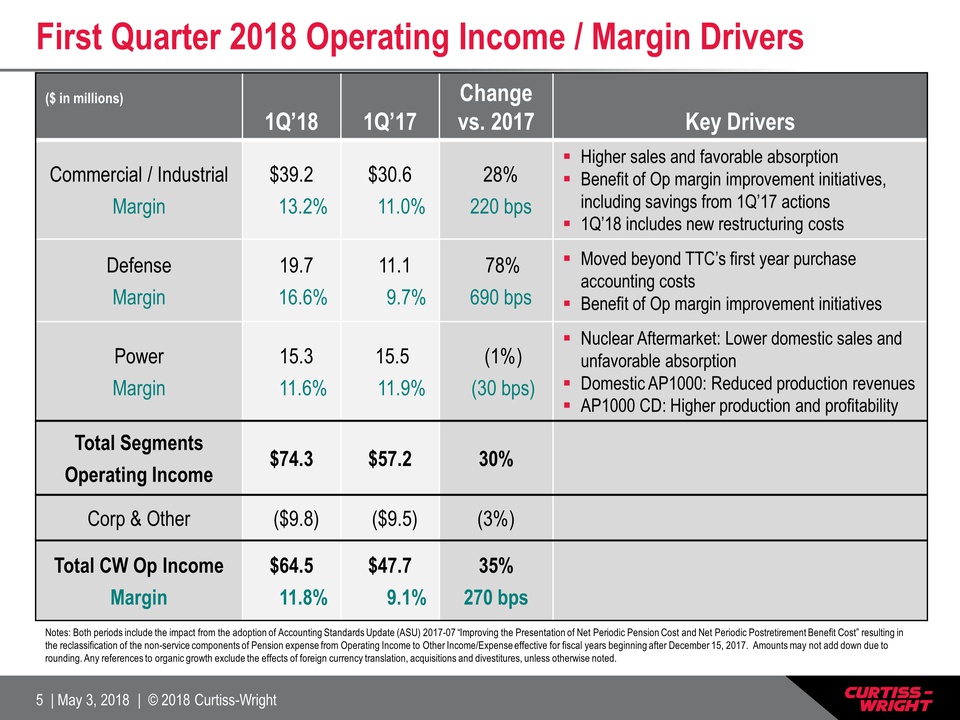
First Quarter 2018 Operating Income / Margin Drivers ($ in millions) 1Q’18 1Q’17 Change vs. 2017 Key Drivers Commercial / IndustrialMargin $39.2 13.2% $30.6 11.0% 28% 220 bps Higher sales and favorable absorptionBenefit of Op margin improvement initiatives, including savings from 1Q’17 actions1Q’18 includes new restructuring costs DefenseMargin 19.7 16.6% 11.1 9.7% 78% 690 bps Moved beyond TTC’s first year purchase accounting costsBenefit of Op margin improvement initiatives PowerMargin 15.3 11.6% 15.5 11.9% (1%) (30 bps) Nuclear Aftermarket: Lower domestic sales and unfavorable absorptionDomestic AP1000: Reduced production revenuesAP1000 CD: Higher production and profitability Total SegmentsOperating Income $74.3 $57.2 30% Corp & Other ($9.8) ($9.5) (3%) Total CW Op IncomeMargin $64.5 11.8% $47.7 9.1% 35%270 bps Notes: Both periods include the impact from the adoption of Accounting Standards Update (ASU) 2017-07 “Improving the Presentation of Net Periodic Pension Cost and Net Periodic Postretirement Benefit Cost” resulting in the reclassification of the non-service components of Pension expense from Operating Income to Other Income/Expense effective for fiscal years beginning after December 15, 2017. Amounts may not add down due to rounding. Any references to organic growth exclude the effects of foreign currency translation, acquisitions and divestitures, unless otherwise noted.
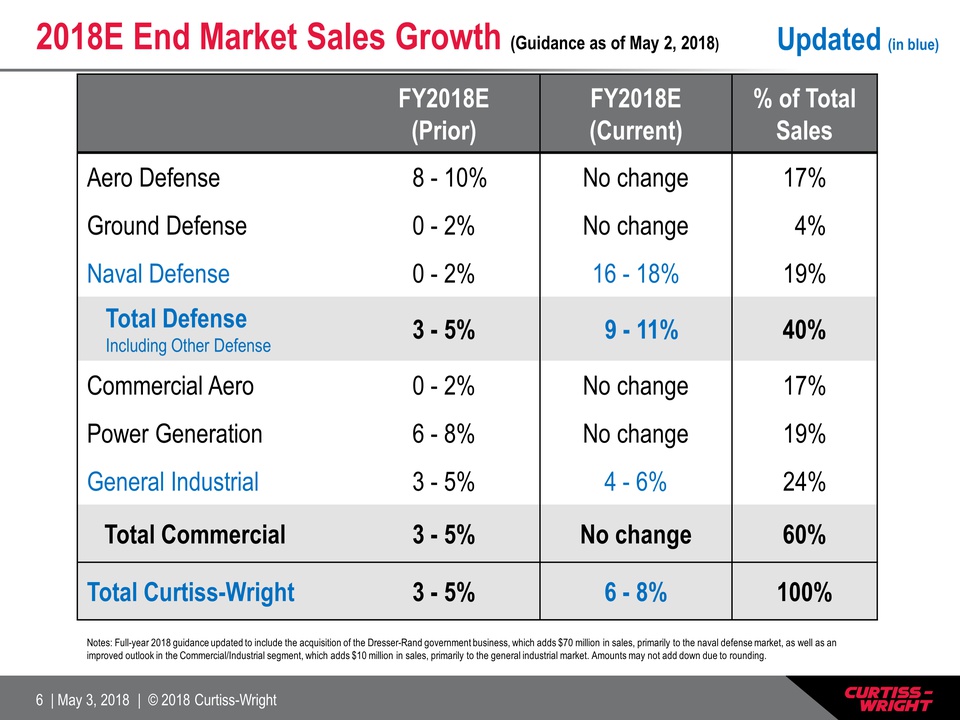
2018E End Market Sales Growth (Guidance as of May 2, 2018) FY2018E(Prior) FY2018E(Current) % of Total Sales Aero Defense 8 - 10% No change 17% Ground Defense 0 - 2% No change 4% Naval Defense 0 - 2% 16 - 18% 19% Total DefenseIncluding Other Defense 3 - 5% 9 - 11% 40% Commercial Aero 0 - 2% No change 17% Power Generation 6 - 8% No change 19% General Industrial 3 - 5% 4 - 6% 24% Total Commercial 3 - 5% No change 60% Total Curtiss-Wright 3 - 5% 6 - 8% 100% Notes: Full-year 2018 guidance updated to include the acquisition of the Dresser-Rand government business, which adds $70 million in sales, primarily to the naval defense market, as well as an improved outlook in the Commercial/Industrial segment, which adds $10 million in sales, primarily to the general industrial market. Amounts may not add down due to rounding. Updated (in blue)
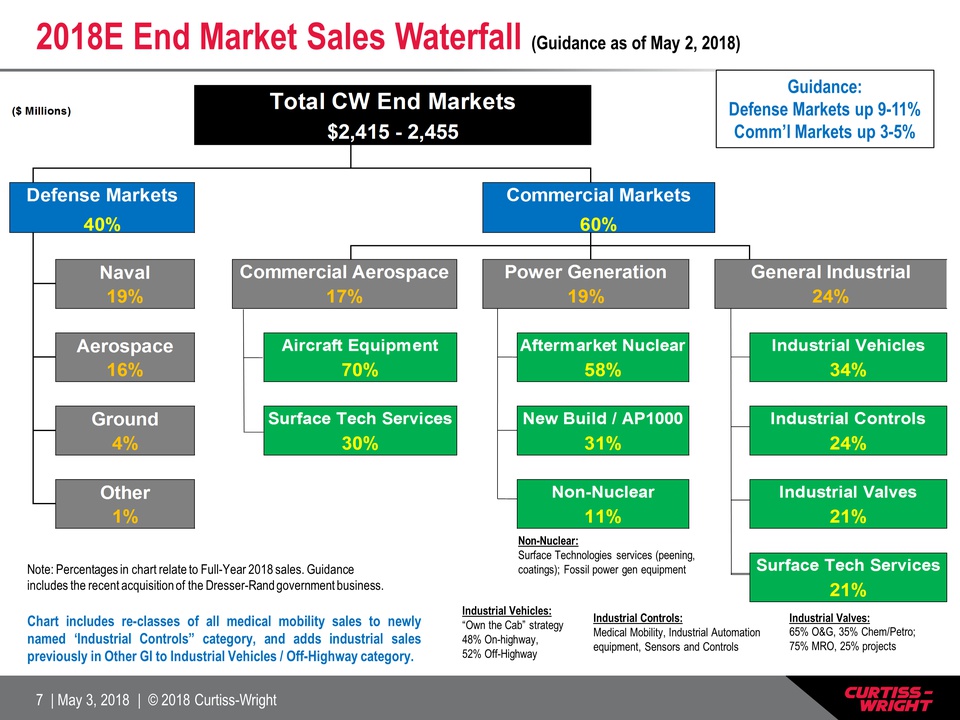
2018E End Market Sales Waterfall (Guidance as of May 2, 2018) Guidance:Defense Markets up 9-11%Comm’l Markets up 3-5% Industrial Controls:Medical Mobility, Industrial Automation equipment, Sensors and Controls Industrial Vehicles:“Own the Cab” strategy48% On-highway,52% Off-Highway Industrial Valves:65% O&G, 35% Chem/Petro; 75% MRO, 25% projects Non-Nuclear:Surface Technologies services (peening, coatings); Fossil power gen equipment Note: Percentages in chart relate to Full-Year 2018 sales. Guidance includes the recent acquisition of the Dresser-Rand government business. Chart includes re-classes of all medical mobility sales to newly named ‘Industrial Controls” category, and adds industrial sales previously in Other GI to Industrial Vehicles / Off-Highway category.

($ in millions, except EPS) FY2018E(Prior) $ Change FY2018E(Current) FY2018E Change vs 2017 Commercial / Industrial $1,183 - 1,203 $10 $1,193 - 1,213 3 - 4% Defense $565 - 575 $565 - 575 2 - 4% Power $587 - 597 $70 $657 - 667 19 - 21% Total Sales $2,335 - 2,375 $80 $2,415 - 2,455 6 - 8% Commercial / IndustrialMargin $174 - 179 14.7% - 14.9% ~$3 $177 - 182 14.8% - 15.0% 5 - 8% +30 - 50 bps DefenseMargin $121 - 124 21.3% - 21.5% $121 - 124 21.3% - 21.5% 10 - 13% +160 - 180 bps PowerMargin $94 - 97 16.0% - 16.2% ($14) $80 - 83 12.2% - 12.4% (1) - 2% (230 - 250 bps) Corporate and Other ($34 - 35) ($34 - 35) - Total Oper. IncomeCW Margin $355 - 365 15.2% - 15.4% ($12) $343 - 353 14.2% - 14.4% 6 - 9% (10) - 10 bps 2018E Financial Outlook (Guidance as of May 2, 2018) Note: Amounts may not add down due to rounding. Full-year 2018 guidance updated to include the acquisition of the Dresser-Rand government business (Dresser-Rand) within the Power segment, which adds $70 million in sales, but reduces operating income and operating margin, due to first year purchase accounting costs associated with the acquisition. Guidance update also reflects an improved outlook in the Commercial/Industrial segment. Updated (in blue)

($ in millions, except EPS) FY2018E(Prior) FY2018E(Current) FY2018E Change vs 2017 Total Operating Income $355 - 365 $343 - 353 6 - 9% Other Income/(Expense) $14 $14 Interest Expense $37 - 38 $36 - 37 Provision for Income Taxes(2) $80 - 82 $77 - 79 Effective Tax Rate(2) 24.0% 24.0% Diluted EPS(2) $5.65 - 5.80 $5.47 - 5.62 14 - 17% Diluted Shares Outstanding 44.7 44.7 2018E Financial Outlook1 (Guidance as of May 2, 2018) Note: Amounts may not add down due to rounding. Full-year 2018 guidance updated to include the acquisition of the Dresser-Rand government business (Dresser-Rand) within the Power segment, which adds $70 million in sales, but reduces operating income and operating margin, due to first year purchase accounting costs associated with the acquisition. Guidance update also reflects an improved outlook in the Commercial/Industrial segment.Full-year 2018 effective tax rate guidance includes the impacts of the Tax Cuts and Jobs Act. Updated (in blue)
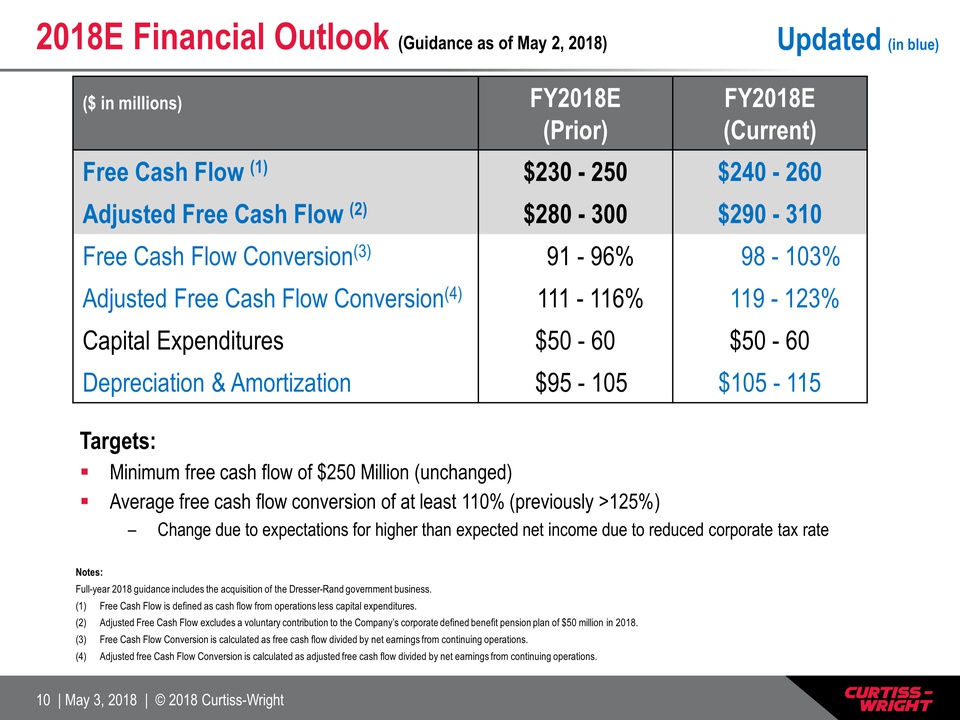
Notes:Full-year 2018 guidance includes the acquisition of the Dresser-Rand government business.Free Cash Flow is defined as cash flow from operations less capital expenditures. Adjusted Free Cash Flow excludes a voluntary contribution to the Company’s corporate defined benefit pension plan of $50 million in 2018.Free Cash Flow Conversion is calculated as free cash flow divided by net earnings from continuing operations.Adjusted free Cash Flow Conversion is calculated as adjusted free cash flow divided by net earnings from continuing operations. 2018E Financial Outlook (Guidance as of May 2, 2018) ($ in millions) FY2018E(Prior) FY2018E(Current) Free Cash Flow (1) $230 - 250 $240 - 260 Adjusted Free Cash Flow (2) $280 - 300 $290 - 310 Free Cash Flow Conversion(3) 91 - 96% 98 - 103% Adjusted Free Cash Flow Conversion(4) 111 - 116% 119 - 123% Capital Expenditures $50 - 60 $50 - 60 Depreciation & Amortization $95 - 105 $105 - 115 Targets:Minimum free cash flow of $250 Million (unchanged)Average free cash flow conversion of at least 110% (previously >125%)Change due to expectations for higher than expected net income due to reduced corporate tax rate Updated (in blue)
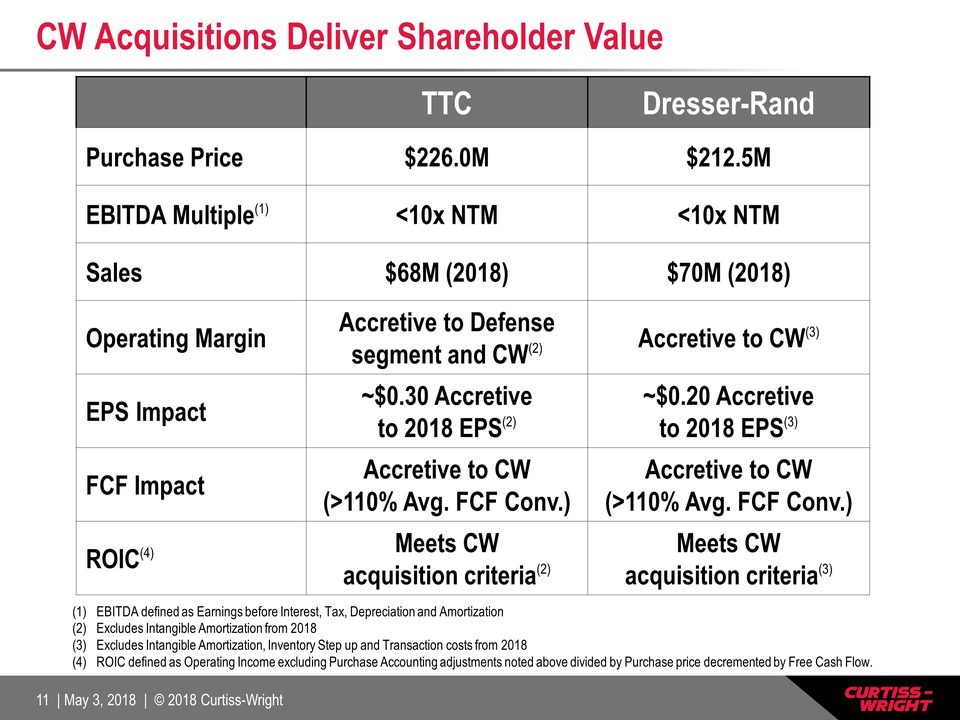
TTC Dresser-Rand Purchase Price $226.0M $212.5M EBITDA Multiple(1) <10x NTM <10x NTM Sales $68M (2018) $70M (2018) Operating Margin Accretive to Defense segment and CW(2) Accretive to CW(3) EPS Impact ~$0.30 Accretive to 2018 EPS(2) ~$0.20 Accretive to 2018 EPS(3) FCF Impact Accretive to CW(>110% Avg. FCF Conv.) Accretive to CW(>110% Avg. FCF Conv.) ROIC(4) Meets CW acquisition criteria(2) Meets CW acquisition criteria(3) CW Acquisitions Deliver Shareholder Value EBITDA defined as Earnings before Interest, Tax, Depreciation and Amortization Excludes Intangible Amortization from 2018 Excludes Intangible Amortization, Inventory Step up and Transaction costs from 2018ROIC defined as Operating Income excluding Purchase Accounting adjustments noted above divided by Purchase price decremented by Free Cash Flow.
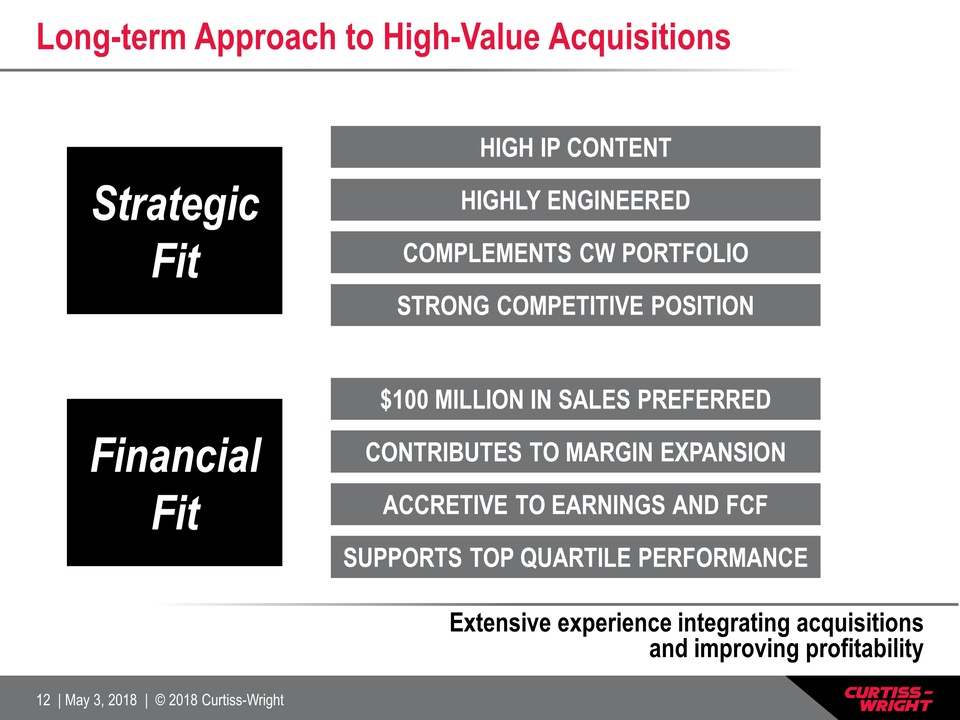
Long-term Approach to High-Value Acquisitions Extensive experience integrating acquisitions and improving profitability HIGH IP CONTENT HIGHLY ENGINEERED COMPLEMENTS CW PORTFOLIO STRONG COMPETITIVE POSITION Strategic Fit $100 MILLION IN SALES PREFERRED CONTRIBUTES TO MARGIN EXPANSION ACCRETIVE TO EARNINGS AND FCF SUPPORTS TOP QUARTILE PERFORMANCE Financial Fit
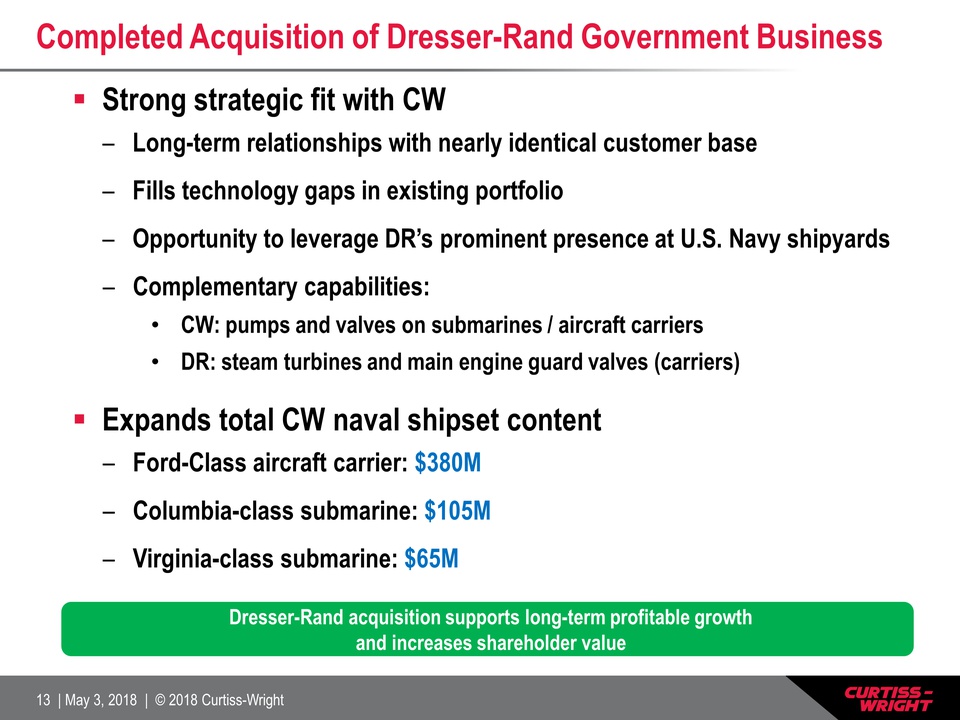
Completed Acquisition of Dresser-Rand Government Business Dresser-Rand acquisition supports long-term profitable growth and increases shareholder value Strong strategic fit with CWLong-term relationships with nearly identical customer baseFills technology gaps in existing portfolioOpportunity to leverage DR’s prominent presence at U.S. Navy shipyardsComplementary capabilities: CW: pumps and valves on submarines / aircraft carriers DR: steam turbines and main engine guard valves (carriers)Expands total CW naval shipset contentFord-Class aircraft carrier: $380MColumbia-class submarine: $105MVirginia-class submarine: $65M

Positioned to Deliver Strong 2018 Results Synchronized sales growth, up 6 - 8%Up 3 - 5% organic, increases in all end marketsContinued operating margin expansion Organic improvement of 90 - 110 bpsImproving sales outlook and benefit of ongoing margin improvement initiativesSolid, double-digit growth in diluted EPS, up 14 - 17%Adjusted free cash flow remains solid, driven by efficient working capital managementCommitted to a balanced capital allocation strategy Notes: Full-year 2018 guidance includes the acquisition of the Dresser-Rand government business. Any references to organic growth exclude the effects of foreign currency translation, acquisitions and divestitures, unless otherwise noted. Adjusted Free Cash Flow is defined as cash flow from operations less capital expenditures, and excludes a voluntary contribution to the Company’s corporate defined benefit pension plan of $50 million in 2018.
Appendix
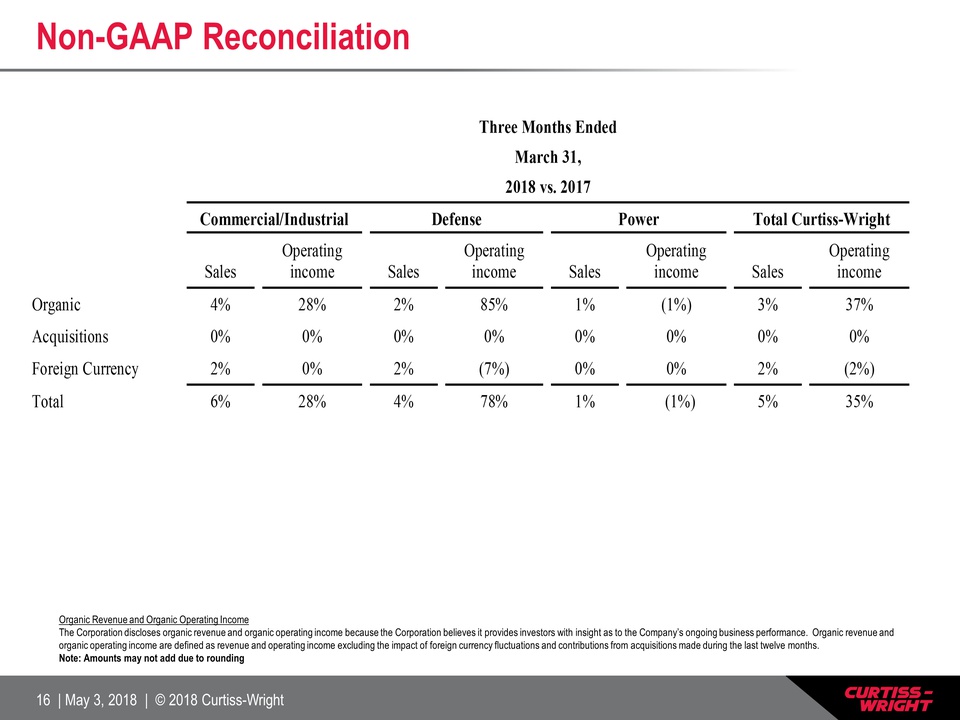
Non-GAAP Reconciliation Organic Revenue and Organic Operating Income The Corporation discloses organic revenue and organic operating income because the Corporation believes it provides investors with insight as to the Company’s ongoing business performance. Organic revenue and organic operating income are defined as revenue and operating income excluding the impact of foreign currency fluctuations and contributions from acquisitions made during the last twelve months. Note: Amounts may not add due to rounding
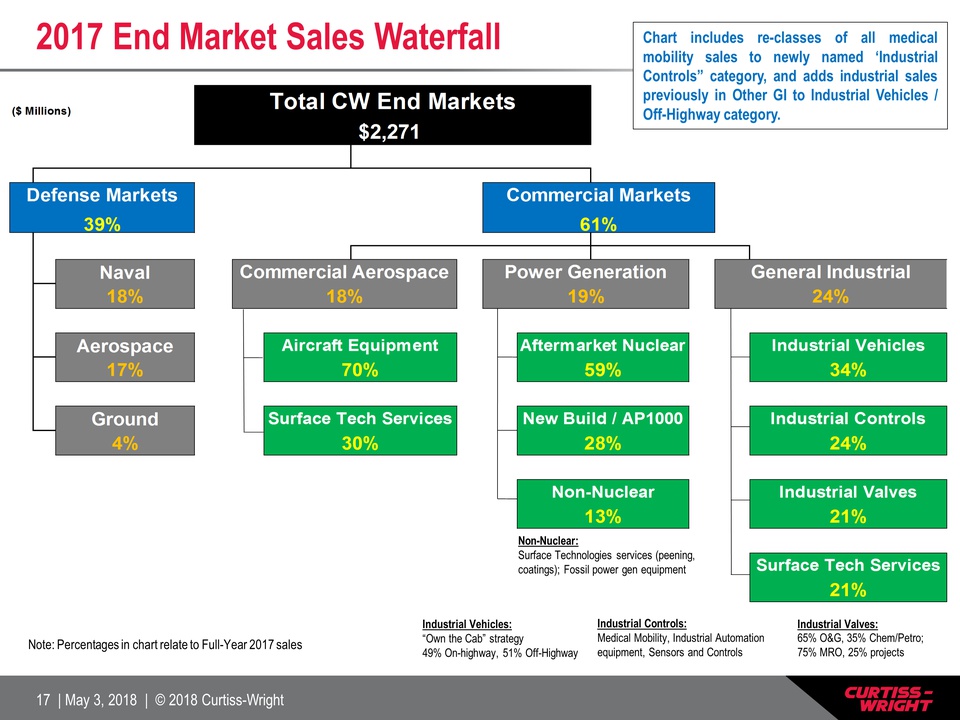
2017 End Market Sales Waterfall Industrial Controls:Medical Mobility, Industrial Automation equipment, Sensors and Controls Industrial Vehicles:“Own the Cab” strategy49% On-highway, 51% Off-Highway Industrial Valves:65% O&G, 35% Chem/Petro; 75% MRO, 25% projects Non-Nuclear:Surface Technologies services (peening, coatings); Fossil power gen equipment Note: Percentages in chart relate to Full-Year 2017 sales Chart includes re-classes of all medical mobility sales to newly named ‘Industrial Controls” category, and adds industrial sales previously in Other GI to Industrial Vehicles / Off-Highway category.
Serious News for Serious Traders! Try StreetInsider.com Premium Free!
You May Also Be Interested In
- Curtiss-Wright (CW) PT Raised to $272 at Stifel
- ROSEN, TRUSTED INVESTOR COUNSEL, Encourages Autodesk, Inc. Investors to Inquire About Securities Class Action Investigation – ADSK
- Sandata Opposes Singular Fiscal Intermediary to Manage Care In New York
Create E-mail Alert Related Categories
SEC FilingsSign up for StreetInsider Free!
Receive full access to all new and archived articles, unlimited portfolio tracking, e-mail alerts, custom newswires and RSS feeds - and more!
